Diversity Analysis and Breeding for Maize Weevil (Sitophilus ...
248
Diversity Analysis and Breeding for Maize Weevil (Sitophilus zeamais Motschulsky) and Larger Grain Borer (Prostephanus truncatus Horn) Resistance in Productive Maize Germplasm in Malawi By Macpherson Baxton Matewele BSc (Crop Science), MSc Plant Protection (Pathology), Bunda College of Agriculture, University of Malawi A thesis submitted in partial fulfilment of the requirements for the degree of Doctor of Philosophy (PhD) in Plant Breeding African Centre for Crop Improvement School of Agricultural, Earth and Environmental Sciences College of Agriculture, Engineering and Science University of KwaZulu-Natal Republic of South Africa October, 2014
-
Upload
khangminh22 -
Category
Documents
-
view
0 -
download
0
Transcript of Diversity Analysis and Breeding for Maize Weevil (Sitophilus ...

Diversity Analysis and Breeding for Maize Weevil (Sitophilus zeamais
Motschulsky) and Larger Grain Borer (Prostephanus truncatus Horn)
Resistance in Productive Maize Germplasm in Malawi
By
Macpherson Baxton Matewele
BSc (Crop Science), MSc Plant Protection (Pathology), Bunda College of Agriculture,
University of Malawi
A thesis submitted in partial fulfilment of the requirements for the degree of Doctor of
Philosophy (PhD) in Plant Breeding
African Centre for Crop Improvement
School of Agricultural, Earth and Environmental Sciences
College of Agriculture, Engineering and Science
University of KwaZulu-Natal
Republic of South Africa
October, 2014

i
Thesis Abstract
Maize (Zea mays L.) is the main staple food crop in Malawi grown by 97% of small holder
farmers. However, the potential maize yields are reduced by postharvest losses of grain in
storage due to the larger grain borer (Prostephanus truncatus Horn) and maize weevil
(Sitophilus zeamais Motschulsky). Limited research is conducted to improve larger grain borer
and maize weevil resistance in productive varieties and to exploit their genetic potential for
insect resistance breeding programmes. Little is also known about the existing genetic diversity
among local maize varieties in Malawi, which is critical for selection of parents for such breeding
programmes. In addition, the sustainability of insect resistant materials in farmers’ agro-
environments depends on their performance in the field and on farmers’ perceptions on the
varieties. Studies were conducted in Malawi between 2012 and 2014 focusing on genetic
diversity analysis and breeding for maize weevil and larger grain borer resistance in productive
maize germplasm. The objectives of the study were to: i) identify farmers’ perceptions on yield,
maize production constraints and storability of local maize varieties; ii) determine genetic
diversity of the potential breeding sources for use in introgressing larger grain borer and maize
weevil resistance genes in farmer-preferred local varieties; iii) determine levels of larger grain
borer and maize weevil resistance in local maize varieties; iv) determine the value for cultivation
of larger grain borer and maize weevil resistant hybrids, as reflected by combination of high
productivity and stability, under farmer representative conditions in multi-location trials
representing the target production environments in Malawi; v) estimate general combining ability
(GCA) and specific combining ability (SCA) between maize lines and their hybrids for grain yield
and resistance to larger grain borer and maize weevil.
Results of participatory rural appraisal showed that both hybrids and local varieties are grown by
farmers. Maize hybrids are cultivated mainly because of their high yield potential and early
maturity than local varieties, while local maize varieties are grown due to good tolerance to
pests and diseases, large cobs, large grain size, good yields under low soil fertility, white color,
superior poundability, drought tolerance and high storability than hybrids. Grain hardness, grain
size, grain color, poundability and grain texture were the main characteristics used by farmers to
select maize varieties tolerant to maize weevil and larger grain borer. The study indicated that

ii
farmer requirements should be incorporated in the conventional breeding programmes in
Malawi. Storability and other traits should be bred in hybrids that are preferred by farmers.
Diversity analysis revealed that phenotypic variation exists among local maize varieties largely
due to kernel weight, plant height and ear placement. Phenotypic data produced eight clusters.
SSR markers revealed 97.56% polymorphism among the loci. A total of 165 alleles were
detected, with a range of 2-9 alleles and an average of four (4) alleles per locus. The mean
gene diversity (He) of 0.5115 and mean heterozygosity (Ho) of 0.5233 were observed. The
furthest genetic distance of 0.9001 was between local varieties 206 and local 2 and the closest
genetic distance of 0.2190 was between local varieties 203 and 811. SSR marker data revealed
ten clusters. Both phenotypic and genotypic data support observation of large diversity and
variation among open pollinated maize varieties and landraces, which could be exploited by the
breeding programme in Malawi.
The analysis of resistance for maize weevil (MW) among local maize varieties showed that
14.5% of the varieties were resistant, 21.7% were moderately resistant, 24.6% moderately
susceptible, 23.2% susceptible and 16% highly susceptible. Maize varieties, such as, 1772,
1983, 1992, 3243, 3244, 750 and 752 were resistant to maize weevil. For larger grain borer
(LGB), all maize varieties were susceptible. However, varieties 1992, 2012, and 1983,
representing Five (5) percent of the entire maize population had reasonable levels of resistance
against large grain borer. Varieties 1992 and 1983 also showed high levels of resistance against
maize weevil, qualifying them as suitable candidates for use in stacking MW and LGB
resistance in new hybrids.
Designed crosses to combine for maize weevil and larger grain borer resistance in adapted
maize lines resulted in the development of 4 to 67% maize weevil resistant hybrids and 4 to 9%
larger grain borer resistant hybrids across sets. Stacking of maize weevil and larger grain borer
resistance produced 67% maize weevil resistant hybrids, 14% larger grain borer resistant
hybrids and 14% maize hybrids with resistance to both larger grain borer and maize weevil.
Maize hybrids, MWA06A showed a yield potential of 10 tons/ha, MWMW15106 (9.07 tons/ha)
and MWA10A (7.69 tons/ha) and useful resistance to maize weevil. Maize hybrids,
lgMW087940 expressed a yield potential of 11.05 tons/ha and MWlg06264 (8.16 tons/ha) and
good resistance to both maize weevil and larger grain borer. This demonstrated that the LGB
and MW resistance genes can be incorporated into productive cultivars.
iii
Analysis for gene action among maize weevil and larger grain borer resistant F1 maize hybrids
revealed that both additive and non-additive gene action were responsible for determining
weevil resistance. Only additive gene action was responsible for grain yield in maize weevil
resistant hybrids. For larger grain borer, additive gene action was responsible for both
resistance and grain yield in the F1 maize hybrids. This indicated that both selection and
hybridisation strategies would be effective for breeding MW and LGB resistance in productive
maize germplasm.
The study has demonstrated that maize breeding in Malawi should focus at developing both
hybrids and local varieties that meet different needs and traits preferred by farmers. Storability is
one of such important traits in local maize varieties. The expressed genetic variation in local
maize varieties provides an opportunity to explore for new sources of resistance to maize weevil
and larger grain borer. The variation observed in resistance against maize weevil and larger
grain borer among local varieties can be exploited to develop new populations or improve
resistance in productive maize populations. Breeding for high yielding insect resistant maize
hybrids is achievable and would provide a sustainable way of reducing postharvest grain losses
in storage and improve net gain in maize yields for smallholder farmers in Malawi. The stacking
of maize weevil and larger grain borer resistance in single maize hybrids would offer an effective
way of breeding for insect pest resistance to both maize weevil and larger grain borer .The
preponderance of additive gene effects over dominance gene effects in the maize hybrids gives
a practical option for selection to enhance resistance and grain yield among productive maize
germplasm. The exceptional hybrids, which combined high grain yield potential with high levels
of resistance to MW and LGB, will be advanced in the breeding programme in Malawi. Overall,
findings from the completed research will be useful for devising effective strategies in breeding
programmes that emphasize grain resistance to LGB and MW and to those that seek to
incorporate selection for these principal postharvest pests in the conventional breeding
programmes.

iv
Declaration
I, Macpherson Baxton Matewele, declare that
1. The research reported in this thesis, except where otherwise indicated, is my original
research work.
2. This thesis has not been submitted for any degree or examination at any other
university.
3. This thesis does not contain other person’s data, pictures, graphs or other information,
unless specifically acknowledged as being sourced from other persons.
4. This thesis does not contain other person’s writing, unless specifically acknowledged as
being sourced from other researchers. Where other written sources have been quoted,
then:
a. Their words have been re-written but the general information attributed to them has
been referenced.
b. Where their exact words have been used, then their writing has been placed in italics
and inside quotation marks, and referenced.
5. This thesis does not contain text, graphics or tables copied and pasted from the internet,
unless specifically acknowledged, and the source being detailed in the thesis and in the
references sections.
Signed
_________________________________________________________________
Macpherson Baxton Matewele (Candidate)
As candidate’s supervisors, we agree to the submission of this thesis:
_________________________________________________________________
Prof. J. Derera (Supervisor)
__________________________________________________________________
Prof. H. Shimelis (Co-supervisor)

v
Dedication
I dedicate this work to the omnipotent God of my father and to my people for their support and
understanding.

vi
Acknowledgements
I wish to acknowledge the following people and institutions for the support given to me during
my studies at the African Centre for Crop Improvement (ACCI) and research work in Malawi:
Prof. J. Derera and Prof. H. Shimelis for their professional advice and guidance during the
course of my research work. Prof. M. Laing, the Director of ACCI for his wise leadership and
timely intervention when faced with challenges.
Mrs Lesley Brown and administrative staff of ACCI for their administrative support and guidance
given to me during my studies.
The Alliance for a Green Revolution in Africa (AGRA) for financial support, Dr Rufaro
Madakadze for her support, dedication and passion to see me through. CIMMYT-Kenya,
CIMMYT-Zimbabwe and Chitedze Research Station for providing maize germplasm for my
research work.
The Station Manager and members of staff at Chitedze Research Station for their support.
Special recognition should go to Mr F. Chitezi from the Malawi Gene Bank, Mr Singano and staff
from the Crop Storage Lab for their technical assistance. My research assistants, Mr W.
Kwapata, Mr D. Nyemba, Mr W. Kazembe, Mr A. Mpoya and Mr A. Phiri and others for their
assistance and commitment towards my work.
Family members and relatives for their love, understanding and support during my studies. I
salute you.

vii
Table of contents
Thesis Abstract ............................................................................................................................... i
Declaration ................................................................................................................................... iv
Dedication ..................................................................................................................................... v
Acknowledgements ...................................................................................................................... vi
Table of contents .......................................................................................................................... vii
List of Tables ............................................................................................................................. xviii
List of Figures .............................................................................................................................. xxi
List of Abbreviations ................................................................................................................... xxv
Thesis Introduction ..................................................................................................................... 1
1.0 Importance of maize in Malawi....................................................................................... 1
2.0 The problem of postharvest grain losses ....................................................................... 2
3.0 The larger grain borer (Prostephanus truncatus Horn) ................................................... 3
4.0 Maize weevil (Sitophilus zeamais Motschulsky) ............................................................. 6
5.0 Performance of insect resistant maize varieties under farmers’ conditions .................... 7
6.0 Phenotypic and molecular characterisation of maize ..................................................... 8
7.0 Summary of problem statement ..................................................................................... 9
8.0 Main objective ................................................................................................................ 9
9.0 Specific objectives ......................................................................................................... 9
10.0 Hypotheses.................................................................................................................. 10
11.0 Thesis Structure .......................................................................................................... 11
References .................................................................................................................................. 11
Chapter 1 .................................................................................................................................... 16
Literature Review ....................................................................................................................... 16

viii
1.1 Introduction .................................................................................................................. 16
1.2 Agriculture in Malawi .................................................................................................... 16
1.3 Importance of maize in Malawi..................................................................................... 17
1.4 Constraints to maize production in Malawi ................................................................... 18
1.4.1 High cost of agricultural inputs ..................................................................................... 18
1.4.2 Climate change ............................................................................................................ 18
1.4.3 Drought ........................................................................................................................ 18
1.4.4 Low soil fertility ............................................................................................................ 19
1.4.5 Diseases and Pests ..................................................................................................... 19
1.4.5.1 Diseases ...................................................................................................................... 19
1.4.5.2 Postharvest insect pests .............................................................................................. 19
1.5 The larger grain borer (Prostephanus truncatus Horn) ................................................. 20
1.5.1 Origin and distribution .................................................................................................. 20
1.5.2 Ecology, morphology and reproduction of larger grain borer ........................................ 20
1.5.3 Control of the larger grain borer ................................................................................... 21
1.5.3.1 Use of insecticides ....................................................................................................... 21
1.5.3.2 Use of Pesticidal plants............................................................................................... 22
1.5.3.3 Use of natural enemies (biological agents) .................................................................. 22
1.5.3.4 Integrated Pest Management (IPM) ............................................................................. 23
1.5.3.5 Host resistance ............................................................................................................ 23
1.6 Maize weevil (Sitophilus zeamais Motschulsky) ........................................................... 24
1.6.1 Importance, morphology and reproduction of maize weevil ............................................. 24
1.6.2 Control of maize weevil ................................................................................................ 24
1.6.3 Use of plant material .................................................................................................... 24
1.6.4 Chemical control .......................................................................................................... 25
1.6.5 Breeding for resistance against maize weevil .............................................................. 25
1.6.6 Genetic basis for weevil resistance .............................................................................. 26

ix
1.7 Participatory Rural Appraisal (PRA) and Surveys ........................................................ 26
1.8 Genetic diversity .......................................................................................................... 27
1.9 Genotype x Environment Interaction (GEI) .................................................................. 28
1.10 Conclusion ................................................................................................................... 29
References .................................................................................................................................. 30
Chapter 2 .................................................................................................................................... 41
Assessment of farmers’ perceptions on maize production constraints, trait preference and storability of local maize varieties in Central Malawi ....................................................... 41
Abstract .................................................................................................................................... 41
2.1 Introduction .................................................................................................................. 42
2.2 Study objectives .......................................................................................................... 43
2.2 Methodology ................................................................................................................ 44
2.2.1 Study areas ................................................................................................................. 44
2.2.2 Data collection ............................................................................................................. 45
2.2.2.1 Semi-structured Interviews .......................................................................................... 45
2.2.2.2 Direct matrix and transect walks .................................................................................. 46
2.2.2.3 Focus group discussion ............................................................................................... 46
2.2.2.4 Key informants and secondary information .................................................................. 47
2.2.3 Data analysis ............................................................................................................... 47
2.3 Results ........................................................................................................................ 47
2.3.1 Demographic characteristics of the households ........................................................... 47
2.3.2 Most important crops grown by farmers ....................................................................... 48
2.3.3 Maize production at household level ............................................................................ 49
2.3.4 Maize production constraints ....................................................................................... 50
2.3.5 Storage facilities, yield losses and control measures ................................................... 50
2.3.6 Interaction between farmers and agricultural extension workers .................................. 51
2.3.7 Type and source of maize seeds ................................................................................. 51
2.3.8 Farmers’ perception on important maize characteristics .............................................. 52

x
2.3.9 Prioritization on the most important characteristics for local varieties by farmers ......... 52
2.3.10 Traits used by farmers to identify storage pest tolerant varieties .................................. 53
2.4 Discussion ................................................................................................................... 53
2.5 Breeding perspective ................................................................................................... 56
2.6 Conclusion ................................................................................................................... 56
References .................................................................................................................................. 56
Chapter 3 .................................................................................................................................... 59
Phenotypic and molecular genetic diversity of local maize varieties in Malawi ................... 59
Abstract ........................................................................................................................... 59
3.1 Introduction .................................................................................................................. 60
3.2 Study objectives .......................................................................................................... 61
3.3 Materials and methods ................................................................................................ 61
3.3.1 Phenotypic diversity analysis of local maize varieties .................................................. 61
3.3.1.1 Plant materials and planting ......................................................................................... 61
3.3.1.2 Data collection ............................................................................................................. 63
3.3.1.3 Statistical analysis ....................................................................................................... 63
3.3.2 Molecular diversity of local maize varieties using SSR markers ................................... 64
3.3.2.1 Plant materials and SSR markers ................................................................................ 64
3.3.2.1.1 Harvesting of plant tissues ........................................................................................... 65
3.3.2.1.2 DNA extraction ............................................................................................................ 65
3.3.2.1.3 Quality control and normalization of DNA samples ...................................................... 66
3.3.2.1.4 PCR procedure ............................................................................................................ 66
3.3.2.1.5 DNA fragment analysis procedure ............................................................................... 66
3.3.2.1.6 Fragment analysis ....................................................................................................... 67
3.3.2.1.7 Data analysis and output ............................................................................................. 67
3.4 Results ........................................................................................................................ 68
3.4.1 Phenotypic diversity of local maize varieties at Chitedze Research Station ................. 68

xi
3.4.1.2 Yield assessment of local maize varieties .................................................................... 72
3.4.1.3 Correlation analysis among phenotypic traits ............................................................... 72
3.4.1.4 Principal component analysis ...................................................................................... 73
3.4.1.5 Cluster analysis using phenotypic data ........................................................................ 74
3.4.1.6 Phenotypic diversity of local maize varieties at Chimoto .............................................. 76
3.4.2 Molecular diversity of maize varieties using SSR markers ........................................... 76
3.4.2.1 Loci polymorphism and number of alleles .................................................................... 76
3.4.2.2 Gene diversity (He) and Heterozygosity (Ho) ................................................................ 76
3.4.2.3 Polymorphism Information Content (PIC) ..................................................................... 76
3.4.2.4 Number of allele pairs (genotypes) and major allele frequency .................................... 77
3.4.2.5 Rare and common alleles within local maize varieties ................................................. 78
3.4.2.6 Genetic distances ........................................................................................................ 79
3.4.2.7 Cluster analysis using SSR markers ............................................................................ 79
3.4.2.8 Comparison of clusters based on phenotypic data and SSR data ................................ 81
3.4.2.9 Number of migrants ..................................................................................................... 82
3.5 Discussion ................................................................................................................... 82
3.5.1 Phenotypic diversity of local maize varieties ................................................................ 82
3.5.2 Molecular diversity of local maize varieties .................................................................. 84
3.6 Conclusion ................................................................................................................... 86
References .................................................................................................................................. 86
Chapter 4 .................................................................................................................................... 91
Variation in levels of resistance against maize weevil (Sitophilus zeamais Motschulsky) and larger grain borer (Prostephanus truncatus Horn) among local maize varieties in Malawi .................................................................................................................................... 91
Abstract .................................................................................................................................... 91
4.1 Introduction .................................................................................................................. 92
4.2 Study objectives .......................................................................................................... 93
4.3 Materials and methods ................................................................................................ 94

xii
4.3.1 Plant materials ............................................................................................................. 94
4.3.2 Planting and experimental design ................................................................................ 94
4.3.3 Rearing of larger grain borer and maize weevil ............................................................ 94
4.3.4 Evaluations of maize varieties for maize weevil and LGB resistance ........................... 95
4.4 Data collected .............................................................................................................. 96
4.4.1 Measurements for maize weevil resistance.................................................................. 96
4.4.2 Measurements for Larger grain borer resistance ......................................................... 97
4.5 Data analysis ............................................................................................................... 97
4.6 Results ........................................................................................................................ 97
4.6.1 Response of maize varieties to maize weevil infestation .............................................. 97
4.6.1.1 Adult mortality .............................................................................................................. 98
4.6.1.2 Total number of F1 progenies ....................................................................................... 99
4.6.1.3 Median Development Period (MDP) .......................................................................... 100
4.6.1.4 Percent grain damage ............................................................................................... 100
4.6.1.5 Percent grain weight loss ........................................................................................... 101
4.6.1.6 Dobie index of susceptibility (DSI) ............................................................................. 101
4.6.1.7 Correlation analysis among resistance parameters and yield .................................... 104
4.6.2 Response of maize varieties to larger grain borer infestation ..................................... 105
4.6.2.1 Total number of insects ............................................................................................. 105
4.6.2.2 Insect mortality .......................................................................................................... 106
4.6.2.3 Flour weight (g) .......................................................................................................... 107
4.6.2.4 Grain damage (%) ..................................................................................................... 107
4.6.2.5 Grain weight loss (%) ................................................................................................. 108
4.6.2.6 Correlation between LGB resistance parameters and yield ........................................ 110
4.7 Discussion ................................................................................................................. 111
4.7.1 Maize weevil resistance among local maize varieties ................................................ 111
4.7.2 Larger grain borer resistance among local maize varieties ........................................ 112
4.7.3 Yield and grain resistance .......................................................................................... 114

xiii
4.8 Conclusion ................................................................................................................. 114
References ................................................................................................................................ 115
Chapter 5 .................................................................................................................................. 120
Assessment of larger grain borer (Sitophilus zeamais Motschulsky) and maize weevil (Sitophilus zeamais Motschulsky) resistance and yield potential of F1 maize hybrids in Malawi .................................................................................................................................. 120
Abstract .................................................................................................................................. 120
5.1 Introduction ................................................................................................................ 121
5.2 Study objectives ........................................................................................................ 122
5.3 Materials and Methods .............................................................................................. 123
5.3.1 Collection of maize breeding lines ............................................................................. 123
5.3.2 Planting of maize breeding lines ................................................................................ 124
5.3.3 Generation of crosses ................................................................................................ 124
5.3.4 Planting of insect resistant F1 hybrids ........................................................................ 126
5.3.5 Field data collection and analysis .............................................................................. 127
5.3.6 Resistance screening for maize weevil and larger grain borer resistance using F2 grain ......................................................................................................................... 127
5.3.6.1 Rearing of larger grain borer and maize weevil .......................................................... 127
5.4 Data collected ............................................................................................................ 128
5.4.1 Maize weevil and larger grain borer resistance parameters ....................................... 128
5.5 Results ...................................................................................................................... 129
5.5.1. Set A: Adapted Malawi lines X Maize weevil resistant lines ....................................... 129
5.5.1.1. Grain resistance to maize weevil among F1 hybrids ................................................... 129
5.5.1.1.1. Grain weight loss (%) ................................................................................................. 129
5.5.1.1.2 Total number of insects ............................................................................................. 130
6.5.1.1.3 Grain damage (%) ..................................................................................................... 130
5.5.1.2 Correlation between grain resistance parameters for maize weevil ............................ 133
5.5.1.3 Yield potential of F1 hybrids (set a) ............................................................................ 133
5.5.1.4 Yield potential and maize weevil resistance among F1 hybrids .................................. 133

xiv
5.5.2 Set B: Maize weevil resistant lines X Maize weevil resistant lines .............................. 134
5.5.2.1 Grain resistance to maize weevil among F1 hybrids ................................................... 134
5.5.2.1.1 Insect mortality .......................................................................................................... 135
5.5.2.1.2 Total number of insects ............................................................................................. 135
5.5.2.1.3 Grain weight loss (%) ................................................................................................. 136
5.5.2.1.4 Percent grain damage ............................................................................................... 137
5.5.2.2 Correlation between grain resistance parameters for maize weevil ............................ 139
5.5.2.3 Yield potential of F1 hybrids (set b) ............................................................................ 140
5.5.2.4 Yield potential and maize weevil resistance among F1 hybrids .................................. 140
5.5.3. SET C: Adapted Malawi lines X LGB resistant lines ................................................... 141
5.5.3.1. Grain resistance of maize hybrids to larger grain borer .............................................. 141
5.5.3.1.1 Total number of insects ............................................................................................. 142
5.5.3.1.2 Insect mortality .......................................................................................................... 142
5.5.3.1.3 Flour weight (g) .......................................................................................................... 143
5.5.3.1.4 Grain weight loss (%) ................................................................................................. 144
5.5.3.1.5 Grain damage (%) ..................................................................................................... 144
5.5.3.2 Correlation between grain resistance parameters ...................................................... 146
5.5.3.3 Yield potential of F1 hybrids (set c) ............................................................................. 147
5.5.3.4 Yield potential and larger grain borer resistance among F1 hybrids ............................ 147
5.5.4 Set D: LGB resistant lines X LGB resistant lines ........................................................ 149
5.5.4.1 Resistance of F1 hybrids to larger grain borer ............................................................ 149
5.5.4.1.1 Total number of insects ............................................................................................. 149
5.5.4.1.2 Flour weight (g) .......................................................................................................... 149
5.5.4.1.3 Percent grain weight loss ........................................................................................... 150
5.5.4.1.4 Grain damage (%) ..................................................................................................... 151
5.5.4.2 Correlations between grain resistance parameters .................................................... 153
5.5.4.3 Yield potential of F1 hybrids (set d) ............................................................................ 153
5.5.4.4 Yield potential and maize weevil resistance of F1 hybrids ........................................... 153

xv
5.5.5 SET E: Larger gain borer resistant lines X Maize weevil resistant lines ..................... 155
5.5.5.1 Grain resistance of F1 hybrids to maize weevil ........................................................... 155
5.5.5.1.1 Insect mortality .......................................................................................................... 155
5.5.5.1.2 Total number of insects ............................................................................................. 155
5.5.5.1.3 Grain weight loss (%) ................................................................................................ 156
5.5.5.1.4 Grain damage (%) ..................................................................................................... 157
5.5.5.1.5 Correlation between resistance parameters for maize weevil .................................... 159
5.5.5.2 Grain resistance of F1 hybrids to larger grain borer .................................................... 159
5.5.5.2.1 Flour weight (g) .......................................................................................................... 159
5.5.5.2.2 Grain weight loss (%) ................................................................................................. 159
5.5.5.2.3 Percent grain damage (%) ......................................................................................... 160
5.5.5.3 Correlation between resistance parameters for larger grain borer .............................. 162
5.5.5.4 Yield potential of F1 hybrids (set e) ............................................................................ 162
5.5.5.5 Yield potential and resistance levels of F1 hybrids ..................................................... 164
5.5.6 Analysis for yield and resistance across sets (A-E) .................................................... 165
5.5.6.1. Response of maize hybrids to maize weevil across three sets (A, B & E) .................. 165
5.5.6.2 Top 20 maize weevil resistant F1 hybrids ................................................................... 165
5.5.6.3 Response of F1 hybrids to larger grain borer across sets (C, D & E) .......................... 165
5.5.6.3.1 Top 20 larger grain borer resistant hybrids ................................................................ 166
5.5.6.4 Combined yield analysis of F1 hybrids across environments ...................................... 166
5.5.6.5 Insect resistance among top 20 high yielding F1 hybrids ............................................ 168
5.6 Discussion ................................................................................................................. 168
5.6.1 Response of maize varieties to maize weevil infestation ............................................ 168
5.6.2 Response of maize varieties to larger grain borer infestation ..................................... 170
5.6.3 Stacking of larger grain borer and weevil resistance in F1 maize hybrids ................... 171
5.6.4 Combined analysis of maize weevil and larger grain borer resistance across sets..... 172
5.6.5 Yield potential of insect resistant F1 hybrids across environments ............................. 172
5.6.6 Breeding of high yielding insect resistant hybrids in Malawi ....................................... 173

xvi
5.7 Conclusion ................................................................................................................. 174
Chapter 6 .................................................................................................................................. 180
Combining ability for grain yield and resistance among maize weevil and larger grain borer resistant maize lines ..................................................................................................... 180
Abstract .................................................................................................................................. 180
6.1 Introduction ................................................................................................................ 181
6.2 Study objectives ........................................................................................................ 182
6.3 Materials and Methods .............................................................................................. 183
6.3.1 Collection of materials ............................................................................................... 183
6.3.2 Planting of breeding lines........................................................................................... 183
6.3.3 Generation of crosses ................................................................................................ 184
6.3.4 Planting of crosses .................................................................................................... 184
6.3.5 Resistance screening for maize weevil and LGB resistance using F2 grain ................ 185
6.3.5.1 Rearing of larger grain borer and maize weevil .......................................................... 185
6.3.5.2 Data collected ............................................................................................................ 185
6.4 Results ...................................................................................................................... 186
6.4.1 SET B: Combining ability analysis for resistance and grain yield among maize weevil resistant lines ............................................................................................................. 186
6.4.1.1 Analysis of Variance for grain damage (%) ................................................................ 186
6.4.1.2 Analysis of Variance for grain yield ............................................................................ 188
6.4.1.3 Comparison of GCAs for resistance and grain yield among maize lines .................... 189
6.4.2 SET D: Combining ability analysis for resistance and grain yield among larger grain borer resistant lines ................................................................................................... 190
6.4.2.1 Grain resistance ........................................................................................................ 190
6.4.2.2 Grain yield ................................................................................................................. 191
6.4.2.3 Comparison of GCAs for resistance and grain yield among LGB maize lines ............ 193
6.5 Discussion ................................................................................................................. 194
6.5.1 Gene action controlling grain resistance and grain yield in maize weevil resistant maize hybrids ............................................................................................................ 194

xvii
6.5.2 Gene action controlling grain resistance and grain yield in larger grain borer resistant maize hybrids ............................................................................................................ 195
6.6 Conclusion ................................................................................................................. 196
References ................................................................................................................................ 196
Chapter 7 .................................................................................................................................. 200
General overview ..................................................................................................................... 200
7.1 Introduction ................................................................................................................ 200
7.2 Main objectives .......................................................................................................... 200
7.3. Major findings ............................................................................................................ 200
7.4 Challenges to breeding for insect resistant varieties .................................................. 204
7.5 Opportunities ............................................................................................................. 205
7.6 Breeding implications ................................................................................................. 205
7.7 Recommendations ..................................................................................................... 206
Appendices ................................................................................................................................ 207

xviii
List of Tables
Table 1: Crop production in Malawi (2012) ................................................................................. 1
Table 2.1: Study areas indicating name of village, EPA, District and ADD ................................45
Table 2.2: Demographic characteristics of respondents ............................................................48
Table 2.3: Percentages of respondents involved in different farming practices..........................48
Table 2.4: Crops grown in each EPA in order of importance .....................................................49
Table 2.5: Number of respondents reporting yield losses in maize storage facilities .................50
Table 2.6: Level of interaction between farmers and extension workers on storage related
problems ...................................................................................................................................51
Table 2.7: Ranking of traits in local varieties by sex ..................................................................53
Table 3.1: List of local maize varieties and origin ......................................................................62
Table 3.2: List of 41 SSR markers used for molecular diversity analysis of local maize varieties
.................................................................................................................................................64
Table 3.3: PCR reaction conditioning for maize DNA sequencing .............................................66
Table 3.4: Partial marker data output ........................................................................................67
Table 3.5: Analysis of variance (ANOVA) for phenotypic traits at Chitedze Research Station ...69
Table 3.6: Analysis of variance for yield ....................................................................................72
Table 3.7: Correlation between phenotypic traits among local maize varieties ..........................73
Table 3.8: Variation within the local maize varieties as explained by principal component
analysis .....................................................................................................................................73
Table 3.9: Molecular diversity among local maize varieties .......................................................77
Table 3.10: Some rare and common alleles within local maize varieties ...................................78

xix
Table 3.11: Partial genetic distance matrix for the local maize varieties based on SSR marker
data ...........................................................................................................................................79
Table 3.12: Comparison between phenotypic data and SSR data clusters and origin ...............81
Table 3.13: Number of migrants within maize population ..........................................................82
Table 4.1: Analysis of Variance (ANOVA) for grain resistance related parameters for maize
weevil ........................................................................................................................................98
Table 4.2: Table of means for grain resistance parameters against maize weevil ................... 103
Table 4.3: Correlation among parameters for measuring maize weevil resistance and yield ... 104
Table 4.4: Analysis of Variance (ANOVA) for grain resistance related parameters against larger
grain borer .............................................................................................................................. 105
Table 4.5: Table of means for grain resistance parameters against larger grain borer ............ 109
Table 4.6: Correlation among resistance parameters for LGB and yield .................................. 110
Table 5.1: Breeding lines used in insect resistant F1 hybrid development ............................... 123
Table 5.2 : List of F1 hybrids in sets used in the study ............................................................. 125
Table 5.3: Table of means for grain resistance parameters against maize weevil (set a) ........ 132
Table 5.4: Yield potential, resistance and ranking of F1 hybrids across environments (set a) .. 134
Table 5.5: Table of means for grain resistance parameters against maize weevil (set b) ........ 139
Table 5.6: Yield potential, resistance and ranking of F1 hybrids across environments (set b) .. 141
Table 5.7: Table of means for grain resistance parameters against larger grain borer (set c) .. 146
Table 5.8: Yield potential and resistance levels of maize hybrids to LGB (set c) ..................... 148
Table 5.9: Table of means for grain resistance parameters against larger grain borer (set d) . 152
Table 5.10: Mean yield and resistance levels for F1 hybrids (set d) ......................................... 154
Table 5.11: Table of means for grain resistance parameters against maize weevil (set e) ...... 158

xx
Table 5.12: Table of means for grain resistance parameters against larger grain borer (set e)161
Table 5.13: Mean yield potential and mean rank of F1 hybrids across environments (set e) .... 163
Table 5.14: Yield potential, yield ranking and dual resistance among F1 hybrids from set e .... 164
Table 5.15: Analysis of Variance for percent grain damage across three sets ......................... 165
Table 5.16: Analysis of variance for percent grain damage across three sets ......................... 166
Table 5.17: Analysis of variance for combined yield across environments .............................. 166
Table 5.18: Resistance among top most high yielding F1 hybrids ............................................ 168
Table 6.1: Breeding lines for combining ability analysis for yield and insect resistance ........... 183
Table 6.2: Analysis of variance for grain damage (%) among maize weevil lines .................... 187
Table 6.3: Estimates for GCA for maize weevil resistance among maize weevil lines ............. 187
Table 6.4: Estimates for SCA for maize weevil resistance ....................................................... 188
Table 6.5: Analysis of variance for grain yield among maize weevil lines ................................ 188
Table 6.6: Estimates for GCA for grain yield among maize weevil lines .................................. 189
Table 6.7: Estimates for SCA for grain yield among maize weevil lines ................................... 189
Table 6.8: GCAs for both yield and resistance among maize weevil lines ............................... 190
Table 6.9: Analysis of Variance for grain damage (%) among LGB lines ................................. 190
Table 6.10: Estimates for GCA for LGB resistance ................................................................. 191
Table 6.11: Estimates for SCA for LGB resistance .................................................................. 191
Table 6.12: Analysis of variance for grain yield among LGB maize lines ................................. 192
Table 6.13: Estimates for GCA for grain yield among LGB maize lines ................................... 192
Table 6.14: Estimates for SCA for grain yield among LGB maize lines ................................... 193
Table 6.15: Comparison of GCAs for grain yield and resistance among LGB lines ................. 193

xxi
List of Figures
Figure 1: National maize yields in Malawi from 2001 to 2012. Data source: FAO (2014) ............ 2
Figure 2: Traditional storage structure for maize in Salima district (Central Malawi) ................... 3
Figure 3: Larger grain borer (Prostephanus truncatus Horn) ...................................................... 4
Figure 4: Maize weevil (Sitophilus zeamais Motschulsky) .......................................................... 6
Figure 1.1: Crop production in Malawi. Source: FAOSTAT (2014) ............................................17
Figure 2.1: Maize storage structure in Chinguluwe Extension Planning Area (EPA), Salima
district .......................................................................................................................................42
Figure 2.2: Eight (8) Agricultural Development Divisions (ADD) in Malawi with study areas
indicated by stars ......................................................................................................................44
Figure 2.3: Focus groups (Top-Ngwangwa EPA, Lilongwe ADD, Bottom-Msitu EPA, Kasungu
ADD) .........................................................................................................................................46
Figure 2.4: Number of maize bags (50 kg) produced per household .........................................49
Figure 2.5: Maize production constraints as indicated by farmers in the 3 Etension Planning
Areas (EPA) ..............................................................................................................................50
Figure 2.6: Important attributes for selecting local maize varieties.............................................52
Figure 3.1: Local maize varieties showing variation in grain colour ...........................................70
Figure 3.2: Distribution of varieties based on 1st and 2nd principal components .......................74
Figure 3.3: Cluster analysis of maize varieties using the unweighted pair-group method with
arithmetic averages (UPGMA) based on phenotypic data. ........................................................75
Figure 3.4 : Cluster analysis of maize varieties using Rogers (1972) the unweighted pair-group
method with arithmetic averages (UPGMA) based on SSR data ...............................................80
Figure 4.1: Maize samples in plastic containers (250 mls) bottom and glass jars (400 mls) top
with insect pests for resistance screening against MW and LGB, respectively ..........................95

xxii
Figure 4.2: Distribution of variation for adult mortality among local maze varieties ....................99
Figure 4.3: Distribution of variation for F1 progenies among local maize varieties .....................99
Figure 4.4: Distribution of variation for MDP among local maize varieties ............................... 100
Figure 4.5: Distribution of variation for percent grain damage among local maize varieties ..... 101
Figure 4.6: Distribution of variation for percent weight loss among local maize varieties ......... 101
Figure 4.7: Grouping of local maize varieties into maize weevil resistance groups using DIS.. 102
Figure 4.8: Distribution of variation for DIS among local maize varieties ................................. 102
Figure 4.9: Distribution of variation for total number of insects among local maize varieties .... 106
Figure 4.10: Distribution of variation for insect mortality among local varieties ........................ 106
Figure 4.11: Distribution of variation for flour weight among local varieties .............................. 107
Figure 4.12: Distribution of variation for grain damage (%) among local varieties .................... 108
Figure 4.13: Distribution of variation for grain weight loss (%) among local maize varieties .... 108
Figure 5.1: North Carolina Design II crossing scheme ............................................................. 124
Figure 5.2: Full Sib mating done by hand ................................................................................ 126
Figure 5.3: Distribution of variation for grain weight loss (%) among F1 hybrids (Set a) ........... 129
Figure 5.4: Distribution of variation for total number of insects among F1 hybrids (set a) ......... 130
Figure 5.5: Distribution of variation for grain damage (%) among F1 hybrids (set a) ................ 131
Figure 5.6: Maize weevil resistance groups based on grain damage (%) (set a) ..................... 131
Figure 5.7: Distribution of variation for insect mortality among F1 hybrids (set b) .................... 135
Figure 5.8: Distribution of variation for total number of insects among F1 hybrids (set b) ........ 136
Figure 5.9: Distribution of variation for percent weight loss among F1 hybrids (set b) ............. 136
Figure 5.10: Distribution of variation for grain damage (%) among F1 hybrids (set b) .............. 137

xxiii
Figure 5.11: Resistance groups based on grain damage (%) .................................................. 138
Figure 5.12: Distribution of variation for total number of insects among F1 hybrids (set c) ....... 142
Figure 5.13: Distribution of variation for insect mortality among F1 hybrids (set c) .................. 143
Figure 5.14: Distribution of variation for flour weight among F1 hybrids (set c) ........................ 143
Figure 5.15: Distribution of variation for grain weight loss (%) among F1 hybrids (set c) ......... 144
Figure 5.16: Distribution of variation for grain damage (%) among F1 hybrids (set c) .............. 145
Figure 5.17: Discrimination of F1 hybrids into resistance groups using grain damage (%) ....... 145
Figure 5.18: Distribution of variation for total number of insects among F1 hybrids (set d) ...... 149
Figure 5.19: Distribution of variation for flour weight (g) among F1 hybrids (set d) .................. 150
Figure 5.20: Distribution of variation for grain weight loss (%) among F1 hybrids (set d) ......... 150
Figure 5.21: Distribution of variation for percent grain damage among F1 hybrids (set d) ........ 151
Figure 5.22: Grouping of F1 hybrids into resistant groups based on grain damage (%) ........... 152
Figure 5.23: Distribution of variation for insect mortality among F1 hybrids (set e) .................. 155
Figure 5.24: Distribution of variation for total number of insects among F1 hybrids (set e) ...... 156
Figure 5.25: Distribution of variation for grain weight losses (%) among F1 hybrids (set e) ..... 156
Figure 5.26: Distribution of variation for grain damage (%) among F1 hybrids (set e).............. 157
Figure 5.27: Grouping of F1 hybrids into resistance groups using grain damage (%) ............... 158
Figure 5.28: Distribution of variation for flour (g) among F1 hybrids (set e) ............................. 159
Figure 5.29: Distribution of variation for percent grain weight loss among F1 hybrids (set e)... 160
Figure 5.30: Distribution of variation for grain damage among F1 hybrids (set e) .................... 160
Figure 5.31: Grouping of F1 hybrids based on grain damage (%) among F1 hybrids (set e) .... 161
Figure 5.32: Contribution of each set to top 20 high yielding hybrids ....................................... 167

xxiv
Figure 5.33: Mean maize yields across sets ............................................................................ 167
Figure 6.1: North Carolina Design II crossing scheme ............................................................. 184

xxv
List of Abbreviations
ACCI African Centre for Crop Improvement ADD Agricultural Development Division
AFLP Amplified Fragment Length Polymorphism
AGRA Alliance for a Green Revolution in Africa
AMMI Additive Main Effects and Multiplicative Interaction Effects
ANOVA Analysis Of Variance
CIMMYT International Maize and Wheat Improvement Centre
DMS Department of Meteorological Services
DNA Deoxyribonucleic Acid
DSI Dobie Index of Susceptibility
FAO Food and Agriculture Organisation
GCA General Combining Ability
GDP Gross Domestic Product
GEI Genotype and Environment Interaction
GLS Grey Leaf Spot
IFPRI International Food Policy Research Institute
IPCC Intergovernmental Panel on Climate Change
IPM Intergraded Pest Management
LGB Larger grain borer

xxvi
MDP Median Development Period
MDS Multidimensional Scaling
MET Multiple Environmental Trial
MPVA Malawi Poverty Vulnerability Assessment
MSV Maize Streak Virus
MW Maize weevil
OPV Open Pollinated Variety
PC Principal Component
PCA Principal Component Analysis
PCoA Principal Coordinate Analysis
PCR Polymerase Chain Reaction
PRA Participatory Rural Appraisal
RAPDS Random Amplified Polymorphic DNA
REML Residual Maximum Likelihood
RFLP Restriction Fragment Length Polymorphism
SCA Specific Combining Ability
SPSS Statistical Package for Social Scientists
SSR Simple Sequence Repeat
UPGMA Unweighted Pair –Group Method with Arithmetic Averages

1
Thesis Introduction
1.0 Importance of maize in Malawi
Maize (Zea mays L.) is one of the most important food crops grown in Malawi. It is grown by
97% of small holder farmers, covering approximately 70% of the arable land (Ngwira, 2001;
Denning et al., 2009). In 2012, maize ranked among the top three food crops grown in the
country, with an estimated yield production of 3618699 metric tonnes (FAO, 2014) (Table 1).
Table 1: Crop production in Malawi (2012)
Rank Crop Production (Int $1000) Production (mt)
1 Cassava 490162 4692202
2 Potatoes 482771 4152204
3 Maize 427154 3618699
4 Sugar cane 91944 2800000
5 Bananas 107020 380000
6 Plantains 74325 360000
7 Groundnuts, with shell 160886 268081
8 Pigeon peas 111695 237210
9 Fruit, freshnes 80278 230000
10 Vegetables, freshnes 40609 215500
Source: (FAO, 2014)
Before 2006, maize production in Malawi had generally been low. As a response to perpetual
decline in maize production, in 2005/2006 growing season, the Government of Malawi
introduced the input subsidy programme through which smallholder farmers accessed improved
seed and fertilizer. This intervention, coupled with good rains, resulted in the country realizing a
surplus of 510,000 tonnes in the 2005/2006 growing season (Denning et al., 2009). Since then,
Malawi has dramatically experienced unprecedented increase in food production, especially
maize (Figure 1).

2
Figure 1: National maize yields in Malawi from 2001 to 2012. Data source: FAO (2014)
This increase in food production has enabled the country attain food sufficiency at the national
level. However, there are still food shortages at the household level in many parts of the country
due to different factors including plant diseases, insect pests, weeds, low soil fertility, soil
acidity, soil erosion, climatic change, low rainfall, season length, high cost of farm inputs,
insufficient maize materials that can withstand different production stresses, drought and post-
harvest losses resulting from insect pest damage in storage (Zambezi, 1993; Sanchez et al.,
1997; CIMMYT, 2000; Ngwira, 2001; Pingali and Pandey, 2001; Dorward et al., 2008;
FAOSTAT, 2008; Makoka, 2008; Denning et al., 2009).
2.0 The problem of postharvest grain losses
Farmers in Malawi still use traditional methods and structures of keeping grain (Figure 2). Under
such conditions, maize grain is more vulnerable to serious attacks from rodents, birds, micro-
organisms and insects (Nukenine, 2010). For example, between 2004 and 2012, postharvest
weight losses of maize grain in Malawi ranged from 19.3 to 22.5% (APHLIS, 2015). Damage
caused by insects is a challenge for an African farmer and leads to loss after production (Mugo
et al., 2002). The larger grain borer, Prostephanus truncatus Horn and the maize weevil,
Sitophilus zeamais Motschulsky are the most important insect pests associated with grain
storage (CIMMYT, 2000). P. truncatus and S. zeamais have most severe effects on grain

3
damage and grain weight loss (Danjumma et al., 2009). Preservation of grain can only be
possible if damage from pests is minimised (Bergvinson and Garcı´a-Lara, 2004). Sustainable
strategies that are environmentally sound are required to protect farmers’ harvest and the use of
host resistance (resistant varieties) is the easiest, safest, most effective and economical way of
controlling insect pests on stored grain (Ahmed and Yusuf, 2007).
Figure 2: Traditional storage structure for maize in Salima district (Central Malawi)
3.0 The larger grain borer (Prostephanus truncatus Horn)
The larger grain borer (LGB) is the single most important field and storage pest of dried cassava
and maize in Africa (Farrell and Schulten, 2002) (Figure 3). LGB causes a wide range of grain
losses in maize, which include: weight loss, nutritional loss, loss in grain quality, loss of seed
viability, and loss of commercial value (McFarlane, 1989). Postharvest losses in susceptible
varieties can range from 40 to 100% (Mushi, 1990; CIMMYT, 1999; Denning et al., 2009).
However, according to APHLIS (2015), in Africa, between 2003 and 2014 postharvest weight
loss of maize grain ranged from 16.8 to 19.9%. For Malawi, in 2012, postharvest losses due to
larger grain borer was estimated at 1.2%, translating to a loss of 47000 tonnes of the total maize
yields realised in the country (APHLIS, 2015).

4
Figure 3: Larger grain borer (Prostephanus truncatus Horn)
Source: Dr Werener–Freyberg Strasse (2012) (modified)
The larger grain borer in Malawi was first detected in the northern district of Karonga which
borders with Southern Tanzania in 1991. Ever since, the pest has spread to many districts in the
country (Binder, 1992). It has now become a major pest of maize in Malawi (Ching’oma, 2009),
especially in the storage facilities (Makoka, 2008; Singano et al., 2009). The negative effect of
LGB on maize grain in Malawi was so apparent, for instance, between 1995 and 2001, the
weight loss of stored maize due to LGB increased from 5 to 16% (Singano et al., 2009). To
reduce the spread of the pest in the country, an integrated pest management (IPM) strategy
was put in place. The strategy comprised of bio-control agents, field and storage facility
inspections, traps and chemicals (Paliani and Muwalo, 2001). However, the main focus of this
strategy has been the use of chemical compounds, such as Actellic Super, a mixture of
pirimophis methyl and permethrin, and biological agent (histerid beetle, Teretrius nigrescens
Lewis) (Ching’oma, 2009). Despite the availability of Actellic Super and Teretrius nigrescens,
larger grain borer is still on the increase in the country (Singano et al., 2009). In view of this, a
more holistic IPM approach in LGB control is required, which among other aspects, necessitates
integrating host resistance as part of the IPM strategy against LGB. Unfortunately, not much

5
progress has been made in identifying genetic resistance of maize grain to storage insects
(Derera et al., 2000). For instance, Kasambala (2009) evaluated the susceptibility of nine
commercial maize hybrids, namely SC403, SC407, SC513, SC627, SC717, DK8033, DK8053,
DK8073, MH18 and a local variety “Kanjerenjere” to LGB in Malawi. All the nine hybrids were
found to be susceptible and only the local variety was resistant (Kasambala, 2009). The
resistance of landraces to LGB has also been reported in other regions. Kumar (2002) reported
the availability of 19 landraces from the Caribbean which showed resistance to LGB after
undergoing selection. Nhamucho et al. (2014) reported the existence of LGB resistance among
maize genotypes in Mozambique. The resistance observed was attributed to antibiosis (Kumar,
2002; Nhamucho et al., 2014).
Successes in breeding for maize materials with resistance to LGB have also been reported in
Kenya through CIMMYT supported programmes. These materials would be available for use in
other countries (Anonymous, 2008). Furthermore, Mwololo et al. (2010) reported existence of
genetic diversity for resistance among maize materials against LGB in Kenya. According to
Mwololo et al. (2010), genetic diversity is important in understanding different mechanisms
responsible for host plant resistance and provides a platform for developing breeding materials
with resistance to storage pests. Ndiso et al. (2007) also reported variation for resistance to
LGB among varieties in Kenya. However, there are no available reports indicating the type of
gene action responsible for the resistance. This was pursued in the study.
In Malawi, apart from the work reported by Kasambala (2009) on susceptibility of ten maize
varieties to larger grain borer, no comprehensive work has been done to determine the extent of
genetic diversity for LGB resistance among maize varieties. These initiatives and information
offer an opportunity and thrust for Malawi to explore genetic diversity for LGB resistance among
open pollinated maize varieties and further develop maize varieties with substantial resistance
to larger grain borer. Development of materials with better pest and disease resistance is of
paramount importance for Malawi (Denning et al., 2009), considering that maize is the staple
food for millions of people in the country. For instance, in 2011, direct maize consumption in
Malawi was around 2.03 million tones, representing 69% of the total maize produced. The
average annual maize consumption per individual was around 131.2 kg, providing 1142
kcal/day (FAOSTAT, 2014).

6
4.0 Maize weevil (Sitophilus zeamais Motschulsky)
The Maize weevil (MW) is an important pest in developing countries with yield losses ranging
from 5 to 15% (Tigar et al., 1994). Pest infestation starts in the field and is carried over to the
storage facility (CIMMYT, 2000). In the tropics, yield losses of more than 80% have been
reported, especially in untreated grain in storage facilities (Pingali and Pandey, 2001). Maize
weevil is a major pest of maize in Malawi (Kamanula et al., 2011) (Figure 4).
Figure 4: Maize weevil (Sitophilus zeamais Motschulsky)
Source: Dr Werener–Freyberg Strasse II (2012) (modified)
The control of maize weevil has depended much on the use of chemical products (pesticides),
which are mostly beyond the reach of smallholder farmers (Dhliwayo and Pixley, 2003). Plant
resistance can be incorporated as part of integrated pest management strategy for controlling
maize weevil. For example, apart from the responsible use of chemical pesticides as part of IPM
strategy, the combination of weevil resistance with plant and grain characteristics, such as husk
cover and grain flintiness can improve resistance to maize weevil (Kim and Kossou, 2003).

7
Improvement of resistance against maize weevil in maize materials is possible (Dhliwayo and
Pixley, 2003) as variation for weevil resistance among maize genotypes exists. Abebe et al.
(2009) found variation for resistance levels among Ethiopian maize varieties. Derera et al.
(2000) reported variation for resistance against maize weevil among genotypes from Southern,
Eastern and Western Africa. This resistance has been attributed to the presence of phenolic
compounds in grains that confer both mechanical and antibiosis resistances (Arnason et al.,
1992; Derera et al., 2000).
Unfortunately, no work has been done in Malawi to determine the extent of genetic diversity of
maize weevil resistance in Malawian germplasm. Studies have also shown that additive gene
actions, dominance gene action, and maternal effects play important role in maize weevil
resistance (Derera et al., 2000; Kim and Kossou, 2003). However, not much has been done to
exploit this genetic variation for breeding programmes for the development of maize weevil
resistant materials (Dhliwayo and Pixley, 2003) and no varieties have been released on the
basis of weevil resistance (Derera, personal communication). This is partly explained by not
incorporating insect resistance in a conventional breeding programme. Pest resistance
increases yield and differential reaction of genotypes to maize weevil can be exploited for
breeding purposes (Kitaw et al., 2001) as such, breeding for maize weevil resistance is a
practical option.
5.0 Performance of insect resistant maize varieties under farmers’
conditions
The sustainability of insect resistant materials in farmers’ agro-environments depends on their
performance in the field and farmers’ perceptions about the varieties. Previous studies had
revealed differences in agronomic performance of insect resistant maize hybrids in the field
(Tefera et al., 2012) and an increase in acceptability of varieties by the farmers through
incorporation of farmers’ views and knowledge in breeding programmes (Mukanga et al., 2011).
It is therefore, imperative that LGB and MW resistant materials be productive (high yielding) and
performs well under prevailing farmers’ conditions. Differences in environmental and climatic
conditions affect yields of maize mainly due to the differential reaction of genotypes to
environmental factors, such as soil nutrients, light, pests, diseases, drought and physical injury
(Yan and Kang, 2003; Mekonnen and Mohammed, 2009). Low N and drought are the most
important stress factors affecting maize production in Eastern and Southern Africa (Bänziger

8
and Diallo, 2001). Low soil fertility and drought conditions have a huge impact on maize
productivity (Zambezi, 1993; FAOSTAT, 2008).
Due to continuous cultivation, without nutrient replenishment, soils under smallholder cultivation
manifest serious nitrogen, phosphorous and potassium depletion (Sanchez et al., 1997). Low
and declining soil fertility greatly contributes to low yields. Therefore, the use of nutrient
utilization efficient cultivars becomes a prerequisite (CIMMYT, 2000). Furthermore, the majority
of smallholder farmers in Malawi depend on rainfed agriculture, as such their farming system is
prone to fluctuating maize production due to drought (Denning et al., 2009). The vulnerability of
Malawians to drought cannot be overemphasized, for example, during the 2004/2005 growing
season, the country experienced a drought that resulted in 36% reduction in maize production
(FAOSTAT, 2008) and over five million Malawians survived on food aid (Makoka, 2008). In
addition, some parts of Malawi, especially the low to mid altitude areas receive less than 50% of
the national average rainfall (DMS, 2008). These areas are associated with relatively high
temperatures, accompanied by dry spells (DMS, 2008). The case in point is Chikwawa (one of
the districts in Shire Valley), where drought caused irreversible damages to maize crops in the
2009/10 growing season and most farmers had to re-plant. As a result, some farmers were
planning to stop growing maize (Ngozo, 2010).
6.0 Phenotypic and molecular characterisation of maize
Through phenotypic and molecular characterisation, maize has been identified as one of the
most diverse crops in the world. Interestingly, its potential in breeding programmes has been
underutilized due to inability to identify variants largely within local varieties and lines (Tanksley
and McCouch, 1997). For instance, studies have been conducted to identify genetic diversity in
maize landraces using both phenotypic and molecular markers. The results have shown that
landraces remain the main good source of genetic diversity and contain unique alleles not
present in other maize varieties (Warburton et al., 2008). Unfortunately for Malawi, no
comprehensive work has been done to determine the extent of genetic diversity among locally
grown open pollinated varieties that can be exploited in breeding programmes, such as the
development of insect resistant maize germplasm.

9
7.0 Summary of problem statement
Despite measures being put in place to control the spread of larger grain borer and damaging
effects of the maize weevil, the pests are far from being contained as the pest populations are
still on the increase. Interestingly, the IPM strategies employed to contain the spread of LGB
and MW do not include the concept of breeding or improving grain resistance to the insect pest
in maize varieties and worse still not much has been done to exploit genetic variation for maize
weevil resistance in breeding programmes in Malawi. Nonetheless, plant resistance is an
essential element of integrated pest management as it is cheap, environmentally friendly and
acceptable by farmers. Furthermore, no comprehensive work has been done in Malawi to
determine the extent of genetic diversity among locally grown open pollinated varieties that can
be exploited in breeding programmes to improve larger grain borer and maize weevil resistance
in productive varieties. In addition, the development of insect resistant maize materials without
considering their yield potential under farmers’ conditions, such as drought and low soil fertility
is a risky strategy. This calls for development of insect resistant maize materials which should
also perform well under specific farmer’s agro-ecological environment. In view of this, the
research therefore, focused on identification and characterisation of locally grown open
pollinated maize varieties and exploration of maize weevil and larger grain borer resistant lines
for the development of larger grain borer and maize weevil resistant hybrids that meet farmers’
preferences and agronomic conditions.
8.0 Main objective
The main objective of this study was to develop maize varieties with resistance to larger grain
borer and maize weevil, having desired agronomic performance, under smallholder conditions
that will contribute towards improving food availability and self-sufficiency at the household level
in Malawi.
9.0 Specific objectives
The specific objectives of the study were to:
1. Identify farmers’ perceptions on yield, maize production constraints and storability of
local open pollinated maize varieties (OPV).

10
2. Determine genetic marker diversity of the potential breeding sources for use in
introgressing LGB and MW resistance genes in farmer-preferred local varieties.
3. Determine levels of LGB and MW resistance in local maize varieties.
4. Estimate general combining ability (GCA) and specific combining ability (SCA) between
maize lines and their hybrids for grain yield and resistance to larger grain borer and
maize weevil.
5. Determine the value for cultivation of LGB and MW resistant hybrids, as reflected by
combination of high productivity and stability, under farmer representative conditions in
multi-location trials, representing the target production environments in Malawi.
10.0 Hypotheses
The following hypotheses were tested:
1. Farmers have different perceptions of yield potential, production constraints and
resistance to post-harvest grain pests in local varieties. Knowledge of this information is
crucial in setting up the breeding priorities to improve grain storage ability in maize
hybrids and local varieties.
2. Genetic diversity, productivity and grain resistance to LGB and MW are not mutually
exclusive in the maize germplasm. Therefore breeding for LGB and MW resistance will
not compromise grain yield of hybrids and populations.
3. Genetic variation exists among local varieties in Malawi for resistance against larger
grain borer and maize weevil. This variation can be exploited in a breeding programme
to improve the resistance in productive varieties.
4. Development of larger grain borer and maize weevil resistant maize varieties can
substantially improve net maize yields in Malawi.
5. LGB and MW resistant maize hybrids developed have acceptable productivity in the field
and stability in the target environments, which will be complemented by high levels of
storage ability resulting in superior net yield on farm.

11
6. Larger grain borer and maize weevil resistant maize lines have good combining ability
for resistance and grain yield which can be exploited in developing hybrids and synthetic
populations.
7. There are maternal effects and additive gene effects which are responsible for
controlling resistance to LGB and MW in maize germplasm, suggesting that selection
can be used to enhance the resistance.
11.0 Thesis Structure
This thesis is divided into seven chapters as follows:
Chapter 1: Literature review
Chapter 2: Assessment of farmers’ perceptions on maize production constraints, trait
preference and storability of local maize varieties in central Malawi
Chapter 3: Phenotypic and molecular genetic diversity of local varieties in Malawi
Chapter 4: Variation in levels of resistance against maize weevil (Sitophilus zeamais
Motschulsky) and larger grain borer (Prostephanus truncatus Horn) among local
maize varieties in Malawi
Chapter 5: Assessment of larger grain borer (Sitophilus zeamais Motschulsky) and maize
weevil (Sitophilus zeamais Motschulsky) resistance and yield potential of F1
maize hybrids in Malawi
Chapter 6: Combining ability for grain yield and resistance among maize weevil and larger
grain borer resistant maize lines
Chapter 7: General overview
References
Abebe, F., T. Teheran, S. Mugo, Y. Been, and S. Vidal. 2009. Resistance of maize varieties to
the maize weevil, Sitophilus zeamais Motsch (Coleoptera: Curculionidae). African Journal
of Biotechnology 8:5937-5943.
Ahmed, B.I., and A.U. Yusuf. 2007. Host–plant resistance: A viable non–chemical and
environmentally friendly strategy of controlling stored products pests-a review.
Emirates Journal of Food Agriculture 19:1-12.

12
Anonymous. 2008. Body blow to grain borer. Appropriate Technology 35:48, ABI/INFORM
Global.
APHLIS. 2015. African Post-Harvest Losses Information System. Available at
http://www.aphlis.net. Accessed on 6 March, 2015.
Arnason, J.T., J. Gale, B.C.D. Beyssac, A. Sen, S.S. Miller, B.J.R. Philogene, J.D.H. Lambert,
R.G. Fulcher, A. Serratos, and J. Mihm. 1992. Role of phenolics in resistance of maize
grain to the stored grain insects, Prostephanus truncatus (horn) and Sitophilus zeamais
(motsch.). Journal of Stored Products Research 28:119-126.
Bänziger, M., and A.O. Diallo. 2001. Progress in developing drought and N stress torelant maize
cultivars for Eastern and Southern Africa. p. 189-194. Seventh Eastern and Southern
Africa regional maize conference.
Bergvinson, D., and S. Garcı´a-Lara. 2004. Genetic approaches to reducing losses of stored
grain to insects and diseases. Current Opinion in Plant Biology 7:480–485.
Binder, K.F. 1992. Strategy on containment of the larger grain borer in Malawi. Plant protection
workshop, 1–5 June 1992, Lilongwe, Malawi.
Ching’oma, P. 2009. Spatial and temperal distribution of the larger grain borer, Prostephanus
trancatus (Horn) and the predator, Teretrius nigrescens Lewis in relation to weather
parameters. Makoka Agricultural Research Station, Thondwe, Malawi.
CIMMYT. 1999. CIMMYT 1997/98 World maize facts and trends. Maize production in drought-
stressed environments: Technical options and research resource allocation. CIMMYT,
Mexico, D.F.
CIMMYT. 2000. World maize facts and trends. Mexico, D.F.
Danjumma, B.J., Q. Majeed, S.B. Manga, A.Yabaya, M.C. Dike, and L. Bamaiyi. 2009. Effect of
some plants powders in the control of Sitophilus zeamais Motsch (Coleoptera:
Curculionidae) infestation on maize grains. American-Eurasian Journal of Scientific
Research 4:313-316.
Denning, G., P. Kabambe, P. Sanchez, A. Malik, and R. Flor. 2009. Input subsidies to improve
smallholder maize productivity in Malawi: Towards an African green revolution. Public
Library of Science Biology 7(1): e1000023.doi:10.1371/journal.pbio.1000023. Available
at http://www.plosbiology.org. Accessed on 30 June 2010. Public Library of Science,
USA.
Department of Meteorological Services (DMS). 2008. Report. Blantyre, Malawi.

13
Derera, J., K.V. Pixley, and P. D. Giga. 2000. Resistance of maize to the maize weevil: I.
Antibiosis. African Crop Science Journal 9:431-440.
Dhliwayo, T., and K.V. Pixley. 2003. Divergent selection for resistance to maize weevil in six
maize populations. Crop Science 43:2043–2049.
Dorward, A., E. Chirwa, R. Slater, T. Jayne, and D. Boughton. 2008. Evaluation of the 2006/7
Agricultural Input Subsidy Programme. Malawi. Final report. Available at
https://eprints.soas.ac.uk. Accessed 30 June 2010.
FAOSTAT. 2008. Food and Agriculture Organisation (FAO). Available at http://faostat.fao.org.
Accessed on 3 July 2010. FAO, Rome.
FAOSTAT. 2014. Food and Agriculture Organisation (FAO). Available at http://faostat.fao.org.
Accessed on 5 June 2014. FAO, Rome.
Farrel, G., and G. Schulten. 2002. Larger grain borer in Africa; a history of efforts to limit its
impact. Integrated Pest Management Reviews 7:67–84.
Kamanula, J., G.W. Sileshi, S.R. Belmain, P. Sola, B.M. Mvumi, G.K.C. Nyirenda, S.P.
Nyirenda, and P.C. Stevenson. 2011. Farmers’ insect pest management practices and
pesticidal plant use in the protection of stored maize and beans in Southern Africa.
International Journal of Pest Management 57:41–49.
Kasambala, T. 2009. Prostephanus truncatus (Horn) (Coleoptera: Bostrichidae) infestation
levels on different maize varieties in Malawi. Resistant Pest Management Newsletter
Vol. 19, No. 1 (Fall 2009) p. 9-13. Center for Integrated Plant Systems (CIPS).
Kim, S.K., and D.K. Kossou. 2003. Responses and genetics of maize germplasm resistant to
the maize weevil Sitophilus zeamais Motschulsky in West Africa. Journal of Stored
Products Research 39:489–505.
Kitaw, D., F. Eticha, and A. Tadesse. 2001. Response of commercial varieties and other
genotypes of maize for resistance to the maize weevil, Sitophilus zeamais MOTSCH
(COLEOPTERA: CIRCULIONIDAE). p. 92-101 Seventh Eastern and Southern Africa
Regional Maize Conference.
Kumar, H. 2002. Resistance in maize to the larger grain borer, Prostephanus truncatus (Horn)
(Coleoptera: Bostrichidae). Journal of Stored Products Research 38:267–280.
Makoka, D. 2008. The Impact of drought on household vulnerability: The case of rural Malawi.
2008 United Nations University (UNU-EHS) Summer Academy on “Environmental
Change, Migration and Social Vulnerability”. Bonn, Germany.

14
McFarlane, J.A. 1989. Guidelines for pest management research to reduce stored food losses
caused by insects and mites. Overseas Development Natural Resources Institute
Bulletin 22:62.
Mekonnen, Z., and H. Mohammed. 2009. Study on genotype X environment interaction of oil
content in sesame (Sesamum indicum L.). Middle-East Journal of Scientific
Research 4:100-104.
Mugo, S., J. Songa, H. DeGroote, and D. Hoisington. 2002. Insect Resistant Maize for Africa
(IRMA) Project: An overview Syngenta Symposium, June 25, Washington DC.
Mukanga, M., J. Derera, P. Tongoona, and M.D. Laing. 2011. Farmers’ perceptions and
management of maize ear rots and their implications for breeding for resistance. African
Journal of Agricultural Research 6(19):4544-4554.
Mushi, A.M. 1990. Damage caused by larger grain borer, Prostephanus trancatus in Tanzania
and its control measures. Proceedings: Intergrated Pest Management in Tropical and
Sub-Tropical cropping systems. Bad Durkheim, Germany.
Ndiso, J.B., S. Mugo, A.M. Kibe, R.S. Pathak, and P. Likhayo. 2007. Characterization for
phenotypic drought tolerance and resistance to storage pests in local coastal maize
landraces in Kenya. p. 245-250 African Crop Science Conference Proceedings.
Ngozo, C. 2010. Malawi climate change is changing farming methods. Global Information
Network. Available at http://www.proquest.umi.com. Accessed on 27 June 2010. New
York, USA.
Ngwira, P. 2001. Managing maize diseases through breeding. Chitedze Resarch Station,
Lilongwe.
Nhamucho, C., S. Mugo, M.Kinyua, L. Gohole, T. Tefera, and E. Mulima. 2014. Antibiosis
mechanism for resistance to larger grain borer, Prostephanus truncatus (Horn)
(coleoptera: Bostrichidae) in maize. Journal of Entomology 11:248–260.
Nukenine, E.N. 2010. Stored product protection in Africa: Past, present and future. p. 425. 10th
International Working Conference on Stored Product Protection. Julius-Kühn-Archiv.
Paliani, A.L., and E.S. Muwalo. 2001. Evaluation of insecticides for the protection of stored grain
insect pest in Malawi. Bvumbwe Research Station, Malawi.
Pingali, P.L., and S. Pandey. 2001. Meeting world maize needs: Technological opportunities
and priorities for the public sector. CIMMYT 1999/2000 World maize facts and trends.
CIMMYT, Mexico, D.F.

15
Sanchez, P.A., K.D. Shepherd, M.J. Soule, F.M. Place, R.J. Buresh, M.N. Izac, A.U. Mokwunye,
F.R. Kwesiga, C.G. Ndiritu, and P.L Woomer. 1997. Soil fertility replenishment in Africa:
An investment in natural resource capital. p. 1-46. In R.J. Buresh, P.A. Sachez, and F.
Calhoun (ed.) Replenishing soil fertility in Africa. Special Publication 51. Soil Science
Society of American Journal. Madison, Wisconsin.
Singano, C.D., B.T. Nkhata, and V.Mhango. 2009. National annual report on larger grain borer
monitoring and Teretrius Nigrescens rearing and releases in Malawi.
Tanksley, S. D., and S. R. McCouch. 1997. Seed banks and molecular maps: unlocking genetic
potential from the wild. Science 277:1063-1066.
Tefera, T., G. Demissie, S.Mugo, and Y. Beyene. 2012. Yield and agronomic perfomance of
maize hybrids resistant to the maize weevil, Sitophilus zeamais Motschulsky,
(Coleopterai Curculionidae) Crop protection 46:94-99.
Tigar, B.J., P.E. Osborne, G.E. Key, M.E. Flores-S and M. Vazquez-A.1994. Insect pests
associated with rural maize stores in Mexico with particular reference to Prostephanus
truncatus (Coleoptera:Bostrichidae). Journal of Stored Products Research 30:267-281.
Warburton, M.L., J.C. Reif, M. Frisch, M. Bohn, C. Bedoya, X.C. Xia, J. Crossa, J. Franco, D.
Hoisington, K. Pixley, S. Taba, and A.E. Melchinger. 2008. Genetic diversity in CIMMYT
non-temperate maize germplasm: Landraces, open pollinated varieties, and inbred lines.
Crop Science 48:617–624.
Werener–Freyberg Strasse II. 2012. Larger grain borer and maize weevil pictures. Sourced from
Crop storage laboratory pictures, Chitedze Research Station.
Yan, W., and M.S. Kang. 2003. GGE Biplot Analysis: A Graphical tool for breeders, geneticists
and agronomists. CRC Press, Boca Raton, Florida.
Zambezi, B.T. 1993. Closing the maize yield gap. p. 37-155. In D.C. Munthali, J.T Munthali, F.
Kisyombe (ed.) Proceedings of the Conference on Agricultural Research for
Development. Ministry of Agriculture, University of Malawi, Zomba.

16
Chapter 1
Literature Review
1.1 Introduction
The chapter on literature review outlines overarching information about the general status of
agriculture in Malawi, the importance of maize in Malawi, constraints to maize production,
underpinning on postharvest pests, control strategies and the role of host resistance in reducing
the effects of storage pests. This chapter further describes the role of participatory rural
appraisal (PRA), genetic diversity, and genotype x environment interaction in plant breeding. In
the course of reviewing the literature, gaps were identified some of which were addressed in the
current study.
1.2 Agriculture in Malawi
Agriculture is the single most important sector in Malawi, contributing 40% of GDP (Malawi
Government and World Bank, 2006). It is estimated that of the 11.84 million hectares of land
available in the country, 48.4% is suitable for agriculture and only 31.6% is suitable for crop
production (FAOSTAT, 2014). Crop production in Malawi is largely dependent on rainfall, as a
result, crop yields tend to fluctuate due to frequent dry spells experienced within the season
(Denning et al., 2009). In 2012, the top crop productions mainly came from cassava, maize,
potato, sugarcane, groundnuts, and bananas among other crops (Figure 1.1).

17
Figure 1.1: Crop production in Malawi. Source: FAOSTAT (2014)
1.3 Importance of maize in Malawi
Maize (Zea mays L) is the main food crop in Malawi. It is grown by 97% of farming households
and accounts for 60% of total calorie consumption (Denning et al., 2009). The mean annual
maize consumption per individual is around 131.2 kg (FAOSTAT, 2014). Before 2005,
agricultural sector in Malawi experienced low maize productivity that resulted in only 20% of
maize farmers realising surplus maize (FAOSTAT, 2008). In response to the low and declining
maize productivity, the Government of Malawi introduced the national subsidy programme in
2005, through which smallholder farmers accessed cheap seed and fertilizer. This intervention
greatly improved maize productivity in the country (Denning et al., 2009). However, sustaining
the current levels of maize production is becoming a challenge due to high cost of agricultural
inputs, low soil fertility, climate change, drought, diseases, and postharvest losses due to
storage pests (Denning et al., 2009).

18
1.4 Constraints to maize production in Malawi
1.4.1 High cost of agricultural inputs
Agriculture development in general, and maize production in particular, is impeded by high cost
of agricultural inputs that are most of the times beyond the reach of resource-poor smallholder
farmers. The price of farm inputs has been going up in Malawi. According to Dorward et al.
(2008), between 2007 and 2008, the cost of fertilizer in Malawi created a deficit on the national
budget by US$80 million. Without government intervention, high costs of inputs result in
smallholder farmers’ inability to purchase and use inputs as per requirement to sustain maize
production. For example, in 2008, the overall market value of farm inputs was at K5,500 (44
USD) but farmers were required to pay only K2,050 (16.40 USD) (Dorward et al., 2008).
1.4.2 Climate change
Climate change is undoubtedly one of the modern threats to agricultural production (IFPRI,
2007). Climate change has a direct effect on people’s life especially in tropical climates (IPCC,
2001). In Sub-Saharan Africa, 95% of the cropping area is rainfed (Voortman et al., 2003) as
such, the cropping system is prone to effects of climate change. For example, unprecedented
high temperatures, short growing seasons and unpredictable rainfall pattern have of late been
experienced in Malawi, there by affecting maize production (Denning et al., 2009). It is projected
that by 2055, the world will experience a 10% reduction in maize production due to climate
change and Africa will largely be affected due to its dependence on rainfed agriculture (Jones
and Thornton, 2003).
1.4.3 Drought
Drought is one of the important factors limiting maize production, especially where farmers
sorely depend on rainfed agriculture (CIMMYT, 1999). Yield losses due to drought are by far
greater than any other causes (Farooq et al., 2008). Yield loss of up to 60% caused by drought
has been reported in maize (Edmeades et al., 1999). Mild and severe water stress can reduce
maize yield up to 63% and 85%, respectively (Earl and Davis, 2003). Economic estimates
showed that by 2016, 13 countries in Eastern and Southern Africa could come out of the poverty
trap by adopting drought tolerant maize varieties (La Rovere et al., 2010). Drought and heat

19
tolerant maize varieties could yield 34% more than the current varieties in Malawi, Zambia and
Zimbabwe (IFPRI, 2007).
1.4.4 Low soil fertility
Due to continuous cultivation, without nutrient replenishment, soils manifest serious nitrogen,
phosphorous and potassium depletions. The loss in soil fertility is estimated at 22kg/ha,
2.5kg/ha and 15kg/ha for N, P and K, respectively (Sanchez, 2002). However, N and P
deficiencies are the major soil fertility constraints to maize production in Malawi (Akinnifesi et al.,
2007). Of all the nutrients required by maize plants, nitrogen is the most limiting nutrient (Phiri et
al., 1999). In maize, nitrogen is important for plant metabolism, protein synthesis and
contributes greatly to grain production and protein quantity (Machado and Fernandes, 2001).
Improving soil fertility can increase maize yield from an average of 1300 kg ha-1 to as high as
6000–7000 kgha-1 (Zambezi, 1993). To maintain soil fertility therefore, a more encompassing
approach is required, such as the efficient use of chemical and organic inputs, crop rotations
and use of nutrient efficient cultivars (CIMMYT, 2000). Maize varieties that efficiently use
nitrogen under low N soil conditions can contribute towards sustainable agriculture (Presterl et
al., 2002).
1.4.5 Diseases and Pests
1.4.5.1 Diseases
Due to variability in environmental conditions, maize crop is prone to attacks by a wide range of
diseases. The effect of diseases are noted through reduced grain yield, poor grain quality, poor
feeding value and production of toxic animal feed (Ngwira, 2001). Of the many diseases
affecting maize production in Malawi, Maize Streak Virus (MSV), Grey Leaf Spot (GLS) and leaf
blight are of major concern (Ngwira, 2001). MSV and leaf blight can cause grain yield losses of
up 70% (CIMMYT, 2000; Ngwira, 2001), while GLS can reduce grain yield by 30% (CIMMYT,
2000).
1.4.5.2 Postharvest insect pests
The sustainability of food sufficiency at household level in Malawi is further threatened by huge
postharvest losses due to grain damage by insect pests, such as larger grain borer (LGB) and

20
maize weevil (MW). Postharvest losses due to MW and LGB erode net gain in maize
production. For instance, LGB can cause maize yield losses ranging from 5–40% (Paliani and
Muwalo, 2001; Ching’oma, 2009). Without chemical application, postharvest losses due to LGB
can range between 40-100% (Denning et al., 2009). Maize weevil is another important pest in
developing countries with yield losses ranging from 5 to 15% (Tigar et al., 1994). Yield losses of
more than 80% have been reported in untreated grain in storage facilities (Pingali and Pandey,
2001). However, other publications by APHLIS (2015) showed that between 2003 and 2014,
Africa experienced an average of 18% in postharvest weight losses of maize.
1.5 The larger grain borer (Prostephanus truncatus Horn)
1.5.1 Origin and distribution
The larger grain borer (LGB) Prostephanus truncatus (Horn) (Coleoptera:Bostrichidae) is also
known as powder post beetles (Booth et al., 1990).The origin of LGB is traced back to meso-
America (Hodges, 1994). LGB is now wide spread in many areas, notably in the New world,
Israel, Iraq, Central America, Thailand and East, West and Sub-Saharan Africa (Hill et al., 2002;
Nansen and Meikle, 2002). Larger grain borer was accidentally introduced in East Africa
(Tanzania) in 1970’s where it caused a lot of devastation on maize (Golob and Hodges, 1981).
The pest has now spread to many countries in Africa causing havoc on dried maize and
cassava, threatening food security in the affected countries (Dunstan and Magazini, 1981;
Farrell and Schulten, 2002). Incidences of LGB have been reported in Benin, Burkina Faso,
Burundi, Ghana, Guinea Conakry, Kenya, Mozambique, Namibia, Niger, Nigeria, Rwanda,
South Africa, Tanzania, Togo, Uganda, Zambia, Zimbabwe and Malawi (Tyler and Boxal, 1984;
Mushi, 1990; Nyagwaya et al., 2010; Tefera et al., 2010). In Malawi, LGB was first observed in
Karonga district which borders Tanzania in 1991. Its presence has now been detected in 27 of
the 28 political districts in the country and has become a major storage pest of maize in Malawi
(Binder, 1992; Paliani and Muwalo, 2001; Ching’oma, 2009; Singano et al., 2009; Kamanula et
al., 2011).
1.5.2 Ecology, morphology and reproduction of larger grain borer
Larger grain borer is found in diverse habitats and ecologies (Hodges, 2002). Hill et al. (2002)
categorized the ecology of Prostephanus truncatus into, ecology outside the storage system

21
and ecology within the storage system. Ecology outside the storage system includes forests,
woody frames, grain storage facilities, dry timber, green timber, sap wood and forest branches
(Hill et al., 2002). Sixteen tree species belonging to the groups Leguminosea, Burseracea and
Anacardiaceae are alternative hosts of LGB. The pest prefers young soft wood to old wood
(Nang’ayo et al., 1993). Within the storage system, LGB associates with other insect pests that
destroy maize, such as predators, parasitoids and ecto-parasites (Hill et al., 2002). The
presence of P .truncatus has also been reported in stored cassava roots (Hodges et al., 1985).
The morphology of LGB is characterised by deflexed head with well-built mandibles and
cylindrical body protected by pronotum that give the insect excavation abilities (LI, 1988). LGB
has a body length of 2 to 3.5 mm and a width of between 1 to 1.5 mm. The pest is able to
reproduce on maize grain and cobs, dry cassava and other stored-products. Females can lay
five to eight eggs in each oviposition chamber and 300 eggs can be produced in its entire
lifespan (Tefera et al., 2010).
1.5.3 Control of the larger grain borer
Various methods have been employed to contain LGB. These methods include, the use of
insecticides, pesticidal plants, biological control, integrated pest management (IPM) and host
resistance (Paliani and Muwalo, 2001; Adda et al., 2002; Farrell and Schulten, 2002; Golob,
2002; Ching’oma, 2009; Kasambala, 2009).
1.5.3.1 Use of insecticides
The control of LGB has depended heavily on the use of insecticides mainly organophosphates.
Organophosphates such as pirimiphos-methyl, fenitrothion, permethrin and bromophos dilute
dust have been used in Tanzania (Golob, 2002). In a trial that was conducted at Tumbi
Research Station in Tanzania, only Pirimiphos-methyl was found to be more effective against
LGB (Golob et al., 1983). In Togo, a combination of organophosphates with synthetic pyrethroid
has been used to control LGB (Golob, 1988). Actellic super which is the mixture of 1.6%
Pirimiphos-methyl and 0.3% permethrin has been adopted as an effective chemical against
larger grain borer (Farrell and Schulten, 2002). The use of Actellic super by smallholder farmers
has been documented in a number of African countries (Kimenju and De Groote, 2010). For
example, in Tanzania, Actellic super is overwhelmingly being used by smallholder farmers with
an adoption rate of 93% (Kaliba et al., 1998). In Malawi, farmers use Methacrifos 2P, bifenthrin

22
and Actellic super to control LGB (Paliani and Muwalo, 2001; Ching’oma, 2009; Kasambala,
2009). Even though the use of chemical control has largely been effective in mitigating the
devastating effects of LGB, there is a possibility of the pest developing resistance to the
insecticides due to misuse. For instance, after permethrin was used for 4 years in Tanzania in
the form of dust, an increase in adult survival of P. truncutus was observed in maize (Golob,
2002). Due to the increasing occurrence of insecticide resistance, possibility of environmental
damage, grain contamination and costs, there is need to look for alternative methods to protect
maize against LGB (Golob, 2002; Ahmed and Yusuf, 2007; Singano et al., 2009).
1.5.3.2 Use of Pesticidal plants
The use of pesticidal plants by local farmers has been reported in countries such as Malawi,
Zambia and Kenya. Kamanula et al. (2011) reported the use of Tephrosia vogelii, Fabaceae,
neem, tobacco, pepper and vernonia by smallholder farmers in Malawi and Zambia. These
plants have been used to preserve maize grain and beans. Other reports from Kenya revealed
the use of leaf dust of Tephrosia vogelii in maize grain to control the infestation and spread of
storage pests (Ogendo et al., 2004).
1.5.3.3 Use of natural enemies (biological agents)
The use of natural enemies has been one of the key strategies in controlling larger grain borer.
One of such biological agent is Teretrius nigrescens Lewis. T. nigrescens Lewis (Coleoptera:
Histeridae) is natural predator of larger grain borer (Paliani and Muwalo, 2001) as it is attracted
by aggregation pheromone produced by LGB (Rees et al., 1990). The larvae and adults of
T.nigrescens feed on eggs and larvae of LGB (Rees, 1987). The predatory effect of
T.nigrescens Lewis on LGB population has been investigated. In a study to assess the impact of
Teretrius nigrescens on Prostephanus truncatus and losses in traditional maize stores in
Southern Togo, Richter et al. (1997) reported a decrease in LGB infestation after the
introduction of T. nigrescens. This was attributed to the fast multiplication of the predator within
a short time after release. Rees (1991) reported LGB infestation reduction by 83% after
introduction of the natural enemy. Since 1990, T. nigrescens has been deployed in selected
sites in Malawi (Paliani and Muwalo, 2001). Although, there were reports of reduction in
numbers of LGB after introduction of T.nigrescens, (Paliani and Muwalo, 2001), the strategy has
not been very successful, as the population of the insect pest is on the increase. New

23
infestations have been found in forest reserves that act as reservoirs for secondary infections on
field plants (Ching’oma, 2009). Hence, the need to develop a more robust system that could
effectively contain the spread of LGB in Malawi, and that system should incorporate host
resistance.
1.5.3.4 Integrated Pest Management (IPM)
The unexpected presence of LGB in Malawi led to the deployment of an IPM strategy that
included, awareness programmes, field and storage facility inspections, deployment of traps,
chemical applications and use of T. nigrescens (Paliani and Muwalo, 2001).The use of a
storage system that integrates improved variety with higher yield and moderately good husk
cover characteristics has been effective in reducing insect pest infestation in Togo (Adda et al.,
2002). The use of post-harvest insect resistance maize with Teretrius nigrescens has been
investigated. The combination of the biological agent with both resistant and susceptible maize
grains showed significant differences in progeny number, grain weight loss and frass
production. Without the biological agent, susceptible genotypes suffered significant damages
than resistant genotypes (Bergvinson and Garcϊa-Lara, 2011).
1.5.3.5 Host resistance
The use of host resistance has been reported as the easiest, the most safe, effective, and
economical way of controlling insect pests on stored grain (Ahmed and Yusuf, 2007). Host
insect resistance provides farmers with the opportunity to benefit much from farming by
minimizing costs of synthetic insecticides (Smith, 1994). Screening and evaluation for insect
resistant materials is a first step in developing cultivars that can minimize damage caused by
insect pests (Ahmed and Yusuf, 2007). The screening of resistant material necessitates
artificially infesting storage grains with insect pest, assessing levels of oviposition, and insect
development (Ahmed and Yusuf, 2007). For grain, anti-biosis and non-preference are the most
important forms of resistance against storage pests (Derera et al., 2000). The numbers of
progenies emerging during incubation, percent grain damage, grain weight loss and grain
physical characteristics have been used to determine levels of resistance against LGB among
genotypes (Kasambala, 2009). Grain characteristics, such as grain moisture, grain hardness,
vitreous endosperm and nutritional factors play a significant role in LGB development and
behaviour (Arnason et al., 1992).

24
The variability in LGB resistance exists among maize materials. In Kenya, differences in
resistance to LGB were observed among landraces along the coastal region (Ndiso et al.,
2007). Mwololo et al. (2010) reported significant differences in grain damage, amount of flour,
number of dead and live insects among Kenyan genotypes. In Benin, Meikle et al. (1998)
reported the existence of resistance among maize varieties due to husk cover other than with
grain characteristics. Kumar (2002) identified 19 landraces from the Caribbean with high
resistance to LGB after a series of infestation, selection and inbreeding. The resistance
observed in these landraces was attributed to antibiosis especially within the S3 progenies
(Kumar, 2002).
1.6 Maize weevil (Sitophilus zeamais Motschulsky)
1.6.1 Importance, morphology and reproduction of maize weevil
Maize weevil (MW) is an important pest in developing countries with yield losses ranging from 5
to 80% (Tigar et al., 1994; Pingali and Pandey, 2001). Pest infestation starts in the field and is
carried over to the storage facilities (CIMMYT, 2000; Dhliwayo and Pixley, 2003; Demissie et al.,
2008). Maize weevil belongs to the order Coleoptera and family Curculionidae. The pest has a
body size of between 2.4 to 4.5m (Tefera et al., 2010). The body is mostly reddish brown, dark
brown or black in colour. Maize weevil has a pre-ovipositing of three days and females can lay
eggs up to four eggs in a kernel. Adult maize weevil feeds and lives between four to five months
(Tefera et al., 2010).
1.6.2 Control of maize weevil
Different control measures have been employed to manage maize weevil especially in storage.
These methods include, sun drying of maize grain, use of plant leaves, flowers, seeds and
powder extracts mixed with grain, use of synthetic chemicals and host resistance (CIMMYT,
2001; Nukenine, 2010).
1.6.3 Use of plant material
Plant powders from Nicotiana tobacum, Allium sativa and Zingiber Officinale have been
effective in controlling maize weevil on maize grain (Danjumma et al., 2009). Plant spices, such
as Piper guineense, Afromomum meleguate, Xylopia aethiopica and Tetrapleura tetrapterra

25
have also been reported to be effective in controlling maize weevil (Udo, 2005). Demissie et al.
(2008) reported high mortality rates of maize weevil due to silicosec and wood ash. Plant
extracts, such as Angustifolia Ch, Laurus nobilis L, Rosmarimus officianalis L and Thymus have
been used in controlling weevils, but their commercial application depends on obtaining
adequate amount of essential oils (Rozman et al., 2007). Laboratory evaluations of ethanolic
extracts revealed high levels of toxicity against maize weevil in Cupressus arizonica, Ocimum
gratissimum and Eucalyptus grandis leaves (Akob and Ewete, 2009).
1.6.4 Chemical control
Use of chemicals has been the major method of controlling maize weevil (Rozman et al., 2007).
Synthetic chemical insecticides, such as pyrethroid, organophosphates and gaseous fumigants
have been applied to control MW (Udo, 2005; Abebe et al., 2009; Pereira et al., 2009;
Nukenine, 2010; Kamanula et al., 2011). However, the use of insecticides to control of maize
weevil is being threatened by development of maize weevil resistance (Fragoso et al., 2005;
Pereira et al., 2009) and the chemical products are also mostly beyond the reach of smallholder
farmers (Dhliwayo and Pixley, 2003).
1.6.5 Breeding for resistance against maize weevil
The initial breeding focus for weevil resistance has been on husk cover. The role of husk cover
in controlling maize weevil has been investigated (Meikle et al., 1998; Demissie et al., 2008).
Differences in resistance among genotypes have been observed due to the size of the husk
cover. Genotypes with good husk cover extension showed low numbers of weevils and
damaged ears. Husk cover extension and tightness were the most important parameters in
maize resistance to maize weevil in the field (Demissie et al., 2008). Meikle et al. (1998)
reported negative association between the susceptibility of varieties to maize weevil and husk
cover extension in the field. The combination of husk cover extension and grain flintiness can
improve resistance to maize weevil (Kim and Kossou, 2003). Harder seeds tend to be more
resistant than soft seeds (Tongjura et al., 2010). Makate (2010) reported a positive correlation
between susceptibility of genotypes with moisture content and seed weight. The variation in
results obtained by researchers when assessing traits and factors responsible for grain
resistance against maize weevil could be due to genotypic differences and differences in
environmental conditions under which the research work was carried out. This implies that a

26
holistic approach (multi-trait approach) and standardisation of assessment procedures must be
employed when devising a breeding strategy for the control of maize weevil.
1.6.6 Genetic basis for weevil resistance
Additive gene action, dominance gene action and maternal effects play a role in maize weevil
resistance (Derera et al., 2000; Kim and Kossou, 2003). In a study to screen F2 hybrids,
commercial hybrids and popcorn for resistance against maize weevil, Derera et al. (2000)
reported significant maternal effects on weevil emergence and susceptibility. Both GCA and
SCA were significant in determining susceptibility index, weevil emergence and grain weight
loss. Kim and Kossou (2003) evaluated maize cultivars and crosses between inbred lines. The
results showed significant variation for weevil attack, general combining ability, and specific
combining ability. Both additive and non-additive gene actions contributed significantly to maize
weevil resistance among the genotypes. Dhliwayo and Pixley (2003) reported improved
resistance against maize weevil through divergent selection in six maize populations due to
additive gene action. Masasa et al., (2013) reported significant differences in susceptibility of
local maize varieties to maize weevil in Zimbabwe. Significant differences were observed for the
number of damaged grains, grain weight loss and weevil mortality but no significant differences
were observed for weevil progeny emergence, fecundity and Dobie Index of Susceptibility.
Parameters such as progeny emergence, grain weight loss, median development period and
Dobie susceptibility index were found to be heritable. Significant differences in genotypic
variation, general combining ability, and specific combining ability were also reported among
lines and hybrids for grain weight loss and emerged F1 weevils (Dari et al., 2010). Both additive
and non-additive gene actions were responsible for resistance observed in the genotypes.
Dhliwayo et al. (2005) reported significant SCA, GCA and reciprocal effects in F1 weevils
emerging from F2 grain in 14 Southern African maize inbred lines and weevil resistance was
controlled by additive gene action only.
1.7 Participatory Rural Appraisal (PRA) and Surveys
The incorporation of farmers’ knowledge and opinions in breeding programmes is of paramount
importance. Participatory approaches and methods provide enabling environment for farmers to
share ideas on issues affecting their wellbeing (Chambers, 1992). PRA tools and surveys help
to bring out issues that may not be priotised by researchers, scientists and policy makers but

27
are important to smallholder farmers (CIMMYT, 2001). PRA has been effective in narrowing the
information gap between researchers and farmers to reach a common consensus on issues
affecting farmers. Miti (2007) successfully used PRA to obtain farmers’ preferences in selecting
maize crop cultivars. Fisher and Mazunda (2011) used PRA tools to assess adoption of modern
varieties in Malawi and reported that farmers still use both landraces and locally adapted
varieties in their fields. Information from both farmers and researchers is critical in research and
technology development. Incorporation of farmers’ views and knowledge may increase
acceptability of varieties by farmers (Mukanga et al., 2011).
1.8 Genetic diversity
Genetic diversity is the basic component of the biological and species diversity (Yao et al.,
2007) critical for the sustainability of plant and crop productivity (Jarvis and Hodgkin, 2005).
Determination of genetic diversity involves analysis of variation among individuals or
populations (Jarvis and Hodgkin, 2005). The variation is measured by the number of
polymorphic genes, number of alleles for each polymorphic gene and the number of genes per
individual that are polymorphic (Magorokosho, 2006). Genetic markers have been used to
explore variation that exists among individuals or populations. The genetic markers can be
morphological, biochemical or molecular (Jones et al., 1997; Collard et al., 2005; Magorokosho,
2006). Morphological markers represent phenotypic traits, such as flower colour, seed shape
among other traits, biochemical markers are markers that use electrophoresis and staining to
identify variation, and molecular markers are genetic markers that utilize variation within the
DNA structure (Jones et al., 1997; Collard et al., 2005).
Phenotypic and molecular characterisation has revealed the extreme diversity of maize plant.
Sadly, its potential in breeding programmes has been underutilized due to failure to identify
variation within maize germplasm, especially among landraces and lines (Tanksley and
McCouch, 1997). Studies have been conducted to identify genetic diversity in maize landraces
using both morphological and molecular markers. Magorokosho (2006) explored maize diversity
in Malawi, Zambia and Zimbabwe using morphological markers and reported that Open
pollinated varieties (OPV) and landraces grown by farmers in these three countries contain
substantial variation. It is worth noting that landraces remain the main good source of genetic
diversity and unique alleles not present in OPVs (Warburton et al., 2008).

28
Specific molecular markers have been applied in diversity studies, such as Restriction Fragment
Length Polymorphism (RFLP), Amplified Fragment Length Polymorphism (AFLP), Random
Amplified Polymorphic DNA (RAPDS) and Simple Sequence Repeats (SSRs). Comparatively,
the SSRs are mostly applied in diversity studies because they are co-dominant, simple to
deploy, transferable between populations, locus specific, and multi-allelic (Powell et al., 1996;
McCouch et al., 1997; Collard et al., 2005; Magorokosho, 2006). Use of SSR markers to
quantify genetic diversity in maize has been reported (Betra’n et al., 2003; Reif et al., 2004; Reif
et al., 2005; Magorokosho, 2006). Magorokosho (2006) reported high levels of diversity
between landraces and commercial varieties collected from Southern Africa, USA and CIMMYT.
Betra’n et al. (2003) successfully used SSR markers to assess genetic diversity in tropical
maize under-stress and non-stress environments. Reif et al. (2004) and Reif et al. (2005)
deployed SSR markers to determine levels of genetic diversity within CIMMYT materials and
European maize landraces, respectively.
1.9 Genotype x Environment Interaction (GEI)
Yield potential and stability of genotypes are some of the important factors considered when
selecting genotypes for particular environments (Yan and Hunt, 1998; Mendes et al., 2012).
Differences in environmental and climatic conditions affect yields of maize mainly due to
genotype and environment interaction (GIE) (Grada and Ciulca, 2013). GIE is the differential
reaction of genotypes to environmental factors, such as soil nutrients, light, pests, diseases and
physical injury (Yan and Kang, 2003; Mekonnen and Mohammed, 2009). GEI complicates
selection of superior genotypes in target environments (Yan and Hunt, 1998; Yan and Kang,
2003; Mekonnen and Mohammed, 2009). Significant GEI affects heritability of traits, adaptability
of genotypes, ranking of genotypes and selection of superior genotypes across environments
(Yan and Hunt, 1998).
The performance of genotypes across environments is assessed through Multiple Environment
Trial (MET). MET refers to multiple testing on genotypes in one or more environments (Yan and
Hunt, 1998). Data on the performance of cultivars across environments aids in selection of
superior genotypes (Setimela et al., 2007). Different methods are available for determining yield,
GEI and stability of genotypes across environments. The use of Analysis of Variance (ANOVA),
Linear regression, GGE Biplot, Additive Main Effects and Multiplicative Interaction (AMMI) and
Residual maximum likelihood (REML) in yield analysis has been reported (Finlay and Wilkinson,

29
1963, Gauch, 1992; Maa’li, 2008; Miranda et al., 2009; Payne et al., 2009; Nzuve et al., 2013).
ANOVA shows main effects only without GEI (Miranda et al., 2009). Finlay and Wilkinson (1963)
reported the use of regression on mean model, where GEI is obtained through the variation for
yield potential of different genotypes to the change of the environment. This is represented as
Yge = µ + αg+ ygβe+ θge + Ɛge, where; Yge is the measure GEI for yield, µ is the overall mean, yg is
the yield sensitivity of the genotype g to the environmental alteration, θge is part of GEI not
accounted for by the regression line, and βe is a measure of the environment. GGE biplot and
AMMI use both ANOVA and PCA to provide information about individual genotypes,
environments and the interaction between genotypes and environments (Gauch, 1992; Maa’li,
2008; Miranda et al., 2009; Nzuve et al., 2013). The following AMMI model has been used in
GEI analysis: = µ + Gi + Ej + + + , Where, Yij is the average
response of genotype i in environment j, μ is the general mean, Gi is the genotype effect, Ej is
the environment effect, GEij was modelled in the way that λk is the square root of the kth
eigenvalue of the matrices (GE)(GE)’ and (GE)’(GE) (from non-null equal eigenvalues), γik is the
ith element (related to genotype i) of the kth auto vector of (GE) (GE)’, αjk is the jth element
(related to environment j) of the kth auto vector of (GE)’(GE), ρij is the residual not explained by
principal components used, and εij is the associated error (Balestre et al., 2009). REML is an
efficient yield analysis tool (Payne et al., 2009). REML analyses more than one source of error
variation, and its use on unbalanced designs has been recommended (Payne et al., 2009).
Residual maximum likelihood manipulates both random and fixed factors affecting yield as
follows (O’Neil, 2010): Yield = mean + fixed effects + random effects.
1.10 Conclusion
Through the review of literature, it has been established that maize remains the main food crop
in Malawi. The net gain in maize production is being curtailed by post–harvest loses due to
larger grain borer and maize weevil. These losses are threatening food security at household
level. Measures for controlling storage pests are available but are inadequate to address the
problem of storage insect pests in Malawi. Incorporation of host resistance could improve the
efficiency of the strategies to control storage pests. Variation for insect resistance exists among
maize materials which can be exploited in breeding for insect resistance. But the variation has
not been fully utilised in maize breeding programmes. The review of literature has not
established any published reports indicating any released productive hybrids that have fully
30
incorporated genes for resistant to larger grain borer and maize weevil. Both additive and non–
additive actions are responsible for determining weevil resistance, but nothing is documented on
the type of gene action responsible for resistance against larger grain borer in maize genotypes.
It has further been established that incorporation of farmers’ knowledge and opinions in
breeding programmes can lead to high adoption rate of maize varieties. But this has generally
been overlooked or ignored by researchers when designing breeding programmes. Maize is one
of the diverse crops in the world but its potential in breeding programmes has been
underutilized due to inability to identify variation within local varieties and landraces. Local
maize varieties and landraces could provide good sources of materials for breeding. The yield
potential of genotypes is affected by significant GEI which influences heritability of traits,
adaptability of genotypes, ranking of genotypes and selection of superior genotypes across
environments. This calls for the multi-location testing of maize varieties.
References
Abebe, F., T. Tefera, S. Mugo, Y. Been, and S. Vidal. 2009. Resistance of maize varieties to the
maize weevil, Sitophilus zeamais (Motsch.) (Coleoptera: Curculionidae). African Journal
of Biotechnology 8:5937-5943.
Adda, C., C. Borgemeister, A. Biliwa, W.G. Meikle, R.H. Markhamb, and H.M. Poehling. 2002.
Integrated pest management in post-harvest maize: A case study from the Republic of
Togo (West Africa). Agriculture, Ecosystems and Environment 93:305–321.
Ahmed, B.I., and A. U.Yusuf. 2007. Host–plant resistance: A viable non–chemical and
environmentally friendly strategy of controlling stored products pests. A review.
Emirates Journal of Food Agriculture 19:1-12.
Akinnifesi, F.K., W. Makumba, G. Sileshi, O.C. Ajayi, and D. Mweta. 2007. Synergistic effect of
inorganic N and P fertilizers and organic inputs from Gliricidia sepium on productivity of
intercropped maize in Southern Malawi. Plant and Soil 294:203–217.
Akob, C.A., and F.K. Ewete. 2009. Laboratory evaluation of bioactivity of ethanolic extracts of
plants used for protection of stored maize against Sitophilus zeamais Motschulsky in
Cameroon. African Entomology 17:90-94.
APHLIS. 2015. African Post Harvest Losses Information System. 2015. Available at
http://www.aphlis.net. Accessed on 6 March, 2015.

31
Arnason, J.T., J. Gale, B.C.D. Beyssac, A. Sen, S.S. Miller, B.J.R. Philogene, J.D.H. Lambert,
R.G. Fulcher, A. Serratos, and J. Mihm. 1992. Role of phenolics in resistance of maize
grain to the stored grain insects, Prostephanus truncatus (Horn) and Sitophilus
zeamais (motsch.). Journal of Stored Products Research 28:119-126.
Balestre, M., R.G.V. Pinho, J.C. Souza, and R.L. Oliveira. 2009. Genotypic stability and
adaptability in tropical maize based on AMMI and GGE biplot analysis. Genetics and
Molecular Research 8:1311-1322.
Bergvinson, D.J., and S. García-Lara. 2011. Synergistic effects of insect-resistant maize and
Teretrius nigrescens on the reduction of grain losses caused by Prostephanus
truncatus (Horn.). Journal of Stored Products Research 47:95-100.
Betra’n, F.J., J.M. Ribaut, D. Beck, and D. Gonzalez de Leo´n. 2003. Genetic diversity, specific
combining ability, and heterosis in tropical maize under stress and nonstress
environments. Crop Science 43:797–806.
Binder, K.F. 1992. Strategy on containment of the larger grain borer in Malawi. Plant Protection
Workshop, 1–5 June 1992, Lilongwe, Malawi.
Booth, R.G., M.I. Cox, and R.B. Madge.1990. IIE Guide to insects of importance to man:3.
Coleoptera. Cab International. Natural History Museum of London, 383.
Chambers, R. 1992. Methods for analysis by farmers: The Professional Challange Association
for Farming Systems Research/Extension 1991-1992 Symposium. University of Sussex,
England, Michigan State University.
Ching’oma, P. 2009. Spatial and temperal distribution of the larger grain borer, Prostephanus
trancatus (Horn) and the predator, Teretrius nigrescens Lewis in relation to weather
parameters. Makoka Agricultural Research Station, Thondwe, Malawi.
CIMMYT. 1999. CIMMYT 1997/98. World maize facts and trends. Maize production in drought-
stressed environments: Technical options and research resource allocation. CIMMYT,
Mexico, D.F.
CIMMYT. 2000. World maize facts and trends. CIMMYT, Mexico, D.F.
CIMMYT. 2001. CIMMYT 1999-2000 World maize facts and trends. Meeting world maize needs:
Technological opportunities and oriorities for the public sector. CIMMYT, Mexico, D.F.
Collard, B.C.Y., M.Z.Z. Jahufer, J.B. Brouwer, and E.C.K. Pang. 2005. An introduction to
markers, quantitative trai loci (QTL) mapping and marker-assisted selection for crop
improvement: The basic concepts. Euphytica 142:169-196.
32
Danjumma, B.J., Q. Majeed, S.B. Manga, A.Yabaya, M.C. Dike, and L. Bamaiyi. 2009. Effect of
some plant powders in the control of Sitophilus zeamais Motsch (Coleoptera:
Curculionidae) infestation on maize grains. American-Eurasian Journal of Scientific
Research 4:313-316.
Dari, S., K.V. Pixley, and P. Setimela. 2010. Resistance of early generation maize inbred lines
and their hybrids to maize weevil (Sitophilus zeamais Motschulsky). Crop Science
50:1310–1317.
Demissie, G., T. Tefera, and A. Tadesse. 2008. Efficacy of Silicosec, filter cake and wood ash
against the maize weevil, Sitophilus zeamais Motschulsky (Coleoptera: Curculionidae)
on three maize genotypes. Journal of Stored Products Research 44:227–231.
Demissie, G., T. Tefera, and A. Tadesse. 2008. Importance of husk covering on field infestation
of maize by Sitophilus zeamais Motsch (Coleoptera: Curculionidea) at Bako, Western
Ethiopia. African Journal of Biotechnology 7:3777-3782.
Denning, G., P. Kabambe, P. Sanchez, A. Malik, and R. Flor. 2009. Input subsidies to improve
smallholder maize productivity in Malawi: Toward an African green revolution. Public
Library of Science Biology 7(1): e1000023.doi:10.1371/journal.pbio.1000023. Available
at http:www.plosbiology.org. Accessed 30 June, 2010.
Derera, J., K.V. Pixley, and P. D. Giga. 2000. Resistance of maize to the maize weevil: I.
Antibiosis. African Crop Science Journal 9:431-440.
Dhliwayo T., and K.V. Pixley. 2003. Divergent selection for resistance to maize weevil in six
maize populations. Crop Science 43:2043–2049.
Dhliwayo, T., K. Pixley, and V. Kazembe. 2005. Combining ability for resistance to maize weevil
among 14 Southern African maize inbred lines. Crop Science 45:662-667
Dorward, A., E.Chirwa, R. Slater, T. Jayne, and D. Boughton. 2008. Evaluation of the 2006/7
Agricultural Input Subsidy Programme, Malawi. Final report. Available at
https://eprints.soas.ac.uk. Accessed 30 June 2010.
Dunstan, W.R., and I. Magazini. 1981. Outbreak and new records. Tanzania, larger grain borer
on stored products. FAO Plant Protection Bulletin 29:80-81.
Earl, H.J., and R.F. Davis. 2003. Effect of drought stress on leaf and whole canopy radiation use
efficiency and yield of maize. Agronomy Journal 95:688–696.
Edmeades, G.O., J. Bolanos, S.C. Chapman, H.R. Lafitte, and M. Banziger. 1999. Selection
improves drought tolerance in tropical maize populations. Crop Science 39:1306-1315.

33
FAOSTAT. 2008. Food and Agriculture Organisation. Available at http://faostat.fao.org.
Accessed on 3 July 2010. FAO, Rome.
FAOSTAT. 2014. Food and Agriculture Organisation. Available at http://faostat.fao.org.
Accessed on 7 June 2014. FAO, Rome.
Farooq, M., A. Wahid, N. Kobayashi, D. Fujita, and S.M. Basra. 2008. Plant drought stress:
Effects, mechanisms and management. Agronomy for Sustainable Development
29:185–212.
Farrell, G., and G.M. Schulten. 2002. Larger grain borer in Africa; a history of efforts to limit its
impact. Integrated Pest Management Reviews 7: 67–84.
Finlay, K.W., and G.N. Wilkinson. 1963. The analysis of adaptation in a plant-breeding
programme. Australian Journal of Agricultural and Resource Economics 14:742-754.
Fisher, M., and J. Mazunda. 2011. Could low adoption of modern maize varieties in Malawi be
explained by farmers’ interest in diverse seed characteristics? International Food policy
Research Institute.
Fragoso, D.B., R.N.C. Guedes, and L.A. Peternelli. 2005. Developmental rates and population
growth of insecticide resistant and susceptible populations of Sitophilus zeamais. Journal
of Stored Products Research 41:271–281.
Gauch, H.G. Jr. 1992. AMMI and related models. In H.G. Gauch (ed.) Statistical analysis of
regional trials. Elsevier Science Publishers.The Netherlands.
Golob, P.1988. Current status of larger grain borer, Prostephanus truncatus (Horn) in Africa.
Insect Science Application 9:737–45.
Golob, P. 2002. Chemical, physical and cultural control of Prostephanus truncatus. Intergrated
pest management reviews 7:245-277.
Golob, P., W.R. Dunstan, N. Evans, J. Meik, D. Rees, and I. Magazini.1983. Preliminary field
trials to control Prostephunus truncatus (Horn) in Tanzania. Tropical stored Products
Information 45:15-17.
Golob, P., and R. Hodges.1981. Report on a short visit to Tanzania to study an outbreak of
Prostephanus truncatus (Horn) in Tabora region. Tropical Products Institute, Chatham.
Grada, F., and S. Ciulca. 2013. Analysis of genotype and environment interaction for yield in
some maize hybrids. Journal of horticulture, Forestry and Biotechnology 17(2):192-196.
Hill, M.G., C. Borgemeister, and C. Nansen. 2002. Ecological studies on the larger grain borer,
Prostephanus truncatus (Horn)(Col.: Bostrichidae) and their implications for integrated
pest management. Integrated Pest Management Reviews 7:201–221.

34
Hodges, R.J. 1994. Recent advances in the biology and control of Prostephanus truncatus. p.
929-934. In Highley, E., Wright, E.J., Banks, H.J. and Champ, B.R. (ed) Stored Product
Protection. Proceedings of the 6th International Working Conference on Stored-product
Protection. CAB International, Wallingford.
Hodges, R.J. 2002. Detection and monitoring of larger grain borer, Prostephanus truncatus
Horn)(Coleoptera: Bostrichidae) Integrated Pest Management Reviews 7:223–243.
Hodges, R. J., Meik J., and H. Denton. 1985. Infestation of dried cassava (Manihot esculenta
Crantz) by Prostephanus truncatus (Horn) (Coleoptera: Bostrichidae). Journal of Stored
Products Research 21:73-77.
IFPRI. 2007. The world food situation: New driving forces and required actions. Washington,
D.C.
Intergovernmental Panel on Climate Change (IPCC). 2001. Climate Change 2001: The
Scientific basis. Working Group 1 Contribution to the IPCC Third Assessment Report.
Available on line at http://www.ipcc.ch. Accessed on 3 July 2010.
Jarvis, D., and T. Hodgkin. 2005. Introduction. In D. Jarvis, et al. (ed.) Enhancing the use of
crop genetic diversity to manage abiotic stress in agricultural production systems,
proceedings of a workshop, 23–27 May 2005, Budapest, Hungary. International Plant
Genetic Resources Institute, Rome, Italy.
Jones, N., H. Ougham, and H. Thomas. 1997. Markers and mapping: We are all genetics now.
New Phytology 137:165-177.
Jones, P.G., and P.K. Thornton. 2003.The potential impacts of climate change on maize
production in Africa and Latin America in 2055. Global Environmental Change 13:51–59.
Kaliba, A.R.M., Verkuijl, H., MWangi, W., Byamungu, D.A., Anandajayasekeram, P., and Moshi.,
A.J. 1998. Adoption of maize production technologies in Western Tanzania. Mexico,
D.E: CIMMYT, the United Republic of Tanzania, and the Southern Africa Center for
Cooperation in Agricultural Research (SACCAR).
Kamanula, J., G.W. Sileshi, S.R. Belmain, P. Sola, B.M. Mvumi, G.K.C. Nyirenda, S.P.
Nyirenda, and P.C. Stevenson. 2011. Farmers’ insect pest management practices and
pesticidal plant use in the protection of stored maize and beans in Southern Africa.
International Journal of Pest Management 57:41–49.
Kasambala, T. 2009. Prostephanus truncatus (Horn) (Coleoptera: Bostrichidae) infestation
levels on different maize varieties in Malawi. Resistant Pest Management Newsletter
Vol. 19, No. 1 (Fall 2009) p. 9-13. Center for Integrated Plant Systems (CIPS).

35
Kim, S.K., and D.K. Kossou. 2003. Journal of Stored Products Research 39:489–505.
Kimenju, S.C., and H.D. Groote. 2010. Economic analysis of alternative maize storage
technologies in Kenya The 3rd International Conference of the African Association of
Agricultural Economists,19-23 September 2010. Cape Town- South Africa.
Kumar, H. 2002. Resistance in maize to the larger grain borer, Prostephanus truncatus (Horn)
(Coleoptera: Bostrichidae). Journal of Stored Products Research 38:267–280.
La Rovere, R., G. Kostandini, T. Abdoulaye, J. Dixon, W. MWangi, Z. Guo, and M. Bänziger.
2010. Potential impact of investments in drought tolerant maize in Africa. CIMMYT,
Addis Ababa, Ethiopia.
Li, L.1988. Behavioral ecology and life history evolution in the larger grain borer, Prostephanus
truncatus (Horn). Ph.D thesis, University of Reading.
Ma’ali, S.H. 2008. Additive mean effects and multiplicative interaction analysis of maize yield
trials in South Africa. South African Journal of Plant and Soil 25:185-193.
Machado, A.T., and M.S. Fernandes. 2001. Participatory maize breeding for low nitrogen
tolerance. Euphytica 122:567–573.
Magorokosho, C. 2006. Genetic diversity and performance of maize varieties from Zimbabwe,
Zambia and Malawi. Texas A&M University, Texas, USA.
Makate, N. 2010. The susceptibility of different maize varieties to postharvest infestation by
Sitophilus zeamais (MOTSCH)(Coleoptera: Cuculionidae). Scientific Research and
Essay 5:030-034.
Malawi Government and World Bank. 2006. Malawi Poverty Vulnerability Assessment (MPVA)
Report. Lilongwe, Malawi.
Masasa R.T., P.S. Setimela, and Z.A. Chiteka. 2013. Evaluation of open pollinated varieties of
maize for resistance to the maize weevil in a controlled temperature and humidity
laboratory in Zimbabwe. Euphytica 193:293-302.
McCouch, S.R., X. Chen, O. Panaud, S. Temnykh, Y. Xu, Y. Chao, N. Haung, T. Ishii, and M.
Blair. 1997. Microsatellite marker development, mapping and applications in rice
genetics and breeding. Plant Molecular Biology 35:89-99.
Meikle, W.G., C. Adda, K. Azoma, C. Borgemeister, P. Degbey, B. Djomamou, and R.H.
Markham. 1998. The effects of maize variety on the density of Prostephanus
truncatus (Coleoptera: Bostrichidae) and Sitophilus zeamais (Coleoptera:
Curculionidae) in post-harvest stores in Benin Republic. Journal of Stored Products
Reseach 34:45-58.

36
Mekonnen, Z., and H. Mohammed. 2009. Study on genotype X environment interaction of oil
content in sesame (Sesamum indicum L.). Middle-East Journal of Scientific
Research 4:100-104.
Mendes, F.F., L.J.M. Guimarȃes, J.C. Souza, P.V. Guimarȃes, C.A.P. Pacheco, J.Machado,
W.F. Meirelles, A.R. da Silva, and S.N. Parentoni. 2012. Adaptability and stability of
maize varieties using mixed model methodology. Crop Breeding and Applied
Biotechnology 12:111-117.
Miranda, G., L. Souza, L. Guimaraȇs, H. Namorato, R. Oliveira, and M. Soares. 2009.
Multivariate analyses of genotype x environment of popcorn. Pesquisa Agropecuária
Brasileira 44:45-50.
Miti, F. 2007. Breeding investigations of maize (Zea mays L.) genotypes for tolerance to low
nitrogen and drought in Zambia. Pietermaritzburg, University of KwaZulu-Natal, PhD
Thesis in Plant Breeding, South Africa.
Mukanga, M., J. Derera, P. Tongoona, and M.D. Laing. 2011. Farmers’ perceptions and
management of maize ear rots and their implications for breeding for resistance. African
Journal of Agricultural Research 6(19):4544-4554.
Mushi, A.M. 1990. Damage caused by larger grain borer, Prostephanus trancatus in Tanzania
and its control measures. Proceedings: Intergrated Pest Management in Tropical
and Sub-Tropical cropping systems, Bad Durkheim, Germany, `3:961-976.
Mwololo, J.K., S. Mugo, P. Okori, T. Tadele, and S.W. Munyiri. 2010. Genetic diversity for
resistance to larger grain borer in maize hybrids and open pollinated varieties in
Kenya Second RUFORUM Biennial Meeting 20-24 September 2010, Entebbe,
Uganda.
Nang’ayo, F.L.O., M.G. Hill, E.A. Chandi, C.T. Chiro, D.N. Nzeve, and J.W. Obiero. 1993. The
natural environment as a reservoir for the Prostephanus truncatus (Horn)
(Coleoptera:Bostrichidae) in Kenya. Africa Crop Science Journal 1: 39-47.
Nansen, C., and W.G. Meikle. 2002. The biology of the larger grain borer, Prostephanus
truncatus (Horn) coleoptera:Bostichidae. Intergrated Pest Management Reviews
7:91-104.
Ndiso, J.B., S. Mugo, A.M. Kibe, R.S. Pathak, and P. Likhayo. 2007. Characterization for
phenotypic drought tolerance and resistance to storage pests in local coastal maize
landraces in Kenya. 245-250 African Crop Science Conference Proceedings,
Volume 8.

37
Ngwira, P. 2001. Managing maize diseases through breeding. Chitedze Resarch Station,
Lilongwe.
Nukenine, E.N. 2010. Stored product protection in Africa: Past, present and future. p. 425 10th
International Working Conference on Stored Product Protection. Julius-Kühn-Archiv,
Berlin, German.
Nzuve, F., S.Githi, D.M. Mukunya, and J.Gethi. 2013. Analysis of genotype x environment
interraction for grain yield in maize hybrids. Journal of Agricultural Science. Available at
http://dx.doj.org. Accessed on 8th August, 2014. Canadian Center of Science and
Education.
Ogendo, J.O., A.L. Deng, S.R. Belmain, D.J. Walker, and A.A. Musandu. 2004. Effect of
insecticidal plant materials Lantana camara L. and Tephrosia vogelii hook, on the quality
parameters of stored maize grains. Journal of Food Technology in Africa 9:29-36.
O’neil, M. 2010. ANOVA and REML. A guide to linear mixed models in an experimental design
context. Statistical Advisory and Training Service Pty Ltd.
Paliani, A.L., and E.S. Muwalo. 2001. Evaluation of insecticides for the protection of stored grain
insect pest in Malawi. Bvumbwe Research Station, Malawi, Malawi Government.
Payne, R.W., S.A. Harding, D.A., and S.J. Welham. 2009. A Guide to REML in GenStat. VSN
International 5. The Waterhouse, Waterhouse Street, Hemel Hempstead, Hertfordshire
HP1 1ES, UK.
Pereira, C.J., E.J.G. Pereira, E.M.G. Cordeiro, T.M.C.D. Lucia, M.R. Totola, and R.N.C.
Guedes. 2009. Organophosphate resistance in the maize weevil, Sitophilus zeamais:
Magnitude and behavior. Crop Protection 28:168–173.
Phiri, R.H., S. Snapp, and G.Y. Kanyama-Phiri. 1999. Soil nitrate dynamics in relation to
nitrogen source and landscape position in Malawi. Agroforestry Systems 47:253–262.
Pingali, P.L., and S. Pandey. 2001. Meeting world maize needs: Technological opportunities
and priorities for the public sector. CIMMYT 1999/2000 World maize facts and trends.
CIMMYT, Mexico, D.F.
Powell, W., G. Machray, and J. Provan. 1996. Polymorphism revealed by simple sequence
repeats. Trends in Plant Science 1:215-222.
Presterl, T., S. Groh, M. Landbeck, G. Seitz, W. Schmidt, and H.H. Geiger. 2002. Nitrogen
uptake and utilization efficiency of European maize hybrids developed under conditions
of low and high nitrogen input. Plant Breeding 121:480-486.

38
Rees D.P. 1987. Laboratory studies of predator by Teretriosoma nigrescens Lewis (Col.
Histeridae) on Prostephanus truncatus (Horn) Col. Bostrichidae) infesting maize cobs in
the presence of other maize pests. Journal of Stored Products Research 23:191-195.
Rees, D.P., R. Rodriguez Rivera, and F.J. H. Rodriguez. 1990. Observation of the ecology of
Terestriosoma nigrescens Lewis (Col.: Histeridae) and its prey Prostephanus Truncatus
(Horn) (Coleoptera: Bostrichidae) in the Yucalan peninsula, Mexico. Tropical Science
30:153-165.
Rees, D.P. 1991. The effect of Teretriosoma nigrescens Lewis (Coleoptera: Histeridae) on three
species of storage bostrichidae infesting shelled maize. Journal Stored Products 27:83-
86.
Reif, J.C., X.C. Xia, A.E. Melchinger, M.L. Warburton, D.A. Hoisington, D. Beck, M. Bohn, and
M. Frisch. 2004. Genetic diversity determined within and among CIMMYT maize
populations of tropical, subtropical, and temperate germplasm by SSR markers. Crop
Science 44:326-334.
Reif, J.C., S. Hamrit, M. Heckenberger, W. Schipprack, H.P. Maurer, M. Bohn, and A.E.
Melchinger. 2005. Genetic structure and diversity of European flint maize populations
determined with SSR analyses of individuals and bulks. Theory and Applied Genetics
111:906–913.
Richter, J., A. Biliwa, J. Helbig, and S. Henning-Helbig. 1997. Impact of Teretriosoma
nigrescens lewis (Coleoptera: Histeridae) on Prostephanus truncatus (Horn)
(Coleoptera: Bostrichidae) and losses in traditional maize stores in southern Togo.
Journal of Stored Products Research 33:137-142.
Rozman, V., I. Kalinovic, A. Liska, Z. Korunic, and R. Balicevic. 2007. Toxicity of naturally
occurring compounds of dalmatian (croatia) lamiaceae and lauraceae to maize weevil,
Sitophilus zeamais motsch. Cereal Research Communications 35.
Sanchez P. 2002. Soil fertility and hunger in Africa. Sciences’ Compass. Available at
www.sciencemag.org. Accessed 27 June 2010. University of California, USA.
Setimela, P.S., B. Viveka, M. Ba¨nziger, J. Crossa, and F. Maideni. 2007. Evaluation of early to
medium maturing open pollinated maize varieties in SADC region using GGE biplot
based on the SREG model. Field Crops Research 103:161–169.
Singano, C.D., B.T. Nkhata, and V.Mhango. 2009. National annual report on larger grain borer
monitoring and Teretrius Nigrescens rearing and releases in Malawi.

39
Smith, C.M. 1994. An Overview of the mechanisms and bases of insect resistance in maize.
p.1-12. In J. A. Mihm (ed.) Insect Resistant Maize: Recent advances and utilization:
Proceedings of an International Symposium held at the International Maize and Wheat
Improvement Center, 27 November-3 December, 1994. Mexico, D.F. CIMMYT.
Tanksley, S. D., and S. R. McCouch. 1997. Seed banks and molecular maps: unlocking genetic
potential from the wild. Science 277:1063-1066.
Tefera, Tadele, S. Mugo, R. Tende, and P. Likhayo. 2010. Mass rearing of stem borers, maize
weevil, and larger grain borer insect pests of maize. CIMMYT: Nairobi, Kenya.
Tigar, B.J., P.E. Osborne, G.E. Key, M.E. Flores-S, and M. Vazquez-A.1994. Insect pests
associated with rural maize stores in Mexico with particular reference to Prostephanus
truncatus (Coleoptera:Bostrichidae). Journal of Stored Products Research 30:267-281.
Tongjura, J.D.C., G.A. Amuga, and H.B. Mafuyai. 2010. Laboratory assessment of the
susceptibility of some varieties of zea mays infested with Sitophilus zeamais motsch.
(Coleoptera, Curculionidae) in Jos, Plateau state, Nigeria. Available at
www.scienceworldjournal.org. Accessed on 5th August 2011.
Tyler, P.S., and R.A. Boxall. 1984. Post-harvest loss reduction programmes: A decade of
activities; what consequences? Tropical Stored Products Information 50:4–13.
UDO, I.O. 2005. Evaluation of the potential of some local spices as stored grain protectants
against the maize weevil Sitophilus zeamais Motsch (Coleoptera: Curculionidae).
Journal of Applied Science in Environmental Management 9:165-168.
Voortman, R., B. Sonneveld, and M. A. Keyzer. 2003. African land ecology: Opportunities and
constraints for agricultural development. Available at Http://www.ambio.kva.se.
Accessed on 27 June 2010. Centre for World Food Studies, Amsterdam, The
Netherlands.
Warburton, M.L., J.C. Reif, M. Frisch, M. Bohn, C. Bedoya, X.C. Xia, J. Crossa, J. Franco, D.
Hoisington, K. Pixley, S. Taba, and A.E. Melchinger. 2008. Genetic diversity in CIMMYT
nontemperate maize germplasm: Landraces, open pollinated varieties, and inbred lines.
Crop Science 48:617–624.
Yan, W., and L.A. Hunt. 1998. Genotype by environment interaction and crop yield. Plant
Breeding Reviews 16.
Yan, W., and M.S. Kang. 2003. GGE Biplot Analysis: A Graphical tool for breeders, geneticists
and agronomists. CRC Press, Boca Raton, Florida.

40
Yao, Q., K. Yang, G. Pan, and T. Rong. 2007. Genetic diversity of maize (Zea mays L.)
landraces from Southwest China based on SSR Data. Journal of Genetics and
Genomics 34:851-860.
Zambezi, B.T. 1993. Closing the maize yield gap. p. 37-155. In D.C. Munthali, J.T Munthali, F.
Kisyombe (ed.) Proceedings of the conference on agricultural research for
development. Ministry of Agriculture, University of Malawi, Zomba, Malawi.

41
Chapter 2
Assessment of farmers’ perceptions on maize production constraints, trait
preference and storability of local maize varieties in Central Malawi
Abstract
The major shift in hybrid maize seed production from semi-flint varieties to dent varieties
ushered in high yielding maize hybrids in Malawi. Despite the yield advantage that the hybrids
have over local varieties, smallholder farmers still cling to their own local varieties seemingly
due to their superior storability. A farmer perception assessment was conducted at Msitu,
Ngwangwa and Chinguluwe Extension Planning Areas (EPA) in Mchinji, Lilongwe and Salima
districts, respectively, in 2012. The objectives of the assessment were to understand farmers’
perception on maize production constraints and storability of local maize varieties, to identify
critical traits used to select varieties for planting and to develop selection criteria for insect
resistant maize materials for future breeding programmes. The assessment was carried out on
210 farmers using semi-structured questionnaire, focus group discussions, direct matrix,
transect walks and key informants. Farmers continue to grow both hybrids and local varieties.
Hybrids were cultivated mainly because of their high yield potential and early maturity, while
local maize varieties were grown for good tolerance to pests and diseases, large grain size,
large cob size, good yields under low soil fertility, white colour, superior poundability, drought
tolerance and high storability than hybrids. Conspicuously missing on their preferred traits was
taste which has been generally regarded as one of the important attributes in local varieties.
The major maize production constraints were lack of fertilizer, low soil fertility, pests, and lack of
high quality seeds. Farmers identified grain hardness, grain size, grain colour, poundability and
grain texture as the main characteristics used to select maize varieties tolerant to maize weevil
and larger grain borer. Farmer requirements should be incorporated in the conventional
breeding programmes in Malawi. Storability and other traits should be bred in hybrids that are
preferred by farmers.
Keywords: Breeding, insect resistance, landraces, maize storability, participatory rural
appraisal

42
2.1 Introduction
Malawi has experienced a major shift in maize seed production from semi-flint varieties to dent
varieties especially by multinational seeds companies (Gilbert and Jones, 2012). In addition, the
Government of Malawi has been providing largely hybrid seeds and improved open pollinated
varieties (OPV) to farmers through its subsidy programme to improve food sufficiency at
national level (Denning et al., 2009). The shift in maize seed production coupled with the large
distribution of hybrid seeds and improved OPVs has ushered in high yielding varieties but highly
susceptible to storage pests, such as larger grain borer (LGB) (Prostephanus truncatus Horn)
and maize weevil (MW) (Sitophilus zeamais Motschulsky) (Gilbert and Jones, 2012). LGB and
MW have been identified as the major storage pests of maize in Malawi (Binder, 1992;
Ching’oma, 2009; Kamanula et al., 2011). Unfortunately, the majority of smallholder farmers in
Malawi still use traditional methods and structures of keeping grain (Figure 2.1).
Figure 2.1: Maize storage structure in Chinguluwe Extension Planning Area (EPA), Salima
district
Under such conditions, maize grain is more vulnerable to serious attacks from rodents, birds,
micro-organisms and insect pests (Nukenine, 2010; World Bank, 2011). According to the
Ministry of Agriculture (2012), postharvest losses account for more than 12% reduction in
national maize yield output every year and insect damage contributes significantly to that loss.
Postharvest losses caused by the insect pests are hindering the translation of the current
national levels in maize production to food sufficiency at household level.
In the past, postharvest losses or storability have been recognised as an important factor in
famers’ decision making process on the type of maize seeds to grow, but its significance has

43
largely been ignored (Gilbelt and Jones, 2012). In cases where storability has been recognised
as an important issue, the focus has been on chemical control (Ching’oma, 2009; Gilbert and
Jones, 2012). However, not much attention has been put on improving host resistance among
maize varieties in Malawi. Despite the yielding advantage that hybrid varieties have over OPVs,
and many researchers and scientists advocating for increased adoption of hybrid seeds, many
farmers still cling to their landraces and locally adapted varieties (Fisher and Mazunda, 2011). In
this regard, farmers’ and researchers’ views differ on preferences, choices and criteria for
selection of maize varieties (Ouma and De Grote, 2011). Hence, there is need to assess and
understand farmers’ perceptions on maize production constraints, trait preference, storability of
local varieties and determine the implication of farmers’ perceptions on development of insect
resistant maize varieties in Malawi.
Participatory rural appraisal (PRA) approaches and methods have enabled local people to
brainstorm and share ideas on many topical issues (Chambers, 1992). PRA tools, such as focus
group discussions help to bring out issues that are not apparent to researchers, scientists and
policy makers but are important to smallholder farmers (CIMMYT, 2001). For example, selection
of varieties by farmers involves use of many traits, some of which may be perceived as
insignificant by researchers and may not be prioritized by breeders when developing breeding
programmes. In addition, production constraints faced by farmers in their respective ecological
zones dictates their preferences (Derera et al., 2006; Holden and Lunduka, 2010). The
importance of PRA in obtaining information from farmers needs not to be overemphasized. For
instance, Miti (2007) effectively used PRA to obtain farmers’ preferences in selecting maize crop
cultivars in Zambia, Fisher and Mazunda (2011) used PRA tools to assess adoption of modern
varieties in Malawi and report that farmers plant both local maize varieties and maize hybrids.
Information from both farmers and researchers is critical in research and technology
development. Incorporation of farmers’ views and knowledge may increase acceptability of
varieties by farmers (Mukanga et al., 2011).
2.2 Study objectives
The objectives of the study were therefore to:
1. Understand farmers’ perception on maize production constraints and storability of local
maize varieties.

44
2. Identify critical traits used by farmers when selecting suitable varieties for planting.
3. Develop selection criteria for insect resistant maize materials for future breeding
programmes.
2.2 Methodology
2.2.1 Study areas
The study was conducted in Lilongwe, Mchinji and Salima districts in the Central region of
Malawi in 2012. The three districts belong to three different Agricultural Development Divisions
(ADD), namely Lilongwe, Kasungu and Salima, respectively (Fig 2.2).
Figure 2.2: Eight (8) Agricultural Development Divisions (ADD) in Malawi with study areas indicated by stars
Source: IFPRI (2010) modified
From each district, an Extension Planning Area (EPA) was selected for the assessment. In
Lilongwe, the study was conducted in villages surrounding Ngwangwa EPA (S 130 52.156’ E
Chinguluwe EPA
Msitu EPA
Ngwangwa EPA

45
0330 40.767’), while villages surrounding Chinguluwe EPA (S 130 41.269’ E 0340 23.834’) and
Msitu EPA (S 130 57.646’ E 033’ 19.235’) were selected for Salima and Mchinji districts,
respectively. EPAs were purposefully selected for their agricultural activities and maize is
predominantly grown by farmers in these areas. Selection of villages was at random using
farming family registers kept by the Agricultural Extension Officers.
2.2.2 Data collection
Five PRA tools were used in data collection, namely semi-structured questionnaire (Appendix
2.1) focus group discussions, transect walks, direct matrix and key informants.
2.2.2.1 Semi-structured Interviews
Fourteen (14) villages were selected in Ngwangwa EPA and 49 households were sampled, six
villages were chosen from Msitu EPA with a total of 42 households sampled and in Chinguluwe
EPA, six villages were selected and 64 households used. The households were selected based
on their farming records and their active participation in agricultural activities in their respective
EPAs as indicated by the Agricultural Extension Officers (Table 2.1).
Table 2.1: Study areas indicating name of village, EPA, District and ADD
Village EPA District ADD Village EPA District ADD
S4 North
Chinguluwe Salima Salima
Chizululu
Ngwangwa
Lilongwe
Lilongwe
Kalembo Ng'ombe Kalala Kamkwende Kadala Kalimbakatha Thengolimeta Malango Chisomba Kangunje
Muyeso
Msitu
Mchinji
Kasungu
Chirombo Potazina Khola Mweso Tsokalofanana Chiutsi Jambo Chophola Kafulatira Ovilisoni Akanike Zanje Ngwangwa Lilongwe Lilongwe Kaluma
EPA= Extension Planning Area, ADD= Agricultural Development Division
The semi-structured questionnaire was used to collect demographic information of the
respondents, such as sex, EPA, village , district, region, family headship, marital status, age,
education, source of income, and production factors, such as type of farming, farm size, crops

46
grown, maize production levels, storage losses, storage pests, seed preference, seed source,
type of storage facilities, level of knowledge on post-harvest losses, level of interaction between
the farmer and agricultural extension officer, pest control measures, key traits for identifying
storage pest tolerant varieties, traits preference on maize crop in general, important traits for
selecting local varieties and constraints to maize production.
2.2.2.2 Direct matrix and transect walks
Direct matrix was used for ranking of preferred traits by farmers, maize production constraints
and storage pests. Transect walks were used to collect information on storage facilities within
the villages.
2.2.2.3 Focus group discussion
Twenty (20) individuals were involved in focus group discussions in Ngwangwa EPA, 15 and 20
people in Msitu and Chinguluwe, respectively (Fig 2.3). One focus group discussion was
conducted in each EPA.
Figure 2.3: Focus groups (Top-Ngwangwa EPA, Lilongwe ADD, Bottom-Msitu EPA, Kasungu
ADD)

47
The main focus of the discussion was to gather in-depth information from the respondents on
various topical issues, such as cropping system, important crops, farming problems, source of
seeds, important storage pests and control measures, knowledge about local varieties that have
resistance to storage pests and grain loss experience due to storage pests, sources of income,
and production constraints.
2.2.2.4 Key informants and secondary information
Agricultural Extension Officers and Chiefs were used as key informants to get important
information, such as cultural values, demographic and social issues before conducting
interviews, and focus group discussions. Secondary information was obtained through reports
and publications on line. In total, 210 respondents were involved in the assessment, 55 of which
were used for focus group discussions, 155 respondents were interviewed using a semi-
structured questionnaire.
2.2.3 Data analysis
Data collected was analysed using the Statistical Package for Social Scientists (SPSS) version
16 (2007). Chi-square analysis was applied on interaction between farmers and agricultural
extension workers, and farmers’ knowledge on crop storage problems. Results from the
analysis were presented in tables and graphs.
2.3 Results
2.3.1 Demographic characteristics of the households
The respondents were predominantly females (52%), married (91.6%), young adults (21-35),
with primary education (73.5%) and engaged in farming (78.7%) (Table 2.2).

48
Table 2.2: Demographic characteristics of respondents
Sex % Marital status % Age range % Level of Education % Source of income %
Female 52 Married 91.6 15-20 years 5.8 Never 13.5 Farming 78.7
Male 48 Single 1.9 21-35 years 47 Primary 73.5 Farming & business 17.4
Divorced 1.9 36-45 years 17.4 Secondary 9 Farming & employment 3.9
Separation 0.6 46-55 years 12.3 Tertiary 0
Widowed 3.9 above 55 years 17.5 Adult literacy 4
The households engaged in different farming practices, with 57% of the respondents engaged in
production of field crops and 25% combined field crops and horticulture (Figure 2.3). About 85%
of the households had less than two acres of farm land while 15% had between two and five
acres of farm land.
Table 2.3: Percentages of respondents involved in different farming practices
Farming practices Percentage
Field crops only 57
Field crops + livestock 6
Field crops + poultry 3
Field crops + horticulture 25
Field crops + Livestock + horticulture 2
Field crops + Livestock + poultry 2
Field crops+ livestock + poultry + horticulture 2
Not sure 3
Analysis of Variance on the demographic characteristics showed that marital status, age,
income sources and education level were not significantly different among the EPAs, while
significant differences (p ≤ 0.05).were observed for the type of farming, farm sizes, and type of
crops grown in the three EPAs.
2.3.2 Most important crops grown by farmers
Maize, cassava, groundnuts, cotton, rice, sweet potato and pigeon peas were the most
important crops in Chinguluwe EPA. In Msitu, respondents mentioned maize, soybeans,
common beans, groundnuts and tobacco, while farmers in Ngwangwa EPA indicated maize,
groundnuts, tobacco, sweet potato, soybeans, and common beans as the most important crops

49
(Table 2.4). However, maize and groundnuts were the only crops mentioned in all the three
EPAs.
Table 2.4: Crops grown in each EPA in order of importance
Rank Chunguluwe EPA Msitu EPA Ngwangwa EPA
1 Maize Maize Maize
2 Cassava Soybeans Groundnuts
3 Groundnuts Common beans Tobacco
4 Cotton Groundnuts Sweet potato
5 Rice Tobacco Soybeans
6 Sweet potato
Common beans
7 Pigeon peas
2.3.3 Maize production at household level
About 56.8% of the households produced enough maize to feed their families for the whole year
but only 33.3% of these households realised surplus maize. The majority of the respondents fell
into two major categories, those that produced between 6 and 10 bags (50 kg) of maize/year
and more than 20 bags/ year (Fig 2.4). However, food sufficiency for the whole year at a
household depended on the family size.
Figure 2.4: Number of maize bags (50 kg) produced per household

50
2.3.4 Maize production constraints
There were differences on farmers’ perceptions on maize production constraints among the
three EPAs. In general, the most frequently mentioned maize production constraints were lack
of fertilizer, low soil fertility, pests, lack of good seeds, and drought (Figure 2.5).
Figure 2.5: Maize production constraints as indicated by farmers in the 3 Extension Planning
Areas (EPA)
2.3.5 Storage facilities, yield losses and control measures
Thirty eight percent (38%) of the households used traditional structures to store maize grain,
34.8% combined traditional structures and bags, 27.1% use bags. Farmers had experienced
maize losses in storage ranging from 0 to 100 %, with most respondents reporting losses of
25% and 50% of total production within six months after harvesting (Table 2.5).
Table 2.5: Number of respondents reporting yield losses in maize storage facilities
Yield loss Number of respondents Percentage
100% 3 1.9
75% 10 6.5
50% 54 34.8
25% 43 27.7
0% 8 5.2
not sure 37 23.9
155 100

51
Larger grain borer, maize weevil and rodents were reported as the most common storage pests.
Farmers use different control measures to protect their harvest from insect pest attacks, such as
insecticides, general sanitation, use of tolerant varieties, grain processing, and early harvesting.
The use of synthetic pesticides, such as actellic dust, is the single most commonly used control
measure (used by 52.3% of the farmers). However, most of the times farmers used different
combinations of control measures to protect maize grain which was a form of Integrated Pest
Management.
2.3.6 Interaction between farmers and agricultural extension workers
Fifty four percent (54%) of the households had an excellent interaction with the Agricultural
extension officers on storage related problems, 29% discussed storage problems in passing,
while 17% indicated that they had never discussed any storage problems with their extension
officers. Highly significant differences (p<0.001) for interaction levels between farmers and
extension officers on storage problems were observed among the EPAs (Table 2.6).
Table 2.6: Level of interaction between farmers and extension workers on storage related
problems
Name of EPA Excellent Good Fair Poor None Total
Chinguluwe
33 11 7 11 2 64
Msitu
15 11 7 9 0 42
Ngwangwa
6 9 5 14 15 49
Total 54 31 19 34 17 155 Note: Figures in the table are absolute numbers Pearson Chi-square = 41.459
2.3.7 Type and source of maize seeds
Most respondents used hybrid seeds (59%), followed by those that combined hybrids and open
pollinated varieties (OPV) (32%) and 9% used OPVs only. Farmers got their seeds mainly
through recycling, Government subsidy programme, and from commercial seed companies.

52
2.3.8 Farmers’ perception on important maize characteristics
For maize crop in general, grain size, yield, cob size, poundability, resistance to pests and
diseases, storability, and drought tolerance were perceived as the most important attributes by
the respondents. However, preferences for maize attributes were significantly different between
the EPAs (p ≤ 0.01). Hybrids were cultivated mainly because of their high yield potential and
early maturity than local varieties, while local maize varieties were grown due to good tolerance
to pests and diseases, large grain size, large cob size, good yields under low soil fertility, white
color, superior poundability, drought tolerance and high storability than hybrids. Preference on
traits was generally the same in all the three EPAs (Fig 2.6).
Figure 2.6: Important attributes for selecting local maize varieties
2.3.9 Prioritization on the most important characteristics for local
varieties by farmers
During the focus group discussions, respondents were divided into two groups based on
gender. One group comprised of males and the other group was made up of females to
prioritize on the most important characteristics for local varieties using a scale of 1-8, with 1
being the most important maize characteristic and 8 the least important. Differences in
prioritization appeared among the EPAs and between the groups. Yield featured highly as the
most important attribute (Table 2.7). In Ngwangwa EPA, the group was predominantly male
(only one female), as such gender differences did not apply. The ranking was therefore done by

53
males. Using spearman’s rho, correlation in the rankings between males and females in each
EPA were significant. For instance, in Chunguluwe the correlation in ranking between sex was
significant (p<0.01) with a correlation coefficient of 0.857**, while at Msitu the correlation was
significant (p<0.05) with a correlation coefficient of 0.810*.
Table 2.7: Ranking of traits in local varieties by sex
Extension Planning Area (EPA)
Ngwangwa Chinguluwe Msitu
Trait Males Males Females Males Females
Grain size 5 5 5 1 3
Cob size 6 3 4 2 2
Yield 1 1 1 3 1
Poundability 4 4 2 4 4
Color 7 8 7 5 5
Taste 8 7 6 6 8
Storability 3 6 8 7 7
Pest and disease resistance 2 2 3 8 6
Scale 1-8, 1= most important, 8= least important
2.3.10 Traits used by farmers to identify storage pest tolerant varieties
Farmers identified grain hardness, grain size, grain color, poundability and grain texture as the
main characteristics used to identify maize varieties that are tolerant to storage pests especially
maize weevil and larger grain borer. Surprisingly, 60% of respondents indicated that they would
rather get slightly low yielding varieties with high levels of resistance to storage pests than high
yielding varieties that are highly susceptible to storage pests.
2.4 Discussion
The distribution between males and females in the sample followed the national trend where
approximately 51% of the population are women and 49% are me (NSO, 2008). Most of the
farming households were male headed which is typical of Malawi society. Most farmers were
largely young (21-35 years), having attended mainly primary school education. This could
probably be attributed to high numbers of primary school drop outs. For instance, in 2007,
primary school dropout in Malawi was estimated at 65% (Sabates et al., 2011). Some of these
pupils end up engaging themselves in farming activities. Though there were differences on the
type of crops grown in the areas, maize and groundnuts were the most common crops grown.

54
About 58% of households produce enough maize for the whole year, few produce surplus maize
(18%), slightly lower than national average of 20% (FAOSTAT, 2008). Therefore, there is need
for an urgent intervention to reduce the post-harvest losses that farmer’s incur in storage, as it
increases food deficit.
Lack of fertilizer, low soil fertility, pests, lack of quality seeds and drought were the main
constraints to maize production. Lack of fertilizer and seeds can ably be handled by the
government by making farm inputs affordable to smallholder farmers. The problem of pests and
diseases, low soil fertility and drought need the intervention of researchers and breeders to
provide a long term solution. This could be achieved through the development of maize varieties
that are pest resistant, drought tolerant and nutrient utilization-efficient.
Farmers mostly use hybrid maize seeds, followed by those that combine hybrid and local
varieties. This concurs with Fisher and Mazunda (2011) who reported that farmers in Malawi
use hybrid seeds but they also keep their local varieties. It is worth noting that farmers in these
areas have specific hybrids they like, such as DK33, DK 9089, SC 403 and Njovu among a host
of varieties available on the market. Farmers however, lamented that most of the maize hybrids
are susceptible to storage pests and easily rot, as such they would only opt to increase the
acreage of hybrid maize only if they can afford the purchase of pesticides, such as Actellic.
Otherwise they would opt for local varieties. This therefore means that farmers have different
perceptions from researchers on yield potential, production constraints and resistance to
postharvest grain pests in local varieties. In that case, provision of high yielding insect resistant
varieties would offer a solution to the quagmire farmers face in making decisions on maize
varieties to cultivate. Farmers further complained that most hybrids especially those from
multinational seed companies do not stay long on the market despite their preference. They
believe that these companies do not serve the interests of the farmers but just making profits
out of them.
Farmers were aware of the need to have maize varieties that are tolerant to insect pests and of
the existing resistance variation among varieties especially between maize hybrid and locally
varieties. Gilbert and Jones (2012) reported that farmers are aware of the large postharvest
losses in the improved varieties as compared to local varieties. The use of traditional grain
storage structures, bags and a combination of traditional structures and bags to keep maize was
common. For example, soon after harvesting, farmers keep their maize with husks in traditional

55
structures, when maize cobs are completely dry, cobs are shelled and grains are stored in bags.
Losses of maize in storage are attributed to LGB, maize weevil and rodents. About 24% of the
farmers were not sure of the yield losses experienced in their households due to storage pests
simply because they never bothered to quantify maize losses incurred in their storage facilities.
Others claimed that they did not have enough maize to last long enough to observe grain losses
in storage.
In general, grain size, yield, cob size, poundability, resistance to pests and diseases, storability
and drought tolerance were the most desired traits in maize. The results agreed with Holden
and Lunduka (2010) who reported that farmers in Malawi use a wide range of traits for selecting
maize materials for planting. Specifically, high yielding and early maturity were the main reasons
for farmers opting for maize hybrids, while good tolerance to pests and diseases, large grain
size, high storability, and superior poundability were some of the main reasons for farmers
choosing local varieties. Interestingly, farmers in this study did not perceive taste in local
varieties as an important trait. This could signal a significant shift in farmers’ perception on
important traits for opting local maize varieties.
Fisher and Mazunda (2011) reported that storage, high poundability, high flour-grain ratio, and
good taste are the key characteristics that farmers look for in local varieties. Holden and
Lunduka (2010) also reported storability, poundability, taste, and high flour–grain ratio as farmer
preferred traits. Reports from other countries, such as Zambia indicate storability, recyclability,
good flour quality, high yielding, readily availability of seed and lack of cash as some of the
reasons farmers opt for local varieties (Miti, 2007). Mukanga et al. (2011) reported that farmers
look for high yielding, drought tolerance, early maturing, resistance to storage pests and husk
cover in opting local varieties and landraces.
Storability, grain hardness, grain size, grain colour, poundability and grain texture were the main
maize attributes that farmers use for selecting maize varieties with resistance to MW and LGB
Interestingly, grain hardness and other physical grain characteristics have been reported to
confer resistance to storage pest damage caused by LGB and MW (Arnason et al., 1992;
Kasambala, 2009).

56
2.5 Breeding perspective
Taking into consideration the wide range of attributes that farmers use when choosing varieties
for planting, selection of a large breeding population is a prerequisite when developing maize
varieties for small holder farmers. Breeding for insect pest resistant maize varieties should focus
on yield and other biophysical grain characteristics, such as grain hardness, grain size, grain
colour, poundability and grain texture. Maize breeders should also consider incorporation of
other important traits such as drought tolerance, pest and diseases resistance and cob size that
were perceived as critical by famers. Since farmers tend to keep their own local seeds, apart
from developing hybrids, breeding initiatives should also focus on developing improved open
pollinated varieties.
2.6 Conclusion
Farmers in Malawi still cultivate both hybrid and local varieties and use a wide range of traits to
select desirable maize varieties for planting. Farmers generally perceive yield as the most
important trait in maize varieties. However, under certain circumstances, such as when the
hybrid varieties are very susceptible to storage pests and have no resources to buy pesticides,
they would opt to grow local varieties. To increase the chances of adoption of varieties by
farmers, as many traits as practically possible should be incorporated in the selection index.
Breeding for insect resistant maize varieties should focus at developing both hybrids and
improved OPVs. Therefore, farmer requirements should be incorporated in the conventional
breeding programmes in Malawi. Storability and other traits should be bred in hybrids that are
preferred by farmers.
References
Arnason, J.T., J. Gale, B.C.D. Beyssac, A. Sen, S.S. Miller, B.J.R. Philogene, J.D.H. Lambert,
R.G. Fulcher, A. Serratos, and J. Mihm. 1992. Role of phenolics in resistance of maize
grain to the stored grain insects, Prostephanus truncatus (horn) and sitophilus zeamais
(motsch.). Journal of Stored Products Research 28:119-126.
Binder, K.F. 1992. Strategy on containment of the larger grain borer in Malawi. Plant Protection
Workshop, 1–5 June 1992, Lilongwe, Malawi.

57
Chambers, R. 1992. Methods for analysis by farmers: The Professional Challange Association
for Farming Systems Research/Extension 1991-1992 Symposium. University of Sussex,
England, Michigan State University.
Ching’oma, P. 2009. Spatial and temperal distribution of the larger grain borer, Prostephanus
trancatus (Horn) and the predator, Teretrius nigrescens Lewis in relation to weather
parameters. Makoka Agricultural Research Station, Thondwe, Malawi.
CIMMYT. 2001. CIMMYT 1999-2000 World maize facts and trends. Meeting world maize needs:
Technological opportunities and priorities for the public sector. CIMMYT, Mexico, D.F.
Denning, G., P. Kabambe, P. Sanchez, A. Malik, and R. Flor. 2009. Input subsidies to improve
smallholder maize productivity in Malawi: Towards an African green revolution. Public
Library of Science Biology 7(1): e1000023.doi:10.1371/journal.pbio.1000023. Available
at http://www.plosbiology.org. Accessed on 30 June 2010. Public Library of Science,
USA.
Derera, J., P. Tongoona, A. Langyintuo, M.D. Laing, and B. Vivek. 2006. Farmer perceptions on
maize cultivars in the marginal eastern belt of Zimbabwe and their implications for
breeding. African Crop Science Journal 14:1-15.
FAOSTAT. 2008. Food and Agriculture Organisation. Available at http://faostat.fao.org.
Accessed on 3 July 2010. FAO, Rome.
Fisher, M., and J. Mazunda. 2011. Could low adoption of modern maize varieties in Malawi be
explained by farmers’ interest in diverse seed characteristics? International Food policy
Research Institute.
Gilbert, J., and M. Jones. 2012. Does access to storage protectant increase smallholder
adoption of improved maize seed? Insights from Malawi Agricultural & Applied
Economics Association’s 2012 AAEA Annual Meeting, Seattle, Washington.
Holden, S., and R. Lunduka. 2010. Impacts of the fertilizer subsidy programme in Malawi:
Targeting, household perceptions, and preferences. Norwegian University of Life
Sciences, Norway.
International Food Policy Research Institute (IFPRI). 2010. Agricultural Development Division
(ADD) map.www.ifpri.org.
Kamanula, J., G.W. Sileshi, S.R. Belmain, P. Sola, B.M. Mvumi, G.K.C. Nyirenda, S.P.
Nyirenda, and P.C. Stevenson. 2011. Farmers’ insect pest management practices and
pesticidal plant use in the protection of stored maize and beans in Southern Africa.
International Journal of Pest Management 57:41–49.

58
Kasambala, T. 2009. Prostephanus truncatus (Horn) (Coleoptera: Bostrichidae) infestation
levels on different maize varieties in Malawi. Resistant Pest Management Newsletter 19
(1):9-13. Center for Integrated Plant Systems (CIPS).
Ministry of Agriculture and Water development. 2012. Crop estimates report, unpublished,
Lilongwe, Malawi.
Miti, F. 2007. Breeding investigations of maize (Zea mays L.) genotypes for tolerance to low
nitrogen and drought in Zambia. Pietermaritzburg, University of KwaZulu-Natal, PhD
Thesis in Plant Breeding, South Africa.
Mukanga, M., J. Derera, P. Tongoona, and M.D. Laing. 2011. Farmers’ perceptions and
management of maize ear rots and their implications for breeding for resistance. African
Journal of Agricultural Research 6(19):4544-4554.
NSO. 2008. 2008 Population and Housing Census. Report. National Statistical Office, Zomba ,
Malawi.
Nukenine, E.N. 2010. Stored product protection in Africa: Past, present and future. p. 425 10th
International Working Conference on Stored Product Protection. Julius-Kühn-Archiv.
Ouma, J.O., and H.D.Groote. 2011. Maize varieties and production constraints: Capturing
farmers’ perceptions through participatory rural appraisals (PRAs) in Eastern Kenya.
Journal of Development and Agricultural Economics 3(15):679-688.
Sabates, R., K. Akyeampong, J. Westbrook, and F. Hunt. 2011. Paper Commissioned for the
EFA Global Monitoring Report 2011. The hidden crisis: Armed conflict and education,
Center for International Education, University of Sussex, UK.
Statistical Package for Social Scientists Inc. Released 2007. SPSS for Windows, Version 16.0.
Chicago, SPSS Inc.
World Bank. 2011. Missing food: The case of post-harvest grain losses in Sub- Saharan Africa.
Report 60371-AFR.

59
Chapter 3
Phenotypic and molecular genetic diversity of local maize varieties in Malawi
Abstract
Breeding for storage insect pest resistance in maize is an important breeding initiative in
Malawi. Identification of existing genetic diversity among local maize varieties is fundamental in
exploring parents for such breeding programmes. The objective of the study was to determine
genetic marker diversity of the potential breeding sources for use in introgressing larger grain
borer and maize weevil resistance genes in farmer-preferred local varieties. Sixty eight (68)
local maize varieties were characterised for genetic diversity using 15 phenotypic markers and
41 SSR markers. Local maize varieties showed significant variation (P<0.05) for plant height,
ear placement, kernel colour, kernel size, kernel type, days to tassel, days to silking, ear
damage, 1000 kernel weight, number of kernel rows. The observed variation in the local
varieties was mainly due to 1000 kernel weight, plant height and ear placement. Using
phenotypic data, the local varieties were grouped into eight clusters. SSR markers revealed
97.56% polymorphism among the loci. A total of 165 alleles were detected, with a range of 2-9
alleles and an average of four (4) alleles per locus. Gene diversity (He) ranged from 0.0298 to
0.7905, with a mean of 0.5115. Heterozygosity (Ho) ranged from 0-1, with a mean of 0.5233.
Polymorphism Information Content (PIC) ranged from 0.094 to 0.7565 and showed a mean of
0.4548. A total of 303 allele pairs were obtained, ranging from 2-17 allele pairs per locus. The
frequency of major alleles ranged from 0.2540 to 0.9848. The furthest genetic distance was
between varieties 206 and local 2 (0.9001) and the shortest genetic distance was between
varieties 203 and 811 (0.2189). Based on SRR marker data, the local varieties were grouped
into ten clusters. Local maize varieties expressed substantial levels of genetic diversity both at
phenotypic and molecular levels. The expressed variation provides an opportunity to explore
local maize varieties for useful levels of resistance to maize weevil and larger grain borer.
Key words: Genetic diversity, local maize varieties, phenotypic markers, SSR markers

60
3.1 Introduction
Phenotypic and molecular characterization plays a crucial role in crop improvement through the
identification of variation of individuals and/or populations (Jarvis and Hodgkin, 2005). Variation
is important in plant breeding for the identification of cultivars, selection of parents, introgressing
of genes into a population and development of new hybrids (Li et al., 2002; Xia et al., 2004;
Jarvis and Hodgkin, 2005; Magorokosho, 2006). Genetic diversity within a population is
measured by the number of polymorphic genes, number of alleles for each polymorphic gene
and the number of genes per individual that are polymorphic (Magorokosho, 2006).
Genetic markers have been employed to characterize materials for genetic diversity and have
revealed existing variation among individuals or populations (Jarvis and Hodgkin, 2005). These
genetic markers can be phenotypic, biochemical and molecular in nature (Jones et al., 1997).
Based on phenotypic and molecular markers, maize has been identified as one of the most
diverse crops in the world (Buckler et al., 2006) exhibiting high levels of genetic diversity (Jaric
et al., 2010). Because of the wide variation that exists in maize, it is widely grown in different
environments across the globe (Shah et al., 2010).
Maize (Zea mays L.) is widely grown in Malawi (Ngwira, 2001; Denning et al., 2009). However,
its potential yield is compromised by insect pest damage in storage especially maize weevil
(MW) and larger grain borer (LGB) (Ching’oma, 2009; Kamanula et al., 2011). This therefore,
dictates the need to search for maize materials with useful resistance to such storage pests. A
wide genetic diversity among these materials is prerequisite for successful implementation of
such breeding initiatives. Breeding for storage insect pest resistance in maize is possible though
little progress has been made in identifying genetic resistance of maize grain to storage insects
(Derera et al., 2000). For instance, maize has not been fully exploited in breeding programmes
especially landraces due to underutilisation of available genetic variation (Warburton et al.,
2008). Landraces can be a good source of resistance (Mwololo et al., 2012). Identification of
existing genetic diversity among local maize varieties in Malawi would be a starting point in the
exploration and exploitation of maize materials for storage insect pest resistant breeding
programme. The identified resistant varieties could be used to introgress LGB and MW
resistance genes in farmer-preferred local varieties or develop new maize populations resistant
to maize weevil and larger grain borer.

61
Studies have been conducted to identify genetic diversity in maize populations using phenotypic
and molecular markers. Warburton et al. (2008) assessed genetic diversity among maize
landraces at molecular level and reported the uniqueness of maize landraces as source of new
alleles not present in introduced open pollinated varieties. Magorokosho (2006) explored maize
diversity in maize varieties from Malawi, Zambia, Zimbabwe, USA and CIMMYT using both
phenotypic and molecular markers. According to Magorokosho (2006) open pollinated varieties
and landraces grown by farmers in these countries have substantial variation and contain
unique traits not present in improved varieties. Reif et al. (2004, 2005) successfully determined
the levels of genetic diversity within CIMMYT materials and European maize landraces using
SSR markers. Apart from the diversity work done by Magorokosho (2006) that revealed genetic
diversity among maize varieties in Malawi, Zambia and Zimbabwe, no comprehensive work has
been done or documented in Malawi to reveal the extent of genetic diversity that exists in local
maize varieties tailored for a specific maize breeding programme such as storage insect pest
resistance screening. In addition to maize hybrids, farmers continue to grow local maize
varieties (Fisher and Mazunda, 2011) partly due to their storability. Hence the need to determine
genetic marker diversity of the potential breeding sources for use in introgressing LGB and MW
resistance genes in farmer-preferred local varieties and the development of new insect resistant
maize populations.
3.2 Study objectives
The objectives of the study were to:
a. Assess genetic diversity in local maize varieties using phenotypic markers.
b. Quantify genetic diversity in local maize varieties using SSR markers.
3.3 Materials and methods
3.3.1 Phenotypic diversity analysis of local maize varieties
3.3.1.1 Plant materials and planting
Sixty eight (68) local maize varieties were collected from the National Gene Bank (65) and
smallholder farmers (3) in Malawi (Table 3.1).

62
Table 3.1: List of local maize varieties and origin
Variety District Longitude Latitude Altitude Variety District LLongitude Latitude Altitude
172 Nkhatabay 34° 03´ 11° 38´ 650 m 2027 Lilongwe 34° 04´ 14° 02´ 131.5m 243 Mzimba 33° 32´ 12° 05´ 45m 289 Karonga 33° 44´ 9° 45´
322 Rumphi 33° 54´ 11° 12´ 38m 1786 Dedza 250 Mzimba 33° 20´ 12° 14´ 38.4m 699 Zomba 36° 26´ 15° 40´
1772 Ntcheu 34° 45´ 15° 01´ 91.9m 2872 Likoma 34° 44´ 12° 02´ 55m 740 Balaka 34° 54´ 15° 15´
Local 1 Dowa
787 Machinga 35°32´ 14° 52´
164 Nkhatabay 34° 14´ 11° 35´ 510m 3414 Zomba 35° 04´ 15° 31´ 51.8m 1992 Dedza 34° 25´ 14° 18´ 158.9m 3411 Zomba 35° 11´ 15° 23´
725 Balaka 35° 00´ 14° 55´
629 Thyolo 35° 12´ 15° 09´ 880m 148 Mzimba 35° 44´ 11° 18´ 1150m 163 Nkhatabay 33° 57´ 11° 43´ 1300m 206 Mzimba 33° 27´ 11° 57´ 1200m 1795 Dowa 34° 16´ 13° 42´ 65.4m 315 Mzimba 33° 26´ 11° 15´ 1100m 218 Mzimba 33° 20´ 11° 53´ 37.4m 1845 Ntchisi 33° 52´ 13° 22´ 141.1m 696 Zomba 35° 21´ 15° 34´
260 Chitipa 33° 41´ 10° 20´
199 Mzimba 33° 37´ 11° 56´ 1410m 2012 Lilongwe 33° 58´ 14° 09´ 131.5m 410 Chikwawa 34° 41´ 16° 22´
445 Chikwawa
752 Balaka 34° 55´ 15° 03´
249 Mzimba 33° 29´ 12° 13´ 1300m 332 Mzimba 33° 54´ 11° 12´ 1180m 741 Balaka 34° 54´ 15° 11´
145 Mzimba 33° 45´ 11° 26´ 1200m 193 Mzimba 33° 36´ 11° 54´ 1350m 2017 Lilongwe 33° 58´ 14° 09´ 131.5m 811 Mangochi 35° 33´ 14° 40´
310 Mzimba 33° 36´ 11° 17´ 1140m 1983 Dedza 34° 24´ 14° 21´ 163.8m 139 Mzimba
226 Mzimba 33° 27´ 11° 41´ 1210m
569 Chiradzulu 35° 18´ 15° 57´ 710m 1915 Kasungu 33° 23´ 12° 47´ 98.5m 736 Balaka 35° 03´ 14° 58´
Local 2 Lilongwe
303 Mzimba 33° 38´ 10° 52´ 1120m 1850 Dowa 33° 46´ 13° 28´ 136.4m 292 Karonga 33° 50´ 9° 58´ 600m 403 Nsanje 35° 15´ 16° 27´ 1350m 240 Mzimba 33° 26´ 11° 23´ 1120m Knjnj Blantyre
386 Nsanje 35° 10´ 17° 05´
3243 Mzimba 750 Balaka 34° 53´
2862 Karonga 34° 02´ 10° 09´ 52.6m
3244 Mzimba
783 Machinga 35° 32´ 14° 55´ 203 Mzimba 33° 32´ 11° 53´ 1260m 539 Phalombe 35° 44´ 15° 40´ 710m
1857 Dowa 33° 25´ 13° 25´ 119.16m 637 Thyolo 35° 15´ 16° 23´ 240m 584 Chiradzulu 35° 08´ 15° 33´ 955m 1892 Mchinji 33° 50´ 13° 57´ 127.4m 297 Karonga 33° 58´ 10° 03´ 520m 154 Nkhatabay 33° 58´ 11° 43´ 1000m
The varieties were planted at Chitedze Research Station and Chimoto during the 2011/2012
and 2013/2014 growing seasons, respectively. The two locations belong to two different agro-
ecological zones. Field planting was done using the Alpha lattice design (10 blocks and 6/7
entries per block) with 3 replicates. Each replicate was 10 m in width and 124 m in length, giving
a total field area of approximately 3720m2. One unplanted ridge separated the rows and 4
unplanted ridges separated the blocks. One seed was planted at 25 cm between planting
stations and 75 cm between rows. A 10 m row represented a plot, translating to approximately
40 plants per plot and 120 plants in total per variety. Hybrid maize “DK8053” was used in guard
rows. As a standard practice in Malawi, basal application of fertilizer was done using NPK
(23.21.0+4S) and top dressing was done using Urea (46% N) fertilizer at 100kg/ha. Maize fields

63
were weeded twice and an insecticide “Karate” (lambda-cyhalothrin) was applied to control
termites.
3.3.1.2 Data collection
Data was collected based on phenotypic descriptors associated with grain characteristics and
some important agronomic descriptors. The characteristics measured included, plant height
(measured from ground level to the base of the tassel after milking stage), ear placement (from
ground level to the node bearing the upper most ear after milking stage), kernel colour, days to
tasselling (number of days from sowing to when 50% of the plants had shed pollen), days to
silking (number of days from sowing to when silks had emerged on 50% of the plants) kernel
type, husk extension, ear damage, kernel row arrangement (using the upper most ear), number
of kernel rows (number of kernel rows were determined in the central part of the uppermost
ear), kernel colour, kernel size, number of ears per plant, 1000 kernel weight (g), number of
tassel branches and yield.
3.3.1.3 Statistical analysis
Data collected was analysed in GenStat Release 14 (Payne et al., 2011). Analysis of Variance
(ANOVA) was applied to observe variation among phenotypic traits. Correlation analysis was
used to assess relationships between phenotypic traits. Principal component analysis was
employed to identify phenotypic traits that significantly contributed to the phenotypic variation
observed in the local maize varieties. Cluster analysis using the unweighted pair-group method
with arithmetic averages (UPGMA) was applied to identify group formations among maize
varieties. Broad-sense heritability was calculated based on the ANOVA as follows (Hallauer and
Miranda, 1988):
=
H2 = Broad -sense heritability
= Mean sum of square for varieties
= Mean sum of square for error

64
r = Replication
3.3.2 Molecular diversity of local maize varieties using SSR markers
3.3.2.1 Plant materials and SSR markers
Seeds from sixty seven (67) maize varieties (Table 3.1) were sent to BecA hub in Kenya for
genotyping services. Each genotype was represented by 15 seeds (plants). Seeds were planted
in the green house at BecA and three weeks after germination, bulked leaf tissues were
harvested from all 15 plants for each variety. Forty one (41) markers which have been used in
maize analysis before were picked for the analysis (Table 3.2).
Table 3.2: List of 41 SSR markers used for molecular diversity analysis of local maize varieties
Marker Motif Forward_Primer Reverse_Primer Annealing_Tm
nc130 AGC gCACATgAAgATCCTgCTgA TgTggATgACggTgATgC 54 nc133 GTGTC AATCAAACACACACCTTgCg gCAAgggAATAAggTgACgA phi014 GGC ggACCTCATCggCAACAA CCTCgCTgCTTCgTTCTTATC phi029 AGCG TTgTCTTTCTTCCTCCACAAgCAgCgAA ATTTCCAgTTgCCACCgACgAAgAACTT 56 phi031 GTAC gCAACAggTTACATgAgCTgACgA CCAgCgTgCTgTTCCAgTAgTT 60 phi034 3bp TAgCgACAggATggCCTCTTCT ggggAgCACgCCTTCgTTCT 62 phi041 AGCC TTggCTCCCAgCgCCgCAAA gATCCAgAgCgATTTgACggCA 56 phi046 ACGC ATCTCgCgAACgTgTgCAgATTCT TCgATCTTTCCCggAACTCTgAC 60 phi056 CCG ACTTgCTTgCCTgCCgTTAC CgCACACCACTTCCCAgAA 56 phi062 ACG CCAACCCgCTAggCTACTTCAA ATgCCATgCgTTCgCTCTgTATC 56 phi063 TATC ggCggCggTgCTggTAg CAgCTAgCCgCTAgATATACgCT phi065 CACTT AgggACAAATACgTggAgACACAg CgATCTgCACAAAgTggAgTAgTC phi069 GAC AgACACCgCCgTggTCgTC AgTCCggCTCCACCTCCTTC phi072 AAAC ACCgTgCATgATTAATTTCTCCAgCCTT gACAgCgCgCAAATggATTgAACT 56 phi075 CT ggAggAgctCACCggCgCATAA AAAggTTACTggACAAATATgC 54 phi076 GAGCGG TTCTTCCgCggCTTCAATTTgACC gCATCAggACCCgCAgAgTC phi079 CATCT TggTgCTCgTTgCCAAATCTACgA gCAgTggTggTTTCgAACAgACAA phi084 GAA AgAAggAATCCgATCCATCCAAgC CACCCgTACTTgAggAAAACCC 54 phi085 AACGC AgCAgAACggCAAgggCTACT TTTggCACACCACgACgA phi090 ATATC CTACCTATCCAAgCgATggggA CgTgCAAATAATTCCCCgTgggA phi093 AGCT AgTgCgTCAgCTTCATCgCCTACAAg AggCCATgCATgCTTgCAACAATggATACA phi102228 AAGC ATTCCgACgCAATCAACA TTCATCTCCTCCAggAgCCTT 54 phi108411 AGCT CgTCCCTTggATTTCgAC CgTACgggACCTgTCAACAA phi112 AG TgCCCTgCAggTTCACATTgAgT AggAgTACgCTTggATgCTCTTC phi114 GCCT CCgAgACCgTCAAgACCATCAA AgCTCCAAACgATTCTgAACTCgC 60 phi123 AAAG ggAgACgAggTgCTACTTCTTCAA TgTggCTgAggCTAggAATCTC phi127 AGAC ATATgCATTgCCTggAACTggAAggA AATTCAAACACgCCTCCCgAgTgT phi227562 ACC TgATAAAgCTCAgCCACAAgg ATCTCggCTACggCCAgA 56 phi299852 AGC gATgTgggTgCTACgAgCC AgATCTCggAgCTCggCTA phi308707 AGC gCAACAAgATCCAgCCgAT gTCgCCCTCATATgACCTTC 54 phi331888 AAG TTgCgCAAgTTTgTAgCTg ACTgAACCgCATgCCAAC phi374118 ACC TACCCggACATggTTgAgC TgAAgggTgTCCTTCCgAT 56 phi96100 ACCT AggAggACCCCAACTCCTg TTgCACgAgCCATCgTAT 56 umc1161 GCTGGG ggTACCgCTACTgCTTgTTACTgC gCTCgCTgTTggTAgCAAgTTTTA 56 umc1266 CAG CACAggTAAAAgTAAACgCACACg CTC gTCATTTTCAACgTCCTCTTT umc1304 TCGA CATgCAgCTCTCCAAATTAAATCC gCCAACTAgAACTACTgCTgCTCC umc1367 CGA TggACgATCTgCTTCTTCAgg gAAggCTTCTTCCTCgAgTAggTC 62 umc1545 AAGA gAAAACTgCATCAACAACAAgCTg ATTggTTggTTCTTgCTTCCATTA umc1917 CTG ACTTCCACTTCACCAgCCTTTTC ggAAAgAAgAgCCgCTTggT 52 umc2047 GACT gACAgACATTCCTCgCTACCTgAT CTgCTAgCTACCAAACATTCCgAT umc2250 ACG ACAggTCACAgATgTTCATCCAgg CTCgACTggATCgCCTCCTC 58

65
3.3.2.1.1 Harvesting of plant tissues
Plant tissues were harvested using a well labelled 96-well box containing one stainless steel ball
in each tube. Tubes were placed in ice bucket filled with liquid nitrogen for cooling. A 96–well
grid worksheet was positioned in the same way as the plate and labelled accordingly as tissues
were being harvested. Approximately 1.2 cm2 of leaf tissue was placed into each tube.
3.3.2.1.2 DNA extraction
DNA was extracted using a modified CTAB procedure (BecA hub laboratory protocol, Kenya) as
follows. The freeze-dried leaf sample (at least 0.01g lyophilized tissue) was crushed into fine
powder using GenoGrinder-2000 at a speed of 500 strokes per minute for four minutes. Tubes
were spun down for about two to three minutes to bring down the tissues into the bottom of the
tube. Freshly prepared modified CTAB extraction buffer (600 ul) was added and ground for two
minutes. The samples were incubated at 650C water bath for 30 minutes with continuous gentle
shaking. Tubes were inverted once every ten minutes to homogenize the tissue with the
extraction buffer then removed from the water bath and allowed to cool for five to ten minutes in
fume hood. Tubes were again centrifuged at 3500 rpm for ten minutes at 150C. An aqueous
phase (500 ul) was transferred into new tubes. Chloroform: isoamylalcohol (24:1) (400 ul) was
added into the side of the tubes. The contents were mixed with gentle continuous shaking for 30
minutes at room temperature then centrifuged at 3500 rpm for ten minutes. The aqueous layer
was transferred to fresh strip tubes and the chloroform: isoamylalcohol wash was repeated. The
upper aqueous layer (400 ul) was transferred into fresh strip tubes and 300 ul of 100% cold
isopropanol stored at -200C was added. The contents were mixed gently in the tubes for five
minutes to precipitate the nucleic acid and kept frozen over night at -200C. The tubes were left
on the bench for five to ten minutes, while being gently inverted for about 50x until whitish
substance floated. The contents were then centrifuged at 3500 rpm for 30 minutes to form
pellets at the bottom of the tube. The supernatant were discarded. About 400 ul of 70% ethanol
was added into the tubes and gently inverted to let the pellet float for ease of washing, then
centrifuged for 15 minutes. Ethanol was discarded by decantation. The pellet was washed with
200 ul of 70% ethanol and centrifuged for 15 minutes. Ethanol was discarded by decantation.
The pellet was allowed to air dry for one hour until ethanol evaporated. A 10mM Tris-HCL at ph
8.3 (150 ul) was added into the tubes and incubated for about 45 minutes at 450C water bath
with gentle tapping every ten minutes. RNase (3 ul) was added after the pellets have completely

66
dissolved. The RNase was spun down with the centrifuge at 3500 rpm for one to two minutes
and incubated at 370C water bath for three hours. The samples were kept in fridge at 40C
awaiting further analysis.
3.3.2.1.3 Quality control and normalization of DNA samples
About 2ul of DNA was loaded in a 0.8% agarose gel and electrophoresed at 120 volts/hour to
check the overall sample quality. Most of the samples were found to be of good quality with
intact DNA. The concentration and quality were further determined by OD reading using a
nanodrop ND-8000. The concentrations were used to guide the normalisation of each sample at
a concentration of 50ng/ul. In addition, the ratio 260/280 was provided by the nanodrop
revealing purity of the samples. The ratio of most samples was 1.8 to 2.0 within the eptable
range for subsequent analysis.
3.3.2.1.4 PCR procedure
PCR reaction conditioning for amplification of DNA was implemented using buffer (10x), MgCl2
(10mM), dNTPs (2.5mM), 1.0 pmoles/ul of primer (F&R), TaqDNA polymerase (5.0U/ul), water,
and DNA (50ng/ul). A six step thermal cycler programme was implemented (Table 3.3).
Table 3.3: PCR reaction conditioning for maize DNA sequencing
Components Stock concentration One reaction in 10ul
Buffer 10X 1.0 ul MgCl2 10mM 0.8ul dNTPs 2.5mM 0.8ul Primer F & R 1.0 pmoles/ul 0.2ul TaqDNA polymerase 5.0 U/ul 0.075ul H2O
4.725ul
DNA 50 ng/ul 1.0ul Final volume 10ul
Thermal cycler programme 1. 94
0C x 3 minutes
2. 940C x 30 seconds
3.520C-60
0C x 1 minute for 35 cycles
4. 720C x 2.0 minutes
5. 720C x 10 minutes
6. 40C hold
3.3.2.1.5 DNA fragment analysis procedure
Approximately 1.0 ml of HIDI-formamide was pipetted into 1.5 ml eppendorf tube. About 12.0 ul
of LIZ-500 size standard was added and mixed by vortexing. An aliquot of 9 ul was mixed into

67
each of 96 well plates. PCR products (1.2 ul) were added and denatured at 950C then quickly
cooled in ice for five minutes.
3.3.2.1.6 Fragment analysis
The PCR products were ran and detected on capillary system ABI-3730 and ABI-3130 using the
LIZ500 as internal size standard.
3.3.2.1.7 Data analysis and output
The data from markers was captured using the genescan collection software (Applied bios
stems) and the fragments analysed using the gene mapper software version 4.1 (Applied
biosystems). A total of 2675 data points were achieved out of the expected 2747 data points
giving an overall success rate of 97.4%. The data was compiled into a spread sheet as a
standard genemapper output file. The output file was composed of sample ID and marker to
identify each genotype. Ned(Y) Pet R) 6-FAM (B) and Vic (G) were used as reference dyes. The
sizes for each detected allele were indicated in base pairs. Parameters considered for data
quality were indicated in the peak height and genotyping quality (GQ) columns of the excel file
(Table 3.4). The lower peaks were verified manually and discarded where necessary. Statistical
analysis of data was done using Power marker, version 3.25 (Liu and Muse, 2005) and
Popgene, version 1.32 (Yen and Yan, 2002).
Table 3.4: Partial marker data output
Sample ID Marker Dye Allele 1 Allele 2 Size 1 Size 2 Height 1 Height 2 Peak Area 1 Peak Area 2 GQ
811 phi10228 Y 121 121 120.97 120.97 32576 32576 239086 239086 0.1735 1850 phi10228 Y 121 125 120.95 125.19 17340 3283 99053 19563 1 LOCAL1 phi10228 Y 121 125 121.19 125.18 15639 20681 92146 110788 0.1405 811 nc130 G 139 139 138.44 138.44 17832 17832 109431 109431 1 1850 nc130 G 139 139 138.43 138.43 15446 15446 89523 89523 0.3945 LOCAL1 nc130 G 139 141 138.43 141.46 1991 3172 11274 18338 0.6245 811 phi029 B 148 152 147.3 151.78 930 222 6634 1578 1 1850 phi029 B 148 148 147.18 147.18 390 390 2821 2821 1 LOCAL1 phi029 B 148 152 147.07 151.72 868 852 5297 5215 0.3123

68
3.4 Results
3.4.1 Phenotypic diversity of local maize varieties at Chitedze Research
Station
Maize varieties showed significant variation for plant height, ear placement, kernel colour, kernel
size, kernel weight, kernel type, days to tasselling, days to silking, ear damage, number of
kernel rows (P<0.05). No significant variation was observed for husk cover, number of ears per
plant, number of tassel branches and kernel row arrangement. Broad sense heritability (H2)
ranged from 0.69 for kernel role arrangement to 0.94 for number of kernel rows (Table 3.5).

69
Table 3.5: Analysis of variance (ANOVA) for phenotypic traits at Chitedze Research Station
Trait
SOV df
PH EPL KC KS KT DT KW DS KR ED HC EP KRA TB
variety 67 MS 1518.7* 1066*.1 0.1669* 0.1828* 0.16194* 14.44* 7516* 22.791* 2.6376* 0.03473 0.2371 0.03984 0.03646 14.35
Block 9 MS 1315.5 926.8 0.09086 0.05999 0.07485 5.91 2986 18.386 1.0396 0.0159 0.2362 0.07843 0.0548 8.7
Residual 127 MS 328.2 429.3 0.01948 0.04265 0.04334 12.77 1998 8.391 0.4733 0.01461 0.1919 0.03429 0.04817 11.08
Total 203 MS 764.9 661.6 0.07132 0.08969 0.08388 13.02 3863 13.587 1.2127 0.02131 0.2088 0.03807 0.0446 12.05
R² 73 59 83 70 68 39 68 61 76 57 43 44 32 42
CV (%) 8.73 19.46 11.66 9.6 8.67 4.8 13.1 3.78 6.79 48.48 6.4 16.13 15.62 20.63
SE 18.12 20.72 0.1396 0.2065 0.2082 3.574 44.7 2.897 0.688 0.1209 0.438 0.1852 0.2195 3.329
H2 0.93 0.88 0.96 0.93 0.91 0.77 0.92 0.89 0.94 0.88 0.79 0.78 0.69 0.79
Days_to_silking (DS), Ear damage (ED), Ear placements (EPL), Husk cover (HC), Kernel size (KS), Number_of_ears_plant (EP), Number_of_tassel_branches
(TB), Plant_hieght (PH), days_to_tassel (DT), kernel colour (KC), number_of_kernels_rows (KR), kernel type (KT), kernel weight (KW), kernel_role_arrangement
(KRA). Note: Sg* = significant at p<0.05

70
Plant height
Maize varieties showed significant differences (P<0.05) for plant height. The following varieties
were the tallest, 297(260.5 cm), 1915 (242.8 cm), 206 (242.3 cm), 303 (234.8 cm) and 164 9
(233.9 cm). The shortest varieties were 2872 (174.3 cm), 193 (172.9 cm), 3243 (161.7 cm), 569
(159.6 cm) and 2862 (107 cm) (Appendix 3.1).
Kernel colour
Significant differences (p<0.05) were observed for kernel colour. Maize varieties revealed white,
orange, red, pink and variegated kernels (Figure 3.1).
Figure 3.1: Local maize varieties showing variation in grain colour
Ear damage
Significant differences (p<0.05) were observed for ear damage. Varieties 289, 240, 403, 164,
local 1 were less susceptible to ear damage, while varieties 2862, 2872, 315, 584 and 2027
were more susceptible to ear damage (Appendix 3.1).

71
Kernel size
Significant differences (p<0.05) were observed for kernel size. The following varieties showed
large kernel sizes, local 1, 240, 1892, 154 and 303. On the other hand, varieties 3244, 445,
3243, 569 and 2862 showed the smallest kernel size (Appendix 3.1).
Days to tassel
Significant differences (p<0.05) were observed for days to tasselling. The early tasselling
varieties were 629 (72), 811 (71), 3411 (71), kanjerenjere (71) and local 2 (70), while 410 (81),
1795 (80), 154 (79), 218 (79) and 332 (79) were the late tasseling varieties (Appendix 3.1).
Days to silking
Significant differences (p<0.05) were observed for days to silking. Varieties 445 (73), local 2
(73), 1983 (73), 3243 (72) and 2863 (62) produced silks early, while varieties 740 (82), 1772
(81), 240 (81), 139 (80) and 279 (80) started producing silks late (Appendix 3.1).
Kernel type
Significant differences (p<0.05) were observed for grain hardness among the varieties.
Varieties, such as 629, 303, 226, 322 and 260 were semi-flint, while varieties, such as 2862,
local 1, 3243, 410 and 3244 were dent (Appendix 3.1).
Kernel rows
Significant differences (p<0.05) were observed for number of kernel rows. The following
varieties had the highest number of kernel rows, 2872 (12), 206 (12) 2012 (12) 172 (12) and
3244 (12), while varieties 1845 (9) 410(8), 243 (8), 629 (8) and local 1 had the lowest number of
kernel rows (Appendix 3.1).
Ear placement
Significant differences (p<0.05) were observed for ear placement. Varieties 584 (179.6 cm), 297
(138.3 cm), 206 (128.6cm), 164 (126.8 cm) and 203 (126.4 cm) showed higher ear placements,
while 736 (84.6 cm), 696 (83.5 cm), 2872 (67.1 cm), 3243 (62.8 cm) and 2862 (23.4cm) showed
the lowest ear placements (Appendix 3.1).

72
1000 Kernel weight
Significant differences (p<0.05) were observed for kernel weight. Local 1 (465g), 1857 (438g),
240 (413g), 1845 (412g) and 206 (404g) showed high grain weights. Varieties 445 (263g), 403
(258g), 410 (258g), 369 (213g) and 2862 (140g) showed the lowest grain weights (Appendix
3.1).
3.4.1.2 Yield assessment of local maize varieties
No significant differences were observed for yield among the local maize varieties (Table 3.6).
Table 3.6: Analysis of variance for yield
Source of variation d.f. s.s. m.s. v.r. F pr.
Block 9 4.4453 0.4939 2.7 0.011
Variety 66 13.3588 0.2024 1.11 0.354
Residual 54 9.8895 0.1831
Total 129 27.6936 0.2147
CV (%) =46, sed = 0.4765, H2 = 0.76
3.4.1.3 Correlation analysis among phenotypic traits
Significant correlations were observed for the phenotypic traits. For example, positive and
significant correlations were observed between plant height and kernel weight (0.41), plant
height and kernel size (0.43), kernel size and kernel weight (0.72). Negative but significant
associations were obtained between yield with 1000 kernel weight (-0.29), and ear damage with
plant height (-0.29) (Table 3.7)

73
Table 3.7: Correlation between phenotypic traits among local maize varieties
Days_to_silking (DS), Ear damage (ED), Ear placements (EPL), Husk cover (HC), Kernel size (KS), Number_of_ears_plant (EP), Number_of_tassel_branches (TB), Plant_hieght (PH), days_to_tassel (DT), kernel colour (KC), number_of_kernels_rows (KR), kernel type (KT), kernel weight (KW), kernel_role_arrangement (KRA), Yield (YD) . Note: Correlation coefficients with * were significantly correlated p<0.05, ** significantly correlated p<0.01 and *** significantly correlated at p<0.001
3.4.1.4 Principal component analysis
Four principal components accounted for 99.57% of the observed variation. However, the first
two principal components accounted for 94.98% of the observed variation (Table 3.8)
Table 3.8: Variation within the local maize varieties as explained by principal component
analysis
PC1 PC2 PC3 PC4 PC5 PC6 PC7 PC8
%1000 kernel weight 0.95475 -0.28628 -0.07963 0.0051 0.00624 0.00762 0.00435 0.00096 Ear Placement 0.15407 0.70644 -0.69057 -0.00083 0.01662 0.00379 0.00506 -0.00002 Ear damage -0.00063 -0.00077 -0.00213 -0.00766 0.00482 -0.00112 0.00405 0.03801 Husk cover 0.00073 -0.00023 0.00023 0.00437 0.01684 0.01744 -0.01984 -0.99248 Kernel row arrangement 0.00005 -0.00088 -0.00057 0.00837 -0.00318 0.00391 -0.02567 -0.10482 Kernel type -0.00081 -0.00155 -0.00004 -0.00043 -0.00046 0.00153 -0.04753 0.03606 No of ears plant 0.00038 0.00057 0.00217 0.00308 0.00088 0.00398 0.01736 0.00136 No of tassel branches 0.00999 0.02746 0.0165 -0.15127 -0.71109 0.68076 -0.08241 0.00139 Number of kernel rows -0.00221 0.00383 0.00942 -0.04793 -0.06678 0.0402 0.99355 -0.02105 Plant height cm 0.25357 0.64608 0.71842 -0.01815 0.04111 -0.00909 -0.00656 0.00076 Days to Tasseling -0.0083 0.00381 0.01074 0.82848 0.28111 0.48205 0.03967 0.0168 Kernel colour -0.0004 -0.00085 0.00086 -0.00169 -0.00386 -0.00283 0.02736 -0.01484 Kernel size 0.00358 0.00111 0.00139 0.0103 -0.00523 0.00571 -0.00165 0.00143 Days to Silking 0.0151 0.02785 0.01284 0.53649 -0.63915 -0.54958 0.00461 -0.01719 Percent variation 77.9 17.08 4.33 0.26 0.24 0.17 0.02 0
KW
EPL 0.16 -
ED -0.19* -0.02 -
HC 0.14 0.05 -0.11 -
KRA -0.04 -0.04 0.08 0.16 -
KT -0.11 -0.1 -0.04 -0.08 -0.01
EP 0.07 0.01 -0.16 0 0.02 -0.04 -
TB 0.13 0.16 -0.14 -0.04 -0.12 0.05 -0.01 -
KRA -0.16 -0.08 0.15 -0.07 -0.19* -0.11 0.1 0.12 -
PH 0.41*** 0.54*** -0.29*** 0.08 -0.09 -0.08 0.15 0.24** 0.03 -
DT -0.7 -0.08 -0.03 0.1 0.16 0.05 0.07 -0.16 -0.08 -0.09
YD -0.29*** -0.05 0.11 -0.22* -0.1 -0.01 0.13 -0.09 0.22* -0.18* -0.06 -
KC -0.11 -0.15 -0.01 -0.05 0.1 0.26*** 0.17 -0.05 0.1 -0.12 -0.04 0.10*** -
KS 0.72*** 0.19* -0.14 0.11 -0.03 -0.19* 0.07 0.14 -0.17 0.43*** 0.01 -0.31 -0.27** -
DS 0.02 0.09 -0.09 -0.16 0.08 0.03 -0.11 0.20* -0.04 0.07 0.11 0.01 -0.09 0.1 -
KW EPL ED HC KRA KT EP TB KRA PH DT YD KC KS DS

74
148
303
3244
696
750
811
386
741
292
445
172260243
315
250
Local 2
1772
3243
740
725
787
164
3414
2872
3411
1786
629
2027
163
knjnj1795
6371850
584
1983
203
226
193
218
2012
206
199539
410
Local 1
752
289
332
783
145
1857
2017
249
310
1892
139
699
569
297
736
1845
154
2862
1992
403
240
1915
-200
-100
-150
0
-100
100
-50
0
50
100
150
-150 50-5
0
150
_pcscore[1]
_pcs
core
[2]
The variation observed in PC1 was largely as a result of kernel weight, ear placements and
plant height. The variation in PC2 was mainly due to ear placements and plant height. Plant
height, ear placement were again responsible for the variation accounted for in PC3 and days to
tasselling and days to silking contributed significantly to the variation observed in PC4.
The plot of the varieties using the first two principal components depicted maize varieties
concentrating between -100 and 100 on the Y axis and between -150 and 100 on the X axis.
Local varieties 2862 and 1857 were outliers on the left and right hand side of the plot,
respectively (Figure 3.2). Data on phenotypic traits showed that genotype 2862 (outlier) had the
lowest mean plant height (107 cm), lowest ear placement (62.46) and smallest kernel weight,
while 1847 had one of the highest kernel weight (Appendix 3.1).
Figure 3.2: Distribution of varieties based on 1st and 2nd principal components
3.4.1.5 Cluster analysis using phenotypic data
Cluster analysis based on the phenotypic data revealed 8 groups. The composition of each
group was as follows, Group 1 had 2 varieties, Group 2 (15 varieties), Group 3 (11), Group 4
(5), Group 5 (4) Group 6 (8), Group 7 (11) and Group 8 had 10 varieties. However, local 1 and
variety 322 were singletons (Figure 3.3).

75
0.65
1 8 4 5
2 0 6
L o c a l 2
1 8 9 2
3 2 4 3
5 3 9
7 2 5
1 9 9 2
1 6 4
L o c a l 1
2 8 7 2
6 9 9
1 7 8 6
2 8 9
2 0 2 7
1 5 4
k n j n j
7 8 3
6 3 7
2 9 7
5 8 4
1 8 5 7
2 0 3
3 2 4 4
7 5 0
3 8 6
2 9 2
3 0 3
1 9 1 5
2 4 0
4 0 3
7 3 6
5 6 9
1 3 9
3 1 0
2 8 6 2
2 0 1 7
1 9 3
1 4 5
2 4 9
3 3 2
2 0 1 2
7 5 2
4 1 0
1 9 9
6 9 6
2 1 8
2 2 6
1 9 8 3
1 8 5 0
1 7 9 5
1 6 3
6 2 9
3 4 1 1
3 4 1 4
7 8 7
7 4 0
1 7 7 2
2 5 0
3 2 2
1 4 8
2 4 3
7 4 1
1 7 2
2 6 0
8 1 1
1.00
3 1 5
0.95 0.90 0.85 0.80 0.75
4 4 5
0.70
Figure 3.3: Cluster analysis of maize varieties using the unweighted pair-group method with
arithmetic averages (UPGMA) based on phenotypic data.
1
1
2
3
4
5
6
7
8
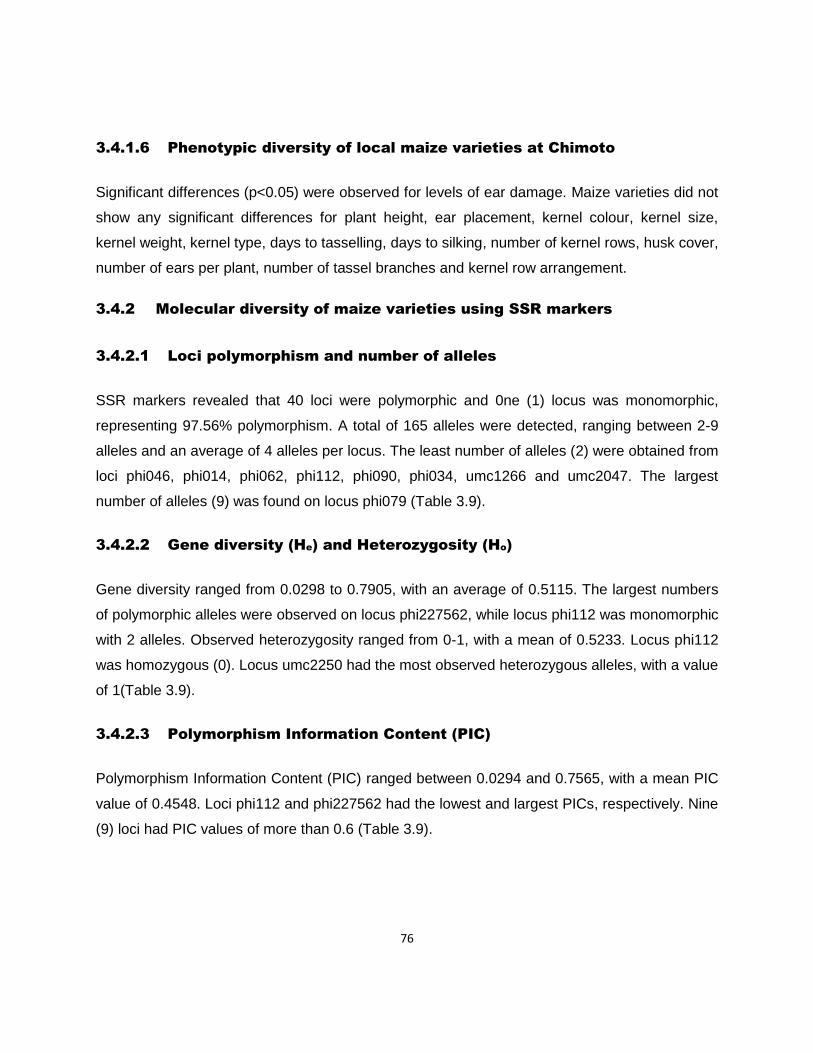
76
3.4.1.6 Phenotypic diversity of local maize varieties at Chimoto
Significant differences (p<0.05) were observed for levels of ear damage. Maize varieties did not
show any significant differences for plant height, ear placement, kernel colour, kernel size,
kernel weight, kernel type, days to tasselling, days to silking, number of kernel rows, husk cover,
number of ears per plant, number of tassel branches and kernel row arrangement.
3.4.2 Molecular diversity of maize varieties using SSR markers
3.4.2.1 Loci polymorphism and number of alleles
SSR markers revealed that 40 loci were polymorphic and 0ne (1) locus was monomorphic,
representing 97.56% polymorphism. A total of 165 alleles were detected, ranging between 2-9
alleles and an average of 4 alleles per locus. The least number of alleles (2) were obtained from
loci phi046, phi014, phi062, phi112, phi090, phi034, umc1266 and umc2047. The largest
number of alleles (9) was found on locus phi079 (Table 3.9).
3.4.2.2 Gene diversity (He) and Heterozygosity (Ho)
Gene diversity ranged from 0.0298 to 0.7905, with an average of 0.5115. The largest numbers
of polymorphic alleles were observed on locus phi227562, while locus phi112 was monomorphic
with 2 alleles. Observed heterozygosity ranged from 0-1, with a mean of 0.5233. Locus phi112
was homozygous (0). Locus umc2250 had the most observed heterozygous alleles, with a value
of 1(Table 3.9).
3.4.2.3 Polymorphism Information Content (PIC)
Polymorphism Information Content (PIC) ranged between 0.0294 and 0.7565, with a mean PIC
value of 0.4548. Loci phi112 and phi227562 had the lowest and largest PICs, respectively. Nine
(9) loci had PIC values of more than 0.6 (Table 3.9).
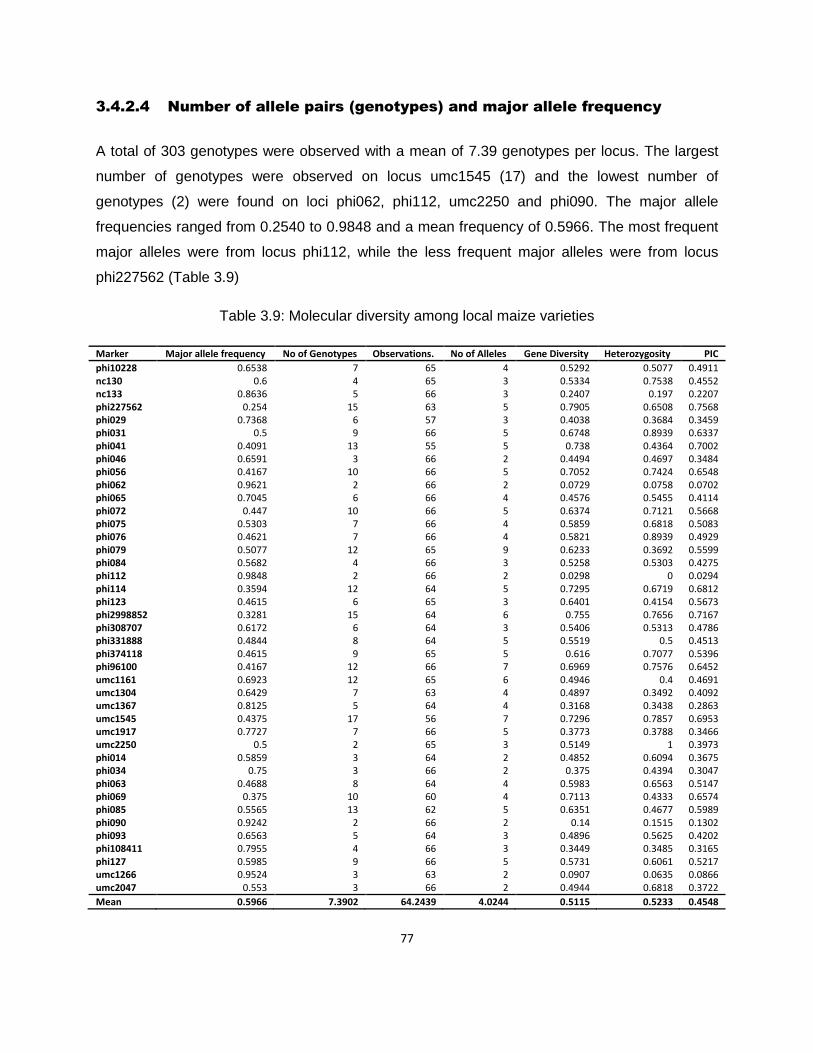
77
3.4.2.4 Number of allele pairs (genotypes) and major allele frequency
A total of 303 genotypes were observed with a mean of 7.39 genotypes per locus. The largest
number of genotypes were observed on locus umc1545 (17) and the lowest number of
genotypes (2) were found on loci phi062, phi112, umc2250 and phi090. The major allele
frequencies ranged from 0.2540 to 0.9848 and a mean frequency of 0.5966. The most frequent
major alleles were from locus phi112, while the less frequent major alleles were from locus
phi227562 (Table 3.9)
Table 3.9: Molecular diversity among local maize varieties
Marker Major allele frequency No of Genotypes Observations. No of Alleles Gene Diversity Heterozygosity PIC
phi10228 0.6538 7 65 4 0.5292 0.5077 0.4911 nc130 0.6 4 65 3 0.5334 0.7538 0.4552 nc133 0.8636 5 66 3 0.2407 0.197 0.2207 phi227562 0.254 15 63 5 0.7905 0.6508 0.7568 phi029 0.7368 6 57 3 0.4038 0.3684 0.3459 phi031 0.5 9 66 5 0.6748 0.8939 0.6337 phi041 0.4091 13 55 5 0.738 0.4364 0.7002 phi046 0.6591 3 66 2 0.4494 0.4697 0.3484 phi056 0.4167 10 66 5 0.7052 0.7424 0.6548 phi062 0.9621 2 66 2 0.0729 0.0758 0.0702 phi065 0.7045 6 66 4 0.4576 0.5455 0.4114 phi072 0.447 10 66 5 0.6374 0.7121 0.5668 phi075 0.5303 7 66 4 0.5859 0.6818 0.5083 phi076 0.4621 7 66 4 0.5821 0.8939 0.4929 phi079 0.5077 12 65 9 0.6233 0.3692 0.5599 phi084 0.5682 4 66 3 0.5258 0.5303 0.4275 phi112 0.9848 2 66 2 0.0298 0 0.0294 phi114 0.3594 12 64 5 0.7295 0.6719 0.6812 phi123 0.4615 6 65 3 0.6401 0.4154 0.5673 phi2998852 0.3281 15 64 6 0.755 0.7656 0.7167 phi308707 0.6172 6 64 3 0.5406 0.5313 0.4786 phi331888 0.4844 8 64 5 0.5519 0.5 0.4513 phi374118 0.4615 9 65 5 0.616 0.7077 0.5396 phi96100 0.4167 12 66 7 0.6969 0.7576 0.6452 umc1161 0.6923 12 65 6 0.4946 0.4 0.4691 umc1304 0.6429 7 63 4 0.4897 0.3492 0.4092 umc1367 0.8125 5 64 4 0.3168 0.3438 0.2863 umc1545 0.4375 17 56 7 0.7296 0.7857 0.6953 umc1917 0.7727 7 66 5 0.3773 0.3788 0.3466 umc2250 0.5 2 65 3 0.5149 1 0.3973 phi014 0.5859 3 64 2 0.4852 0.6094 0.3675 phi034 0.75 3 66 2 0.375 0.4394 0.3047 phi063 0.4688 8 64 4 0.5983 0.6563 0.5147 phi069 0.375 10 60 4 0.7113 0.4333 0.6574 phi085 0.5565 13 62 5 0.6351 0.4677 0.5989 phi090 0.9242 2 66 2 0.14 0.1515 0.1302 phi093 0.6563 5 64 3 0.4896 0.5625 0.4202 phi108411 0.7955 4 66 3 0.3449 0.3485 0.3165 phi127 0.5985 9 66 5 0.5731 0.6061 0.5217 umc1266 0.9524 3 63 2 0.0907 0.0635 0.0866 umc2047 0.553 3 66 2 0.4944 0.6818 0.3722
Mean 0.5966 7.3902 64.2439 4.0244 0.5115 0.5233 0.4548

78
3.4.2.5 Rare and common alleles within local maize varieties
Alleles, such as 242, 267, 279,136, 161, 171, 171, and 178 were less frequent, while other
alleles, such as 154, 162, 134, 142 and 113 were more frequent within the maize population
(varieties) (Table 3.10).
Table 3.10: Some rare and common alleles within local maize varieties
Marker Allele Count Frequency Variance SD status
phi056 242 1 0.0076 5.652E-05 0.0075 Rare phi96100 267 1 0.0076 5.652E-05 0.0075 Rare phi96100 279 1 0.0076 5.652E-05 0.0075 Rare umc1917 136 1 0.0076 5.652E-05 0.0075 Rare phi079 161 1 0.0077 5.826E-05 0.0076 Rare phi079 171 1 0.0077 5.826E-05 0.0076 Rare phi079 178 1 0.0077 5.826E-05 0.0076 Rare phi079 195 1 0.0077 5.826E-05 0.0076 Rare phi374118 219 1 0.0077 5.826E-05 0.0076 Rare umc1367 156 1 0.0078 6.008E-05 0.0078 Rare phi065 147 2 0.0152 0.0001113 0.0106 Rare phi072 161 2 0.0152 0.0001113 0.0106 Rare phi075 211 2 0.0152 0.0001113 0.0106 Rare phi112 160 2 0.0152 0.0002261 0.015 Rare phi127 127 2 0.0152 0.0001113 0.0106 Rare phi079 179 2 0.0154 0.0001147 0.0107 Rare umc1161 137 2 0.0154 0.0001147 0.0107 Rare umc2250 53 2 0.0154 0.0001147 0.0107 Rare phi114 170 2 0.0156 0.0001183 0.0109 Rare phi331888 129 2 0.0156 0.0001183 0.0109 Rare phi331888 134 2 0.0156 0.0001183 0.0109 Rare phi063 181 2 0.0156 0.0001183 0.0109 Rare umc1304 128 2 0.0159 0.000248 0.0157 Rare umc1545 67 2 0.0179 0.0001537 0.0124 Rare nc130 139 78 0.6000 0.0009704 0.0312 common phi308707 131 79 0.6172 0.0019217 0.0438 common umc1304 132 81 0.6429 0.0023216 0.0482 common phi10228 121 85 0.6538 0.0016477 0.0406 common phi093 288 84 0.6563 0.0015717 0.0396 common phi046 60 87 0.6591 0.0016252 0.0403 common umc1161 143 90 0.6923 0.0019754 0.0444 common phi065 131 93 0.7045 0.0011452 0.0338 common phi029 148 84 0.7368 0.0018629 0.0432 common phi034 98 99 0.7500 0.0011765 0.0343 common umc1917 130 102 0.7727 0.0012835 0.0358 common phi108411 122 105 0.7955 0.0011452 0.0338 common umc1367 160 104 0.8125 0.0010376 0.0322 common nc133 113 114 0.8636 0.0010957 0.0331 common phi090 142 122 0.9242 0.000487 0.0221 common umc1266 134 120 0.9524 0.0004679 0.0216 common phi062 162 127 0.9621 0.0002652 0.0163 common phi112 154 130 0.9848 0.0002261 0.015 common

79
3.4.2.6 Genetic distances
The furthest genetic distance was between varieties 206 and local 2 (0.9001) and the shortest
genetic distance was between varieties 203 and 811 (0.2189) (Table 3.11). Full genetic distance
matrix in appendix 3.2.
Table 3.11: Partial genetic distance matrix for the local maize varieties based on SSR marker
data
203 0.219 0.3015 0.2538 0.3815 0.2513 0.4408 0.4004 0.3629 0.3082 0.4221 0.3885
750 0.357 0.2636 0.3576 0.3549 0.4181 0.3616 0.3093 0.4143 0.331 0.4896 0.3251
699 0.472 0.36 0.5195 0.3683 0.4581 0.4408 0.3234 0.5108 0.4095 0.435 0.5079
696 0.446 0.3973 0.4613 0.3804 0.4053 0.3881 0.5384 0.5216 0.4215 0.6609 0.4783
193 0.32 0.3071 0.3397 0.4255 0.2252 0.331 0.3781 0.4051 0.4002 0.439 0.4055
249 0.437 0.4894 0.3523 0.4918 0.4994 0.3319 0.4965 0.5815 0.4917 0.5435 0.5214
kjnj 0.524 0.4008 0.4487 0.4595 0.3841 0.2769 0.492 0.5328 0.4876 0.4996 0.4784
297 0.359 0.2796 0.3681 0.3885 0.2957 0.3474 0.3692 0.4608 0.4166 0.5217 0.4219
163 0.499 0.3721 0.4631 0.5401 0.3927 0.586 0.4984 0.4964 0.5682 0.5447 0.522
629 0.425 0.3775 0.4744 0.3328 0.4447 0.492 0.5058 0.6351 0.4609 0.4008 0.4407
260 0.427 0.3393 0.391 0.5596 0.3604 0.4513 0.3961 0.4803 0.4773 0.5748 0.506
164 0.497 0.4602 0.4883 0.3054 0.5827 0.3881 0.4804 0.5805 0.3578 0.4346 0.452
3244 0.586 0.5331 0.551 0.3985 0.4886 0.5572 0.5153 0.5277 0.4399 0.7704 0.6604
local2 0.56 0.5081 0.5103 0.6215 0.547 0.6351 0.5027 0.6674 0.5557 0.9001 0.4601
2012 0.413 0.2791 0.4237 0.3092 0.4079 0.519 0.3051 0.519 0.4478 0.4126 0.4531
243 0.357 0.2656 0.3433 0.3637 0.414 0.4096 0.332 0.4768 0.3661 0.4053 0.3018
1983 0.337 0.4221 0.4229 0.4943 0.3677 0.3382 0.3358 0.4011 0.4504 0.4747 0.4665
226 0.379 0.4846 0.3416 0.4329 0.3751 0.4507 0.4236 0.3579 0.5506 0.4986 0.4525
154 0.495 0.4713 0.4208 0.4997 0.5209 0.4503 0.5044 0.5174 0.4858 0.6384 0.4253
410 0.47 0.3282 0.5124 0.4855 0.3454 0.49 0.3363 0.6045 0.3818 0.5105 0.4009
3414 0.31 0.2414 0.3082 0.2904 0.3536 0.3616 0.3093 0.4009 0.306 0.3702 0.4002
1772 0.317 0.2714 0.3721 0.3675 0.3565 0.3275 0.3364 0.4394 0.4348 0.5136 0.4013
811 1850 Local 1 303 199 386 250 740 445 206 1786
3.4.2.7 Cluster analysis using SSR markers
Cluster analysis of maize varieties using the unweighted pair-group method with arithmetic
averages (UPGMA) based on molecular data revealed 10 clusters. Cluster 1 had 2 varieties,
Cluster 2 (5), Cluster 3 (7), Cluster 4 (8), Cluster 5(15), Cluster 6 (11), Cluster 7(9), Cluster 8(3),
Cluster 9 (2) and Cluster 10 (2). Varieties 1772 and 163 were singletons. The closest genetic

80
distance was between clusters 6 (203) and 3 (811), while the furthest genetic distance was
between clusters 9 (206) and 1(local 2) (Figure 3.4).
Figure 3.4 : Cluster analysis of maize varieties using Rogers (1972) the unweighted pair-group
method with arithmetic averages (UPGMA) based on SSR data

81
3.4.2.8 Comparison of clusters based on phenotypic data and SSR data
The clusters formed by phenotypic and SSR data were not similar. However, some varieties
appeared together in the same clusters for both phenotypic data and SSR data. For example,
using phenotypic data, varieties 249, 2012 and 2017 were in group 2, based on SSR data, the
varieties appeared together in cluster 2. The origin of the varieties and the clusters developed
by the two data sets did not show any obvious pattern. The only notable pattern for SSR data
were clusters 3 and 9. In cluster 3, maize varieties were predominantly from districts in the east
of the country, except for 1 variety (2862) which originated from the north. Varieties in cluster 9
all came from districts in the north of the country (Table 3.12).
Table 3.12: Comparison between phenotypic data and SSR data clusters and origin
Variety SSR
Clusters Phenotypic
Clusters District Region Variety SRR Clusters
Phenotypic Clusters District Region
3243 1 5 Mzimba North 1850 5 6 Dowa Centre Local 2 3 Lilongwe Centre 303
3 Mzimba North
218 2 7 Mzimba North 1915
3 Kasungu Centre 249
2 Mzimba North 637 2 Thyolo South
629
8 Thyolo South 1857 6 3 Dowa Centre 2012
2 Lilongwe Centre 725
3 Balaka East
2027 2 Lilongwe Central 569
6 Chiradzulu East 741 3 2 Balaka East 240
5 Mzimba North
783
3 Machinga East Local 1
None Dowa Centre 2862
1 Karonga North 203
4 Mzimba North
736
6 Balaka East 289
2 Karonga North 696
6 Zomba East 410
7 Chikwawa South
811
2 Mangochi East 539
2 Phalombe South 787 7 Machinga East 750
7 Balaka East
403 4 6 Nsanje South 332 8 Mzimba North 148
2 Mzimba North 250 7 1 Mzimba North
584
7 Chiradzulu East 740
6 Balaka East 139
8 Mzimba North 752
6 Balaka East
1992
3 Dedza Central 3411
7 Zomba East 172
8 Nkhatabay north 193
4 Mzimba North
445
5 Chikwawa South 199
6 Mzimba North 699 2 Zomba East 226
8 Mzimba North
145 5 8 Mzimba North 1983
7 Dedza Centre 164
2 Nkhatabay North 2872 2 Likoma North
1786
3 Dedza Central 1892 8 2 Mchinji Centre 243
8 Mzimba North 260
4 Chitipa North
310
7 Mzimba North Knjnj 2 Blantyre South 386
7 Nsanje South 206 9 2 Mzimba North
3414
8 Zomba East 322 none Rumphi North 1845
3 Ntchisi Centre 154 10 3 Nkhatabay North
292
3 Karonga North 3244 5 Mzimba North 297
4 Karonga North 1772 none 7 Ntcheu Centre
1795 8 Dowa Centre 163 none 8 Nkhatabay North

82
3.4.2.9 Number of migrants
The proportion of migrants among populations using private alleles was at 0.333 Nm, with a
mean frequency of 0.5909 (Table 3.13).
Table 3.13: Number of migrants within maize population
Number of populations detected 67
Number of loci detected 41
Mean sample size 0.999234
Mean frequency of private alleles 0.590909
Number of migrants 0.333262
3.5 Discussion
3.5.1 Phenotypic diversity of local maize varieties
At Chitedze Research Station, local maize varieties showed significant differences for plant
height, ear placement, kernel colour, kernel size, kernel type, tasselling days, silking days, ear
damage, and number of kernel rows. However, no significant differences were observed for
yield, husk cover, number of ears per plant, number of tassel branches and kernel row
arrangement. Chitedze Research Station experienced normal season in 2011/2012 planting
season. At Chimoto, maize varieties did not show any significant differences for all phenotypic
traits except for ear damage. The 2013/2014 growing season was characterised frequent dry
spells. As such phenotypic makers were affected by the change in environmental conditions
(Jones et al., 1997; Collard et al., 2005; Antwi et al., 2012). Magorokosho (2006) found
significant variation for number of ears per plant, number of kernel rows per ear, weight of 1000
kernels, days to silking, days to tassel, plant height, ear placements, kernel arrangement,
number of primary tassels, cob colour. No significant differences were observed for kernel
texture, husk cover and kernel size among landraces and local varieties from Malawi, Zambia
and Zimbabwe. Rivella and Tracy (1995) found significant variation for plant height, tassel size
but no significant variation for ear and kernel related characteristics in sweet corn land races.
Significant variation for days to tassel, days to silking, plant height, ear placements, number of

83
ears per plant among landraces were reported by Antwi et al. (2012). Bige and Lorenzoni (2007)
reported high significant variation for silking date, ear height, number of kernel rows and kernel
shape among Angola landraces.
Significant correlations were obtained among the phenotypic traits and yield. This was in
agreement with Antwi et al. (2012) who reported significant correlations between kernel
characteristics with yield. Magorokosho (2006) reported strong correlations among phenotypic
markers within landraces and open pollinated maize varieties. The knowledge about these
associations is critical when selecting traits of interests in maize germplasm (Bocanski et al.,
2009).
Principal component analysis revealed that the variation among the varieties was largely due to
kernel weight, plant height and ear placement. For example, the observed variation in PC1 was
largely as a result of kernel weight, ear placement and plant height. The variation in PC2 was
mainly due to ear placement and plant height. Plant height and ear placement were again
responsible for the variation accounted for in PC3 and days to tasselling and days to silking
contributed significantly to the variation observed in PC4. This implies that during selection of
maize materials for breeding purposes, plant height, ear placement, 1000 kernel weight, days to
tassel and days to silking will have significant influence on the outcome of the breeding
population. In addition, the broad-sense heritability values for these important traits were
relatively high. For example, plant height had a broad-sense heritability of 0.93, 1000 kernel
weight (0.92), days to silking (0.89), ear placement (0.88) and days to tassel (0.77). Plant
height, ear height, days to tassel, 1000-seed weight and number kernel rows are important in
the expression of genetic variation among maize varieties (Jaric´ et al., 2010; Khaldun and
Sanda, 2012). The use of Principal components has been reported. For instance, Khavari et al.
(2011) used principal component analysis to study variability in new corn hybrids. The Principal
component analysis efficiently identified factors that were contributing significantly to the
observed phenotypic variation in sweet corn maize.
Cluster analysis categorized maize varieties into eight distinct groups. The clusters were mainly
influenced by variation for plant height, ear placement, kernel weight, days to tassel and days to
silking. Apart from ear damage, kernel size and kernel colour, all the phenotypic traits that
showed significant variation among the varieties, such as kernel weight, plant height, ear
placement, days to tassel, number of kernel rows have been recommended for clustering of

84
maize (Sanchez et al., 1993; Magorokosho, 2006). This implies that clusters as shown in Figure
3.3 were a reflection of the possible phenotypic similarities and differences within the clusters
and between clusters at Chitedze Research Station.
3.5.2 Molecular diversity of local maize varieties
SSR markers revealed the existence of genetic variation among local maize varieties in Malawi.
The existing variation has been demonstrated through high polymorphism among the loci
(97.56%), high gene diversity (0.5115), high heterozygosity (0.5233), larger number of
genotypes (303), large genetic distances between varieties (0.9001) and highly informative
Polymorphism Information Content (PIC) (0.0294-0.7565). These measurements of molecular
variation have been used in genetic diversity analysis for maize genotypes and have revealed
the existence of molecular variation in different maize materials (Xia et al., 2004; Choukan and
Warburton, 2005; Magorokosho, 2006; Legesse et al., 2007; Yu et al., 2007; Wende et al.,
2013, Mafu et al., 2014). For instance, using number of alleles within maize germplasm,
Legesse (2007) reported a total of 104 alleles, with an average of 3.85 alleles per locus within
CIMMYT inbred lines, Xia et al. (2004) reported 566 alleles, with an average of 7.2 alleles per
locus among CIMMYT inbred lines. Magorokosho (2006) reported a total of 214 alleles, with a
mean of 9.3 alleles and a range of 4–7 alleles in 108 varieties collected from USA, Malawi,
Zambia and Zimbabwe. Reif et al. (2006) reported a total of 196 alleles with 7.84 alleles per
locus among Mexican varieties. Choukan and Warburton (2005) reported 194 alleles with an
average of 4.5 alleles per locus on Iranian and CIMMYT materials. Wende et al. (2013) reported
108 alleles, with allelic range of 1-11 among 20 medium to late maturing tropical maize inbred
lines. Mafu et al. (2014) reported the presence of 94 alleles, ranging from 1-9 among 25 inbred
lines tailored towards the development of Maize Streak Virus (MSV) resistant hybrids.
Differences in gene diversity and heterozygosity among maize germplasm from different
geographic areas appear to be common. For example, Magorokosho (2006) reported gene
diversity of 0.652 among USA, Malawi, Zambia, and Zimbabwe varieties, Legesse et al. (2007)
reported a gene diversity of 0.59 among African maize inbred lines. The reported diversity
figures were slightly higher than those found among maize varieties in the present study
(0.5115). This can be attributed to small geographic collection (Malawi) from which the current
materials were collected and materials were all open pollinated varieties. Materials reported by
other authors (Magorokosho, 2006; Legesse et al., 2007) were a collection from a large

85
geographical area and from different countries, with some of the materials being inbred lines,
including tropical and temperate germplasm. The results further showed that the mean
heterozygosity among the local maize varieties was 0.5233. This was also indicative of the
presence of gene diversity among the varieties (Halliburton, 2004). In contrast, Yu et al. (2007)
reported lower heterozygosity among Chinese lines (<0.2).
A wide range of Polymorphism Information Content (PIC) values (0.0294-0.7565) and nine
markers showing PIC values >0.6 demonstrated the efficacy of the markers to discriminate local
maize varieties based on DNA (Legesse et al., 2007; Wende et al., 2013; Mafu et al., 2014).).
Wende et al. (2013) reported correlations between PIC values and number of alleles. Large PIC
values were associated with high numbers of alleles. Although in the present study, the locus
with the largest PIC value was not linked with the highest number of alleles, but the smallest
PIC values were associated with the least numbers of alleles. Speculatively, the difference
could be due to type of maize materials used (inbred lines versus open pollinated varieties).
The average number of individuals migrating between population (varieties) per generation was
relatively low <1 Nm. This implied that gene flow among the varieties was low (Wolf and Soltis,
1992). Hence, the study results showed some alleles that were rare and in low frequencies
among the local varieties. This was possible because, a large proportion of the varieties used in
the study have been kept in isolation at the Malawi Gene Bank for long time. This led to reduced
selection, no gene flow and no genetic drift among the varieties. As reported by Warburton et al.
(2008) genetic diversity can be reduced through genetic drift and selection within the population.
This provides an opportunity to find unique and distinct varieties for developing new maize
populations.
Phenotypic and molecular data did not form similar clusters. However, some varieties appeared
together for both phenotypic and SSR clusters. Both cluster systems produced a large number
of clusters, eight and ten clusters for phenotypic and molecular data, respectively. This was an
indication of diversity among the local maize varieties. Clustering of varieties into groups in
association with origin did not reveal any obvious pattern. However, for SSR marker data, in
cluster 3, all but one variety came from districts from the eastern part of Malawi and in cluster 9,
all varieties came from the northern region. This showed that there was a high probability of
these varieties sharing similar alleles. The clustering of maize materials has been instrumental
in understanding the pedigree and origin of maize materials for possible use in breeding

86
programmes, such as Maize Streak Virus resistance breeding (Mafu et al., 2014) and selection
for grain yield (Wende et al., 2013). The identified clusters could be valuable information when
conducting further evaluations on local maize varieties for resistance against maize weevil and
larger grain borer. The clusters may point to similarity in some genes within clusters which may
help in selection of materials for evaluations.
3.6 Conclusion
Analysis of variance, cluster analysis, principal component analysis and SSR marker analysis
revealed that genetic diversity exists among local maize varieties grown in Malawi.
Phenotypically, plant height, ear placement and kernel weight were largely responsible for the
observed phenotypic variation. SSR markers revealed high genetic variation through high
polymorphism, high gene diversity, high heterozygosity, larger number of genotypes, large
genetic distances between varieties and highly informative Polymorphism Information Content
(PIC). The expressed variation provides evidence of diversity for exploiting local maize varieties
in Malawi for maize weevil and larger grain borer resistance screening.
References
Antwi, K.O., P.Q. Craufurd, A. Menkir, R.H. Ellis, and P.Y.K Sallah. 2012. Phenotypic Diversity
in maize landraces in Ghana. International Journal of Science and Advanced
Technology 2:2221-8386.
Bige, T., and C. Lorenzoni. 2007. Characterization of maize (Zea mays L.) germplasm of
Angola. Maydica 32:135-144.
Bocanski, J., Z. Sreckov, and A. Nastasic. 2009. Genetic and phenotypic relationship between
grain yield and components of grain yield of maize (Zea mays L.). Genetika 41:145-154.
Buckler, E.S., B.S. Gaut, and M.D. McMullen. 2006. Molecular and functional diversity of maize.
Current Opinion in Plant Biology 9:172–176.
Ching’oma, P. 2009. Spatial and temporal distribution of the larger grain borer, Prostephanus
trancatus (Horn) and the predator Teretrius nigrescens Lewis in relation to weather
parameters. Makoka Agricultural Research Station, Thondwe, Malawi.

87
Choukan, R., and M.L. Warburton. 2005. Use of SSR data to determine relationships among
early maturing Iranian maize inbred lines. Maydica 50:163-170.
Collard, B.C.Y., M.Z.Z. Jahufer, J.B. Brouwer, and E.C.K. Pang. 2005. An Introduction to
markers, quantitative trai loci (QTL) mapping and marker-assisted selection for crop
improvement: The basic concepts. Euphytica 142:169-196.
Denning, G., P. Kabambe, P. Sanchez, A. Malik, and R. Flor. 2009. Input subsidies to improve
smallholder maize productivity in Malawi: Towards an African green revolution. Public
Library of Science Biology 7(1): e1000023.doi:10.1371/journal.pbio.1000023. Available
at http://www.plosbiology.org. Accessed on 30 June 2010. Public Library of Science,
USA.
Derera, J., K.V. Pixley, and P. D. Giga. 2000. Resistance of maize to the maize weevil: I.
Antibiosis. African Crop Science Journal 9:431-440.
Fisher, M., and J. Mazunda. 2011. Could low adoption of modern maize varieties in Malawi be
explained by farmers’ interest in diverse seed characteristics? International Food policy
Research Institute.
Hallauer, A. R., and J.B Miranda. 1988. Quantitative genetics in maize breeding. 2nd edition.
Iowa State University Press, Ames, Iowa, USA.
Halliburton, R. 2004. Introduction to population genetics. Pearson Education, Upper Saddle
River, New Jersey 07458, USA.
Jaric, J.K., S. Prodanovic, M. Iwarsson, and A. Minina. 2010. Diversity of maize (Zea mays L.)
landraces in eastern serbia: morphological and storage protein characterization. Maydica
55:231-238.
Jarvis, D., and T. Hodgkin. 2005. Introduction. In D. Jarvis, et al. (ed.) Enhancing the use of
crop genetic diversity to manage abiotic stress in agricultural production systems,
proceedings of a workshop, 23–27 May 2005, Budapest, Hungary. International Plant
Genetic Resources Institute, Rome, Italy.
Jones, N., H. Ougham, and H. Thomas. 1997. Markers and mapping: We are all genetics now.
New Phytology 137:165-177.
Kamanula, J., G.W. Sileshi, S.R. Belmain, P. Sola, B.M. Mvumi, G.K.C. Nyirenda, S.P.
Nyirenda, and P.C. Stevenson. 2011. Farmers’ insect pest management practices and

88
pesticidal plant use in the protection of stored maize and beans in Southern Africa.
International Journal of Pest Management 57:41–49.
Khaldun, A.B., and S.Z. Sanda. 2012. Genetic diversity in some exotic inbred lines of maize
(Zea mays L.). SAARC Journal of Agriculture 10:111-117.
Khavari, K.S., K. Mostafavi, E. Zandipour, and A. Heidarian. 2011. Multivariate analysis of
agronomic traits of new corn hybrids (Zea mays L.). International Journal of AgriScience
1:314-322.
Legesse, B.W., A. Myburg, K.V. Pixley, and A.M. Botha. 2007. Genetic diversity of African
maize inbred lines revealed by SSR markers. Hereditas 144:10-17.
Li, Y., J. Du, T. Wang, Y. Shi, Y. Song, and J. Jia. 2002. Genetic diversity and relationships
among Chinese maize inbred lines revealed by SSR markers. Maydica 47:93-101.
Liu, K. and S.V. Muse. 2005. Power Maker: Integrated analysis environment for genetic marker
data. Bioinformatics 21(9):2121-2129.
Mafu, N., R. Naidoo, P. Fato, J. Danson, J. Derera, and M. Laing. 2014. Genetic diversity of
maize germplasm lines and implications for breeding Maize streak virus resistant
hybrids. African Journal of Plant and Soil, DOI: 10.1080/02571862.2014.907452.
Available at Http://dx.doi.org. Accessed on 19 September 2014. Taylor and Francis,
London, UK.
Magorokosho, C. 2006. Genetic diversity and performance of maize varieties from Zimbabwe,
Zambia and Malawi, Graduate Studies of Texas A&M University, Texas A&M University.
Mwololo, J.K., S. Mugo, P. Okori, T. Tefera, M. Otim, and S.W. Munyiri. 2012. Sources of
resistance to the maize weevil, Sitophilus zeamais in tropical maize. Journal of
Agricultural Science 4:1916-9752.
Ngwira, P. 2001. Managing maize diseases through breeding. Chitedze Resarch Station,
Lilongwe.
Payne, R.W., S.A. Harding, D.A. Murray, D.M. Soutar, D.B. Baird, A.I. Glaser, S.J. Welham,
A.R. Gilmour, R. Thompson, and R. Webster. 2011. GenStat Release 14. VSN
International 5 The Waterhouse, Waterhouse Street, Hemel Hempstead, Hertfordshire
HP1 1ES, UK.

89
Reif, J.C., X.C. Xia, A.E. Melchinger, M.L. Warburton, D.A. Hoisington, D. Beck, M. Bohn, and
M. Frisch. 2004. Genetic diversity determined within and among CIMMYT maize
populations of tropical, subtropical, and temperate germplasm by SSR markers. Crop
Science 44:326-334.
Reif, J.C., S. Hamrit, M. Heckenberger, W. Schipprack, H.P. Maurer, M. Bohn, and A.E.
Melchinger. 2005. Genetic structure and diversity of European flint maize populations
determined with SSR analyses of individuals and bulks. Theory and Applied Genetics
111:906–913.
Reif, J.C., M.L. Warburton, X.C. Xia, D.A. Hoisington, J. Crossa, S. Taba, J. Muminovic, M.
Bohn, M. Frisch, and A.E. Melchinger. 2006. Grouping of varieties of Mexican races of
maize revisited with SSR markers. Theoretical and Applied Genetics 113:177–185.
Revilla, P., and J Tracy. 1995. Morphological characterization and classification of open-
pollinated sweet corn cultivars. Journal of American Society of Horticultural Science
120:112-118.
Sanchez, J.J., M.M. Goodman, and J.O. Rawlings. 1993. Appropriate characters for racial
classification in maize. Economic Botany 47:44-59.
Shah, M.M., S.W. Hassan, K. Maqbool, I. Shahzadi, and A. Pervez. 2010. Comparisons of DNA
marker-based genetic diversity with phenotypic estimates in maize grown in Pakistan.
Genetics and Molecular Research 9:1936-1945
Warburton, M.L., J.C. Reif, M. Frisch, M. Bohn, C. Bedoya, X.C. Xia, J. Crossa, J. Franco, D.
Hoisington, K. Pixley, S. Taba, and A.E. Melchinger. 2008. Genetic diversity in CIMMYT
non-temperate maize germplasm: Landraces, open pollinated varieties, and inbred lines.
Crop Science 48:617–624.
Wende, A., H. Shimelis, J. Derera, W. Mosisa, J. Danson, and M. Laing. 2013. Genetic
relationships among medium to late maturing tropical maize inbred lines using selected
SSR markers. Euphytica 191:269-277.
Wolf, P.G., and P.S. Soltis. 1992. Estimates of gene flow among populations, geographic races,
and secies in the Ipomopsis aggregata Complex. Genetics 130:639-647.

90
Xia, X., J.C. Reif, D.A. Hoisington, A.E. Melchinger, M. Frisch, and M.L. Warburton. 2004.
Genetic diversity among CIMMYT maize inbred lines investigated with SSR Markers:
Lowland tropical maize. Crop Science 44:2230–2237.
Yen, F.C., and Yan R. 2002. POPGENE VERSION 1.31. Microsoft Window–based freeware for
population genetics analysis. Edmonton, Canada.
Yu, Y., R. Wang, Y. Shi, Y. Song, T. Wang, and Y. Li. 2007. Genetic diversity and structure of
the core collection for maize inbred lines in China. Maydica 52:181-194.

91
Chapter 4
Variation in levels of resistance against maize weevil (Sitophilus zeamais
Motschulsky) and larger grain borer (Prostephanus truncatus Horn) among
local maize varieties in Malawi
Abstract
Maize weevil (Sitophilus zeamais Motschulsky) and larger grain borer (Prostephanus truncatus
Horn) are the most important grain storage pests in Malawi. Farmers in the country continue to
cultivate local maize varieties because of their perceived tolerance to larger grain borer (LGB)
and maize weevil (MW), among other factors. The objectives of the study were to determine
levels of LGB and MW resistance among local maize varieties and to identify local maize
varieties that can be exploited for LGB and maize weevil resistance breeding. Sixty eight (68)
local maize varieties were assessed for MW and LGB resistance using fecundity, grain damage
(%), grain weight loss (%) and flour weight. Against maize weevil, maize varieties showed
significant differences for adult mortality, median development period, grain damage (%) and
number of F1 progenies. About 14.5% of the varieties were resistant, 21.7% moderately
resistant, 24.6% moderately susceptible, 23.2% susceptible and 16% highly susceptible. Maize
varieties denoted as 1772, 1983, 1992, 3243, 3244, 750 and 752 showed high resistance to
maize weevil. For larger grain borer, significant differences were observed among maize
varieties for insect mortality, total number of insects, grain damage (%), weight loss (%) and
flour weight. All maize varieties were susceptible to larger grain borer. However, varieties 1992,
2012, and 1983, representing 5% of the entire maize populations had reasonable levels of
resistance against LGB. Of interest were local varieties 1992 and 1983 that also showed high
levels of resistance to maize weevil. Substantial variation for resistance against MW exists
among local varieties. The resistance can be exploited to develop new populations or improve
resistance in productive maize populations. For LGB resistance, recurrent selection should be
used to increase frequency of resistant genes in the identified varieties.
Keywords: larger grain borer, maize breeding, maize weevil, insect resistance, storage pests,
insect resistance variation

92
4.1 Introduction
Maize (Zea mais L) is an important staple food crop in Malawi. However, postharvest losses due
to storage insect pests are becoming a serious challenge to food security at household level in
the country (Denning et al., 2009). Maize weevil (MW) (Sitophilus zeamais Motschulsky) and
larger grain borer (LGB) (Prostephanus truncatus Horn) are the most important post-harvest
pests in Malawi (Makoka, 2008; Singano et al., 2009; Kamanula et al., 2011). Yield losses
ranging from 5% to 80% caused by maize weevil have been reported (Tigar et al., 1994; Pingali
and Pandey, 2001; Dhliwayo et al., 2005). Larger gain borer is prevalent in Africa and is
negatively affecting maize production (Tefera et al., 2011). For instance, about 1.2% of
household grain losses of maize in Malawi were reportedly due to LGB (APHLIS, 2015) and
from 1995 to 2001, weight loss of stored maize due to the pest increased from 5 to 16%
(Denning et al., 2009; Singano et al., 2009).
The management of the two insect pests has relied heavily on the use of chemical compounds,
such as Actellic Super dust (Dhliwayo and Pixley, 2003; Ching’oma, 2009). Unfortunately, the
use of insecticides to control insect pests such as maize weevil and larger grain borer is being
threatened by development of insect resistance (Golob, 2002; Fragoso et al., 2005; Pereira et
al., 2009). In addition, these chemical products are generally costly to smallholder farmers
(Dhliwayo and Pixley, 2003).
However, host resistance can be integrated into the pest management system and could
provide a durable means of resistance to pest damage (Smith, 1994). Unfortunately, host
resistance has largely been overlooked in Malawi, mainly due to the promotion of pesticide use
against storage pests.
Understanding the variation for resistance that may exist among genotypes is an important step
in breeding for durable pest resistance (Mwololo et al., 2010). Differential reaction of genotypes
to insect pests can be exploited for breeding purposes (Kitaw et al., 2001). For example,
resistant varieties can be combined with other control measures, such as metal silos to protect
grains from LGB and MW (Tefera et al., 2011). Thee combination of the biological agent with
both resistant and susceptible maize grains increases maize resistance to storage pests
through reduced progeny numbers, grain weight loss and frass production (Bergvinson and
Garcϊa-Lara, 2011).

93
Genetic variation for resistance against the storage pests has been observed. Variable and
useful maize weevil resistance has been reported by Kim and Kossou (2003) in both open
pollinated and hybrid cultivars of maize in Africa. Derera et al. (2000) reported variation for
resistance against maize weevil among maize genotypes sampled from Southern, Eastern and
Western Africa. The existence of weevil resistance variation was also reported among Mexican
landraces by Arnason et al. (1992). Abebe et al. (2009) reported variability in resistance against
maize weevil in improved maize varieties in Ethiopia. The results showed a decrease in number
of F1 progenies, low seed damage and low seed weight loss among resistant genotypes. For
larger grain borer resistance, Ndiso et al. (2007) reported variation for resistance to LGB among
maize varieties in Kenya. In Malawi, variation in susceptibility among maize varieties against
LGB was reported by Kasambala (2009). Kumar (2002) reported some 19 landraces from the
Caribbean which showed resistance to LGB. The observed variation for resistance among the
varieties was due to mechanical and biochemical factors, such as phenolic compounds that
provide both mechanical resistance and antibiosis in maize grain (Arnason et al., 1992; Derera
et al., 2000; Kumar, 2002; García-Lara et al., 2004).
Considering huge grain losses emanating from storage insect pests in Malawi, exploration for
variation in maize resistance against maize weevil and larger grain borer among different local
maize varieties would be an important step in identifying resistant varieties. The identified
resistant varieties could be used for the development of insect resistant maize populations and
for improvement of resistance in productive maize populations in Malawi.
4.2 Study objectives
The objectives of the study were:
1. To determine levels of larger grain borer and maize weevil resistance among local maize
varieties in Malawi.
2. To identify maize varieties that can be exploited for larger grain borer and maize weevil
resistance breeding.

94
4.3 Materials and methods
4.3.1 Plant materials
Sixty eight (68) local maize varieties were collected from the National Gene Bank and
smallholder farmers, in Malawi. The list included 1 commercial hybrid and 1 local landrace
(Kanjerenjere) with known resistance against maize weevil and larger grain borer as standard
checks for susceptibility and resistance, respectively (list of varieties in chapter 4, Table 4.1).
4.3.2 Planting and experimental design
The maize varieties were planted at Chitedze Research Station during the 2011/2012 growing
season using the Alpha lattice design (10 incomplete blocks, each with 6 or 7 entries) and three
replicates. Each replicate was 10 m wide and 124 m long, giving a total area of approximately
3720 m2. One seed was planted per station using 25 cm spacing between plants and 75 cm
between rows. The hybrid maize variety “DK 8053” was used in guard rows. Full-sib mating was
done for each variety. As a standard practice in Malawi, basal application of fertilizer was done
using NPK (23:21:0 +4S) and top dressing was done using Urea (46% N) fertilizers at the rate
of 100kg/ha. The fields were weeded twice and Karate (lambda-cyhalothrin) was applied to
control termites. At maturity, cobs were harvested and dried at 12-13% moisture content for
resistance evaluations in the laboratory.
4.3.3 Rearing of larger grain borer and maize weevil
The rearing of LGB and MW was done at Chitedze Research Station (crop storage facilities)
according to the procedures outlined by CIMMYT (Tefera et al., 2010). Unsexed pests were
reared in a controlled environment at 28± 1oC, 65±5% RH, with a 12h: 12h light: dark regime to
minimize fluctuations in temperature and relative humidity and promote insect survival (Haines,
1991). The LGB and MW were cultured on susceptible mixed maize grain in sealed but
ventilated glass jars. All precautionary measures were taken to exclude other insects from
contaminating the cultures. The emergences of new adults were carefully monitored to ensure
that insects were of the same generation.

95
4.3.4 Evaluations of maize varieties for maize weevil and LGB resistance
Maize varieties were evaluated for maize weevil and larger grain borer resistance under lab
conditions (controlled environment) using Complete Randomised Block Design (CRBD) with
four replications. About 1 kg maize grains from each variety were collected for testing. Grains
were fumigated with phostoxin tablets for seven days to avoid carry over insects from the field.
One hundred (100) grams of grain were sampled from each of the 1 kg maize grains and placed
into jars. Forty-five (45) unsexed adult beetles (7-15 days old) were infested on 100 g of grain
and kept inside 250 ml plastic jars for maize weevil and in 400 ml glass jars for LGB (Fig 4.1). A
commercial maize hybrid variety ‘DK8053’ and a local variety ‘Kanjerenjere’ were used as
standard checks for susceptibility and resistance, respectively.
Figure 4.1: Maize samples in plastic containers (250 mls) bottom and glass jars (400 mls) top
with insect pests for resistance screening against MW and LGB, respectively

96
4.4 Data collected
4.4.1 Measurements for maize weevil resistance
The following parameters were used for measuring weevil resistance among the varieties: Adult
mortality was determined 10 days after infestation; both live and dead insects were counted
and discarded. Insects were separated from maize materials using sieves. The F1 progenies
were recorded 21 days after the 10 day ovipositioning, the recording was done every 3 days,
until no more insects were expected. The F1 progeny mortality was assessed by separating
dead progenies from the total number of F1 progenies. Damaged and undamaged grains were
counted based on 100 grains randomly selected from each jar. Based on percent grain damage,
resistance among maize varieties were conveniently categorised as follows, highly resistant
(0%), resistant (≤2%), moderately resistant (2.1-2.9%), moderately susceptible (3-3.9%),
susceptible (4-4.9%) and highly susceptible (≥5%). Susceptibility index was determined using
the susceptibility index developed by Dobie (1974): DSI = [Loge Y/t] x 100; where DSI = Dobie
susceptibility Index, Y = total number of progenies emerging from the treatment, t = median
development period (number of days from the middle of the oviposition (day 5) period to the
emergence of 50% of the F1 progeny (Derera et al., 2000). However, where zero or 1 maize
weevil emerged, the maximum median development period was calculated based on the last
day of insect counting. The values calculated were assigned resistance/susceptibility categories
as follows, highly resistant (0), resistant (≤2), moderately resistant (2.1-2.9), moderately
susceptible (3-3.9), susceptible (4-4.9) and highly susceptible (≥5). High susceptibility index
signified that the maize varieties were susceptible and low susceptibility index meant, maize
varieties were resistant. For comparison purposes, grain weight loss was also calculated using
the damaged and undamaged grains (CIMMYT protocol, Boxall 2002) as follows: Weight loss
(%) = {(Wu x Nd) - (Wd x Nu)/ Wu x (ND + Nu)} x 100; where Wu= weight of undamaged seed,
NU= number of undamaged seeds, Wd = Weight of damaged seed Nd = number of damaged
seed. The following categories were used to determine resistance based on grain weight loss:
Resistant (grain weight loss ≤ 2%), moderately resistant (grain weight loss between 2.1% and
4%), moderately susceptible (grain weight loss between 4.1 and 6%), susceptible (grain weight
loss of between 6.1% and 8%), highly susceptible (grain weight loss ≥8.1%).

97
4.4.2 Measurements for Larger grain borer resistance
Due to the peak in lab activities at Chitedze crop storage laboratory, a different resistance
screening methodology (CIMMYT Protocol) was adopted for LGB that does not require
collection of data every 3 days as outlined in section 4.4.1. Collection of data on resistant
parameters was done 90 days after infestation. For LGB, the following resistance parameters
were collected, total number of insects, insect mortality, grain damage and weight loss and flour
weight. Insect total number of insects was determined by a total count of both live and dead
insects, insect mortality was assessed by separating dead insects from the total number of
insects. Percent grain damage and Grain weight loss were determined as indicated in section
(4.4.1). Weight of flour produced in the jars due to insect damage was separated from insects
and maize using sieves and measurements were taken using an electronic weighing balance.
4.5 Data analysis
Data collected on flour weight (g), grain damage (%), grain weight loss (%), number of insects
was transformed using log (base e) to normalize variance before subjecting it to the analysis of
variance (ANOVA) and correlation analysis in GenStat (Payne et al., 2011). Broad-sense
heritability was calculated based on ANOVA as follows:
=
H2 = Broad -sense heritability
= Mean sum of square for varieties
= Mean sum of square for error
r = Replication
4.6 Results
4.6.1 Response of maize varieties to maize weevil infestation
Maize varieties showed significant differences for adult mortality, median development period,
grain damage (%) and total F1 progenies, while F1 progeny mortality and grain weight loss did

98
not show any significant differences. Broad-sense heritability (H2) among the parameters ranged
from 0.84 for grain weight loss (%) to 0.92 for adult mortality (Table 4.1).
Table 4.1: Analysis of Variance (ANOVA) for grain resistance related parameters for maize
weevil
Resistance parameters
SOV Df
Adult mortality F1 progenies MDP Grain damage (%) Weight loss (%) F1 progeny mortality
Variety 68 MS 0.4756** 0.275** 0.033* 0.2753** 0.1424 0.2462
Block 3 MS 0.2461 0.1754 0.0332 0.0931 0.1232 0.165
Residual 204 MS 0.1684 0.1418 0.0238 0.156 0.1101 0.1803
Total 275 MS 0.2452 0.1751 0.02614 0.1848 0.1186 0.1964
CV (%) 12.8 22.4 4.3 27.6 35.3 37.1
lsd (0.05) 0.5721 0.2663 0.2149 0.2093 0.4748 0.3003
SED 0.2902 0.525 0.109 0.5506 0.2407 0.592
H
2 0.92 0.89 0.85 0.88 0.84 0.85
Sg** = significant at P<0.001, Sg*= significant at P<0.05
4.6.1.1 Adult mortality
Highly significant differences (p<0.001) for adult mortality were observed among the varieties.
The following varieties showed the highest adult mortality numbers: 148, 3244, 2862, 445, 249
and Kenjerenjere (resistant check). Three varieties, namely 148, 3244, and 249 had mean
insect mortality numbers of 39.25, 42.5 and 40.75, respectively. These varieties performed
better than the resistant check (38.50) (Table 4.2). The variation for adult mortality was normally
distributed. The majority of the varieties experienced moderate numbers of adult mortality
(Figure 4.2).

99
Distribution of variation among maize varirties based on adult mortality
45
10.0
7.5
2015
5.0
2.5
35
0.0
17.5
10 25
12.5
5030 40
15.0
Adu
lt m
orta
lity
Distribution of variation among varieties based on F1 progenies
100 6
20
15
2
10
5
84
0
Tota
l num
ber
of in
sect
s
Figure 4.2: Distribution of variation for adult mortality among local maze varieties
4.6.1.2 Total number of F1 progenies
Highly significant differences (p<0.001) were observed for total number of F1 progenies among
maize varieties. Maize varieties 1992, 1772, 3243, 3244, and 403 had the lowest mean number
of F1 progenies (<1). These varieties outperformed the resistant check “Kanjerenjere,” which
had a mean value of 2.0 (Table 4.2). Most of the local varieties experienced moderate to lower
numbers of F1 progenies (Figure 4.3).
Figure 4.3: Distribution of variation for F1 progenies among local maize varieties

100
Distribution of variation among variaties based on MDP
34 4632
15
10
42
5
0
30 38
25
4436
20
40
MD
P
4.6.1.3 Median Development Period (MDP)
Significant differences (p<0.05) were observed among the varieties for the median development
period. Varieties 148, 315, 3243, 1992, and 3244 had the longest median development period
compared to the resistant check “kanjerenjere” (Table 4.2).The majority of F1 progenies took
moderate to short periods of time to reach the 50% threshold from the middle of oviposition, in
the majority of the varieties (Figure 4.4)
Figure 4.4: Distribution of variation for MDP among local maize varieties
4.6.1.4 Percent grain damage
Highly significant differences (p<0.001) for percent grain damage were observed among maize
varieties. Varieties 3244, 2012, 445, 250 and 218 had values ≤ 1%. These values were better
than the resistant check (2.5) (Table 4.2 and appendix 4.1). The majority of the varieties
experienced moderate to little grain damage from maize weevil (Figure 4.5).

101
Distribution of variation for percent weight loss among maize varieties
42
16
14
12
0 8
10
8
6
4
6 10
2
0
Weig
ht lo
ss (%
)
Distribution of variation for percent grain damage among maize varieties
17.5
21
15.0
12.5
6
10.0
7.5
0 4
5.0
20.0
2.5
0.0
3 5
Gra
in d
amag
a (%
)
Figure 4.5: Distribution of variation for percent grain damage among local maize varieties
4.6.1.5 Percent grain weight loss
Using percent grain weight loss as an indicator of resistance among the varieties, 9% of the
varieties were resistant, 35.3% moderately resistant, 38.2 % moderately susceptible, 16%
susceptible and 1.4 % highly susceptible. Varieties 148, 322, 1772, 445, 386 and 218
experienced less grain weight loss (%) (Table 4.2). The grain weight loss (%) due to insects
feeding was moderate among most of the varieties. However, few varieties experienced very
low grain weight loss (Figure 4.6).
Figure 4.6: Distribution of variation for percent weight loss among local maize varieties
4.6.1.6 Dobie index of susceptibility (DSI)
Using Dobie index of susceptibility, 14.5% of the varieties were resistant, 21.7% were
moderately resistant, 24.6% moderately susceptible, 23.2% susceptible and 16% highly
susceptible (Figure 4.7). The most promising varieties were 1772, 1992, 811, 699, 249, 403,

102
Distribution of variation among maize varieties based on DIS
8
17.5
15.0
2 71
12.5
10.0
5
7.5
5.0
0 3
2.5
0.0
4 6
DIS
1995, 240, 3243, 1983, 750, 752 and 3244. These varieties had values <2 which were lower
than the resistant check “kanjerenjere” (2.9) (Table 4.2).
Figure 4.7: Grouping of local maize varieties into maize weevil resistance groups using DIS
Distribution of variation for DIS among the varieties was normal, which means, most the
varieties were moderately resistant and moderately susceptible. Few varieties were highly
susceptible and highly resistant as shown by left and right tails of the histogram, respectively
(Figure 4.8).
Figure 4.8: Distribution of variation for DIS among local maize varieties

103
Table 4.2: Table of means for grain resistance parameters against maize weevil
Variety Adult
mortality Total F1
progenies MDP
Grain damage (%)
Grain weight loss (%)
DSI Resistance status Yield
(tons/ha)
139 27.5 3.25 36.5 3.8 5.3 3.92 moderately susceptible 2.32 145 22.0 3.75 33.3 3.5 7.9 4.33 susceptible 3.43 148 39.2 1.75 39.8 2.0 1.8 2.55 moderately resistant 1.51 154 11.3 4.75 34.0 3.8 4.0 4.89 susceptible 2.77 163 23.0 4.00 30.0 3.8 4.4 5.19 highly susceptible 4.15 164 17.8 9.25 30.0 2.8 5.2 7.67 highly susceptible 2.19 172 26.0 1.75 36.0 1.8 6.0 2.71 moderately resistant 1.80 1772 32.0 0.25 43.0 1.3 1.4 0.40 resistant 3.76 1786 16.3 3.75 30.8 1.5 5.8 4.95 susceptible 4.81 1795 30.5 2.75 33.0 3.3 7.9 3.97 moderately susceptible 3.49 1845 25.5 2.25 30.8 3.0 3.4 3.80 moderately susceptible 1.93 1850 33.0 2.25 36.5 1.5 2.9 3.05 moderately susceptible 1.70 1857 29.5 3.75 33.3 3.3 5.3 4.27 susceptible 1.29 1892 17.3 6.50 30.8 2.3 3.7 6.50 highly susceptible 2.80 260 24.3 3.50 33.3 3.0 4.0 4.39 susceptible 2.41 2862 36.0 1.75 36.5 2.8 7.0 2.88 moderately resistant 2872 20.3 3.75 33.3 3.5 8.0 4.67 susceptible 2.49 289 26.8 2.25 39.8 2.8 4.2 2.54 moderately resistant 2.43 297 20.3 2.00 36.5 2.3 4.1 2.81 moderately resistant 1.54 303 32.8 1.75 34.0 2.8 3.1 2.90 moderately resistant 0.26 310 21.3 2.75 33.3 2.5 3.4 4.05 susceptible 1.02 315 26.8 1.75 39.8 3.3 8.2 2.30 moderately resistant 2.35 322 32.0 2.00 36.5 1.8 1.9 2.68 moderately resistant 1.74 3243 23.3 0.75 43.0 2.3 4.6 1.21 resistant 2.85 3244 42.5 0.75 39.8 0.8 3.4 1.16 resistant 3.91 332 28.5 3.25 30.8 3.3 5.8 4.43 susceptible 2.44 3411 26.5 2.75 36.5 4.0 4.1 3.64 moderately susceptible 2.60 3414 20.3 5.00 30.8 4.0 5.7 5.80 highly susceptible 2.30 386 25.5 3.25 33.3 1.0 1.6 4.04 susceptible 1.60 403 23.5 0.75 40.5 2.3 3.7 1.24 resistant 2.49 410 16.0 4.50 34.0 5.8 5.2 4.35 susceptible 1.65 445 36.0 2.50 33.5 0.3 0.0 3.81 moderately susceptible 3.81 Dk8053 1.07 5.00 30.8 4.8 5.4 5.38 highly susceptible Kanjnj 38.5 2.00 33.3 2.5 8.0 2.90 moderately resistant 2.31 local1 30.3 2.75 33.3 2.3 3.2 3.81 moderately susceptible 1.72 193 19.3 2.75 33.3 2.0 4.1 3.69 moderately susceptible 2.79 1983 35.8 2.00 36.5 2.3 3.2 3.06 moderately susceptible 3.16 199 31.5 1.75 36.5 1.3 2.4 2.88 moderately resistant 2.22 1992 39.0 0.5 43.0 2.0 3.5 0.81 resistant 2.88 1995 31.5 1.25 39.8 5.8 7.6 1.49 resistant
2012 29.0 1.75 33.3 0.5 2.5 2.99 moderately resistant 4.57 2017 33.3 4.00 33.3 2.8 5.7 4.73 susceptible 1.01 2027 29.5 4.00 30.1 4.0 6.0 5.19 highly susceptible 3.17 203 30.3 2.75 33.3 4.5 7.5 4.05 susceptible 2.42 206 34.8 1.75 34.0 3.5 4.0 2.88 moderately resistant 2.39 218 29.8 2.75 36.5 0.5 1.7 3.64 moderately susceptible 0.99 226 24.0 4.25 36.5 2.0 4.9 3.63 moderately susceptible 2.06 240 27.3 0.75 39.8 3.0 2.5 1.32 resistant 1.40 243 18.3 2.75 33.3 1.8 3.8 4.00 susceptible 2.61 249 40.8 0.75 40.5 1.8 2.3 1.24 resistant 2.20 250 27.0 2.75 33.3 1.0 3.1 4.00 susceptible 1.79 292 12.0 5.50 30.0 4.0 6.5 5.97 highly susceptible 2.76
539 31.5 4.75 30.8 2.8 2.8 5.24 highly susceptible 1.35 569 27.8 2.25 33.3 2.0 6.5 3.41 moderately susceptible 4.09 584 14.8 5.25 31.5 3.5 5.4 5.72 highly susceptible 2.13 629 21.8 4.25 37.3 3.8 6.0 4.03 susceptible 2.41 637 20.0 2.50 36.5 1.5 3.7 3.45 moderately susceptible 2.58 696 18.5 3.75 34.0 3.8 4.9 4.38 susceptible 2.24 699 37.8 0.75 33.3 1.5 3.5 1.24 resistant 2.29

104
Table 4.2…continued
Variety Adult
mortality Total F1
progenies MDP
Grain damage (%)
Grain weight loss (%)
DSI Resistance status Yield
(tons/ha)
725 26.0 3.25 34.8 2.3 3.7 3.63 moderately susceptible 1.48 736 23.5 5.25 30.8 3.3 4.9 5.73 highly susceptible 2.45 740 25.5 8.50 34.0 3.3 6.7 6.28 highly susceptible 3.84 741 40.0 2.00 36.5 1.8 4.2 2.68 moderately resistant 1.81 750 29.0 1.50 39.8 4.0 6.9 2.15 moderately resistant 3.52 752 17.5 2.25 33.3 1.5 3.0 3.32 moderately susceptible 4.18 783 31.5 2.00 36.5 2.5 5.8 3.12 moderately susceptible 2.81 787 36.2 1.75 36.5 1.5 2.5 2.66 moderately resistant 1.46 811 34.0 0.75 39.8 1.3 3.0 1.32 resistant 1.71 local2 34.0 2.00 33.3 1.5 3.6 3.17 moderately susceptible 2.66
mean 28.63 2.76 35.01 2.47 4.41 3.44
H2 0.92 0.89 0.85 0.88 0.85
DSI= Dobie index of susceptibility, MDP= Median Development Period
4.6.1.7 Correlation analysis among resistance parameters and yield
Correlation analysis showed significant relationships among different resistance parameters.
Importantly, highly significant (p<0.001) and positive correlations were observed between
percent grain damage and percent grain weight loss (0.637), and between percent grain
damage and total number of F1 progenies (0.4299). Negative but highly significant correlations
(p<0.001) were observed between median development period and DSI (-0.8312), and between
median development period and total number of F1 progenies (-0.6572) Yield potential among
the local varieties did not show any significant differences (Chapter 3, Table 3.7). Correlation
between yield and weevil resistance parameters was not significant (Table 4.3).
Table 4.3: Correlation among parameters for measuring maize weevil resistance and yield
Adult mortality 1 -
DSI 2 -0.5923*** -
Grain damage_% 3 -0.4056*** 0.4258*** -
MDP 4 0.4108*** -0.8312*** -0.2678* -
Total F1 progenies 5 -0.5755*** 0.9369*** 0.4299*** -0.6572** -
Weight loss % 6 -0.2937* 0.3395** 0.637*** -0.2478* 0.3418** -
Yield tons ha 7 -0.1266 0.0368 -0.0654 -0.0582 0.0337 0.206 -
1 2 3 4 5 6 7
Note: Correlation coefficients with * were significantly correlated p<0.05, ** significantly correlated p<0.01 and ***
significantly correlated at p<0.001

105
4.6.2 Response of maize varieties to larger grain borer infestation
Significant differences in response of maize varieties to larger grain borer were observed for
insect mortality, total number of insects, grain damage (%), flour weight (g) and grain weight
loss (%). Broad-sense heritability (H2) ranged from 0.65 for grain weight loss to 0.97 for flour
weight (Table 4.4).
Table 4.4: Analysis of Variance (ANOVA) for grain resistance related parameters against larger
grain borer
SOV df
Insect mortality Total number of
insects Flour weight
Grain damage (%)
Grain weight loss (%)
variety 66 MS 0.131** 0.078* 0.212** 0.451** 0.051**
Block 3 MS 0.627 0.175 0.162 0.068 0.349
Residual 198 MS 0.09 0.047 0.027 0.108 0.108
Total 267 MS 0.106 0.056 0.074 0.193 0.168
CV (%) 9.2 5.5 8.4 11.7 13.4
lsd (0.05) 0.4195 0.3021 0.229 0.459 0.462
SED 0.2127 0.1532 0.116 0.233 0.234
H2 0.85 0.87 0.97 0.94 0.65
Sg** = significant at P<0.001, sg*= significant at P<0.01
4.6.2.1 Total number of insects
Maize varieties showed significant differences (p<0.01) for total number of insects. Varieties
172, 164, 699, 410, and 322 experienced the lowest number of insects than the resistant check
(42.75) (Table 4.5). The majority of the varieties experienced moderate number of insects, while
very few varieties had high and lower numbers of insects as shown by the right and left tails of
the histogram, respectively (Figure 4.9 ).

106
Distribution of variation among maize varieties for total number of insects
5040
35
30
90
25
20
30 70
15
10
5
0
60 80
Tota
l nu
mbe
r of
inse
cts
Distribution of variation for total number of dead insects among local varieties
2.5
2520 40
20.0
17.5
30
15.0
12.5
0.0
35
10.0
7.5
5.0
Inse
ct m
orta
lity
Figure 4.9: Distribution of variation for total number of insects among local maize varieties
4.6.2.2 Insect mortality
Significant differences (P<0.05) for insect mortality were observed among varieties. Varieties
1992 (33.5), 445 (36.5), 1983 (41.5), 292 (38.08) and 154 (41.25) had the highest number of
dead insects and outperformed the resistant check “Kanjerenjere” (23) (Table 4.5). The majority
of the varieties had medium to lower number of dead insects. However, few varieties
experienced extremely high number of dead insects (Figure 4.10).
Figure 4.10: Distribution of variation for insect mortality among local varieties

107
Distribution of variation for amount of flour among local maize varieties
0.0
42
20.0
0 8
17.5
15.0
12.5
10.0
6 10
7.5
5.0
2.5
Flou
r
4.6.2.3 Flour weight (g)
Highly significant difference (p<0.001) for flour weights were observed among the varieties. The
best performers with the least amount of flour produced were varieties 1983 (0.95g), and 1992
(1.8g). Resistant and susceptible checks had 3.225g and 4.225g of flour produced, respectively.
The worse performers with high amount of flour were varieties 304 (8.5g), 154 (8.1g), 1957
(7.95g), 260 (7.82g) and 310 (7.6g) (Table 4.5). The maize varieties produced moderate to high
amount of flour as shown by the skewness to the right of the distribution of variation for flour
weight (Figure 4.11).
Figure 4.11: Distribution of variation for flour weight among local varieties
4.6.2.4 Grain damage (%)
High significant differences (p<0.001) for percent grain damage were observed among the
varieties. Varieties 1983, 1992, and 2012 experienced the least grain damage ranging from 5-
6.75%, while the resistant and susceptible checks had 10.75% and 13.50% grain damage (%),
respectively (Table 4.5 and Appendix 4.1). Maize varieties experienced largely moderate grain
damage, with exceptions of few varieties that experienced high grain damage (Figure 4.12).

108
Distribution of variation for grain damage (%) among local maize varieties
105
17.5
15.0
30
12.5
10.0
0 20
7.5
5.0
2.5
0.0
15 25
Gra
in d
amag
e (%
)
Distribution of variation for weight loss (%) among local maize varieties
30.0
17.5
15.0
15.0 27.512.5
12.5
10.0
22.5
7.5
5.0
10.0 17.5
2.5
0.0
20.0 25.0
Wei
ght
loss
(%
)
Figure 4.12: Distribution of variation for grain damage (%) among local varieties
4.6.2.5 Grain weight loss (%)
Percent grain weight loss showed highly significant differences (p<0.001) among the varieties.
Despite showing significant differences, percent grain weight loss as a measure of resistance
determined that all the varieties were highly susceptible to LGB. However, a good number of
varieties such as 1983 (10.64%), 1850 (13.33%), 1992 (12.93%), 2012 (12.01%), 386 (11.89%)
and 2017 (13.37%) performed better than the resistant control (kanjerenjere) (15.62%).
Varieties, such as 310, 260, 292, 303, and 154 performed worse than the susceptible
commercial hybrid (DK8053) (Table 4.5). Most varieties experienced low to moderate weight
losses except for a few susceptible varieties that had high grain weight loss (Figure 4.13).
Figure 4.13: Distribution of variation for grain weight loss (%) among local maize varieties

109
Table 4.5: Table of means for grain resistance parameters against larger grain borer
Variety Total insect number Insect mortality Grain damage (%) Grain weight loss (%) Flour weight (g) Yield (tons/ha)
139 47.5 25.3 18.0 20.4 5.5 2.32 145 51.3 30.3 18.3 19.3 5.3 3.43 148 54.0 29.3 16.3 17.5 6.3 1.51 154 71.8 41.3 25.0 23.6 8.1 2.77 163 43.0 23.8 14.3 19.8 4.1 4.15 164 39.8 18.8 20.8 21.5 4.7 2.19 172 40.5 24.0 13.0 17.4 3.5 1.80 1772 51.8 29.8 22.8 21.5 4.1 3.76 1786 48.0 21.8 17.8 19.6 4.6 4.81 1795 43.8 26.8 13.3 17.9 3.1 3.49 1845 66.5 30.3 18.3 20.6 6.1 1.93 1850 40.5 30.0 7.8 13.3 2.3 1.70 1857 79.3 31.0 22.5 23.1 8.0 1.29 1892 54.5 23.5 20.8 21.0 6.3 2.80 1915 48.5 29.0 12.8 16.9 3.4
193 47.8 24.8 18.3 20.8 4.9 2.79 218 53.8 26.5 20.0 21.4 6.2 0.99 249 38.5 25.3 9.9 15.3 2.4 2.20 250 57.8 31.8 18.5 20.6 5.5 1.79 260 55.0 21.3 30.8 28.6 7.8 2.41 2872 50.0 32.8 11.3 16.8 3.0 2.49 289 46.8 33.0 8.3 14.7 2.4 2.43 292 56.6 38.1 21.5 21.6 6.5 2.76 297 58.8 24.5 19.0 21.5 6.8 1.54 303 55.8 26.8 31.0 26.3 8.5 0.26 310 60.5 28.3 32.0 28.5 7.6 1.02 315 43.3 28.3 10.8 14.7 3.0 2.35 322 40.8 20.5 13.5 18.5 5.3 1.74 3243 46.0 32.8 10.8 15.2 2.2 2.85 3244 46.5 30.3 7.3 12.1 3.1 3.91 332 49.3 29.5 13.3 16.6 4.0 2.44 3411 52.1 29.0 8.8 13.7 3.8 2.60 3414 49.0 31.0 12.5 17.5 3.1 2.30 206 41.0 27.5 14.0 17.2 3.2 2.39 740 49.0 31.3 13.8 16.8 3.4 3.84 741 41.3 28.3 10.3 15.0 2.7 1.81 750 44.3 19.0 22.3 21.0 5.5 3.52 752 41.3 26.5 11.3 15.5 3.4 4.18 783 68.8 31.0 26.5 24.4 6.2 2.81 787 40.5 28.0 14.3 17.4 3.7 1.46 811 42.0 26.0 15.0 17.7 3.3 1.71 DK8453 (s) 47.3 27.8 13.5 18.2 4.2
Kanjnj (r) 42.8 23.0 10.8 15.6 3.2 2.31 local 1 49.8 21.5 14.5 17.9 5.8 1.72 local 2 54.3 27.8 17.3 19.8 5.0 2.66 1992 42.8 33.5 6.8 12.9 1.8 2.88 2012 38.0 29.5 6.8 12.0 2.1 4.57 2017 45.0 28.3 7.8 13.4 3.9 1.01 2027 50.5 30.0 10.0 14.4 2.7 3.17 203 45.8 20.3 19.0 19.5 6.0 2.42 725 41.3 25.3 13.8 17.2 4.0 1.48 1983 47.0 41.5 5.0 10.6 1.0 3.16 199 45.8 27.5 13.3 17.7 3.7 2.22 569 43.8 31.8 12.3 16.1 3.1 4.09 629 50.5 31.8 18.3 20.7 5.8 2.41 637 41.8 27.5 11.0 15.9 4.0 2.58 696 41.8 21.3 21.0 22.4 4.5 2.24 736 46.8 18.8 17.8 19.2 5.5 2.45 386 41.0 26.5 8.0 11.9 3.0 1.60 403 42.8 22.8 8.0 13.7 2.7 2.49 410 40.8 29.0 13.5 16.1 4.0 1.65

110
Table 4.5 ………..continued
Variety Total insect number Insect mortality Grain damage (%) Grain weight loss (%) Flour weight (g) Yield
(tons/ha)
445 45.00 36.5 8.3 14.3 2.0 3.81
539 49.75 30.0 12.5 16.6 3.2 1.35
699 26.00 26.0 8.5 13.4 2.7 2.29
226 50.25 25.3 17.5 18.7 5.1 2.06
240 59.75 31.0 18.0 20.7 6.1 1.40
243 50.75 28.5 23.8 22.6 5.2 2.61
Mean 50.88 28.1 16.8 19.3 4.8
H2 0.87 0.9 0.9 0.7 1.0
4.6.2.6 Correlation between LGB resistance parameters and yield
Highly significant correlations (p<0.001) were observed between grain weight loss (%) and grain
damage (%) (0.8828), between flour weight and grain damage (%) (0.9789), and between flour
weight and grain weight loss (%) (0.8722). Correlations between yield and resistance
parameters were not significant except for flour weight (0.3599) (Table 4.6).
Table 4.6: Correlation among resistance parameters for LGB and yield
Flour weight (g) 1 -
Grain damage% 2 0.8828** -
Insect mortality 3 -0.1868 -0.195 -
Total number of insects 4 0.7099** 0.6128** 0.3454* -
Weight loss % 5 0.8722** 0.9789** -0.216 0.6137** -
Yield tons ha 6 -0.3599* -0.2284 0.1226 -0.1858 -0.2345 -
1 2 3 4 5 6 Note: Correlation coefficients with * were significantly correlated at p<0.01, ** significantly correlated at P<0.001

111
4.7 Discussion
4.7.1 Maize weevil resistance among local maize varieties
Substantial variation in resistance against maize weevil exists among local maize varieties in
Malawi. The variation for resistance was confirmed by significant differences for adult mortality,
total F1 progenies, median development period, percent grain damage, percent grain weight
loss and Dobie index of susceptibility among local maize varieties. These results are in
agreement with reports by Giga and Mazarura (1991) who found variation for maize weevil
resistance among exotic, local open pollinated varieties and maize hybrids obtained from
Malawi, Zimbabwe and Mexico. Resistant varieties showed low adult mortality, low percent
grain weight loss and low Dobie Index of susceptibility.
Percent grain weight loss as an indicator of susceptibility appeared to be more conservative in
identifying resistant varieties than Dobie Index of susceptibility. Furthermore, percent grain
weight loss and Dobie Index of Susceptibility (DIS) showed a weak but significant correlation
(0.3395) at p≤ 0.01. This weak but significant relationship probably could be an indication that
the two indicators of susceptibility have a small chance of identifying similar resistant varieties.
Hence, the two indicators only identified one common resistant variety (1772) among the top
most resistant varieties. In addition, DSI significantly correlated with the other resistant
parameters at P≥0.001. Combining DIS, percent grain weight loss, percent grain damage, total
number of F1 progenies and adult mortality, maize varieties 1772, 1992, 3243, 3244, 148, 322,
445, 386, 218, 2012, 741, 699, 811, 1983, 249, 403 and 250, were identified as the most
resistant varieties. However, using percent weight loss alone, only varieties, 148, 218, 322, 386,
445 and 1772 were identified as resistant. It is however, worth noting that distribution of
variation for DIS was normal. This indicates that for DIS was a better parameter for
discriminating maize varieties for weevil resistance in this study. The differences in the
distribution of variation among resistance parameters signified the existing variation for weevil
resistance among the maize varieties.
The use of percent grain weight loss, percent grain damage, fecundity and DIS as indicators of
susceptibility or resistance has been documented (Derera et al., 2000; Kitaw et al., 2001; Abbe
et al., 2009; Mwololo et al., 2012). Mwololo et al. (2012) used grain weight loss, grain damage
(%) and number of insects to differentiate levels of weevil resistance among maize varieties in

112
Kenya. Resistant varieties showed low grain weight loss, low grain damage (%) and low number
of insects as also established by Abbe et al. (2009) among varieties in Ethiopia. Derera et al.
(2000) and Kitaw et al. (2001) demonstrated that resistant varieties can be identified using adult
weevil mortality, grain damage (%), progeny numbers, median development period and Dobie
index of susceptibility. From a breeding perspective, the grain resistance parameters showed
good levels of broad-sense heritability. For example, F1 progenies showed a broad-sense
heritability of 0.89, adult mortality (0.92), weight loss (%) (0.85), MDP (0.85) and grain damage
(%) (0.88).This indicates that these parameters are heritable as reported by Dhliwayo and
Pixley (2003).
The resistance observed in maize varieties against maize weevil could be due to biophysical
grain factors or antibiosis (Derera et al., 2000; García-Lara et al., 2004). For example, Mwololo
et al. (2013) reported differences in grain hardness between resistant and susceptible varieties
due to protein composition within the grain structure. Taking into consideration that many traits
are involved in maize weevil resistance (Mwololo et al., 2013), a multi-trait breeding approach to
maize weevil resistance breeding is crucial. For example, the use of molecular markers,
exploitation of husk cover, physical grain characteristics and chemical composition (Meikle et
al., 1998; Derera et al. 2000; García-Lara et al., 2004; Reif et al., 2004; Mwololo et al., 2013)
can lead to a successful maize weevil resistance breeding programme. However, central to this
approach is the identification of the nature of gene action controlling maize weevil resistance in
maize materials (Derera et al., 2000; Dhilwayo and Pixley, 2003; Kim and Kossou, 2003; Dari et
al., 2010). The nature of gene action would help in devising a strategy for enhancing resistance
in the maize varieties. This is discussed in chapter 6 of the current study.
4.7.2 Larger grain borer resistance among local maize varieties
Maize varieties showed significant variation in response to LGB infestation. The variation in
resistance among maize varieties were shown by highly significant differences for flour weight,
insect mortality, percent grain damage and percent grain weight loss. The distribution of
variation for resistance parameters among the varieties seemed to be concentrating at the
centre. This indicates that most of the local varieties had moderate resistance against larger
grain borer. Variation for resistance to LGB was also reported among landraces along the
coastal region of Kenya (Ndiso et al., 2007). Variety differences in response to LGB are critical
in the control of the pest (Rugumamu, 2006).

113
Exploitation of variation for flour weight, insect numbers, development periods, percent grain
weight loss, percent grain damage to measure varietal resistance against LGB have been
reported (Kasambala, 2009; Mwololo et al., 2010). For instance, Kasambala (2009) used insect
numbers, percent grain weight loss and percent grain damage to determine the existing
variation for resistance against LGB among maize varieties in Malawi. The results revealed
variation for grain weight loss ranging between 7.7 and 30.3%, percent grain damage (33-
66.7%) and insect numbers (41 to 99). In the study, Kanjerenjere (local variety) was identified
as resistant variety. Hence, Kanjerenjere was used as a resistant check in the current study.
The current study results showed that the total number of insects ranged from 38 to 79, percent
grain damage ranged from 5 to 32% and percent weight loss ranged from 10.64% to 28.61%.
These ranges did not differ significantly from the results obtained by Kasambala (2009).
However, some varieties outperformed the resistant check. This is an indication of high level of
variation among maize varieties which should be exploited in breeding programmes. Mwololo et
al. (2010) reported significant differences in grain damage, flour weights, number of dead and
live insects among varieties in Kenya. Importantly, these parameters are heritable. For example,
in the current study, percent grain weight loss showed a broad-sense heritability of 0.65 and
percent grain damage (0.94), flour weights (0.97), adult mortality (0.85) and insect numbers
(0.85).Therefore, according to the present results, these parameters can reliably discriminate
varieties against larger grain borer.
Correlation analysis showed highly significant relationships between flour weights with grain
damage (%), and between grain damage (%) and number of insects. This relationship is
consistent with the manner LGB excavates the grain with its deflexed head and well-built
mandibles (LI, 1988). Consequently, increase in number of insects resulted in the increased
grain damage and high amount of flour produced. Using percent weight loss to measure
susceptibility of varieties, all varieties were susceptible. However, varieties, such as 1992, 2012,
1850, 2017, 386 and 1983 had lesser percent weight loss and performed better than the
resistant check (Kanjerenjere). The relatively low percent grain weight loss among the varieties
was consistent with their respective percent grain damages, which were also relatively lower
than the resistant check. This provides a new opportunity for new sources of resistance for use
in breeding for insect resistance. It is also worth noting that varieties 1992 and 1983 showed
also high level of resistance to maize weevil. This provides an opportunity to select for both

114
maize weevil and larger grain borer resistance, since both insect pests are generally found in
the same environment within the storage facilities.
The resistance observed in maize varieties against larger grain borer could be due to antibiosis
(Kumar, 2002; Nhamucho et al., 2014). Of late, Mwololo et al. (2012) reported the effect of
protein composition and lipids on maize resistance to LGB in tropical maize. Resistant varieties
exhibited high levels of lipids and protein content. Arnason et al. (1992) reported the role of
grain moisture, grain hardness, vitreous endosperm and nutritional factors in LGB development
and behaviour.
4.7.3 Yield and grain resistance
Results on yield had shown that there were no significant differences for yield among maize
varieties. However, some varieties showed promising yield potentials, such as 2012 (4.57
tons/ha), 1786 (4.81 tons/ha), 1795 (3.49 tons/ha), 2012 (4.57 tons/ha), 3244 (3.91 tons/ha),
445 (3.81 tons/ha), and 752 (4.18 tons/ha). Reports by Mwololo et al. (2013) indicated
significant variation for grain yield among insect resistant varieties in Kenya. Combining weevil
resistance and yield performance, the best local maize varieties were 1772, 1983, 1992, 3243,
3244, 750 and 752. Except for varieties, 2012, 1772 and 752 that were semi-flint, the rest of the
varieties were dent. For larger grain borer, the best varieties with useful resistance levels and
yields were varieties 1983 (3.16 tons/ha) and 1992 (2.88 tons/ha) and were dent.
The correlations between yield and resistance parameters for both maize weevil and larger
grain borer were not significant. This means that selection for resistance can be done without
significantly affecting yield. In this regard, potential varieties that have been identified as having
better resistance against maize weevil and larger grain borer can be improved upon to enhance
both resistance and yield.
4.8 Conclusion
Variation in resistance against maize weevil and larger grain borer exists among local maize
varieties grown in Malawi. Therefore genetic diversity and grain resistance are not mutually
exclusive in the maize germplasm. The results from the study have shown that resistance to
larger grain borer and maize weevil can be found in a single variety as demonstrated by
varieties 1992 and 1983. The identified new sources of LGB and MW resistance would be

115
recommended for use in programmes that emphasize post-harvest insect resistance. For
instance, varieties, such as 1772, 1983, 1992, 3243, 3244, 750 and 752 are good candidates for
developing populations that are resistant to maize weevil. For larger grain borer resistance,
1992, 2012, and 1983 could be used in developing LGB resistant populations. However, these
varieties would require recurrent selection to increase the frequency of resistant genes. Further
tests on the recommended varieties should be done to ascertain their consistency in resistance
levels, largely against larger grain borer to dispel pseudo-resistance among the varieties. The
assessment of the top varieties should be done inclusive of other equally important agronomic
attributes preferred by farmers.
References
Abebe, F., T. Teheran, S. Mugo, Y. Been, and S. Vidal. 2009. Resistance of maize varieties to
the maize weevil, Sitophilus zeamais (Motsch.) (Coleoptera: Curculionidae). African
Journal of Biotechnology 8:5937-5943.
APHLIS. 2015. African Post-Harvest Losses Information System. 2015. Available at
http://www.aphlis.net. Accessed on 6 March, 2015.
Arnason, J.T., J. Gale, B.C.D. Beyssac, A. Sen, S.S. Miller, B.J.R. Philogene, J.D.H. Lambert,
R.G. Fulcher, A. Serratos, and J. Mihm. 1992. Role of phenolics in resistance of maize
grain to the stored grain insects, Prostephanus truncatus (Horn) and Sitophilus zeamais
(motsch.). Journal of Stored Products Research 28:119-126.
Boxall, R.A. 2002. Damage and loss caused by the larger grain borer, Prostephanus truncatus.
Intergrated Pest Management Reviews 7:105-121. Kluwer Academic Publisher,
Netherlands.
Bergvinson, D.J., and S. García-Lara. 2011. Synergistic effects of insect-resistant maize and
Teretrius nigrescens on the reduction of grain losses caused by Prostephanus
truncatus (Horn.). Journal of Stored Products Research 47:95-100.
Ching’oma, P. 2009. Spatial and temporal distribution of the Larger Grain Borer, Prostephanus
truncatus (Horn) and the predator Teretrius nigrescens Lewis in relation to weather
parameters. Makoka Agricultural Research Station, Thondwe, Malawi.
CIMMYT. 2000. World maize facts and trends. CIMMYT, Mexico, D.F.

116
Dari, S., K.V. Pixley, and P. Setimela. 2010. Resistance of early generation maize inbred lines
and their hybrids to maize weevil, Sitophilus zeamais Motschulsky. Crop Science
50:1310–1317.
Denning, G., P. Kabambe, P. Sanchez, A. Malik, and R. Flor. 2009. Input subsidies to improve
smallholder maize productivity in Malawi: Towards an African green revolution. Public
Library of Science Biology 7(1): e1000023.doi:10.1371/journal.pbio.1000023. Available
at http://www.plosbiology.org. Accessed on 30 June 2010. Public Library of Science,
USA.
Derera, J., K.V. Pixley, and P. D. Giga. 2000. Resistance of maize to the maize weevil: I.
Antibiosis. African Crop Science Journal 9:431-440.
Dhliwayo, T., and K.V. Pixley. 2003. Divergent selection for resistance to maize weevil in six
maize populations. Crop Science 43:2043–2049.
Dhliwayo, T., K. Pixley, and V. Kazembe. 2005. Combining ability for resistance to maize wevil
among 14 Southern African maize inbred lines. Crop Science 45:662-667.
Dobie, P. 1974. The laboratory assessment of the inherent susceptibility of maize varieties to
post harvest infestation by Sitophilus zeamais Motsch. (Coleoptera: Curculionidea)
infesting field corn. Journal of Entomological Science 21:367-375.
Fragoso, D.B., R.N.C. Guedes, and L.A. Peternelli. 2005. Developmental rates and population
growth of insecticide resistant and susceptible populations of Sitophilus zeamais. Journal
of Stored Products Research 41:271–281.
Garci'a-lara, S., Bergvinson, D., Burt, A. J., Ramput, A., Duaz-pontones, D. M., and Arnason, J.
T. 2004. The role of pericarp cell wall components in maize weevil resistance. Crop
Science 44:546-1552.
Giga, D.P., and U.W. Mazarira. 1991. Levels of resistance to the maize weevil, Sitophilus
zeamais (Motsch) in exotic, local open pollinated and hybrid maize germplasm.
International Journal of Tropical Insect Science 12:159-169.
Golob, P. 2002. Chemical, physical and cultural control of Prostephanus truncatus. Intergrated
pest management reviews 7:245-277.
Haines, C.P. 1991. Insects and arachnids of tropical stored products: their biology and
identification – A training manual. Natural Resources Institute (NRI).
Kamanula, J., G.W. Sileshi, S.R. Belmain, P. Sola, B.M. Mvumi, G.K.C. Nyirenda, S.P.
Nyirenda, and P.C. Stevenson. 2011. Farmers’ insect pest management practices and

117
pesticidal plant use in the protection of stored maize and beans in Southern Africa.
International Journal of Pest Management 57:41–49.
Kasambala, T. 2009. Prostephanus truncatus (Horn) (Coleoptera: Bostrichidae) infestation
levels on different maize varieties in Malawi. Resistant Pest Management Newsletter
Vol. 19, No. 1 (Fall 2009) p. 9-13. Center for Integrated Plant Systems (CIPS).
Kim, S.K., and D.K. Kossou. 2003. Responses and genetics of maize germplasm resistant to
the maize weevil, Sitophilus zeamais (Motschulsky) in West Africa. Journal of Stored
Products Research 39:489–505.
Kitaw, D., F. Eticha, and A. Tadesse. 2001. Response of commercial varieties and other
genotypes of maize for resistance to the maize weevil, Sitophilus zeamais (motsch.)
(Coleoptera: Circulionidae). p. 92-101. Seventh Eastern and Southern Africa Regional
Maize Conference.
Kumar, H. 2002. Resistance in maize to the Larger Grain Borer, Prostephanus truncatus (Horn)
(Coleoptera: Bostrichidae). Journal of Stored Products Research 38: 267–280.
Li, L. 1988. Behavioral ecology and life history evolution in the larger grain borer, Prostephanus
truncatus (Horn). Ph.D thesis, University of Reading.
Makoka, D. 2008. The Impact of drought on household vulnerability: The case of rural Malawi.
2008 United Nations University (UNU-EHS) Summer Academy on “Environmental
Change, Migration and Social Vulnerability”. Bonn, Germany.
Meikle, W.G., C. Adda, K. Azoma, C. Borgemeister, P. Degbey, B. Djomamou, and R.H.
Markham. 1998. The effects of maize variety on the density of Prostephanus truncatus
(Coleoptera: Bostrichidae) and Sitophilus zeamais (Coleoptera: Curculionidae) in Post-
harvest Stores in Benin Republic. Journal of Stored Products Reseach 34:45-58.
Mwololo, J.K., S. Mugo, P. Okori, T. Tadele, and S.W. Munyiri. 2010. Genetic diversity for
resistance to larger grain borer in maize hybrids and open pollinated varieties in Kenya.
Second RUFORUM Biennial Meeting 20-24 September 2010, Entebbe, Uganda.
Mwololo, J.K., S. Mugo, P. Okori, T. Tefera, M. Otim, and S.W. Munyiri. 2012. Sources of
resistance to the maize weevil, Sitophilus zeamais in tropical maize. Journal of
Agricultural Science 4:1916-9752.

118
Mwololo J.K., S. Mugo, P. Okori, T. Tadele, and S.W. Munyiri, and K. Semagn. 2012.
Resistance of tropical maize genotype to the larger grain borer. Journal of Pest Science
81(1): Doi 10.1007/s10340-012-0427-0. Accessed on 4 September 2014.
Mwololo, J.K., S. Mugo, T. Tefera, and S.W. Munyiri. 2013. Evaluation of traits of resistance to
post harvest insect pests in tropical maize. International Journal of Agriculture and Crop
Science 6(13):926-933.
Ndiso, J.B., S. Mugo, A.M. Kibe, R.S. Pathak, and P. Likhayo. 2007. Characterization for
phenotypic drought tolerance and resistance to storage pests in local coastal maize
landraces in Kenya. p. 245-250 African Crop Science Conference Proceedings.
Nhamucho, C., S. Mugo, M.Kinyua, L. Gohole, T. Tefera, and E. Mulima. 2014. Antibiosis
mechanism for resistance to larger grain borer, Prostephanus truncatus (Horn)
(coleoptera: Bostrichidae) in maize. Journal of Entomology 11:248–260.
Payne, R.W., S.A. Harding, D.A. Murray, D.M. Soutar, D.B. Baird, A.I. Glaser, S.J. Welham,
A.R. Gilmour, R. Thompson, and R. Webster. 2011. GenStat Release 14. VSN
International 5 The Waterhouse, Waterhouse Street, Hemel Hempstead, Hertfordshire
HP1 1ES, UK.
Pereira, C.J., E.J.G. Pereira, E.M.G. Cordeiro, T.M.C.D. Lucia, M.R. Totola, and R.N.C.
Guedes. 2009. Organophosphate resistance in the maize weevil, Sitophilus zeamais:
Magnitude and behavior. Crop Protection 28:168–173.
Pingali, P. 2001. CIMMYT 1999-2000 World maize facts and trends. Meeting world maize
needs: Technological opportunities and priorities for the public Sector CIMMYT, Mexico,
D.F.
Reif, J.C., X.C. Xia, A.E. Melchinger, M.L. Warburton, D.A. Hoisington, D. Beck, M. Bohn, and
M. Frisch. 2004. Genetic diversity determined within and among CIMMYT maize
populations of tropical, subtropical, and temperate germplasm by SSR markers. Crop
Science 44:326-334.
Rugumamu, C.P. 2006. Varietal role in the management of the larger grain borer, Prostephanus
truncatus (Horn) in stored maize. Tanzania Journal of Science 32(2).
Singano, C.D., B.T. Nkhata, and V.Mhango. 2009. National annual report on larger grain borer
monitoring and Teretrius Nigrescens rearing and releases in Malawi
Smith, C.M. 1994. An Overview of the mechanisms and bases of insect resistance in maize.
p.1-12. In J. A. Mihm (ed.) Insect Resistant Maize: Recent advances and utilization:

119
Proceedings of an International Symposium held at the International Maize and Wheat
Improvement Center, 27 November-3 December, 1994. Mexico, D.F. CIMMYT.
Tefera, Tadele, Stephen Mugo, Regina Tende and Paddy Likhayo. 2010. Mass rearing of stem
borers, maize weevil, and larger grain borer insect pests of maize. CIMMYT: Nairobi,
Kenya.
Tefera, T., S. Mugo, and P. Likhayo. 2011. Effects of insect population density and storage time
on grain damage and weight loss in maize due to the maize weevil Sitophilus zeamais
and the larger grain borer, Prostephanus truncatus. African Journal of Agricultural
Research 6:2249-2254.
Tigar, B.J., P.E. Osborne, G.E. Key, M.E. Flores-S and M. Vazquez-A.1994. Insect pests
associated with rural maize stores in Mexico with particular reference to Prostephanus
truncatus (Coleoptera:Bostrichidae). Journal of Stored Products Research 30:267-281.

120
Chapter 5
Assessment of larger grain borer (Sitophilus zeamais Motschulsky) and maize
weevil (Sitophilus zeamais Motschulsky) resistance and yield potential of F1
maize hybrids in Malawi
Abstract
Maize production among smallholder farmers in Malawi is compromised by the negative effects
of larger grain borer and maize weevil on maize grain in storage. Breeding for high yielding
maize varieties with useful levels of resistance against these storage pests is central in
improving net gain in maize production in the country. The objectives of the study were to
develop insect resistant maize hybrids for use by smallholder farmers in Malawi and to evaluate
the yield potential of insect resistant F1 hybrids in target production environments in Malawi. The
F1 maize hybrids showed significant differences for grain damage (%), insect mortality, total
number of insects, flour weight (g) and grain weight loss (%). Maize weevil resistant hybrids
ranged from 4 to 67% across sets, while larger grain borer resistant hybrids ranged from 4 to
9% across sets. Stacking of maize weevil and larger grain borer resistance produced 67%
maize weevil resistant hybrids, 14% larger grain borer resistant hybrids and 14% hybrids with
resistance to both larger grain borer and maize weevil. Highly significant differences (p<0.001)
were observed for yield among the F1 hybrids across environments. Maize hybrids MWA06A
showed a yield potential of 10 tons/ha, MWMW15106 (9.07 tons/ha) and MWMW10A (7.69
tons/ha) and good resistance to maize weevil. Maize hybrids lgMW087940 and MWlg06264
expressed high yield potential of 11.05 tons/ha and 8.16 tons/ha, respectively and good
resistance to both maize weevil and larger grain borer. The stacking of maize weevil and larger
grain borer resistance in single maize hybrids would provide an effective way of breeding for
dual insect pest resistance. Breeding for high yielding insect resistant maize hybrids would
provide a sustainable way of improving net gain in grain yield for smallholder farmers in Malawi.
Keywords: Breeding, genotype x environment, larger grain borer, maize weevil, insect
resistance

121
5.1 Introduction
The importance of maize to Malawi cannot be overemphasized. Maize is grown by 97% of
farming households and accounts for 60% of total calorie consumption (Denning et al., 2009). In
2012, the mean annual maize consumption per individual was 131.2 kg (FAOSTAT, 2014).
Despite its important role as a staple food crop, the net gain in maize production in Malawi is
reduced by a number of factors, one of which is post-harvest loss of maize grain in storage due
to insect pests. Maize weevil (MW) (Sitophilus zeamais Motschulsky) and larger grain borer
(LGB) (Prostephanus truncatus Horn) are the most important storage insect pests of maize in
Malawi (Makoka, 2008; Singano et al., 2009; Kamanula et al., 2011). Therefore, breeding for
high yielding maize varieties with useful levels of resistance against storage pests is an
important undertaking in the country.
In Malawi, maize is grown under various environmental conditions (Ngwira, 2001) that affect
maize productivity. The maize growing environments are affected by the depletion in soil
nutrients, climate change, low rainfall, drought, pests and diseases among other factors
(Denning et al., 2009). Nitrogen and phosphorus deficiencies are the major soil fertility
constraints to maize production in Malawi (Akinnifesi et al., 2007). Furthermore, losses in yield
due to drought are by far greater than any other causes (Farooq et al., 2008). For example, mild
and severe water stress can reduce maize yields by 63% and 85%, respectively (Earl and
Davis, 2003). Climate and environmental changes are also threatening agricultural production in
the world (IFPRI, 2007) and Malawi is not an exception. The country has experienced
unprecedented high temperatures, short growing seasons and unpredictable rainfall pattern
(Denning et al., 2009).
The changes in environmental and climatic conditions affect the yielding potential of maize
genotypes mainly due to genotype and environment interaction (GEI) (Grada and Ciulca, 2013).
The GIE is the differential reaction of genotypes across environments (Yan and Kang, 2003).
The GIE results from genetic differences between cultivars in their response to environmental
factors such as soil nutrients, light, pests, diseases, physical injury, year of planting, and state of
technology (Pereira de Oliveira et al., 2003; Yan and Kang, 2003; Banzinger et al., 2004). In
addition, changes in yield and stability of genotypes in different environments are caused by
significant GEI (Abera et al., 2004) which depends on sufficient differences in environments and
genotypes (Yan and Hunt, 1998). Significant GEI affects heritability of traits, adaptability of

122
genotypes, ranking and selection of superior genotypes across environments (Yan and Hunt,
1998).
The performance of genotypes across environments can only be assessed through Multiple
Environment Trial (MET) through which genotypes are planted several times in one or more
environments. Multi-location testing of genotypes helps to reduce the effects of GEI (Nzuve et
al., 2013). The data collected on the performance of cultivars across the environments helps in
the selection of superior genotypes (Setimela et al., 2007).
Different methods are available for analysis of yield data, such as Analysis of Variance
(ANOVA), Linear regression analysis, GGE Biplot, Additive Main Effects and Multiplicative
Interaction (AMMI) and Residual Maximum Likelihood (REML). Analysis of Variance provides
main effects without GEI (Miranda et al., 2009). Finlay and Wilkinson (1963) reported the use of
regression on mean model, where GEI is obtained through the variation in yielding potential of
different genotypes to the change in the environment. GGE biplot and AMMI use both ANOVA
and PCA to provide information about individual genotypes, environments and the degree of the
interaction between genotypes and environments (Gauch, 1992; Maa’li, 2008; Miranda et al.,
2009; Nzuve et al., 2013). Residual Maximum Likelihood has been reported as one of the
easiest and robust methods in yield data analysis. REML analyses more than one source of
error variation and it is an ideal tool for unbalanced design (Payne et al., 2009). REML
manipulates both random and fixed factors as follows: Yield = mean + fixed effects + random
effects (O’Neil, 2010).
Since maize grows in diverse environments and interacts with different environmental factors
(Nzuve et al., 2013), the sustainability of insect resistant maize varieties in farmers’ agro-
environments depends on their performance in different environmental conditions. This
necessitates the evaluation of insect resistant maize hybrids in different agro-environments in
Malawi.
5.2 Study objectives
The objectives of the study were:
1. To develop insect resistant maize hybrids for use by smallholder farmers in Malawi.

123
2. To evaluate yield potential of insect resistant F1 hybrids in target production environments in
Malawi.
5.3 Materials and Methods
5.3.1 Collection of maize breeding lines
Maize breeding lines were collected from Chitedze Research Station (Malawi), CIMMYT-Kenya,
and CIMMYT-Zimbabwe. Lines from CIMMYT-Kenya and CIMMYT-Zimbabwe are known to
have useful resistance against larger grain borer and maize weevil, respectively, while lines
from Malawi are known to have good adaptation and yield potential (Table 5.1).
Table 5.1: Breeding lines used in insect resistant F1 hybrid development
Breeding line Breeding prominence Source
CKSPL10264 Larger grain borer resistance CIMMYT-KENYA CKSP10021 Larger grain borer resistance CIMMYT-KENYA CKSPL10074 Larger grain borer resistance CIMMYT-KENYA CKSPL10089 Larger grain borer resistance CIMMYT-KENYA CKSPL10164 Larger grain borer resistance CIMMYT-KENYA CKSPL10218 Larger grain borer resistance CIMMYT-KENYA CKSPL0176 Larger grain borer resistance CIMMYT-KENYA CKSPL10007 Larger grain borer resistance CIMMYT-KENYA CKSPL10088 Larger grain borer resistance CIMMYT-KENYA CKSPL10087 Larger grain borer resistance CIMMYT-KENYA CL106675 Maize weevil resistance CIMMYT-ZIMBABWE CL106937 Maize weevil resistance CIMMYT-ZIMBABWE CL106939 Maize weevil resistance CIMMYT-ZIMBABWE CL106940 Maize weevil resistance CIMMYT-ZIMBABWE CL106510 Maize weevil resistance CIMMYT-ZIMBABWE CL106506 Maize weevil resistance CIMMYT-ZIMBABWE CL106513 Maize weevil resistance CIMMYT-ZIMBABWE CL106674 Maize weevil resistance CIMMYT-ZIMBABWE CL1012151 Maize weevil resistance CIMMYT-ZIMBABWE VL081446 Maize weevil resistance CIMMYT-ZIMBABWE CL106511 Maize weevil resistance CIMMYT-ZIMBABWE CL106508 Maize weevil resistance CIMMYT-ZIMBABWE CL106690 Maize weevil resistance CIMMYT-ZIMBABWE CL106674 Maize weevil resistance CIMMYT-ZIMBABWE CL106512 Maize weevil resistance CIMMYT-ZIMBABWE CL106676 Maize weevil resistance CIMMYT-ZIMBABWE CL106514 Maize weevil resistance CIMMYT-ZIMBABWE INBRED A Adaptation and yield CHITEDZE-MALAWI CML202 Adaptation and yield CHITEDZE-MALAWI 46C2W Adaptation and yield CHITEDZE-MALAWI MAT273 Adaptation and yield CHITEDZE-MALAWI CML395 Adaptation and yield CHITEDZE-MALAWI CHIT116 Adaptation and yield CHITEDZE-MALAWI CML444 Adaptation and yield CHITEDZE-MALAWI CZ10020 Adaptation and yield CHITEDZE-MALAWI I(83) Adaptation and yield CHITEDZE-MALAWI AR158 Adaptation and yield CHITEDZE-MALAWI

124
5.3.2 Planting of maize breeding lines
Maize breeding lines were planted in pots under ambient conditions at Chitedze Research
Station during the 2011/2012 growing season to generate crosses. The pots were 24 cm in
diameter and 28 cm high. Loam soil mixed with organic manure was put into the pots. Two
seeds were planted in each pot. Basal application of fertilizer NPK (23:21:0 +4S) and top
dressing was done using Urea (46% N) at 5g/pot (50kg/ha). Weeds were removed manually
from the pots every time they appeared. Insecticide ‘karate’ (lambda-cyhalothrin) was applied to
the soil to control termites.
5.3.3 Generation of crosses
Five sets (a-e) of breeding materials (F1s) were generated through crossing using North
Carolina Design II scheme (Figure 5.1) as follows, Set a: Maize weevil resistant lines X locally
adapted Malawi lines Set b: Maize weevil resistant lines X maize weevil resistant lines, Set c:
Larger grain borer resistant lines X locally adapted Malawi lines, Set d: Larger grain borer
resistant lines X larger grain borer resistant lines, and Set e: Larger grain borer resistant lines X
maize weevil resistant lines.
Females
Males 1 2 3 4 5 6
7 1x7 2x7 3x7 4x7 5x7 6x7
8 1x8 2x8 3x8 4x8 5x8 6x8
9 1x9 2x9 3x9 4x9 5x9 6x9
10 1x10 2x10 3x10 4x10 5x10 6x10
11 1x11 2x11 3x11 4x11 5x11 6x11
12 1x12 2x12 3x12 4x12 5x12 6x12
Figure 5.1: North Carolina Design II crossing scheme
In each set, 12 lines (six females and six males) were crossed. Thirty six crosses were made
per set, giving a total of 180 crosses (F1 hybrids) for five sets (Table 5.2). At maturity, cobs were
harvested and sundried in readiness for field planting during the 2012/2013 growing season.
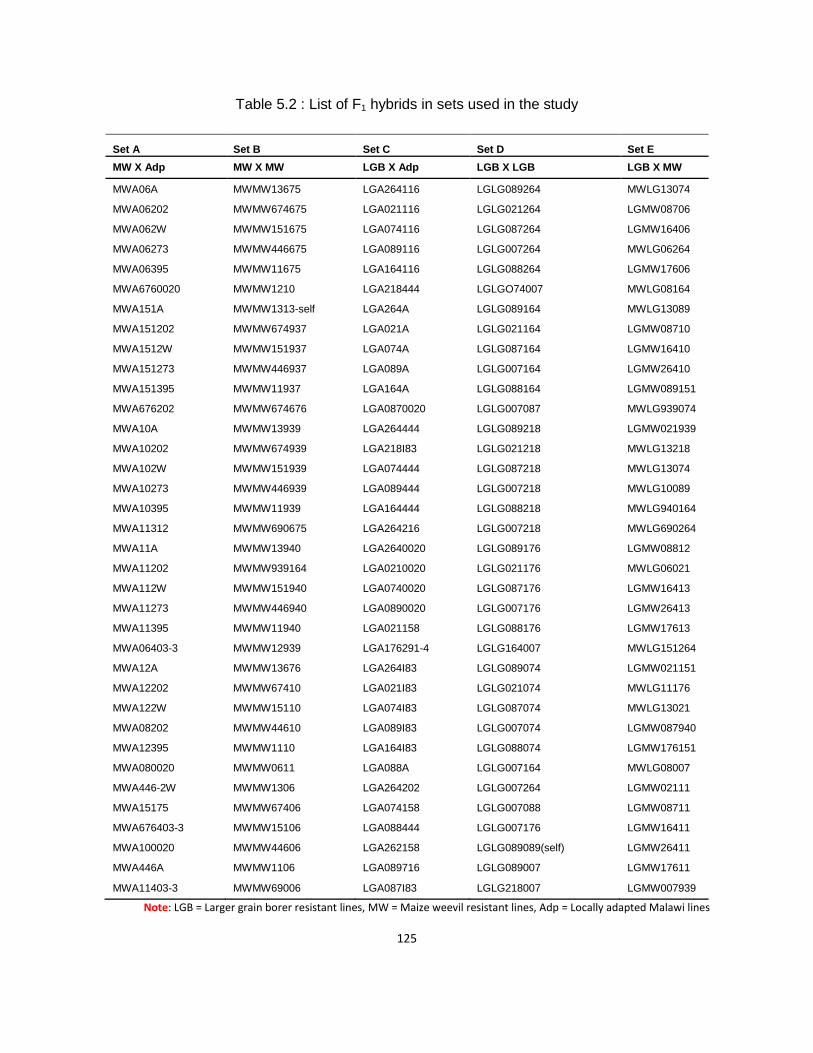
125
Table 5.2 : List of F1 hybrids in sets used in the study
Set A Set B Set C Set D Set E
MW X Adp MW X MW LGB X Adp LGB X LGB LGB X MW
MWA06A MWMW13675 LGA264116 LGLG089264 MWLG13074
MWA06202 MWMW674675 LGA021116 LGLG021264 LGMW08706
MWA062W MWMW151675 LGA074116 LGLG087264 LGMW16406
MWA06273 MWMW446675 LGA089116 LGLG007264 MWLG06264
MWA06395 MWMW11675 LGA164116 LGLG088264 LGMW17606
MWA6760020 MWMW1210 LGA218444 LGLGO74007 MWLG08164
MWA151A MWMW1313-self LGA264A LGLG089164 MWLG13089
MWA151202 MWMW674937 LGA021A LGLG021164 LGMW08710
MWA1512W MWMW151937 LGA074A LGLG087164 LGMW16410
MWA151273 MWMW446937 LGA089A LGLG007164 LGMW26410
MWA151395 MWMW11937 LGA164A LGLG088164 LGMW089151
MWA676202 MWMW674676 LGA0870020 LGLG007087 MWLG939074
MWA10A MWMW13939 LGA264444 LGLG089218 LGMW021939
MWA10202 MWMW674939 LGA218I83 LGLG021218 MWLG13218
MWA102W MWMW151939 LGA074444 LGLG087218 MWLG13074
MWA10273 MWMW446939 LGA089444 LGLG007218 MWLG10089
MWA10395 MWMW11939 LGA164444 LGLG088218 MWLG940164
MWA11312 MWMW690675 LGA264216 LGLG007218 MWLG690264
MWA11A MWMW13940 LGA2640020 LGLG089176 LGMW08812
MWA11202 MWMW939164 LGA0210020 LGLG021176 MWLG06021
MWA112W MWMW151940 LGA0740020 LGLG087176 LGMW16413
MWA11273 MWMW446940 LGA0890020 LGLG007176 LGMW26413
MWA11395 MWMW11940 LGA021158 LGLG088176 LGMW17613
MWA06403-3 MWMW12939 LGA176291-4 LGLG164007 MWLG151264
MWA12A MWMW13676 LGA264I83 LGLG089074 LGMW021151
MWA12202 MWMW67410 LGA021I83 LGLG021074 MWLG11176
MWA122W MWMW15110 LGA074I83 LGLG087074 MWLG13021
MWA08202 MWMW44610 LGA089I83 LGLG007074 LGMW087940
MWA12395 MWMW1110 LGA164I83 LGLG088074 LGMW176151
MWA080020 MWMW0611 LGA088A LGLG007164 MWLG08007
MWA446-2W MWMW1306 LGA264202 LGLG007264 LGMW02111
MWA15175 MWMW67406 LGA074158 LGLG007088 LGMW08711
MWA676403-3 MWMW15106 LGA088444 LGLG007176 LGMW16411
MWA100020 MWMW44606 LGA262158 LGLG089089(self) LGMW26411
MWA446A MWMW1106 LGA089716 LGLG089007 LGMW17611
MWA11403-3 MWMW69006 LGA087I83 LGLG218007 LGMW007939
Note: LGB = Larger grain borer resistant lines, MW = Maize weevil resistant lines, Adp = Locally adapted Malawi lines

126
5.3.4 Planting of insect resistant F1 hybrids
F1 hybrids were planted at Kandiani Irrigation Scheme during the 2012/2013 growing season
under rainfed (summer), late 2013 (winter) under irrigation and at Chimoto in 2013/2014
growing season under farmers’ condition. The three locations represented three different
growing environments namely, rainfed, irrigation and late drought, respectively. F1 hybrids were
evaluated in 5 sets based on the type of crosses generated. The hybrids were arranged using
alpha lattice design (6 blocks each with 6 or 7 entries) with 2 replications. Each plot was 6 m
long. One seed was planted per planting station with 25 cm spacing between plants and 75 cm
between rows. However, number of varieties planted varied among the environments due to
shortage of seed. The hybrid maize variety “Kanyani” was used as guard rows. Basal
application of fertilizer NPK (23:21:0 +4S) and top dressing was done using Urea (46% N)
fertilizers at the rate of 100kg/ha. The fields were weeded manually thrice and insecticide karate
(lambda-cyhalothrin) was applied to control termites. Full-sib mating was employed for each F1
hybrid during the 2012/2013 growing season under rainfed (Figure 5.2).
Figure 5.2: Full Sib mating done by hand

127
5.3.5 Field data collection and analysis
Data collection was done from whole plot on plant height (measured from ground level to the
base of the tassel after milking stage), ear placement (from ground level to the node bearing the
upper most ear after milking stage), days to tasselling (number of days from sowing to when
50% of the plants had shed pollen), days to silking (number of days from sowing to when silks
had emerged on 50% of the plants), husk cover, grain size, ear size, disease score, field weight
and grain weight. At maturity, cobs were harvested and dried ready for yield and resistance
assessments. Only maize grains harvested from 2012/2013 growing season (rainfed) were used
for grain resistance testing, while yield data from all three growing environments were used for
yield assessment. Data collected was analysed using GenStat Release 14 (2011). Field data
was subjected to ANOVA, stability coefficients, and REML. For REML analysis, environments
and genotypes were treated as having fixed effects. Data for resistant parameters was
subjected to ANOVA. Broad-sense heritability was calculated based on ANOVA as follows:
=
H2 = Broad -sense heritability
= Mean sum of square for varieties
= Mean sum of square for error
r = Replication
5.3.6 Resistance screening for maize weevil and larger grain borer
resistance using F2 grain
5.3.6.1 Rearing of larger grain borer and maize weevil
The rearing of larger grain borer (LGB) and maize weevil (MW) was done at Chitedze Research
Station according to the procedures outlined by CIMMYT (Tefera et al., 2010). Unsexed pests
were reared in a controlled environment at 28± 1oC, 65±5 RH, with a 12h: 12h light: dark regime
to minimize fluctuations in temperature and relative humidity and promote insect survival
(Haines, 1991). The LGB and MW were cultured on susceptible mixed maize grain in sealed but

128
ventilated glass jars. All precautionary measures were taken to exclude other insects from
contaminating the cultures. Maize varieties were evaluated for maize weevil and LGB resistance
under lab conditions using four replications for sets b, c and d and three replications for sets a
and e in a Complete Randomised Block Design (CRBD). About 1 kg maize grains from each
variety were collected for testing. Grains were fumigated with phostoxin tablets at the rate of 1.5
g/m3 of grain (3 tablets) for seven days to avoid carry over insects from the field. One hundred
(100) grams of grain were sampled from each of the 1 kg maize grains and placed into jars. Fifty
(50) unsexed adult beetles (7- 15 days old) were infested on 100 g of grain and kept inside 250
ml plastic jars for MW and in 400 ml glass jars for LGB.
5.4 Data collected
5.4.1 Maize weevil and larger grain borer resistance parameters
After 100 days, the following parameters were used for measuring insect resistance among the
varieties; number of live and dead insects, total number of insects, damaged and undamaged
grains based on 100 grains randomly selected from each jar. Maize hybrids were categorized
into resistant groups based on percent grain damage as follows, highly resistant (0%), resistant
(≤2%), moderately resistant (2.1-2.9%), moderately susceptible (3-3.9%), susceptible (4-4.9%)
and highly susceptible (≥5%). Grain weight loss was calculated based on the damaged and
undamaged grains using (CIMMYT protocol, Boxall, 2002 ) as follows: weight loss (%) = {(Wu x
ND) - (Wad x Nu)/ Wu x (ND + Nu)} x 100; where Wu= weight of undamaged seed, NU=
number of undamaged seeds, Wad = Weight of damaged seed ND = number of damaged seed.
Determination of resistance based on grain weight loss was as follows: Resistant (grain weight
loss ≤ 2%), moderately resistant (grain weight loss between 2.1% and 4%), moderately
susceptible (grain weight loss between 4.1 and 6%), susceptible (grain weight loss of between
6.1% and 8%), highly susceptible (grain weight loss ≥8.1%). For LGB, Weight of flour produced
in the jars due to insect damage was sieved and measured using an electronic weighing
balance.

129
Distribution of variation for weight loss (%)
15
12
5
108642
10
0
25
20
0
Wei
ght l
oss
(%)
5.5 Results
5.5.1. Set A: Adapted Malawi lines X Maize weevil resistant lines
5.5.1.1. Grain resistance to maize weevil among F1 hybrids
Maize hybrids showed significant differences (p<0.05) for percent grain damage and total
number of insects, while insect mortality and percent grain weight loss did not show any
significant differences (Table 5.3).
5.5.1.1.1. Grain weight loss (%)
No significant differences were observed for percent grain weight loss among the F1 hybrids.
However, maize hybrids MWA10A, MWA06A, MWA151A, MWA11273, MWA11312 and
MWA12395 had the lowest grain weight losses, while maize hybrids MWA446A, MWA06403-3,
MWA676403-3, MWA1512W and MWA12202 experienced high grain weight losses. Distribution
of variation for percent grain weight loss showed that most of the hybrids experienced low
percent weight loss (Figure 5.3).
Figure 5.3: Distribution of variation for grain weight loss (%) among F1 hybrids (Set a)

130
Distribution of variation for total number of insects among the F1 hybrids
75
60
50
40
30
50 65
20
10
55
0
7060
To
tal
nu
mb
er
of
inse
cts
5.5.1.1.2 Total number of insects
Significant differences (p<0.05) were observed for total number of insects among the hybrids.
The least number of insects were observed in the following hybrids, MWA112W, MWA11273,
MWA151273, MWA44606, and MWA10395. The highest numbers of insects were obtained
from MWA06403-3, MWA446A, MWA151175, MWA11403-3, and MWA151A (Table 5.3). The
distribution of variation for total number of insects showed that most of the hybrids experienced
less number of insect pests (Figure 5.4).
Figure 5.4: Distribution of variation for total number of insects among F1 hybrids (set a)
6.5.1.1.3 Grain damage (%)
Significant differences (p<0.05) were observed for percent grain damage among the F1 hybrids.
Maize hybrids, MWA06A, MWA12395, MWA11312, MWA10A and MWA11A experienced less
grain damage, while maize hybrids, MWA12202, MWA06395, MWA1512W, MWA06403-3 and
MWA446A experienced the highest grain damage (Table 5.3). The distribution of variation for
grain damage (%) revealed that most of the hybrids experienced less grain damage (Figure
5.5).

131
Distribution of variation for grain damage (%) among F1 maize hybrids
0 30
50
10
40
30
4020
20
10
0
Gra
in d
am
age
(%
)
Figure 5.5: Distribution of variation for grain damage (%) among F1 hybrids (set a)
The percent grain damage as a measure of resistance determined that 3.2% of the F1 hybrids
were highly resistant, 9.8% were resistant, 12.9% moderately resistant, 19.4% moderately
susceptible, 16.1% susceptible and 38.7% highly susceptible (Figure 5.6).
Figure 5.6: Maize weevil resistance groups based on grain damage (%) (set a)

132
Table 5.3: Table of means for grain resistance parameters against maize weevil (set a)
Variety Total number of insects Insect mortality Weight loss (%) Grain damage (%) Resistance level
MWA10A 50.7 48.0 0.0 2.0 Resistant
MWA06A 50.3 47.0 0.0 0.0 Highly resistant
MWA151A 53.3 48.0 0.1 3.7 Moderately susceptible
MWA11273 50.0 46.0 0.2 2.7 Moderately resistant
MWA12395 51.3 50.3 0.2 0.4 Resistant
MWA11A 50.3 44.0 0.3 2.4 Moderately resistant
MWA151273 50.0 49.7 0.4 2.7 Moderately resistant
MWA12A 51.4 51.2 0.4 3.9 Moderately susceptible
MWA112W 49.9 46.7 0.4 4.3 Susceptible
MWA6760020 50.0 46.3 0.4 4.7 Susceptible
MWA122W 52.0 48.3 0.5 3.0 Moderately susceptible
MWA15175 54.7 50.3 0.5 4.4 Susceptible
MWA151395 50.0 44.7 0.5 8.0 Highly susceptible
MWA44606 50.0 39.3 0.6 3.4 Moderately susceptible
MWA1512W 51.0 48.3 0.6 13.4 Highly susceptible
MWA10273 50.4 44.7 0.6 3.4 Moderately susceptible
MWA062W 50.0 48.0 0.6 6.4 Highly susceptible
MWA08202 50.2 49.2 0.6 2.4 Moderately resistant
MWA4462W 52.3 48.0 0.7 5.7 Highly susceptible
MWA11312 50.3 49.3 0.7 1.7 Resistant
MWA67406 52.9 50.7 0.7 4.8 Susceptible
MWA11403-3 54.3 50.0 0.9 10.7 Highly susceptible
MWA12202 51.3 49.0 1.1 11.7 Highly susceptible
MWA10395 50.0 44.7 1.1 4.0 Susceptible
MWA06395 50.3 44.7 1.2 12.4 Highly susceptible
MWA676202 50.7 48.7 1.4 3.4 Moderately susceptible
MWA06273 53.0 52.0 1.7 10.7 Highly susceptible
MWA676403-3 50.0 44.3 2.1 11.0 Highly susceptible
MWA11202 52.4 48.7 3.8 6.4 Highly susceptible
MWA06403-3 69.4 60.7 5.8 13.8 Highly susceptible
MWA446A 58.3 47.7 11.7 15.0 Highly susceptible
P.level sg* nsg nsg sg*
CV (%) 5.5 11.2 12.9 13.4 lsd (0.05) 4.921 9.44 0.437 0.469 SED 2.453 4.704 0.218 0.234 H
2 0.77 0.76 0.74 0.83
sg* = significant at p<0.05, nsg= not significant

133
5.5.1.2 Correlation between grain resistance parameters for maize weevil
Highly significant (p<0.001) correlations were observed between percent grain weight loss and
percent grain damage (0.6965) and between percent grain damage and total number of insects
(0.4653) (Appendix 5.1).
5.5.1.3 Yield potential of F1 hybrids (set a)
Significant differences (p<0.01) were observed for yield potential under rainfed conditions, but
no significant differences for yield potential were observed under irrigation and drought
conditions. Combined yield analysis across environments showed highly significant differences
(p<0.01) for yield potential among maize hybrids and the interaction between the hybrids and
the environments. Maize varieties, MWA112W, MWA06403-3, MWA11273, MWA151A,
MWA446A, MWA06273, MWA11403-3, MWA122W, MWA06A, and MWA062W had the highest
mean yields across environments. The maize yields ranged from 10 to 15.64 tons/ha. The
hybrids outperformed a commercial hybrid “Kanyani” which had a mean yield of (5.42 tons/ha).
Maize hybrids, MWA112W, MWA11273, MWA062W, and MWA11403-3 had good general
adaptation across environments (Table 5.4).
5.5.1.4 Yield potential and maize weevil resistance among F1 hybrids
Combination of yield potential and maize weevil resistance showed that the following hybrids
had good yield potential and high resistance levels against maize weevil, MWA10A (7.69
tons/ha), MWA06A (10 tons/ha), and MWA12395 (6.67 tons/ha) (Table 5.4).

134
Table 5.4: Yield potential, resistance and ranking of F1 hybrids across environments (set a)
Variety Yield
Group Rank Superiority
index Grain
damage (%) Net yield (tons/ha)
Resistance status (tons/ha)
MWA112W 15.64 2 5 0 4.3 14.97 Susceptible MWA06403-3 13.60 2 15.5 0.013889 13.8 11.72 Highly susceptible MWA11273 11.69 2 6.5 0 2.7 11.37 Moderately resistant MWA151A 11.33 2 7 0 3.7 10.91 Moderately susceptible MWA446A 10.98 2 8.5 0 3.4 9.32 Highly susceptible MWA06273 10.44 2 10.75 0.000868 10.7 9.32 Highly susceptible MWA11403-3 10.09 4 5.17 0.000868 10.7 9.01 Highly susceptible MWA122W 10.04 4 6.67 0 3.1 9.74 Moderately susceptible MWA06A 10.00 4 10 0.007812 0.0 9.99 Highly resistant MWA062W 10.00 3 13.5 0.000868 6.4 9.36 Highly susceptible MWA4462W 9.51 4 7.83 0.000868 5.7 8.97 Highly susceptible MWA102W 8.89 2 10.75 0.000868
8.89
MWA06395 8.71 2 17 0.007812 12.4 7.63 Highly susceptible MWA151273 8.62 2 16 0.003472 2.7 8.39 Moderately resistant MWA10395 8.49 4 8.83 0.000868 4.1 8.14 Susceptible MWA08202 8.13 2 19 0 2.4 7.93 Moderately resistant MWA1512W 7.82 2 17 0.003472 13.4 6.77 Highly susceptible MWA080020 7.78 3 24 0.007812
7.78
MWA11A 7.78 3 24 0.007812 2.4 7.59 Moderately resistant MWA10A 7.69 2 21 0.013889 2.0 7.53 Resistant MWA06202 7.56 2 21 0.003472
7.56
MWA6760020 7.51 2 20.75 0.000868 4.7 7.16 Susceptible MWA12A 7.47 2 14.75 0.000868 3.9 7.17 Moderately susceptible MWA10202 7.16 2 20.5 0.007812
7.16
MWA100020 6.80 2 21 0.007812
6.8
MWA151395 6.76 2 21.5 0.003472 8.1 6.21 Highly susceptible MWA12395 6.67 4 16.67 0.013889 0.4 6.64 Resistant MWA151202 6.67 3 30 0.013889
6.67
MWA676403-3 6.67 3 30 0.013889 11.1 5.93 Highly susceptible MWA11395 6.49 4 12.33 0
6.49
MWA10273 6.27 2 22 0.003472 3.4 6.05 Moderately susceptible MWA15175 6.18 2 24 0.021701 4.4 5.91 Susceptible Kanyani 5.42 1 13 0
5.42
MWA08312 5.29 5 20 0
5.29
MWA11202 4.80 2 27.5 0.007812 6.4 4.49 Highly susceptible MWA676202 4.44 3 34 0.03125 3.4 4.29 Moderately susceptible MWA11312 1.78 2 33.5 0.055556 1.7 1.72 Resistant MWA12202 1.47 2 32.5 0.08 11.7 1.29 Highly susceptible
Fixed term Wald statistic n.d.f. d.d.f. F pr VARIETY 103.89 37 79 <0.001
ENVIRONMENT 7.2 2 79 0.032
VAR.ENVIR 72.67 36 79 0.005
H2 (yield) = 0.92
5.5.2 Set B: Maize weevil resistant lines X Maize weevil resistant lines
5.5.2.1 Grain resistance to maize weevil among F1 hybrids
Maize hybrids showed significant differences for insect mortality, total number of insects and
percent grain damage, while percent grain weight loss did not show any significant differences
among the maize hybrids (Table 5.5).

135
Distribution of variance for insect mortality among F1 hybrids
10
6
50
2
4846444240
8
38
0
36
4Inse
ct m
orta
lity
5.5.2.1.1 Insect mortality
Highly significant differences (p<0.001) were observed for insect mortality. The highest number
of insect mortalities was observed in maize hybrids, MWMW1313, MWMW1110, MWMW13675,
MWMW1306, and MWMW1210. The least number of adult mortalities was observed in maize
hybrids, MWMW1106, MWMW674937, MWMW13939, MWMW11675 and MWMW151937
(Table 5.5). The distribution of variation for insect mortality showed that most of the hybrids had
high numbers of insect mortalities (Figure 5.7).
Figure 5.7: Distribution of variation for insect mortality among F1 hybrids (set b)
5.5.2.1.2 Total number of insects
Significant differences (p<0.05) were observed for total number of insects. The following hybrids
showed the least number of insects, MWMW13939, MWMW151939, MWMW446675,
MWMW151675, and MWMW11675. The highest numbers of insects were observed in maize
hybrids MWMW1210, MWMW13675, MWMW690675, MWMW13676 and MWMW44606) (Table
5.5). The maize hybrids largely experienced moderate to high insect numbers (Figure 5.8).

136
Distribution of variation for total number of insects among F1 hybrids
8
4
54
0
535251
10
50
2
49
6
Tota
l num
ber o
f ins
ects
Distribution of variation for weight loss (%)
6
6
2
54321
4
0
10
8
0
Wei
ght
loss
(%
)
Figure 5.8: Distribution of variation for total number of insects among F1 hybrids (set b)
5.5.2.1.3 Grain weight loss (%)
No significant differences were observed for percent grain weight loss among F1 hybrids.
However, some maize hybrids experienced less weight loss, such as MWMW1313,
MWMW67410, MWMW446939, MWMW151939, MWMW13939, and MWMW15106. The largest
grain weight losses were observed in maize hybrids, MWMW12939, MWMW674675,
MWMW13676, and MWMW151937 (Table 5.5). The majority of the hybrids experienced less
grain weight loss (Figure 5.9).
Figure 5.9: Distribution of variation for percent weight loss among F1 hybrids (set b)

137
Distribution of variation for grain damage (%) among F1 hybrids
7
5
3
12
1
10864
6
2
2
0
8
4
0
Gra
in d
amag
e (%
)
5.5.2.1.4 Percent grain damage
Highly significant differences (p<0.001) were observed for percent grain damage. The top six
hybrids with the least grain damages were, MWMW15106, MWMW446939, MWMW0611,
MWMW674937, MWMW12939 and MWMW151939. Higher levels of grain damage were
observed in hybrids, MWMW151937, MWMW13675, MWMW11675 MWMW446675 and
MWMW674675 (Table 5.5). The majority of the hybrids experienced moderate to lower levels of
grain damage (Figure 5.10).
Figure 5.10: Distribution of variation for grain damage (%) among F1 hybrids (set b)
Using grain damage (%) as a measure of resistance, the results revealed that 4.2% of the
hybrids were highly resistant, 25% resistant, 8.3% moderately resistant, 8.3% moderately
susceptible, 8.3% susceptible and 45.8% highly susceptible (Figure 5.11).
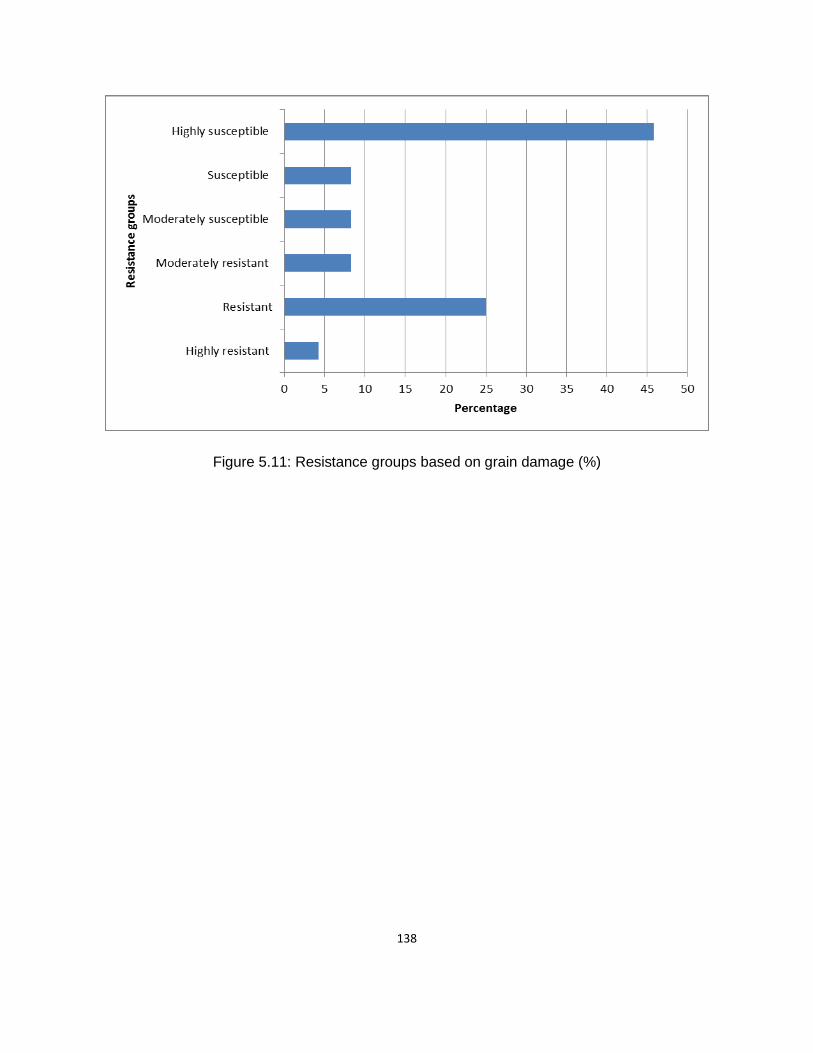
138
Figure 5.11: Resistance groups based on grain damage (%)
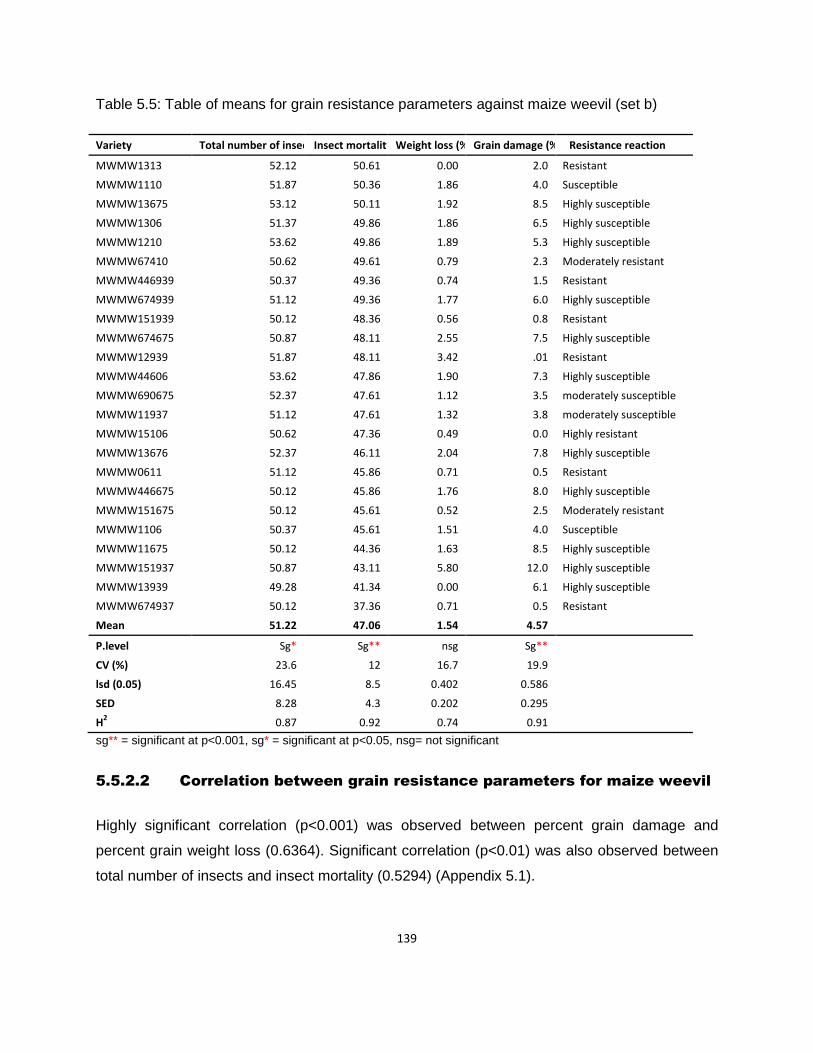
139
Table 5.5: Table of means for grain resistance parameters against maize weevil (set b)
Variety Total number of insects Insect mortality Weight loss (%) Grain damage (%) Resistance reaction
MWMW1313 52.12 50.61 0.00 2.0 Resistant
MWMW1110 51.87 50.36 1.86 4.0 Susceptible
MWMW13675 53.12 50.11 1.92 8.5 Highly susceptible
MWMW1306 51.37 49.86 1.86 6.5 Highly susceptible
MWMW1210 53.62 49.86 1.89 5.3 Highly susceptible
MWMW67410 50.62 49.61 0.79 2.3 Moderately resistant
MWMW446939 50.37 49.36 0.74 1.5 Resistant
MWMW674939 51.12 49.36 1.77 6.0 Highly susceptible
MWMW151939 50.12 48.36 0.56 0.8 Resistant
MWMW674675 50.87 48.11 2.55 7.5 Highly susceptible
MWMW12939 51.87 48.11 3.42 .01 Resistant
MWMW44606 53.62 47.86 1.90 7.3 Highly susceptible
MWMW690675 52.37 47.61 1.12 3.5 moderately susceptible
MWMW11937 51.12 47.61 1.32 3.8 moderately susceptible
MWMW15106 50.62 47.36 0.49 0.0 Highly resistant
MWMW13676 52.37 46.11 2.04 7.8 Highly susceptible
MWMW0611 51.12 45.86 0.71 0.5 Resistant
MWMW446675 50.12 45.86 1.76 8.0 Highly susceptible
MWMW151675 50.12 45.61 0.52 2.5 Moderately resistant
MWMW1106 50.37 45.61 1.51 4.0 Susceptible
MWMW11675 50.12 44.36 1.63 8.5 Highly susceptible
MWMW151937 50.87 43.11 5.80 12.0 Highly susceptible
MWMW13939 49.28 41.34 0.00 6.1 Highly susceptible
MWMW674937 50.12 37.36 0.71 0.5 Resistant
Mean 51.22 47.06 1.54 4.57
P.level Sg* Sg** nsg Sg**
CV (%) 23.6 12 16.7 19.9
lsd (0.05) 16.45 8.5 0.402 0.586
SED 8.28 4.3 0.202 0.295
H2 0.87 0.92 0.74 0.91
sg** = significant at p<0.001, sg* = significant at p<0.05, nsg= not significant
5.5.2.2 Correlation between grain resistance parameters for maize weevil
Highly significant correlation (p<0.001) was observed between percent grain damage and
percent grain weight loss (0.6364). Significant correlation (p<0.01) was also observed between
total number of insects and insect mortality (0.5294) (Appendix 5.1).

140
5.5.2.3 Yield potential of F1 hybrids (set b)
Significant differences (p<0.01) were observed for yield potential among the hybrids under
irrigation. No significant differences were observed for yield potential under rainfed and drought
conditions. Combined yield analysis however, showed highly significant differences (p<0.001)
for yield potential across environments. No significant differences were observed for the
interaction between maize hybrids and environments. The top five performing hybrids were
MWMW13939, MWMW1106, MWMW44610, MWMW44606, and MWMW13675 with mean
yields ranging from 10 to 12.76 tons/ha. These hybrids performed better than a commercial
hybrid “Kanyani” which had a mean yield of 7.29 tons/ha. Superiority index showed that maize
hybrids, MWMW13939, MWMW1106, MWMW13675 and MWMW44610 were generally stable
across environments (Table 5.6).
5.5.2.4 Yield potential and maize weevil resistance among F1 hybrids
Based on yield potential and resistance levels, results showed that the following hybrids had
better yield potential and high resistance levels against maize weevil, MWMW15106 (9.07
tons/ha), MWMW1313 (5.84 tons/ha), and MWMW446939 (6.67 tons/ha) (Table 5.6).

141
Table 5.6: Yield potential, resistance and ranking of F1 hybrids across environments (set b)
Variety Rank Group Yield
(tons/ha) Superiority
index Grain
damage (%) Resistance
Net Yield (tons/ha)
MWMW13939 2.25 4 12.76 0.021701 6.1 Highly susceptible 11.98 MWMW1106 2 3 12.76 0.013889 4.0 susceptible 12.24 MWMW44610 4 2 11.11 0.013889
11.11
MWMW44606 2.5 3 10.98 0.021701 7.3 Highly susceptible 10.18 MWMW13675 6 2 10.00 0.007812 8.5 Highly susceptible 9.15 MWMW13676 9.5 4 9.73 0.003472 7.8 Highly susceptible 8.98 MWMW15106 15.5 4 9.07 0.000868 0.0 Highly resistant 9.07 MWMW446937 7.33 3 9.02 0.003472 0.5 Resistant 8.98 MWMW151937 10.5 4 9.02 0.013889 12.0 Highly susceptible 7.94 MWMW446940 9 3 8.27 0.003472 1.4 Resistant 8.15 MWMW15110 10.17 3 8.27 0
8.27
MWMW1210 15.75 4 8.13 0 5.3 Highly susceptible 7.71 MWMW13940 14 2 7.78 0.000868 1.5 Resistant 7.67 MWMW151675 14 2 7.78 0.000868 2.5 moderately resistant 7.58 MWMW1306 10.33 3 7.78 0.003472 6.5 Highly susceptible 7.58 MWMW1110 11.83 3 7.64 0 4.0 moderately resistant 7.45 MWMW446675 12.5 3 7.47 0 8.0 Highly susceptible 6.87 Kanyani 11 1 7.29 0
7.29
MWMW11937 17 4 6.93 0.000868 3.8 Moderately susceptible 6.67 MWMW674675 15.67 3 6.76 0.000868 7.5 Highly susceptible 6.25 MWMW446939 19.5 2 6.67 0 1.5 Resistant 6.57 MWMW67406 13.67 3 6.53 0.000868
6.53
MWMW67410 15.67 3 6.18 0.003472 2.3 moderately resistant 6.04 MWMW69010 13 1 6.09 0
6.09
MWMW690675 18 3 6.04 0.000868 3.5 Moderately susceptible 5.83 MWMW1313 16.33 3 5.96 0.000868 2.0 moderately resistant 5.84 MWMW11675 18.33 3 5.69 0.000868 8.5 Highly susceptible 5.21 MWMW11939 26 2 5.56 0.000868
5.56
MWMW12939 26.5 4 4.62 0.000868 1.0 Resistant 4.58 MWMW151940 23.17 3 4.53 0.003472 9.11 Highly susceptible 4.12 MWMW0611 31.5 2 4.44 0.003472 0.5 Resistant 4.42 MWMW674937 31.5 2 4.44 0.003472 0.5 Resistant 4.42 MWMW674676 27.25 4 4.44 0.003472
4.44
MWMW674939 21 3 4.27 0.000868 6.0 Highly susceptible 4.01 MWMW151939 34 2 3.56 0.006806 0.8 Resistant 3.53 MWMW69006 35 2 3.33 0.007812 8.3 Highly susceptible 3.06 MWMW11940 30.5 4 2.84 0.013889 1.1 Resistant 2.81
Fixed term Wald
statistic d.f. Wald/d.f. chi pr
VARIETY 95.13 37 2.57 <0.001
ENVIRONMENT 43.06 2 21.53 <0.001
VAR.ENVIRON 40.93 41 1 0.474
H2 (yield) = 0.95
5.5.3. SET C: Adapted Malawi lines X LGB resistant lines
5.5.3.1. Grain resistance of maize hybrids to larger grain borer
Maize hybrids showed highly significant differences (p<0.001) for adult mortality, total number of
insects, grain damage (%), flour weight and grain weight loss (%) (Table 5.7).

142
Distribution of variation for total number of insects among f1 hybrids
20
10
100
0
90807060
15
5040
5
Tota
l num
ber
of in
sect
s
5.5.3.1.1 Total number of insects
Highly significant differences (p<0.001) were observed for total number of insects. The least
number of insects were noted in the following hybrids, LGA089I83, LGA089118, LGA087I83,
and LGA264158. The highest numbers of insects were found in LGA164444, LGA264A,
LGA264216, and LGA218I83 (Table 5.7). The distribution of variation for total number of insects
showed that most of the hybrids had moderate to low numbers of insect pests (Figure 5.12)
Figure 5.12: Distribution of variation for total number of insects among F1 hybrids (set c)
5.5.3.1.2 Insect mortality
Significant differences (p<0.05) were observed for insect mortality among the F1 hybrids. The
following hybrids had the highest number of adult mortalities; LGA089I83, LGA074158,
LGA074116, LGA264116, and LGA264202, while the least number of insect mortalities were
observed in LGA264158, LGA264A, LGA089716, LGA021158 and LGA218444 (Table 5.7). The
distribution of variation for insect mortality indicated that most hybrids had large numbers of
dead insects (Figure 5.13).

143
Distribution of variation for flour among the varieties
14
10
6
7
2
6543
16
2
8
1
0
0
12
4
Flou
r
Distribution of variation for insect mortality among maize hybrids
17.5
12.5
7.5
55
2.5
50454035
20.0
30
10.0
25
0.0
20
15.0
5.0
Inse
ct m
orta
lity
Figure 5.13: Distribution of variation for insect mortality among F1 hybrids (set c)
5.5.3.1.3 Flour weight (g)
Highly significant differences (p<0.001) were observed for flour weight among maize hybrids.
The least amount of flour was obtained from hybrids, LGA089118, LGA264158, LGA088A,
LGA0740020, and LGA264202, while highest amount of flour were observed in the following
hybrids; LGA264A, LGA164444, LGA218I83, LGA264216 and LGA264444 (Table 5.7). The
majority of the hybrids produced moderate to low amount of flour (Figure 5.14).
Figure 5.14: Distribution of variation for flour weight among F1 hybrids (set c)

144
14
10
6
17.5
2
15.012.510.07.55.0
8
2.5
0
0.0
12
4
Gra
in w
eigh
t lo
ss (
%)
5.5.3.1.4 Grain weight loss (%)
Highly significant differences (p>0.001) were observed for grain weight loss (%) among F1
hybrids. The following hybrids experienced less grain weight loss, LGA089116, LGA087I83, and
LGA088A. The highest grain weight loss was observed in hybrids, LGA264A, LGA164444 and
LGA218I83 (Table 5.7). The distribution of variation for grain weight loss showed that the
majority of F1 hybrids experienced moderate to low levels of grain weight losses (Figure 5.15).
Figure 5.15: Distribution of variation for grain weight loss (%) among F1 hybrids (set c)
5.5.3.1.5 Grain damage (%)
Highly significant differences (p<0.001) were obtained for percent grain damage among the
hybrids. The least grain damage was observed in the following hybrids, LGA089116,
LGA087I83, and LGA088A. Highest grain damage was observed in hybrids, LGA264A,
LGA164444, LGA264216, LGA218I83 and LGA021A (Table 5.7). The distribution of variation for
grain damage revealed that most of the hybrids experienced moderate to low grain damage
(Figure 5.16).

145
Distribution of variation for grain damage (%) among hybrids
25
12
10
8
6
0 15
4
2
5
0
2010
Gra
in d
amag
e (%
)
Figure 5.16: Distribution of variation for grain damage (%) among F1 hybrids (set c)
Based on percent grain damage, 5.5% of the hybrids were resistant, 2.8% moderately resistant,
8.3% moderately susceptible, 5.5% susceptible and 77.8% highly susceptible (Figure 5.17).
Figure 5.17: Discrimination of F1 hybrids into resistance groups using grain damage (%)

146
Table 5.7: Table of means for grain resistance parameters against larger grain borer (set c)
Variety Total
number of insects
Insect mortality
Weight loss (%)
Grain damage (%)
Flour (g)
Resistance status
LGA089116 51.57 48.07 0.0 1.5 1.43 Resistant LGA087I83 46.93 47.95 0.9 1.9 1.28 Resistant LGA088A 50.33 46.21 1.5 2.8 0.44 Moderately resistant LGA0870020 56.08 47.96 1.9 3.6 0.99 Moderately susceptible LGA0740020 50.08 41.46 2.4 3.3 0.67 Moderately susceptible LGA264202 53.33 48.46 3.0 4.1 0.79 Susceptible LGA089I83 46.08 50.84 3.0 4.9 1.62 Susceptible LGA264158 46.93 23.00 3.2 7.9 0.20 Highly susceptible LGA176291-4 53.58 47.96 3.5 5.3 1.29 Highly susceptible LGA089118 46.93 46.00 3.6 3.9 0.03 Moderately susceptible LGA021I83 53.08 45.71 3.8 5.8 1.14 Highly susceptible LGA021158 50.08 37.21 3.9 5.8 1.57 Highly susceptible LGA074444 53.58 46.21 4.0 5.6 1.47 Highly susceptible LGA164116 54.83 47.71 4.0 5.6 1.42 Highly susceptible LGA0890020 56.58 43.21 4.1 6.1 1.84 Highly susceptible LGA264116 57.58 49.71 4.9 6.6 1.57 Highly susceptible LGA164I83 54.08 42.21 5.2 8.6 2.44 Highly susceptible LGA074158 58.58 50.71 5.4 7.8 1.44 Highly susceptible LGA074I83 52.08 44.21 5.7 7.6 1.34 Highly susceptible LGA264444 61.08 42.21 5.9 9.3 3.62 Highly susceptible LGA089A 51.33 43.46 6.2 7.6 1.24 Highly susceptible LGA089716 50.58 36.96 6.3 9.3 1.79 Highly susceptible LGA074A 51.58 45.46 6.5 9.6 1.37 Highly susceptible LGA218444 63.83 38.96 6.6 10.1 3.07 Highly susceptible LGA089444 65.35 46.51 7.2 11.9 3.32 Highly susceptible LGA2640020 54.91 45.07 7.9 12.3 2.14 Highly susceptible LGA164A 62.33 39.71 8.1 11.6 3.09 Highly susceptible LGA264I83 59.33 44.46 8.2 10.8 1.84 Highly susceptible LGA088444 57.58 43.46 8.7 15.1 3.04 Highly susceptible LGA074116 62.57 49.73 9.8 12.8 2.16 Highly susceptible LGA0210020 61.33 39.71 10.8 15.8 3.32 Highly susceptible LGA021A 58.08 40.96 10.9 16.6 3.52 Highly susceptible LGA264216 69.33 46.21 13.6 19.1 4.22 Highly susceptible LGA218I83 68.83 43.21 13.8 17.8 5.14 Highly susceptible LGA164444 91.08 43.71 16.3 23.1 6.29 Highly susceptible LGA264A 71.08 34.96 16.7 23.8 6.49 Highly susceptible Mean 56.52 43.91 6.3 9.26 2.16
P.level Sg** Sg* Sg** Sg** Sg**
CV (%) 20.41 13.3 19.5 21.8 27.05
lsd (0.05) 18.1 9.12 0.645 0.758 0.4412
SED 9.12 4.59 0.325 0.382 0.2223 H
2 0.9 0.89 0.93 0.94 0.97
sg* = Significant at p<0.05, sg** = Significant at p<0.001
5.5.3.2 Correlation between grain resistance parameters
Highly significant correlations (p<0.001) were obtained among all parameters except for insect
mortality. Percent grain damage and percent grain weight loss had a correlation coefficient of
0.9847, percent grain damage and total number of insects (0.8187), percent grain weight loss
and total number of insects (0.8287) (Appendix 5.3).

147
5.5.3.3 Yield potential of F1 hybrids (set c)
Analysis of variance for yield potential within each of the three environments (rainfed, irrigated,
drought) showed no significant differences among the hybrids. However, combined yield
analysis across environments showed significant differences (p<0.01) for yield potential and
environmental effects. There was no evidence of significant interaction between the
environments and varieties. The following were the best yielding maize hybrids, LGA089444,
LGA0890020, LGA218I83, LGA164A, LGA087I83, LGA0870020, LGA0210020, LGA164444,
and LGA021A. These hybrids had the highest yield across the three environments ranging from
7.96 to 14.44 tons/ha. Except for LGA021A, the rest of the hybrids out performed “Kanyani” the
commercial hybrid that showed a yield potential of 8.42 tons/ha. LGA089444, LGA0890020 and
LGA164A had better general adaptation across the environments (Table 5.8).
5.5.3.4 Yield potential and larger grain borer resistance among F1 hybrids
Using levels of resistance and yield potential across the environments as criteria for selection of
hybrids, only two hybrids, LGA087I83 and LGA089116 showed high yield potential (8.89
tons/ha) and (6.6 tons/ha) respectively and high levels of resistance to larger grain borer (Table
5.8).

148
Table 5.8: Yield potential and resistance levels of maize hybrids to LGB (set c)
Variety Yield
(tons/ha) Group Mean rank
Superiority Index
Grain damage (%)
Net yield (tons/ha)
Resistance status
LGA089444 14.44 2 1 0 11.9 12.73 Highly susceptible LGA0890020 10.55 3 1.33 0.01451 6.1 9.91 Highly susceptible LGA218I83 10.00 2 4 0.01389 17.8 8.22 Highly susceptible LGA164A 9.58 4 8 0.0236 11.6 8.47 Highly susceptible LGA087I83 8.89 2 7 0.0217 1.9 8.72 Resistant LGA0870020 8.89 2 7 0.0217 3.6 8.57 Moderately susceptible LGA0210020 8.52 3 6.67 0.01748 15.8 7.18 Highly susceptible LGA164444 8.48 3 7.5 0.03643 23.1 6.52 Highly susceptible Kanyani 8.42 1 9.5 0.0039
LGA021A 7.96 3 10.17 0.04581 16.6 6.65 Highly susceptible LGA021I83 7.78 2 11.5 0.03125 5.8 7.33 Highly susceptible LGA074158 7.78 2 11.5 0.03125 7.8 7.17 Highly susceptible LGA089716 7.78 2 11.5 0.03125 9.3 7.05 Highly susceptible LGA264I83 7.59 4 14.75 0.05368 10.8 6.77 Highly susceptible LGA264444 7.40 3 9.5 0.03125 9.3 6.71 Highly susceptible LGA218444 7.24 3 9 0.06112 10.1 6.51 Highly susceptible LGA164116 7.13 3 11.17 0.05627 5.6 6.73 Highly susceptible LGA089I83 6.93 3 11.83 0.05626 4.9 6.59 Susceptible LGA264A 6.90 3 14 0.07123 23.8 5.26 Highly susceptible LGA074A 6.81 4 23 0.08536 9.6 6.16 Highly susceptible LGA088A 6.75 4 22.25 0.08903 2.8 6.56 Moderately resistant LGA264158 6.74 3 13.17 0.05737 7.9 6.21 Highly susceptible LGA074116 6.67 2 16.5 0.04253 12.8 5.81 Highly susceptible LGA088444 6.67 2 16.5 0.04253 15.1 5.66 Highly susceptible LGA264202 6.67 4 16.5 0.04253 4.1 6.40 Susceptible LGA089116 6.60 4 22.5 0.07948 1.5 6.51 Resistant LGA0740020 5.96 3 17.33 0.0733 3.3 5.76 Moderately susceptible LGA074I83 5.56 2 21.5 0.05556 7.6 5.14 Highly susceptible LGA2640020 5.55 3 16.17 0.07499 12.3 4.87 Highly susceptible LGA021158 5.16 3 18.17 0.07465 5.8 4.86 Highly susceptible LGA089A 5.13 4 21.25 0.11162 7.6 4.74 Highly susceptible LGA164I83 4.94 3 18.67 0.10864 8.6 4.52 Highly susceptible LGA176291-4 4.67 2 25.5 0.06722 5.3 4.42 Highly susceptible LGA021116 4.44 2 30 0.07031 7.9 4.09 Highly susceptible LGA074444 4.44 2 30 0.07031 5.6 4.20 Highly susceptible LGA264216 3.33 2 34.5 0.08681 19.1 2.70 Highly susceptible LGA264116 2.44 2 36 0.10125 6.6 2.28 Highly susceptible
Fixed term Wald
statistic d.f. Wald/d.f. chi pr
VARIETY 57.1 36 1.59 0.014 ENVIRONMENT 79.53 2 39.77 <0.001 VAR.ENVIRO 29.87 33 0.91 0.624
H2 (yield) = 0.91

149
Distribution of variation for total number of insects among maize hybrids
12
6
65
2
6055
14
50
10
4540
4
35
8
0
Tota
l num
ber o
f ins
ects
5.5.4 Set D: LGB resistant lines X LGB resistant lines
5.5.4.1 Resistance of F1 hybrids to larger grain borer
Ssignificant differences were observed for percent grain damage, flour weight, and total number
of insects. No significant differences were observed for insect mortality and percent grain weight
loss (Table 5.9).
5.5.4.1.1 Total number of insects
Significant differences (p<0.01) were observed for total number of insects among maize hybrids.
Maize hybrids, LGLG087218, LGLG089089, LGLG089218, LGLG021074, and LGLG088218
had the least number of insects. On the other hand, maize hybrids, LGLG007074,
LGLG087074, LGLG007088, LGLG021264 and LGLG088164 had the highest number of
insects (Table 5.9). The majority of the hybrids experienced moderate to high numbers of
insects (Figure 5.18).
Figure 5.18: Distribution of variation for total number of insects among F1 hybrids (set d)
5.5.4.1.2 Flour weight (g)
Highly significant differences (p<0.001) were observed for flour weight among the hybrids. The
following hybrids produced the least amount of flour, LGLG021074, LGLG089089,
LGLG088218, LGLG074007 and LGLG089218. Maize hybrids, LGLG007088, LGLG007074,
LGLG088176, LGLG021264 and LGLG089074 produced the highest amount of flour (Table

150
Distribution of variation for flour among maize hybrids
4
8
4.03.53.02.52.0
6
1.5
2
1.00.50.0
0
10
Flou
r (g)
Grain weihgt loss (5)
10
6
12
2
108642
8
0
0
-2
4
Gra
in w
eigh
t lo
ss (
%)
5.8). The distribution for variation for flour weight among the hybrids indicated that most of the
hybrids produced moderate to little amount of flour (Figure 5.19).
Figure 5.19: Distribution of variation for flour weight (g) among F1 hybrids (set d)
5.5.4.1.3 Percent grain weight loss
No significant differences were observed for percent grain weight loss among the F1 hybrids
(Table 5.9). However, maize hybrids, LGLG089218, LGLG088218, LGLG021074,
LGLG021161, LGLG007164 and LGLG087264 showed less grain weight loss, while maize
hybrids, LGLG007088, LGLG021264, LGLG164007 and LGLG089074 experienced high grain
weight losses. The distribution of variation for grain weight loss showed that most of the hybrids
experiencing moderate grain weight losses (Figure 5.20).
Figure 5.20: Distribution of variation for grain weight loss (%) among F1 hybrids (set d)

151
Distribution for variation for grain damage (%) among maize hybrids
4
8
20.017.515.012.510.0
6
7.5
2
5.02.50.0
0
10
Gra
in d
am
ag
e (
%)
5.5.4.1.4 Grain damage (%)
Highly significant differences (p<0.001) were observed for percent grain damage among the
hybrids. The following hybrids experienced the least grain damage, LGLG089218,
LGLG021074, LGLG007164, LGLG087264, and LGLG088218, while maize hybrids,
LGLG007088, LGLG021264, LGLG021164 and LGLG007074 experienced substantial grain
damage (Table 5.9). Distribution of variation for percent grain damage showed that most hybrids
experienced moderate to low grain damage (Figure 5.21).
Figure 5.21: Distribution of variation for percent grain damage among F1 hybrids (set d)
Grain damage as a measure of resistance determined that 4% of the hybrids were resistant,
24% moderately resistant, 8% moderately susceptible, 8% susceptible and 56% highly
susceptible (Figure 5.22).

152
Figure 5.22: Grouping of F1 hybrids into resistant groups based on grain damage (%)
Table 5.9: Table of means for grain resistance parameters against larger grain borer (set d)
Variety Total number
of insects Insect
mortality Weight loss (%)
Grain damage (%)
Flour weight (g)
Resistance status
LGLG089218 36.4 53.1 2.1 1.9 0.22 Resistant LGLG088218 50.0 45.2 0.0 3.0 0.43 Moderately resistant LGLG021074 50.2 46.5 0.9 2.1 0.36 Moderately resistant LGLG089089 50.4 45.8 3.2 5.5 0.35 Highly susceptible LGLG087218 51.0 47.7 2.2 3.0 0.51 Moderately resistant LGLG081218 51.0 41.2 4.7 8.2 0.66 Highly susceptible LGLG074007 51.5 49.2 2.5 3.5 0.50 Moderately susceptible LGLG087264 51.5 46.1 0.7 2.7 1.13 Moderately resistant LGLG088264 51.7 47.0 3.8 5.0 0.86 Susceptible LGLG007264 52.0 44.5 5.3 7.2 0.86 Highly susceptible LGLG088176 52.2 43.5 2.3 4.0 1.86 Moderately susceptible LGLG089176 52.2 48.2 4.6 6.0 0.96 Highly susceptible LGLG164007 52.5 42.2 5.8 8.0 1.03 Highly susceptible LGLG089074 52.7 43.7 5.8 8.2 1.76 Highly susceptible LGLG007218 52.8 46.1 2.4 4.8 1.38 Susceptible LGLG21164 54.2 49.0 0.0 10.2 1.46 Highly susceptible LGLG089007 54.7 46.0 2.0 7.3 1.11 Highly susceptible LGLG007164 55.5 51.2 0.3 2.6 0.81 Moderately resistant LGLG021176 56.0 46.7 4.9 7.0 1.43 Highly susceptible LGLG007176 57.0 50.2 2.2 3.0 0.61 Moderately resistant LGLG088164 58.0 49.0 0.6 7.2 1.76 Highly susceptible LGLG021264 58.5 44.5 6.4 10.5 1.83 Highly susceptible LGLG007088 58.5 40.2 11.0 18.2 3.33 Highly susceptible LGLG087074 60.7 39.7 4.3 6.7 0.86 Highly susceptible LGLG007074 61.5 45.7 6.0 9.0 2.23 Highly susceptible Mean 52.1 45.2 3.4 6.4 1.16
P.level Sg* nsg nsg Sg** Sg** CV (%) 18.7 15.1 25.4 15.1 7.76
lsd(0.05) 14.45 10.43 0.6679 0.5215 0.1935
Sed 7.246 5.23 0.3343 0.2613 0.097 H
2 0.89 0.85 0.83 0.93 0.94
Sg* = Significant at p<0.01, sg** = Significant at p<0.001, nsg= not significant

153
5.5.4.2 Correlations between grain resistance parameters
Highly significant correlation (p<0.001) was observed between percent grain damage and
percent weight loss (0.7658), significant correlation (p<0.01) was observed between percent
grain damage and total number of insects (0.5174) (Appendix 5.4).
5.5.4.3 Yield potential of F1 hybrids (set d)
Under drought conditions maize hybrids showed significant differences (p<0.01) for yield
potential. No significant differences were observed among the hybrids for yield potential under
irrigation and rainfed conditions. Highly significant differences (p<0.001) were observed for
yield potential and environmental effects across environments. Significant differences (p<0.01)
were also observed for the interaction between environments and the hybrids. The following
hybrids were the top five high yielding varieties, LGLG218089, LGLG088264, LGLG088176,
LGLG021007, LGLG087218, and LGLG007264 with yields ranging from 6.22 to 8.80 tons/ha.
However, only varieties LGLG218089 (8.80 tons/ha) and LGLG088264 (7.16 tons/ha)
outperformed the commercial hybrid (Kanyani) (7.11 tons/ha). The superiority index revealed
that maize varieties, LGLG218089, LGLG088264, and LGLG088176 were generally adapted to
the three environments (Table 5.10).
5.5.4.4 Yield potential and maize weevil resistance of F1 hybrids
Combining yield potential and resistance, only three maize hybrids, LGLG087218 (6.36
tons/ha), LGLG088218 (6.00 tons/ha) and LGLG021074 (4.13 tons/ha) met the criteria for
selection. However, the hybrids were moderately resistant against larger grain borer (Table
5.10).

154
Table 5.10: Mean yield and resistance levels for F1 hybrids (set d)
Variety Mean rank Group Superiority
index Yield
(tons/ha) Grain
damage (%) Resistance status
Net yield (tons/ha)
LGLG218089 8 4 0.00437 8.80 LGLG088264 8.5 2 0.02506 7.16 4.96 Susceptible 6.80
Kanyani 7.5 1 0.00981 7.11
LGLG088176 7.33 3 0.01968 6.67 3.96 Moderately susceptible 6.40 LGLG021007 20 4 0.01674 6.53
LGLG087218 11.67 3 0.02053 6.36 2.96 Moderately resistant 6.17 LGLG007264 7.67 3 0.01534 6.22 7.21 Highly susceptible 5.77 LGLG007218 6.67 3 0.0069 6.18 4.75 Susceptible 5.88 LGLG087074 9 3 0.04647 6.04 6.71 Highly susceptible 5.64 LGLG088218 10.83 3 0.0194 6.00 2.96 Moderately resistant 5.82 LGLG087176 15 2 0.01602 5.82 4.15 Susceptible 5.58 LGLG007074 17 2 0.03403 5.51 8.96 Highly susceptible 5.02 LGLG089264 12.83 3 0.02575 5.33
LGLG088074 12.5 5 0.03516 5.07
LGLG164007 14.83 3 0 5.07 7.96 Highly susceptible 4.66 LGLG164089 26 4 0.02971 5.02
5.02
LGLG007088 20 2 0.04949 4.76 18.21 Highly susceptible 3.89 LGLG021218 15 3 0.01407 4.71 8.21 Highly susceptible 4.32 LGLG089007 13.17 3 0.00393 4.62 7.25 Highly susceptible 4.29 LGLG089176 13.5 3 0.00392 4.53 5.96 Highly susceptible 4.26 LGLG087264 14 6 0.00391 4.44 2.74 Moderately resistant 4.32 LGLG089089 14 6 0.00391 4.44 5.51 Highly susceptible 4.20 LGLG021164 16.67 3 0.00721 4.44 10.21 Highly susceptible 3.99 LGLG176089 29 4 0.03682 4.31
LGLG021074 20.67 3 0.04829 4.13 2.07 Moderately resistant 4.05 LGLG088164 11.67 3 0.00447 4.09 7.21 Highly susceptible 3.79 LGLG007087 24 2 0.03224 4.09
LGLG218007 18.5 3 0.02356 3.91
LGLG089164 19.5 3 0.01235 3.82
LGLG007176 19.83 3 0.01883 3.82 2.96 Moderately resistant 3.71 LGLG089074 19.33 3 0.0389 3.56 8.21 Highly susceptible 3.26 LGLG021176 21.33 3 0.01663 3.51 6.96 Highly susceptible 3.27 LGLG007164 17.83 3 0.00941 3.47 2.55 Moderately resistant 3.38 LGLG087164 19.33 3 0.00833 3.16
LGLG089218 16.5 5 0.00098 2.76 1.87 Resistant 2.70 LGLG021264 23 5 0 1.96 10.46 Highly susceptible 1.75 LGLGO74007 30.25 2 0.0871 1.69 3.46 Moderately susceptible 1.63
Fixed term Wald
statistic d.f. Wald/d.f. chi pr
VARIETY 86.89 36 2.41 <0.001 ENVIRONMENT 130.04 2 65.02 <0.001 VARIETY.ENVIRON 80.68 50 1.61 0.004
H2 (yield) = 0.91

155
Distribution of variatin for insect mortality among hybrids
4
8
12
16
2
55504540
10
3530252015
14
0
6Inse
ct m
orta
lity
5.5.5 SET E: Larger gain borer resistant lines X Maize weevil resistant
lines
5.5.5.1 Grain resistance of F1 hybrids to maize weevil
Highly significant differences (p<0.001) were observed among the hybrids for adult mortality,
total number of insects, and percent grain damage. No significant differences were observed for
percent grain weight loss (Table 5.11).
5.5.5.1.1 Insect mortality
Highly significant differences (p<0.001) were obtained for insect mortality among maize hybrids.
Maize hybrids, MWlg939164, MWlg151264, MWlg13089, lgMW26411, and lgMW08812 showed
the highest number of insect mortalities. On the other hand, maize hybrids MWlg08164,
lgMW08711, MWlg06264, lgMW26410 and lgMW02111 had the least number of insect
mortalities (Table 5.11). Distribution of variation for insect mortalities indicated that most hybrids
experienced low levels of insect mortalities (Figure 5.23).
Figure 5.23: Distribution of variation for insect mortality among F1 hybrids (set e)
5.5.5.1.2 Total number of insects
Highly significant differences (p<0.001) were observed for total number of insects among the
hybrids. Maize hybrids MWlg06264, MWlg11176, lgMW16413, lgMW087940, and lgMW02111
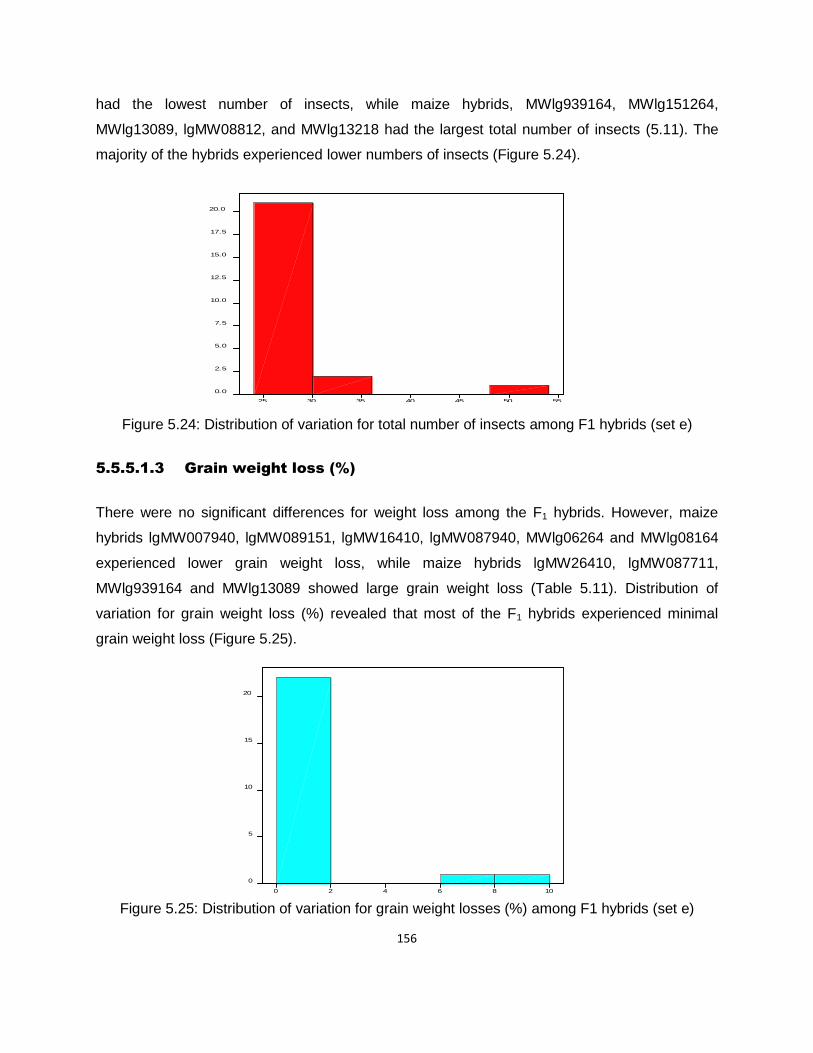
156
Distribution of variation for total number of insects among the hybrids
0.0
5.0
10.0
15.0
20.0
555045
7.5
40
17.5
353025
2.5
12.5
Tota
l num
ber o
f ins
ects
5
15
0
10864
10
20
20
Wei
ght
loss
(%
)
had the lowest number of insects, while maize hybrids, MWlg939164, MWlg151264,
MWlg13089, lgMW08812, and MWlg13218 had the largest total number of insects (5.11). The
majority of the hybrids experienced lower numbers of insects (Figure 5.24).
Figure 5.24: Distribution of variation for total number of insects among F1 hybrids (set e)
5.5.5.1.3 Grain weight loss (%)
There were no significant differences for weight loss among the F1 hybrids. However, maize
hybrids lgMW007940, lgMW089151, lgMW16410, lgMW087940, MWlg06264 and MWlg08164
experienced lower grain weight loss, while maize hybrids lgMW26410, lgMW087711,
MWlg939164 and MWlg13089 showed large grain weight loss (Table 5.11). Distribution of
variation for grain weight loss (%) revealed that most of the F1 hybrids experienced minimal
grain weight loss (Figure 5.25).
Figure 5.25: Distribution of variation for grain weight losses (%) among F1 hybrids (set e)

157
Distribution of variation for grain damage (%) among maize hybrids
15.0
20.0
12.5
7.5
12
2.5
108642
5.0
0
17.5
10.0
0.0
Gra
in d
ama
ge (
%)
5.5.5.1.4 Grain damage (%)
Highly significant differences (p<0.001) were observed for percent grain damage among maize
hybrids. The least number of damaged grains were observed in the following maize hybrids,
lgMW007940, lgMW087940, MWlg06264, lgMW089151, MWlg08007, MWlg06021, lgMW08710
and MWlg08164, while maize hybrids, lgMW26410, lgMW08711, lgMW16411, lgMW16410 and
MWlg13089 experienced the highest grain damage (Table 5.11). Distribution of variation for
grain damage (%) revealed that most of the hybrids experienced less grain damage (Figure
5.26).
Figure 5.26: Distribution of variation for grain damage (%) among F1 hybrids (set e)
Grain damage (%) as a measure of resistance determined that 16.7% of the F1 hybrids were
highly resistant, 50% were resistant, 21% moderately resistant, 4.2% moderately susceptible
and 8.3% highly susceptible (Figure 5.27).

158
Figure 5.27: Grouping of F1 hybrids into resistance groups using grain damage (%)
Table 5.11: Table of means for grain resistance parameters against maize weevil (set e)
Variety Total number of insects Adult mortality
Weight loss (%)
Grain damage (%)
Resistance reaction
lgMW007940 25.35 24.7 0.0 0.0 Highly resistant lgMW021151 26.02 25.4 0.0 0.3 Resistant lgMW089151 25.35 25.0 0.0 0.0 Highly resistant lgMW16410 25.35 24.7 0.0 2.7 Moderately resistant MWlg06021 25.68 25.7 0.0 1.0 Resistant MWlg08007 25.35 24.7 0.0 0.0 Highly resistant MWlg08164 25.44 22.4 0.0 0.0 Highly resistant lgMW26411 27.68 27.4 0.0 2.3 Moderately resistant MWlg06264 25.02 23.4 0.1 1.3 Resistant lgMW08812 29.02 28.7 0.1 0.7 Resistant MWlg13218 29.02 26.7 0.1 2.0 Resistant MWlg151264 34.02 33.7 0.1 0.3 Resistant MWlg11176 25.02 24.4 0.2 1.0 Resistant lgMW02111 25.02 23.7 0.2 2.3 Moderately resistant lgMW16413 25.02 24.7 0.2 0.3 Resistant lgMW08710 25.68 25.0 0.2 1.3 Resistant lgMW087940 25.02 24.4 0.3 0.7 Resistant lgMW17606 26.68 26.7 0.6 2.3 Moderately resistant lgMW16411 26.35 24.7 0.7 3.7 Moderately susceptible MWlg13074 26.35 25.7 0.9 1.7 Resistant MWlg13089 31.35 31.0 1.0 2.3 Moderately resistant MWlg939164 52.68 52.7 1.7 1.0 Resistant lgMW08711 25.68 23.0 6.0 10.0 Highly susceptible lgMW26410 25.02 23.4 8.4 11.0 Highly susceptible Mean 27.63 26.7 0.9 2.0
P.level Sg* Sg* nsg Sg* CV (%) 3.9 4.8 21.8 16.8
lsd (0.05) 0.218 0.263 0.66 0.468
SED 0.108 0.131 0.328 0.233 H
2 0.92 0.91 0.82 0.89
sg*= significant at p<0.001, nsg= not significant

159
Distribution of variation for amount of flour among hybrids
4
8
4.03.53.02.52.0
6
1.5
2
1.00.50.0
0
10
Flou
r (g)
5.5.5.1.5 Correlation between resistance parameters for maize weevil
Highly significant correlations (p<0.001) were observed between percent grain damage and
percent grain weight loss (0.9324) and between insect mortality and total number of insects
(Appendix 5.5).
5.5.5.2 Grain resistance of F1 hybrids to larger grain borer
Significant differences were observed for percent grain damage, flour weight, and percent grain
weight loss. Insect mortality and total number of insects did not show any significant differences
(Table 5.12).
5.5.5.2.1 Flour weight (g)
Significant differences (p<0.05) were observed for flour weight among the hybrids. Maize
hybrids, lgMW089151, lgMW08710, MWlg06021, lgMW021151, and MWlg06264, produced the
least amount of flour. The highest amount of flour was observed on maize hybrids, MWlg11176,
lgMW26411, MWlg13074, lgMW08711 and lgMW16411 (Table 5.12). Most hybrids produced
moderate to small amount of flour (Figure 5.28).
Figure 5.28: Distribution of variation for flour (g) among F1 hybrids (set e)
5.5.5.2.2 Grain weight loss (%)
Highly significant differences (p<0.001) were observed for grain weight loss among F1 hybrids.
Maize hybrids lgMW087940, MWlg06264, lgMW08710, lgMW089151 experienced less grain
weight loss, while maize hybrids MWlg11176, lgMW16411, MWlg13074 and lgMW26411
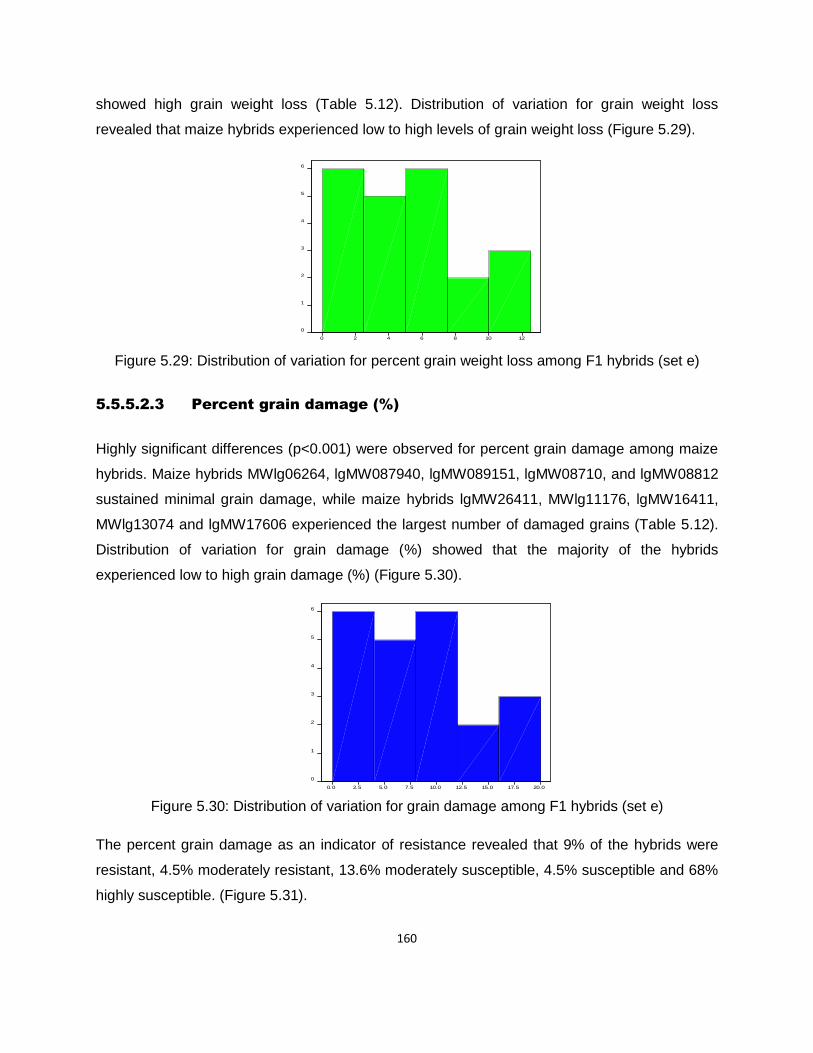
160
5
3
12
1
10864
6
2
2
0
4
0
Wei
ght
loss
(%
)
Distribution of variation for grain damage (%) among maize hybrids
5
3
20.0
1
17.515.012.510.07.5
6
5.0
2
2.50.0
4
0
Gra
in d
amag
e (%
)
showed high grain weight loss (Table 5.12). Distribution of variation for grain weight loss
revealed that maize hybrids experienced low to high levels of grain weight loss (Figure 5.29).
Figure 5.29: Distribution of variation for percent grain weight loss among F1 hybrids (set e)
5.5.5.2.3 Percent grain damage (%)
Highly significant differences (p<0.001) were observed for percent grain damage among maize
hybrids. Maize hybrids MWlg06264, lgMW087940, lgMW089151, lgMW08710, and lgMW08812
sustained minimal grain damage, while maize hybrids lgMW26411, MWlg11176, lgMW16411,
MWlg13074 and lgMW17606 experienced the largest number of damaged grains (Table 5.12).
Distribution of variation for grain damage (%) showed that the majority of the hybrids
experienced low to high grain damage (%) (Figure 5.30).
Figure 5.30: Distribution of variation for grain damage among F1 hybrids (set e)
The percent grain damage as an indicator of resistance revealed that 9% of the hybrids were
resistant, 4.5% moderately resistant, 13.6% moderately susceptible, 4.5% susceptible and 68%
highly susceptible. (Figure 5.31).

161
Figure 5.31: Grouping of F1 hybrids based on grain damage (%) among F1 hybrids (set e)
Table 5.12: Table of means for grain resistance parameters against larger grain borer (set e)
Variety Total number
of insects Insect
mortality Weight loss
(%) Grain damage
(%) Flour
weight (g) Resistance reaction
lgMW087940 25.03 23.0 0.0 1.7 0.90 Resistant MWlg06021 25.03 20.7 2.8 4.7 0.30 Susceptible lgMW08710 25.36 21.3 1.7 3.0 0.24 Moderately susceptible lgMW089151 26.36 24.7 1.7 2.7 0.10 Moderately resistant lgMW021151 27.03 23.0 2.4 3.7 0.36 Moderately susceptible MWlg13218 27.03 20.0 4.1 7.0 0.90 Highly susceptible lgMW08711 28.36 22.7 4.8 8.7 1.40 Highly susceptible lgMW26410 29.03 24.3 6.1 9.3 1.28 Highly susceptible lgMW02111 29.36 24.7 5.5 8.7 1.04 Highly susceptible lgMW007939 29.36 23.0 6.0 11.7 1.07 Highly susceptible lgMW08812 30.03 22.3 2.4 3.3 0.40 Moderately susceptible MWlg151264 30.69 26.0 5.8 8.7 1.20 Highly susceptible MWlg13089 31.03 25.7 5.3 6.0 0.67 Highly susceptible lgMW17606 31.62 26.3 7.8 12.8 1.28 Highly susceptible lgMW16413 33.03 21.0 6.2 8.7 1.00 Highly susceptible MWlg06264 33.36 28.0 0.8 1.3 0.40 Resistant lgMW26411 34.03 21.0 11.9 19.7 2.37 Highly susceptible lgMW16410 35.69 31.7 3.4 5.3 0.90 Highly susceptible MWlg13074 36.36 26.0 8.0 15.0 1.60 Highly susceptible MWlg08164 37.36 29.0 4.9 6.3 1.07 Highly susceptible lgMW16411 40.36 23.0 11.2 16.7 2.43 Highly susceptible MWlg11176 47.03 20.3 10.1 19.0 3.10 Highly susceptible Mean 31.48 24.0 5.0 8.4 1.09
P.level nsg nsg Sg** Sg** Sg* CV 24.9 21.8 22.1 15.6 22.3
lsd(0.05) 13.05 8.712 0.6927 0.6165 0.4179
Sed 6.461 4.314 0.3425 0.3053 0.2064 H
2 0.81 0.75 0.9 0.9 0.85
* Significant at p<0.05, **significant at p<0.001, nsg=not significant

162
5.5.5.3 Correlation between resistance parameters for larger grain borer
Highly significant correlations (p<0.001) were observed between percent grain damage and
percent grain weight loss (0.9726), between percent grain damage and total number of insects
(0.6685), and between percent grain weight loss and total number of insects (0.6771) (Appendix
5.6 ).
5.5.5.4 Yield potential of F1 hybrids (set e)
Analysis of individual environments revealed significant differences (p<0.01) for yield potential
among the hybrids under rainfed and no significant differences for yield potential were observed
among the hybrids under irrigation and drought. Combined yield analysis revealed highly
significant differences (p<0.001) for yield potential and significant differences (p< 0.01) for the
genotype and environment interaction among the hybrids. Maize hybrids, lgMW26413,
MWlg08264, lgMW087940, lgMW26411, lgMW08710, lgMW16411, lgMW13218, lgMW02111,
MWlg939074 and MWlg08089 showed highest yield potential, with mean yields ranging from
8.92 to 14.23 tons/ha. These hybrids out yielded the check “Kanyani” which had a mean yield of
6.34 tons/ha. The following hybrids exhibited general adaptability, lgMW26413, lgMW26411,
lgMW087940, lgMW08710, lgMW26411 and lgMW16411 (Table 5.13).

163
Table 5.13: Mean yield potential and mean rank of F1 hybrids across environments (set e)
Variety Yield (tons/ha) Group Mean rank Superiority Index
LGMMW26413 14.23 2 4.75 0.05769 MWLG08264 11.08 5 10 0.00002 LGMW087940 11.05 2 10.25 0.0146 LGMW26411 10.30 3 5.83 0.02632 LGMW08710 10.16 2 8.75 0.0078 LGMW16411 10.00 6 2.5 0.01351 MWLG13218 9.93 2 12.25 0.00435 LGMW02111 9.37 3 7.5 0.01059 MWLG939074 8.98 2 13.25 0.01925 MWLG08089 8.92 4 9 0.01959 LGMW17611 8.89 6 8.5 0.0076 MWLG13021 8.86 3 7.17 0.02121 MWLG13089 8.81 2 17.75 0.00152 MWLG06087 8.61 5 20 0.00345 MWLG06264 8.16 2 17.25 0.02736 MWLG08007 8.16 2 18.25 0.00187 MWLG939264 7.98 4 14.25 0.01282 LGMW16413 7.78 6 13.5 0.00338 LGMW08706 7.67 2 19.75 0.00084 LGMW26410 7.60 3 13.5 0.01511 MWLG151089 7.37 5 27 0.00823 LGMW021151 7.09 2 22.25 0.00847 MWLG13074 6.68 3 15.33 0.00493 LGMW16410 6.67 6 18.5 0.00084 MWLG690264 6.64 3 15.17 0.01301 MWLG13218 6.56 3 10.5 0.01958 Kanyani 6.34 1 2 0.00067 MWLG10089 6.22 2 25.5 0.0064 LGMW08711 6.22 3 14.5 0.02829 MWLG06089 6.13 4 17.5 0.01582 MWLG940164 6.02 3 18.67 0.01039 MWLG08164 5.80 3 18.83 0.0424 LGMW08812 5.59 3 18.83 0.00795 MWLG11176 5.56 6 24 0 MWLG06021 5.40 7 16.25 0.00891 MWLG089151 5.24 3 20.83 0.01475 MWLG13164 5.17 5 33 0.02177 lgMW26413 4.93 1 5 0.00044 LGMW17613 4.82 3 22.33 0.01798 LGMW089151 4.68 2 31 0.02452 LGMW13089 4.65 5 35 0.02592 LGMW007939 4.17 3 28.17 0.04069 LGMW176151 3.80 3 25.67 0.03135 LGMW021939 3.72 2 32.75 0.01926 LGMW17606 3.54 3 27.67 0.0448 LGMW16406 2.37 2 36.25 0.05276 MWLG151264 1.98 7 27.75 0.02362
Fixed term Wald statistic d.f. Wald/d.f. chi pr VARIETY 132.31 49 2.7 <0.001 ENVIRONMENT 112.19 2 56.1 <0.001
VARIETY.ENVIRONMENT 77.58 49 1.58 0.006
H2 (yield) = 0.93

164
5.5.5.5 Yield potential and resistance levels of F1 hybrids
Combining yield performance and resistance levels as criteria for selecting hybrids, maize
hybrids lgMW087940 (11.05 tons/ha), MWlg06264 (8.16 tons/ha) and lgMW08710 (10.16
tons/ha), MWlg13218 (9.93 tons/ha) and lgMW089151 (5.24 tons/ha) were resistant to maize
weevil and revealed high yield potential. Maize hybrids, lgMW08710, MWlg06264 and
lgMW089151 were resistant to larger grain borer (Table 5.14).
Table 5.14: Yield potential, yield ranking and dual resistance among F1 hybrids from set e
Larger grain borer resistance
Maize weevil resistance
Variety
Grain damage (%)
Resistance reaction Grain
damage (%) Resistance reaction
Yield (tons/ha)
Rank
lgMW087940 1.7 Resistant
0.7 Resistant 11.05 1
MWlg06021 4.7 Susceptible
1.0 Resistant 5.40 19
lgMW08710 3.0 Moderately susceptible
1.3 Resistant 10.16 3
lgMW089151 2.7 Moderately resistant
0.0 Highly resistant 5.24 20
lgMW021151 3.7 Moderately susceptible
0.3 Resistant 7.09 12
MWlg13218 7.0 Highly susceptible
2.0 Resistant 9.93 6
lgMW08711 8.7 Highly susceptible
10 Highly Susceptible 6.22 15
lgMW26410 9.3 Highly susceptible
11 Highly susceptible 7.60 11
lgMW02111 8.7 Highly susceptible
2.3 Moderately resistant 9.37 7
lgMW08812 3.3 Moderate susceptible
0.7 Resistant 5.59 17
MWlg151264 8.7 Highly susceptible
0.3 Resistant 1.98 22
MWlg13089 6.1 Highly susceptible
2.3 Moderately resistant 8.81 8
lgMW17606 12.8 Highly susceptible
2.3 Moderately resistant 3.54 21
lgMW16413 8.7 Highly susceptible
0.3 Resistant 7.78 10
MWlg06264 1.3 Resistant
1.3 Resistant 8.16 9
lgMW26411 19.7 Highly susceptible
2.3 Moderately resistant 10.30 2
lgMW16410 5.3 Highly susceptible
2.7 Moderately resistant 6.67 14
MWlg13074 15.0 Highly susceptible
1.7 Resistant 6.68 13
MWlg08164 6.3 Highly susceptible
0.0 Highly resistant 5.80 16
lgMW16411 16.7 Highly susceptible
3.7 Moderately susceptible
10.00 4
MWlg11176 19.0 Highly susceptible 1.0 Resistant 5.56 18

165
5.5.6 Analysis for yield and resistance across sets (A-E)
5.5.6.1. Response of maize hybrids to maize weevil across three sets (A, B
& E)
Highly significant differences (p<0.001) were observed for grain damage across three sets
(Table 5.15).
Table 5.15: Analysis of Variance for percent grain damage across three sets
Source of variation d.f. s.s. m.s. v.r. F pr.
Set 2 7.9595 3.9797 27.78 <.001
Variety 84 37.1165 0.4419 3.08 <.001
Residual 190 27.2165 0.1432
Total 276 72.2925 0.261
CV = 19.27, SE= 0.3785, LSD= 0.9394, P<0.001
Fixed term Wald statistic d.f. Wald/d.f. chi pr
set 22.56 2 11.28 <0.001
Variety. Set 253.06 83 3.05 <0.001
5.5.6.2 Top 20 maize weevil resistant F1 hybrids
Using percent grain damage to compare maize hybrids for grain resistance against maize
weevil across sets, the results showed that among the top 20 most maize weevil resistant
hybrids, 18 hybrids came from set a “crosses between adapted Malawi lines and maize weevil
resistant lines” and 2 hybrids from set b “crosses between maize weevil resistant lines”. The top
five most ranked maize weevil resistant hybrids were MWA06A, MWA12395, MWA08202,
MWA11312 and MWA10A belonged to set a (Appendix 5.7).
5.5.6.3 Response of F1 hybrids to larger grain borer across sets (C, D & E)
Highly significant differences (p<0.001) were observed for percent grain damage across three
sets (Table 5.16).

166
Table 5.16: Analysis of variance for percent grain damage across three sets
Analysis of variance d.f. s.s. m.s. v.r. F pr.
Set 2 4.019 2.0095 8.7 <.001
Variety 83 65.2517 0.7862 3.4 <.001
Residual 211 48.7343 0.231
Total 296 118.0049 0.3987
CV= 22.48, se= 0.4806, lsd =0.9241, p<0.001
5.5.6.3.1 Top 20 larger grain borer resistant hybrids
Using percent grain damage to determine overall top 20 resistant hybrids against larger grain
borer, the results revealed that ten hybrids came from set c “crosses between adapted Malawi
lines and larger grain borer resistant lines”, seven hybrids came from set d “crosses between
larger grain borer resistant lines” and three hybrids came from set e “crosses between maize
weevil resistant lines and larger grain borer resistant lines” (Table 5.18). However, top three
resistant hybrids came from set c, namely, LGA089116, LGA087I83, and LGA088A (Appendix
5.8).
5.5.6.4 Combined yield analysis of F1 hybrids across environments
Highly significant differences (p<0.001) were observed for yield potential, environmental effects
and the interaction between varieties and environments (Table 5.17)
Table 5.17: Analysis of variance for combined yield across environments
Fixed term Wald statistic d.f. Wald/d.f. chi pr
VARIETY 674.62 195 3.46 <0.001
ENVIRONMENT 263.05 2 131.52 <0.001
VARIETY.ENVIRONMENT 324.32 214 1.52 <0.001
Among the top hybrids with high yielding potential, set a contributed seven hybrids, five hybrids
came from set b, two hybrids from set c, six hybrids from set e and none from set d (Figure
5.32).

167
0
1
2
3
4
5
6
7
8
Set a (mw x adp) Set b (mw x mw) Set c (lgb x adp) Set d (lgb x lgb) Set e (lgb x mw)
Nu
mb
er
of
hyb
rid
s
Sets
Figure 5.32: Contribution of each set to top 20 high yielding hybrids
Note: MW = maize weevil resistant lines, LGB = LGB resistant lines, Adp = adapted Malawi lines
The F1 hybrids from crosses between locally adapted Malawi lines and maize weevil resistant
lines produced the highest mean yields. These were followed by hybrids from crosses between
adapted Malawi lines and larger grain borer resistant lines (Figure 5.33).
Figure 5.33: Mean maize yields across sets

168
5.5.6.5 Insect resistance among top 20 high yielding F1 hybrids
Maize hybrids MWA11273, lgMW087940, lgMW08710 and MWA06A were the highest yielding
maize weevil resistant hybrids across sets. Maize hybrid, lgMW087940 was the best larger grain
borer and maize weevil resistant hybrid with high yield potential (Table 5.18).
Table 5.18: Resistance among top most high yielding F1 hybrids
Resistance levels
VARIETY Yield (tons/ha) Maize weevil resistance Larger grain borer resistance
MWA112W 15.64
Susceptible LGA089444 14.14
Highly susceptible
MWA06403-3 13.60
Highly susceptible MWMW13939 12.76
Highly susceptible
MWMW1106 12.76
Susceptible MWA151A 11.33
Moderately susceptible
MWA11273 11.69
Moderately resistant MWLG08264 11.08
LGMW087940 11.05
Resistant
Resistant MWMW44606 10.98
Highly susceptible
LGMW26411 10.30
Moderately resistant
Highly susceptible MWA06273 10.44
Highly susceptible
LGA0890020 10.55
Highly susceptible LGMW08710 10.16
Resistant
Moderately susceptible
MWA446A 10.98
Highly susceptible MWMW44610 11.11
LGMW16411 10
Moderately susceptible
Highly susceptible MWA06A 10
Highly resistant
MWMW13675 10 Highly susceptible
5.6 Discussion
5.6.1 Response of maize varieties to maize weevil infestation
Significant variation in levels of resistance against maize weevil was observed among the F1
hybrids. The variation was revealed through significant differences obtained among the hybrids
for the number of insect mortalities, total number of insects, and percent grain damage.
Resistant varieties showed high insect mortality numbers, experienced less grain damage, and
had less total number of insects (Abebe et al., 2009; Tefera et al., 2011; Mwololo et al., 2012).
From each set, maize hybrids with useful amount of resistance were identified using grain
resistant parameters. For instance, using percent grain damage to cluster maize materials into
resistant groups and the distribution of variation for the resistant parameters was so variable
among the hybrids. This was indicative of varietal differences in their response to weevil attack.

169
Hence, genetic variation for resistance against maize weevil existed among the maize hybrids
(Kim and Kossou, 2003).
Correlation analysis among the resistant parameters showed significant and non-significant
relationships. In general, percent grain weight loss and percent grain damage had consistently
showed highly significant positive correlations. Correlations between number of insects with
both percent grain weight loss and percent grain damage were not consistent. For example in
set a, total number of insects showed highly significant positive correlation with percent grain
damage, in set b, the relationship between the two parameters was positive and non-significant,
and in set e the relationship was negative and non-significant. The only apparent difference
between the sets was the availability of LGB resistant genes in set e. Hence, use of insect
number as an indicator of resistant to maize weevil was unreliable. In view of this development,
percent grain weight loss and percent grain damage were better indicators of resistance among
maize hybrids. In addition, these indicators were largely heritable. For example, percent grain
damage had broad- sense heritability ranging from 0.83 to 0.91 across sets, while percent grain
weight loss had broad-sense heritability ranging from 0.74 to 0.82 across sets.
Using both percent grain damage and percent weight loss to identify the top maize weevil
resistant hybrids across sets, in set a, both percent grain damage and percent grain weight loss
identified MWA10A, MWA06A, MWA12395 and MWA11312 as resistant hybrids. In set b, both
indicators identified maize hybrids MWMW15106, MWMW151939, MWMW0611,
MWMW674937, MWMW1313 and MWMW446939. While for set e, the parameters identified
lgMW007940, lgMW089151, MWlg06021, MWlg08007, and MWlg08164 as being resistant to
maize weevil. Kitaw et al. (2001) and Abebe et al. (2009) found strong positive correlation
between percent grain damage, weight loss and insect numbers. The increase in number of
insect pests led to increase grain damage subsequently increase in weight loss.
Mechanical and biochemical factors have been attributed to the observed variation in resistance
among maize varieties. For example, phenolic compounds were reported to be responsible for
providing both mechanical resistance and antibiosis in maize grain (Arnason et al., 1994; Derera
et al., 2000; García-Lara et al., 2004). Ferulic and P-coumaric acids (feruloyl and P-coumaroyl
arabinoxylans) were reported to be responsible for mechanical resistance against maize weevil,
while phenolic amides such as diferuloyl and dicoumaroyl putrescine were responsible for
antibiosis against maize weevil (Arnason et al., 1994). Phenolics play a pivotal role in

170
strengthening the cell wall structures in cereals, (Garcia-Lara et al., 2004). For instance, simple
phenolic acids, diferulates strengthen pericarp cell wall and dehydrodiferulates join polymers in
plant walls, there by conferring resistance to maize weevil (Garcia-Lara, et al., 2004).
5.6.2 Response of maize varieties to larger grain borer infestation
Variation in varietal response to larger grain borer was observed among the hybrids. The
distribution of variation for resistant parameters was also variable. Resistant varieties exhibited
high insect mortality rates, low grain damage (%), less amount of flour produced and less grain
weight loss (%). The use of grain weight loss (%), grain damage (%), flour weight and number of
insects as indicators of susceptibility among maize varieties have been reported (Ndiso et al.,
2007; Kasambala, 2009; Mwololo et al., 2010; Tefera et al., 2011). Tefera et al. (2011) reported
significant variation in amount of dust, grain weight loss and grain damage in a three way cross
maize hybrids. Ndiso et al. (2007) used amount of flour and weight loss to isolate resistant
varieties among landraces in Kenya. Mwololo et al. (2010) reported variation in varietal
resistance to LGB among hybrids and OPVs in Kenya. The varieties showed significant
differences in flour weight, grain damage and number of insects. Report from Malawi by
Kasambala (2009) indicated significant variation was observed for grain weight loss, grain
damage and number of insects among commercial maize hybrids in Malawi.
Highly significant correlations were observed among the resistance parameters, especially
between grain weight loss (%), grain damage (%) and insect numbers. This implied that the
three resistance parameters, which are also heritable, could be used to distinguish resistant
maize varieties from the susceptible varieties when exposed to LGB infestation. For instance,
the heritability of percent grain damage ranged from 0.90-0.94, percent grain weight loss (0.83-
0.93) and total number of insects (0.81-0.89). Tefera et al. (2011) reported significant
correlations between insect numbers, amount of dust and weight loss. Maize varieties with large
number of insects produced the highest amount of flour and had the largest grain weight losses.
Using both percent grain weight loss and percent grain damage to identify resistant hybrids, in
set c, both parameters identified varieties LGA087I83, LGA088A, and LGA089116 as top LGB
resistant hybrids. In set d, the two parameters identified LGLG088218, LGLG021074,
LGLG087264, and LGLG007164, and set e, maize hybrids lgMW087940, lgMW089151,
lgMW08710, and MWlg06264 were resistant. The resistance observed in these varieties could

171
be attributed to structural (physical) factors and chemical compound, such as amylose, lipids,
protein and phenolic compounds that are found within the grain (Arnason et al., 1994; Garcia-
Lara et al., 2004; Nhamucho et al., 2014). In contrast, Meikle et al. (1998) reported that husk
cover extension had greater ability in providing resistance against LGB than grain
characteristics.
5.6.3 Stacking of larger grain borer and weevil resistance in F1 maize
hybrids
The stacking of larger grain borer and weevil resistance in F1 maize hybrids has proven to be
effective in breeding for both maize weevil and larger grain borer resistant hybrids. For instance,
the stacking of maize weevil and larger grain borer resistance produced 67% maize weevil
resistant hybrids and 14% larger grain borer resistant maize hybrids and 14% hybrids with
resistance to both larger grain borer and maize weevil. Of interest were maize hybrids,
lgMW087940, lgMW089151, and MWlg06264 that were resistant to both larger grain borer and
maize weevil. This could suggest that the hybrids contained a combination of genes (similar
genes or complementally genes) conferring resistance to both maize weevil and larger grain
borer. This was in agreement with an observation by Tefera et al. (2011) who reported the
existence of maize hybrids in Kenya that were able to confer resistance to both LGB and maize
weevil. The identification of such resistant hybrids means that selection for both maize weevil
and larger grain borer among maize germplasm is a practical and feasible option to reduce the
damage caused by the insect pests (Tefera et al., 2011). This dual resistance found in the
hybrids could be exploited for breeding maize varieties that are resistant to both insect pests in
Malawi. However, screening for dual resistance should involve the use of larger grain borer
insect pests as also recommended by Tefera et al. (2011). The results in this study have shown
that hybrids that were resistant to LGB were also found to be resistant to maize weevil, while
most of the hybrids resistant to maize weevil were found to be susceptible to larger grain borer.
In addition, the development of dual resistant maize hybrids should use LGB resistant lines as
female parents. Results have shown that most of the hybrids that were resistant to both maize
weevil and larger grain borer, the female parents were largey LGB resistant. As observed in
maize weevil resistance by Derera et al. (2000) and Kim and Kossou, (2003), it appears, though
not conclusive that female effects could play a significant role in development of dual resistant
maize hybrids.

172
5.6.4 Combined analysis of maize weevil and larger grain borer resistance
across sets
Combined analysis for maize weevil resistance across sets revealed that among top 20 weevil
resistant hybrids, 18 hybrids came from set a “adapted maize lines x maize weevil resistant
lines”, only 2 hybrids came from set b “maize weevil resistant lines x maize weevil resistant
lines”. The top most maize weevil resistant hybrids were MWA06A, MWA12395, MWA10A and
MWA11312 that came from set a. The presence of larger number of resistant hybrids from set a
meant that maize germplasm in Malawi have genes for weevil resistance but have never been
fully explored and exploited in breeding programmes (Gilbert and Jones, 2012).
Combined analysis of larger grain borer resistance across sets showed that among the top 20
larger grain borer resistant hybrids, ten hybrids came from set c “adapted Malawi lines x larger
grain borer resistant lines”, Seven (7) hybrids came from set d “larger grain borer resistant lines
x larger grain borer” and set e “maize weevil resistant lines x larger grain borer resistant lines”
produced three hybrids. Maize hybrids, LGA089116, LGA087I83, and LGA088A were the top
most resistant hybrids. The large presence of resistant varieties originating from set c was also
indicative of the availability of genes for larger grain borer resistant among the locally adapted
lines. Although Kasambara (2009) reported the susceptibility of all commercial hybrids to larger
grain borer in Malawi, current results have demonstrated that improvement of LGB resistance
among productive maize germplasm in Malawi is possible.
5.6.5 Yield potential of insect resistant F1 hybrids across environments
Yield potential among the hybrids within environments did not differ significantly except for sets
d under drought, set b under irrigation, and sets a and e under rainfed. But combined yield
analysis across environments showed significant differences for yield potential, environmental
effects and the genotype and environment interaction. This was in agreement with
Kanyamasoro et al. (2010) who also reported significant variation for yield potential especially
among weevil resistant varieties. Variation in environmental conditions can result in significant
genotype and environment interaction which affects maize productivity (Sibiya et al., 2011;
Grada and Ciulca, 2013). Significant interaction between genotype and environment affects
selection of genotypes (Kanyamasoro et al., 2010; Mendes et al., 2012). The assessment of the
top 20 high yielding varieties across the sets and across environments revealed that most of the

173
high yielding varieties came from crosses between locally adapted Malawi lines with LGB or
MW resistant lines. Crosses from all LGB or MW performed poorly possibly due to poor
adaptation to the testing environments. Stability and adaptability of genotypes are important
factors when selecting cultivars for planting (Scapim et al., 2000). Using mean ranking or
superiority index to measure general adaptation of varieties across environments in each set,
the following maize hybrids were identified as having good general adaptability; LGA089444,
MWA112W, MWA11273, LGLG218089, MWMW13939, MWMW1106, lgMW26413,
MWA06403-3, LGA151A, MWMW44606, MWlg08264 and lgMW087940. The adaptable
varieties had the highest mean yields across environments, as such the combination of mean
yield and superiority index can help in the selection and isolation of superior varieties (Scapim,
2000). Isolating hybrids that are stable and adaptable to the environments minimizes the effect
of genotype and environmental interaction (Eberhart and Russell, 1966).
5.6.6 Breeding of high yielding insect resistant hybrids in Malawi
Breeding for high yielding maize varieties with high levels of resistance to maize weevil should
involve the use crosses between weevil resistant lines and crosses between adapted Malawi
lines and weevil resistant lines. This has been demonstrated by the development of maize
hybrids, such as MWA06A (10 tons/ha), MWMW15106 (9.07 tons/ha), MWA10A (7.69 tons/ha),
and MWMW446939 (6.67 tons/ha) and MWMW12939 (6.67 tons/ha) that have good resistance
to maize weevil and high yield potential across environments and some of the hybrids out
performed a commercial hybrid. Better performances of weevil resistant varieties against
commercial hybrids were also reported by Tefera et al. (2012) among improved hybrids with
different resistance levels in Kenya. For larger grain borer resistance, crosses between larger
grain borer resistant lines and maize weevil resistant lines, and crosses between locally adapted
maize lines and larger grain borer resistant lines should be used to develop maize hybrids with
high yield potential and high levels of resistance to LGB. For instance, lgMW087940 (11.05
tons/ha), LGA087I83 (8.89 tons/ha), MWlg06264 (8.16 tons/ha) and lgMW089116 (6.6 tons/ha)
have shown to have good resistance to larger grain borer and better yield potential across
environments.
174
5.7 Conclusion
The study has demonstrated that development of insect resistant hybrids is possible. The
developed F1 hybrids exhibited significant variation in yield potential and resistance to both
maize weevil and larger grain borer. The study has also demonstrated that stacking of maize
weevil and larger grain borer resistance can lead to increase in number of maize weevil
resistant hybrids and the development of dual resistant maize hybrids. Insect resistance can
form part of an integrated pest management strategy for storage pests in Malawi. However,
productive hybrids would be obtained largely by crossing local adapted lines with maize weevil
and larger grain borer resistance sources, and partly from crosses between maize weevil and
larger grain borer resistance sources. Therefore, study results demonstrated that insect
resistant hybrids would provide a sustainable way of reducing post-harvest grain losses in
storage and increase net grain yield among smallholder farmers in the country. The developed
LGB and MW resistant hybrids would have acceptable productivity in the field and stability in the
target environment resulting in superior net yield on farm.
References
Abebe, F., T. Teheran, S. Mug, Y. Been, and S. Vidal. 2009. Resistance of maize varieties to
the maize weevil, Sitophilus zeamais (Motsch.) (Coleoptera: Curculionidae). African
Journal of Biotechnology 8:5937-5943.
Abera, W., B.J. van Rensburg, M.T. Labuschagne, and H. Martens. 2004. Genotype-
environment interactions and yield stability analyses of maize in Ethiopia. South African
Journal of Plant and Soil 21:251-254.
Akinnifesi, F.K., W. Makumba, G. Sileshi, O.C. Ajayi, and D. MWeta. 2007. Synergistic effect of
inorganic N and P fertilizers and organic inputs from Gliricidia sepium on productivity of
intercropped maize in Southern Malawi. Plant and Soil 294:203–217.
Arnason, J.T., B. Baum, J. Gale, J.D.H. Lambert, D. Bergvinson, B.J.R. Philogene, J.A.
Serratos, J. Mihm, and D.C. Jewell. 1994. Variation in resistance of Mexican landraces
of maize to maize weevil, Sitophilus zeamais in relation to taxonomic and biochemical
parameters. Euphytica 74:227-236.

175
Bänziger, M., P S. Setimela, D. Hodson, and B. Vivek. 2004. Breeding for improved drought
tolerance in maize adapted to southern Africa. Available at www.cropscience.org.au.
Accesssed on 20 June 2010. Brisbane, Australia.
Boxall, R.A. 2002. Damage and loss caused by the larger grain borer, Prostephanus truncatus.
Intergrated Pest Management Reviews 7:105-121. Kluwer Academic Publisher,
Netherlands.
Denning, G., P. Kabambe, P. Sanchez, A. Malik, and R. Flor. 2009. Input subsidies to improve
smallholder maize productivity in Malawi: Towards an African green revolution. Public
Library of Science Biology 7(1): e1000023.doi:10.1371/journal.pbio.1000023. Available
at http://www.plosbiology.org. Accessed on 30 June 2010. Public Library of Science,
USA.
Derera, J., K.V. Pixley, and P. D. Giga. 2000. Resistance of maize to the maize weevil: I.
Antibiosis. African Crop Science Journal 9:431-440.
Earl, H.J., and R.F. Davis. 2003. Effect of drought stress on leaf and whole canopy radiation use
efficiency and yield of maize. Agronomy Journal 95:688–696.
Eberhart, S.A., and Russell W.A. 1966. Stability parameters of comparing varieties. Crop
Science 6:36-40.
FAOSTAT. 2014. Food and Agriculture Organisation. Available at http://faostat.fao.org.
Accessed on 7 June 2014. FAO, Rome.
Farooq, M., A. Wahid, N. Kobayashi, D. Fujita, and S.M.A. Basra. 2008. Plant drought stress:
Effects, mechanisms and management. Agronomy for Sustainable Development
29:185–212.
Finlay, K. W. and G.N. Wilkinson. 1963. The analysis of adaptation in a plant-breeding
programme. Australian Journal of Agricultural and Resource Economics 14:742-754.
Garci'a-lara, S., D. Bergvinson, A. J. Burt, A. Ramput, D.M Duaz-pontones, and J.T. Arnason.
2004. The role of pericarp cell wall components in maize weevil resistance. Crop
Science 44:546-1552.
Gauch, H.G. Jr. 1992. AMMI and related models. In H.G. Gauch (ed.) Statistical analysis of
regional trials. Elsevier Science Publishers, The Netherlands.
Gilbert, J., and M. Jones. 2012. Does Access to Storage Protectant Increase Smallholder
Adoption of Improved Maize Seed? Insights from Malawi Agricultural & Applied
Economics Association’s 2012 AAEA Annual Meeting, Seattle, Washington.

176
Grada, F., and S. Ciulca. 2013. Analysis of genotype and environment interaction for yield in
some maize hybrids. Journal of horticulture, Forestry and Biotechnology 17(2):192 -196.
Haines, C.P. 1991. Insects and arachnids of tropical stored products: their biology and
identification–A training manual. Natural Resources Institute (NRI).
IFPRI. 2007. The world food situation: New driving forces and required actions. Washington,
D.C.
Kamanula, J., G.W. Sileshi, S.R. Belmain, P. Sola, B.M. Mvumi, G.K.C. Nyirenda, S.P.
Nyirenda, and P.C. Stevenson. 2011. Farmers’ insect pest management practices and
pesticidal plant use in the protection of stored maize and beans in Southern Africa.
International Journal of Pest Management 57:41–49.
Kanyamasoro, M.G., J. Karungi, G. Asea, and P. Gibson. 2010. Determination of the hererotic
groups in maize inbred lines and the inheritance of their resistance to maize weevil.
African Crop Science Journal 20:99-105.
Kasambala, T. 2009. Prostephanus truncatus (Horn) (Coleoptera: Bostrichidae) infestation
levels on different maize varieties in Malawi. Resistant Pest Management Newsletter
Vol. 19, No. 1 (Fall 2009) p. 9-13. Center for Integrated Plant Systems (CIPS).
Kim, S.K., and D.K. Kossou. 2003. Responses and genetics of maize germplasm resistant to
the maize weevil, Sitophilus zeamais Motschulsky in West Africa. Journal of Stored
Products Research 39:489–505.
Kitaw, D., F. Eticha, and A. Tadesse. 2001. Response of commercial varieties and other
genotypes of maize for resistance to the maize weevil, Sitophilus zeamais (MOTSCH.)
(COLEOPTERA: CIRCULIONIDAE). p. 92-101 Seventh Eastern and Southern Africa
Regional Maize Conference.
Ma’ali, S.H. 2008. Additive mean effects and multiplicative interaction analysis of maize yield
trials in South Africa. South African Journal of Plant and Soil 25:185-193.
Makoka, D. 2008. The Impact of drought on household vulnerability: The case of rural Malawi.
2008 United Nations University (UNU-EHS) Summer Academy on “Environmental
Change, Migration and Social Vulnerability”. Bonn, Germany.
Meikle, W.G., C. Adda, K. Azoma, C. Borgemeister, P. Degbey, B. Djomamou, and R.H.
Markham. 1998. The effects of maize variety on the density of Prostephanus truncatus
(Coleoptera: Bostrichidae) and Sitophilus zeamais (Coleoptera: Curculionidae) in post-
harvest stores in Benin Republic. Journal of Stored Products Reseach 34:45-58.

177
Mendes, F.F., L.J.M. Guimarȃes, J.C. Souza, P.V. Guimarȃes, C.A.P. Pacheco, J.Machado,
W.F. Meirelles, A.R. da Silva, and S.N. Parentoni. 2012. Adaptability and stability of
maize varieties using mixed model methodology. Crop Breeding and Applied
Biotechnology 12:111-117.
Miranda, G., L. Souza, L. Guimaraȇs, H. Namorato, R. Oliveira and M. Soares. 2009.
Multivariate analyses of genotype x environment of popcorn. Pesquisa Agropecuária
Brasileira 44:45-50.
Mwololo, J.K., S. Mugo, P. Okori, T. Tadele, and S.W. Munyiri. 2010. Genetic diversity for
resistance to larger grain borer in maize hybrids and open pollinated varieties in
Kenya Second RUFORUM Biennial Meeting 20 - 24 September 2010, Entebbe,
Uganda.
Mwololo, J.K., S. Mugo, P. Okori, T. Tefera, M. Otim, and S.W. Munyiri. 2012. Sources of
resistance to the maize weevil, Sitophilus zeamais in tropical maize. Journal of
Agricultural Science 4:1916-9752.
Ndiso, J.B., S. Mugo, A.M. Kibe, R.S. Pathak, and P. Likhayo. 2007. Characterization for
phenotypic drought tolerance and resistance to storage pests in local coastal maize
landraces in Kenya. p. 245-250 African Crop Science Conference Proceedings.
Ngwira, P. 2001. Managing maize diseases through breeding. Chitedze Resarch Station,
Lilongwe.
Nhamucho, C., S. Mugo, M.Kinyua, L. Gohole, T. Tefera, and E. Mulima. 2014. Antibiosis
mechanism for resistance to larger grain borer Prostephanus truncatus (Horn)
(coleoptera: Bostrichidae) in maize. Journal of Entomology 11:248–260.
Nzuve, F., S.Githi, D.M. Mukunya, J.Gethi. 2013. Analysis of genotype x environment
interraction for grain yield in maize hybrids. Journal of Agricultural Science. Available at
http://dx.doj.org. Accessed on 8th August, 2014. Canadian Center of Science and
Education.
O’neil, M. 2010. ANOVA and REML. A guide to linear mixed models in an experimental design
context. Statistical Advisory and Training Service Pty Ltd.
Payne, R.W., S.A. Harding, D.A., and S.J. Welham. 2009. A Guide to REML in GenStat. VSN
International 5. The Waterhouse, Waterhouse Street, Hemel Hempstead, Hertfordshire
HP1 1ES, UK.
Payne, R.W., S.A. Harding, D.A. Murray, D.M. Soutar, D.B. Baird, A.I. Glaser, S.J. Welham,
A.R. Gilmour, R. Thompson, and R. Webster. 2011. GenStat Release 14. VSN

178
International 5. The Waterhouse, Waterhouse Street, Hemel Hempstead, Hertfordshire
HP1 1ES, UK.
Pereira de Oliveira, J., W.N. Moreira Junior, J. Duarte, L.J. Chaves, and J.B.Pinheiro. 2003.
Genotype-environment interaction in maize hybrids: an application of AMMI model. Crop
Breeding and Applied Biotechnology 3:185-192.
Scapim, C.A., V.R. Oliveira, A. Braccini, C.D. Cruz, C. Andrade, and M. Vidigal. 2000. Yield
variability in maize (Zea mays L) and correlations among the parameters of the Eberhart
and Russell, Lin and Binns and Huehn models. Genetics and Molecular Biology 23:287-
393.
Setimela, P.S., B. Viveka, M. Ba¨nziger, J. Crossa, and F. Maideni. 2007. Evaluation of early to
medium maturing open pollinated maize varieties in SADC region using GGE biplot
based on the SREG model. Field Crops Research 103:161–169.
Sibiya, J., P. Tongoona, J. Derera, and N. Rij. 2012. Genetic analysis and genotype by
environment (GXE) for gray leaf spot disease resistance in elite African maize (Zea mais
L.) germplasm. Euphytica 185:349-362.
Singano, C.D., B.T. Nkhata, and V.Mhango. 2009. National annual report on larger grain borer
monitoring and Teretrius Nigrescens rearing and releases in Malawi.
Tefera, Tadele, Stephen Mugo, Regina Tende and Paddy Likhayo. 2010. Mass rearing of stem
borers, maize weevil, and larger grain borer insect pests of maize. CIMMYT: Nairobi,
Kenya.
Tefera, T., S. Mugo, and P. Likhayo. 2011. Effects of insect population density and storage time
on grain damage and weight loss in maize due to the maize weevil (Sitophilus zeamais)
and the larger grain borer, Prostephanus truncatus. African Journal of Agricultural
Research 6:2249-2254.
Tefera, T., S. Mugo, and P. Likhayo, and Y. Beyene. 2011. Resistance of three-way cross
experimental maize hybrids to post-harvest insect pests, the larger grain borer,
Prostephanus truncatus and maize weevil, Sitophilus zeamais. International Journal of
Tropical Insect Science 31:3-12.
Tefera, T., G. Demissie, S.Mugo, and Y. Beyene. 2012. Yield and agronomic perfomance of
maize hybrids resistant to the maize weevil, Sitophilus zeamais Motschulsky,
(Coleopterai Curculionidae) Crop protection 46:94-99.
Yan, W., and L.A. Hunt. 1998. Genotype by environment interaction and crop yield. Plant
Breeding Reviews 16.

179
Yan, W., and M.S. Kang. 2003. GGE Biplot Analysis: A Graphical tool for breeders, geneticists
and agronomists. CRC Press, Boca Raton, Florida.

180
Chapter 6
Combining ability for grain yield and resistance among maize weevil and
larger grain borer resistant maize lines
Abstract
Identification of maize lines with good combining ability for yield and resistance is central in the
development of acceptable insect resistant maize varieties by farmers in Malawi. Determination
of the nature of gene action would help in devising breeding strategy for the development of
maize varieties with yield superiority and useful levels of resistance. Single cross F1 hybrids
were developed from maize weevil and larger grain borer resistant lines using North Carolina
Design II. The objectives of the study were to estimate general combining ability (GCA) and
specific combining ability (SCA) between maize lines and their hybrids for grain yield and
resistance to maize weevil and larger grain borer. Significant GCA (p<0.01) and highly
significant SCA (P<0.001) were obtained for weevil resistance. Additive and non-additive gene
actions were responsible for determining weevil resistance in the maize hybrids. Parental lines
CL106940 and CL106674 showed good combining ability for resistance as male and female,
respectively. A cross between CL106675 and CL1012151 showed good specific combining
ability for resistance. Significant GCA (p<0.05) was observed for grain yield, indicative of
additive gene action being responsible for grain yield in the maize hybrids. Maize line CL106940
had good general combining for both yield and resistance. For larger grain borer, GCA was
highly significant (p<0.001) for both resistance and grain yield suggesting that additive gene
actions were responsible for both resistance and grain yield in the maize hybrids. Maize lines
CKSPL10218 and CKSPL10007 showed good combining ability for resistance as male and
female parents, respectively. Maize lines CKSPL10074 and CKSPL10088 showed good GCA
for yield as male and female parents, respectively. The preponderance of additive gene effects
over dominance gene effects in the maize hybrids gives a practical option for selecting for both
resistance and grain yield.
Key words: GCA, grain yield, insect resistance, larger grain borer, maize weevil, design II
mating scheme, SCA

181
6.1 Introduction
Maize cultivation in Malawi is faced by a number of constraints that adversely affect
sustainability of high levels of maize production in the country (Denning et al., 2009). Like most
of the Eastern and Southern African countries, drought, low soil fertility and climate change are
the most important stress factors affecting maize production in Malawi (Zambezi, 1993;
Bänziger and Diallo, 2001; FAOSTAT, 2008). Apart from these stress factors, maize yields in
the country are further reduced by post-harvest losses due to maize weevil and larger grain
borer in storage facilities (Makoka, 2008; Singano et al., 2009; Kamanula et al., 2011).
Development of insect resistant maize varieties is crucial in reducing posts-harvest losses of
maize grain in storage. Selection of maize lines with good combining ability for yield and
resistance is central in the development of insect resistant maize varieties with yield superiority
that can easily be accepted by farmers. For instance, the success in breeding for higher yielding
maize varieties depends on the ability to select maize lines with good combining ability for yield,
resulting in the development of superior varieties (Sleeper and Poehlman, 2006; Brown and
Caligari, 2008; Balestre et al., 2009).
The type of combining ability (general/specific) identified in potential crosses indicates the
nature of gene action. General combining ability (GCA) is an average performance of a line in
all its crosses expressed as a deviation from the mean of all crosses. GCA points to additive
gene effects (Falconer and Mackay, 1996). Specific combining ability (SCA) implies any
deviation from the sum of the general combining ability of two parental lines. SCA provides non-
additive gene effects (Falconer and Mackay, 1996). However, significant SCA in some cases
points to the presence of additive and dominance gene actions, in such cases, the ratio of GCA
to SCA greater than 1 is indicative of preponderance of additive gene action over non-additive
gene action (Falconer and Mackay, 1996; Muraya et al., 2006).
The success in selecting for combining abilities depends on availability of variation within the
breeding germplasm. From variation and statistical perspective, the variance of GCA is
equivalent to additive variance, while the variance for SCA specifies non-additive variance
(Falconer and Mackay, 1996). Estimation of genetic variances is possible through the use of
mating designs. Mating designs provide information for the determination of general and specific
combining ability, consequently the nature of gene actions (Bridgewater, 1992; Durel, 1998).

182
Hierarchical, diallel and factorial (North Carolina II) designs are some of the commonly used
mating designs in plant breeding (Pepper, 1983). For example, North Carolina design II (NC
Design II) gives two independent estimates of GCA with expected mean squares for males and
females giving GCA and the interaction between females and males providing SCA (Hallauer et
al., 2010).
Studies have been conducted to determine combining abilities of different traits in maize. Malik
et al. (2004) determined combining abilities for days to pollen shade, plant height, ear size, leaf
area, ear weight, kernel rows and grain yield in maize inbred lines within temperate, subtropical
and tropical environments. Combining ability and nature of gene action for maize weevil
resistance have been explored and reported. Derera et al. (2000) reported significant maternal
effects, significant GCA and SCA in determining susceptibility index, weevil emergency and
grain weight loss in maize. Additive gene action, dominance gene action and maternal effects
were important in maize weevil resistance. Kim and Kossou (2003) evaluated maize cultivars
and crosses between inbred lines, the results showed significant general combining ability and
specific combining ability. Both additive and non-additive gene actions contributed significantly
to maize weevil resistance. Significant general and specific combining abilities were also
reported among lines and hybrids for grain weight loss and emerged F1 weevils in maize (Dari et
al., 2010). Derera et al. (2000) successfully estimated GCA and SCA for weevil resistance using
NC design II.
Importantly, not much is documented about the nature of gene action for resistance against
larger grain borer. Very little has been done in breeding programmes to exploit genetic variation
in maize weevil germplasm for development of maize weevil resistant materials (Dhliwayo and
Pixley, 2003). Identification of maize lines with good combining ability for yield and resistance is
crucial in the development of insect resistant maize varieties in Malawi. The nature of gene
action would help in devising breeding strategy for the advancement of maize varieties with
yield superiority and high levels of resistance to maize weevil and larger grain borer.
6.2 Study objectives
The objectives of the study were:
1. To estimate general combining ability (GCA) and specific combining ability (SCA)
between maize inbred lines for resistance to maize weevil and larger grain borer.

183
2. To estimate general combining ability (GCA) and specific combining ability (SCA)
between maize lines for grain yield.
6.3 Materials and Methods
6.3.1 Collection of materials
A total of 20 maize breeding lines were collected from CIMMYT-Kenya and CIMMYT-Zimbabwe.
Maize lines from Kenya and Zimbabwe were known to have useful resistance against larger
grain borer and maize weevil, respectively (Table 6.1). Set B (MW x MW) was comprised of
crosses between maize weevil resistant lines while Set D ( LGB X LGB) was made up of
crosses between LGB resistant lines.
Table 6.1: Breeding lines for combining ability analysis for yield and insect resistance
Set B (MW x MW)
Set D (LGB x LGB)
Maize weevil resistant lines
Larger grain borer resistant lines
Maize line Source Role Maize line Source Role
CL106513 CIMMYT-Zimbabwe Female
CKSPL10088 CIMMYT-Kenya Female
CL106674 CIMMYT-Zimbabwe Female
CKSPL10087 CIMMYT-Kenya Female
CL1012151 CIMMYT-Zimbabwe Female
CKSPL10021 CIMMYT-Kenya Female
VL081446 CIMMYT-Zimbabwe Female
CKSPL10089 CIMMYT-Kenya Female
CL106511 CIMMYT-Zimbabwe Female
CKSPL10007 CIMMYT-Kenya Female
CL106675 CIMMYT-Zimbabwe Male
CKSPL10264 CIMMYT-Kenya Male
CL106937 CIMMYT-Zimbabwe Male
CKSPL10164 CIMMYT-Kenya Male
CL106939 CIMMYT-Zimbabwe Male
CKSPL10218 CIMMYT-Kenya Male
CL106940 CIMMYT-Zimbabwe Male
CKSPL10176 CIMMYT-Kenya Male
CL106506 CIMMYT-Zimbabwe Male CKSPL10074 CIMMYT-Kenya Male
6.3.2 Planting of breeding lines
Maize lines were planted in pots filled with loam soil mixed with organic manure at Chitedze
Research Station during the 2011/2012 growing season. The pots were 24 cm in diameter and
28 cm high. Two seeds were planted in each pot. Basal application of fertilizer was done using

184
NPK (23:21:0 +4S) and top dressing was done using Urea (46% N) at the rate of 5g/pot. Weeds
were removed from the pots each time they appear. Insecticide ‘karate’ (lambda-cyhalothrin)
was applied to the soil to control termites.
6.3.3 Generation of crosses
Crosses were generated in each set of breeding lines (maize weevil lines and larger grain borer
lines) using North Carolina Design II crossing scheme (Figure 6.1).
Females
Males 1 2 3 4 5
7 1x7 2x7 3x7 4x7 5x7
8 1x8 2x8 3x8 4x8 5x8
9 1x9 2x9 3x9 4x9 5x9
10 1x10 2x10 3x10 4x10 5x10
11 1x11 2x11 3x11 4x11 5x11
Figure 6.1: North Carolina Design II crossing scheme
For maize weevil, 16 crosses were generated for combining ability analysis for yield and 25
crosses for resistance. For larger grain borer, 16 crosses were generated for combining ability
analysis for resistance and 25 crosses for yield. At maturity, cobs were harvested and sundried
in readiness for field planting during the 2012/2013 growing season.
6.3.4 Planting of crosses
F1 hybrids were planted at Kandiani Irrigation Scheme during the 2012/2013 growing season.
Hybrids were arranged using alpha lattice design (6 blocks each with 6 or 7 entries) in 2
replications. Each plot was 6 m long. One seed was planted per planting station with 25 cm
spacing between plants and 75 cm between rows. A commercial maize hybrid “Kanyani” was
used as guard rows. Full-sib mating was employed for each cross. Basal application of fertilizer
NPK (23:21:0 +4S) and top dressing using Urea (46% N) was done at the rate of 100kg/ha. The
field was weeded thrice and insecticides “karate” (lambda-cyhalothrin) was applied to control
termites. At maturity, cobs were harvested and dried ready for yield assessment and resistance
screening at Chitedze Research Station (crop storage laboratory).

185
6.3.5 Resistance screening for maize weevil and LGB resistance using F2
grain
6.3.5.1 Rearing of larger grain borer and maize weevil
The rearing of LGB and maize was done at Chitedze Research Station (crop storage facilities)
according to the procedures outlined by CIMMYT (Tefera et al., 2010). Unsexed pests were
reared in a controlled environment at 28± 1oC, 65±5% RH, with a 12h: 12h light: dark regime to
minimize fluctuations in temperature and relative humidity and promote insect survival (Haines,
1991). The LGB and maize weevils were cultured on susceptible mixed maize grains in sealed
but ventilated glass jars. All precautionary measures were taken to exclude other insects from
contaminating the cultures. Maize varieties were evaluated for maize weevil and LGB resistance
under lab conditions using four replications in a Complete Randomised Block Design (CRBD).
About 1 kg maize grains from each variety were collected for testing. Grains were fumigated
with phostoxin (Aluminum Phosphide) tablets for seven days to avoid carry over insects from
the field at the rate of 1.5g of phostoxin (3 tablets) per 1 m3 of maize grain. One hundred (100)
grams of grain were sampled from each of the 1 kg maize grains and placed into jars. 50
unsexed adult beetles (7- 15 days old) were infested on 100 g of grain and kept inside 250 ml
plastic jars for maize weevil and in 400 ml glass jars for LGB. Percent grain damage was used
as indicator susceptibility in the study. Percent grain damage as a parameter for resistance has
consistently shown strong correlations with other resistance parameters such as percent grain
weight loss. In addition, grain damage is an indicator that farmers use to determine susceptibility
of maize varieties to storage pests.
6.3.5.2 Data collected
After 100 days, data on a number of resistance parameters were collected such as number of
live and dead insects, total number of insects, damaged and undamaged grains based on 100
grains randomly selected from each jar.
Yield data (grain weights) collection was based on whole plot. Data on grain weights and
percent grain damage was analysed for combining ability using SAS (2001). The following
statistical model was used to determine general and specific combining ability for both yield and
resistance in one environment (Comstock and Robinson, 1948) as follows:

186
Yijk = µ + rk+ gi + gj + hij+eijk
Yijk = Observed performance of the ith female parent, the jth male parent, in kth replication
µ= grand mean
rk = replication effect
gi = the GCA effect of the ith female parent
gj = the GCA effect of the jth male parent
hij = the SCA effect specific to a cross between ith female parent and jth male parent
eijk= random error for Yijk observation
Broad sense heritability was calculated based on Analysis of Variance as follows:
=
Genotype (crosses) mean sum of square
Error mean sum of square
r = Replication
6.4 Results
6.4.1 SET B: Combining ability analysis for resistance and grain yield
among maize weevil resistant lines
6.4.1.1 Analysis of Variance for grain damage (%)
Significant differences for effects on grain damage (%) were observed for crosses, males, and
interaction between males and females, while female effects did not significantly affect grain
damage (%) (Table 6.2).

187
Table 6.2: Analysis of variance for grain damage (%) among maize weevil lines
Source of variation df ss ms Pr>f
Replications 3 27.76 9.253 0.6047
Crosses 24 1137.06 47.378** 0.001
Males 4 267.06 66.765* 0.0028
Females 4 34.96 8.74 0.6745
Males x Females 16 835.04 52.19** 0.001
Residual 72 1075.74 14.941
*Significant at p<0.01, **significant at p<0.001
H2 = 0.93
The best GCA estimate for resistance among males was from parent CL106940, while the best
GCA estimate among females was from parent CL106674. The contribution of male effects on
grain resistance was at 23.49%, female effects (3.10%) and effects from the interaction between
males and females were at 73.44% (Table 6.3)
Table 6.3: Estimates for GCA for maize weevil resistance among maize weevil lines
Maize line Parental role GCA
CL106513 Female 0.42
CL106674 Female -1.08
CL1012151 Female 0.62
VL081446 Female -0.08
CL106511 Female 0.12
CL106675 Male 3.12
CL106937 Male -0.23
CL106939 Male -0.98
CL106940 Male -1.58
CL106506 Male -0.33
Male Effects 23.49%
Female effects 3.10%
Males x Females effects 73.44%
Additive genetic variance (F=1) -0.18
Dominance genetic variance (F=1) 9.312

188
The best estimate for specific combining ability for resistance was from a cross between parent
CL106675 and parent CL1012151 (-5.12) (Table 6.4).
Table 6.4: Estimates for SCA for maize weevil resistance
Females
Males CL106513 CL106674 CL1012151 VL081446 CL106511
CL106675 1.08 1.58 -5.12 1.08 1.38
CL106937 -3.07 -2.07 7.73 -2.57 -0.02
CL106939 0.68 4.18 -2.77 -1.32 -0.77
CL106940 -1.22
4.33 -0.97 -0.92
CL106506 2.53 3.78 0.33
6.4.1.2 Analysis of Variance for grain yield
Significant differences (p<0.05) were observed for male effects on yield among maize lines. No
significant effects on grain yield were observed for crosses, females, and the interaction
between males and females (Table 6.5).
Table 6.5: Analysis of variance for grain yield among maize weevil lines
Source of variation df SS MS Pr>F
Replications 1 0.911 0.911 0.1042
Crosses 15 9.319 0.621 0.0895
Males 3 3.134 1.045* 0.0444
Females 3 1.696 0.565 0.1804
Males x Females 9 4.489 0.499 0.1914
Residual 15 4.569 0.305
*Significant at p<0.05
H2 = 0.80
The best estimate for general combining ability for grain yield among males was from parent
CL106940. Though effects of females on yield were not significant, female parent VL081446
had a better GCA estimate for yield. Males contributed 33.63% of the effects, females (18.20%)
and contribution from the interaction between males and females was 48.17% (Table 6.6).

189
Table 6.6: Estimates for GCA for grain yield among maize weevil lines
Maize line Parental role GCA
CL106674 Female -0.3313
CL1012151 Female -0.0688
VL081446 Female 0.2938
CL106511 Female 0.1063
CL106675 Male -0.2063
CL106937 Male 0.1688
CL106939 Male -0.3813
CL106940 Male 0.4188
Male Effects 33.63%
Female effects 18.20%
Males x Females effects 48.17%
Additive genetic variance (F=1) 0.013
Dominance genetic variance (F=1) 0.097
Although not significantly different in the overall analysis, estimates for specific combining ability
showed that the interaction between CL106937 and CL1012151 had a better SCA for grain yield
(Table 6.7).
Table 6.7: Estimates for SCA for grain yield among maize weevil lines
Females
Males CL106674 CL1012151 VL081446 CL106511
CL106675 0.14375 0.38125 -0.23125 -0.29375
CL106937 -0.48125 0.75625 -0.10625 -0.16875
CL106939 0.31875 -0.39375 -0.05625 0.13125
CL106940 0.01875 -0.74375 0.39375 0.33125
6.4.1.3 Comparison of GCAs for resistance and grain yield among maize
lines
Focusing on both GCAs for resistance and grain yield, the results showed that male parent
CL106940 had good combining ability for both grain yield and resistance (Table 6.8).

190
Table 6.8: GCAs for both yield and resistance among maize weevil lines
Weevil resistance Grain yield
Line Parental role GCA GCA
CL106513 Female 0.42
CL106674 Female -1.08 -0.331
CL1012151 Female 0.62 -0.069
VL081446 Female -0.08 0.2938
CL106511 Female 0.12 0.1063
CL106675 Male 3.12 -0.206
CL106937 Male -0.23 0.1688
CL106939 Male -0.98 -0.381
CL106940 Male -1.58 0.419
CL106506 Male -0.33
6.4.2 SET D: Combining ability analysis for resistance and grain yield
among larger grain borer resistant lines
6.4.2.1 Grain resistance
Highly significant differences (p<0.001) were observed for effects of crosses and females on
grain damage (%) among the maize lines. Male effects and the interaction between males and
females had no significant effects on grain damage (%) (Table 6.9).
Table 6.9: Analysis of Variance for grain damage (%) among LGB lines
Source of variation df SS MS Pr>F
Replications 3 25.63 8.54 0.382
Crosses 15 490.5 32.7* 0.0002
Males 3 60.38 20.13 0.0747
Females 3 334.75 111.58* 0.0001
Males X Females 9 95.38 10.6 0.2656
Residual 45 367.89 8.18
*significant at p<0.001
H2 = 0.94
The best estimates for GCA were observed in male parent CKSPL10218 and female parent
CKSPL10087. The results further revealed that males contributed 12.31% effects on resistance,
females (68.25%), and the interaction between males and females contribution on effects was
at 19.44% (Table 6.10).

191
Table 6.10: Estimates for GCA for LGB resistance
Maize line Parental role GCA
CKSPL10088 Female -0.4375 CKSPL10087 Female -2.1875 CKSPL10021 Female 3.8125 CKSPL10007 Female -1.1875 CKSPL10264 Male 1.375 CKSPL10164 Male 0.4375 CKSPL10218 Male -1.0625 CKSPL10176 Male -0.75
Male effects 12.31% Female effects 68.25%
Male x Female effects 19.44% Additive genetic variance (F=1) 1.151 Dominance genetic variance (F =1) 0.606
Though the interaction between males and females were not significant, in the overall analysis,
the cross between CKSPL10007 and CKSPL10164 produced a better estimate for specific
combining ability for LGB resistance (Table 6.11).
Table 6.11: Estimates for SCA for LGB resistance
Males
Females CKSPL10264 CKSPL10164 CKSPL10218 CKSPL10176
CKSPL10088 -1.1875 2 -0.75 -0.0625
CKSPL10087 -1.6875 -1 1 1.6875
CKSPL10021 1.0625 0.75 -0.5 -1.3125
CKSPL10007 1.8125 -1.75 0.25 -0.3125
6.4.2.2 Grain yield
Significant differences for effects on grain yield were observed for replications, treatments,
crosses, male and female parents. However, effects from the interaction between males and
females were not significant (Table 6.12)

192
Table 6.12: Analysis of variance for grain yield among LGB maize lines
Source of variation df ss ms Pr>F
Replications 1 1.095 1.095* 0.0063
Crosses 24 8.979 0.374* 0.0041
Males 4 3.795 0.949** 0.0004
Females 4 2.725 0.681* 0.0026
Males x Females 16 2.459 0.154 0.2986
Residual 24 2.935 0.122
*significant at p<0.01, **significant at p<0.001
H2 = 0.86
Estimates of GCA for grain yield showed that male parent CKSPL10074 had a good GCA for
grain yield, while female parent CKSPL10088 had good GCA for grain yield. Male effects on
grain yield were 42.26%, female effects (30.35%) and the interaction between males and
females contributed 27.39% of the effects in the hybrid (Table 6.13).
Table 6.13: Estimates for GCA for grain yield among LGB maize lines
Line Parental role GCA
CKSPL10088 Female 0.368
CKSPL10087 Female 0.068
CKSPL10021 Female -0.272
CKSPL10089 Female -0.232
CKSPL10007 Female 0.068
CKSPL10264 Male 0.168
CKSPL10164 Male -0.382
CKSPL10218 Male -0.032
CKSPL10176 Male -0.172
CKSPL10074 Male 0.418
Male effects 42.26 Female effects 30.35
Male x Female effects 27.39
Additive genetic variance (F=1) 0.017
Dominance genetic variance (F =1) 0.016
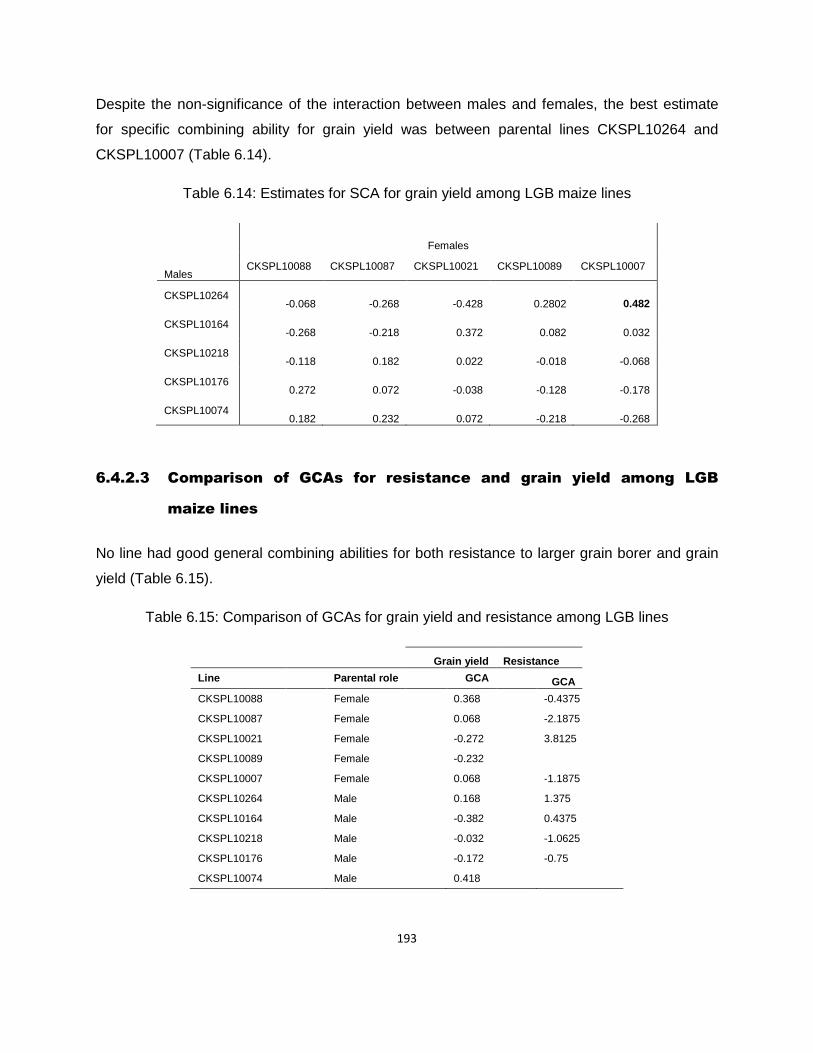
193
Despite the non-significance of the interaction between males and females, the best estimate
for specific combining ability for grain yield was between parental lines CKSPL10264 and
CKSPL10007 (Table 6.14).
Table 6.14: Estimates for SCA for grain yield among LGB maize lines
Females
Males CKSPL10088 CKSPL10087 CKSPL10021 CKSPL10089 CKSPL10007
CKSPL10264 -0.068 -0.268 -0.428 0.2802 0.482
CKSPL10164 -0.268 -0.218 0.372 0.082 0.032
CKSPL10218 -0.118 0.182 0.022 -0.018 -0.068
CKSPL10176 0.272 0.072 -0.038 -0.128 -0.178
CKSPL10074 0.182 0.232 0.072 -0.218 -0.268
6.4.2.3 Comparison of GCAs for resistance and grain yield among LGB
maize lines
No line had good general combining abilities for both resistance to larger grain borer and grain
yield (Table 6.15).
Table 6.15: Comparison of GCAs for grain yield and resistance among LGB lines
Grain yield Resistance
Line Parental role GCA GCA
CKSPL10088 Female 0.368 -0.4375
CKSPL10087 Female 0.068 -2.1875
CKSPL10021 Female -0.272 3.8125
CKSPL10089 Female -0.232
CKSPL10007 Female 0.068 -1.1875
CKSPL10264 Male 0.168 1.375
CKSPL10164 Male -0.382 0.4375
CKSPL10218 Male -0.032 -1.0625
CKSPL10176 Male -0.172 -0.75
CKSPL10074 Male 0.418

194
6.5 Discussion
6.5.1 Gene action controlling grain resistance and grain yield in maize
weevil resistant maize hybrids
General combining ability (GCA) and Specific combining ability (SCA) effects were significant
for maize weevil resistance. The significance of both GCA and SCA demonstrated that both
additive gene action and non-additive gene actions were responsible for determining weevil
resistance in maize hybrids (Falconer and Mackay, 1996; Muraya et al., 2006). The mean sum
of square for males was found to be significant, while the mean sum of square for females was
not significant. In addition, males contributed more effects (23.49%) on resistance than females
(3.07%). Hence, male effects were more dominant than female effects in determining resistance
among the maize hybrids. The results further showed that grain damage as a parameter for
maize weevil resistance was highly heritable (0.93). As such it can be used in selection of
materials to improve weevil resistance. The results from a study by Kim and Kossou (2003) on
maize cultivars and crosses between inbred lines showed that both additive and non-additive
gene actions contributed significantly to maize weevil resistance among the genotypes. Dari et
al. (2010) also reported the significance of both general combining ability, and specific
combining ability among lines and hybrids for grain resistance using weight loss and emerged
F1 weevils. However, Dhliwayo and Pixley (2003) reported the significance of only additive gene
action in determining weevil resistance. Derera et al. (2000) demonstrated that additive gene
action, dominance gene action and maternal effects were responsible for weevil resistance in
maize germplasm. Dhliwayo et al. (2005) studying 14 Southern African maize inbred lines
reported that additive gene action only was responsible for weevil resistance. Nonetheless, the
present study had shown that additive gene effects, non–additive gene effects, and male effects
affected maize weevil resistance among maize hybrids
The significance of general combining ability in determining grain yield among maize hybrids
was an indication that additive gene action significantly determined grain yield in maize weevil
resistant hybrids. Males contributed more effects (33.63%) than females (18.20%). This was
also confirmed by the significance of mean sum of square for males and non-significance of
mean sum of square for females. In this regard, males were predominant in their effects on
grain yield than females. The heritability value was for grain yield was at 0.80. The heritability

195
value was slightly lower can partly due to environmental effects (Chapter 5). This means that
yield can be improved upon among maize weevil varieties through selection. Of interest was
male parent CL106940 which had good combining ability for both grain yield and resistance.
This parent would be an ideal candidate for developing maize weevil resistant hybrids with high
yield potential. Kanyamasoro et al. (2010) reported the significance of additive and non-additive
effects in determine grain yield in maize inbred lines. The nature of gene action controlling grain
yield in general has been reported. Singh (2010) reported the significance of SCA in
determining grain yield in short duration maize. Santos et al. (2007) reported that both SCA and
GCA were responsible for grain yield in maize populations. Derera et al. (2007) and Musila et al.
(2010) reported that only additive gene action was responsible for grain yield.
6.5.2 Gene action controlling grain resistance and grain yield in larger
grain borer resistant maize hybrids
The significance of GCA for grain resistance demonstrated that additive gene action was
responsible for determining grain resistance to larger grain borer among the maize hybrids.
Females contributed more effects to resistance (68.25%) than males (12.31%). Furthermore,
females mean sum of square was significant, while mean sum of square for males was not
significant. It is therefore conclusive that female effects played a significant role in determining
larger grain borer resistance. At the moment, there are no published reports on gene action
responsible for larger grain borer resistance. However, in the previous study (Chapter 6) and
reports by Tefera et al. (2011) revealed the existence of maize hybrids conferring resistance to
both LGB and MW. It was construed that same genes confer resistance to both maize weevil
and larger grain borer (Tefera et al., 2011). Based on the premise that genes conferring
resistance to maize weevil are the same genes providing resistance to larger grain borer and on
the evidence from the current study that additive gene actions are responsible for maize weevil
resistance. It can therefore be concluded that additive gene action is largely responsible for
determining larger grain borer resistance. The higher heritability value of 0.94 for percent grain
damage means that the resistance parameter is highly heritable. Therefore selection can easily
be applied in developing larger grain borer resistant maize germplasm.
Additive gene effects were responsible in determining grain yield. Both male effects (42.26%)
and female effects (30.35%) significantly contributed to grain yield. In addition, maize hybrids
showed high broad sense heritability (0.86) for grain yield. At present there are no published

196
reports on gene action responsible for grain yield, specifically for larger grain borer resistant
maize hybrids. However, studies on gene effects on grain yield suggest that mainly GCA and
partly SCA are responsible for determining grain yield (Derera et al., 2007; Santos et al., 2007;
Musila et al., 2010; Singh, 2010)
6.6 Conclusion
Both additive and non-additive gene action were responsible for determining weevil resistance
in the maize hybrids, while only additive gene action was responsible for determining grain yield.
For larger grain borer, both resistance and grain yield were determined by additive gene action.
Maize lines with significant GCA, especially for resistance should be crossed with adapted
Malawi lines to develop varieties with both yield superiority and insect resistance. The
preponderance of additive gene effects over non-additive effects suggests that selection is
possible for both resistance and grain yield among maize germplasm. The male parent
CL106940 showed good combining ability for both grain yield and weevil resistance. This parent
would be useful as a male parent in breeding maize hybrids for both maize weevil resistance
and grain yield. It is therefore concluded that LGB and MW resistant maize lines have good
combining ability for resistance and grain yield which can be exploited in developing hybrids and
synthetic populations. Additive gene effects are responsible for controlling resistance to LGB
and MW in maize germplasm, suggesting that selection can be used to enhance the resistance.
References
Balestre, M., R.G.V. Pinho, J.C. Souza, and R.L. Oliveira. 2009. Genotypic stability and
adaptability in tropical maize based on AMMI and GGE biplot analysis. Genetics and
Molecular Research 8:1311-1322.
Banziger, M., and A.O. Diallo. 2001. Progress in developing drought and N stress torelant maize
cultivars for Eastern and Southern Africa. p. 189-194. Seventh Eastern and Southern
Africa Regional Maize Conference.
Bridgewater, F. 1992. Mating designs. p. 69-93. In L. Fins, et al. (ed.) Handbook of quantitative
forest genetics. Kluwer Academic publishers.
Brown, J., and, P. Calagari. 2008. Introduction to plant breeding. Blackwell publishing limited,
9600, Garsington road, Oxford, OX42DQ, United Kingdom.

197
Comstock, R.E., and H.F. Robinson. 1948. The components of genetic variance in populations
of biparental progenies and their use in estimating the average degree of dominance.
Biometrics 4:254-266.
Dari, S., K.V. Pixley, and P. Setimela. 2010. Resistance of early generation maize inbred lines
and their hybrids to maize weevil, Sitophilus zeamais (Motschulsky). Crop Science
50:1310–1317.
Denning, G., P. Kabambe, P. Sanchez, A. Malik, and R. Flor. 2009. Input subsidies to improve
smallholder maize productivity in Malawi: Towards an African green revolution. Public
Library of Science Biology 7(1): e1000023.doi:10.1371/journal.pbio.1000023. Available at
http://www.plosbiology.org. Accessed on 30 June 2010. Public Library of Science, USA.
Derera, J., K.V. Pixley, and P. D. Giga. 2000. Resistance of maize to the maize weevil: I.
Antibiosis. African Crop Science Journal 9:431-440.
Derera, J., P. Tongoona, B. Vivec, and M.Laing. 2007. Gene action controlling grain yield and
secondary traits in Southern African maize hybrids under drought and non-drought
environments. Euphytica 162:411-422.
Dhliwayo, T., and K.V. Pixley. 2003. Divergent selection for resistance to maize weevil in six
maize populations. Crop Science 43:2043–2049.
Dhliwayo, T., K. Pixley, and V. Kazembe. 2005. Combining ability for resistance to maize wevil
among 14 Southern African maize inbred lines. Crop Science 45:662-667.
Durel, C.E., F. Laurens, A. Fouillet, and Y. Lespinasse. 1998. Utilization of pedigree information
to estimate genetic parameters from large unbalanced data sets in apple. Theoretical and
Applied Genetics 96:1077.
Falconer, D.S., and F.C. Mackay. 1996. Introduction to quantitative genetics. Longman Group
Limited, New York.
FAOSTAT. 2008. Food and Agriculture Organisation. Available at http://faostat.fao.org.
Accessed on 3 July 2010. FAO, Rome.
Haines, C.P. 1991. Insects and arachnids of tropical stored products: their biology and
identification–A training manual. Natural Resources Institute (NRI).
Hallauer, A., C.J. Marcelo, and M.B. Filho. 2010. Quantitative genetics in maize breeding. Hand
book of plant breeding. Springer Science and Business Media, New York.

198
Kamanula, J., G.W. Sileshi, S.R. Belmain, P. Sola, B.M. Mvumi, G.K.C. Nyirenda, S.P.
Nyirenda, and P.C. Stevenson. 2011. Farmers’ insect pest management practices and
pesticidal plant use in the protection of stored maize and beans in Southern Africa.
International Journal of Pest Management 57:41–49.
Kanyamasoro, M.G., J. Karungi, and G. Asea. 2010. Determination of the heterotic groups of
maize inbred lines and the inheritance of their resistance to the maize weevil. African
Crop Science Journal 20:99-104.
Kim, S.K., and D.K. Kossou. 2003. Responses and genetics of maize germplasm resistant to
the maize weevil, Sitophilus zeamais (Motschulsky) in West Africa. Journal of Stored
Products Research 39:489–505.
Makoka, D. 2008. The Impact of drought on household vulnerability: The case of rural Malawi.
2008 United Nations University (UNU-EHS) Summer Academy on “Environmental
Change, Migration and Social Vulnerability”. Bonn, Germany.
Malik, S.I., H.N. Malik, N.M. Minhas, and M.Munir. 2004. General and specific combining ability
studies in maize diallel crosses. International Journal of Agriculture and Biology 6 (5)
856-859. Available at http://www.ijab.org. Accessed on 18 August 2014.
Muraya, M.M., C.M. Ndirangu, and E. O. Omolo. 2006. Heterosis and combining ability in diallel
crosses involving maize (Zea mays L.) S1 lines. Australian Journal of Experimental
Agriculture 46:387–394.
Musila, R.N., Alpha O. Diallo, Dan Makumbi, and Kiarie Njoroge. 2010. Combining ability of
early-maturing quality protein maize inbred lines adapted to East Africa. Field Crops
Research 119:231–237.
Pepper, W.D. 1983. Choosing plant-mating design allocations to estimate genetic variance
components in the absence of prior knowledge of the relative magnitudes. Biometrics
39:511-521.
Santos, M.F., T.M. Câmara, G.V. Moro, E.F.N. Costa, and C. Lopes De Souza Jr. 2007.
Responses to selection and changes in combining ability after three cycles of a
modified reciprocal recurrent selection in maize. Euphytica 157:185-194.
SAS Institute. 2001. SAS for Windows. Proprietary software. SAS Institute Incorporation, USA.
Singano, C.D., B.T. Nkhata, and V.Mhango. 2009. National annual report on larger grain borer
monitoring and Teretrius Nigrescens rearing and releases in Malawi.

199
Singh, Pooja Devi N.K. 2010. Heterosis, molecular diversity, combining ability and their
interrelationships in short duration maize (Zea mays L.) across the environments.
Euphytica 178:71-81.
Sleeper, D.A., and J.Poehlman. 2006. Breeding field crops. Blackwell publishing limited, 9600,
Garsington road, Oxford, United Kingdom.
Tefera, Tadele, Stephen Mugo, Regina Tende and Paddy Likhayo. 2010. Mass rearing of stem
borers, maize weevil, and larger grain borer insect pests of maize. CIMMYT: Nairobi,
Kenya.
Tefera, T., S. Mugo, and P. Likhayo. 2011. Effects of insect population density and storage time
on grain damage and weight loss in maize due to the maize weevil, Sitophilus zeamais
and the larger grainborer, Prostephanus truncatus. African Journal of Agricultural
Research 6:2249-2254.
Zambezi, B.T., 1993. Closing the maize yield gap. p. 37-155. In D.C. Munthali, J.T Munthali, F.
Kisyombe (ed.) Proceedings of the Conference on Agricultural Research for
Development. Ministry of Agriculture, University of Malawi, Zomba.
200
Chapter 7
General overview
7.1 Introduction
This chapter provides a synopsis of the study on “Diversity analysis and breeding for maize
weevil and larger grain borer resistance in productive germplasm in Malawi.” The synopsis
details the main objectives of the study, major findings, challenges, breeding implications and
recommendations for future maize breeding activities for larger grain borer and maize weevil
resistance in Malawi.
7.2 Main objectives
The study was conducted to achieve 5 objectives as outlined in chapter 1, section 9.
7.3. Major findings
7.3.1. Farmers’ perceptions on yield, maize production constraints and storability of
local maize varieties
a. Farmers continue to grow both hybrids and local varieties on their farms. Hybrids are
mainly grown because of their high yield potential and early maturity than landraces,
while local varieties are grown due to good tolerance to pests and diseases, large grain
size, good yields under low fertility, white colour, superior poundability, drought tolerance
and high storability than hybrids.
b. Major maize production constraints were lack of fertilizer, low soil fertility, pests, lack of
high quality seeds, and drought.
c. Yield is the single most important factor for selecting varieties for planting, however, if
highly susceptible to storage pests, farmers may opt for another variety.
d. Larger grain borer and maize weevil were the most important and common storage
pests of maize among the farmers.
e. Farmers are aware of differences in variety resistance to larger grain borer and maize
weevil.

201
f. Grain hardness, grain size, grain colour, poundability and grain texture were the main
characteristics farmers use to identify maize varieties that are tolerant to maize weevil
and larger grain borer.
g. Farmers practice integrated pest management to control storage pests, as such host
resistance can easily be integrated in the farmers’ IPM strategies.
h. Farmers use many traits when selecting varieties for planting. Therefore, breeding for
new hybrids and local varieties should include as many traits as practically possible to
meet the needs of farmers.
7.3.2 Genetic marker diversity of the potential breeding sources for use in introgressing
larger grain borer and maize weevil resistance genes in farmer-preferred local
varieties
a. Based on phenotypic data, local maize varieties in Malawi are highly diverse.
b. Phenological differences among the varieties were mainly due to differences in plant
height, ear placement, kernel weight, days to tasselling and days to silking.
c. Phenotypic data produced 8 local maize clusters.
d. Gene diversity exists among local maize varieties. The SSR markers exhibited 97.56%
polymorphism, gene diversity of 0.5115, and heterozygosity of 0.5233.
e. A total of 165 alleles were obtained, ranging from 2-9 alleles and an average of 4 alleles
per locus.
f. Ten clusters were observed using molecular data. The largest genetic distance (0.9001)
was between varieties 206 (cluster 9) and local 2 (cluster 1), while the shortest genetic
distance was 0.2189 between varieties 203 (cluster 6) and 811 (cluster 3).
g. Gene migration between populations per generation was at 0.33. This was <1Nm, which
suggest that gene flow among the varieties was low. Hence, unique germplasm can be
identified within and between the maize populations.
7.3.3 Variation for resistance to larger grain borer and maize weevil among local maize
varieties
a. Variation for resistance to maize weevil and larger grain borer exists among local
varieties in Malawi.
b. For maize weevil, 14.5% of the local varieties studied were resistant, 21.7% moderately
resistant, 24.6% moderately susceptible, 23.25% susceptible and 16% highly

202
susceptible. For larger grain borer all varieties were susceptible except for varieties
2012, 1992, 386 and 1983 that showed moderate resistance.
c. Local varieties 2012, 386, 1992 and 1983 were resistant to maize weevil and moderately
resistant to larger grain borer.
7.3.4 Levels of insect resistance among F1 hybrids
a. Grain weight loss (%) and grain damage (%) were the most consistent grain resistant
parameters for discriminating resistant from susceptible hybrids. The two parameters
were highly correlated to each other and generally produced similar groups of resistant
hybrids.
b. Larger grain borer resistant hybrids were also resistant to maize weevil, while not many
of maize weevil resistant hybrids were resistant to larger grain borer.
c. The percentage of maize weevil resistant hybrids developed ranged from 4 to 67%
across sets, while larger grain borer resistant hybrids ranged from 4 to 9% across sets.
d. Stacking of maize weevil and larger grain borer resistance produced 67% maize weevil
resistant hybrids, 14% larger grain borer resistant hybrids, 14% maize hybrids with
resistance to both larger grain borer and maize weevil.
e. Maize hybrids, MWMW151939, MWMW446929, MWA06A, MWA12395, lgMW087940,
MWlg06264, MWA11312 and MWA10A were resistant to maize weevil. Maize hybrids,
LGLG088218, LGLG021074, lgMW087940, LGA089116, LGA087I83, LGA088A, and
MWlg06264 were resistant to larger grain borer.
f. For maize weevil, the majority of resistant hybrids came from crosses between locally
adapted maize lines and maize weevil resistant lines. For larger grain borer, most of the
resistant hybrids came from crosses between locally adapted maize lines and larger
grain borer resistant lines. This means therefore, that maize genes conferring resistance
to weevil and larger grain borer exists among locally available maize germplasm. The
identified germplasm can be used to develop insect resistant hybrids. But have generally
been unnoticed or ignored in the country.
g. Maize hybrids lgMW087940, lgMW089151 and MWlg06264 were resistant to both maize
weevil and larger grain borer, implying that same gens could be conferring resistance to
both maize weevil and larger grain borer.

203
h. The majority of maize hybrids with resistance to both maize weevil and larger grain
borer, the female parent came from the larger grain borer resistant lines. It appears that
female effects were important in dual insect resistant maize hybrids.
7.3.5. Value for cultivation of larger grain borer and maize weevil resistant hybrids, as
reflected by combination of high productivity and stability
a. F1 hybrids showed differences in yield potential across environments, therefore genetic
differences for yield exist among the hybrids.
b. Genotype x Environment interaction was significant and that affected the selection of
hybrids across environments.
c. Environmental effects were significantly different, as such the test environments ably
represented some of the target production environments for farmers in Malawi.
d. Crosses among maize weevil resistant lines and larger grain borer resistant lines
performed poorly across environments possibly due to poor adaptation to the testing
environments. Therefore, resistance to larger grain borer and maize weevil should be
bred into locally adapted maize lines.
e. Maize hybrids MWA06A (10 tons/ha), MWMW15106 (9.07 tons/ha), MWA10A (7.69
tons/ha), MWMW446939 (6.67 tons/ha), and MWMW12939 (6.67 tons/ha) showed high
yield potential and high levels of resistance to maize weevil.
f. Maize hybrids lgMW087940 (11.05 tons/ha), LGA087I83 (8.89 tons/ha), LGA089116
(6.6 tons/ha) and MWlg06264 (8.16 tons/ha) revealed high resistance levels to larger
grain borer and high yield potential.
g. Maize hybrids lgMW087940 (11.05 tons/ha) and MWlg06264 (8.16 tons/ha) showed
high levels of resistance to both larger grain borer and maize weevil and high yield
potential.
7.3.6. General combining ability (GCA) and specific combining ability (SCA) among
maize lines for resistance to larger grain borer, maize weevil and grain yield

204
a. Both additive (GCA) and non-additive gene actions (SCA) determined weevil resistance
in maize weevil resistant hybrids. The interaction between males and females
contributed significant effects to grain resistance (73.44%).
b. Only additive gene action (GCA) influenced grain yield in weevil resistant maize hybrids.
Males and the interaction between males and females contributed more effects to grain
yield, 33.63% and 48.17%, respectively.
c. Male line CL106940 showed good combining ability for both weevil resistance and grain
yield. This line is a good candidate for crossing with locally adapted germplasm for the
development of high yielding weevil resistant hybrids.
d. Additive gene effects (GCA) determined both grain yield and resistance in larger grain
borer resistant maize hybrids. Female effects contributed significantly to larger grain
borer resistance (68.25%), while both male effects (42.26%) and female effects (30.35)
significantly contributed to grain yield.
7.4 Challenges to breeding for insect resistant varieties
a. Maize breeding programme in Malawi does not have a well developed (structured)
breeding programme for insect resistant as such setting up a workable structure could
drag the process of kick-starting insect resistance breeding programme.
b. Rearing of insects requires specialized equipment which could drain already limited
resources for such breeding programmes.
d. Farmers and other potential users of the insect resistant varieties may look for a quick fix
in breeding for insect resistant varieties. This could compromise the programme through
fast tracking the release of resistant hybrids before adequate evaluation and testing is
done. This may lead to early breakdown in resistance.
e. Agro-dealers and multinational companies in Malawi that promote chemical control of
storage insect pests may perceive breeding for insect resistance as a threat to their
business. This view may affect progress in developing insect resistant maize varieties.
f. Intellectual property Rights may prohibit or hinder the release of insect resistant maize
hybrids due to the use of lines from other countries or institutions.

205
7.5 Opportunities
a. Insect pest damage in maize storage facilities has been recognized as a national
problem that threatens food security at household level in Malawi.
b. Malawi has on-going maize breeding programmes that can easily integrate insect
resistance breeding in its programmes.
c. The current high costs of chemical products and environmental concerns would work in
favor of breeding for insect resistant maize.
d. Chitedze Research Station has a functional laboratory and trained personnel for insect
handling and grain resistance evaluation, critical for kick starting the insect resistant
breeding programme.
7.6 Breeding implications
Farmers use a wide range of traits when choosing varieties for planting. Selection of a large
breeding population with diverse traits is a prerequisite when developing maize varieties for
small holder farmers. Breeding for insect pest resistant maize varieties should focus on yield
and other biophysical characteristics such as grain hardness, grain size, grain color,
poundability and grain texture. This would make sure that varieties are easily accepted by
farmers. Breeding programmes should also consider selection of other important traits such as
drought tolerance, diseases resistance, grain size and cob size that were perceived as critical
by famers. Since farmers tend to keep their own local varieties, apart from developing hybrids,
breeding initiatives should also focus on developing or improving the existing open pollinated
varieties kept by farmers.
Local maize varieties in Malawi expressed good levels of genetic diversity. The expressed
diversity would offer a good source of genes for the breeding programmes in Malawi. The
availability of local maize varieties with resistance to both larger grain borer and maize weevil
offer new opportunities for Malawi to kick start storage insect resistant breeding programmes.
The same maize materials would be used for both larger grain borer and maize weevil resistant
screening. This would make the breeding process more efficient and cost effective. In addition,
lines can be developed from dual resistant varieties for introgressing genes into susceptible but

206
high yielding maize varieties. Varieties with desirable characteristics for farmers but with
moderate resistance could be improved upon through recurrent selection that exploits the
additive and non-additive variances to increase the frequency of resistant genes.
For maize hybrids, many of the adapted Malawi lines displayed a good combination of yield
potential and resistance with larger grain borer and maize weevil lines. These could be a good
source of breeding materials for developing lines for grain yield and insect resistance. The
strong presence of additive gene effects for both maize weevil and larger grain borer resistant
hybrids suggest that recurrent selection can be applied to increase the frequency of desirable
genes. Where dual resistance (weevil and LGB) screening is pursued, breeders should focus on
initially using larger grain borer for screening. Results have shown that all maize hybrids with
resistance to larger grain borer were also resistant to maize weevil, while most of the maize
hybrids resistant to maize weevil were susceptible to larger grain borer. By making initial
selection with larger grain borer, the selected germplasm will likely be resistant to maize weevil.
Ultimately productive hybrids will be formed by crossing the adapted lines by the insect resistant
maize inbred lines.
7.7 Recommendations
a. Varieties with superior characteristics for yield performance and resistance must further
be evaluated in more diverse environments and seasons to confirm performance before
recommendation to farmers.
b. Analysis of levels of phenolic compounds among the selected varieties must be carried
out to link levels of resistance and amount of phenolic compounds as a screening tool.
This could not be done in the current study due to prohibitive costs.
c. Malawi should develop a well-structured programme for insect resistance breeding
focusing more on maize weevil and larger grain borer. The government of Malawi should
set aside extra funding for maize research for the integration of insect resistance
breeding in conventional maize programmes so that insect resistance is incorporated in
productive varieties to enhance net grain yield.
d. QTL analysis should be conducted to validate the existence of the same genes conferring
resistance to both maize weevil and larger grain borer among maize varieties. Results
have shown that quantitative genes were largely responsible for resistance for both larger
grain borer and maize weevil hybrids.

207
Appendices
Appendix 2.1: Survey questionaire on farmers’ perception on yield performance and storageability of landraces and locally adapted improved varieties
Name of Intervewee……………………………………………………..…..
Sex…………………………………………………………….………..……..
Region………………………………………………….……….…..………...
District…………………………………………………………………………
EPA……………………………………………………………………………
Village…………………………………………………………………………
A. Interviewee details
1. Household head 1. Yes 2. No
2. Gender of interviewee 1. Female 2. Male 3. Marital status 1. Married 2. Single 3. Widowed
4. Divorce 5. Separated
4 Age (years): 1. 15-20 2. 21-35 3. 36-45 4. 46-55 5. Above 55
5. Educational level: 1. None 2. Primary 3. Secondary 4. Tertially 5. Other
B. Sources of income
1. Farming
2. Business
3. Employment
4. None
C. Type of Farming
1 Field crop production 2 Animal production

208
3 Poultry production 4 Horticulture productions 6 Fishing D. If 1 (what is the size of the farm) 1. less than 2ha 2. Beween 2-5ha, 3. Between 5-10 ha 4. More than 10 ha E. Type of crops grown 1. Maize 2.Cassava 3. Sweet potato 4. Sorghum 5.Millets 6. Groundnuts 7. Beans. 8. Irish potato 9. Cotton 10.tobacco 11. Others F. (On maize) Does you produce enough for the whole year? 1. Yes with surplus- a. Yes b. No 2. No G. How many 50 kg bags of maize do you realise per year 1. 1 – 5 bags 2. 5 – 10 bags 3. 11- 15 bags 4. 16 – 20 bags 5. More than 20 bags H. Constrants to maize production 1 Lack of seeds 2 lack of resources to buy in puts 3. Low yields varieties 5 lack of Fertiliser not available 7 Diseases 8.Pests 9 Drought 10.Post harvest losses 11.Poor poundability 12.Shortage of labour 13. Lack of market 14. Low soil fertility 15. Other (specify) I. How much maize do you lose in storage due to pests?
1. all the harvest 2. Half of the harvest 3. Three quarter of te harvest 4. None 5. Not sure
J. Common storage pests 1. Rodents 2. Larger grain borer

209
3. Maize weevil 4. Moisture 5. Moulds 6. Theft by people K. Type of seed used or preferred (maize only) 1. Land races and Locally adapted cultivars/varieties 2. Hybrids 3. Both L. Why do the farmers prefer that type of seeds? 1. High yelding 2. Readly available 3. Locally found 4. Other reasons M Source of seeds 1. Keep on seed 2. Friends 3. Admarc 4. Seed companies N. Important attributes for selecting land races and locally adapted maize varieties for
planting 1. Grain size 2. Cob size 3. Yield 4. Poundability 5. Colour 6. Taste 7. Storability 8. Resistance to pests and diseases 9. Drought torelant 10. Other (specify) O. Type of storage facilities for maize grain 1. Traditional structures 2. Bags 3. Modern facilities 4. Others P. Farmers’ level of knowledge on storage problems 1. Excellent 2. Very good 3. Good 4. Fair 5. Poor 6. Very poor 7. Not sure Q. Farmers interaction with extension workers on problems of storage pests
1. Excellent 2. good 3. Fair 4. Fairly

210
5. None R. Control of storage pests 1. Use of natural pesticides/ indeginous plants 2. Chemicals 3. Grain processing (pounding) 4. Use of resistant varieties 5. General sanitation 6. None 7. Other (specify) S. Can you use grain storage resistant varieties with slightly lower yields than the
current susceptible high yielding varieties? 1. Yes 2. No 3. Not sure T. What is an ideal crop (important attrebutes) for the farmer (ideotype)?

211
Appendix 3.1: Mean trait values for each local maize variety
Variety yield (tons/ha)
PH (cm) KW(g) ED EPL(cm) HC KS EP TB DT KC KRA KT KR DS
139 2.32
200.2 332 0.245 106.5 6.82 2.235 1.061 16.56 76.9 1.031 1.366 2.132 9.9 80.42
145 3.43
210.4 363 0.135 96.5 6.969 2.42 1.351 17.29 73.91 1.104 1.327 2.042 11.02 78.98
148 1.51
218.9 380 0.181 113.1 6.933 2.414 1.125 16.49 74.33 1.151 1.555 2.436 9.92 79.3
154 2.77
228.1 391 0.27 111.2 6.862 2.471 1.449 18.68 78.87 1.15 1.59 2.577 10.04 77.53
163 4.15
216.4 291 0.354 108.6 6.825 2.029 1.26 18.46 75.02 1.082 1.383 2.614 11.54 78.22
164 2.19
233.9 379 0.126 126.8 6.894 2.154 1.237 14.99 76.46 1.004 1.31 2.225 10.58 76.39
172 1.8
200.3 319 0.151 115.7 7.102 2.047 1.063 17.17 74.65 1.039 1.407 2.37 11.64 74.8
1772 3.76
194.7 323 0.314 93.5 6.29 2.165 1.07 16.74 73.93 1.172 1.258 2.362 10.12 81.12
1786 4.81
198.2 381 0.209 99.2 6.954 2.346 1.249 16.83 73.98 1.023 1.565 2.347 10.92 75.36
1795 3.49
195.9 296 0.306 104.3 6.985 2.025 1.114 14.73 79.51 1.711 1.353 2.621 11.24 79.69
1845 1.93
221.6 412 0.281 100.2 6.924 2.204 1.063 15.94 74.36 1.268 1.622 2.631 8.63 76.82
1850 1.7
217.2 293 0.259 122.9 6.255 2.075 1.201 29.84 75.02 1.227 1.502 2.534 11.17 78.97
1857 1.29
208.4 438 0.286 100.3 6.889 2.436 1.031 17.73 72.82 1.184 1.411 2.645 9.36 76.84
1892 2.8
205.4 391 0.246 106 6.904 2.485 1.278 14.23 74.99 1.03 1.305 2.258 9.41 74.5
1915 2.28
242.8 398 0.189 126.3 6.991 2.348 1.22 16 78.17 1.688 1.457 2.536 9.71 76.99
193 2.79
172.9 362 0.164 102.3 6.766 2.234 0.992 17.56 76.66 1.028 1.311 2.299 10.68 79.3
1983 3.16
178.6 356 0.278 105.4 6.976 2.064 1.013 17.4 72.13 1.075 1.19 2.541 9.75 72.5
199 2.22
207.6 348 0.162 103.4 6.359 2.212 1.06 15.5 74.98 1.216 1.466 2.552 9.82 79.03
1992 2.88
197.3 325 0.325 95.1 6.817 2.083 1.223 15.32 75.53 1.055 1.185 2.756 10.31 76.22
2012 4.57
213.2 373 0.152 110.4 6.919 2.259 1.159 15.8 72.39 1.477 1.391 2.446 11.71 77.57
2017 1.01
223.1 385 0.199 114.5 7.081 2.396 1.179 17.03 73.37 1.074 1.32 2.488 9.88 75.55
2027 3.17
206.9 322 0.448 108.1 6.732 1.98 1.017 15.66 72.98 1.083 1.618 2.629 10.67 78.98
203 2.42
230.4 318 0.225 126.4 6.807 2.319 1.165 17.84 73.27 1.254 1.536 2.293 9.23 77.35
206 2.39
242.3 404 0.224 128.6 6.825 2.363 1.315 17.11 73.26 1.163 1.286 2.455 12.03 79.75
218 0.99
229.6 390 0.277 119.5 7.181 2.346 0.994 14.73 78.55 0.981 1.336 2.09 9.93 75.94
226 2.06
212.2 361 0.269 91.5 7.275 2.266 1.043 16.93 74.22 1.055 1.467 2.014 9.98 75.69
240 1.4
230.6 413 0.13 116.5 6.964 2.556 1.41 17.8 76.66 1.083 1.408 2.302 9.99 80.63
243 2.61
204.8 331 0.135 102.6 7.011 2.27 1.053 17.68 76.57 1.063 1.381 2.388 8.34 75.78
249 2.2
206.3 349 0.178 104.5 6.733 2.029 1.042 15.84 76.87 1.462 1.436 2.55 10.52 75.72
250 1.79
192.3 381 0.33 99.9 7.026 2.257 1.06 15.68 77.94 1.203 1.518 2.51 9.48 77.6
260 2.41
222 395 0.296 119.4 7.46 2.386 1.107 14.7 72.56 1.138 1.41 1.688 10.03 76.96
2862
107 140 0.664 23.4 6.89 1.055 1.05 8.47 75.6 1.1 1.411 2.996 8.64 62.46

212
Appendix 3.1….continued
Variety Yield (tons/ha) PH (cm) KW (g) ED EPL (cm) HC KS EP TB DT KC KRA KT KR DS
2872 2.49 174.3 356 0.574 67.1 6.249 2.246 1.177 13.87 72.14 1.215 1.239 2.276 12.23 73.77
289 2.43 210.7 323 0.134 107.7 6.849 2.081 1.177 15.4 72.81 1.169 1.426 2.34 10.46 75.77
292 2.76 224 339 0.137 2119 6.919 2.233 1.252 16.1 76.11 1.29 1.318 2.116 9.99 78.92
297 1.54 260.5 381 0.153 138.3 6.856 2.291 1.159 18.62 73.61 1.042 1.493 2.276 10.56 79.86
303 0.26 234.8 397 0.2 122.7 6.104 2.444 1.149 16.6 74.04 1.175 1.181 2.031 10.27 74.62
310 1.02 222.7 380 0.2 119.1 7.022 2.386 0.995 16.1 74.78 1.026 1.341 2.511 9.26 77.39
315 2.35 208.3 313 0.492 107.3 6.562 1.974 1.109 16.67 73.31 1.061 1.599 2.296 11.26 76.51
322 1.74 218.8 351 0.39 116 7.009 2.311 1.17 16.21 75.89 1.071 1.436 2.013 9.62 77.72
3243 2.85 161.7 292 0.298 62.8 7.124 1.606 1.299 14.69 72.2 2.693 1.544 2.856 10.8 72.35
3244 3.91 190 303 0.139 92.4 7.044 1.734 1.075 16.46 72 1.291 1.422 2.788 11.59 73.68
332 2.44 204.2 324 0.197 100.6 7.083 2.188 1.046 16.25 78.27 1.506 1.549 2.538 9.72 75.17
3411 2.6 212.2 374 0.228 100.8 7.086 2.167 0.942 15.91 71.46 1.137 1.454 2.473 9.95 76.55
3414 2.3 182.2 328 0.231 87.7 7.016 2.222 1.255 16.11 77.86 1.282 1.369 2.299 10.6 75.48
386 1.6 225.5 334 0.239 118.6 6.917 2.23 1.238 15.25 73.06 1.086 1.262 2.393 10.48 76.39
403 2.49 210.7 258 0.13 110.4 7.055 1.88 1.218 17.43 73.88 1.484 1.514 2.228 10.58 78.89
410 1.65 208.2 258 0.271 123.2 6.917 1.949 1.199 13.43 80.54 1.248 1.466 2.845 8.48 79.28
445 3.81 203.7 263 0.151 102.7 6.958 1.717 1.397 15 71.7 1.192 1.586 2.084 11.01 72.82
539 1.35 224.4 337 0.163 113.9 7.012 2.059 1.181 15.47 71.78 1.209 1.546 2.479 11.06 73.63
569 4.09 159.6 213 0.293 90.4 6.264 1.503 1.014 16.23 74.68 1.021 1.31 2.557 11.34 74.04
584 2.13 213.4 369 0.467 179.6 6.847 2.15 1.128 16.6 71.79 1.018 1.331 2.174 8.8 74.7
629 2.41 180.6 327 0.292 101.2 6.921 2.011 1.067 14.71 71.68 1.121 1.288 2.041 8.31 78.64
637 2.58 197.8 308 0.321 97.6 6.56 2.068 1.183 15.88 72.59 1.298 1.615 2.435 11.1 74.65
696 2.24 179.8 305 0.145 83.5 6.357 1.969 1.045 14.26 75.32 1.057 1.456 2.527 9.49 74.87
699 2.29 218.9 348 0.234 107.8 7.045 2.191 1.404 15.53 74.54 1.11 1.382 2.236 9.68 78.12
725 1.48 231.4 380 0.163 124.2 6.974 2.362 1.078 16.3 72.99 1.306 1.336 2.485 10.06 78.5
736 2.45 182.9 331 0.266 84.6 6.185 2.199 1.061 15.1 72.45 1.317 1.251 2.431 9.59 74.05
740 3.84 199.8 337 0.183 101.4 6.275 2.134 1.037 15.81 75.25 1.104 1.293 2.383 10.44 82.05
741 1.81 219.5 334 0.255 115 6.92 2.268 1.096 14.68 72.93 1.124 1.289 2.189 10.84 74.65
750 3.52 233.8 340 0.313 124.3 6.974 2.047 1.149 16.07 76.7 1.388 1.331 2.624 8.88 79.29
752 4.18 196.7 277 0.179 92.3 6.357 1.909 1.045 14.93 75.32 1.22 1.403 2.274 10.95 76.2
783 2.81 218.2 323 0.225 106.1 6.894 1.959 1.061 14.2 72.12 1.131 1.421 2.441 9.34 75.7
787 1.46 191.1 320 0.253 98.7 7.021 1.964 1.198 15.94 74.16 1.152 1.305 2.277 10.14 75.51
811 1.71 224.6 331 0.258 115.2 6.933 1.943 1.143 15.56 71.47 1.049 1.297 2.631 10.31 78.02
Knjnj 2.31 203.9 318 0.355 98.3 6.9 2.069 1.077 15.1 71.37 1.156 1.418 2.326 9.02 75.25
Local 1 1.72 218.9 465 0.035 100.1 6.92 2.64 1.5 16.06 74.8 1.069 1.643 2.912 7.16 77.63
Local 2 2.66 199.9 335 0.383 107.8 6.15 2.222 1.089 15.84 69.9 1.223 1.327 2.207 9.76 72.73
Days_to_silking (DS), Ear damage (ED), Ear placements (EPL), Husk cover (HC), Kernel size (KS), Number_of_ears_plant (EP),
Number_of_tassel_branches (TB), Plant_hieght (PH), days_to_tassel (DT), kernel colour (KC), number_of_kernels_row (KR), kernel
type (KT), kernel weight (KW), kernel_role_arrangement (KRA)

213
Appendix 3.2: Genetic diatances between local maize varieties
811
1850 0.2741 Local 1 0.2385 0.3362
303 0.4578 0.3175 0.4649 199 0.3454 0.2875 0.3927 0.39
386 0.4374 0.4134 0.4011 0.4136 0.359 250 0.4496 0.2887 0.3484 0.4006 0.4359 0.5195
740 0.3515 0.4263 0.4011 0.4418 0.3467 0.5021 0.3654 445 0.4324 0.3828 0.4095 0.3958 0.3918 0.4009 0.3738 0.4009
206 0.446 0.4733 0.4481 0.4757 0.4699 0.6112 0.439 0.643 0.4756 1786 0.3889 0.3769 0.3885 0.4818 0.4096 0.418 0.4041 0.4578 0.4133 0.5762
1857 0.4545 0.4438 0.4053 0.3774 0.4139 0.5227 0.4376 0.4233 0.4054 0.4986 0.4763
2872 0.3621 0.5 0.4094 0.4337 0.3214 0.4394 0.4526 0.3881 0.3096 0.5413 0.4137 0.5272
569 0.4213 0.422 0.3015 0.4475 0.3929 0.5074 0.4804 0.5654 0.5038 0.6296 0.439 0.4572 0.3732
172 0.3311 0.3649 0.3046 0.3852 0.3724 0.331 0.3654 0.3674 0.2442 0.452 0.418 0.3222 0.3298 0.4263
584 0.4653 0.3814 0.5339 0.4252 0.4884 0.5114 0.5407 0.5972 0.2954 0.492 0.5371 0.411 0.4538 0.505 0.3277
539 0.3818 0.3702 0.4366 0.3684 0.3918 0.3116 0.4718 0.4988 0.4378 0.4756 0.362 0.3788 0.4348 0.3578 0.3745 0.4665
240 0.3818 0.2749 0.3203 0.382 0.3048 0.4009 0.3475 0.4417 0.3185 0.3955 0.3873 0.34 0.3702 0.3096 0.2896 0.4402 0.2697
1332 0.3633 0.2928 0.3504 0.3208 0.436 0.3542 0.3397 0.5021 0.3489 0.4934 0.3192 0.3453 0.4263 0.3513 0.2732 0.291 0.2524 0.3239
1857 0.3172 0.3732 0.4221 0.3548 0.2987 0.4263 0.3364 0.3881 0.2636 0.4096 0.3531 0.2839 0.2932 0.3614 0.274 0.336 0.3455 0.2863 0.2483
203 0.2189 0.3015 0.2538 0.3815 0.2513 0.4408 0.4004 0.3629 0.3082 0.4221 0.3885 0.3052 0.2902 0.3721 0.2819 0.3917 0.3326 0.2844 0.3382 0.2355
750 0.3574 0.2636 0.3576 0.3549 0.4181 0.3616 0.3093 0.4143 0.331 0.4896 0.3251 0.3788 0.3955 0.4482 0.3251 0.3552 0.2697 0.383 0.2185 0.2749 0.3082
699 0.4721 0.36 0.5195 0.3683 0.4581 0.4408 0.3234 0.5108 0.4095 0.435 0.5079 0.4594 0.4613 0.4883 0.4267 0.4038 0.3842 0.4095 0.3141 0.4221 0.4495
696 0.446 0.3973 0.4613 0.3804 0.4053 0.3881 0.5384 0.5216 0.4215 0.6609 0.4783 0.5869 0.3497 0.4473 0.4783 0.5317 0.4482 0.4084 0.3634 0.3732 0.4613
193 0.32 0.3071 0.3397 0.4255 0.2252 0.331 0.3781 0.4051 0.4002 0.439 0.4055 0.4355 0.3298 0.3278 0.3216 0.5371 0.3373 0.3373 0.331 0.2849 0.3279
249 0.4374 0.4894 0.3523 0.4918 0.4994 0.3319 0.4965 0.5815 0.4917 0.5435 0.5214 0.5289 0.4134 0.4763 0.4174 0.5292 0.3739 0.4246 0.3436 0.4507 0.4382
2027 0.553 0.362 0.4909 0.411 0.4867 0.5082 0.4552 0.6645 0.4644 0.454 0.5605 0.526 0.5553 0.442 0.4578 0.4273 0.5036 0.4266 0.3503 0.373 0.3703
741 0.4863 0.5576 0.5663 0.5648 0.4306 0.4749 0.6591 0.5927 0.5058 0.7007 0.6006 0.6773 0.5744 0.493 0.5832 0.5565 0.457 0.5226 0.5576 0.4324 0.5158
292 0.324 0.2518 0.3788 0.4403 0.3211 0.3839 0.3569 0.3979 0.4531 0.4898 0.3042 0.447 0.4318 0.3904 0.4235 0.5067 0.3661 0.312 0.3839 0.3904 0.3926
403 0.4496 0.4946 0.559 0.3728 0.4779 0.4325 0.448 0.4607 0.4146 0.5236 0.4581 0.5572 0.4123 0.5236 0.4173 0.5407 0.3872 0.3842 0.3654 0.3123 0.3871
1795 0.3127 0.2213 0.3111 0.3728 0.3826 0.2903 0.3646 0.3784 0.3346 0.4946 0.3654 0.4956 0.3864 0.4526 0.3404 0.4441 0.4718 0.4146 0.4051 0.3864 0.4004
637 0.519 0.3578 0.3585 0.358 0.4783 0.3239 0.3769 0.5375 0.3861 0.466 0.3495 0.4821 0.424 0.3707 0.4022 0.5121 0.4142 0.306 0.3368 0.397 0.4126
289 0.3726 0.3364 0.3111 0.4292 0.332 0.3784 0.3917 0.4897 0.3872 0.5534 0.3528 0.4236 0.3736 0.3864 0.3404 0.4573 0.3093 0.2846 0.3024 0.3864 0.2752
148 0.4541 0.4177 0.4694 0.5427 0.4914 0.5297 0.3568 0.4742 0.2717 0.4177 0.4998 0.5209 0.4177 0.5617 0.3153 0.4745 0.4837 0.4037 0.3962 0.3695 0.4049
811 1850 Local 1 303 199 386 250 740 445 206 1786 1857 2872 569 172 584 539 240 1332 1857 203
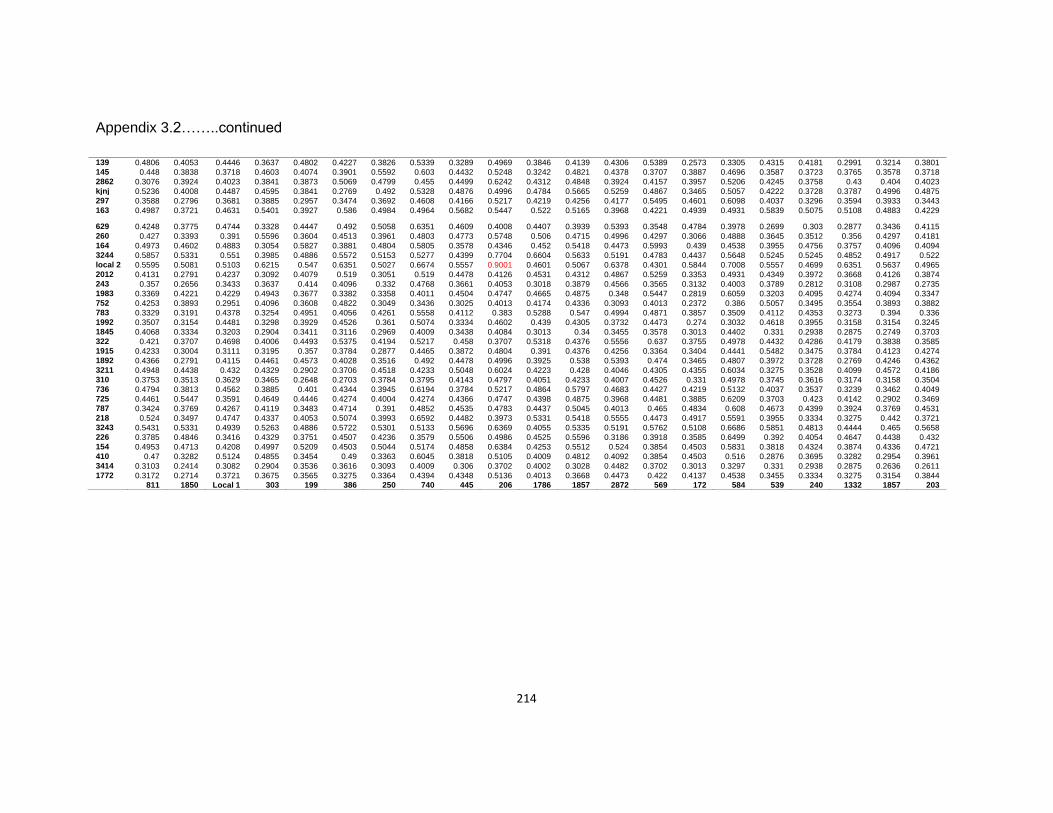
214
Appendix 3.2……..continued
139 0.4806 0.4053 0.4446 0.3637 0.4802 0.4227 0.3826 0.5339 0.3289 0.4969 0.3846 0.4139 0.4306 0.5389 0.2573 0.3305 0.4315 0.4181 0.2991 0.3214 0.3801
145 0.448 0.3838 0.3718 0.4603 0.4074 0.3901 0.5592 0.603 0.4432 0.5248 0.3242 0.4821 0.4378 0.3707 0.3887 0.4696 0.3587 0.3723 0.3765 0.3578 0.3718
2862 0.3076 0.3924 0.4023 0.3841 0.3873 0.5069 0.4799 0.455 0.4499 0.6242 0.4312 0.4848 0.3924 0.4157 0.3957 0.5206 0.4245 0.3758 0.43 0.404 0.4023
kjnj 0.5236 0.4008 0.4487 0.4595 0.3841 0.2769 0.492 0.5328 0.4876 0.4996 0.4784 0.5665 0.5259 0.4867 0.3465 0.5057 0.4222 0.3728 0.3787 0.4996 0.4875
297 0.3588 0.2796 0.3681 0.3885 0.2957 0.3474 0.3692 0.4608 0.4166 0.5217 0.4219 0.4256 0.4177 0.5495 0.4601 0.6098 0.4037 0.3296 0.3594 0.3933 0.3443
163 0.4987 0.3721 0.4631 0.5401 0.3927 0.586 0.4984 0.4964 0.5682 0.5447 0.522 0.5165 0.3968 0.4221 0.4939 0.4931 0.5839 0.5075 0.5108 0.4883 0.4229
629 0.4248 0.3775 0.4744 0.3328 0.4447 0.492 0.5058 0.6351 0.4609 0.4008 0.4407 0.3939 0.5393 0.3548 0.4784 0.3978 0.2699 0.303 0.2877 0.3436 0.4115
260 0.427 0.3393 0.391 0.5596 0.3604 0.4513 0.3961 0.4803 0.4773 0.5748 0.506 0.4715 0.4996 0.4297 0.3066 0.4888 0.3645 0.3512 0.356 0.4297 0.4181
164 0.4973 0.4602 0.4883 0.3054 0.5827 0.3881 0.4804 0.5805 0.3578 0.4346 0.452 0.5418 0.4473 0.5993 0.439 0.4538 0.3955 0.4756 0.3757 0.4096 0.4094
3244 0.5857 0.5331 0.551 0.3985 0.4886 0.5572 0.5153 0.5277 0.4399 0.7704 0.6604 0.5633 0.5191 0.4783 0.4437 0.5648 0.5245 0.5245 0.4852 0.4917 0.522
local 2 0.5595 0.5081 0.5103 0.6215 0.547 0.6351 0.5027 0.6674 0.5557 0.9001 0.4601 0.5067 0.6378 0.4301 0.5844 0.7008 0.5557 0.4699 0.6351 0.5637 0.4965
2012 0.4131 0.2791 0.4237 0.3092 0.4079 0.519 0.3051 0.519 0.4478 0.4126 0.4531 0.4312 0.4867 0.5259 0.3353 0.4931 0.4349 0.3972 0.3668 0.4126 0.3874
243 0.357 0.2656 0.3433 0.3637 0.414 0.4096 0.332 0.4768 0.3661 0.4053 0.3018 0.3879 0.4566 0.3565 0.3132 0.4003 0.3789 0.2812 0.3108 0.2987 0.2735
1983 0.3369 0.4221 0.4229 0.4943 0.3677 0.3382 0.3358 0.4011 0.4504 0.4747 0.4665 0.4875 0.348 0.5447 0.2819 0.6059 0.3203 0.4095 0.4274 0.4094 0.3347
752 0.4253 0.3893 0.2951 0.4096 0.3608 0.4822 0.3049 0.3436 0.3025 0.4013 0.4174 0.4336 0.3093 0.4013 0.2372 0.386 0.5057 0.3495 0.3554 0.3893 0.3882
783 0.3329 0.3191 0.4378 0.3254 0.4951 0.4056 0.4261 0.5558 0.4112 0.383 0.5288 0.547 0.4994 0.4871 0.3857 0.3509 0.4112 0.4353 0.3273 0.394 0.336
1992 0.3507 0.3154 0.4481 0.3298 0.3929 0.4526 0.361 0.5074 0.3334 0.4602 0.439 0.4305 0.3732 0.4473 0.274 0.3032 0.4618 0.3955 0.3158 0.3154 0.3245
1845 0.4068 0.3334 0.3203 0.2904 0.3411 0.3116 0.2969 0.4009 0.3438 0.4084 0.3013 0.34 0.3455 0.3578 0.3013 0.4402 0.331 0.2938 0.2875 0.2749 0.3703
322 0.421 0.3707 0.4698 0.4006 0.4493 0.5375 0.4194 0.5217 0.458 0.3707 0.5318 0.4376 0.5556 0.637 0.3755 0.4978 0.4432 0.4286 0.4179 0.3838 0.3585
1915 0.4233 0.3004 0.3111 0.3195 0.357 0.3784 0.2877 0.4465 0.3872 0.4804 0.391 0.4376 0.4256 0.3364 0.3404 0.4441 0.5482 0.3475 0.3784 0.4123 0.4274
1892 0.4366 0.2791 0.4115 0.4461 0.4573 0.4028 0.3516 0.492 0.4478 0.4996 0.3925 0.538 0.5393 0.474 0.3465 0.4807 0.3972 0.3728 0.2769 0.4246 0.4362
3211 0.4948 0.4438 0.432 0.4329 0.2902 0.3706 0.4518 0.4233 0.5048 0.6024 0.4223 0.428 0.4046 0.4305 0.4355 0.6034 0.3275 0.3528 0.4099 0.4572 0.4186
310 0.3753 0.3513 0.3629 0.3465 0.2648 0.2703 0.3784 0.3795 0.4143 0.4797 0.4051 0.4233 0.4007 0.4526 0.331 0.4978 0.3745 0.3616 0.3174 0.3158 0.3504
736 0.4794 0.3813 0.4562 0.3885 0.401 0.4344 0.3945 0.6194 0.3784 0.5217 0.4864 0.5797 0.4683 0.4427 0.4219 0.5132 0.4037 0.3537 0.3239 0.3462 0.4049
725 0.4461 0.5447 0.3591 0.4649 0.4446 0.4274 0.4004 0.4274 0.4366 0.4747 0.4398 0.4875 0.3968 0.4481 0.3885 0.6209 0.3703 0.423 0.4142 0.2902 0.3469
787 0.3424 0.3769 0.4267 0.4119 0.3483 0.4714 0.391 0.4852 0.4535 0.4783 0.4437 0.5045 0.4013 0.465 0.4834 0.608 0.4673 0.4399 0.3924 0.3769 0.4531
218 0.524 0.3497 0.4747 0.4337 0.4053 0.5074 0.3993 0.6592 0.4482 0.3973 0.5331 0.5418 0.5555 0.4473 0.4917 0.5591 0.3955 0.3334 0.3275 0.442 0.3721
3243 0.5431 0.5331 0.4939 0.5263 0.4886 0.5722 0.5301 0.5133 0.5696 0.6369 0.4055 0.5335 0.5191 0.5762 0.5108 0.6686 0.5851 0.4813 0.4444 0.465 0.5658
226 0.3785 0.4846 0.3416 0.4329 0.3751 0.4507 0.4236 0.3579 0.5506 0.4986 0.4525 0.5596 0.3186 0.3918 0.3585 0.6499 0.392 0.4054 0.4647 0.4438 0.432
154 0.4953 0.4713 0.4208 0.4997 0.5209 0.4503 0.5044 0.5174 0.4858 0.6384 0.4253 0.5512 0.524 0.3854 0.4503 0.5831 0.3818 0.4324 0.3874 0.4336 0.4721
410 0.47 0.3282 0.5124 0.4855 0.3454 0.49 0.3363 0.6045 0.3818 0.5105 0.4009 0.4812 0.4092 0.3854 0.4503 0.516 0.2876 0.3695 0.3282 0.2954 0.3961
3414 0.3103 0.2414 0.3082 0.2904 0.3536 0.3616 0.3093 0.4009 0.306 0.3702 0.4002 0.3028 0.4482 0.3702 0.3013 0.3297 0.331 0.2938 0.2875 0.2636 0.2611
1772 0.3172 0.2714 0.3721 0.3675 0.3565 0.3275 0.3364 0.4394 0.4348 0.5136 0.4013 0.3668 0.4473 0.422 0.4137 0.4538 0.3455 0.3334 0.3275 0.3154 0.3844
811 1850 Local 1 303 199 386 250 740 445 206 1786 1857 2872 569 172 584 539 240 1332 1857 203

215
Appendix 3.2……….continued
139 0.3048 0.3677 0.5247 0.4353 0.5694 0.5657 0.6099 0.4437 0.4779 0.332 0.3938 0.3826 0.5328 145 0.3723 0.4126 0.4804 0.3624 0.5259 0.5066 0.468 0.3855 0.4194 0.3769 0.3623 0.3228 0.446 0.354
2862 0.4499 0.4764 0.5016 0.3727 0.626 0.4498 0.5318 0.4584 0.4536 0.4154 0.5061 0.2976 0.5357 0.5242 0.4784 kjnj 0.3608 0.3638 0.3661 0.3925 0.4651 0.3904 0.4718 0.4712 0.465 0.4004 0.3972 0.4258 0.5611 0.47 0.4772 0.4789
297 0.3415 0.4175 0.3813 0.385 0.4588 0.6183 0.5996 0.3332 0.4337 0.2626 0.4051 0.3945 0.6156 0.3888 0.4741 0.4597 0.4207 163 0.4644 0.5947 0.5161 0.4665 0.7006 0.5169 0.6377 0.4066 0.5907 0.4138 0.5304 0.5907 0.5973 0.5136 0.4408 0.6587 0.5141 0.6125
629 0.4222 0.3994 0.4614 0.4531 0.4651 0.3669 0.5804 0.4298 0.534 0.465 0.2995 0.4517 0.603 0.47 0.3844 0.5283 0.5134 0.5208 0.6593 260 0.3915 0.4744 0.4996 0.3434 0.4872 0.3599 0.5386 0.4345 0.5297 0.4533 0.5499 0.4243 0.4652 0.5124 0.4101 0.484 0.3072 0.5522 0.489 0.4827
164 0.2863 0.4883 0.3973 0.6061 0.4507 0.5688 0.6446 0.4178 0.3864 0.3364 0.3707 0.4526 0.4947 0.3565 0.3707 0.5679 0.5667 0.4054 0.6845 0.4126 0.6562 3244 0.5393 0.5364 0.5473 0.4834 0.6375 0.5471 0.6924 0.6609 0.5452 0.4721 0.5631 0.5452 0.5844 0.5306 0.5318 0.5193 0.6305 0.5698 0.6762 0.5725 0.435 0.5762
local 2 0.6495 0.7094 0.7517 0.7434 0.7174 0.7378 0.6898 0.4979 0.7082 0.5616 0.5795 0.5923 0.6931 0.5614 0.5637 0.576 0.6468 0.5576 0.6125 0.6619 0.5987 0.7868 0.7434 2012 0.3849 0.3523 0.6538 0.3925 0.4901 0.3689 0.684 0.4998 0.4387 0.3398 0.4498 0.4517 0.4089 0.3608 0.4772 0.491 0.4402 0.4207 0.4487 0.4055 0.3664 0.4996 0.4284 243 0.3411 0.4054 0.4833 0.3483 0.486 0.4253 0.5577 0.3603 0.4779 0.3076 0.3411 0.4223 0.4517 0.2933 0.3671 0.4722 0.4323 0.3766 0.528 0.3381 0.4404 0.3929 0.4484 1983 0.3832 0.4229 0.5303 0.2932 0.3406 0.6135 0.5663 0.4056 0.4984 0.4274 0.5461 0.3612 0.4431 0.4855 0.5304 0.5024 0.3994 0.3925 0.5489 0.5415 0.391 0.5161 0.5658 752 0.3864 0.3761 0.5027 0.3692 0.5322 0.5195 0.6076 0.3931 0.4417 0.2933 0.3999 0.4025 0.3975 0.3261 0.454 0.4086 0.3822 0.3509 0.5183 0.4901 0.3932 0.3775 0.5878 783 0.3203 0.2836 0.4395 0.3857 0.4791 0.3279 0.3979 0.4405 0.3331 0.4261 0.3499 0.4384 0.4021 0.3554 0.4223 0.3838 0.3482 0.4831 0.5379 0.4446 0.4668 0.394 0.5288 1992 0.3334 0.2679 0.3732 0.4013 0.5575 0.4302 0.5248 0.4604 0.3993 0.361 0.4104 0.3242 0.3462 0.2441 0.3578 0.3585 0.3216 0.4177 0.4613 0.4126 0.4571 0.3154 0.4783 1845 0.306 0.3703 0.3955 0.3132 0.3989 0.4516 0.4893 0.2607 0.4008 0.3219 0.2683 0.3475 0.3909 0.3918 0.3861 0.4371 0.4096 0.3659 0.4504 0.349 0.4773 0.3955 0.4955 322 0.4286 0.4408 0.5714 0.4577 0.5562 0.4526 0.6504 0.4306 0.5264 0.5104 0.5306 0.434 0.533 0.5547 0.5996 0.5061 0.5054 0.4741 0.5784 0.4364 0.4247 0.5248 0.7942 1915 0.3606 0.4138 0.439 0.3781 0.5696 0.4174 0.5656 0.3431 0.6046 0.3001 0.2841 0.3646 0.4205 0.3957 0.4639 0.3666 0.4004 0.4337 0.3871 0.4258 0.4243 0.4664 0.4721 1892 0.2699 0.4487 0.3891 0.3808 0.4901 0.5947 0.5482 0.4032 0.3757 0.3636 0.4364 0.4258 0.4207 0.3841 0.4634 0.5157 0.3395 0.3082 0.5697 0.5134 0.4293 0.4008 0.5447 3211 0.4754 0.4875 0.4708 0.3342 0.5289 0.6106 0.6773 0.447 0.4662 0.4099 0.467 0.3962 0.5647 0.5549 0.467 0.4211 0.5522 0.3999 0.5165 0.4312 0.4569 0.5566 0.5335 310 0.31116 0.3504 0.4263 0.2959 0.3319 0.4951 0.575 0.3565 0.3784 0.3271 0.3901 0.3397 0.4215 0.384 0.4179 0.4937 0.3552 0.3009 0.6178 0.4401 0.4094 0.4263 0.4852 736 0.3415 0.4049 0.3813 0.4472 0.5378 0.4501 0.5492 0.4399 0.4337 0.3568 0.3659 0.3324 0.4895 0.4517 0.3919 0.4006 0.3972 0.3659 0.7796 0.3629 0.4378 0.3933 0.4601 725 0.3963 0.4631 0.6044 0.3761 0.329 0.5436 0.5158 0.5104 0.4004 0.5132 0.4126 0.4694 0.4965 0.4855 0.4552 0.4764 0.4744 0.4431 0.6105 0.5415 0.5496 0.5741 0.6117 787 0.3745 0.3517 0.3071 0.3567 0.4424 0.4951 0.4095 0.2795 0.4307 0.3404 0.4577 0.5301 0.5554 0.5024 0.5015 0.4556 0.4531 0.2713 0.6117 0.4913 0.435 0.4917 0.4437 218 0.4084 0.435 0.5274 0.439 0.3428 0.4302 0.5744 0.446 0.4526 0.439 0.424 0.4804 0.5081 0.4699 0.4804 0.5817 0.4246 0.3933 0.6679 0.3548 0.3899 0.3973 0.452 3243 0.5851 0.6434 0.5331 0.6286 0.701 0.6019 0.7118 0.5118 0.6077 0.4173 0.5318 0.4721 0.7608 0.4484 0.5166 0.4934 0.4913 0.3972 0.7101 0.5867 0.4914 0.6061 0.5534 226 0.461 0.3922 0.4572 0.2757 0.5007 0.5674 0.5838 0.4621 0.4518 0.4099 0.3813 0.3828 0.4789 0.5105 0.4091 0.4848 0.4062 0.4519 0.5617 0.4699 0.4005 0.6504 0.5189 154 0.4324 0.5401 0.4973 0.3654 0.5815 0.553 0.8473 0.3747 0.4766 0.4496 0.5796 0.4233 0.6315 0.4676 0.448 0.5516 0.6047 0.4541 0.6284 0.5634 0.4811 0.5105 0.489 410 0.2545 0.3369 0.4586 0.32 0.4747 0.4542 0.3993 0.3365 0.3726 0.463 0.4344 0.3976 0.3363 0.4939 0.3947 0.4756 0.4248 0.4053 0.5124 0.4607 0.4402 0.5376 0.6454 3414 0.2938 0.345 0.4756 0.2896 0.3617 0.3784 0.5226 0.3252 0.4286 0.3346 0.3452 0.2969 0.3784 0.3048 0.332 0.4499 0.4478 0.3537 0.4366 0.349 0.4479 0.3578 0.5245 1772 0.3334 0.3245 0.4602 0.3071 0.4381 0.4908 0.541 0.3125 0.5236 0.3004 0.345 0.361 0.4947 0.3565 0.4104 0.4395 0.4614 0.2904 0.5741 0.4126 0.4711 0.4733 0.5191
750 699 696 193 249 2027 741 292 403 1795 637 289 148 139 145 2862 kjnj 297 163 629 260 164 3244

216
Appendix 3.2……….continued
2012 0.5889 243 0.5188 0.3841
1983 0.7265 0.3874 0.4183 752 0.6386 0.3822 0.3376 0.4129
783 0.6973 0.4559 0.282 0.5119 0.4326 1992 0.5495 0.3326 0.333 0.4613 0.3093 0.2399
1845 0.4563 0.3849 0.3289 0.4366 0.314 0.4112 0.3702 322 0.6118 0.3719 0.4931 0.4266 0.5259 0.5138 0.446 0.3861
1915 0.4885 0.3516 0.357 0.4838 0.3166 0.3902 0.3242 0.2725 0.3769 1892 0.5889 0.464 0.305 0.4362 0.3597 0.3181 0.3436 0.3728 0.5344 0.413
3211 0.6423 0.4966 0.5105 0.4594 0.4079 0.5884 0.5418 0.3528 0.5446 0.4376 0.3939 310 0.5587 0.4528 0.3346 0.3754 0.3674 0.394 0.3393 0.3363 0.4179 0.3917 0.3209 0.3579
736 0.6931 0.5341 0.4914 0.4562 0.4588 0.4831 0.3695 0.4037 0.5482 0.4337 0.4571 0.5067 0.3715 725 0.6438 0.4875 0.4183 0.3591 0.5045 0.4498 0.5447 0.3326 0.4552 0.5435 0.5415 0.5314 0.4111 0.5528
787 0.6295 0.5177 0.3971 0.4011 0.3692 0.4082 0.465 0.3251 0.5631 0.4173 0.3925 0.4903 0.343 0.338 0.4939 218 0.5495 0.4008 0.3447 0.4747 0.4894 0.4052 0.4346 0.3578 0.466 0.4946 0.3001 0.4986 0.4134 0.3235 0.5021 0.3531
3243 0.5554 0.601 0.545 0.7632 0.4552 0.6089 0.4917 0.4002 0.5318 0.4444 0.5447 0.4625 0.4578 0.4472 0.5658 0.497 0.5616 226 0.5647 0.4312 0.4961 0.3666 0.3829 0.4566 0.4572 0.3788 0.4376 0.4376 0.4966 0.428 0.3706 0.4256 0.3922 0.4763 0.5128 0.4763
154 0.5187 0.6627 0.3925 0.6132 0.4374 0.6138 0.5795 0.3942 0.5641 0.5624 0.5107 0.4812 0.3168 0.5877 0.5543 0.489 0.5376 0.5293 0.4545 410 0.5321 0.4607 0.4806 0.4084 0.4374 0.4292 0.3972 0.3336 0.5488 0.5044 0.4015 0.5368 0.3874 0.3363 0.4853 0.3654 0.4213 0.6454 0.4415 0.4576
3414 0.4837 0.3373 0.2582 0.345 0.3257 0.2777 0.2979 0.2461 0.3723 0.2969 0.3972 0.48 0.2875 0.4166 0.3576 0.4399 0.3828 0.5393 0.392 0.4195 0.3942 1772 0.5217 0.4126 0.31 0.4094 0.3893 0.383 0.4346 0.2979 0.495 0.3242 0.4367 0.4846 0.2815 0.4177 0.3968 0.3414 0.4346 0.5191 0.4438 0.4213 0.3854 0.2636
local 2 2012 243 1983 752 783 1992 1845 322 1915 1892 3211 310 736 725 787 218 3243 226 154 410 3414 1772
699 0.3203 696 0.4084 0.4221
193 0.3495 0.3162 0.389 249 0.3495 0.5323 0.6006 0.4299
2027 0.4143 0.5038 0.4784 0.3872 0.4945 741 0.5226 0.5492 0.5088 0.4693 0.5905 0.5311
292 0.286 0.4208 0.4178 0.3424 0.4765 0.4866 0.4315 403 0.3093 0.3612 0.4256 0.4307 0.4825 0.5078 0.4966 0.3709
1795 0.2969 0.4138 0.3864 0.3528 0.4551 0.4812 0.5656 0.3028 0.4336 637 0.306 0.3455 0.4104 0.4022 0.454 0.4139 0.537 0.3423 0.4639 0.2715
289 0.3219 0.3484 0.4664 0.2575 0.4965 0.4944 0.5656 0.414 0.4774 0.4195 0.4194 148 0.3537 0.3096 0.5026 0.385 0.5378 0.5115 0.5492 0.4831 0.4205 0.5317 0.5031 0.4337
750 699 696 193 249 2027 741 292 403 1795 637 289

217
Appendix 4.1: Grain yield, grain type and levels of resistance
Maize weevil
Larger grain borer
Variety Grain yield (tons/ha)
Grain damage
(%) Resistance level
Grain damage (%)
Resistance level Grain type
139 2.32
3.75 Moderately susceptible 18 Highly susceptible semi-flint
145 3.43
3.50 Moderately susceptible
18.25 Highly susceptible semi-flint 148 1.51
2.00 Resistant 16.25 Highly susceptible semi-flint
154 2.77
3.75 Moderately susceptible
25 Highly susceptible dent
163 4.15
3.75 Moderately susceptible 14.25 Highly susceptible dent 164 2.19
2.75 Moderately resistant 20.75 Highly susceptible semi-flint
172 1.80
1.75 Resistant 13 Highly susceptible semi-flint
1772 3.76
1.25 Resistant
22.75 Highly susceptible semi-flint 1786 4.81
1.50 Resistant
17.75 Highly susceptible semi-flint
1795 3.49
3.25 moderately susceptible 13.25 Highly susceptible dent
1845 1.93
3.00 moderately susceptible 18.25 Highly susceptible dent 1850 1.70
1.50 Resistant 7.75 Highly susceptible dent
1857 1.29
3.25 Moderately susceptible
22.5 Highly susceptible dent
1892 2.80
2.25 Moderately resistant 20.75 Highly susceptible semi-flint 1915 2.28
12.75 Highly susceptible dent
193 2.79
2.00 Resistant 18.25 Highly susceptible semi-flint
1983 3.16
2.25 Moderately resistant 5.00 Highly susceptible dent 199 2.22
1.25 Resistant 13.25 Highly susceptible dent
1992 2.88
2.00 Resistant
6.75 Highly susceptible dent
2012 4.57
0.50 Resistant 6.75 Highly susceptible semi-flint 2017 1.01
2.75 Moderately resistant
7.75 Highly susceptible dent
2027 3.17
4.00 Susceptible 10.00 Highly susceptible dent
203 2.42
4.50 Susceptible
19.00 Highly susceptible semi-flint 206 2.39
3.50 Moderately susceptible 14.00 Highly susceptible semi-flint
218 0.99
0.50 Resistant 20.00 Highly susceptible semi-flint
226 2.06
2.00 Resistant 17.5 Highly susceptible semi-flint 240 1.40
3.00 Moderately susceptible
18.00 Highly susceptible semi-flint
243 2.61
1.75 Resistant
23.75 Highly susceptible semi-flint
249 2.20
1.75 Resistant
9.85 Highly susceptible dent 250 1.79
1.00 Resistant
18.5 Highly susceptible dent
260 2.41
3.00 Moderately susceptible
30.75 Highly susceptible semi-flint
2862
2.75 Moderately resistant
dent 2872 2.49
3.5 Moderately susceptible
11.25 Highly susceptible semi-flint
289 2.43
2.75 Moderately resistant 8.25 Highly susceptible semi-flint
292 2.76
4.00 Susceptible 21.5 Highly susceptible semi-flint 297 1.54
2.25 Moderately resistant 19.00 Highly susceptible semi-flint
303 0.26
2.75 Moderately resistant 31.00 Highly susceptible semi-flint
310 1.02
2.50 Moderately resistant
32.00 Highly susceptible semi-flint 315 2.35
3.25 moderately susceptible 10.75 Highly susceptible semi-flint
322 1.74
1.75 Resistant 13.5 Highly susceptible semi-flint
3243 2.85
2.25 Moderately resistant
10.75 Highly susceptible dent 3244 3.91
0.75 Resistant
7.25 Highly susceptible dent
332 2.44
3.25 susceptible
13.25 Highly susceptible dent
3411 2.60
4.00 Susceptible 8.75 Highly susceptible semi-flint 3414 2.30
4.00 Susceptible 12.5 Highly susceptible semi-flint
386 1.60
1.00 Resistant
8.00 Highly susceptible semi-flint
403 2.49
2.25 Moderately resistant
8.00 Highly susceptible semi-flint 410 1.65
5.75 Highly susceptible
13.5 Highly susceptible semi-flint
445 3.81
0.25 Resistant 8.25 Highly susceptible semi-flint 539 1.35
2.75 Moderately resistant 12.50 Highly susceptible semi-flint
569 4.09
2.00 Resistant 12.25 Highly susceptible dent
584 2.13
3.50 Moderately susceptible
semi-flint 629 2.41
3.75 Moderately susceptible
18.25 Highly susceptible semi-flint
637 2.58
1.50 Resistant 11.00 Highly susceptible semi-flint
696 2.24
3.75 Moderately susceptible
21.00 Highly susceptible dent 699 2.29
1.50 Resistant
8.50 Highly susceptible semi-flint
725 1.48
2.25 moderately resistant 13.75 Highly susceptible semi-flint

218
Table 4.1…….continued
Maize weevil
Larger grain borer
Variety Grain yield (tons/ha)
Grain damage
(%) Resistance level
Grain damage (%)
Resistance level Grain type
736 2.45
3.25 Moderately susceptible
17.75 Highly susceptible semi-flint 740 3.84
3.25 Moderately susceptible
13.75 Highly susceptible semi-flint
741 1.81
1.75 Resistant
10.25 Highly susceptible semi-flint 750 3.52
4 Susceptible
22.25 Highly susceptible dent
752 4.18
1.5 Resistant 11.25 Highly susceptible semi-flint 783 2.81
2.5 Moderately resistant 26.5 Highly susceptible semi-flint
787 1.46
1.5 Resistant
14.25 Highly susceptible semi-flint 811 1.71
1.25 Resistant
15 Highly susceptible dent
Knjnj 2.31
2.5 Moderately resistant
10.75 Highly susceptible semi-flint Local 1 1.72
2.25 Moderately resistant 14.5 Highly susceptible dent
Local 2 2.66 1.5 Resistant 17.25 Highly susceptible semi-flint
Appendix 5.1: Correlation between resistant parameters for maize weevil (set a)
Total_number_of_insects 1 - weight_loss_% 2 0.5226* -
Grain_damage_% 3 0.4653* 0.6965 - Adult_mortality 4 0.464*7 -0.0425 0.0082 -
1 2 3 4
*Highly significant at P<0.001
Appendix 5.2: Correlation between resistant parameters (set b)
Grain_damage_% 1 - Weight_loss_% 2 0.6364** -
Adult_mortality 3 -0.0629 -0.0186 - Total_number_of_insects 4 0.1959 0.2544 0.5294* -
1 2 3 4
*significantly correlated at p<0.01, **significantly correlated at p<0.001
Appendix 5.3: Correlation between resistant parameters in set c
Adult_mortality 1 - Flour_g 2 -0.1844 -
Grain_damage_% 3 -0.2975 0.9025* - Total_number_of_insects 4 -0.0288 0.8761* 0.8187* -
weight_loss_% 5 -0.2206 0.8925* 0.9847* 0.8287* - 1 2 3 4 5
*Significantly correlated at p<0.001

219
Appendix 5.4: Correlation between resistant parameters in set d
Adult_mortality 1 - Grain_damage_% 2 -0.5657** -
Total_number_of_insects 3 -0.3992* 0.5174** - Weight_loss_% 4 -0.622*** 0.7658*** 0.3246 -
flour_g 5 -0.4112* 0.7971*** 0.5895** 0.5978** - 1 2 3 4 5
*significantly correlated at p<0.05, **significantly correlated at p<0.01, ***significantly correlated at p<0.001
Appendix 5.5: Correlation between resistant parameters for maize weevil (set e)
Insect mortality 1 Grain_damage_% 2 -0.1735 -
Total_number_of_insects 3 0.9909* -0.117 - Weight_loss_% 4 -0.0249 0.9324* 0.0277 -
1 2 3 4
*significantly correlated at p<0.001
Appendix 5.6: Correlation between resistant parameters for LGB resistance (set e)
Grain_damage_% 1 - Insect_mortality 2 -0.2272 -
Total_number_of_insects 3 0.6685* 0.1982 - Weight_loss_% 4 0.9726* -0.1666 0.6771* -
flour_g 5 0.9171* -0.1856 0.7753* 0.8798* -
1 2 3 4 5
*significantly correlated at p<0.001

220
Appendix 5.7: Ranking of F1 hybrids using percent grain damage due to maize weevil
across sets
Variety Grain damage (%) Rank Set Variety Grain damage (%) Rank Set Variety Grain damage (%) Rank set
MWA06A 0.72 1 A MWMW11940 1.72 29 B lgMW087940 2.169 57 E
MWA12395 0.794 2 A MWMW446939 1.772 30 B MWlg06021 2.23 58 E
MWA08202 1 3 A MWA446A 1.797 31 A MWlg11176 2.23 59 E
MWA11312 1.042 4 A MWMW13940 1.802 32 b MWlg939164 2.23 60 E
MWA10A 1.086 5 A MWA151395 1.812 33 A MWMW674939 2.242 61 B
MWA11A 1.138 6 A MWMW446940 1.819 34 B lgMW08710 2.282 62 E
MWA122W 1.192 7 A MWMW1313 1.873 35 B MWlg06264 2.291 63 E
MWA151273 1.212 8 A MWMW67410 1.912 36 B MWMW13939 2.308 64 B
MWA11273 1.221 9 A MWMW13940 1.955 37 B MWlg13074 2.326 65 E
MWA44606 1.296 10 A MWMW151675 1.958 38 B MWlg13218 2.387 66 E
MWA676202 1.312 11 A MWA12202 1.972 39 A MWlg13089 2.401 67 E
MWA10273 1.328 12 A MWA06273 1.976 40 A MWMW674675 2.412 68 B
MWA151A 1.357 13 A MWA11403-3 1.989 41 A lgMW26411 2.426 69 E
MWA12A 1.381 14 A lgMW007940 2.021 42 E MWMW1306 2.435 70 B
MWA15175 1.383 15 A lgMW089151 2.021 43 E lgMW17606 2.438 71 E
MWA10395 1.396 16 A MWlg08007 2.021 44 E MWMW13676 2.469 72 B
MWA6760020 1.418 17 A MWlg08164 2.021 45 E lgMW02111 2.478 73 E
MWMW15106 1.497 18 B MWA1512W 2.063 46 A lgMW16410 2.501 74 E
MWMW446937 1.497 19 B MWMW11937 2.071 47 B MWMW44606 2.514 75 B
MWA4462W 1.505 20 A lgMW021151 2.095 48 E MWMW446675 2.537 76 B
MWA112W 1.506 21 A lgMW16413 2.095 49 E MWMW69006 2.563 77 B
MWA67406 1.584 22 A MWlg151264 2.095 50 E MWMW151940 2.581 78 B
MWMW0611 1.609 23 B MWA06395 2.108 51 A MWMW11675 2.592 79 B
MWMW674937 1.609 24 B MWMW1106 2.126 52 B lgMW16411 2.596 80 E
MWMW151939 1.637 25 B MWMW1110 2.141 53 B MWMW13675 2.629 81 B
MWA062W 1.662 26 A MWMW1210 2.141 54 B MWMW151937 2.781 82 B
MWA11202 1.684 27 A lgMW08812 2.156 55 E lgMW26410 3.138 83 E
MWMW12939 1.7 28 B MWA06403-3 2.162 56 A lgMW08711 3.232 84 E
CV = 19.27, SE= 0.3785, LSD= 0.9394, P<0.001, Note: Set A: Crosses between adapted Malawi lines and maize weevil resistant lines, Set B: Crosses between maize weevil resistant lines, Set E: Crosses between maize weevil resistant lines and larger grain borer resistant lines

221
Appendix 5.8: Ranking of F1 based on percent grain damage due to LGB across sets
Variety Grain damage (%) Rank Set Variety Grain damage (%) Rank Set Variety Grain damage (%) Rank Set
LGA089116 0.998 1 C LGA074I83 1.861 29 C LGLG081218 2.363 57 d LGA087I83 1.266 2 C lgMW08710 1.894 30 E LGA089444 2.394 58 C LGA088A 1.278 3 C LGLG088176 1.908 31 D LGLG089074 2.41 59 D LGA0740020 1.317 4 C LGA074158 1.909 32 C MWlg08164 2.412 60 E LGA264202 1.357 5 C LGLG087176 1.915 33 D LGLG007074 2.413 61 D LGLG089218 1.365 6 D lgMW08812 1.945 34 E LGA2640020 2.416 62 C LGLG021074 1.369 7 D LGA089A 1.962 35 C LGA074116 2.423 63 C LGA0870020 1.425 8 C lgMW021151 2.02 36 E MWlg13218 2.479 64 E MWlg06264 1.432 9 E LGLG088264 2.042 37 D LGA088444 2.58 65 C lgMW087940 1.493 10 E LGLG089089 2.059 38 D LGLG021264 2.586 66 D LGLG007164 1.549 11 D LGA089716 2.07 39 C lgMW16413 2.587 67 E LGA021I83 1.579 12 C LGLG089176 2.081 40 D LGA0210020 2.597 68 C LGA164116 1.589 13 C LGA164I83 2.085 41 C LGA218I83 2.598 69 C LGA176291-4 1.625 14 C MWlg06021 2.09 42 E LGA021A 2.626 70 C LGLG087264 1.644 15 D LGA264444 2.106 43 C lgMW02111 2.626 71 E LGLG007176 1.679 16 D LGA164A 2.128 44 C lgMW08711 2.626 72 E lgMW089151 1.685 17 E LGA218444 2.152 45 C lgMW26410 2.714 73 E LGLG087218 1.696 18 D LGA074A 2.168 46 C LGA264216 2.743 74 C LGLG088218 1.696 19 D LGLG087074 2.186 47 D lgMW007939 2.761 75 E LGA089I83 1.714 20 C LGA264I83 2.236 48 C LGLG088007 2.794 76 D LGA074444 1.726 21 C LGLG021176 2.244 49 D LGA164444 2.863 77 C LGLG074007 1.741 22 D LGA264158 2.253 50 C lgMW17606 2.947 78 E LGA021158 1.798 23 C LGLG088164 2.27 51 D LGA264A 2.995 79 C LGLG007218 1.818 24 D LGLG089007 2.272 52 D MWlg13074 3.081 80 E LGA0890020 1.822 25 C lgMW16410 2.277 53 E MWlg11176 3.111 81 E LGA089118 1.847 26 C LGLG164007 2.308 54 D LGLG007088 3.114 82 D LGA264116 1.854 27 C LGLG007264 2.32 55 D lgMW16411 3.165 83 E LGA021116 1.86 28 c MWlg13089 2.356 56 E lgMW26411 3.295 84 E
CV= 22.48, se= 0.4806, lsd =0.9241, p<0.001, Note: Set c: Crosses between adapted Malawi lines and larger grain borer resistant lines, Set d: Crosses between larger grain borer resistant lines Set e: Crosses between maize weevil resistant lines and larger grain borer resistant lines,