DETECTION OF THE RED PALM WEEVIL RHYNCHOPHORUS FERRUGINEUS USING ITS BIOACOUSTICS FEATURES
20
This article was downloaded by: [Bibliothek der TU Muenchen], [Walid Hussein] On: 13 April 2012, At: 04:02 Publisher: Taylor & Francis Informa Ltd Registered in England and Wales Registered Number: 1072954 Registered office: Mortimer House, 37-41 Mortimer Street, London W1T 3JH, UK Bioacoustics: The International Journal of Animal Sound and its Recording Publication details, including instructions for authors and subscription information: http://www.tandfonline.com/loi/tbio20 DETECTION OF THE RED PALM WEEVIL RHYNCHOPHORUS FERRUGINEUS USING ITS BIOACOUSTICS FEATURES WALID BARAKAT HUSSEIN a , MOHAMED AHMED HUSSEIN a & THOMAS BECKER a a Center of Life Science Engineering, Technical University of Munich, Weihenstephaner steig 20, D-85354, Freising, Germany Available online: 13 Apr 2012 To cite this article: WALID BARAKAT HUSSEIN, MOHAMED AHMED HUSSEIN & THOMAS BECKER (2010): DETECTION OF THE RED PALM WEEVIL RHYNCHOPHORUS FERRUGINEUS USING ITS BIOACOUSTICS FEATURES, Bioacoustics: The International Journal of Animal Sound and its Recording, 19:3, 177-194 To link to this article: http://dx.doi.org/10.1080/09524622.2010.9753623 PLEASE SCROLL DOWN FOR ARTICLE
-
Upload
independent -
Category
Documents
-
view
5 -
download
0
Transcript of DETECTION OF THE RED PALM WEEVIL RHYNCHOPHORUS FERRUGINEUS USING ITS BIOACOUSTICS FEATURES
This article was downloaded by: [Bibliothek der TU Muenchen], [WalidHussein]On: 13 April 2012, At: 04:02Publisher: Taylor & FrancisInforma Ltd Registered in England and Wales Registered Number:1072954 Registered office: Mortimer House, 37-41 Mortimer Street,London W1T 3JH, UK
Bioacoustics: TheInternational Journalof Animal Sound and itsRecordingPublication details, including instructions forauthors and subscription information:http://www.tandfonline.com/loi/tbio20
DETECTION OF THERED PALM WEEVILRHYNCHOPHORUSFERRUGINEUS USING ITSBIOACOUSTICS FEATURESWALID BARAKAT HUSSEIN a , MOHAMEDAHMED HUSSEIN a & THOMAS BECKER aa Center of Life Science Engineering,Technical University of Munich,Weihenstephaner steig 20, D-85354, Freising,Germany
Available online: 13 Apr 2012
To cite this article: WALID BARAKAT HUSSEIN, MOHAMED AHMED HUSSEIN& THOMAS BECKER (2010): DETECTION OF THE RED PALM WEEVILRHYNCHOPHORUS FERRUGINEUS USING ITS BIOACOUSTICS FEATURES,Bioacoustics: The International Journal of Animal Sound and its Recording,19:3, 177-194
To link to this article: http://dx.doi.org/10.1080/09524622.2010.9753623
PLEASE SCROLL DOWN FOR ARTICLE
Full terms and conditions of use: http://www.tandfonline.com/page/terms-and-conditions
This article may be used for research, teaching, and private studypurposes. Any substantial or systematic reproduction, redistribution,reselling, loan, sub-licensing, systematic supply, or distribution in anyform to anyone is expressly forbidden.
The publisher does not give any warranty express or implied or makeany representation that the contents will be complete or accurateor up to date. The accuracy of any instructions, formulae, and drugdoses should be independently verified with primary sources. Thepublisher shall not be liable for any loss, actions, claims, proceedings,demand, or costs or damages whatsoever or howsoever causedarising directly or indirectly in connection with or arising out of theuse of this material.
Dow
nloa
ded
by [
Bib
lioth
ek d
er T
U M
uenc
hen]
, [W
alid
Hus
sein
] at
04:
02 1
3 A
pril
2012

BioacousticsThe International Journal of Animal Sound and its Recording, 2010, Vol. 19, pp. 177–194© 2010 AB Academic Publishers
DETECTION OF THE RED PALM WEEVIL RHYNCHOPHORUS FERRUGINEUS USING ITS BIOACOUSTICS FEATURES
WALID BARAKAT HUSSEIN*, MOHAMED AHMED HUSSEIN AND THOMAS BECKER
Center of Life Science Engineering, Technical University of Munich, Weihenstephaner steig 20, D-85354 Freising, Germany
ABSTRACT
The Red Palm Weevil (RPW) is the most destructive pest of the date palm in the world and a serious pest of coconuts. The insect has caused up to 20% loss of these plantations in Asia and the Middle East. The economic damage to palm crops due to RPW could be mitigated significantly by bioacoustics recognition in an earlier phase of infestation and by applying the appropriate treatment. This study is conducted under the hypothesis that distinctive spectral and temporal features in RPW larval sounds can be combined to construct improved indicators for automated detection of infestations. In this paper, a signal processing system is developed with available acoustic technology to detect the existence of RPW in a tree through its feeding sounds. A large set of features are extracted, including unconventional features such as temporal roll-off, temporal slope and temporal spread. Additionally, an analysis is provided of the criteria for the choice of the optimum frame length, as well as the selection of the suitable window function. The results confirm the efficiency of the developed system with the selected representative features, window functions and frame length to detect the existence of the RPW.
Keywords: Red Palm Weevil, bioacoustics detection, signal processing, feature extraction, feature selection.
INTRODUCTION
Since the 1980s, the Red Palm Weevil (RPW) has rapidly expanded its geographical range westwards. It reached Saudi Arabia and the United Arab Emirates in 1985, spreading throughout the Middle East and into Egypt. In 1994 it was detected in Spain, Israel, Jordan and Palestine in 1999, Italy in 2004, Canary Islands in 2005, Balearic Islands, France, and Greece in 2006, and Turkey in 2007 (Malumphy & Moran 2007). The European Commission is in the process of
*Corresponding author. Email: [email protected]
178
introducing emergency measures to prevent the further spread of RPW within the European Community.
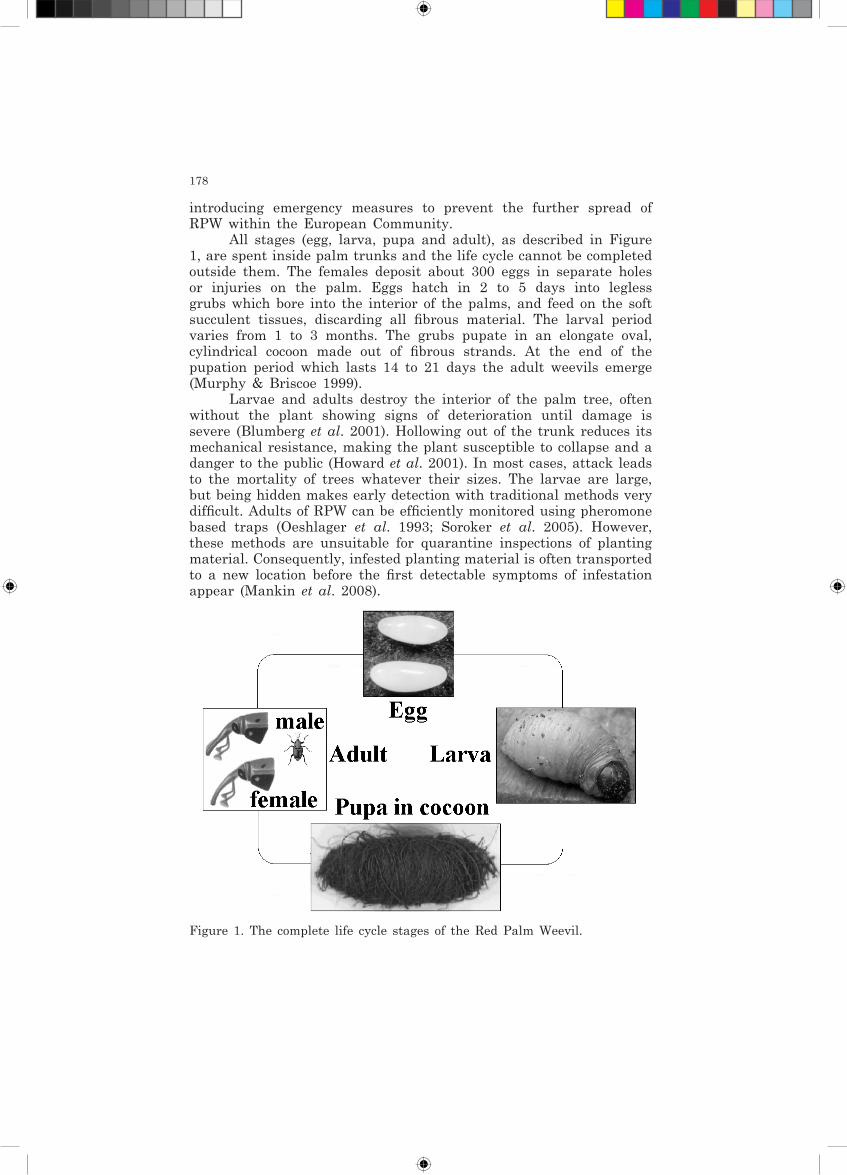
All stages (egg, larva, pupa and adult), as described in Figure 1, are spent inside palm trunks and the life cycle cannot be completed outside them. The females deposit about 300 eggs in separate holes or injuries on the palm. Eggs hatch in 2 to 5 days into legless grubs which bore into the interior of the palms, and feed on the soft succulent tissues, discarding all fibrous material. The larval period varies from 1 to 3 months. The grubs pupate in an elongate oval, cylindrical cocoon made out of fibrous strands. At the end of the pupation period which lasts 14 to 21 days the adult weevils emerge (Murphy & Briscoe 1999).
Larvae and adults destroy the interior of the palm tree, often without the plant showing signs of deterioration until damage is severe (Blumberg et al. 2001). Hollowing out of the trunk reduces its mechanical resistance, making the plant susceptible to collapse and a danger to the public (Howard et al. 2001). In most cases, attack leads to the mortality of trees whatever their sizes. The larvae are large, but being hidden makes early detection with traditional methods very difficult. Adults of RPW can be efficiently monitored using pheromone based traps (Oeshlager et al. 1993; Soroker et al. 2005). However, these methods are unsuitable for quarantine inspections of planting material. Consequently, infested planting material is often transported to a new location before the first detectable symptoms of infestation appear (Mankin et al. 2008).
Figure 1. The complete life cycle stages of the Red Palm Weevil.
179
The economic damage to date palm crops due to RPW could be mitigated significantly by early detection and treatment. Bioacoustics technology and x-rays enable the detection of the early phase of infestation, however the usage of x-rays is expensive. Acoustic technology has potential for reducing the expense and dangers involved in tree inspection. Acoustic recordings from insects in trees often reveal signals with spectral and temporal features that make them distinctive and easily detectable (Mankin et al. 2002). Preliminary studies (Mizrach et al. 2003; Hetzroni et al. 2004; Soroker et al. 2004, 2006) have demonstrated that sensitive microphones and dedicated amplifiers enable detection of the movement and feeding sounds of RPW larvae in palm trees.
Automated acoustic analyses of sounds produced by hidden insect infestations have focused primarily on spectral aspects of the insect-produced signals (Mankin et al. 2000, 2001, 2007). Temporal patterns were considered by Zhang et al. (2003) in classifying larval sounds as snaps, rustles, or repeated pulses, and it has been observed that different stored product insects produce distinctly different sound patterns (Andrieu & Lessard 1990; Mankin et al. 1997).
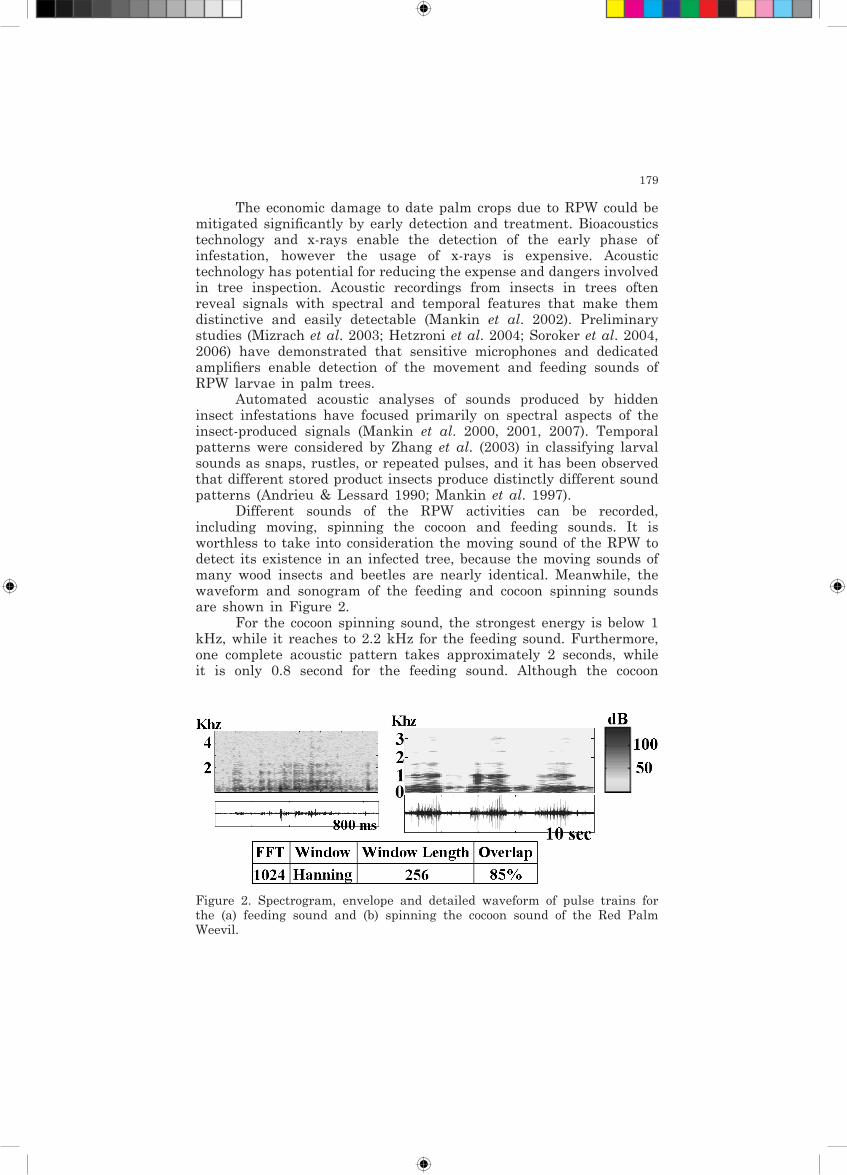
Different sounds of the RPW activities can be recorded, including moving, spinning the cocoon and feeding sounds. It is worthless to take into consideration the moving sound of the RPW to detect its existence in an infected tree, because the moving sounds of many wood insects and beetles are nearly identical. Meanwhile, the waveform and sonogram of the feeding and cocoon spinning sounds are shown in Figure 2.
For the cocoon spinning sound, the strongest energy is below 1 kHz, while it reaches to 2.2 kHz for the feeding sound. Furthermore, one complete acoustic pattern takes approximately 2 seconds, while it is only 0.8 second for the feeding sound. Although the cocoon
Figure 2. Spectrogram, envelope and detailed waveform of pulse trains for the (a) feeding sound and (b) spinning the cocoon sound of the Red Palm Weevil.
180
spinning sound may be a characteristic for the RPW, it is a seasonal sound that takes place only in certain periods of the overall life cycle. Therefore, it is less useful for the bioacoustic detection of the RPW. On the other hand; the feeding sound is the most frequently occurred sound in an infected tree. As RPW has a distinctive body shape and internal mouth structure compared to other coexisting beetles, its feeding sound has some unique features that make it more reliable for the RPW detection task.
In this paper, the audio detection system for the RPW feeding sound is presented in detail. The next section describes the recording method and the families of detection features which have been used in the system. This is followed by a section explaining the criteria behind the choice of the window function, before applying Fourier Transform to each time frame of the recorded sound. Finally, we discuss the selection of the representative features and the optimum frame length.
MATERIALS AND METHODS
Recording device
An infested date palm sample trunk (70 cm length, 38-43 cm diameters, 117 kg weight) was transferred from Saudi Arabia to Germany and stored in a quarantine room. The trunk was further divided into small blocks to focus on the weevil development and investigate the activities of the larvae during recording. This resulted in a complete picture for the RPW activities hidden in the trunk. Afterwards, equipment was installed including a mercury steam lamp, heater, humidity device, thermometer, infrared video cameras, as well as the recording device.
Two different recording devices were assessed for this task. The first was a Laar Ultrasound Gate hard disk recording System (frequency range 50 Hz – 250 kHz). The second was a Laar WD 60 detector with amplifying system and insertion sensors of different types (Contact microphone, airborne ultrasound microphone, contact acceleration sensor and a combined contact/airborne probe sensor). The best recordings were obtained via the second device which was attached to a Laar/Avisoft SASLab Pro sound analyzer (50 Hz to 30 kHz). Since there was no contact from the recording person, every recorded sound was caused by the RPW activities in the trunk. For a period of 13 subsequent months (~3 life cycles), covering different environments (i.e., pressure and temperature changes), 251 adult weevils emereged from the trunk (and were later eradicated) and 980 successful feeding sound recordings (each of 0.8 second) were made of the RPW.
181
Signal processing
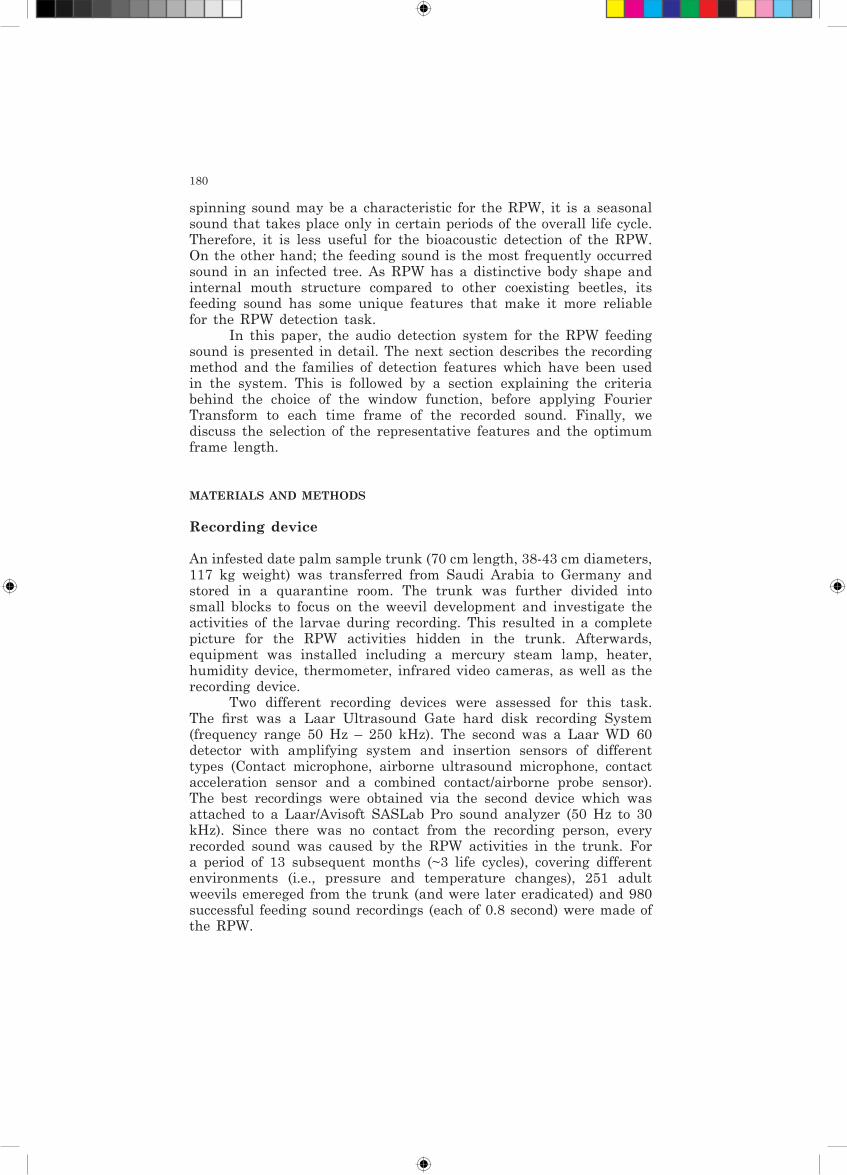
The recordings were digitized at 11,025 Hz sampling rate on a computer and saved in .wav file format. The recorded signals were then high-pass filtered with a 200-Hz cutoff frequency to eliminate low-frequency background noise. The recorded signals were then divided into time frames with 90% overlap between frames, as shown in Figure 3. A program was developed using MATLAB, with user-friendly graphical interface, to hold all the signal processing procedures up to the detection step.
Time domain features
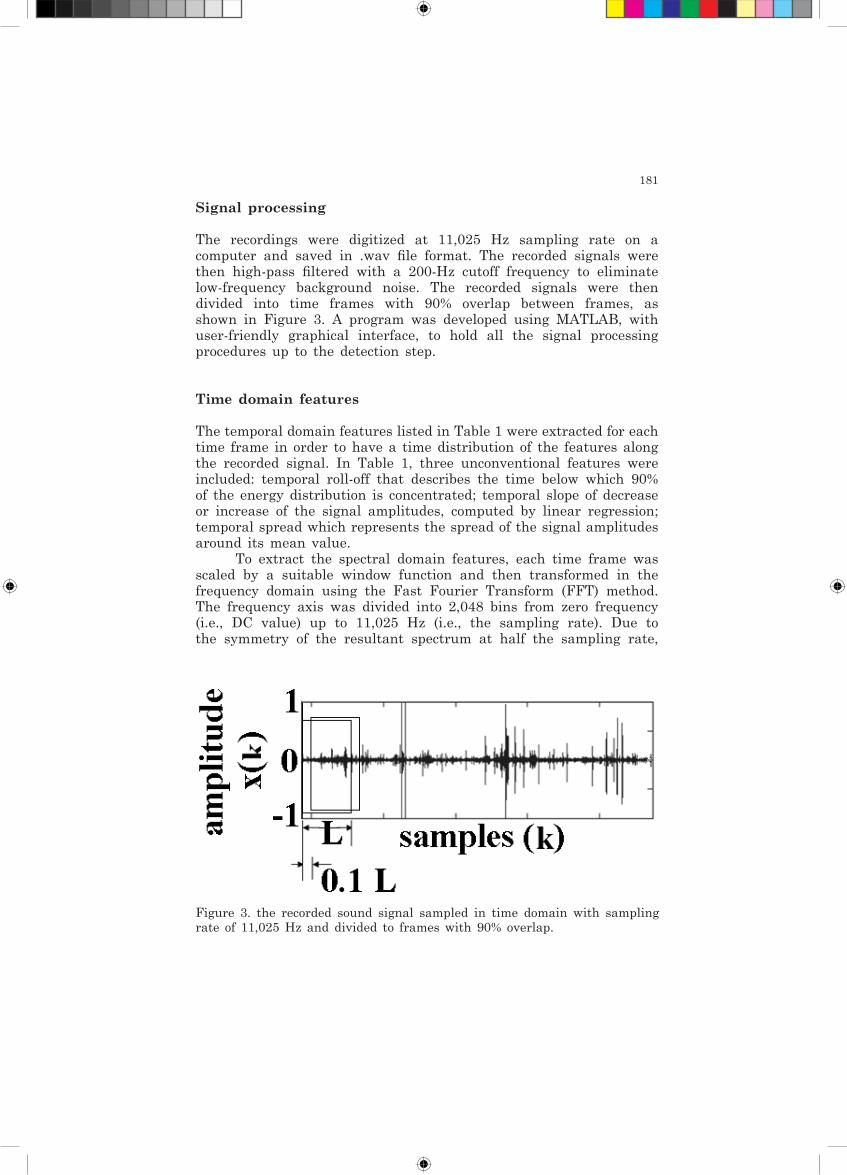
The temporal domain features listed in Table 1 were extracted for each time frame in order to have a time distribution of the features along the recorded signal. In Table 1, three unconventional features were included: temporal roll-off that describes the time below which 90% of the energy distribution is concentrated; temporal slope of decrease or increase of the signal amplitudes, computed by linear regression; temporal spread which represents the spread of the signal amplitudes around its mean value.
To extract the spectral domain features, each time frame was scaled by a suitable window function and then transformed in the frequency domain using the Fast Fourier Transform (FFT) method. The frequency axis was divided into 2,048 bins from zero frequency (i.e., DC value) up to 11,025 Hz (i.e., the sampling rate). Due to the symmetry of the resultant spectrum at half the sampling rate,
Figure 3. the recorded sound signal sampled in time domain with sampling rate of 11,025 Hz and divided to frames with 90% overlap.
182
TABLE 1
The time domain features which are used in this study to detect the existence of the Red Palm Weevil. Where x(k) is the amplitude at sample k, krf is the
bin number of the roll-off frequency, and N is the number of samples. One complete RPW feeding sound is 0.8 sec (i.e., 8,821 samples)
Name Equation
Zero crossing rate
Short time energy
Energy root mean square
Temporal entropy
Temporal roll-off
Temporal slope
Temporal flux
Temporal crest-factor
Temporal decrease
Temporal smoothness
Temporal centroid
Temporal spread
Temporal skewness
Temporal flatness
Temporal tonality
183
only the spectrum values corresponding to the first 1,024 bins were taken into consideration, resulting in a significant reduction in data processing.
Windowing
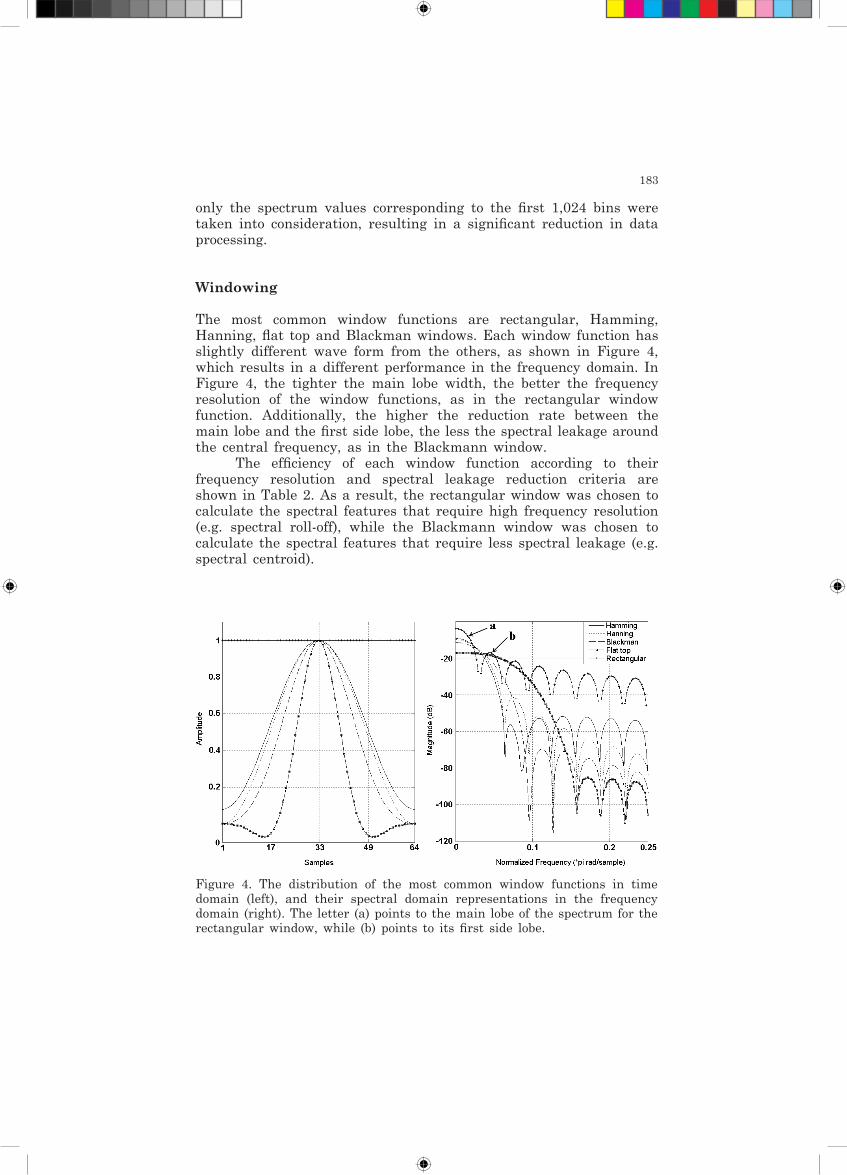
The most common window functions are rectangular, Hamming, Hanning, flat top and Blackman windows. Each window function has slightly different wave form from the others, as shown in Figure 4, which results in a different performance in the frequency domain. In Figure 4, the tighter the main lobe width, the better the frequency resolution of the window functions, as in the rectangular window function. Additionally, the higher the reduction rate between the main lobe and the first side lobe, the less the spectral leakage around the central frequency, as in the Blackmann window.
The efficiency of each window function according to their frequency resolution and spectral leakage reduction criteria are shown in Table 2. As a result, the rectangular window was chosen to calculate the spectral features that require high frequency resolution (e.g. spectral roll-off), while the Blackmann window was chosen to calculate the spectral features that require less spectral leakage (e.g. spectral centroid).
Figure 4. The distribution of the most common window functions in time domain (left), and their spectral domain representations in the frequency domain (right). The letter (a) points to the main lobe of the spectrum for the rectangular window, while (b) points to its first side lobe.

184
Frequency domain features
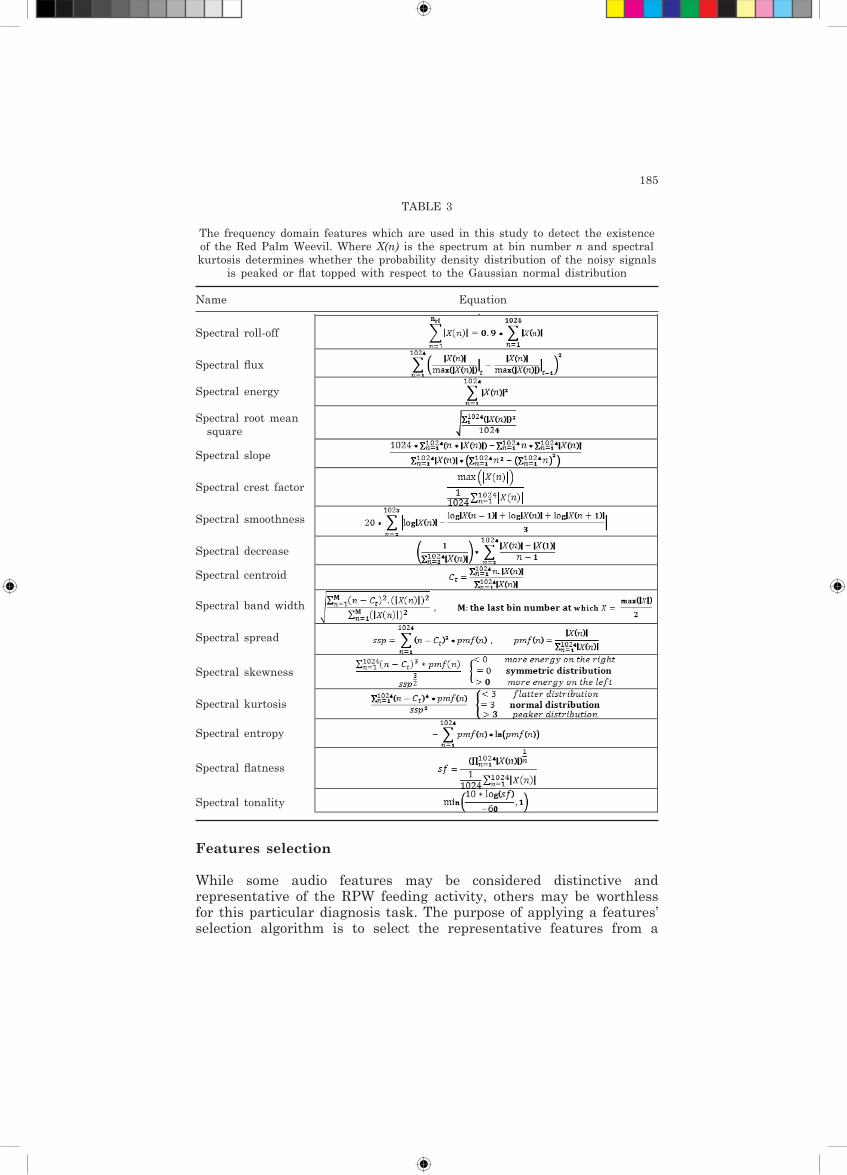
The spectral domain features listed in Table 3 were extracted after applying the FFT to the windowing time frame. Adding these spectral features to the previously calculated temporal features, a group of 31 features were extracted for each time frame.
TABLE 2
Comparison of the frequency resolution and spectral leakage analyses of the different window functions of Figure 5.
Window Frequency resolution Spectral leakage reduction
Hamming Good FairHanning Good GoodBlackman Poor BestFlat top Poor GoodRectangular Best Poor
Figure 5: (a) Schematic diagram for the features selection algorithm. (b) Flow chart for the features selection algorithm. (po) is the percentage of frames overlap for a frame length of 0.4 sec., (j) is the number of the set, and (n) is the total number for the extracted features out of the signal.
185
TABLE 3
The frequency domain features which are used in this study to detect the existence of the Red Palm Weevil. Where X(n) is the spectrum at bin number n and spectral kurtosis determines whether the probability density distribution of the noisy signals
is peaked or flat topped with respect to the Gaussian normal distribution
Name Equation
Spectral roll-off
Spectral flux
Spectral energy
Spectral root mean square
Spectral slope
Spectral crest factor
Spectral smoothness
Spectral decrease
Spectral centroid
Spectral band width
Spectral spread
Spectral skewness
Spectral kurtosis
Spectral entropy
Spectral flatness
Spectral tonality
Features selection
While some audio features may be considered distinctive and representative of the RPW feeding activity, others may be worthless for this particular diagnosis task. The purpose of applying a features’ selection algorithm is to select the representative features from a
186
large set of features. Feature selection algorithms typically fall into two categories: feature ranking (Peng et al. 2005) and subset selection (Singhi & Liu 2006). Feature ranking ranks the features by a metric and eliminates all features that do not achieve an adequate score. Subset selection searches the set of possible features for the optimal subset by removing the most irrelevant and redundant features from the data. In this study the feature ranking method was applied. To handle this, the temporal and spectral features were extracted for 765 out of the 980 RPW feeding sound recordings. Subsequently, the average feature value was calculated for the 765 values (based on the 765 recordings). If more than 80% of the recordings have a feature value that lies within 5% deviation from the corresponding average feature value, that feature will be selected as a distinctive feature. The algorithm, as shown in Figure 5, was implemented for 60, 70, 80, and 90% frames overlap and the resultant selected features were stored in set(1), set(2), set(3), and set(4); respectively, as clarified in Table 4.
Optimum frame length
As mentioned above, the recorded signal is divided into a number of time frames. The time frame length depends on the total duration of the desired sound (e.g. the feeding sound), the percentage of overlap, and the required number of time frames. Equation (1) may be used to calculate the frame duration
(1)
where x is the whole sound duration; y is the frame duration; and n is the number of frames. For example, it requires 0.208 second for each frame to divide the feeding sound of the RPW (0.8 sec) into 20 time frames with 85% overlap. Whereas there is an optimum selection for the frame length which is affected by the intended representative features. In depth, if the mean zero crossing rate is considered as identification feature for the feeding sound of the RPW, the frame period should ensure that the value of the mean zero crossing rate is approximately the same for all recorded feeding sounds of the RPW. In Figure 6, the predetermined sets of features (i.e., set(1), set (2), set(3), and set(4)) were extracted for two audio signals (signal (1), and signal (2)), as well as for a reference signal of a typical feeding sound of the RPW, over different choices of frame lengths. Signal (1) contains a feeding sound for a RPW, while signal (2) does not contain a feeding sound. The mean square error between the selected features
y xn percentage of overlapping
=+ - -1 1 1( ).( )
187
of each signal and the reference signal features was calculated and scanned with the corresponding frame length.
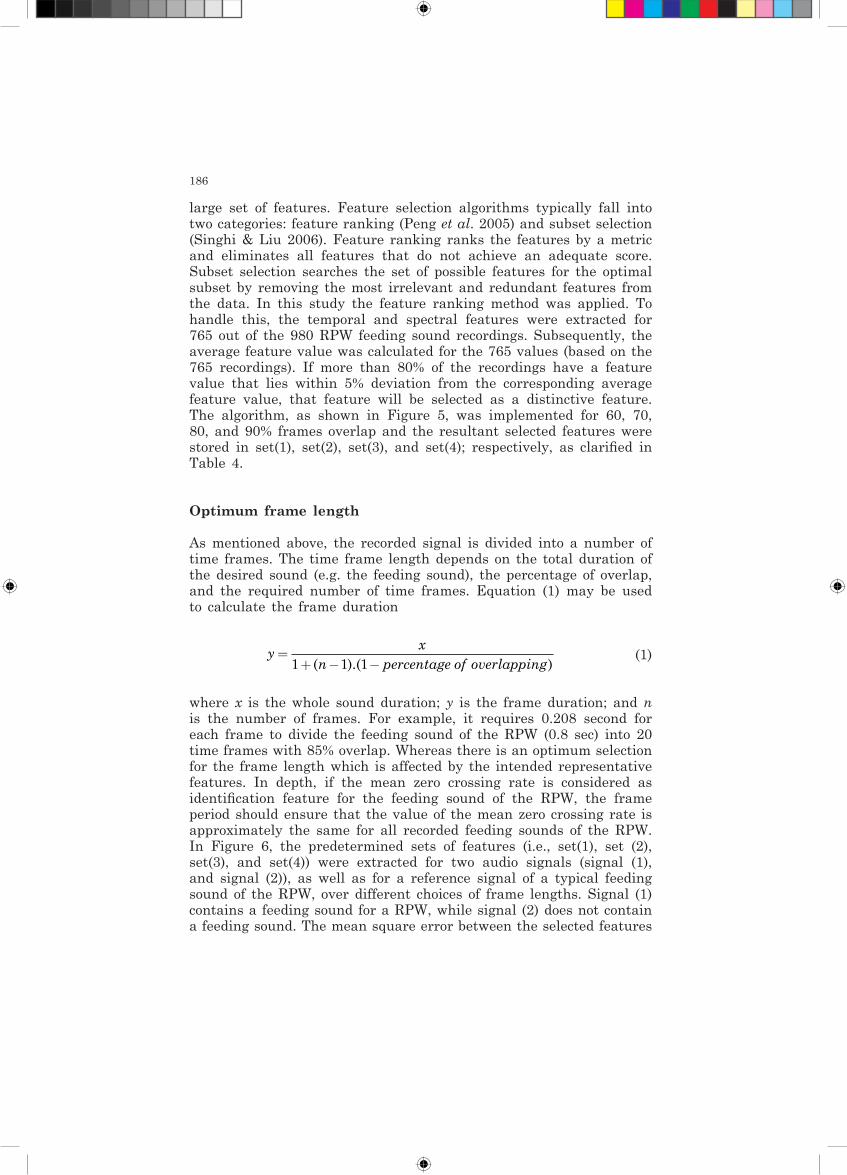
In this paper, features set(4), with an overlap of 90%, is chosen in the detection of the feeding sound of the RPW, and as a result of Figure 6, an optimum frame length of 0.42 sec is selected. The reason for the choice of features set (4) is its large content of worldwide implemented features in the task of sound-based surveillance, and also it contains the three innovative features of this study (i.e., temporal roll-off, temporal slope and temporal spread).
TABLE 4
The enclosing set for the selected features, results from the features selection algorithm of Figure 5 and frame
overlap values of 60, 70, 80, and 90%.
Feature Enclosing Set
Zero crossing rate 1,3,4Short time energy 2,4Energy root mean square 3,4Temporal entropy 1,2Temporal roll-off 1,3,4Temporal slope 2,4Temporal flux 2,3Temporal crest-factor 2,3,4Temporal decrease 1,2Temporal smoothness 1Temporal centroid 1,4Temporal spread 1,4Temporal skewness 2,3Temporal flatness 1,3Temporal tonality 2,3Spectral roll-off 2,3,4Spectral flux 1,3Spectral energy 1,2Spectral root mean square 1,2,4Spectral slope 2,4Spectral crest factor 1,3Spectral smoothness 1,3Spectral decrease 2,4Spectral centroid 1,4Spectral band width 4Spectral spread 3,4Spectral skewness 4Spectral kurtosis 1,4Spectral entropy 2,3,4Spectral flatness 2,3Spectral tonality

188
RESULTS AND DISCUSSION
Developing the system
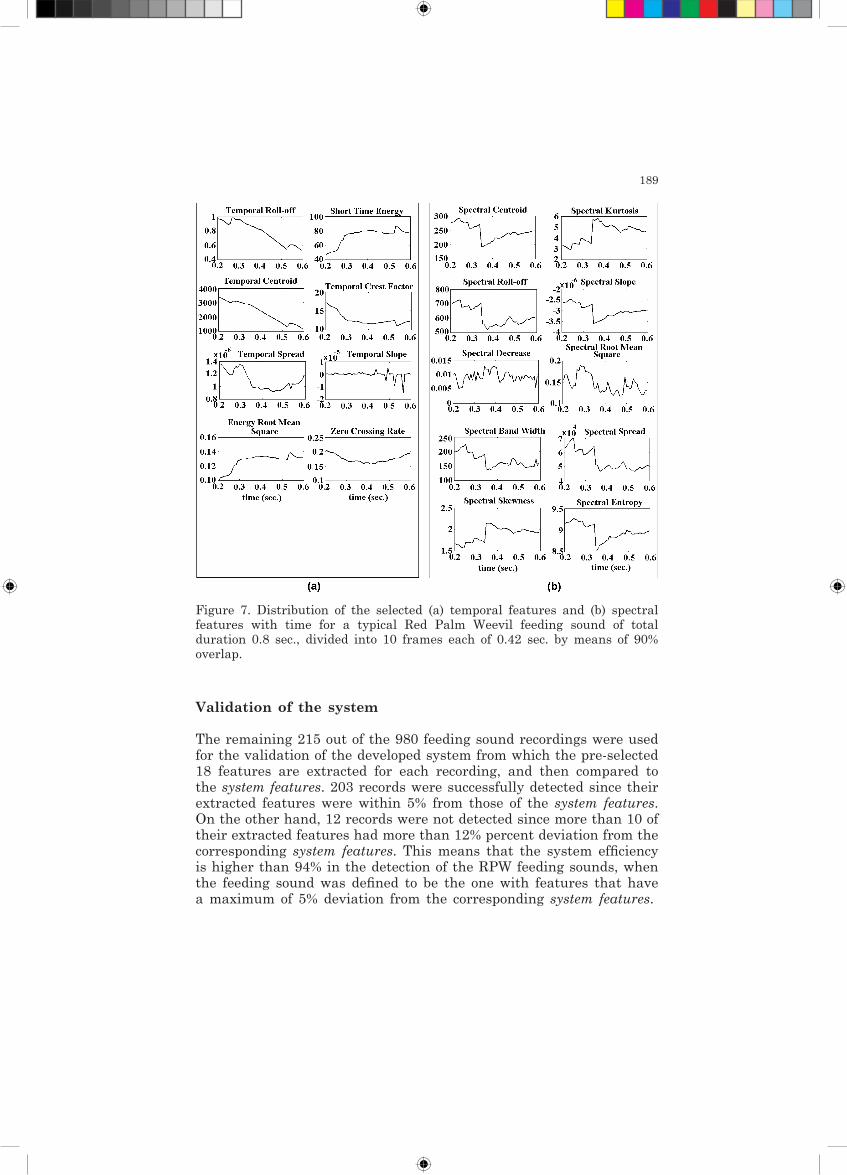
The selected temporal as well as the selected spectral features were extracted for 765 out of the 980 recordings, using features listed in Table 1 and Table 3 respectively. The distributions of these features with time are shown in Figure 7 for a typical RPW feeding sound. In Figure 7, some features experience equivalent standard deviations, which make it difficult to differentiate among them, e.g. temporal roll-off and temporal centroid, spectral slope and spectral centroid; and spectral kurtosis and spectral skewness. Meanwhile the mean value of most features is more representative than the standard deviation. This necessitates careful attention to exclude redundant values in the choice of the related statistic for each feature. Table 5 shows which statistic was assigned to each feature. Therefore, one representative value was considered for each feature over one recording and this value averaged for the 765 recordings. The resultant system contained 18 representative features (i.e., set(4)) for the RPW feeding sound, and these features values were saved as the system features.
Figure 6. The mean square error between recorded sounds and a reference feeding sound of Red Palm Weevil versus the frame length. Based on features of (a) set(1), (b) set(2), (c) set(3), or (d) set(4). Signal (1) contains a feeding sound while signal (2) does not.
189
Figure 7. Distribution of the selected (a) temporal features and (b) spectral features with time for a typical Red Palm Weevil feeding sound of total duration 0.8 sec., divided into 10 frames each of 0.42 sec. by means of 90% overlap.
Validation of the system
The remaining 215 out of the 980 feeding sound recordings were used for the validation of the developed system from which the pre-selected 18 features are extracted for each recording, and then compared to the system features. 203 records were successfully detected since their extracted features were within 5% from those of the system features. On the other hand, 12 records were not detected since more than 10 of their extracted features had more than 12% percent deviation from the corresponding system features. This means that the system efficiency is higher than 94% in the detection of the RPW feeding sounds, when the feeding sound was defined to be the one with features that have a maximum of 5% deviation from the corresponding system features.

190
Evaluation of the system
In order to test the power of the developed system to detect the existence of the RPW in the field, the recording device with its insertion microphone was used. The insertion microphone brings the sensor near the sound source and avoids wind noise effects, resulting in high quality recordings. Human, animal, machinery and footsteps sounds were avoided as much as possible, since they can greatly affect the waveforms and result in a wrong detection.
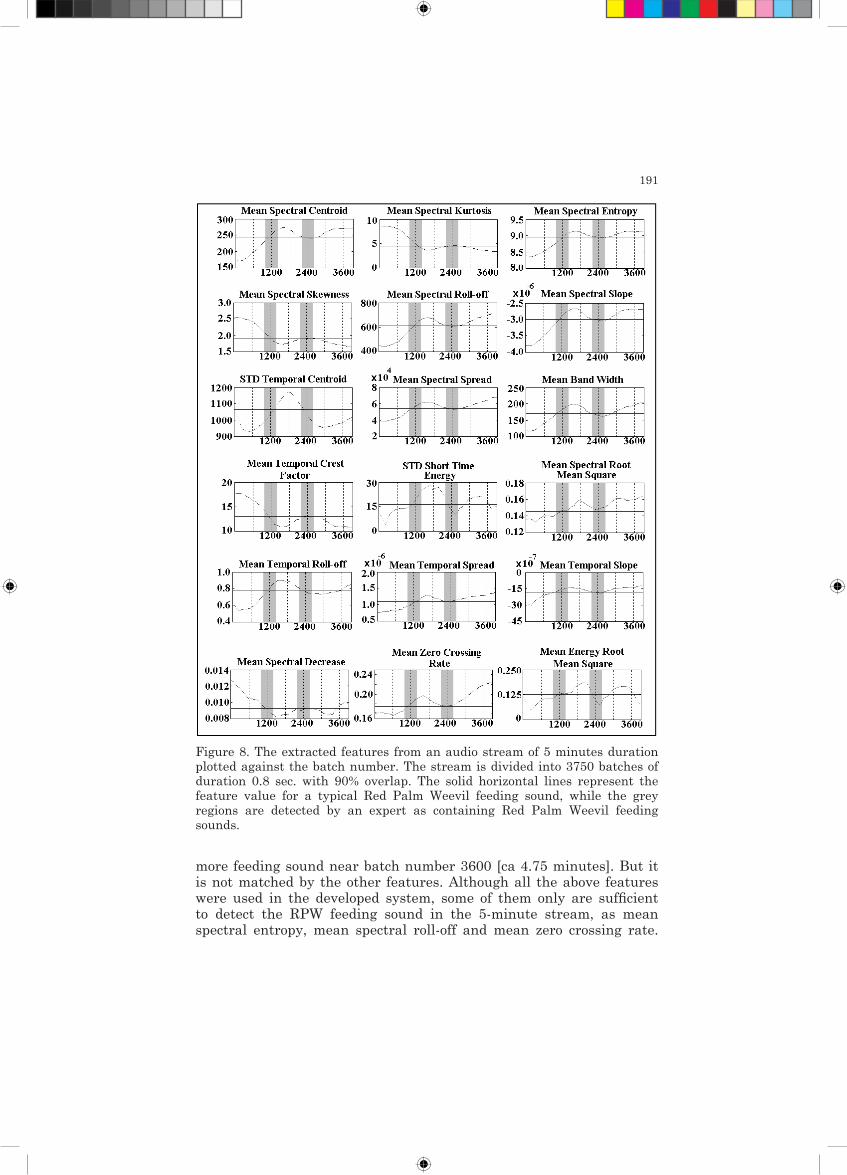
An audio stream of 5 minutes duration was recorded on one infected palm tree and the sound features were extracted for each 0.8 second batch, with 90% overlap. The extracted features were scanned for each batch as shown in Figure 8, as well as the system features (the horizontal solid lines). Similarly, an expert listener (see Acknowledgments) was able to detect the feeding sound regions by band pass filtering the whole stream between 1-3 kHz, followed by analysing the filtered stream using BVL Spectrogram V8 Sound analysis software. The analysis revealed trains of impulses separated by intervals of less than 500 ms that were considered as potential RPW feeding sounds (the grey regions in Figure 8).
From Figure 8, the features distributions in some batches have the same values as those for the reference feeding sound. These batches lie on the same times that were detected by an expert as a RPW feeding sound. Mean temporal roll-off, mean spectral decrease, STD short time energy, and STD temporal root mean square introduce one
TABLE 5
The related statistic and the window function assigned to each feature.
Feature Related statistic Window Function
Zero crossing rate mean —Short time energy std —Energy root mean square mean —Temporal roll-off mean —Temporal slope mean —Temporal crest-factor mean —Temporal centroid std —Temporal spread mean —Spectral roll-off mean RectangularSpectral root mean square mean BlackmanSpectral slope mean BlackmanSpectral decrease mean BlackmanSpectral centroid mean BlackmanSpectral band width mean BlackmanSpectral spread mean BlackmanSpectral skewness mean BlackmanSpectral kurtosis mean BlackmanSpectral entropy mean Blackman
191
more feeding sound near batch number 3600 [ca 4.75 minutes]. But it is not matched by the other features. Although all the above features were used in the developed system, some of them only are sufficient to detect the RPW feeding sound in the 5-minute stream, as mean spectral entropy, mean spectral roll-off and mean zero crossing rate.
Figure 8. The extracted features from an audio stream of 5 minutes duration plotted against the batch number. The stream is divided into 3750 batches of duration 0.8 sec. with 90% overlap. The solid horizontal lines represent the feature value for a typical Red Palm Weevil feeding sound, while the grey regions are detected by an expert as containing Red Palm Weevil feeding sounds.
192
Another two 50-second streams were recorded from two uninfected trunks – having average diameters of 36.4 and 45.8 centimetres – revealing sounds that did not match the system features, indicating no existence for the RPW in these trunks. The results demonstrate the efficiency of the developed system with the selected representative features, window functions, and frame period to detect the existence of the RPW through its feeding sound.
CONCLUSIONS
The economic damage to palm crops due to RPW could be mitigated significantly by bioacoustic recognition in an earlier phase of infestation and applying the appropriate treatment. While their secretive behaviour makes an early detection with traditional methods (e.g. pheromone traps) not applicable, it can be performed using bioacoustics recognition. Acoustic recordings from insects in trees often reveal sound waves with spectral and temporal features that make them distinctive and easily detectable. In this study, before dividing the sound wave into time frames, the optimum frame length – for the case of the RPW feeding sound – was investigated for several overlap percentages (60, 70, 80, 90%). The developed system applies 90% overlap, with its corresponding optimum frame interval of 0.42 sec, to divide the recorded sounds. For each frame, 15 time domain features were extracted. In addition, the criteria behind the selection of the window function were studied, followed by the extraction of 16 frequency domain features, using their appropriate window functions.
Because some features may be useless for RPW detection, the values of the selected feature should have small deviation for all reference RPW feeding sounds. As a result, ten frequency domain features were selected, beside eight time domain features containing temporal roll-off, temporal slope and temporal spread. These three features are introduced as new features, and are competently implemented in the developed detection system. The developed system was validated to have an efficiency higher than 94% Therefore it was well able to detect the existence of the RPW feeding sound in a five-minute sound stream recorded on an infected trunk and its absence in two 50-second streams recorded on an uninfected trunk.
After the positive determination of the presence of Red Palm Weevil in a palm, it is necessary to remove the palm tree, because to date no real efficient treatment method exists. Also the disinfection of the soil needs to be taken under consideration. The next step of this research is to develop a machine learning program to handle all the available values for the feeding sound features in different environmental conditions. In order to decide whether a new recorded
193
sound represents a feeding sound, methods such as artificial neural networks or support vector machines may be implemented.
ACKNOWLEDGMENTS
This work is supported by the Deutsche Bundesstiftung Umwelt (DBU), grant number AZ 25124-34. Finally, we are grateful to Benedikt von Laar who helped by providing recordings of the Red Palm Weevil sounds and determined the feeding sounds in these recordings.
REFERENCES
Andrieu, A. J. & Fleurat-Lessard, F. (1990). Insect noise in stored foodstuffs. Compact disk, INRA, Versailles, France.
Blumberg, D., Navon, A., Kehat, E. & Lavski, S. (2001). Date palm pests in Israel early second millennium. Alon Hanotea, 55, 42-48.
Drosopoulos, S. & Claridge, M. (2006). Insect sounds and communication. Physiology, behaviour, ecology and evolution. New York:CRC Press LLC.
Hetzroni, A., Mizrach, A., Nakache, Y. & Soroker, V. (2004). Developing Spectral Model to Monitor Activity of Red Palm Weevil. Alon Hanotea, 58, 466-469.
Howard, F. W., Moore, D., Giblin-Davis, R. & Abad, R. (2001). Insects on Palms. Oxford: CABI Publishing, Wallingford.
Malumphy, C. & Moran, H. (2007). Plant Pest Notice: Red palm weevil (Rhynchophorus ferrugineu). Central Science Laboratory, Sand Hutton, York, U.K.
Mankin, R. W., Shuman, D. & Coffelt, J. A. (1997). Acoustic counting of adult insects with differing rates and intensities of sound production in stored wheat. Journal of Economic Entomology, 90, 1032-1038.
Mankin, R. W., Brandhorst-Hubbard, J., Flanders, K. L., Zhang, M., Crocker, R. L., Lapointe, S. L., McCoy, C. W., Fisher, J. R. & Weaver, D. K. (2000). Eavesdropping on insects hidden in soil and interior structures of plants. Journal of Economic Entomology, 93, 1173-1182.
Mankin, R. W., Lapointe, S. L. & Franqui, R. A. (2001). Acoustic surveying of subterranean insect populations in citrus groves. Journal of Economic Entomology, 94, 853-859.
Mankin, R. W., Osbrink, W. L., Oi, F. M. & Anderson, J. B. (2002). Acoustic Detection of Termite Infestations in Urban Trees. Journal of Economic Entomology, 95, 981-988.
Mankin, R. W., Hubbard, J. L. & Flanders, K. L. (2007). Acoustic indicators for mapping infestation probabilities of soil invertebrates. Journal of Economic Entomology, 100, 790-800.
Mankin, R. W., Mizrach, A., Hetzroni, A., Levsky, S., Nakache, Y. & Soroker, V. (2008). Temporal and spectral features of sounds of wood-boring beetle larvae: identifiable patterns of activity enable improved discrimination from background noise. Florida Entomologist, 91, 241-248.
Mizrach, A., Hetzroni, A., Nacashe, Y. & Soroker, V. (2003). Acoustic detection of Red Palm Weevil activity in the tree trunk. Proceeding of the International Congress on Information Technology in Agriculture, Food and Environment (Ed. by Sindir, K. O.), p. 25. Izmir, Turkey.
Murphy, S. T. & Briscoe, B. R. (1999). The red palm weevil as an alien invasive: biology and prospects for biological control as a component of IPM. Biocontrol News and Information, 20, 35-45.
194
Oehlschlager, A. C., Chinchilla, C. M., Jiron, L. F., Morgan, B. & Mexzon, R. G. (1993). Development of an effective pheromone based trapping system for the American palm weevil, Rhynchophorus palmarum, in oil palm plantations. Journal of Economic Entomology, 86, 1381-1392.
Palestrini C., Pavan G. & Zunino M. (1991). Acoustic signals in Copris incertus Say (Coleoptera Scarabaeidae Coprinae). Ethology, Ecology & Evolution, 1, 143-146.
Peng, H., Long, F. & Ding, C. (2005). Feature selection based on mutual information: criteria of max-dependency, max-relevance, and min-redundancy. IEEE Transactions on Pattern Analysis and Machine Intelligence, 27, 1226-1238.
Singhi, S. & Liu, H. (2006). Feature subset selection bias for classification learning. Proceedings of the 23rd international conference on machine learning. Pittsburgh, Pennsylvania 2006, pp. 849-856.
Soroker, V., Nakache, Y., Landau, U., Mizrach, A., Hetzroni, A. & Gerling, D. (2004). Utilization of sounding methodology to detect infestation by Rhynchophorus ferrugineus on palm offshoots. Phytoparasitica, 32, 6-8.
Soroker, V., Blumberg, D., Haberman, A., Hamburger-Rishard, M., Reneh, S., Talebaev, S., Anshelevich, L. & Harari, A. R. (2005). Current status of red palm weevil infestation in date palm plantations in Israel. Phytoparasitica, 33, 97-106.
Soroker, V., Gindin, G., Glazer, I., Pinhas, J., Levsky, S., Eliahu, M., Biton, S., Haberman, A., Nakache, Y., Mizrach, A. & Hetzroni, A. (2006). The red palm weevil infestation in Israel: occurrence and management. I Jornada International sobre el Picudo Rojo de la Palmeras. Agroalimed, Generalitat Valenciana 2006, pp. 59-79.
Zhang, M., Crocker, R. L., Mankin, R. W., Flanders, K. L. & Brandhorst-Hubbard, J. L. (2003). Acoustic identification and measurement of activity patterns of white grubs in soil. Journal of Economic Entomology, 96, 1704-1710.
Received 23 March 2009, revised 1 September 2009 and accepted 2 September 2009