Integrated Energy Master Plan - Sustain IU - Indiana University

Diverse perennial crop mixtures sustainhigher productivity over time based onecological complementarity
Valentın D. Picasso1*, E. Charles Brummer2, Matt Liebman3, Philip M. Dixon4
and Brian J. Wilsey5
1Departamento de Produccion Animal y Pasturas, Facultad de Agronomıa, Universidad de la Republica,Garzon 780, Montevideo 12900, Uruguay.2The Samuel Roberts Noble Foundation, 2510 Sam Noble Parkway, Ardmore, OK 73401, USA.3Department of Agronomy, Iowa State University, Ames, IA 50011, USA.4Department of Statistics, Iowa State University, Ames, IA 50011, USA.5Department of Ecology, Organismal and Evolutionary Biology, Iowa State University, Ames, IA 50011, USA.*Corresponding author: [email protected]
Accepted 28 February 2011; First published online 19 April 2011 Research Paper
AbstractCropping systems that rely on renewable energy and resources and are based on ecological principles could be more stable
and productive into the future than current monoculture systems with serious unintended environmental consequences such
as soil erosion and water pollution. In nonagricultural systems, communities with higher species diversity have higher
productivity and provide other ecosystem services. However, communities of well-adapted crop species selected for bio-
mass production may respond differently to increasing diversity. Diversity effects may be due to complementarity among
species (complementary resource use and facilitative interactions) or positive selection effects (e.g., species with higher
productivity dominate the mixture), and these effects may change over time or across environments. Our goal was to
identify the ecological mechanisms causing diversity effects in a biodiversity experiment using agriculturally relevant
species, and evaluate the implications for the design of sustainable cropping systems. We seeded seven perennial forage
species in a replicated field experiment at two locations in Iowa, USA, and evaluated biomass productivity of monocultures
and two- to six-species mixtures over 3 years after the establishment year under management systems of contrasting inten-
sity: one or three harvests per year. Productivity increased with seeded species richness in all environments, and the positive
relationship did not change over time. Polyculture overyielding was due to complementarity among species in the
community rather than to selection effects of individual species. Complementarity increased as a log-linear function of
species richness in all environments, and this trend was consistent across years. Legume–grass facilitation may explain
much of this complementarity effect. Although individual species with high biomass production had a major effect on
productivity of mixtures, the species producing the highest biomass in monoculture changed over the years in most
environments. Furthermore, transgressive overyielding was observed and was more prevalent in later years, in some
environments. We conclude that choosing a single well-adapted species for maximizing productivity may not be the best
alternative over the long term and that high levels of species diversity should be included in the design of productive and
ecologically sound agricultural systems.
Key words: monoculture, polyculture, richness, overyielding, transgressive overyielding, legume, grass
Introduction
A growing sector of the agriculture community believes
that research should focus on developing systems that
‘depend largely on contemporary energy, current sunlight
rather than scarce fossil fuels (. . .) and recognize the
overriding importance of ecology and uniqueness of
place’1. Polyculture systems, in which multiple species
are grown in mixture, may reduce dependence on external
inputs, economic risk and food insecurity, while protecting
natural resources2. Perennial herbaceous polycultures are
mixtures of perennial grass and forb species grown for
Renewable Agriculture and Food Systems: 26(4); 317–327 doi:10.1017/S1742170511000135
# Cambridge University Press 2011

agricultural purposes (grain, forage or biomass production)
that can increase diversity and productivity in agricultural
landscapes while reducing soil erosion, especially in lands
suitable for low-input systems3–6. Because these plant com-
munities are composed of perennial species, understanding
their long-term dynamics is critically important for
management recommendations.
Ecological studies in non-agricultural systems have
shown that plant species and functional diversity can
increase biomass productivity compared to monocultures, a
phenomenon termed as overyielding, but the mechanisms
responsible for these effects are still debated7,8. Species-
rich communities have a greater diversity of traits (e.g.,
various rooting depths) and may use resources more com-
pletely than monocultures. Positive interactions among
species can enhance productivity in diverse communities
(e.g., legumes can improve nitrogen availability to other
species8,9). These mechanisms, collectively referred to as
complementarity, provided the initial hypothesis for the
positive relationship between diversity and productivity10.
Overyielding may also occur when highly productive
species dominate the community, that is, there is a covari-
ance between the species yield in monoculture and its
relative yield in the mixture, an example of the selection
effect. Because complementarity and selection have differ-
ent theoretical and practical implications and both may
operate at the same time, it is relevant to distinguish be-
tween these effects in biodiversity experiments10.
A second relevant issue is whether overyielding effects
observed in biodiversity experiments are consistent across
time and environments. Long-term studies in grasslands
have shown a consistent and increasingly positive diversity
effect on productivity and stability11, and experiments
conducted at multiple locations have shown, in general, a
consistent increase in productivity with diversity across
locations12. However, experiments may operate at spatial
and temporal scales smaller than relevant to fully capture
agroecosystem dynamics13,14.
Individual species may perform differently in alternative
environments and/or years, and therefore diversity–produc-
tivity relationships may change with species composition in
agricultural contexts15. Also, because agricultural systems
require species and cultivars that involve important breed-
ing efforts, understanding the role of individual species on
polyculture productivity is relevant to design future breed-
ing programs. Furthermore, identifying the amount of
species diversity required to maximize productivity and
desirable ecosystem functions is a timely issue16. Of special
interest in an agricultural context is the identification of
situations promoting transgressive overyielding, that is,
when a polyculture yields more than the highest yielding
component species in monoculture, a phenomenon not
usually found in biodiversity experiments17.
In the first 2 years of a biodiversity experiment, we found
a positive biomass productivity–species richness relation-
ship, but the presence of a single high-yielding species in
each environment explained most of this diversity effect 15.
In the first paper we did not attempt to identify the
ecological mechanisms causing this relationship. However,
with an additional year of data, we attempted to evaluate
the productivity–species richness relationship in more
detail. Because perennial forage species expend energy
during establishment developing roots below ground, a
complex community may be expected to be in an estab-
lishment phase in the first 1–2 years post-seeding. Thus, the
third year of the experiment would represent the first year
that all species, especially the warm-season grasses, were
fully established, and with the addition of that year’s data,
changes in community dynamics over time could be detec-
ted. Therefore, in this paper, we extend the results from our
previous paper by analyzing the results of 3 years of our
experiment, with the goal of identifying in detail the eco-
logical mechanisms that sustained higher biomass yields
over a longer term and evaluating the implications for the
design of sustainable cropping systems. We specifically test
the following hypotheses: (1) that a positive productivity–
species richness relationship was consistent across environ-
ments over 3 years; (2) that the identity of the highest
yielding species changed over time in 3 years; (3) that a
positive overyielding–species richness relationship was due
to complementarity among species and not to a selection
effect; (4) that complementarity increased as a function of
species richness across environments and years; and (5)
transgressive overyielding increased over time across
environments.
Materials and Methods
Experimental design
Forty-eight plant community entries (i.e., treatments) were
assembled using seven perennial species from three
taxonomic groups: legumes [alfalfa (Medicago sativa L.),
white clover (Trifolium repens L.), Illinois bundleflower
(Desmanthus illinoensis (Michx.) MacM. ex B.L. Robins.
& Fern.)]; C3 grasses [orchardgrass (Dactylis glomerata L.)
and intermediate wheatgrass (Thinopyrum intermedium
(Host) Barkworth & D.R. Dewey)]; and C4 grasses
[switchgrass (Panicum virgatum L.) and eastern gamagrass
(Tripsacum dactyloides (L.) L.)]. Monocultures of each
species were included (7 entries), as well as selected poly-
cultures of two (19 entries), three (13 entries), four
(6 entries) and six (3 entries) species (for the list of entries
see Picasso et al.15). The suite of treatments was not
random but systematic so that for most levels of species
richness some entries included each individual species and
other entries did not. This design allowed us to analyze the
effect of individual species on the richness–productivity
relationship. Because legumes have been shown to have
a major impact on the results of biodiversity experi-
ments18,19, we included at least one legume in all entries
except for monocultures and two-species combinations of
grasses, and the same grass species and mixtures were
included with each of the three legumes. Monoculture seed
318 V.D. Picasso et al.

identity and seed density were: alfalfa (cv. 54H51) 838 pure
live seeds (PLS) m - 2, white clover (cv. Alice) 795 PLS
m - 2, bundleflower (University of Minnesota accessions)
199 PLS m - 2, orchardgrass (cv. Duke) 1625 PLS m - 2, inter-
mediate wheatgrass (cv. Oahe) 239 PLS m - 2. switchgrass
(cv. Cave-in-Rock), 621 PLS m - 2, and eastern gamagrass
(cv. PMK-24) 15 PLS m - 2 based on standard agronomic
recommendations for Iowa20,21. A replacement design was
used22, such that seed density for species in polycultures
was reduced proportionally according to the number of
species (e.g., a two-species mix included half of the seeds
of each monoculture). Thus, the expected proportion of
each species in the polyculture was 0.50, 0.33, 0.25 and
0.17 for two, three, four and six species, respectively, and
expected evenness was 1 for all polycultures.
Each entry was replicated three times in an alpha
lattice design at two locations: the Iowa State University
Agronomy and Agricultural Engineering Research Farm in
Boone, Boone Co., IA, USA, with a Nicollet loam soil
(fine-loamy, mixed, superactive, mesic Aquic Hapludolls)
and the ISU Hinds Research Farm in Ames, Story Co., IA,
USA with a Spillville loam soil (fine-loamy, mixed, super-
active, mesic Cumulic Hapludolls). In spring 2003, plots
were tilled before drilling seeds into 4-mr3-m plots con-
sisting of 20 rows spaced 0.15 m apart. Plots were mowed
in June and September 2003 to a 0.15-m height to control
weeds. In October 2003, the number of plants of each
species present along a 1-m transect per plot was counted.
Eastern gamagrass was reseeded by hand in April 2004,
because no plants were found in 2003. More details on site
characteristics and management practices can be found
elsewhere15.
In 2004, each plot was split into half to form two
2 mr3 m subplots that were allocated to either a multiple
harvest system with removal of all biomass, or to a single-
harvest management simulating a perennial grain system
with only seed biomass of selected species being removed.
The same allocations were used in 2005 and 2006 as well.
Plots were machine clipped with a flail-type harvester
(Carter Manufacturing, Brookston, IN, USA) equipped with
an electronic weigh system. A single 1-m-wider3-m-long
strip was harvested for biomass through the center of
each subplot. The adjacent 50-cm strips on either side of
the measured area were cut immediately after data col-
lection so that all biomass was clipped to ground level. Dry
matter percentage of samples taken from each subplot
immediately before each harvest was used to calculate dry
biomass weight per subplot (hereafter referred as total
biomass).
In the multiple harvest system, subplots were harvested
three times per year in 2004 and 2005, in late-May, mid-
July and mid-September; and twice in 2006, in late-June
and mid-August. At Ames in 2004 the third harvest was
incomplete because of field labor constrains, and so these
harvest data were dropped from the analysis. In the single-
harvest management, total accumulated biomass of the
subplots was harvested in late-October to early November
depending on the year. Before that, reproductive structures
of four species (Illinois bundleflower, orchardgrass, inter-
mediate wheatgrass and switchgrass) were hand harvested
from the entire subplot area as each species matured,
weighed and added to the total subplot biomass in 2004 and
2005, but no seed harvest was conducted in 2006.
Two different methods were used to estimate relative
abundance of each species (both seeded and weeds). In
2004 and 2005, individual species biomass was measured
by clipping two 0.09-m2 quadrats per plot, sorting species
in the laboratory, and weighing them. In 2005 and 2006,
individual species ground cover percentage was recorded
from visual observations on each plot by the same observer,
using a 1 m2 quadrat located in the center of the plot. Linear
regressions for the relative abundance of each species based
on biomass and ground cover for 2005 revealed a strong
association between the two variables (all P < 0.0001 and
average R2 = 0.78) for most seeded species with the excep-
tion of species with low yields in certain environments
(eastern gamagrass in B1 and B3, white clover in A1, wheat-
grass in A3), although linear coefficients were not equal to
one for several species. Therefore, relative abundance in
2006 was estimated using relative cover data for 2006 and
regression coefficients from 2005. We estimated the
biomass using the regression coefficients, rather than using
the cover estimates, because the linear coefficients differed
among species due to density differences, that is, biomass
per unit of cover varied among species.
Data analyses
We found location and management systemrentry
interactions (with crossover), and so all analyses were
conducted separately for location and management combi-
nations, hereafter referred to as environments: Boone-one
harvest (B1), Boone-three harvests (B3), Ames-one harvest
(A1) and Ames-three harvests (A3). The variable of interest
was biomass productivity of seeded species, and so biomass
of weeds (either spontaneous species or seeded species not
intended in a plot) was excluded from the analyses (similar
results were obtained when all species were considered,
see15). For each environment a heterogeneous regression
lines mixed model was fit, including richness of seeded
species (natural log transformed, continuous variable), year
(repeated measures on each plot), richnessryear interac-
tion, replications (large complete blocks) and blocks within
replication (smaller incomplete blocks of the alpha lattice
design). All factors were considered fixed except for
replication and block(rep), which were considered random.
An autoregressive covariance structure for the residuals
was used. In order to fit the correct model, we first tested
the hypothesis that the effect of richness was zero for all
years by fitting a model with only year and yearrrichness
effects, which we rejected if the yearrrichness effect was
significant. If the first hypothesis was rejected, we tested a
second hypothesis of no yearrrichness interaction by
fitting a full model with year, richness and yearrrichness,
Diverse perennial crop mixtures sustain higher productivity over time 319

and rejecting it if yearrrichness was significant23.
Least-squares means for each entry were calculated, and
means were separated using Tukey’s multiple comparisons
test. Because the presence of individual species was shown
to affect the relationship richness–productivity15, the effect
of the single species with higher 3-year average mono-
culture yields at each environment was tested by conduct-
ing regressions for the subsets of plots including and
excluding each of these single species for all environments
and years.
In order to identify the ecological mechanisms behind the
relationships richness–productivity, we partitioned the net
richness effect into complementarity and selection effects
using the method of Loreau and Hector10:
DY = YO -YE = N�DRY �M +N � cov(DRY,M)
where the net richness effect DY is the difference between
the observed yield of the polyculture (YO) and the expected
yield (YE) based on the sum of the component species’
monoculture yields weighted by their proportion in
the mixture. A positive net richness effect means that the
polyculture yields were greater than the average of the
monocultures, a condition we define as ‘polyculture over-
yielding’.
The complementary effect is denoted by N�DRY�M,
where N is the number of species in the mixture, M is the
mean monoculture yield of the component species and DRY
is the mean relative yield deviation across the i species in
the polyculture. The relative yield deviation of a given
species, DRYi, is the difference of that species’ observed
relative yield (RYi)—its polyculture yield divided by its
monoculture yield—and its expected relative yield (ERYi)
based on the proportion seeded in the polyculture. A
positive value of DRYi means that the species in poly-
culture yielded more than expected, a condition defined as
‘species overyielding’. The selection effect is defined as
N �cov(DRY, M), i.e., the covariance between relative yield
deviations and monoculture yields. Positive complementar-
ity effect occurs when the species in the polyculture, on
average, yield more than expected based on their mono-
culture yield and their proportion in the mixture. The sel-
ection effect is present if the relative yield deviation is
related to monoculture performance. A selection effect is
positive when as monocultures yields increase, relative
yield deviations in polycultures also increase, and it is
negative when as monocultures yields increase, relative
yield deviations decrease. Polyculture overyielding, com-
plementarity and selection effects can each be positive or
negative independently, and so this method provides a prac-
tical framework to understand the mechanisms involved in
the richness–productivity relationship. In our calculations,
we used the monoculture yields averaged over the three
replications in the experiment, and so the mean mono-
culture yield by environment and year was the basis for
comparisons to polyculture yield and relative yield as is
recommended for intercropping experiments by Federer24.
Monoculture yield of eastern gamagrass was zero in 2004
in Boone, and so we excluded it from the analyses for that
environment and year to avoid the problem of relative
yields approaching infinity when monoculture values are
too small8.
A mixed model similar to the one used for productivity
was fit for each of the three effects (i.e., polyculture over-
yielding, complementarity, and selection) and least squares
means by the richness level were calculated across years
by environment. The effect of year on the relationship
richness–overyielding, richness–complementarity and rich-
ness–selection was tested using the heterogeneous regres-
sion lines mixed-modeling approach described above.
In order to identify transgressive overyielding we
subtracted from each polyculture yield the highest mono-
culture yield of the species seeded in each mixture. Least-
square means for this variable by entry were calculated
by environment and year, using a mixed model fitted as
described for productivity. Mixtures with means signifi-
cantly different from zero (at the 10% probability level)
were identified as showing transgressive overyielding. The
proportion of mixtures showing transgressive overyielding
was calculated by environment and year, and differences in
this proportion between first and last years were assessed
with a Z-test assuming a normal approximation of the
binomial distribution.
All analyses of variance and contrasts were performed
using PROC MIXED and regression coefficients were cal-
culated using PROC REG, in the SAS statistical software
package25. Statistical significance was assessed at the 5%
level unless otherwise indicated.
Results
Productivity^richness relationship over time
There was a strong linear association between the observed
richness of seeded species and the original richness of
seeded species at the time of sowing for each combination
of environment and year (P < 0.0001; data not shown).
Analyses of effects of richness on productivity gave similar
results for both measures of richness. For clarity and con-
sistency with the complementarity-selection analyses, we
show the results here using seeded species richness.
We found an overall effect of species richness on pro-
ductivity for all environments (P < 0.0001). Environments
B1 and B3 had no richnessryear interaction; therefore, a
model without interaction was fit, where productivity was a
log-linear function of richness (for B1, b1 = 280; for B3,
b1 = 478, all P < 0.0001). A richnessryear interaction was
found in A1 (P = 0.02) and A3 (P = 0.03), but slopes were
positive for all years (for A1: b1 = 275 in 2004, b1 = 192 in
2005 and b1 = 331 in 2006; for A3: b1 = 261 in 2004,
b1 = 395 in 2005 and b1 = 405 in 2006, all P < 0.0001).
There was no consistent trend of either strengthening or
weakening of the richness–productivity relationship with
years, except for environment A3, where the slope in-
creased over time.
320 V.D. Picasso et al.

Individual species effects on productivityover time
Biomass yield of monoculture plots differed among species
within environments for all years (Fig. 1) except for Ames
in 2006. In B1, the highest monoculture yields were from
intermediate wheatgrass in 2004, but no significant differ-
ences were found among the three highest yielding species
in 2005 and 2006. In B3, alfalfa had the highest yields in
monoculture every year, and no other species had equi-
valent yield in any year. In A1 intermediate wheatgrass had
the highest monoculture yields in 2004, but no differences
were observed among the three highest yielding mono-
cultures in 2005 and 2006. In A3, no significant differences
were found among species in any year. Therefore, maxi-
mum monoculture yields were consistently observed from a
single species in only one environment every year (alfalfa
in B3); no single species show a similar pattern in the other
environments.
Alfalfa in the multiple harvest management and inter-
mediate wheatgrass in the single-harvest management were
the species with highest yields in monoculture in both
locations averaged over the 3 years. In A3 and B3, pro-
ductivity of plots with alfalfa was consistently higher than
that in plots without alfalfa across richness levels. In A1
and B1, productivity of plots with intermediate wheatgrass
was usually higher than that in plots without intermediate
wheatgrass across richness levels.
For the subset of plots excluding the highest-yielding
species in each environment, in general productivity in-
creased log-linearly with seeded species richness (Table 1).
The only exception was year 2005 for the one harvest
management environments (plots without intermediate
wheatgrass), where no increase in productivity was found
with richness. For the subset of plots including the highest-
yielding species in each environment there was a more
diverse response of productivity to richness (Table 1 and
Fig. 2) across environments. In B3, plots including alfalfa
in the seeded mix had constant and high productivity
regardless of seeded species richness. In A1 and B1, in
2004 and 2005 productivity of plots including intermediate
wheatgrass did not change with richness, but in 2006,
productivity did increase with richness. Finally, in A3, the
first 2 years productivity increased with species richness
and in 2006 there was no change.
Polyculture overyielding, complementarity andselection effects
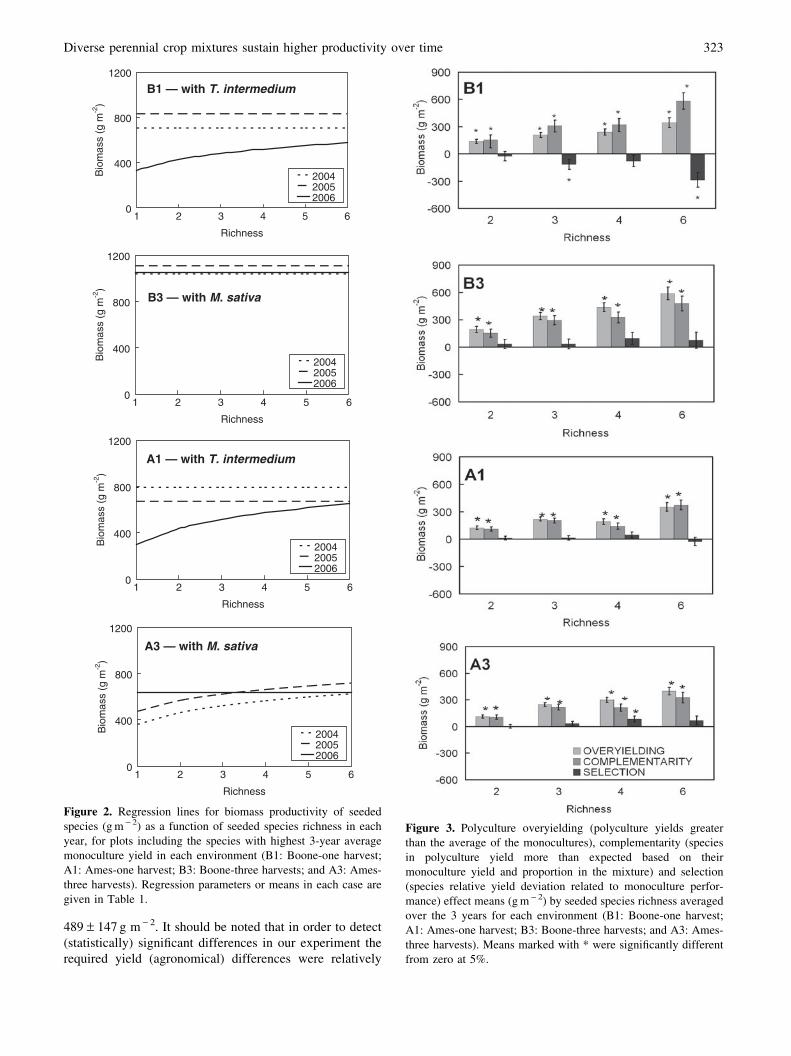
A positive polyculture overyielding effect was observed
across all environments (Figs. 3 and 4). Therefore, poly-
culture yields were greater than the average of the
component species in monoculture. For all environments
polyculture overyielding increased as a log-linear function
of species richness (b1 = 255.3 in B1, b1 = 461.4 in B3,
b1 = 219.8 in A1, b1 = 333.1 in A3, P < 0.0001 for all
environments).
B1
0
500
1000
1500
2004 2005 2006Year
Bio
mas
s (g
m-2
)
M. sativaT. intermediumP. virgatum*
B3
0
500
1000
1500
2004 2005 2006
Year
Bio
mas
s (g
m-2
)
M. sativaT. intermediumT. repens
*
* *
A1
0
500
1000
1500
2004 2005 2006
Year
Bio
mas
s (g
m-2
)
M. sativaT. intermediumP. virgatumD. glomerata
*
A3
0
500
1000
1500
2004 2005 2006
Year
Bio
mas
s (g
m-2
)
M. sativaT. intermediumT. repensD. glomerata
Figure 1. Means of biomass productivity (g m - 2) of the highest-
yielding monocultures over the 3 years in each environment (B1:
Boone-one harvest; A1: Ames-one harvest; B3: Boone-three
harvests; and A3: Ames-three harvests). Species included had
either the highest or second to high yield in at least 1 year in each
environment. Standard error bars for the mean in each environ-
ment are shown. Means marked with * were significantly different
from the other means shown below in that year in a Tukey
multiple comparisons test at 5%.
Diverse perennial crop mixtures sustain higher productivity over time 321
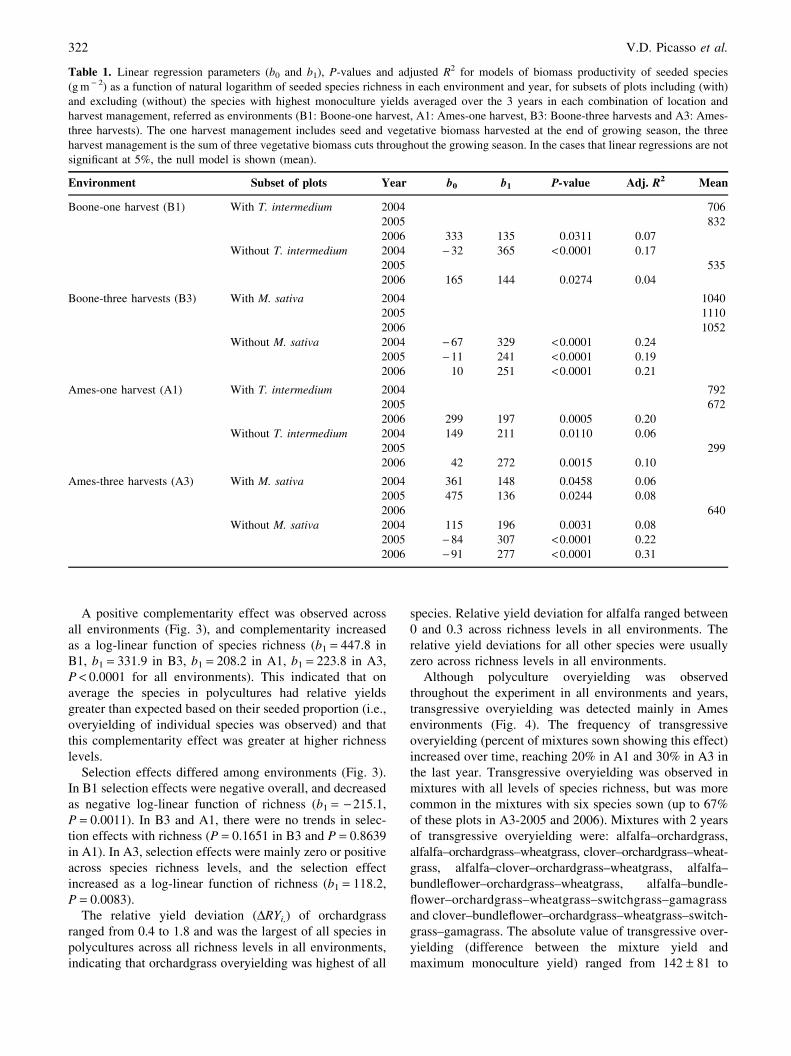
A positive complementarity effect was observed across
all environments (Fig. 3), and complementarity increased
as a log-linear function of species richness (b1 = 447.8 in
B1, b1 = 331.9 in B3, b1 = 208.2 in A1, b1 = 223.8 in A3,
P < 0.0001 for all environments). This indicated that on
average the species in polycultures had relative yields
greater than expected based on their seeded proportion (i.e.,
overyielding of individual species was observed) and that
this complementarity effect was greater at higher richness
levels.
Selection effects differed among environments (Fig. 3).
In B1 selection effects were negative overall, and decreased
as negative log-linear function of richness (b1 = -215.1,
P = 0.0011). In B3 and A1, there were no trends in selec-
tion effects with richness (P = 0.1651 in B3 and P = 0.8639
in A1). In A3, selection effects were mainly zero or positive
across species richness levels, and the selection effect
increased as a log-linear function of richness (b1 = 118.2,
P = 0.0083).
The relative yield deviation (DRYi,) of orchardgrass
ranged from 0.4 to 1.8 and was the largest of all species in
polycultures across all richness levels in all environments,
indicating that orchardgrass overyielding was highest of all
species. Relative yield deviation for alfalfa ranged between
0 and 0.3 across richness levels in all environments. The
relative yield deviations for all other species were usually
zero across richness levels in all environments.
Although polyculture overyielding was observed
throughout the experiment in all environments and years,
transgressive overyielding was detected mainly in Ames
environments (Fig. 4). The frequency of transgressive
overyielding (percent of mixtures sown showing this effect)
increased over time, reaching 20% in A1 and 30% in A3 in
the last year. Transgressive overyielding was observed in
mixtures with all levels of species richness, but was more
common in the mixtures with six species sown (up to 67%
of these plots in A3-2005 and 2006). Mixtures with 2 years
of transgressive overyielding were: alfalfa–orchardgrass,
alfalfa–orchardgrass–wheatgrass, clover–orchardgrass–wheat-
grass, alfalfa–clover–orchardgrass–wheatgrass, alfalfa–
bundleflower–orchardgrass–wheatgrass, alfalfa–bundle-
flower–orchardgrass–wheatgrass–switchgrass–gamagrass
and clover–bundleflower–orchardgrass–wheatgrass–switch-
grass–gamagrass. The absolute value of transgressive over-
yielding (difference between the mixture yield and
maximum monoculture yield) ranged from 142 – 81 to
Table 1. Linear regression parameters (b0 and b1), P-values and adjusted R2 for models of biomass productivity of seeded species
(g m - 2) as a function of natural logarithm of seeded species richness in each environment and year, for subsets of plots including (with)
and excluding (without) the species with highest monoculture yields averaged over the 3 years in each combination of location and
harvest management, referred as environments (B1: Boone-one harvest, A1: Ames-one harvest, B3: Boone-three harvests and A3: Ames-
three harvests). The one harvest management includes seed and vegetative biomass harvested at the end of growing season, the three
harvest management is the sum of three vegetative biomass cuts throughout the growing season. In the cases that linear regressions are not
significant at 5%, the null model is shown (mean).
Environment Subset of plots Year b0 b1 P-value Adj. R2 Mean
Boone-one harvest (B1) With T. intermedium 2004 706
2005 832
2006 333 135 0.0311 0.07
Without T. intermedium 2004 - 32 365 <0.0001 0.17
2005 535
2006 165 144 0.0274 0.04
Boone-three harvests (B3) With M. sativa 2004 1040
2005 1110
2006 1052
Without M. sativa 2004 - 67 329 <0.0001 0.24
2005 - 11 241 <0.0001 0.19
2006 10 251 <0.0001 0.21
Ames-one harvest (A1) With T. intermedium 2004 792
2005 672
2006 299 197 0.0005 0.20
Without T. intermedium 2004 149 211 0.0110 0.06
2005 299
2006 42 272 0.0015 0.10
Ames-three harvests (A3) With M. sativa 2004 361 148 0.0458 0.06
2005 475 136 0.0244 0.08
2006 640
Without M. sativa 2004 115 196 0.0031 0.08
2005 - 84 307 <0.0001 0.22
2006 - 91 277 <0.0001 0.31
322 V.D. Picasso et al.
489 – 147 g m - 2. It should be noted that in order to detect
(statistically) significant differences in our experiment the
required yield (agronomical) differences were relatively
B1 — with T. intermedium
0
400
800
1200
1 2 3 4 5 6
Richness
Bio
mas
s (g
m-2
)
200420052006
B3 — with M. sativa
0
400
800
1200
1 2 3 4 5 6
Richness
Bio
mas
s (g
m-2
)
200420052006
A1 — with T. intermedium
0
400
800
1200
1 2 3 4 5 6
Richness
Bio
mas
s (g
m-2
)
200420052006
A3 — with M. sativa
0
400
800
1200
1 2 3 4 5 6
Richness
Bio
mas
s (g
m-2
)
200420052006
Figure 2. Regression lines for biomass productivity of seeded
species (g m - 2) as a function of seeded species richness in each
year, for plots including the species with highest 3-year average
monoculture yield in each environment (B1: Boone-one harvest;
A1: Ames-one harvest; B3: Boone-three harvests; and A3: Ames-
three harvests). Regression parameters or means in each case are
given in Table 1.
Figure 3. Polyculture overyielding (polyculture yields greater
than the average of the monocultures), complementarity (species
in polyculture yield more than expected based on their
monoculture yield and proportion in the mixture) and selection
(species relative yield deviation related to monoculture perfor-
mance) effect means (g m - 2) by seeded species richness averaged
over the 3 years for each environment (B1: Boone-one harvest;
A1: Ames-one harvest; B3: Boone-three harvests; and A3: Ames-
three harvests). Means marked with * were significantly different
from zero at 5%.
Diverse perennial crop mixtures sustain higher productivity over time 323

high for productive agriculture situations (1420–4890 kg
ha - 1). In order to find mixtures with greater yield than any
monoculture in the experiment, we further identified mix-
tures that included the highest-yielding species in mono-
culture in that particular environment and year. When this
environment-wise transgressive overyielding was assessed,
we found only 5% of plots in A1 and 23% of plots in A3 in
the last year.
Discussion
The positive relationship between productivity and seeded
species richness did not change over time in our experiment
with agronomically relevant species in agricultural con-
ditions. This result provides further evidence that richness
effects are not transient, in accord with the results of many
ecological studies17. Other studies lasting longer than
5 years have found a strengthening of the positive
richness–productivity effect, but over the 3 years of our
study, we could not detect this effect.
Across all environments and richness levels, the net rich-
ness effect was positive; that is, polyculture overyielding
was observed. Complementarity effects were positive
(Figs. 5 and 6) and selection effects either negative or
zero. Complementarity arises when the average relative
yield deviation of individual species in the polyculture
versus their performance in monoculture is greater than
zero. In the absence of a selection effect, the polyculture
will exhibit overyielding if complementarity is present.
However, complementarity may be counteracted by a
negative selection effect, resulting in a polyculture that
does not exhibit overyielding. In our experiment, orchard-
grass and alfalfa showed species overyielding—i.e., they
consistently had DRY greater than zero, whereas most other
species had DRY consistently less than zero. This suggests
that orchardgrass and alfalfa were largely responsible for
the positive complementarity effect. The largest comple-
mentarity effect was the result of orchardgrass overyielding
in polycultures with legumes. Although we did not measure
plant nitrogen, orchardgrass leaves in polycultures with
legumes were visually greener than leaves in monocultures
(personal observation). This suggests that nitrogen facilita-
tion may have explained the complementarity effect, con-
sistent with other experiments that measured nitrogen pools
(see e.g., Fargione et al.8). Positive selection effects are
observed when species with high yields in monoculture
overyield in polycultures and low-yielding monocultures
perform poorly in polycultures. In contrast, negative selec-
tion effects exist when species with low yields in mono-
culture overyield in polycultures and species with
high monoculture performance underyield26,27. In our
experiment, alfalfa generally was highly productive in
monoculture and overyielded in mixtures, intermediate
wheatgrass was highly productive in A1 but did not
overyield in mixtures, and orchardgrass yielded poorly in
monocultures but overyielded in mixtures in all environ-
ments. As a result of these species interactions, in most
B3
0%
40%
80%
2004 2005 2006
Year
Per
cent
of p
lots
Overyielding
Transgressiveoveryielding
B1
0%
40%
80%
2004 2005 2006
Year
Per
cent
of p
lots
Overyielding
Transgressiveoveryielding
A1
0%
40%
80%
2004 2005 2006
Year
Per
cent
of p
lots
Overyielding
Transgressiveoveryielding
*
A3
0%
40%
80%
2004 2005 2006
Year
Per
cent
of p
lots
Overyielding
Transgressiveoveryielding
*
Figure 4. Percent of plots that showed significant polyculture
overyielding (polyculture yields greater than the average of the
monocultures in the mixture, open circles) and transgressive
overyielding (polyculture yields greater than the highest mono-
culture in the mixture, filled squares) over the 3 years of the
experiment in each environment (B1: Boone-one harvest; A1:
Ames-one harvest; B3: Boone-three harvests; and A3: Ames-three
harvests). Values in 2006 marked with * were significantly
different from the values in 2004, at 5%.
324 V.D. Picasso et al.

environments no selection effects were observed because
the positive effect of alfalfa was canceled out by the
negative effect of orchardgrass. In B1, a negative selection
effect was observed due to orchardgrass overyielding and
alfalfa, with a high monoculture performance, not over-
yielding substantially in mixtures.
Our results using cultivars of highly productive forage
species are consistent with ecological experiments at
multiple sites throughout Europe12 where polycultures over-
yielded and complementarity effects were positive, but
selection effects were variable across sites. Also, long-term
experiments on Minnesotan grasslands showed that the
complementarity effect increased consistently over time,
whereas the selection effect was positive during the first
2 years and negative later8. This shift occurred because
monoculture yields changed with time as initially low-
yielding species became the highest-yielding ones in later
years8. A negative selection effect has been observed in
communities with varying evenness and richness26 and in
polycultures containing a grass [Arrhenatherum elatius (L.)
Figure 5. Overview of perennial polyculture plots in Boone, IA, USA in June 2006, before biomass harvest.
Figure 6. Overview of perennial polyculture plots in Ames, IA, USA in May 2005, after the first biomass harvest.
Diverse perennial crop mixtures sustain higher productivity over time 325

P. Beauv. ex J. Presl et C. Presl] with high monoculture
performance that reduced all other species in mixtures28.
Species that increase overyielding by increasing the relative
yields of other highly productive species, due to improving
nitrogen availability for instance, can produce a positive
selection effect, as observed for Trifolium pratense L. and
T. repens L.28. Finally, a recent meta-analysis of plant
experiments found that, on average, complementarity
increased with time in experiments lasting more than
5 years, while selection effects remained constant17. Over-
yielding and transgressive overyielding (i.e., the polycul-
ture yields more than the highest-yielding monoculture)
increased in experiments that ran for longer time frames
because complementarity effects among species increased
with time. Since most experiments are short term and
transgressive overyielding in plant communities may take 5
years to be observed, the potential for transgressive over-
yielding has likely been underestimated. This also is likely
in our experiment.
Several high-diversity polycultures had yields similar to
the highest-yielding species in monoculture. Furthermore,
in various environments and years, transgressive over-
yielding was not observed, and plots including the highest
yielding species in monoculture did not change their yields
with richness. Therefore, in certain environments (e.g., B3)
with certain species well adapted to intense management
(e.g., alfalfa), monocultures may be the best production
option. Results similar to these have been used to argue that
monocultures or simple mixtures of two species (bicultures)
should be a better and more achievable target for sustain-
able agriculture systems in the short term16. Although we
agree that levels of plant diversity comparable to natural
ecosystems (>10 species) may not be needed in agricultural
systems, ‘reasonable’ levels of diversity (four to six
species) may be of better value. We support this statement
based on two of our findings.
First, in most of our environments the species with
highest monoculture yields changed over time. Therefore,
over the long term, it is not possible to define the ‘best’
monoculture. Individual species may change their relative
productivity because of external factors like climatic vari-
ability (rainfall and temperature) or pests and disease
pressure over the years, but also because of internal factors
related to their life cycle and age of the plant. In our experi-
ment for instance, switchgrass initially had a very low pro-
ductivity, which increased constantly over time (possibly
related to the root growth in the establishment years),
whereas intermediate wheatgrass had an opposite behavior
(perhaps related to disease pressure). If we additionally con-
sider that management (e.g., harvesting frequency) can (and
usually does) change in real farming situations over the years,
we find that choosing a single ‘best’ perennial species that
could maximize productivity becomes very difficult.
Second, in several environments and years, transgressive
overyielding was observed, and productivity did increase
with species richness even in the plots including the
highest-yielding species in monoculture. This suggests
that diverse polycultures may be more stable over longer
time frames than monocultures or bicultures, at least in
perennial agriculture systems using low levels of inputs.
Although in the short term the best-adapted monocultures
may equal or exceed polyculture performance, in the long
term, polycultures may be advantageous and transgressive
overyielding may become more common.
Finally, in this paper, we focus only on one ecosystem
function, i.e., biomass productivity. Sustainable agriculture
has multiple goals and, as other authors have suggested,
when other ecosystem functions are considered (e.g., pest
and weed suppression, soil fertility), the minimum number
of species required to maximize all functions may
increase15,29,30.
Conclusion
In summary, as our perennial polyculture communities had
more time to establish and grow and a third year of data
were measured and analyzed, the positive biomass
productivity–species richness relationship remained con-
sistent across time and environments, and this was due to
increasing ecological complementarity over time and not
selection effects. In some environments, transgressive
overyielding started to be detected, and the identity of the
highest-yielding species changed over time, which contrasts
with our results from the first 2 years. This stresses the need
for continuous funding of long-term studies of perennial
polyculture communities.
In this experiment, we used commonly grown forage
species to examine the ecological mechanisms that explain
the relationship between productivity and species richness
in mixtures. We intended to relate our results using agri-
culturally relevant species to previous research using
grassland and non-agricultural assemblages of plants. Our
results are broadly congruent with the ecological literature,
in which positive productivity-richness effects are due to
complementarity among species, but not selection effects.
We could extrapolate our work based on the ecology litera-
ture to suggest that the value of mixtures would increase
with time as complementarity effects become more
common and transgressive overyielding is more frequent.
Therefore, choosing a single well-adapted species for maxi-
mizing productivity in a monoculture may not be the best
alternative over the long term and reasonably high levels of
species diversity (four to six species) should be included in
the design of productive and ecologically sound perennial
agricultural systems.
Acknowledgements. This research was co-funded by grantsfrom R. Baker Center for Plant Breeding at Iowa State Uni-versity, Ames, IA, to E.C.B.; Fulbright-Uruguay Graduate Fel-lowship, NCR-SARE Graduate Student Project GNC05-055,Natural Systems Agriculture Graduate Fellowship from TheLand Institute, Salina, KS, and CSIC–UDELAR (Uruguay) toV.D.P. We thank Mark Smith and students in the ISU foragebreeding lab for field and lab assistance, the Graduate Programin Sustainable Agriculture at ISU for support and anonymousreviewers for improving the manuscript.
326 V.D. Picasso et al.

References
1 Francis, C. and Doran, J. 2010. Editorial: ‘food for life’:
looking beyond the horizon. Renewable Agriculture and Food
Systems 25:1–2.
2 Liebman, M. 1995. Polyculture cropping systems. In: M.
Altieri (ed.). Agroecology: the Science of Sustainable Agri-
culture. 2nd ed. Westview Press, Boulder, CO. p. 205–218.
3 Jackson, W. 2002. Natural systems agriculture: a truly radical
alternative. Agriculture Ecosystems and Environment 88:111–
117.
4 Schulte, L.A., Liebman, M., Asbjornsen, H., and Crow, T.R.
2006. Agroecosystem restoration through strategic integration
of perennials. Journal of Soil and Water Conservation 61:164A–
169A.
5 Cox, T.S., Glover, J.D., Van Tassel, D.L., Cox, C.M., and
DeHaan, L.R. 2006. Prospects for developing perennial-grain
crops. Bioscience 56:649–659.
6 Glover, J.D., Reganold, J.P., Bell, L.W., Borevitz, J.,
Brummer, E.C., Buckler, E.S., Cox, C.M., Cox, T.S., Crews,
T.E., Culman, S.W., DeHaan, L.R., Eriksson, D., Gill, B.S.,
Holland, J., Hu, F., Hulke, B.S., Ibrahim, A.M.H., Jackson,
W., Jones, S.S., Murray, S.C., Paterson, A.H., Ploschuk, E.,
Sacks, E.J., Snapp, S., Tao, D., Van Tassel, D.L., Wade, L.J.,
Wyse, D.L., and Xu, Y. 2010. Increased food and ecosystem
security via perennial grains. Science 328:1638–1639.
7 Loreau, M., Naeem, S., Inchausti, P., Bengtsson, J., Grime,
J.P., Hector, A., Hooper, D.U., Huston, M.A., Raffaelli, D.,
Schmid, B., Tilman, D., and Wardle, D.A. 2001. Biodiversity
and ecosystem functioning: current knowledge and future
challenges. Science 294:804–808.
8 Fargione, J., Tilman, D., Dybzinski, R., Lambers, J.H.R.,
Clark, C., Harpole, W.S., Knops, J.M.H., Reich, P.B.,
and Loreau, M. 2007. From selection to complementarity:
shifts in the causes of biodiversity-productivity relationships in
a long-term biodiversity experiment. Proceedings of the Royal
Society B: Biological Sciences 274:871–876.
9 Hille-Ris Lambers, J., Harpole, S., Tilman, D., Knops, J., and
Reich, P.B. 2004. Mechanisms responsible for the positivedi-
versity – productivity relationship in Minnesota grasslands.
Ecology Letters 7:661–668.
10 Loreau, M. and Hector, A. 2001. Partitioning selection and com-
plementarity in biodiversity experiments. Nature 412:72–76.
11 Tilman, D., Reich, P.B., and Knops, J.M.H. 2006. Biodiversity
and ecosystem stability in a decade-long grassland experi-
ment. Nature 441:629–632.
12 Hector, A., Schmid, B., Beierkuhnlein, C., Caldeira, M.C.,
Diemer, M., Dimitrakopoulos, P.G., Finn, J.A., Freitas, H.,
Giller, P.S., Good, J., Harris, J., Hogberg, P., Huss-Danell, K.,
Joshi, J., Jumpponen, A., Korner, C., Leadley, P.W., Loreau,
M., Minns, A., Mulder, C.P.H., O’Donnovan, G., Otway, S.J.,
Pereira, J.S., Prinz, A., Read, D.J., Scherer-Lorenzen, M.,
Schulze, E.-D., Siamantziouras, A.S.D., Spehn, E.M.,
Terry, A.C., Troumbis, A.Y., Woodward, F.I., Yachi, S., and
Lawton, J.H. 1999. Plant diversity and productivity experi-
ments in European grasslands. Science 286:1123–1127.
13 Hooper, D.U., Chapin, F.S., Ewel, J.J., Hector, A., Inchausti,
P., Lavorel, S., Lawton, J.H., Lodge, D.M., Loreau, M.,
Naeem, S., Schmid, B., Setala, H., Symstad, A.J., Vanderm-
eer, J., and Wardle, D.A. 2005. Effects of biodiversity on
ecosystem functioning: a consensus of current knowledge.
Ecological Monographs 75:3–35.
14 Srivastava, D.S. and Vellend, M. 2005. Biodiversity-
ecosystem function research: is it relevant to conservation?
Annual Review of Ecology Evolution and Systematics
36:267–294.
15 Picasso, V.D., Brummer, E.C., Liebman, M., Dixon, P.M., and
Wilsey, B.J. 2008. Crop species diversity affects productivity
and weed suppression in perennial polycultures under two
management strategies. Crop Science 48:331–342.
16 DeHaan, L., Wesiberg, S., Tilman, D., and Fornara, D. 2010.
Harvested perennial grasslands: ecological models for farm-
ing’s perennial future. Agriculture, Ecosystems and Environ-
ment 137:33–38.
17 Cardinale, B., Wright, J., Cadotte, M., Carroll, I., Hector, A.,
Srivastava, D., Loreau, M., and Weis, J.J. 2007. Impacts of
plant diversity on biomass production increase through time
because of species complementarity. Proceedings of the
National Academy of Sciences 104:18123–18128.
18 Hector, A., Joshi, J., Scherer-Lorenzen, M., Schmid, B.,
Spehn, E., Wacker, L., Weilenmann, M., Bazeley-White, E.,
Beierkuhnlein, C., Caldeira, M.C., Dimitrakopoulos, P.G.,
Finn, J.A., Huss-Danell, K., Jumpponen, A., Leadley, P.W.,
Loreau, M., Mulder, C.P.H., Neßhover, C., Palmborg, C.,
Read, D.J., Siamantziouras, A.S.D., Terry, A.C., and Troum-
bis, A.Y. 2007. Biodiversity and ecosystem functioning:
reconciling the results of experimental and observational
studies. Functional Ecology 21:998–1002.
19 Spehn, E.M., Scherer-Lorenzen, M., Schmid, B., Hector,
A., Caldeira, M.C., Dimitrakopoulos, P.G., Finn, J.A.,
Jumpponen, A., O’Donnovan, G., Pereira, J.S., Schulze,
E.-D., Troumbis, A.Y., and Korner, C. 2002. The role of
legumes as a component of biodiversity in a cross-European
study of grassland biomass nitrogen. Oikos 98:205–218.
20 Barnhart, S. 1999. Selecting Forage Species. ISU Extension
Publication Pm 1792. Iowa State University, Ames, IA.
21 Piper, J. and Pimm, S. 2002. The creation of diverse prairie-
like communities. Community Ecology 3:205–216.
22 Jolliffe, P.A. 2000. The replacement series. Journal of Ecology
88:371–385.
23 Littell, R., Milliken, G., Stroup, W., and Wolfinger, R. 1996.
SAS System for Mixed Models. SAS Institute Inc., Cary, NC.
24 Federer, W.T. 1993. Statistical Design and Analysis for
Intercropping Experiments. Springer-Verlag, New York, NY.
25 SAS-Institute-Inc. 2003. SAS Software 9.1.3 for Windows.
SAS Institute Inc., Cary, NC.
26 Polley, H.W., Wilsey, B.J., and Derner, J.D. 2003. Do species
evenness and plant density influence the magnitude of
selection and complementarity effects in annual plant species
mixtures? Ecology Letters 6:248–256.
27 Isbell, F.I., Polley, H.W., and Wilsey, B.J. 2009. Species
interaction mechanisms maintain grassland plant species
diversity. Ecology 90:1821–1830.
28 Roscher, C., Schumacher, J., Weisser, W., Schmid, B., and
Schulze, E-D. 2007. Detecting the role of individual species
for overyielding in experimental grassland communities
composed of potentially dominant species. Oecologia
154:535–549.
29 Sanderson, M.A., Skinner, R.H., Barker, D.J., Edwards, G.R.,
Tracy, B.F., and Wedin, D.A. 2004. Plant species diversity and
management of temperate forage and grazing land ecosystems.
Crop Science 44:1132–1144.
30 Hector, A. and Bagchi, R. 2007. Biodiversity and ecosystem
multifunctionality. Nature 448:188–190.
Diverse perennial crop mixtures sustain higher productivity over time 327
Copyright © 2022 FDOKUMEN