1 SUSTAIN - AN EPA BMP PROCESS AND PLACEMENT ...
23
1 SUSTAIN - AN EPA BMP PROCESS AND PLACEMENT TOOL FOR URBAN WATERSHEDS Fu-hsiung Lai 1 , Ting Dai 2 , Jenny Zhen 2 , John Riverson 2 , Khalid Alvi 2 , and Leslie Shoemaker 2 1 U.S. Environmental Protection Agency Office of Research and Development, Urban Water Management Branch 2890 Woodbridge Avenue (MS-104), Edison, NJ 08837 2 Tetra Tech, Inc., Fairfax, VA 22030 ABSTRACT To assist stormwater management professionals in planning for implementation of best management practices (BMPs), efforts have been under way by the U.S. Environmental Protection Agency (EPA) since 2003 to develop a decision-support system for placement of BMPs at strategic locations in urban watersheds. This tool will help develop, evaluate, select, and place BMP options in various watershed scales based on cost and effectiveness. The system is called the System for Urban Stormwater Treatment and Analysis INtegration (SUSTAIN). SUSTAIN has seven key components: framework manager, ArcGIS interface, watershed module, BMP module, optimization module, post-processor, and Microsoft Access database. They are integrated under a common ArcGIS platform. The completed Phase 1 work included a framework design with all major components in place. The ongoing Phase 2 work will expand the capabilities and functionalities of the system. In addition to describing the background of the SUSTAIN development and framework components, presented in this paper is a SUSTAIN’s pre- processing tool to facilitate BMP selection and configuration. Also discussed are adopted simulation processes for watershed runoff computation and routing through BMPs; an approach to address dual objectives of pollution and flood control; optimization search algorithms; and a multi-tier optimization strategy to develop large watershed-scale solutions from information developed in small-scale watersheds. Finally in this paper, the issue of balancing computational efficiency during the optimization process with the process simulation details is described. KEYWORDS Stormwater, best management practices, low impact development, GIS, flow and water quality modeling, cost, and optimization. INTRODUCTION According to the U.S. Department of Agriculture (USDA), between 1945 and 1997, urban land area in the nation increased by almost 327 % from 15 million acres to about 64 million acres primarily developed from land that was previously forestland, pasture, and range (USDA, 2000). During the same time, paved road mileage increased by about 280 % (EPA, 2000). As a result, urbanization, with its accompanying expansion of impervious surfaces, e.g., sidewalks, roofs, parking lots, and roads, has significantly increased the nation’s total developed land and paved surface area. This development reduces the amount of wetlands and other undeveloped land, and
-
Upload
khangminh22 -
Category
Documents
-
view
5 -
download
0
Transcript of 1 SUSTAIN - AN EPA BMP PROCESS AND PLACEMENT ...

1
SUSTAIN - AN EPA BMP PROCESS AND PLACEMENT TOOL FOR URBAN WATERSHEDS
Fu-hsiung Lai 1, Ting Dai 2, Jenny Zhen 2, John Riverson 2, Khalid Alvi 2, and Leslie Shoemaker 2
1 U.S. Environmental Protection Agency Office of Research and Development, Urban Water Management Branch
2890 Woodbridge Avenue (MS-104), Edison, NJ 08837 2 Tetra Tech, Inc., Fairfax, VA 22030
ABSTRACT To assist stormwater management professionals in planning for implementation of best management practices (BMPs), efforts have been under way by the U.S. Environmental Protection Agency (EPA) since 2003 to develop a decision-support system for placement of BMPs at strategic locations in urban watersheds. This tool will help develop, evaluate, select, and place BMP options in various watershed scales based on cost and effectiveness. The system is called the System for Urban Stormwater Treatment and Analysis INtegration (SUSTAIN). SUSTAIN has seven key components: framework manager, ArcGIS interface, watershed module, BMP module, optimization module, post-processor, and Microsoft Access database. They are integrated under a common ArcGIS platform. The completed Phase 1 work included a framework design with all major components in place. The ongoing Phase 2 work will expand the capabilities and functionalities of the system. In addition to describing the background of the SUSTAIN development and framework components, presented in this paper is a SUSTAIN’s pre-processing tool to facilitate BMP selection and configuration. Also discussed are adopted simulation processes for watershed runoff computation and routing through BMPs; an approach to address dual objectives of pollution and flood control; optimization search algorithms; and a multi-tier optimization strategy to develop large watershed-scale solutions from information developed in small-scale watersheds. Finally in this paper, the issue of balancing computational efficiency during the optimization process with the process simulation details is described. KEYWORDS Stormwater, best management practices, low impact development, GIS, flow and water quality modeling, cost, and optimization. INTRODUCTION According to the U.S. Department of Agriculture (USDA), between 1945 and 1997, urban land area in the nation increased by almost 327 % from 15 million acres to about 64 million acres primarily developed from land that was previously forestland, pasture, and range (USDA, 2000). During the same time, paved road mileage increased by about 280 % (EPA, 2000). As a result, urbanization, with its accompanying expansion of impervious surfaces, e.g., sidewalks, roofs, parking lots, and roads, has significantly increased the nation’s total developed land and paved surface area. This development reduces the amount of wetlands and other undeveloped land, and

2
thus reduces the watershed’s ability to mitigate floods, facilitate sediment replenishment, and improve water quality by removing excess nutrients and other chemical contaminants before runoff enters receiving waters. Urban development also causes changes in the hydrologic regime, which can result in more frequent bankful events, lower baseflows, and increased stream channel erosion (Roesner et al., 2001). Urban runoff contains nutrients, solids, pathogens, metals, hydrocarbons, organics, salt, and trash. Water flowing over various surfaces, such as streets, parking lots, construction sites, industrial facilities, rooftops, and lawns carries these pollutants to receiving waters. Research conducted by the Center for Watershed Protection found that in general, when the percentage of impervious cover exceeds 25 to 30% of the watershed, streams tend to no longer support diverse fish and aquatic life and have poor water quality (Center for Watershed Protection, 1994). Currently, over 40% of the nation’s assessed waters do not meet set water quality standards and overwhelming majorities of the population – 218 million – live within 10 miles of the impaired waters (EPA, 2006). Since 1972, states, territories, and authorized tribes have been required to develop 303(d) lists of impaired waters and to prepare Total Maximum Daily Loads (TMDLs) that set the maximum amount of a pollutant from point and nonpoint sources that a waterbody can receive and meet water quality standards. Recognizing the significance of continuing adverse pollution effects of stormwater on the nation’s waters from the municipal separate storm sewer systems (MS4s) and those associated with construction and industrial activities, EPA issued, under the National Pollutant Discharge Elimination System (NPDES) program, Phase I (1990) and Phase II (1999) stormwater regulations that target all sizes of MS4s in urbanized areas and construction sites. These regulations are designed to control stormwater runoff pollution generated from urban areas and highways in the same NPDES permit mold for controlling municipal and industrial wastewater point source discharges. A number of stormwater structural and non-structural control strategies, commonly known as best management practices (BMPs), have become the national focus for the mitigation of stormwater pollution. BMP types include ponds, bioretention facilities, infiltration trenches, grass swales, and filter strips. Another control option is “low-impact development” (LID) – or hydrologic source control – which strives to retain a site’s pre-development hydrologic regime by combining impervious area controls with small-scale BMPs. Retaining and treating the stormwater runoff at or near its source is the prime objective of the LID concept. Instead of simply removing stormwater from a site without treatment, and potentially creating water quantity and quality problems downstream, water is stored, reused, and treated at or near its source. This source control helps create more sustainable development that manages stormwater while minimizing downstream effects. One of the challenges faced by local municipalities is how to assess the benefits of a variety of water quantity and quality control strategies consistent with the TMDL and MS4 programs. Significant investments are needed to evaluate, design, and implement these BMPs/LIDs to protect and restore water quality, and address TMDLs for achieving water quality goals. There are numerous stormwater management options available to watershed and stormwater managers. Modeling tools are needed to specifically support the selection and evaluation of viable BMP/LID options, and decide where these options are best placed in a watershed in a way that

3
achieves cost-effectiveness in addressing environmental quality restoration and protection needs in urban and developing areas. To facilitate the use of decision-support tools by watershed managers, these modeling tools must include a seamless integration of GIS interface, watershed simulation models, process-based BMP simulation models, and cost-optimization models. PROJECT BACKGROUND Recognizing that there was no comprehensive modeling system available in the public domain for systematically evaluating the location, type, and cost of stormwater BMPs, EPA initiated a research project in 2003 to develop a decision-support system based on sound science and engineering, for selection and placement of BMPs/LIDs at strategic locations in urban watersheds. The BMP/LID assessment tools would help develop, evaluate, select, and place BMP options based on cost and effectiveness. Called the System for Urban Stormwater Treatment and Analysis INtegration (SUSTAIN), it provides a means for objective analysis of management alternatives among multiple interacting and competing factors. The desired outcome from the system application is a thorough, practical, and informative assessment of BMP/LID placement options considering the significant water quantity and quality factors in urban watersheds and associated restoration or mitigation costs. SUSTAIN is intended to support local and county government engineers/planners, federal/state regulatory reviewers, private consulting engineers, concerned citizens, stakeholders, and academicians in the development of watershed-based management plans. The users are expected to have a fundamental understanding of watershed and BMP modeling processes. SUSTAIN is being developed in phases because of its comprehensive scope. The Phase 1 work was completed in 2005 and the Phase 2 work is currently underway and scheduled to be completed in 2008. SUSTAIN has seven key components: framework manager, ArcGIS interface, watershed module, BMP module, optimization module, post-processor, and Microsoft Access database. They are integrated under a common ArcGIS platform. In Phase 1, a conceptual framework design was developed and major components were programmed and preliminarily tested. The systematic development of the framework through a critical review of modeling needs, current and emerging data management technology, and available watershed and BMP models has been previously presented (Lai et al. 2003, Lai et al. 2004, Riverson et al. 2004; Lai et al. 2005; and Lai et al. 2006). The systematic design process ensures that SUSTAIN provides a platform that satisfies the needs of environmental managers with technical sophistication consistent with current and emerging technology. The Phase 1 work adopted the existing BMP module and parts of the optimization module in the Prince George’s County BMP evaluation model (Prince George’s County 2001). The ongoing Phase 2 work will expand the capabilities and functionalities of the system. Key enhancements include a pre-processor to facilitate selection of placement sites, more tightly integrated and flexible post-processors, expanded cost estimating functions, and additional BMP types and improved BMP simulation processes. The optimization module will include additional solution techniques and provide a means to perform a multi-tier evaluation of individual watersheds and of multiple, nested watersheds. In addition, the work will include case studies at

4
several sites to demonstrate applications of a diversity of BMP types, soil/climate, and watershed development conditions. SYSTEM DESIGN The design and major system component relationships for SUSTAIN are shown in Figure 1. The use of distinct components developed as functional modules provides flexibility in the development and maintenance of the modeling system. The key components that comprise SUSTAIN are described below: • Framework manager (FM) - serves as the command center of SUSTAIN. The FM
facilitates the linkages between GIS, external inputs, watershed and BMP simulations, post-processor, feasible options matrix, and the decision optimization engine.
• Watershed module - integrates locally derived data with watershed simulation models that predict flow and pollutant loading for input to BMPs.
• BMP module - performs process-based simulation to derive the performance (effectiveness) of a BMP.
• Optimization module - performs cost estimating and systematically compares performance and cost data of various BMP options and their placement scenarios.
Figure 1 - Conceptual Diagram of SUSTAIN
The FM uses a system and interface architecture predicated on GIS-based visualization and support for developing watershed simulation networks. The main user interface is based on the ArcGIS software system. This provides the flexibility to support spatial placement of BMPs and evaluation of drainage areas and flow networks. ArcGIS has two components: ArcView 9.x and

5
Spatial Analyst. They are used to read and edit the spatial and temporal datasets, and interact with the Microsoft Access database components of SUSTAIN. The Access database consists of tables and queries that allow the ArcGIS interface and watershed and BMP simulation modules to interact and exchange data. In addition to linkage with external models for inputs of hydrology and pollutant time series, SUSTAIN includes four internal, stand-alone simulation modules that can be used individually or in combination to represent various watershed systems:
• Land for performing watershed/landscape runoff simulation. • BMP for process simulation of a BMP. • Conduit for routing flow and pollutants through a conduit network. • Reach for stream conveyance and pollutant routing.
The needed simulation codes for the LAND module were initially derived from the existing runoff simulation routines in the Storm Water Management Model Version 5.0 (SWMM5) (EPA, 2005). These codes, particularly for the simulation of sediment loading and transport, are being replaced or enhanced with selected algorithms in SWMM5 and the Hydrological Simulation Program in FORTRAN (HSPF) (Bricknell et al., 2001). The BMP Module in Phase 1 built on the BMP Module previously developed for Prince George’s County (Prince George’s County 2001) and this module will be largely enhanced in Phase 2. The Conduit and Reach modules use the SWMM5 algorithms referred to as the Transport Block in previous SWMM versions (Huber et al., 1988).
The integration of the system components provides a consistent approach for evaluating water and pollutant transport through a watershed. The system components were carefully selected to provide a robust approach with a manageable and relatively consistent level of complexity. More detailed formulations of specific watershed and BMP processes are likely to require significantly more detailed monitoring and data collection. More simplified approaches would place significant limitations on the time step and sensitivity for simulating flow and pollutant transport processes.
SUSTAIN includes an Optimization Module to identify the optimal or near optimal BMP placement and selection strategies for a pre-selected list of potential BMP sites and applicable types. The user can select goals such as to minimize the total cost for the specified water quantity and/or water quality control targets. The Module compares the control effectiveness and the total cost of a BMP implementation plan (including exact BMP locations and configurations) and can evaluate benefits at multiple assessment points in the watershed specified by the user. The Optimization Module is also used to generate the optimal cost-effectiveness curve for the desired water quantity or water quality control targets. SYSTAIN OPERATION Referring to Figure 1, SUSTAIN allows the users to perform the following sequence of analyses:

6
• Beginning with GIS view and database, review the available data (e.g., land use, soil, water table) and BMP site criteria and use the BMP siting tool to identify suitable locations and appropriate BMP types for those locations. BMP site suitability maps will be generated, stored, and used when an actual BMP is defined and placed.
• Use the GIS interface and customized tools to configure a specific BMP, and place it at a suitable location based on the BMP site suitability map. Represent distributed BMPs as an aggregated generic BMP and placed it in the sub-study area or sub-watershed.
• Develop a simulation network that describes the relationships between land-area units, BMPs, and streams in a watershed.
• Define assessment locations and decision criteria (e.g., flow frequency, phosphorus load) for evaluation of objectives.
• Identify the modules (Land, BMP, Conduit, and Reach) to be used, prepare model input files, and route the external inputs or generate internal loading time series to appropriate modules and their outputs to the Output Post-Processor.
• Send outputs from the Output Post-Processor to the Decision Optimization Engine. • Use the Optimization Engine to evaluate the current option and select the next preferred
option from that contained in the Feasible Option Matrix based on cost and defined decision criteria. The Feasible Option Matrix contains types, configurations, locations, and costs of feasible BMP options. The ranges and increments of configuration parameters are specified for defining the alternative BMPs to be searched. For a target pollutant load reduction for the watershed, the locations and types of BMPs are varied over a range of alternative options and numerous iterations of SUSTAIN are performed.
• End the iterations when the user-defined convergence criteria are met. • Perform multi-tier optimization procedures if multiple sub-areas or sub-watersheds are
studied. The database associated with the selected optimal scenarios will be saved in SUSTAIN to allow users to perform additional assessment as needed. Users of the system are expected to use multiple applications of SUSTAIN under various assumptions to explore different management options in a specific watershed. Users must understand the watershed characteristics and localized constraints (e.g., poorly drained soils) in the assessment and selection of potential BMP locations and types. The tool would not automatically select the best solution, but can be used iteratively to explore and test various approaches and eventually help the users to select optimal solutions based on the defined criteria and constraints. SUSTAIN APPROACH BMP Siting Tool The identification of management opportunities consistent with site suitability considerations, such as slope and soil infiltration rates, is one of the key factors for successful performance of structural BMPs (EPA, 1999). A BMP siting tool has been developed as a part of SUSTAIN to support users in selecting suitable locations for the most common structural BMPs. The tool is implemented using ESRI’s ArcView 9.x and Spatial Analyst extension. Table 1 describes seven GIS data layers used as the base input for the tool.

7
Table 1 - GIS Data Requirement for BMP Suitability Analysis GIS Layer Format Description DEM Raster file The digital elevation model (DEM) is used to calculate the drainage
slope and drainage area which are used to identify the suitable locations for BMPs.
MRLC Land Use Raster file The USGS Multi-Resolution Land Characterization (MRLC) land use grid is used to eliminate the unsuitable areas for BMPs.
Soil Shape file The soil data contain the soil properties such as hydrological soil group and the soil permeability which are used to identify suitable locations for BMPs.
Urban Land Use Shape file The urban land use data contain the boundaries for the buildings and the impervious areas needed to identify suitable locations for LIDs.
Road Shape file The road layer is used to identify suitable locations for some BMPs that must be placed within a specific road buffer area.
Stream Shape file The stream layer is used to define a buffer so that certain BMP types can be placed outside the buffer to minimize the impact on streams.
Groundwater Table Depth
Shape file The groundwater table depth layer is used to identify suitable locations for the infiltration BMPs.
The system includes a structured site suitability criteria matrix, populated with initial default criteria that can be adapted to user’s preferences or locally derived studies. The default site suitability criteria currently included in the siting tool are derived from two EPA reports (EPA, 2004a; 2004b). The users may modify these default criteria through the interface. Figure 2 shows the BMP siting tool interface for specifying spatial input data and defining site criteria for Figure 2 - BMP Siting Tool Interface

8
a specified BMP. This figure uses wet ponds as the example. The potentially suitable location for considering a wet pond BMP needs to meet the following criteria: drainage area greater than 25 acres, drainage slope less than 15%, hydrological soil group A to D, groundwater table depth greater than 4 ft, and not located within the 100-ft buffer around the streams. From the output of the BMP siting tool, the SUSTAIN GIS interface presents the highlighted areas that meet the default or user-specified site criteria for the selected BMP. The system will store these data in the BMP suitability map for later guidance and evaluation and placement of BMPs. BMP Interface In SUSTAIN, BMPs are classified and conceptualized as scale-based and type-based. The scale-based category classifies various BMPs based on the size and type of the application area, such as BMPs at lot, community, or watershed scales. The type-based category classifies BMPs into three types based on their geometric properties:
• Point BMPs: Practices that capture upstream drainage at a specific location and may use a combination of detention, infiltration, evaporation, settling, and transformation to manage flow and remove pollutants.
• Linear BMPs: Narrow linear shapes adjacent to stream channels that provide filtration of runoff, nutrient uptake, and ancillary benefits of stream shading, wildlife habitat, and aesthetic value.
• Area BMPs: Land-based management practices that affect impervious area, land cover, and pollutant inputs (e.g., fertilizer, pet waste).
The BMP interface is a visual tool, which allows users to specify each BMP in terms of scale, type, and location within the modeling environment. The user selects BMPs from a visual scale-based representation (lot, community, or watershed scales), as shown in Figure 3. This establishes the conceptual role of the selected BMP within the modeling environment. After clicking a BMP on a scale-based selection screen, the BMP definition window is displayed for that specific BMP. This window introduces the second layer of BMP classification (point, line, or area), and provides entry boxes for defining relevant parameter values. For example, if the user selects bioretention from the lot scale-based BMP view, Figure 4 shows how the next BMP definition window would appear. The selected BMP is highlighted in the definition window to confirm the selection. The user will have the option to change the BMP type at this point by using the type-based selection dropdown box and tabs. SUSTAIN also provides the option for a user to proceed directly to the BMP definition window and bypass the visual scale-based BMP selection screens.

9
Figure 3 - Scale-Based BMP Selection Screens
Figure 4 - BMP Definition Window for Bioretention Basin
Green Roof
Bioretention
Porous Pavement
Cistern&
Rain Barrel
Lot ScaleLow-Impact Development Practices
Watershed ScaleGeneralized Practices
Stream Restoration
Disconnected Imperviousness
AgriculturalManagement
Buffer Strip
Community ScaleConventional Facilities and Practices
InfiltrationTrench
Dry Pond
Wet PondVegetative Swale
StreetSweeping

10
Distributed BMPS In SUSTAIN, the term “distributed BMPs” is used to refer to a collection of a large number of BMPs, such as those located in residential parcels of a new development or an existing neighborhood. For these distributed BMPs, their precise locations may not be important relative to the scale of a study and their physical characteristics can be represented by their collective properties (e.g., total detention volume or total infiltration). SUSTAIN uses a “lumped” approach to represent distributed BMPs to minimize computational effort, especially when distributed BMPs are involved in the optimization process as decision variables.
The hydrologic and water quality functions of distributed BMPs can be classified into two major categories; i.e., infiltration and detention. Therefore, distributed BMPs are aggregated and modeled in SUSTAIN as two types of generic BMPs (one representative infiltration structure and one representative detention structure per affected area) that capture water from a combination of pervious and impervious surfaces at the sub-watershed scale. Figure 5 and Figure 6 illustrate the generic infiltration and detention BMPs, respectively. The generic BMPs are described in the system using the capacity parameters:
• Infiltration structure: infiltration volume, infiltration rate, and evapotranspiration rate. • Detention structure: permanent pool storage, extended detention storage, and evaporation
and/or evapotranspiration rates.
Figure 5 – Schematics of a Generic Infiltration Structure
from selected upland surface
areas
from selected upland surface
areas
to groundwater storage in neighboring pervious areas
design volume for infiltration
dry extended detention
(controls peak)
evaporation evapotranspiration

11
Figure 6 – Schematics of a Generic Detention Structure
SUSTAIN provides users with a BMP interface (e.g., Figure 5) with customized tools to define an area or sub-watershed where distributed BMPs are intended and specifies the land cover types and ranges of BMP capacity parameters that can be designated as decision variables. Below are the steps for defining distributed BMPs using the interface.
Step 1. Define an area or sub-watershed (e.g., a polygon with a size threshold) where distributed BMPs are intended as shown in Figure 7.
Figure 7 - Define an Area for Distributed BMPs
Step 2. Calculate available areas for the distributed BMPs. The distributed BMPs are mostly associated with specific land covers, e.g., parking lot, roof top, street. The available land use types and areas for the distributed BMPs are extracted and presented to the user in a tabular format.
permanent pool
extended detention
spillway
evaporation evapotranspiration
from selected upland surface
areas
from selected upland surface
areas

12
Step 3. Specify distributed BMP option(s) and capacity (represented by the generic BMP types described above) for each selected land use/cover type. For each selected BMP option, the user is prompted to input the desired generic BMP type and capacity parameters, and the minimum and maximum values if these options are considered as the optimization decision variables. Each option is also associated with unit-area cost information.
Watershed Module The SUSTAIN watershed/land simulation module performs rainfall-runoff simulations; pollutant and sediment generation on a landscape; and routing of flow, sediment, and pollutants through the land surface. In the watershed/land simulation module, surface runoff and water quality components are either provided through an external linkage or from a built-in model (LAND) derived from SWMM5. The following are the main algorithms used in the system:
• Physically-based infiltration simulation. • Overland flow routing/hydrograph generation. • Pollutant accumulation and wash-off. • Sediment detachment and transport. • Land-to-stream flow routing. • Groundwater interaction between the upper and lower soil zones.
The watershed simulation methods in SUSTAIN are listed in Table 2. The runoff, snowmelt, evapotranspiration, infiltration, overland flow, pollutant build-up/wash-off, and street cleaning processes are derived from and identical to that in SWMM version 5. The two-zone groundwater module, sediment generation and transport for the pervious land, and particle size distribution from overland soil loss are developed from both SWMM and HSPF. To simulate the sediment process on land and in stream, SUSTAIN integrates the HSPF sediment generation and transport algorithms on pervious land areas and in reach segments with the SWMM build-up and wash-off algorithms on impervious land areas. The sediment particle size distribution is represented as fractional distribution. SUSTAIN uses three particle size classes (sand, silt, and clay) to track the particle dynamics as shown in Figure 8. BMP Process Module SUSTAIN includes a BMP simulation module intended to process flow and pollutants (including sediment) through ponds, wetlands, infiltration trench, swales, buffer strips, constructed wetlands, and other BMPs (e.g., green roof, porous pavement). It allows users to select from a library of BMP types, configure them based on physical features (i.e., size, weir type, and filter media), and evaluate BMP performance by simulating the major processes that affect hydrology and pollutant behavior. The module can evaluate management practices under an individual storm event and/or continuous storm conditions. Available BMP processes include weir and orifice functions to define surface capacity and control, swale characteristics, hydraulic transport, infiltration and saturation, underdrain, evapotranspiration, general pollutant removal,

13
Table 2 - SUSTAIN Watershed/Land Simulation Methods Components Options References
Rainfall Weather data file Rossman, L.A., 2005
Snowmelt Degree-day equation; Anderson’s equation Rossman, L.A., 2005
Evapotranspiration (ET)
• Constant value • Monthly average value • User-supplied time series
Actual ET (AET) is calculated as a function of potential ET, soil moisture storages, groundwater availability, and canopy conditions.
Rossman, L.A., 2005
Infiltration Green-Ampt method Rossman, L.A., 2005
Groundwater Flow Two-zone groundwater structure with a interaction between the upper unsaturated soil zone and the lower saturated soil zone
Rossman, L.A., 2005 Hydrocomp and AQUA TERRA, 1996
Overland Flow Non-linear reservoir Rossman, L.A., 2005
Pollutant Build-up • Power function • Exponential function • Saturation function
Rossman, L.A., 2005
Pollutant Wash-off
• Exponential function • Rating curve
Rossman, L.A., 2005
Street Cleaning User specified pollutant removal efficiency Rossman, L.A., 2005
Erosion HSPF sediment algorithms for pervious land Bricknell et al., 2001
Particle Size Distribution
Three particle sizes (sand, silt, and clay) based on soil data, simulation, or user input
Bricknell et al., 2001
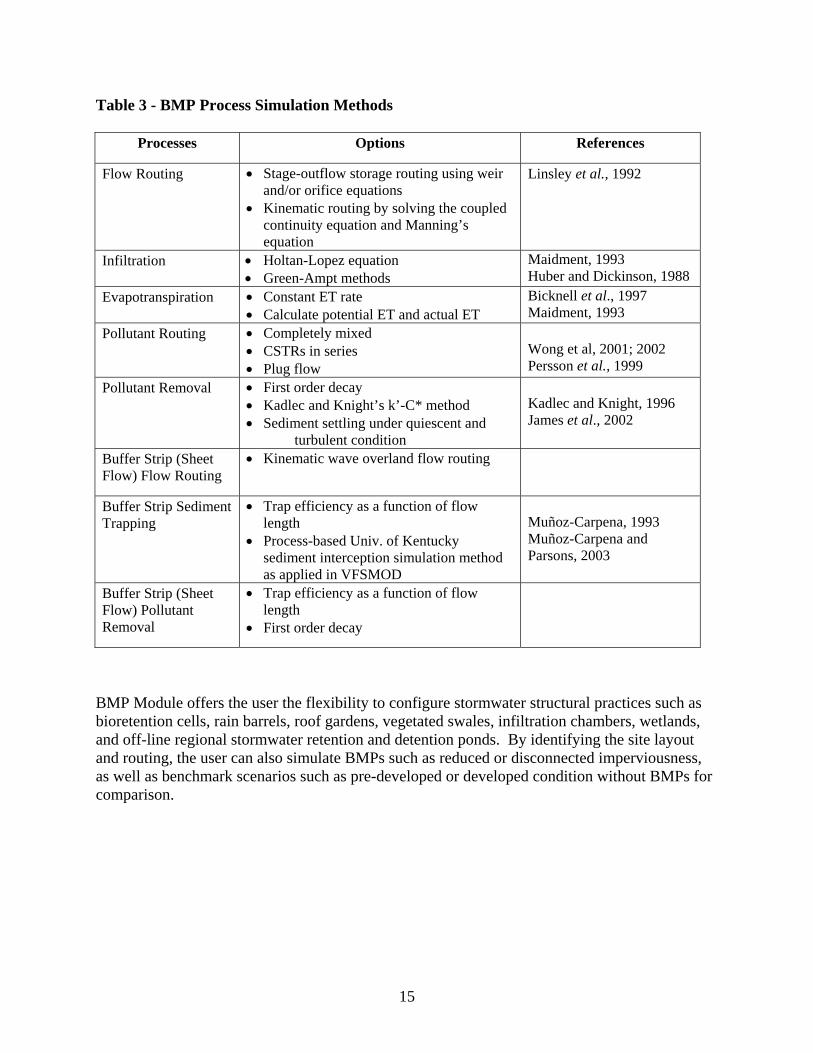
and filtration through soil media. The modular design of SUSTAIN allows additional BMPs to be added or alternative solution techniques provided. The BMP Module uses continuous simulation to develop time series of hydrographs and pollutant loads so that the effectiveness of practices can be measured on a storm-by-storm basis over many storms to better characterize the mode and methods by which BMPs treat stormwater. It uses stormwater runoff time series from models such as SWMM, together with a series of process-based algorithms for BMP simulation. The specific processes and options used to describe performances of key BMPs for the current version of SUSTAIN are shown in Tables 3 and 4. Table 3 provides a summary of the key processes that are included in SUSTAIN, and Table 4 lists the BMP types and the associated applicable process simulation methods. The

14
Figure 8 - Flow Chart for Routing Sediment and Particle Size Distribution
WATERSHED/LAND
Input: • Climate time series data • Coefficients and exponents for soil detachment, wash-off, and scour
equations for the pervious land • Buildup and wash-off rates of solids on impervious surface
Simulation Method: • Production and removal of sediment on/from pervious land segment is
computed using the HSPF sediment algorithms • Accumulation and removal of sediment on/from the impervious land segment
is computed using the SWMM buildup and wash-off algorithms Output:
• Outflow time series • Concentrations time series of total sediment
↓
↓ ↓
BMP
Input: • Inflow time series • Concentration time series for sand,
silt, and clay particles • Settling velocity for sand, silt, and
clay particles Simulation Method:
• Plug flow pollutant routing technique is applied, and sediment trap efficiency of each representative particle size is calculated as a function of detention time for each plug (the inflow during each time step is called a plug)
• The outflow concentration is calculated as a composite of effluent plugs
Output: • Outflow time series • Concentration time series for sand,
silt, and clay particles
REACH
Input: • Inflow time series • Concentration time series for
sand, silt, and clay particles • Settling velocity, critical shear
stress, and density for sand, silt, and clay particles
Simulation Method: • Simulation of transport,
deposition and scouring of the sediment in stream is computed using the HSPF sediment transport algorithms
• Exchange of cohesive sediments with the bed is calculated based on the bed shear stress and user defined critical shear stress for deposition and for scour
Output: • Outflow time series • Concentration time series for
sand, silt, and clay particles
Split total sediment concentration into sand (0.05-2.0 mm dia), silt (0.002-0.05 mm dia), and clay (<0.002 mm dia) concentrations
15
Table 3 - BMP Process Simulation Methods
Processes Options References
Flow Routing • Stage-outflow storage routing using weir and/or orifice equations
• Kinematic routing by solving the coupled continuity equation and Manning’s equation
Linsley et al., 1992
Infiltration • Holtan-Lopez equation • Green-Ampt methods
Maidment, 1993 Huber and Dickinson, 1988
Evapotranspiration • Constant ET rate • Calculate potential ET and actual ET
Bicknell et al., 1997 Maidment, 1993
Pollutant Routing • Completely mixed • CSTRs in series • Plug flow
Wong et al, 2001; 2002 Persson et al., 1999
Pollutant Removal • First order decay • Kadlec and Knight’s k’-C* method • Sediment settling under quiescent and
turbulent condition
Kadlec and Knight, 1996 James et al., 2002
Buffer Strip (Sheet Flow) Flow Routing
• Kinematic wave overland flow routing
Buffer Strip Sediment Trapping
• Trap efficiency as a function of flow length
• Process-based Univ. of Kentucky sediment interception simulation method as applied in VFSMOD
Muñoz-Carpena, 1993 Muñoz-Carpena and Parsons, 2003
Buffer Strip (Sheet Flow) Pollutant Removal
• Trap efficiency as a function of flow length
• First order decay
BMP Module offers the user the flexibility to configure stormwater structural practices such as bioretention cells, rain barrels, roof gardens, vegetated swales, infiltration chambers, wetlands, and off-line regional stormwater retention and detention ponds. By identifying the site layout and routing, the user can also simulate BMPs such as reduced or disconnected imperviousness, as well as benchmark scenarios such as pre-developed or developed condition without BMPs for comparison.

16
Table 4 - Representative BMPs and Major Processes Involved
BMPs Basic Option Advanced Option
Detention pond • Holtan-Lopez equation • Constant evapotranspiration (ET) rate • Stage-outflow storage routing using
weir and/or orifice equations • Completely mixed pollutant routing • 1st order decay
• Green-Ampt method • Calculate potential ET and actual ET • Continuously stirred tank reactor
(CSTR) in series pollutant routing • Plug flow pollutant routing • Kadlec and Knight’s (1996) 1st order
kinetic method • Sedimentation
Wetland • Holtan-Lopez equation • Constant ET rate • Stage-outflow storage routing using
weir and/or orifice equations • Completely mixed pollutant routing • First order decay
• Green-Ampt method • Calculate potential ET and actual ET • CSTR in series pollutant routing • Plug flow pollutant routing • Kadlec and Knight’s (1996) 1st order
kinetic method • Sedimentation
Bio-retention • Holtan-Lopez equation • Constant ET rate • Stage-outflow storage routing using
weir and/or orifice equations • Completely mixed pollutant routing • First order decay • Underdrain percent reduction (user
defined)
• Green-Ampt method • Calculate potential ET and actual ET
Infiltration trench • Holtan-Lopez equation • Constant ET rate • Stage-outflow storage routing using
weir and/or orifice equations • Completely mixed pollutant routing • First order decay
• Green-Ampt method
Hydrodynamic storage device
• Stage-outflow storage routing using weir and/or orifice equations
• Completely mixed pollutant routing • First order decay
• CSTR in series pollutant routing • Plug flow pollutant routing • Kadlec and Knight’s (1996) 1st order
kinetic method • Sedimentation
Swale • Kinematic flow routing by solving the coupled continuity equation and Manning’s equation
• Completely mixed pollutant routing • First order decay
• Plug flow pollutant routing • CSTR in series pollutant routing • Sedimentation
Buffer Strip/Riparian Buffer
• Pollutant trap efficiency as a function of strip width (flow length)
• Kinematic wave overland flow routing
• Process-based sediment interception simulation method (VFSMOD).
• First order decay nutrient/pollutant removal simulation method

17
Optimization Methods The Optimization Module in SUSTAIN includes interfaces for users to define decision variables (e.g., the range of the width and/or depth of a particular BMP structure) and water quantity and quality evaluation factors (e.g., flow volume and pollutant load reductions). To solve the nonlinear, multi-objective, complex optimization problem formulated using the SUSTAIN optimization setup interface, meta-heuristic or evolutionary search techniques (such as genetic algorithms and scatter search) are used. These techniques require extensive computing time; however, rapid advances in computer power and speed make these techniques more practical and accessible. The current version of SUSTAIN will include two types of optimization search algorithms— genetic algorithms (GAs) and scatter search. GAs are the most commonly used techniques at the present time (Harrell 2001). Basically, GAs are stochastic search procedures that use probabilistic rather than deterministic search rules and are based on the “survival of the fittest” principle. The objective function magnitude, instead of derivative information, is used directly in the search, thereby allowing GAs to be applied to non-convex, highly nonlinear, and complex problems (Goldberg 1989). Scatter search is another meta-heuristic search technique that has been explored and used in optimizing complex systems (Glover et al., 2003). Scatter search shares some commonalities with GAs, although it has a number of quite distinct features. Both scatter search and GAs are "population based" approaches. Both incorporate an approach that combines existing elements. GA approaches are predicated on the idea of choosing parents randomly to produce offspring, and further on introducing randomization to determine which components of the parents should be combined. By contrast, the scatter search approach does not emphasize randomization, particularly in the sense of being indifferent to choices among alternatives. Instead, the approach is designed to incorporate strategic responses, both deterministic and probabilistic, that take account of evaluation and history. Scatter search focuses on generating relevant outcomes without losing the ability to produce diverse solutions, in light of the way the generation process is implemented (Laguna and Marti, 2002). Because of this feature of scatter search, for optimization problems that have a computer processing time-consuming evaluator, it is expected that scatter search can find the near-optimal solution in a more efficient way. SUSTAIN considers flood control objectives as constraints in the optimization problem formulation using the flow related evaluation factor provided in the optimization interface. The interface provides options to define various evaluation factors as optimization constraints on flow and pollutants. The evaluation factor can be calculated on a long-term base (e.g. exceeding frequency) or on a design-storm base. Using the multiple constrains, the final optimization results can provide a solution set that satisfies both the pollution and flood control objectives. Watershed-based Placement Scenario and Tiered Analysis A relatively large watershed can usually be subdivided into several smaller sub-watersheds. For each sub-watershed, users select an appropriate suite of feasible BMP options (types,

18
configurations, and costs) at strategic locations. SUSTAIN generates time series rainfall-runoff data from BMP tributary areas and routes them through BMPs, in parallel or in series, and predicts quantity and quality at selected locations. SUSTAIN produces output for deriving optimal cost-effectiveness curves that relate flow or pollutant load reductions with costs as shown in Figure 9. Each point on a curve represents an optimal combination of BMPs that will collectively remove the targeted amount of pollutant load at the least cost. Figure 9 – Tiered Application of SUSTAIN for Developing Cost-effectiveness Curves
One dominant technical requirement for SUSTAIN is the ability to place management practices at multiple scales. This is because placement of BMPs at different spatial levels, i.e., on-site, sub-regional, and regional, affects the overall cost-effectiveness of the stormwater control system (Zhen and Yu, 2004). Management plans often need to evaluate the cumulative benefit of management practices at multiple scales on downstream water quality in rivers, lakes, or estuaries. Detailed simulation can be performed at the site scale or small watershed scale to evaluate the impacts of various combinations of practices and treatment trains on localized water quantity and quality. For evaluation and placement at a larger scale watershed, there can be hundreds or thousands of individual management practices. To manage the complexity of larger scale applications, SUSTAIN uses a tiered evaluation approach shown in Figure 9 that allows for evaluation of both individual watersheds and multiple nested watersheds. As the first step of the tiered optimization analysis, the cost-effectiveness curves for each tier-1 sub-watershed or assessment point are generated by performing continuous multiple optimization runs at incremental flow/pollutant reduction targets.
SUSTAINSUSTAIN
SUSTAIN
Target Load Reduction
DecisionOptimization
Engine
Cost
Load
R
educ
tion
Cost
Load
R
educ
tion
Cost
Load
R
educ
tion
19
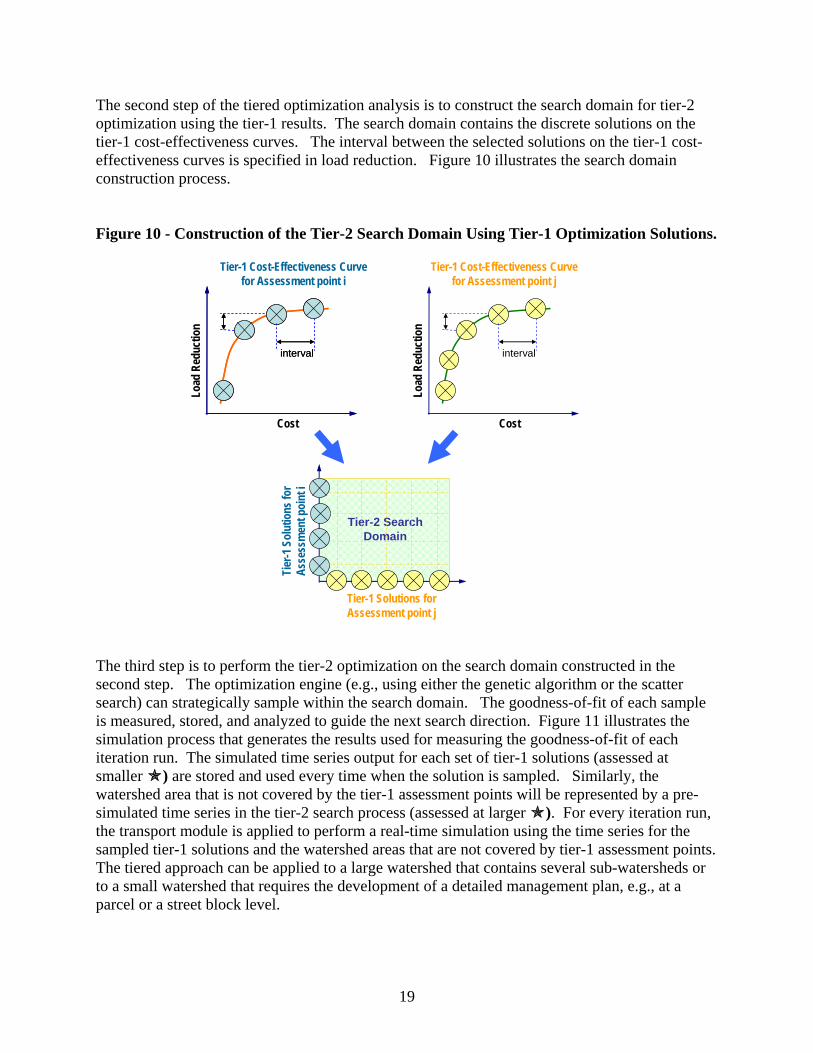
The second step of the tiered optimization analysis is to construct the search domain for tier-2 optimization using the tier-1 results. The search domain contains the discrete solutions on the tier-1 cost-effectiveness curves. The interval between the selected solutions on the tier-1 cost-effectiveness curves is specified in load reduction. Figure 10 illustrates the search domain construction process. Figure 10 - Construction of the Tier-2 Search Domain Using Tier-1 Optimization Solutions.
The third step is to perform the tier-2 optimization on the search domain constructed in the second step. The optimization engine (e.g., using either the genetic algorithm or the scatter search) can strategically sample within the search domain. The goodness-of-fit of each sample is measured, stored, and analyzed to guide the next search direction. Figure 11 illustrates the simulation process that generates the results used for measuring the goodness-of-fit of each iteration run. The simulated time series output for each set of tier-1 solutions (assessed at smaller ) are stored and used every time when the solution is sampled. Similarly, the watershed area that is not covered by the tier-1 assessment points will be represented by a pre-simulated time series in the tier-2 search process (assessed at larger ). For every iteration run, the transport module is applied to perform a real-time simulation using the time series for the sampled tier-1 solutions and the watershed areas that are not covered by tier-1 assessment points. The tiered approach can be applied to a large watershed that contains several sub-watersheds or to a small watershed that requires the development of a detailed management plan, e.g., at a parcel or a street block level.
Cost
Load
Red
uctio
n
interval
Cost
Load
Red
uctio
n
interval
CostLo
ad R
educ
tion
interval
Tier-1 Solutions for Assessment point j
Tier
-1 S
olut
ions
for
Asse
ssm
ent p
oint
i
Tier-2 Search Domain
Tier-1 Cost-Effectiveness Curve for Assessment point j
Tier-1 Cost-Effectiveness Curve for Assessment point i

20
Figure 11 - Simulation Process for Each Iteration Run
Computational Efficiency Consideration Initial tests for running tiered optimizations showed that channel/pipe routing is computationally intensive because it employs the kinematic wave flow routing method. To reduce the computational burden, it is desirable to simplify the routing simulation during optimization runs and only use the kinematic wave approach for evaluation runs. Additional research will be needed to develop ways to balance the computational efficiency and accurate hydraulic routing in channels/pipes. CONCLUSIONS This project represents an intensive effort by the EPA to develop a decision-support tool to evaluate, select, and place BMP options in an urban watershed based on user-defined cost and effectiveness criteria. This public domain tool will be capable of evaluating the optimal location, type, and cost of stormwater BMPs needed to meet water quality goals. It will provide critically needed support to federal, state, local, and watershed practitioners in developing sound stormwater management evaluations and cost optimizations to meet their existing program needs. After four years into development, the SUSTAIN framework has evolved into a comprehensive system with a modular structure that incorporates many of the emerging technologies in optimization, BMP simulation, and computational efficiency. A focus of the development research has been on significant limitations in currently available tools for the simulation of sediment generation and its fate through natural runoff and treatment at a BMP. Although
Transport Module:Time Series:
RCH
Conduit
Simulation process for each iteration run:
Transport Module:Time Series:
RCH
Conduit
Simulation process for each iteration run:
Transport Module:Time Series:
RCH
Conduit
Simulation process for each iteration run:
Tier-1 solution time series at assessment points
Time series for the areas/catchment that are not covered by tier-1 assessment points
Tier-1 solution time series at assessment points
Time series for the areas/catchment that are not covered by tier-1 assessment points

21
SUSTAIN has a significant resolution to the routing of sediment by considering three sediment fractions (i.e., sand, silt, and clay), this approach remains a compromise since the state-of-the-art knowledge and the needed monitoring data are still limited. The modular approach used in SUSTAIN is designed to facilitate updates as research is continued in this area. The proposed tiered optimization approach to account for different watershed spatial scales was positively confirmed by optimization experts specifically convened for the project in September, 2006. One major concern was the daunting computation time required in running numerous process simulation models during an optimization run. To alleviate this concern, one idea is to reduce the complexity of the simulation system by employing a simpler simulation approach for evaluating BMP effectiveness. The other idea is to find or develop more efficient solution search techniques. The objective is to strike the balance between the need for process based representations of the watershed systems and computational efficiency. While the effort to achieve this objective is ongoing, additional research to find and develop new simulation methods and optimization algorithms will likely continue beyond the release of the first beta testing version of SUSTAIN in 2008. ACKNOWLEDGMENTS The authors thank Dr. Sabu Paul, Ms. Teresa Rafi, and Mr. Haihong Yang of Tetra Tech, Inc. for their technical contributions to the development of SUSTAIN and thank Ms. Sally Gutierrez, Director of EPA ORD, National Risk Management Research Laboratory and Mr. Anthony N. Tafuri, Chief of Urban Watershed Management Branch for their continuing management funding support and attention. Our appreciation is also extended to the Prince George’s County, MD, and to Dr. Mow-Soung Cheng in particular, for making their BMP module and optimization routine available during the Phase 1 development of SUSTAIN. DISCLAIMER
Any opinions expressed in this paper are those of the author(s) and do not, necessarily, reflect the official positions and policies of the EPA. Any mention of products or trade names does not constitute recommendation for use by the EPA. REFERENCES Bicknell, B. R.; Imhoff, J. C.; Kittle, J. L., Jr.; Donigian, A. S., Jr.; Johanson, R. C. (1997)
Hydrological Simulation Program - FORTRAN, User's manual for version 11. Athens: U.S. Environmental Protection Agency, EPA/600/R-97/080.
Bicknell, B. R.; Imhoff, J. C.; Kittle, J. L., Jr.; Jobes, T. H.; Donigian, A. S, Jr. (2001) Hydrological Simulation Program - FORTRAN, Version 12, User’s Manual. AQUA TERRA Consultants.
Center for Watershed Protection (1994) The Importance of Imperviousness; Watershed Protection Techniques; v.1:3.

22
Glover, F.; Laguna, M.; Marti, R. (2003) Scatter Search; In: Advances in Evolutionary Computation: Theory and Applications; (Eds) A. Ghosh and S. Tsutsui; Springer-Verlag.; New York, pp. 519-537.
Goldberg, D.E. (1989) Genetic Algorithms in Search, Optimization, and Machine Learning. NY, NY: Addison-Wesley Publishing Company, Inc.
Harrell, L. J. (2001) Evolutionary algorithm-based design of a system of wet detention basins under uncertainty for watershed management. In Proceedings of the EWRI World Water and Environmental Resources Congress, Orlando, FL.
Huber, W. C.; Dickinson, R. E. (1988) Storm Water Management Model User’s Manual, Version 4. EPA/600/3-88/001a, U.S. Environmental Protection Agency, Athens, GA.
Hydrocomp, Inc.; AQUA TERRA Consultants. (1996) Modifications to HSPF for High Water Table and Wetlands Conditions in South Florida: Conceptual Analysis, Preliminary Design and Implementation, and Initial Testing; Report to South Florida Water Management District;West Palm Beach, FL; 102p.
James, W.; Huber, W.C.; Pitt, R. E.; Dickinson, R. E.; Rosener, L. A.; Aldrich, J. A.;. James, W. R. (2002) SWMM4 User’s Manual (User’s Guide to the EPA Stormwater Management Model and to PCSWMM); University of Guelph and CHAI; Guelph, Ontario, Canada; October.
Kadlec, R. H.; Knight, R. L. (1996) Treatment Wetlands. Boca Raton, FL: Lewis Publishers. Laguna, M.; Marti, R. (2002) The OptQuest Callable Library to Appear in Optimization
Software Class Libraries; ed. S. Voss and D.L. Woodruff; pp. 193-218; Boston: Kluwer Academic Publishers.
Lai, F.-h.; Fan, C.; Shoemaker, L.; Field, R. (2003) Development of a Decision-support Framework for Placement of BMPs in Urban Watersheds; In: Water Environment Federation Specialty Conference TMDL 2003; Nov. 15-19, 2003; Chicago, IL.
Lai, F.-h.; Shoemaker, L.; Riverson, J. (2004) Framework for Placement of BMP/LID in Urban Watersheds.; In: LID Conference: Putting the LID on Stormwater Management, Sept. 21-23, 2004; College Park, MD.
Lai, F.-h.; Shoemaker, L.; Riverson, J. (2005) Framework Design for BMP Placement in Urban Watersheds; In: Proceedings of the ASCE EWRI World Water and Environmental Congress; May 15 19, 2005; Anchorage, AK.
Lai, F.-h.; Zhen, J.; Riverson, J.; Shoemaker, L. (2006) SUSTAIN – An Evaluation and Cost-Optimization Tool for Placement of BMPs; In: Proceedings of the ASCE EWRI World Water and Environmental Congress; May 21-25, 2006; Omaha, NE.
Linsley, R. K.; Franzini, J. B.; Freyberg, D. L.; Tchobanoglous, G. (1992) Water-Resources Engineering. 4th Edition, McGraw-Hill, New York.
Maidment, D. (1993) Handbook of Hydrology; McGraw-Hill; New York, NY. Muñoz-Carpena, R. (1993) Modeling hydrology and sediment transport on vegetative filter
strips. Ph.D. dissertation, North Carolina State University, Raleigh, NC. Muñoz-Carpena, R.; Parsons, J.E. (2003) VFSMOD-W Vegetative Filter Strips Hydrology and
Sediment Transport Modeling System: Model Documentation and User’s Manual. Biological and Agricultural Engineering, University of Florida.
Persson, J.; Sommes, N. L.G.; Wong, T. H. F. (1999) Hydraulics efficiency of constructed wetlands and ponds. Water Science and Technology 40(3), 291–300.
Prince George’s County (2001) Low-Impact Development Management Practices Evaluation Computer Module, User’s Guide. Prepared by Tetra Tech, Inc., Fairfax, VA.

23
Riverson, J.; Zhen, J.; Shoemaker, L.; Lai, F.-h. (2004) Design of a Decision Support System for Selection and Placement of BMPs in Urban Watersheds. World Water and Environmental Resources Congress 2004, June 27 – July 1, 2004, Salt Lake City, Utah, USA.
Roesner, L.; Bledsoe, B.; Brashear, R (2001) Are best-management-practice criteria really environmentally friendly?. ASCE Journal of Water Resources Planning and Management, 27(3), 150-154.
Rossman, L. A. (2005) Stormwater Management Model User’s Manual, Version 5.0. Cincinnati, OH 45268.
United States Environmental Protection Agency (EPA) (1999) Preliminary data summary of urban storm water best management practices; EPA 821/R-99/012; Office of Water, Washington, DC.
United States Environmental Protection Agency (EPA) (2000) Our Built and Natural Environments, A Technical Review of the Interaction Between Land Use, Transportation and Environmental Quality; EPA Report EPA231-R-00-005.
United States Environmental Protection Agency (EPA) (2004a) Stormwater Best Management Practice Design Guide; EPA/600/R-04/121; Office of Research and Development, Washington, DC.
United States Environmental Protection Agency (EPA) (2004b) The Use of Best Management Practices (BMPs) in Urban Watersheds; EPA/600/R-04/184; Office of Research and Development, Washington, DC.
United States Environmental Protection Agency (EPA) (2005) Storm Water Management Model (SWMM) Version 5.0.005b. Available at: http://www.epa.gov/ednnrmrl/swmm/index.htm. Accessed in September, 2005.
United States Environmental Protection Agency (EPA) (2006) Overview of Current Total Maximum Daily Load – TMDL – Program and Regulations. http://www.epa.gov/cgi-bin/epaprintonly.cgi.
Wong, T. H. F.; Breen, P. F. (2002) Recent advances in Australian practice on the use of constructed wetlands for stormwater treatment. In Global Solutions for Urban Drainage, Proceedings of the Ninth International Conference on Urban Drainage, eds. Strecker E. W.; Huber, W. C., Portland, OR; American Society of Civil Engineers. CD-ROM, September 2002.
Wong, T. H. F.; Duncan, H. P.; Fletcher, T. D.; Jenkins G. A. (2001) A unified approach to modelling urban stormwater treatment. In Proceedings of the Second South Pacific Stormwater Conference, Auckland, New Zealand, June 2001.
Zhen, X.; Yu, S. L. (2004) Optimal location and sizing of stormwater basins at watershed scale. Journal of Water Resources Planning and Management, 130(4) (July 2004).