Diurnal and seasonal osmotic potential changes in Lotus creticus creticus plants grown under saline...
10
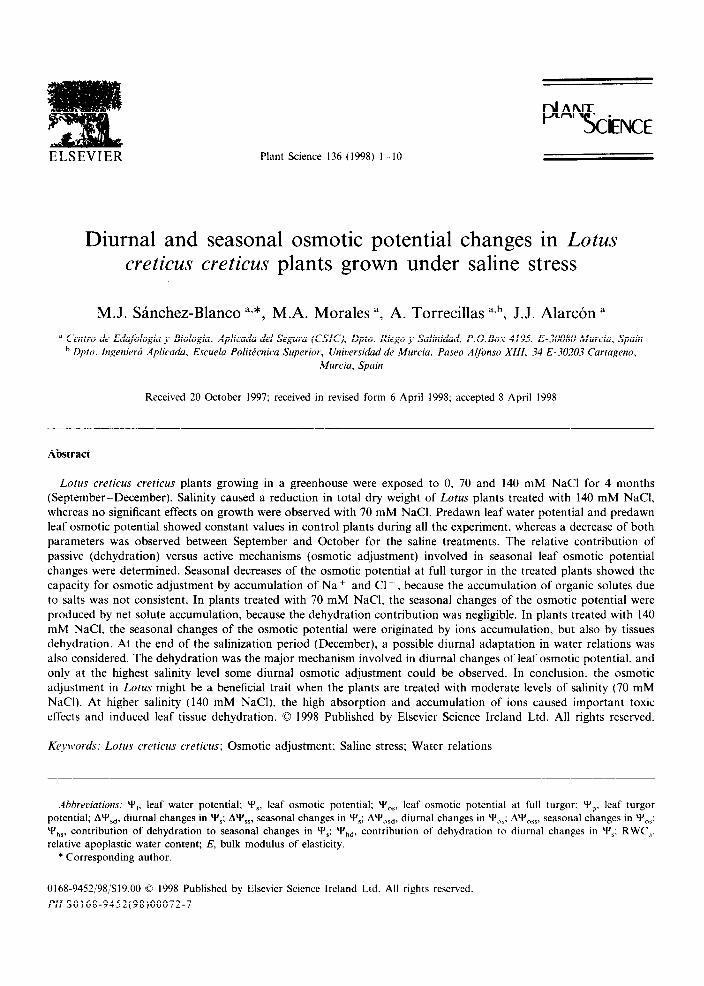
ELSEVIER Plant Science 136 (1998) l-10 Diurnal and seasonal osmotic potential changes in Lotus creticus creticus plants grown under saline stress M.J. Sinchez-Blanc0 ‘**, M.A. Morales ‘, A. Torrecillas a.b, J.J. Alardn a ” C’entro de Edqfblogia _V Biologia, Aplicada del Segura (CSIC), Dpto. Riego y Salinidad, P.O.Bos 4195. E-30080 Murcia, Spain b Dpto. Ingenierd Aplicada. Escuela Polittknica Superior, Universidad de Murcia. Paseo AIfbnso XIII, 34 E-30203 Cartagena. Murcia, Spain Received 20 October 1997; received in revised form 6 April 1998; accepted 8 April 1998 Abstract Lotus creticus creticus plants growing in a greenhouse were exposed to 0. 70 and 140 mM NaCl for 4 months (September-December). Salinity caused a reduction in total dry weight of Lotus plants treated with 140 mM NaCl, whereas no significant effects on growth were observed with 70 mM NaCl. Predawn leaf water potential and predawn leaf osmotic potential showed constant values in control plants during all the experiment, whereas a decrease of both parameters was observed between September and October for the saline treatments. The relative contribution of passive (dehydration) versus active mechanisms (osmotic adjustment) involved in seasonal leaf osmotic potential changes were determined. Seasonal decreases of the osmotic potential at full turgor in the treated plants showed the capacity for osmotic adjustment by accumulation of Na + and Cl -- , because the accumulation of organic solutes due to salts was not consistent. In plants treated with 70 mM NaCl. the seasonal changes of the osmotic potential were produced by net solute accumulation, because the dehydration contribution was negligible. In plants treated with 140 mM NaCl, the seasonal changes of the osmotic potential were originated by ions accumulation, but also by tissues dehydration. At the end of the salinization period (December), a possible diurnal adaptation in water relations was also considered. The dehydration was the major mechanism involved in diurnal changes of leaf osmotic potential, and only at the highest salinity level some diurnal osmotic adjustment could be observed. In conclusion. the osmotic adjustment in Lotus might be a beneficial trait when the plants are treated with moderate levels of salinity (70 mM NaCl). At higher salinity (140 mM NaCl), the high absorption and accumulation of ions caused important toxic effects and induced leaf tissue dehydration. 0 1998 Published by Elsevier Science Ireland Ltd. All rights reserved. Keywords: Lotus creticus crrticus: Osmotic adjustment; Saline stress; Water relations .4bbreviations: ‘Y,. leaf water potential; Y_ leaf osmotic potential; YO,, leaf osmotic potential at full turgor; Y’,, leaf turgor potential; AYy,,, diurnal changes in Y,; AY’,,, seasonal changes in Y’,; AY,,,, diurnal changes in Y,,; AY,,,, seasonal changes in Y,,: Y,,, contribution of dehydration to seasonal changes in Ys; Yhd, contribution of dehydration to diurnal changes in Y’,: RWC,,. relative apoplastic water content; E, bulk modulus of elasticity. * Corresponding author. 0168-9452/98/$19.00 0 1998 Published by Elsevier Science Ireland Ltd. All rights reserved I’II SO1 68-9452(98)00072-7
Transcript of Diurnal and seasonal osmotic potential changes in Lotus creticus creticus plants grown under saline...
ELSEVIER Plant Science 136 (1998) l-10
Diurnal and seasonal osmotic potential changes in Lotus creticus creticus plants grown under saline stress
M.J. Sinchez-Blanc0 ‘**, M.A. Morales ‘, A. Torrecillas a.b, J.J. Alardn a
” C’entro de Edqfblogia _V Biologia, Aplicada del Segura (CSIC), Dpto. Riego y Salinidad, P.O.Bos 4195. E-30080 Murcia, Spain b Dpto. Ingenierd Aplicada. Escuela Polittknica Superior, Universidad de Murcia. Paseo AIfbnso XIII, 34 E-30203 Cartagena.
Murcia, Spain
Received 20 October 1997; received in revised form 6 April 1998; accepted 8 April 1998
Abstract
Lotus creticus creticus plants growing in a greenhouse were exposed to 0. 70 and 140 mM NaCl for 4 months (September-December). Salinity caused a reduction in total dry weight of Lotus plants treated with 140 mM NaCl, whereas no significant effects on growth were observed with 70 mM NaCl. Predawn leaf water potential and predawn leaf osmotic potential showed constant values in control plants during all the experiment, whereas a decrease of both parameters was observed between September and October for the saline treatments. The relative contribution of
passive (dehydration) versus active mechanisms (osmotic adjustment) involved in seasonal leaf osmotic potential changes were determined. Seasonal decreases of the osmotic potential at full turgor in the treated plants showed the capacity for osmotic adjustment by accumulation of Na + and Cl -- , because the accumulation of organic solutes due to salts was not consistent. In plants treated with 70 mM NaCl. the seasonal changes of the osmotic potential were produced by net solute accumulation, because the dehydration contribution was negligible. In plants treated with 140 mM NaCl, the seasonal changes of the osmotic potential were originated by ions accumulation, but also by tissues dehydration. At the end of the salinization period (December), a possible diurnal adaptation in water relations was also considered. The dehydration was the major mechanism involved in diurnal changes of leaf osmotic potential, and only at the highest salinity level some diurnal osmotic adjustment could be observed. In conclusion. the osmotic adjustment in Lotus might be a beneficial trait when the plants are treated with moderate levels of salinity (70 mM NaCl). At higher salinity (140 mM NaCl), the high absorption and accumulation of ions caused important toxic effects and induced leaf tissue dehydration. 0 1998 Published by Elsevier Science Ireland Ltd. All rights reserved.
Keywords: Lotus creticus crrticus: Osmotic adjustment; Saline stress; Water relations
.4bbreviations: ‘Y,. leaf water potential; Y_ leaf osmotic potential; YO,, leaf osmotic potential at full turgor; Y’,, leaf turgor
potential; AYy,,, diurnal changes in Y,; AY’,,, seasonal changes in Y’,; AY,,,, diurnal changes in Y,,; AY,,,, seasonal changes in Y,,:
Y,,, contribution of dehydration to seasonal changes in Ys; Yhd, contribution of dehydration to diurnal changes in Y’,: RWC,,.
relative apoplastic water content; E, bulk modulus of elasticity.
* Corresponding author.
0168-9452/98/$19.00 0 1998 Published by Elsevier Science Ireland Ltd. All rights reserved
I’II SO1 68-9452(98)00072-7
2 M.J. Sbnchez-Blanco et al. /Plant Science 136 (1998) I- 10
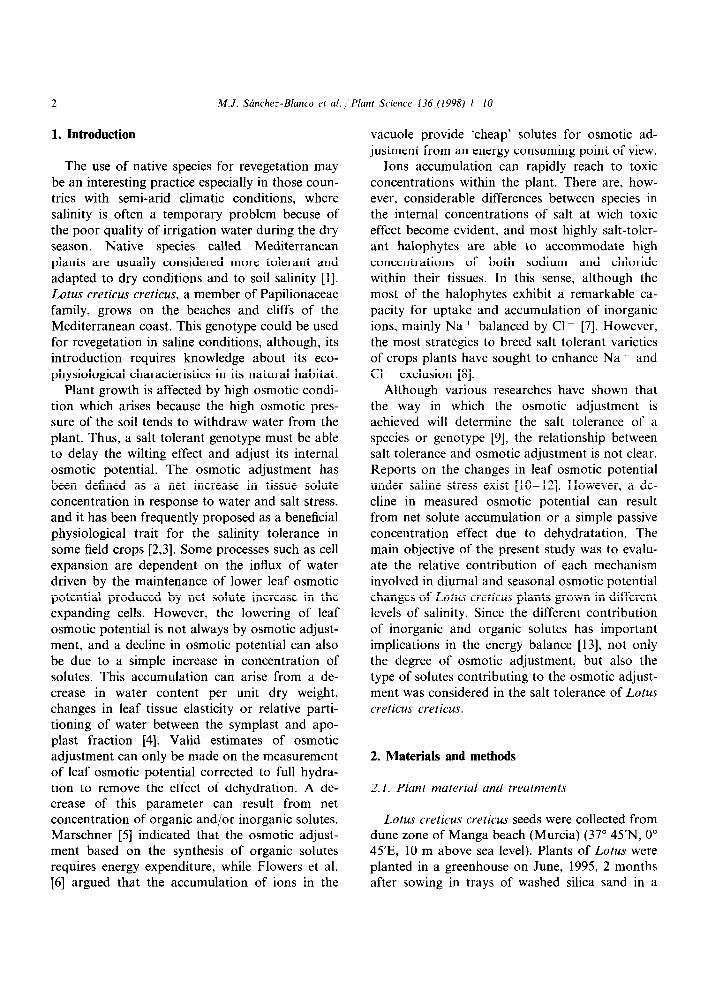
1. Introduction
The use of native species for revegetation may Ions accumulation can rapidly reach to toxic be an interesting practice especially in those coun- concentrations within the plant. There are, how- tries with semi-arid climatic conditions, where ever, considerable differences between species in salinity is often a temporary problem becuse of the internal concentrations of salt at with toxic the poor quality of irrigation water during the dry effect become evident, and most highly salt-toler- season. Native species called Mediterranean ant hdlophytes are able to accommodate high plants are usually considered more tolerant and concentrations of both sodium and chloride adapted to dry conditions and to soil salinity [l]. within their tissues. In this sense, although the Lotus creticus creticus, a member of Papilionaceae most of the halophytes exhibit a remarkable ca- family, grows on the beaches and cliffs of the pacity for uptake and accumulation of inorganic Mediterranean coast. This genotype could be used ions, mainly Na + balanced by Cl ~ [7]. However, for revegetation in saline conditions, although, its the most strategies to breed salt tolerant varieties introduction requires knowledge about its eco- of crops plants have sought to enhance Na + and physiological characteristics in its natural habitat. Cl - exclusion [8].
Plant growth is affected by high osmotic condi- tion which arises because the high osmotic pres- sure of the soil tends to withdraw water from the plant. Thus, a salt tolerant genotype must be able to delay the wilting effect and adjust its internal osmotic potential. The osmotic adjustment has been defined as a net increase in tissue solute concentration in response to water and salt stress, and it has been frequently proposed as a beneficial physiological trait for the salinity tolerance in some field crops [2,3]. Some processes such as cell expansion are dependent on the influx of water driven by the maintenance of lower leaf osmotic potential produced by net solute increase in the expanding cells. However, the lowering of leaf osmotic potential is not always by osmotic adjust- ment, and a decline in osmotic potential can also be due to a simple increase in concentration of solutes. This accumulation can arise from a de- crease in water content per unit dry weight, changes in leaf tissue elasticity or relative parti- tioning of water between the symplast and apo- plast fraction [4]. Valid estimates of osmotic adjustment can only be made on the measurement of leaf osmotic potential corrected to full hydra- tion to remove the effect of dehydration. A de- crease of this parameter can result from net concentration of organic and/or inorganic solutes. Marschner [5] indicated that the osmotic adjust- ment based on the synthesis of organic solutes requires energy expenditure, while Flowers et al. [6] argued that the accumulation of ions in the
Although various researches have shown that the way in which the osmotic adjustment is achieved will determine the salt tolerance of a species or genotype [9], the relationship between salt tolerance and osmotic adjustment is not clear. Reports on the changes in leaf osmotic potential under saline stress exist [lo-121. However, a de- cline in measured osmotic potential can result from net solute accumulation or a simple passive concentration effect due to dehydratation. The main objective of the present study was to evalu- ate the relative contribution of each mechanism involved in diurnal and seasonal osmotic potential changes of Lotus creticus plants grown in different levels of salinity. Since the different contribution of inorganic and organic solutes has important implications in the energy balance [13], not only the degree of osmotic adjustment, but also the type of solutes contributing to the osmotic adjust- ment was considered in the salt tolerance of Lotus creticus creticus.
2. Materials and methods
2.1. Plant materiul and treatments
Lotus creticus creticus seeds were collected from dune zone of Manga beach (Murcia) (37” 45’N, 0” 45’E, 10 m above sea level). Plants of Lotus were planted in a greenhouse on June, 1995, 2 months after sowing in trays of washed silica sand in a
vacuole provide ‘cheap’ solutes for osmotic ad- justment from an energy consuming point of view.
growth chamber. They were grown in 100 x 50 x
15 cm plastic containers filled with a mixture of silt loam, perlite and clay, (equal parts by vol.) during 7 months (June-December). There were two plants per container in a randomized com- plete block design using one control and two saline treatments and three replications. The plants were irrigated daily, with an automated drip irrigation system. with 500 ml/plant of nutri- ent solution (0.3 g/l NH,NO,, 0.15 g/l KNO,, 0.15 g/l NH,PO,H; O.O6g/l Ca, 0.005 g/l Fe and 0.005 g/l Zn).
The treatments 0. 70, and 140 mM NaCl (con- trol, Sl and S2 treatments, respectively) were applied from September, when the plants were have got used to the field conditions. The irriga-
tion water during the experimental period had an average electrical conductivity (EC) of 1.25 ds/m for the control treatment and 7.23 ds/m and 12.61 ds:m for Sl and S2. respectively. The environmen- tal conditions during the experiment were 35/lO”C maximum/minimum average temperatures and the relative humidity ranged between 30 and 90%. The average of the maximum photosynthetically active radiation (PAR), measured with a quantum sensor (LICOR, model 19OS-1) installated 1 m above plants. was 970 /lmol/m’ per s.
2.2. Wtrter rehtions und growh meusurements
Seasonal courses of leaf water potential (Y,), osmotic potential (Y’,), leaf osmotic potential at full turgor (Y’,) and turgor potential (Y,) were measured monthly at predawn. Besides, these wa- ter parameters were registered from dawn to sun- set at 2 h intervals at the end of the salinization period (December). Measurements on two leaves! plant and one plant/replication and treatment were taken at each sampling time.
Leaf water potential was measured using a pressure chamber according to Turner [14]. Leaves were kept in a plastic bag and placed in the chamber within 20 s of collection. Leaf os- motic potential (Y’,) and leaf osmotic potential at full turgor (Y’,,,) were measured with a Wescor 5500 vapour pressure osmometer (Wescor). The leaves for the measurements of Y, and Y’,,, were frozen in liquid nitrogen and stored at - SO”C,
and 10 ,~11 of sap were expressed for determination of the solute concentration according to Gucci et
al. [15]. For Y’,,, the leaf samples were previously subjected to a rehydration treatment by dipping their petioles in distilled water for 24 h. The
rehydration treatment was applied at dark, high humidity (95% H.R.) and low temperature (lo-- 15°C) [12].
Diurnal changes in Y’, (AY,,) and Y,,, (AY’,,,) were calculated according to Girma and Krieg [4]. as the difference in Y, and Y,,, between predawn
(dw) and the each sampling times during the day
(day).
A’f’,, = ( Y\)d” - (Y$ra?
AY = (Y <>\J 0, )dw -(Y o\ )““?
Seasonal changes in Y’, (AY’,,) and Yy,,, (AY’,,,,) were estimated as the difference between the ini-
tial values of Y’, and Y,,, measured in September (it), and the values of these parameters measured in the latter months (It).
AY,, = (Ys)” - (Y’,)”
AY’,,,, = (Y’,,,)” - (Y,,,)”
The contribution of dehydration to the daily and seasonal changes of Y, (Y,,, and Y,,, respec- tively) was calculated using the following equations:
Y’,,, = AY,, - AY<,,,
YY,, = AY’,, - AY<,,,
The bulk modulus of elasticity (E) at 100% RWC was estimated by assuming an almost linear relationship between turgor potential and RWC using the method of Wilson et al. [16].
Apoplastic water content (RWC,) was esti- mated using pressure-volume relationships ac- cording to Torrecillas et al. [17]. For the construction of a pressure-volume curve the leaves excised in the dark were placed in a beaker with their cut ends submerged in water and left for 24 h. Water loss was determined by monitoring the change in fresh weight with time during a 5 h period. Apoplastic water content was calculated by extrapolation to the abscissa of a linear por- tion of the curve l/Y, versus RWC (relative water
4 M.J. Sbnchez-Blanc0 et al. /Plant Science 136 (1998) l-10
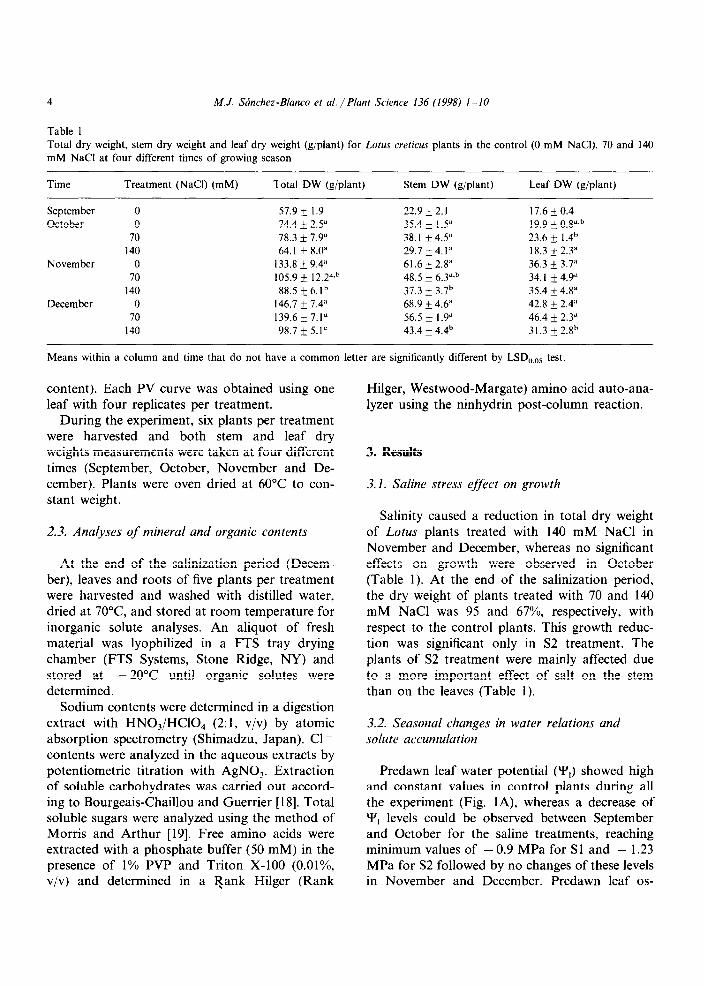
Table 1 Total dry weight, stem dry weight and leaf dry weight (g/plant) for Lotus creticus plants in the control (0 mM NaCI), 70 and 140 mM NaCl at four different times of growing season
Time Treatment (NaCI) (mM) Total DW (g/plant) Stem DW (g/plant) Leaf DW (g/plant)
September 0 57.9 * 1.9 22.9 * 2.1 17.6 * 0.4 October 0 74.4 + 2.5” 35.4 * 1.5” 19.9 + 0.8”.b
70 78.3 17.9” 38.1 k 4.5” 23.6 ; 1 .4b 140 64.1 + 8.0” 29.7 + 4.1” 18.3 + 2.3”
November 0 133.8 * 9.4” 61.6I2.8” 36.3 + 3.7” 70 105 . 9 + 12 . 2”.b 48.5 + 6.3”.b 34.1 + 4.9”
140 88.5 k6.1b 37.3 + 3.7b 35.4 + 4.8” December 0 146.7 k 7.4” 68.9 + 4.6” 42.8
70 139.6 k 7.1” 56.5 + 1.9” + 2.4”
46.4 + 2.3” 140 98.7 + 5.1’ 43.4 * 4.4b 31.3 &2.8b
Means within a column and time that do not have a common letter are significantly different by LSD,,,j5 test.
content). Each PV curve was obtained using one Hilger, Westwood-Margate) amino acid auto-ana- leaf with four replicates per treatment. lyzer using the ninhydrin post-column reaction.
During the experiment, six plants per treatment were harvested and both stem and leaf dry weights measurements were taken at four different times (September, October, November and De- cember). Plants were oven dried at 60°C to con- stant weight.
3. Results
3.1. Saline stress effect on growth
2.3. Analyses of mineral and organic contents
At the end of the salinization period (Decem- ber), leaves and roots of five plants per treatment were harvested and washed with distilled water, dried at 70°C and stored at room temperature for inorganic solute analyses. An aliquot of fresh material was lyophilized in a FTS tray drying chamber (FTS Systems, Stone Ridge, NY) and stored at - 20°C until organic solutes were determined.
Salinity caused a reduction in total dry weight of Lotus plants treated with 140 mM NaCl in November and December, whereas no significant effects on growth were observed in October (Table 1). At the end of the salinization period, the dry weight of plants treated with 70 and 140 mM NaCl was 95 and 67%, respectively, with respect to the control plants. This growth reduc- tion was significant only in S2 treatment. The plants of S2 treatment were mainly affected due to a more important effect of salt on the stem than on the leaves (Table 1).
Sodium contents were determined in a digestion extract with HNO,/HClO, (2:1, v/v) by atomic absorption spectrometry (Shimadzu, Japan). Cl ~ contents were analyzed in the aqueous extracts by potentiometric titration with AgNO,. Extraction of soluble carbohydrates was carried out accord- ing to Bourgeais-Chaillou and Guerrier [18]. Total soluble sugars were analyzed using the method of Morris and Arthur [ 191. Free amino acids were extracted with a phosphate buffer (50 mM) in the presence of 1% PVP and Triton X-100 (O.Ol%, v/v) and determined in a Rank Hilger (Rank
3.2. Seasonal changes in water relations and solute accumulation
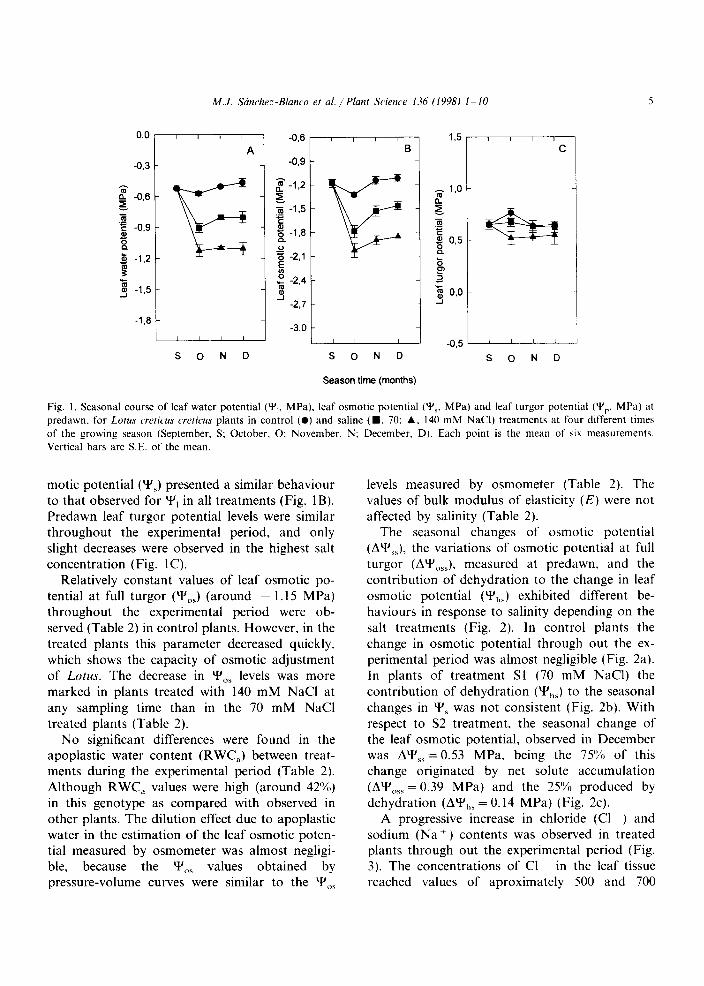
Predawn leaf water potential (Y,) showed high and constant values in control plants during all the experiment (Fig. lA), whereas a decrease of Y, levels could be observed between September and October for the saline treatments, reaching minimum values of - 0.9 MPa for Sl and - 1.23 MPa for S2 followed by no changes of these levels in November and December. Predawn leaf os-
M.J. Srinchc-Blanco et al. /Plant S&wce 136 (1998) I IO
-Iv8 L S o N D
z -1.2 -
E z -1.5 - ‘G s
: -‘,8 ‘f -2,l :E
; -24 -
-I -2-7 -
-3,o t , , / ,
S 0 N D -0.5 ----
S 0 N D
Season time (months)
Fig. 1. Seasonal course of leaf water potential (Y,, MPa). leaf osmotic potential (Y,. Mf’d) and leaf turgor potential (Y,,, MPa) at
predawn. for Lotus crrtic,us creticus plants in control (0) and saline ( W. 70: A, 140 mM NaCl) treatments at four different times
of the growing season (September, S: October, 0; November, N; December. D). Each point is the mean of SIX measurements.
Vertical bars are SE. of the mean.
motic potential (Y,) presented a similar behaviour to that observed for Y, in all treatments (Fig. 1B). Predawn leaf turgor potential levels were similar throughout the experimental period, and only slight decreases were observed in the highest salt concentration (Fig. 1 C).
Relatively constant values of leaf osmotic po- tential at full turgor (‘I’,,) (around - 1.15 MPa) throughout the experimental period were ob-
served (Table 2) in control plants. However, in the treated plants this parameter decreased quickly. which shows the capacity of osmotic adjustment of Lotus. The decrease in Y’,, levels was more marked in plants treated with 140 mM NaCl at
any sampling time than in the 70 mM NaCl treated plants (Table 2).
No significant differences were found in the apoplastic water content (RWC,) between treat- ments during the experimental period (Table 2). Although RWC, values were high (around 42%) in this genotype as compared with observed in other plants. The dilution effect due to apoplastic water in the estimation of the leaf osmotic poten- tial measured by osmometer was almost negligi- ble, because the Y’,, values obtained by pressure-volume curves were similar to the Yes
levels measured by osmometer (Table 2). The values of bulk modulus of elasticity (E) were not affected by salinity (Table 2).
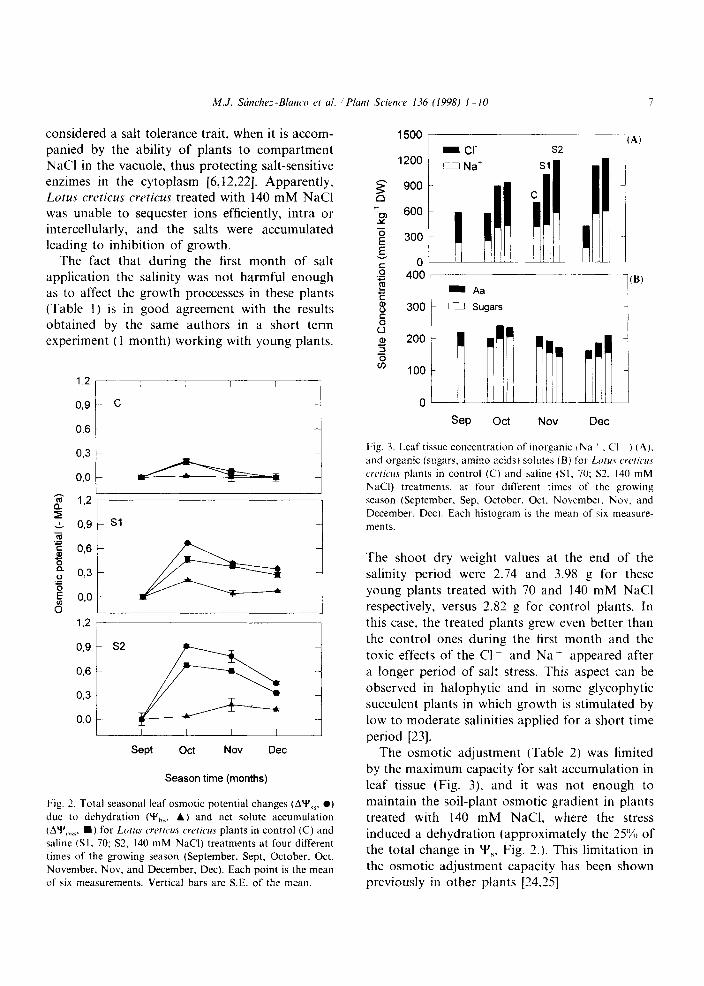
The seasonal changes of osmotic potential (AY,,), the variations of osmotic potential at full turgor (AY&, measured at predawn, and the contribution of dehydration to the change in leaf osmotic potential (Y& exhibited different be- haviours in response to salinity depending on the salt treatments (Fig. 2). In control plants the change in osmotic potential through out the ex- perimental period was almost negligible (Fig. 2a). In plants of treatment Sl (70 mM NaCl) the contribution of dehydration (Y’,,) to the seasonal
changes in Y’, was not consistent (Fig. 2b). With respect to S2 treatment, the seasonal change of the leaf osmotic potential, observed in December was AY’,,=O.53 MPa, being the 75% of this change originated by net solute accumulation (AY’,,, = 0.39 MPa) and the 25% produced by dehydration (AY,,, = 0.14 MPa) (Fig. 2~).
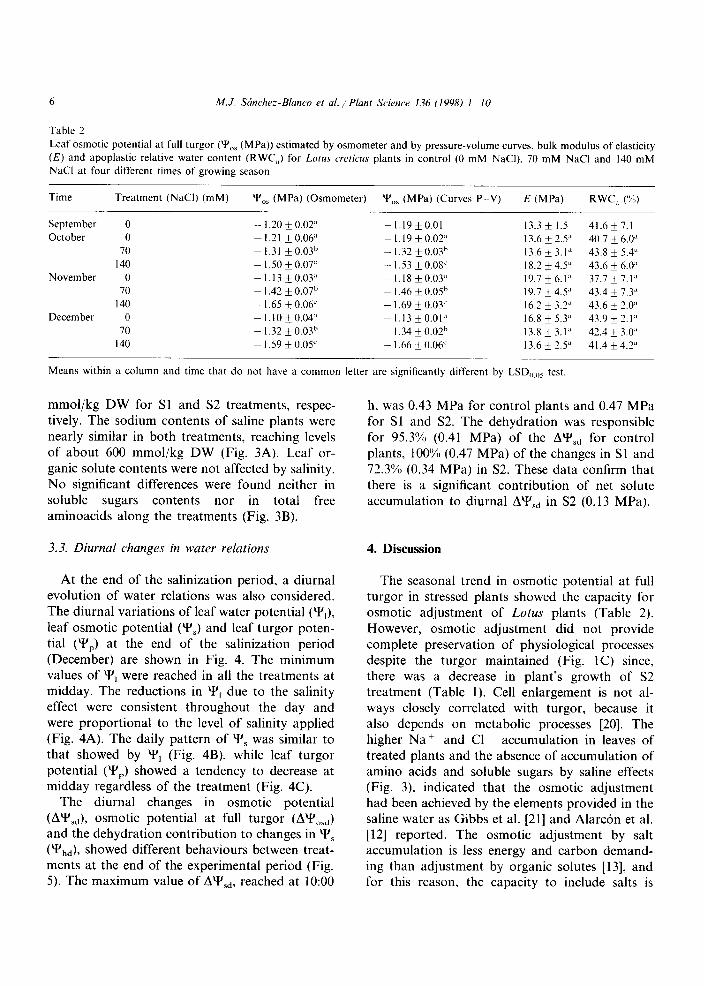
A progressive increase in chloride (Cl ) and sodium (Na+) contents was observed in treated plants through out the experimental period (Fig. 3). The concentrations of Cl in the leaf tissue reached values of aproximately 500 and 700
6 M.J. Srinchc-Blanc0 et ul. /Plant Science 136 (1998) l-10
Table 2
Leaf osmotic potential at full turgor (Y”, (MPa)) estimated by osmometer and by pressure-volume curves, bulk modulus of elasticity
(E) and apoplastic relative water content (RWC.) for Lotus creticus plants in control (0 mM NaCI). 70 mM NaCl and 140 mM
NaCl at four different times of growing season
Time Treatment (NaCI) (mM) ‘f’“, (MPa) (Osmometer) ‘PC,, (MPd) (Curves P--V) E (MPa) RWC, (‘%,)
September 0
October 0
70
140
November 0 70
140
December 0
70
140
- 1.20 * 0.02” -1.19~0.0l 13.3 + I.5 41.6 * 7.1
-1.71 +0.06” -l.l9*0.02.’ 13.6 * 2.5” 40.7 + 6.0”
-I.& T0.03b - I .32 + 0.03h 13.6 i 3.1” 43.8 + 5.4” _ - I .50 * 0.07’ - I .53 * 0.08’ 18.2 + 4.5” 43.6 i 6.0”
-1.13+0.03” - I.18 kO.03,’ 19.7 i 6.1.’ 37.7 + 7.1,’
- I .42 * 0.07h - I .46 + 0.05” 19.7 + 4.5;’ _ 43.4 * 7.3”
- I .65 k 0.06’ - 1.69 + 0.03’ 16.2 f 3.2” 43.6 + 3.0;’ _- -l.lo+o.o4” - I.13 f 0.01,’ 16.8 * 5.3” 43.9 i_ 2.1,’
- I .32 f 0.03h ~ I .34 f 0.02h 13.8 k 3.1” 42.4 f 3.p
- I .59 f 0.05’ - I .66 * 0.06’ 13.6 + 2.5” 41.4 f 4.?
Means within a column and time that do not have a common letter are significantly different by LSD,,,,, test.
mmol/kg DW for Sl and S2 treatments, respec- tively. The sodium contents of saline plants were nearly similar in both treatments, reaching levels of about 600 mmol/kg DW (Fig. 3A). Leaf or- ganic solute contents were not affected by salinity. No significant differences were found neither in soluble sugars contents nor in total free aminoacids along the treatments (Fig. 3B).
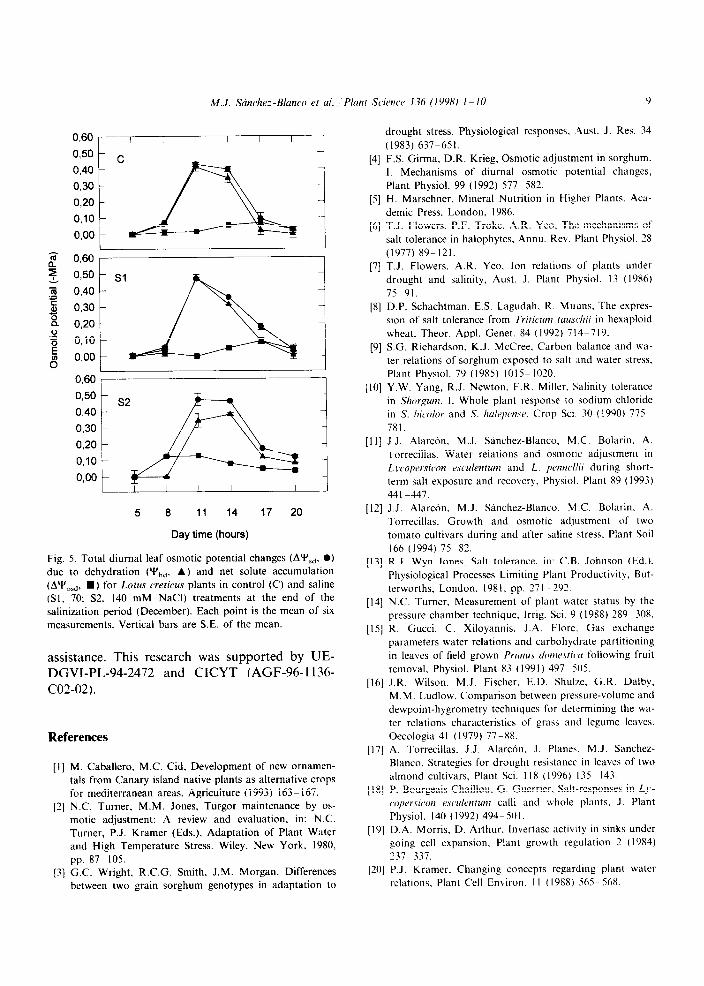
h, was 0.43 MPa for control plants and 0.47 MPa for Sl and S2. The dehydration was responsible for 95.3% (0.41 MPa) of the AY’,, for control plants, 100% (0.47 MPa) of the changes in Sl and 72.3% (0.34 MPa) in S2. These data confirm that there is a significant contribution of net solute accumulation to diurnal AY’,, in S2 (0.13 MPa).
3.3. Diurnal changes in water relations 4. Discussion
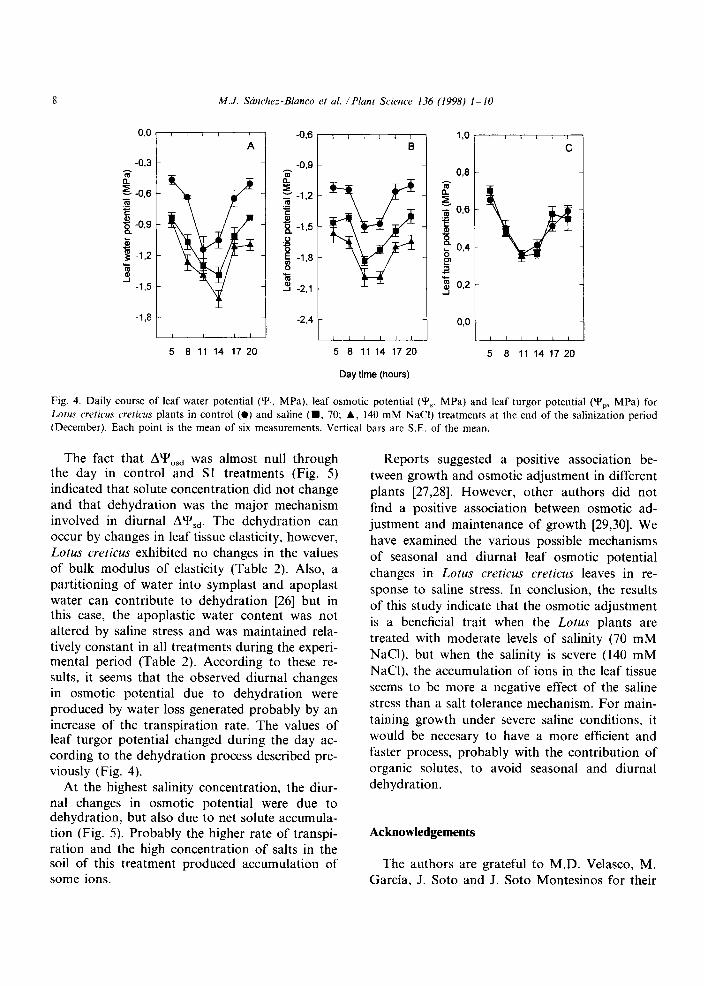
At the end of the salinization period, a diurnal evolution of water relations was also considered. The diurnal variations of leaf water potential (Y,), leaf osmotic potential (Y,) and leaf turgor poten- tial (Y,) at the end of the salinization period (December) are shown in Fig. 4. The minimum values of Y, were reached in all the treatments at midday. The reductions in Y, due to the salinity effect were consistent throughout the day and were proportional to the level of salinity applied (Fig. 4A). The daily pattern of Y’, was similar to that showed by Y, (Fig. 4B), while leaf turgor potential (Y,) showed a tendency to decrease at midday regardless of the treatment (Fig. 4C).
The diurnal changes in osmotic potential (AYs,), osmotic potential at full turgor (AY& and the dehydration contribution to changes in Y’, (Y&, showed different behaviours between treat- ments at the end of the experimental period (Fig. 5). The maximum value of AY’,,, reached at 10:00
The seasonal trend in osmotic potential at full turgor in stressed plants showed the capacity for osmotic adjustment of Lotus plants (Table 2).
However, osmotic adjustment did not provide complete preservation of physiological processes despite the turgor maintained (Fig. 1C) since, there was a decrease in plant’s growth of S2 treatment (Table 1). Cell enlargement is not al- ways closely correlated with turgor, because it also depends on metabolic processes [20]. The higher Na+ and Cl ~ accumulation in leaves of
treated plants and the absence of accumulation of amino acids and soluble sugars by saline effects (Fig. 3). indicated that the osmotic adjustment had been achieved by the elements provided in the saline water as Gibbs et al. [21] and Alarcon et al. [12] reported. The osmotic adjustment by salt accumulation is less energy and carbon demand- ing than adjustment by organic solutes [13], and for this reason, the capacity to include salts is
considered a salt tolerance trait, when it is accom- 1500 /
c I
(A) panied by the ability of plants to compartment - cl- s2
NaCl in the vacuole, thus protecting salt-sensitive 1200 CII Na’ Sl
enzimes in the cytoplasm [f&12,22]. Apparently, Z
900 Lotus cwticus crrticus treated with 140 mM NaCl C
was unable to sequester ions efficiently, intra 01 ‘; 9
600
intercellularly, and the salts were accumulated 5 leading to inhibition of growth.
300
The fact that during the first month of salt Z
0’ L I
application the salinity was not harmful enough S ‘5 400
as to affect the growth proccesses in these plants
ifiy:
, -Aa 1 (B) E
(Table 1) is in good agreement with the results 8 _ 300 1 0 Sugars
obtained by the same authors in a short term E 0
experiment (1 month) working with young plants.
Sept Ott Nov Dee
Season time (months)
Sep act Nov Dee
Fig. 3. Leaf tissue concentration of inorganic iNa ’ , C‘I ) (A).
and organic (sugars, amino acids) solutes (B) for Lt>ru.v crc~rk~c
c~ric~.s plants in control (C) and saline (SI. 70; S1, I40 mM
NaCI) treatments, at four different times of the growing
season (September. Sep. October. Oct. November. Nov. and
December. Dee). Each histogram is the mean of six measure-
ments.
The shoot dry weight values at the end of the
salinity period were 2.74 and 3.98 g for these
young plants treated with 70 and 140 mM NaCl
respectively, versus 2.82 g for control plants. In
this case, the treated plants grew even better than
the control ones during the first month and the
toxic effects of the Cl ~ and Na + appeared after
a longer period of salt stress. This aspect can be
observed in halophytic and in some glycophytic
succulent plants in which growth is stimulated by low to moderate salinities applied for a short time
period [23]. The osmotic adjustment (Table 2) was limited
by the maximum capacity for salt accumulation in
leaf tissue (Fig. 3), and it was not enough to
Fig. 2. Total seasonal leaf osmotic potential changes (A’+‘,,, 0)
due to dehydration (Y,,,. A) and net solute accumulation
(A’+‘,,,,. W) for Lotus crrticus cwticus plants in control (C) and
saline (Sl, 70; S2, 140 mM NaCl) treatments at four different
times of the growing season (September, Sept. October, Oct.
November, Nov, and December. Dee). Each point is the mean
of six measurements. Vertical bars are S.E. of the mean.
maintain the soil-plant osmotic gradient in plants
treated with 140 mM NaCl, where the stress
induced a dehydration (approximately the 25% of the total change in Y’,, Fig. 2.). This limitation in
the osmotic adjustment capacity has been shown previously in other plants [24.25]
M.J. Srinchez-Blanco et al. /Plant Science 136 (1998) I-IO
-0,6
-0,9 3
B - -I,2 3 E
“g -I,5 .$
f -I,8 :: z .!Y -2,l
-2.4
I I I I
Day time (hours)
I I I
5 8 11141720
4. Daily of leaf potential (Y’,, leaf osmotic (Y,. MPa) leaf turgor (Y,, MPa)
Lotus creficus plants in (0) and (m. 70; 140 mM treatments at end of salinization period
Each point the mean six measurements. bars are of the
The fact that AY’,,, was almost null through the day in control and Sl treatments (Fig. 5) indicated that solute concentration did not change and that dehydration was the major mechanism involved in diurnal AYs,. The dehydration can occur by changes in leaf tissue elasticity, however, Lotus creticus exhibited no changes in the values of bulk modulus of elasticity (Table 2). Also, a partitioning of water into symplast and apoplast water can contribute to dehydration [26] but in this case, the apoplastic water content was not altered by saline stress and was maintained rela- tively constant in all treatments during the experi- mental period (Table 2). According to these re- sults, it seems that the observed diurnal changes in osmotic potential due to dehydration were
produced by water loss generated probably by an increase of the transpiration rate. The values of leaf turgor potential changed during the day ac- cording to the dehydration process described pre- viously (Fig. 4).
At the highest salinity concentration, the diur- nal changes in osmotic potential were due to dehydration, but also due to net solute accumula- tion (Fig. 5). Probably the higher rate of transpi- ration and the high concentration of salts in the soil of this treatment produced accumulation of some ions.
Reports suggested a positive association be-
tween growth and osmotic adjustment in different
plants [27,28]. However, other authors did not
find a positive association between osmotic ad-
justment and maintenance of growth [29,30]. We
have examined the various possible mechanisms
of seasonal and diurnal leaf osmotic potential
changes in Lotus creticus creticus leaves in re-
sponse to saline stress. In conclusion, the results
of this study indicate that the osmotic adjustment
is a beneficial trait when the Lotus plants are
treated with moderate levels of salinity (70 mM
NaCl), but when the salinity is severe (140 mM
NaCl), the accumulation of ions in the leaf tissue seems to be more a negative effect of the saline
stress than a salt tolerance mechanism. For main-
taining growth under severe saline conditions, it
would be necesary to have a more efficient and
faster process, probably with the contribution of
organic solutes, to avoid seasonal and diurnal dehydration.
Acknowledgements
The authors are grateful to M.D. Velasco, M. Garcia, J. Soto and J. Soto Montesinos for their
M.J. Sbnck-Blunco et al. ‘Plant Science 136 (1998) I - 10 9
0,60
0,50 - 61
0,40 -
0,30 -
0,20 ~
0.10 -
o,oo-
0,60 /
0.50 s2
0,40
0,30
0,20
0,lO
0,oo IA:
5 8 11 14 17 20 [IT
Fig. 5. Total diurnal leaf osmotic potential changes (A’Py,,. 0)
due to dehydration (Y’,,, A) and net solute accumulation
(A’?‘,,, n ) for Lotus crericus plants in control (C) and saline
(SI. 70: S2. 140 mM NaCI) treatments at the end of the
salinization period (December). Each point is the mean of six
measurements. Vertical bars are S.E. of the mean.
[I31
[I41
[I51
assistance. This research was supported by UE- DGVI-PL-94-2472 and CICYT (AGF-96- 1136- co2-02).
References
[I] M. Caballero, M.C. Cid, Development of new ornamen-
tals from Canary island native plants as alternative crops
for mediterranean areas, Agriculture (1993) 163- 167.
[2] N.C. Turner. M.M. Jones, Tuvgor maintenance by os- motic adjustment: A review and evaluation, in: N.C.
Turner, P.J. Kramer (Eds.). Adaptation of Plant Water
and High Temperature Stress. Wiley, New York. 1980,
pp. 87-105.
[3] G.C. Wright, R.C.G. Smith, J.M. Morgan, Differences
between two grain sorghum genotypes in adaptation to
[41
ES1
[‘51
drought stress. Physiological responses. .Aust. J. Res. 34
(1983) 637-651.
F.S. Girma, D.R. Krieg. Osmotic adjustment in sorghum.
1. Mechanisms of diurnal osmotic potential changes,
Plant Physiol. 99 (1992) 577-582.
H. Marschner. Mineral Nutrition in Higher Plants. Aca-
demic Press, London, 1986.
[71
T.J. Flowers. P.F. Troke. A.R. Yeo, The mechanisms of
salt tolerance in halophytes, Annu. Rev. Plant Physiol. 28
(1977) 89-121.
T.J. Flowers. A.R. Yeo. Ion relations of plants under
drought and salinity, Aust. J. Plant Physiol. 13 (1986)
75-91.
PI
[91 I 1
I
[lOI
D.P. Schachtman. E.S. Lagudah. R. Muuns. The expres-
sion of salt tolerance from Triticum fauschii in hexaploid
wheat. Theor. Appl. Genet. 84 (1992) 714--719.
S.G. Richardson, K.J. McCree, Carbon balance and wa-
ter relations of sorghum exposed to salt and water stress.
Plant Physiol. 79 (1985) 1015- 1020.
Y.W. Yang, R.J. Newton, F.R. Miller. Salinity tolerance
in Stuyqm. I. Whole plant response to sodium chloride
in S. hi&or and S. tlu/r~e~7.\e. Crop Sci. 30 ( 1990) 775
781.
I
I
[I 11
[I61
u71
[181
J.J. Alarcbn. M.J. Slinchez-Blanco, M.C. Bolarin. A.
Torrecillas. Water relations and osmotic adjustment in
L~c~opersicon rsmlentun~ and L. pennrltii during short-
term salt exposure and recovery. Physiol. Plant X9 (1993)
441447.
J.J. Alar&n, M.J. Slinchez-Blanco. M.C. Bolarin, A.
Torrecillas. Growth and osmotic adjustment of two
tomato cultivars during and after saline stress. Plant Soil
166 (1994) 75-82.
R.J. Wyn Jones, Salt tolerance. in: C.B. Johnson (Ed.),
Physiological Processes Limiting Plant Productivity, But-
terworths, London, 1981. pp. 271 292.
N.C. Turner, Measurement of plant water status by the
pressure chamber technique. Irrig. Sci. 9 (1988) 289 ~~308.
R. Gucci. C. Xiloyannis. J.A. Flore, Gas exchange
parameters water relations and carbohydrate partitioning
in leaves of field grown Prunu.v chv~7asti~~tr following fruit
removal, Physiol. Plant 83 (1991) 497- 505.
J.R. Wilson, M.J. Fischer. E.D. Shulze, G.R. Dalby.
M.M. Ludlow. Comparison between pressure-volume and
dewpoint-hygrometry techniques for determining the wa-
ter relations characteristics of grass and legume leaves.
Oecologia 41 (1979) 77 -8X.
A. Torrecillas. J.J. Alarcbn. J. Planes. M.J. Sgnchez-
Blanco, Strategies for drought resistance in leaves of two
almond cultivars. Plant Sci. 118 (1996) 135-143.
P. Bourgeais-Chaillou. G. Guerrier. Salt-responses in L.I,-
wpwium r.wulentun7 calli and whole plants. J. Plant
Physiol. 140 (1992) 494- 501.
[19] D.A. Morris. D. Arthur. lnvertase activity in sinks under
going cell expansion. Plant growth regulation 3 (1984)
237 337.
[20] P.J. Kramer, Changing concepts regarding plant water
relations. Plant Cell Environ. I I (1988) 565~ 568.
10 M.J. Sinchrs-Blanco rl al. /Plant Scirnce 136 (1998) I- 10
[21] J. Gibbs. M. Dracup. H. Greenway, J.A. McComb, Ef-
fects of high NaCl on growth, turgor and internal solutes
of tobacco callus, J. Plant Physiol. I34 (1989) 61-69.
[22] R.G. Wyn Jones. A. Pollard, Proteins, enzymes and inor-
ganic ions, in: A. Lauchli, R.L. Bieleski (Eds.). Encyclo-
pedia of Plant Physiology, New Series, vol. 15,
Springer-Verlag. Berlin, 1983, pp. 528562.
[23] J. Gorham, Mechanisms of salt tolerance of halophytes,
in: R. Chopukr-Allah. C.V. Malcolm, A. Hamdy (Eds.),
Halophytes and Biosaline Agriculture, Marcel Dekker,
New York, 1996, pp. 31-53.
1241 M.J. Sanchez-Blanco, M.C. Bolarin. J.J. Alarcon, A.
Torrecillas, Salinity effects on water relations in Lyqxr-
sicon esculentum and its wild salt-tolerant relative species
L. pennellii, Physiol. Plant 83 (1991) 269-274.
[25] M.J. Tyree, P.G. Jarvis. Water in tissues and cells. in:
O.L. Lange, P.S. Nobel, C.B. Osmond, H. Ziegler (Eds.).
Physiological Plant Ecology II. vol. IZB, Springer-Verlag.
Berlin, 1982. pp. 35577.
[26] E. Fereres, E. Acevedo, D.W. Henderson. T.C. Hsiao.
Seasonal changes in waer potential and turgor mainte-
nance in sorghum and maize under water stress, Physiol.
Plant 44 (1978) 261-267.
[27] R.C. Ackerson. D.R. Krieg, F.J.M. Sung. Leaf conduc-
tance and osmoregulation of field-grown sorghum geno-
types, Crop Sci. 20 (1980) 10-14.
[28] J.B. Kuang. N.C. Turner. I.E. Henson. Influence of
xylem water potential on leaf elongation and osmotic
adjustment of wheat and lupin, J. Exp. Bot. 41 (1990)
217-221.
[29] A. Blum. J. Mayer. G. Golan. Agronomic and physiolog-
ical assessment of genotypic variation for drought
resistence in sorghum. Aust. J. Agric. Res. 40 (1989)
4961.
[30] K.A. Shackel, A.E. Hall, Comparison of water relations
and osmotic adjustment in sorghum and cowpea under
field conditions, Aust. J. Plant. Physiol. IO (1983) 423-
435.