Ditc20082cer en
357
Transcript of Ditc20082cer en


Copyright © United Nations 2008All rights reserved
UNCTAD/DITC/2008/2
ISBN 978-0-9816619-0-2
Material in this publication may be freely quoted or reprinted as long as acknowledgementis provided with a reference to the source. A copy of the publication containing the quotationor reprint should be sent to the UNCTAD secretariat at: Palais des Nations,CH-1211 Geneva 10, Switzerland, and to the UNDP Special Unit for South-SouthCooperation, 1 UN Plaza, New York, NY 10017 USA.
This Report is the fruit of a collaborative effort that was led by UNCTAD and the UNDP SpecialUnit for South-South Cooperation and that included a team of experts from the collaborating UN agencies – UNCTAD, UNDP, UNESCO, WIPO and ITC – as well as internationalconsultants.
The designations employed and the presentation of material in this publication do not implythe expression of any opinion whatsoever concerning the legal status of any country,territory, city or area, or concerning the delimitation of its frontiers or boundaries.
The English version of the full report and the French and Spanish versions of its overview section are currently available on the Internet at the addresses indicated below:http://www.unctad.org/creative-economy and http://ssc.undp.org/creative_economy


ii C R E AT I V E E C O N O M Y R E P O R T 2 0 0 8

The world economy has clearly seen anextraordinary expansion in the past five years.This expansion has been more broadly basedthan ever before, allowing many developingcountries to benefit from it. Even some of theleast developed countries have been able to gen-erate average annual GDP growth of more than5 per cent, representing significant progress overthat made in the 1990s. Nevertheless, this pathof economic growth has not yet been sufficientto ensure the welfare and decent living standardsfor the large majority of people in the develop-ing world. Despite efforts to diversify theireconomies, 86 of 144 developing countries stilldepend on commodities for more than halftheir export earnings. Prevailing developmentstrategies have yet to succeed in generatingexpected levels of socio-economic developmentfor these countries. The challenge is to find fea-sible development options that take intoaccount their specific realities and in particulartheir scarcity of skilled labour, lack of basicinfrastructure and very low levels of foreigndirect investment. How to promote developmentthat is both sustainable and inclusive?
As economic models do not function inisolation, the time has come to go beyond economics and look for a more holistic develop-ment approach that considers their different cultural identities, economic aspirations, socialdisparities and technological disadvantages.Development strategies also must be updated inorder to cope with the far-reaching cultural andtechnological shifts under way in our society. Theworld needs to adapt to this new environment bybringing issues relating to culture and technologyinto the mainstream of economic developmentthinking. Achieving the Millennium DevelopmentGoals calls for dealing with cross-cutting development issues by introducing concertedmultidisciplinary policies and reinforcing policycoherence at the national and international levels.
Globalization and connectivity are newrealities that have brought profound changes inlifestyles worldwide. This is reshaping the overallpattern of cultural production, consumption andtrade in a world increasingly filled with images,sounds, texts and symbols. There is a clear need tobetter grasp the complex interactions among theeconomic, cultural, technological and socialaspects guiding the dynamics of the world econ-omy and the way people live in the twenty-firstcentury. In this era of transformation, creativityand knowledge are fast becoming powerful meansof fostering development gains.
In this context, the interface among cre-ativity, culture, economics and technology, asexpressed in the ability to create and circulateintellectual capital, has the potential to generateincome, jobs and export earnings while at thesame time promoting social inclusion, culturaldiversity and human development. This is whatthe emerging creative economy has alreadybegun to do as a leading component of eco-nomic growth, employment, trade, innovationand social cohesion in most advancedeconomies. The creative economy also seems tobe a feasible option for developing countries. Ifeffective public policies are in place, the creativeeconomy generates cross-cutting linkages withthe overall economy at macro and micro levels.It thus fosters a development dimension, offeringnew opportunities for developing countries toleapfrog into emerging high-growth areas of theworld economy.
This study is the first to present the perspectives of the United Nations on thisexciting new topic. The creative economy is anevolving concept centred on the dynamics of thecreative industries. There is no single definitionof the creative economy nor is there a consensusas to the set of knowledge-based economic activ-ities on which the creative industries are based.There is no one-size-fits-all recipe but rather, flexible
iiiC R E AT I V E E C O N O M Y R E P O R T 2 0 0 8
Fore
word
Foreword
The creativeeconomy hasthe potential to generateincome and jobswhile promotingsocial inclusion,cultural diversityand humandevelopment

iv C R E AT I V E E C O N O M Y R E P O R T 2 0 0 8
and strategic choices to be made by national governments in order to optimize the benefits oftheir creative economies for development.
At the heart of the creative economy liethe creative industries. Loosely defined, the cre-ative industries are at the crossroads of the arts,culture, business and technology. In other words,they comprise the cycle of creation, productionand distribution of goods and services that useintellectual capital as their primary input. Today’screative industries involve the interplay of tradi-tional, technology-intensive and service-orientedsubsectors. They range from folk art, festivals,music, books, paintings and performing arts tomore technology-intensive subsectors such as thefilm industry, broadcasting, digital animationand video games, and more service-orientedfields such as architectural and advertising services.All these activities are intensive in creative skillsand can generate income through trade andintellectual property rights.
This Report provides empirical evidencethat the creative industries are among the mostdynamic emerging sectors in world trade. Overthe period 2000-2005, trade in creative goodsand services increased at an unprecedented aver-age annual rate of 8.7 per cent. World exportsof creative products were valued at $424.4 billion in 2005 as compared to $227.5 billionin 1996, according to preliminary UNCTADfigures. Creative services in particular enjoyedrapid export growth – 8.8 per cent annuallybetween 1996 and 2005. This positive trendoccurred in all regions and groups of countriesand is expected to continue into the nextdecade, assuming that the global demand forcreative goods and services continues to rise.
It is clear that developed countries stilldominate the global market for creative products.Nonetheless, many developing-country prod-ucts are already benefiting from the creative
industry boom, particularly in Asia.Unfortunately, however, the large majority ofdeveloping countries are not yet able to harnesstheir creative capacities for development. InAfrica, for instance, despite the abundance ofcreative talents, the creative potential remainshighly underutilized. The continent’s share inglobal trade of creative products remains mar-ginal at less than 1 per cent of world exportsdespite sharp increases. As is the case for otherdeveloping regions, this is a reflection of bothdomestic policy weaknesses and global systemic biases.
The policy-oriented analysis presented inthis Report represents an initial contribution todeveloping a better understanding of the keyissues underlying the creative economy and itsdevelopment dimension. The Report addressesthe challenge of assessing the creative economywith a view to informed policy-making by outlining the conceptual, institutional and policyframework in which this economy is flourishing.Given the multifaceted nature of the creativeeconomy, strategic choices for concerted interministerial policy action are crucial. Theimportant implications of multilateral processesin shaping policies for the creative economy alsowarrant consideration.
This Report is an example of coopera-tion inside the United Nations system, com-prising contributions from five internationalorganizations: UNCTAD, UNDP via itsSpecial Unit for South-South Cooperation,UNESCO, WIPO and ITC. It is a joint endeav-our that builds on complementarities in order toenhance the effectiveness of international coop-eration and policy coherence in this innovativefield. The creative economy is producing newopportunities for both developed and developingcountries, but the challenges ahead should not beunderestimated.
Fore
word
This Report provides empiricalevidence that thecreative industries
are among themost dynamic
emerging sectorsin world trade
The large majorityof developingcountries are
not yet able toharness their
creative capacitiesfor development
Supachai PanitchpakdiSecretary-GeneralUnited Nations Conference on Trade and Development
Kemal DervisAdministratorUnited Nations Development Programme

The Creative Economy Report 2008 is theresult of an initiative put forward by the part-nership between UNCTAD and the UNDPSpecial Unit for South-South Cooperation.This policy-oriented study is the main outputof the project, “Strengthening the CreativeEconomy in Developing Countries”, jointlycoordinated by Edna dos Santos-Duisenberg,Chief, UNCTAD Creative Economy andIndustries Programme, and FranciscoSimplicio, Chief, Division for KnowledgeManagement and Operations of the UNDPSpecial Unit for South-South Cooperation.
The Partnership expresses its sinceregratitude to Yiping Zhou, Director, UNDPSpecial Unit for South-South Cooperation,for his deep support to this initiative. Withouthis vision and commitment, this work wouldnot have materialized.
The Report was prepared under theleadership of UNCTAD and is a pioneeringexample of multi-agency cooperation reflectingthe work of the United Nations Multi-Agency Informal Group on CreativeIndustries in an effort to build upon comple-mentarities and enhance policy coherence onmatters relating to the creative industries andthe creative economy. It is the first report topresent the United Nations system-wide perspective on this innovative topic and itbrings together contributions from five collaborating bodies: the United NationsConference on Trade and Development (UNC-TAD), the United Nations DevelopmentProgramme (UNDP) Special Unit for South-South Cooperation, the United NationsEducational, Scientific and Cultural Organization(UNESCO), the World Intellectual Property
Organization (WIPO) and the InternationalTrade Centre (ITC).
The research and policy-oriented analysiswere carried out under the overall guidance of Edna dos Santos-Duisenberg, the main co-writer of this Report. The Report greatlybenefited from the invaluable academic insightsfrom Dr. David Throsby from MacquarieUniversity, Sidney, and Dr. Andrew Pratt fromthe London School of Economics, to whomthe team expresses its deep gratitude. TheMulti-Agency Group acknowledges and thanksthe contribution of the following team ofinternational consultants who provided inputsfor various chapters: Avril Joffe, PernilleAskerud, Ana Carla Fonseca Reis, David Diaz-Benevides and Sylvia Amaya Londoño.
The Partnership extends its profoundappreciation to all the colleagues from the collaborating organizations who participatedin this joint endeavour, in particular the mem-bers of the United Nations Multi-AgencyGroup. Acknowledgements are expressed to:Georges Poussin, Richard Engelhardt, SimonEllis, Lydia Deloumeaux and Guiomar AlonsoCano from UNESCO; Dimiter Gantchev,Wend Wendland, Brigitte Vezina and RichardOwens from WIPO; and Iris Hauswirth, Jean-Michel Pasteels and Kefalla Conte from ITC.
From UNCTAD, our special thanks goto the Head of the Central Statistics Branch,Henri Laurencin, and his team composed ofDavid Critsallo, Sanja Blazevic, Yoann Chaine,Mirco Moretti, Flavine Creppy and SoniaBlachier. Analytical inputs were also providedby Matfobhi Riba and Dimo Calowski.Comments were received from DianaBarrowclough, Yuefin Li and Susan Teltscher.
vC R E AT I V E E C O N O M Y R E P O R T 2 0 0 8
Ackn
ow
ledgem
ents
Acknowledgements
vi C R E AT I V E E C O N O M Y R E P O R T 2 0 0 8
Research assistance was provided by CarolinaQuintana as well as by Cheng Shang Li andSimon Alder, who were extremely devoted to thiswork during their internship with UNCTAD.
The Partnership also expresses its sinceregratitude to all those who kindly accepted ourinvitation to contribute with signed articles featuring concrete cases and/or their experi-ences in the creative economy as illustrated inthe boxes throughout the Report. These articleshelped to bring pragmatism to the policy-oriented analysis of this Report and evidence
for some of the empirical arguments.
The text was edited by Barbara Brewka,and Jennifer Bergamini designed the cover andthe layout of this publication.
Administrative and secretarial supportwas provided by Clisse Medeiros Ramos Perretfrom UNCTAD and Lourdes Hermosura-Chang and Ines Tofalo from the UNDPSpecial Unit for South-South Cooperation.
The Creative Economy Report 2008 wasfinanced by the UNDP Special Unit forSouth-South Cooperation.
Ackn
ow
ledgem
ents

viiC R E AT I V E E C O N O M Y R E P O R T 2 0 0 8
Conte
nts
Contents
Foreword ..........................................................................................................................................iii
Acknowledgements ..........................................................................................................................v
Abbreviations and acronyms ........................................................................................................xix
PART 1. THE CREATIVE ECONOMY
Overview ............................................................................................................................................3
Chapter
1. Concept and context of the creative economy 9
1.1 Evolving concepts and definitions ........................................................................................91.1.1 Creativity ................................................................................................................................91.1.2 Creative goods and services..................................................................................................101.1.3 Cultural industries ................................................................................................................111.1.4 Cultural economics ..............................................................................................................111.1.5 Creative industries ................................................................................................................111.1.6 The UNCTAD classification of the creative industries ..............................................................121.1.7 The creative economy ..........................................................................................................151.1.8 The creative class and creative entrepreneurs........................................................................161.1.9 Creative cities ......................................................................................................................161.1.10 Creative clusters, networks and districts ................................................................................20
1.2 Major drivers of the creative economy worldwide..............................................................221.2.1 Technology ..........................................................................................................................221.2.2 Demand ..............................................................................................................................231.2.3 Tourism ................................................................................................................................23
1.3 The multiple dimensions of the creative economy ............................................................241.3.1 Economic aspects ................................................................................................................241.3.2 Social aspects ......................................................................................................................241.3.3 Cultural aspects....................................................................................................................261.3.4 Sustainable development ......................................................................................................26
1.4 The cross-cutting nature of creative industries..................................................................271.4.1 Need for concerted interministerial policies ............................................................................271.4.2 Need for dialogue with multiple stakeholders ........................................................................281.4.3 Need for institutional mechanisms ........................................................................................28
1.5 The creative economy in the developed world....................................................................28

viii C R E AT I V E E C O N O M Y R E P O R T 2 0 0 8
Conte
nts
2. The development dimension 33
2.1 Policy implications: The Millennium Development Goals ..................................................33
2.2 The creative economy: Linkages and development implications ......................................352.2.1 Multifaceted aspects of the creative economy ........................................................................352.2.2 Cultural and technological linkages........................................................................................352.2.3 Social interactions ................................................................................................................36
2.3 Interface between traditional knowledge, arts and the creative economy ..........................36
2.4 Obstacles to the expansion of the creative economy ........................................................40
2.5 Shaping a model for enhancing the creative economy in developing countries ..............41
2.6 The creative economy in the developing world and transition economies ......................422.6.1 Africa ..................................................................................................................................432.6.2 The Asia-Pacific region ........................................................................................................462.6.3 Central Asia and the Middle East ..........................................................................................482.6.4 Latin America ......................................................................................................................502.6.5 The Caribbean ......................................................................................................................542.6.6 Eastern European economies in transition ..............................................................................56
PART 2. ASSESSING THE CREATIVE ECONOMY: ANALYSIS AND MEASUREMENT
3. Analysing the creative economy 61
3.1 The need for systematic analysis ........................................................................................61
3.2 Organization of the creative economy ................................................................................623.2.1 Organizational structures ......................................................................................................623.2.2 Operational matters ..............................................................................................................623.2.3 Locational issues ..................................................................................................................63
3.3 Economic analysis of the creative industries ........................................................643.3.1 Industrial organization analysis ..............................................................................................643.3.2 Value-chain analysis ............................................................................................................643.3.3 Inter-industry analysis ..........................................................................................................653.3.4 Locational analysis................................................................................................................663.3.5 Copyright and intellectual property ........................................................................................683.3.6 Contract theory ....................................................................................................................68
3.4 Structure of the creative industries ....................................................................................693.4.1 Predominance of small and medium-sized enterprises ..........................................................693.4.2 Large-scale corporate enterprises..........................................................................................713.4.3 Public or quasi-public cultural institutions ..............................................................................713.4.4 Individual artists and producers ............................................................................................71
3.5 Distribution and competition issues ..................................................................................723.5.1 Changing consumption patterns ..........................................................................................773.5.2 Creative industries and regulation..........................................................................................77

ixC R E AT I V E E C O N O M Y R E P O R T 2 0 0 8
Conte
nts
3.6 An application of production-chain analysis: The music industry in sub-Saharan Africa ..........................................................................................................78
4. Towards an evidence-based assessment of the creative economy 81
4.1 Why we need a new information base and why it doesn’t already exist ..........................81
4.2 Towards a reliable benchmark for the creative economy ..................................................82
4.3 The challenge of building an operational model of the creative economy........................83
4.4 Measures: Their limitations and potential ..........................................................................844.4.1 Employment ........................................................................................................................844.4.2 Time use ..............................................................................................................................854.4.3 Trade and value added..........................................................................................................864.4.4 Copyright and IPR ................................................................................................................864.4.5 Public investment..................................................................................................................87
4.5 Implementation of a Culture Satellite Account ..................................................................89
4.6 Data sources and assessment tools: Why the current data are inadequate ................90
4.7 The case for a trade model for the creative industries using a product classification methodology ..................................................................................................91
4.8 Methodological basis for a unified measure of international trade of creative goods ....93
4.9 Main considerations ............................................................................................................96
PART 3. INTERNATIONAL TRADE IN CREATIVE GOODS AND SERVICES
5. International trade in creative goods and services: Global trends and features 101
5.1 Setting the scene ................................................................................................................101
5.2 Creative industries: A new dynamic sector in world trade ..............................................106
5.3 Global trends in world trade of creative goods and services ..........................................1075.3.1 Global trends in world exports ............................................................................................1075.3.2 Global trends in world imports ............................................................................................1095.3.3 Key players in the global market for creative goods ..............................................................110
5.4 Regional economic groups in world markets....................................................................112
5.5 Prospects for North-South and South-South trade in creative goods and services ............113
5.6 Global trends in international trade of creative industries, by subgroup ........................1145.6.1 Heritage ............................................................................................................................1145.6.2 Performing arts ..................................................................................................................1185.6.3 Visual arts ..........................................................................................................................1225.6.4 Audiovisuals ......................................................................................................................1245.6.5 Publishing and printed media ..............................................................................................1275.6.6 Design................................................................................................................................1295.6.7 New media ........................................................................................................................1325.6.8 Creative services ................................................................................................................134

x C R E AT I V E E C O N O M Y R E P O R T 2 0 0 8
Conte
nts
5.6.9 Royalties and licence fees ..................................................................................................1355.6.10 Related industries ..............................................................................................................136
PART 4. THE ROLE OF INTELLECTUAL PROPERTY AND TECHNOLOGY
6. The role of intellectual property in the creative economy 141
6.1 Introduction ........................................................................................................................141
6.2 What are intellectual property rights? ..............................................................................142
6.3 Intellectual property and the creative industries ..............................................................1436.3.1 Geographical indications and appellations of origin ..............................................................144
6.4 Copyright and the creative economy ................................................................................1446.4.1 Exclusive rights ..................................................................................................................1456.4.2 Moral rights ........................................................................................................................1456.4.3 Related rights ....................................................................................................................1466.4.4 Exceptions and limitations to copyright ................................................................................1476.4.5 Enforcement of copyright ....................................................................................................148
6.5 The economics of copyright ..............................................................................................149
6.6 Contribution of the creative industries to the economy ..................................................149
6.7 Copyright, the creative industries and traditional cultural expressions..........................1516.7.1 Indigenous communities and new technologies ....................................................................152
6.8 Copyrights and new technologies......................................................................................154
6.9 Possible policy options ......................................................................................................155
7. Technology, connectivity and the creative economy 157
7.1 Introduction ........................................................................................................................157
7.2 Connectivity and its wider impact ....................................................................................157
7.3 Measurement issues and creative content........................................................................160
7.4 ICTs and their impact on the creative economy................................................................162
7.5 Digitization ........................................................................................................................163
7.6 Convergence and new business models ..........................................................................163
7.7 Impact across the production chain ................................................................................165
7.8 Looking into the future ......................................................................................................168
PART 5. PROMOTING THE CREATIVE ECONOMY FOR DEVELOPMENT
8. Policy strategies for the creative industries 173
8.1 Introduction ........................................................................................................................173
8.2 The role of public policies ..................................................................................................174

8.3 The policy process ..............................................................................................................175
8.4 Policy directions..................................................................................................................1768.4.1 Provision of infrastructure....................................................................................................1768.4.2 Provision of finance and investment ....................................................................................1778.4.3 Creation of institutional mechanisms....................................................................................1788.4.4 Development of export markets ..........................................................................................1798.4.5 Protection of creators’ rights ..............................................................................................1808.4.6 Establishment of creative clusters........................................................................................1808.4.7 Institution of effective data-collection measures ..................................................................181
8.5 Target measures for enhancing creative capacities ........................................................1838.5.1 Non-formal sector ..............................................................................................................1838.5.2 Creative arts ......................................................................................................................1838.5.3 Small and medium-sized enterprises ..................................................................................1838.5.4 Public cultural institutions....................................................................................................1858.5.5 Corporate sector ................................................................................................................185
8.6 Tailoring policy action at the national level ......................................................................185
9. The international dimension of creative-industries policy 187
9.1 The international policy framework ..................................................................................187
9.2 UNCTAD: Creative industries on the economic and development agenda ......................1879.2.1 UNCTAD X: Audiovisual services ..........................................................................................1879.2.2 Third United Nations Conference on the Least Developed Countries: Music ..........................1899.2.3 UNCTAD XI: Creative industries – A turning point..................................................................1899.2.4 UNCTAD XII: From the creative industries to the creative economy ........................................190
9.3 WTO multilateral negotiations and implications for creative industries..........................1919.3.1 General Agreement on Trade in Services..............................................................................1919.3.2 Implications of multilateral and regional trade agreements for creative industries ........................1939.3.3 TRIPS Agreement................................................................................................................193
9.4 UNESCO cultural-diversity perspective ..............................................................................194
9.5 WIPO Development Agenda ................................................................................................196
9.6 UNDP: Engaging developing countries in the creative economy for development ................197
9.7 ITC: Creating business opportunities for creative industries ..........................................199
10. Lessons learned and policy options 201
10.1 Lessons learned ..................................................................................................................201
10.2 Major findings ....................................................................................................................20210.2.1 Definitions and concepts ....................................................................................................20210.2.2 Cross-cutting linkages ........................................................................................................20210.2.3 The creative economy in the developed world ......................................................................20310.2.4 The creative economy in the developing world ....................................................................20310.2.5 The value chain for creative products ..................................................................................203
xiC R E AT I V E E C O N O M Y R E P O R T 2 0 0 8
Conte
nts

xii C R E AT I V E E C O N O M Y R E P O R T 2 0 0 8
Conte
nts
10.2.6 Data issues ........................................................................................................................20410.2.7 Trade..................................................................................................................................20410.2.8 Connectivity and ICTs..........................................................................................................20510.2.9 Policy towards the creative economy ..................................................................................20510.2.10 International context............................................................................................................205
10.3 Policy options ......................................................................................................................20610.3.1 Role of governments ..........................................................................................................20710.3.2 Role of creative entrepreneurs ............................................................................................20810.3.3 Role of civil society and the place of strategic alliances ........................................................208
10.4 The way ahead ....................................................................................................................20910.4.1 Redefining priorities ............................................................................................................20910.4.2 Role of international cooperation..........................................................................................209
References ....................................................................................................................................211
LIST OF BOXES
1.1 A creative entrepreneur: Transforming ideas into successful business ..........................................171.2 The creative city ........................................................................................................................181.3 Cultural and creative clusters in China ........................................................................................211.4 Petra: A cultural trip ....................................................................................................................241.5 Cirque du Soleil: A very simple dream..........................................................................................251.6 Economics of the museum district of Paris ..................................................................................272.1 South-South sharing of creative experiences................................................................................362.2 Brazilian carnivals ......................................................................................................................382.3 Africa Remix: Africa speaking loudly, brightly and colourfully ........................................................432.4 Experience of the Shanghai Creative Industry Center....................................................................472.5 Guatemala: The economic contribution of culture ........................................................................512.6 Brand Jamaica as the home of reggae ........................................................................................552.7 The Bolshoi: A sublime gift to the world ......................................................................................573.1 Creative clusters ........................................................................................................................663.2 Broadcasting creativity blooms in South Africa ............................................................................723.3 Properties of creative industries ..................................................................................................753.4 Commercial practices and business models particular to the audiovisual and music industries ......76 4.1 Reality and numbers ..................................................................................................................87 4.2 Lessons from Uruguay ................................................................................................................976.1 Design as a key ingredient for growth........................................................................................1436.2 The Da Vinci Code case ............................................................................................................146 6.3 A collaborative approach to creativity and knowledge ................................................................1486.4 Jewellery: A magic marriage between tradition and contemporary design ..................................1536.5 Collective management of copyright ..........................................................................................155 7.1 When ICTs give rise to new business models ............................................................................165

7.2 Free and open-source software and the creative economy ........................................................167 7.3 Eurovision ................................................................................................................................1708.1 The Egyptian film industry: The waning of the “Hollywood of the East”? ......................................1788.2 Shanghai creative industries: The Chinese way ..........................................................................1818.3 Alphadi: The fashion caravan ....................................................................................................1848.4 Cultural policy in action: The Nairobi Plan of Action ....................................................................1869.1 Television and soap operas ......................................................................................................1889.2 Puppet planet ..........................................................................................................................1929.3 Cultural tourism: Impressions of the Peruvian experience ..........................................................1959.4 Nollywood: A creative response ................................................................................................1989.5 The Biennale of Contemporary African Art of Dakar: A contribution to economic and cultural
development in Africa ..............................................................................................................20010.1 Summary of key messages ......................................................................................................206
LIST OF TABLES
1.1 Classification systems for the creative industries derived from different models ............................131.2 Estimates of culture employment in selected creative cities ..........................................................201.3 Creative Cities Network ..............................................................................................................201.4 Workers in creative industries in the United States, 2003 ............................................................251.5 Contribution of the European cultural and creative sector to the European national economies ......291.6 Contribution of the cultural industries to GDP or GVA for five countries, various years ....................301.7 Contribution of the cultural sector to the national economies of eight European countries,
various years ..............................................................................................................................301.8 Comparison of contribution of creative/cultural sector with contributions of other sectors
for eight European countries (% of GDP)......................................................................................30 1.9 Estimates of the contribution of creative industries to GDP for five OECD countries........................312.1 Features of the African music industry ........................................................................................453.1 Value chain in the cultural industries in Canada, 2002 ................................................................654.1 Proposed categorization of creative goods ..................................................................................955.1 Goods and services of creative industries ..................................................................................1035.2 Creative goods: Exports, by economic group, 2005 ....................................................................1085.3 Creative goods: Exports, by economic group and region, 2000 and 2005 ..................................1095.4 Creative goods: Imports, by economic group, 1996 and 2005 ....................................................1095.5 Creative goods: Imports, by economic group and region, 2000 and 2005 ..................................110 5.6 Creative goods: Top 20 exporters worldwide, 1996 and 2005 ....................................................1105.7 Creative goods: Top 10 exporters among developed economies, 2005........................................1115.8 Creative goods: Top 10 exporters among developing economies, 2005 ......................................1125.9 Creative goods: Exports, by regional economic group, 1996 and 2005 ......................................1135.10 World exports of all creative-industry products (goods and services), by subgroup, 1996 and 2005 ......1155.11 Arts and crafts: Exports, by economic group and region, 2000 and 2005 ..................................1175.12 Arts and crafts: Top 10 exporters among developing economies, 2005 ......................................1175.13 Music: Exports, by economic group and region, 2000 and 2005 ................................................120
xiiiC R E AT I V E E C O N O M Y R E P O R T 2 0 0 8
Conte
nts

xiv C R E AT I V E E C O N O M Y R E P O R T 2 0 0 8
5.14 Music: Top 10 exporters among developed economies, 2005 ....................................................1215.15 Music: Top 10 exporters among developing economies, 2005 ....................................................1215.16 Visual arts: Top 10 exporters among developed economies, 2005 ..............................................1245.17 Visual arts: Top 10 exporters among developing economies, 2005 ............................................124 5.18 Publishing and printed media: Top 10 exporters among developed economies, 2005 ..................1285.19 Publishing materials: Top 10 exporters among developing economies, 2005 ..............................128 5.20 Design: Exports, by economic group and region, 2000 and 2005 ..............................................130 5.21 Design: Top 10 exporters among developed economies, 2005....................................................1315.22 Design: Top 10 exporters among developing economies, 2005 ..................................................1325.23 New media: Exports, by economic group and region, 2000 and 2005 ........................................1335.24 New media: Top 10 exporters among developed economies, 2005 ............................................1335.25 New media: Top 10 exporters among developing economies, 2005 ............................................1345.26 Reported exports of creative services, 1996, 2000 and 2005 ....................................................1355.27 Royalties and license fees: World exports and imports, 1996, 2000 and 2005 ............................1366.1 Some results of the surveys based on the WIPO Guide ..............................................................1507.1 Contribution of segments of ICT industries to global GDP, 2003-2007 ........................................1587.2 ICT industries global market, by region, 2003-2007 ..................................................................1597.3 Internet penetration, by regional economic group, 2002-2006....................................................1597.4 Mobile phone penetration, by regional economic group, 2002-2006 ..........................................1607.5 Interconnected dimensions of digital life: Enablers, communications, content and transactions ....1607.6 Partnership on Measuring ICT for Development: Core ICT indicators ..........................................1617.7 Top 20 audiovisual companies worldwide and their 2004 turnover..............................................16410.1 Creative industries policy options ..............................................................................................207
LIST OF FIGURES
1.1 Creativity in today’s economy ........................................................................................................91.2 Interplay of the 5Cs: Outcomes of creativity + 4 capitals ..............................................................101.3 UNCTAD classification of creative industries ................................................................................142.1 Development dimension of the creative economy ........................................................................352.2 The creative nexus: The C-ITET model ........................................................................................413.1 Creative-industry value chain ......................................................................................................653.2 Simplified diagram of Porter’s model for clusters..........................................................................663.3 Stages of a music production chain in sub-Saharan Africa ..........................................................784.1 The creative chain ......................................................................................................................838.1 Funding flows to the cultural sector ..........................................................................................177
LIST OF CHARTS
5.1.a Creative industries: Exports of creative goods, by economic group, 2005 ....................................107 5.1.b Creative industries: Exports of creative services, by economic group, 2005 ................................1075.2 Evolution of world exports of creative goods and services, 1996-2005 ......................................1075.3.a Creative industries: Exports, by group, 1996 ..............................................................................108
Conte
nts

5.3.b Creative industries: Exports, by group, 2005 ..............................................................................1085.4 Share of economic groups in world exports of creative goods ....................................................108 5.5.a Imports of creative goods, by economic group, 1996, 2000 and 2005 ......................................1095.5.b Imports of creative goods, by group, 2005 ................................................................................1095.6 Creative goods: Exports from all developing countries, 1996 and 2005 ......................................1125.7 Heritage goods and services: Exports, by economic group, 1996 and 2005 ................................1165.8 Arts and crafts: Market and product diversification in world markets..........................................1165.9 Arts and crafts: Market and product diversification of developing economies ..............................117 5.10 Music: Exports, by economic group, 1996 and 2005..................................................................1205.11 Music: Market and product diversification of developing economies ............................................121 5.12 Visual arts: Exports, by economic group, 1996 and 2005 ..........................................................1235.13 Visual arts: Market and product diversification worldwide ..........................................................124 5.14 Audiovisuals: Exports, by economic group, 1996 and 2005 ........................................................1265.15 Audiovisuals: Market and product diversification worldwide ........................................................127 5.16 Publishing and printed media: Exports, by economic group, 1996 and 2005 ..............................1285.17 Publishing and printed media: Market and product diversification of developing economies ........1295.18 Design: Exports, by economic group, 1996 and 2005 ................................................................1305.19 Design: Market and product diversification worldwide ................................................................1315.20 Design: Market and product diversification of developing economies ..........................................132 5.21 New media: Exports, by economic group, 1996 and 2005..........................................................1335.22 New media: Market and product diversification worldwide ..........................................................134 5.23 Creative services: Exports, by economic group, 2005 ................................................................1355.24 Royalties and licence fees: World exports and imports, 1996, 2000 and 2005............................1365.25 Goods of related industries: Evolution of world exports, 1996 and 2005......................................137 6.1 Contribution of the creative industries to GDP ............................................................................1506.2 Contribution of groups of copyright-based industries to total of creative industries ......................150 6.3 Contribution of the creative industries to national employment....................................................151
STATISTICAL ANNEX
General explanatory notes....................................................................................................................226Distribution of developing economies by geographical region and economic grouping ............................232Distribution of developed economies and economies in transition by geographical region ......................234Distribution of economies by trade group..............................................................................................236
Part 1. Creative goods 238
1.1 Creative goods: Exports and imports, by economic group, region and country/territory,1996-2005..............................................................................................................................238
1.2.A Creative goods: Total world exports, by origin and product group, 1996, 2000 and 2005 ............2441.2.B Creative goods: Total world imports, by origin and product group, 1996, 2000 and 2005 ............2481.3.1.A Creative goods: Total world exports, by product group, 1996, 2000 and 2005 ............................2521.3.1.B Creative goods: Total world imports, by product group, 1996, 2000 and 2005 ............................253
xvC R E AT I V E E C O N O M Y R E P O R T 2 0 0 8
Conte
nts

xvi C R E AT I V E E C O N O M Y R E P O R T 2 0 0 8
1.3.2.A Creative goods: Exports by developed economies, by product group, 1996, 2000 and 2005 ....2541.3.2.B Creative goods: Imports by developed economies, by product group, 1996, 2000 and 2005....2551.3.3.A Creative goods: Exports by developing economies, by product group, 1996, 2000 and 2005 ....2561.3.3.B Creative goods: Imports by developing economies, by product group, 1996, 2000 and 2005 ....2571.3.4.A Creative goods: Exports by economies in transition, by product group, 1996, 2000 and 2005 ....2581.3.4.B Creative goods: Imports by economies in transition, by product group, 1996, 2000 and 2005 ....2591.4.1.A Creative goods: Top 10 world exporters, by product group, 2005................................................2601.4.1.B Creative goods: Top 10 world importers, by product group, 2005 ..............................................2641.4.2.A Creative goods: Top 10 exporters among developed economies, by product group, 2005 ........2681.4.2.B Creative goods: Top 10 importers among developed economies, by product group, 2005 ..........2721.4.3.A Creative goods: Top 10 exporters among developing economies, by product group, 2005..........2761.4.3.B Creative goods: Top 10 importers among developing economies, by product group, 2005..........2801.4.4.A Creative goods: Top 10 exporters among economies in transition, by product group, 2005 ..........2841.4.4.B Creative goods: Top 10 importers among economies in transition, by product group, 2005..........2881.5.A1 Creative goods: Exports, by trade group, 1996-2005 ................................................................2921.5.A2 Creative goods: Exports, by trade group, as % of total exports of creative groups by all trade
groups, 1996-2005..................................................................................................................2931.5.B1 Creative goods: Imports, by trade group, 1996-2005 ................................................................2921.5.B2 Creative goods: Imports, by trade group, as % of total imports of creative goods by all trade
groups, 1996-2005..................................................................................................................293
Part 2. Creative services and royalties 295
2.1.A Categories of services that include creative industries: Exports of all creative services,by country/territory, 1996-2005 ................................................................................................295
2.1.B Categories of services that include creative industries: Imports of all creative services,by country/territory, 1996-2005 ................................................................................................297
2.2.A Categories of services that include creative industries: Exports of advertising, market research and public opinion polling services, by economic group and country/territory, 1996-2005 ..........299
2.2.B Categories of services that include creative industries: Imports of advertising, market research and public opinion polling services, by economic group and country/territory, 1996-2005 ..........300
2.3.A Categories of services that include creative industries: Exports of architectural, engineering and other technical services, by economic group and country/territory, 1996-2005 ....................301
2.3.B Categories of services that include creative industries: Imports of architectural, engineering and other technical services, by economic group and country/territory, 1996-2005 ....................302
2.4.A Categories of services that include creative industries: Exports of audiovisual and related services, by economic group and country/territory, 1996-2005 ..................................................303
2.4.B Categories of services that include creative industries: Imports of audiovisual and related services, by economic group and country/territory, 1996-2005 ..................................................304
2.5.A Categories of services that include creative industries: Exports of research and development services, by economic group and country/territory, 1996-2005 ..................................................305
2.5.B Categories of services that include creative industries: Imports of research and development services, by economic group and country/territory, 1996-2005 ..............................306
2.6.A Categories of services that include creative industries: Exports of personal, cultural and recreational services, by economic group and country/territory, 1996-2005................................307
2.6.B Categories of services that include creative industries: Imports of personal, cultural and
Conte
nts

recreational services, by economic group and country/territory, 1996-2005................................3092.7.A Categories of services that include creative industries: Exports of other personal, cultural
and recreational services, by economic group and country/territory, 1996-2005 ........................3112.7.B Categories of services that include creative industries: Imports of other personal, cultural
and recreational services, by economic group and country/territory, 1996-2005 ........................3122.8.A Categories of services that include creative industries: Exports of royalties and licence fees,
by economic group and country/territory, 1996-2005 ................................................................3132.8.B Categories of services that include creative industries: Imports of royalties and licence fees,
by economic group and country/territory, 1996-2005 ................................................................315
Part 3. Related industries 318
3.1 Related industries: World exports and imports, by economic group and country/territory,1996-2005..............................................................................................................................318
3.2.A Related industries: Exports, by origin and product group, 1996, 2000 and 2005 ......................3243.2.B Related industries: Imports, by origin and product group, 1996, 2000 and 2005 ......................3263.3.1.A Related industries: Total world exports, by product group, 1996, 2000 and 2005........................3283.3.1.B Related industries: Total world imports, by product group, 1996, 2000 and 2005........................3283.3.2.A Related industries: Exports of developed economies, by product group, 1996, 2000 and 2005....3293.3.2.B Related industries: Imports of developed economies, by product group, 1996, 2000 and 2005 ....3293.3.3.A Related industries: Exports of developing economies, by product group, 1996, 2000 and 2005 ....3303.3.3.B Related industries: Imports of developing economies, by product group, 1996, 2000 and 2005 ....3303.3.4.A Related industries: Exports of economies in transition, by product group, 1996, 2000 and 2005 ....3313.3.4.B Related industries: Imports of economies in transition, by product group, 1996, 2000 and 2005 ....331
xviiC R E AT I V E E C O N O M Y R E P O R T 2 0 0 8
Conte
nts

xviii C R E AT I V E E C O N O M Y R E P O R T 2 0 0 8
xixC R E AT I V E E C O N O M Y R E P O R T 2 0 0 8
Abbre
viatio
ns
and
acro
nym
s
ACP African, Caribbean and PacificANCOM Andean Common MarketAPEC Asia-Pacific Economic CooperationAPTA Asia-Pacific Trade Agreement (former Bangkok Agreement)ASEAN Association of Southeast Asian NationsBOP Balance of payments BSEC Black Sea Economic Cooperation OrganizationCACM Central American Common MarketCAFTA Central American-Dominican Republic Free Trade AgreementCARICOM Caribbean CommunityCD Compact discc.i.f. Cost, insurance and freightCIS Commonwealth of Independent StatesCOMESA Common Market for Eastern and Southern Africa (formerly PTA)COMTRADE Commodity Trade Statistics DatabaseCSA Cultural Satellite AccountDAC Development Assistance Committee (of OECD)DCMS Department of Culture, Media and SportDVD Digital versatile disc (formerly digital videodisc)EBOPS Extended Balance of Payments Services ClassificationECCAS Economic Community of Central African StatesECE Economic Commission for EuropeECO Economic Cooperation OrganizationECOWAS Economic Community of West African StatesEFTA European Free Trade AssociationESCAP Economic and Social Commission for Asia and the PacificESCWA Economic and Social Commission for Western AsiaEUROSTAT Statistical Office of the European Communitiesexcl. ExcludingFAO Food and Agriculture Organization of the United NationsFDI Foreign direct investmentf.o.b. Free on boardFOSS Free and open-source softwareFTA Free trade areaFTAA Free Trade Area of the AmericasG-77 Group of 77GATS General Agreement on Trade in ServicesGATT General Agreement on Tariffs and Trade
Abbreviations and acronyms

xx C R E AT I V E E C O N O M Y R E P O R T 2 0 0 8
GCC Gulf Cooperation CouncilGDP Gross domestic productGNP Gross national productGVA Gross value addedHIPCs Heavily indebted poor countriesIFPI International Federation of the Phonographic IndustryILO International Labour OrganizationIMF International Monetary FundIOM International Organization for MigrationIPR Intellectual property rightITC International Trade Centre ITU International Telecommunication UnionLAIA Latin American Integration AssociationLDC Least developed countryMDG Millennium Development Goal MERCOSUR Common Market of the SouthMFN Most-favoured nationMSITS Manual on Statistics of International Trade in ServicesNAFTA North American Free Trade Agreementn.e.s. Not elsewhere specifiedNGO Non-governmental organizationn.i.e. Not included elsewhereNPISHs Non-profit institutions serving householdsODA Official development assistanceOECD Organisation for Economic Co-operation and DevelopmentOECS Organisation of Eastern Caribbean StatesPRSP Poverty Reduction Strategy PaperR&D Research and developmentRMB RenminbiRTA Regional trade agreementSAARC South Asian Association for Regional CooperationSADC Southern African Development CommunitySAM Social accounting matrixSAR Special Administrative RegionSIDS Small island developing StateSITC Standard Industrial Trade ClassificationSMEs Small and medium-sized enterprisesSNA System of National AccountsTFYR The former Yugoslav Republic of MacedoniaTNC Transnational corporationTRIPS Trade-Related Aspects of Intellectual Property RightsUEMOA West African Economic and Monetary UnionUIS UNESCO Institute for StatisticsUMA Arab Maghreb UnionUN/DESA/SD United Nations Department of Economic and Social Affairs, Statistics DivisionUNAIDS Joint United Nations Programme on HIV/AIDS
Abbre
viati
ons
and
acro
nym
s

UNCTAD United Nations Conference on Trade and DevelopmentUNDP United Nations Development ProgrammeUNESCO United Nations Educational, Scientific and Cultural OrganizationUNHCR United Nations High Commissioner for RefugeesUNICEF United Nations Children’s FundUNWTO United Nations World Tourism OrganizationUSSR Union of Soviet Socialist RepublicsVCR Video cassette recorderWFP World Food ProgrammeWHO World Health OrganizationWIPO World Intellectual Property Organization WMO World Meteorological OrganizationWSIS World Summit on the Information SocietyWTO World Trade Organization
xxiC R E AT I V E E C O N O M Y R E P O R T 2 0 0 8
Abbre
viatio
ns
and
acro
nym
s

xxii C R E AT I V E E C O N O M Y R E P O R T 2 0 0 8

The Creative Economy 1PART

2 C R E AT I V E E C O N O M Y R E P O R T 2 0 0 8

In the contemporary world, a new devel-opment paradigm is emerging that links theeconomy and culture, embracing economic, cultural, technological and social aspects ofdevelopment at both the macro and micro levels. Central to the new paradigm is the factthat creativity, knowledge and access to infor-mation are increasingly recognized as powerfulengines driving economic growth and promot-ing development in a globalizing world.“Creativity” in this context refers to the formu-lation of new ideas and to the application ofthese ideas to produce original works of art andcultural products, functional creations, scientificinventions and technological innovations. Thereis thus an economic aspect to creativity, observ-able in the way it contributes to entrepreneur-ship, fosters innovation, enhances productivityand promotes economic growth.
Creativity is found in all societies andcountries – rich or poor, large or small,advanced or developing. The word “creativity”is associated with originality, imagination,inspiration, ingenuity and inventiveness. It isan inner characteristic of individuals to beimaginative and express ideas; associated withknowledge, these ideas are the essence of intel-lectual capital. Similarly, every society has itsstock of intangible cultural capital articulatedby people’s identity and values. Civilizationssince time immemorial have been aware ofthese concepts. However, the twenty-first century has seen a growing understanding ofthe interface between creativity, culture andeconomics, the rationale behind the emergingconcept of the “creative economy”.
The concept of the “creative economy”is an evolving one that is gaining ground in
3C R E AT I V E E C O N O M Y R E P O R T 2 0 0 8
Ove
rview
Overview
Creativity, culture and economic development
The Creative Economy Report 2008 is the first study to present the United Nations perspective on this emerging topic. It is an initiative of the partnership between UNCTADand the UNDP Special Unit for South-South Cooperation. Furthermore, it is a pioneerexample of the work being undertaken by the Multi-Agency Informal Dialogue Group onCreative Industries.1 It brings together contributions from five relevant United Nationsbodies: UNCTAD, UNDP, UNESCO, WIPO and ITC. This collective effort not only contributesto building synergy and exploring complementarities but also is an effective way toadvance policy coherence and enhance the impact of international actions in the area ofthe creative economy and creative industries.
Creativity,knowledge and access toinformation arerecognized as powerfuldrivers ofdevelopment
1 This Group was set up by the Secretary-General of the United Nations Conference on Trade and Development (UNCTAD) in2004 in the context of preparations for the High-level Panel on Creative Industries and Development, held during the UNCTADXI Ministerial Conference. UNCTAD, as chair of the Group, convenes two meetings a year in Geneva. The work of the Group hasbeen revitalized with a view to promoting concerted international actions and joint initiatives by the United Nations family so asto enhance the contribution of the creative economy to development.

4 C R E AT I V E E C O N O M Y R E P O R T 2 0 0 8
contemporary thinking about economicdevelopment. It entails a shift from the conventional models towards a multidiscipli-nary model dealing with the interfacebetween economics, culture and technologyand centred on the predominance of servicesand creative content. Given its multidiscipli-nary structure, the creative economy offers a feasible option as part of a results-orienteddevelopment strategy for developing coun-tries. It calls for the adoption of effectivecross-cutting mechanisms and innovativeinterministerial policy action.2
For some people, the “creative economy”is a holistic concept dealing with complexinteractions between culture, economics andtechnology in the contemporary globalizedworld that is dominated by symbols, texts,sounds and images. Others are more scepticalabout this fashionable label, voicing concernsabout its overstated importance and the way itmay exacerbate cultural and technologicaldivisions. Against this background, the cre-ative economy has become a topical issue ofthe international economic and developmentagenda, calling for informed policy responsesin both developed and developing countries.
There is no unique definition of the“creative economy”. It is a subjective conceptthat is still being shaped. There is, however,growing convergence on a core group of activitiesand their interactions both in individual countries and at the international level.
The present Report adopts the UNCTADdefinition of the “creative economy”, whichcan be summarized as follows:
■ The creative economy is an evolving conceptbased on creative assets potentially generatingeconomic growth and development;
■ It can foster income generation, job creationand export earnings while promoting social
inclusion, cultural diversity and humandevelopment;
■ It embraces economic, cultural and socialaspects interacting with technology, intel-lectual property and tourism objectives;
■ It is a set of knowledge-based economicactivities with a development dimensionand cross-cutting linkages at macro andmicro levels to the overall economy;
■ It is a feasible development option callingfor innovative multidisciplinary policyresponses and interministerial action;
■ At the heart of the creative economy are thecreative industries.3
“Creative industries” can be defined as thecycles of creation, production and distributionof goods and services that use creativity andintellectual capital as primary inputs. Theycomprise a set of knowledge-based activitiesthat produce tangible goods and intangibleintellectual or artistic services with creativecontent, economic value and market objec-tives.4 Creative industries constitute a vast andheterogeneous field dealing with the interplayof various creative activities ranging from traditional arts and crafts, publishing, music,and visual and performing arts to more technology-intensive and services-orientedgroups of activities such as film, television andradio broadcasting, new media and design.The creative sector has a flexible and modularmarket structure that ranges from independentartists and small-business enterprises at oneextreme to some of the world’s largest conglomerates at the other.
Today, creative industries are among themost dynamic sectors in world trade. Over theperiod 2000-2005, international trade in cre-ative goods and services experienced anunprecedented average annual growth rate of8.7 per cent. The value of world exports of
Ove
rvie
w 2 UNCTAD Statement at the Second Meeting of the Ministers of Culture of the African, Caribbean and Pacific (ACP) Group of States, Santo Domingo, Dominican Republic, October 2006.
3 Definition by the UNCTAD Creative Economy and Industries Programme, 2005.4 UNCTAD definition further elaborated in chapter 1.
The creativeindustries are
at the heart of the creative
economy
The creative economy calls forinformed
policyresponses

creative goods and services reached $424.4billion in 2005, representing 3.4 per cent oftotal world trade, according to UNCTAD.Nowadays in the most advanced countries, thecreative industries are emerging as a strategicchoice for reinvigorating economic growth,employment and social cohesion. The so-called “creative cities” are proliferating inEurope and North America, revitalizing theeconomy of urban centres through culturaland social developments offering attractivejobs, particularly to young people. Theturnover of the European creative industriesamounted to 654 billion euros in 2003,growing 12.3 per cent faster than the overalleconomy of the European Union andemploying over 5.6 million people.5
A significant finding of the presentstudy is the evidence that some developingcountries, mainly in Asia, have started benefit-ing from the dynamism of the global creativeeconomy and are putting in place tailoredcross-cutting policies to enhance their creativeindustries. China, which is leading thisprocess, became the world’s leading producerand exporter of value-added creative products
in 2005. Nevertheless, the large majority ofdeveloping countries are not yet able to har-ness their creative capacities for developmentgains. The obstacles preventing these develop-ing countries from enhancing their creativeeconomies are a combination of domesticpolicy weaknesses and global systemic biases,issues addressed in the analysis of this Report.
Another important conclusion of thisstudy is that developing-country exports ofrelated creative goods (including computers,cameras, television sets, and broadcasting andaudiovisual equipment) increased rapidly overthe period 1996-2005 from $51 billion to$274 billion.6 This spectacular growth isindicative of the catching-up strategies beingpursued in a number of developing countriesto increase their capacities to supply value-added products to global markets. Italso reaffirms the continually expandingdemand for creative products that rely onthese related industries for their distribu-tion and consumption. This ever-increasingdemand is further confirmation of the potentialof the creative economy to contribute to economic growth.
5C R E AT I V E E C O N O M Y R E P O R T 2 0 0 8
Ove
rview
5 See Economy of Culture in Europe, study prepared for the European Commission by KEA, European Affairs, Brussels, 2006.6 See also chapter 5.7 See Summary of High-level Panel on Creative Industries (document TD/L.379, 16 June 2004).
The creative industries accountfor 3.4 per cent of total worldtrade, withexports reaching $424.4 billion in 2005 and anaverage annualgrowth rate of 8.7 per cent during 2000-2005
The large majorityof developing countries are notyet able to harnesstheir creativecapacities
The development dimension of the cre-ative economy is the guiding principle of thisReport. Developing countries can furtherintegrate into the global economy by nurtur-ing their creative capacities and enhancing thecompetitiveness of their creative goods andservices in world markets, provided thatappropriate public policies are in place at thenational level and market imbalances can beredressed at the international level. In thisrespect, support for domestic creative indus-tries should be seen as an integral part of thepromotion and protection of cultural diversity.
Moreover, such diversity, because it is a globalpublic good, needs to be fully supported bythe international community.7
With the increasing knowledge intensityof the contemporary economy and the needfor innovation to maintain competitive advan-tage, it has become imperative for countries totap into their vast reserves of creativity. Thishas been made easier by rapid advances ininformation and communication technologies(ICTs), which are progressively linking coun-tries and regions worldwide. Opportunitiesare thus created for developing countries to
The development dimension

6 C R E AT I V E E C O N O M Y R E P O R T 2 0 0 8
access global markets for the products of theircreativity and cultural diversity in a way notpreviously possible – and to do so directly,without intermediaries. Nonetheless, the challenges are immense and should not beunderestimated.
Despite the richness of their culturaldiversity and the abundance of creative talent,the great majority of developing countries arenot yet fully benefiting from the enormouspotential of their creative economies toimprove development gains.8 These countrieshave been facing domestic and internationalobstacles that need to be fully understood andovercome through cross-cutting institutionalmechanisms and multidisciplinary policies. Inthis scenario, development strategies must beupdated to cope with the far-reaching cultural,economic and technological shifts that arereshaping society.
There is, for example, widespread recog-nition of the significance of tourism for devel-opment.9 In the present Report, a preliminaryattempt is made to investigate the link betweentourism and the creative industries, addressingthe question as to whether the demand for cre-ative goods and services by tourists supportsthe development of the creative economy.From the perspective of the creative economyelaborated in this Report, measures need to betaken to ensure that creative workers can reapthe benefits from the increasing demand bytourists for creative products.
The role of culture in development hasbeen analysed in the Human Development Report2004 published for UNDP.10 The present
Report aims to build on the normative debateabout culture and development by adding theeconomic dimension of the creative economyto the consideration of the developmentprocess. In so doing, it raises the question ofthe precise relationship between humanexpression and social and economic instru-mentalism. The Report raises this issue as anessential matter that must be taken intoaccount in policy-making.
Overall, this study is a first attempt topresent a broader perspective on the potentialof the creative economy to assist developingcountries to leapfrog into new high-growthcreative sectors. Development strategies aimedin this direction are consistent with theachievement of the Millennium DevelopmentGoals (MDGs). As is well known, these goalsrepresent the commitment of the internationalcommunity to engage in the global developmentagenda in the coming years. There are eightgoals with specific time-bound targets to bereached by 2015, the first and most importantof which aims at the eradication of extremepoverty and hunger. The MDGs addressdevelopment challenges not as a separate butas an inherent part of the global economy andsocieties. The full realization of these goalsnecessitates innovative and cross-sectoralapproaches to development and the seriousconsideration of issues such as culture, envi-ronment and social development. The achieve-ment of the MDGs demands a holistic andmultisectoral approach that goes beyond eco-nomics and includes cultural and socialframeworks; the creative economy reflectssuch an approach.
Ove
rvie
w
The achievement of the MDGs
demands a holisticand multisectoral
approach thatincludes cultural
and social frameworks
Africa’s share in global trade ofcreative productsremains marginal
at less than 1 per cent of world exports
8 Statement of the Secretary-General of UNCTAD at the World Knowledge Forum, Seoul, Republic of Korea, October 2006.9 Tourism, Culture and Sustainable Development (United Nations Educational, Scientific and Cultural Organization (UNESCO),
2006); World Tourism Barometer (United Nations World Tourism Organization (UNWTO), 2007); and Outcome of Pre-UNCTADXI High-Level International Meeting of Experts on Sustainable Tourism for Development (UNCTAD document TD(XI)/PC/6,18 March 2004).
10Human Development Report 2004: Cultural Liberty in Today’s Diverse World, published for the United Nations Development Programme(UNDP) and for which Professor Amartya Sen developed the conceptual framework.

The main purpose of this Report is toprovide the conceptual and policy frameworkfor understanding the creative economy, with aview to identifying analytical tools conduciveto informed policy-making. The Report intro-duces the concept of the “creative economy”,reviews definitions, recognizes characteristicsand identifies parameters to assist in measur-ing the impact of the creative economy at thenational and international levels. The objectiveis to propose a shared vision and a policy-oriented research agenda that reflects currenteconomic thinking and enables comparativeanalysis as the basis for national and international policy formulation.
The Report takes stock of ongoingresearch being carried out in different parts ofthe world for mapping the overall impact ofthe creative economy at the national and international levels. Rather than prescribing asingle model for mapping the creative economyin developing countries, it sheds light on pos-sible alternatives, pointing, however, to thelimitations of certain methodologies and current gaps in statistics and quantitative analytical tools. Nevertheless, it suggests someelements to facilitate comparability across cre-ative industries within and among countries.The purpose is to present a comprehensiveanalysis and pave the way for the introductionof parameters for assessing national creativeeconomies worldwide, emphasizing theimportance of international trade in thedevelopment process.
Despite the limitations of economicand social indicators, this Report takes thefirst step in using available official data totrace the global and regional trade flows ofcreative products and services for the period1996-2005, examining the main trends andidentifying the key players in major markets.It presents an analysis of the value chain andthe market structure of creative industries,
concluding that the oligopolistic nature ofmarketing and distribution inhibits the compet-itiveness of creative goods and services fromdeveloping countries in the global trading sys-tem. It draws attention to the difficulties inquantifying intangible values and the constraintsto capturing the real impact of internationaltrade in creative goods and services in the worldeconomy. This Report emphasizes the need toimprove market transparency, particularly in themost technology-intensive and services-orientedsectors such as audiovisuals and new media. It also examines the scope for reinforcingSouth-South as well as North-South trade andcooperation.
This Report recognizes the growing roleof intellectual property rights (IPRs) as a toolwith which to generate earnings from creative industries. The need to improve aware-ness and to reinforce the effectiveness of intel-lectual property regimes is highlighted.Nevertheless, the Report also recognizes theasymmetries existing in the current regime andstresses the need to review the enforcement ofsome policy instruments with a view to ensur-ing that the interests of developing countries areproperly taken into account. Issues relating totraditional knowledge, cultural expressions andpublic domain are also discussed in the light ofprogress made in the work of the WorldIntellectual Property Organization (WIPO).
The Report also presents an analysis ofthe phenomenon of connectivity and itsinfluence on world patterns of production,consumption and trade in tangible and intan-gible creative products. The importance ofICT tools and the new business models withnew forms of marketing and distribution ofcreative content in the digital era are discussed. Technology plays a key role in thecreative economy not only as the essence ofcreative sectors such as audiovisuals and newmedia but also as the means by which to
7C R E AT I V E E C O N O M Y R E P O R T 2 0 0 8
Ove
rview
Scope of this Report
Rather thanprescribing asingle model for mapping thecreative economy,this Reportanalyses alternativesand suggests anextensible modelbased on trade flows
Intellectualproperty rightsare increasinglymore importantas a tool for capitalizing onthe creativeindustries

8 C R E AT I V E E C O N O M Y R E P O R T 2 0 0 8
access and circulate digitized content intoday’s interactive multimedia environment.
The importance of international policiesand global processes in shaping the emergingcreative economy is also examined. ThisReport addresses the issue of the relevance of multilateral processes such as theDevelopment Agendas of WIPO and theWorld Trade Organization (WTO) as well asthe entering into force of the UNESCOConvention on the Protection and Promotionof the Diversity of Cultural Expressions andtheir implications for the creative industriesand the creative economy. Attention is alsogiven to greater mobilization of developingcountries by the Member States of the Groupof 77 (G-77)11 in order to promote the creative economy as a tool for developmentand by the inter-agency cooperation promotedby UNDP through its Special Unit forSouth-South Cooperation.12 This Reportpresents an overview of the most influentialintergovernmental decisions of relevance tothe creative economy. The purpose is toexplore the policy framework surrounding thecreative economy, with a view to identifyingpolicy options to strengthen and integratelocal creative industries into national andinternational development strategies andglobal markets.
Given the multiplicity of approaches,the conclusion is reached that at this stage,there is no consensual model of the optimumpackage of policies towards the creative indus-tries. Nevertheless, individual countries areencouraged to make some strategic choices of
cross-cutting public policies in order tostrengthen their creative economies. Dueaccount should be taken of the specificities oftheir cultural identities and the competitiveadvantages of particular creative industries.Illustrative cases and successful practicesbeing carried out in different countries arefeatured in the Report as evidence of the sortsof opportunities available in different parts ofthe world.
In summary, this Report aims to assistdeveloping countries to harness their creativeeconomies and to maximize developmentgains by recognizing the creative economy as afeasible option for linking economic, technolog-ical, social and cultural development objectivesin a globalizing world. It does this by:
■ discussing concepts, methods and thestructure of the creative economy;
■ sharing evidence-based analysis confirmingthat the creative industries constitute a newdynamic sector in international trade; and
■ suggesting directions for policy strategies.
The Report recognizes that creativityand human talent, more than traditional pro-duction factors such as labour and capital, arefast becoming powerful engines of sustainabledevelopment. Developing countries aroundthe world can find ways to optimize thepotential of the creative economy for generatingsocio-economic growth, job creation andexport earnings while at the same time promoting social inclusion, cultural diversityand human development.
Ove
rvie
w
Countries areencouraged to
make somestrategic choices
to strengthentheir creative
economies
Technology plays a key rolein the creative
economy for content
production anddistribution
11Message from the Chairman of the G-77 at the International Forum on the Creative Economy for Development held in Rio de Janeiro, Brazil, on 26 November 2006: http://www.g77.org/Speeches/112606.html
12Statements of the Administrator of UNDP and the Director-General of UNESCO at the 2005 United Nations Day for South-South Cooperation that focused on “Celebrating the Global South: Diversity and Creativity”:http://tcdc.undp.org/UNDAY/unday2-admin-stmt.pdf and http://portal.unesco.org/culture/es/ev.php-URL_ID=29653&URL_DO=DO_TOPIC&URL_SECTION=201.html
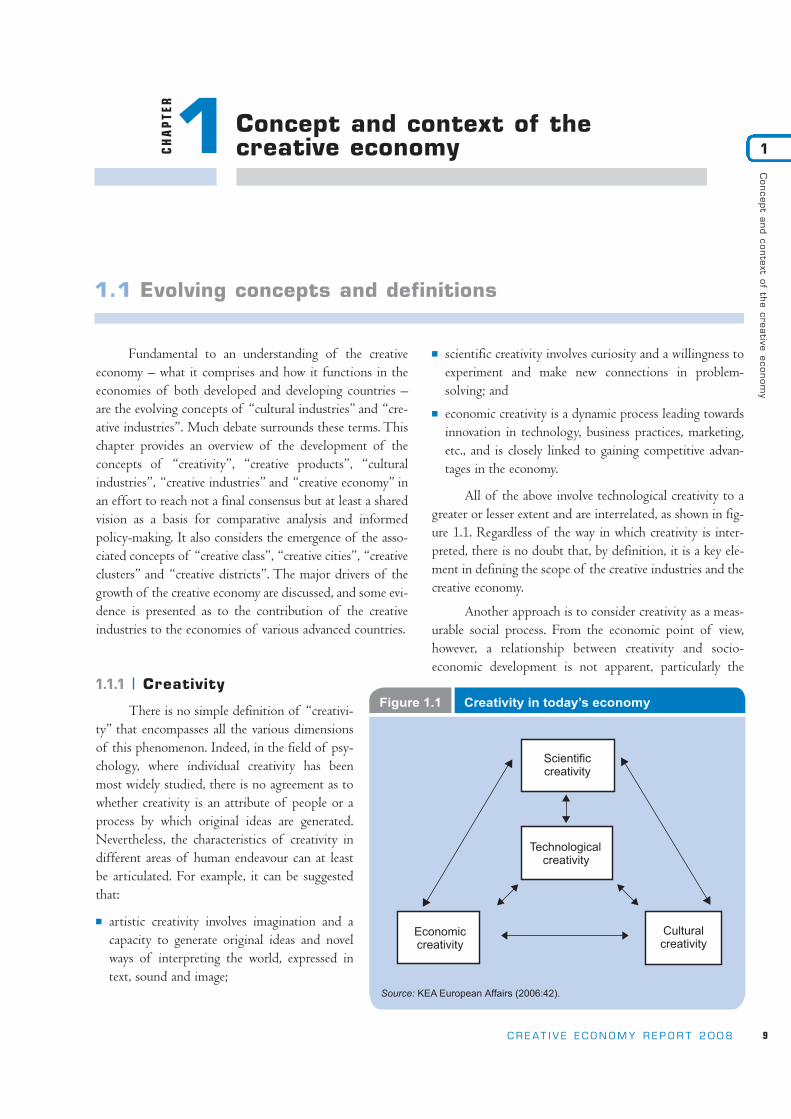
Fundamental to an understanding of the creativeeconomy – what it comprises and how it functions in theeconomies of both developed and developing countries –are the evolving concepts of “cultural industries” and “cre-ative industries”. Much debate surrounds these terms. Thischapter provides an overview of the development of theconcepts of “creativity”, “creative products”, “culturalindustries”, “creative industries” and “creative economy” inan effort to reach not a final consensus but at least a sharedvision as a basis for comparative analysis and informed policy-making. It also considers the emergence of the asso-ciated concepts of “creative class”, “creative cities”, “creativeclusters” and “creative districts”. The major drivers of thegrowth of the creative economy are discussed, and some evi-dence is presented as to the contribution of the creativeindustries to the economies of various advanced countries.
1.1.1 Creativity
There is no simple definition of “creativi-ty” that encompasses all the various dimensionsof this phenomenon. Indeed, in the field of psy-chology, where individual creativity has beenmost widely studied, there is no agreement as towhether creativity is an attribute of people or aprocess by which original ideas are generated.Nevertheless, the characteristics of creativity indifferent areas of human endeavour can at leastbe articulated. For example, it can be suggestedthat:
■ artistic creativity involves imagination and acapacity to generate original ideas and novelways of interpreting the world, expressed intext, sound and image;
■ scientific creativity involves curiosity and a willingness toexperiment and make new connections in problem-solving; and
■ economic creativity is a dynamic process leading towardsinnovation in technology, business practices, marketing,etc., and is closely linked to gaining competitive advan-tages in the economy.
All of the above involve technological creativity to agreater or lesser extent and are interrelated, as shown in fig-ure 1.1. Regardless of the way in which creativity is inter-preted, there is no doubt that, by definition, it is a key ele-ment in defining the scope of the creative industries and thecreative economy.
Another approach is to consider creativity as a meas-urable social process. From the economic point of view,however, a relationship between creativity and socio-economic development is not apparent, particularly the
9C R E AT I V E E C O N O M Y R E P O R T 2 0 0 8
Concept
and
conte
xtof
the
cre
ative
econom
y
1CH
AP
TER
1Concept and context of the creative economy
1.1 Evolving concepts and definitions
Figure 1.1 Creativity in today’s economy
Scientificcreativity
Economiccreativity
Technologicalcreativity
Culturalcreativity
Source: KEA European Affairs (2006:42).

10 C R E AT I V E E C O N O M Y R E P O R T 2 0 0 8
extent to which creativity contributes to economic growth. Inthis case, it is important to measure not only economic out-comes of creativity but also the cycle of creative activitythrough the interplay of four forms of capital – social cultural, human, and structural or institutional – as thedeterminants of the growth of creativity – the creative capital. The accumulated effects of these determinants arethe “outcomes of creativity”. This is the framework of thecreativity index, also known as the 5 Cs model.1 “Creativity”can also be defined as the process by which ideas are gener-ated, connected and transformed into things that are valued.2
“Originality” means creating something from nothing orreworking something that already exists.
1.1.2 Creative goods and services
The scope of the creative economy is determined bythe extent of the creative industries. Defining “creativeindustries”, however, is a matter of considerable inconsisten-cy and disagreement in the academic literature and in policy-making circles, especially in relation to the parallel conceptof “cultural industries”. Sometimes a distinction is madebetween the creative and the cultural industries; sometimesthe two terms are used interchangeably. A sensible way toproceed is to begin by defining the goods and services thatthese industries produce.
The concept of “cultural products” can be articulatedif the notion of “culture” is accepted whether in its anthro-pological or its functional sense. It might be argued, for exam-ple, that cultural goods and services such as artwork, musicalperformances, literature, film and television programmes,and video games share the following characteristics:
■ their production requires some input of human creativity;
■ they are vehicles for symbolic messages to those who con-sume them, i.e., they are more than simply utilitarian inso-far as they additionally serve some larger, communicativepurpose; and
■ they contain, at least potentially, some intellectual propertythat is attributable to the individual or group producingthe good or service.
An alternative or additional definition of “culturalgoods and services” derives from a consideration of the typeof value that they embody or generate. That is, it can be sug-gested that these goods and services have cultural value inaddition to whatever commercial value they may possess andthat this cultural value may not be fully measurable in mon-etary terms. In other words, cultural activities of varioussorts and the goods and services that they produce are valued– both by those who make them and by those who consumethem – for social and cultural reasons that are likely to com-plement or transcend a purely economic valuation. Thesereasons might include aesthetic considerations or the contri-bution of the activities to community understanding of cul-tural identity. If such cultural value can be identified, it mayserve as an observable characteristic by which to distinguishcultural goods and services as compared with different typesof commodities.
Defined in either or both of these ways, “culturalgoods and services” can be seen as a subset of a wider cate-gory of goods that can be called “creative goods and servic-es”. These are man-made products whose manufacturerequires some reasonably significant level of creativity. Thusthe category “creative goods” extends beyond cultural goodsas defined above to include products such as fashion andsoftware. These latter goods and services can be seen asessentially commercial products, but their production doesinvolve some level of creativity.
This distinction between cultural and creative goods
Concept
and c
onte
xt o
f th
e c
reati
ve e
conom
y
1Figure 1.2
Interplay of the 5Cs: Outcomes of creativity + 4 capitals
Human capital
Cultural
capital
Source: A Study on Creativity Index, 2005.
Structural or
institutional
capital
Social capital
Manifestationsof creativity(outputs andoutcomes)
1 This model was developed by a research team of the Centre for Cultural Policy Research of the University of Hong Kong that was led by Prof. Desmond Hui. See A Study onCreativity Index, 2005. http://www.hab.gov.hk/en/publications_and_press_releases/reports.htm.
2 See Boston's Creative Economy, BRA/Research, United States of America.

provides a basis for differentiating between cultural and creative industries, as is discussed in the following sections.
1.1.3 Cultural industries
The term “culture industry” appeared in the post-warperiod as a radical critique of mass entertainment by mem-bers of the Frankfurt school led by Theodor Adorno andMax Horkheimer, followed subsequently by writers such asHerbert Marcuse.3 At that time, “culture industry” was aconcept intended to shock; culture and industry were arguedto be opposites and the term was used in polemics againstthe limitations of modern cultural life. It continued to beused as an expression of contempt for the popular newspa-pers, movies, magazines and music that distracted the masses.4
In the present day, there remain different interpreta-tions of culture as an industry. For some, the notion of “cul-tural industries” evokes dichotomies such as elite versus massculture, high versus popular culture, and fine arts versuscommercial entertainment. More generally, however, theproposition that the cultural industries are simply those indus-tries that produce cultural goods and services, typically definedalong the lines outlined above, has gained greater acceptance.
In UNESCO, for example, the cultural industries areregarded as those industries that “combine the creation, pro-duction and commercialisation of contents which are intan-gible and cultural in nature. These contents are typically pro-tected by copyright and they can take the form of goods orservices”. An important aspect of the cultural industries,according to UNESCO, is that they are “central in promot-ing and maintaining cultural diversity and in ensuring dem-ocratic access to culture”.5 This twofold nature – combiningthe cultural and the economic – gives the cultural industriesa distinctive profile.
Similarly, in France, the “cultural industries” haverecently been defined as a set of economic activities thatcombine the functions of conception, creation and produc-tion of culture with more industrial functions in the large-scale manufacture and commercialization of cultural prod-ucts.6 Such a definition seems to initiate a process leadingtowards a broader interpretation of the cultural industries thanthat implied by traditional notions of the “cultural sector”.
1.1.4 Cultural economics
Many politicians and academics, particularly inEurope and Latin America, use the concept of “cultural eco-nomics” or the term “economy of culture” when dealingwith the economic aspects of cultural policy. Moreover,many artists and intellectuals feel uncomfortable with theemphasis given to market aspects in the debate on the cre-ative industries and hence the creative economy. “Culturaleconomics” is the application of economic analysis to all ofthe creative and performing arts, the heritage and culturalindustries, whether publicly or private owned. It is concernedwith the economic organization of the cultural sector andwith the behaviour of producers, consumers and govern-ments in this sector. The subject includes a range ofapproaches, mainstream and radical, neoclassical, welfareeconomics, public policy and institutional economics.7
While the theoretical and economic analysis in this Reportis based on the principles of cultural economics as a disci-pline, the purpose is to better understand the dynamics ofcreativity and its overall interactions with the world econo-my, including its multidisciplinary dimension in which cul-tural policies interact with technological and trade policies.
1.1.5 Creative industries
Usage of the term “creative industries” varies amongcountries. It is of relatively recent origin, emerging inAustralia in 1994 with the launching of the report, CreativeNation. It was given wider exposure by policy-makers in theUnited Kingdom in 1997, when the Government, throughthe Department of Culture, Media and Sport, set up theCreative Industries Task Force. It is noteworthy that the des-ignation “creative industries” that has developed since thenhas broadened the scope of cultural industries beyond thearts and has marked a shift in approach to potential com-mercial activities that until recently were regarded purely orpredominantly in non-economic terms.8
A number of different models have been put forwardover recent years as a means of providing a systematic under-standing of the structural characteristics of the creativeindustries. The following paragraphs review four of thesemodels, highlighting the different classification systems that
11C R E AT I V E E C O N O M Y R E P O R T 2 0 0 8
Concept a
nd c
onte
xt of th
e c
reative
econom
y
1
3 See Adorno and Horkheimer (1947), Marcuse (1991).4 See John Carey, The Intellectual and the Masses, London: Faber, 1992.5 See http://portal.unesco.org/culture/en/ev.php-URL_ID=34603&URL_DO=DO_TOPIC&URL_SECTION=201.html .6 See Département des études, de la prospective et des statistiques (2006:7).7 According to the definition by the Journal of Cultural Economics, an academic quarterly periodical published in cooperation with the Association of Cultural Economics International.8 See Creative Industries and Development (document TD(XI)/BP/13, 4 June 2004).

12 C R E AT I V E E C O N O M Y R E P O R T 2 0 0 8
they imply for the creative economy. Each model has a par-ticular rationale, depending on underlying assumptionsabout the purpose and mode of operation of the industries.Each one leads to a somewhat different basis for classifica-tion into “core” and “peripheral” industries within the cre-ative economy, emphasizing once again the difficulties indefining the “creative sector” that were discussed earlier. Thefour models are as follows:
■ UK DCMS model. This model derives from the impetus inthe late 1990s in the United Kingdom to reposition theBritish economy as an economy driven by creativity andinnovation in a globally competitive world. “Creativeindustries” are defined as those requiring creativity, skilland talent, with potential for wealth and job creationthrough the exploitation of their intellectual property(United Kingdom Department of Culture, Media andSport (DCMS), 2001). Virtually all of the 13 industriesincluded in the DCMS classification could be seen as“cultural” in the terms defined earlier; however, theGovernment of the United Kingdom has preferred to usethe term “creative” industries to describe this grouping,apparently to sidestep possible high-culture connotationsof the word “cultural”.
■ Symbolic texts model. This model is typical of the approach tothe cultural industries arising from the critical-cultural-studies tradition as it exists in Europe and especially theUnited Kingdom (for example, Hesmondhalgh, 2002).This approach sees the “high” or “serious” arts as theprovince of the social and political establishment andtherefore focuses attention instead on popular culture.The processes by which the culture of a society is formedand transmitted are portrayed in this model via the indus-trial production, dissemination and consumption of sym-bolic texts or messages, which are conveyed by means ofvarious media such as film, broadcasting and the press.
■ Concentric circles model. This model is based on the proposi-tion that it is the cultural value of cultural goods that givesthese industries their most distinguishing characteristic.Thus the more pronounced the cultural content of a par-ticular good or service, the stronger is the claim to inclu-sion of the industry producing it (Throsby, 2001). Themodel asserts that creative ideas originate in the core cre-ative arts in the form of sound, text and image and thatthese ideas and influences diffuse outwards through aseries of layers or “concentric circles”, with the propor-tion of cultural to commercial content decreasing as onemoves further outwards from the centre. This model has
been the basis for classifying the creative industries inEurope in the recent study prepared for the EuropeanCommission (KEA European Affairs, 2006:53-57).
■ WIPO copyright model. This model is based on industriesinvolved directly or indirectly in the creation, manufacture,production, broadcast and distribution of copyrightedworks (World Intellectual Property Organization, 2003).The focus is thus on intellectual property as the embodi-ment of the creativity that has gone into the making ofthe goods and services included in the classification. A dis-tinction is made between industries that actually producethe intellectual property and those that are necessary toconvey the goods and services to the consumer. A furthergroup of “partial” copyright industries comprises thosewhere intellectual property is only a minor part of theiroperation (see chapter 6).
Table 1.1 summarizes the industries included in eachmodel. The UK DCMS model makes no distinction betweenthe industries included, but the other three designate a groupof “core” industries, i.e., those whose inclusion is central tothe definition adopted in each case. It is apparent that thecontents of the core differ markedly among these three mod-els; for example, the creative arts, which are the epicentre ofthe concentric circles model, are regarded as peripheral in thesymbolic texts construction.
There is no “right” or “wrong” model of the creativeindustries, simply different ways of interpreting the structur-al characteristics of creative production. The attractiveness ofthe various models may therefore be different, depending onthe analytical purpose. From the viewpoint of statistical datacollection, however, a standardized set of definitions and acommon classification system are needed as a basis fordesigning a workable framework for dealing with the creativeindustries within the larger standard industrial classificationsystems that apply across the whole economy.
1.1.6 The UNCTAD classification of the creative industries
A significant landmark in embracing the concept ofthe “creative industries” was the UNCTAD XI MinisterialConference in 2004. At this Conference, the topic of creativeindustries was introduced onto the international economicand development agenda, drawing upon recommendationsmade by a High-level Panel on Creative Industries andDevelopment. This topic is further elaborated in chapter 9.
Concept
and c
onte
xt o
f th
e c
reati
ve e
conom
y
1

The UNCTAD approach to the creative industriesrelies on enlarging the concept of “creativity” from activitieshaving a strong artistic component to “any economic activityproducing symbolic products with a heavy reliance on intellec-tual property and for as wide a market as possible”9 (UNC-TAD, 2004). UNCTAD makes a distinction between“upstream activities” (traditional cultural activities such as per-forming arts or visual arts) and “downstream activities” (muchcloser to the market, such as advertising, publishing or media-related activities) and argues that the second group derives itscommercial value from low reproduction costs and easy trans-fer to other economic domains. From this perspective, cultur-al industries make up a subset of the creative industries.
Creative industries are vast in scope, dealing with theinterplay of various subsectors. These subsectors range fromactivities rooted in traditional knowledge and cultural her-itage such as arts and crafts, and cultural festivities, to moretechnology and services-oriented subgroups such as audiovi-suals and the new media. The UNCTAD classification ofcreative industries is divided into four broad groups: heritage,arts, media and functional creations. These groups are in turndivided into nine subgroups, as presented in figure 1.3.
The rationale behind this classification is the fact thatmost countries and institutions include various industries underthe heading “creative industries”, but very few try to classify
these industries in domains, groups and subsectors. Yet doingso would facilitate an understanding of the cross-sectoral inter-actions as well as of the broad picture. This classification couldalso be used to provide consistency in quantitative and qualita-tive analysis. It should be noted that all trade statistics present-ed in this Report are based on this classification.
According to this classification, the creative industriescomprise four groups, taking into account their distinctcharacteristics. These groups, which are heritage, arts, mediaand functional creations, are described in figure 1.3.
13C R E AT I V E E C O N O M Y R E P O R T 2 0 0 8
Concept a
nd c
onte
xt of th
e c
reative
econom
y
1Table 1.1 Classification systems for the creative industries derived from different models
1. UK DCMS model
AdvertisingArchitectureArt and antiques marketCraftsDesignFashionFilm and videoMusicPerforming artsPublishingSoftwareTelevision and radioVideo and computer games
2. Symbolic texts model
Core cultural industriesAdvertisingFilmInternetMusicPublishingTelevision and radioVideo and computer games
Peripheral cultural industriesCreative arts
Borderline cultural industriesConsumer electronicsFashionSoftwareSport
3. Concentric circles model
Core creative artsLiterature MusicPerforming artsVisual arts
Other core cultural industriesFilmMuseums and libraries
Wider cultural industriesHeritage servicesPublishingSound recordingTelevision and radioVideo and computer games
Related industriesAdvertisingArchitectureDesign Fashion
4. WIPO copyright model
Core copyright industriesAdvertisingCollecting societiesFilm and videoMusicPerforming artsPublishingSoftwareTelevision and radioVisual and graphic art
Interdependent copyright industriesBlank recording materialConsumer electronicsMusical instrumentsPaperPhotocopiers, photographic equipment
Partial copyright industriesArchitectureClothing, footwearDesignFashionHousehold goodsToys
9 See Creative Industries and Development (document TD(XI)/BP/13, 4 June 2004).
UNCTAD definition of the creative industriesThe creative industries:
■ are the cycles of creation, production and distribution of goods andservices that use creativity and intellectual capital as primary inputs;
■ constitute a set of knowledge-based activities, focused on but notlimited to arts, potentially generating revenues from trade and intellectual property rights;
■ comprise tangible products and intangible intellectual or artisticservices with creative content, economic value and market objectives;
■ are at the cross-road among the artisan, services and industrial sectors; and
■ constitute a new dynamic sector in world trade.

14 C R E AT I V E E C O N O M Y R E P O R T 2 0 0 8
■ Heritage. Cultural heritage is identified as the origin of allforms of arts and the soul of cultural and creative indus-tries. It is the starting point of this classification. It is heritage that brings together cultural aspects from the his-torical, anthropological, ethnic, aesthetic and societalviewpoints, influences creativity and is the origin of anumber of heritage goods and services as well as culturalactivities. Associated with heritage is the concept of“traditional knowledge and cultural expressions” embeddedin the creation of arts and crafts as well as in folklore andtraditional cultural festivities. This group is thereforedivided into two subgroups:
– Traditional cultural expressions: arts and crafts, festivals andcelebrations; and
– Cultural sites: archaeological sites, museums, libraries,exhibitions, etc.
■ Arts. This group includes creative industries based purelyon art and culture. Artwork is inspired by heritage, identity values and symbolic meaning. This group is divided into two large subgroups:
– Visual arts: painting, sculpture, photography andantiques; and
– Performing arts: live music, theatre, dance, opera, circus,puppetry, etc.
■ Media. This group covers two subgroups of media that pro-duce creative content with the purpose of communicatingwith large audiences (“new media” is classified separately):
– Publishing and printed media: books,press and other publications; and
– Audiovisuals: film, television, radioand other broadcasting.
■ Functional creations. This group com-prises more demand-driven andservices-oriented industries creatinggoods and services with functionalpurposes. It is divided into the following subgroups:
– Design: interior, graphic, fashion,jewellery, toys;
– New media: software, video games,and digitalized creative content;and
– Creative services: architectural,advertising, cultural and recre-ational, creative research anddevelopment (R&D), digital andother related creative services.
There is an ongoing debate about whether science andR&D are components of the creative economy. Besides theissue of including the economic gains derived from intellec-tual property stemming from scientific research, there ishardly any empirical research analysing the interactionsbetween research, science and the dynamics of the creativeeconomy. UNESCO approached this matter in the contextof increased cooperation between science and industry aswell as between the public and private sectors in the promo-tion of scientific research for long-term goals, prior to thediscourse about the creative economy, in the context of theWorld Conference on Science in 1999. As pointed out in theDeclaration, the two sectors should work in close collabora-tion and in a complementary manner. However, from review-ing follow-up activities, it seems that scientists from the public and private sectors have not yet articulated this cooperation even if the private sector is a direct beneficiaryof scientific innovation and science education and anincreasing proportion of funds for creative-industry-relatedscientific research is financed by the private sector.
Sport and its role in the creative economy are also debatable.Some classifications of creative industries include sport. Inmost cases, this is because ministries of culture are also incharge of sport matters. This is also justified by the fact thatsport is an important source of revenue and generates positiveexternalities in various other sectors of the economy. Another
Concept
and c
onte
xt o
f th
e c
reati
ve e
conom
y
1 Figure 1.3 UNCTAD classification of creative industries
Source: UNCTAD
Heritage
Arts
Media
Functionalcreations
Creative industries
Performing artsLive music, theatre, dance, opera, circus, puppetry, etc.
AudiovisualsFilm, television, radio,
other broadcasting
Cultural sitesArchaeological sites, museums, libraries,
exhibitions, etc.
Traditional cultural expressions
Arts and crafts,festivals and celebrations
Visual artsPaintings, sculptures,
photography and antiques
Publishing and printed mediaBooks, press andother publications
DesignInterior, graphic,
fashion, jewellery and toys
New mediaSoftware, video games,
digitalized creative content
Creative services Architectural, advertising,
creative R&D, cultural & recreational

practical and methodological reason is that in nationalaccounts, sport is aggregated with recreational services. Fromthe conceptual viewpoint adopted by the present Report, however, sport is associated more with training, rules and com-petition than with creative content. Therefore, sport is notincluded in the UNCTAD classification of “creative industries”.
1.1.7 The creative economy
Regardless of the way in which the creative industriesare defined and classified, there is no disagreement that theylay at the centre of what can be labelled in broader terms the“creative economy”. The term “creative economy” appearedin 2001 in John Howkins’ book about the relationshipbetween creativity and economics.10 For Howkins, “creativi-ty is not new and neither is economics, but what is new is thenature and the extent of the relationship between them andhow they combine to create extraordinary value and wealth”.Howkins’ use of the term “creative economy” is broad, covering fifteen creative industries extending from arts to thewider fields of science and technology. According to his esti-mates, in the year 2000, the creative economy was worth$2.2 trillion worldwide, and it was growing at 5 per centannually. For Howkins, there are two kinds of creativity: thekind that relates to people’s fulfilment as individuals and thekind that generates a product. The first one is a universalcharacteristic of humanity and is found in all societies andcultures. The second is stronger in industrial societies, whichput a higher value on novelty, on science and technologicalinnovation, and on intellectual property rights (IPRs).
There is no unique definition of the “creative economy”. It is a subjective concept that is still being shaped.There is, however, growing convergence on a core group ofcreative industries and their overall interactions both in individual countries and at the international level.
This Report adopts the UNCTAD definition of the“creative economy”, which is summarized in the following box.11
For countries in the developing world, recognition ofthe development dimension of the creative industries andhence of the creative economy has been more recent. The SãoPaulo Consensus arising from UNCTAD XI was a decisivestep in this regard. Subsequently, UNCTAD has enlargedthe focus of its policy-oriented analysis, emphasizing fourkey objectives in its approach to the creative economy:
■ to reconcile national cultural objectives with technologicaland international trade policies;
■ to deal with the asymmetries inhibiting the growth ofcreative industries in developing countries;
■ to reinforce the so-called “creative nexus” between invest-ment, technology, entrepreneurship and trade; and
■ to identify innovative policy responses for enhancing thecreative economy for development gains.
Other initiatives that have furthered the role of the cre-ative economy in development include a symposium held inNagaur, India, in 2005. Organized by UNESCO, the sympo-sium focused on the role of cultural industries in develop-ment, with particular emphasis on the importance of localartistic and cultural activity as a means towards economicempowerment and poverty alleviation. The recommendationsof this event, known as the Jodhpur Initiatives, put forward aseries of strategies for data collection and industry develop-ment for implementation in various Asian countries.
At the same time at UNESCO Headquarters, workwas proceeding on the preparation of a cultural diversityconvention whose provisions would specifically recognize thecontribution that cultural industries make to economic andcultural development in both industrialized and developingcountries. The resulting Convention on the Protection andPromotion of the Diversity of Cultural Expressions was
15C R E AT I V E E C O N O M Y R E P O R T 2 0 0 8
Concept a
nd c
onte
xt of th
e c
reative
econom
y
1
10See Howkins (2001), The Creative Economy: How People Make Money from Ideas.11Reference made to the definition by the UNCTAD Creative Economy and Industries Programme, 2006.
UNCTAD definition of the creative economy
The “creative economy” is an evolving concept based oncreative assets potentially generating economic growthand development.
■ It can foster income-generation, job creation and export earningswhile promoting social inclusion, cultural diversity and humandevelopment.
■ It embraces economic, cultural and social aspects interacting withtechnology, intellectual property and tourism objectives.
■ It is a set of knowledge-based economic activities with a developmentdimension and cross-cutting linkages at macro and micro levels tothe overall economy.
■ It is a feasible development option calling for innovative, multidisciplinary policy responses and interministerial action.
■ At the heart of the creative economy are the creative industries.

16 C R E AT I V E E C O N O M Y R E P O R T 2 0 0 8
adopted by the General Conference of UNESCO inOctober 2005 and entered into force in March 2007 (see chapter 9).12
Thus it can be seen that the concept of the “creativeeconomy” has evolved along several paths over the last tenyears. It has emerged as a means of focusing attention on therole of creativity as a force in contemporary economic life,embodying the proposition that economic and culturaldevelopment are not separate or unrelated phenomena butpart of a larger process of sustainable development in whichboth economic and cultural growth can occur hand in hand.In particular, the idea of the creative economy in the devel-oping world draws attention to the significant creative assetsand rich cultural resources that exist in all developing coun-tries. The creative industries that use these resources not onlyenable countries to tell their own stories and to project theirown unique cultural identities to themselves and to the worldbut they also provide these countries with a source of eco-nomic growth, employment creation and increased participa-tion in the global economy. At the same time, the creativeeconomy promotes social inclusion, cultural diversity andhuman development.
1.1.8 The creative class and creativeentrepreneurs
A broad interpretation of creativity also underliesRichard Florida’s descriptions of the emerging “creativeclass” in society, a cohort of professional, scientific and artis-tic workers whose presence generates economic, social andcultural dynamism, especially in urban areas.13 More specifi-cally, the creative class includes people in science and engi-neering, architecture and design, education, arts, music andentertainment whose economic function is to create newideas, new technology or new creative content. In Florida’sapproach, the creative class also includes a broader group ofcreative professionals in business, finance and law. Whetherthey are artists or engineers, musicians or computer scien-tists, writers or entrepreneurs, these workers share a commoncreative ethos that values creativity, individuality, differenceand merit. In sum, they are people who add economic valuethrough creativity. The values of the creative class are individuality, meritocracy, diversity and openness.
Florida estimated that at the beginning of the twenty-first century, the creative class represented almost one thirdof the workforce in the United States of America and thatthe creative sector accounted for nearly half of all wage andsalary income in this country, about $1.7 trillion, as much asthe manufacturing and service sectors combined.14
“Creativity is not intelligence. Creativity involves the abilityto synthesize. It is a matter of sifting through data, percep-tions and materials to come up with something new and use-ful”. In his second book,15 Florida points out that we areentering the creative age, as the rise of creativity is the primefactor of our economy. He presents his “3 Ts theory” foreconomic growth: technology, talent and tolerance. His the-ory differs from the conventional theory since he argues thattalent drives growth. He then goes a step further by addingthe third T, tolerance, which is needed to attract human cap-ital. Criticisms have been raised about Florida’s work, includ-ing that the range of occupational categories to define thecreative class is too broad. Nevertheless, it is recognized thathe has contributed to advancing a public discourse about theemerging creative economy.
Along these lines, the notion of “creative entrepre-neurs” is also emerging to characterize successful and talentedentrepreneurial people able to transform ideas into creativeproducts or services for society (see box 1.1).
1.1.9 Creative cities
The idea of a creative economy has also been appliedspecifically to the economy of cities, leading to the emergenceof the concept of a “creative city”. This term describes anurban complex where cultural activities of various sorts are anintegral component of the city’s economic and social func-tioning. Such cities tend to be built upon a strong social andcultural infrastructure, to have relatively high concentrationsof creative employment, and to be attractive to inward invest-ment because of their well-established cultural facilities.
Charles Landry, in his seminal work on the concept ofthe creative city, argues that cities have one crucial resource:their people. Creativity is replacing location, naturalresources and market access as a principal key to urbandynamism. He points out that “Today many of the world’scities face periods of transition largely brought about by the
Concept
and c
onte
xt o
f th
e c
reati
ve e
conom
y
1
12See also chapter 8.13See Florida (2002).14See Harvard Business Review, February 2004.15See R. Florida (2005), The Flight of the Creative Class.

vigour of renewed globalization. These transitions vary fromregion to region. In areas such as Asia, cities are growing,while in others, such as Europe, old industries are disappear-ing and the value added in cities is created less through what
is manufactured and more through intellectual capitalapplied to products, processes and services”.16
Creative cities use their creative potential in variousways. Some function as nodes for generating cultural experi-
ences for inhabitants and visitors through the presentation oftheir cultural heritage assets or through their cultural activi-ties in the performing and visual arts. Some, such asBayreuth, Edinburgh or Salzburg, use festivals that shape theidentity of the whole city. Others look to broader culturaland media industries to provide employment and incomesand to act as centres for urban and regional growth. In othercases, a more pervasive role for culture in the creative cityrests on the capacity of the arts and culture to foster urbanliveability, social cohesion and cultural identity.
The contribution of the creative sector to the eco-nomic vitality of cities can be measured in terms of thedirect contribution of the sector to output, value added,incomes and employment and further through the indirectand induced effects caused, for example, by the expendituresof tourists visiting the city to experience its cultural attrac-tions. In addition, cities with an active cultural life can attractinward investment in other industries seeking to locate incentres that will provide an enjoyable, stimulating environ-ment for employees.
17C R E AT I V E E C O N O M Y R E P O R T 2 0 0 8
Concept a
nd c
onte
xt of th
e c
reative
econom
y
1
Box 1.1 A creative entrepreneur: Transforming ideas into successful business
In the last 20 years, intellectual property has become increasingly important to businesses, and personal computers started appearing on every desk-top, employees morphed into knowledge workers, companies began to focus on knowledge management and key information was stored in knowledgebases connected – in theory – via knowledge networks. The result was the knowledge economy, a phenomenon that has transformed the business ofbusiness and helped entire emerging economies to compete globally.
In this context, however, most of the "knowledge" on which the knowledge economy is built is actually just information – data, facts and basic businessintelligence. As management guru Tom Davenport once said, "Knowledge is information combined with experience, context, interpretation, and reflec-tion”. It is the knowledge derived from information that gives you a competitive edge. Many of us now live in an "information democracy" – if you haveaccess to a personal computer (PC) and the Internet, you can tap into almost all the information that is publicly available worldwide. Advanced softwareand Web services can help trace, slice and dice the information in ways that were impossible a decade ago.
The emergence of low-cost PCs gave rise to a powerful network that has transformed opportunities for learning and communicating. The magical thingabout this network is not just that it collapses distance and makes everyone your neighbour. It also dramatically increases the number of brilliant mindswe can have working together – and this scales up the rate of innovation to a staggering degree.
As more and more of the world's information, commerce, and communications moves to digital form, it will open the door to a new world of connectedexperiences that link our interests and our communities into a seamless whole that extends across home, work, school and play. Already, a new gener-ation of technology is transforming expectations for how we will conduct business, communicate, access entertainment and much more. Increasingly,people envision a world of anywhere access – a world in which the information, the communities and the content that they value are available instant-ly and easily no matter where they are.
William (Bill) H. Gates is chairman of Microsoft Corporation, one of the biggest companies in software services and business solutions in the world. WhenMicrosoft began in 1975, Mr. Gates and Paul Allen, co-founder of Microsoft, immediately recognized the implications of the microprocessor and its poten-tial to revolutionize the information and communication technology. In 1981, I.B.M. selected the fledgling company to be the main supplier of operatingsystems for its first PC – Microsoft's first big step towards defining the software standards of the PC industry. Its Windows operating systems and Officeproductivity programmes are the dominant PC software. Microsoft had revenues of $51.12 billion for the fiscal year ending June 2007 and employs morethan 78,000 people in 105 countries and regions.
In addition, Mr. Gates founded Corbis, which is developing one of the world's largest resources of visual arts information – a comprehensive digital archiveof art and photography from public and private collections around the globe. He and his wife, Melinda, have endowed a foundation to support philan-thropic initiatives in the areas of global health and education.
Sources: http://www.microsoft.com/presspass/exec/billg/books/default.mspx
http://www.gatesfoundation.org/MediaCenter/Speeches/Co-ChairSpeeches/BillgSpeeches/BGSpeechHarvard-070607.htm
http://topics.nytimes.com/top/reference/timestopics/people/g/bill_gates/index.html?inline=nyt-per
By Carolina Quintana, UNCTAD secretariat.
16See Landry (2000:xiii).

18 C R E AT I V E E C O N O M Y R E P O R T 2 0 0 8
Concept
and c
onte
xt o
f th
e c
reati
ve e
conom
y
1 Box 1.2 The creative city
The notion of “creativity” has moved centre-stage given the dramatic shifts in global terms of trade, the operating dynamics of the economy, the rise ofthe talent agenda and the repositioning of cities worldwide. Everyone is now in the creativity game. Creativity has become a mantra of our age, endowedalmost exclusively with positive virtues. At my last count, over 60 cities worldwide called themselves “creative city” from Creative Manchester to Bristoland, of course, Creative London in Britain. And ditto Canada: Toronto with its Culture Plan for the Creative City; Vancouver and the Creative City Task Forceand Ottawa’s plan to be a creative city. In Australia we find the Brisbane Creative City strategy; there is Creative Auckland. In the United States, there iscreative Cincinnati, creative Tampa Bay and the welter of creative regions such as creative New England. Partners for Livable Communities in Washington,D.C., launched a Creative Cities Initiative in 2001; Osaka set up a Graduate School for Creative Cities in 2003 and launched a Japanese Creative CitiesNetwork in 2005; and since 2004, there has been “Yokohama: Creative City”. Even UNESCO, through its Global Alliance for Cultural Diversity, launchedits Creative Cities Network in 2004, crowning Edinburgh as the first member for its literary creativity, and since then, over a dozen have followed. To sim-plify, there are four ways in which the term “creative city” has been used.
The creative city as arts and cultural infrastructure
Indeed, on closer examination, most of the strategies and plans are in fact concerned with strengthening the arts and cultural fabric, such as support forthe arts and artists and the institutional infrastructure to match.
The creative city as the creative economy
Increasingly, there is a focus on fostering the creative industries or creative economy, which is seen as a platform for developing the economy and eventhe city. At its core there are three main domains: the arts and cultural heritage, the media and entertainment industries, and the creative business-to-business services.
The latter sphere is perhaps the most important since it can add value to every product or service. Design, advertising and entertainment in particularact as drivers of innovation in the broader economy and shape the so-called “experience economy”.
The creative city as synonymous with a strong creative class
Richard Florida, who introduced the term “creative class”, makes an important conceptual shift by focusing on the creative role of people in the “cre-ative age”. He argues that the economy is moving from a corporate-centred system to a people-driven one and companies now move to people and notpeople to jobs, and cities need a people climate as well as a business climate.
Florida develops indicators to measure the attributes of places that attract and retain the creative class, which in turn attracts companies. Artists con-stitute one group at the core of this class, as are creative economy people and importantly, scientists, so the city with a strong creative class is broaderthan the first two definitions. Cities are locked in competition to attract, keep or grow their own creative classes, and the factors that contribute to this,such as good air connections, research capacity, venture capital investment, and clusters of producers, are all well known in the widely copied “SiliconSomewhere” model.
The cities that are succeeding in the new economy are also the most diverse, tolerant and bohemian places. Cities that are investing heavily in hightechnology futures but that also are not providing a broad mix of cultural experiences will fall behind in the longer term. The central concern of RichardFlorida in The Rise of the Creative Class1 is the “quality of place”, captured by inquiring: What’s there? Who’s there? and What’s going on?
The creative city as a place that fosters a culture of creativity
The three definitions described above are helpful, but this is not what the “creative city” is exclusively concerned with. The “creative city” notion is broad-er than that of the “creative economy” and “creative class”. It sees the city is an integrated system of multiple organizations and an amalgam of cul-tures in the public, private and community sectors. It claims that in a period of dramatic change, the disparate bodies in a city need to each becomemore inventive and work together to address the challenges; otherwise, they will go backwards.
The Creative City2 argues that “Cities have one crucial resource – their people. Human cleverness, desires, motivations, imagination and creativity arereplacing location, natural resources and market access as urban resources. The creativity of those who live in and run cities will determine future success. As cities became large and complex enough to present problems of urban management so they became laboratories that developed the solu-tions – technological, conceptual and social – to the problems of growth”.
The idea of the “creative city” emerged in the late 1980s. It was a response to the fact that globally, cities had been struggling and restructuring as global terms of trade shifted to the East and elsewhere. When the “creative city” notion was more publicly introduced in the early 1990s, the philosophywas that there is always more potential in any place than any of us would think at first sight, even though very few cities, perhaps London, Tokyo, NewYork or Amsterdam, are comprehensively creative. It posits that conditions need to be created for people to think, plan and act with imagination in harnessing opportunities ranging from addressing homelessness to creating wealth or getting artists to unsettle conventional attitudes. The concept isthat ordinary people can make the extraordinary happen and that if everyone were just 5 per cent more imaginative about what they did, the impactwould be dramatic.

19C R E AT I V E E C O N O M Y R E P O R T 2 0 0 8
Concept a
nd c
onte
xt of th
e c
reative
econom
y
1
17Data from GLA Economics, quoted in The Work Foundation, Staying Ahead: The Economic Performance of the UK’s Creative Industries (2007:48).
Box 1.2 continued The creative city
In the “creative city”, it is not only artists and those involved in the creative economy who are creative. Creativity can come from anyone who address-es issues in an inventive way, be it a social worker, a business person, an engineer, a scientist or a public servant. In the urban context, interestingly, itis combined teams that, with different insights, generate the most interesting ideas and projects. This implies that the “creative city” is a place that isimaginative comprehensively. It has a creative bureaucracy, creative individuals, organizations, schools, universities and much more. By encouraging cre-ativity and legitimizing the use of imagination within the public, private and community spheres, the idea bank of possibilities and potential solutions toany urban problem will be broadened.
The “creative city” requires infrastructures beyond the hardware – buildings, roads or sewage. Creative infrastructure is a combination of the hard andthe soft, including, too, the mental infrastructure, the way a city approaches opportunities and problems, the atmosphere and the enabling devices thatit fosters through its incentives and regulatory structures. The soft infrastructure needs to include: a highly skilled and flexible labour force; dynamicthinkers, creators and implementers; being able to give maverick personalities space; strong communication linkages internally and with the externalworld; and an overall culture of entrepreneurship whether this is applied to social or economic ends. This establishes a creative rub as the imaginativecity stands on the cusp of a dynamic and tense equilibrium.
Being creative as an individual or organization is relatively easy, yet to be creative as a city is a different proposition, given the amalgam of cultures andinterests involved. This usually implies taking measured risks, widespread leadership, a sense of going somewhere, being determined but not determin-istic and, crucially, being strategically principled and tactically flexible. To maximize this requires a change in mindset, perception, ambition and will, andan understanding of the city’s networking capacity and its cultural depth and richness. This transformation has a strong impact on organizational cul-ture. It requires thousands of changes in mindset, creating the conditions for people to become agents of change rather than victims of change, seeingtransformation as a lived experience, not a one-off event. It requires bureaucracies that are themselves creative.
The built environment – the stage, the setting, the container – is crucial for establishing a milieu. Essentially, the city is seen as a complex adaptive systemwhere a more holistic approach creates “systemic creativity” and where creativity is leveraged in the entire community. This milieu creates the mood of thecity, the atmosphere and its culture.
1 Florida, R. (2002), The Rise of the Creative Class …And How It’s Transforming Work, Leisure, Community, & Everyday Life. New York: Basic Books.2 Charles Landry (2000), The Creative City: A Toolkit for Urban Innovators, Earthscan Publications Ltd., London.
By Charles Landry, who wrote The Creative City: A Toolkit for Urban Innovators in 2000 and more recently The Art of City-Making in 2006.
A good example of a creative city is London; the cre-ative industries comprise the second biggest sector in theLondon economy. Between 1995 and 2001, London’s creativeindustries grew faster than any other major industry exceptfinancial and business services and accounted for between 20and 25 per cent of job growth in the city over this period.17
Table 1.2 provides some indicators regarding the creativeworkforce in some major creative cities in recent years.
Established in 2004, the UNESCO Creative CitiesNetwork reflects a changing perception of culture and itsrole in society and as part of the economy. The idea for thenetwork was based on the observation that while many citiesaround the world realize that the creative industries arebeginning to play a much greater role in their local econom-ic and social development schemes, they do not see clearlyhow to harness this potential or how to engage the appropri-ate actors in this development.
The main objective of the network is, therefore, to
facilitate the development of cultural clusters around theworld to exchange know-how, experiences and best practicesas a means of promoting local economic and social develop-ment through creative industries. In order to better target thedevelopment needs of specific subsectors within the culturalindustries, the Creative Cities Network devised seven the-matic networks and cities can choose one field on which tofocus their efforts. Cities with established creative pedigreesin the fields of literature, cinema, music, folk art, design,information technology/media arts or gastronomy can applyto join the network. Cities are encouraged to consider theircandidature in fields that have the greatest potential for eco-nomic and social development.
Montreal is a case study for design-integrated process-es and the kind of development of cultural districts that isalso found in other parts of the world. The notion of“design” is fully integrated as part of the urban planningstrategy for the city. In Montreal, design is not only about

generating wealth but also about improving the quality ofpeople’s lives. The Canadian authorities invited designers andarchitects to redefine a new aesthetic/functionality of openspaces and to reinvent and redevelop neglected parts ofMontreal in order to make these more attractive to the citi-zens. The “Design Commerce Montreal” project inviteddesigners/architects to work on the look and feel of shop-ping areas by redesigning numerous shops and restaurants.
The city of Popayan, Colombia, was appointed as thefirst UNESCO City of Gastronomy and it provides quite adifferent model for development. It has made extraordinarystrides in formalizing its informal gastronomy industry. Byfacilitating space and other facilities, imposing mandatoryhygiene regulations and publishing widely circulated restau-rant and food surveys that include even the smallest foodstands, Popayan has invigorated its economy and provided jobsand income to many people through the conscious support ofthis subsector of the creative industries. This newly discoveredtransparency and openness to the world are giving individuals,families and communities in Popayan the opportunity to come
together and celebrate their distinctive recipes, rituals andingredients within an international forum.
It is interesting to note that while the Creative CitiesNetwork started out by focusing on the fine arts and corecultural industries such as literature, music and folk art aswell as on the need to build on a proven track record withinone of the cultural themes or disciplines, the difficulties indemonstrating measurable economic results may have led toa more economics-based interpretation of this requirement,shifting the focus from fine arts/tradition and its upgradingor adornment effect on the city to a more innovative (design)and market-driven (gastronomy) approach to the develop-ment of creative industries within the cityscape.
1.1.10 Creative clusters, networksand districts
A specific aspect of the growth of creative productionwithin an urban context derives from the existence ofagglomeration externalities, the beneficial spillovers thataccrue to firms from proximity to one another. It is not onlyin cities that such effects can be realized. In principle, groupsof creative businesses might grow up in any location if theconditions for development of a creative cluster exist. Thetendency of firms producing cultural products such asmusic, film, visual arts, fashion, design and so on to convergein distinctive clusters reflects the economic, social and cul-tural interactions that develop between firms and thatbecome essential to their survival and growth. As Allen Scottargues (Scott, 2005:7), “By clustering together, firms areable to economize on their spatial inter-linkages, to reap themultiple advantages of spatially concentrated labour markets,to tap into the abundant information flows and innovativepotentials that are present wherever many different specializedbut complementary producers are congregated, and so on.”
20 C R E AT I V E E C O N O M Y R E P O R T 2 0 0 8
Concept
and c
onte
xt o
f th
e c
reati
ve e
conom
y
1
Table 1.3 Creative Cities Network
City
Edinburgh
Bologna
Seville
Buenos Aires
Montreal
Berlin
Santa Fe, New Mexico
Aswan
Popayan
Country
Scotland
Italy
Spain
Argentina
Canada
Germany
United States
Egypt
Colombia
Theme
UNESCO City of Literature
UNESCO City of Music
UNESCO City of Music
UNESCO City of Design
UNESCO City of Design
UNESCO City of Design
UNESCO City of Folk Art
UNESCO City of Folk Art
UNESCO City of Gastronomy
Source: UNESCO.
Table 1.2 Estimates of culture employment in selected creative cities
City
LondonMontrealNew YorkParis (Ile-de-France)
Source: John C. Gordon and Helen Beilby-Orrin, International Measurement of the Economic and Social Importance of Culture, Organisation for Economic Co-operation
and Development (OECD), 2007.
Reference year
2002200320022003
City population (000s) City population as %of national population
7,3712,3718,107
11,130
12.47.42.8
18.5
City cultureemployment (000s)
52598
309113
City culture employ-ment as % of nationalculture employment
23.816.4
8.945.4
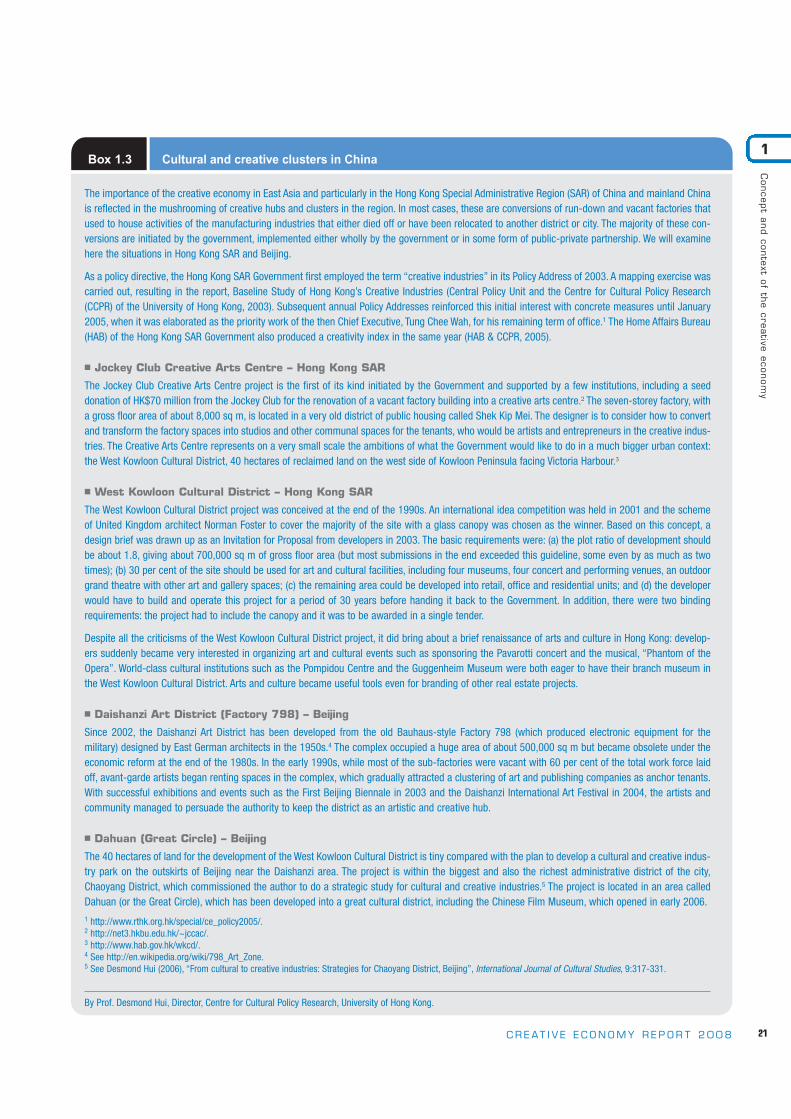
21C R E AT I V E E C O N O M Y R E P O R T 2 0 0 8
Concept a
nd c
onte
xt of th
e c
reative
econom
y
1Box 1.3 Cultural and creative clusters in China
The importance of the creative economy in East Asia and particularly in the Hong Kong Special Administrative Region (SAR) of China and mainland Chinais reflected in the mushrooming of creative hubs and clusters in the region. In most cases, these are conversions of run-down and vacant factories thatused to house activities of the manufacturing industries that either died off or have been relocated to another district or city. The majority of these con-versions are initiated by the government, implemented either wholly by the government or in some form of public-private partnership. We will examinehere the situations in Hong Kong SAR and Beijing.
As a policy directive, the Hong Kong SAR Government first employed the term “creative industries” in its Policy Address of 2003. A mapping exercise wascarried out, resulting in the report, Baseline Study of Hong Kong’s Creative Industries (Central Policy Unit and the Centre for Cultural Policy Research(CCPR) of the University of Hong Kong, 2003). Subsequent annual Policy Addresses reinforced this initial interest with concrete measures until January2005, when it was elaborated as the priority work of the then Chief Executive, Tung Chee Wah, for his remaining term of office.1 The Home Affairs Bureau(HAB) of the Hong Kong SAR Government also produced a creativity index in the same year (HAB & CCPR, 2005).
■ Jockey Club Creative Arts Centre – Hong Kong SAR
The Jockey Club Creative Arts Centre project is the first of its kind initiated by the Government and supported by a few institutions, including a seeddonation of HK$70 million from the Jockey Club for the renovation of a vacant factory building into a creative arts centre.2 The seven-storey factory, witha gross floor area of about 8,000 sq m, is located in a very old district of public housing called Shek Kip Mei. The designer is to consider how to convertand transform the factory spaces into studios and other communal spaces for the tenants, who would be artists and entrepreneurs in the creative indus-tries. The Creative Arts Centre represents on a very small scale the ambitions of what the Government would like to do in a much bigger urban context:the West Kowloon Cultural District, 40 hectares of reclaimed land on the west side of Kowloon Peninsula facing Victoria Harbour.3
■ West Kowloon Cultural District – Hong Kong SAR
The West Kowloon Cultural District project was conceived at the end of the 1990s. An international idea competition was held in 2001 and the schemeof United Kingdom architect Norman Foster to cover the majority of the site with a glass canopy was chosen as the winner. Based on this concept, adesign brief was drawn up as an Invitation for Proposal from developers in 2003. The basic requirements were: (a) the plot ratio of development shouldbe about 1.8, giving about 700,000 sq m of gross floor area (but most submissions in the end exceeded this guideline, some even by as much as twotimes); (b) 30 per cent of the site should be used for art and cultural facilities, including four museums, four concert and performing venues, an outdoorgrand theatre with other art and gallery spaces; (c) the remaining area could be developed into retail, office and residential units; and (d) the developerwould have to build and operate this project for a period of 30 years before handing it back to the Government. In addition, there were two bindingrequirements: the project had to include the canopy and it was to be awarded in a single tender.
Despite all the criticisms of the West Kowloon Cultural District project, it did bring about a brief renaissance of arts and culture in Hong Kong: develop-ers suddenly became very interested in organizing art and cultural events such as sponsoring the Pavarotti concert and the musical, “Phantom of theOpera”. World-class cultural institutions such as the Pompidou Centre and the Guggenheim Museum were both eager to have their branch museum inthe West Kowloon Cultural District. Arts and culture became useful tools even for branding of other real estate projects.
■ Daishanzi Art District (Factory 798) – Beijing
Since 2002, the Daishanzi Art District has been developed from the old Bauhaus-style Factory 798 (which produced electronic equipment for the military) designed by East German architects in the 1950s.4 The complex occupied a huge area of about 500,000 sq m but became obsolete under theeconomic reform at the end of the 1980s. In the early 1990s, while most of the sub-factories were vacant with 60 per cent of the total work force laidoff, avant-garde artists began renting spaces in the complex, which gradually attracted a clustering of art and publishing companies as anchor tenants.With successful exhibitions and events such as the First Beijing Biennale in 2003 and the Daishanzi International Art Festival in 2004, the artists andcommunity managed to persuade the authority to keep the district as an artistic and creative hub.
■ Dahuan (Great Circle) – Beijing
The 40 hectares of land for the development of the West Kowloon Cultural District is tiny compared with the plan to develop a cultural and creative indus-try park on the outskirts of Beijing near the Daishanzi area. The project is within the biggest and also the richest administrative district of the city,Chaoyang District, which commissioned the author to do a strategic study for cultural and creative industries.5 The project is located in an area calledDahuan (or the Great Circle), which has been developed into a great cultural district, including the Chinese Film Museum, which opened in early 2006.1 http://www.rthk.org.hk/special/ce_policy2005/.2 http://net3.hkbu.edu.hk/~jccac/.3 http://www.hab.gov.hk/wkcd/.4 See http://en.wikipedia.org/wiki/798_Art_Zone.5 See Desmond Hui (2006), “From cultural to creative industries: Strategies for Chaoyang District, Beijing”, International Journal of Cultural Studies, 9:317-331.
By Prof. Desmond Hui, Director, Centre for Cultural Policy Research, University of Hong Kong.

22 C R E AT I V E E C O N O M Y R E P O R T 2 0 0 8
Concept
and c
onte
xt o
f th
e c
reati
ve e
conom
y
1 As Michael Porter has argued (Porter, 1990), the pro-duction of creative goods and services under these circum-stances can be shown to enhance efficiency and productivitygrowth and promote sustainable development.18 In an urbancontext, this has been observed in traditional centres of cul-tural production and creative activity such as London, LosAngeles, New York and Paris and, more recently, in the met-ropolitan surroundings of Bombay, Hong Kong, MexicoCity, Seoul and Shanghai.
It is not only in the major centres that such cultural dis-tricts arise, however. In many parts of the world, similarprocesses are going on to produce local concentrations of cul-tural production that both provide economic empowermentfor the community and reflect the traditional knowledge,skills and cultural traditions of the people. Some examples ofsuch production drawn from the developing world are cited
by Santagata (2006) as follows:
■ In Sigchos, Ecuador, a number of craftsmen produce pottery, woven goods and clothing reproducing old forms,designs and traditional colours.
■ In Aleppo, Syrian Arab Republic, micro and small firmsgathered in small areas of the town produce green olive soapaccording to a three-thousand-year-old tradition. The tech-nology employed is ancient, the product highly standardized.
Santagata argues that cultural districts such as thesemay be able to establish collective IPRs over the distinctivequalities of their particular output. Such rights, which may,for example, be exercised in the form of trademarks, can actas a safeguard against illegal copying as well as a stimulus tonew business investment and the maintenance of qualitystandards (see chapter 6).
The major drivers responsible for the extraordinarygrowth in the creative industries worldwide can be found inboth technology and economics. The technological transfor-mations in communications brought about by the digital revolution and the economic environment within which thisrevolution has taken place have combined to create the con-ditions for this growth. Some of the most significant driversof growth in the creative economy are considered in moredetail in sections 1.2.1 to 1.2.3.
1.2.1 Technology
The convergence of multimedia and telecommunica-tion technologies has led to an integration of the means bywhich creative content is produced, distributed and consumed and has in turn fostered new forms of artistic andcreative expression. At the same time, the deregulation ofmedia and telecommunication industries and the privatiza-tion of previously State-owned enterprises in these sphereshave opened the way for massive growth in private-sectorinvestment, with consequent effects on output and employ-ment across the board. A number of countries have seized theopportunities provided by these developments. To illustrate,
the Republic of Korea has ridden a wave of growth driven byits harnessing of content creation to the new technologies invideo games, animation and other audiovisual services. As aresult, Korean television programming exports, for example,increased threefold in value (from $12.7 million to $37.5million) over the period from 1999 to 2003.19
Digital technology has brought about enormous growth inthe range of media through which creative content is conveyed toconsumers, such as video-on-demand, music podcasting, stream-ing, computer games and the provision of television services viacable, satellite and the Internet. Overall, the number of distribu-tion channels and platforms has continued to grow, generating anincreasing demand for creative content. It is the task of the creativeindustries, wherever they are located, to supply this content in away that is culturally expressive and economically profitable.
Underlying these developments has been a more generaltrend in economic policy-making towards a broadening of theconcept of “innovation” from one concerned only with scienceand technology into a more wide-reaching appreciation of therole of creativity in the economy. Opening up the idea of cre-ativity as a driving force in the knowledge economy pushes thecreative industries into the spotlight as a primary source of theskilled workforce that can produce creative ideas and make
1.2 Major drivers of the creative economy worldwide
18Further discussion of the Porter model of creative clusters is contained in chapter 3.19See Shim (2006:28).

innovation happen across a wide range of activities from busi-ness entrepreneurship to imaginative new social programmes.
1.2.2 Demand
Growth in demand for creative products has also beena significant driver of the growth of the creative economy.Several factors lie behind this demand push. First, rising realincomes in industrialized countries have tended to increasethe demand for income-elastic products, including creativegoods and services. Moreover, the real prices of some ofthese products and particularly the prices of the means fortheir mediated consumption have fallen as technologyadvances, leading to further upward pressure on demand.
A further factor that continues to drive the growth ofthe creative economy is the changing patterns of culturalconsumption. Again it is the spread of new communicationtechnologies that lies behind the transformation. New gen-erations of consumers are using the Internet, mobile teleph-ony, digital media, etc., in ways that not only expand theirrange of cultural experiences but also transform them frompassive recipients of cultural messages into active co-creatorsof cultural content. The sense of empowerment broughtabout by these developments and the process of redefiningcultural identities are likely to continue as significant influ-ences on the growth of the creative industries in the future.
The emergence of consumers as creators or co-creators of creative products has stimulated an enormousamount of cultural interaction and interchange. Some of thishas been harnessed by firms in the creative industries thathave been able to involve consumers in the co-production oftheir good or service. Examples include open-source softwareand peer-produced information (see chapter 7).
1.2.3 Tourism
Worldwide growth in tourism has continued in recentyears and has helped to fuel the growth of those creativeindustries selling creative goods and cultural services into thetourist market. In 2004, international tourist arrivals inEurope totalled 416 million while the numbers arriving inthe Asia and Pacific region amounted to 153 million. Therewere only 33 million arrivals in the whole of Africa.20
The cultural sector contributes to tourism through thedemand for visits to cultural heritage sites, museums and gal-leries, festivals and so on as well as tourists’ interest in attend-ing music, dance, theatre and opera performances in mostcities and towns. More generally, the cultural ambience andtraditions of different locations can be an attraction fortourists, especially for those classified as “cultural tourists”whose demand is more discriminating and culturally awarethan that of the so-called “mass tourist”.
Cultural tourism centred on heritage sites has becomea rapidly growing industry in many countries over the lastseveral decades, supported among other things by theUNESCO World Heritage List. The World Heritage Listcurrently includes 851 properties forming part of the cultur-al and natural heritage that the World Heritage Committeeconsiders as having outstanding universal value. Theseinclude 660 cultural, 166 natural and 25 mixed properties in141 States Parties. As of October 2007, 184 States Partieshad ratified the World Heritage Convention.21
A visit to any of the major heritage sites in the Asiaregion clearly demonstrates the increasing number of visitorsfrom China, Japan, Malaysia and the Republic of Korea. It ispredicted that there will be over 200 million middle-classChinese within five years, and many will join the ranks ofinternational tourism. The wealthy middle class in India isequally mobile and looking at travel as a source of educationand recreation even as religious tourism and pilgrimage trav-el are major sources of activity. Discount airline travel in Asiaand other parts of the developing world is now a reality andan additional factor in the continuous expansion of tourismin the next few years.
In recent years, however, there has been a shift in theapproach to cultural tourism. UNESCO is urging govern-ments to better balance tourism with protection, fearful thatsome of the most beautiful and important cultural and naturalsites are being harmed by throngs of visitors. Internationalorganizations such as the United Nations World TourismOrganization (UNWTO) and UNCTAD have thereforebeen actively promoting a shift in the attitude of govern-ments towards the formulation of tourism policy, focusingon the concept that tourism policy should be both culturallyand environmentally friendly and benefit local people.
23C R E AT I V E E C O N O M Y R E P O R T 2 0 0 8
Concept a
nd c
onte
xt of th
e c
reative
econom
y
1
20Figures quoted in Anheier and Isar (2007:526-527).21For more information, see http://whc.unesco.org/en/list/.

24 C R E AT I V E E C O N O M Y R E P O R T 2 0 0 8
The creative economy is not monolithic, but it has amultitude of dimensions and it contributes to economic,social and cultural development in a number of ways.
1.3.1 Economic aspects
From the economic perspective, international trade is akey component of the creative economy. According to UNC-TAD, world trade in creative-industry products increasedsharply in recent years. In the period 2000-2005, trade in goodsand services from the creative industries grew on average by 8.7per cent annually. For instance, world exports of visual arts morethan doubled from $10.3 billion in 1996 to $22.1 billion in2005. Exports of audiovisuals tripled over the same period (see
chapter 5); much of the trade in audiovisual products occurs inthe form of rights transactions as the means for buying and selling creative content. The functioning of intellectual propertymarkets both nationally and internationally depends on the exis-tence of effective copyright regimes in the countries involved,allowing efficient collection and equitable distribution of copy-right payments. Further details of international trade in creativegoods and services as well as intellectual property and copyrightsissues are presented in subsequent chapters of this Report.
1.3.2 Social aspects
A major social impact of the creative industries is theircontribution to employment. It should be noted that creative
Concept
and c
onte
xt o
f th
e c
reati
ve e
conom
y
1 Box 1.4 Petra: A cultural trip
A visit to Petra can be more than simply a tour of a dazzling archeological site. It may turn into a full dive into the two-thousand-year-old culture of theancient Jordanian tribes and a trip to times when the region was an important junction for the trade routes that linked China, India and southern Arabiawith Egypt, the Syrian Arab Republic, Greece and Rome.
Though it was “rediscovered” by Western eyes in 1812, the grand debut of Petra on the global-tourism stage took place in 1985 when it was declareda UNESCO World Heritage site. The giant carved red mountains and vast mausoleums provide an awe-inspiring experience. The environment is enrichedby the presence of artisans from the town of Wadi Musa and a nearby Bedouin settlement that sell handicrafts and jewellery inspired by local tastes.Evening activities include a candlelight visit to the entrance of Petra, when old stories are told while tea is served beneath the moon. Alternatively, a gas-tronomy class where tourists learn by cooking and then dining on local delicacies offers another inspiring cultural experience.
Things could be rosier, though. The UNESCO report, Cultural Landscapes: the Challenges of Conservation, stated, in 2002, that in order to arrest the crumbling of thestone, ancient techniques would have to be reintroduced. Petra required the reconstruction of the entire ecosystem that existed when the city was built, comprisinga system of canals, terraced overhangs and cultivated gardens in an area close to Petra, the wadi Al Mataha. The most immediate threat to be addressed, however,was presented by the increasing flow of tourists, with all the potential pernicious consequences to the already fragile infrastructure and the local traditions.
The Petra Regional Planning Council, a cross-sectoral entity chaired by the Minister of Tourism and Antiquities and comprising governmental and non-governmental representatives, was set up in 1995 by the Jordanian authorities, funded by 25 per cent of the revenues from the Petra entrance fee. In1997, a project executed by the Ministry of Tourism and Antiquities and supported by a $44 million loan from the World Bank was taken forward. Under theproject, the need for physical upgrading and management capacities at the archeological sites was addressed and roads and urban infrastructures in theirvicinity were improved. In addition, services were provided to communities living next to the tourist attractions.
The Jordan National Tourism Strategy 2004-2010 estimates that tourism receipts in the country will skyrocket from around $807 million in 2003 to $1,840 million in 2010 and the number of tourism-supported jobs will more than double in the same period. Part of this increase has roots in festival and cultural events,photography and film productions. The importance of the latter led to the creation, in 2003, of the Royal Film Commission of Jordan, since it was recognized thatfilms can “produce a huge positive impact on the tourism industry by helping to position and market the country”. In the past, the stunning Jordanian natural land-scapes, of which Petra is paramount, were the stage for a number of films, such as “Lawrence of Arabia” (1962) and “Indiana Jones and the Last Crusade” (1989).
Indeed, the touristic potential of Jordan is still to be explored. According to the United Nations World Tourism Organization, the country received 2,987 mil-lion visitors in 2005, representing a growth of 4.7 per cent over that of the previous year but no more than a 7.6 per cent market share in the Middle East.The forecasts are matched by those of the International Monetary Fund (IMF) issues paper, Jordan: Selected Issues and Statistical Appendix (IMF CountryReport No. 04/121, May 2004), which projects an average of 8 per cent annual growth in tourism in the whole of Jordan between 2007 and 2009.
By Ana Carla Fonseca Reis, Garimpo de Solucoes, economia, cultura & desenvolvimiento.
1.3 The multiple dimensions of the creative economy

industries are both knowledge intensive, requiring specific skillsand high-level qualifications of their workforce, and labourintensive, especially those with a high concentration of creativeinputs, as occurs, for example, in theatre or film production.The contribution of the creative industries to employment isusually significant; typically, they account for around 2 to 8 percent of the workforce in the economy, again depending on thescope of the sector as defined. The job-creation potential ofthese industries can be important in policy terms. For example,strategies aimed at redeveloping depressed industrial regions ina number of countries have looked to the establishment ofcreative industries as an effective way to boost employment.Furthermore, it is sometimes noted that the quality of jobs generated by the creative economy may provide greater levels ofemployee satisfaction than more routine occupations because ofthe commitment and sense of cultural involvement engenderedamong participants in a creative endeavour.
In the United States, for example, the creative indus-tries accounted for about 2.5 percent of total employment in2003, with numbers being spread across the whole range ofindustries. The largest concentration of creative workersoccurred among independent artists, writers and performersand in the publishing industry. Details are given in table 1.4.
Another important social aspect of the creative indus-
tries relates to their role in fostering social inclusion. At thegrass-roots level, the creative economy includes culturalactivities that can be important in linking social groups incommunities and contributing to social cohesion.Communities that are plagued by social tensions and con-flicts of various sorts can often be brought together throughshared participation in cultural rituals. Initiatives such ascommunity arts programmes build social capital by boosting
25C R E AT I V E E C O N O M Y R E P O R T 2 0 0 8
Concept a
nd c
onte
xt of th
e c
reative
econom
y
1
Box 1.5 Cirque du Soleil : A very simple dream
Cirque du Soleil® is an international company from Quebec dedicated to the creation, production and distribution of artistic works. Founded by GuyLaliberté in 1984, Cirque du Soleil was started with a group of 73 young artists and creative entrepreneurs with a shared spirit of offering its creatorsthe freedom to dream the wildest dreams and make them come true. Today, the business has over 3,800 employees worldwide, including close to 1,000artists, represents over 40 nationalities, and speaks 25 different languages. Cirque du Soleil's touring shows have made nearly 250 stops in over 100cities around the world and more than 70 million spectators have seen a Cirque du Soleil show since 1984.
Cirque du Soleil is primarily a creative content provider for a wide variety of unique projects. The organization’s mission is to invoke the imagination, pro-voke the senses and evoke the emotions of people throughout the world. Cirque du Soleil is a generator of new experiences, a laboratory and platformfor creators. It is constantly researching new artistic avenues and innovating within the organization. In 2007, Cirque du Soleil presented 15 differentshows around the world. The heart of its activity remains creating live shows and presenting them under big tops, in theatres or in arenas. Since 1984,close to 200 creators from the four corners of the globe have contributed their talents to this end.
Cirque du Soleil wants above all to take its place in society as a good citizen, with all the duties and responsibilities that go with citizenship. Since 1989,it has elected to give 1 per cent of its annual turnover to social and cultural programmes as a concrete expression of citizenship that goes beyond itsbusiness markets. Circus arts also offer young people the chance to open up, express themselves and use their marginalized status as a tool to makenew links with a society that often excludes them. This is how Cirque du Soleil has developed its international expertise and leadership in social circus.Cirque du Monde® is one of the greatest sources of pride for Cirque du Soleil. Set in motion in 1995, this programme is now operating in associationwith partners in social and cultural action such as Oxfam International and Jeunesse du Monde to assist young people in more than 80 communities inmore than 20 countries throughout the world.
Cirque du Soleil also remains an active member of the artistic community. It supports artists and artistic institutions in various ways and is involved inmany cultural organizations. The company offers financial support to innovative projects created by emerging artists and artistic companies.
By Charles Beraud, Office of the Senior Vice President of Marketing, Cirque du Soleil.
Table 1.4 Workers in creative industries in the United States, 2003
Creative industries
AdvertisingApplied designArchitectureBroadcastingFilm and videoMusic productionPerforming artsPublishingVisual artsOther (a)Total – creative industriesTotal – all industries
No. of workers (000)
429428296320142
41159700122611
3,250132,047
Proportion ofworkforce (%)
0.30.30.20.20.10.00.10.50.10.52.5
100.0
Note: (a) Includes independent artists, writers and performers in creative industries.Source: United States Census Bureau, quoted in the OECD study (2007:46).

26 C R E AT I V E E C O N O M Y R E P O R T 2 0 0 8
the ability and motivation of people to become engaged incommunity life and inculcating skills that can be usefullyemployed in local creative industries. Furthermore, creativeactivity can be shown to be important for individual healthand psychological well-being.
As many women work in the production of arts andcrafts, fashion-related areas and the organization of culturalactivities, the creative economy can also play a catalytic rolein promoting gender balance in the creative workforce, particularly in developing countries. It can also facilitategreater absorption of some categories of generally marginal-ized talented workers involved in creative activities in theinformal sector of the economy.
In addition, the creative economy has important relation-ships with the educational systems in both developed and devel-oping countries. In schools, the role of the arts in forming chil-dren’s social attitudes and behaviours is well recognized. In adulteducation, many possibilities exist for using education in cultureand the arts to enhance understanding of society and its functions.There is a two-way relationship between the education system andthe creative industries. On the one hand, education and traininginstitutions are responsible for turning out individuals with theskills and motivation to join the creative workforce. On the otherhand, the creative industries provide the necessary artistic and cul-tural inputs into the education system to facilitate students’ edu-cation in the society in which they live and, in the longer term, tobuild a more culturally aware population.
1.3.3 Cultural aspects
Whether the term “culture” is interpreted in ananthropological sense to mean the shared values and tradi-tions that identify a community or a nation and bind ittogether or whether it takes a more functional sense to meanthe practice of the arts, the creative economy as a purveyorof creative goods and services clearly has profound culturalimplications. Perhaps these effects are best summarized bythe proposition that cultural activities give rise to both economicand cultural value; it is the latter that provides the distinctivecontribution that these products make to individuals, to theeconomy and to society. From a policy perspective, the genera-tion of cultural value alongside economic value from the operation of the creative industries is relevant because it servesthe cultural objectives of society, which stand alongside theeconomic objectives of a government and are reflected in thebroad-ranging reach of its cultural policy. The cultural value of
identity is especially important here, whether understood at thelevel of a nation, a region or a city, town or village or whetherit is expressed in terms of some other grouping.
Diversity is a cultural dimension of the creative indus-tries that has become more prominent in recent years. Asprocesses of globalization continue, the value of culturaldiversity has been more sharply defined and the role of thecreative industries in promoting it has been more clearlyunderstood. The Universal Declaration on Cultural Diversityadopted by UNESCO in 2001 sees diversity as beingembodied in the “uniqueness and plurality” of the identitiesof various societies and groups, a common heritage ofhumankind. Since culture itself is intrinsic to the realizationof human aspirations, it is argued that cultural diversity willbe an important factor in promoting economic, social andcultural development. These sentiments were in turn givensubstance in the Convention on the Protection andPromotion of the Diversity of Cultural Expressions men-tioned earlier, where the cultural industries are specificallyidentified as essential to the achievement of the benefits ofcultural diversity in developed and developing countries alike.
1.3.4 Sustainable development
The creative industries also contribute to sustainabledevelopment. It is becoming increasingly recognized that theconcept of “sustainability” has a larger scope beyond simplyits application to the environment. The tangible and intangiblecultural capital of a community, a nation or a region of theworld is something that must be preserved for future gener-ations just as natural resources and ecosystems need to besafeguarded to ensure continuation of human life on theplanet. Cultural sustainability implies a development processthat maintains all types of cultural assets, from minority languages and traditional rituals to artworks, artefacts andheritage buildings and sites. It is the creative industries thatprovide the services and the investments necessary for culturallysustainable development paths to be followed.
Furthermore, creative industries are environmentallyfriendly. Since the primary input for creative activities is creativ-ity rather than natural resources as in the case of mining or landin the case of agriculture and the production of creative prod-ucts is usually less dependent on heavy industrial infrastructure,policies for enhancing creative capacities are in principle compatible with objectives of environmental protection.
Concept
and c
onte
xt o
f th
e c
reati
ve e
conom
y
1

1.4.1 Need for concerted interministerial policies
The creative economy extends into a wide range ofareas of political responsibility and government administra-tion. Although many governments have set up specific ministries, departments or specialized units to deal with thecreative industries, almost all areas of government policyhave some sort of interaction with these industries, includingin the following fields:
■ economic development: as noted above, creative industries canbe a significant contributor to national economic growth,making them a focus of interest on the part of treasuries,ministries of finance and planning departments;
■ trade: creative goods and services comprise an importantelement in the international trade of most countries andthus come under the policy surveillance of ministries oftrade, foreign affairs and international relations;
■ regional growth: the creative sector may be a specific target for devel-opment strategies in the context of regional economic planning;
■ labour: as noted earlier, the employment effects of the creative industries are significant, making them an area ofinterest in labour-market policy;
■ domestic and foreign investment: private investment in creativeindustries may be encouraged or channelled in certaindirections by specific fiscal or regulatory measures;
■ technology and communications: given the importance of newcommunication technologies to the growth of the creative
27C R E AT I V E E C O N O M Y R E P O R T 2 0 0 8
Concept a
nd c
onte
xt of th
e c
reative
econom
y
1
Box 1.6 Economics of the museum district of Paris
The economic spin-offs from museums are important. They are even more significant in the big cities, such as Paris.
In 1998, nearly 12 million tourists came to Paris for various reasons: cultural, business, and recreational, among others. "Museum tourists" were definedwithin this group as those visiting at least three museums or similar institutions. Given the difficulty of identifying these visits when admission is some-times free, two hypotheses were constructed: a low hypothesis, according to which 2.98 million tourists had visited the museums of the Louvre, Versaillesand La Villette or Orsay, and a high hypothesis, according to which 4.2 million tourists had visited the Eiffel Tower, the Louvre and Versailles (Greffe, 1999).
These tourists behaved differently depending on whether they were French or foreign. They did not spend the same number of nights in Paris.1 In addi-tion, their daily spending patterns were not the same: a French tourist was assumed to spend on average €121 a day for accommodation, transporta-tion and entrance fees while a foreign tourist would spend around €151, with substantial differences from one person to the next.2 From this, we derivedoverall spending of €1.17 billion under the low hypothesis and €1.62 billion under the high hypothesis.
We then had to apply a multiplier coefficient to take account of the effect of this spending on the incomes of hotel, museum and transportation workerssince these incomes would be spent and passed on through other economic sectors successively. For this purpose, we selected Myerscough’s multipli-er coefficient for London (1.4) as one of the most plausible. Total spending, then, was €1.64 billion under the low hypothesis and €2.26 billion under thehigh hypothesis.
It was then necessary to add in the spending on souvenirs or luxury goods that, because they are not generally produced in Paris, would not have a mul-tiplier effect on the immediate territory but might contribute to creating jobs elsewhere in the country. Based on the same surveys, we assumed averagesouvenir spending of €45.45 for a French tourist and €75.75 for a foreign tourist. This resulted in total spending of €1.84 billion under the low hypothe-sis and €2.64 billion under the high hypothesis. If the cost of creating one job in the services sector is around €40,000, this amount represents a total of43,000 jobs created or maintained. If we take a lower figure (€30,000) as the cost for creating a service job, the figure for employment created or main-tained is 86,000. The first figure seems considerably more plausible since we must first deduct from this total spending the amount spent on materials.
The bottom line from this type of analysis, which relies on many hypotheses, each of which reduces the reliability of the final outcome, is that the amountof this spending and the number of jobs created are very significant.3
1 On average, two nights for the first group and three nights for the second. The amount of their daily spending varied with their country of origin. The French/foreign splitamong tourists was 30 per cent/70 per cent: under the low hypothesis, there were 6.3 million foreign-tourist overnights and 1.8 million French-tourist overnights, andunder the high hypothesis, the respective figures were 8.6 million and 2.6 million.
2 Higher spending by Americans and Japanese offset by far the lower spending of tourists from developing countries.3 In this particular case and for the particular year in question, this amount was higher than total government spending on heritage throughout France, and the number of
jobs was nearly double that in the publicly assisted hospitals of Paris.
By Xavier Greffe, Professor of Economics, University of Paris I – Panthéon-Sorbonne.
1.4 The cross-cutting nature of creative industries

There is no doubt that, whether viewed from a globalor a national perspective, the creative economy – however itis defined – is growing, and growing rapidly. Data for thebroadest conceptualization of the creative economy showthat in the 1990s in OECD countries, it grew at an annualrate that was more than twice that of the service industriesoverall and more than four times that of manufacturing.22
For the creative sector more narrowly defined, statistics onoutput growth in a number of countries over the past 5, 10or 15 years show a similar pattern.
In the period 1997-2004, output of the creative indus-tries in the United Kingdom, measured as value added, grew
at 5 per cent per annum compared to 3-per cent growth forthe rest of the economy (DCMS, 2006). Employmentgrowth was also substantial. In the United Kingdom, employ-ment grew approximately twice as fast in the creative sector aselsewhere over the last decade, while in the cultural sector ofEurope as a whole, the average number of employed personsgrew by about 3 to 5 per cent annually in the period from1995 to 2000, with significantly higher rates of growth insome countries (Wiesand and Sondermann 2005:9), point-ing again to generally stronger employment growth in the cre-ative industries than elsewhere in the economy.
In many advanced economies, the creative economy is
28 C R E AT I V E E C O N O M Y R E P O R T 2 0 0 8
sector, the regulation (or deregulation) of telephone services,the Internet, broadband, satellite communications, etc., allhave important implications for the creative industries;
■ culture: the core functions of the creative arts are frequentlysupported by governments in pursuit of both economicand cultural objectives;
■ tourism: as noted earlier, in a number of countries, there isa close association between the creative industries – partic-ularly the performing and visual arts and the provision ofheritage services – and the contribution of tourism to theeconomic viability of towns, cities and regions;
■ social affairs: policies dealing with poverty alleviation, socialtensions among minorities, youth and gender issues canbe tackled through the creative economy;
■ education: vocational training for the workforce of the creative industries is a matter of increasing interest as theindustries expand and evolve. The more general aspects ofarts in education are also relevant, as discussed earlier.
1.4.2 Need for dialogue with multiple stakeholders
In addition to the cross-cutting nature of political andadministrative responsibilities, there is also a similar multi-plicity of levels of involvement if one looks at the varioussectors of the economy with which the creative industries areengaged. Individuals and organizations involved in culturalactivities and active in the creative economy operate in the
following areas:
■ the public sector (public cultural institutions such asmuseums, galleries, public service broadcasting organiza-tions, etc.);
■ the for-profit private sector (a wide range of commercialoperations in all fields of culture and creative productionand distribution);
■ the non-profit sector (theatre and dance companies, festivals,orchestras and other music ensembles, craft cooperatives,etc., some of which may receive government financial incentives); and
■ civil society (advocacy non-governmental organizations(NGOs), foundations, academia, artistic and creator’sprofessional associations, sectoral organizations, etc.).
1.4.3 Need for institutional mechanisms
The multidimensionality and cross-cutting nature ofthe creative industries mean that there is an inevitable ten-dency for policy strategies to become fragmented. If thisleads to the application of piecemeal measures, there may bea danger that the policy strategies are contradictory in theirimpact. It is clear that an integrated approach towardsenhancing the creative industries and hence the creativeeconomy is needed in policy-making. This approachrequires effective institutional mechanisms for coordinationof policies across the various agencies with responsibilitiesin this area.
Concept
and c
onte
xt o
f th
e c
reati
ve e
conom
y
1
22Howkins (2001:xvi).
1.5 The creative economy in the developed world

29C R E AT I V E E C O N O M Y R E P O R T 2 0 0 8
Concept a
nd c
onte
xt of th
e c
reative
econom
y
1Table 1.5 Contribution of the European cultural and creative sector to the European national economies
AustriaBelgiumCyprusCzech RepublicDenmarkEstoniaFinlandFranceGermanyGreeceHungaryIrelandItalyLatviaLithuaniaLuxembourgMaltaNetherlandsPolandPortugalSlovakiaSloveniaSpainSwedenUnited KingdomBulgariaRomaniaNorwayIceland
Total European Union (25 countries)
Total 30 countries*
Turnover, 2003 (all sectors included)
(€ million)
14,60322,174
3185,577
10,111612
10,67779,424
126,0606,8754,0666,922
84,359508759673
2333,372
6,2356,3582,4981,771
61,33318,155
132,682884
2,20514,841
212
636,146
654,288
Value added to national GDP(all sectors included) (%)
1.802.600.802.303.102.403.103.402.501.001.201.702.301.801.700.600.202.701.201.402.002.202.302.403.001.201.403.20
0.70
* The countries covered by the statistical analysis include the 25 Member States of the European Union plus the two countries that joined in January 2007 (Bulgaria and Romania)plus the three European Economic Area countries of Iceland, Norway and Liechtenstein.
Source: Eurostat and AMADEUS/Data elaborated by Media Group.
now recognized as a leading sector in generating economicgrowth, employment and trade. In Europe, the creative econo-my generated a turnover of 654 billion euros in 2003, increas-ing 12 per cent faster than the overall economy and employingabout 4.7 million people.23 In the United Kingdom in 2004,the creative industries contributed 8 per cent of grossdomestic product (GDP) and generated nearly 2 millionjobs. Denmark is another remarkable example where the cre-ative economy accounted for 5.3 per cent of GDP, providing12 per cent of total jobs and 16 per cent of total exports.
The creative industries contribute to output, valueadded, income and the balance of payments. Typically, theseindustries have contributed somewhere between 2 and 6 percent of GDP, depending on the definitions used. For example,the cultural sector provided about 3.5 per cent of GDP inCanada and almost 6 per cent of gross value added (GVA)in the United Kingdom, as shown in table 1.6.
This chapter has been concerned primarily with theevolution of the basic concepts involved in any considerationof the creative sector. This final section turns from conceptsto practice and considers some more detailed empirical evidence for some of the propositions discussed earlier.
Some representative data are shown in tables 1.6 to 1.8.Table 1.6 shows the contribution of the cultural industries toGDP or GVA for five countries in various years. Table 1.7indicates the contribution of the cultural sectors of eightEuropean countries to the economy. It should be noted thatin four of the eight countries shown, the creative industriescontributed more than 5 per cent of GVA, and in two coun-tries, they contributed 10 per cent or more of employment.
Comparisons with other sectors of the economiesconcerned are shown in table 1.8 and table 1.9 on developedeconomies.
23See The Economy of Culture in Europe, study prepared for the European Commission by Kea, European Affairs, Brussels, 2006.
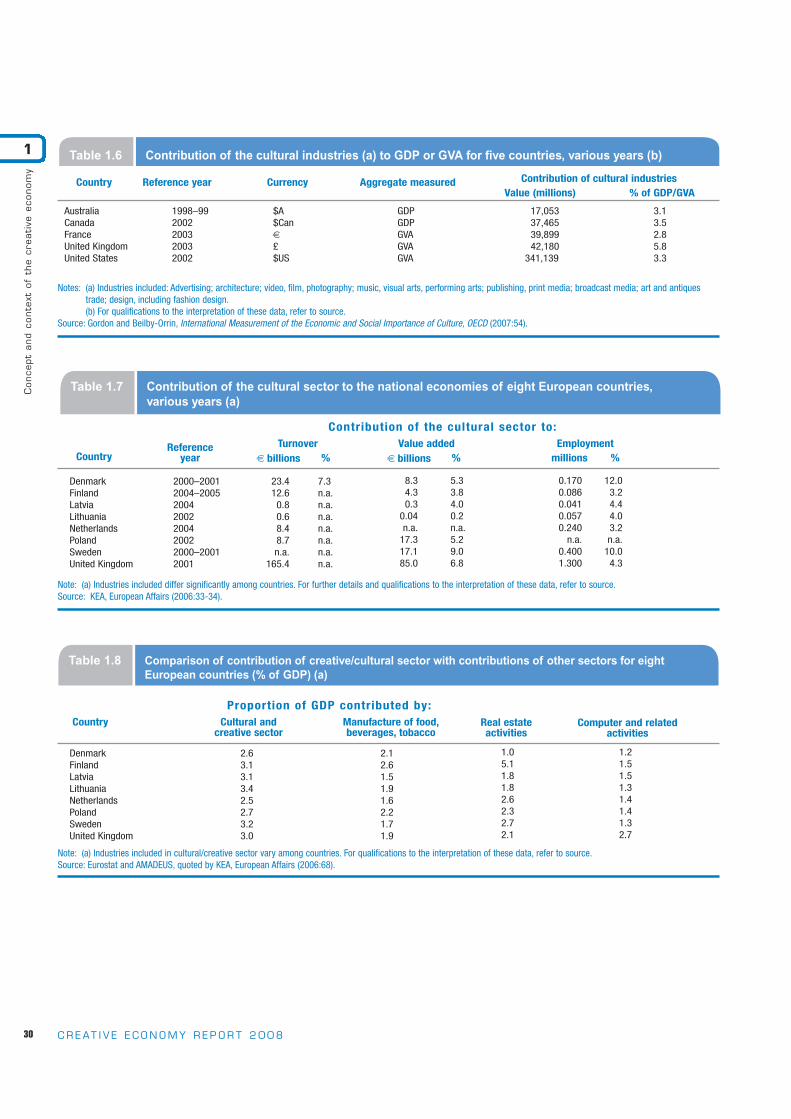
30 C R E AT I V E E C O N O M Y R E P O R T 2 0 0 8
Concept
and c
onte
xt o
f th
e c
reati
ve e
conom
y
1 Table 1.6 Contribution of the cultural industries (a) to GDP or GVA for five countries, various years (b)
Notes: (a) Industries included: Advertising; architecture; video, film, photography; music, visual arts, performing arts; publishing, print media; broadcast media; art and antiquestrade; design, including fashion design.(b) For qualifications to the interpretation of these data, refer to source.
Source: Gordon and Beilby-Orrin, International Measurement of the Economic and Social Importance of Culture, OECD (2007:54).
Country
AustraliaCanadaFranceUnited KingdomUnited States
Reference year
$A$Can€£$US
Currency Aggregate measured
GDPGDPGVAGVAGVA
1998–992002200320032002
Value (millions)Contribution of cultural industries
17,05337,46539,89942,180
341,139
% of GDP/GVA
3.13.52.85.83.3
Table 1.7 Contribution of the cultural sector to the national economies of eight European countries, various years (a)
Note: (a) Industries included differ significantly among countries. For further details and qualifications to the interpretation of these data, refer to source.Source: KEA, European Affairs (2006:33-34).
CountryTurnover Value added Employment
€ billions € billions millions% % %
DenmarkFinlandLatviaLithuaniaNetherlandsPolandSwedenUnited Kingdom
Referenceyear
23.412.6
0.80.68.48.7n.a.
165.4
7.3n.a.n.a.n.a.n.a.n.a.n.a.n.a.
8.34.30.3
0.04n.a.
17.317.185.0
5.33.84.00.2n.a.5.29.06.8
0.1700.0860.0410.0570.240
n.a.0.4001.300
12.03.24.44.03.2n.a.
10.04.3
2000–20012004–200520042002200420022000–20012001
Contribution of the cultural sector to:
Table 1.8 Comparison of contribution of creative/cultural sector with contributions of other sectors for eight European countries (% of GDP) (a)
Note: (a) Industries included in cultural/creative sector vary among countries. For qualifications to the interpretation of these data, refer to source.Source: Eurostat and AMADEUS, quoted by KEA, European Affairs (2006:68).
Country Manufacture of food,beverages, tobacco
Real estateactivities
Computer and relatedactivities
DenmarkFinlandLatviaLithuaniaNetherlandsPolandSwedenUnited Kingdom
2.63.13.13.42.52.73.23.0
2.12.61.51.91.62.21.71.9
1.05.11.81.82.62.32.72.1
1.21.51.51.31.41.41.32.7
Cultural andcreative sector
Proportion of GDP contributed by:

31C R E AT I V E E C O N O M Y R E P O R T 2 0 0 8
Concept a
nd c
onte
xt of th
e c
reative
econom
y
1
Tab
le 1
.9E
stim
ates
of
the
con
trib
uti
on
of
crea
tive
ind
ust
ries
to
GD
P fo
r fiv
e O
EC
D c
ou
ntr
ies
Crea
tive
indu
stri
esCr
eativ
e in
dust
ries
A$
mill
ions
% GD
PC$
mill
ions
% GD
P€
mill
ions
% GVA
£m
illio
ns% GVA
US$
mill
ions
% GVA
1998
-199
9A
ustr
alia
2002
Cana
da20
03Fr
ance
2003
Unite
d Ki
ngdo
m20
02Un
ited
Stat
es
Adve
rtis
ing
Arch
itect
ure
Vide
o,fil
m a
nd p
hoto
grap
hyM
usic
& t
he v
isua
l & p
erfo
rmin
g ar
tsPu
blis
hing
/writ
ten
med
ia
of w
hich
:prin
ting
Radi
o an
d TV
(bro
adca
stin
g)Ar
t an
d an
tique
s tr
ade
Des
ign
(incl
udin
g de
sign
er f
ashi
on)
Craf
ts
Tota
l
Tota
l eco
nom
y (G
DP
or G
VA)
Libr
arie
s (in
clud
es a
rchi
ves)
Mus
eum
sH
erita
ge s
ites
Elec
tron
ic g
ames
2,46
4*78
8*2,
397*
952*
6,59
0*5,
640*
3,47
4* 74*
313* na
*
17,0
53*
542,
831
792,
2 #
716,
4 # na na
0.50
0.10
0.40
0.20
1.20
1.00
0.60
0.00
0.10 na
3.10
100.
00 … … na na
2,85
6*1,
084*
3,90
9*2,
576*
19,4
27*
na5,
305*
1,08
2*1,
226* na
37,4
65*
1,06
9,70
3
1,23
6*55
0*67
2* na
0.30
0.10
0.40
0.20
1.80 na
0.50
0.10
0.10 na
3.50
100.
00
0.10
0.10
0.10 na
11,8
58*
2,52
4*5,
155*
3,42
5*11
,283
*4,
851*
4,87
8*41
3*36
3* na
39,8
99*
1,43
4,81
2 na14
8* na
8,16
9*
0.80
0.20
0.40
0.20
0.80
0.30
0.30
0.00
0.00 na
2.80
100.
00 na0.
00 Na
0.60
5,00
04,
000
2,20
03,
700
14,9
506,
350
6,20
050
05,
630 na
42,1
80*
732,
395 na na na
20,7
00
0.70
0.50
0.30
0.50
2.10
0.90
0.90
0.10
0.70 na
5.80
100.
00 na na na
2.80
20,8
35*
19,1
11*
39,0
76*
30,2
94*
116,
451*
45,6
62*
101,
713*
195*
13,4
63*
na
341,
139*
10,4
69,6
01
1,11
2*3,
294*
508*
129,
636*
0.20
0.20
0.40
0.30
1.10
0.40
1.00
0.00
0.10 na
3.30
100.
00
0.00
0.00
0.00
1.20
* =
OEC
D es
timat
e#
= in
com
e da
ta
Cave
at:T
hese
dat
a ar
e in
itial
est
imat
es a
nd s
houl
d be
inte
rpre
ted
with
ext
rem
e ca
utio
n,be
arin
g in
min
d th
at (a
) the
y ar
e ba
sed
on n
atio
nal c
ultu
ral i
ndus
try
typo
logi
es; (
b) th
e co
nten
ts o
f ind
ivid
ual h
eadi
ngs
are
diffe
rent
from
one
cou
ntry
to a
noth
er; a
nd (c
) tre
atm
ent o
f tax
es s
uch
as th
e va
lue
adde
d ta
x is
not
con
sist
ent a
cros
s co
untri
es.I
n or
der t
o m
aint
ain
cons
iste
ncy
betw
een
the
num
erat
or a
nd th
e de
nom
inat
or w
hen
calc
ulat
ing
the
perc
enta
ges,
the
tota
l GVA
or G
DPha
s be
en u
sed
as a
ppro
pria
te.
Aust
ralia
:Dat
a ar
e OE
CD e
stim
ates
der
ived
from
out
put b
y pr
oduc
t and
by
indu
stry
dat
a pr
esen
ted
in th
e Au
stra
lian
Bure
au o
f Sta
tistic
s (A
BS),
Arts
and
Cul
ture
in A
ustra
lia:A
Sta
tistic
al O
verv
iew
.Rat
ios
of v
alue
add
ed to
out
put w
ere
deriv
ed fr
om v
ario
us A
BS S
ervi
ce In
dust
ries
Surv
eys
avai
labl
e on
the
ABS
web
site
.Ca
nada
:Sta
tistic
s Ca
nada
est
imat
es a
t ww
w.s
tatc
an.c
a/en
glis
h/fre
epub
/87-
008-
GIE/
them
/eco
nom
icco
nt.h
tm.T
hese
are
upd
ates
to th
e ta
bles
pre
sent
ed in
Sta
tistic
s Ca
nada
,Eco
nom
ic C
ontri
butio
n of
Cul
ture
in C
anad
a,De
cem
ber 2
004
(Cat
alog
ue n
o.81
-595
-MIE
– n
o.02
3) a
lso
avai
labl
e on
the
Stat
istic
s Ca
nada
web
site
.The
cat
egor
y “S
uppo
rt ac
tiviti
es”
used
in th
e Ca
nadi
an fr
amew
ork
has
been
dis
tribu
ted
prop
ortio
nally
acr
oss
the
othe
r sec
tors
.Fr
ance
:Dat
a ar
e OE
CD e
stim
ates
.The
y w
ere
deriv
ed fr
om N
atio
nal I
nstit
ute
for S
tatis
tics
and
Econ
omic
Stu
dies
(INS
EE) t
urno
ver d
ata,
supp
lied
by th
e Fr
ench
Min
istr
y of
Cul
ture
and
Com
mun
icat
ions
,by
appl
ying
val
ue a
dded
to tu
rnov
erra
tios
take
n fro
m IN
SEE
and
OECD
dat
a.To
tal G
VA h
as b
een
take
n fro
m IN
SEE
natio
nal a
ccou
nts
data
.Un
ited
King
dom
:UK
DCM
S es
timat
es a
re b
ased
on
Unite
d Ki
ngdo
m O
ffice
for N
atio
nal S
tatis
tics
data
take
n fro
m th
e DC
MS
Crea
tive
Indu
strie
s Ec
onom
ic E
stim
ates
Sta
tistic
al B
ulle
tin,O
ctob
er 2
005
- Re
vise
d Ve
rsio
n at
ww
w.c
ultu
re.g
ov.u
k/gl
obal
/res
earc
h/st
atis
tics_
outp
uts/
crea
tive_
indu
strie
s_ec
o_es
t.htm
.The
tabl
e de
parts
from
the
equi
vale
nt D
CMS
tabl
e in
that
the
activ
ities
of t
he p
rintin
g in
dust
ry h
ave
been
add
ed to
"Pu
blis
hing
" an
d th
e "T
otal
of
abov
e".T
his
has
been
don
e to
enh
ance
cro
ss-c
ount
ry c
ompa
rabi
lity.
Unite
d St
ates
of A
mer
ica:
Data
are
OEC
D es
timat
es.T
hey
wer
e de
rived
from
Bur
eau
of E
cono
mic
Ana
lysi
s an
d Un
ited
Stat
es B
urea
u of
the
Cens
us d
ata.
Thes
e es
timat
es s
houl
d be
use
d w
ith p
artic
ular
cau
tion
give
n th
e nu
mbe
r of
assu
mpt
ions
app
lied
in th
eir p
repa
ratio
n.
Sour
ce:G
ordo
n an
d Be
ilby-
Orrin
,Int
erna
tiona
l Mea
sure
men
t of t
he E
cono
mic
and
Soc
ial I
mpo
rtanc
e of
Cul
ture
,OEC
D (2
007)
.
*

32 C R E AT I V E E C O N O M Y R E P O R T 2 0 0 8

The MDGs are an expression of the overall interna-tional consensus for the global development agenda in thecoming years. There are eight goals with specific time-bound targets to be reached by 2015. These goals are to:(1) eradicate extreme poverty and hunger; (2) achieve uni-versal primary education; (3) promote gender equality andempower women; (4) reduce child mortality; (5) improvematernal health; (6) combat HIV/AIDS, malaria andother diseases; (7) ensure environmental sustainability; and(8) develop a global partnership for development.
The MDGs address development challenges not as aseparate, but as an inherent, part of the global economy andsocieties. The goals encompass the holistic approach todevelopment echoed in concepts such as the “human development index”, “liveable societies” and “gross nationalhappiness”. The full realization of these goals necessitatesinnovative and cross-sectoral approaches to development
and the serious consideration of issues such as culture, envi-ronment and social development.
The creative sectors of developing economies havesignificant potential to contribute towards the achievementof at least the following six specific components of theMDGs:
■ Poverty eradication and reduction of inequality.The manifestationsof a people’s culture – the customs, rituals, artefacts,music and so on – permeate the daily lives of men,women and children and constitute a significant elementin providing for their happiness and well-being. Anystrategy that uses culture as a means of economic devel-opment and empowerment has the capacity to reach outto all members of a community and to affect their livesin some way regardless of their socioeconomic status. Itfollows that sustainable development of the creative
33C R E AT I V E E C O N O M Y R E P O R T 2 0 0 8
The d
eve
lopm
ent d
imensio
n
2
CH
AP
TER
2 The development dimension
2.1 Policy implications: The Millennium Development Goals
Most of the attention in the debate about the creative economy around the world has been paid to developed economies, where creative industries are wellestablished and where participation in global markets forcreative products is strong. In developing economies, how-ever, the situation is more nuanced. Asian countries, led byChina, have experienced rapid growth in creative capacitiesand have benefited from greater competitiveness of thesecreative goods and services in world markets over the lastdecade. By contrast, in other areas of the developing world,the creative economy has not been able to realize its fullpotential and the poorest countries remain marginal playersin world markets for creative goods and services. Yet thereexists a wide range of creative talent in developing countriesand significant levels of intangible cultural capital such astraditional and cultural expressions on which to draw in
producing creative goods and services for domestic andinternational markets. This chapter reviews the develop-ment dimensions of the creative economy, looking at theeconomic and cultural linkages and their implications andthen surveying the state of the creative economy in regionsof the developing world.
The analysis is presented in the context of theMillennium Development Goals (MDGs) since they rep-resent the international policy environment within whichnational strategies for advancing the creative economy indeveloping countries are expected to be implemented.Chapter 9 will further elaborate on the multilateralprocesses and ongoing policy action under implementationby United Nations bodies and the international community pursuant to the Millennium Declaration.
34 C R E AT I V E E C O N O M Y R E P O R T 2 0 0 8
industries at the local level, especially if it targets the arts,creative activities and the growth of small business, will becapable of making an important contribution to povertyeradication and the reduction of inequality.
Contrary to more traditional, larger-scale industrialdevelopment, the business unit in the creative-industriessector is typically quite small, often comprising familybusinesses. This means that the product originates inmany diverse units while the production is mostly on asmall scale. In this respect, the creative industries areparticularly suited to contribute to community regener-ation and correspond well with the practice in more traditional societies. The creative industries not onlyoffer the possibility of income-generation but they alsoprovide opportunities for employment that are easier toreconcile with family and community obligations. Thesmaller business unit is also more closely affiliated tothe informal economy and to the private-sector invest-ment potential that are found in the poorer segments ofthe economy. It will therefore provide a more effectivevehicle for targeted economic development initiativeswhose focus is poverty alleviation.
■ Gender equality. The production of creative goods and serv-ices provides many opportunities for women to participatein creative activity that yields both economic and culturalrewards. It can be seen, therefore, that a development strat-egy involving the creative industries is likely to advance theMDG of enhancing equality in economic and socialopportunity for women in developing economies.
■ Sustainable development strategies. The integration of cultureinto strategies for moving the economies of developingcountries onto a sustainable development path is clearlyserved by promotion of the creative industries. As alreadyobserved, one of the most attractive attributes of theseindustries is their potential for linking economic with cultural development in a way that can not only generatesubstantial economic rewards but also yield significantcultural payoffs by stimulating creativity and civic engage-ment, advancing cultural awareness and promoting thebenefits of cultural diversity.
■ Global partnerships for development. One of the key prospectsfor advancing the achievement of the MDG concernedwith encouraging international cooperation to assist the
developing world lies in a willingness of developed countries to take positive steps to expand their imports ofcreative goods from Southern countries. A number ofavenues exist for such cooperation, including culturalexchanges of various sorts, especially when the exchangesfunction as a prelude to opening up opportunities for cultural trade. Furthermore, it is not only North-Southpartnerships that are implicated here; there are significantprospects for South-South cooperation in the creative-economy field as well.
■ Strategies for the social inclusion of youth. It has been found thatthe arts and cultural activity can be used successfully as a means of engaging in productive work young people whowould otherwise be unemployed and perhaps at risk ofantisocial conduct. Creative work can provide a sense ofpurpose in otherwise seemingly futile lives, and engage-ment in artistic production of various sorts can raise self-esteem and social awareness. In this respect, the fosteringof locally based creative industries may provide productiveopportunities for young people and, in rural areas, help todiscourage the drift to the cities that so often contributesto the problem of marginalized youth.
■ Spreading access to new communications. As noted above, devel-opment of the creative economy is strongly associatedwith new communication technologies. Hence as the creative industries expand in any country or region, so alsodo capabilities for using such technologies not just inthose industries themselves but also more widely.Fostering the creative industries can thus be seen as con-sistent with the MDG target of making the benefits ofnew technologies, especially ICTs, more generally availablein the developing world.
An example of the way in which development strategies can contribute to the achievement of MDGs isprovided by the Creative Industry Development Frameworkin the Gauteng province of South Africa. This frameworkmakes explicit the contribution of the creative industries tosocial development goals such as community participationin cultural activities; regional integration across Africa;poverty alleviation, particularly in previously disadvantagedcommunities and among the youth; and public-private part-nerships in community-based cultural programmes such asindigenous dance and music, carnivals and festivals.
The d
eve
lopm
ent
dim
ensi
on
2

The d
eve
lopm
ent d
imensio
n
2The approach advocated in this Report differs from, yet
complements, that of “culture and development”. The creative-economy perspective stresses the direct economic impact ofcultural production, not simply its indirect effects on, for exam-ple, tourism. As a consequence of this added emphasis, care isneeded in regard to policy objectives and evaluation. In partic-ular, it must be recognized that policies involving culture andthe creative economy may have different types of outcomes;some may even include competing priorities. Thus, it is impor-tant that policy objectives be clear and not overly ambitious intheir claims so that they can be fairly evaluated.
Economic imbalances and social inequalities remain visi-ble challenges of the globalizing world despite the technologicaladvances and the prosperity that have characterized the growthof the world economy in recent years. A number of developingeconomies have grown faster than developed economies over thelast decade but not fast enough to narrow the absolute per capi-ta income gap. Poverty remains an issue to be tackled not onlyin the least developed countries (LDCs) but also in many mid-dle-income countries and economies in transition. How canthese long-lasting challenges be overcome effectively?
The time has come to go beyond economics and lookfor a more comprehensive holistic approach that takes intoaccount the realities and specificities of countries, recognizingtheir cultural differences, identities and real needs. It seems clear
that the world needs to adapt to new circumstances by bring-ing issues relating to culture and technology into the main-stream of development thinking.1 Development strategies mustbe updated to cope with far-reaching cultural, economic, socialand technological shifts that are rapidly changing the world.Development models strictly based on conventional economictheories have failed to redress these asymmetries. Therefore,neo-liberal approaches should be revisited in order to reinforcepolicy coherence by introducing concerted multidisciplinaryand multicultural policies.
2.2.1 Multifaceted aspects of the creative economy
The development dimension of the creative economyhas complex interactions, as depicted in figure 2.1. A number of concepts are embedded in the dynamics of thecreative economy. Furthermore, the policy framework of thecreative economy is multidisciplinary in nature, ideally call-ing for integrated cross-cutting public policies requiringinterministerial actions. Institutional mechanisms are neededto facilitate synchronized and mutually supportive economic,social, cultural and technological policies.
2.2.2 Cultural and technological linkages
The creative economy is omnipresent in ourdaily life whether through education or work aswell as in moments of leisure and entertainment.In the contemporary society dominated byimages, sounds, texts and symbols, connectivity isinfluencing our attitudes and is an integral partof our lifestyles. In this regard, from the anthro-pological viewpoint, cultural and historical valuesare intertwined, forging the essence of culturaldiversity so debated nowadays. Moreover, owingto its intertemporal nature, the creative economyis able to assimilate traditional knowledge fromthe past as well as current technologies. However,it also requires a forward-looking vision capableof reacting to the rapid economic, cultural and
35C R E AT I V E E C O N O M Y R E P O R T 2 0 0 8
1 See E. Dos Santos, “The Creative Economy: Is It a Feasible Development Option?”, 2008.
Figure 2.1 Development dimension of the creative economy
Source: UNCTAD (Dos Santos, 2006).
Policy dimensionEconomic, technological,
cultural and social policies
Cultural/Historical values
Anthropological/aesthetic, ethnic and
cultural diversity IntertemporalPast traditions,
present technologies, future vision
Omnipresent Education, work,
leisure and entertainment
Society-inclusivePublic and private sectors, all social classes, profit and non-profit NGOs
MultidisciplinaryCulture, labour,
trade, technology,
education, tourism
2.2 The creative economy: Linkages and development implications

36 C R E AT I V E E C O N O M Y R E P O R T 2 0 0 8
technological shifts that are taking place in our society butthat are not always immediately perceived.
Emphasizing that human development requires morethan health, education, a decent standard of living andpolitical freedom, the UNDP Human Development Report20042 makes a case for respecting diversity and buildingmore inclusive societies by adopting policies that explicitly recognize cultural differences and multicultural policies.
2.2.3 Social interactions
Social aspects are also influential in the formulation ofpolicies to foster local creative economies with a view tomaximizing positive spillovers on employment and promot-ing social inclusion and cohesion. In developing countries,particularly in the LDCs, the creative economy can be a toolto attenuate social tensions. Creative activities, especiallythose associated with arts and traditional cultural festivities,are conducive to the inclusion of usually excluded minorities.
The creative economy can also facilitate greater absorptionof marginalized youth; in many cases, young people areinvolved in creative activities in the informal sector of theeconomy. Moreover, as many women work in the productionof arts and crafts, fashion-related areas and the organizationof cultural activities, the creative economy also plays a cat-alytic role in facilitating gender balance among the creativeworkforce. The creative economy can also be consideredsociety-inclusive: people from all social classes participate inthis economy, in some cases as producers but always as con-sumers of different creative products on different occasions.
Another feature of the creative economy is that it bringstogether several segments of society such as those stakeholdersinvolved in the public and private sectors as well as individualswith distinct interests – those in profit-making firms and non-profit organizations such as NGOs and civil society as awhole. The creative economy can serve as part of a moreresults-oriented development strategy for developing countriesif appropriate concerted public policies are put in place.
The d
eve
lopm
ent
dim
ensi
on
2
Box 2.1 South-South sharing of creative experiences
At the 2006 Pan-African Dance Festival held in Kigali, Rwanda, the UNDP Special Unit for South-South Cooperation sponsored the InternationalConference on Creative Economy for Development. The objective was ¨to promote the effective use of creativity as a source of wealth, a means of generating employment, and a significant factor in poverty reduction¨.
During this Conference, two NGOs from Africa, Maison des jeunes de Kimisagara from Rwanda and the Lake Victoria and Nyansa Creative Arts Associationfrom Kenya, were invited to participate in a partnership with a Brazilian NGO, Ação Comunitária do Brasil do Rio de Janeiro (ACB/RJ), to develop a pilotexperience based on the creative-economy principle of sharing experiences in order to put into practice what had been discussed.
Principal goals of the partnership
The partnership aimed to: undertake socio-cultural exchanges; create products and services that value and promote culture, the creative economy andinnovation; explore the possibilities of selling the goods and services on local and international markets in the context of fair trade; implement long-termrelationships between Southern countries in light of the work of the UNDP Special Unit for South-South Cooperation on the agenda of the creative econ-omy for development; improve the quality of life of many people living in developing countries; and contribute to preserving and protecting the culturalheritage of developing countries.
2 Human Development Report 2004: Cultural liberty in today’s diverse world, UNDP, New York. Available at: http://hdr.undp.org .
2.3 Interface between traditional knowledge, arts and the creative economy
The foundation of the creative industries in any coun-try is the traditional knowledge that underlies that country’sdistinctive forms of creative expression: the songs, dances,poetry, stories, images and symbols that are the unique her-
itage of the land and its people. This knowledge is kept aliveby written, oral and pictorial transmission of cultural tradi-tions from one generation to the next. Like any body ofknowledge, it does not stay still but is constantly interpreted,
The d
eve
lopm
ent d
imensio
n
2
37C R E AT I V E E C O N O M Y R E P O R T 2 0 0 8
Box 2.1 continued South-South sharing of creative experiences
Selected NGOs
Ação Comunitária do Brasil do Rio de Janeiro (ACB/RJ)Ação Comunitária do Brasil do Rio de Janeiro (ACB/RJ) was founded 41 years ago to promote and defend the rights of thousands of socially, economicallyand culturally excluded Brazilians. It focuses mainly on children, youth and their families who are in situations of vulnerability and/or personal and socialrisk, especially teenagers, young adults, women and Afro-Brazilian citizens. ACB/RJ undertakes socio-educational activities, including training workshopsand projects aimed at the achievement of professional qualifications, providing space for educational formation, work and income-generation. Such initiatives, which help to prepare individuals for entry into the labour market, adhere to the principles of fair trade and are oriented so that they providevisibility and value to local culture. In order to scale up and provide greater reach for its activities, the NGO has developed a strategy of working in aseries of networks, identifying specific organizations and social movements so as to establish partnership arrangements.
Lake Victoria and Nyanza Creative Arts Association (LAVINCA)Created in 1999, the objective of LAVINCA is to promote and create awareness of Kenyan arts and culture. Its programme includes projects that aim tobring poor artists together and offer an opportunity to share ideas and experiences. The association also was created to tackle social issues that affectthe youth of Kenya such as dropping out of school and poverty, and it intends to put in place mechanisms that will improve their quality of life. The NGOitself specializes in batik work, visual arts, sculpture (carving) and ornaments.
Maisons des Jeunes de Kimisagara (MJK), RwandaThe Ministry of Youth, Culture and Sports of Rwanda, in collaboration with the National Youth Council, decided in 1999 to create a centre that would helpthe youth of Rwanda to tackle various issues that they face on a daily basis, such AIDS, poverty, teen pregnancy and dropping out of school. The centre,Maison des Jeunes de Kimisagara (MJK), has a youth council named Giramahoro, which means “Have peace”. As of October 2006, this NGO had created partnerships with over 60 youth associations comprising various sports teams and different cultural troupes. In addition, it intends to supportcultural exchanges among the youth of Rwanda nationally and regionally.
Partnership exchanges
Three artists from the National Ballet of Rwanda and connected with MJK spent two weeks in Rio de Janeiro in November 2006 on an exchange programme of music and dance. The ACB/RJ cultural group chosen for the exchange was Kina Mutembua, which seeks to rescue and give value to Afro-Brazilian culture, especially banto manifestations. Its work integrates music, Afro dance and capoeira and includes the Orchestra of Berimbaus.
At the same time, ACB/RJ and two artists from LAVINCA from Kisumu, Kenya, spent 15 days exchanging experiences in the areas of fashion and style.During this period, the group developed images that were used for the conception of articles of clothing, decoration and stationery and exchanged information on silk-screen and batik techniques.
Principal achievements of the partnership
On 26 November 2006 following oral presentations, an art exhibit and a spectacle organized by the three NGOs – ACB/RJ, LAVINCA and MJK – were presented to the public attending the World Cultural Forum in Rio de Janeiro and the International Conference on Creative Economy for Development thatwas taking place in the same auditorium. The spectacle consisted of 45 minutes of choreography rich in music and percussion and including a mix ofRwandan and Afro-Brazilian dances performed by members of the Rwandan National Ballet and the ACB/RJ Berimbaus Orchestra. The mixture ofBrazilian songs and dances with the Rwandan drums called ingoma demonstrated that culture is a uniting force that can bring together in harmony different people from different places and cultures and create a thrilling performance. The Kenyan team, in collaboration with the Brazilian artists fromACB/RJ, has produced over 300 creative items using tie-dye, batik and silk screening techniques, some of which were presented at the same Forum. InJanuary 2007, this pilot experience was also presented at the World Social Forum in Nairobi.
Hopes for the future
ACB/JR hopes that this initial contact with African artists from Kenya and Rwanda will trigger a series of concrete activities and measures that will openmarkets for creative-economy goods and services in Africa and vice versa, strengthening the ties of friendship and cooperation between continents withso many similarities, differences and idiosyncrasies. The NGOs involved believe that it is fundamental to view initiatives of cooperation similar or identicalto this one as stages in an irreversible process where new schemes follow old ones. This would give continuity to a process of cultural exchange, socialinsertion and formation of fair markets integrated by aware consumers. These NGOs thus consider this partnership as an initial, yet important step on along path that ultimately will consolidate the creative economy as a strategy for attaining the desired goal of sustainable human development.
By Arnold Juma, Kenya; Erik Musanganya, Rwanda; and Marilia Pastuk, Brazil.

38 C R E AT I V E E C O N O M Y R E P O R T 2 0 0 8
reinterpreted, augmented and adapted to new formats. It isaccessed by the people in many different ways, serving as arich cultural resource from which a wide variety of creativeexpressions can be derived. Some of these are routine andeveryday in nature, such as traditional styles and patterns ofclothing; other cultural expressions are created and interpret-ed by artists using both traditional and modern skills to produce music, works of art, literature, performances, artsand crafts, and so on.
Altogether the transformation of traditional knowledgeinto creative goods and services reflects something significantabout the cultural values of the country and its people. At thesame time, the goods and services are also likely to have eco-nomic potential; they may be demanded by local consumers orthey may enter international marketing channels to satisfydemands from consumers in other countries. The essential fea-ture of the creative industries, which link the traditional knowl-
edge at one end of the chain with the ultimate consumer at theother end, is their capacity to serve both cultural and economic objectives in the development process. Chapter6 will present a broader analysis of matters relating to intel-lectual property, including traditional cultural expressions.
The linkages between traditional knowledge, culture,art and the economy can be illustrated with reference to thesorts of cultural festivals that occur regularly in many devel-oping countries in the Caribbean and Latin America. Thecarnival industries in countries such as Brazil, Colombia,Cuba, and Trinidad and Tobago, for example, have growninto significant contributors to the cultural and economiclife of these countries. The carnivals provide for a concentra-tion of live and recorded performance activity in music anddance that has considerable cultural significance for bothdomestic and international audiences. The festivals generatecultural value for local people who can enjoy their country’s
The d
eve
lopm
ent
dim
ensi
on
2
Box 2.2 Brazilian carnivals
The simple mention of carnival takes us to Brazil. But, as the poet and Bahian essayist, Antonio Risério, affirms,1 Brazil is not the “country of carnival”that is celebrated in the title of Jorge Amado`s famous novel, O País do Carnaval. Rather, it is a country of “many carnivals”, as described in CaetanoVeloso’s song. This is because, beyond pervasive commonalities, the Brazilian carnival has multiple dimensions and distinctive manifestations in differ-ent cities. Thus, we must abandon the inexact idea of one “Brazilian carnival” and speak about the carioca carnival in Rio de Janeiro, the carnivals ofRecife and Olinda in Pernambuco, and the Salvador carnival in Bahia, among others.
The carioca carnival, for example, is characterized by its appeal as a spectacle and its strong links to the tourism economy. Carnival in Pernambuco is stronglylinked to traditional forms of popular expression. Distinctively, the Bahian festival is a large-scale, popular event characterized by cultural hybridizations, traditionand innovations. It has established itself since the late 1980s as the catalyst and backbone of a multifaceted economy. Therefore it provides an interesting casestudy that hints, on the one hand, of the economic dimension of culture as a stimulant of cultural production and dissemination and as an enabler of the devel-opment and establishment of artists. On the other hand, it delves into the cultural dimension of the economy as a catalyst for innovation, job creation and growth.
Bahia has always occupied a key place in the Brazilian cultural scene. The carnival frolics, with their blocos,2 afoxés3 and trios elétricos,4 constitute an exuberant market of symbolic cultural goods and services that in the last 25 years has come to characterize Salvador. In the contemporary configurationof the Bahian carnival, mercantile practices co-exist with cultural expression in a creative economy that combines celebration with economic production.
Three important developments emerged in Carnival frolics in the last fifty years, culturally distinct and distant from one another in time. The first one isthe birth of the trio elétrico in 1950. Inaugurating the popular participation that since then has characterized the Carnival of Bahia, the trio elétrico, alsoan excellent vehicle for advertising, became the first carnival enterprise. The second one is the 1970s resurgence of afoxés, particularly the emergenceof blocos afro,5 a new form of participation in the celebrations by the organized Afro-Brazilian youth that combines culture, politics and commerce,contributing to the exaltation of ethnic pride particularly within the Afro-Brazilian communities. The third phenomenon is the 1980s emergence of blocos de trio.6 Placing ropes around the bloco privatized the trio elétrico since people pay to parade within the confines of the ropes dressed in theabadás.7 This reintroduced a social hierarchy into the occupation of the public space, thus inverting the movement registered in 1950 when this samehierarchy was disarticulated by the emergence of the trio elétrico. On the basis of the repertoire created by the blocos afro, the blocos de trio favouredthe birth of axé music, a musical style born at the Bahian carnivals that established itself throughout Brazil. When the blocos de trio organized them-selves as enterprises and attained economies of scale, they transformed the Bahian carnival into a product with a reach further than the party and thecity they animated. They exported the Bahian carnival model to dozens of Brazilian cities, notably stimulating a market around carnival.
Other elements contributed to the transformation of carnival into a great business. The various actions of private enterprises in the creative industries(recorders, publishing companies, radio stations, etc.), technological advances (of the trio elétrico, recording studios, etc.), an aggressive marketing campaign to promote tourism, and improvements in infrastructure are all elements that contributed to the growth of the Bahian carnival, its products andmarkets. Carnival showed enormous capacity to generate multiple products, including music, artists, organizations and the trio elétrico, which, in con-junction with the cultural industry, the leisure and tourism industry and the service economy of the city, developed immense and diversified businesspossibilities for job and income creation. The Bahian carnival transformed itself into a mega event, surpassing by far and in all aspects any other popular event in Brazil. A quick look at the statistics of the 2006 and 2007 carnivals presented in the following table illustrates this point.

The d
eve
lopm
ent d
imensio
n
2
39C R E AT I V E E C O N O M Y R E P O R T 2 0 0 8
Box 2.2 continued Brazilian carnivals
As the magnitude of the figures above suggests, carnival demands led to a radical change in the way the Government and the private sector plan, manage,support infrastructure and equipment, and supply services to ensure carnival’s success. Re-conceived as a strategic business by various public and privateactors, the reconfigured Bahian carnival acquired great social and economic importance, expanding business opportunities for an array of productive agents.
In effect, the transformation of carnival into an economic phenomenon engendered many lucrative activities. The blocos de carnival, the biggest symbolof the carnival business, have evolved from simple playful clubs to profitable companies by capitalizing on the organizational and technological innovations acquired during the last 25 years of carnival celebrations. Today there are over 200 blocos, the largest employing as many as 2,000 peopleas musicians, dancers, waiters, drivers, security, electricians, carpenters, etc. and contracting third-party services for the construction of trios elétricos,the making of abadás, production of instruments, etc. The business portfolio of blocos includes countless activities linked to the production and commercialization of symbolic cultural products, such as the sale of abadás; sponsorships for the parade and other year-round, nation-wide shows; commercialization of food and drinks during the parade; business partnerships with singers and bands;8 and franchises of the bloco’s trademark.
The activities of the tourism economy (accommodation, transport, tour operation, gourmet, etc.) and of the cultural and leisure industry (show business,phonographic arts, publishing, radio broadcasting, etc.) benefit from the economic dimension of carnival. Street commerce is also invigorated. Thebaianas de acarajé, street vendors of all kinds of products, collectors of recyclable materials, car security guards, all thrive under the carnival economy,with seasonal workers in such categories numbering around 25,000 people in 2006.9
More could be elaborated on how the boom of the creative economy of carnival unleashed opportunities for people to escape poverty and on its diverse impacts,particularly on Salvador’s social fabric. In the Bahian context of high levels of inequity and social exclusion, a regulatory role remains to be played in the multiplication and social distribution of the opportunities arising from the commercialization of carnival, particularly since carnival is, in essence, a cultural phenomenon. This poses a twofold challenge: safeguarding the symbolic, cultural meaning of this party for the soul of the city and its people so as to ensurethe participatory, popular spirit of the Bahian carnival while at the same time unleashing, leveraging and capitalizing on the business that it represents.
1 Risério, Antônio, Carnaval: As cores da mudança. Afro-Ásia, Salvador, Centro de Estudos Afro-Orientais da Universidade Federal da Bahia, no.16, pp.90-106, September 1995.2 The blocos are the groups of people who parade while singing and dancing. The origin of the blocos precedes the emergence of the carnival itself. Their probable
ancestors were the groups of masked performers known as cucumbis, formed by black slaves who participated in the festivities of the entrudo in colonial society.Such groups paraded singing and dancing to the sound of their musical instruments, mainly satirizing the dominant white society.
3 The afoxés are old carnival groups of the Afro-Brazilian communities explicitly linked with candomblé, an Afro-Brazilian religion.4 The trio elétrico, created by Bahians Dodô and Osmar in the 1950 carnival, is a platform, mounted on a truck equipped with giant speakers, on which musicians perform;
people follow the trucks singing and dancing.5 The blocos afro that parade to the sound of great bands mainly composed of percussion instruments have been a symbol of the Bahian carnival since the 1970s.
Among the most famous is the internationally known Olodum.6 The blocos de trio, a creation of the Bahian middle class, are characterized by their use of a trio elétrico inside the roped-off area.7 The abadá is a fancy costume used by the participants in the blocos.8 Intricately associated with the growth of the blocos is the artistic success achieved by the singers and musical groups who now occupy a leading place in the mercantile
space of the carnival. Many simple bloco singers have entered the market with their own blocos, or have become co-owners of already existing blocos, or have set up theirtrios elétricos. Many have become great stars, creating their own producers, recording studios and publishing companies for the distribution of hundreds of thousands ofrecords, and take part in the so-called “extemporaneous” carnivals, that is, festivities that are not organized exactly forty days before Easter as the Christian calendarrequires but at any and all times during the year.
9 Emtursa, ibid.
Prof. Paulo Miguez, Universidade Federal do Recôncavo da Bahia.
Indicators of the Bahian carnival, 2007
Indicator StatisticDuration 6 daysEstimated audience 900,000 peopleOccupied urban space 25 km of streets/squares, 30,000 sq m of other spaces Number of carnival groups 227 groupsArtists involved 11,750 peopleCasual employment 131,000 jobs (97,000 from the private sector
and 34,000 from the public sector)Number of tourists 360,307 people (national); 96,401 (foreign)Hotel occupancy 100% Accredited press 2,531 professionalsIncome generated by tourists $94 millionIncome turnover $168 millionPublic income from taxation $3.2 millionPrivate income $95 millionPublic expenses $27 million
Source: Emtursa, Relatório, 2006; Infocultura 2007.

40 C R E AT I V E E C O N O M Y R E P O R T 2 0 0 8
traditional costumes, music, dance and rituals in an engagingcommunal context, and they project the cultural identities ofthe countries onto the international stage. The carnivalindustries also have a significant impact on the economies ofthese countries through the direct marketable output in liveand recorded performances that they produce for sale to
local people and tourists and through the indirect effects ofexpenditures of tourists whose visits have been stimulated bythe presence of the carnival. There are also further economicspin-offs, for example in the development of skills of localartists and in the inculcation of business skills among thefestival entrepreneurs.
The d
eve
lopm
ent
dim
ensi
on
2
2.4 Obstacles to the expansion of the creative economy
Despite encouraging prospects for the growth of thecreative economy in the developing world, there are problems.Many opportunities for value creation, employment expan-sion, technological upgrading and market development in thecreative sector have gone unrealized in developing countriesbecause of obstacles such as lack of investment, lack ofentrepreneurial skills and inadequate infrastructure to sup-port the growth of the creative industries. As a result, accessby Southern countries to the benefits of growth in the glob-al creative economy has been limited at best. Indeed, there isa danger that when these countries are brought into interna-tional market networks by large transnational corporations, they will tend to be relegated to the lowestvalue-adding stages in the production chain. Some of themajor difficulties facing the expansion of the creative economy in developing countries are discussed below.
Lack of capital
Businesses in the creative sector face capital rationingat all stages. Start-up financing is often difficult to accessbecause of the uncertain prospects in markets for creativeproducts; forecasting demand for creative goods such as filmsis generally more difficult than for more standardized prod-ucts so public and private investors often look upon projectsin these areas as too high-risk. Occasionally, firms have accessto public investment assistance programmes, business incuba-tors or private venture-capital sources. Nevertheless, difficulties in obtaining finance continue into the operationalstages of creative businesses, when working capital is neededand funds for business expansion are also typically in shortsupply (see chapter 8).
Lack of entrepreneurial skills
The management of creative businesses requires specific skills in both the entrepreneurial and the artistic orcultural aspects of the business operation. In developing
countries, skill-development programmes and vocationaltraining courses can address these difficulties but progresstends to be slow. Furthermore, there is often a lack of under-standing of the value chain in the creative industries and theroles and responsibilities of the players at each stage of thevalue chain. For instance, African artists who have successful-ly penetrated World Music and who have been recordedlocally need intermediaries in order for their work to be distributed internationally, so the commercial value of theirsuccess is not necessarily retained within their countries. Thislack of understanding extends not only to role-players with-in the industry but to the industry and government, wherecommercial goals and objectives of cultural policy collideover the purpose of the support and where role-players seethemselves in competition with one another (see chapter 3).
Lack of infrastructure and institutions
The problem of lack of infrastructure and institu-tions relates particularly to gaps in the supply chain forinputs into creative processes, inadequacy of distributionnetworks for effective marketing of products, and lack ofinstitutional support mechanisms. The problem extends tothe regulatory environment within which the creative economy functions. For example, a sound legal frameworkgoverning the writing and enforcement of contracts is need-ed for orderly business practice, and this may be lacking orineffective in some countries. In particular, inadequacies inthe recognition of IPRs for creative work present a majorstumbling block. Without an effective copyright regime,creative producers are unable to receive equitable paymentfor their output and hence lack the financial incentive tocontinue in production. Although many countries in thedeveloping world are making progress in establishing work-able legislative arrangements for dealing with intellectualproperty, there is still a long way to go (see chapter 6).

The d
eve
lopm
ent d
imensio
n
2
Against this background, the UNCTAD secretariat isdeveloping an economic model to assist developing countriesto optimize trade and development gains from the creativeeconomy. The basic premise is the recognition that tradeplays an increasing role in promoting socio-economic growth, employment and development. Tradealone, however, is a necessary but insufficient condition forstrengthening creative capacities. On the one hand, the contribution of domestic and foreign direct investment(FDI) to capital formation is essential to induce technology-led innovation, artistic creativity and technical inventiveness.On the other hand, creative entrepreneurship can provide thebasis for well-adapted and result-oriented market strategies.
Moreover, in order to positively influence export performance while enhancing creative capacities, effectivecross-cutting mechanisms should aim at strengthening insti-tutional and regulatory instruments, particularly to reinforceintellectual property regimes, competition law and fiscalpolicies. Such a framework can facilitate the following: betteraccess to financing, including micro-credit for independentcreative workers and micro enterprises; the formation ofcreative clusters for sharing know-how and infrastructure
facilities; investment promotion and public-private partner-ships; greater efficiency in the functioning of networks oflocal creative firms; and increased competitiveness of creativeproducts and services in global markets. In this schema, tailor-made capacity-building activities to improve entrepreneurial skills and trade- and investment-related policies are highly recommended.
The conceptual approach of this scheme is inspiredby ongoing policy-oriented research in areas of competenceof UNCTAD.3 The model is in its embryonic stage, stillrequiring empirical analysis with a view to understandinghow the economic and technological spillovers interact or,in other words, how the so-called “positive externalities”may occur in practice. It should also be recalled that creativeindustries comprise a vast and heterogeneous group offirms with distinct and usually flexible organizational struc-tures specific to each creative subsector (see chapter 3).Certainly, the model is still a set of testable propositionsrequiring practical application to provide evidence for andvalidate these assumptions. Indeed, to date, little is knownand there is insufficient robust evidence about the impact ofthe creative industries on the wider economy, particularly
their spillovers into other segments ofthe economy.4
In this scenario, a pragmatic wayto nurture creative capacities is to laythe foundation for putting in place acreative nexus. The starting point is toreinforce the nexus between creative ↔investment, technology, entrepreneur-ship and trade, which is named the C-ITEC model (see figure 2.2).
The rationale is that effectivepublic policies are likely to stimulateprivate-sector investments, attractingtechnologies and therefore leading toexport-led strategies for creative-indus-try firms. These in turn would lead togreater convergence between macro and
41C R E AT I V E E C O N O M Y R E P O R T 2 0 0 8
Figure 2.2 The creative nexus: The C-ITET model
Creative Nexus
Technology Entrepreneurship
TradeInvestment
Source: UNCTAD (Dos Santos, 2007).
C-ITET = Creative Investment Technology Entrepreneurship Trade
3 In July 2007, the Secretary-General of UNCTAD set up the Ad Hoc Inter-divisional Task-Force on Creative Economy and Industries with a view to building on in-house expertisein the multifaceted aspects of the creative economy, such as development policies, trade, investment, technology and enterprise development.
4 See Creative Industry Spillovers: Understanding Their Impact on the Wider Economy, a report prepared by Frontier Economics for the United Kingdom Department of Culture, Media and Sports, 2007.
2.5 Shaping a model for enhancing the creative economy in developing countries

42 C R E AT I V E E C O N O M Y R E P O R T 2 0 0 8
micro policies as a result of better synergy among governmentinterventions and business initiatives by enterprises, includingby providing incentives for investments and mobilization ofdomestic resources. Sequenced and mutually supportive mech-anisms would provoke a virtuous circle to optimize the impactof target investments in the most competitive creative indus-tries, identified by a value-chain analysis. Investments, prefer-ably FDI, would induce knowledge innovation or the use ofmore advanced technologies, particularly ITC tools, facilitatingmarket penetration of creative products from developingeconomies in global markets. Creative entrepreneurship towardsproduct-specific marketing strategies would complement thecircle to improve export performance of creative products andservices from developing economies in global markets.
The C-ITET creative nexus would ease the process ofreconciling national cultural and social objectives with tech-nological, industrial and international trade policies. Theaim is not only to strengthen creative capacities but also toassist developing economies to leapfrog into high-growthsubsectors of the creative economy by enhancing the competitiveness of their value-added creative products andservices in world markets.
Trade is a key component in this model because inrecent years, creative industries have been among the mostdynamic sectors in the global trading system. The averagegrowth rates of creative services are increasing faster thanthose of other more conventional services. While the growthrate of total world exports of services rose 12 per cent forthe period 2000-2005, the performance of creative servicesincreased much more rapidly: 22 per cent for advertising, 19per cent for architectural services, and 16 per cent for audio-visual services (see general explanatory notes in the annex). Itshould be pointed out that, owing to the lack of other reli-able economic indicators, the net trade balance of creativeproducts and services is at present the only benchmark for
identifying the dynamism of creative industries in worldmarkets. Also, trade-related indexes are currently the onlyofficial quantitative indicators available at the global level toassist governments in comparative analysis and policy-mak-ing in this area.
Nevertheless, caution is needed to avoid arriving atmisleading conclusions through exclusive reliance on ananalysis of trade statistics for creative goods and services. Itis obvious that exports figures alone do not capture thewhole picture of the contribution of the creative industriesto national economies. It is widely recognized that the greaterpart of creative/artistic revenues originates from copyrights,licences, and marketing and distribution of digitized creativecontent, for which disaggregated, reliable and comparabledata to enable analysis at the global level are key elements.5
Chapters 4 and 5 provide more evidence on this topic.
Furthermore, in the absence of consistent internationallycomparable quantitative indicators for mapping and measur-ing the economic, social and cultural impact of the creativeindustries and hence the creative economy at the national andinternational levels, trade statistics are used for trend analy-sis despite their lacunae. A number of trade-related indica-tors relating to export performance such as market share, nettrade, growth rate and per capita exports by GDP are possi-ble benchmarks that can be calculated on the basis of nation-al trade statistics, as shown in the annex. In this regard,UNCTAD has undertaken empirical research with a view toidentifying the components for a trade and developmentindex6 in order to assist governments in the formulation ofinternational trade policies. The level of trade openness andmarket access can be measured through indices of productdiversification and product concentration as well as indica-tors relating to trade liberalization such as tariff barriers andnon-tariff barriers. These more complex issues are beyondthe scope of this study.
The d
eve
lopm
ent
dim
ensi
on
2
5 Presentation by E. dos Santos, “Capturing the Creative Economy in Developing Countries”, at the OECD seminar on “Measuring the Impact of Culture in the Economy”, Paris, 2006.6 For a comprehensive analysis, refer to the UNCTAD publication, “Developing Countries in International Trade – 2006 Trade and Development Index”
(UNCTAD/DITC/TAB/2006/1), Geneva, 2007.
2.6 The creative economy in the developing world and transition economies
This section provides an overview of the creative indus-tries in the following regions of the developing world: Africa,Asia-Pacific, Central Asia and the Middle East, Latin America,
and the Caribbean. It also looks briefly at the creative econo-my in those Eastern European economies in transition forwhich some data are available.
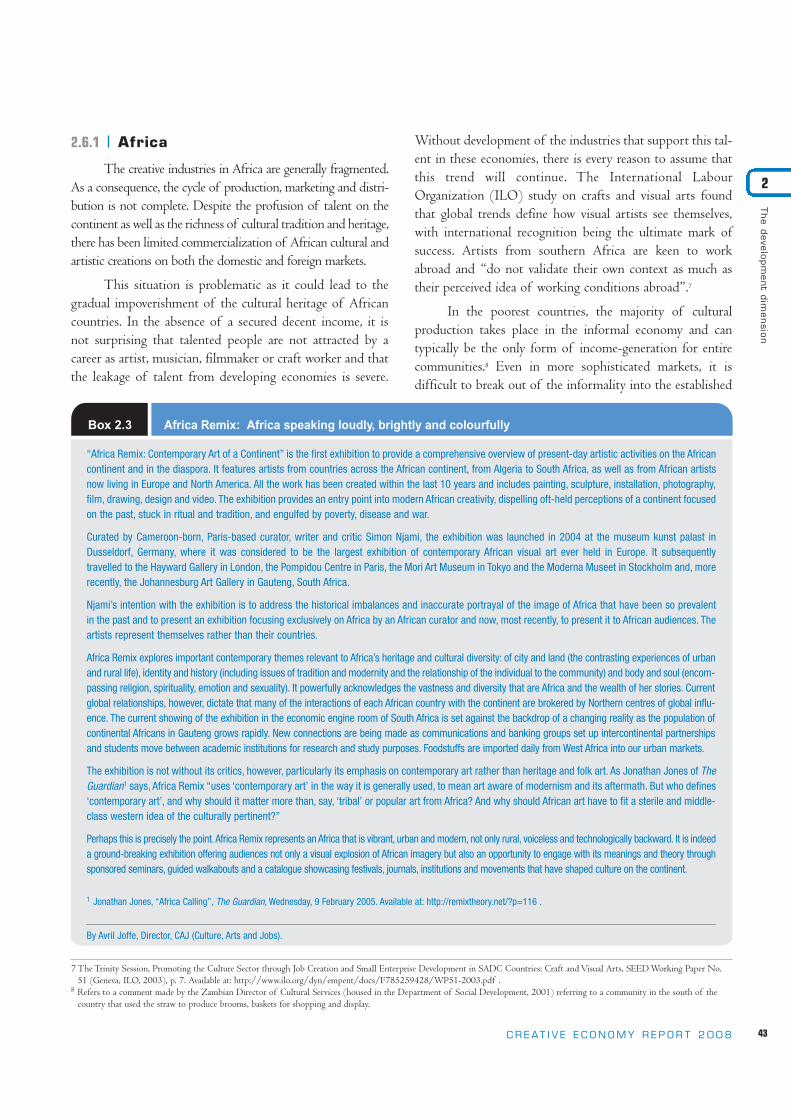
Box 2.3 Africa Remix: Africa speaking loudly, brightly and colourfully
The d
eve
lopm
ent d
imensio
n
2
2.6.1 Africa
The creative industries in Africa are generally fragmented.As a consequence, the cycle of production, marketing and distri-bution is not complete. Despite the profusion of talent on thecontinent as well as the richness of cultural tradition and heritage,there has been limited commercialization of African cultural andartistic creations on both the domestic and foreign markets.
This situation is problematic as it could lead to thegradual impoverishment of the cultural heritage of Africancountries. In the absence of a secured decent income, it isnot surprising that talented people are not attracted by acareer as artist, musician, filmmaker or craft worker and thatthe leakage of talent from developing economies is severe.
Without development of the industries that support this tal-ent in these economies, there is every reason to assume thatthis trend will continue. The International LabourOrganization (ILO) study on crafts and visual arts foundthat global trends define how visual artists see themselves,with international recognition being the ultimate mark ofsuccess. Artists from southern Africa are keen to workabroad and “do not validate their own context as much astheir perceived idea of working conditions abroad”.7
In the poorest countries, the majority of cultural production takes place in the informal economy and can typically be the only form of income-generation for entirecommunities.8 Even in more sophisticated markets, it is difficult to break out of the informality into the established
43C R E AT I V E E C O N O M Y R E P O R T 2 0 0 8
7 The Trinity Session, Promoting the Culture Sector through Job Creation and Small Enterprise Development in SADC Countries: Craft and Visual Arts, SEED Working Paper No.51 (Geneva, ILO, 2003), p. 7. Available at: http://www.ilo.org/dyn/empent/docs/F785259428/WP51-2003.pdf .
8 Refers to a comment made by the Zambian Director of Cultural Services (housed in the Department of Social Development, 2001) referring to a community in the south of thecountry that used the straw to produce brooms, baskets for shopping and display.
“Africa Remix: Contemporary Art of a Continent” is the first exhibition to provide a comprehensive overview of present-day artistic activities on the Africancontinent and in the diaspora. It features artists from countries across the African continent, from Algeria to South Africa, as well as from African artistsnow living in Europe and North America. All the work has been created within the last 10 years and includes painting, sculpture, installation, photography,film, drawing, design and video. The exhibition provides an entry point into modern African creativity, dispelling oft-held perceptions of a continent focusedon the past, stuck in ritual and tradition, and engulfed by poverty, disease and war.
Curated by Cameroon-born, Paris-based curator, writer and critic Simon Njami, the exhibition was launched in 2004 at the museum kunst palast inDusseldorf, Germany, where it was considered to be the largest exhibition of contemporary African visual art ever held in Europe. It subsequently travelled to the Hayward Gallery in London, the Pompidou Centre in Paris, the Mori Art Museum in Tokyo and the Moderna Museet in Stockholm and, morerecently, the Johannesburg Art Gallery in Gauteng, South Africa.
Njami’s intention with the exhibition is to address the historical imbalances and inaccurate portrayal of the image of Africa that have been so prevalentin the past and to present an exhibition focusing exclusively on Africa by an African curator and now, most recently, to present it to African audiences. Theartists represent themselves rather than their countries.
Africa Remix explores important contemporary themes relevant to Africa’s heritage and cultural diversity: of city and land (the contrasting experiences of urbanand rural life), identity and history (including issues of tradition and modernity and the relationship of the individual to the community) and body and soul (encom-passing religion, spirituality, emotion and sexuality). It powerfully acknowledges the vastness and diversity that are Africa and the wealth of her stories. Currentglobal relationships, however, dictate that many of the interactions of each African country with the continent are brokered by Northern centres of global influ-ence. The current showing of the exhibition in the economic engine room of South Africa is set against the backdrop of a changing reality as the population ofcontinental Africans in Gauteng grows rapidly. New connections are being made as communications and banking groups set up intercontinental partnershipsand students move between academic institutions for research and study purposes. Foodstuffs are imported daily from West Africa into our urban markets.
The exhibition is not without its critics, however, particularly its emphasis on contemporary art rather than heritage and folk art. As Jonathan Jones of TheGuardian1 says, Africa Remix “uses ‘contemporary art’ in the way it is generally used, to mean art aware of modernism and its aftermath. But who defines‘contemporary art’, and why should it matter more than, say, ‘tribal’ or popular art from Africa? And why should African art have to fit a sterile and middle-class western idea of the culturally pertinent?”
Perhaps this is precisely the point.Africa Remix represents an Africa that is vibrant, urban and modern, not only rural, voiceless and technologically backward. It is indeeda ground-breaking exhibition offering audiences not only a visual explosion of African imagery but also an opportunity to engage with its meanings and theory throughsponsored seminars, guided walkabouts and a catalogue showcasing festivals, journals, institutions and movements that have shaped culture on the continent.
1 Jonathan Jones, “Africa Calling”, The Guardian, Wednesday, 9 February 2005. Available at: http://remixtheory.net/?p=116 .
By Avril Joffe, Director, CAJ (Culture, Arts and Jobs).

44 C R E AT I V E E C O N O M Y R E P O R T 2 0 0 8
industry. The value chain is simple (primary inputs combined to produce outputs sold directly to consumers);however, this does not translate into an industry where allaspects of the value chain are present.
In many African countries, for instance Nigeria, musicplays an important part in daily life, rituals and commemo-rations; however, evidence of formal production and circula-tion of recorded music products is extremely limited. Thereis also little correlation between strong economic hubs andthe existence of vibrant and economically viable and legalproduction and consumption of cultural products. WhileDakar in Senegal, Cairo in Egypt and areas of South Africa,such as the province of Gauteng or the cities of Cape Townand Durban, are indeed places where production and con-sumption of a range of cultural goods and services takesplace, other strong economic hubs such as Botswana have adearth of cultural production. Yet economically distressedcountries such as Mali, Mozambique, Rwanda or Zambiahave significant production and consumption of culturalproducts such as music, dance, crafts and visual arts.
In regard to the music industry specifically, the focusis still largely on live performance rather than on either recordings or the protection of content through well-functioning IPR systems. In these circumstances, it is notsurprising that creative talent gets attracted overseas. It is notonly that there is often little recognition locally compared tothe international star status that some of the African artistsreceive (for example, the internationally renownedMozambican artist, Malangatana; the South African con-temporary dancer, Robyn Orlin; or Youssou N’Dhour ofSenegal). Also, local audiences are small and artists earn theirmain income from performances rather than copyrights. Thecreative industries of the developed world have drawnAfrican talents to their centres of production and marketplaces. Without enhancing the industries that support thiscreative talent in the developing countries, there is no reasonto assume that this trend will not continue.
In an attempt to classify the music industry withinAfrican countries, research prepared for the UNESCOGlobal Alliance for Cultural Diversity developed a taxonomybased on stages of development of the music industry from“countries with emerging or previously established musicindustries” to “countries with embryonic music industries”and “countries where music production and consumption
are undertaken on a craft-like scale”. An established industryis one firmly based on a value chain comprising a recordingindustry with players at each stage. A live-performanceindustry with a vibrant live-music culture has performingartists, managers and agents, promoters, roadies, sound andlighting engineers, equipment rental and management as wellas suitable venues. These two parts of the industry are servedby an effective and supportive regulatory environment.
The study as presented in table 2.1 indicates that onlyseven countries in Africa have established performanceindustries and only two have an established recording indus-try. Most of the rest are embryonic, and in 30 per cent of allcountries in sub-Saharan Africa, there is little evidence of amusic industry. The table reveals that it is the live perform-ance of music that is driving the music industry in sub-Saharan African countries. More importantly, in more than35 per cent of these countries, there is a music industry;however, only two are classified in the “established recordingindustry” category: South Africa and Zimbabwe.9
The past ten years have seen the development ofcultural policy around the continent and the inclusion ofcultural issues in continental and regional forums such as theOrganization of African Unity and the Southern AfricanDevelopment Community (SADC). Many countries acrossthe continent do not have an explicit cultural policy, however, and those that do often lack the institutions orinfrastructure to deliver on policy objectives. In addition,there is a disparity in the location of culture as a portfoliowithin government. Policy focus is primarily on heritage andpreservation in response to historical factors and nationalidentity while there is limited attention to contemporary cul-ture, which tends to be left up to arts councils, with littleattention paid to creative industries at a policy level. Indeed,these are common problems in most developing countries.
Nevertheless, countries in Africa have started to recog-nize the potential of the cultural sector to alleviate povertyand create jobs and have committed their governments tosupport these sectors. At a Ministerial Conference held inMozambique in 2000 on the role and place of culture on theregional integration agenda, Member States of SADCagreed to ”take decisive steps toward the promotion ofcultural industries as a way of exploiting their capabilities toalleviate poverty, generate employment and contribute toeconomic growth”.10
The d
eve
lopm
ent
dim
ensi
on
2
9 Development Works, “Take Note! The (Re)naissance of the Music Industry in Sub-Saharan Africa”, paper prepared for The Global Alliance for Cultural Diversity, UNESCO, Paris, 2004.10Jabulani Sithole, “Culture Can Play a Key Role in Regional Integration”, 15 December 2000. Available at: http://www.sardc.net/editorial/sanf/2000/Iss23/Nf2.html.

The d
eve
lopm
ent d
imensio
n
2
There is as yet no integrated coordinated frameworkfor African cultural policy; as a consequence, the potential ofthe cultural market in Africa is not realized. To do so wouldrequire coherent multidisciplinary policies, determination intheir implementation, financial and human resources dedi-cated to the creative sector, and an environment conducive toinformation and communication technologies (ICTs) andIPRs. The African Cultural Common Market is intended tobe the framework for the reorganization and restructuring ofthe African cultural spaces and market. The African Unionestablished the Economic, Social and Cultural Council(ECOSOCC) in March 2005 (with full establishment ofthe African Economic Community to take place only in2025), which aims at strengthening the linkages between cultural, economic and social policies.
On the other hand, the cultural sector and the creativeindustries are gradually becoming an instrument for theachievement of broader development goals and are able toreceive funding. In Africa, four countries – Ghana, Mali,Nigeria and Senegal – integrated culture into their PovertyReduction Strategy Papers (PRSPs) as “major axes”,11 whichhas highlighted the contribution that the cultural sector canmake to poverty reduction.
In the case of Ghana, emphasis is placed on the development and promotion of the music and film indus-tries as potential sources of employment generation, wealthcreation and skill development. The PRSP for Mali linksculture with religion, social harmony and security as a majoraxis in the country’s poverty reduction strategies. This is inrecognition of the potential of Malian culture in promoting
45C R E AT I V E E C O N O M Y R E P O R T 2 0 0 8
Table 2.1 Features of the African music industry
Congo Democratic Republic of the CongoKenyaMaliSenegal South AfricaUnited Republic
of Tanzania
BotswanaBurkina FasoCameroonEquatorial Guinea GambiaGuinea BissauIvory CoastMadagascarZambiaZimbabwe
BeninCape VerdeCentral African RepublicGhanaMauritiusMozambiqueNamibia Uganda
AngolaGabonMalawiNigerSeychellesSwazilandTogo
BurundiChadDjiboutiEritreaEthiopiaLesothoLiberiaMauritaniaRwandaSierra LeoneSomaliaSudan
16 %
South AfricaZimbabwe
3%
9%
24 %
Cameroon Cape VerdeIvory CoastKenyaMadagascarMaliMauritius SenegalUnited Republic
of TanzaniaZambia
26%
26%
17 %
BeninBotswanaBurkina FasoCentral African RepublicCongo Democratic Republic
of the Congo Equatorial GuineaGhanaGuinea BissauMalawi MozambiqueNamibiaUganda
27%
22%
16 %
GabonGambia NigerSeychellesTogo
11%
14%
27 %
AngolaBurundiChadDjiboutiEritreaEthiopiaLesothoLiberiaMauritaniaRwandaSierra LeoneSomaliaSudanSwaziland
32%
30%
Rec
ordi
ng in
dust
ry
Perf
orm
ance
indu
stry
Establishedindustry
Emerging/ previouslyestablished industry
Embryonic industry Craft-like scale Unclear evidenceof industry
Total
Total
Average
11Burama Sagnia (2006), “Culture and Poverty Alleviation in Africa: A Review of the Cultural Effectiveness of Poverty Reduction Strategy Papers in West and Central Africa”. Thereport was prepared for the ARTerial, Conference on Vitalizing African Cultural Assets, Gorée Institute, Dakar, Senegal, 5-7 March 2007. Available at: http://www.hivos.nl/english/english/arterial/background-materials.

46 C R E AT I V E E C O N O M Y R E P O R T 2 0 0 8
traditional and religious values with a view to creating a cli-mate of social harmony and security. In recognition of thetremendous potential of Nollywood, the home video filmindustry of Nigeria (see box 9.4), the Nigerian PRSP pro-gramme places culture as a major axis in the poverty reduc-tion strategies. Senegal also recognized the potential value ofcrafts to the national economy and included it as one of theprincipal poverty reduction strategies.
In 2006, the Second Meeting of the African,Caribbean and Pacific (ACP) Ministers of Culture tookplace in Santo Domingo, Dominican Republic. The event,which gathered ministers from 79 States from the ACPregions, sent a clear political message that was reflected in theadopted resolutions emphasizing that cultural policies areessential components for the development strategies of ACPStates and that cultural diversity is a factor of social cohe-sion and stability at the national and international levels. Theministers reaffirmed the relevance of the Dakar Declarationfor the promotion of ACP cultures and their cultural indus-tries. In this regard, a multi-agency project proposal for“Strengthening the Creative Industries in Five Selected ACPCountries through Employment and Trade” was approved in2007. The project is being jointly implemented by ILO,UNCTAD and UNESCO with funds from the EuropeanCommission and institutional support from the ACP secre-tariat. The beneficiary countries for this pilot project, whichshould be concluded in 2010, are Fiji, Mozambique,Senegal, Trinidad and Tobago, and Zambia.12
2.6.2 The Asia-Pacific region
In the Asia-Pacific region, the creative industries havebeen an important element in the development of the matureeconomies of countries such as Japan and the Republic ofKorea and, to a lesser extent, in the fast-growing economiessuch as Malaysia. Many city authorities in China, Japan, theRepublic of Korea and Singapore have formulated economicinvestment policies based on creativity and creative enterpriseas a strategy for economic growth and competitive advantage.In most Asian countries, however, the “creative economy” isnot really a concept that has taken hold and is not reflectedin national economic development plans. Neither are the con-cepts of “creative or cultural industries”, which are hardlyused in debates about national economic strategies.
While both the crafts industries and cultural tourismcentred on heritage sites have attracted some attention andare recognized for their potential for income-generation,they remain isolated activities. In general, these industries arethe focus of individual projects driven either by entrepre-neurs or as part of development projects funded by theGovernment or external international assistance or NGOs.Over the years, there have been projects designed, for exam-ple, on the basis of the potential of harnessing the craftindustries as a motor for economic development among thepoorer segments of the population. Often, however, theseeconomic activities fail to maintain the economic growthforeseen in the projects as soon as external support stopsowing to constraints in terms of infrastructure or inadequatefunding. It is gradually being understood, therefore, that acomprehensive development strategy is needed to realize thepotential of these industries for economic development andpoverty alleviation. This is the motivation behind such programmes as the Jodhpur Initiatives and the Paro Initiative.
Regionally, one can perhaps divide the Asia-Pacificregion into different groups according to how importantly theconcept and activities of creative industries figure as part of theeconomy. There is a large group of countries with importanteconomic activities that are part of what in other countries isconsidered the creative economy. This grouping includes coun-tries such as China, India, Indonesia, Malaysia, the Philippines,the Republic of Korea, Singapore, Thailand and Viet Nam.These countries may all be considered major Asia-Pacificeconomies with a strategic interest in creative-industry develop-ment though it may not be expressed in these terms.
In China, the “cultural creative industries” have start-ed booming over the last five years. As evidenced by the tradefigures presented in the annex, China became the leadingplayer in the world market for creative goods. This develop-ment reflects a clear determination of the Government tofully explore the potential of the creative industries as adevelopment strategy, as emphasized in the 11th Five-YearPlan. Moreover, the impressive economic performance ofChina over the past several decades has made its developmentexperience rather distinct from those of many othereconomies. China had the fastest economic growth in theworld for more than 25 years and recently has been attractingFDI on the order of $60 billion per year. As a result, in a rel-atively short period starting in 1990, its exports of servicesincreased eightfold, amounting to $70 billion in 2005.
The d
eve
lopm
ent
dim
ensi
on
2
12See UNCTAD, Creative Economy and Industries Newsletter, No. 4, December 2006.

The d
eve
lopm
ent d
imensio
n
2
Furthermore, technology has been paramount in the “catch-ing-up” strategy of China.13 Obviously, these conditions –particularly the combination of investment, technology andcreativity – have been conducive to harnessing the creativeeconomy in the country. Design, publishing and arts andcrafts are among its most competitive creative products.
Another important feature of China’s modernizationdrive and the success of its creative industries results from themultidisciplinary policies in place where ministers ofcommerce, culture, science and technology, information andeducation have been working in a concerted manner. The cre-ative industries were identified as one of the pillars of China’s
future economic development.14 Structural reforms recognizingthe growing role of culture and creativity for economic devel-opment have been articulated with a view to enhancing creativeindustries, particularly those generating high-growth, value-added goods and services. In this respect, China is a concreteexample of how cross-cutting policies should be integrated inorder to enhance the overall impact of the creative economy fordevelopment gains. Recently, innovative financing arrange-ments, including new private partnership, have been an enginefor the dynamism of its technology-intensive creative indus-tries.15 An important shift in policy orientation from “made inChina” towards “created in China” is already noticeable.
47C R E AT I V E E C O N O M Y R E P O R T 2 0 0 8
13Keynote address by E. Dos Santos (UNCTAD) on the interface between technology and culture at the Tenth China International High-Tech Expo (CHITEC), Beijing, May 2007.14See opening speech by the Minister of Culture of China, First China Beijing International Cultural and Creative Industry Forum & Expo, Beijing, December 2006 (see UNCTAD,
Creative Economy and Industries Newsletter, No. 6, 2007).15See “Technology and Creativity”, address by E. Dos Santos, Chief, Creative Economy and Industries Programme, UNCTAD, at the Creative Industry Development Forum, Beijing, May 2007.
Box 2.4 Experience of the Shanghai Creative Industry Center
An illustration of the application of a creative-industry development policy in an urban setting is provided by Shanghai, where the Shanghai MunicipalGovernment has clearly stated that the development of creative industries is one of its priorities during the 11th Five-Year Plan period (2006-2010).According to the Shanghai Creative Industry Center, 3,000 companies from 30 countries had entered one of the 75 new creative industry parks (2.2 million sqm) around the city, creating job opportunities for more than 25,000 people. In 2005, the creative industries of Shanghai realized an increase of 54.9 bil-lion yuan in turnover, nearly 18 per cent higher than that of the previous year. In 2005, the total turnover of the creative industries accounted for 6 per centof the GDP of the city1 (see table below).
According to a Shanghai Municipal Government Press Conference Memo of 20 September 2006:2
“[Recently,] Shanghai’s cultural industry authority issued a series of policies and guidelines to encourage non-public investments. The further opening ofthe cultural market has driven up the enthusiasm of private investors. By the end of last year, 186 institutions owned business licenses for broadcastingand TV program production, with 159 privately-owned; 85 business arts performance troupes with 43 privately owned; and 157 performance agencies,with 78 percent privately-run. The private-based economy has played a major role in entertainment sites such as net-cafés and other Internet services.”
“The establishment of a public cultural system has played an important role in boosting the city’s cultural industry, which has been enhanced by govern-ment sourcing to the development of the industry. The acceleration of the establishment of community cultural activity centers, cultural information stations, museums and libraries has created more jobs and has driven up the demand for books, audio products, movies and Internet services. In 2006,public-welfare cultural protection and equipment services, cultural activities of the public, cultural research and community services registered revenuesof 2.35 billion yuan, with the added value of 1.24 billion yuan, covering four percent of the whole cultural service sector.”
Contribution of cultural/creative industries to the City of Shanghai
2005 2006 2005 2006Total 197.57 229.17 54.94 67.4R&D/design 89.28 96.58 2.09 28.79Architectural design 37.16 41.96 9.87 11.87Arts and media 12.84 14.84 4.94 5.73Consulting and planning 41.03 54.41 13.68 18.27Fashion consumption 17.26 21.38 2.36 2.8
Source: Shanghai Creative Industry Center.
Output (in billions of RMB)
Added value(in billions of RMB)
1 2005 creative industry contribution to GDP of Shanghai: 6.0%; 2006 creative industry contribution to GDP of Shanghai: 6.5%; 2006 GDP per capita in Shanghai: $7,490.2 Memo available at: http://www.shanghai.gov.cn/shanghai/node17256/node17971/node17973/userobject22ai22962.html .
By Panjin, Deputy Secretary-General, Shanghai Creative Industry Center.

48 C R E AT I V E E C O N O M Y R E P O R T 2 0 0 8
India is also benefiting from the dynamism of theglobal creative economy by implementing tailored policies.The stunning success of its film industry is a case in point.At present, India is the world’s largest film producer, produc-ing about 1,000 films a year. The film industry providesemployment to some 5 million people. India’s support to thefilm industry rests on the action of three institutes at the federal level, and some States have also developed supportmeasures with an emphasis on training in film directing.16
Moreover, the National Film Development Corporationsupports small-budget productions as well as loans for theconstruction of cinemas. However, fiscal measures are themain mechanism of State intervention while tax exemptionsto lower production costs, cuts in customs duties on filmequipment, and an export incentive system are the maininstruments of public policies.
Bollywood, the colloquial term for Hindi moviesmade in Mumbai, dominates the Indian national market, butregional film-producing States have their own growing markets. The film industry is fragmented but has beenrestructuring. Filmmaking, distribution and exhibition arenow increasingly controlled by a smaller number of compa-nies merging to form bigger companies.17 Traditionally,Indian films have been produced mainly for domestic markets. Over the last decade, however, Indian films have hadgreater penetration of world markets, nowadays generatingabout $220 million in annual export earnings.
The creative industries of the Republic of Korea havebeen performing well, particularly those in technology-oriented areas such as audiovisuals and new media (mainlyfilms, animation and video games). Public policies on audio-visuals have been instrumental not only in enhancing the creative sector domestically but also in guiding internationaltrade policies in the context of World Trade Organization(WTO) negotiations. The Korean BroadcastingCommission plays an important role in strengtheningdomestic production of works for television. In addition, thecountry has a higher-than-average level of audiovisual appli-ances such as video cassette recorders (VCRs) and DVDs,stimulating domestic demand.
Another group features countries or regions with lessemphasis on creative-industry development but where partic-ularly craft industries, furniture making and handloom
industries have traditionally been widespread secondaryemployment activities, namely, Bangladesh, Bhutan,Cambodia, Lao People’s Democratic Republic, Myanmar,Nepal and Pakistan. Even though there are great differencesbetween the countries in this group, their creative economieshave certain common features, including the fact that themajority of economic activities relating to the creative industries are in the large urban centres.
Finally, there are countries where the creative industriesare an almost unnoticed part of the economy, especially in thePacific Islands. In these countries, creative industries existmostly in terms of more traditional cultural activities and thecultural manufacture that is part of the communities’(traditional) life. Throughout the Asia and the Pacific region,however, the cultural sphere increasingly represents a forumfor the search for identity. This search is a real need for manyof the people of the region who experience the onslaught ofsocial change and increasing economic insecurity among largegroups of the populations. This is coupled with the oftenwildly different and contradictory norms and values presentedthrough the mass of cultural goods and services that havebecome easily available – old and new, traditional and contemporary, global and local.
2.6.3 Central Asia and the Middle East
Most of the countries of Central Asia, includingMongolia, are still adapting to the transition to a marketeconomy, and within this scenario, the concept of the “creative industries” is not one that figures very prominently.This has partly to do with the different traditions concern-ing IPRs and weak institutional support in respect of a moreWestern understanding of copyrights. While the culturaland artistic traditions are very rich and diverse in the regionand hold considerable potential for commercial develop-ment, the core cultural and handicraft industries in thesecountries are in general part of the non-formal economy andare not yet positioned as part of any creative economy. Thenomadic tradition in all of these countries is a particularaspect of the potential development of creative industries.
The creative industries are more developed in coun-tries such as the Islamic Republic of Iran and Turkey.Istanbul especially is well known as a rapidly developing
The d
eve
lopm
ent
dim
ensi
on
2
16See “Audiovisual markets in the developing world”, E. Cocq with F. Levy, in Trends in Audiovisual Markets: Regional Perspectives from the South(document CI/COM/2006/PUB/10), UNESCO, 2006.
17See “Trends in Audiovisual Markets: Perspectives from Asia”, M. Rao, in Trends in Audiovisual Markets: Regional Perspectives from the South(document CI/COM/2006/PUB/10), UNESCO, 2006.

The d
eve
lopm
ent d
imensio
n
2
metropolis that plays an important role as a bridge betweenEurope and Asia. Government authorities in Turkey are moving towards enhancing the socio-economic impact ofcultural life while enhancing creative industries not only inthe capital but throughout the country. This decision is alsomotivated by the fact that Istanbul has been selected to bethe Cultural Capital of Europe in 2010.18 Arts and culturalfestivals are no longer seasonal affairs but are spread out during the year.
In the Islamic Republic of Iran, creative industries suchas publishing and film production have a long tradition. Iranianfilms exhibit a strong cultural identity and audiences have beenincreasing worldwide. Carpets remain one of the most appreci-ated items of the Iranian culture in global markets. UNCTADfigures show the Islamic Republic of Iran as the third-largestcarpet-exporting country, accounting for nearly 15 per cent ofworld market share (see table 1.4.1.A in the annex).
A WIPO study from 2004, Creative Industries in ArabCountries,19 describes and explains the economic performanceof four key copyright-based industries – book publishing,music sound recording, film production and software – infive Arab States: Egypt, Jordan, Lebanon, Morocco andTunisia. The overall results of the study suggest that copy-right-based industries in Arab States are substantially under-developed and that there remains a great potential thatshould be systematically mobilized.
Beirut and Cairo used to be the biggest producers offilms and music in the Arab world. Efforts have been madeto stimulate the development of creative industries in theregion, including through the organization of BeirutDevelopment and Cinema (Beirut DC), founded in Lebanonin 1999 by a group of cinema professionals and art advocates.The aim of Beirut DC is to provide support to Arab independent filmmakers in overcoming the constraints facingindependently minded Arab cinema. Important film festivalsare organized in Beirut, and in the fourth edition held in2006, the festival screened more than 40 films, mainly shortsand documentaries.
More recently, the rapid economic development inplaces such as Dubai and some other cities of the Arab
States region does target culture and creativity as vectors foreconomic growth and development. The new sprawlingmedia city complex in Dubai has turned the United ArabEmirates into a centre for broadcasting and publishing, hostinghundreds of Arabic- and English-language publications andsatellite television channels beaming throughout the region.Deeper into the desert, the massive Production City is grow-ing into a sprawling movie and television production zone,seeking to do for Dubai what Hollywood did for LosAngeles. In 2006, Dubai played host to the 40th WorldCongress of the International Advertising Association, thelargest regional creative gathering to date. All activities arenot large in scale, however: a recent exhibition celebrated creativity in art, crafts and the design of jewellery manufacturedin Dubai. The exhibition was organized to make a strongcase for jewellery as one of the creative industries with strongpotential for cultural expression and commercial growth in Dubai.
In nearby Abu Dhabi, which produces the televisionshow, “Poet of Millions”, the Emirate, as part of an initiativeto preserve heritage, has begun a $10 billion plan to buildand operate Middle Eastern branches of the Louvre and theGuggenheim museums on a huge arts and culture developmentmeant to preserve Gulf culture even as it embraces the artsand culture of the West. Meanwhile in Saudi Arabia, RotanaMusic, the region’s largest media company, has acquiredmore than 80 per cent of the music libraries of the Arabworld and almost as much of its film libraries in an effort toput talent from the Gulf in the spotlight.20
Recent facts indicate that creative industries have startedto receive serious consideration in the region. In 2006, theinternational auction house Christie’s held the first contem-porary art auction in the Middle East in Dubai. Its secondauction of contemporary Arab, Iranian, Indian and Westernart drew collectors from India, the Arab world and beyondand topped the house’s own expectations with $9.4 millionin sales. From Arabic calligraphy to American icon AndyWarhol, 190 works of contemporary art went under thehammer in Dubai, the commercial hub better known for itsglass skyscrapers and malls than its arts scene.
49C R E AT I V E E C O N O M Y R E P O R T 2 0 0 8
18In June 2007, the Istanbul Metropolitan Municipality hosted an international conference providing a forum to discuss future strategies for the so-called “cultural cities” and theircreative industries (see UNCTAD, Creative Economy and Industries Newsletter, No. 6, September 2007).
19This study by Najib Harabi incorporates five national case studies, giving a comparative account of the performance of the four copyright-based industries in these Arab States.Using the Porter (Diamond) model as its theoretical background, a survey was conducted in the years 2002-2003 among 242 experts, covering firm representatives, industry and government experts.
20Hassan M. Fattah, “Letter from Dubai: Gulf Culture Emerges as New Voice of Arab World”, International Herald Tribune – Africa and Middle East, 1 August 2007.

50 C R E AT I V E E C O N O M Y R E P O R T 2 0 0 8
2.6.4 Latin America
The engagement of Latin American countries in a creative economy agenda varies considerably on account ofthe substantial differences in the industrial and export capabilities of the creative industries across countries andsubsectors in the region. The number of national govern-ments that have recognized the socio-economic potential ofthe creative industries remains small although considerableprogress has been made in recent years.
The analysis of the creative economy in Latin Americais a matter that is progressively acquiring significance withinregional cultural policies and visibility in economic andsocial development strategies. A series of studies that consti-tute a basis for the development of a creative economy in theregion is currently being put together with the support andencouragement of international and regional organizationssuch as Convenio Andrés Bello; the Organization ofAmerican States; the Organization of Ibero-American Statesfor Education, Science and Culture; the Regional Center forthe Promotion of Books in Latin America and theCaribbean; UNESCO; and, more recently, UNCTAD andUNDP. The development of the creative industries is evolv-ing differently throughout the region; indeed the conceptand terminology of “cultural industries” and “cultural economy” prevail in Latin America. Although countries withhigher economic development such as Argentina, Brazil,Chile, Colombia and Mexico have been concentratinggreater efforts in this area in recent years, awareness of thesocio-economic importance of the creative economy is gradually spreading in the region.
More recent studies measuring the impact of the creative industries in Latin America reflect two factors: thegradual availability of statistics and primary information andthe growing political will of governments to promote theseinitiatives. Statistical availability accounts for a two-wayinfluence on the development of different methodologies formeasuring the activities of the cultural industries. Thus,when more statistical information becomes available, morecomplex methodologies can be designed, enabling a betterdiagnosis of the cultural sector of the economy. Also, it mustbe said that those countries that have started preparing for aSatellite Account on culture have recognized the cultural
sector as a full-fledged economic sector, as happened withrespect to tourism a few decades ago. The different nationalefforts to analyse the economic contribution of the culturaland creative industries have employed similar methodologiesbut with significant differences in the degree of refinementand statistical reliability. Six main approaches have been identified, according to the level of disaggregation of the eco-nomic activities considered as cultural and creative industries.21
■ Mexico and Guatemala. These studies use the System ofNational Accounts as the source for data and four categoriesaccording to the WIPO model (“core industries”, “inter-dependent industries”, “partial copyright industries” and“non-dedicated support industries”). They are the onlystudies that generate an estimate of the illegal and infor-mal sectors, labelled as “shadow economy”, providing acomplete view of the cultural industries.22 Even thoughthe same methodology was used for both Guatemala andMexico, for the Guatemalan study, the five categories hadto be grouped into two owing to the statistical limitations.
■ Argentina, Brazil, Chile, Paraguay and Uruguay. Activities aredivided into four groups, depending on how they relate tothe cultural industries. The first category includes all thoseactivities considered completely cultural and is labeled“main industries”. The other categories are: “partiallyrelated industries”, “distribution industries” and “relatedindustries”.
■ Peru. The Peruvian study is characterized by the variety ofsources and methodologies employed. Owing to the lackof government agencies that produce statistical informationon culture and economics, both private and public sourceswere used to estimate the final demands for cultural consumption plus the investments made in the culturalsector and the value of exports.
■ Colombia. This is one of the most comprehensive studiesmade on the subject using a modern methodology similar tothe ones already described but grouping the cultural industriesinto three categories: “direct”, “indirect” and “supply-producing”. This enables comparisons with other studies.23
■ Chile. Only the economic activities representative of thecultural sector are included. Therefore, the multipliereffects of related sectors or the shadow economy are nottaken into account.24
The d
eve
lopm
ent
dim
ensi
on
2
21The descriptions of the methodologies used in Latin America included here are based on recent studies carried out by E. Piedras Feria as commissioned by several governments in the region. 22Ernesto Piedras Feria, ¿Cuánto vale la cultura? Contribución Económica de las Industrias Culturales en México, CONACULTA-CANIEM-SOGEM-SACM, Mexico, 2004.23Ministerio de Cultura de Colombia, Impacto Económico de las Industrias Culturales en Colombia, Convenio Andrés Bello, Bogota, 2003.24Consejo Nacional de la Cultura y las Artes de Chile, Impacto de la Cultura en la Economía Chilena: Participación de Algunas Actividades Culturales en el PIB y Evaluación de las Fuentes Estadísticas
Disponibles. Universidad ARCIS, Convenio Andrés Bello, Bogota, 2003.

Box 2.5 Guatemala: The economic contribution of culture1
The d
eve
lopm
ent d
imensio
n
2
■ Venezuela. A solid methodology is used, including the economic activities that characterize the cultural sector aswell as teaching because of its role in developing andexpanding cultural services. This makes it rather difficultto compare with other Latin American studies.25
■ El Salvador. This study, like many others, employs economiccensuses and the international activity classification systems. It divides cultural activities into two groups:“core industries” and “other industries”.
As these studies indicate, the range of the economiccontribution of Latin American cultural and creative industriesvaries considerably, reflecting the cultural wealth of eachcountry as well as the varying availability of statistics andmethodologies employed. It should be noted that to date,
12 countries in the region have developed this kind ofquantitative analysis. While the available statistical information is relevant only when it enables comparisonswith similar realities, at present, the fact that these coun-tries are devoting attention to this exercise is a positivedevelopment. However, the data collated thus far shouldbe considered only as indicative and as a starting point forfuture systematic and robust data collection. Again, effortsshould be made to harmonize approaches to data collection with a view to making the most efficient use ofscarce resources.
As regards concrete policy actions, Latin Americancountries exhibit different levels of maturity and awarenessof the potential of the creative economy to foster develop-
51C R E AT I V E E C O N O M Y R E P O R T 2 0 0 8
25Guzmán Cárdenas, Carlos Enrique, Yesenia Medina y Yolanda Quintero Aguilar, La Dinámica de la Cultura en Venezuela y su Contribución al PIB, Convenio Andrés Bello, Bogota, 2005.
In recent years, research in the field of cultural economics has progressed so much that, today, there is little doubt about the importance of the economiccontribution generated by the economic agents or firms that are a part of it. Obviously, not all countries have realized it. Most notably, those countries lacking economic resources to conduct these types of research have fallen behind in their analyses of cultural and creative industries. Such is the case forcountries in Central America which, until now, have not counted on such kinds of studies. It is striking and worrisome at the same time that none of theCentral American countries have national analyses of their cultural industries.
Recently, however, these countries have started to think of their cultural sector as a productive one with the ability to produce economic growth and econom-ic development at the same time. The first study developed in Central America was in Guatemala, where the economic contribution of the cultural industriesreached 7.6 per cent of GDP. The annual average growth was 7.3 per cent for the years 2001-2005, a higher rate than that registered in the majority of othersectors of the Guatemalan economy. The shadow economy (which includes illegal and informal activities) in Guatemala represented almost half of the nation-al economic activities. When the contribution of the shadow economy is included, cultural industries were responsible for 9.02 per cent of GDP in 2005.
The study also found that the cultural sector employed 7.14 per cent of the labour force. When compared with the economic contribution (7.26 per cent),we can conclude that the jobs created by the cultural industries were, on average, slightly more productive than the average jobs in the whole economy.This may also be interpreted as indicating that the cultural industries were important contributors to the improvement of competitiveness of the Guatemalaneconomy and its labour force.
Regarding international trade of goods and services, imports of cultural goods were higher than exports in 2004 (3.36 per cent and 2.12 per cent,respectively), resulting in a trade deficit of 1.24 per cent for that year.
It is now clear that culture and creativity contribute to the economic growth and development of a country in addition to having intrinsic social and aesthetic values. This is demonstrated by the relatively high contribution of cultural industries to GDP and the productivity of their workers. In other words,cultural activities constitute their very own sector of economic activity.
The cultural industries add economic and social value to countries and individuals. They constitute a type of knowledge that translates into jobs and abundance, consolidating creativity – their “raw material" – to promote innovation in production and sales processes. At the same time, they are central tothe promotion and maintenance of cultural diversity as well as in assuring democratic and cultural access.
Moreover, as noted earlier, cultural industries have the dual capacity to simultaneously generate economic growth and economic development. Countriesmust take full advantage of the economic potential for growth and development provided by the comparative advantages of their cultural-economic activities while respecting cultural identities and diversity.1 Analysis by Ernesto Piedras Feria for the Ministry of Culture and Sports, Government of Guatemala, with funding from the Inter-American Development Bank, Guatemala, 2007.
By Ernesto Piedras Feria, economist, Instituto Tecnológico Autónomo de México (Mexico Autonomous Institute of Technology), and CEO, The Competitive Intelligence Unit.

52 C R E AT I V E E C O N O M Y R E P O R T 2 0 0 8
ment, and sharp differences also occur within individualcountries. In general, culture-related goods and services stilltend to be marginal from the economic perspective and culture is considered almost exclusively in terms of itsanthropological definition. The economics of culture liessomewhere between the public institutions in charge ofculture and those dealing with development issues but jointefforts are uncommon. There are, however, a few exceptions,as will be discussed below.
The conceptual debate about the creative economy isstill in its early stages. Though the success of creative-economy programmes of a number of developed countrieshas drawn the attention of policy-makers and culturalresearchers, there is resistance to the prevailing concept ofthe “creative economy”, which places too much emphasis onIPRs. Arguments are twofold. First, the suitability of IPRsfor traditional and communitarian knowledge is argued agreat deal, and it is feared that cases of biopiracy may be followed by a similar wave of foreign appropriation of cul-tural knowledge. Second, a wide range of cultural goods,services and expressions, such as traditional festivals, whereIPRs are not applicable, produce a huge socio-economicimpact and sustain cultural diversity. It is therefore likely thata new definition of the “creative economy” will emerge inthe region. As will be shown later, references to the creativeeconomy are scarce and most of the surveys on the economiccontribution of the creative industries refer exclusively to thecultural or copyright industries.
In Argentina, cultural industries have for many yearsbeen the focus of a number of studies, with special emphasison publishing, phonographic and audiovisual industries,many of them conducted by the Observatory of CulturalIndustries in Buenos Aires. According to the Cultural IndustriesYearbook 2005, the cultural industries altogether contributed7.4 per cent of the Buenos Aires GDP and were responsiblefor 105,000 employees (8.2 per cent), 130,000 if entertain-ment is included. More importantly, the growth rate of thissector is higher on average than that of the economy as a whole.
Buenos Aires, long considered a special case in theLatin American design industry, was appointed the first
UNESCO City of Design by the UNESCO Creative CitiesNetwork. One of the most successful initiatives in this areais the Metropolitan Design Centre, a public institution sup-porting designers and companies to increase their innovationpotential and competitiveness through the use of design. Inthe past few years, other industries have attracted publicattention, such as video games and media. Though the vastmajority of research in Argentina refers to the city of BuenosAires, in national terms, the audiovisual industry has theleading role among the cultural industries. Part of the creditis due to the Instituto Nacional de Cine y ArtesAudiovisuales, which fosters the production, co-productionand distribution of audiovisuals and has legislation in placeto promote the industry.
According to a report by the Brazilian Institute ofGeography and Statistics, the selected cultural industries inthe survey employed 4 per cent of the workforce andaccounted for 5.2 per cent of Brazilian companies.26 Theresearch on the cultural industries covers publishing; trade inbooks and magazines; film and video production, distributionand projection; radio and television broadcasting; arts andperforming arts; news agencies; libraries, archives, museumsand the like; leisure and sports activities; traditional festivals;advertising, and – for the first time in this kind of nationalresearch – ICT equipment and services, including Internetand cable television.
Chile is a special case in Latin America, occupying adistinctive position with respect to many social and economicindicators. Its high educational level and sound economicstrategy have provided a good base for a creative-economystrategy. Not surprisingly, the country also plays a leadingrole in the development of a cultural information system,building on the statistics compiled annually by the NationalStatistics Institute. The project started in 2004 and shouldestablish a dialogue between a directory of artists and institutions, cultural consumption data and the profile ofcultural workers. The aim is to complement the set of assess-ments with a cultural satellite account. Meanwhile, the latestedition of the annual report, Yearbook of Culture and Leisure Time(published since 1997),27 already presents sound statistics oncreation, heritage, media, cultural jobs profile, tourism,
The d
eve
lopm
ent
dim
ensi
on
2
26Brazilian Institute of Geography and Statistics, “The Numbers of Culture in Brazil”, System of Cultural Information and Indicators, 2006.27Consejo Nacional de la Cultura y las Artes & Instituto Nacional de Estadísticas, Cultura y Tiempo Libre – Informe Anual 2005.
Available at: www.ine.cl/canales/chile_estadistico/estadisticas_sociales_culturales/cultura/pdf/CULTURA%20Y%20TIEMPO%20LIBRE%202005.pdf.

The d
eve
lopm
ent d
imensio
n
2cultural consumption and intellectual property, paving theway for the monitoring of a future creative-economy pro-gramme, which to date has not been part of the agenda. The2004 report, for instance, shows that national authorsreceived no more than 36 per cent of the IPRs distributed inthe country and that the estimated piracy rate in the softwareindustry was 64 per cent.
Colombia, as home to the Convenio Andrés Bello(CAB), an intergovernmental institution active in 10 LatinAmerican countries and Spain, has been encouraging theproduction of cultural studies not only at the national levelbut also covering other member countries, such as Bolivia,Chile, Peru and Venezuela. Convenio Andrés Bello also playsa key role in the organization of seminars with experts oncultural economics, promoting awareness and providing aninternational comparison of cultural policy, funding mecha-nisms, and research analysis to identify economic and culturalindicators towards the development of a satellite account onculture. CAB, in cooperation with the Ministry of Cultureof Colombia, launched the project, “Economy and Culture”,with the aim of providing an analytical approach to the economic impact of cultural industries and activities. Adetailed list of key surveys and assessments of studies oncultural and creative industries in Latin America and theCaribbean is provided in the references (see also chapter 4).
The Ministry of Culture of Colombia took the firststep in developing a Cultural Satellite Account: an initialmeasurement was made of the production of the activitiesconsidered to be directly related to the tools of the NationalAccounts System. The National System of CulturalInformation is a good source of studies in the field ofculture. Initial results reveal that the economic contributionof culture to the national GDP is 1.67 per cent (base year:2000), with a high proportion represented by entertainment,cultural services and leisure (35 per cent); advertising, photography, research and development (33 per cent); andprinting (19 per cent).28 Though cultural heritage and the
film industry have been the subject of economic studies andtarget policies in Colombia, the role of creative industries inthe country achieved important recognition in 2005 when Popayan was appointed first UNESCO City ofGastronomy, as mentioned in the previous chapter.
Although Mexico has a number of significant economic studies on specific cultural sectors, cultural infra-structure and cultural industries, they are not developed on acontinuous basis. The National Council for Culture and theArts presents a series of statistics – heritage, funding lines,festivals, cultural consumption and production, to mentionbut a few – under what is called the Cultural InformationSystem (Sistema de Información Cultural). The CulturalInfrastructure Atlas (Atlas de Infraestructura Cultural deMexico, 2003) provides information for the formulation ofcultural policies and programmes.29
A few surveys and assessments were developed by private and academic researchers. A study on the economicimpact of the copyright industries (following the WIPOdefinition) shows that the contribution of these industriesincreased from 5.4 per cent of the national GDP in 1993 to6.6 per cent in 1998, positioning them among the mostimportant of the Mexican economy, ahead of the automotiveand construction industries. In 2004, another book, TheCultural Industries and the Development of Mexico, was published,providing a historical and analytical review of the subject.30
In Venezuela, the creation of the Ministry of Culturein 2005 was a sign of political will to consolidate a new cultural institutional framework in the country. As a result, aplatform for strengthening the impact of culture on thesocio-economic development of the country is taking shape.Surveys and studies, including for the analysis of culturalindicators, are being carried out to assess needs and identifypolicy priorities, with emphasis on book and reading-orientedprogrammes. Other countries in the region offer spot studies on specific subsectors, consumption and a profile ofcultural works, as in the case of Peru and Uruguay.
53C R E AT I V E E C O N O M Y R E P O R T 2 0 0 8
28Ministry of Culture, “Sistema Nacional de Información Cultural”. Available at: www.sinic.gov.co/SINIC/CuentaSatelite/CuentasateliteDocumentos.aspx?CUEID=24. Satellite Account methodological summary. Available at: www.sinic.gov.co/SINIC/CuentaSatelite/documentos/Ficha%20Metodológica%20Cuenta%20Satélite%20de%20Cultura.pdf.
29Consejo Nacional para la Cultura y las Artes, Atlas de Infraestructura Cultural, 2003. Available at: http://sic.conaculta.gob.mx/resultados.php?target=atlas+endesa.html.30Consejo Nacional para la Cultura y las Artes, “Sistema de Información Cultural”. Available at: http://sic.conaculta.gob.mx/publicaciones_sic.php?&l=&estado_id=
Consejo Nacional para la Cultura y las Artes, Atlas de Infraestructura Cultural, 2003. Available at: http://sic.conaculta.gob.mx/resultados.php?target=atlas+endesa.htmlGarcía Canclini, Néstro y Piedras Feria, Ernesto, Las Industrias Culturales y el Desarrollo de México. Mexico, Siglo XXI Editores, 2006.Ernesto Piedras Feria, Cuánto Vale la Cultura? Contribución Económica de las Industrias Protegidas por el Derecho de Autor en México, Conaculta, CANIEM, SOGEM, SACM, 2004.

54 C R E AT I V E E C O N O M Y R E P O R T 2 0 0 8
2.6.5 The Caribbean
The Caribbean presents sharper contrasts on a country-by-country basis than other regions. Over the past ten years,Barbados, Jamaica, and Trinidad and Tobago have been work-ing to put in place a creative-economy strategy and actionplan, with a focus on music and cultural festivals, engagingeither the private sector or the Government. In Trinidad andTobago, a key study was carried out in 2001 that analysed thestructure, challenges and opportunities of the music industry.One of the main problems faced by the researchers was thevirtual non-existence of official statistics, making the contri-bution and the size of the subsector an area of speculation.
For Jamaica, a study commissioned by UNCTAD andWIPO31 in 2002 confirmed the importance of music as animportant economic activity, a source of income-generationand trade opportunities. A key message conveyed by thereport and that would be applicable in principle to the wholeCaribbean region is that the industry has developed with little government assistance. A turning point occurred whenthe National Industrial Policy recognized music and enter-tainment as two key elements of the national developmentstrategy. This debate progressed further when a NationalStrategy and Action Plan to develop the Jamaican musicindustry was prepared in 2004 for implementation throughpartnerships uniting the private sector, governments andinternational institutions. Debates evolved and in 2007, thePrime Minister announced that a new Cultural IndustriesCouncil would replace the existing Entertainment AdvisoryBoard, recognizing that “cultural industries representJamaica’s natural competitive advantage”.
In Barbados, the National Task Force on CulturalIndustries was established in 2002, comprising nine ministersand a number of representatives from different sectors andinstitutions and focusing on culture and development. As aresult, the Barbados’ Creative Economy: A CulturalIndustries Development Strategy was prepared in 2004. Itstated that “cultural industries are a significant contributorto the economy of Barbados, despite the perception that cul-tural industries constitute a ‘soft’ sector and are carried outmore as an after hours diversion than a veritable businessenterprise”. Since then, increasing attention has been devot-ed to the potential of the creative economy as a development
strategy for this small island developing State. The forum,“Promoting Creative Industries: A Trade and InvestmentStrategy for the Caribbean”, organized in 2006 by theCaribbean Regional Negotiating Machinery with the sup-port of the European Union Proinvest Project, was a furtherstep in this direction.
Music remains the focus of creative-industry effortsthroughout the Caribbean region. An important study onthe subject32 was prepared in 2000 by UNCTAD andWIPO, recognizing the need for policies to address issuessuch as investment opportunities, codification and use ofCaribbean music, institution-building, and strengthening ofcopyright legislation. It was also intended to assist and reinforce marketing distribution schemes for music incomes.However, a fundamental problem in the design and implementation of national economic policies for this sub-sector remains the chronic lack of statistics and economicmappings.33 More recently, some Caribbean States havebecome attractive locations for big film productions.Therefore, they are reinforcing their abilities to provide filmsupporting services and establishing film commissions topromote the interests of their countries. In particular,Jamaica and Trinidad and Tobago have been exploring possi-bilities of signing international co-production treaties. Forinstance, a treaty for film co-production between Jamaicaand the United Kingdom was signed in early 2007.34
A broader view of the creative economy in the regionwas canvassed in 2006 when the study, The Cultural Industriesin CARICOM: Trade and Development Challenges, was released.35
The first study to present a comprehensive analysis of thecreative industries in the Caribbean, it assessed their economiccontribution in the region and identified the obstacles to itsglobal competitiveness. It also provided inputs to a strategicplan for the development of the sector, including an investi-gation of the market structure, the economic flows and theexport performance of the various subsectors of the culturalindustries. The research emphasized that the Caribbean hassome competitive advantage in specific subsectors, particu-larly at the production stage. The draining of talent to developed economies is still a reality and the overall aim oftapping into the growth potential of the rising creative sec-tor is hampered by the poor organization of stakeholders
The d
eve
lopm
ent
dim
ensi
on
2
31See Witter (2002).32See Vanus (2000).33On the limitations of mapping and measurement in the region, see K. Nurse et al. (2006); Piedras and Rojón (2005); and Buanain and De Carvalho (2004).34See UNCTAD, Creative Economy and Industries Newsletter, No. 5, August 2007.35This study, which presents important policy recommendations, is available at: http://www.crnm.org/documents/cultural_industries/Cultural_Industries_Report_Final_Jan07.pdf

The d
eve
lopm
ent d
imensio
n
2
55C R E AT I V E E C O N O M Y R E P O R T 2 0 0 8
Box 2.6 Brand Jamaica as the home of reggae
Creativity represents one of Jamaica’s most distinguishable assets and competitive advantages as a country. Through its music, fashion, dance and cuisineJamaican culture continues to influence and impact global pop culture as it has done since the introduction of Garveyism, Rastafari and reggae music.Jamaica’s exploitation of this sector is vital if it is to realize development gains from international trade, as highlighted in the UNCTAD São Paulo Consensus.
The United Nations estimates that the creative industries are growing at a faster rate than the world economy in general. Yet there is still a critical lackof empirical statistics on the contribution of Jamaican music or creative industries to national GDP. This has resulted in repeated undervaluation of thissector in an array of studies, with estimates ranging from $1.5 billion to $1.7 billion in generated revenue.
Brand Jamaica is a business brand building campaign to expand the country’s profile from a primarily leisure destination, celebrated for its cultural iconsand athletes, to one where business plays an even greater role. Brand Jamaica has for the most part been an organic evolution driven by the country’screative entrepreneurs and their cultural products. A decade ago, the Government awakened to the potential of culture and creative industries as an important economic strategy for national growth, signalled with the inclusion of music and entertainment as a strategic cluster group in the NationalIndustrial Policy in 1996. Responsibility for promotion of the sector was given to the country’s trade and investment facilitation agency, Jamaica PromotionsCorporation (JAMPRO). The agency, in partnership with the music industry, facilitated the development of the national Sounds of JamaicaTM brand campaign launched at the Marché international de l’édition musicale (MIDEM), the world’s largest music industry trade fair, in 1997 in France. The initiative galvanized the Jamaican music industry in an unprecedented demonstration of strategic cooperation. However, after a vibrant period of activebrand management and trade show participation between 1997 and 2000, the initiative lost momentum. Fragmentation of various aspects of Jamaica’screative industries across five ministries and at least six agencies without the benefit of a sector-driven master plan resulted in staggered duplication,inertia and ongoing loss of wealth-generating opportunities. Additionally, Jamaica has a “hustler” reputation internationally, which negatively affects market confidence in supply consistency, legal protection and business practices.
The global appeal and adoption of Jamaican music have spawned home-grown versions and artists within the genre from Germany’s Gentleman to UnitedStates Grammy winner No Doubt, for example. The increasing availability of home-grown reggae and the rising cost of Jamaican versus home-grown talent have begun to impact the demand for authentic Jamaican reggae, with festivals in major markets such as Germany and Japan successfully producing reggae festivals without any Jamaican artists on the line-up. Product quality in terms of recorded and live music must be maintained at thelevel of excellence established for Jamaican music internationally by Bob Marley and others in order for Jamaica to grow its market share of the internationalJamaican music industry.
Jamaica’s music represents the country’s most easily exportable creative-industry product and the one that has strengthened the brand internationally intraditional markets as the foundation of Brand Jamaica. Emerging markets for Jamaica’s music, particularly in Asia and Latin America, hold great prom-ise for a musical culture that has been embraced by a diverse range of cultural markets. Jamaica’s musical success in these markets opens the door forthe introduction of other creative products into the market. Jamaica and its culture are inextricably linked in the mind of the international market. Jamaicaas the culturally authentic home of reggae music and culture has the opportunity to guarantee its competitive advantage in the cultural market space onceit enables creative entrepreneurs to position themselves effectively in the international market with quality products.
Jamaica’s creative products are diverse and include finished audio video tangibles that are exported physically and digitally as well as facilities and servicesconsumed by foreigners visiting Jamaica to record in one of its state-of-the-art studios, collaborate with top artists, musicians and producers or shoot anew music video against the flavoured texture of the diverse Jamaican landscape. Given the broad scope of creative industries, the JAMPRO 1996-1997Marketing Plan for Music and Entertainment estimated that 15,000 persons were directly and indirectly employed in this sector. The impact of this relatively small group on the Jamaican economy is, therefore, out of proportion to the group’s size. The products and services generated by the sectorcontribute significantly to Jamaica’s capital wealth, public image and goodwill. In keeping with global trends, this generation of youth is empowered creative mavericks developing their own labels, fashion brands and production houses and building a new creative economy for the future.
It is noteworthy that the creative sector has affected traditionally vulnerable groups as Jamaica’s cultural richness has for the most part been producedby the poorer, marginalized class. The creative expression and folk heritage of the poor have evolved into a global phenomenon, with many examples ofyoung people raising themselves out of poverty through their talents and despite their lack of business experience. From the earliest period of Jamaica’smusic history, it was young people who fuelled the growth of this industry as performers, producers, promoters and agents. Early pioneers and legendsinclude labels Studio One and Treasure Isle and artists such as the Skatallites, Jimmy Cliff, Toots & the Maytals, Prince Buster, Alton Ellis, and Bob Marley& The Wailers. Today, young people continue to fuel the legacy of creative wealth and empower themselves through their creative capital to bring aboutindividual and community growth. Traditionally, Jamaican music has been a very male-oriented industry with a few women performers such as MillieSmall or Marcia Griffiths and an even smaller number as managers, promoters and producers such as Sonia Pottinger. Over the last five to ten years,however, women have become increasingly visible on the entertainment scene in Jamaica, with an unprecedented number of new female solo artistsarriving on the scene, female managers and promoters as well as women in the areas of legal and financial services, engineering and video production.
Historically, the fragmented distribution of Jamaican music and limited appreciation of the publishing value resulted in a unique Jamaican music busi-ness model that relies heavily on revenue from live performances and special exclusive recordings called “dubplates” rather than depending on recordsales and publishing like creators in developed music markets. Most international showcasing of talent or distribution of catalogues was made possible

56 C R E AT I V E E C O N O M Y R E P O R T 2 0 0 8
and the absence of more comprehensive policy measures. Asstated in the study, “Changing the mindset of the govern-ments and the corporate sector is key for transforming thesector’s viability but it is equally important for the industrystakeholders to become better organized and provide a moresustained and cohesive advocacy capability”.
In the Eastern Caribbean States, the linkages betweentourism and creative industries have been reinforced. A ministerial conference organized by the Organisation ofEastern Caribbean States (OECS), held in St. Lucia in early2007, addressed this issue in the efforts of these States toshape a long-term vision for the development of the region.A new treaty with plans for an economic union is guidingeconomic policy among OECS member States. UNCTADand the OECS secretariat are exploring cooperative actionsto enhance creative capacities in the region, particularly inarts and crafts, visual arts and music festivals.
At the political level, the last Ministerial Conferenceof the Small Island Developing States, held in Mauritius in2005, recognized the importance of culture to accelerate development in the region through the implementation ofthe Mauritius Plan of Action.
2.6.6 Eastern European economies in transition
It is difficult to generalize about the state of the creative economy in economies in transition because eachcountry has its own particular economic and cultural circumstances. Nevertheless, these countries do share thecommon problem of how to deal with cultural assets thatwere formerly State-owned and that are now in the domainof the private sector. This applies particularly to tangible cultural heritage; many historic buildings ranging frommanor houses to urban apartments have been handed back toprivate owners who often have neither the resources nor thewill to maintain them, let alone to renovate or restore them.Similarly, many cultural organizations – theatres, galleries,literary publishers, music ensembles, etc. – that were previously State-financed have been forced to make their wayin the private marketplace, and many have not been able tosurvive the transition.
Some cities in Eastern European countries havelooked to the cultural industries as an avenue towardsbecoming “creative cities”. An example is St. Petersburg inthe Russian Federation. However, despite the attraction ofthis city as the location of the Hermitage, one of theworld’s finest art museums, there have been problems.Overreliance on a single organization to entice tourism has
The d
eve
lopm
ent
dim
ensi
on
2
Box 2.6 continued Brand Jamaica as the home of reggae
through artist deals or product licensing agreements with overseas distributors or labels and limited media exposure through a network of niche reggaeprogrammes worldwide, particularly on independent and college radio stations in Europe and North America. Jamaican music was internationally established and has been maintained through this touring circuit strategy, making live performances the foundation of the Jamaican music businessmodel. Live performances also are slowly evolving into this role in the international music business as the rise in illegal file sharing and declining CD salesare decreasing the industry’s reliance on revenues from record sales and publishing. Consequently, the substantial divide that existed between theJamaican and international business models is narrowing.
Overall, Jamaica’s creativity has earned it a place in the global arena despite the small size and inexperienced management of its creative industries. Inorder for Jamaica and the Caribbean to survive in a globalized world, policy-makers and stakeholders seeking economic growth and job creation mustposition the creative industries as the cornerstone of any serious development strategy. The inherent entrepreneurial talent of Jamaicans has developedand sustained the country’s creative product brands over the past fifty years without a proactive public policy, institutional infrastructure or formalizedventure funding. It is now time to unleash the full potential of Brand Jamaica by providing the creative industries with the required overarching support.If properly managed, Brand Jamaica could foster joint venture projects and macro branding opportunities that would maximize the global appeal of thecountry’s lifestyle brand and national identity.
Jamaica’s national brand identity has international consumer appeal and proven economic potential. The success of Jamaica in nationally and interna-tionally marketing its cultural products demonstrates that Southern economies can expand into international markets by increasing brand awareness andpackaging a diverse product line built on their cultural production.
By Andrea M. Davis, Jamaica Arts Holdings/International Reggae Day.

Box 2.7 The Bolshoi: A sublime gift to the world
The d
eve
lopm
ent d
imensio
n
2
tended to mask the lack of a developed ecosystem ofcultural activity in the city. It is argued that the way for-ward is to introduce creative industries into the city bysupporting small-scale cultural producers together withappropriate institutional support for the development ofculture-related SMEs.36
Three other economies in transition for which some dataon the creative industries are available are Bulgaria, Hungaryand Latvia, all the subject of recent national studies of the eco-nomic contribution of the copyright industries carried out byWIPO. The Hungarian study estimated that the core copyrightindustries contributed about 4 per cent of the GDP of that
country in 2002 and 4 per cent of employment. The entiregroup of copyright industries as defined by WIPO is the sec-ond largest industry group in Hungary in terms of GDP con-tribution and the third largest in terms of employment. InLatvia, somewhat similar percentages apply: the core copyrightindustries contributed just 3 per cent of value added to GDPand 4 per cent of employment in 2000 (see chapter 4).
A notable development is that Hungary and Romania,although new in the European Union, have become attractivecountries for film, video and advertising production. Asshown in the annex, Hungary became an important exporterof audiovisual services.
57C R E AT I V E E C O N O M Y R E P O R T 2 0 0 8
36See O’Connor (2005:244-258). See UNCTAD, Creative Economy and Industries Newsletter, No. 4, April 2007.
The Bolshoi Theatre is one of the most famous cultural institutions not only in Russia but also around the world. However, this has not always been the case.Bolshoi’s history goes back to March 1776 when the Russian Tsarina, Catherine the Great, granted Prince Urussov exclusive rights to organize performancesand masquerades in Moscow. In four years – by 1780 – Petrovsky Theatre was built for the company on the exact spot where the historic building of theBolshoi Theatre now stands, at the place that today we call Teatralnaya Square. Only after the big fire of 1805, when the building was ruined, and in orderto preserve the company was the decision taken for it to come under the Emperor’s theatres, which eventually included the Mariinsky (renamed the KirovTheatre for part of the twentieth century), Aleksandrinsky and Maly Theatres in St. Petersburg and Maly Theatre in Moscow. With the Russian capital locatedin St. Petersburg, all major musical theatre events during the nineteenth century took place at the Mariinsky rather than at the Bolshoi.
After the October revolution of 1917, the capital was moved to Moscow and the situation drastically changed. All the best artists were invited to Moscow.Prior to that time, Anatoly Lunacharsky, who was the Cultural Minister of the new Soviet Republic, had to win a major battle in order to convince author-ities that ballet and opera were not a mere bourgeois form of distraction but rather a truly great art that expresses the national glory of Russian peopleno less evidently than any economic, social or scientific achievements.
The importance of art as an ideological tool was understood quite rapidly by the communists and throughout the twentieth century, State support to theBolshoi was outstanding even in the most difficult times. Stalin himself was often a guest in the official box of the Bolshoi Theatre. Galina Ulanova, MarinaSemionova, Olga Lepeshinskaya, Maya Plisetskaya, Vladimir Vasiliev – these are only some of the names of legendary dancers who made the BolshoiBallet synonymous with the highest standards in classical ballet. From the first Bolshoi international tour in 1956, the Western world was confronted witha new face of Soviet Russia – talented, human, touching and expressive.
Today the Bolshoi Ballet Company comprises 220 dancers and is the largest classical ballet company in the world. It has faced some difficult times, how-ever, particularly in the early 1990s after a decade of perestroika where the State for a while lost interest in the company; all former privileges wereerased, all former relations were broken. The company had to find its place in the new country and it took several years to do so. The situation wasaggravated owing to internal artistic crises. When Yury Grigorovich had to leave his post as chief choreographer after holding the post for 30 years, theBolshoi Ballet Company was torn apart by different creative forces and no interesting projects materialized for years.
In 2000, Anatoly Iksanov was appointed General Director of the Bolshoi Theater and had to meet several challenges. One of the main ones was the renovation and reconstruction of the historic building of the company, which had been without any major renovation since 1856. The particular natureof the Bolshoi is that opera, ballet, orchestra and building all form an outstanding cultural institution known in the world as the Bolshoi. Hence duringrenovation, it was important not merely to reinforce basement and walls and to install new stage equipment but first of all to preserve a unique compa-ny. In order to do this, Bolshoi needed to have another place to perform and in 2002, the Bolshoi new stage opened. Finally, after years of discussions,the plan for Bolshoi renovation and reconstruction was approved and in the summer of 2005, the Bolshoi historic building was closed for repairs.
The top artistic goal was to enlarge the Bolshoi repertoire and to make the artistic life of the house interesting and dynamic as well as to open it moretowards international artists. As a result, there was a great increase in the number of Bolshoi premieres. While the Bolshoi was operating on two stages,it produced an average of seven premieres per year. With the new stage only, the Bolshoi management decided to limit this activity to four major premieres per year: two operas and two ballets.

58 C R E AT I V E E C O N O M Y R E P O R T 2 0 0 8
The d
eve
lopm
ent
dim
ensi
on
2
Box 2.7 continued The Bolshoi: A sublime gift to the world
Many famous international artists came to work with the Bolshoi, among them choreographers such as Roland Petit, John Neumeier, Pierre Lacotte andCristopher Wheldon, and stage directors Francesca Sambello, Graham Vick, and Peter Konvichny. It goes without saying that the priority of the house is tostage works of Russian composers. Sixty per cent of the Bolshoi repertoire is made up of Russian music. The Bolshoi Ballet Company is the only balletcompany that has all three Shostakovitch ballets; among recent premieres are Prokofiev’s “Cinderella”, “Go for Broke” staged to Stravinsky’s score, and“Queen of Spades”, created by Roland Petit to Tchaikovsky’s Sixth symphony. Recent opera premieres include “Rake’s Progress” (Stravinsky), “War andPeace” and “Fiery Angel” (Prokofiev), “Khovanschina” and “Boris Godunov” (Musorgsky), and “Evgeny Onegin” (Tchaikovsky). The need for dynamism alsobrought to the Bolshoi works of the younger generation of directors and choreographers among whom one should mention the artistic director of theBolshoi Ballet Company, Alexei Ratmansky, and one of the most famous Russian contemporary opera directors, Dmitry Tcherniakov.
For such great artistic activity, the Bolshoi needed to reinforce its economic position. Confronted with this problem, Anatoly Iksanov invited McKinseyCompany to examine ways to improve the Bolshoi’s situation. Subsequently, Bolshoi management started to work in three directions. First, State dona-tions to the Bolshoi have been dramatically increased. While in 2000 $12 million were allocated to the Bolshoi, the amount now surpasses $45 million. Special grants are given to major cultural institutions in Russia such as the Bolshoi and Mariinsky Theatres, the Philharmonic Orchestra in St.Petersburg and the Moscow and St. Petersburg Conservatories, which makes State recognition of these organizations quite tangible.
The second way to improve the Bolshoi was to increase its own income through ticket sales. The Bolshoi Box Office was the first in Russia to sell ticketswell in advance through the Internet and to introduce eight ticket price ranges according to seat location. Owing to these changes, the Bolshoi annual cashflow grew from $2 million to $11 million. The $9 million difference is basically what the Bolshoi took away from scalpers. For students, however, the Bolshoihas a special programme that permits them to buy tickets at special prices, the equivalent of which is $1 to $2 per seat. A Board of Trustees was alsoorganized, including leaders of Russian businesses such as Lukoil, Rusal and Severstal. It was important to Iksanov not only to obtain additional financialsupport but also to bring in Russian businessmen to share responsibility for the existence of a national treasure such as the Bolshoi.
Finally, the Bolshoi had to prove again its place as the world’s leading musical theatre. In the past few years, the Bolshoi established very close connec-tions with Covent Garden, La Scala and the Paris Opera. Seasons 231 and 232 exemplify Bolshoi’s priorities and the geographical range of its tours: Berlin,London, Milan, Paris and Washington, DC. The best proof of the Bolshoi’s success can be found in the response of the London press during the Bolshoisummer tour of 2007 (for example, Zoe Anderson, “The Bolshoi Ballet is back with a dynamic artistic director and exciting new productions”, TheIndependent, 12 July 2007).
By Katerina Novikova, Bolshoi Ballet.

Assessing the Creative Economy: Analysis and Measurement 2
PART

60 C R E AT I V E E C O N O M Y R E P O R T 2 0 0 8

The formulation of policy strategies to foster thedevelopment of the creative economy at the local, nation-al or international level cannot proceed in a vacuum. Threerequirements are critical to providing the sort of informa-tion and analysis upon which sound policy can be based.These are:
■ a systematic understanding of the structure of the cre-ative economy, who the stakeholders are, how they relateto one another, and how the creative sector relates toother sectors of the economy;
■ sound methods to analyse the functioning of the cre-ative economy and to assess the contribution it makes toeconomic, social and cultural life; and
■ comprehensive statistics to quantify the analytical meth-ods and to provide a systematic basis for evaluation ofthe contribution of the creative sector to output,employment, trade and economic growth.
An evidence base is needed to understand the natureof and potential impact for growth and change in the creative economy. Evidence comes in many forms, quanti-tative and qualitative. The focus of this Report relies onthe collection and analysis of quantitative data; in thissense, it echoes the work done by a number of nationalagencies to map their creative economy.1 However, whilethe great value of these accounts lies in the fact that theypresent data within a normative framework that is directlycomparable with other sectors of the economy, this is alsoa particular weakness. It is a weakness since it assumes, orat least presents the reader with the impression that, thecreative economy is precisely the same as the rest of theeconomy. Likewise, the gross value added (GVA), orexport and import structure, is the same, as is the natureof work. Given the ongoing debates and research beingcarried out on the “new business models” and their impacton the organizational forms and strategies of the creative
industries, there is good evidence for questioning such anassumption.
There is no option but to present the same quantita-tive measures as are used for other industries; nevertheless,caution is urged in their interpretation. This chapter willhighlight ways in which the creative industries seem toadopt or to occupy different organizational forms andbusiness models. Accordingly, it is argued that this mayhave an impact on policy formulation. As such, it will beargued that quantitative data are necessary but insufficientfor an analysis of a new and emergent sector such as thecreative economy. Much more detailed work is required onthe institutional forms and organizational particularities ofthe creative economy to engender confidence in policy pre-scriptions. In sum, this raises the question that researchershave been grappling with for a number of years, which iswhether the creative economy is the same as the rest of theeconomy, if not why not, and in what ways is it different.Moreover, additional lines of inquiry are whether genericindustrial policy is sufficient or a new formulation specificto the creative economy will be required. It is our view thata more nuanced understanding of the creative economywill be achieved with the collation of qualitative assess-ment and the analysis presented in this chapter. As a wayof illustrating this point, this chapter will outline the particularities of the creative economy and their implications for the selection of tools for analysis andappropriate indicators for monitoring and evaluation.
This chapter is divided into three substantive parts.The first deals with the question of conceptualizing anddescribing the organization of the creative economy. Thesecond part reviews tools of economic analysis that may beuseful for the investigation of the creative economy.Finally, in part three, the value-chain model is used as atool to facilitate analysis of the creative economy.
61C R E AT I V E E C O N O M Y R E P O R T 2 0 0 8
Analysin
g th
e c
reative
econom
y
3
CH
AP
TER
3Analysing the creative economy
3.1 The need for systematic analysis
1 See, for example, DCMS (1998), Creative Industries Mapping Document, London, plus others.
62 C R E AT I V E E C O N O M Y R E P O R T 2 0 0 8
A key question usually raised concerning the creativeeconomy is whether it is substantively the same as the “restof the economy”. There are two reasons for raising this issue.First, traditionally, matters relating to “culture and arts” havebeen dealt with as special cases, given their peculiar forms ofproduction and the specific characteristics of their markets.Historically, cultural policy is considered as exceptional or afield with special needs based upon a welfare-economics con-ception of market failure balanced against cultural values.Second, many have argued that the creative economy is sufficiently different from the mainstream economy; there-fore, specific rather than generic policy-making might beappropriate. This chapter develops this second line ofargument. The starting point is to identify how and why thecreative economy is different and in what ways it is necessaryto do fine-tuning with generic analyses and policies.
Thus, this section is subdivided into three parts corre-sponding to identifiable dimensions of the creative economythat distinguish it as different or at least sufficiently unusualto merit the development or refinement of analytical tools.Attention is drawn to three critical aspects of the creativeeconomy for policy-making. Initially, the basic organizationalstructure of the creative economy is examined, then the characteristics of its day-to-day operations, and finally someof the locational consequences.
In general, the creative economy is dealt with as a single set of activities. Nevertheless, there are significant dif-ferences between individual creative industries associatedwith markets, products, technologies and distribution sys-tems. In fact, the debate about “convergence” highlights thispoint, seeking innovative possibilities to deal with theseinteractions. For the purpose of this Report, however, it issufficient to begin with a set of policies and analysis of thecreative economy in general. Clearly, there is scope for specificadaptation to particular industries and regulatory norms.The point to be stressed is that the creative economy is bothinternally coherent and sufficiently different from the “restof the economy” to merit separate attention. In many ways,this conclusion is accepted since it retains the possibility offormulating creative economy policies that both attend toeconomic specificities while they may be open to incorporat-ing special concerns that are critical to local and regional cultural identity.
3.2.1 Organizational structures
The main characteristic of the creative economy is, inorganizational terms, its “missing middle”. This refers to thefact that there is a preponderance of a small number of verylarge firms working internationally, counterbalanced by avery large number of essentially local, micro enterprises,many of which are simply single persons. Despite the com-mon image, the creative economy is not “one big machine”resonant of “Hollywood” in the early twentieth century.There is very little classical vertical integration of the kindmost commonly associated with transnational corporationsin other sectors. There is strong integration, horizontal andvertical, of parts of the creative economy; however, this doesnot extend to the micro enterprises and individual creativeentrepreneurs.
Where a research scientist may work for a big pharma-ceutical laboratory; a musician is unlikely to be an employeeof a big music corporation such as Sony or EMI. The contractual relationship will exist, but it will be associatedwith the distribution of the final product and a proportionof the intellectual property rights (IPRs). Accordingly, thereare a considerable number of artists working with large companies. A key role is played by a small number ofseparate intermediaries – usually referred to as “agents” –who broker deals between “creatives” and corporations. Aswill be further examined later in this chapter, the creativeeconomy has evolved in this way in order to manage the largeamount of risk involved in cultural business. This risk is notsimply linked to the nature of the creative product and audience preparation, but it is also associated with the timing of reaching markets.
3.2.2 Operational matters
In part, the organizational structure of the creative econo-my is a response to the possibilities of massive economies of scalethrough the mass production of creative products. The case of amusic CD is a case in point. Limited costs may be involved in thecomposition and recording of content; however, the possibilitiesare for a million or more CDs to be sold over a short period,reaping considerable returns for all concerned. With every extrasale, profits increase as the initial investment is a one-off (asidefrom marginal distribution and marketing costs).
Analy
sing t
he c
reati
ve e
conom
y
3
3.2 Organization of the creative economy

Analysin
g th
e c
reative
econom
y
3
The possibilities of this style of production and itsrepetition are the reason why the creative economy is organ-ized predominantly around “charts”, which rank top-sellingartists. Charts seek to both signal to consumers to buy andfunnel consumption into a small range of alternatives (thereby reducing waste and stockholding). However, theresult of chart-driven markets is that they are “winner takesall” in structure; profits are focused in a single or small number of winners to whom the majority of income goes;many others are lucky to cover their initial investment.Indeed, in the film industry, it is widely recognized that asmany as 80 per cent of films will fall into this category; ofcourse, it is the 20 per cent that make super profits and thuscross-subsidize the losses. The problem is that despite charts,as Richard Caves notes later in this chapter, the creativeeconomy has a “nobody knows” characteristic regardingwhich ones will be successful or not.
Again, the creative economy has organized itself toadapt to such circumstances. The risks can be offset if onehas a large enough portfolio and a sufficient turnover in anyone year so that losses can be borne until profits comethrough. However, this does mean that it is extremely difficult for individual artists or smaller groups of artists tocompete with such a model. The situation is exacerbated bythe strong control of access to the market that a small numberof distribution companies have. While the risk limitation ofconventional distributors is understandable, it does have alimiting effect on the range of creative products that tendtowards the norm and towards what worked before. Ofcourse, with luck, a small producer may strike it rich.However, this is unlikely to be a sustainable model.
It is noteworthy that this fast turnover of productsrequires continuous innovation to develop new products. Italso means that each product (a CD, for example) has a limited life and that it must be on the market in precisely theright window that accords with local taste. This can meanthat several million dollars of development that has taken ayear or more to achieve by a hundred or more people mayturn on whether it reaches the market at precisely the righttime and whether the consumers like it. In computer games,the window can be as narrow as 14 days; if the game doesnot enter the chart within this time, it is withdrawn and aloss is taken. This is a punishing innovation cycle comparedto that of most industries.
A further aspect of the rapid innovation cycle is themicro-organizational form adopted by many in the creativeeconomy. The most popular form is not the classical firm butthe project. A project team may be formed from personnelwithin a firm or with an informal network. Members will beselected to fit with the desired product. For a short time,they work as one in intensive development; after the productis completed, the project team disintegrates and participantsreform as new teams. Thus firm life can appear to be veryshort; however, the resources and expertise are in the labourpool. Film making is characterized by this format. While insome industries such as advertising project team membersmay be continuously employed by a “holding company”, inmany other industries, all of the participants may be free-lance or self employed. Thus close attention is needed interms of local strategies, data collection and labour-marketanalysis in the creative economy if these unique characteristicsare to be accurately captured and understood.
3.2.3 Locational issues
The organization and operational peculiarities of thecreative economy lead to a particular locational characteristic:clustering. Although clustering, or at least co-location, canbe identified in many industries, the particular nature ofclustering is both important and a defining characteristic ofthe creative economy.
In principle, much of what happens in the creativeeconomy can be transmitted in digital form and hence, onemight expect, there would be little spatial pull of particularlocations. However, as noted earlier, clustering is a solutionto enable the benefits of labour pooling and re-employmentof workers on new projects. Moreover, co-location andlabour mobility have a further benefit, namely, that knowl-edge and expertise are constantly circulated and updatedacross firms and projects. Furthermore, in many cases, thelocation in a consumption centre facilitates a short circuit ofproduction and consumption, allowing new trends to bedeveloped and tested. In these districts, there is considerableinformal exchange of information and ideas among competitorsthat serves them all by keeping them at the leading edge oftheir industry. Conversely, producers who are isolated fromsuch settings are at a considerable disadvantage as they maybe slightly out of touch or behind the times. As noted earlier,in winner-takes-all markets, such failure is punished severely.
63C R E AT I V E E C O N O M Y R E P O R T 2 0 0 8

64 C R E AT I V E E C O N O M Y R E P O R T 2 0 0 8
A number of methodological approaches may beadopted in undertaking economic analysis of the creativeindustries. The most common of these are basic industrialorganization analysis, value-chain analysis, inter-industryanalysis, locational analysis, copyright and intellectual property, and contract theory.
3.3.1 Industrial organization analysis
The most basic form of economic analysis is to measure the standard economic variables for which data areroutinely collected for all industries by statistical agencies:gross value of production, value added, fixed capital forma-tion, levels of employment of different categories of labour,business concentration and so on. This enables the structure,conduct and performance analyses to be carried out according to the traditional methods of industrial organizationtheory. Studies of the economic contribution of creativeindustries may be of value as a means of demonstrating, forexample, that they are not some minor economic backwaterbut account for a larger proportion of GDP than the casualobserver might have imagined.
3.3.2 Value-chain analysis
One of the most straightforward and widely recognizedmethods for analysing the structure and function of the creative industries is value-chain analysis. In its simplestform, the analytical model of the creative production chainis one where the initial creative ideas are combined withother inputs to produce a creative good or service that maythen pass through further value-adding stages until it entersmarketing and distribution channels and eventually reachesthe final consumer. The strength of this approach is that itis sensitive to both individual action and context, especiallyinstitutions, networks and their governance.
For some creative goods, this apparently simpleprocess can become more complex as the creative idea istransformed or reformatted at successive stages. For example,a musical idea might begin with a composer writing a songand passing it on to a publisher who puts it into tangibleprinted form. From there, the idea might be realized as a live
performance before an audience, with the performance subsequently being recorded and marketed by a record com-pany. The record will pass through a sequence of wholesaleand retail value-adding until bought by a consumer or it maybe uploaded onto the Internet and subsequently accessed byconsumers who pay a price for online delivery. Thus the overallchain can become quite attenuated, one effect of which is todiminish the relative share of total revenue accruing to thecreator of the original idea.
Figure 3.1 presents a generic creative-industry valuechain2 encompassing four different stages: (a) creation/conception – where the development of an idea or concepttakes place; (b) production/reproduction – the stage atwhich an idea or concept is developed further and then pack-aged; (c) marketing and distribution; and (d) consumption.One or more stages of the value chain may be carried out bythe same enterprise or individual, and, depending on theproduct, several different skill groups may be required tocomplete the chain. Consequently, creative industries’ valuechains can differ widely in terms of degrees of complexity.The chain of the film industry is often quoted as beingamong the most complex because it embraces a multitude ofinterdependent stages and skills drawn from various subsectorsof the creative industries, with each skill group required toexecute key functions in an organized, networked fashion. Incontrast, the commercialization of visual arts can entail asignificantly shorter value chain that may well includeonly two participants, i.e., the artist and the gallery (if theartist does not sell directly to the public). In terms ofcompetition analysis, each stage of the value chain canrepresent a distinct market and there may be differencesin the degree or intensity of competition between thedifferent stages.
An empirical estimate of the value added at each stagein a value chain is provided by a study undertaken for the creative industries in Canada in the year 2002.3 The totalvalue added was estimated as shown in table 3.1. It is apparent that the production stage of the value chain is themost significant in terms of value added, accounting forabout half of the total cultural value added according to thisanalysis. A further illustration of the application ofvalue-chain analysis is given in the next section.
Analy
sing t
he c
reati
ve e
conom
y
3
3.3 Economic analysis of the creative industries
2 See A. C. Pratt (2004) “Creative clusters: Towards the governance of the creative industries production system?” Media International Australia (112:50-66); A. C. Pratt (2004), “The New Economy, Creativity and Consumption”, in International Journal of Cultural Studies (7.1:117-128), March.
3 Quoted in the OECD study by Gordon and Beilby-Orrin (2007:39).

Analysin
g th
e c
reative
econom
y
3
3.3.3 Inter -industry analysis
One of the most long-standing techniques for studyinginter-industry relations is input-output analysis. Its capacityto depict the ways in which output is produced and distrib-uted in the economy, and to capture the direct, indirect andinduced effects on industries, consumers and government ofa range of external stimuli is well known. In regard to theusefulness of input-output as a tool for economic impactanalysis in the arts and cultural industries, two considerationsstand out. The first is that few input-output tables that havebeen constructed for whole economies or parts thereof havecontained a sufficiently detailed breakdown of the arts andcultural industries. Often the arts will be included, if at all,under “recreation”, “leisure”, “other services”, or some othercategorization too broad to enable meaningful analysis ofthe cultural sector. The second problem is common to allinput-output studies, namely, the stringent data require-ments. Even input-output tables constructed at a relativelyhigh level of aggregation can be estimated only after extensivedata gathering, including the necessity of some data collec-tion from primary sources. The combination of these twoproblems places a serious constraint on the extent to whichinput-output analysis can be used for studying economicimpact in the creative sector.
Some of close relatives of input-outputanalysis may be somewhat easier to apply. Forexample, social accounting matrices (SAMs) arenot quite so demanding of data and yet enablea similar sort of analysis of the inter-industryeffects of economic change. SAMs enjoyed avogue during the 1970s and 1980s, especially inthe World Bank where they were exhaustivelyinvestigated as a workable tool for developmentplanning. At that time, interest focused fairlyheavily on the traditional sources of growth indeveloping countries – agriculture, secondaryindustry, infrastructure, etc. Now, with theincreasing attention being paid to the role ofcreative industries as a source of economicgrowth in these countries, it may be that SAMscould enjoy a revival of interest as a meanstowards more rigorous analysis of the economicfunctions of these industries, assuming, ofcourse, that the necessary data can be found –this is not the case at present.
A specific aspect of inter-industry relationships that may not be fully picked up in the above-mentioned forms of analysis is the existence of beneficialspillovers from the creative sector to other parts of the econ-omy. Generally it is very difficult to capture these externaleffects without specific surveys and measurement tools.Nevertheless, such positive externalities might include:
■ knowledge spillovers, where firms benefit from new ideas, discoveries or processes developed by other firms, e.g.,through their R&D activities;
■ product spillovers, where the demand for a firm’s productincreases as a result of the product development of anotherfirm, such as when the demand for CD players rises as aresult of the development of the CD;
■ network spillovers, where firms gain benefits from other firmsthat are located nearby, such as in the clustering of filmproduction services in particular areas;
■ training spillovers, when labour that is trained on one industrymoves to another, as when actors trained in the subsidizedtheatre move to commercial theatre or television;
■ artistic spillovers, where the innovative work of an artist or acompany advances an art form to the benefit of otherartists or companies.
65C R E AT I V E E C O N O M Y R E P O R T 2 0 0 8
Figure 3.1 Creative-industry value chain
CREATION DISTRIBUTIONRETAIL &
CONSUMPTIONPRODUCTION
Total cultural value added(in millions of $Can)
Creation 5,713Production 19,829Support services 4,231Manufacturing 7,285Distribution 2,865Total 39,923Proportion of GDP (%) 3.46
Source: Statistics Canada.
Table 3.1 Value chain in the cultural industries in Canada, 2002

66 C R E AT I V E E C O N O M Y R E P O R T 2 0 0 8
3.3.4 Locational analysis
An important approach to economic analysis appliedto the creative sector is the model of creative clusters due toMichael Porter. In his original work on the competitiveadvantage of nations (Porter, 1990), he put forward a micro-economic based theory of national, state and localcompetitiveness in the global economy in which clusters havea prominent role. Clusters are geographic concentrations ofinterconnected companies, service providers, etc., that compete but also cooperate.
Porter’s model is often depicted in the form of a “diamond” showing the sources of locational competitiveadvantage. A simplified version of the diamond is shown infigure 3.2. This model is readily applicable to the creative
industries, where the opportunities for creative clusters areevident in subsectors such as film production, fashion, designand so on.
Although creative clusters may grow of their ownaccord when commercial businesses spontaneously sense theadvantages from co-location with other firms, there may alsobe a role for policy to start the process. For example, start-up investments may be facilitated via government programmes to encourage firms to locate in a particular area,with a view to enabling the industry to become self-sustainingonce a critical mass has been reached. Some researchers, however, have pointed to the relative weaknesses of the standard Porter model of business clusters in relation tointernational transfers and international organizations.4
Analy
sing t
he c
reati
ve e
conom
y
3
Figure 3.2 Simplified diagram of Porter's model for clusters
Context for firm
strategy and rivalry
A local context that
encourages investment
and growth, with
vigorous competition
among local rivals
Related and
supporting industries
Factor input conditions Demand conditions
Box 3.1 Creative clusters
A distinctive feature of creative enterprises is that they thrive only in one another’s company. Whether they are artists in the East End of London, film makersin Bollywood, fashion designers in Milan or animators in Seoul, creative enterprises gather together in visible hot spots which, when fully established,become self-sustaining clusters of creative activity. This happens at every level, from the media centre in a small town to global centres such as Hollywood.
The purpose of the United Kingdom Creative Clusters Conference (www.creativeclusters.com) is to understand why the sector develops in this way and toexamine the consequences for development policy. As we do this, it becomes apparent that the lessons learned have a wide application across other areasof social and economic development.
Why clusters?
Clustering is not confined to the creative sector. Specialist markets, neighbourhoods devoted to particular trades and region-based industries have alwaysexisted. Clusters develop naturally, often linked historically to a natural advantage, and they persist as long as it is in the interests of new enterprises to
4 See A. C. Pratt (2008), “Cultural commodity chains, cultural clusters, or cultural production chains?” Growth and Change (39:95-103).

Analysin
g th
e c
reative
econom
y
3
67C R E AT I V E E C O N O M Y R E P O R T 2 0 0 8
Box 3.1 continued Creative clusters
join them. There is a substantial literature analysing clusters, from Alfred Marshall in 1920 to contemporary economists such as Michael Porter andMichael Enright. Broadly, they agree that clusters confer competitive advantage on their constituents because:
■ proximity sharpens competition and drives up standards;■ proximity encourages collaboration and diffusion of good practice between firms;■ a sophisticated local market can develop around a cluster, stimulating innovation and improving marketing;■ clusters can develop place-based branding, benefiting all firms in the cluster;■ proximity enables small companies to band together into alliances and networks, giving them some of the advantages of larger ones – for example,
by giving them better access to suppliers and resources;■ an infrastructure of specialized professional support services is encouraged to develop; and■ clusters become a focus and a magnet for outside investment.
Like coal and steel clusters, clusters of creative businesses may owe their original provenance to an accident of geography or climate: Hollywood, it issaid, is there because of the sunshine. There are, however, some special reasons why clustering occurs in the creative sector and why it is found rightdown to the level of individual streets and buildings.
While creative people are highly mobile, the big producers and distribution companies on which they ultimately rely are not, so creative talent is drawnto the places where distributors are located. Creative businesses need this pool of specialist labour to scale up to cope with big projects such as filmsand games. In its turn, this talent pool of creative people and services encourages a discerning local market, which is essential for creative producers tounderstand new trends and fashions, the engine of innovation in this sector. A sophisticated local market is a key component of a creative cluster:creative clusters are clusters of both production and consumption.
Reputation is a critical and often overlooked factor. No matter how much intellectual property their past work has generated, the future prospects of a creative enterprise are determined by its reputation. The best place to build and manage reputation is at the centre of the action, among discerning peersand customers eager to spot new trends and talent. The reputation of the cluster itself is also important. Everyone associated with a successful cluster sharesin its reputation so new arrivals receive a free gift, a small boost to their kudos, just for turning up and joining in. In addition, once a place has a reputationas being the centre for a particular specialism, it is hard for new places to displace it. A cluster’s reputation is the key indicator of its sustainability.
These are the factors that explain the peculiar dominance of places such as Hollywood, London and Paris in their respective creative sectors.
Business engagement
Many cluster programmes find it hard to win the support of existing businesses. Local firms may discourage “incomers” and tend to prefer closed networks to open clusters. Larger firms may not take part at all or will use cluster programmes to consolidate their position. There may be a reluctanceto commercialize cultural products, particularly from creative enterprises used to the non-profit sector.
The root of the problem is that creative enterprises are in business not for economic development but for their own mixed cultural and business purposes,so arguments couched in broad development terms will not win them round. Nevertheless, the engagement of creative people is essential to the success ofany cluster programme, and a key task for the cluster manager is to find the programmes and the language that will make allies of them.
Creative clusters are hard to develop (and perhaps harder to define), but the characteristic features of successful clusters are widely agreed:
■ connectivity to the world: creative entrepreneurship thrives where local and global cultural forces interconnect;■ cultural diversity, free trade and free expression: openness and a through-flow of new people, new ideas and new products;■ production and consumption: the beginning and end of the supply network (maybe not the middle); and■ more than business: art, education, culture and tourism.
Finally, some exciting “big-picture” insights from Creative Clusters Conferences begin to show how policies for the creative industries are relevant to allsectors of the global economy:
■ places without strong creative clusters will lose their creative people and businesses to places that have them;■ locally rooted creative clusters are highly resilient to global competition;■ a key survival strategy for non-knowledge-based firms is to anchor themselves to local creative industries;■ building creative clusters requires that cultural and economic development come together and act in concert; and■ cultural diversity is an economic asset and a source of competitive advantage.
By Simon Evans, a cultural entrepreneur and founder of Creative Clusters Ltd.

68 C R E AT I V E E C O N O M Y R E P O R T 2 0 0 8
3.3.5 Copyright and intellectual property
The relatively new concerns with the creative economyhave highlighted the fact that material goods may be separatedfrom their symbolic, cultural or artistic values through cultural production processes, notably via digitization. Thisis not a new problem; it is one that IPR/copyright seeks toaddress. What is new is the balance of value divided betweenthe material and the virtual, and the possibility of separatingthem. Previously, many IPRs were regulated de facto via theregulation of physical goods in which IPRs were effectivelylocked up. Much of the commercialization of the creativeindustries has involved the innovation of new ways to lockup valuable IPRs in physical or virtual containers (encryp-tion is an example). The recognition that the intellectualproperty is where a large share of values lies has been reflectedin the shift by large corporations to include IPR and brandvalue on their balance sheets and to present them as a corecomponent of company valuations.
The challenge for researchers and policy-makers aswell as those concerned directly with the creative economy isthreefold: how to measure the value of intellectual property,how to redistribute profits, and how to regulate these activities.As will be further elaborated in chapter 4, the measurementof intellectual property is very difficult using tools that weredeveloped mainly to capture the physical movement ofgoods. Regulation and redistribution remain interrelated andproblematic. Poor or irregular distribution of IPR earningsdue mainly to institutional inadequacies undermines thelegitimacy of an IPR legal regime.
Moreover, there are some structural challenges to policyand practice associated with uneven development. The creative industries as a whole are characterized by first-moveradvantage and a winner-takes-all form. Thus, the developedworld is in a strategically very powerful position.Furthermore, the legal resources and techniques elaboratedin the developed world do not mesh with more traditionalmethods of attributing cultural and economic values. Thisleads to the perfectly legal, but morally anomalous, positionof a company from a developed country that can use anunregistered intellectual property in a developing countryand register it as its own in another country. The developingcountry then has no legal claim to what it may regard is itsown intellectual property. It is for this reason that consider-able assistance is needed to extend the logic of intellectualproperty in the developing world and to sustain a viable system for the collection and distribution of IPRs.
3.3.6 Contract theory
Complex creative industries such as film and televisionproduction depend on the existence of contractual arrangementsat all stages in the value chain. Richard Caves’ book on the creative industries (2000) identifies the peculiarities of culturalproduction that cause contracts in the creative industries to beunlike those in other areas of the economy. Caves proposes thatcreative activities are characterized by several fundamental prop-erties, beginning most importantly with the uncertainty ofdemand, epitomized in the well-known Hollywood aphorism,“nobody knows”. This property means that at virtually no stagein the production sequence can the project’s final outcome be predicted with any degree of assurance: sleepers inexplicably turninto smash hits, and sure-fire successes flop. Next comes whatCaves labels the “art-for-art’s-sake” property, the fact that creativeworkers care passionately about the quality of their product andwill therefore often behave in ways that are contrary to the predictions of rational market labour theory. Other characteristicsof creative products that he suggests include their infinite variety,the fact that they require diverse and vertically differentiatedskills, and their durability, which enables them to yield rents overa long period. These properties make it all but impossible to writea complete contract at any stage of the game. So, in response tothe dual motivation of artistic and economic incentives, the creative industries have evolved a variety of means for organizingthemselves and for doing deals that serve the interests of all participants as effectively as possible. Caves’ analysis relates to thecreative sector of the United States and at present is of limitedrelevance to most of the developing world. However, as the cre-ative industries continue to expand and become more diversifiedin developing countries, the importance of an effective contrac-tual basis for their operations is likely to grow, as illustrated in theexamples presented in the boxes and subsections.
The general case for value-chain analysis can be considered compelling. However, work on the organization ofcreative production chains has pointed to the importance ofaudience feedback and critique as well as market research on thecreative economy. Moreover, while value-chain approaches havesought to maximize economic value, production-chainapproaches have sought to stress the nature of the cultural product as well as price. This is why we advocate production-chainapproaches. More sustainable cultural production systems havewell-developed critical feedback mechanisms, and less sustain-able ones, little feedback. The development of this “critical culture” often rests on a longer-term investment in the fundingof public arts and education as well as the promotion and sustenance of a viable civil society; these latter resources arecommonly weaker in the developing world.
Analy
sing t
he c
reati
ve e
conom
y
3

Analysin
g th
e c
reative
econom
y
3As a consequence of practice in the creative economy,5
the profile of the creative industries is distinctive although,in a broad sense, the structure of the creative economy ismuch the same for industrialized and developing countriesalike, comprising a productive sector, a distribution and marketing network, and a body of consumers who demandcreative output in its various forms. However, there are likely to be differences between countries in the relativeimportance of the different components of the creativeeconomy, depending particularly on countries’ differentstages of development.
3.4.1 Predominance of small and medium-sized enterprises
Small and medium-sized enterprises (SMEs) – manyof which are micro or sole trader businesses – predominantlypopulate the various stages of the supply chains of creativeproducts in many countries. Information from availablestudies confirms that this market structure is evident acrossboth developed and developing economies.6 Micro and smallenterprises are especially evident at the top of the supplychain (creation stage). The prevalence of individuals andSMEs is not unexpected given the reliance of creative indus-tries on creativity. There is a chronic oversupply of talent.Indeed, UNCTAD (2004) states that creativity is deeplyembedded in every country’s cultural context so that allcountries are assumed to have at their disposal an abundanceof raw creative talent and as such, the potential to grow creative industries. At the level of the individual, talent isunique and results in monopolistic competition7 based on adifferentiated product (talent), which softens competitionand lowers the barriers to entry.8
In some countries, creative SMEs exist alongside andcompete against a few large vertically integrated firms, result-ing in asymmetric competition. For example, in the UnitedKingdom, particularly in software and computer gamesindustries and to a lesser extent in advertising and film, small
firms compete against significantly larger multinationalfirms. Cutler & Company (2002) paints a similar picture forthe interactive games and advertising industries of Australia.According to HKDC (2002), the Hong Kong SpecialAdministrative Region (SAR) of China is the advertisingcapital of Asia and the Asian hub from which many interna-tional advertising, architecture, design, and art and antiquesagencies run their regional operations.
Creative industries are characterized by interlockingand flexible networks of production and service systemsspanning the entire supply chain. Thus, notwithstanding theasymmetric competition between the small and larger creative firms, the available evidence suggests that smallercreative firms do gain from the presence of larger firms inthe industry to the extent that these larger firms and multinationals are an important source of commissions andcapital whether through subcontracting and outsourcingarrangements or joint ventures.
Strategies for developing domestic creative industriesthat are outward-looking and actively target FDI and exportmarkets in addition to local markets for creative productsappear to be a key feature of successful creative industries. Inthis context, East Asian countries stand out. For example, theSingapore strategy is aimed at establishing a reputation forSingapore as the new creative hub for Asia. Among the listof international creative industries, Singapore has succeededin attracting international film financing company RGMHoldings, electronic games developer Koei from Japan, andautomotive and product design studio BMW Design works.In addition, 53 foreign media companies have set up regionalheadquarters or hubs in the last four years. Similarly, theindustries of Hong Kong SAR are highly export-orientedgiven the small size of the local market and have benefitedfrom their spatial and cultural proximity to the huge marketof mainland China. Likewise, the creative industries of theUnited States, which are very competitive and have anestablished reputation, vigorously pursue opportunities inexport markets.
69C R E AT I V E E C O N O M Y R E P O R T 2 0 0 8
3.4 Structure of the creative industries
5 It is important to note that there are also significant differences within the creative economy in different industries in terms of employment norms, training, and ownership.6 See, for example, Kamara (2004); UK Trade & Investment (2005); KEA (2006); New Zealand Trade and Enterprise (2006); Higgs et al. (2007); and HKTDC (2002).
It should be noted that the size measurements are relative as what is small in one context might be considered medium-sized or perhaps large in another. 7 Competition among many sellers whereby no one seller can influence its rivals directly and competitors’ products are differentiated even if by very small dissimilarities.8 The requirement for prior investments in formal education represents a constraint to entry for certain creative professions although this is probably less applicable to the cultural
subgroups of the creative industries.

70 C R E AT I V E E C O N O M Y R E P O R T 2 0 0 8
The prevalence of SMEs in the creative sector underlines the need for policy-makers to address size-relatedconstraints. SMEs in creative industries are susceptible to thesame constraints that afflict small enterprises in other areasof the economy. Chief among these constraints is access tofinance to develop creative projects. The transformation ofcreative ideas into goods or services is usually capital-intensiveand the cost of technological inputs or other professionalservices can be significant for these industries. In short,access to finance remains one of the key hurdles for creativeentrepreneurs looking to realize their creative ideas. Asalready mentioned, larger enterprises are one source offinance to SMEs. Creative SMEs do better in economieswhere the financial sector is better adapted to financingSMEs and where creative industries are officially recognized.In this context, SMEs in most developing countries are at adisadvantage, particularly since the concept of creativeindustries is still very new and financial institutions are traditionally risk-averse.
Other challenges faced by SMEs include a lack ofbusiness skills relating to marketing and financial manage-ment, information asymmetries and resource constraintsaffecting access to up-to-date technologies. In many develop-ing countries, the support network of local industry participants providing complementary services is largelyabsent when compared to more developed countries.Consequently, the competitiveness and ability of developingcountries to grow recognizable industries in the creative sec-tor are compromised. For instance, in many developingcountries, it is more common that the proprietor fulfils anumber of organizational roles – producer, agent, marketerand retailer (see, for example, Ambert, 2003, and The TrinitySession, 2003). This is significant because the level ofspecialization or availability of local, specialized participantsalong the supply chain appears to be highly correlated withthe competitiveness of creative industries. On the whole, thesupply chain of creative industries in many developing coun-tries appears to exhibit a number of gaps and fragmentation.In particular, there is an absence of intermediaries who playan important role as gatekeepers.
Gatekeepers perform an often critical role in creativeindustries because there is a considerable amount ofuncertainty about whether or not a creative idea will be
commercially successful both at the early and later stages ofthe value chain. The gatekeeper effectively picks the winnersfrom losers. For instance, galleries or art agents who interpretand promote visual arts are gatekeepers and the tour operator performs a comparable function where tourism9 isconcerned. Similarly in the audiovisual, book and computergames industries, various intermediaries such as talent scouts,agents, editors, recording studios and publishers function asgatekeepers and can be critical to enhancing the marketability oftalent and creativity in addition to securing distribution deals.
For example, there are numerous cases in the musicindustry of South Africa where there remains a dearth ofentertainment lawyers despite the fact that the music industryin this country is fairly well established. Consequently, artistsoften opt to sell all their rights in exchange for a one-timeupfront payment.10 This practice is criticized by some com-mentators because they interpret this as a choice to forego aregular and steady flow of income in favour of a livelihoodthat is dependent on a punishing schedule and the prolificrelease of albums. An alternative interpretation is that this is,in fact, a pragmatic approach in light of the fact that individual artists are ill-equipped to manage their rights anddoing so would in any case be extremely complex and costly.Indeed, the advice from WIPO would seem to support thelatter interpretation.11 Further support for the latter interpre-tation can be found in an oft-repeated complaint by theCaribbean music industry that collection societies in developed countries fail to capture airplay and live perform-ance statistics for Caribbean music played overseas while theCaribbean collects and distributes significant royalty payments abroad. This perceived unfairness in treatmentmeans that Caribbean artists receive very little by way ofroyalty payments from outside the Caribbean and it is furthermotivation for artists in developing countries to opt for one-off payment.
Many artists in developing countries, and most recentlyalso in developed countries, are turning to live performancesas the main source of their livelihood because this avenueallows them to capture revenues directly. Madonna is themost recent high-profile artist who has taken this route byswapping her record label for an event promotion company.Indeed, Legros (2006) states that creators may benefit fromthe distribution of illegal copies in that even if they cannot
Analy
sing t
he c
reati
ve e
conom
y
3
9 Tourism is an important vehicle through which many creative products access consumers.10High levels of piracy, in addition to general unfamiliarity with copyright systems and the considerable administrative workload and costs relating to administering copyright,
provides an additional incentive to many creators in developing countries to sell their rights in exchange for an upfront one-time payment.11The WIPO guide on copyright and related rights for SMEs makes the point that one-off payments will often add up to much greater profits for business than direct exploitation
of copyright by the author, creator or copyright owner.

Analysin
g th
e c
reative
econom
y
3
appropriate the monetary gains, they may be able to appro-priate the reputation gains (e.g., positive effects for live-performance audience numbers) and as such tend to favourweaker copyright than would distributors. The move by theartist Prince to give away “free”12 copies of his new album incollaboration with the London Daily Mail newspaper in thelead-up to what turned out to be a very successful series oflive concerts is a case in point.
Notwithstanding the positive role played by gatekeepersin creative industries, the fact that the supply of talent typically far outstrips the number of gatekeepers in any oneindustry is of concern because it accords the gatekeepersmarket power that manifests as asymmetric bargaining powerbetween individual creators and gatekeepers. It also createspoints of congestion along the supply chain. This situationhas a profound influence on contract terms and can result inlow returns, particularly for creators who have not alreadyestablished a reputation for themselves.
3.4.2 Large-scale corporate enterprises
In the global economy, the largest producers ofcreative goods and services measured in terms of value ofoutput are large commercial corporations, located particularlyin the audiovisual and publishing industries. Within nationaleconomies, large corporate enterprises are found to a varyingextent in the cultural subgroups, their size depending on thecountry’s stage of development. Sometimes they arisethrough the growth of domestic firms producing creativegoods, and sometimes they occur as subsidiaries or branchesof larger transnational corporations. The business models inthese subgroups of the creative economy are different fromthose applicable to the sorts of enterprises discussed earlier.For example, large-scale commercial operations have morecomplex value chains, more differentiated managementstructures, and a larger labour force than firms at the smallerand simpler end of the spectrum.
Large enterprises producing creative goods and servicesare often involved in areas using new communication technologies with digital applications and supplying massconsumer markets. Although the goods and services pro-duced are classifiable as cultural products, the motivations ofthe firms are likely to be more profit-related than cultural in
nature. Furthermore, if the enterprises are subsidiaries oflarger corporations whose headquarters are located else-where, host countries may lose some or all of any surplusearned if profits are repatriated to the parent company.
In higher-income countries, the creative economytends to be more technologically advanced and service-oriented and the creative industries tend to be dominated infinancial terms by large conglomerates. In many cases, theseenterprises have strong market power in important creativesubsectors such as computer services and software, mediaand entertainment, and publishing and printing, which aredominated by global corporations. The four major companiesin software are all United States-based, the largest beingMicrosoft with profits in 2005 exceeding $8 billion. Thebiggest media, music, entertainment and publishing companieson a world scale are based in France, Germany, Japan and theUnited States, the two largest being Time-Warner and Walt Disney.13
3.4.3 Public or quasi-public cultural institutions
A significant amount of the movable and immovablecultural capital of any country is held in public or quasi-public institutions such as museums, galleries, archives,monasteries, shrines, historic buildings, heritage sites, etc. Inaddition, these institutions are also often repositories ofintangible cultural capital, as in the case of heritage loca-tions, for example, which are inextricably bound up withtheir history and with the rituals and customs with whichthey are associated. These institutions contribute culturaloutput primarily in the form of services, consumed by bothlocal people and visitors. With regard to the latter, thetourism potential of some of these institutions may be sub-stantial. Hence, to the extent that they attract internationaltourists, they may be able to make a significant direct or indirectimpact on the foreign exchange earnings of the country.
3.4.4 Individual artists and producers
Creative workers of one sort or another – primarilycreative artists such as actors, dancers, musicians, sculptors,painters and writers – are found at the originating end of the
71C R E AT I V E E C O N O M Y R E P O R T 2 0 0 8
12The newspaper is reported to have compensated him handsomely, so this case is also an example of an alternative distribution system that bypasses mainstream distribution channels.There are many other examples of musicians, both big and small, who are testing the boundaries of the current system. An emblematic example was that of the band Radiohead that,in 2007, offered its new album online for a voluntary contribution. This is clearly an important potential site for policy and institutional innovation that has opened up.
13Data from the Fortune and Forbes rankings, quoted in Anheier and Isar (2007:448).

72 C R E AT I V E E C O N O M Y R E P O R T 2 0 0 8
value chain. They supply the raw creative material that maybe sold as finished product directly to consumers or, moreoften, as inputs to the next stage in a given productionsequence. Whether in a developed- or developing-countrycontext, the artistic content will often be drawn from cultur-al forms and practices belonging to the country or to thelocal community. Despite the high levels of skill that thesepractitioners typically have, their financial reward tends to berelatively low. Nevertheless, the practice of the arts is likelyto yield substantial cultural value, and the non-market bene-fits that artists generate need to be recognized and promul-gated in policy strategies towards the cultural sector.
What is the relative importance of these four groupsof producers in the productive sectors of the creativeeconomies of countries at different stages of development?In particular, how does large-scale commercial cultural pro-duction relate to the economies of countries in Africa andLatin America? If experience from the industrialized worldwere applied, it could be concluded that the large-scale, dig-itally oriented, mass-consumption industries could be seen asthe agent for economic dynamism and structural transforma-tion in the developing world as well. Certainly, this has been
true for those developing countries already embarked on arapid growth path such as the emerging economies of Asia;their development policy continues to provide a strong focuson promoting commercial creative industries. For the major-ity of the developing world, however, more widespread andmore far-reaching gains are likely to be found by concentrat-ing attention on fostering smaller-scale enterprise andencouraging a more locally oriented process of linking eco-nomic and cultural development.
Nevertheless, whatever the stage of development, inideal terms, all four groups discussed above need to beaccounted for in any creative-industry strategy. While it isimportant to recognize that community-based developmentmay have better immediate prospects of achieving povertyalleviation and other economic and social goals at the locallevel than does a reliance on the “trickle-down” from larger-scale commercial development occurring primarily in urbancentres, countries in a globalizing world cannot afford toremain outside the knowledge economy. They thus need tocultivate the creative industries that will facilitate access tothe benefits of the information age within the limitsimposed by their particular stage of development.
Analy
sing t
he c
reati
ve e
conom
y
3
Box 3.2 Broadcasting creativity blooms in South Africa
Post-apartheid South Africa has seen television achieve its current state of unprecedented creativity in just over a decade through a series of contradictoryinfluences that makes it unique. The country has shaken off the bonds of national culturally specific media, and the modern media, including television, areinfluenced by the pressures of diverse cultures and interests. They have given rise to highly creative and popular local content as well as a continuous output of material of questionable cultural value. Two Oscars awarded to South Africans have at the same time propelled ambitions to the global markets,seemingly unaware that international standards take time to develop.
Media seem divided between the commercially owned and profit-driven media, the public and government-owned media, and the community-owned media.There is no community television yet in South Africa, mainly as it is vehemently opposed by the interests within community radio and community print media.
At first glance, South African television consists of the polar opposites of public and commercial television. However, the situation is not as simple as that.The regulator, the Independent Communications Authority of South Africa (ICASA), dictates the percentages of local content, often specifying the genreand time slot. Local content in general costs ten times imported foreign content. The local soap opera, “Generations”, costs about $24,650 for half anhour compared to $2,300 for the same duration on imported “Bold and the Beautiful”, yet they both charge the same for a thirty-second spot ($8,300).On this basis, “The Bold” makes twice as much in clear profit as the local “Generations”. Local content in this way needs to be cross-subsidized by low-cost fare that is important to both commercial and public television.
There are now three broadcasters: SABC with three channels and the lion’s share of the market; one commercial free-to-air station, e.tv; and the satellite broadcaster DStv, which broadcasts over 60 channels (a few of them locally produced) by subscription only. There are 9 million households withtelevision in South Africa. DStv has 1 million of them (at $63 a month). Its local channel, M-Net, combines with the local sport channel, SuperSport. Printmedia, television and radio remain the main sources of information, as the Internet is still accessible to only 10 per cent of the population.
Commercial television accepts these local content quotas (and the higher cost of content) as the price it must pay for the operating licence. It appeals tothe creativity of writers, directors and producers to make local hit programmes that, despite their high cost, still make a profit, draw in large audiencesand develop channel loyalty.
Commercial television is also behind the mass purchase of international formats such as “Weakest Link” and “Big Brother”. Thus, while it encourages localcreativity, it also stifles it with imported formulaic stagnant programmes that tend at the same time to enforce the mediocrity that comes with globalized creativity.

Box 3.2 continued Broadcasting creativity blooms in South Africa
Analysin
g th
e c
reative
econom
y
3
73C R E AT I V E E C O N O M Y R E P O R T 2 0 0 8
On the other hand, the public broadcaster (SABC) has innate contradictions of its own. It has a stringent public service mandate, a local content quota of80 per cent, and a mandate to pay for itself through commercial programmes. Naturally, it, too, wants to make a profit that provides for further capitalexpenditure, so it rushes to buy the least expensive, imported hit programmes and also the sanitized formats that deliver higher income at lower risk.However, it will also try to leverage popular appeal and the resultant income from popular local programmes.
Profitable local content, however, is not always possible for a public broadcaster mandated to produce educational and public information programming (aprogramme on legal rights is hardly likely to attract the same revenue as a soap opera). The content of public television programmes has been largely orien-tated towards the provisions of government priorities and constitutional mandates. Hence programme themes are closely related to “nation-building” fromHIV avoidance to gender equity and non-discrimination. Even local public soap operas have social intentions, and the global models for socially responsibledrama are closely followed.
The television sector has grown appreciably. The increase in ad revenue over the years 2000-2006 indicates growth far in excess of that of other nationalindices such that for television, ad revenue grew more than 259 per cent and for the cinema, it increased by 564 per cent in the same period (AC Nielsen).
This growth in income has largely had to pay for local product. Between 2000 and today, local content has grown by a factor of three, replacing the far moreprofitable imported product. Unfortunately, this has not had a significant impact on job creation. Less expensive equipment also leads to greater efficiency, withfewer people required to do more work. Perceptions are that busy people are working harder and do not have the time to train the new entrants, who then findit slow to gain experience. Despite the country’s focus on outcome-based training, there has been slow growth in the number of outcome-based trainers.
South African content has made little global impact. There is a regular flow of soap operas into other African countries, but the latter pay very little for thiscontent although where sales occur, such as in Jamaica, they receive much media hype. There has always been a steady flow of wildlife programming, butagain these are largely commissions from the global channels. Sales are made into the Caribbean, and while South Africa buys Hollywood and Bollywoodmovies, there is no reciprocal flow. As such, the rest of the world is the serious competitor, and the first signs of South African cultural promotion may beapparent at the Soccer World Cup in 2010.
© SAARF 2006
SO
UR
CE
: S
AA
RF
AM
PS
®
%
Broad media consumption 2004-2006
0
20
40
60
80
100
Any TV – Y Any Radio– Y Any Newspaper
2005RA2004 2006RA
67
66
.9
66
.2
78
78.1 79
.7*
39
36
34
.735
.1
6 66.0
6.06.5
6.4
91
90.2
88
.6*
40
.0 41.6
*
* Significant change
* Significant change
* Significant change
Any Mgazine Cinema p6w Internet p4wAny Outdoorp7d
There is hardly any government support for television. SABC has receipt of the local television licences ($32 a year), but nearly half of households do notpay and SABC must pay for the cost of collection. It is hoped that, when SABC goes digital terrestrial, licence collection will increase to almost 99 per centat a negligible cost of collection, but this will start only at the end of 2008, with analogue switch off at the end of 2011.
Yet South Africa has a major lesson to offer the world: if you are going to promote your television industry, promote it actively and forcefully. Lessons from manyother countries show that deliberate and bold action over a sustained period makes an impact. The belief of the Government that the creative industries shouldpay their own way is largely the reason why the growth has been small and the global trade insignificant.
There also have been no formal or statistically acceptable skills, jobs, turnover or tax contribution audit. There is no national standard for film and television education and training.
In conclusion, the aggressive promotion of local content quotas has grown the South African industry and substantiates the worldwide phenomenon thatpeople like local programming but it also shows that this is not enough. There must also be an aggressive, all-encompassing approach that covers thefull extent of the value chain from idea development, through training and production, right up to distribution and marketing.
By Howard Thomas, Director, Busvannah Communications, and researcher and trainer in the broadcasting field in South Africa.

74 C R E AT I V E E C O N O M Y R E P O R T 2 0 0 8
Some segments of the value chain, notably marketingand distribution, are particularly prone to high levels ofconcentration. Small creative firms have traditionally had tocollaborate with larger distributors in order to reach orexpand the market for their products. This concentration toa large extent reflects the magnitude of the costs and theeconomies of scale associated with this segment. In this con-text, the global dominance of the music and film industry bythe so-called majors is well known. Their smaller competitorsare particularly affected by the majors’ use of aggressive commercial practices and business models that can imposesignificant restraints on trade (see box 3.3). The ambiguityabout whether or not the business practices of media con-glomerates are welfare enhancing makes the application ofcompetition policy very difficult and especially challenginggiven the global nature of these industries (Acheson andMaule, 2006). In most cases, domestic markets are too small(and in many cases culturally and linguistically fragmented)and undercapitalized for local industries to attain the requisitemarket size to be competitive. The natural market for thisindustry is thus transnational. The ability of the Americanaudiovisual industry to amortize production costs on a large,dynamic, domestic market characterized by linguistic andcultural homogeneity is a major contributing factor to itscompetitiveness and global dominance. American producersare able to sell their audiovisual products around the globe atprices that local producers find difficult to match. Their efficientworldwide network of dominant brands reinforces theirhegemony.
Creative products are subject to demand uncertaintybecause consumer valuation of a product is unknown before-hand. Consumer valuation is extremely difficult to predictbecause it is not based on subjective criteria; taste is acquiredthrough consumption and is subject to a number of factors,including culture, fashion, self-image and lifestyle (the“nobody knows” property; see box 3.3). Distributors usuallyassume the role of promoting the final product to the con-sumer. The investments made in promotion and marketingcampaigns can be considerable and well beyond the budgetsof small firms at the top of the supply chain. The proliferation
of creative products that are differentiated by quality,uniqueness and ranking (the infinite variety and A list/B listproperties14) and the need to spread the risk across many creative products so that profitable products subsidize othersthat are not so profitable are additional features that are asso-ciated with economies of scale in distribution. Experienceddistributors are in a relatively superior position in terms ofassessing the commercial prospects of a creative project asreflected in their critical role in financing through advances thecreative products for which they obtain distribution rights.15
Most of the distribution channels for creative productsare governed by large multinationals. Nevertheless, even inthis particular segment, there is room for a competitivefringe16 of small distribution firms that often service nichemarkets although if their products are particularly successful,they run the risk of attracting the attention of the larger distributors. The relationships between the small distributorsand their larger competitors is characterized by a mixture oftension (because of the asymmetric competition and bargaining power that results in the poaching of talent bylarger distributors from small distributors) and mutuallyreinforcing interaction (because the smaller distributors are arich source of new talent and creative products for the larger players and many of them enter into distributionagreements with larger distributors).
Securing a good distribution deal can make or break acreative entrepreneur. The market power that distributorspossess can potentially be exploited to the detriment ofcreators through low returns. Creators must often cede theirproperty rights to the distributors in exchange for distribu-tion services. The fact that the lion’s share of the economicreturns from creative products are most often retained bythose who control the distribution channels is somethingthat many artists find hard to contend with, particularlywhen their creation proves successful and spawns other creativeworks (for example, the hard-cover book that is subsequentlyreleased in paperback, then turned into a screenplay for amotion picture). Spin-offs from the motion picture mightinclude the soundtrack score issued as a recording, a televisionseries and characters from the motion picture issued as toys.
Analy
sing t
he c
reati
ve e
conom
y
3
3.5 Distribution and competition issues
14See Caves (2000).15Acheson and Maule (2006).16Defined as a large number of firms within an industry, each having negligible market shares. The combined market share of the competitive fringe is often substantially
less than that of the dominant firm(s).
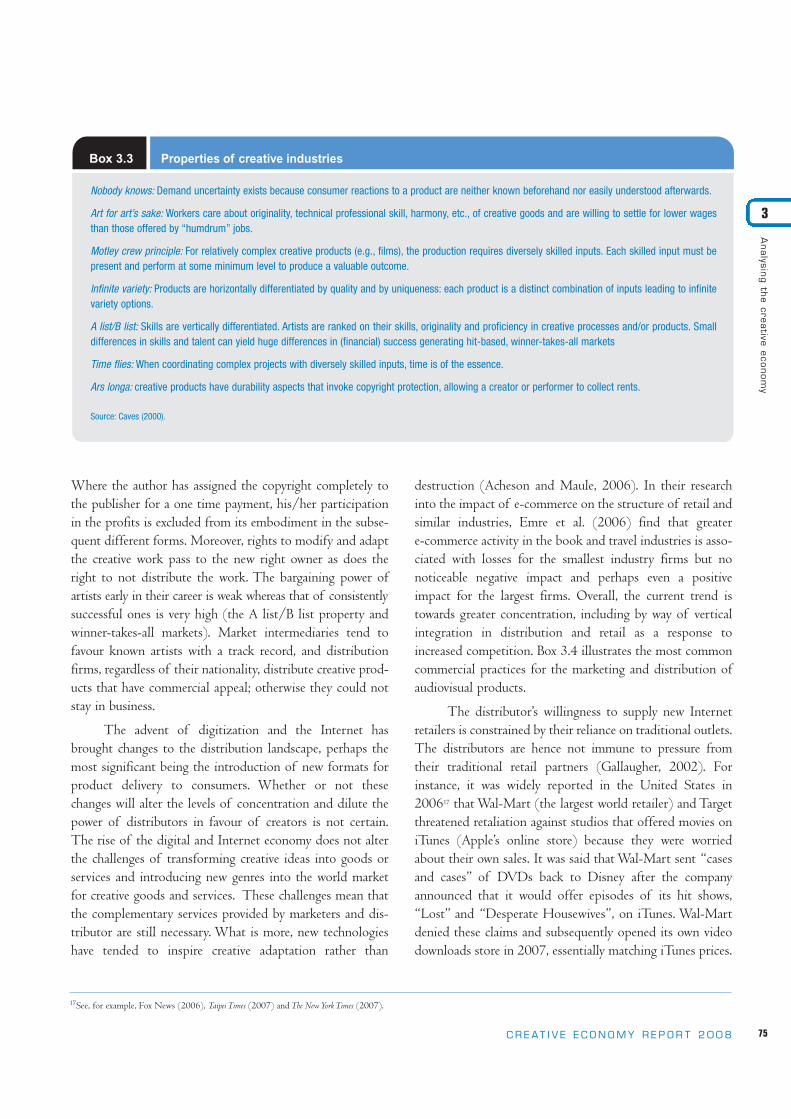
Analysin
g th
e c
reative
econom
y
3
Where the author has assigned the copyright completely tothe publisher for a one time payment, his/her participationin the profits is excluded from its embodiment in the subse-quent different forms. Moreover, rights to modify and adaptthe creative work pass to the new right owner as does theright to not distribute the work. The bargaining power ofartists early in their career is weak whereas that of consistentlysuccessful ones is very high (the A list/B list property andwinner-takes-all markets). Market intermediaries tend tofavour known artists with a track record, and distributionfirms, regardless of their nationality, distribute creative prod-ucts that have commercial appeal; otherwise they could notstay in business.
The advent of digitization and the Internet hasbrought changes to the distribution landscape, perhaps themost significant being the introduction of new formats forproduct delivery to consumers. Whether or not thesechanges will alter the levels of concentration and dilute thepower of distributors in favour of creators is not certain.The rise of the digital and Internet economy does not alterthe challenges of transforming creative ideas into goods orservices and introducing new genres into the world marketfor creative goods and services. These challenges mean thatthe complementary services provided by marketers and dis-tributor are still necessary. What is more, new technologieshave tended to inspire creative adaptation rather than
destruction (Acheson and Maule, 2006). In their researchinto the impact of e-commerce on the structure of retail andsimilar industries, Emre et al. (2006) find that greater e-commerce activity in the book and travel industries is asso-ciated with losses for the smallest industry firms but nonoticeable negative impact and perhaps even a positiveimpact for the largest firms. Overall, the current trend istowards greater concentration, including by way of verticalintegration in distribution and retail as a response toincreased competition. Box 3.4 illustrates the most commoncommercial practices for the marketing and distribution ofaudiovisual products.
The distributor’s willingness to supply new Internetretailers is constrained by their reliance on traditional outlets.The distributors are hence not immune to pressure fromtheir traditional retail partners (Gallaugher, 2002). Forinstance, it was widely reported in the United States in200617 that Wal-Mart (the largest world retailer) and Targetthreatened retaliation against studios that offered movies oniTunes (Apple’s online store) because they were worriedabout their own sales. It was said that Wal-Mart sent “casesand cases” of DVDs back to Disney after the companyannounced that it would offer episodes of its hit shows,“Lost” and “Desperate Housewives”, on iTunes. Wal-Martdenied these claims and subsequently opened its own videodownloads store in 2007, essentially matching iTunes prices.
75C R E AT I V E E C O N O M Y R E P O R T 2 0 0 8
17See, for example, Fox News (2006), Taipei Times (2007) and The New York Times (2007).
Box 3.3 Properties of creative industries
Nobody knows: Demand uncertainty exists because consumer reactions to a product are neither known beforehand nor easily understood afterwards.
Art for art’s sake: Workers care about originality, technical professional skill, harmony, etc., of creative goods and are willing to settle for lower wagesthan those offered by “humdrum” jobs.
Motley crew principle: For relatively complex creative products (e.g., films), the production requires diversely skilled inputs. Each skilled input must bepresent and perform at some minimum level to produce a valuable outcome.
Infinite variety: Products are horizontally differentiated by quality and by uniqueness: each product is a distinct combination of inputs leading to infinitevariety options.
A list/B list: Skills are vertically differentiated. Artists are ranked on their skills, originality and proficiency in creative processes and/or products. Smalldifferences in skills and talent can yield huge differences in (financial) success generating hit-based, winner-takes-all markets
Time flies: When coordinating complex projects with diversely skilled inputs, time is of the essence.
Ars longa: creative products have durability aspects that invoke copyright protection, allowing a creator or performer to collect rents.
Source: Caves (2000).

76 C R E AT I V E E C O N O M Y R E P O R T 2 0 0 8
Distributors are concerned not only about disappointingtheir traditional partners but also about the loss of revenueswhere online retailers practise deep discounting.
Online distribution offers viable alternatives to traditionaldistribution channels. It may favour the development of nicheproducts and present a profitable outlet, especially for B-list creations that are excluded from mainstream distributionchannels because the biggest firms usually aim for the hits(i.e., the A List). The example of Amazon.com, which makesits profit mainly through the sale of less popular books thatare not carried by its off-line rivals, is often quoted as the
typical example of the long-tail theory in practice. The longtail is believed to provide even the very smallest companies –and, by extension, individual creators – the necessary leverage to compete against dominant retail firms and dis-tributors.18 The recent move by many smaller music artists aswell as major players such as Prince, Paul McCartney,Radiohead, Nine Inch Nails and Madonna to eschew themajor record labels is leading some industry analysts to con-clude that big-name artists have the possibility of beingindependent. However, most music-industry analysts stressthat the bids for independence make sense particularly for
Analy
sing t
he c
reati
ve e
conom
y
3
Box 3.4 Commercial practices and business models particular to the audiovisual and music industries
The “window” distribution system, which enables the sequential release of films, videos and television programmes in a staged process (windows) sothat the product can be resold to different markets over time at little additional cost. It facilitates price discrimination and the exploitation of secondarymarkets.
Price discrimination. Unequal competition in secondary markets for audiovisual services has sometimes been likened to dumping because the initialcosts of production have largely been recovered in the home market and the price (or licence fee) charged in secondary markets bears little relation toactual production costs. The majors have been accused of greed and some see increased levels of piracy as a direct result of their pricing policies.
Parallel import restrictions on films, videos and television programmes intended to enforce distribution windows, which also underpins the financingstructures of most television and film projects and the valuation of distribution rights
Minimum exhibition period: requirements by distributors of minimum exhibition periods for films that may force smaller exhibitors to forego particulartitles and thereby diminish their commercial viability.
Blind bidding, whereby a distributor requires an operator to order a film without prior viewing.
Block booking or bundling of films and television programmes by international distributors, whereby less popular products are tied to those that aresought after; serves as a barrier to the screening of competitors’ content.
“No share” periods imposed by major distributors that prevent a cinema from showing different titles at different times of the day and/or week that areparticularly onerous for small independent exhibitors and, if excessive, make it more difficult for independent distributors to compete.
Joint purchasing arrangements by cinema operators seeking to strengthen their bargaining power with distributors by pooling their demand for feature films.
Refusals to supply and exclusivity clauses in film contracts, whereby a distributor may refuse to supply first-run prints for potential blockbuster films totwo competing cinemas unless the additional audience generated is sufficient to outweigh both the loss of rentals through shared receipts and the additional cost of the print. In such cases, independent distributors often lose out because, by the time they hire the film for exhibition, demand may have waned.
Payola, whereby record companies funnel promotional money (or ticket giveaways, concert promotions, vacation trips and other perks) to radio stationsthrough independent promoters in exchange for airplay consideration, which excludes the majority of artists except the most heavily financed, servingto raise the costs of doing business for smaller distributors. This has a secondary effect on artists’ income from royalties collected by collection societies on the basis of the number of times the work is aired.
Vertical integration of distributors into exhibition, pay-per-view services and broadcasting.
Duration and terms of contracts between artists and record companies.
Source: Caves (2000).
18It should be noted that not all online retailers represent new entries (or lower prices) because many of the existing players on the market are responding to the new competition by setting up their own online operations. Nevertheless, there is an increase in the intensity of competition, which can also result in enhanced consumer welfare and opportunities for business.

Analysin
g th
e c
reative
econom
y
3
the most popular acts or those with devout fans who fill concert seats, buy merchandise (or self-produced CDs) andseek out their favoured artist’s music.
The technological revolution may yet lead to a revolutionin the types of contracts prevalent in creative industries becauseindividual creators are increasingly looking to capitalize onspin-offs from their original creations. On the other hand, italso has its downside. It raises a number of employment-related concerns. For example, in the publishing industry, technological developments have made it possible to do awaywith some of the “motley crew”: whereas typography and pagelayout were tasks that only experts could carry out, today anyone with a computer can achieve a professional layout anddesktop publish. Digitalization has also heightened the risks ofpiracy and loss of revenues due to the ease of acquiring digitalcontent without having paid for it.
3.5.1 Changing consumption patterns
Naturally, the creative economy includes consumers, whosedemands ultimately determine what is produced and how itis distributed. Changing demographics19 and new consumptiontechnologies are combining to cause significant shifts in patterns of cultural consumption around the world in devel-oped and developing countries alike. As populations age, theelderly acquire more time and more accumulated income tospend on cultural consumption of various sorts. At the otherend of the demographic scale, young people are significantplayers in the markets for creative goods and services. Theytend to be the quickest group to take up new technologiesfor accessing audiovisual products, and their demands, channelled through innovative means of cultural consump-tion and participation, are influencing production patternswithin the creative industries in a number of countries.
Consumers also influence the creative economy inother ways, for example indirectly through the fact that reg-ulatory action may be taken on their behalf by governments.An illustration is provided by the film industries of countrieswhere local content quotas are enforced in order to protectindigenous cultural expression. The rationale of such regula-tions is essentially qualitative in nature, relating to matters ofcultural identity. Their economic effect is to channel
resources into the local creative industries and to reduceexpenditures on imported creative products.
Tourists are a particular group of consumers of interestto the creative economy. Tourism provides a significantsource of demand for cultural output in many countries.Such demand comes in two forms: mass tourism characterizedas high-volume and low-yield, where demand for creativeproducts or cultural experiences tends to be uninformed andundiscriminating, and cultural tourism, which is low-volume,sometimes high-yield and generally better educated andmore sensitive to local cultural values. International touristdemand for visitation to heritage sites can be especiallyimportant in earning foreign exchange. In such cases, revenuefrom entrance fees may be a primary source of funds formaintenance and restoration work, while the associatedimpact of tourist expenditures on the local economy can besubstantial, measured in terms of incomes and employment.
3.5.2 Creative industries and regulation
The incidence of creative industries in countries isinfluenced by national culture, taxation, education, industrialpolicies and level of ambition (as evidenced by the success ofthe East Asian nations). These factors have contributed todiffering intra- and inter-country levels of maturity and mar-ket organization across various types of creative industriesand across various segments of the national supply chains ofcreative industries. These factors have also meant that cre-ative industries encompass a wide spectrum of commercial,subsidized and non-profit ventures. The issue of subsidies ispotentially problematic as more domestic creative industriesbecome commercialized and are traded internationally. Thedispute over the venture of the British BroadcastingCorporation (BBC) is a case in point. Commercial publish-ers complained that by going online, the BBC had movedinto areas already well served by the private sector. They feltconstrained in their ability to compete by virtue of the BBCbrand, which is associated with high standards of journal-ism, quality and range and depth of content coupled with itsaccess to licence fees that commercial providers could matchthrough advertising income or venture capital. They arguedthat the support for the BBC free content provision on the
77C R E AT I V E E C O N O M Y R E P O R T 2 0 0 8
19See A. C. Pratt (2007), “The state of the cultural economy: The rise of the cultural economy and the challenges to cultural policy making”, in The Urgency of Theory, A. Ribeiro (ed.)(Manchester, Carcanet Press/Calouste Gulbenkian Foundation), pp. 166-190.

78 C R E AT I V E E C O N O M Y R E P O R T 2 0 0 8
Internet creates unfair competition, particularly for smallsuppliers in terms of news and the delivery of online educa-tion.20 Similarly, the majority of Southern AfricanDevelopment Community (SADC) States have largely builtup delivery infrastructure (galleries and museums) for thecrafts and visual arts industry (although rural artists are lesswell served) and have managed to organize the industrythrough a combination of public policy initiatives and funding, and private outlets (Trinity Session, 2003). It isuncertain whether this kind of assistance will be possible forcountries that are trying to grow their creative industries inthe context of pressures on all countries to open up all sectors of their economies to international trade and investment.
Concern about cultural diversity has caused many gov-ernments in developed and developing countries to prioritizethe development of domestic audiovisual content throughnational quotas and other types of preferential treatment,including subsidies, tax incentives, tariffs and dubbingrequirements applicable to the film and broadcasting
industries. The heavy reliance of the audiovisual industry onpublic and donor funding in Africa, for instance, has resultedin financially fragile industries with limited creative freedomand poorly maintained or often obsolete production equip-ment where available. On the other hand, since many of theproducts of creative industries are entertainment goods andare often classified as luxury items, tariff structures can beunfavourable. For example, musical equipment in Zimbabweis treated as a luxury good and carries a 25 per cent importtax. Similarly, the printing and publishing industry in theCaribbean is faced with inconsistencies in the regulatory andtaxation policies affecting the subsector whereby booksimported in hard copy do not attract duty whereas inputs forthe industry and manuscripts imported in electronic form(CD-ROM) do. Eighty per cent of the paper used in theMoroccan printing and publishing industry is imported andthese imports are subject to customs duties of between 10and 50 per cent (D’Almeida and Alleman, 2004).
An overview of themusic industry in sub-Saharan Africa, organizedaccording to production-chain analysis, is summarizedin figure 3.3.
Details of the stagesof this production chain inthe African context are asfollows:
Beginning: Idea and content generation
■ Rich musical traditions, including Congolese rumba,Zaïroise Moderne, Afropop, gospel.
■ New sounds now emerging from rapidly urbanized youth,e.g., Kwaito (South Africa), Bongo Flava (United Republicof Tanzania).
■ Political leadership important when music is used to support national identity, e.g., Democratic Republic ofthe Congo, United Republic of Tanzania.
Production
■ Three main centres for music production: East Africa(Kenya, United Republic of Tanzania); West Africa(Ivory Coast, Mali, Nigeria, Senegal); Southern Africa(South Africa, Zimbabwe).
Analy
sing t
he c
reati
ve e
conom
y
3
3.6 An application of production-chain analysis: The musicindustry in sub-Saharan Africa
Figure 3.3 Stages of a music production chain in sub-Saharan Africa
Beginning: Idea
and content
generation
ProductionDistribution/
circulation
Exhibition/
delivery
Audience
reception/
feedback
20This does raise another issue with respect to the characteristics of the new information economy where potentially most information is in principle available on line. The new issueraised is the added value of commentary and the trust that audiences have in the carrier. The BBC may argue that it adds a particular value in both areas.

Analysin
g th
e c
reative
econom
y
3
79C R E AT I V E E C O N O M Y R E P O R T 2 0 0 8
■ Growth of recording industries reflects different colonialties (English: weak; French: strong).
■ Independent studios and labels set up by entrepreneurs andartists (Ivory Coast, Senegal, South Africa, Zimbabwe).
■ Self-producing artists and State broadcasters(Mozambique, South Africa, United Republic ofTanzania, Zambia).
■ Increasingly, artists are recording in other African countries(Kenya, South Africa) rather than travelling to Europe.
Distribution/circulation
■ Most African music distributed locally, but a few artistshave broken into International markets via distributorsoutside Africa (France, Germany, United Kingdom).
■ Major record companies now active only in South Africa.
■ Circulation limited by lack of reciprocal licensing and distribution deals between record companies in differentterritories.
■ New trend of independents entering into contracts withmajor labels to produce music products under licence.
Exhibition/delivery
■ Deregulation of broadcasting in Democratic Republic ofthe Congo, Malawi, United Republic of Tanzania hasboosted demand for local music.
■ Specialist music retail outlets exist in francophone Africa;other countries have music in supermarkets (e.g., BurkinaFaso, Namibia), clothing stores (e.g., Zimbabwe), petrolstations (e.g., Senegal, Zambia).
■ Informal retail networks exist where distributors sell toinformal vendors (hawkers, small retail outlets); piratedmaterial delivered via informal networks.
■ Internet distribution is embryonic.
Audience reception/feedback
■ Some music awards (e.g., Kora Awards, South AfricanMusic Awards, Zambian Ngoma Awards) to recognizelocal artists and music production.
■ Awards are controversial, with criticism by musicians thatrecord companies influence outcomes.
■ Music journalism mostly about artists and performances,little on industry or development issues.
The financial aspects of this production chain inAfrican music exemplify some of the problems andprospects of creative industries in a regional context. Thebeginning of the production chain in African creative indus-tries represents a rich and vital heritage, but this is not wherethe money is made. The realization of value from the creativecontent of Africa is often in the hands of foreign distributorssuch that income leaves the countries where the content iscreated and produced. The artist makes money from sound-carrier sales by receiving a royalty on each sale; composersand authors (who can also be artists) receive royalties fromthe various uses made of their compositions such as mechanicalroyalties from recordings or performance royalties from liveperformance or broadcasting. In Africa, however, because theartists expect to receive little or no royalty from record salespartly owing to piracy and partly to the inadequate collec-tion of copyrights, they negotiate a bigger share of an up-front payment that essentially signs away their rights tothe music. Combined with this career-limiting decision is thepoor understanding of the music business, which results inthere being few professional producers or managers.
To overcome these constraints, it is important for allstakeholders in the value chain to work together if the musicindustry in Africa is going to be successful. As Seligmanargues, “The challenge is working with local producers, locallabels and local artists in Africa to try to establish a structurein which everyone, from record companies to artists, composers and authors receive due payment without stiflingthis enormously dynamic and very creative scene

80 C R E AT I V E E C O N O M Y R E P O R T 2 0 0 8

An assessment of the current status of the creativeeconomy globally is a key requirement for countries ofboth the developing and developed world. As shown inprevious chapters, progress towards such a goal has beenslow and disjointed. At the same time, the creative econo-my is growing and developing rapidly as well as becomingmore integrated internally and with other parts of theeconomy. This chapter argues for a pragmatic means ofmeasuring activity in the creative economy that can beextended to all United Nations Member States for thepurpose of universal comparative analysis. A number ofdebates surround the construction of a model to measurethe creative economy, particularly in developing countries.The debates involve several dimensions, usually presentedas extremes, whereas in actuality, solutions will certainlyinvolve practical compromises.
The focus of this chapter and the analysis inchapter 5 is on trade issues. It is widely recognized that
other measures (such as employment and occupation1)add considerable insights. Pragmatically, however, theonly way to create an international baseline measure atthis point in time is to use trade data, as shown in thefollowing chapter. Nevertheless, the measurement oftrade flows is simply a first staging post on a longerjourney that will end with a satisfactory analytic map ofthe creative industries in both the developing and thedeveloped countries. In summary, the ideas and propos-als put forward at this stage reflect ongoing empiricalresearch but further investigations are required. Ourintention is to move ahead the debate by proposingsome possible options that can be applied worldwide inthe short term and with a minimum incremental cost.The creative economy is booming and governmentsfrom developing countries should have the tools to putin place the necessary public policies to embark on thisnew terrain.
For policy-making to be successful, it must be seenas a legitimate action based on generally accepted relevantprocesses, and it must be subject to scrutiny so that its suc-cess or failure can be evaluated in a transparent manner. Inorder to achieve both objectives, a sound base of scientificunderstanding of the processes is needed. Clear informa-tion is required to identify appropriate indicators forchange. This is what is termed “evidence-based policy-making”. Political decisions are still taken about the allo-cation of resources, but they are legitimated by recourse toreliable and transparent evidence.
As a result of the informal and political nature ofpolicy-making that has historically characterized the
cultural sphere, there is a lack of a tradition of monitor-ing and evaluation as well as an established infrastructurefor carrying out these activities. Moreover, the allocationof resources in the cultural sphere has not been based onan analysis of cost-effectiveness or process effectivenessowing to concerns about making political or cultural judg-ments as to the value of culture. Historically, the focus ofcultural policy has been viewed as a realm of either thenot-for-profit or of public-sector support driven by wel-fare-economics principles and advocacy, a realm that wasseldom required to be evaluated in economic terms. Or, asmentioned in the previous chapter, culture was seen as ameans of social development.
81C R E AT I V E E C O N O M Y R E P O R T 2 0 0 8
Tow
ard
san
evid
ence-b
ase
dasse
ssment
of
the
cre
ative
econom
y
4
CH
AP
TER
4Towards an evidence-based assessment of the creative economy
1 See the UNESCO Institute for Statistics (UIS) framework that focuses on employment measures in a unified framework. Burns Owens Partnership, A.C. Pratt and C. Taylor, A framework for the cultural sector: A report for UIS/UNESCO, Paris, 2006
4.1 Why we need a new information base and why it doesn’t already exist
82 C R E AT I V E E C O N O M Y R E P O R T 2 0 0 8
In recent years, there has been a tendency in mostcountries to consider cultural projects in monetary termsalongside other objectives. Moreover, as public provision hasbeen largely outsourced, contracted out or privatized, con-siderable attention has been paid to the potential economicimpact of the creative economy. If, for example, culture is tobe taken seriously within such a framework, it needs to bepresented in terms comparable to those of health or educa-tion in its demands for resources and efficiency in their use.The lack of a tradition and an institutional legacy of eco-nomic valuation/cost-accounting in the field of culturemakes it difficult for practitioners and policy-makers toargue the case for resources in such a climate.
The development of indicators is problematic in thefield of culture and creativity for a number of reasonsbeyond the central issue of the “valuation” of culture. First,as noted earlier, a central issue concerns the legitimation ofpublic or private spending on culture. Resources must bedemonstrated to be well managed and effectively used. It isproblematic to devise a reliable and legitimate metric to cap-ture such issues. Second, the creative and cultural industriesrepresent new forms of economic, social and cultural activi-ty. One thing that most commentators can agree upon is thatthe creative industries are innovative; hence they are in a rapidand constant process of change. It is therefore difficult todevise appropriate measures of activity, especially if theactivity under investigation is itself novel and changing. The
use of new technologies and new business models for thedistribution of products (e.g., music) has created huge prob-lems for analysts in understanding what is being sold andwhere the value lies. In such a context, old evaluation andmeasurement techniques, developed with other industrialprocesses in mind, can misapprehend activities and outputs.This problem applies to all industries, but it is particularlyacute in the creative industries. Finally, background knowl-edge of the form and operation of the creative economy isrelatively scarce compared to that for more established indus-tries. It is often difficult to identify which variables areimportant, and it is very common that data on such variableswill not have been collected previously.
Creative-economy researchers and policy-makers arethus caught in a difficult position, asserting the importanceof this activity but unable to prove or demonstrate it usingconventional means. In order to demonstrate the importanceof the creative economy and to legitimate expenditure, newdata must be collected. However, this task is costly, and cen-sus bodies are understandably unwilling to devote resourcesto new activities that they cannot be certain will be useful. Asunderlined in the previous chapter, a number of isolatedstudies have, in various ways, demonstrated that the creativeeconomy exists, that it is growing quickly and that it gener-ates income and jobs. The challenge to be faced is to devel-op a measure of, and an evidence base for, the creative econ-omy that can be deployed in all countries and situations.
Our objective in this Report is to develop a measure ofthe contribution of the creative economy to society and to theoverall economy. Clearly, this is a very ambitious aspiration. Inthis chapter, the focus will be on economic measures. First, itis fully accepted that economic indicators are not appropriatefor capturing all creative-economy outputs and that the cre-ative economy has a profound impact both in other parts ofthe economy and more broadly in society. Examples includethe impact on individual, local and national identity, the roleof the creative economy in community empowerment, andthe role of culture and creativity in social mobilization.Clearly, the measures that are developed in this analysis will bepartial as well as a significant underestimation of the trueimpact in other areas. Hence, it is our intention to stress theimportance of an economic evaluation but one that is not
exhaustive. The real value in all terms will be much greater.
Our aim is to create the first international means ofmeasurement of the creative economy, one that can be fur-ther elaborated as more data are generated and that will alsoact as a framework for, and a stimulus to, new data collec-tion. As noted previously, the field is confusing because ofthe multiple measures and definitions already available andthe fact that most are nationally or culturally specific.Therefore, this is one of the challenges that must be over-come in order to develop a less culturally biased measure ofthe creative economy. The predominant measures that havebeen used to date are those that measure employment, invest-ment or time spent on cultural activities. Our focus is tohighlight the role of trade. The aim is to develop a schemathat will facilitate comparison across countries and that will
Tow
ard
s an e
vidence-b
ase
d a
ssess
ment
of
the c
reati
ve e
conom
y
4
4.2 Towards a reliable benchmark for the creative economy

allow comparison of the contribution of the creative economyto that of other sectors.
This proposal builds on work already carried out bythe UNESCO Institute for Statistics (UIS) in developing aninternational framework for cultural statistics. The UISapproach has two characteristics. First, it explores thebreadth and the depth of the cultural sector. Breadth refersto which activities are included while depth deals with stagesof a production chain (see fig. 4.1 and chapter 3). The second
characteristic of the UIS model is the notion of a nestedmatrix of data. A core set of activities is defined as necessaryfor international agreement although there are also a numberof alternative data sets (from a predefined list) that can bedeveloped by individual countries based on need and asresources become available. In contrast to the UIS approach,the model being proposed in this Report seeks to develop acore, minimal set of data as well as expanded but overlap-ping, specific data sets tailored to the needs of differentcountries. This model would run in parallel to that of UIS.
The development of a benchmark measure for the cre-ative economy is particularly problematic owing to a range ofdefinitional problems – from the conceptual to the practical.At the conceptual level, there is the issue of the boundariesbetween arts/culture and industry. Traditionally, such a divi-sion was based on commercialization, and commonly, provi-sion by the private sector was associated with the commercialand public provision with the non-commercial. However,these boundaries are being rapidly eroded; some commenta-tors prefer to view them as a continuum rather than as adualism. Certainly, arts and crafts sits at a mid-point on sucha continuum and in many ways illustrates the problem ofcreative industries in the developing world. Arts-and-craftsgoods may be mass-produced as part of a tourist strategy;however, their value lies in their local production or localidentification for visitors.
Mass production of arts-and-crafts goodsfor tourism may seem like a contradiction interms, but it is a reality for many communities andoffers a way to sustain local skills and to earn asustainable income. Arts-and-crafts goods lie at anexus of tourism, trade and development.Moreover, they are often produced or distributedvia the informal economy. If one uses traditionalmeasures of economic activity (based on commer-cial outputs), arts-and-crafts activities may beunderreported or not reported at all. Such report-ing problems undermine efforts to develop policywith regard to these activities in order to eithersustain them, protect them or commercialize them.
Building an effective operational model of the creativeeconomy must take into account the fact that all existingmodels have in-built assumptions. These assumptions are acombination of abstract concepts, objectives and outcomes.It is in this sense that the range of existing models is embed-ded in one way or another within particular governanceregimes. Though these models may be appropriate for theirspecific usage, some problems need to be addressed if weseek to universalize them. At least three salient assumptionsare built into all the models discussed in previous chapters:the assumption of public or private funding and legitimationof activities; the balance of formal and informal activities;and the relationship of the for-profit and the not-for-profitactivities. For example, it is only recently that Europeancountries have begun to consider the realm of the for-profit
83C R E AT I V E E C O N O M Y R E P O R T 2 0 0 8
Tow
ard
s an e
vidence-b
ase
d a
ssessm
ent o
f the c
reative
econom
y
4
4.3 The challenge of building an operational model of the creative economy
Figure 4.1 The creative chain
SUPPLY
PARTICIPATIONEXHIBITIONRECEPTION
(site of
exchange of rights
to consume)
MAKING(One-off
production, mass
production,
tools/
infrastructure)
CREATION(Content
origination,
xxxx, ideas)
Source: Burns Owens Partnership, Pratt, A.C., Taylor, C., 2006.
A framework for the cultural sector: A report for UIS/UNESCO, Paris.
DISSEMINATION(Distribution,
wholesale, retail)
ARCHIVING/PRESERVING
EDUCATION/TRAINING EDUCATION/CRITIQUE
DEMAND

84 C R E AT I V E E C O N O M Y R E P O R T 2 0 0 8
creative economy and its relationship to, and potential gov-ernance relationship with, the not-for-profit and the State-supported sector.
Models can be modified to take different assumptionsinto account. Here we are guided by a core set of principlesregarding what we might understand by the creative econo-my (see chapter 3). The present chapter focuses on therefinement of criteria that may be taken into account whenwe seek to measure the creative economy. The point is thatdeveloped countries have pioneered analysis of the creativeindustries and have led the rise in their empirical importance;however, other modes of production and organization areemerging. Consequently, we should be wary of an implicitdevelopmentalism, or modernization thesis, that implies aneventual convergence of experience in developing countrieswith that of the developed world. It should be noted thatempirically, many of the most economically important firmsare located in developed countries and that regulation hasbeen developed based on this pattern. We need to be awareof the different trajectories that developing countries maytake in shaping their creative economies. One clear exampleis the role and importance of arts-and-crafts goods that areseldom classified or measured as part of the creative econo-my in the North; however, they are commonly the core of anemergent creative economy in regions of the South.Moreover, these activities may be carried out primarily in theinformal economy and/or be reliant on a vibrant not-for-
profit sector. This is not only a North-South issue; many dif-ferences also exist between East and West both internation-ally and even within regions.
Again, it should be noted that even the best-resourcedNorthern economies have struggled to develop and maintaininformation frameworks that capture creative-industry activ-ity. This is compounded by a historical factor, namely, thatmost industrial classifications and taxonomies were devel-oped at times when the creative economy was insignificant.Thus, in many cases, the creative economy does not exist instatistical terms. Additionally, those countries of the Norththat have set about the collection of such information havebeen surprised at the rate of change that they have seen,notably in the growth of the sector. Moreover, this rate ofchange is unlikely to abate; in fact, quite the opposite: changein output and nature of output and production is happeningapace, a good example being the digitization of production(see chapter 7).
In summary, there is a limited set of measures of cre-ative-economy outputs. These measures were not originallydeveloped for the purpose of interrogating the creativeindustries; thus they are suboptimal. As will be further elab-orated in the followings sections, it is possible to fine-tunethese measures as a pragmatic solution to the challenge athand. However, there is no substitute for root and branchrestructuring if this task is to be done properly.
There are four potential means of measuring creative-industry activity: employment, time use, trade and valueadded, and copyright and IPR. However, these means areunevenly and inadequately applied to measures of the cre-ative industries in either the developed or developing world.The development of a comprehensive data set would beextremely costly and require organizational resources that areunrealistic. Hence, our approach is twofold: first, to try toidentify at least one pragmatic measure that can be used forthe sector; and second, to help to stimulate further data col-lection and monitoring by public agencies worldwide. In part,this latter task will require the use of new survey instruments.
In this regard, the role of the United Nations organi-zations is essential, in particular UNCTAD and UNESCO,which are already working in close collaboration, with a view
to ensuring that official data are collected and analysed forall countries. It is important to ensure equivalence and coher-ence between various national efforts in this endeavour. Inpart, some of this new data can be collected by marginalextension of existing official census and survey instruments,and it is important that a clear, overarching aspiration beshared between different organizations locally.
4.4.1 Employment
A recent method associated with the growth of thecreative economy has focused on ways of measuring employ-ment generated. Such an approach is hampered by a lack ofagreement of definitions of the sector. It is also hindered by
Tow
ard
s an e
vidence-b
ase
d a
ssess
ment
of
the c
reati
ve e
conom
y
4
4.4 Measures: Their limitations and potential
the rate of development: either the industries are new, or justemerging, or they are unevenly concentrated in parts of theworld and hence are not an issue for some countries at themoment. In some countries, there is a separate labour mar-ket survey while in others, this information is collected aspart of a general census. However, this broad category of“employment” is accepted and used in other areas of eco-nomic life; thus benchmarking is possible.
Occupation
Perhaps the most popular measures of creative activi-ty have been derived from occupational analyses. Using clas-sifications of occupation, people are categorized as creativeworkers. One of the problems with this sort of measurementis that people may have more than one job, commonly thecreative occupation may pay less, and the creative occupationis often undercounted. Second, occupational measures tendto under-represent the jobs relating to the creative sector.Creative work involves so-called creative occupations as wellas non-creative ones, so machine operators might be seen ascreative workers if they are working a printing press but nota sheet metal press.
Industry/sector
Employment by industry has been used as an alterna-tive to occupation in order to capture this interlinking ofactivities that comprise creative output. Again, put aside theconceptual definitions of creative activity; they commonlydivide over which are directly cultural output (aperformer/performance) and cultural facilitator (theatreticket sales), or creator (script writer). Another problem withemployment data concerns the length of time worked –whether the job is full time (according to national norms) orfractional. This is a particular problem as contract or projectemployment is common in the creative economy. Finally,there is the problem of contract and self-employment. Thiscan shade into informal work, or second jobs, or simply bemissed in census reporting as many cultural workers are inmicro-enterprises or self-employed with a small turnover.Commonly, the turnover for such entities is below that onwhich data are collected. While it may legitimately be saidthat individually these are insignificant components of theeconomy, they are a significant part of the creative economyand, as this sector grows, a more significant part of thewhole economy. Given the rate of growth, it is important tomonitor these changes.
Co-location/cluster
The topic of co-location has become a popular one indiscussions of local and regional economic development andregional competition. Measures of employment can givesome sense of the degree of concentration of culturalemployment; this is clearly an important distributional ques-tion. However, an important question with respect to allforms of clustering, especially that of the creative economy,is the degree of interaction between the various firms andactivities in the cluster. In traditional analyses of industrialagglomeration, a measure of inter-firm trade is sought.However, such data are seldom available; hence physical co-location is used as a proxy. In addition, in the case of the cre-ative economy, a cluster may be a function of labour-marketpooling and project work as well as a means by which to cir-culate vital knowledge between producers and consumers(see chapter 3). There is no reliable measure of these sorts ofinterrelationships (even in the developed world). However, itis clear that these processes are critical in economic growthand in the more general success of the creative economy.Moreover, research evidence suggests that this type of knowl-edge transfer and critique as well as interaction with audi-ences and consumers is disproportionately more importantin the creative economy than in other areas of economic life.
4.4.2 Time use
Perhaps the most established measure of creative activ-ities is that provided by time-use surveys. Pioneered inAustralia, these surveys try to capture non-economic activity(as well as economic activity) by measuring the time thatpeople spend on particular activities.2 This has been a usefulway of uncovering informal and not-for profit or simplycommunity activity. However, the drawback is that such sur-veys are very labour intensive and exist in few locations. Arelated set of measures is of participation or attendance data.Traditionally, such data have been used to monitor atten-dance at events organized or managed by the public sectorwhere entry is either free or heavily subsidized. In some cases,they are used as a measure of public service performance. Inmost cases, these data are not collected since public expendi-ture is not evaluated in this manner. Moreover, participationis not measured for many informal events. Finally, commer-cial ventures may be more interested in the takings/boxoffice than in attendance numbers and they may also becommercially sensitive. In recent years as services are increas-
85C R E AT I V E E C O N O M Y R E P O R T 2 0 0 8
Tow
ard
s an e
vidence-b
ase
d a
ssessm
ent o
f the c
reative
econom
y
4
2 For example, the 2006 Australian Time Use Survey, Australian Bureau of Statistics.

86 C R E AT I V E E C O N O M Y R E P O R T 2 0 0 8
ingly delivered by digital means, such monitoring has becomeeasier, but it is still at a very early stage. A more sophisticat-ed sort of survey will not only collect such data but alsorelate them to more general demographic data.
4.4.3 Trade and value added
Physical trade
The measurement of trade in relation to the creativeeconomy is problematic in practice, as will be addressed inchapter 5. The existing information sources have been devel-oped to capture the transfer of physical goods. The “dema-terialization” of trade – most well documented in relation tofinancial services – has had a particularly strong impact onthe creative economy.3 For historic reasons, parallel toolshave been developed to capture both physical and financialtrade flows; while far from perfect, they provide a significantinsight into transfers. The case of the creative economy is notso clear; much of the value in the creative economy has beenas a result of trade in physical products that are of relativelylow value as materials but that contain their real value inintellectual property. Conventional trade measures focus onthe flow of material goods, either registering their (free-on-board) price or weight. It is impossible to disentangle theIPR value from such data or even to recognize it. Moreover,digitization is increasingly facilitating the transfer and tradein IPRs online, a means not monitored. It is for these rea-sons that trade in the creative economy is relatively invisible;we are left looking for traces or shadows of IPRs. Moreover,with rapid technological change, the relationships betweengoods and value shift week by week.
A traditional measure that is used in the evaluation ofeconomic activity is output, or turnover, usually representedas gross value added (GVA). This is an important measurewhen one examines the performance of regional and localeconomies and when one seeks to evaluate the performanceof particular linkages in a production or value chain.Constructing such an account requires a great deal of data.Moreover, there is some doubt as to whether such an accountis reliable for the creative economy.
A significant proportion of the creative economy doesnot register in trade or economic statistics for two other rea-sons. First, much of the activity takes place in the informaleconomy. Arguably, this issue is more acute in the developingworld where arts and crafts and visual arts are produced
under such conditions. This data problem is one that is wellknown more generally and there is no simple way to resolveit. Furthermore, in the case of the creative economy, thisissue is compounded in that many cultural activities are car-ried out on a voluntary or recreational basis. However, theybecome an important resource as they support the formaland traded economy. Either artists migrate between the for-mal and informal economy, voluntary and employed, or theyhave (at least) two jobs. While the non-cultural job may bemore remunerative, the cultural one may be more importantto them. Analyses of artists in Australia have identified thiscomplex pattern, one that has not been replicated in thedeveloping world, but, based on the evidence that is available,one might expect it to be even more pronounced.
4.4.4 Copyright and IPR
The WIPO secretariat has been developing a newmethodology and data sets for measuring the impact ofcopyright-based creative industries on national economies interms of employment and contribution to GDP. Surveys andstudies have been carried out in a few but growing numberof countries and the coverage is being expanded. However,the WIPO methodology does not meet the criterion of uni-versal coverage since it is based on industrial taxonomies(International Standard Industrial Classification, or ISIC)and is thus limited in scope. Moreover, it has the drawbackof being expensive, relying on a well-developed and sophisti-cated collection and analysis infrastructure, Also, in princi-ple, it rests on the acceptance and implementation of theWTO rules on intellectual property. In this latter sense, theWIPO model has been developed as a regulatory and mon-itoring tool. This objective limits its applicability in develop-ing and emerging economies that as yet have few institution-al, financial and human resources for managing and imple-menting an IPR regime.
It is important to note that the data on trade of cre-ative services and the WIPO data are essentially measuringdifferent things, and both should be read as an indication ofa scale of magnitude and trend rather than as definitive fig-ures. However, this and the following chapter make the casethat the creative economy is important for both the devel-oped and the developing world and that extra efforts need tobe made to develop a universal measurement system. A pre-condition for this system should be to offer real figures to beused for worldwide comparative analysis. In particular,
Tow
ard
s an e
vidence-b
ase
d a
ssess
ment
of
the c
reati
ve e
conom
y
4
3 See J. N. Bhagwati (1984), “Splintering and disembodiment of services and developing nations”, The World Economy, pp. 133-143.

implementation of this system should be feasible and afford-able to developing countries, including the least developedcountries (LDCs). The creation of such a reliable evidencebase is a prerequisite for proper policy-making and multilat-eral decisions.
4.4.5 Public investment
Much cultural activity is funded by public resources ormanaged by not-for-profit agencies. Conventional market
indicators are not so good at describing this activity.Moreover, there are many different reporting conventions forpublic and not-for-profit bodies such that data are not sys-tematically classified and collated. The few attempts at sim-ply collating public spending on arts and culture are helpfulbut potentially misleading. As Schuster notes in his critique,4
simply knowing how much money is available in any givenyear does not tell one how effectively the spend is or what theoutcome is. A more subtle analysis that is indicative of Stateinstitutions and their modes of operation is required to dis-cern such an outcome.
87C R E AT I V E E C O N O M Y R E P O R T 2 0 0 8
Tow
ard
s an e
vidence-b
ase
d a
ssessm
ent o
f the c
reative
econom
y
4
4 J. Mark Davidson Schuster, Supporting the Arts: An International Comparative Study, National Endowment for the Arts, March 1985. Available through ERIC Document ReproductionServices (www.edrs.com), ERIC document #ED257740; J. Mark Davidson Schuster, "Making compromises to make comparisons in cross national arts policy research", Journal ofCultural Economics, Vol. 11, No. 2, December 1987; Arts Council of England, Policy Research and Planning Department, International Data on Public Spending on the Arts in Eleven Countries,Research Report No. 13, March 1998.
Box 4.1 Reality and numbers
There is a memorable remark, “The map is not reality”, made by a Polish mathematician and philosopher named Alfred Korzybski. Although Korzybski wasborn in Warsaw in 1879 when it was occupied by Russia, I do not believe he was referring his homeland’s confused status. Rather, he was making a pithyencapsulation of his belief that we should not confuse reality with our descriptions of reality. He distrusted humanity’s tendency, faced with reality, to giveit abstract qualities that were often unnecessary, illogical and in many cases simply wrong. He wrote in the great tradition of the Englishman William ofOckham, born over 800 years ago, who said we should not add anything that is not necessary. Both men were saying, keep it simple! So, leaping back totoday, if I say that Matthew Carter, who designed the ubiquitous Verdana typeface now found on every computer, is a wonderful designer, I could be right,I could be wrong. The only certainty is that he designed a wonderful typeface.
I first heard about Korzybski when I was working at the International Institute of Communications in the 1980s and we were trying to understand the newcommunications ecology. We were working on a map of the global flows of television programming and a report to the Government of Norway on elec-tronic information. The Swedish director, Eddi Ploman, used the quotation to warn us against generalizing wrongly from raw data.
His remark popped into my head again this year as I was considering the state of research into the creative economy. On the one hand, we know how wehave ideas and how we develop and share them. We have a feel for how creativity works, or doesn't work, in our neighborhood, in our culture. On theother hand, data and maps seek to quantify the numbers, the scale, of what is happening. We need both, of course. We need the ground reality, and weneed the numbers. But we must not confuse them.
In recent years, there has been an explosion of interest in collecting data on the creative industries, often called “mapping” after the United Kingdom’sfirst mapping document in 1998. These show the creative industries to be larger and generating more wealth than was previously supposed. The databecame powerful tools in persuading governments to promote the creative industries. Fast forward 10 years and mapping the creative industries is nowwidely accepted as the first step on the agenda of any government that wants to develop its country’s creative economy.
These maps provide a quick and easy answer to the question, “What exactly are the creative industries?” They provide the information that politicians,industry and the media rely on. It is therefore important we get it right. Yet I believe that many maps offer shaky guidance for understanding the creativeeconomy and therefore for choosing the right policies. My own business interests cover TV and film. I know the reality of film production and distribution.No map comes close to reality.
Here is one example. A frequently quoted survey says the United Kingdom exports more films than the United States. This, frankly, is nonsense. The sur-vey makes the mistake of categorizing licence income as belonging to the licensee. So if a United States company licenses a film to another country, therevenue counts as local business. Perhaps the same mistake is the cause of the frequent statement that the video games industry is bigger than the filmindustry. The video industry is, in some countries, bigger than the cinema industry but the cinema industry makes up only one third of the film industry.This kind of data is not only wrong in financial terms but also misrepresents the industries’ structure and operations. As a result, any policy-maker whoused this data would be likely to have an incorrect idea of their strengths and weaknesses and propose policies that had little relation to reality.
The art market is also liable to misunderstanding. Art is often called a copyright industry. Strictly speaking, this is true. But the bulk of its revenues comesfrom the sales of manufactured objects, with copyright licences contributing only a few percentage points, most of which are earned by the estates ofdead artists who put little back into the market. By and large, the art market distrusts copying, which is why even original prints rank behind one-off worksand why reproductions are not considered to be art at all.
Why are we in this position? There are several factors. The first is that a lot of data is collected by organizations that have little knowledge, or even con-tact, with creative workers and businesses.

88 C R E AT I V E E C O N O M Y R E P O R T 2 0 0 8
Tow
ard
s an e
vidence-b
ase
d a
ssess
ment
of
the c
reati
ve e
conom
y
4
Box 4.1 continued Reality and numbers
My own criteria for good data are twofold. Data that is collected under government supervision, where failure to supply accurate data is an offence, areusually reliable. Company reports and some employment data are good examples (but the latter can be misleading if many people are self-employed orpart-time). But this is a small proportion of the total and, anyway, often fails the second test.
The second test is, Who is paying, and Why? The acid test of good data is data that are collected by an organization that has the right to check it and tochallenge the provider and that are then sold (not given) back to the provider. This kind of data is common in America, Japan, most of Western Europe andmost other OECD countries and virtually unavailable anywhere else. By this criterion, I trust data on box office admissions in these countries. I trust com-mercial companies that collect, organize, analyse and sell back industry data to the industry. Not much else can be trusted.
We know that all data give their own view of reality. Film companies collect information to make and sell films profitably. Governments collect information to levytaxes and to correct market failures through subsidies and tax breaks. Academics collect data to support their research. Every map has its own point of view.
In the film business, data on production finance and net income are virtually unobtainable by anyone outside the companies involved. We tell each otherwhat we know. Nobody even attempts an official survey. There is one exception, which is that national subsidy schemes may oblige recipients to providedata, but this distorts the picture in favour of the subsidized sector. The commercial deals that represent the bulk of licensing revenues go unrecorded.The ideas, projects, scripts, screen tests, contracts and personal relationships that constitute the main assets and added values of film development arenot caught by data mapping. The same is true for most creative work.
The reliance on industry data itself is coming into question. There is increasing recognition that many creative workers do not work in creative industries.In Australia, the United Kingdom, the United states, the proportion of creative workers outside the creative industries is over 50 per cent. There is anywayincreasing doubt whether “industry” is the right way to describe what is happening. The term captures what happens when big companies make lots ofidentical copies (music, film, High Street fashion, etc). But it does not capture people making one-off expressions of an individual aesthetic (art, architec-ture, craft, etc.).
There are other factors. Trade data are especially weak. Ideas flow easily across borders, especially with the Internet and inexpensive travel. Creative work-ers are nomads. Customs data do not begin to account for everything that is happening and may be so partial that they distort reality. Finally, most data,whether compiled by government or business, lag behind reality. Too often, the categories are out-of-date. This is especially true for business models thatdepend upon digital technology. Too many policy-makers try to plan for the future by doing what Marshall McLuhan described as “driving ahead by look-ing in the rear-view mirror”. What then, is the answer? We will always need maps, because we need to navigate. How do we get a better map?
A way forward
My research at ITR suggests a way forward. We need to rethink the reality of creativity and the creative economy. We need new coordinates and a new compass.
The new coordinates must take account of the environment in which people have ideas in their ordinary (or extraordinary) lives. I call this the “creativeecology”. An effective ecology provides the habitat where an organism can live and flourish. A creative ecology is one where all people have the freedomto pursue their own ideas and where markets allow them to exchange ideas. Its main characteristics are soft infrastructure, social networks and socialmarkets. We are developing parameters to measure this ecology.
Then, we need to relate this creative ecology to global economic developments since the 1950s, and especially since the Internet really took off in themid-1990s. The rise of the creative economy is part of the restructuring and reshaping of the global economy. There is a tendency for work on the cre-ative economy to be isolated from general economic analysis. We need to bring the two maps together.
It follows, I believe, that we need to give proper weight to both commercial and other activities. There is a tendency for policy-makers and researchers toput most emphasis on activities that are not sustainable or not profitable, on the reasonable grounds that profitable businesses can look after themselveswithin the framework of competition policy. It may also be true that many policy-makers in this area have more experience of the public arts sector thanof the commercial world. There is a danger that the creative economy becomes biased towards non-profit work. This would be profoundly limiting.
We need maps not only to tell us the size of a creative industry but how creativity and innovation play a role in the wider economy. In my view, the UnitedStates and many European countries are now mass creative economies. By this I mean that any primary, manufacturing or service sector in these coun-tries that is not creative is uncompetitive and unsustainable. The good news for all countries is that this requires a new approach to both culture and busi-ness. We need new theories and new practices, new ways of working.
For the past three years, I have been mapping the “creative divide” alongside the pioneering work by the International Telecommunication Union on the“digital divide”. The creative divide shows why, say, a person in the South who is as creative as a person from the North is prevented from taking part inthe global creative economy. In this, the United Nations surely has a major role to play. It can draw on the best of advice across a wide range of disciplinesand agencies. It can set standards and share information. In the same way as UNCTAD strives to enable developing countries to join the international tradingsystem, so we now need to ensure that developing countries can join in the global creative economy. This would be a natural and much welcome initiative.
By John Howkins, author of Creative Economy (London, 2001); Chairman, UNCTAD XI High-level Panel on Creative Industries and Development (São Paulo, 2004);Chairman, Tornado Productions Ltd, a London-based web casting company; and director of Equator Group plc, Television Investments Ltd, EveryIdea Ltd and WorldLearning Network Ltd.

The Culture Satellite Account (CSA) is a coherentand systematic accounting framework presenting economicinformation on culture and offering a base for public andprivate decision-making, policy design and evaluation, andgeneral purposes of the economics of culture. The CSA is asatellite account to the System of National Accounts(SNA), which was created in 1993 by the United Nations incollaboration with a number of institutions such as theInternational Monetary Fund, the Organisation forEconomic Co-operation and Development, the StatisticalOffice of the European Communities and the World Bank.It is currently adopted by most countries. This link betweenthe CSA and the SNA is justified by the characteristics ofthe system: (a) it consists of an exhaustive accounting frame-work, useful for the economic measurement of the vastmajority of cultural products and activities; (b) it is efficientand credible, as its concepts have been approved and success-fully applied to many countries at lower costs once they referto one methodological set; and (c) it avoids the use of con-cepts and definitions presenting incompatibilities acrosscountries or sectors.
The main objectives of the CSA are:
■ to select the practices and products of the cultural sectorsand create definitions and classifications following theSNA concepts and framework;
■ to define the mechanisms of generation and interchangeof the cultural products and integrate this analysis intothe existing macroeconomic frameworks with no prejudiceto their specificities (e.g., not all cultural activities are reg-istered in production processes holding economic value);
■ to demarcate the international trade flows affecting cultur-al products, given their potential impact not only on theeconomy but also on the preservation of cultural identities;
■ to delimit the total cultural expenses by object, nature,beneficiary: goods and services directly benefiting house-holds; consumption of assets such as the original artworksused in production processes of cultural products; directpublic expenses in cultural management, etc.;
■ to explore the different funding processes of the culturalconsumption. The public funding, for instance, can takeplace through subsidies or transfers to activities developed
by the private sector; via the direct production of goodsand services by government entities; by simply acquiringand donating cultural and creative assets for the good ofthe community, etc.;
■ to offer pertinent information on the basic social characteristics relating to cultural production and itsorganization, following a producer-driven categorizationby size, type, employment in the cultural field and its characteristics, etc.; and
■ to provide information on the uses, consumption andindicators, enabling a categorization of offer and demandof cultural products (non-monetary quantities and classification by content), and relate them to the economicvariables of this framework.
The CSA, besides providing monetary information onthe generation and use of cultural products and services, canoffer non-monetary data, such as the number of works pro-duced or people involved in a performance. It encompassessocial dimensions, disaggregating data by social and educa-tional levels. Indeed, the CSA does not offer an additionalset of information but a coherent framework for the searchfor weaknesses and gaps in the existing information systems.Given that information normally comes from all differentsources and is presented in various ways, the CSA can recon-cile data, relate them to other economic sectors and disaggre-gate them by geographic area. In short, the analysis of theCSA can also be of benefit to those conducting mappingexercises on the economic measurement of cultural activitiessince it presents a coherent set of concepts, definitions andcategories and reconciles different sources of statistics.
This Report acknowledges the work being carried outby Convenio Andrés Bello,5 which has been developing toolsto assist its Latin American member countries to implementa CSA in their economies. This process started in 2003.Colombia made the first step to develop its Satellite Accountand the first results were published in 2007. Brazil and Chilehave also undertaken preliminary measurements. MERCO-SUR Cultural initiated an exercise for a regional economicmeasurement for the generation of reliable, consistent andcomparable information on issues relating to cultural eco-nomics and the creative economy. Convenio Andrés Bello hasbeen working towards the elaboration of a methodological
89C R E AT I V E E C O N O M Y R E P O R T 2 0 0 8
Tow
ard
s an e
vidence-b
ase
d a
ssessm
ent o
f the c
reative
econom
y
4
4.5 Implementation of a Culture Satellite Account
5 Convenio Andrés Bello is an international intergovernmental organization comprising Bolivia, Colombia, Chile, Cuba, Ecuador, Mexico, Panama, Paraguay, Peru, Spain and Venezuelaand whose main goal is the integration of the educational, scientific and cultural fields in Latin America.

90 C R E AT I V E E C O N O M Y R E P O R T 2 0 0 8
manual. The aim is to offer a methodology with a rigoroustechnical background that is applicable and serves as aninstrument for cultural policies. The first version of themanual became available in early 2008 and will be accessibleto all countries in the region as well as to other regions.
Nevertheless, despite of all this valuable work, themain issue is that the worldwide adoption of the CSA maytake a number of years since it is a long, expensive process.Many developing countries, particularly the LDCs, will cer-tainly have enormous human and financial resource con-straints to embarking on the exercises of first mapping theircreative industries and then moving on towards a gradual
implementation of a satellite account.
It is precisely because of these constraints that thisReport, in particular UNCTAD and ITC, are putting for-ward a proposal with a focus on trade. The main advantageis that trade statistics are already nationally reported regular-ly worldwide, requiring only a marginal additional cost toimprove their level of disaggregation as well as the qualityand coverage of reporting procedures at the national level. Atthis stage, this seems a more feasible approach even if the twoprocesses – the CSA and a trade-based model – are mutual-ly supportive and can move in parallel in countries able toafford them.
There are two interrelated problems with developing atrade-based model for evaluating the creative industries: def-initions and data availability. The question of definition ischallenging: what is, or are, the creative industries? The topichas generated much debate in recent years and notions of the“cultural industries”, “creative industries”, “experience econ-omy” and “creative class” have been circulating. Setting asidethe multifarious debates, the attempts by UNESCO todevelop a common understanding of the concept of “culturalindustries” should be noted. This understanding has much incommon with some of the core ideas associated with theUnited Kingdom concept of the “creative industries”,notably the way in which it has recently been developedaround the notion of a “production chain”. Readers canrefer to a rich semantic and ideological debate about theusability of the labels “cultural” and/or “creative” andwhether it is “industry”, “industries” or “sector”. In thisReport, the terms “creative economy” and “creative indus-tries” are adopted.
The essence of such a definition relates to that of theproduction chain. It challenges normative views on twocounts. First, the notion of “individualism and elite exclusiv-ity” that is commonly related to the romantic tradition ofthe artist or creator is operationalized by measurement of, orsupport for, lone artists and not collectives or support serv-ices (without which they could not function). Second is theidea that art or culture has an intrinsic and eternal meaningsuch that it is “pre-interpreted”. Counter to this is the need
for critique and debate and the interrelated development ofartists, audiences and markets.
Thus, contemporary definitions of the “creative econ-omy” have come to express a whole sphere, or field, of pro-duction (and consumption) that includes not only artists butalso manufacturers and exhibitors. Therefore, the definitionis based on a concept of cultural production. In fact, such aconcept underpins traditional manufacture. Thus, when it isoperationalized as a measure of employment or trade, oneincludes raw materials manufacture, distribution and con-struction of finished articles. Traditional creative industriessuch as print and publishing share such a heritage. In stan-dard industrial classifications or trade data, it is possible tofind a great deal of information on the process of writing,production and circulation of books. As with all “new”processes, however, the creative sector suffers, whereas fornew manufacturing activities that entail a new material, suchas printed circuit boards, it is easy and straightforward toextend classifications on the basis of process or goods.
The service sector in general suffers from poor meas-urement and reporting because the understanding of theprocess and the definitions are inadequate. New services havegenerally been added, and thought of, as new “industries”.However, economists have generally regarded services asdependent on manufacturing and thus not critical to theeconomy, so less effort has been expended on their measure-ment or conceptualization. Accordingly, the industrial classi-
Tow
ard
s an e
vidence-b
ase
d a
ssess
ment
of
the c
reati
ve e
conom
y
4
4.6 Data sources and assessment tools: Why the currentdata are inadequate

fications provide less detail than is needed. This generatessome problems. In many advanced economies, the servicesector is larger and is growing at a greater rate than the man-ufacturing sector. However, classifications include a multi-tude of categories that are increasingly empty of data and asmall number of categories (the service sector) that are onlycrudely described. This is a general problem. Arguably, thevery notion of services separate from manufacture is an arte-fact of industrial organization in recent years rather than asubstantial economic fact. The two are clearly interrelatedand to a much greater extent than the classifications repre-sent them as being (they are usually represented as discrete).
All of the issues facing the service sector can berepeated in the case of the creative industries. Thus, by defi-nition, the numbers on the creative economy as measured byconventional means are small. When more detailed or morecomplex classifications have been used, researchers andpoliticians have been astonished to discover that the creativeeconomy is not only a big player in economies but it is onewith robust growth; moreover, it is bigger that many more“traditional’ industries. Even so, it has been a slow and
controversial journey to even get this far in developed coun-tries. Such a conceptual and scientific shift has yet to occurevenly across the globe.
Such recognition has occurred and arguably has beenobscured by the rise of instrumental usages of culture. Asnoted in chapter 3, culture can be a way of leveraging otherdevelopment through encouragement to participate andinclusion. In fact, as countries have become more used to theinstrumental uses of culture, funding for idealist or aspira-tional forms has fallen off. This has created a tensionbetween publicly funded and privately funded culture as aresult of concerns that monetary values are overriding cul-tural values. The approach taken here is a non-reductive one:it recognizes that both values are important. However, thekey point is to examine what resources are required to devel-op and expand creative production (in its widest sense) in aparticular situation. Thus, the notion of the “creative pro-duction chain” very broadly cuts across such distortingdualisms as market/State, production/consumption, for-mal/informal and services/manufacture.
Thus far, the discussion of the creative industries andits definitions has focused on measures such as employmentand value added or size and structure. What has not beensystematically addressed is the question of trade flows. Tradeis a matter that presents a new level of difficulty, but it doesmake a useful starting point. In a sector that is internation-al, such a dimension is important. Moreover, in terms ofassessing the impact on development (positive or negative),it is important to know the balance of trade in creative-industry products. Finally, the development of new intellec-tual property regimes needs to be assessed against theirpotential impact on trade.
An approach taken by some governments has been touse data specially collected on the trade in “invisibles”, thatis, pure services where remuneration is for a service rendered.6
The problem is that these data are very poorly documentedand disaggregated by nation States in national accounts.(The technical aspects of the construction of taxonomiesand the collection of trade data with particular reference to
culture and the creative industries are discussed later in thischapter.) Furthermore, as business involving these activitiesmay or may not rely upon a dual flow of earnings derivedfrom physical product and intellectual property, remunera-tion for services rendered or commodity leased is very diffi-cult to capture. Finally, although useful in principle, the levelof disaggregation of statistics such as those of the ExtendedBalance of Payments Services (EBOPS) classification isinsufficient to produce the definition and precision required
Thus, while there is little alternative to using a prod-uct classification, doing so has its limitations. For example, itis going to underreport the effort of the self-employed elec-tronic artist although it may capture the labour of self-employed artisans better. Essentially, the central productclassification (CPC) does not focus on the shapers or design-ers of composite products (plays, music, writing, etc.).
The approach taken starts by defining the creativeindustries on the basis of final products (artists’ paintings,
91C R E AT I V E E C O N O M Y R E P O R T 2 0 0 8
Tow
ard
s an e
vidence-b
ase
d a
ssessm
ent o
f the c
reative
econom
y
4
6 See International Financial Services, World Invisible Trade 2007 (London: International Financial Services).
4.7 The case for a trade model for the creative industriesusing a product classification methodology

92 C R E AT I V E E C O N O M Y R E P O R T 2 0 0 8
hand-blown glass). Moreover, marginal or composite cate-gories are excluded to avoid overcounting. This might be par-ticularly relevant in the computing sector. For example, onecannot include personal computer (PC) output in computergames since doing so would result in an overestimate of thededicated-games usage; however, it will result in a significantundercounting of the impact of the computer games trade.
One must add a caveat: in contradistinction to thenormative approach of industrial or product classification,the creative economy may have some overlapping (and hence,in whole economy terms, double counting) elements withdefinitions that have different bases. This should not invali-date the adoption of a definition on the basis of the “finaluse” of goods or services; one must simply be careful withthe use of elements of product classification to make surethat it is appropriate. A similar protocol is adopted in thecase of satellite accounts.
Finally, it should be added that what many regard asthe core of creative activity – the creation of intellectualproperty (rights) – is not directly measured for the simplereason that IPRs are increasingly disembedded from materi-al products. In the past, IPRs were rolled up in the materialproducts, but increasingly, these elements can be separatedand, in fact, duplicated. A design can be used on a mug or atee-shirt or a book, for example. Moreover, the system ofcollection of IPRs, royalties, is dependent upon a range oflocal particularities concerning collecting societies as well asnational signing up to conventions. Moreover, this systemalso depends on where an artist has registered his/her rightsand whether the artist’s income flows from that place and isidentified as such. This may seem a very individual andunique circumstance, but one of the characteristics of thecreative economy is the extreme wealth that may be held in afew hands.7
It is important to recognize that there is a considerablegap in statistical availability in relation to the creative econo-my. The objective of this Report is to address this problemand begin the steps to solve it. Before describing the stepstaken to collate the data presented in chapter 5, it is usefulto discuss why there is such a gap.
The early development of industrial statistics and cen-suses of economic activity were undertaken in the early twen-tieth century. Not surprisingly, the classifications adopted bystatisticians at that time reflected the dominant industrial
structure in Northern Europe and North America andindustrial production practices. This period preceded thetime when extensive, mechanized mass production (Fordism)became widespread, and the taxonomies that were developedreflected the emphasis on primary resources and manufac-ture; little attention was paid to services. Effective statisticalcollection requires stability in taxonomies and categoriesused for collection and analysis. In addition, internationalcorrespondence tables have been developed for such classifi-cations. Accordingly, change in classifications takes placevery slowly and is resisted.
The nature and structure of most economies haschanged over the century, however, and now there are classi-fications that detail areas of economic activity that play aminor part in economic life and those that almost ignoreareas critical to economic growth. A general example is theservice sector and, more specifically, the creative economy.Second, economic change has occurred quickly, particularlywith respect to areas based on technological change. Again,the creative economy is in the vanguard. It is for these rea-sons that the creative economy is invisible when one looks atnational statistical tables. For instance, based on industryoutput and sales data, it seems that the computer gamesindustry is nowadays as important as the film industryalthough if one looks for information in national statistics,it will not appear. Changes are being made to taxonomies,however, and industrial classifications are being revised asquickly as possible. Nevertheless, owing to their historicallylow profile, they are a low priority.
This is not to suggest that no information is available.Clearly, older creative industries such as cinematography arebetter represented; however, the coverage is still partial. It ispossible to collect and then classify survey information oncreative-economy participants. However, much creative-economy activity is shifting to the virtual field of onlinetransactions. This shift presents a substantial problem fortrade data as only physical goods enter the audit so com-pletely new methods of reporting and surveying will berequired to capture this activity. Again, it is a problem sharedwith many service industries; however, perhaps it is morecritical for the creative economy.
In recent years, many agencies and governments havesought to collect data on the creative economy.Unfortunately, these approaches have been predominantlyopportunistic in the sense that such measures reflect the
Tow
ard
s an e
vidence-b
ase
d a
ssess
ment
of
the c
reati
ve e
conom
y
4
7 For further discussion of these issues, see Burns Owens Partnership, A.C. Pratt and C. Taylor, "A framework for the cultural sector: A report for UIS/UNESCO", (London: BurnsOwens Partnership, 2006); and The New Cultural Map: A Research Agenda for the 21st Century, S. Roodhouse (ed.) (Bretton Hall: S. Leeds University, 2000).

structure of national data bases rather than a systematic basisfor comparison. However, they have played a significant rolein promoting the case for, and the significance of, the creativeeconomy. What is needed now is a more systematic approach.
As will be further elaborated below, it is possible touse existing taxonomies of industry, occupation or trade topartially describe the creative economy. To be sure, this willby definition result in an underestimate; however, a startmust be made as it will itself create the basis for a robust col-lection of data on the creative economy. In particular, it willhighlight the areas that we know most about and, critically,those areas about which we know the least.
Some independent data are available on the creativeeconomy, but much of the data does not fit the current pur-pose. The reasons are related to the previous formulation ofcultural and creative economy policy, which was framed bypublic welfare economics and operated on a subsidy, orgrant-in-aid, model. Under such systems, there is less of acase for economic evaluation; usually the emphasis is on thefulfilment of service criteria rather than economic output.Thus, there is neither a culture nor a tradition of the collec-tion or use of such data on the creative economy.
Finally, there is considerable confusion over the termi-nology, concept and definition of the “creative economy”.As mentioned earlier, a whole range of terms has been usedin recent years. In part, this is evidence of a political strug-gle that the cultural field has been experiencing. The chang-ing nature of cultural production is also an indication of thegrowing desire of States to govern their economies in differ-
ent ways. Undoubtedly, the shift to more neoliberal forms ofgovernance has placed economic evaluation of all activitiesand value for money at centre stage. Moreover, despite theterminology, there is considerable convergence of conceptsand definitions. The recent work by UNESCO (UIS) todevelop a statistical framework in this field is evidence ofthis, and the current work by UNCTAD extends this work.
What then are the objectives of such an exercise? First,there is a need to organize data collection and collation alongcommon lines with agreed core concepts. Even if this does notnecessarily result in one single definition, the UIS suggestionis that a flexible definition or framework be adopted. Thismeans that there is a core set of activities alongside an option-al set defined but not required by all nations. In this way, datacollection can be efficient, related to need and comparable.
Second, with the definition of a core framework, it ispossible to identify not only existing information on a com-parable basis but also common gaps. These gaps are usefulfor developing the case for, and agreement about, the collec-tion of new information.
Third, with such a framework, we can immediatelymove towards a situation where we can have comparable datathat can be benchmarked. At this stage, a foundation forpotential data analysis, policy formulation and future evalu-ation will be in place. The following part of this chapterdescribes the basis for a method that could be further elaborated and used in the future for the classification ofexisting trade data.
Chapter 5 presents in detail the information that canbe collated on the exchange of creative goods. For obviousreasons, this information is dominated by monetary tradeand does not include the informal and not-for-profit activi-ties. It is important to caution the end-users of this data thatthey are not intended to provide a final figure on the value ofglobal creative goods. Rather, the data are presented as oneincremental step towards a better system for reporting, col-lecting and analysing statistics for trade of creative goodsand services. The aim is to give some indication of the orderof magnitude of the trade in creative goods and services aswell as trends.
Our approach was to use caution and err on the side ofunder-definition and exclusion rather than over-inclusion ofvariables. The analysis does not estimate the value of categoriesthat are a mixture of creative and non-creative goods. In fact,where there is uncertainty about the robustness of a categoryin reporting only creative industries, it is omitted. It is neces-sary to proceed on the basis of verifiable facts (not estimates)obtained from official available national sources that are basedon a sound methodology and figures that are reported to theUnited Nations by national sources. Therefore, the findings ofthis Report are at the lower end of valuations; without doubt,the actual figures will be considerably higher.
93C R E AT I V E E C O N O M Y R E P O R T 2 0 0 8
Tow
ard
s an e
vidence-b
ase
d a
ssessm
ent o
f the c
reative
econom
y
4
4.8 Methodological basis for a unified measure of international trade of creative goods

94 C R E AT I V E E C O N O M Y R E P O R T 2 0 0 8
In principle, the methodology deployed is simple andadditive. Trade statistics were broken down in their classifica-tion to the smallest unit of analysis (usually referred to usingfour- or five-digit codes). We then include or exclude suchunits from a definitive list of creative industries. Clearly,some activities associated with creative production are notclassified or described in data sources or they are describedbut carried out informally and have not actually been cap-tured in any data collected. These data will continue to beinvisible and go uncounted in the present schema.
Recognizing that often an important element of cre-ative products is their intellectual property, an attempt ismade to find corresponding data. However, the only availabledata are on overall royalties, and they are collected using adifferent taxonomy. Ideally, some way of relating these datacould be developed as the coverage of the work of WIPOincreases. In addition, specific data on copyrights for the cre-ative industries are not available. As a consequence, data onintellectual property data and on physical trade are not sim-ply additive; it is certain that most intellectual propertytransactions have been missed owing to non-availability ofdata. Copyright data depend on a locally functioning systemfor the regulation, collection and distribution of IPRs.However, this system is not complete in the developed worldand is partial at best in many areas of the developing world.Hence, the developing world is likely to be under-representedin these data.8
Trade information is fundamentally measured throughthe physical auditing of imports and exports of goods acrossnational borders. These goods are measured either by weight,volume or value. The reporting of the services sector is car-ried out on a different basis. The most detailed data are col-lected with respect to financial, trade-related foreignexchange flows self-reported by central banks (but not disag-gregated by product). Knowledge of the trade in services ingeneral and creative goods in particular makes us aware ofthe fact that these figures tell us only a little of what is need-ed to inform policy-oriented analysis. For example, theweight or number of CDs traded is an inferior indicator forour purposes because it does not inform us of the value ofintellectual property associated with what is basically a smalldisc of plastic. Moreover, it is possible that one recording ofa song could be exported (in a passenger’s suitcase) and thenreproduced in a second country under local licence or dis-
tributed as an MP3 file. No financial flows returning to thecountry of origin are either recorded or visible. Thus, thevalue of music to international trade is difficult to ascertain.For some products, the transfer of mass, volume and valuecan act as a proxy for value, but for most, it does not. Henceit is precisely because creative goods are worth more thantheir functional value (if they have one) that the anomaly isso serious. For example, how can two pieces of furniture –chairs, for instance – be fully accounted for when both con-tain similar volumes of material and are therefore the sameweight of goods, but one is an exclusive “designer” chair(which has considerable aesthetic and retail value) and theother is a mass-produced office chair?
The fundamental taxonomy of trade statistics is basedon the type of materials used. This presents those interestedin statistics for the creative economy with a problem. Only asmall number of materials are “cultural or creative” by defi-nition, that is, used exclusively for a cultural purpose.Diamonds, for example, can be used in jewellery and as a cut-ting edge for tools. Qualities of materials are unevenly cap-tured in the current Harmonized System (HS) classification.This is largely a historical issue that refers more to the pat-terns of trade when such taxonomies were first devised, inshort, when trade was dominated by manufactured goodsand commodities (see HS 5206 for an example of the finedistinctions made between different yarns used in clothing).A classification based on the amount of plastic used in theproduction of a classical music and a pop music CD, forexample, would inform us only of the raw materials incor-porated into the products. Even a measure of the wholesaleprice of the CDs reveals nothing of the copyrights associat-ed with the products.
Clearly, there is no way to express the “real” value of asong or a story. It might be suggested that one could trackthe royalty payments. However, this again is difficult. First,such tracking relies upon a sophisticated and well-function-ing collecting society (the organization that acts as an inter-mediary between artist and users). Manufacturers and dis-tributors return a particular percentage on sales of products(books and records, for example) to the collecting society, asdo broadcasters, and any public users of, say, music. Thenroyalty owners receive a proportion of returns. In theory, itwould be possible to track such “micro-payments” in anonline system. However, this is not a current reality.
Tow
ard
s an e
vidence-b
ase
d a
ssess
ment
of
the c
reati
ve e
conom
y
4
8 For example, the International Federation of the Phonographic Industry, an international trade body for music companies (http://www.ifpi.org/ ), does not collect data in manycountries as reliable data are not available.

The aim, therefore, is to develop a pragmatic way for-ward within the confines of the current data sets that wouldtell us something about the creative economy summarized intable 4.1. Creative products are clearly a sub-set of all prod-ucts. So, beyond this matrix lie all other products, whereusage is wholly functional. Our proposal is that productscould be subject to two criteria. The first criterion would bewhether they are primarily the subject of artistic or artisanalproduction, or of mass production. In reality, products willlie on a continuum; however, for classificatory purposes, it isnecessary to create a division. This criterion is indicative ofthe degree of creative labour content of each item produced.The assumption is that creative labour content is high ingoods of higher creative content and significance.
The second criterion would be to represent the typicaluse of the product, ranging from an artistic decorative artefactor ornament (which we term “aesthetic”), through designerproducts, to those that are mainly functional (beyond this willlie all other products that are primarily functional). Again, thisshould be seen as a continuum with, in practice, usages beingproportionately more one use or another. For example, a“designer” chair is functional but it is aesthetically valued aswell. In such a case, the assumption is that the more aestheticuse is likely to represent more creative value.
In the absence of an ideal or precise taxonomy anddata base, we have combined these two criteria so as to offersome useful and pragmatic distinctions. The two extremesmight be mass-produced functional usage (cell 4) and artisanaland aesthetic usage (cell 1). In between, we can distinguish thearts-and-crafts designer goods from those that are mass-produced but with a premium on “design” (or creative input).
Attempts should be made to separate out the aesthetical-ly specific goods from those that are more functional, and fromthose that are only functional (non-creative goods). However,there are a number of “grey areas” that are associated with shift-ing cultural practice. For instance, interior-design products com-prise a very difficult category. However, we might distinguishsome of these products from the more or less functional onesby the degree to which their value rests on aesthetics (cell 2).
The same sort of distinction is even more difficult tomake with respect to clothing. Traditionally, high fashion/ hautecouture is distinguished from prêt-à-porter/ready to wear oreven basic production. As indicated in the proposed classifica-
tion below, there is a possibility of separating out designer one-offs and designer styled goods. However, in practice, in thecase of clothing, we can identify only “luxury goods” such asfur, cashmere or silk as markers. In order not to distort the data,at the initial stage, it is better to exclude textiles from the fash-ion category since they are too difficult to distinguish.
This is clearly not a perfect system of classification: itis offered as an indicator to simply under-representing thecreative sector by – in effect – including only items that fallinto cell 1.9 The benefit of the taxonomy presented in table4.1 is that we can gain a more indicative picture of the extentof the creative economy. Moreover, cells 2 through 4 areindicative of the site of discussion of future taxonomies anddata collection if they are to begin to represent the creativeproducts accurately rather than what happens at presentwhere the existing taxonomies effectively render the creativeeconomy invisible.
95C R E AT I V E E C O N O M Y R E P O R T 2 0 0 8
Tow
ard
s an e
vidence-b
ase
d a
ssessm
ent o
f the c
reative
econom
y
4
9 Any product/artefact whether mass/artisanal or aesthetic/functional can be commodified – sold/traded – or be considered as beyond such valuation. Where a particular product liesin this commodification domain is always an empirical fact that needs to be investigated, and it will change through time and place.
Table 4.1 Proposed categorization of creative goods
Aesthetic
Functional
1
3
2
4
Organization of productionof the product
Artisanal Mass
Dominant use ofthe product
Cell examples
1 – A fine-art painting2 – A newspaper or book3 – A hand-made ceramic vase4 – Designed furniture (high design content,
mass produced)
Cells 1 and 2 are most clearly dedicated to creative activities that are exclusive but can be artisanal or mass pro-duction. In some cases, it can be difficult to distinguishwhether materials are dedicated to artisanal or mass production. For example, in the case of a fine-art item, it ispossible to distinguish the trade in high-value goods from amore low-level (artistically speaking) reproduction market.
Cells 3 and 4 are for creative goods that have not only a creative content but also a functional nature, but the latterdominates. For example, a handmade ceramic vase is a decorative interior article but also has a utility value.

96 C R E AT I V E E C O N O M Y R E P O R T 2 0 0 8
Obviously, there are challenges to understanding thescale and nature of international trade in creative goods,services and rights. This chapter argues that it is possible todevelop a rudimentary, first-cut analysis from a combinationof modified existing trade data. The resultant taxonomiesand the data that populate them are neither ideal nor perfect.Caution is needed to draw taxonomies tightly but to developthem with intelligence such that they map – and make visible – the shifting dimensions of creative production.
The proposal that is being put forward seeks to useraw data from verified public sources that are already collect-ed internationally rather than rely upon samples or estimatesfrom sources whose rigour in their data collection methodsis not guaranteed, or to rely upon very costly and time-consuming primary data collection. Of course, the finalobjective of an accurate audit of the creative economy willbe achievable only with the adoption of new taxonomies and with new data collection. Until that time, pragmatic solu-tions such as the one outlined here will be a way forward.
There is clearly a need for a better understanding aswell as a measure of the organizational and institutionalforms that have developed in the creative industries. If policyinterventions are to be considered, a baseline will be required
to identify a starting point for evaluating impact and vari-ables will need to be matched with objectives. The creativeindustries commonly seek to achieve a number of contradic-tory outcomes: access and excellence, social inclusion andprofitability, etc. It is for this reason that considerable care isneeded in the creation of indicators for comparative work,evaluation and policy-making.
The issue is to develop an information base that isrobust, meaningful and flexible. While quantitative statisticshave their use, there is also a place for qualitative informa-tion. Most statistical indicators are focused on outputs; how-ever, in the arts and culture process, indicators are also criti-cal. Invariably, these describe such things as institutionalform, density and competence as well as particular ways inwhich people are employed or carry out tasks.
In summary, this is an outline to develop a possibleapproach by which otherwise invisible activities of the cre-ative economy may be made visible. This scheme is intendedto reconstruct a production-chain measure for physicalgoods. However, completing the picture for invisible orcopyright transactions is still some way off. Considerableefforts are needed to expand and improve this visibility. To
ward
s an e
vidence-b
ase
d a
ssess
ment
of
the c
reati
ve e
conom
y
4
4.9 Main considerations

97C R E AT I V E E C O N O M Y R E P O R T 2 0 0 8
Tow
ard
s an e
vidence-b
ase
d a
ssessm
ent o
f the c
reative
econom
y
4
Box 4.2 Lessons from Uruguay
Thus begins the inspiring poem, “The South also exists”, by the awarding-winning Uruguayan writer, Mario Benedetti.Uruguay, a country of small dimensions, is home to a flourishing cultural production. From the galleries of the Mercadodel Puerto in Montevideo to the tiny José Ignacio city, the works of art exhibiting a myriad of styles and techniques proudlydisplay the stamp “Hecho en Uruguay”. The recognition that distribution channels can be a huge bottleneck for the cre-ative economy gave birth to different initiatives in the country, including the Mercados de los Artesanos (ArtisansMarkets), today a small network of points of sale located in heritage sites of Montevideo such as the Mercado de laAbundancia (Abundance Market). This century-old building hosts a market, restaurants and shops, tempting the eyes aswell as the gastronomic and cultural appetites of tourists and locals. Created and managed by the Asociación Uruguayade los Artesanos (AUDA), this initiative has 300 members, who have access not only to direct points of sale but also tosmall amounts of credit at preferential interest rates, granted with the warrant of the association.
Equally enlightening is Manos del Uruguay (Hands of Uruguay), a cooperative, not-for-profit business set up in 1968 to foster thedistribution of the woven clothing and handicrafts made by artisans in the countryside. Under the guidance of a team of design-ers, the original core of 12 groups grew to 31 in the first year as a result of the amount of sales. The small cooperative becamea company. In 1969, a service centre established programmes of quality control and supply-chain management. Courses werealso provided to improve the capacity of artisans, turning Manos into a self-managed business in 1976. The mix of social pur-pose, financial balance and high-quality products put Manos del Uruguay on the pages of fashion magazines in New York, Parisand Tokyo under brands such as Polo Ralph Lauren, Donna Karan and Victoria’s Secret. Today, the company has 100 employeesand a network of 17 cooperatives, with a total of 350 artisans all over Uruguay. It also works with 200 independent profession-als, who produce designer objects with a range of local materials (wood, ceramics, leather) and traded in the five stores of thechain. Moreover, anthropologists and historians collaborate on the creation of pieces with a strong national identity.
The benefits are twofold. On the one hand, the guarantee of a stable source of revenue enables the artisans in the coun-tryside to live off their cultural talent. On the other, the national traditions and cultural technologies are not only pre-served but also valued as a booster of socio-economic inclusion, irrefutable proof that creativity and culture can be aninexhaustible source of sustainable development through the creative economy.
By Ana Carla Fonseca Reis, Garimpo de Soluções, economia, cultura & desenvolvimiento.
“With its ritual of steel its great chimneys its secret scholars its siren song its neon skies its Christmas sales its cult of God the Father and of epaulets
with its keys to the kingdom the North is the one who orders
but down here, down hunger at hand resorts to the bitter fruit of what others decide while time passes and pass the parades and other things that the North doesn't forbid.
With its hard hope the South also exists.”

98 C R E AT I V E E C O N O M Y R E P O R T 2 0 0 8

International Trade in Creative Goods and Services 3
PART

100 C R E AT I V E E C O N O M Y R E P O R T 2 0 0 8

Global and regional trade flows of creative goodsand services encompass trade transactions with complexinteractions among culture, economics and technology.Likewise, trade is framed within the rules and practices ofthe global trading system. Such a framework includes theuniversally accepted multilateral rules governing tradeamong members of the WTO and other legal provisionsfor free trade agreements, economic unions and economicpartnership agreements. Creative-industry trade rules mayalso be influenced by other legal instruments such as theUNESCO Convention on Cultural Diversity and the likein other international organizations at the regional level aswell as by other specific agreements dealing with culturaltrade exchanges and intellectual property regimes.
With the emergence of the creative economy and thegrowing importance of products of creative industries inworld trade, issues relating to the interface between inter-national trade policies and national cultural objectives arereceiving prominent attention in the economic develop-ment agenda of the third millennium. The new round ofmultilateral trade negotiations aiming at further trade lib-eralization remained inconclusive throughout 2007 owingto polarized views on how free markets can be a tool forredressing socio-economic imbalances and improvingdevelopment prospects for better welfare and a more equi-table and inclusive society. In this context, this chapterpresents a picture and a first-ever analysis of internationaltrade flows of creative goods and services in global mar-kets. The purpose is to examine the main features inherentto each creative industry and to assist policy-makers inassessing the actual and potential economic impact oftheir creative industries for trade and development gains.
At the outset, this Report is introducing pioneeringwork by presenting the first universal comparative analysisbased on available national trade statistics for creativegoods and services. Nevertheless, despite the efforts tocompile and share reliable figures, there are visible gaps inthe quality and coverage of reported trade statistics for cre-ative industries at the global level. Attention is drawn notonly to what the figures show but in particular to whatthey are not able to capture. Therefore, the Report shouldbe seen as the starting point of a work in progress thataims at improving market transparency in the area of thecreative industries with a view to facilitating a betterunderstanding of the dynamics of the creative economyand supporting governments in policy formulation.
This quantitative assessment faced a number of dif-ficulties from both the conceptual and the methodologicalpoint of view. As explained in chapter 1, there is nounique, universally agreed set of creative industries.Countries have different definitions of the creative industriesand have adopted diverse groupings of these industries. Thestatistical analysis is based on the UNCTAD definitionand grouping of creative industries, and the items includedin each group were jointly classified by the UNCTAD andITC secretariats, taking as the starting point theUNESCO Framework for Cultural Statistics.
This Report shows trade figures for the creativeindustries, which constitute a larger group than the culturalindustries.1 For instance, first-hand figures for arts andcrafts as well as for the group of design products areshown. Despite the challenge of classifying more than fivehundred items, initial results are valuable; arts and crafts
101C R E AT I V E E C O N O M Y R E P O R T 2 0 0 8
Inte
rnatio
nal tra
de in
cre
ative
goods a
nd se
rvices: G
lobal tre
nds a
nd fe
atu
res
5
CH
AP
TER
5International trade in creative goods and services: Global trends and features
1 The UNESCO report, International Flows of Selected Cultural Goods and Services, 1994-2003, is the most comprehensive report on this matter. However, the focus is on culturalindustries where data for art and crafts, design and some creative services were not included. Therefore, as the classification of items differs, the figures presented in this reporthave a different magnitude and are not comparable with the data presented in the UNESCO report owing to different coverage. It is noteworthy that UNCTAD worked inclose collaboration with ITC and in liaison with the UNESCO Institute for Statistics in the preparation of data for the Creative Economy Report 2008.
5.1 Setting the scene

102 C R E AT I V E E C O N O M Y R E P O R T 2 0 0 8
and design, for which universal data have never been com-piled, are indeed the two groups of creative industries ofgreatest economic and social importance for developingcountries.
Attention is drawn to the shortcomings of the figurespresented for the more technology-intensive and services-oriented creative industries, such as music, audiovisuals andnew media. These figures are highly underestimated and donot reflect the vibrant reality of the global markets forphonographic, audiovisual and digital products. In thisregard, three important points should be taken into consideration:
■ Only 57 out of 192 United Nations Member Statesreported figures for trade in services in 1996 although thesituation subsequently improved since this number rose to90 countries in 2005. In the case of creative goods, signsare more encouraging: in 2005, the number of reportingcountries was 131 compared to 54 countries in 1996;
■ Current standard statistical classifications remain cus-toms-based and refer only to tangible physical goods. Thesystem is outdated and lacks the level of disaggregationrequired for an in-depth product-by-product analysis. Italso does not reflect the reality of connectivity and theincreasing use of e-business and ITC tools for virtualtrade and distribution of creative content. Therefore, it isnot yet possible to capture the growing volume of digital-ized creative content such as music, films and books tradedvia the Internet and mobile phones; and
■ The non-availability of statistics for copyrights and thegaps in data for creative services, combined with the diffi-culties in collecting figures at the global level on relatedmarketing and distribution services (box-office revenuesof cinemas, theatres, concerts, etc.), hide the real impactof this dynamic sector in international trade and theworld economy.
Although imperfect, the figures give an indication ofmarket trends and trade flows, showing the key players foreach group of creative industries in global markets. Even ifthe figures do not show the full economic impact of eachcreative group, the fact that the same basket of products hasbeen used for all countries for a ten-year time series providesthe basis for a universal comparative analysis. However, in
order to avoid misinterpretations, the analysis should be seenin light of the issues addressed in chapter 4, and the generalexplanatory note in the annex.
This section shows global trade flows of creative-industry products for the period 1996-2005 although theperiod 2000-2005 is more representative because it covers alarger number of countries and gradually, reporting proce-dures have improved in recent years. The country groupingis the one used by UNCTAD, as listed in the annex. Theanalysis of trade figures covers the domains of creativeindustries as presented in table 5.1 below.
Trade data for products of industries related to thecreative industries (hereafter referred to as “related industries”)2
are shown separately for the purpose of market transparencyand the following four main reasons:
(a) the related industries are fully dependent on creative content for their own existence;
(b) the related industries constitute a relevant tool for theanalysis of current and future demand for creative goodsand services;
(c) technological advances in these related industries ofhardware products (television and radio sets, digitalequipment (DVDs, MP3s, etc.), musical instruments,etc.) are linked with the making of creative content andvice versa; and
(d) the majority of related industries are technology-intensive and innovation-led, thus influencing the level ofR&D and other creative services.
The same rationale applies to figures for royalties.Given the non-existence of specific data for copyrights at theworld level, which are more closely linked with the creativeindustries, figures for royalties are provided only as comple-mentary information. These data are not included in thetotals as creative services owing to the impossibility of iden-tifying the royalties pertaining exclusively to the creativeindustries. Their inclusion would thus give rise to possiblemisleading interpretations and would inflate the figures forcreative industries.
The analysis is based on official statistics reported bynational sources to the United Nations Commodity TradeStatistics Database (Comtrade) and further classified
Inte
rnati
onal
trade i
n c
reati
ve g
oods
and s
erv
ices:
G
lobal
trends
and f
eatu
res
5
2 Products of related industries include equipment, such as computers, cameras and other goods needed to produce or consume creative goods and services. This classification, comprisingtwo broad categories (“core” and “related industries”), has been used by UNESCO to report trade of cultural industries. WIPO also includes this category although with a differentname (“core and interdependent copyright-based industries”) for IPR purposes. The UNCTAD/ITC classification differs since it refers exclusively to creative goods and services.Creative industries for UNCTAD cover the nine subgroups mentioned above but the term “core industries” is not used. Related industries are provided only as indicative data.

103C R E AT I V E E C O N O M Y R E P O R T 2 0 0 8
Inte
rnatio
nal tra
de in
cre
ative
goods a
nd se
rvices: G
lobal tre
nds a
nd fe
atu
res
5
Table 5.1 Goods and services of creative industries
Domain
5.1.a Heritage and arts: Goods and services
Subgroup
Traditional culturalexpressions
Creative goods (available data)
Creative services aggregated
Creative services(data currently unavailable)
Arts and crafts: carpets,yarn, wickerware,paperware, celebrationarticles and others.
Heritage
Cultural sites
Other personal, culturaland recreational services.
Cultural & recreationalservices: library services;archive services; museumservices; preservation services of historical sitesand buildings; botanicaland zoological garden serv-ices; amusement park andsimilar attraction services.
Arts
Visual arts
Antiques, painting,photography, sculpture;others: collages and similardecorative material
Photography: portrait pho-tography services; advertis-ing and related photographyservices; action photographyservices; specialty photog-raphy services; restoration,copying and retouchingservices of photography;other photographic services;photography processingservices. Painting & sculpture: services ofauthors, composers,sculptors and other artistsexcept performing artists.
Performing arts
Performing arts: performingarts event promotion andorganization services; performing arts event production and presentationservices; performing artsfacility operation services;other performing arts andlive entertainment services
Music
Recorded laser discs andrecorded magnetic tapes,and manuscript music.
Music: Sound recordingservices; reproductionservices of recorded media,on a fee or contract basis.
C
R
E
A
T
I
V
E
I
N
D
U
S
T
R
I
E
S
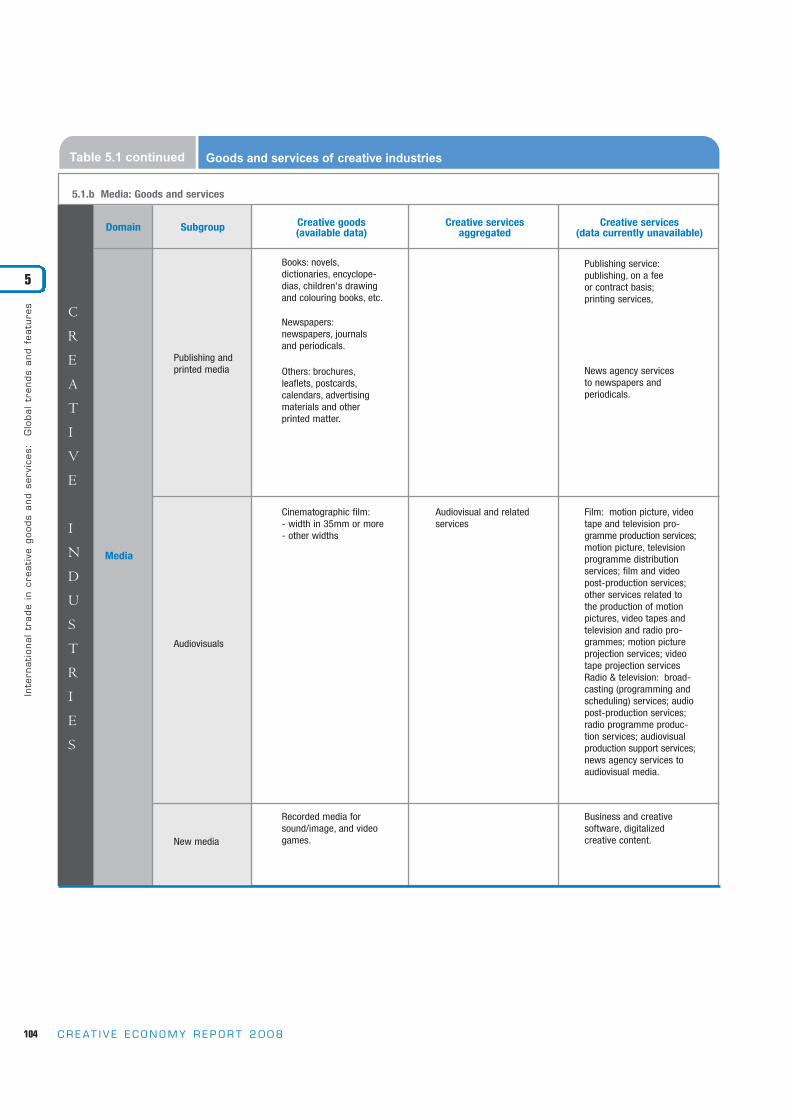
104 C R E AT I V E E C O N O M Y R E P O R T 2 0 0 8
Inte
rnati
onal
trade i
n c
reati
ve g
oods
and s
erv
ices:
G
lobal
trends
and f
eatu
res
5
C
R
E
A
T
I
V
E
I
N
D
U
S
T
R
I
E
S
Table 5.1 continued Goods and services of creative industries
Domain
5.1.b Media: Goods and services
Subgroup Creative goods (available data)
Creative services aggregated
Creative services(data currently unavailable)
Books: novels,dictionaries, encyclope-dias, children's drawingand colouring books, etc.
Publishing service:publishing, on a fee or contract basis; printing services,
Publishing andprinted media
Newspapers:newspapers, journals and periodicals.
Others: brochures,leaflets, postcards,calendars, advertisingmaterials and other printed matter.
News agency services to newspapers and periodicals.
Media
Cinematographic film:- width in 35mm or more - other widths
Audiovisual and relatedservices
Film: motion picture, videotape and television pro-gramme production services;motion picture, televisionprogramme distributionservices; film and videopost-production services;other services related tothe production of motionpictures, video tapes andtelevision and radio pro-grammes; motion pictureprojection services; videotape projection servicesRadio & television: broad-casting (programming andscheduling) services; audiopost-production services;radio programme produc-tion services; audiovisualproduction support services;news agency services toaudiovisual media.
Audiovisuals
New media
Recorded media forsound/image, and videogames.
Business and creative software, digitalized creative content.
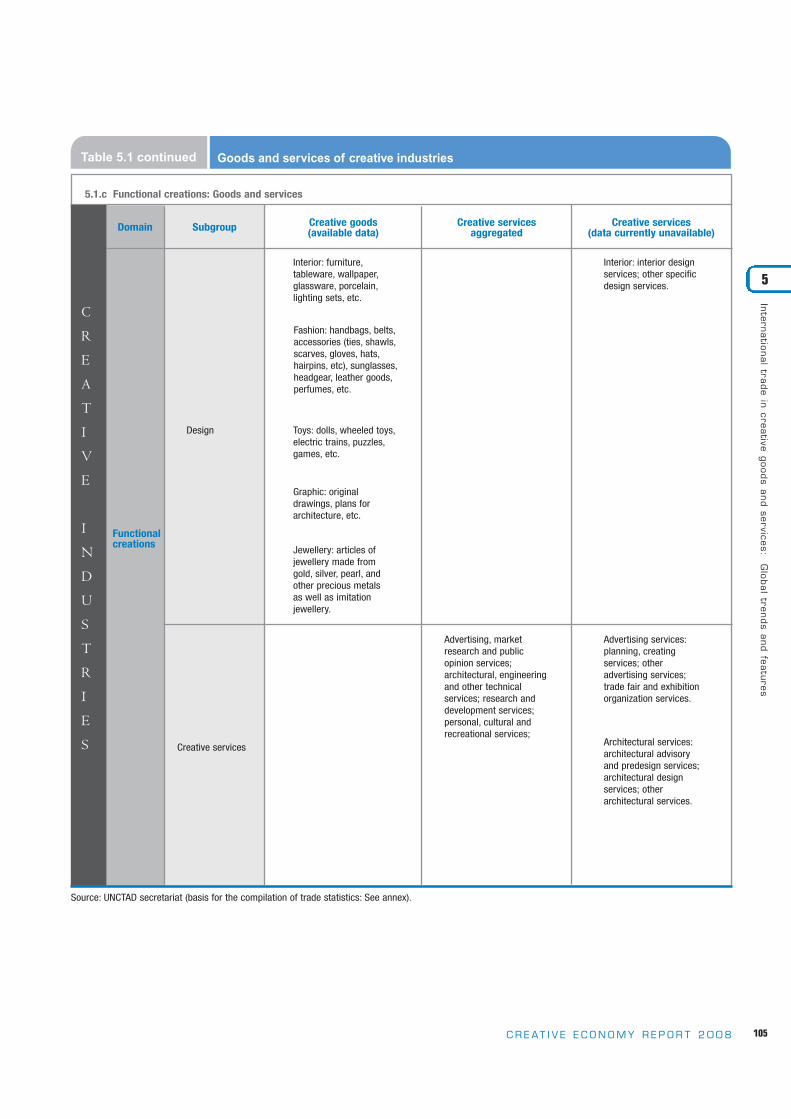
105C R E AT I V E E C O N O M Y R E P O R T 2 0 0 8
Inte
rnatio
nal tra
de in
cre
ative
goods a
nd se
rvices: G
lobal tre
nds a
nd fe
atu
res
5
C
R
E
A
T
I
V
E
I
N
D
U
S
T
R
I
E
S
Table 5.1 continued Goods and services of creative industries
5.1.c Functional creations: Goods and services
Interior: furniture,tableware, wallpaper,glassware, porcelain,lighting sets, etc.
Interior: interior designservices; other specificdesign services.
Fashion: handbags, belts,accessories (ties, shawls,scarves, gloves, hats,hairpins, etc), sunglasses,headgear, leather goods,perfumes, etc.
Toys: dolls, wheeled toys,electric trains, puzzles,games, etc.
Graphic: original drawings, plans for architecture, etc.
Jewellery: articles of jewellery made fromgold, silver, pearl, andother precious metals as well as imitation jewellery.
Advertising, marketresearch and public opinion services; architectural, engineeringand other technical services; research anddevelopment services;personal, cultural andrecreational services;
Advertising services:planning, creating services; other advertising services;trade fair and exhibitionorganization services.
Architectural services:architectural advisory and predesign services;architectural design services; other architectural services.
Design
Functionalcreations
Creative services
Domain Subgroup Creative goods (available data)
Creative services aggregated
Creative services(data currently unavailable)
Source: UNCTAD secretariat (basis for the compilation of trade statistics: See annex).

106 C R E AT I V E E C O N O M Y R E P O R T 2 0 0 8
and processed by UNCTAD. Table 5.1 shows the products(goods and services) used for the compilation of the tradestatistics as well as the list of those products for which figures are currently unavailable. There are no estimates ormirror data. Additional tables are presented in the annex, andmore detailed country and sectoral statistics are accessible viaInternet through the “UNCTAD Global Databank onCreative Economy and Industries”.3
A key issue in approaching trade features is to examinehow creative industries generate value from cross-bordertrade and what the backward and forward linkages are in thevalue chain of each creative-industry subgroup so as to prop-erly assess its impact for both the exporting and importing
countries. Nowadays it is not yet possible to undertake morerefined input and output analysis to evaluate forward andbackward spillovers.
The creative industries have been generating increasingrevenue from the production, trade and distribution of theirgoods and services as well as from the collection of copy-rights associated with their use. Trade and IPR flows originatefrom international transactions among two or more countriesand intra-firm transactions between transnational corpora-tions. Trade flows of creative products include the revenues ofexport and import operations for goods and services pro-duced by the creative industries. Against this background, thesalient features and the global trade flows of creative goodsand services are examined in the following sections.
The global market for traded goods and services ofthe creative industries has enjoyed an unprecedenteddynamism in recent years. The value of world exports of cre-ative-industry goods and services reached $424.4.billion in2005, accounting for 3.4 per cent of world trade as com-pared with $227.4 billion in 1996 according to UNCTAD.Over the period 1996-2005, the creative industries gainedshares in global markets, growing at an annual rate of 8.7 percent for the period 2000-2005. This upward trend is likelyto continue throughout the decade, given the positiveprospects for global demand.
Exports of creative goods accounted for the vastmajority of world trade of creative industries, accounting for3.2 per cent of world trade in merchandise goods. In 2005,they reached $335.5 billion, a level 77 per cent higher thanthe $189.2 billion in 1996 (see table 5.10) and representingan annual growth rate of 6.0 per cent over the period.Exports of creative services increased by 8.8 per cent annu-ally, rising from $38.2 billion in 1996 to $89 billion in2005 although this increase is also indicative of the growingnumber of reporting countries, as explained earlier. In anycase, trade in creative services grew faster than trade in cre-ative goods (see explanatory notes in the annex).
For the first time, world trade figures for creativeindustries are being published, providing evidence that cre-ative industries constitute a new dynamic sector in world
trade. The magnitude and the potential of the global marketfor creative-industry products are vast and have only recentlybeen recognized. The creative economy in general and thecreative industries in particular are indeed opening up newopportunities for developing countries to leapfrog into high-growth sectors of the world economy and increase their participation in global trade. The creative industries arealready driving trade and development gains in a growingnumber of countries, particularly in Asia.
While developed countries have dominated bothexport and import flows, developing countries year after yearhave increased their share in world markets for creative prod-ucts, and their exports have risen faster than those fromdeveloped countries. Exports of creative goods from devel-oping economies accounted for 29 per cent of world exportsof creative goods in 1996 and reached 41 per cent in 2005(see chart 5.1.a). This significant growth reflects the remark-able increase in production and trade of creative goods inChina, which became the world’s leading exporting countryof creative goods in 2005 with an impressive market share of19 per cent of total world exports of creative goods.Although the fast growth of creative industries is takingplace mainly in Asia, all developing regions have increasedtheir participation in the world trade of creative goods (seecharts 5.1.a and 5.1.b and tables 1.1 and 1.3.3 in the annex).
Inte
rnati
onal
trade i
n c
reati
ve g
oods
and s
erv
ices:
G
lobal
trends
and f
eatu
res
5
3 The UNCTAD Creative Economy and Industries Programme jointly with the Central Statistics Branch launched the “UNCTAD Global Databank on Creative Economy & Industries” in April 2008. The statistics can be accessed by the general public at: http://www.unctad.org/statistics, or www.unctadxi.org/creative . For further information, contact: [email protected].
5.2 Creative industries: A new dynamic sector in world trade

5.3.1 Global trends in world exports
In 2005, total exports of all creative-industry prod-ucts reached $424.4 billion (see chart 5.2), with a growthrate of 6.4 per cent over the decade under review. Exportearnings from creative industries cover the value of exportsof all creative-industry products, comprising tangible goodsand intangible services in each subgroup. It should be notedthat, owing to the gaps in the availability of data for creativeservices,4 figures for exports of creative goods were higherthan those for creative services – a distortion of the reality.
The value of exports of creative goods increasedmarkedly during the period 1996-2005, with the total valuereaching $335.5 billion in 2005 (table 5.2). The annualgrowth rate during this 10-year period was 6.1 per cent, andas a result, all regions and economic groups of countriesbenefited from higher export earnings. Exports of creativegoods from developed countries predominated in world mar-kets. At the same time, exports from developing economiesincreased dramatically (by 143 per cent) from $56 billion in1996 to $136 billion in 2005 (see chart 5.2 and table 1.2.Ain the annex).
As regards creative services, the value of exports expe-rienced exponential growth from $38 billion to $89 billion,growing annually by 8.8 per cent during the period 1996-2005. This means that exports of creative services grew
faster than world exports of all creative products. On thebasis of available statistics, creative services accounted foronly 21 per cent of the total exports of creative industries in2005. Obviously, this share is underestimated since mostcountries, both developing and developed, do not reportdata for all categories of creative services.
The structure of exports of goods from creativeindustries, by economic group, is presented in table 5.2. Thepredominance of developed economies in world trade ofcreative goods is noteworthy (chart 5.4). In 2005, their share
107C R E AT I V E E C O N O M Y R E P O R T 2 0 0 8
Inte
rnatio
nal tra
de in
cre
ative
goods a
nd se
rvices: G
lobal tre
nds a
nd fe
atu
res
5
4 Even key players in the world market such as the United Kingdom and the United States do not report data for important subsectors of creative services such as advertising andarchitecture.
5.3 Global trends in world trade of creative goods and services
Chart 5.1.aCreative industries: Exports of creative goods, by economic group, 2005
Developed economies
Source: UNCTAD
Developing economies
Economies in transition
China
22%
19%41%
58%
1%
Other developing economies
Chart 5.1.b
Source: UNCTAD
Creative industries: Exports of creative services, by economic group, 2005
Developed economies
Developing economies
Economies in transition
82%
11%
7%
Chart 5.2 Evolution of world exports of creative goods and services, 1996-2005 (in billions of $)
Source: UNCTAD
2005
424
227
218
119
88
38
44
32
25
15
22
10
18
6
14
5
12
7
1996
(billion US $)
0 10050 200150 300250 400350 450
All creative
industries
Design
Creative services
Publishing &
printed media
Heritage goods
and services
Visual arts
Audiovisual
Performing arts
New media

108 C R E AT I V E E C O N O M Y R E P O R T 2 0 0 8
in total exports of creative goods was about 90 per cent formusic and audiovisuals, around 80 per cent forpublishing/printed media, 70 per cent for visual arts, andover 50 per cent for new media and design. This trend isvalid and very relevant for market analysis. Chart 5.4 showsthe importance of creative industries for both developedand developing economies. Furthermore, these trade datamirror the fact that the high-growth subgroups of creativeindustries with higher value added such as audiovisuals andnew media are exported mainly by advanced economies.
For developing economies, arts and crafts constitutesthe most important group of creative products, accountingfor 60 per cent of their share in the world market for cre-ative-industry goods (chart 5.4). Design and new media alsohave great potential; exports from developing economieshave been increasing and each of these subgroups respondedto approximately 47 per cent of the demand from globalmarkets in 2005. This upward trend in exports of creativegoods from developing economies is due mainly to substan-tial increases in the design subgroup, with exports risingfrom $42.9 billion in 1996 to $102.4 billion in 2005,reflecting mainly the growth in China. If China is consideredapart, the situation of developing countries in world marketsis less bright; their total share in world exports of all creativegoods becomes 22 per cent instead of 41 per cent for 2005,as shown in chart 5.1.a and in several tables in the annex. Theeconomies in transition play a marginal role in world marketsof creative goods and services, accounting for less than 1 percent of market share over the period under review, accordingto available figures.
Inte
rnati
onal
trade i
n c
reati
ve g
oods
and s
erv
ices:
G
lobal
trends
and f
eatu
res
5
Chart 5.3.a Creative industries: Exports, by group, 1996
Arts and crafts (8%)
Source: UNCTAD
Audiovisuals (0.2%)
Design (63%)
Music (3%)
New media (4%)
Publishing (17%)
Visual arts (5%)
Arts and crafts (7%)
Source: UNCT AD
Audiovisuals (0.2%)
Design (65%)
Mu sic (4%)
New me dia (4%)
Publishing (13%)
Visual arts (7%)
Creative industries: Exports, by group, 2005 Chart 5.3.b
Table 5.2Creative goods: Exports, by economic group, 2005 (in millions of $)
All creative goodsArts and craftsAudiovisualsDesignMusicNew mediaPublishingVisual arts
Source: UNCTAD.
World
335,49423,244
664218,173
14,92412,03544,30422,149
Developedeconomies
196,1099,118
592112,595
13,4246,471
36,59315,651
Developingeconomies
136,23113,881
55102,413
1,4125,5086,5676,395
Economiesin transition
3,154137
21,735
6350
1,09671
020
%40
%60
%80
%10
0%

109C R E AT I V E E C O N O M Y R E P O R T 2 0 0 8
5.3.2 Global trends in world imports
The evolution of world imports of creative goodsduring the period 1996-2005 showed a similar upwardtrend but with higher values than those of exports,5 increas-ing from $190.5 billion to $350.9 billion (table 5.4). Theshare of developed economies in world imports of creativegoods declined from 85 per cent to 81 per cent. In 2005,developing countries imported 17.3 per cent of all creativegoods, with a value of about $60.8 billion. In the case ofeconomies in transition, their imports of creative goodsrepresented about 2 per cent of the world total, amountingto $7.5 billion (see table 5.4 and the annex).
As chart 5.5.a illustrates, developed economies werethe largest importers of creative goods during the period1996-2005. A picture of imports of creative goods is pre-sented in chart 5.5.b. As the chart shows, design, whichaccounts for 65 per cent of total imports, is the subgroupwith the highest volume in world trade, followed by publica-
Inte
rnatio
nal tra
de in
cre
ative
goods a
nd se
rvices: G
lobal tre
nds a
nd fe
atu
res
5
5 For all customs-based trade statistics, imports are reported on a c.i.f. basis (including costs, insurance and freight) and exports on an f.o.b. basis (free on board). As a result, the former are always higher than the latter.
Table 5.3Creative goods: Exports, by economic group and region, 2000 and 2005
WorldwideDeveloped economiesEuropeUnited StatesJapanCanadaDeveloping economiesAsia - South, Eastern,
Southeastern ChinaWestern AsiaLatin America and CaribbeanAfricaLDCsSIDSEconomies in transition
Source: UNCTAD.
Economic group and region 2000
Value (in millions of $) Change (%)
228,695136,643
99,20120,703
4,80310,41389,827
79,31628,474
2,7476,769
973648133
2,226
2005
335,494194,445149,825
25,5445,547
11,377136,231
119,83961,360
5,9478,6411,775
211153
4,818
2000-2005
4742512315
952
51115116
2882
-6715
116
Table 5.4 Creative goods: Imports, by economic group, 1996 and 2005 (in millions of $)
All creative industriesArts and craftsAudiovisuals DesignMusicNew mediaPublishingVisual arts
Source: UNCTAD.
1996
Worldwide
190,49215,679
333120,603
4,8516,250
31,24211,534
2005
350,88425,091
650228,428
16,41913,40245,78321,111
1996
Developedeconomies
163,25712,680
255101,451
4,4425,683
28,22510,521
2005
282,55820,174
526184,052
13,73710,71834,74018,610
1996
Developingeconomies
27,0742,984
7819,057
406564
2,9731,011
2005
60,7594,390
11639,257
2,4132,4659,7352,382
1996
Economies in transition
16115
095
33
442
2005
7,568527
75,119
269220
1,308118
Chart 5.5.a Imports of creative goods, by economic group, 1996, 2000 and 2005
Developing economies
Developed economies
Economies in transition
1996 2000 2005
Source: UNCTAD
0
50
100
150
200
250
300
(Bill
ion
US
$)
Chart 5.5.b Imports of creative goods, by group, 2005 (%)
Design (65.1)
Design
Publishing (13.05)
Publishing
Arts and crafts (7.15) Arts and crafts
Visual arts (6.02)
Visual arts
Music (CDs, tapes) (4.68)
Music
New media (3.82)
New media
Audiovisuals (0.19)
Audiovisuals
Source: UNCTAD
68.09%

tions and printed media. This structure is the same in allthree economic groups of countries, as shown in table 5.4.
More than 50 per cent of total imports of creative goodswere accounted for by developed economies, with the world’s topimporters being Europe (the 27-member European Union (EU-27)), followed by the United States, Japan and Canada. Amongdeveloping economies, Asia was the region with the highest levelof imports of creative goods, which increased by 43 per centfrom $23.4 billion in 1996 to $45.3 billion in 2005. In Latin
America and the Caribbean, imports of creative goods tripledfrom $3.3 billion in 1996 to $10.9 billion in 2005. In Africa,imports of creative goods increased sharply, from $211 millionto $4.3 billion, or 95 per cent over the decade.6 Imports byLDCs also grew remarkably from $111 million to $1.2 billion,an increase of 91 per cent over the period 1996-2005. In sum-mary, with the exception of Asia, which was a net exporter, otherdeveloping regions, in particular Africa, the Pacific, theCaribbean and Latin America, have been consuming more andmore imported creative products and practically all countries arenet importers of creative goods and services.
5.3.3 Key players in the global market for creative goods
The list of the world’s 20 leading exporters of creativegoods in 1996 and 2005 is presented in table 5.6. Chinaheaded the list while the positions of Italy, the United States,Germany, the United Kingdom, France and Canada were thesame in 2005 as they had been in 1996. India, Turkey,Thailand and Mexico are the other developing economiesthat ranked among the top 20 exporters of creative goods in2005. India showed the greatest growth in exports of creativegoods during the period 2000-2005. More detailed data ontrade flows by region and share of world total are provided intable 5.6, and tables 1.2.A and 1.2.B of the annex.
110 C R E AT I V E E C O N O M Y R E P O R T 2 0 0 8
5
Table 5.5Creative goods: Imports, by economic group and region, 2000 and 2005
WorldwideDeveloped economiesEuropeUnited StatesJapanCanadaDeveloping economiesEastern and Southeastern AsiaChinaWestern AsiaLatin America and CaribbeanAfricaLDCsSIDS
Source: UNCTAD.
Economic group and region 2000Value (in millions of $) Change (%)
242,685194,476
93,37572,95814,350
8,27246,11431,162
2,2423,6789,1232,085
520717
2005
350,884282,558148,986
95,02118,59212,09460,75939,501
3,6765,808
10,9234,2881,214
833
2000-2005
4545603030463227645820
106134
16
Table 5.6 Creative goods: Top 20 exporters worldwide, 1996 and 2005
ChinaItalyChina, SAR of Hong Kong United StatesGermanyUnited KingdomFranceCanadaBelgium (1)SpainIndiaNetherlandsSwitzerlandJapanTurkeyAustriaThailand (2)MexicoPolandDenmark
Exporter
123456789
1011121314151617181920
Rank2005
32145678-9
161011122017
-152119
Rank19962005
Value (in millions of $) Growth rate %
61,36028,00827,67725,54424,76319,03017,70611,377
9,3439,1388,1557,2506,0535,5475,0814,8834,3234,2714,2153,449
1996
18,42823,65424,39117,52913,97612,43912,368
9,312-
5,9882,3825,2354,5013,6181,7632,355
-2,6931,6022,341
2000-2005
17.65.90.83.6
14.29.88.61.7
-8.1
21.19.79.11.8
18.311.1
5.10.5
18.28.5
Market share %
2005
18.38.38.27.67.45.75.33.42.82.72.42.21.81.71.51.51.31.31.31.0
Source: UNCTAD.Notes: (1) Belgium and Luxembourg reported trade figures jointly from 1996 to 2001 and separately after 2002;
(2) Trade figures for creative goods from Thailand were available only after 1999.
6 These high records by Africa and LDCs must be viewed with caution owing to statistical problems underlined earlier.
Inte
rnati
onal
trade i
n c
reati
ve g
oods
and s
erv
ices:
G
lobal
trends
and f
eatu
res

Developed economies: Top 10 exporters
Exports of creative goods from the developedeconomies showed positive trends during the period 2000-2005. Export earnings increased 42 per cent from $137 billion in 2000 to $196 billion in 2005. Design productsprovided the highest contribution to the trade balances ofthese economies, followed by publishing. Exports of arts andcrafts increased in value but the developed economies lostmarket share as a result of the increase in exports by devel-oping economies. Table 5.7 shows the top 10 developedeconomies in terms of their exports of creative goods in2005. Italy ranked first thanks to its competitive position indesign, which includes, among other items, interior objectsand fashion accessories. The constant positioning of thesame economies among the top 10 exporters in 1996 as wellas in 2005 is also noteworthy.
Developing economies: Top 10 exporters
The dynamism of exports of creative products bydeveloping economies is a new element in the creative econo-my. The increase in the export performance of China over theten years was remarkable – from $18.4 billion in 1996 to$61.3 billion in 2005. During this period, exports ofcreative goods from developing countries increased 143 percent, nearly tripling from $55.7 billion to $136.2 billion(chart 5.6). Asian economies accounted for more than threequarters of total exports of creative goods from economies ofthe South. This development is explained by major increasesnot only in China (233 per cent) but also in Southeast Asia(136 per cent) and Western Asia (237 per cent) during the
period 1996-2005. Tables 1.4.3.A and 1.4.3.B in the annexshow the performance of the top 10 exporting economies interms of leading products of the creative industries.
In Latin America and the Caribbean, exports of creativegoods more than doubled from approximately $3.5 billion to$8.6 billion although the level of exports from the regionremains comparatively low given the potential of its creativeindustries. Only Mexico figures among the top ten exporters.Brazil, Colombia and Argentina appear on the list of mainexporters of some specific creative items, as shown in table1.4.3.A in the annex. In the Caribbean, total exports of allcreative goods amounted to $57 million in 2005. Cuba andTrinidad and Tobago were the main exporters in the region.In summary, the Latin America and the Caribbean regionsare net importers of creative goods and services.
Africa contributed marginally (less than 1 per cent) toworld exports of creative goods during the period under con-sideration even though African exports of creative goodsincreased from $973 million to $1.8 billion during the period2000-2005. South Africa was the largest African exporter, followed by Namibia, Tunisia, Morocco and Kenya. Ghana forthe first time reported a considerable amount of exports ofcreative goods in 2005. Indeed, the weak presence of Africa inglobal markets reflects not only the limited supply capacity onthe continent but also the fact that the great majority ofcreative and cultural production in Africa takes place in theinformal sector for which statistics are non-existent.7
There are very limited available data for the LDCs.However, the existing data from the few reporting LDCsdemonstrate the overwhelming importance of creative indus-tries in some countries such as Cambodia, Mali, Senegal andthe United Republic of Tanzania. The same observation isvalid for the small island developing States (SIDS).8
The list of major exporters from developingeconomies is obviously led by China as the world’s leadingexporting country. It should be noted, however, that of thetop 10 exporters of creative goods among developingeconomies, 9 are in Asia, as shown in table 5.8. Mexico is theonly economy in Latin America that appears on the list,occupying sixth place. For the moment, African creativeproducts are very under-represented in world markets despitethe abundance of creative talent on the continent.
111C R E AT I V E E C O N O M Y R E P O R T 2 0 0 8
Inte
rnatio
nal tra
de in
cre
ative
goods a
nd se
rvices: G
lobal tre
nds a
nd fe
atu
res
5
7 The trade data for this Report were compiled on the basis of HS codes 1996 since this classification system is the most used universally. However, it may happen that some countriesare reporting their figures using another nomenclature, Egypt being a case in point. For details, see the general explanatory notes in the annex.
8 The existing statistical records of some developing countries need substantial improvement; data collection needs to be systematic and comparable nomenclatures and standard statistical codes need to be used. Otherwise, the difficulties in assessing the participation of developing countries in world trade of creative-industry products will remain.
Table 5.7Creative goods: Top 10 exporters among developed economies, 2005
ItalyUnited StatesGermanyUnited KingdomFranceCanadaBelgiumSpainNetherlandsSwitzerland
Developedeconomy
123456789
10
Rank
5.93.6
14.29.88.61.7
-8.19.79.1
2005
Value (in millions of $)
2005
Market share (%)
2000-2005
Growth rate (%)
28,00825,54424,76319,03017,70611,377
9,3439,1387,2506,053
8.357.617.385.675.283.392.782.722.161.80
Source: UNCTAD.

Chart 5.6Creative goods: Exports from all developing economies, 1996 and 2005
All
developing
economies
Asia
America
Africa
Source: UNCTAD
2005
1996
(in billion US $)
0 604020 80 100 120 140
Exports of creative-industry products during the period1996-2005 were led by Europe. As shown in table 5.9, the27-member European Union (EU-27) is the leading region-al economic grouping in exports of creative goods, dominat-ing the market with 43 per cent of world exports of thesegoods. It should be recalled, however, that this increase alsoreflects the growing number of countries in the EuropeanUnion. Conversely, there are fewer countries grouped aseconomies in transition, one of the reasons for their very lowlevel of exports. European Union exports of creative prod-ucts increased markedly during the period 1996-2005 forboth goods and services. Its exports of creative goodstotalled $96 billion in 1996, rising to $145 billion in 2005.For data on trade flows by trade group, see tables 1.5.A and1.5.B in the annex.
Asia became the second largest exporting region in2002, when the total value of its exports of creative goodssurpassed the total exports of creative goods from NorthAmerica, according to reported figures. As mentioned earli-er, the main reason for this is the impressive growth ofexports of creative goods from China, which increased 115per cent from 2000 to 2005 when they reached $61.3 bil-lion, plus $27.7 billion for the Hong Kong Special
Administrative Region of China. Moreover, exports ofcreative goods from the 10 countries of the Association ofSoutheast Asian Nations (ASEAN) rose exponentially from$2.3 billion in 1996 to $14.3 billion in 2005. If the so-called ASEAN+3 (ASEAN plus China, Japan and theRepublic of Korea) is considered, in 2005 their total exportsof creative goods reached $84.2 billion while their exports ofcreative services totalled $5.3 billion (see table 5.9 as well astable 1.5.A in the annex). In other regions in Asia, includingWestern and Eastern Asia, production and exports of cre-ative products also increased sharply from 1996 to 2005 (seetable 1.1 in the annex).
In Latin America and the Caribbean, the performanceof creative industries also improved but less rapidly. Takinginto account the 34 countries that actively participate in theFree Trade Area of the Americas (FTAA),9 their exports ofcreative goods increased from $30.3 billion in 1996 to $45.6billion in 2005. Of the latter amount, $41.2 billion repre-sented the exports from North America, that is, the exportsfrom the three North American Free Trade Agreement(NAFTA) countries (Canada, Mexico and the UnitedStates). In the case of creative services, the dominant positionof NAFTA countries in the region is greatly accentuated, and
112 C R E AT I V E E C O N O M Y R E P O R T 2 0 0 8
Inte
rnati
onal
trade i
n c
reati
ve g
oods
and s
erv
ices:
G
lobal
trends
and f
eatu
res
5
Table 5.8Creative goods: Top 10 exporters among developing economies, 2005
ChinaChina, SAR of Hong KongIndiaTurkeyThailandMexicoMalaysiaSingaporeRepublic of KoreaIndonesia
Exporter
123456789
10
Rank
17.60.8
21.118.3
5.10.57.8
17.52.80.1
2005
Value (in millions of $)
2005
Market share (%)
2000-2005
Growth rate (%)
61,36027,677
8,1555,0814,3234,2713,2333,0672,9422,833
18.298.252.431.511.291.270.960.910.880.84
Source: UNCTAD.
9 The FTAA includes all countries that are members of NAFTA (3) and the Common Market of the South (MERCOSUR) (4), plus other countries in Latin America and theCaribbean. All of these countries are members of the Organization of American States, of which 34 member States participate in world trade of creative industries. For furtherinformation on country groups, see the list of geographical regions in the annex.
5.4 Regional economic groups in world markets

their exports further increased from $11 billion in 1996 to$24 billion in 2005. On the other hand, MERCOSURcountries have a small share in the world trade of creativegoods despite the gradual increases; the four countries –
Argentina, Brazil, Paraguay and Uruguay – together exported$3.5 billion of creative services and $2.6 billion of creativegoods in 2005. The other countries of the region have a verysmall share in world trade of creative-industry products. Insummary, the potential of creative industries in LatinAmerica and the Caribbean has not yet been fully explored.
For the ACP Group, which covers the 79 countries ofAfrica, the Caribbean and the Pacific, these economies are notyet benefiting from the huge potential of their creative indus-tries despite their rich cultural assets. Their share in worldmarkets remains extremely small. Nevertheless, attentionshould be paid to the improvements of recent years. Exportsof creative goods increased from $20 million in 1995 to $1.4billion in 2005. The same situation applies for the group of50 LDCs as well as to the SIDS. (Most of the LDCs andSIDS are also members of the ACP Group). Undoubtedly,further efforts should be made to enhance creative capacitiesfor trade and development gains in all these countries.
113C R E AT I V E E C O N O M Y R E P O R T 2 0 0 8
Inte
rnatio
nal tra
de in
cre
ative
goods a
nd se
rvices: G
lobal tre
nds a
nd fe
atu
res
5
Table 5.9Creative goods: Exports, by regional economic group, 1996 and 2005
AmericaFTAA – 34 NAFTA – 3MERCOSUR – 4
AsiaASEAN – 10ASEAN+3
EuropeEU-27
InternationalACP-79
Regional economic group 2005
Value (in millions of $)
2005
Market share (%)
45,56041,192
2,661
14,36184,210
145,056
1,387
1996
30,33229,534
449
2,34627,437
96,115
20
13.5812.28
0.8
4.2825.1
43.24
0.41
Source: UNCTAD.
5.5 Prospects for North-South and South-South trade in creative goods and services
The dynamism of exchanges of creative-industryproducts described in this chapter confirms promisingprospects for increased regional trade flows among countriesin all regions. North-South trade in both the traditional cre-ative areas as well as new areas related to digitalization,including new media, is expanding. A recent study byUNESCO10 on cultural exchanges confirms that regionaltrade agreements (RTAs), free trade agreements (FTAs) andeconomic unions are stimulating trade and investments inaudiovisuals among their member countries.
In the North-South direction, as in the case of theCentral American Free Trade Agreement (CAFTA), thenumerous bilateral agreements are reinforcing this trend. Thisis attested to by the sharp increase in imports of creative-industry products, in particular trade in television and radioprogrammes, films, books and educational materials includingeducational software. With the consolidation of FTAs andRTAs, many modalities of cooperation are emerging for co-production in the field of films and television programmes aswell as for the creation of joint ventures in both the South-South and the North-South sphere.
Creative services such as architectural services consti-tute one of the best examples of trade ventures. In addition,the Economic Partnership Agreement between the EuropeanUnion and the ACP States (79 countries) as well as the FTAwith others countries including with the Euro-Mediterranean countries, and the European Union bilateraltreaties with other countries provide grounds for more tradeliberalization than WTO agreements through the applica-tion of Article XXIV of the General Agreement on Tariffsand Trade (GATT) and Article V of the General Agreementon Trade in Services (GATS).
Despite the deficiencies in data collection of trade statistics for accurately measuring trade flows of creativegoods and services, tables 1.5.A.1/1.5.A.2 and 1.5.B.1/1.5.B.2 in the annex show the evolution of trade in creativegoods for the period 1996-2005 for major regional tradegroups. As tables 1.5.A.1 and 1.5.A.2 reveal, the value of exports of creative goods by all regional trade groupsgreatly increased over the decade.
The 27-member European Union maintained its
10UNESCO, Trends in Audiovisual Markets: Regional Perspectives from the South (UNESCO document CI/COM/2006/PUB/10), Paris, 2006.

114 C R E AT I V E E C O N O M Y R E P O R T 2 0 0 8
The structure of world exports of creativegoods and services by subgroup in 1996 and 2005is presented in table 5.10. The components of thistable will be referred to under each group to widenthe scope of the overall analysis. The order of thegroups follows the UNCTAD definition of creativeindustries as described in chapter 1, starting with themore traditional groups led by heritage and arts, followed by the more technology-intensive and services-oriented groups of media and functional creations. Figure 1.3 is provided again to facilitateunderstanding of the structure of the analysis.
5.6.1 Heritage
Features
Cultural heritage comprises the vestiges of our society.Heritage sites are relics of ancient civilizations, over the yearsconsidered as cultural patrimony of mankind and the her-itage of nations. In addition to their cultural and historicvalue, such unique endowments contribute to reinforcing ouridentities and broadening our education. Heritage sites arethe main attractions in cultural tourism all over the world.For some countries, these sites are major sources of revenue,albeit usually not reported as cultural services of the creativeeconomy (see chapter 2).
Heritage is also embedded in the traditional culturalexpressions of human creativity, manifested in cultural cele-brations, festivals and folklore. In different parts of theworld, native peoples and communities are keeping alive, andsometimes reviving and rescuing, old traditions by reproduc-
ing ancient crafts, using their original designs. This is attest-ed to by many indigenous communities that, through tradi-tional knowledge, keep alive remnants of ancient civilizationssuch as the Mayas in Guatemala and the Incas in Bolivia andPeru. For these populations, the production and sale ofhandicrafts based on traditional designs and raw materialsare sometimes the only source of revenue.
As shown in table 5.10, the heritage domain compris-es tangible and intangible goods and services. A carpet is anexample of heritage goods while heritage services cover thecultural and recreational services that are associated with his-torical monuments, archeological sites, museum, libraries,archives, etc. Traditional cultural festivities, including festi-vals, are culturally important creative activities for developingcountries, particularly when associated with tourism, even ifdata on these festivities are usually not collected worldwide.
leading position as the major exporting group for creativegoods, with exports totalling $96 billion in 1996 and $145billion in 2005. Exports from Latin America and theCaribbean from the FTAA economies increased from $30.3billion to $45.6 billion at an annual growth rate of about13 per cent during the period 1996-2005. The greatestgrowth was in the ASEAN group of countries; althoughstarting from a lower level of $2.3 billion in 1996, theirexports reached $14.3 billion in 2005. However, if
ASEAN+3 is considered, this enlarged group of Asiancountries increased their exports from $27 billion to $84billion in 2005, increasing their share of the world marketfor creative goods from 15 per cent in 1996 to 25 per centin 2005. While the group of 79 ACP States and the MERCOSUR group of four countries also improved theirexport performance, both still accounted for less than 1 percent of world trade in creative goods.
Inte
rnati
onal
trade i
n c
reati
ve g
oods
and s
erv
ices:
G
lobal
trends
and f
eatu
res
5
5.6 Global trends in international trade of creative industries,by subgroup
Reintroduction of figure 1.3: UNCTAD classification of creative industries
Source: UNCTAD
Heritage
Arts
Media
Functionalcreations
Creative industries
Performing artsLive music, theatre,
dance, opera, circus, puppetry, etc.
AudiovisualsFilm, television, radio,
other broadcasting
Cultural sitesArchaeological sites, museums, libraries,
exhibitions, etc.
Traditional cultural expressions
Arts and crafts, festivals and celebrations
Visual artsPaintings, sculptures,
photography and antiques
Publishing and printed media
Books, press and other publications
DesignInterior, graphic,
fashion, jewellery and toys
New mediaSoftware, video games,
digitalized creative content
Creative services Architectural, advertising,
creative R&D, cultural & recreational

The carnival in Brazil is a good illustration of the economicimportance of traditional celebrations (see box 2.2 in chap-ter 2). The evolution of exports from the heritage goods andservices is shown in chart 5.7. This is the only group of cre-ative industries in which developing countries have a strongparticipation in world markets due to the importance of theproduction and trade of arts and crafts.
To define and classify arts and crafts is a complex exer-cise.11 Arts and crafts have distinctive features and they canbe utilitarian, aesthetic, artistic, creative, culturally attached,decorative, functional, traditional, and religiously and sociallysymbolic.12 The value chain in arts and crafts production isintricate due to the lack of formalized policies and ofteninformal workings; as a result, the classification of items is
115C R E AT I V E E C O N O M Y R E P O R T 2 0 0 8
Inte
rnatio
nal tra
de in
cre
ative
goods a
nd se
rvices: G
lobal tre
nds a
nd fe
atu
res
5
Table 5.10 World exports of all creative-industry products (goods and services), by subgroup, 1996 and 2005
All creative industries (3)All creative goods (4)All creative services (5)HeritageArts and crafts goodsOther cultural services Visual artsVisual arts goodsPerforming artsMusic goodsPublishing & printed mediaPublishing goodsAudiovisualsAudiovisual goodsAudiovisual and related
servicesNew mediaMedia goodsDesignDesign goodsCreative servicesArchitectural and
related servicesAdvertising and related
servicesResearch and
development servicesPersonal, cultural and
recreational services
1996 (1) 2005 (1) 1996-2005
Value (millions of $)
Value (millions of $)
As % of all creative
industries
As % of all creative
industries
As % of totalworld exports
(goods/ services) (2)
As % of totalworld exports
(goods/ services) (2)
GrowthrateSubgroup
227,451189,214
38,23715,76014,738
1,02210,33110,331
5,1005,100
32,18032,180
6,682355
6,3276,8046,804
119,706119,706
38,236
9,828
5,008
13,336
10,064
100.0083.1816.82
6.726.280.444.404.402.172.17
13.7113.71
2.840.15
2.692.902.90
50.9850.9816.29
4.19
2.13
5.68
4.29
-3.502.87
-0.270.08
-0.19
-0.09
-0.60
-0.01
0.48-
0.13-
2.22-
0.74
0.38
1.00
0.76
424,427335,494
88,93326,69223,244
3,44822,14922,14914,92414,92444,30444,30418.182
664
17,51812,03512,035
218,173218,173
88,779
27,722
15,703
17,990
27,364
100.0079.0420.96
5.995.220.774.974.973.353.359.959.954.080.15
3.932.702.70
49.0049.0019.95
6.23
3.53
4.04
6.15
-3.213.50
-0.220.14
-0.21
-0.14
-0.42
-0.01
0.70-
0.12-
2.09-
1.11
0.63
0.72
1.10
6.46.08.85.44.3
12.97.97.9
13.513.5
3.43.4
10.57.6
10.76.56.56.26.28.7
10.9
12.1
3.0
10.5
Source: UNCTAD secretariat calculations based on data in United Nations Comtrade.
Notes: (1) Reported official figures for creative goods based on 54 reporting countries in 1996 and 131 countries in 2005; creative services based on 57 reporting
countries in 1996 and 90 countries in 2005. (2) This column shows the percentage of creative goods in total world merchandise trade, and percentage of creative
services in total world trade in services, respectively. (3) All Creative Industries are composed of All Creative Goods and All Creative Services. (4) All Creative Goods are
composed of arts and crafts goods, visual arts goods, music goods, publishing goods, audiovisual goods, new media goods, and design goods. (5) All Creative Services
are composed of advertising, market research and public opinion polling services; architectural, engineering and other technical services; research and development
services; and personal, cultural and recreational services. Audiovisual and related services and other cultural and recreational services are sub-items of personal,
cultural and recreational services. For definitions, please refer to the general explanatory notes, paragraph 14, in the annex.
11A definition adopted by ITC and UNESCO considers that artisan products are those produced by artisans either completely by hand or with the help of hand tools or even mechan-ical means as long as the direct manual contribution of the artisan remains the most substantial component of the finished product. Artisan products can be classified in several categories, the six main ones being basket/wicker/vegetable fiber works; leather; metal; pottery; textiles; and wood.
12See Promoting the Culture Sector through Job Creation and Small Enterprise Development in SADC Countries: Crafts and Visual Arts, ILO Infocus Programme, Working Paper No.51, Geneva, 2003.
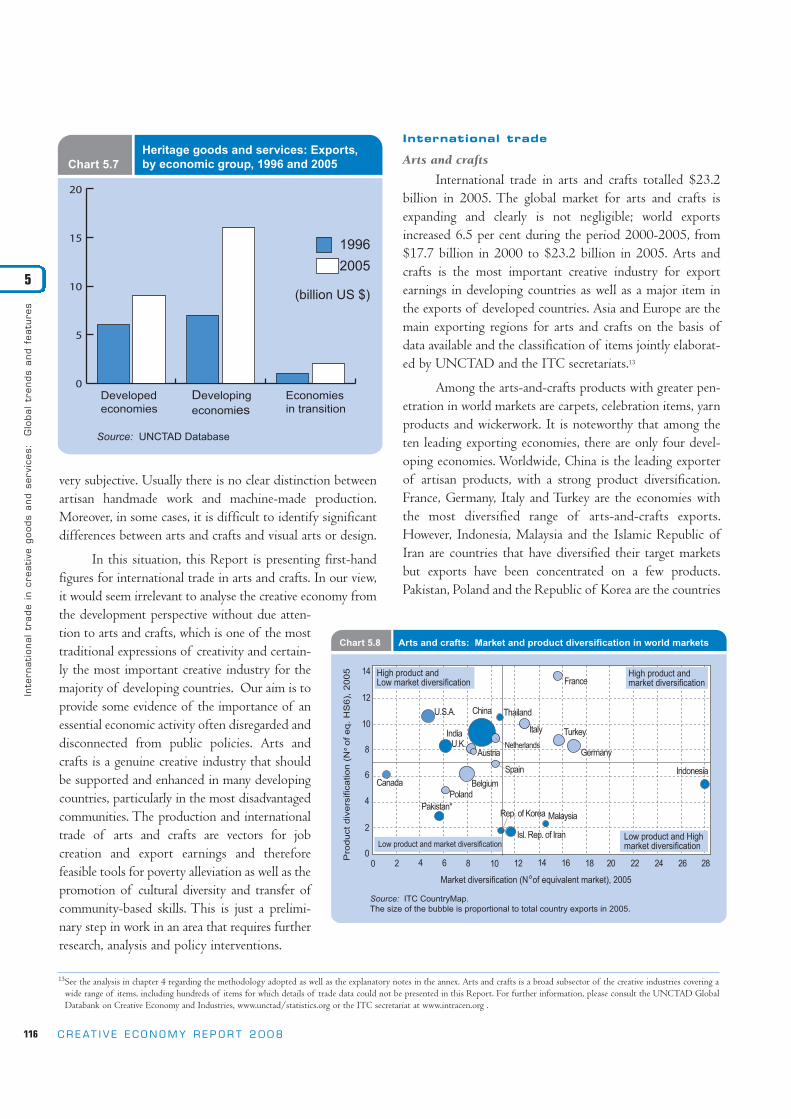
116 C R E AT I V E E C O N O M Y R E P O R T 2 0 0 8
very subjective. Usually there is no clear distinction betweenartisan handmade work and machine-made production.Moreover, in some cases, it is difficult to identify significantdifferences between arts and crafts and visual arts or design.
In this situation, this Report is presenting first-handfigures for international trade in arts and crafts. In our view,it would seem irrelevant to analyse the creative economy fromthe development perspective without due atten-tion to arts and crafts, which is one of the mosttraditional expressions of creativity and certain-ly the most important creative industry for themajority of developing countries. Our aim is toprovide some evidence of the importance of anessential economic activity often disregarded anddisconnected from public policies. Arts andcrafts is a genuine creative industry that shouldbe supported and enhanced in many developingcountries, particularly in the most disadvantagedcommunities. The production and internationaltrade of arts and crafts are vectors for job creation and export earnings and therefore feasible tools for poverty alleviation as well as thepromotion of cultural diversity and transfer ofcommunity-based skills. This is just a prelimi-nary step in work in an area that requires furtherresearch, analysis and policy interventions.
International trade
Arts and crafts
International trade in arts and crafts totalled $23.2billion in 2005. The global market for arts and crafts isexpanding and clearly is not negligible; world exportsincreased 6.5 per cent during the period 2000-2005, from$17.7 billion in 2000 to $23.2 billion in 2005. Arts andcrafts is the most important creative industry for exportearnings in developing countries as well as a major item inthe exports of developed countries. Asia and Europe are themain exporting regions for arts and crafts on the basis ofdata available and the classification of items jointly elaborat-ed by UNCTAD and the ITC secretariats.13
Among the arts-and-crafts products with greater pen-etration in world markets are carpets, celebration items, yarnproducts and wickerwork. It is noteworthy that among theten leading exporting economies, there are only four devel-oping economies. Worldwide, China is the leading exporterof artisan products, with a strong product diversification.France, Germany, Italy and Turkey are the economies withthe most diversified range of arts-and-crafts exports.However, Indonesia, Malaysia and the Islamic Republic ofIran are countries that have diversified their target marketsbut exports have been concentrated on a few products.Pakistan, Poland and the Republic of Korea are the countries
Inte
rnati
onal
trade i
n c
reati
ve g
oods
and s
erv
ices:
G
lobal
trends
and f
eatu
res
5
13See the analysis in chapter 4 regarding the methodology adopted as well as the explanatory notes in the annex. Arts and crafts is a broad subsector of the creative industries covering awide range of items, including hundreds of items for which details of trade data could not be presented in this Report. For further information, please consult the UNCTAD GlobalDatabank on Creative Economy and Industries, www.unctad/statistics.org or the ITC secretariat at www.intracen.org .
Chart 5.7Heritage goods and services: Exports, by economic group, 1996 and 2005
1996
2005
(billion US $)
Developed
economies
Developing
economies
Economies
in transition
Source: UNCTAD Database
0
5
10
15
20
Chart 5.8 Arts and crafts: Market and product diversification in world markets
U.S.A.
IndiaU.K.
Canada
Poland
Pakistan*
AustriaNetherlands
France
Indonesia
Isl. Rep. of Iran
Malaysia
Turkey
Germany
China
Belgium
Spain
Rep. of Korea
Italy
Source: ITC CountryMap.
The size of the bubble is proportional to total country exports in 2005.
Market diversification (N of equivalent market), 2005
Pro
du
ct
di v
ers
ific
atio
n (
N
of
eq
. H
S6
), 2
00
5
14
12
10
8
8
6
6
4
4
2
20
0 18 20 22 24 26 2816141210
Thailand
High product and Low market diversification
High product and market diversification
Low product and High market diversificationLow product and market diversification

whose exports are more concentrated in major markets, asshown in chart 5.8. The evolution of trade by region is pre-sented in table 5.11. For further details about trade flows, seetables 1.2.A and 1.2.B in the annex.
In 2005, arts and crafts exported from developedeconomies totalled $9.1 billion, accounting for nearly 40 percent of total world exports of creative goods. The carpet wasthe most important item exported, followed by yarn (seetable 1.3.2.A of the annex). Among the 10 major exportersof arts and crafts among developed economies, Belgium andGermany had the best export performance in 2005, asshown in table 1.4.2.A in the annex. Data on economies intransition are very deficient with respect to all creative indus-tries; in 2005, their exports totalled $4.8 billion, accountingfor about 1 per cent of total exports of creative goods, asshown in table 1.4.4.A in the annex.
Key players from the developing worldArts and crafts is the only creative industry where
developing countries have a leading position in the globalmarket. For this creative sector, developing-country exportsnearly doubled in ten years, increasing from $7.7 billion in1996 to $13.8 billion in 2005, accounting for 60 per centof total world exports of creative goods. Tourism and theexpansion of leisure and art markets will continue to con-tribute to the dynamism of arts and crafts in world trade. Atthe national level, efforts to enhance the production of artsand crafts in developing countries can help to preserve cul-tural identity and foster economic development through artand culture. However, policies and incentives are required topromote cultural policy while exploring new trade opportu-nities. These two objectives are mutually supportive and canpromote inclusive development at the grass-roots level.
China headed the list of top exporters of arts andcrafts in 2005, with an important market share (24 per cent)compared with that of other developing countries (see table5.12). Asia dominated the arts and crafts market: all tenmajor exporters of arts and crafts from developing countrieswere from Asia. Exports from India doubled in ten years,reaching $1.1 billion in 2005. For details on the exports andimports of arts and crafts by the key market players in eachproduct group, see tables 1.4.3.A and 1.4.3 B in the annex.
Chart 5.9 on the diversification of arts and crafts indeveloping economies confirms the predominance of Asiancountries as the major exporters of arts and crafts. China,Thailand, Turkey, Indonesia and South Africa show highproduct and market diversification while for India andMexico, arts and crafts are diversified in terms of export prod-ucts. On the other hand, Brazil, Viet Nam and Malaysia arecountries that are rather diversified in terms of target markets.
117C R E AT I V E E C O N O M Y R E P O R T 2 0 0 8
Inte
rnatio
nal tra
de in
cre
ative
goods a
nd se
rvices: G
lobal tre
nds a
nd fe
atu
res
5
Table 5.11Arts and crafts: Exports, by economic group and region, 2000 and 2005
WorldwideDeveloped economiesEuropeUnited StatesJapanCanadaDeveloping economies Eastern, Southern and Southeastern AsiaChinaWestern AsiaAmerica Latin America and CaribbeanAfricaLDCsSIDSEconomies in transition
Economic group and region2005
Value (in millions of $)
2000-2005
Annual change (%)
2000
17,7076,8125,421
861120248
10,7569,3103,012
581727129190
32139
6.57.07.62.7
-5.37.76.15.4
17.218.8-2.825.8
-14.3-4.412.4
Source: UNCTAD.
23,2449,1187,498
97788
34313,88111,832
5,6021,127
624296
5425
245
Arts and crafts: Market and product diversification of developing economies Chart 5.9
Source: ITC CountryMap.
The size of the bubble is proportional to total country exports in 2005.
Market diversification (N of equivalent market), 2005
Pro
du
ct
div
ers
ific
atio
n (
N o
f e
q.
HS
6),
20
05
Thailand
IndiaMexico
Taiwan (PoC)South Africa
Brazil
Viet Nam*
SaudiArabia
Egypt*
Philippines
Guatemala
U.A.Emirates*
Pakistan*
Isl. Rep. of Iran
MalaysiaRep. of Korea
Turkey
Indonesia
10
8
6
4
2
0
0 4 8 12 16 20 24 28
Nepal*
China
High product and Low market diversification
High product and market diversification
Low product and High market diversificationLow product and market diversification
Table 5.12Arts and crafts: Top 10 exporters among developing economies, 2005
ChinaChina, SAR of Hong KongIndiaTurkeyPakistanIran (Islamic Republic of)IndonesiaThailandRepublic of KoreaMalaysia
Developingeconomy
123456789
10
Rank
14.1-6.911.614.834.5-1.94.05.60.6
14.2
2005
Value (in millions of $)
2005
Market share (%)
2000-2005
Growth rate (%)
5,6022,2661,063
951626621387301286265
24.109.754.574.092.692.671.671.301.231.14
Source: UNCTAD.

118 C R E AT I V E E C O N O M Y R E P O R T 2 0 0 8
Cultural and recreational services
As regards cultural and recreational services, whichinclude museums, libraries, archives and historical sites,world revenues reached $3.4 billion in 2005 as comparedwith $1 billion in 1996. Among all the creative services,these services experienced a high annual growth of 12.9 percent during the period 1996-2005, which is double thegrowth of all creative industries although a very limitednumber of countries provide data in this area.
The level of participation of developing countries inthis market is low. Malaysia and Turkey are the countriesthat are benefiting from their cultural services in terms ofexport earnings, as per the available data. An overview ofexports of cultural and recreational services is provided intable 2.7.A while information on imports is presented intable 2.7.B of the annex.
5.6.2 Performing arts
The performing arts are important creative industries,particularly owing to their interaction across other creativeactivities such as music, costumes and broadcasting. Thissubgroup covers all sorts of stage art, performed live byartists for an audience. Performing arts can take the form oftheatre, opera, poetry, dance, ballet, concerts, the circus, pup-petry, etc., usually for cultural, educational, entertainmentand business purposes.
It is not possible to provide a comprehensive analysison performing arts in the context of this chapter owing tothe lack of data for measuring their economic impact inworld markets, and in particular for the trade balance ofcountries. The main income from performing arts derivesfrom box-office revenues, national and international touring,and performance royalties. In most developed economies, theperforming arts benefit from government grants or subsidiesand funding from foundations or other profit or non-profitorganizations. In developing economies, however, when suchfunds exist, they are very limited.
Performing arts are a special case since their productsare expressed only as an intangible service, unlike other sub-groups of the creative industries for which figures for inter-national trade of tangible creative goods (such as a sculpture
for visual arts) are indicators for evidence-based economicanalysis. In the performing arts, the focus is on the artist asprovider of performing services, and there are issues relatingto labour-market conditions that need to be addressed atboth the national and international levels.
The employment conditions of artists are often pre-carious. Artists’ contractual obligations usually are project-based, with periods of unemployment between engagementsbeing a normal feature of their working lives. Most perform-ing artists work on an irregular, part-time or self-employedbasis, with limited coverage for medical and pensionschemes, particularly in developing countries. This is an arearequiring public policies at the national level. The ILO, incollaboration with UNESCO and other international organ-izations, is developing an international framework of alloccupational categories of the cultural sector. The aim is toassist governments to have the necessary information aboutthe labour aspects of their creative industries as a tool tofacilitate policy formulation for improving employment con-ditions and job creation in the sector.
Internationally, the mobility of artists is an issueunder negotiations at the WTO Doha Round in the contextof the GATS agreement for liberalization of trade in services.Issues related to the “free movement of natural persons” andthe policy debate about the four modes of supplying services are particularly relevant for artists, performers, chore-ographers, musicians, etc. (see chapter 9). The internationalcommunity should find and agree upon solutions to provideopportunities to enable those working in performing arts tohave greater access to international markets so that they will be able to offer and export their creative and culturalservices worldwide.14
International touring of performing artists andgroups has a dual role. From the cultural perspective, ithelps to promote cultural exchange and cultural diversity.Economically, it not only generates revenue for the per-formers, which translates into foreign earnings for theircountries, but it also induces positive spin-offs and finan-cial benefits for the hosting cities. The success story featured in box 1.5 in chapter 1 concerns a traditional performing art – the circus – that reinvented itself for thejoy of its world audience.
Inte
rnati
onal
trade i
n c
reati
ve g
oods
and s
erv
ices:
G
lobal
trends
and f
eatu
res
5
14Issues relating to WTO multilateral negotiations are further elaborated in chapter 9.

Music
Features
Music is a talent-based creation and one of the cen-tral creative industries, with great cultural and economicvalue in all societies. Everywhere in the world, music is theuniversal idiom to give expression to our feelings and aspi-rations. Sharing a musical experience, whether domesticallyor internationally, is an act that goes beyond establishedboundaries and transcends existing divides. For centuries,composers, singers and musicians have been carrying theirlocal musical traditions across geographical borders, con-tributing to the fusion of music styles among many cultureseven if the lyrics remain an expression of cultural diversitymirroring local realities. Music is an essential instrument ofintercultural dialogue.
Today, thanks to technological advances, local musiccan reach out to global audiences almost instantaneously.Digital technologies are also a tool for assisting artistic cre-ativity in music making. Connectivity has changed lifestylesand the way in which music is created, produced, repro-duced, commercialized and consumed in national and glob-al markets. Therefore, trade of music became very closelylinked to the use of new digitalized tools such as theInternet peer-to-peer (p2p) networks, mobile telephonesand MP3s. As a consequence, the world market for musichas adapted to changing business models emerging fromnew forms of production, marketing and distribution ofmusic goods and services, particularly digitalized products(see also chapters 3 and 7).
Furthermore, music is not only a cultural expressionand a form of entertainment but also a very dynamic cre-ative industry in global trade and big business in the worldeconomy, responsible for millions of jobs and income-generation worldwide. Trade figures for physical goodsalone, such as sales of CDs and tapes, cannot capture thehuge contribution of the music industry to the economiesof many countries. The value chain and the market structureof the music industry are very complex. The size of inter-national markets cannot be captured by a simplistic analysiswith incomplete statistics and economic indicators. Theabsence of figures for copyright revenues and the obscurityof intra-firm financial transactions of the large transnationalconglomerates, usually vertically and horizontally integrated,
which dominate the production, distribution and copyrightsof music products, are missing links for any sound analysisof the world music industry.
Music is not only part of the performing arts sub-group of creative industries when considered in terms oflive performances and concerts, but it may also be includedas part of the broader area of audiovisuals when dealingwith the creation of sound records and compositions.Music can also be classified under the new-media subgroupwhen music goods and services are traded virtually as cre-ative content in digitalized form. For these reasons, music isfeatured apart for the purpose of trade and statistical analy-sis presented in this Report.
A paradox faced by those involved in the music mar-ket is that while more and more music is being consumedworldwide, particularly by youth, the earnings received bysongwriters, producers and performers have been declining.This situation reflects two key issues: (a) the lacunae in thecurrent regimes of IPRs, and (b) the need for songwritersand the singers to retain greater control over their music andmake better use of all ICT tools for accessing global mar-kets. In order to tackle these IPR issues, the music industryis facing a number of challenges. The first is to call for theenforcement of development-oriented copyright legislationby governments and international treaties. The second is todevelop a commercially viable and legitimate alternative tothe illegal but free downloading of copyrighted content.Indeed, a piece of written music can be protected by copy-right and related rights at each stage of its life, and the com-position can be protected for the composer’s lifetime plusseventy years. In practice, however, a publisher offers to buythe rights of a piece of music and seeks to exploit it bymeans of recordings, etc.15 As UNCTAD analysis has indi-cated, “Despite some early success in several for-pay musicdownload portals, the creative and business power of theInternet will be greatly advanced when artists, industry andaudiences master how to better commercialize peer-to-peer(P2P) file sharing” and online distribution.16
Against this picture, the trade figures shown in thischapter as well as in the annex should be seen as merelyindicative of market trends. The trade flows based onnational reported figures amounted to $14.9 billion in
119C R E AT I V E E C O N O M Y R E P O R T 2 0 0 8
Inte
rnatio
nal tra
de in
cre
ative
goods a
nd se
rvices: G
lobal tre
nds a
nd fe
atu
res
5
15This straightforward explanation is shared by J. Howkins in his book, The Creative Economy, London, 2001, p. 100. This Report further elaborates on issues relating to intellectualproperty rights in chapter 6.
16The UNCTAD E-Commerce and Development Report 2004 (document UNCTAD/SDTE.ECB.2004.1) contains a comprehensive analysis of this matter (see chapter 3, “Creative industries and digital and Internet technologies: The case of music”, pp. 61-94). The report is available at: http//www.unctad.org/ecommerce/ecommerce_en/edr04_en.htm.

2005 whereas private sources such as the InternationalFederation of the Phonographic Industry estimated a market value at about $20 billion17. The issue is how to measure the economic impact of the music industry in theabsence of disaggregated indicators for trade, employment,copyrights, marketing and distribution. It is clear thatpolitical will at the national level, combined with a well-coordinated effort by international institutions, is neededin order to improve market transparency and deal with the imbalances affecting the functioning of world markets inthe area of audiovisuals in general and the music industryin particular.
International trade
On the basis of available figures, world exports of record-ed music tripled from $5 billion in 1996 to $14.8 billion in2005, accounting for 4.4 per cent of total exports of creativegoods. This spectacular increase – 13.5 per cent annual growthduring the period 1996-2005 – represents the highest rise ingrowth rates among the exports of all the creative industries.The sales of compact discs (CDs) is the main physical goodused for trade analysis of recorded music; it represents morethan 99 per cent of world music exports nowadays (see table5.13 as well as tables 1.2.A and 1.2.B in the annex).
International trade in music continues to be dominatedby developed economies. As a group, these economiesaccounted for about 90 per cent of total exports of recorded
music (mainly CDs) over the period under review. Theirexports increased sharply from $6.2 billion in 1996 to $13.4billion in 2005. Similarly, imports by developed economiestripled, following the same trend, reaching $13.8 billion in2005. Developed countries’ exports and imports of musicCDs accounted for about 80 to 90 per cent of world trade inmusic goods. Among the top 10 developed economies, therankings showed only minor changes from 1996 to 2005.
Key players in global markets World trade in music is driven by developed
economies. As shown in table 5.14, together the five topexporters have about 60 per cent of global markets.Germany predominates with a market share of 23 per cent,followed by the United Kingdom, the United States, Austriaand the Netherlands, each with about 10 per cent. All thetop players benefited from the dynamism of the market inthe period 2000-2005, particularly Germany, which enjoyeda growth rate of 39 per cent, reinforcing its leading position.What these figures do not show is the oligopolistic marketstructure of the world production and distribution of music.This structure is dominated by four vertically integratedmajor conglomerates that together and through their sub-sidiaries retain nearly 80 per cent of the world market forrecorded music. This situation inhibits music production by
120 C R E AT I V E E C O N O M Y R E P O R T 2 0 0 8
Inte
rnati
onal
trade i
n c
reati
ve g
oods
and s
erv
ices:
G
lobal
trends
and f
eatu
res
5
Chart 5.10 Music: Exports, by economic group, 1996 and 2005
1996
2005
(billion US $)
Developed
economies
Developing
economies
Economies
in transition
Source: UNCTAD Database
0
5
10
15
Table 5.13Music: Exports, by economic group and region, 2000 and 2005
WorldDeveloped economiesEuropeUnited StatesJapanCanadaDeveloping economiesEastern, Southern and Southeastern AsiaChinaWestern AsiaLatin America and CaribbeanAfricaLDCsSIDSEconomies in transition
Economic group and region
17.017.627.010.018.013.412.511.526.8
3.224.6-1.5
-19.686.717.1
2000 2005
Value (in millions of $)
2000-2005
Growth rate (%)
7,0766,2084,746
991156225841666
5817
151820
26
14,92413,42411,172
1,491297376
1,4121,049
13520
336702
88
Source: UNCTAD.
17The International Federation of the Phonographic Industry (IFPI) publishes an annual report, Recording Industry in Numbers, which presents data provided by companies from its 1,450members in 75 countries and affiliated industry associations in 49 countries. The IFPI figures are widely used as a reference for business in the world music market. Nevertheless, asmany developing countries are not members of the Federation, data presented do not have a universal coverage nor do they capture the interests of small or independent producers.The 2007 report indicates that the world sales of music totalled $20 billion, of which $1 billion was in the form of downloads.

independent local producers in developing countries.However, downloading music from the Internet is graduallytransforming this picture, as indicated earlier.
Despite the low level of participation of developingeconomies in the world trade of recorded music, from 2000to 2005 their exports increased 12.5 per cent, totalling $1.4billion in 2005, or 9.5 per cent of world music exports.Economies in transition had $63 million in exports ofrecorded music and $171 million in imports in 2005. Acommon feature of developing economies and economies intransition with respect to the music industry is that botheconomies are net importers of recorded music. The mainreason is that in most cases, despite the fact that the music –the creative content – is created in developing countries, it isrecorded and commercialized by transnational companiesinside the countries or abroad. As a result, developing coun-tries import not only foreign music but also their own music.
Asia is the developing region with better, althoughsmall, penetration in global markets for music, reflectingincreases in exports, particularly from China and India. Indiaincreased its exports from a very low level, reaching $185million in exports of recorded music in 2005. It is notewor-thy that China and India each has a regulatory frameworkthat is less conducive to the penetration of the major con-glomerates; therefore, both countries have independentdomestic music production.18 Malaysia, the Republic ofKorea and Singapore all improved their export performance
between 2000 and 2005.
Surprisingly, Latin America and theCaribbean are practically absent from worldmarkets for recorded music despite the greatappeal of their music worldwide. Mexico is theleading exporter from the region whileArgentina and Colombia are very small players.Brazil is an important music producer, with alarge domestic market but with a very timidpresence in the world market in terms ofexports despite the fact that its famous music isplayed worldwide. This is a typical case of struc-tural problems of marketing and distribution, asexplained earlier and below. A similar situationhampers foreign exchange earnings from reggaeand calypso music in the Caribbean in additionto the fact that their music industry is highly
121C R E AT I V E E C O N O M Y R E P O R T 2 0 0 8
Inte
rnatio
nal tra
de in
cre
ative
goods a
nd se
rvices: G
lobal tre
nds a
nd fe
atu
res
5
18See UNESCO, Trends in Audiovisual Markets, Paris, 2006, p. 78.
Table 5.14Music: Top 10 exporters among developed economies, 2005
GermanyUnited KingdomUnited StatesAustriaNetherlandsIrelandFranceCanadaSwedenBelgium
Developedeconomy
123456789
10
Rank
39.016.510.1
9.018.612.918.010.823.5
-
2005
Value (in millions of $)
2005
Market share (%)
2000-2005
Growth rate (%)
3,4811,5961,4911,3471,325
801644376347313
23.3210.70
9.999.028.885.374.322.522.322.09
Source: UNCTAD.
Table 5.15Music: Top 10 exporters among developing economies, 2005
ChinaMexicoIndiaChina, SAR of Hong Kong SingaporeMalaysiaRepublic of KoreaArgentinaColombiaTurkey
Developingeconomy
123456789
10
Rank
16.827.595.1-2.127.040.922.021.6
2.06.3
2005
Value f.o.b.(in millions of $)
2005
Market share (%)
2000-2005
Growth rate (%)
373249185181119
8180342015
2.501.671.241.210.800.540.540.230.141.95
Source: UNCTAD.
Chart 5.11 Music: Market and product diversification of developing economies
Source: ITC CountryMap.
The size of the bubble is proportional to total country exports in 2005.
Pro
duct
div
ers
ific
ation (
N
of eq. H
S6),
2005
Thailand
India
Mexico
Taiwan (PoC)Philippines
U.A.Emirates*
Singapore
China
Brazil
Lebanon
South Africa
Rep. of KoreaPeru
Cuba Uruguay
Turkey
Argentina
Colombia
Malaysia
Indonesia2
4
00 4 6 8 102
Market diversification (N of equivalent market), 2005
High product and Low market diversification
High product and market diversification
Low product and High market diversification
Low product and market diversification

fragmented and lacks a strong institutional framework.19
The case of Latin America and the Caribbean is anillustration of the difficulties faced by developing countriesin their efforts to benefit from the earnings of their ownmusic. As mentioned earlier, the key issues are associatedwith the market structure and the dominant position of themajor conglomerates and their business practices. Threemain aspects stand out: (a) intra-firm trade between head-quarters and subsidiaries, where transfer pricing may result inunderestimation of trade figures;20 (b) the origin of the cul-tural or creative content: as most of the music is recorded instudios abroad where it is published and from where it willbe distributed to world markets, the international sales ofthe final product are declared elsewhere; and (c) copyrightsare also collected by the publisher in the country where themusic is produced. As a result, export earnings from worldsales as well as revenues from royalties and copyrights areretained abroad instead of reverting to the homeland of thesinger-songwriter in developing countries.21 This topic is further elaborated in chapters 3 and 6.
African countries are absent from table 5.15. Indeed,African music production has a special characteristic becausethe big conglomerates have a weak presence on the continent.As a result, music production is largely independent, informal,small in scale and domestically oriented, except in South Africa.Recently, steps have been taken to better structure the musicindustry, mainly through private initiatives taken by Africanmusic stars such as Youssou N’Dour in Senegal and Salif Keitain Mali as well as by professional associations. Nevertheless,government intervention is needed to support these individualactions, particularly in order to put in place supportive fiscalregulations and mechanisms for micro credit for independentartists as well as to reinforce IPR regimes in a more favourablemanner, aiming to better benefit local African artists.
5.6.3 Visual arts
Features
The main characteristic of the market for visual arts isthe focus on the exclusivity and originality of an artwork.The rarer a piece of art, the more value it is likely to have.Sales are much more personalized and products are created
with a uniqueness that makes works of art hardly compara-ble. Consequently, each piece has its own value, which canvary over time, making each transaction a unique deal.
Art markets operate differently in developed anddeveloping economies. Auction sales are predominant indeveloped economies and uncommon in the developingworld. While most of the sales in major markets take placein galleries and museums, in developing economies, most art-work is traded informally in flea markets targeting tourists.Owing to the limited number of formalized structures,appropriate legislation and social safety nets, very few artistsfrom developing countries are able to survive as full-timeartists and fully benefit from the revenue of their artwork.Awareness of artist’s rights is usually limited. Moreover,most artists are vulnerable and unprepared for negotiatingtheir work with agents such as curators, collectors, dealersand buyers.22
Nowadays, not only is contemporary art by artists andwith materials from, developing economies receiving increas-ingly attention in world markets, but there is also a renewedinterest in original art rooted in indigenous traditionalknowledge. New Internet-based delivery networks are offer-ing new opportunities for greater international exposure ofvisual arts from the South. Furthermore, the organization ofinternational expositions, trade fairs and major events such asthe Biennales of Cairo, Dakar, Havana and São Paulo, whichbecame part of the international art calendar, have been con-tributing to the promotion of artwork within the regionsand internationally.
The visual arts subgroup of creative industries com-prises antiques, painting, sculpture and photography as wellas the open-ended miscellaneous items of “other visual arts”consisting of engravings, carvings, lithographs, collages andother ornaments. The categorization of the products in thissubgroup is more precise but it is widely recognized thatowing to tax regulations and trade secrets, reported figuresdo not always correspond to final deals. Another special fea-ture of visual arts is that exports of some art and antiquepieces are restricted or prohibited by governments with a viewto preserving cultural identity, national heritage or the environ-ment, including wildlife, as in the case of the embargo in manycountries of exports of artworks made of ivory.
122 C R E AT I V E E C O N O M Y R E P O R T 2 0 0 8
Inte
rnati
onal
trade i
n c
reati
ve g
oods
and s
erv
ices:
G
lobal
trends
and f
eatu
res
5
19See The Cultural Industries in CARICOM: Trade and Development Challenges, K. Nurse, Barbados, 2006, p. 34.20This issue has also been raised by UNESCO in International Flows of Selected Cultural Goods and Services, 1994-2003, Montreal, 2005, pp. 18-19.21See UNCTAD, “Becoming a globally competitive player: The case of Jamaican Music Industry” by Z. Kozul-Wright and L. Stanbury, Discussion Paper, 1998.22See ILO study Promoting the Culture Sector through Job Creation and Small Enterprise Development in SADAC Countries: Crafts and Visual Arts, Geneva, 2003.

123C R E AT I V E E C O N O M Y R E P O R T 2 0 0 8
Inte
rnatio
nal tra
de in
cre
ative
goods a
nd se
rvices: G
lobal tre
nds a
nd fe
atu
res
5
International trade
Global art markets have expanded vertiginously inrecent years. World trade in visual arts more than doubled,jumping from $10.3 billion in 1996 to $22.1 billion in 2005,reflecting the climbing sales of a mix of contemporary artand antiques. This means a market that experienced a signifi-cant average annual growth of 8 per cent and that accountedfor 6.6 per cent of total exports of creative goods. Among themain artworks traded internationally are those covered underthe miscellaneous group described above, which in 2005accounted for 50 per cent of total global sales. Second wassculpture, which also covers the traditional ornamental articles nowadays expressed as the three-dimensional works ofcontemporary art; the total value of exports of these prod-ucts reached $6 billion in 2005, of which developingeconomies had nearly a 70-per cent market share.
The market for antiques witnessed spectacular growthof 100 per cent in ten years, increasing in value from $1.3billion in 1996 to $2.6 billion in 2005. Defined as antiquesare artworks more than one hundred years old. It should benoted that developed economies had 93 per cent of the global market for antiques in 2005. Photography is anothercreative industry that has been expanding, with exports dou-bling from $725 million in 1996 to $1.5 billion in 2005. Inthis area, developing economies have been more involved inworld trade; their share in world markets increased from 28per cent in 1996 to 34 per cent in 2005. Last but not least is
painting. International sales of paintings also experienced anoticeable dynamism, increasing in value from $410 millionin 1996 to $955 million in 2005. In this regard, these offi-cial data are certainly underestimated since they fail to capturethe informal sales of paintings that take place in flea marketsfor tourists in developing countries, as mentioned earlier. Fordetailed data on the trade flows of visual-arts products, seetables 1.3.1.A and 1.3.1.B of the annex.
Key players in global markets
Developed economies continued to dominate the mar-ket for visual arts but their market share decreased slightlyfrom 76 per cent to 70 per cent during the period 1996-2005. Antiques were the main item of both their exports andimports, while in the case of paintings, developed economieswere net importers of works from developing economies. Thekey players in the global market for arts were the UnitedKingdom and the United States, which together accountedfor 45 per cent of international sales of artworks, as shownin table 5.16. Cities such as London and New York areirrefutable reference points in the art scene and leading hubsfor artwork transactions, followed by Paris, Berlin, Genevaand Tokyo. These cities are typical examples of the spilloversof the creative economy where cultural and trade objectivesare intertwined to reinvigorate socio-economic growth.Moreover, they encompass the concept of “creative cities” aselaborated in chapter 1.
For developing economies, the situation is much morenuanced. Even if figures show that their total exports ofvisual arts increased from $2.5 billion in 1996 to $6.4billion in 2005, raising their market share in global mar-kets from 24 per cent to 29 per cent, these numbersreflect only a partial reality since all of the increase tookplace in Asia, mainly in China. Other countries andregions of the developing world have a marginal or nearlynon-existent participation in global markets for visualarts. For instance, the 50 poorest countries in the world,the LDCs, together exported only $4 million dollars invisual arts in 2005; indeed, this means a retraction fromworld markets as this value is half of their exports in2000. A similar situation occurred in the SIDS (seetables 1.2.A and 1.2.B in the annex).
Among the major exporters from the South apart fromChina, India demonstrated the greatest dynamism: itsexports of visual arts doubled during the period 2000-
Chart 5.12 Visual arts: Exports, by economic group, 1996 and 2005
1996
2005
(billion US $)
Developed economies
Developing economies
Economies in transition
Source: UNCTAD Database
0
5
10
15
20

124 C R E AT I V E E C O N O M Y R E P O R T 2 0 0 8
2005, as shown in table 5.17. Improvements in export per-formance also were achieved in the Republic of Korea,Thailand, Malaysia, Philippines, Singapore and Ghana; thelatter was not among the major exporters of visual arts in1996 but appeared on the list in 2005. Mexico has lostexport competitiveness in recent years. Chart 5.13 gives anidea of the market strategy adopted by the major players asregards the degree of diversification or concentration oftheir products and target markets.
5.6.4 Audiovisuals
Features
A common feature of the creative industries is theabsence of clear definitions. Audiovisuals do not constitute
an exception. Audiovisuals include motion picture, televi-sion, radio and other forms of broadcasting. With theintroduction of new ITC tools and the emergence of thenew media and connectivity, the definition became moreproblematic because the cultural and creative contents aremixed together and it is difficult to affirm that a digitalizedcartoon film is part of new media or an audiovisual prod-uct. In any case, audiovisuals is one of the most complex,politically sensitive and underestimated subgroups amongthe creative industries and one of the engines of the creative economy.
Data for audiovisuals are scarce and do not show thereal contribution of the subgroup to global trade and theworld economy. Regulatory regimes, market structure, specificities of each audiovisual product, diversity of busi-ness operations, different forms of marketing and distribu-tion, and market access are among the issues to be examinedfor a comprehensive analysis of market trends in audiovisu-als.23 This goes beyond our purpose in this study, which is totake stock of the current situation and propose possibleaction to improve the global picture.
Nevertheless, the figures shown in this Report indicatesome trends that are useful for the formulation of both cul-tural and international trade policy. It is hoped that the lim-itations in data for audiovisuals will point towards the needto improve the quality and coverage of statistics on trade inservices for the sake of market transparency since they are anessential tool for policy formulation.
Table 5.16Visual arts: Top 10 exporters among developed economies, 2005
United KingdomUnited StatesFranceGermanySwitzerlandJapanCanadaItalyBelgiumNetherlands
Developedeconomy
123456789
10
Rank
11.52.24.43.13.1
17.811.6
0.4-
7.8
2005
Value (in millions of $)
2005
Market share (%)
2000-2005
Growth rate (%)
5,3544,5231,019
803785598512431416250
24.1720.42
4.603.623.542.702.311.941.881.13
Source: UNCTAD.
Chart 5.13 Visual arts: Market and product diversification worldwide
Thailand
India
U.S.A.
Mexico
Taiwan (PoC)
ChinaFrance
Switzerland
CanadaJapan
U.K.
Germany
Netherlands
ItalyBelgium
Denmark
Rep. of KoreaViet Nam*
Spain
Indonesia
0
1
2
3
4
5
6
7
8
9
0 4 6 8 102
Source: ITC CountryMap.
The size of the bubble is proportional to total country exports in 2005.
Market diversification (N of equivalent market), 2005
Pro
du
ct
div
ers
ific
atio
n (
N o
f e
q.
HS
6),
20
05
High product and Low market diversification
High product and market diversification
Low product and High market diversification
Low product and market diversification
Table 5.17Visual arts: Top 10 exporters among developing economies, 2005
ChinaChina, SAR of Hong KongIndiaRepublic of KoreaMexicoThailandIndonesiaTaiwan Province of ChinaGhanaPhilippines
Developingeconomy
123456789
10
Rank
10.8-7.5
107.418.2-8.72.01.10.5
767.0-
2005
Value f.o.b.(in millions of $)
2005
Market share (%)
2000-2005
Growth rate (%)
3,459839503262198189182180109107
15.623.792.271.180.890.850.820.810.490.48
Source: UNCTAD.
23For a comprehensive analysis, see Trends in Audiovisual Markets: Regional Perspectives from the South (UNESCO Document CI/COM/2006/PUB/10), UNESCO, Paris, 2006.
Inte
rnati
onal
trade i
n c
reati
ve g
oods
and s
erv
ices:
G
lobal
trends
and f
eatu
res
5
Film industry
Globally, the value of the film industry is estimated ataround $75 billion,24 of which $55 billion are accounted forby the production and sale of DVDs. This means that morefilms are seen in the world but fewer people go to cinemas.Revenue for the film industry derives from box-office salesdomestically and abroad, music rights, television and satelliterights, video and Internet rights, merchandising, CD andDVD rentals plus copyrights for reproduction. Therefore,intellectual property right (IPR) issues are crucial for theearnings of the film industry but data are not available. Themaking, distribution and exhibition of films continue to bedominated largely by a small number of big, vertically inte-grated groups, inhibiting the expansion of the film industryin developing economies and their presence in the globalmarket. Worldwide, 85 per cent of all films exhibited areHollywood productions, while many developing economieshave never produced one single commercial movie. Manycountries are trying to put in place legislation and incentivesto stimulate national production but they claim the need forpolicy space in order to be able to act under the scope of theWTO rules.25
India is the world’s largest film producer, makingabout 1,000 commercial films annually but these are mostlyfor the domestic market. Even if more Indian films havebeen exported recently, targeting mainly its diasporas, thereis a problem of distribution. Elsewhere in Asia, the expansionof the film industry in China is taking place simultaneouslywith the decline of the industry in Japan, one of the largestmarkets for films but one that has turned into a market high-ly dependent on the rental of videos. Films from the Republicof Korea are increasingly appreciated in world markets butface market access constraints under the WTO agreements.
Creative ideas are reviving the film industry in LatinAmerica, particularly in Argentina, Brazil and Colombia.Progress in regional integration through MERCOSUR isfacilitating better articulation of cultural policies in theregion, with a positive effect on the film industry. A shifttowards more independent productions and distributionschemes is part of the efforts to consolidate cultural, socialand economic integration in Latin America.26 A new trend isthe choice of landscapes, particularly in the Caribbean, forshooting American and European movies. A priori, this has
a positive impact since it creates jobs, injects foreign currencyand helps to revitalize the local economy. In the long run,however, this may inhibit local creation by national inde-pendent film-makers, who generally have little access tofinancing and modern infrastructure and therefore are unableto compete.
Real life in Africa and the struggle of Africa to pre-serve its roots, identities and languages are all captured wellby the relatively small but qualitatively rich iconography ofAfrican films. The emergence and rise of the Nigerian video-based film industry, the so-called Nollywood, is a creativeresponse to satisfy the cultural needs of modern Africansociety (see box 9.4 in chapter 9). Nonetheless, developingcountries are lagging behind in the film industry, since onaverage, they produce 1.2 films per million inhabitants compared with 6.3 films in developed countries.27
Television and radio
Television and radio broadcasting are the most popu-lar among the creative industries. Both are in a phase of tech-nological shifts from the analogue to the digital system andfrom terrestrial to satellite and cable stations. This is takingplace simultaneously on a global scale, including in theLDCs. Furthermore, many countries under WTO obliga-tions liberalized their telecommunication industry in the1990s, opening their doors to fierce competition, therebyaffecting the production of local creative products.Penetration of cable television throughout the developingworld is a fact, bringing with it both challenges and oppor-tunities. On the positive side, it expands the choice of con-sumers, facilitating access to world news and stimulatingsome local business initiatives. Conversely, it reduces thespace for cultural diversity owing to the massive invasion offoreign packages showing the realities of completely differ-ent societies. This may have an adverse impact on educationand cultural life. The shift towards digital radio poses a similar problem, raising controversies. The key issue is morecultural and economic than technological.
Most developing countries are net importers of televi-sion creative content. There are, however, some success stories, such as Televisa in Mexico and TV Globo in Brazilthat are major exporters of television programmes – mainlysoap operas (telenovelas) – to world markets (see box 9.1 in
125C R E AT I V E E C O N O M Y R E P O R T 2 0 0 8
Inte
rnatio
nal tra
de in
cre
ative
goods a
nd se
rvices: G
lobal tre
nds a
nd fe
atu
res
5
24See International Flows of Selected Cultural Goods and Services, 1994-2003, UNESCO Institute for Statistics, Montreal, 2005. 25Chapter 9 addresses issues relating to WTO multilateral negotiations.26The cinema industry in the world”, A. Maleiros, Sao Paulo, 2007.27For a better understanding of audiovisual markets, see Trends in Audiovisual Markets: Regional Perspectives from the South (UNESCO Document CI/COM/2006/PUB/10), UNESCO, Paris, 2006.

126 C R E AT I V E E C O N O M Y R E P O R T 2 0 0 8
chapter 9). Copyrights, trademarks, advertising, subscrip-tions, sponsorships and viewer licences are the sources ofincome for television and radio. Today, it is not possible tocapture the size of this market through official statistics forthe reasons explained earlier and particularly since officialdata for radio and television services are not reported.Nevertheless, annual global television revenues were roughlyestimated at around $195 billion in 2000.28
International trade
International trade in audiovisuals tripled during theperiod 1996-2005. Exports of audiovisual products (goodsand services) increased from $6.7 billion to $18.2 billion,growing on average by 10.5 per cent over ten years. However,the share of audiovisuals in total exports of creative-industryproducts remained practically unchanged at about 4 per centin 2005. The bulk of global trade in audiovisuals was in serv-ices, which amounted to $17.5 billion in 2005 while audio-visual goods totalled only $664 million.
Developed economies dominated the market foraudiovisuals, retaining nearly 90 per cent of world exportsfor this subgroup. The United States was the leading export-ing country; in 2005, its exports of audiovisual servicesexceeded $7 billion. The United Kingdom, France andCanada were the other major players. Hungary emerged asthe fifth major exporter of audiovisual services in 2005. Onthe other hand, developing economies lost market shares inaudiovisual exports during the period 2000-2005. Totalexports of audiovisual services from developing economiesamounted to only $877 million in 2005. Mexico was the
main exporter of audiovisual services, followed by Argentina,China and the Republic of Korea. The Russian Federationwas the largest exporter of these services from the economiesin transition (see tables 2.4.A and 2.4.B in the annex).
This overall trend is indicative of the world market situation for audiovisuals even if the magnitude of thereported data (amounting to $18.2 billion) does not reflectthe real size of the global market. Audiovisuals constitute alarge and dynamic subgroup that will remain as one of thepillars of the creative economy.
A similar situation occurred for audiovisual goods.The level of exports nearly doubled, reaching $664 millionin 2005 compared to $355 million in 1996, with a growthrate of 7.6 per cent over the period 1996-2005. Moreover,in the last five years of this period, the growth of exports waseven more accentuated, with the level in 2005 14.4 per centhigher than in 2000. Developed countries had 89 per cent ofworld market share of audiovisual goods against 8 per centfor developing countries and 2 per cent for the economies intransition. Exports from developed countries amounted to$592 million in 2005, while those from developing coun-tries dropped by nearly 8 per cent (see table 1.4.1.A forexports and table 1.4.1.B for imports, both in the annex).
Key players in the global market
For the reasons mentioned earlier, it is not helpful topresent the list of the key players in the world market foraudiovisuals since it would give an erroneous picture of theglobal market. The figures reported are few and relatively loweven from countries with advanced statistical data-collectionsystems. For details, see in particular tables 2.4.A and 2.4.Bfor audiovisual services as well as the tables for creative goodsprovided in the annex.
In terms of audiovisual goods, India, Mexico, theRepublic of Korea, Thailand and Argentina are the mainexporters from the South. Concerning market diversifica-tion, India has diversified both its products and the targetmarkets, the same strategy adopted by Mexico, Argentina andThailand, while the Republic of Korea aims at diversificationof markets and Singapore is the most diversified in terms ofexport products.
Against this picture, clouded by the very limited par-ticipation of developing countries in a buoyant market suchas the global market for audiovisuals, chart 5.15, with its
Inte
rnati
onal
trade i
n c
reati
ve g
oods
and s
erv
ices:
G
lobal
trends
and f
eatu
res
5
Chart 5.14 Audiovisuals: Exports, by economic group, 1996 and 2005
1996
2005
(billion US $)
Developed
economies
Developing
economies
Economies
in transition
Source: UNCTAD Database
0
6
4
2
10
8
16
14
12
18
28See J. Howkins, The Creative Economy: How People make Money from Ideas, London, 2001.
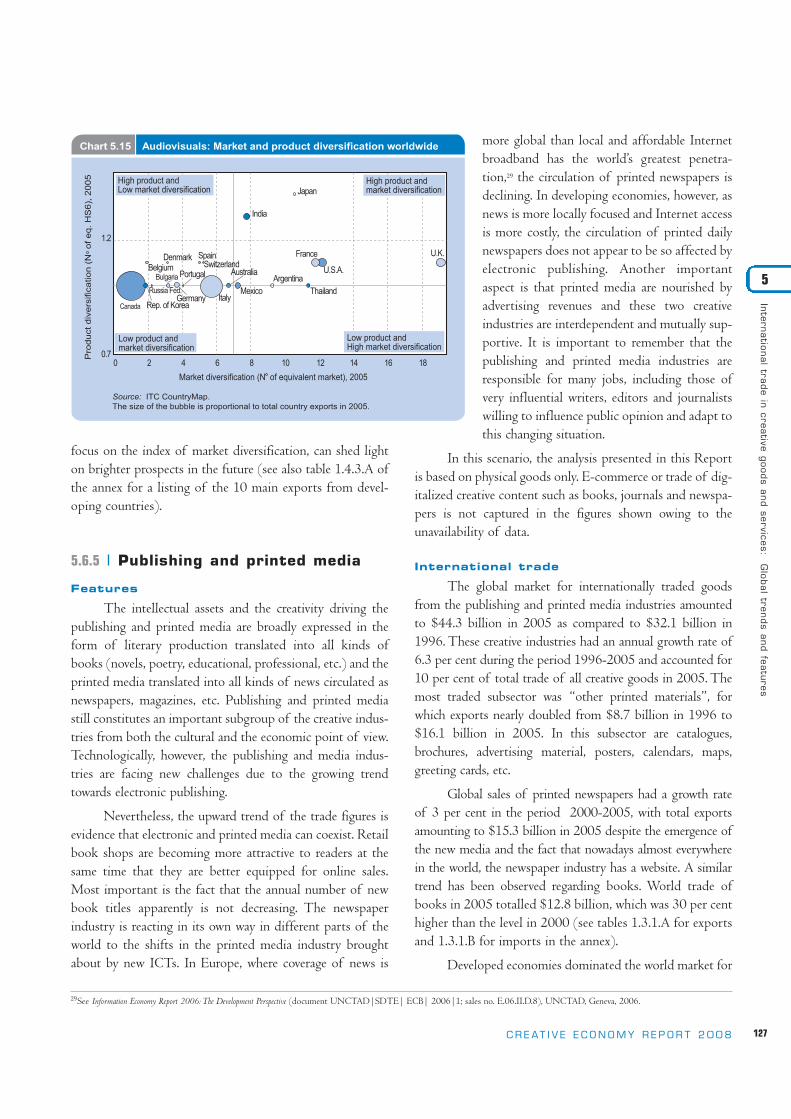
focus on the index of market diversification, can shed lighton brighter prospects in the future (see also table 1.4.3.A ofthe annex for a listing of the 10 main exports from devel-oping countries).
5.6.5 Publishing and printed media
Features
The intellectual assets and the creativity driving thepublishing and printed media are broadly expressed in theform of literary production translated into all kinds ofbooks (novels, poetry, educational, professional, etc.) and theprinted media translated into all kinds of news circulated asnewspapers, magazines, etc. Publishing and printed mediastill constitutes an important subgroup of the creative indus-tries from both the cultural and the economic point of view.Technologically, however, the publishing and media indus-tries are facing new challenges due to the growing trendtowards electronic publishing.
Nevertheless, the upward trend of the trade figures isevidence that electronic and printed media can coexist. Retailbook shops are becoming more attractive to readers at thesame time that they are better equipped for online sales.Most important is the fact that the annual number of newbook titles apparently is not decreasing. The newspaperindustry is reacting in its own way in different parts of theworld to the shifts in the printed media industry broughtabout by new ICTs. In Europe, where coverage of news is
more global than local and affordable Internetbroadband has the world’s greatest penetra-tion,29 the circulation of printed newspapers isdeclining. In developing economies, however, asnews is more locally focused and Internet accessis more costly, the circulation of printed dailynewspapers does not appear to be so affected byelectronic publishing. Another importantaspect is that printed media are nourished byadvertising revenues and these two creativeindustries are interdependent and mutually sup-portive. It is important to remember that thepublishing and printed media industries areresponsible for many jobs, including those ofvery influential writers, editors and journalistswilling to influence public opinion and adapt tothis changing situation.
In this scenario, the analysis presented in this Reportis based on physical goods only. E-commerce or trade of dig-italized creative content such as books, journals and newspa-pers is not captured in the figures shown owing to theunavailability of data.
International trade
The global market for internationally traded goodsfrom the publishing and printed media industries amountedto $44.3 billion in 2005 as compared to $32.1 billion in1996. These creative industries had an annual growth rate of6.3 per cent during the period 1996-2005 and accounted for10 per cent of total trade of all creative goods in 2005. Themost traded subsector was “other printed materials”, forwhich exports nearly doubled from $8.7 billion in 1996 to$16.1 billion in 2005. In this subsector are catalogues,brochures, advertising material, posters, calendars, maps,greeting cards, etc.
Global sales of printed newspapers had a growth rate of 3 per cent in the period 2000-2005, with total exportsamounting to $15.3 billion in 2005 despite the emergence ofthe new media and the fact that nowadays almost everywherein the world, the newspaper industry has a website. A similartrend has been observed regarding books. World trade ofbooks in 2005 totalled $12.8 billion, which was 30 per centhigher than the level in 2000 (see tables 1.3.1.A for exportsand 1.3.1.B for imports in the annex).
Developed economies dominated the world market for
127C R E AT I V E E C O N O M Y R E P O R T 2 0 0 8
Inte
rnatio
nal tra
de in
cre
ative
goods a
nd se
rvices: G
lobal tre
nds a
nd fe
atu
res
5
Chart 5.15 Audiovisuals: Market and product diversification worldwide
ThailandMexico
AustraliaArgentina
India
U.S.A.
U.K.France
Japan
Switzerland
CanadaGermany
Russia Fed.
Denmark
BulgariaBelgium
Portugal
ItalyRep. of Korea
Spain
0.7
1.2
4 6 8 10 12 14 16 1820
Source: ITC CountryMap.
The size of the bubble is proportional to total country exports in 2005.
Market diversification (N of equivalent market), 2005
Pro
du
ct d
ive
rsi fic
atio
n (
N o
f e
q. H
S6
), 2
005
High product and Low market diversification
High product and market diversification
Low product and High market diversification
Low product and market diversification
29See Information Economy Report 2006: The Development Perspective (document UNCTAD|SDTE| ECB| 2006|1; sales no. E.06.II.D.8), UNCTAD, Geneva, 2006.

128 C R E AT I V E E C O N O M Y R E P O R T 2 0 0 8
publishing and printed media exports, accounting for 83per cent of world exports in 2005. European exports roseto $24.2 billion in this year. Among the top ten exporters,8 out of 10 were European countries. Canada andGermany were the top two exporters, with nearly $6 bil-lion in annual exports of publishing and printed mediamaterials; both countries had a 13-per cent share of theworld market for exports of creative goods. They were fol-lowed by the United States, the United Kingdom andFrance. In terms of market strategies, Germany was thecountry that had most diversified its exports in terms ofproducts and markets, while Canada was the opposite,concentrating on a few products and a few markets.Europe in general was more diversified than Asia andAmerica (see table 5.18 and chart 5.17).
Developing countries, despite their slight participationin world markets, showed great dynamism during the period1996-2005. Over the decade, their exports quintupled from$1.7 billion to $6.6 billion. As a result, their share in globalmarkets reached nearly 15 per cent owing mainly to the risein exports from China. Books were the main product gainingan important market share over the period, increasing from10 per cent in 1996 to 23 per cent in 2005. Similar positivetrends were observed for other printed materials as well asfor newspapers. Economies in transition exported $1.14 billion and imported $1.3 billion in publishing materials andprinted media in 2005, of which about 5 per cent werenewspapers. Table 5.19 shows the 10 leading exportersamong developing economies.
The rapid expansion of this creative industry inChina over the period 1996-2005 was remarkable. With anannual growth rate of 19.5 per cent, Chinese exports ofpublishing material and printed media sharply increasedfrom $197 million in 1996 to $1.1 billion in 2005although trade data cannot distinguish creative productsthat are “made” from those that are”created” in China.Positive developments also took place in most developingcountries. Asia and Latin America had a presence in worldmarkets. China exports were more targeted than those ofthe Republic of Korea, Singapore and the RussianFederation. For trade flows, see tables 1.2.A, 1.2.B and 1.4.3in the annex.
Inte
rnati
onal
trade i
n c
reati
ve g
oods
and s
erv
ices:
G
lobal
trends
and f
eatu
res
5
Chart 5.16Publishing and printed media: Exports, by economic group, 1996 and 2005
1996
2005
(billion US $)
Developed
economiesDeveloping
economiesEconomies
in transition
Source: UNCTAD Database
0
10
20
30
40
Table 5.18Publishing and printed media: Top 10 exporters among developed economies, 2005
CanadaGermanyUnited StatesUnited KingdomFranceItalyBelgiumSpainSwedenNetherlands
Developedeconomy
123456789
10
Rank
0.512.2
1.69.56.26.4
-5.03.2
10.7
2005
Value (in millions of $)
2005
Market share (%)
2000-2005
Growth rate (%)
5,9655,8945,4964,1342,4901,6761,5521,3271,2251,205
13.4613.3012.40
9.335.623.783.502.992.772.72
Source: UNCTAD.
Table 5.19Publishing materials: Top 10 exporters among developing economies, 2005
China, SAR of Hong KongChinaSingaporeRepublic of KoreaMexicoNamibiaMalaysiaIndonesiaChileColombia
Developingeconomy
123456789
10
Rank
9.022.2
9.07.63.3
12.08.8
-3.6-3.64.9
2005
Value (in millions of $)
2005
Market share (%)
2000-2005
Growth rate (%)
1,5521,146
932487417216190175172169
3.502.592.101.100.940.490.430.400.390.38
Source: UNCTAD.

5.6.6 Design
Features
Design deals with the creation of forms and theappearance of products. Creative design is expressed in sever-al ways: through the creation of decorative luxury items suchas jewellery, by the uniqueness of a functional service such asthe architectural design of a building, or as utilitarian mass-produced goods such as an interior object. Design productsare usually aesthetic functional creations based on conceptsand specifications. Again, the definition of design enters intothe debate of IPRs. For many, design is an input into all man-ufacturing processes and cannot be separated from any finalphysical product. For others, such as the Industrial DesignSociety of America, the definition of “design” is “the cre-ation and development of concepts and specifications thatoptimize the functions, value and appearance of products andsystems for the mutual benefit of users and manufacturers”.30
Without arguing the merits of different approaches,design fits into the “functional creations” category of theUNCTAD definition of “creative industries”. It is the resultof human creativity expressed as a knowledge-based econom-ic activity, with creative content, cultural value and marketobjectives. As such, the design industry is part of the creativeeconomy given that it cuts across the artisan, manufacturingand services components of the value chain, interacting withtechnology and qualifying for IPRs (see chapter 1). As an
artistic work, design is associated with copyrights andspecifically with “design rights” although the delimita-tion between the artistic expression and the industrialmanufacturing is not evident. Certainly, withoutdesign, most goods and services would not exist orwould fail to be differentiated in the market place.
Current statistical classifications31 do not allow aclear identification of those functional products withhigher creative content in the design value-added chain.Therefore, in carrying out the statistical analyses, aneffort was made to select those products with a pre-sumably high design input. At this stage, it is not pos-sible to isolate the design input from the final product.Thus, the export figures reflect the total value of thefinal products, not the design content. To a certainextent, this explains the predominance of high figuresunder the design subgroup of creative industries.
Design products include goods and services. The analy-sis contained in this Report is based on trade data for interiorobjects, graphic design, jewellery, toys and fashion, as indicatedin table 5.1 presented earlier.32 Industrial design is not coveredand architectural services are treated under “functional creative services”. Most of the items included under “fash-ion” are accessories; clothing and footwear are not includedowing to the impossibility of differentiating design creationsfrom mass-production goods, as explained earlier.Furthermore, as for all creative industries, the lack of data forcopyrights, trademarks, brands, etc., makes it difficult toassess the overall economic impact of each subgroup ofcreative industries on national economies.
Fashion is a creative industry deserving special atten-tion, given its characteristics and the great potential of thefashion industry for trade. The global fashion industry isexpanding; it goes beyond the “haute couture”, which is dis-tinct from the prêt-à-porter (ready to wear) and the trendydesign wear. Nowadays, the fashion industry covers a widerange of fashionable products, including perfume, jewelleryand accessories such as scarves, purses and belts. A unique,handmade fashion creation is distinct from industrial-scaleproduction. Therefore, fashion design products should beprotected by copyrights or trademarks before entering intohighly competitive domestic or international markets. Indeed,
129C R E AT I V E E C O N O M Y R E P O R T 2 0 0 8
Inte
rnatio
nal tra
de in
cre
ative
goods a
nd se
rvices: G
lobal tre
nds a
nd fe
atu
res
5
30 For further information, consult the websites of the Industrial Designers Association of America, the American Institute of Graphic Arts and the Design Council, London.31 The international statistical classification used for the trade data presented in this Report is the Harmonized System 1996. For further explanation, see the explanatory notes in the annex.32 The explanatory notes in the annex provide more detail about the list of the selected items.
Chart 5.17Publishing and printed media: Market and product diversification of developing economies
Taiwan (PoC)
Mexico
Indonesia
Argentina
Singapore
Chile
India
U.A. Emirates*
South Africa
China
Cambodia*
Kenya*
Turkey
Rep. of Korea
Philippines
Colombia
MalaysiaThailand
Peru
Brazil
7
6
5
4
2
3
1
04 6 8 10 1220
Source: ITC CountryMap.
The size of the bubble is proportional to total country exports in 2005.
Market diversification (N of equivalent market), 2005
Pro
duct div
ers
ific
ation (
N of eq. H
S6),
200
5
High product and Low market diversification
High product and market diversification
Low product and High market diversificationLow product and market diversification

130 C R E AT I V E E C O N O M Y R E P O R T 2 0 0 8
it is the brand or label attesting to the creative content andnovelty of products that ensures value added and higher rev-enues for the stylists. These and other intricacies of the glob-al fashion industry need to be better understood in order forthe fashion industry to be enhanced in developing countries.33
Today, the originality of ethnic textiles combined withthe eccentricity and diversity of works by fashion designersfrom developing countries are conquering world markets. Theorganization of Fashion Weeks in all developing regions suchas in Brazil, China, India, Jamaica and South Africa are contributing to the promotion of the work of their fashioncreators and stylists and the circulation of models from theSouth towards the rest of the world. In this respect, develop-ing economies are called upon to better explore trade opportunities in world markets in light of the new scenarioof liberalized markets for textiles and clothing post-Multi-Fibre Agreement.34
The aim of this Report is to sensitize policy-makers tothe positive economic and social spillovers of these usuallyneglected creative industries. For fashion, in the absence ofdata for marketing and brands and owing to the difficulty indistinguishing between a fashion creation and the more pop-ular mass-production manufacturing from the clothing andfootwear industries, only trade data for accessories are includ-ed in the fashion subsector. The trade figures presented forthe design industry, including fashion, have deficiencies andshould be seen as results of preliminary work that should bepursued and improved.
International trade
This first assessment of global trade in design goodshas shown impressive results. Design was found to be theleading subgroup in the world market for creative goods. Theglobal market for these goods reached $218.1 billion in2005, accounting for nearly half of total world exports ofcreative goods.35 The inclusion of design as a creative industryhas completely changed the position of key players in theworld market for creative goods and services.36 China and Italybecame leading exporters of creative-industry productsthanks to their competitive position in the production andtrade of design goods and services.
World exports of design goods nearly doubled from$119.7 billion to $218.2 billion from 1996 to 2005, with anannual growth rate of 6.3 per cent during the period. Theshare of design products in total exports of creative goodsremained stable at about 50 per cent. As shown in table1.3.1.A of the annex, when ranking the share of exports bydesign items in 2005, interior products were first with nearly20 per cent, followed by fashion items (18 per cent), jewellery(11 per cent) and toys (9 per cent).
Inte
rnati
onal
trade i
n c
reati
ve g
oods
and s
erv
ices:
G
lobal
trends
and f
eatu
res
5
Chart 5.18 Design: Exports, by economic group, 1996 and 2005
1996
2005
(billion US $)
Developed economies
Developing economies
Economies in transition
Source: UNCTAD Database
0
20
40
80
120
60
100
Table 5.20Design: Exports, by economic group and region, 2000 and 2005
WorldDeveloped economiesEuropeUnited StatesJapanCanadaDeveloping economiesEastern, Southern and Southeastern AsiaChinaWestern AsiaLatin America and CaribbeanAfricaLDCsSIDSEconomies in transition
Economic group and region
9.18.39.85.19.21.09.69.9
21.925.8
7.714.0-0.52.4
24.1
2000 2005
Value (in millions of $)
2000-2005
Growth rate (%)
146,72577,92562,175
8,9152,5183,509
67,61360,54622,440
2,0394,531
4859778
546
218,173112,59592,.87911,224
3,6783,692
102,41390,61447,078
4,6746,280
8269488
1,735
Source: UNCTAD.
33A comprehensive analysis of the fashion industry in the Caribbean is presented in the study, The Cultural Industries in CARICOM: Trade and Development Challenges, prepared by K. Nurse,lead consultant, for the Caribbean Regional Negotiating Machinery, November 2006.
34International trade of fashion goods and services is ruled by multilateral and regional agreements. Issues relating to the removal of trade obstacles such as rules of origin, preferentialtreatment, safeguards and import quotas are negotiated in WTO and are crucial instruments for access of products from developing countries to world markets.
35This also reflects the fact that design is the best statistically reported subgroup among the creative industries.36The UNESCO report, International Flows of Selected Cultural Goods and Services 1994-2003: Defining and Capturing the Flows of Global Cultural Trade, ranks the United Kingdom, the United
States and China as the biggest exporting countries on the basis of data for 2002 for cultural goods.
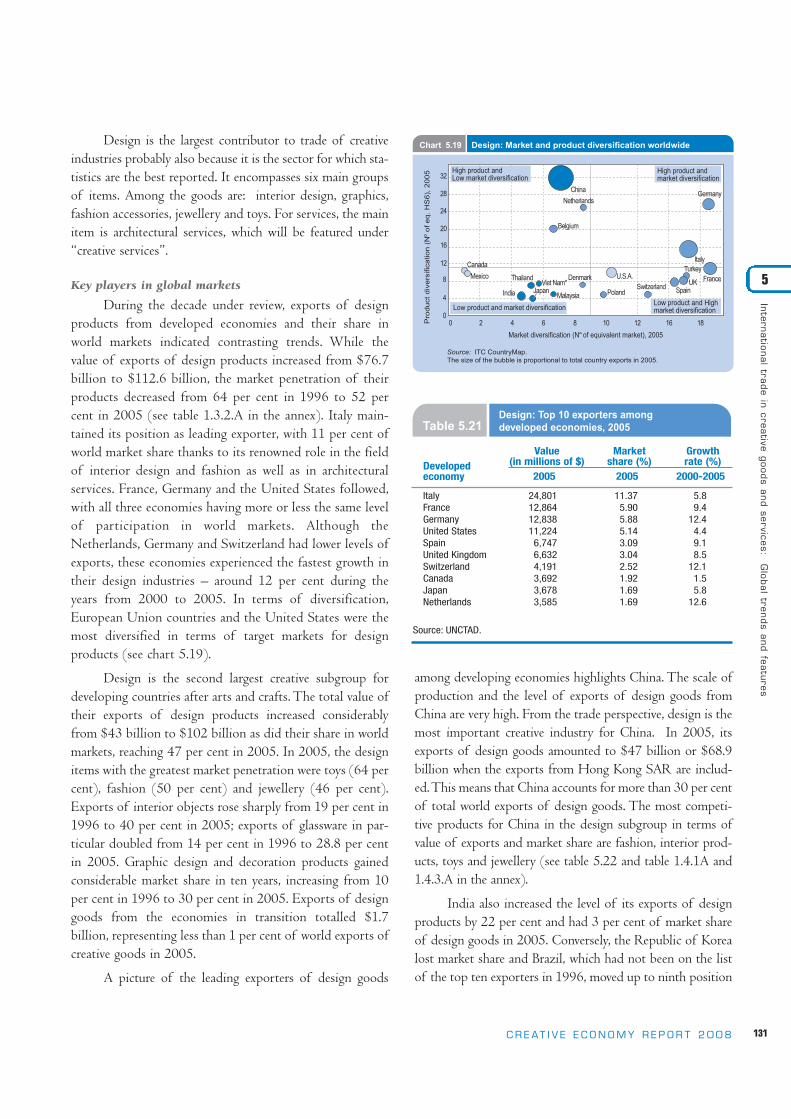
Design is the largest contributor to trade of creativeindustries probably also because it is the sector for which sta-tistics are the best reported. It encompasses six main groupsof items. Among the goods are: interior design, graphics,fashion accessories, jewellery and toys. For services, the mainitem is architectural services, which will be featured under“creative services”.
Key players in global markets
During the decade under review, exports of designproducts from developed economies and their share inworld markets indicated contrasting trends. While thevalue of exports of design products increased from $76.7billion to $112.6 billion, the market penetration of theirproducts decreased from 64 per cent in 1996 to 52 percent in 2005 (see table 1.3.2.A in the annex). Italy main-tained its position as leading exporter, with 11 per cent ofworld market share thanks to its renowned role in the fieldof interior design and fashion as well as in architecturalservices. France, Germany and the United States followed,with all three economies having more or less the same levelof participation in world markets. Although theNetherlands, Germany and Switzerland had lower levels ofexports, these economies experienced the fastest growth intheir design industries – around 12 per cent during theyears from 2000 to 2005. In terms of diversification,European Union countries and the United States were themost diversified in terms of target markets for design products (see chart 5.19).
Design is the second largest creative subgroup fordeveloping countries after arts and crafts. The total value oftheir exports of design products increased considerablyfrom $43 billion to $102 billion as did their share in worldmarkets, reaching 47 per cent in 2005. In 2005, the designitems with the greatest market penetration were toys (64 percent), fashion (50 per cent) and jewellery (46 per cent).Exports of interior objects rose sharply from 19 per cent in1996 to 40 per cent in 2005; exports of glassware in par-ticular doubled from 14 per cent in 1996 to 28.8 per centin 2005. Graphic design and decoration products gainedconsiderable market share in ten years, increasing from 10per cent in 1996 to 30 per cent in 2005. Exports of designgoods from the economies in transition totalled $1.7 billion, representing less than 1 per cent of world exports ofcreative goods in 2005.
A picture of the leading exporters of design goods
among developing economies highlights China. The scale ofproduction and the level of exports of design goods fromChina are very high. From the trade perspective, design is themost important creative industry for China. In 2005, itsexports of design goods amounted to $47 billion or $68.9billion when the exports from Hong Kong SAR are includ-ed. This means that China accounts for more than 30 per centof total world exports of design goods. The most competi-tive products for China in the design subgroup in terms ofvalue of exports and market share are fashion, interior prod-ucts, toys and jewellery (see table 5.22 and table 1.4.1A and1.4.3.A in the annex).
India also increased the level of its exports of designproducts by 22 per cent and had 3 per cent of market shareof design goods in 2005. Conversely, the Republic of Korealost market share and Brazil, which had not been on the listof the top ten exporters in 1996, moved up to ninth position
131C R E AT I V E E C O N O M Y R E P O R T 2 0 0 8
Inte
rnatio
nal tra
de in
cre
ative
goods a
nd se
rvices: G
lobal tre
nds a
nd fe
atu
res
5
Table 5.21Design: Top 10 exporters among developed economies, 2005
ItalyFranceGermanyUnited StatesSpainUnited KingdomSwitzerlandCanadaJapanNetherlands
Developedeconomy
5.89.4
12.44.49.18.5
12.11.55.8
12.6
2005
Value (in millions of $)
2005
Market share (%)
2000-2005
Growth rate (%)
24,80112,86412,83811,224
6,7476,6324,1913,6923,6783,585
11.375.905.885.143.093.042.521.921.691.69
Source: UNCTAD.
Chart 5.19 Design: Market and product diversification worldwide
Source: ITC CountryMap.
The size of the bubble is proportional to total country exports in 2005.
Market diversification (N of equivalent market), 2005
Pro
duct
div
ers
ific
ation (
N of eq. H
S6),
2005
Canada
MexicoTurkey
Spain
Belgium
UKSwitzerland
Poland
U.S.A.DenmarkViet Nam*
China
NetherlandsGermany
France
Italy
Malaysia
Thailand
India Japan4
8
12
16
20
24
28
32
04 6 8 10 12 16 1820
High product and Low market diversification
High product and market diversification
Low product and High market diversificationLow product and market diversification

132 C R E AT I V E E C O N O M Y R E P O R T 2 0 0 8
in 2005. As shown in chart 5.20 on market and productdiversification of design products for developing economies,China not only was the top exporter but also demonstrated ahigh degree of diversification in terms of products and mar-kets, followed by the Republic of Korea and Egypt.Conversely, India, the Dominican Republic and Brazil werenot very diversified in terms of products and markets.
5.6.7 New media
Features
New media is the newest subgroup among the creativeindustries. It emerged as a result of rapid advances in ICTsthat started in the 1990s with the purpose of promoting the
construction of a global information infrastructure as thebasis of the overall globalization process, giving rise to theso-called “Information Society”.37
In the dynamics of the creative economy, the subgroupnew media plays two roles:
(a) It is a creative product itself, expressed as a digitalized form of creative content such as software, cartoons and interactive products such as video games.
(b) It is an enabler of connectivity used as a tool for marketing and distribution of other creative products such as music, films, books and news, or creative services such as advertising and architectural services (see chapter 7).
At present, it is not yet possible to capture the realdynamism of new media as a driving force of the creativeeconomy. There are two reasons for this: first, the noveltyembedded in the constant updating of technologies used forthe production and consumption of creative content; andsecond, the lack of a universally agreed system of data col-lection of digitalized creative content. In this regard, itshould be recalled that issues relating to measurement ofICT tools, in particular how to collect accurate, useful andcomparable ICT statistics, are addressed in chapter 7 ofthis Report.38
Again, figures presented for new media are extremelyunderestimated for the reasons explained earlier.Nevertheless, they contribute to a better understanding ofcurrent trends. In the UNCTAD classification of creativeindustries, new media includes a wide range of creative digi-talized content such as software, video games, cartoons andother digital products. The figures shown are clearly evidenceof shortcomings in the level of disaggregation of statisticalclassification codes since they cover only digital records andvideo games. Furthermore, the subgroup comprises severalrelatively new creative services, such as Web-related services,for which data are non-existent (see also the general explana-tory notes in the annex).
As an enabler, the subgroup new media is the realexpression of connectivity and as such is highly dependenton the accessibility of ICT digital equipment such as computers, mobile telephones, digital televisions and MP3s,
Inte
rnati
onal
trade i
n c
reati
ve g
oods
and s
erv
ices:
G
lobal
trends
and f
eatu
res
5
Chart 5.20 Design: Market and product diversification of developing economies
Source: ITC Country Map.
The size of the bubble is proportional to total country exports in 2005.
Market diversification (N of equivalent market), 2005
Pro
du
ct
div
ers
ific
atio
n (
N o
f e
q. H
S6),
200
5
Mexico
Turkey
Colombia
Taiwan (PoC)
Viet Nam*
China
Malaysia
Rep. of Korea
Philippines
Saudi Arabia
Dominican R.*Brazil
Isl. Rep. of Iran
Indonesia
Pakistan*
Singapore
Egypt*
U.A.Emirates*
Thailand
India4
8
12
16
20
24
28
32
0
4 6 8 10 12
16
1420
High product and Low market diversification High product and market diversification
Low product and High market diversificationLow product and market diversification
Table 5.22Design: Top 10 exporters among developing economies, 2005
ChinaChina, SAR of Hong KongIndiaTurkeyThailandMexicoMalaysiaIndonesiaBrazilRepublic of Korea
Developingeconomy
17.10.9
22.819.5
4.81.57.10.8
17.9-7.2
2005
Value (in millions of US$)
2005
Market share (%)
2000-2005
Growth rate (%)
47,07821,817
6,1924,0363,6733,1092,6402,0751,9391,718
21.510.0
2.81.81.61.41.20.90.90.8
37For an in-depth analysis, see Knowledge Societies: Information Technology for Sustainable Development, R. Mansell and U. Wehn (eds.), published by Oxford University Press for the UnitedNations Commission on Science and Technology for Development, 1998 (ISBN 0-19-829410-7).
38UNCTAD is a member of the Partnership on Measuring ICT for Development together with ten other international institutions. The key objective of the work of this group is toclose the ICT data gap by collecting data and maintaining a database on the ICT sector and on business uses of ICTs. For further information, see: http://measuring-ict.unctad.org.
Source: UNCTAD.

as discussed in chapter 7. The third part of the annex pres-ents additional quantitative data on trade in related indus-tries. Tables 3.1, 3.2 and 3.3 were prepared with the aim ofproviding empirical evidence of the magnitude of worldtrade of supporting equipment.
International trade
The global market for new-media goods grew very fastduring the period 1996-2005; the annual growth rate was6.5 per cent. World exports nearly doubled from $6.8 billionin 1996 to $12.0 billion in 2005, with the upward trendstarting with the year 2000, when exports of new-mediagoods increased by 10 per cent. The share of this subgroupin total exports of creative goods remained stable at around3.5 per cent. Video games were a very dynamic subsector, forwhich exports more than doubled from $4.2 billion in 1996
to $9.7 billion in 2005, while exports of digital recordingsdecreased slightly to $2 billion in 2005. For details onexports by countries, see tables 1.2.A and 1.2.B in the annex.
Key players in global markets
Developed economies led exports of new-mediagoods over the period 1996-2005. Their exports increasedslightly, amounting to $6.5 billion in 2005, but their sharein world markets for these goods declined sharply from 87per cent to 54 per cent during the ten-year period. Whiletheir exports of digital recordings remained relativelyunchanged, they faced growing competition from develop-ing economies as regards video games. Europe supplied athird of global market demand and its exports were morediversified in terms of target markets. The major exporter,however, was the United States, whose exports were morediversified in terms of products than markets. In Europe,the countries with greater participation in the global mar-kets for new-media products were Ireland, Germany and theUnited Kingdom, as shown in table 1.4.2 in the annex andtable 5.24 below.
In developing economies, there were contrastingtrends in exports of new-media goods. Asia had a strong,dominant position in the global market for these goods.Total exports from developing economies in 2005 reached$5.5 billion, which was six times higher than in 1996. Thisresulted in a substantial increase in their share in world mar-kets – from 13 per cent to 46 per cent. In the case of videogames, the upturn was even more accentuated: from 16 percent in 1996 to 54 per cent in 2005. This developmentreflected the remarkable increase in the exports of China: ifall Chinese regions are considered, its exports of new media
133C R E AT I V E E C O N O M Y R E P O R T 2 0 0 8
Inte
rnatio
nal tra
de in
cre
ative
goods a
nd se
rvices: G
lobal tre
nds a
nd fe
atu
res
5
Table 5.23New media: Exports, by economic group and region, 2000 and 2005
WorldDeveloped economiesEuropeUnited StatesJapanCanadaDeveloping economiesEastern, Southern and Southeastern AsiaChinaWestern AsiaAmericaAfricaEconomies in transition
Economic group and region
10.00.59.06.8
-16.315.633.562.9
209.485.2
6.115.194.8
2000 2005
Value (in millions of $)
2000-2005
Growth rate (%)
6,9365,5622,7241,3441,288
961,3711305
3432
5952
12,0356,4713,9611,805
235171
5,5085,4133,940
1077
855
Source: UNCTAD.
Chart 5.21 New media: Exports, by economic group, 1996 and 2005
1996
2005
(billion US $)
Developed
economies
Developing
economies
Economies
in transition
Source: UNCTAD Database
0
2
3
5
7
1
4
6
Table 5.24New media: Top 10 exporters among developed economies, 2005
United StatesIrelandGermanyUnited KingdomAustriaNetherlandsAustraliaJapanSpainBelgium
Developedeconomy
123456789
10
Rank
4.83.8
32.54.6
27.115.529.430.4
7.8-
2005
Value (in millions of $)
2005
Market share (%)
2000-2005
Growth rate (%)
1,805698691600579330290235190177
15.005.805.744.984.812.742.411.951.581.47
Source: UNCTAD.

reached $5 billion in 2005, or about 40 per cent of globaldemand. Video games constituted the most importantexported and imported item in Asia.
Apart from Asian developing economies, only Mexicoand Turkey are on the list of top ten exporters. Other LatinAmerican economies were very marginal exporters. Africa,the LDCs and the SIDS were not active participants in worldmarkets. Economies in transition had a very small participa-tion in world trade, accounting for less than 1 per cent oftotal exports of new-media goods. It should be pointed out,however, that this dark picture is probably further aggravat-ed by the lack of data from these developing regions.
5.6.8 Creative services
Features
Services are a key component in the dynamics of thecreative economy. For the creative industries, services play agrowing role in all its subgroups. Moreover, the world econ-omy has become much more services-oriented in recentyears. Since 1990, world trade in services has nearly tripled,reaching $2.4 trillion in 2005.39 The implications of liberal-ization of trade in services for poverty alleviation, welfareand the overall development prospects of developing countries remain at the heart of multilateral debates.40
At present, however, the available data for trade inservices do not provide the detail necessary to reach conclu-sive results about the real impact of service outputs ontrade in creative industries and its implications for the creative economy. The principal categories of services covermany aspects of the creative industries that cannot beextracted separately. Nevertheless, despite the limitations, apicture of world trade in services related to the creativeindustries is presented for the first time. It is hoped thatthis will pave the way for more in-depth work by theUnited Nations Multi-Agency Group on CreativeIndustries in collaboration with other international institu-tions such as the Statistical Office of the EuropeanCommunities (EUROSTAT) and OECD. The aim is tomove this work forward (see chapter 4).
In order to facilitate analysis of certaindemand-driven functional creations, UNCTADintroduced into its definition of “creative indus-tries” the subgroup of “functional creative serv-ices”, which covers services that intersect withmore than one subgroup; advertising is a case inpoint. The inclusion of creative-orientedresearch and development (R&D) services isanother. These services fit into the broader scopeof the creative economy and are closely associat-ed with scientific creations and technologicalinnovations. The rationale for the inclusion ofthese services is that the creative economy isrooted in the overall interactions between eco-nomics, culture and technology and, therefore,that the creative economy is centred on, but notrestricted to, arts and culture.
134 C R E AT I V E E C O N O M Y R E P O R T 2 0 0 8
Inte
rnati
onal
trade i
n c
reati
ve g
oods
and s
erv
ices:
G
lobal
trends
and f
eatu
res
5
Chart 5.22 New media: Market and product diversification worldwide
Source: ITC Country Map.
The size of the bubble is proportional to total country exports in 2005.
Market diversification (N of equivalent market), 2005
Pro
duct div
ers
ific
ation (
N
of eq. H
S6),
20
05
Mexico Denmark
Czech Rep.
Slovenia
Cananda
Netherlands
U.K.Japan FranceBelgium
Spain
GermanyU.S.A.
Taiwan (PoC)
China
Australia
Austria
IrelandRep. of Korea
Singapore
0
1
2
3
0 2 4 6 8 10 12 14 16
High product and Low market diversification
High product and market diversification
Low product and High market diversificationLow product and market diversification
Table 5.25New media: Top 10 exporters among developing economies, 2005
ChinaChina, SAR of Hong Kong SingaporeRepublic of KoreaTaiwan Province of China MexicoIndiaThailandTurkeyMalaysia
Developingeconomy
123456789
10
Rank
59.744.238.8
6.30.7
-16.8-34.453.640.2-8.8
2005
Value (in millions of $)
2005
Market share (%)
2000-2005
Growth rate (%)
3,9401,020
193100
77654615
98
32.748.471.600.830.640.540.380.120.080.06
Source: UNCTAD.
39UNCTAD, Trade in Services and Development Implications (document TD/B/COM.1/85), Geneva, 2007. 40See UNCTAD, Challenging Conventional Wisdom: Development Implications of Trade in Services Liberalization, Trade, Poverty and Cross-cutting Development Issues Study Series, No. 2 (document
UNCTAD/DITC/TAB/POV/2006/1), 2007.

International trade
Reported exports of creative services increased sharply,with an annual growth rate of 11.2 per cent for the periodfrom 2000 to 2005. Exports increased from $52.2 billion in2000 to $89 billion in 2005. As trade in creative services hasgrown faster than the average growth rate of total services (12per cent),41 creative services is a new dynamic sector in worldtrade. For instance, advertising services had an average growthrate of 22 per cent between 2000 and 2005, followed byarchitectural services with 19 per cent.
Developed economies accounted for 82 per cent oftotal exports of creative services in 2005 while developingeconomies had an 11 per cent market share, and theeconomies in transition had 7 per cent of the world total, asshown in chart 5.23. Among all creative services, architectur-al as well as personal, cultural and recreational services werethe most traded creative services in world markets in 2005.Both had remarkable increases in exports from about $10 bil-lion in 1996 to about $27.5 billion in 2005 (see table 5.26).
Imports of creative services increased notably from$43.8 billion in 1996 to $85.7 billion in 2005. Imports of
cultural and recreational services increased from $14.8 billion to $25.6 billion, accounting for nearly 30 per cent oftotal imports of these services in 2005. Architectural anddesign services ranked second, with imports increasing from$9.4 billion to $23.3 billion, representing 27.2 per cent oftotal imports of creative services. These were followed byR&D, imports of which rose from $10.2 billion to $19.7billion, or 23 per cent of imports of creative services.Imports of advertising and market-related services increasedfrom $9.2 billion to $16.9 billion, or 19 per cent of importsof creative services in 2005. Finally, audiovisual servicesexperienced an increase from $9.0 billion to $16.3 billion,accounting for 19 per cent of total imports of creative services in 2005.
5.6.9 Royalties and licence fees
As addressed in other chapters, copyrights are themost important IPR instrument for the creative industries asthey provide protection for authorship of paintings, sculptures, music, novels, architecture, etc. However, officialfigures for copyrights are not available.42 According toWIPO, statistical limitations and deficiencies in data collec-tion have made it impossible to date to compile universaldata on copyrights from the creative industries.
Royalty payments and licence fees are associated withthe use of intellectual property for production and consumption of goods and services, for instance, licensingservices for the right to use entertainment, computer soft-ware, or other non-financial intangible assets.
Despite data limitations mentioned earlier, thisReport includes world figures for royalties, which are shownin table 5.27 as well as in tables 2.8.A and 2.8.B in the
annex. This is complementary informa-tion provided to complete the overall picture, based on available national dataon creative industries at the world level.Our intention is to emphasize the needto start collecting data on copyrightearnings. Since it is not possible to disag-gregate the overall royalty figures by iden-tifying and listing only the data relevantfor the creative industries, the data for
135C R E AT I V E E C O N O M Y R E P O R T 2 0 0 8
Inte
rnatio
nal tra
de in
cre
ative
goods a
nd se
rvices: G
lobal tre
nds a
nd fe
atu
res
5
Table 5.26Reported exports of creative services, 1996, 2000 and 2005 (in billions of $)
199620002005
Source: UNCTAD.
All creativeservices
38.252.288.9
Architectural
9.817.327.7
Advertising
5.05.1
15.7
Audiovisual
6.313.317.5
R&D
13.39.6
18.0
Cultural andrecreational
10.520.727.5
Othercultural
1.02.83.5
41See UNCTAD, Trade in Services…, ibid.42The International Confederation of Societies of Authors and Composers (CISAC) compiles data for 210 management societies in 109 countries that are affiliated to the
Confederation. Data cover only amounts raised by licensing activities of these societies in their national territories; thus income from international exchanges is not included.
Chart 5.23 Creative services: Exports, by economic group, 2005
Source: UNCTAD.
Developed economies
Developing economies
Economies in transition
82%
11%
7%

royalties are, therefore, not included in the total of creativeservices. The purpose is to avoid any misinterpretations ofoverall revenues from creative services.
Another consideration in the analysis of the eco-nomic impact of creative industries is the direct relation-ship between the trade figures for the creative industriesand trends in domestic and foreign investments in the cre-ative sector. In this regard, the UNCTAD World InvestmentReport 2006 emphasizes that creative activity-related ICTsectors were the most important destinations for FDIworldwide, including in the context of North-South andSouth-South trade.
Revenues associated with receipts of intellectual prop-erty rights (IPR) more than doubled during the period from1996 to 2005. Royalty revenues rose from $58.2 billion to$123.8 billion. A similar trend is shown for imports, whichincreased from $56.1 billion in 1996 to $134.5 billion in2005 (see tables 2.8.A and 2.8.B in the annex).
5.6.10 Related industries
There is no single definition of “creative industries”but there are different approaches to classifying them depend-ing on the purpose of the analysis, as discussed in chapter 1.For WIPO,43 for instance, the focus is on intellectual property; thus creative industries are divided into four groupsrelating to intellectual property: “core”, “interdependent”,“partial” and “non-dedicated”. For UNESCO, emphasis isplaced on the cultural products, which are classified as “core”or “related” cultural products. In the case of UNCTAD, theapproach is more trade-oriented, and the focus is on creativegoods and creative services. Therefore, the related industriesare treated apart, as an additional economic indicator that isdriven by the creative industries.
There are two types of related industries: some serveas inputs in the creation process (e.g., ink for a painting);others provide supporting equipment needed for the con-sumption or distribution of creative content (e.g., televisionsets for television broadcasting). As they are part of a muchbroader set of manufacturing, chemical and electronics sec-tors, they are not included in the totals of creative industries.Our concern is to avoid distortion and over-accounting in thetrend analysis of creative goods and services.
Following the path of the world market for creativeindustries, trade in goods from the related industries44 alsoshowed a remarkable annual growth rate of 13.6 per cent inthe period 2000-2005. The greatest growth was in relatedindustries linked to the field of audiovisuals, for whichexports jumped from $118.6 billion in 1996 to $418.1 bil-lion in 2005, reflecting technological advances (see tables3.3.1.A and 3.3.1.B in the annex).
Goods of the related industries have a huge market.World exports reached $576 billion in 2005 as compared to$209 billion in 1996 (see chart 5.25). The spectaculargrowth of exports from developing economies in this area –from $51 billion in 1996 to $273.9 billion in 2005 – isnoteworthy. This means that developing economies sharedthis big market with the developed economies on almost a50-50 basis. Moreover, the fast growth of exports fromdeveloping economies of goods of related industries wasmuch more evenly distributed among all regions, includingAfrica and the Caribbean (see tables 3.1, 3.2 A and 3.2.B inthe annex for the trade flows).
136 C R E AT I V E E C O N O M Y R E P O R T 2 0 0 8
Inte
rnati
onal
trade i
n c
reati
ve g
oods
and s
erv
ices:
G
lobal
trends
and f
eatu
res
5
Table 5.27Royalties and licence fees: World exports and imports, 1996, 2000 and 2005
ExportsImports
Source: UNCTAD.
1996
58,21556,165
2000
78,58382,159
2005
123,842134,548
Chart 5.24Royalties and licence fees: World exports and imports, 1996, 2000 and 2005
Exports
Imports
1996 2000 2005
Source: UNCTAD
0
20
40
60
80
100
120
140
(Bill
ion U
S $
)
43The WIPO model of copyright-based creative industries identifies four categories: “core”, “interdependent”, “partial” and “non-dedicated” industries. The UNESCO approach tocultural industries includes “core cultural goods”, “related cultural services” and “related cultural products”.
44See also the general explanatory notes in the annex.
Value(in millions of $)
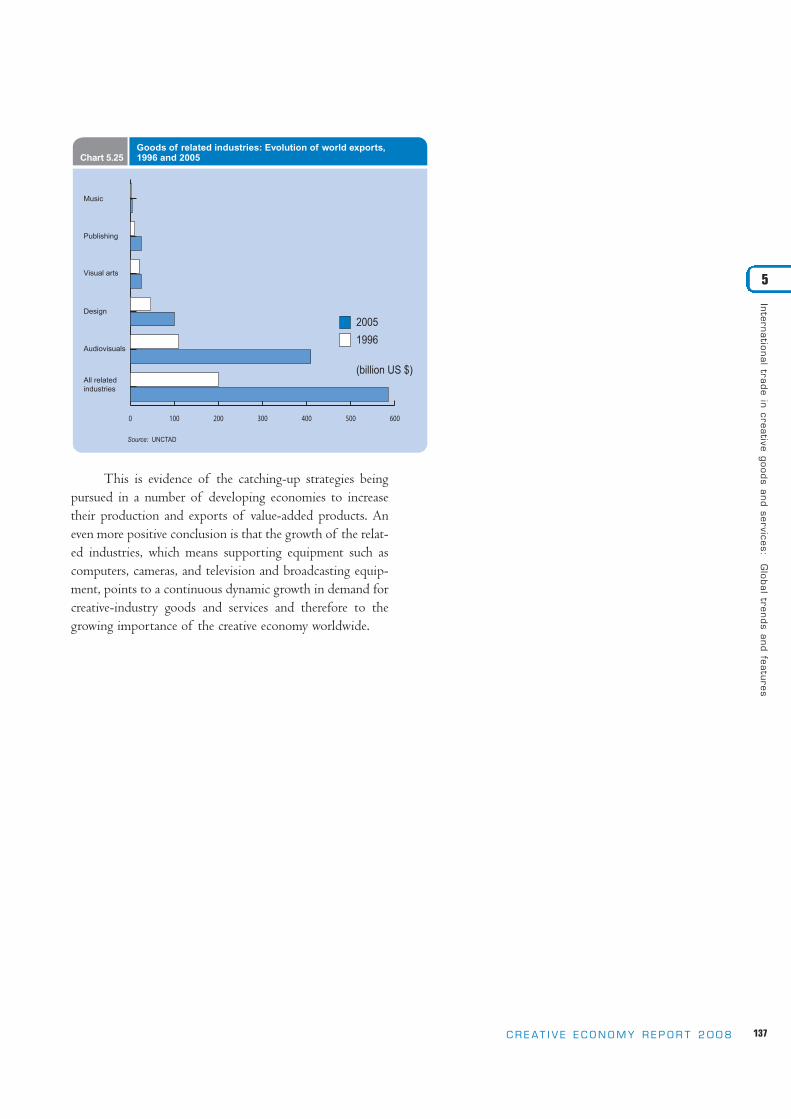
This is evidence of the catching-up strategies beingpursued in a number of developing economies to increasetheir production and exports of value-added products. Aneven more positive conclusion is that the growth of the relat-ed industries, which means supporting equipment such ascomputers, cameras, and television and broadcasting equip-ment, points to a continuous dynamic growth in demand forcreative-industry goods and services and therefore to thegrowing importance of the creative economy worldwide.
137C R E AT I V E E C O N O M Y R E P O R T 2 0 0 8
Inte
rnatio
nal tra
de in
cre
ative
goods a
nd se
rvices: G
lobal tre
nds a
nd fe
atu
res
5
Audiovisuals
Design
Visual arts
Publishing
Music
All related
industries
Chart 5.25Goods of related industries: Evolution of world exports, 1996 and 2005
Source: UNCTAD
2005
1996
(billion US $)
0 100 200 300 400 500 600

138 C R E AT I V E E C O N O M Y R E P O R T 2 0 0 8

The Role of Intellectual Property and Technology 4
PART

140 C R E AT I V E E C O N O M Y R E P O R T 2 0 0 8

Any survey of the creative economy must considerthe role of intellectual property, which has fast become aningredient for the development of the creative industries inall countries. Intellectual property law is a major policytool and part of the regulatory environment suitable forthe establishment and expansion of creative businesses,which are sources of wealth for developed and developingcountries alike.
This chapter is concerned with intellectual propertyrights (IPRs) and the creative economy. It will be clearfrom this chapter that this field presents difficult chal-lenges to governments, artists and creators as well as toanalysts and agencies. Thus, there are sensitive areas anddifferent approaches to addressing IPR issues. The contentand analysis presented in this chapter reflect the ongoingwork and contributions of the WIPO secretariat.Nevertheless, as this study is a joint endeavour of fiveUnited Nations agencies, other perspectives have also beenintroduced with a view to advancing reflection on alternativeways to tackle contending IPR issues, taking due account ofthe perspective of developing countries.
Put simply, common practice has been to measureand regulate the physical movement of goods; this is whattrade flows are. Increasingly, other dimensions of productsand ideas have also been traded in the form of licences,royalties and copyrights. This trade reflects a licence to userather than own an object.
This notion of “intellectual rights” has a long his-tory and an established regulatory system. In the past whensuch rights were embedded, locked into or in some wayintegral to the physical good, rights could be regulated asan adjunct to physical trade. Where it could not, specialprocedures were put in place: a licence to extract oil, a taxon volume of a material extracted, etc. However, with dig-itization, it is possible to totally separate the physical and
intellectual rights, and this has created a crisis with respectto both regulation and business models (see chapter 7).
The aim of this chapter is to analyse how IPRs areparticularly important to the creative economy and the waysin which current modes of regulation and measurement donot yet appear sufficient to allow a proper overview of theireconomic impact on the trade balance of individual coun-tries. Of course, the creative industries are not alone in thisproblem. For some time, most economists have sought tomeasure the trade in “invisibles”, but in general terms, thesemeasures are better adapted to the first generation of theknowledge economy, associated with a trade in licencesassociated with physical goods. Arguably, we might beentering the creative-economy era associated with virtualgoods and rights. Accordingly, the tools currently used forcapturing income flows generated by the creative industriesand translated into copyrights are partial or inadequate, andnew ones need to be devised. In part, chapter 5 offers apragmatic way forward that marries the trade in tangiblegoods and intangible services, but a key component – inter-national flows of copyrights – is missing in order to be ableto present the real picture of the creative economy.
This chapter also reviews recent attempts made byWIPO to map the copyright-related industries in selectedcountries in order to identify broader economic, social andcultural indicators, in particular the share of creative sec-tors in national economies. However, little progress hasbeen made in capturing international flows of copyrightsand measuring the trade balance of countries in intellectu-al property. There is a significant challenge to be faced inmeasuring and understanding this important new flow ofgoods and services circulating in the creative economy, andit is not only statisticians and policy-makers who are inter-ested in this issue. One of the challenges presented by thenew forms of property rights and means of trading them
141C R E AT I V E E C O N O M Y R E P O R T 2 0 0 8
The ro
le o
f inte
llectu
al p
roperty in
the c
reative
econom
y
6
CH
AP
TER
6The role of intellectual property in the creative economy
6.1 Introduction

142 C R E AT I V E E C O N O M Y R E P O R T 2 0 0 8
is to existing business models. Entirely new business formsare emerging as new entities or entirely restructured existingindustries. Thus the insight provided by these new data willbe of use to those hoping to enter, as well as to those alreadyparticipating in, the creative economy. Clearly, the data willalso help to develop understanding on the part of policy-makers and regulators. This is discussed in more detail inchapters 5 and 7.
A number of international and United Nations organ-izations deal with intellectual property issues. Most notably,the World Intellectual Property Organization (WIPO), aspecialized agency of the United Nations, is mandated todevelop a balanced and accessible international intellectualproperty system throughout the world through cooperationamong States and in collaboration with other internationalorganizations. An important part of the mission of WIPOis the promotion of the creation, dissemination, use and
protection of works of the human mind for economic, cultural and social progress. The efforts of WIPO areinscribed in its mandate to create better conditions andopportunities for international trade, development andgrowth in the creative economy.
UNCTAD is implementing a transfer of technologyand IPR work programme and pays particular attention tothe interface among international policies in the area oftechnology transfer, intellectual property and investment.Through its research activities on information technologyfor development, UNCTAD has on several occasionsaddressed open-source and open-access issues. The WTOAgreement on Trade-Related Aspects of IntellectualProperty Rights (TRIPS) indicates minimum standards formany forms of intellectual property regulation and introduces intellectual property issues into the internationaltrading system.
Intellectual property regimes are the legal rights thatresult from intellectual activity in the industrial, scientific,literary and artistic fields. They aim at safeguarding creatorsand other producers of intellectual goods and services bygranting them certain time-limited rights to control the usemade of those productions. These rights do not apply to thephysical object in which the creation may be embodied butinstead to the intellectual creation as such. IPRs can take theform of copyrights or geographical indications and appella-tions of origin, topics that will be elaborated later, but IPRscan also be applied as follows:
■ Patent: an exclusive right granted for an invention that hasan element of novelty and utility. In a practical sense, theexistence of the patent system constitutes an importantincentive to inventive, innovative and creative activity.Patent rights run for a limited length of time, generally upto 20 years, as long as the maintenance fees are paid;
■ Industrial design: the appearance or aesthetic aspect of thewhole or part of a product that may consist, in particular,of the lines, contours, colours, patterns, shape, surface,texture of materials of the product itself. To be protected,a design must appeal to the eye. Industrial designs are
applied to products of industry and handicraft, such asjewellery, architectural structures or textile designs. Theowner is assured an exclusive right against unauthorizedcopying or imitation usually up to a maximum of 15 to25 years;
■ Trademark: may be one or a combination of words, lettersand numerals. It may consist of drawings, symbols, three-dimensional signs such as the shape and packaging ofgoods, music or vocal sounds, fragrances, or colours usedas distinguishing features. A trademark ensures the exclu-sive right to use it to identify goods or services, or toauthorize another to use it in return for payment.Trademarks must be distinctive, but nowadays almostanything can be a trademark.
The aim of the intellectual property system is toencourage the creative activity of local artists and businessesand supports the transformation of this activity into prod-ucts that reach the market, both local and global. Supportingdomestic creators and entrepreneurs engaged in the creation,production, marketing, broadcast or distribution of creativeworks is a key step on the way to cultural vitality and eco-nomic prosperity. The role of intellectual property is
The r
ole
of
inte
llectu
al
pro
pert
y in
the c
reati
ve e
conom
y
6
1 Preamble to the Convention on the Protection and Promotion of the Diversity of Cultural Expressions, 2005, available online at http://portal.unesco.org/en/ev.php-URL_ID=31038&URL_DO=DO_TOPIC&URL_SECTION=201.html#AUTHORITATIVE
6.2 What are intellectual property rights?
6.3 Intellectual property and the creative industries
affirmed not only in international property conventions butalso in key instruments in other policy areas, such as theConvention on the Protection and Promotion of the
Diversity of Cultural Expressions, which recognizes “theimportance of intellectual property rights in sustainingthose involved in cultural creativity”.1
There are different approaches to identifying whichare the creative industries, depending on the criteria chosen.The WIPO perspective stresses the relationship between cre-ativity and intellectual property protection, most notablycopyright.
Creative industries are involved directly or indirectly inthe commercial exploitation of intellectual property-basedgoods and services, i.e., mainly cultural, information and enter-tainment goods. Intangible capital and intellectual propertyprotection play a fundamental role in these industries.
From the WIPO perspective, the creative industriesmay be divided into four groups according to the degree ofuse of copyright material.2 The most important are “coreindustries”, which are generally regarded as synonymous withcopyright industries. The core is made up of industries thatproduce and distribute works that are protectable undercopyright or related rights: film and video, music, perform-ing arts, publishing, software and database, television and
radio, advertising, copyright collecting societies, and visualand graphic art, including photography. The core industriesare wholly engaged in the creation, production and manufac-turing, performance, broadcast, communication and exhibi-tion, or distribution and sales of protected works.
A second group, the “interdependent industries”,comprises those industries that are engaged in the produc-tion, manufacture and sale of equipment whose function isto facilitate the creation, production or use of works andother protected subject matter. The interdependent indus-tries comprise such economic activities as manufacture,wholesale and retail of television sets, radios, CD players,DVD players, electronic games equipment, computers, musi-cal instruments, blank recording material, paper, photo-copiers, and photographic and cinematographic instruments.A further group, the “partial industries”, includes those inwhich a portion of the activities is related to works and otherprotected subject matter. They comprise architecture,
143C R E AT I V E E C O N O M Y R E P O R T 2 0 0 8
The ro
le o
f inte
llectu
al p
roperty in
the c
reative
econom
y
6
2 See WIPO, Guide on Surveying the Economic Contribution of the Copyright-Based Industries, Geneva, 2003. See chapter 1 for the comparison of the models used in the WIPO report.
Box 6.1 Design as a key ingredient for growth
In his youth, Ingvar Kamprad began buying and selling a variety of items and reinvesting the profits. While he was still a teenager, he founded what wouldeventually become the multi-billion-dollar interior design company, IKEA, which has 104,000 employees worldwide. In 1947, his introduction of furnitureinto the company product line met with such success that in 1951, he dropped all other product lines and focused on furniture. The design processalways starts with the price tag. Kamprad’s vision “to create a better everyday life for the many people” has guided the company, spurring creativity byforcing it to always strive towards new, ground-breaking design solutions. The aim is to produce well-designed yet functional products accessible to asmany people as possible while encouraging innovation.
The company also has a long history of working with talented, internationally recognized designers. In the 1960s, for example, it was helped by famousdesigner, Taipo Wirkkala, a recognized glass artist whose works can be viewed at the Metropolitan Museum of Art in New York. The tradition of these col-laborations has continued to give customers the chance to decorate their homes with something a little more special. At the same time, it helps artiststo reach a wider audience through the remarkable influence and large target group of the company. The encouragement of design innovation has notonly proved successful in terms of economic revenues but it has led to widespread recognition through several design awards, such as the ExcellentSwedish Design Award and the internationally prestigious “red dot for highest design quality”.
With a strong concept that is characterized by Swedish values, Scandinavian design, a healthy environment, cost-conciousness and informality, the com-pany not only helps to put Sweden on the map but it also uses its origin as an engine to reach its own goals since it is not tailor-made policy programmesthat explain the company’s success but rather, general conditions that enabled the company to grow. Professor Richard Florida, author of The Rise of theCreative Class, places Sweden at the top of his list for a global creativity index.
By Tobias Nielsén -Lena Rune, QNB Volante.

144 C R E AT I V E E C O N O M Y R E P O R T 2 0 0 8
apparel, textiles and footwear, interior design, householdgoods, china and glass, furniture, jewellery and coins, crafts,wall coverings and carpets, toys and games, and museums.The last category comprises the “non-dedicated industries”in which a portion of the activities is related to facilitatingbroadcast, communication, distribution or sales of worksand whose activities have not been included in the coreindustries. They include general wholesale and retailing, gen-eral transportation, and telephony and the Internet.
In order to fully capture the multiple effects that areproduced by copyright on the various economic activities, theWIPO approach includes all of the above-mentioned fourgroups in any comprehensive survey of the creative sector.
The creative industries encompass the narrower con-cept of the “cultural” industries, which are regarded as thosethat produce products that have culturally significant contentthat is reproduced on an industrial scale (a term often usedin relation to mass media production). The creative industriesbroaden the field of the cultural industries to add all cultur-al or artistic production, whether live or produced as an indi-vidual unit and traditionally used in relation to live perform-ances, cultural heritage and similar “high-art” activities. Theyalso include, in addition to the “cultural” industries, all thoseindustries that contribute indirectly to the production, sale,performance, distribution, etc. of protected work.
Today creative industries have firmly established them-selves as a vital component of our societies and they increas-ingly contribute to the development of national economies.Research has provided solid evidence of their growingimportance, and national decision-makers and opinion lead-ers are more and more aware of the economic importance ofthese industries. While contributing to cultural diversity andthe enhancement of social values, these industries are alsogenerating wealth, creating jobs and promoting trade.3
While the term “intellectual property right” is widelyused, as examined earlier, it should be pointed out that it isa general term for a number of rights: patents, industrialdesigns, trademarks, geographical indications and appella-tions of origin, and copyrights. It is the latter two that are ofmost relevance to the creative industries although all intellec-tual property concerns apply to the creative economy.
6.3.1 Geographical indications and appellations of origin
A geographical indication is a sign used on goods thathave a specific geographical origin (a village or town, a regionor a country) and that possess qualities or a reputation thatare due to that place of origin, including local human fac-tors, such as specific manufacturing skills and traditions. Forexample, “Switzerland” or “Swiss” is perceived as a geo-graphical indication in many countries for watches.“Bohemia Crystal” indicates that the product is made inBohemia, Czech Republic, according to the region’s artistictradition. An appellation of origin is the geographical nameof a country, region or locality used to designate a productthat originates there and that has qualities and characteristicsthat are due exclusively or essentially to the geographicalenvironment, including human factors.
The significance of geographical appellation is that ithas a linkage to the cultural milieu of production and waysof life. First, geographical appellation does recognize andhence legitimate a significance of a cultural tradition andprovide ways to protect it from misuse or simply copying.Second, it provides a means of branding products for sale aswell as places for tourists to visit. Accordingly, geographicalappellation can be important in developing economies.
Copyright is the area of intellectual property law thatprovides protection to original works of authorship, such aspaintings, sculpture, music, novels, poems, plays, architec-ture, dance, instruction manuals, technical documentationand software. Copyright laws give statutory expression to theeconomic and moral rights of creators in their creations and
the rights of the public in the access to those creations. Theyalso aim to promote, as a deliberate act of government policy, creativity and the dissemination and application of itsresults and encourage fair trading as a means by which tocontribute to economic and social development.
The r
ole
of
inte
llectu
al
pro
pert
y in
the c
reati
ve e
conom
y
6
3 For data, see National Studies on Assessing the Economic Contribution of the Copyright-Based Industries, Creative Industries Series, No.1, WIPO, 2006, and the WIPO websitehttp://www.wipo.int/ip-development/en/creative_industry/economic_contribution.html
6.4 Copyright and the creative economy

The concept of “copyright and related rights” isdefined in national legislation. The basic concepts in nation-al law are, however, largely consistent with the provisions ofinternational instruments. The most important of these isthe Bern Convention for the Protection of Literary andArtistic Works; at the time of drafting this Report, therewere 163 contracting parties to the Convention.4
The economic necessity for copyright legislation aris-es from the need to provide an incentive and a reward for thecommercial production and dissemination of creative works.Copyright supports creativity by giving individuals – and thecreative industries in which they are involved – strong incen-tives to invest time, efforts and money in creating, producingand distributing works. Copyright assures the ownership ofa tradable right that can be used to secure a financial returnon their investment.5 Certain legal philosophies view copy-right law as originating from the ever-increasing need ofsociety to consume products of creative industries and seecopyright as the tool to bring the largest number of qualityproducts to market where consumers will ultimately judgetheir merit. Others, seek the legitimacy of copyright fromrespect devoted to works of the human mind and rely on themoral principle that individuals should be rewarded for theircreative labour and contribution to cultural diversity and, ingeneral, to the welfare of society.
6.4.1 Exclusive rights
Copyright consists of a system of rights given to cre-ators in their literary and artistic works at the moment of cre-ation provided they are not under contract that specifies oth-erwise.6 These rights are tradable and may be sold to otherindividuals and firms. Creators and ultimately their heirs, orrights owners, hold the exclusive rights to use or license oth-ers to use the work on agreed terms. The holder of the copy-right of a work can prohibit or authorize, for example:
■ its reproductions in various forms, such as printed publi-cation or a CD;
■ its public performance, as in a play or musical work;
■ its broadcasting, including by radio, television or satellite;
■ its translation into other languages or its adaptation, suchas the adaptation of a novel into a screenplay.
These economic rights have a time limit, according tothe relevant WIPO treaties, of 50 years after the creator’sdeath. National law may establish longer time limits.7 Thislimit enables both creators and their heirs to benefit finan-cially for a reasonable period. Once the copyright term hasexpired, works fall into the public domain.
Copyright provides exclusivity only over the form ofexpression of an idea but not to the idea itself. The creativi-ty protected by copyright law is creativity in the choice andarrangement of words, musical notes, colours, shapes and soon. For example, it is the way in which an artisan has cre-atively executed the idea of creating a tea set or the way aphotographer has taken a picture of a specific subject that iscopyrightable, not the idea itself. Copyright law protects theowner of rights in artistic works against those who “copy”,i.e., those who take and use the form in which the originalwork was expressed by the author. Ideas, processes, proce-dures, methods of operation and facts by themselves may befreely taken and applied or used, subject, of course, to othertypes of limitations.
6.4.2 Moral rights
Copyright protection also includes moral rights, whichinvolve the right to claim authorship of a work and the rightto oppose changes to it that could harm the creator’s reputa-tion. Moral rights correspond to the interests of creators inbeing identified as the originators of a particular work, andthe ability to control the conditions that surround its dis-
145C R E AT I V E E C O N O M Y R E P O R T 2 0 0 8
The ro
le o
f inte
llectu
al p
roperty in
the c
reative
econom
y
6
4 According to the Bern Convention, literary and artistic works are protected without any formalities in all the contracting parties. If a creator is a national or resident of a countryparty to that Convention (or a member of the WTO), or has published the work initially in one of the member countries, his/her copyright will be automatically protected in all theother countries that are party to the Convention. Other major legal instruments include the International Convention for the Protection of Performers, Producers of Phonogramsand Broadcasting Organizations (commonly known as the Rome Convention, at drafting time, there were 86 parties to the Convention), the Agreement on Trade-Related Aspects ofIntellectual Property Rights (commonly known as the TRIPS Agreement, at drafting time, there were 151 WTO members, all of which are parties to the TRIPS Agreement), andthe WIPO Copyright Treaty (WCT) of 1996 and the WIPO Performances and Phonograms Treaty (WPPT) of 1996 (at drafting time, there were 64 contracting parties to theWCT and 62 to the WPPT).
5 For a thorough analysis of the economics of copyright, see William Landes and Richard Posner, “An Economic Analysis of Copyright Law”, The Journal of Legal Studies, Vol. 18, No. 2(June 1989), pp. 325, 325-333, 344-353.
6 If a creative product is produced under a “work [made] for hire” contract – which is common in the music and publishing industries – the contractor or employer is considered thelegal author. In this case, the creator of the work may or may not be publicly credited for the work (attribution) and this has no effect on the ownership status. For example, newsjournals may attribute news articles as written by their staff but will retain the ownership and, from a copyright perspective, the authorship of the articles. In such cases, even thoughthe commercial component of the copyright is detached from the real creators, countries that are signatories of the Bern Convention recognize certain non-commercial moral rightsthat are inalienable under work-for-hire contracts.
7 For example, in India, the term is 60 years after the creator’s death; in countries of the European Union and in the United States, 70 years; and in Mexico, 100 years. Copyright lawsof a wide range of countries can be consulted from the Collection of Laws for Electronic Access (CLEA) database of WIPO at http://www.wipo.int/clea/en/index.jsp

146 C R E AT I V E E C O N O M Y R E P O R T 2 0 0 8
semination, be it from the very decision to go public to thesafekeeping of authenticity, thus addressing both economicand cultural dimensions. Moral rights are inalienable fromthe authors and cannot be transferred to third parties undercommercial contracts.8
6.4.3 Related rights
Many creative works protected by copyright requiremass distribution, communication and financial investmentfor their dissemination (for example, publications, soundrecordings and films); hence, creators often sell or license thecopyrights to their works to individuals or companies bestable to market the works in return for payment. These pay-ments are often made dependent on the actual use of thework and are then referred to as “royalties”.
In principle, works of the mind are created in order tobe disseminated to a wider audience. This generally cannotbe done by an author alone, for it requires financial invest-ment by intermediaries that have the necessary productionand reproduction infrastructure, access to retailers and dis-tribution networks and professional competencies – such as
management, marketing and public relations – that theauthor may not possess. A play needs to be represented onstage; a song needs to be performed by artists, reproduced inthe form of CDs or broadcast by means of radio facilities.All persons who make use of literary, artistic or scientificworks in order to make them publicly accessible to othersrequire their own protection against the unauthorized use oftheir contributions in the process of communicating thework to the public.
In light of the above, the field of rights related tocopyright has rapidly developed over the last fifty years.These related rights grew up around copyrighted works andprovide similar rights although often more limited and ofshorter duration. In the WIPO perspective, they provideprotection to those who assist intellectual creators to com-municate their message and to disseminate their works to thepublic at large
Recent technological developments have dramaticallytransformed the way in which related rights operate. Withregard to the rights of performers, the performance of actorsor musicians, which a century ago ended with the play orconcert in which they performed, may now be fixed on a
The r
ole
of
inte
llectu
al
pro
pert
y in
the c
reati
ve e
conom
y
6
8 While the Bern Convention is “moral rights” friendly, the United States does not recognize it.
Box 6.2 The Da Vinci Code case
A copyright infringement case was brought against the publishers of The Da Vinci Code by Michael Baigent and Richard Leigh, two of the authors of a1982 non-fiction work, The Holy Blood and The Holy Grail. According to an article in the June 2006 issue of WIPO Magazine, “At the centre of the dis-pute was a ‘hypothesis’ presented in The Holy Blood and The Holy Grail” according to which “references to the Grail in early manuscripts were disguisedreferences not to the chalice, but rather to holy blood or Sang real, i.e. to the bloodline of Jesus Christ, and to the belief that this bloodline … had con-tinued and merged with the French Merovingian dynasty”.
The plaintiffs “claimed copyright in the literary work and alleged that Dan Brown”, author of The Da Vinci Code, “had copied the way in which they hadmade the sequence of connections of the facts of the merging of the bloodlines. Since there was little copying of the actual text of The Holy Blood andThe Holy Grail, the claim was that there had been non-literal copying of a substantial part of their literary work”.
The Holy Blood and The Holy Grail “is comprised largely of historical facts which are unprotectable ideas. Baigent and Leigh based their case, therefore,on the claim that Brown had taken a substantial part of the ‘manner’ in which they had expressed those ideas, as opposed to taking the ideas themselves”.
“The court held that, while the evidence was clear that Dan Brown and his primary researcher (his wife) had drawn on The Holy Blood and The Holy Grailto a greater extent than Brown had acknowledged, this did not mean that he had infringed copyright in the book. Rather, they had used The Holy Bloodand The Holy Grail, and other books, to provide general background material for the writing of The Da Vinci Code”.
“The significance of the case for copyright law relates to the fact that the lawyers acting for Baigent and Leigh attempted to make – and lost – an argu-ment that there can be non-literal copying of a work of literature. The non-literal argument has previously been successfully used, usually in the case ofcomputer programs or recipes or knitting patterns.”
Source: Dr. Uma Suthersanen, “Copyright in the Courts: The Da Vinci Code”, WIPO Magazine, June 2006, available at:
http://www.wipo.int/wipo_magazine/en/2006/03/article_0004.html. See Michael Baigent and Richard Leigh v. The Random House Group Limited Neutral Citation
Number: [2006] EWHC 719 (Ch), available at: http://www.binarylaw.co.uk/2006/04/smithy_code.htm.

variety of mechanisms, including radio, television, satellitetransmission and the Internet. What earlier was a localizedand immediate phase of a performance in a hall before a lim-ited audience became an increasingly permanent manifesta-tion capable of unlimited and repeated reproduction and usebefore an equally unlimited audience that went beyondnational borders. The development of broadcasting and tel-evision had similar effects.
Likewise, the increasing technological development ofphonograms, mainly through the rapid proliferation of digi-tal and Internet-based media, has resulted in producers ofphonograms and broadcasting organizations calling for betterand greater protection for their produced content as well asagainst retransmission of their own programmes by othersimilar organizations. In response, there have been suggestionsby both media industry insiders as well as consumer protec-tion groups that the current business model of the recording,film and broadcast industries, which requires ever greater con-tent control and legal remedy, is out of step with the realitiesof the nature and usage of Internet and digital technologies.
6.4.4 Exceptions and limitations to copyright
Developing countries need to have access to productsof creative industries as they seek to bring education to all,facilitate research, improve competitiveness, protect their cul-tural expressions and reduce poverty. There are twoapproaches to this problem. The first is to encourage access:certain acts normally restricted by copyright may, in circum-stances specified in the law, be carried out without theauthorization of the copyright owner, for the benefit of soci-ety. The second is that developing economies need to raiseawareness of the existence and potential of content that,while not in the public domain, is copyrighted but madeavailable under alternative and often less restrictive licencessuch as those proposed by the Creative Commons projectand the free and open-source technology communities.
Concerning the first proposition, exceptions and limi-tations embedded in the traditional copyright system arepart of the delicate balancing process between the needs ofcreators and creative businesses, and the interest of theirusers, society and the public in access to information andknowledge. The challenge is to achieve the right balance
between the incentive to copyright owners to commercializethe product and the copyright-based restrictions placed onthe use of protected works.
There are two basic types of limitations: free uses andnon-voluntary licences. Free uses are acts of exploitation ofworks that may be carried out without authorization andwithout an obligation to compensate the owner of rights forthe use. For instance, under most national copyright laws, itis permissible to reproduce a work exclusively for the person-al and private use of the person who makes the reproduction,provided that this person has already acquired a user licenceby buying the media (a CD or DVD) or agreeing to termsand conditions when purchasing a content file from anonline supplier, or to make quotations from a protectedwork, provided that the source of the quotation, includingthe name of the author, is mentioned and that the extent ofthe quotation is compatible with fair practice. Exceptionsoften include permission for private non-commercial use,quotation, parody, news reporting, and certain educationaland research uses. Non-voluntary licences enable acts ofexploitation to be carried out without authorization but withthe obligation to compensate the owner of rights.
In most countries, national legislation codifies excep-tions and limitations with great specificity. It generally des-ignates a restrictive set of limitations, specific permitted usesidentified and enumerated in detailed rules. Some countries,however, particularly in the common-law tradition, recognizemore open-ended concepts of “fair use” and “fair dealing”.“Fair use” began as a judge-made exception to the rights ofcopyright owners in the United States and is applied by thecourts on a case-by-case basis, based on guiding principlescontained in the statute. By contrast, “fair dealing” is a termthat groups together a number of limitations that are spelledout in more detail in the statute rather than a general stan-dard to be applied by courts as is the case of “fair use” in theUnited States.
Concerning the second proposition on raising aware-ness about less restrictive copyright licences, there is anincreasing quantity of creative products available that areoften world-class products. The most obvious examples arethe Wikipedia project, where the content is published most-ly under some variant of Creative Commons or the GNUFree Documentation licenses9 or the GNU Linux computeroperating system which, while used in for-profit activities
147C R E AT I V E E C O N O M Y R E P O R T 2 0 0 8
The ro
le o
f inte
llectu
al p
roperty in
the c
reative
econom
y
6
9 See http://creativecommons.org/ or http://www.gnu.org/copyleft/fdl.html

Box 6.3 A collaborative approach to creativity and knowledge
148 C R E AT I V E E C O N O M Y R E P O R T 2 0 0 8
and made commercially available by the likes of IBM orNovell, is available under the GNU General Public License.10
National copyright legislation is obliged to enforce andrespect the licence conditions as declared in these and other
open or public licences, and recent cases have upheld therights of the copyright owners distributing works underalternative free and/or open licences.11
6.4.5 Enforcement of copyright
The acquisition of copyrights is of little economicvalue if these rights cannot be enforced effectively. The cred-ibility of the system depends to a considerable extent on the
enforceability of the rights it confers. Well-functioningenforcement mechanisms are the best means to limit thenumber of violations of copyrights and to ensure that rightsholders and society as a whole can reap the benefits from theintellectual property system.
The r
ole
of
inte
llectu
al
pro
pert
y in
the c
reati
ve e
conom
y
6
10 See http://www.gnu.org/copyleft/gpl.html.11 See http://gpl-violations.org/about.html.
Wikipedia is a multilingual, Web-based, free-content encyclopedia project. It is written collaboratively by volunteers from all around the world and its arti-cles can be edited by anyone with access to the Internet. The name Wikipedia is a portmanteau word combining “wiki” (a type of technology that allowsusers to update a web page using their Web browser) and “encyclopedia”. The mission of the Wikimedia Foundation, which, among other things, man-ages Wikipedia, is to empower world citizens to share in the sum of all human knowledge. This is done by engaging people worldwide to collect anddevelop educational content under a free-content licence or in the public domain and to disseminate it effectively and globally. Since its creation in 2001,Wikipedia has grown rapidly into one of the largest reference websites. According to Alexa Internet, Inc., a company providing information on Web traf-fic, it is one of the 10 most visited websites in the world.
In every article, links will guide the user to associated articles. Anyone is welcome to add information, cross references or citations as long as they doso within the Wikipedia editing policy and to an appropriate standard. The Wikipedia software, known as MediaWiki, is carefully designed to allow easyreversal of editorial mistakes.
Because Wikipedia is an ongoing work to which, in principle, anyone can contribute and articles are “living”, it differs from a printed reference source inimportant ways. In particular, older articles tend to be more comprehensive and balanced, while newer articles may still contain misinformation, contentthat is not encyclopedic in nature, or vandalism. Users need to be aware of this so as to obtain valid information and avoid misinformation that has recent-ly been added and not yet removed. Information that remains in Wikipedia needs to be sourced. As a result, most articles have several links to primarysources, which are listed at the bottom of each article. Unlike a printed reference source, Wikipedia is continually updated, with the creation or updatingof articles on topical events within minutes or hours rather than months or years for printed encyclopedias.
Wikipedia is a registered trademark of the nonprofit Wikimedia Foundation, which has created an entire family of free-content projects. On all these proj-ects, people around the world are welcome to be bold and edit articles, contributing knowledge as they see fit in a collaborative way.
Wikipedia was founded as an offshoot of Nupedia, a now-abandoned project to produce a free encyclopedia. During 2000, Jimmy Wales, founder ofNupedia, explored ways to make Nupedia a more open, complementary project. Eventually, he was introduced to the Wiki technology and Wikipedia wasborn. In 2003, Wales created the Wikimedia Foundation, a charity, essentially giving Wikipedia and its sister projects to the world. In March 2007, theword “wiki” became a newly recognized English word.
There are more than 75,000 active contributors working on some 700.000 articles in more than 253 languages. As of today, there are 2,096,561 arti-cles in the English-language version; every day, hundreds of thousands of visitors from around the world make tens of thousands of edits and createthousands of new articles to enhance the knowledge held by the Wikipedia encyclopedia.
All of the text in Wikipedia and most of the images and other content are covered by a GNU Free Documentation Licence (GFDL). Contributions remainthe property of their creators, while the GFDL licence ensures that the content is freely distributable and reproducible.
Many visitors come to the site to acquire knowledge, others to share knowledge. In fact, at this very instant, dozens of articles are being improved andnew articles are being created. You can view changes as they happen. You can also view random articles. Over 1,708 articles have been designated bythe Wikipedia community as “featured articles”, exemplifying the best articles in Wikipedia. Another 2,500 articles are designated as “good articles”.Wikipedia also has portals, which organize content according to topic areas.
By Sandy Ordonez, Wikimedia. Website: http://www.wikipedia.org/

When we consider the protection and enforcement ofcopyright and related rights, piracy appears as one of thecentral issues. All kinds of works are at risk. Music, books,videos, DVDs and even craft design are copied illegally.WIPO argues that in developing economies, as a result ofthe flooding of markets with cheap “copyright-free” foreignproducts, domestic creators and producers lose their compet-itiveness, which in turn endangers cultural diversity and
national identity. Piracy is a huge challenge in many countries,and the argument is that countries where piracy is rampantmay forego opportunities for growth and development onseveral levels, both tangible and intangible, since it destabilizesthe local creative industries and undermines the efforts ofcreative entrepreneurs and businesses. Inadequate enforce-ment of copyright limits incentives to develop creative prod-ucts, especially for small and medium-sized enterprises.
A keen interest in the measurement of the contribu-tion of the creative industries to national economies was inrecent years fueled by the identification of creativity as apotential driver in the creative economy. Many studies wereundertaken to evaluate and compare size, performance andcompetitiveness of the creative industries as well as to mon-itor trends and provide policy options based on solid quan-tifiable evidence. These studies were based on a variety ofapproaches, motivated by equally diverse policy objectives:social, economic or cultural. Difficulties emerged along the
way, especially with regard to the capture of the non-eco-nomic returns of creativity. Clearly, a more transparent linkto statistical reporting was needed to identify the multipleeffects produced by the creative sector on society.
Developed by WIPO and a team of internationalexperts in 2003, the WIPO Guide on Surveying the EconomicContribution of the Copyright-Based Industries outlined a method-ology in economic terms. It provided the basis for undertak-ing a comparative analysis of the size of the creative sectorin various countries that is built on reliable data and
Copyrighted works, like other intangible goods, sufferfrom what economists call the public goods problem: theyare non-rivalrous and non-excludable goods. This means thattheir use by one person does not reduce their usefulness forother persons; thus an unlimited number of people may con-sume the work without using it up. In addition, while thecost of creating copyright goods is often high, the cost ofreproducing them is low. This leads to an economic disincen-tive to commercialize new works.
The limited monopoly granted by copyright laws pro-vides copyright owners with the legal entitlement to excludeothers from enjoying the copyrighted work. In the case oftraditional copyright where the terms and conditions are notspecified beyond the designation “Copyright [date]”, “©”or eventually “All rights reserved”, anyone else who wants touse the work needs to seek permission from the owner. Yetwhile these rights may be exclusive, they are not absolute andcertain national IPR legislations provide limitations andexceptions to help to keep the copyright system balanced toavoid the costs of an overly extensive set of rights. These are
so-called “fair-use” rights and will indicate a permissibledegree of copying, in part or in full, within the family orhousehold circle, for creating backups, in the production ofcomic and satirical material, and for the purpose of studyand academic research. Creative Commons licences refers toa set of liberal copyright licences, often referred to as “copy-left”, that instruct the users of the work as to which condi-tions (none, some, any/all) govern copying, attribution andthe creation of derivative works based on the original.
The overextension of traditional copyright restrictionsis also kept in balance by market competition. If the originalcreator charges a sufficiently high price, other creators mayfind an incentive in investing to produce a comparable alter-native. The availability of such substitute goods for mostworks reduces market share and lessens the potential restric-tive impact of monopoly situations. Wherever monopolisticor anti-competitive practices are detected, there is a role forcompetition policy, which should be perceived as comple-mentary to the copyright system and an important counter-balance to the exclusive rights that it provides.
149C R E AT I V E E C O N O M Y R E P O R T 2 0 0 8
The ro
le o
f inte
llectu
al p
roperty in
the c
reative
econom
y
66.5 The economics of copyright
6.6 Contribution of the creative industries to the economy

150 C R E AT I V E E C O N O M Y R E P O R T 2 0 0 8
common methodologies. The Guide summarized the existingexperience and developed a step-by-step methodology toundertake measurement surveys. Based on a perspective onintellectual property and copyright, it presented new defini-tions of the copyright-based industries following the extent ofuse of copyright material (see also chapter 1).
Since its publication, a number of countries have usedthe Guide to, among other things, position the industries inthe national economy and draw international and cross-sectoral comparisons. The contribution of the creative
industries to the national economy in terms of value added,GDP, generation of employment and trade provides solidevidence of the importance of this sector. According to theWIPO methodology, the creative industries of the UnitedStates grew at the rate of 7.66 per cent in 2005 (comparedto 3.48 per cent for the national economy), and at 8.9 percent in Singapore in 2001 (compared to 3.48 per cent forthe national economy). In 2005, the value added generatedby the core copyright-based industries in Bulgaria grew by 53per cent in comparison to the level in 2003.
As shown in chart 6.2, most of the creative economicactivities are taking place within the core copyright-basedindustries group, followed by the interdependent group. Thecontribution to employment is also substantial, and theemployment growth in the creative industries is often muchstronger than in the overall economy. In Singapore in 2001,the employment growth rate in the creative industries was5.2 per cent compared to 3.5 per cent in the economy as awhole. In Bulgaria from 2003 to 2005, employment in thecore copyright-based industries grew by 12 per cent com-pared to 4 per cent in the economy as a whole.13 In Canada,employment grew by 3.1 per cent in the core copyright-based industries from 2002 to 2003 compared to 2.3 percent in the economy as a whole. The dynamics in the creativeindustries as an employment generator are indicative of thedevelopment potential of this sector in social terms. In somecountries, such as Mexico and the Philippines, the creativeindustries employed more people than many of the tradi-tional sectors of the economy.
In 2006, WIPO published National Studies on Assessing theEconomic Contribution of the Copyright-Based Industries, which pre-sented the results of the first national studies carried out onthe basis of the methodology in the WIPO Guide on Surveyingthe Economic Contribution of the Copyright-Based Industries. Since theNational Studies began to be published, there has been agrowing interest in continuing this research and, to date, over24 surveys have been carried out. The practical experiencederived from using the Guide is employed to adjust its appli-cation to specific country situations. It also opens the doorfor policy interventions by providing robust data that arecomparable across countries and sectors.
The r
ole
of
inte
llectu
al
pro
pert
y in
the c
reati
ve e
conom
y
6
Table 6.1Some results of the surveys based on the WIPO Guide 12
Country
United StatesSingaporeCanadaLatviaHungaryPhilippinesRussian FederationMexicoCroatiaLebanonJamaicaBulgaria
Source: WIPO.
Creative industriescontribution to GDP (%)
11.125.704.504.006.674.926.064.774.424.755.103.42
Creative industries% of employment
8.495.805.554.507.10
11.107.30
11.014.234.493.034.31
Chart 6.1 Contribution of the creative industries to GDP
0
2
4
6
8
10
12%
of G
DP
Hungry Philippines Bulgaria MexicoSingapore RussianFederation
LatviaCanadaUSA
11.12
5.7
4.54
6.67
4.92
3.42
4.77
6.06
4.754.42
5.1
Lebanon Croatia Jamaica
Chart 6.2Contribution of groups of copyright-based industries to total of creative industries
16.9%
7.5%
22.2%
53.3%
Core
Partial
Non-dedicated
Interdependent
12Figures taken from National Studies on Assessing the Economic Contribution of the Copyright-Based Industries (WIPO, 2006) and research currently being conducted at WIPO. See WIPO copyright model in table 1.1.
13Ibid.

Chart 6.3 Contribution of the creative industries to national employment%
of n
atio
na
l e
mp
loym
en
t
Hungry Philippines Bulgaria MexicoSingapore RussianFederation
LatviaCanadaUSA
8.49
5.8 5.55
4.5
7.1
11.1
4.31
11.01
7.3
4.49
6.01
3.03
Lebanon Croatia Jamaica 0
2
4
6
8
10
12
Traditional music, designs, performances, symbols andother creative expressions of traditional cultures communi-cate beliefs and values, embody skills and know how, reflectthe history of a community and define its cultural identity.These traditional cultural expressions are valuable culturalassets of the indigenous and local communities who main-tain, practice and develop them.
Traditional cultural expressions can also be economicassets: they are creations and innovations that can, if so desired,be traded or licensed for income generation and economicdevelopment. They may also serve as an inspiration to othercreators and innovators, who can adapt the traditional expres-sions and derive new creations and innovations from them.
Traditional cultural expressions and other elements ofintangible cultural heritage are therefore a mainspring of cre-ativity as they are in a permanent cumulative process ofadaptation and re-creation.
Unfortunately, too often cultural products deeplyrooted in the cultural heritage of developing countries havecrossed borders and established significant market niches inindustrialized countries, not adequately benefiting the coun-tries of origin. Developing countries should respond by lever-aging their rich cultural heritage and creating and trading in
new, distinctive and locally rooted cultural goods and services.Developing countries should put in place strategies and actionplans to encourage and reward creativity by their own nation-als, drawing from their traditional cultures and heritage.
Traditional cultural expressions are also cultural assets,however, and cultural heritage is not only there to be lever-aged as an economic resource. In this socially, culturally andtechnologically connected world, it is increasingly recognizedthat culture is not a mere commodity and that heritage assuch is worthy of safeguarding and protection. In this case,intellectual property tools can also play a role through valuesembedded in the intellectual property system that preventmisappropriation and misuse of creativity, including tradi-tional creativity. The relationship between intellectual prop-erty and traditional cultural expressions, and the cognate areaof “traditional knowledge”, raises complex legal, cultural,political and conceptual issues, however.14
The conventional intellectual property system hasbeen identified by some as not only inadequate to compre-hensively and appropriately protect traditional culturalexpressions but also as positively harmful in at least twodirections. First, intellectual property rules exclude manytraditional cultural expressions from protection, consigning
151C R E AT I V E E C O N O M Y R E P O R T 2 0 0 8
The ro
le o
f inte
llectu
al p
roperty in
the c
reative
econom
y
6
6.7 Copyright, the creative industries and traditional cultural expressions

152 C R E AT I V E E C O N O M Y R E P O R T 2 0 0 8
them to an unprotected “public domain”. Second, follow-oninnovations and creations derived from traditional culturalexpressions receive protection as “new” intellectual property,giving the holders of the IPRs the exclusive right to deter-mine the conditions under which third parties (including thetraditional cultural expression-holding communities them-selves) may use and benefit from the intellectual property. Asa result, many call for new, sui generis (“special”) systems toprotect traditional cultural expressions, and several countrieshave already put in place national sui generis laws and meas-ures, such as Ghana, New Zealand, Panama and Peru, toname only a few.
The relationship between intellectual property andtraditional cultural expressions is also more nuanced andcomplex, however. For example, contemporary expressions oftraditional cultures are protected by conventional copyright15
and performances of traditional cultural expressions are alsoprotected internationally.16 Certification trademarks andlabels of authenticity have also been used successfully byindigenous communities in Canada, Fiji, New Zealand,Panama and Tonga to curb the sale of fake traditional cre-ative arts. Further, some argue that the creative use by thirdparties of “public domain” traditional cultural expressionssustains creativity and revitalizes, preserves and promotes tra-ditional cultures.
While there are diverse views on these questions, thereis wide consensus that traditional cultural expressionsembody innovation and creativity and should not be misap-propriated and misused. The challenge, then, is to identifygaps in the protection offered by current systems and con-struct balanced and workable measures to fill these gaps inaccordance with the aspirations of indigenous and localcommunities and the broader public interest.
However, what precisely is a “traditional” culturalexpression? When is use of a traditional cultural expressionlegitimate cross-cultural borrowing and when is it “misap-propriation”? What are the appropriate role, contours andshape of the “public domain”? Who should benefit from theprotection of traditional cultural expressions? Since muchcreativity is derivative, are many traditional cultural expres-sions not the result of centuries-old cultural intermingling,making it difficult if not impossible to identify single com-
munity “owners”? For how long should any protection begranted? What public-policy goals are sought to be achievedthrough granting intellectual property-like protection to tra-ditional cultural expressions?
6.7.1 Indigenous communities andnew technologies
Digital technologies and computer networks – espe-cially the Internet – offer unprecedented opportunities forthe promotion, preservation, revitalization and protection ofintangible cultural heritage. Expressions of traditional cre-ativity and innovation can serve as springboards for new cul-tural expression, especially in the digital world. Digitized tra-ditional music, designs and art can reach new audiences inniche markets for distinctive, diverse and “local” culturalgoods and services and, in so doing, promote communityand rural economic and cultural development. However, thedigitization and dissemination of traditional cultural expres-sions can lead to their misappropriation and misuse. In somecases, safeguarding efforts have unwittingly led to the unau-thorized disclosure or commercial exploitation of culturallysensitive materials.
As a result, indigenous organizations, museums andarchives, and researchers (such as ethnomusicologists) havecalled for guidance on which intellectual property issues andoptions arise during recording and digitization initiatives. Inresponse, the WIPO Creative Heritage Project17 is develop-ing best practices and guidelines for managing intellectualproperty issues when recording, digitizing and disseminatingintangible cultural heritage. These best practices and guide-lines will assist communities and cultural institutions tomanage intellectual property options so as to both preservetheir cultural heritage and protect it against misappropria-tion and misuse. For example, copyright and related rightscan provide protection for performances, recordings, compi-lations and contemporary interpretations of traditional cul-tural expressions. Trademarks and other forms of protectionfor distinctive signs and indications can also be useful.
Making traditional cultural expressions publicly avail-able does not necessarily place them in the “public domain”:by creating and exercising IPRs in new digital recordings,
The r
ole
of
inte
llectu
al
pro
pert
y in
the c
reati
ve e
conom
y
6
14 See, generally, WIPO, “Consolidated Analysis of the Legal Protection of Traditional Cultural Expressions/Expressions of Folklore”, WIPO Publication No. 78515 See WIPO, “Minding Culture: Case Studies on Intellectual Property and Traditional Cultural Expressions”, WIPO, Publication No. 781, Geneva, 2003. Available at:
http://www.wipo.int/tk/en/studies/cultural/minding-culture/studies/finalstudy.pdf16 By the WIPO Performances and Phonograms Treaty, 1996.17 See http://www.wipo.int/tk/en/folklore/culturalheritage/index.html .

153C R E AT I V E E C O N O M Y R E P O R T 2 0 0 8
The ro
le o
f inte
llectu
al p
roperty in
the c
reative
econom
y
6
protection of the cultural expressions can be enhanced. Thedecision as to whether or not to use new technologies andintellectual property tools to participate in the informationeconomy is tied to the overall cultural and economic goals ofthe tradition-bearers themselves, on which only they candecide.
The WIPO Creative Heritage Project also providesassociated information-technology support for the record-
ing, digitization and dissemination of cultural materials byindigenous communities if they so decide. A proposedWIPO Creative Heritage Digital Gateway, an online portalon the WIPO website, would seek to provide samples of therecordings made by communities with WIPO assistance andfacilitate access to websites established by them. WIPO is,for example, working with an indigenous Maasai communi-ty in Laikipia, Kenya, to assist it to record, digitize and com-
Box 6.4 Jewellery: A magic marriage between tradition and contemporary design
Diamonds, emeralds, aquamarines, amethysts, topazes, tourmalines, rubies, sapphires and many more inspiring beauties. Hundreds of colourful preciousand semi-precious stones, abundant in countries such as Brazil, Ghana, India, the Lao People’s Democratic Republic and South Africa. Exported for a longtime simply as raw materials for top foreign designers. Now, however, developing countries are perceiving jewellery as a perfect match between tradi-tion and high value-added activity.
The first facet of this market comprises traditional cultural expressions, defined by WIPO as “productions consisting of characteristic elements of the tra-ditional artistic heritage developed and maintained by a community … or by individuals reflecting the traditional artistic expectations of such a commu-nity, in particular … tangible expressions, such as: …jewelry”.1 Indeed, jewels have always been intrinsic to the everyday life of traditional communi-ties. Works of art with religious and other symbolic meanings, jewels play an important role in maintaining traditions. Andean jewellery, for instance, hasits roots in pre-Hispanic times. In Africa, ornaments made of precious stones are believed to have a talismanic power. Indian jewellery is found in mosttraditional representations as sacred ornaments and takes on regional nuances.
Old gemstone markets are also a rich part of the cultural and economic life in a range of countries. A paramount example is the gem market in the heartof the old Thai city of Chantaburi, a paradise for ruby and sapphire trade since the middle of the nineteenth century and a magnet for tourists. TheGhanaian tradition in jewel-making, dating back to the fifth century BC, has been passed down through the generations to craftsmen and craftswomenusing techniques such as granulation, lost wax casting, filigree and chasing and is now evident in the local industry of over 1,000 indigenous artisansbased in cities such as Accra and Kumasi.
Over the centuries, precious stones were considered the proper ornaments for kings, queens and religious chiefs on all continents, with the power toprotect and cure their holders. The multitude of meanings of jewellery has shaped civilizations down the ages, as reported by Pliny the Elder in the lastchapter of his Natural History, written in 77AD. In describing their uses, he referred to famous artists and their creations and to Roman architectural stylesand technology.
For thousands of years, traditional jewellery remained unchanged. Recently, however, producers of precious stones are approaching the jewellery mar-ket differently, expressing traditions through contemporary design. Trade and trends at a global level have favoured fashion as a fundamental sales driv-er, and jewellery manufacturers are rushing to adjust their product designs to cater to this segment while keeping a foot in their cultural roots. In Ghana,artisans combine traditional cultural influences such as traditional Ashanti and Fanti styles with contemporary design, turning old and rare glass beadsalong with brass, horn, gold and silver pieces into wearable jewellery.
The market potential has not remained unobserved by the business world or governments. Tanishq, India's largest jewellery brand and part of the gigan-tic Tata Group, announced in 2007 the opening of its new 3,500 sq ft store in Koramangala, Bangalore. Tanishq specializes in creating contemporaryproducts inspired by India's rich heritage. The H. Stern Brazilian chain, created in the 1950s, nowadays employs 3,000 people and appears in the arti-cles and photographs of the most respected fashion magazines in the world. Its creations are strongly based on design in a dialogue with architecture,fashion, music and the arts in general. The 42,000 sq ft headquarters in Rio de Janeiro is the largest space built for jewellery production and trade inthe world. In Ghana, the industry is supported by training colleges and university courses such as the Jewellery College located at the Weija Industrialand Commercial Estates in Accra and the Metal Products Department of the Kwame Nkrumah University of Science and Technology, which graduatesskilled artisans each year. The Government of Ghana has a number of programmes to boost investment and productivity in the jewellery sector throughthe Ministry of Trade and Industry, the Ghana Export Promotion Council and the Ghana Investment Promotion Centre. These activities have resulted in asignificant rise in the domestic production and sale of jewellery in the country.1 Intellectual property and traditional cultural expressions/folklore, WIPO Booklet No. 1, p. 6. Available at:
http://www.wipo.int/freepublications/en/tk/913/wipo_pub_913.pdf .
By Ana Carla Fonseca Reis, Garimpo de Solucoes, economia, cultura & desenvolvimento and Avril Joffe, Director, CAJ: culture, arts and jobs.

154 C R E AT I V E E C O N O M Y R E P O R T 2 0 0 8
mercialize elements of its intangible cultural heritage and tomanage IPRs in accordance with the community’s overallgoals and aspirations. This Project also works directly withmuseums, archives and other cultural institutions in
developing countries to assist them to digitize and dissemi-nate their collections and manage intellectual propertyissues while doing so.
The purpose of the two 1996 WIPO treaties (theWIPO Copyright Treaty (WCT) and the WIPOPerformances and Phonograms Treaty18) was to update andsupplement the major existing WIPO treaties on copyrightand related rights primarily in order to respond to develop-ments in technology and in the marketplace. Since the Bernand Rome Conventions were adopted or last revised morethan a quarter century ago, new types of works, new marketsand new methods of use and dissemination have evolved.Among other things, both the WIPO Copyright Treaty andthe WIPO Performances and Phonograms Treaty addressthe challenges posed by today’s digital technologies, in par-ticular the dissemination of protected material over digitalnetworks such as the Internet. For this reason, they havesometimes been referred to as the “Internet treaties”.
Both treaties provide the legal rationale for copyrightowners to be adequately and effectively protected in the dig-ital environment when their works and sound recordings aredisseminated through new digital technologies and commu-nication systems. They also create new online rights. Forinstance, Article 8 of the WIPO Copyright Treaty providesa right of communication to the public, “including the mak-ing available to the public of their works in such a way thatmembers of the public may access these works from a placeand at a time individually chosen by them”. In addition,Article 6(1) of the Treaty provides an exclusive right toauthorize the making available to the public of originals andcopies of works through sale or other transfer of ownership,that is, an exclusive right of distribution. Such a right, surviv-ing at least until the first sale of copies, is a powerful tool inthe fight against piracy because it makes it possible for theofficials in charge of enforcement to seize illegal copieswhere they find them in the marketplace, in addition to hav-ing to track down the person responsible for the act ofreproduction, who often will not be the person offering thecopies for sale to the public.
To maintain a fair balance of interests between theowners of rights and the general public, the treaties furtherclarify that countries have reasonable flexibility in establish-ing exceptions or limitations to rights in the digital environ-ment. Countries may, in appropriate circumstances, grantexceptions for uses deemed to be in the public interest, suchas for non-profit educational and research purposes. Thereare some issues to be dealt with in the context of the WIPODevelopment Agenda.
According to the WIPO treaties, countries arerequired to provide not only the rights described above butalso two types of technological adjuncts to the rights. Theseare intended to ensure that right owners can effectively usetechnology to protect their rights and to license their worksonline. The first, known as the “anti-circumvention” provi-sion, tackles the problem of “hacking”: it requires countriesto provide adequate legal protection and effective remediesagainst the circumvention of technological measures (such asencryption). The second type of technological adjunct safe-guards the reliability and integrity of the online marketplaceby requiring countries to prohibit the deliberate alteration ordeletion of electronic “rights management information”,that is, information usually in the form of metadata that mayaccompany any protected digital material and that identifiesthe creator or other owner of the work, performers, rights,and the terms and conditions for its use.
From a policy perspective, “anti-circumvention” and“rights management” technologies pose an important prob-lem: content distributors are free to provide public-domaincontent in media that have “anti-circumvention” and “rightsmanagement” technologies in order to improve or enhancerevenue streams. However, if the underlying content is publicdomain, hacking these technologies to rightfully access thecontent (in order to reuse, create derivative works, redistrib-ute, etc.) becomes a copyright offence. Thus they may be seen
The r
ole
of
inte
llectu
al
pro
pert
y in
the c
reati
ve e
conom
y
6
18A number of countries have implemented the provisions of the two treaties in their national legislation. The Collection of Laws for Electronic Access (CLEA) database of WIPOcan be consulted to search copyright laws of a wide range of countries. It is available at: http://www.wipo.int/clea/en/index.jsp
6.8 Copyrights and new technologies

as tools to reintroduce public-domain content into thedomain of proprietary copyright under traditional restrictivelicence. Such an extension does absolutely nothing for newtalent and provides no incentives to current or future creators.
Additional problems relate to the notion that “anti-circumvention” and “rights management” technologies can
be used to decrease the scope of “fair use”. Clearly, makingprivate copies for use in one’s own household, while being an“exception and limitation” to copyright as discussed in part6.4.4, becomes an unauthorized activity if the content isprotected with “anti-circumvention” and “rights manage-ment” technologies.
From the analysis of this chapter, it can be said that anefficient and fair international intellectual property system isin the interest of creators, creative industries and consumersin all countries, and the level of its implementation is oftenthe subject of discussions in free trade agreements.
IPRs are territorial, which means that they are protect-ed only in the country or region where protection has beenapplied for and obtained. Protecting intellectual property inexport markets is crucial if a creator is to enjoy the samebenefits of protection abroad as are enjoyed in the domesticmarket.
From the WIPO perspective, adherence to interna-tional instruments allows developing countries to have equalaccess to the markets of other member nations, and toensure that their local creators’ works are protected abroad.It allows the creation of a domestic creative-industry infra-structure that competes with foreign products. This helps to
establish credibility in the global community.
Intellectual property provides incentives to creatorsand entrepreneurs in the form of a tradable economic asset– a copyright – that is instrumental for investing in the devel-opment, production and distribution of goods and services,in a market economy, that are largely based on human cre-ativity. This in turn helps increase access to, and enhances theenjoyment of, culture, knowledge and entertainment all overthe world. Ideally, under this system of rights, rights ownersare assured that their works can be disseminated without fearof unauthorized use of their creative and intellectual prod-ucts. In practice, viable enforcement is often a more criticalissue than legal acknowledgement.
Increasing awareness of the contribution and potentialof the creative sector for development is a major task.Protecting copyright is a public-policy goal of countriesseeking sustained growth in the creative economy. The rich,
155C R E AT I V E E C O N O M Y R E P O R T 2 0 0 8
The ro
le o
f inte
llectu
al p
roperty in
the c
reative
econom
y
6Box 6.5 Collective management of copyright
“How is it possible to ensure that an individual musician is remunerated each time his song is played on the radio?Or a writer whenever his play is performed? How can the copyright and related rights of such creators be managedefficiently so as to enable them to concentrate on their creative activity while receiving the economic reward due tothem?
“From Artist to Audience, a WIPO booklet produced in cooperation with the International Confederation of Societiesof Authors [and Composers] (CISAC) and the International Federation of Reproduction Rights Organisations (IFRRO),aims to answer some of these questions by exploring one way in which the copyright and related rights systemworks, namely through the collective management of rights.“
“From Artist to Audience (Publication No. 922) is available in PDF in English or French on the WIPO Free Publicationswebsite: www.wipo.int/freepublications/en/ “
Source: Quoted from “From Artist to Audience - Collective Management of Copyright”, WIPO Magazine, January 2007. Available at:http://www.wipo.int/wipo_magazine/en/2007/01/article_0004.html .
6.9 Possible policy options

156 C R E AT I V E E C O N O M Y R E P O R T 2 0 0 8
intangible cultural heritage of many indigenous and localcommunities and developing countries is a source of creativ-ity that should be tapped for the direct benefit of these com-munities and countries.
Conversely, the inefficiency of intellectual propertylegislation and enforcement systems imperils the economicgrowth to which the creative industries contribute.Enforcement is as important as the education and awareness.Countries that wish to see their creative industries prospermust take a strong stance for the promotion of the full spec-trum of copyrights and their licences, for the best way toexpand the creative economy is to implement a balancedcopyright framework that realizes their development potential. The right balance should be found by providing aspectrum of choices for creators and entrepreneurs on theone hand while enabling access to creative and intellectualcontent and the socio-economic and cultural benefits thatsuch access provides on the other.
There are other views, however, reminding us thatdeveloping countries among themselves, are quite diverse inrespect of their social and economic environment and capa-bilities, and the impact of copyright varies according to theirsocio-economic circumstances. Therefore, a tailoredapproach could take into account the diverse needs andcapacities of developing countries and particularly theLDCs, and ensure that action is consistent with nationalobjectives and development goals.
In theory, all countries tailor laws to fit their needs.However, while most developed countries have, in the past,molded their copyright regimes to suit their particular eco-nomic, social and technological situations, developing coun-tries today have relatively less policy space available under thecurrent international regime although they should betterexplore the flexibilities of the TRIPS Agreement.
Given this limitation and the concurrent need thatintellectual property law must allow and even promotechoice, and recognizing that there is no one-size-fits-allmodel, some alternatives should be considered, for instance,to develop and use copyrighted and other intellectual worksthat fall into the “some rights reserved” and “free/open”categories, in between the extremes of the “public domain”and “all rights reserved” works. This does not mean that tra-ditional copyright works or the public domain should be dis-favoured but that they may provide nuanced economicoptions to authors, innovators and entrepreneurs, be theyindividuals, organizations or firms.
In this sense, intellectual property can offer a range oftools that can address, in a complementary way, both economic and cultural concerns, reinforcing links betweencultural values and cultural valuables. Using the full spectrum of rights options, the copyright system can serve toadequately balance the incentives and rewards to creatorswith the issue of access in a way that truly promotes creativ-ity without entering into contradiction with internationalintellectual property conventions.
The r
ole
of
inte
llectu
al
pro
pert
y in
the c
reati
ve e
conom
y
6
The aim of this chapter is to examine issues relatingto the interface between technology, culture and econom-ics, highlighting the ways in which information and com-munication technologies (ICTs) may bring about changesin the creative economy. While the value of the extendeduse of ICTs and the potential challenges such as the digi-tal divide have been much discussed, these debates haveconcentrated on output and access in general terms.Although issues pertaining to measurement of creativecontent will be addressed, the focus in this chapter is onexploring the implications of ICTs for the creative econo-my and creative production in particular. Arguably, theimpact of ICTs will be greater on this part of the econo-my and society than on others for two reasons: digitizationand convergence. Together these two forces generate twogreat opportunities: innovation and new business models.Finally, the potential increase in demand generated byfalling costs of distribution as well as the declining use ofphysical carriers (e.g., a CD or a tape) will also beaddressed.
Of course, this last element also includes a well-publicized source of debates: the challenge to copyrightregimes. In principle, digitization presents no problems forcopyright; historically, rights have been regulated via thecontrol of physical goods and, more recently, via variousforms of encryption. “Pure” digitization requires thedevelopment of secure, solely digital control of copyright.Indeed, over the past five years, this transition from physi-
cal to digital storage has been far from easy to manage foreven the most technically, legally and electronicallyadvanced countries and corporations in the world. Notsurprisingly, it has proven very difficult for those in thedeveloping world.
The essence of the challenge goes beyond the con-siderable problems of copyright; many creative-economy“products” are potentially digitized and thus subject toentirely new business models and need novel regulatoryregimes. Even those that have their basis in a physicalproduct, such as a craft object, may be subject to copyingunless registered as intellectual property. Likewise, in thecase of music, dance or theatre, these products can berecorded and copied. In both cases, this potentially createsvulnerabilities for developing economies and the class ofgoods and services known as “traditional cultural expres-sions”. In essence, most creative-economy practitionersmake their living from trading in ideas; intellectual proper-ty rights (IPRs) offer a possibility for them to earn “rent”on the use of these ideas. An unevenly developed, operat-ed or governed intellectual property system carries with itmany issues to all producers, and notably cultural produc-ers, and especially those in the developing world, of notreceiving adequate reward for their intellectual and labourinvestment in creative products and services. Second, a reg-ulatory regime that only recognizes IPRs and a single busi-ness model is unlikely to be either successful or effective inthe coming years.
The advent of digital and Internet-based ICTs hasopened a new set of marketing and distribution opportu-nities, thereby boosting the economic potential of the cre-
ative economy. The ICT sector was recognized as a pillarof economic growth and competitiveness by the interna-tional community and most recently in the outcome of the
157C R E AT I V E E C O N O M Y R E P O R T 2 0 0 8
Technolo
gy, c
onnectivity a
nd th
e c
reative
econom
y
7
CH
AP
TER
7Technology, connectivity and the creative economy
7.1 Introduction
7.2 Connectivity and its wider impact
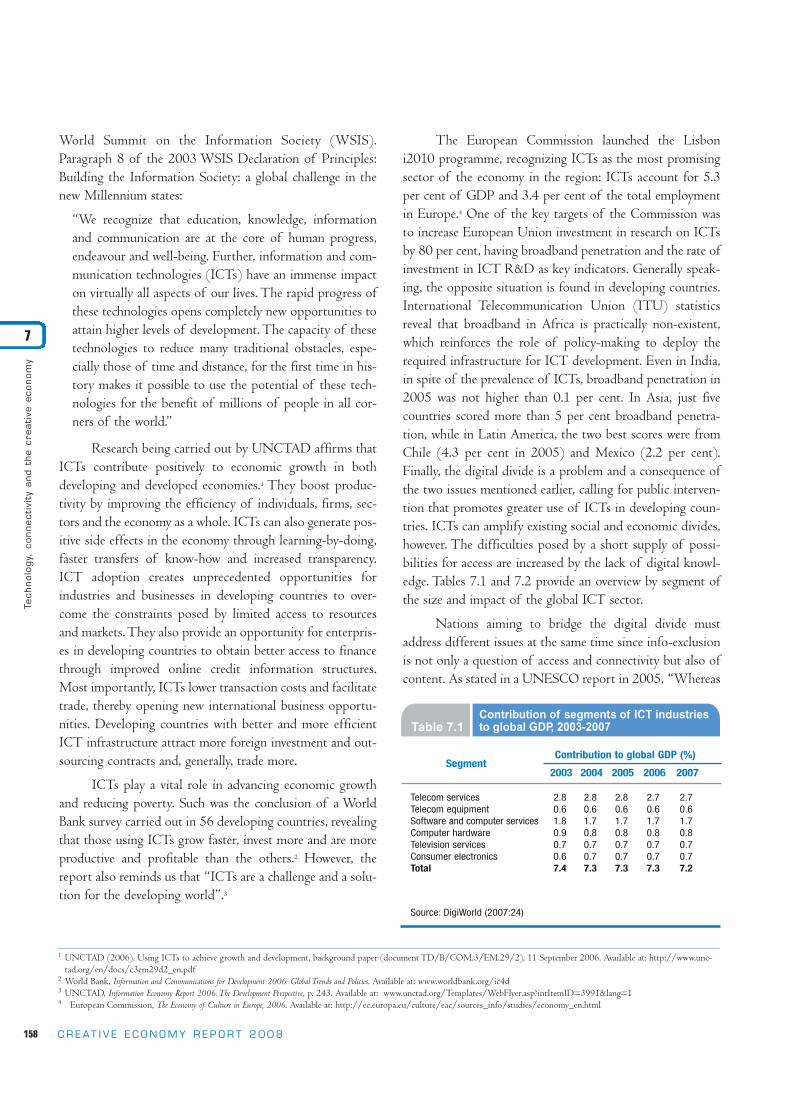
World Summit on the Information Society (WSIS).Paragraph 8 of the 2003 WSIS Declaration of Principles:Building the Information Society: a global challenge in thenew Millennium states:
“We recognize that education, knowledge, informationand communication are at the core of human progress,endeavour and well-being. Further, information and com-munication technologies (ICTs) have an immense impacton virtually all aspects of our lives. The rapid progress ofthese technologies opens completely new opportunities toattain higher levels of development. The capacity of thesetechnologies to reduce many traditional obstacles, espe-cially those of time and distance, for the first time in his-tory makes it possible to use the potential of these tech-nologies for the benefit of millions of people in all cor-ners of the world.”
Research being carried out by UNCTAD affirms thatICTs contribute positively to economic growth in bothdeveloping and developed economies.1 They boost produc-tivity by improving the efficiency of individuals, firms, sec-tors and the economy as a whole. ICTs can also generate pos-itive side effects in the economy through learning-by-doing,faster transfers of know-how and increased transparency.ICT adoption creates unprecedented opportunities forindustries and businesses in developing countries to over-come the constraints posed by limited access to resourcesand markets. They also provide an opportunity for enterpris-es in developing countries to obtain better access to financethrough improved online credit information structures.Most importantly, ICTs lower transaction costs and facilitatetrade, thereby opening new international business opportu-nities. Developing countries with better and more efficientICT infrastructure attract more foreign investment and out-sourcing contracts and, generally, trade more.
ICTs play a vital role in advancing economic growthand reducing poverty. Such was the conclusion of a WorldBank survey carried out in 56 developing countries, revealingthat those using ICTs grow faster, invest more and are moreproductive and profitable than the others.2 However, thereport also reminds us that “ICTs are a challenge and a solu-tion for the developing world”.3
The European Commission launched the Lisboni2010 programme, recognizing ICTs as the most promisingsector of the economy in the region: ICTs account for 5.3per cent of GDP and 3.4 per cent of the total employmentin Europe.4 One of the key targets of the Commission wasto increase European Union investment in research on ICTsby 80 per cent, having broadband penetration and the rate ofinvestment in ICT R&D as key indicators. Generally speak-ing, the opposite situation is found in developing countries.International Telecommunication Union (ITU) statisticsreveal that broadband in Africa is practically non-existent,which reinforces the role of policy-making to deploy therequired infrastructure for ICT development. Even in India,in spite of the prevalence of ICTs, broadband penetration in2005 was not higher than 0.1 per cent. In Asia, just fivecountries scored more than 5 per cent broadband penetra-tion, while in Latin America, the two best scores were fromChile (4.3 per cent in 2005) and Mexico (2.2 per cent).Finally, the digital divide is a problem and a consequence ofthe two issues mentioned earlier, calling for public interven-tion that promotes greater use of ICTs in developing coun-tries. ICTs can amplify existing social and economic divides,however. The difficulties posed by a short supply of possi-bilities for access are increased by the lack of digital knowl-edge. Tables 7.1 and 7.2 provide an overview by segment ofthe size and impact of the global ICT sector.
Nations aiming to bridge the digital divide mustaddress different issues at the same time since info-exclusionis not only a question of access and connectivity but also ofcontent. As stated in a UNESCO report in 2005, “Whereas
158 C R E AT I V E E C O N O M Y R E P O R T 2 0 0 8
Technolo
gy,
connecti
vity
and t
he c
reati
ve e
conom
y
7
1 UNCTAD (2006). Using ICTs to achieve growth and development, background paper (document TD/B/COM.3/EM.29/2), 11 September 2006. Available at: http://www.unc-tad.org/en/docs/c3em29d2_en.pdf
2 World Bank, Information and Communications for Development 2006: Global Trends and Policies. Available at: www.worldbank.org/ic4d3 UNCTAD, Information Economy Report 2006: The Development Perspective, p. 243. Available at: www.unctad.org/Templates/WebFlyer.asp?intItemID=3991&lang=14 European Commission, The Economy of Culture in Europe, 2006. Available at: http://ec.europa.eu/culture/eac/sources_info/studies/economy_en.html
Table 7.1Contribution of segments of ICT industries to global GDP, 2003-2007
Segment2003 2004 2005 2006 2007
2.80.61.80.90.70.67.4
2.80.61.70.80.70.77.3
2.80.61.70.80.70.77.3
2.70.61.70.80.70.77.3
2.70.61.70.80.70.77.2
Contribution to global GDP (%)
Telecom servicesTelecom equipmentSoftware and computer servicesComputer hardwareTelevision servicesConsumer electronicsTotal
Source: DigiWorld (2007:24)

the Internet holds out the promise of an open system, inwhich the effects of distance and remoteness would tem-porarily become irrelevant, the digital divide serves to remindus that geography of the internet continues to exist”. Astudy entitled From the Digital Divide to DigitalOpportunities: Measuring Infostates for Development indi-cates that approximately one third of developing economieshave a penetration rate of less than five per cent, keeping thehave and have-not countries worlds apart. Currently, theprogress made by most developing countries has not beenenough to close the digital gap, which for a number of themis even wider today than it was a few years ago.5
Africa offers a good example of a situation where thehighest growth rates in terms of Internet users are matchedby the lowest penetration rates (since many countries in theregion start from a nearly non-existent user base). Withrespect to broadband subscribers, high-income economiesaccounted for nearly three quarters of total broadband sub-scribers worldwide. Lower-middle-income economiesaccounted for 20 per cent (with China alone accounting for87 per cent of these, or some 15 per cent of the globaltotal). Low-income economies accounted for less than 1 percent of total global broadband subscribers, with India andViet Nam accounting for virtually all of these.6
Mobile telephony, however, has become the mostimportant mode of telecommunication in developingcountries. Internet access has become a reality for manybusinesses and public institutions and for individualswith higher levels of education and income. For the vastmajority of low-income populations, mobile telephony islikely to be their single most relevant communicationtechnology. Much like the Internet, it helps to createbusiness opportunities, enables efficient sharing of infor-mation and knowledge, and empowers households andcommunities with information. Many developing coun-tries are quickly catching up or in some ways have evensurpassed developed countries since mobile connectivitysidesteps some important obstacles to other types ofconnectivity such as the costly and time-consumingdeployment of fixed-line infrastructure owing to theremoteness of underdeveloped areas. In Africa, mobilephones have proved so successful that in many cases, they
159C R E AT I V E E C O N O M Y R E P O R T 2 0 0 8
Technolo
gy, c
onnectivity a
nd th
e c
reative
econom
y
7
5 G. Sciadas (ed.), From the Digital Divide to Digital Opportunities: Measuring Infostates for Development. Orbicom, 2005. Available at: www.itu.int/ITU-D/ict/publications/dd/material/index_ict_opp.pdf
6 ITU/UNCTAD, World Information Society Report 2007: Beyond WSIS, available online at: www.itu.int/wisr.
Table 7.2 ICT industries global market, by region, 2003-2007
EuropeNorth AmericaÁsia-PacificLatin America, Africa,Middle EastTotal
Source: DigiWorld, 2007.
2003
(in billions)
Marketshare (%)
660732600
1862,178
30.333.627.6
8.5100.0
2004
(in billions)
Marketshare (%)
699768649
1892,305
30.333.328.2
8.2100.0
2005
(in billions)
Marketshare (%)
736810693
2172,457
30.033.028.2
8.8100.0
2006
(in billions)
Marketshare (%)
773844739
2432,598
29.832.528.4
9.3100.0
2007
(in billions)
Marketshare (%)
799882791
2662,739
29.232.228.9
9.7100.0
Table 7.3Internet penetration, by regional economic group, 2002-2006
WorldDeveloped economiesAsiaEuropeNorth AmericaOceania Developing economiesAfricaAsiaLatin America and the CaribbeanOceaniaEconomies in transition
Internet users per 100 inhabitants
2002 2003
10.042.045.032.254.152.6
4.21.34.3
8.22.84.1
11.444.746.836.255.156.3
5.31.85.5
9.83.27.3
2004 2005
13.651.360.240.462.464.2
6.62.66.8
11.63.6
11.1
15.654.864.643.366.070.0
8.43.78.4
16.04.0
13.0
(Change (%)
2005-2006 2006
10.96.32.6
10.43.78.1
16.127.314.8
17.110.125.6
17.358.266.347.868.475.7
9.74.79.6
18.84.4
16.3
Source: UNCTAD calculations based on the ITU World Telecommunication Indicators Database, 2006, in UNCTAD Information Economy Report 2006.

Many measurement issues in the creative economyare not exclusive to the ICTs, but. certain specificitiesapply. Besides the lack of availability of data, collecteddata are not always comparable across countries. As washighlighted by the UNCTAD E-Commerce and DevelopmentReport 2004, “this calls for collective action at the interna-tional level to coordinate the methodological work and towork towards a global database of ICT indicators”.
Given the fact that this type of interaction toucheson all aspects of economic and social life, there is a needto develop data and empirical analysis of current ICTdevelopments. To start measuring the information socie-ty, a taxonomy is needed that provides indicators fortracking the progress of ICTs in a staggered process, firstby measuring e-readiness, then the intensity of ICT usageand, finally, the impact and outcomes of ICT on businessorganizations, the creative economy and the economy as awhole. ICT indicators understandably reflect some of the
have replaced fixed lines. Given the increasing penetration ofmobile phones in the developing regions, the role of ICTs infostering the creative economy will not only be related toinformation access and data sharing but also to new multi-media creations. Table 7.4 shows the penetration of the glob-
al market for mobile phones by regional economicgroups.
This positive impact of ICTs on developing countriesis counterbalanced by a number of factors besidesphysical access that contribute to the disparitiesbetween developed and developing countries. Apartfrom the appropriateness of the products, their costs orthe regulatory framework governing ICTs, there is animportant knowledge gap in the skills required tounderstand, absorb and act on the information avail-able on the Internet. The low level of formal educationamong the lower-income populations in many coun-tries in Africa, Asia and Latin America is an absolutebarrier to ICT use and adoption. This problem relatesto: (a) education, since technical skills as well as basicliteracy (linguistic, numeric and computer) are neededin order for people to benefit from ICTs; (b) language,
since the dominance of English on the Internet is a problemfor many populations in developing countries; and (c)human resources, since ICT professionals and technicians arehighly sought after in the developed world, leaving a dearthof these skills in the developing countries.
160 C R E AT I V E E C O N O M Y R E P O R T 2 0 0 8
Technolo
gy,
connecti
vity
and t
he c
reati
ve e
conom
y
7
7.3 Measurement issues and creative content
Source: Adapted from the International Telecommunication Union, digital.life,ITU Internet Report 2006.
Table 7.5Interconnected dimensions of digital life: Enablers, communications, content and transactions
Dimension
Digital enablers
Digital communications
Digital content
Digital transactions
Technology and/or service
Mobile broadbandFixed broadbandPortable Internet
VoiceMessagingSocial networking
Global knowledge webSights and soundsAdult content and gamblingOnline gamblingUser-generated contentContent-aware servicesDigital homes
Contactless payment systemsMobile payments
Table 7.4Mobile phone penetration, by regional economic group, 2002-2006
WorldDeveloped economiesAsiaEuropeNorth AmericaOceania Developing economiesAfricaAsiaLatin America and the CaribbeanOceaniaEconomies in transition
Mobile phone subscribers per 100 inhabitants
2002 2003
18.8064.1065.2275.1747.7463.7210.55
4.4910.73
18.873.36
11.97
22.4769.6069.3281.3952.6571.1113.59
6.1213.90
23.294.16
20.64
2004 2005
27.5877.1073.3389.7360.2781.4917.58
8.9817.50
31.845.72
37.65
33.4383.3176.1597.7865.2090.7422.6514.7321.54
43.097.51
55.94
2005-2006 2006
21.388.997.176.76
15.105.06
30.0839.2430.50
24.142.81
23.86
40.5890.8081.61
104.3975.0595.3329.4720.5128.11
53.507.72
69.29
Source: UNCTAD calculations based on the ITU World Telecommunication/ICT Indicators Database, 2007.

161C R E AT I V E E C O N O M Y R E P O R T 2 0 0 8
Technolo
gy, c
onnectivity a
nd th
e c
reative
econom
y
7
Source: UNCTAD, Information Economy Report 2006: The Development Perspective, pp. 154-156. Available at: http://www.unctad.org/en/docs/sdteecb20061_en.pdf.
Table 7.6 Partnership on Measuring ICT for Development: Core ICT indicators
Infrastructure and access
Access to, and use of, ICT byhouseholds and individuals
Use of ICT by businesses
ICT sector and trade in ICT goods
Basic coreFixed telephone lines per 100 inhabitantsMobile cellular subscribers per 100 inhabitantsComputers per 100 inhabitantsInternet subscribers per 100 inhabitantsBroadband Internet subscribers per 100 inhabitantsInternational Internet bandwidth per inhabitantPercentage of population covered by mobile cellular telephonyInternet access tariffs (20 hours per month), in $, and as a percentage of per capita incomeMobile cellular tariffs (100 minutes of use per month), in $, and as a percentage of per capita incomePercentage of localities with public Internet access centres by number of inhabitants
Extended coreRadio sets/100 inhabitantsTelevision sets/100 inhabitants
Basic coreProportion of households with a radioProportion of households with a TVProportion of households with a fixed line telephoneProportion of households with a mobile cellular telephoneProportion of households with a computerProportion of individuals who used a computer (from any location) in the last 12 monthsProportion of households with Internet access at home Individuals who used the Internet in the last 12 monthsLocation of the individual use of the internet in the last 12 monthsInternet activities undertaken by individuals in the last 12 months
Extended coreProportion of individuals with use of a mobile telephoneProportion of households with access to the Internet by type of accessFrequency of individual access to the Internet in the last 12 months (from any location)
Basic coreProportion of businesses using computersProportion of employees using computersProportion of businesses using the InternetProportion of employees using the InternetProportion of businesses with a Web presenceProportion of businesses with an intranetProportion of businesses receiving orders over the InternetProportion of businesses placing orders over the Internet
Extended coreProportion of businesses using the Internet by type of accessProportion of businesses with a Local Area Network (LAN)Proportion of businesses with an extranetProportion of businesses using the Internet by type of activity
Proportion of total business sector workforce involved in the ICT sectorValue added in the ICT sector (as a percentage of total business-sector value added)ICT goods imports as a percentage of total importsICT goods exports as a percentage of total exports
issues concerning measurement of the creative economy.Though a few indicators are easily mapped – such as thoserelating to infrastructure and access – others, more complex,are still largely unavailable. Underlying this issue is thenotion of four interconnected dimensions of the informa-tion society: digital enablers, digital communications, digitalcontent and digital transactions. These interconnected
dimensions of digital life and related technologies and serv-ices are shown in table 7.5.
Generally speaking, the most common core ICT indi-cators can be grouped into four sets, following the method-ology developed by the Partnership on Measuring ICT forDevelopment.7The vast majority of these parameters refer tothe availability of infrastructure and access to ICTs and the
7 The Partnership brings together experts from ITU, UNCTAD, UNESCO, the Economic Commission for Africa (ECA), the Economic Commission for Latin America and theCaribbean (ECLAC), the Economic and Social Commission for Asia and the Pacific (ESCAP), the Economic and Social Commission for Western Asia (ESCWA), EUROSTAT,OECD and the World Bank.

162 C R E AT I V E E C O N O M Y R E P O R T 2 0 0 8
The general scenario of the impact of ICTs has beenwell reviewed; however, the specifics of this debate – how ICTsmay have a variable impact on some activities and not others –has been less well examined. As noted earlier, it is our hypoth-esis that ICT development will have a disproportionate impacton the creative economy. The reasons for this impact relate tothe specific potential for transformation of the creative-econ-omy production processes; issues related to the productionchain will be further analysed in a subsequent section.
ICTs have enormous power to leverage the developmentof new links in the value chain in virtually all creative indus-tries, albeit at different levels. The key concept underpinningthese changes is “digital convergence”, which can be of threetypes: technological convergence (a shift in patterns of owner-ship of media, such as film, television, music and games),media convergence9 (allowing users to consume different mediaat the same time using a single personal computer) and accessconvergence (all production and distribution of media andservices are being re-engineered to work on a distributed net-work platform, i.e., everything is becoming available or doableon the Internet).
Digital convergence and its manifestation throughincreasingly interlinked and interoperable online technologiesare driven by consumers and by suppliers. A recent report pub-
lished by ITU states that “…the market environment increas-ingly resembles a digital ‘ecosystem’ in which companies mustcooperate to provide jointly provisioned services at the sametime as they compete for resources and for markets. Equally,customers become suppliers and suppliers become customersin evolving relationships of bewildering complexity.”10 Frommobile content on demand to online art auctions, the new features of the value chain emerge at a very fast pace.
The spillover effects of these shifts in developing coun-tries seem to be quite limited, though, owing mainly to the factthat generalized ICT access and use remain lower than indeveloped countries. Compounding the problem is the factthat major media and content producers are large multination-al companies from developed countries, and it follows that thisis where most of the value-added activities are generated. It issufficient to check the list of the top 20 companies in theaudiovisual and video-games industries to realize that they areall based in Europe, Japan or the United States – the samegroup responsible for most of the exports of selected creativegoods and services, with Europe (the 15-member EuropeanUnion, or EU-15) alone accounting for 52 per cent of allreporting countries.11 It is worth mentioning that 17 out ofthe leading 20 audiovisual enterprises worldwide are mainly orpartly active in broadcasting, thus benefiting twice from tech-nological convergence and making profits in both markets.12
Technolo
gy,
connecti
vity
and t
he c
reati
ve e
conom
y
7
8 International Federation of the Phonographic Industry, Digital Music Report 2005.9 Jenkins, Henry, Convergence Culture: Where Old and New Media Collide. New York University Press, 2006.10 ITU, Digital.life – ITU Internet Report 2006. Report is available at: http://www.itu.int/osg/spu/publications/digitalife/11 UNESCO, International Flows of Selected Cultural Goods and Services, 1994-2003: Defining and capturing the flows of global cultural trade, Montreal, 2005. Available at:
www.uis.unesco.org/template/pdf/cscl/IntlFlows_EN.pdf .12 KEA, European Affairs (2006), The Economy of Culture in Europe.
7.4 ICTs and their impact on the creative economy
use of ICTs either for individuals or businesses. Broadbandexpansion, for instance, is seminal to boosting the develop-ment of knowledge-sharing in the creative economy, and thenumbers of employees using computers reveal not onlyaccess to computers but also computer literacy. The last row,digital transactions, adds an economic perspective to the dataset. Having undeniable usefulness, these indicators are thefirst step towards a more complex analysis of ICTs, which islikely to be in the realm of the Partnership on MeasuringICT for Development initiative.
There is a need to understand how infrastructure andaccess are being used. Indicators such as online purchases and
sales allow a comparative analysis of the performance of dig-ital markets vis-à-vis traditional channels. In the case of thecreative industries, for example, according to theInternational Federation of the Phonographic Industry(IFPI), Internet music sales showed a consistent increase inshare across the markets. In Germany, sales of physical mediaproducts (CDs and DVDs) via the Internet reached 15 percent of the market and 10 per cent in the United Kingdomin 2005. This coincided with a drop in sales through tradi-tional retail stores although in most markets, record storesstill account for the majority of sales.8

163C R E AT I V E E C O N O M Y R E P O R T 2 0 0 8
Technolo
gy, c
onnectivity a
nd th
e c
reative
econom
y
7
7.5 Digitization
Until recently, the mode of transmission and storageof information on the creative economy was analogue. ICTs,however, allow a new form of recording of information: dig-itization. Digitization is significantly different in two ways.First, the various forms that were previously separate (sound,images, texts) have the same basic format and are thus poten-tially integrated into one medium. Thus, the same editingtechniques and similar software can be used. Additionally,different media can be combined in the same format. Thisintegration, when based on the same platform, enables atotally new field of convergent media. This has both artisticand business possibilities and represents a significant field ofpotential innovation. Second, the common digital basis ofinformation allows it to be easily communicated and trans-ferred with no degradation of the original, in fact, in anexact copy of the original. This aspect has huge implicationsfor the distribution and copying of digital works (as well asthe digital transformation of analogue works). The digitalformat means that novel editing and integration of media,previously unimagined, can be achieved. Again, this hasopened up the possibility of altogether new art forms as wellas the transformation of existing ones.
The economic implications of ICTs generally have
been discussed in the context of debates about the “neweconomy”. The claimed impact concerns cost-free reproduc-tion and distribution, and perfect copies; it is claimed that,in effect, this creates a new mode of economics differentfrom that based upon physical distribution and manufacture.Second, as indicated earlier, there is the possibility of novelproducts. Some authors have hypothesized that the use ofICTs will remove the need for face-to-face interactions, andthe co-location that follows might minimize transport costs.This has been referred to as “the death of distance”. Thesespatial implications have been challenged on the basis thatthe production of intellectual property still involves labourand the transformation of intellectual property. As such,there may still be specific co-location effects associated withembodied skill and expertise in labour markets and in phys-ically embodied knowledge exchange. In fact, evidence pointsto a renewed importance of place in the digital age (namely,creative clusters).13 As such, while there is potential for thedeveloping world, there is also the threat that divisions ofopportunity may be further hardened. However, to answer thisquestion fully, we need more analysis of the nature of changesin creative-economy production and the particular character ofthe transformation of production and value chains.
13See A.C. Pratt (2004), “Creative Clusters: Towards the Governance of the Creative Industries Production System?”, Media International Australia: Culture and Policy 112:50-66.; A.C. Pratt(2000), “New Media, the New Economy and New Spaces”, Geoforum 31:425-436.
14The merger of Time Warner and AOL was the first and best publicized of these mergers.
7.6 Convergence and new business models
Clearly, since much of the output of the creative econ-omy can potentially be digitized, it is likely to experience a dis-proportionate impact and transformation. Another aspect ofthis transformation is the development of new business mod-els, market structures and governance. New business modelsare made possible at the simplest level by the closer integrationof separate product lines (books, films and music, for exam-ple). Of course, it is notable that the media already display astriking concentration of ownership and power (see table 7.7.)Most major media organizations aspire to be “convergentorganizations”.14 The major objective is that these convergentorganizations are to be traders and users of IPR rights that
may be “re-purposed” (or reused) from one medium to another (for example, a cartoon character in a computer game,a film, a book, a toy or on a piece of clothing). This in effectmultiplies the possibilities of exploitation of intellectual property from a single investment in addition to the traditional monopoly profits possible in the medium.
Digitalization creates a number of possibilities for distribu-tion. This will be discussed later in the chapter. The key point tonote, however, is that with analogue distribution systems, repro-duction leads to degradation of the product; hence it is less thanthe original and declines further with the number reproduced.

In digital terms, reproduction is infinite and incurs no extracost per item. This therefore opens up the possibilities for infi-nite expansion of markets and the reduction or lack of needfor warehousing and storage of products. One of the keydilemmas for any creative producer is how to deal with theuncertainties of demand and the need to maximizeeconomies of scale by concentrating production in as fewitems as possible so as to reduce stockholding and excessproduction costs. These functions must commonly be com-bined with the physical transfer and exchange of goods, i.e.,distribution. For obvious reasons, distributors seek to man-age their stock by restricting choice to the best sellers. Manymechanisms are used to achieve this, but charts are a com-mon way to organize and focus consumers. In a digital age,however, it is potentially possible for producers and consumers to be in direct contact, thereby bypassing the control of the gatekeepers of the distribution system, whichare economically powerful.
Moreover, as stockholding costs are minimal for digi-tal products, maximum choice is available; this is called the“long tail” hypothesis. In the long term, however, the poten-tial for monopoly profits are reduced, hence posing a threatto the current media structure. Significantly, this opens uppossibilities for small producers. Under such a system of
direct micro-payments, it may be that profits are simply spread thinly and hence little traditional benefit fromthe creative economy will be realized. Clearly, this is a hugearea for future debate. Such a situation has led to the use of new business models to exploit these new possibilities(e.g., with respect to music) and it has been suggested thatwith these new options, there may be a variety of models –e.g., free music – offering possibilities for making moneyfrom different aspects of the business. The real issue is thechallenge that these activities (which are not understood orregulated) pose to governance and to how intellectual property is to be used and regulated since this requires anenormous investment in infrastructure.
Increased access to information gives global breadthand depth to the mapping of suppliers, buyers and outsourc-ing possibilities. Therefore, ICTs may play a major role inthis transformation process, reducing costs, improving productivity in the value chain and making companies morevisible in the global market. This contribution is more evi-dent in subsectors depending on technology at their verycore (software, games, multimedia content). However, evenin the more traditional, less technology-driven industriessuch as handicrafts, ICTs open new ranges of trade for serv-ices previously not traded, inaugurating distribution channelsand generating innovative production forms.
Finally, the possibility of delivering servicesonline rather than through a physical presenceallows developing countries to benefit from theircomparative advantage in some ICT-enabledlabour-intensive services. According to the UNC-TAD Information Economy Report 2006: TheDevelopment Perspective, the share of enterprises pur-chasing online in 2004 ranged between 20 percent and 60 per cent in OECD countries, whilethe share of enterprises selling their productsonline ranged between 10 per cent and 20 percent. In developing countries, online sellingranged from 1 per cent of enterprises in Chile to35 per cent in Qatar and 37 per cent inArgentina, indicating that there is still much roomfor the growth of e-commerce in the totalturnover of economies.
164 C R E AT I V E E C O N O M Y R E P O R T 2 0 0 8
Technolo
gy,
connecti
vity
and t
he c
reati
ve e
conom
y
7
Table 7.7Top 20 audiovisual companies worldwide and their 2004 turnover
Walt DisneyViacom Time WarnerSonyVivendi UniversalNews CorporationNBC UniversalThe DirecTV Group Inc.BertelsmannLiberty Media Corp.BBC (Group)ARDNHKBlockbuster Inc.NintendoMediasetRAIITV PLCTFIFrance Televisions
Company
United StatesUnited StatesUnited States JapanFranceAustraliaUnited StatesUnited StatesGermanyUnited StatesUnited KingdomGermanyJapanUnited StatesJapanItalyItalyUnited KingdomFranceFrance
Country
23,002 21,374 20,90716,00615,49414,417 12,90011,36010,113
7,6827,2507,1316,2726,0534,8164,8134,2533,9633,9003,791
Turnover (in millions of $)
18,40217,09916,72612,80512,39511,53410,320
9,0888,0906,1465,8005,7055,0184,8423,8533,8503,4023,1703,1203,033
Turnover (in millions of $)
123456789
1011121314151617181920
Rank
Source: KEA, European Affairs (2006), The Economy of Culture in Europe with figuresfrom the European Audiovisual Observatory.

The use of ICTs can potentially have significantimpact on all steps of the production chain: conception,production, distribution, access to audience, and engagementin feedback from the audience/market; the specificities aredifferent for each specific production activity in the creativeeconomy. The aim of this section is to provide some illustra-tive examples of impact across the production chain. Thepoint is that new ways of making money or developing audiences are possible with digitization and new businessmodels. The future direction is uncertain, however; there ispotential instability for all cultural producers in the yearsahead as well as huge potential growth. The new systems havethe potential to undermine what have become, in the last 50years or so, the normal ways to organize, say, music or filmproduction and distribution. Understandably, those corpora-tions that currently occupy key positions in such a systemwill seek to defend the “old ways”.
Recent shifts in the music industry provide examplesof the challenges likely to be faced by creative producers inadopting new ways of doing business. The old model of themusic industry has production and distribution at the centre,with the objective of promoting and selling huge numbers ofa small range of music. This channels monopoly profits intomusic companies and ensures very high intellectual propertyreturns (for a small number of bands). This process reduces
stockholding costs and increases profitability although it isrisky when it is unclear whether a hit or a miss is likely to beachieved from any one recording (although marketing caninfluence this situation enormously). This is why in music, asin film, companies expect a large percentage of failure to bediscounted by a small number of super successes. Thus, inthis system, intellectual property is a key means by whichartists can make money through recording and by whichmusic companies can target their production, distributionand sales as much as possible.
This model is based on a world of physical products;the new model is based on virtual products where storage costsof digital files are practically zero and a potentially infiniterange of music can be available to the consumer. In fact, therole of the music companies to promote and focus consumerscould be bypassed altogether if artists were to sell directly totheir audience. Of course, by exploiting the “long tail” ofproducts, any one artist is likely to make small returns fromintellectual property and the same is true for the music com-panies. For the latter, the old economics of the extra adminis-trative costs of managing a large number of artists and thecosts of recording, etc. will be an incentive to create a “shorttail” or limited range of products. In such a situation, it maybe logical for artists to focus on activities that make money,that is, live performances and the merchandising opportunities
165C R E AT I V E E C O N O M Y R E P O R T 2 0 0 8
Technolo
gy, c
onnectivity a
nd th
e c
reative
econom
y
7
Box 7.1 When ICTs give rise to new business models
For every action, there is an equal and opposite reaction. ICTs and the creative economy seem to form the perfect ground for the validity of Newton’sthird law. The more concentrated the audiovisual and music markets become in the hands of a few transnational conglomerates, the more alternativebusiness models emerge. Back in 2000, the music sector was revolutionized by peer-to-peer file-sharing programmes such as KaZaA and Napster, whichby 2001 had conquered no less than 3.5 million users.
As creativity seems to reinvent itself, a similar business model was created with Skype. Sold to eBay for $2 billion in 2005, it is now being applied toJoost Internet TV, with a promise to disrupt the oligopoly of the television industry.
By the same token, a myriad of open-source initiatives mushroom in other creative-economy markets, presenting more humble turnovers but provokinga shift in mindset on all continents. In Mexico, Tortillería Editorial is an association of authors, professionals and beginners who decided they would nothave much control over their books if they were to follow the usual publishing-house circuit. As a reaction, they created a mix of database, software andsite where they share their books and writings, allowing any user to generate, print and sell them. In 2007, it reached more than 4,000 texts and hun-dreds of authors.
In Brazil, a country holding a good record in time spent on the Internet, Web 2.0 is facilitating the spread of open-source software. Overmundo, aGovernment-funded project, was commissioned to ensure the alternative cultural coverage, mainly outside the São Paulo-Rio de Janeiro axis.Incorporating strong community participation, users are responsible for its content and design. Overmundo became a cultural database of Brazilian cul-ture at the global level and receives more than 700,000 references via Google. Not surprisingly, it won the Prix Arts Electronica International Competitionfor CyberArts in 2007.
7.7 Impact across the production chain

166 C R E AT I V E E C O N O M Y R E P O R T 2 0 0 8
Technolo
gy,
connecti
vity
and t
he c
reati
ve e
conom
y
7
15UNCTAD, E-Commerce and Development Report 2004.
that these afford. In this way, they can earn a modest income.Moreover, since they are not relying primarily on income fromintellectual property, it is logical that they reduce the price oftheir product, or give it away, in order to generate demand andattendance at concerts. Of course, they would still want tocopyright the work to sell it directly to the public.
This example is instructive in that it shows how thesignificance of intellectual property may change from its roleas income generator to one of simple protection and moralright under different conditions of production. The balanceof power might shift from large companies to independentproducers; in short, the business model is turned upsidedown: in the past, the tee-shirt was seen as the extra elementor souvenir of a concert whereas now it may be the majorincome stream. While this is an example of an actual situa-tion, it does not mean that this is the necessary or generalfuture of the music industry or any other industry; it simplydemonstrates the complex and destabilizing possibilities ofICTs in the cultural field.
A step-by-step exploration of the production chainreveals other areas of potential transformation. Initial con-ception is on the one hand more difficult in the sense thatmany new digital applications require knowledge and accessto computing resources and skills. Beyond this, however, thebarriers are low. With a simple video camera and editing soft-ware, a modest film can be produced in the home; the sameapplies to most digital forms. Moreover, these “one-offs”’can be easily and exactly manufactured, replicated and dis-tributed, with minimal costs, directly from the producer(without the need for intermediaries).
Perhaps the most striking example of the potential ofnew production is the development and use of free and open-source software (FOSS).15 Created through a process of shar-ing knowledge through exchanging source code – the instruc-tion set behind a computer programme – FOSS programmesare today provided and maintained by a range of ICT expertsranging from individuals to corporate giants, such as SunMicrosystems or IBM. FOSS programmes can have a particu-lar significance for developing countries as well as for shapingour understanding of creative processes and endeavours. Thereis a large range of innovative FOSS software that enables theowner of a basic personal computer to engage in what was,until recently, possible only with studio-quality production.
Traditionally, distribution and exchange were special-ized, expensive and exclusive services that had strong
gatekeepers in the form of publishing and distribution companies to protect profitability. As has been discussed, itis technically possible to bypass such systems altogether, orconstruct alternative or parallel systems, or develop multi-stranded versions of the old systems. The particularresolution of this distribution issue has a profound impacton the cultural sector and the sustainability of creativeindustries. With some justification, it has been said that com-mercial distribution narrows choices and focuses on thecommercial exploitation of products. As we have noted, theold business model forces production in this direction.Perhaps, however, we are at a branching point where a rangeof distribution systems might be entertained as possibilities,some closer to the old, narrow system, some closer to the“free for all”. Without doubt, the challenge for the creativeeconomy will be to actively engage with this debate. The danger is that, in the absence of this debate, the financialpower and the pressure of the risk-minimizing “old model”may create a future for creative production that is as narrowas, or even narrower than, that which we currently have.
Critically, the possibilities for greater engagement forthe developing world lie in there being a wider range of cul-ture available and on sale. There is a balance, however. Ifthere are no monopoly profits, then the super profits thatbuoy the creative economy will not exist. Thus, in this peri-od of growing consumption, a step change must be effectedto achieve some modest redistribution. Arguably, this changeis a complex cocktail of regulation and governance; it willnot be achieved by the total clampdown on piracy or via aglobal cultural commons.
This raises the issue of the governance of transitionbetween the existing models. At present, countries that havepoorly developed intellectual property regimes are vulnerableto theft, not simply local theft but international theft andthen copyrighting by third parties. This is legal but immoral.One possibility, among the options available, is to incorpo-rate traditional cultural expressions (TCEs) under copyrightlaw, not by statute but through common practice. There havebeen a number of initiatives established to create digitalarchives of dance, music, oral narrative, etc. While these maynot have the same formal recognition as registering copy-right, they are a first protective step that could be done at alow cost. Moreover, such collections would also have intrin-sic value to both local and international communities. Whilefree for locals to use, such an archive might charge outsidersfor use, providing a form of revenue and legal protection.
167C R E AT I V E E C O N O M Y R E P O R T 2 0 0 8
Technolo
gy, c
onnectivity a
nd th
e c
reative
econom
y
7
Box 7.2 Free and open-source software and the creative economy
The development of the creative economy relies to a certain extent on digital information and communication technologies (ICTs) that have, on their own,been widely recognized as important pillars for economic and social development, most recently within the WSIS process and its outcomes.1 While accessto network infrastructures and hardware technologies is fundamental, it is also insufficient. Access to software and the knowledge needed to understand,adapt and use it is critical if digital technologies are to achieve a positive development effect. Specifically addressing the issue of software helps to refo-cus policy and development thinking towards the human element. After all, software is the interface between cold digital hardware and the impulses ofcreative and innovative individuals. The development and production of software itself are a fundamentally creative and conceptual effort of problem-solving and design.
Free and open-source software (FOSS) is software that does everything that other software does. It is used for writing text, email, Internet browsing,spreadsheets, statistics and data management, etc. There are many programmes that can be used in music and audiovisual production. The opposite ofFOSS is proprietary software. Proprietary software, through copyright law and end-user licences, forbids users to copy, redistribute or alter the softwareand permits use only as narrowly specified within its particular licence.
What is FOSS?
FOSS is different from proprietary or closed-source software in three important ways, which are interlinked and interdependent.
1. FOSS has distinct copyright statement and end-user licences. FOSS licences permit users to copy and redistribute the software without restrictions.The most popular licence, the so-called General Public License (GPL), imposes a unique restriction: all copies, regardless of how much the softwarehas been altered, must also use the GPL and thus permit perpetual unrestricted copying.
2. FOSS licences require that authors of a particular software programme make the source code publicly available. The source code is the software writ-ten out as ordinary text in a programming language. Access to the source code allows anyone to copy or technically alter the performance and fea-tures of a programme. It also allows young computer scientists to learn how a world-class software programme is designed and developed.
3. Finally, FOSS generates important positive economic externalities. It reduces cost redundancies in redeveloping similar software, in particular whenthis is procured by public bodies or government. It reduces the risk of being locked in by a vendor selling a proprietary software product and seek-ing monopoly rents. FOSS also reduces the risk of vendor failure, whereby the producer of a proprietary software ceases to do business but does notrelease into public domain the source code of the software, making it unserviceable in the future and impossible to upgrade and follow advancesmade in the other computer hardware and software. It reduces market imperfections and promotes greater competition among ICT service compa-nies that can, using FOSS, compete on quality of service and competence since it is not possible to charge rents from copyright monopolies – thesesimply do not exist for FOSS. Finally, FOSS permits “looking under the hood” and allows better and faster technological capacity development in ICTand computer science.
There is nothing in any FOSS licence that forbids anyone to sell any FOSS programme. However, many companies that market FOSS programmes actu-ally sell only the service component while the licence is free. In general, in the software business, the service component accounts for more than half ofthe revenues of most software companies anyway. Thus, providing FOSS on a commercial basis does not represent a significant shift in the businessmodel for the ICT industry.
Any software, FOSS or proprietary, can be commercial. Commercial means “available on the market and used in a commercial, for-profit environment”.Proprietary software companies will sometimes try to distinguish their software as “commercial” as opposed to “FOSS”. This is a marketing strategymeant to convince buyers that there is a “commercial” grade or quality that is lacking in FOSS. Nothing could be further from the truth: the most robustand technically advanced software programmes as used by Yahoo.com, Google.com, NASA, many ministries of defence (including the Pentagon), aca-demic and research institutions (the European Organization for Nuclear Research (CERN), the Massachusetts Institute of Technology), and ICT industrybehemoths such as IBM or Sun Microsystems are FOSS.
Importance for developing economies
The advantages for developing economies in developing and using FOSS are big and important.
1. FOSS reduces dependency on expensive and imported proprietary technology and the accompanying ICT consultancy services that are often tied upwith various non-disclosure agreements.
2. FOSS, through its open code and public licences, promotes knowledge-sharing, technology transfer and unrestricted cooperation in knowledge andtechnology development and use.
3. FOSS enables the development of local human capacity and home-grown ICT service industries that can become more than merely fronting business-es selling imported technology.
4. FOSS is economically more efficient because of the positive economic externalities that it generates as described in the previous point.
5. As the main cost involved for using any software is the service component and because FOSS allows local computer experts to learn to work with andservice FOSS programmes, FOSS is more affordable than non-pirated – i.e., legal – proprietary software alternatives for the vast majority of devel-oping economies.

168 C R E AT I V E E C O N O M Y R E P O R T 2 0 0 8
Technolo
gy,
connecti
vity
and t
he c
reati
ve e
conom
y
7
Box 7.2 continued Free and open-source software and the creative economy
6. FOSS is fully intellectual property-regime compliant: it needs and uses copyright to maintain and promote its openness. While its spirit is anti-restric-tive, it does not confront current intellectual property from a formal, technical or legal perspective. Countries, institutions, businesses and individualsthat switch from using pirated software to FOSS work to fulfil their obligations as designated by WIPO and WTO/TRIPS conventions and agreements
7. FOSS promotes good governance: It means that public data will be kept in public data-formats and managed by software the source code of whichcan be inspected and verified by independent bodies. This is immensely important in applications such as taxation, voting or military and defenceuse.
8. FOSS promotes the use of open standards and this improves interoperability among different software programmes, thereby reducing the costs whenthese need to be made to work together – such as merging databases or establishing common project or financial management systems.
9. FOSS allows easy localization. Any FOSS programme can be translated and altered to suit the linguistic, cultural, commercial and regulatory needsand requirements of any location, all without having to seek permission from the original authors or exchanging terms and conditions while using(expensive) legal intermediaries and consultants.
10.Many experts feel that FOSS is more secure, more reliable and more stable than proprietary software. While the debate is inconclusive, what is sureis that FOSS problems can be fixed locally by local experts.
The international community should promote the idea that government policy bodies need to be aware of FOSS and include it in their ICT and e-strate-gy programmes, in e-governance activities and in procurement policies. More importantly, it should promote the notion that when Governments choosea particular technology, the decision to select FOSS or a proprietary (or mixed) solution is an important policy issue and not a purely technical, practicalor cost consideration.
Because FOSS generates important and positive economic externalities, software choice – and technology choice in general – should not be relegatedto oversimplifications and assessments along the lines of “what works” (even though FOSS actually works better most of the time) or how costs com-pare from an accounting perspective. Accounting “analyses”, often referred to as “total cost of ownership” or TCO calculations, are notorious for ignor-ing local economic conditions as well as positive externalities, such as the development of local human capital through FOSS use. Therefore, while thedecision to use FOSS initially is often understood to be a technology-awareness issue, it finally becomes an important policy issue.
FOSS and LDCs
While ethical principles, skills development, compliance with international copyright conventions and national law, public-data governance and bettersecurity are often cited as key reasons for adopting a positive policy stance towards FOSS use, for LDCs, cost issues can be a primary concern. While indeveloped market economies proprietary licence fees may constitute as little as 5 to 10 per cent of total costs of running a computer resource – withadministration, maintenance, integration and support, and hardware representing the rest – in low-income economies, licences may represent the bulkof total costs. This is owing to the fact that aside from hardware and licences, all other costs are essential, non-tradable, labour-intensive services andthese demand correspondingly low wages in LDCs. While hardware costs are manageable to some extent through bulk purchasing from original equip-ment manufacturers, using thin-client technologies2 or recycling outdated hardware from developed market economies, FOSS offers an opportunity toavoid paying licence fees altogether.1 See: http://www.itu.int/wsis/index.html .2 A thin client is a minimal, stripped-down computer and software combination that depends primarily on a powerful central server for data processing and memory and
therefore serves mainly as an input-and-output device between the user and the central server.
By: Dimo Calowski, UNCTAD, E-Commerce Branch.
7.8 Looking into the future
The emergent theme of this chapter is that the impactand effects of the adoption and use of the ICTs are likely tobe amplified in their impact on the creative economy. Theprecise impact is complex, varying by industry and by theorganization and means of incorporating and using ICTs increative production. Critically, this change opens up a win-dow of opportunity to develop new production and distri-
bution systems that might promote a real expansion ofdemocracy and diversity in cultural productions, and to cre-ate new and interesting business models and opportunities.In contrast to this is the historical and vested interest of themedia industries dominated by powerful players. It is clearthat a business-as-usual agenda may deliver pronouncedincreases in inequality, access and range of cultural offerings.
169C R E AT I V E E C O N O M Y R E P O R T 2 0 0 8
Technolo
gy, c
onnectivity a
nd th
e c
reative
econom
y
7
The real challenge will be to develop new forms of gover-nance in the creative economy that will support and encour-age the positive and minimize the negative effects.
The creative industries are clearly well placed to bene-fit enormously from the development of ICTs. However,there are a number of challenges that will need to be careful-ly managed. First, the creative economy often lacks profes-sionals in financing and accounting that would enable it toapproach financial institutions and claim for funding.Second, SMEs normally face legal uncertainties relating tocross-boarder e-commerce and the need to keep up to dateon the dynamics of e-commerce legislation.16 Third, invest-ment and commercial banks are not always prepared to valueintangible assets. This is a veritable lose-lose situation ascompanies find it hard to prove the financial potential oftheir creative products and services and investment andfinancial institutions do not increase their portfolio ofclients. Smaller creative companies must then refer to a mixof internal and external financing sources. A recentCanadian study revealed that approximately 57 per cent ofcultural SMEs have sought debt financing during the lasttwo years, 80 per cent of which were successful in obtainingdebt capital from financial institutions. However, theresearch data do not explain whether cultural SMEs succeed-ed in obtaining the entire amount of capital that they hadrequested or whether the capital was obtained at favourablerates. A clue that such was not the case, however, is providedby the fact that a large share of cultural SMEs (and 42 percent of those receiving debt funding) use personal savings tooperate its businesses.17
As pointed out earlier, the digital divide is real andimportant; the development of inexpensive computing services and of open-source software is very important as astepping stone in closing the gap. However, another digitaldivide is opening up, one that may have even greater conse-quences than the first. It is the investment-intensive universalbroadband. The example of countries such as the Republicof Korea is notable in the sense that such investment hasdriven and expanded the market as well as the innovative useof ICTs. This is one of the main advantages in ICT applica-tions and a way to engage the public. Given the increasingimportance of a closer interaction between producers andconsumers as well as the growing interactive and education-al learning patterns developed by ICTs, rich societies arebecoming more closely bound together in a virtuous interac-tion both on- and off-line. This will be one of the majorchallenges to the democratization of cultural development inthe coming years.
There are also a number of pressing challenges withrespect to intellectual property. The development of archivesis essential for building reflective and critical knowledge ofart and cultural forms, and to develop adequate educationsystems. For a variety of reasons, one of the institutionalweaknesses of many developing economies concerns cultur-al communication and critique. The use of ICTs to developa wider public discourse on art and culture could be a marvelous dividend for the digital age.
16UNCTAD (2004), E-Commerce and Development Report 2004.17Nordicity Group Ltd, Profile of Small and Medium-sized Enterprises in the Canadian Cultural Industries, prepared for the Department of Canadian Heritage, March 2004. Available at:
www.canadianheritage.gc.ca/progs/ac-ca/pubs/profile/sme_e.pdf .

170 C R E AT I V E E C O N O M Y R E P O R T 2 0 0 8
Technolo
gy,
connecti
vity
and t
he c
reati
ve e
conom
y
7
Box 7.3 Eurovision
Geneva-based Eurovision is not only the home of the world's most popular musical talent show, the Eurovision Song Contest; for almost 50 years, it hasalso offered a distribution platform to Europe's public broadcasters for an exchange of news items. Since October 1958, Europe's public broadcastershave provided one another with coverage of news events in their countries on a reciprocal basis. The added value of the Eurovision News Exchangeswas already clear during the first experimental news exchange, when Pope Pius XII fell ill. When he passed away two days later, the editor of the Dutchtelevision news bulletin made history by asking for "the dead Pope live", and Eurovision arranged for a live broadcast from the Vatican.
Today, the Eurovision News Exchanges handle over 42,000 news items per year, using two satellite channels for both news reports and extensive livecoverage of events. Eurovision News Exchange items cover wide-ranging topics from the worlds of politics, culture, science, business, religion and sports.United Nations agencies began offering items to the Eurovision News Exchanges in the mid-1970s. Today, content provided by FAO in Rome, ILO, IOM,UNCTAD, UNHCR, UNICEF, UNTV, WFP, WHO, WIPO and WMO as well as the International Atomic Energy Agency in Vienna, the International Criminal Tribunalfor the Former Yugoslavia in the Hague, and others adds additional breadth to the Eurovision News Exchanges and helps more than 100 national andinternational broadcasters fill their daily news bulletins. United Nations videos, particularly concerning unfolding humanitarian crises, provide broadcast-ers with essential material from regions of the world where press access may be limited and about conflicts in their earliest stages.
Video material from the United Nations is also distributed outside of the News Exchanges via Eurovision's World Feed Service, which began in 2005. Livecoverage of the 62nd General Assembly in September 2007 was distributed to more than 300 broadcasters worldwide. This cooperation betweenEurovision and the United Nations is only the most recent in a fruitful partnership that dates back more than 30 years and puts United Nations materialin front of editors in major TV newsrooms around the world. Additional information about Eurovision is available online at: www.eurovision.net.
By Laura Downhower, Eurovision.

Promoting the Creative Economy for Development 5
PART

172 C R E AT I V E E C O N O M Y R E P O R T 2 0 0 8

As has been argued throughout this Report, knowl-edge and creativity are becoming powerful drivers of eco-nomic growth in the contemporary globalizing world. Theyhave profound implications for trade and development.Together with technology, they open up a huge potential fordeveloping countries to develop new areas of wealth andemployment creation consistent with wider trends in theglobal economy. For such countries to realize this potential,however, carefully formulated policy strategies are necessary.The creative capacities of these countries can be enhancedthrough strategic action by governments at local, nationaland regional levels and by forward-looking cooperation inthe international arena.
A wide range of measures is available to governmentsat all levels to stimulate the creative economy; to reinforcethe connections between the economic, technological, socialand cultural aspects of its functioning; and to promote theachievement of sustainability through linking economic andcultural development. The policy arena within which government action dealing with the creative economy falls isthe broad area of creative-industries policy. Traditionally inmany countries, this area of policy concern has been knownas “cultural policy”. Yet the scope and coverage of the term“cultural policy” differ from country to country. For somecountries, especially in the industrialized world, culturalpolicy simply comprises policy towards the creative arts.Such countries support the arts through measures such assubsidies to artists and performing companies; tax conces-sions for donations to the arts; assistance to education andtraining in music, drama, the visual arts and so on; and theoperation of public cultural institutions such as museumsand galleries. For other countries, particularly in the developing world, cultural policy has tended to connoteprincipally policy towards cultural heritage. In these cases,the policy task is seen as one of preserving or protecting
both tangible and intangible cultural heritage, where thesites, artefacts and traditions involved are vulnerable toexploitation and possible loss through deterioration or disappearance.
Recent times, however, have seen an expansion of thenotion of “cultural policy” to embrace a broader concep-tion of it as policy towards creativity and the creative indus-tries. Such an expansion of cultural into creative policy par-allels the widening of the scope of the creative economyfrom the traditional cultural industries, as discussed earlierin this Report. In Europe, for example, policy interventionsin support of the cultural industries began in the 1920s andwere reaffirmed in the Treaty of Rome (1957) and theMaastricht Treaty (1992), which progressively defined thesupport for culture in the countries of the EuropeanUnion. Originally such support was directed particularlytowards traditional art forms, but more recently, as the mar-ket economy has grown and diversified, the scope haswidened continually to embrace the audiovisual industries,publishing, the media and so on. The Europeans have beenconcerned to stress the importance of the cultural contentof the output of these industries. Public expenditure onculture in the European Union has continued to expand,with countries such as France and Germany committingmore than 8 billion euros to culture in the early years of thetwenty-first century, with total public expenditure on cul-ture across the enlarged European Union now totallingapproximately 50 billion euros (KEA 2006:125).
In line with the cross-cutting and multidimensionalnature of the creative economy, cultural policy in its broad-er interpretation embraces aspects of a number of otherareas of economic and social policy. Perhaps most impor-tantly, consideration of the creative economy becomes a keyelement of industrial policy, whereby industrial develop-ment strategies can exploit the potential dynamism of the
173C R E AT I V E E C O N O M Y R E P O R T 2 0 0 8
Polic
y strate
gie
s for th
e c
reative
industrie
s
8
CH
AP
TER
8Policy strategies for the creativeindustries
8.1 Introduction

174 C R E AT I V E E C O N O M Y R E P O R T 2 0 0 8
creative industries in generating growth in output, exportsand employment. A positive outlook for industrial policy inwhich creativity and innovation are important drivers ofgrowth is well suited to the contemporary economic condi-tions of globalization and structural change. For developingcountries in particular, a refocusing of industry policy alongthese lines can begin to open up many of the exciting possi-bilities for growing the creative economy that have been out-lined in this Report.
Another major area of economic policy for which thecreative economy has significant implications is, of course,trade policy. As discussed elsewhere in this Report, trade inproducts such as audiovisual services has had significantimpact on the cultural sectors of countries in the developedand developing worlds alike, and hence on the formation ofcultural policy. For many countries, the traditional conceptsof cultural policy have expanded to incorporate a significantelement dealing with the promotion of cultural exports and
the protection of vulnerable domestic creative industries.
As discussed in earlier chapters, other areas ofeconomic and social policy with linkages to cultural policyinclude: tourism; urban and regional development (especiallythe “creative city” area); cultural rights and cultural diversity;education and training; and copyright and intellectual prop-erty. It is apparent that, if the widened scope for policytowards the creative economy is to be entertained, it willrequire significant collaboration between the various ministries and bureaucratic departments. Only by such coop-eration will the full development potential of the creativeeconomy be realized.
It is important to bear in mind also the internationalcontext within which policy-making takes place. Multilateralprocesses are the essence of international policies and thedriving force to move forward the international economicand development agenda. These processes will be discussedin the next chapter.
The economic role of government is conventionallytaken to comprise public interventions to promote:
■ efficient resource allocation in the economy;
■ full employment, price stability and external balance; and
■ equitable distribution of income and wealth.
In regard to domestic policy towards the creative econ-omy, the rationale for involvement of the public sector canbe described under several areas of intervention, as follows:
■ Market failure (public goods). The cultural sector in generaland the creative arts in particular are normally regarded asa source of diffused community benefits that have thecharacteristics of non-rival and non-excludable publicgoods. A particular public benefit of relevance here, as dis-cussed in this Report, is the social cohesion that can beexpected to flow from cultural activities and creative pro-duction within communities.
■ Market failure (imperfect competition). If industries becomeconcentrated to such an extent that competition breaksdown, government intervention may be warranted torestore competitive conditions. A specific case of this inthe creative economies of developing countries may arise
if global corporations producing cultural products are ina position to monopolize local markets to the exclusion oflocally produced cultural expressions.
■ Market failure (research and development). The involvement ofgovernment in promoting R&D is justified on thegrounds that beneficial externalities might be producedand/or that the public sector may be in a better positionthan private companies to assume the sorts of riskinvolved, with the prospect of sharing in the payoff fromsuccessful discoveries. In the case of the creative economy,governments can and do facilitate R&D investments increative product development for either or both of thesereasons and may undertake strategic investments in thecreative sector with the hope of “picking winners”.
■ Education and training. Governments have particular respon-sibilities in the areas of education, training, certificationand licensing. Significant strides have been made in thedeveloping world towards achieving universal literacy andensuring access to education opportunities that are bothrelevant and of high quality. The resources available forspecific training programmes are, however, often very lim-ited. For the time being, training and education opportu-
Polic
y st
rate
gie
s fo
r th
e c
reati
ve i
ndust
ries
8
8.2 The role of public policies
nities relating to the creative industries are almost entirelylimited to the major urban centres. The successful promo-tion of creative industries requires that they be reflected inthe national education system, which would offer targetedtraining opportunities at different levels (formal, non-for-mal, informal) in skills and knowledge that are relevant toprofessional participation in the creative-industries sector.Such training also needs to serve as a repository of knowl-edge relating to the rich cultural traditions that underpinthese professions. It is also necessary to confer the statusand importance that are due these specializations througha programme of certification and licensing designedspecifically for the creative-industries sector.
■ Cultural identity/cultural diversity. An area that has traditionallyformed part of cultural policy in the broadest sense hasbeen government responsibilities for the cultural life ofthe people as reflected in the traditional knowledge andthe intangible cultural capital of the community.Although there are demonstrable economic ramificationsarising from areas such as the expression of cultural iden-tity or the protection and celebration of cultural diversity,this is an area of policy that is generally regarded as intrin-sically important in its own right. For our purposes, it isclear that policy in these areas should undoubtedly beregarded as part of an overall domestic policy strategy thatencourages and supports the creative economy.
In considering the process of policy formulation andimplementation in the public sector, a series of steps can beidentified that can be summarized in simple terms as the fol-lowing sequence:
■ Specification of objectives. This first step is critical in specifyingclearly which outcomes policy is designed to achieve.Generally, multiple objectives are involved, and the neces-sity of some trade-off between them might be anticipat-ed. For example, the standard goals of macroeconomicpolicy may require that some balance be sought betweenlevels of growth, inflation, unemployment, external bal-ance, etc. In some cases, however, synergy between objec-tives may be possible. In regard to the creative economy,for instance, a linking of the goals of economic and cul-tural development can readily be imagined wherebygrowth in cultural production can yield both economicand cultural benefits.
■ Choice of instruments. The guiding principle in the allocationof policy instruments to tasks is the so-called assignmentproblem, whereby the most effective and efficient policymeasure or package of measures is aligned with the objec-tive or objectives that they are expected to achieve. Thestandard array of policy instruments available for use insupporting the creative economy includes: fiscal measures(subsidies, tax concessions, investment allowances, businessstart-ups); regulation (copyright, local content quotas,planning laws, FDI regulations); trade-related measures(import quotas, etc.); education and training (direct or
subsidized provisions of services); provision of informationand market development services; international cooperation(cultural exchange, cultural diplomacy); and social securityand welfare policy (including measures to protect culturaldiversity). The usefulness of particular instruments is discussed in more detail later in this chapter.
■ Implementation, monitoring and evaluation. The implementationof cultural policy requires appropriate measures to gatherthe data necessary for monitoring whether or not therequired objectives are being achieved, what the benefitsand costs of intervention have been, and whether therehave been any untoward or unexpected side-effects, eitherpositive or negative. The process of monitoring and evalu-ation is normally seen as part of a feedback loop wherebythe assessment of the effectiveness of policy measures canbe used to inform the further development and refinementof policy formulation and implementation.
The above sequence of the policy process is relevantgenerally to the dynamics of government action in regard tothe creative economies of developed and developing countries alike. Some further considerations to be borne inmind, particularly in the developing-country context, are thefollowing:
■ There is a need in the developing world to create a frame-work of objectives, shared values and measurable outcomes;define the roles and responsibilities of all role players; andconsolidate the role of government as a facilitator and coordinator of the creative sector and its development.
175C R E AT I V E E C O N O M Y R E P O R T 2 0 0 8
Polic
y strate
gie
s for th
e c
reative
industrie
s
8
8.3 The policy process

176 C R E AT I V E E C O N O M Y R E P O R T 2 0 0 8
■ Much of the policy implemented in the developing worldhas used models from developed countries in its design.The current challenge is to ensure that policy embracesvalues relevant to the developing countries themselves,incorporating indigenous knowledge systems and localexperiences into the policy, institutional and programmingenvironment.
■ A critical challenge for policy in the arts, culture and heritagesectors of developing countries is the lack of articulation
between cultural policy and other priorities, and the degreeto which a concern for culture and cultural diversity isembedded in development agendas.
■ One of the most significant challenges to the creative sector in developing countries is the implementation ofgood governance principles across the sector as well as theimprovement of the relationships between producers, distributors, creative workers, employers and retailers.
As the analysis in this Report has demonstrated, critical areas where developing countries need new policy ini-tiatives in order to boost their creative economies include theprovision of infrastructure, the provision of finance andinvestment, the creation of institutional mechanisms, thedevelopment of export markets, the protection of creators’rights, the establishment of creative clusters and the institu-tion of effective data-collection measures.
8.4.1 Provision of infrastructure
It is a fundamental function of government to createand maintain the conditions under which the economic,social and cultural life of the citizens can prosper. Thisresponsibility takes shape through the ways in which thepublic sector provides both tangible and intangible infra-structure. Given the predominance of the market economy asthe basic form of economic organization in the world today,the types of infrastructure required are those institutions thatenable markets to function effectively but at the same time toprotect and promote the public interest. As the UNCTADThe Least Developed Countries Report 2004 puts it:
In implementing post-liberal development strategies,public policies in LDCs should use market-supportingmechanisms aimed at market creation, market develop-ment and market acceleration. These policies must notsimply provide the right price incentives, but also create the right institutions and the infrastructure necessaryfor a modern market economy to function properly(UNCTAD, 2004:xi-xii, emphasis added).
The infrastructure needs of the emerging creative
economies of developing countries arise at all points in thevalue chain from initial creative production (which may beundertaken on a small scale at the local level or on a largerscale in towns and cities) right through to marketing andretailing. As with any other industry, the creative industriesneed affordable access to appropriate space in which to workand to live, transportation, and distribution facilities. Thedispersed but interdependent nature of creativity in the cre-ative-industry sector may make the provision of these basicinfrastructure needs more costly and complicated than forthe development of more traditional heavy and light indus-try. The overlap with the private infrastructure needs of theemployees and the small scale of the needs for the individualindustry may, on the other hand, balance this cost. The pro-motion of creative clusters is one way to overcome this costbut it may not carry the social and cultural advantages oflodging creative industries within existing communities.
One infrastructure requirement particular to the cre-ative industries is the need for access to information andcommunication technology (ICT). Access to informationneeded to boost business development is in many regions ofthe world still far from universal and will never be so with-out conscious public-sector efforts to fund such access.There is no doubt, however, that access to ICT, in terms ofidentification of market opportunities, training, innovations,networking and sales, is a significant factor in the develop-ment of the viability of small business units. Access to ICTprovides a link between education and commerce and assistsin turning knowledge into marketable products. Facilitatingthe movement of workers is another key issue for the devel-opment of creative industries, especially in those industriesthat entail a collective creative process.
Polic
y st
rate
gie
s fo
r th
e c
reati
ve i
ndust
ries
8
8.4 Policy directions

Like any other industry, creative industries are onlytruly sustainable if they contribute to building the assetresource base. This they can do only through the integrityand authenticity of their products. In the longer run, the cre-ative industries depend on the vitality and strength of thecultural sector and the investments in cultural capital(knowledge and heritage). The sustainability of the creativeindustries therefore depends on the safeguarding of culturalcapital and the development of the cultural asset resourcebase. Hence, comprehensive cultural asset management is aprerequisite for sustained growth in the creative-industriessector – and, in a wider perspective, for sustainable econom-ic development and vibrant community life. It is thereforenecessary to maintain the principle that cultural assets areintergenerational capital and that their viability may legiti-mately be sustained by public investment.
8.4.2 Provision of finance and investment
Traditionally, investment in the cultural sector hasdirected investment and programming towards projects,institutions and large enterprises that are all heavily depend-ent on public incentives and financing. The sustainability ofthe creative industries depends, however, on a different andmore comprehensive model of investment. While parts ofthe creative economy have been very successful in identifyingfunding and have become very profitable, many activitiesmay appear to have only a limited commercial potential.These activities may not have been able to realize theirpotential because they have lacked the capital and investmentneeded to scale up their activities and operate as demand-driven, sustainable businesses.
A major problem in this respect is that entrepreneursin the creative industries often find it difficult to present a
177
Polic
y strate
gie
s for th
e c
reative
industrie
s
8
Figure 8.1 Funding flows to the cultural sector
Source: Gordon and Beilby-Orrin (2007:30).
Corporationssectors
Householdssectors
“The
Cultural
Sector”
DOMESTICSECTOR
“Arm’s Length”agencies
(publicbroadcastingcorps, artscouncils)
National administrations(Treasury, Ministries or
Depts. of Culture,Interior, etc.)
LocalAdministrations
Government sector
Incoming transfers from non-resident institutional units(foreign governments and international organisations)
Outgoing transfers to non-resident institutional units(foreign governments, international organisation, NPISHs and households)
NPISHs(Non-profitinstitutions
serving household)
State/RegionalAdministrations
Householdssector
Non-residents
Foundations

convincing business model and many of the professionalskills involved – e.g., choreography, dancing, drawing, edit-ing, weaving, doll-making – simply are not perceived as lead-ing to profitable businesses. While this may be changing insome places under the influence of success stories of onekind or another, many skills and professions related to thecreative economy are not recognized as business categories inlegal terms. Because of this, many small creative industriesdo not have access to credit facilities or to the loans andinvestments that would make their businesses more viable.
Sources of finance for businesses in the creative econ-omy may arise from public-sector funding programmes ofvarious sorts, private-sector investment, and public-privatepartnerships involving joint contributions and responsibili-ties. In regard to public funding of the cultural sector, figure8.1 illustrates the funding flows involved.
8.4.3 Creation of institutional mechanisms
The actual role played by government in dispensingfunds for the cultural sector and hence for the creative econ-omy may involve direct cultural provision via the State appa-ratus (as in the former Soviet Union, China, etc.) or via anenabling role administered through a ministry of culture orthe equivalent. The expansion of cultural policy beyond theconcerns simply of core artistic and cultural activities, as dis-cussed earlier, entails a similar expansion of the ways inwhich cultural funding is provided. In particular, publicfinance and investment in the creative economy are likely toextend beyond cultural ministries and to involve, in particu-lar, ministries responsible for industrial development andtechnology. There is a need for a workable and flexible insti-tutional mechanism to put in place cross-cutting policies.
178 C R E AT I V E E C O N O M Y R E P O R T 2 0 0 8
Polic
y st
rate
gie
s fo
r th
e c
reati
ve i
ndust
ries
8
Box 8.1 The Egyptian film industry: The waning of the “Hollywood of the East”?
Egypt has a long and proud tradition of moviemaking dating back to the late nineteenth century when projections were shown in cafés. The first featurefilms to be produced were romantic movies intended for the urban middle class while the first full-length silent feature and the first made with an entirely Egyptian crew was “Leila”, produced and co-directed by Azira Amira with Turkish director Orfi Bengo in 1927.1 Since then, the Egyptian movieindustry has become the most important in the Arab world. More than 75 per cent of the 4,000 short and feature-length films made in Arabic–speaking countries since 1908 have been Egyptian.2 At its peak, the film industry of Egypt produced some 60 to 70 feature films a year.3 By the late1990s, however, the industry managed to produce only 15.4
The film industry was boosted by the creation of Studio Misr in 1935, becoming “the nucleus of a genuine film industry as part of 20 or more enterprisesby Talaat Harb meant to contribute to the Egyptianisation of the economy”.5 Studio Misr grew to be one of Egypt’s largest production companies, Egypt’sequivalent of Hollywood, and continued to play a prominent role for more than three decades.
The internationally successful films of the 1950s, including musicals and comedies, became classics while their stars became screen legends and theirproducers were internationally acclaimed. Filmmakers produced serious films; Youssef Chahine, for example, won accolades and awards throughout hislong career such as the golden anniversary award at the fiftieth Cannes Film Festival in 1997 for lifetime achievement. He also was the only Egyptiandirector honoured by the Berlin, Cannes and Venice film festivals.6
The film industry did not fare well during the time of Gamal Abdel Nasser. Attendance at movie theatres as well as actual film theatres declined dramat-ically with the nationalization of radio and television industries in the early 1960s. Film theaters in the period 1955-1975 declined from more than 350to fewer than 250 while at the same time, imported foreign films flooded the market.7 The losses incurred by the State film organization saw the grad-ual halting of film production by the early 1970s. The financing from oil-rich Gulf countries of films for television (1980s) and satellite production (1990s),accompanied as it was by the tightening of censorship requirements covering sex, politics and religion, exacerbated the decline of the film industry. Manyfilm critics point to the current power of censors to limit artistic creation and freedom of expression, particularly with respect to criticism of religion. Inaddition, funded television shows benefited enormously from the Gulf petrodollars of the 1980s, also to the detriment of film, so that by the mid-1990s,the Egyptian film industry was thought to be in a state of crisis, with the annual production of films falling to single digits.
At the same time, the last 10 years have seen a new group of Egyptian women film directors emerge such as Hala Khalil, whose “Ahla Al-Awquat” (“Bestof Times”, 2004) reflects on the reality of her generation of Egyptian women set in present-day Cairo.
While the Egyptian film industry is still the biggest in the Arab world, Egyptian filmmakers are concerned about many issues from the quality of film-making, the standard of film courses at the High Cinema Institute, censorship, religious fundamentalism, level of production and technical standards inEgyptian film-making to financing and the level of intellectual property protection. Prominent Egyptian director, Inas al-Deghedy, spoke to Guy Brown inCairo about the quality of film-making, financing and fundamentalism: “Poor quality movies are a reflection of economic difficulties. People are not look-ing for movies that explore important issues; they are trying to escape the economic situation. That is why comedians dominate the industry at themoment … There is no comparison between Egyptian and American or European movies. Production standards in American movies are far ahead of us;European movies are not so far ahead, which is partly because they are also experiencing financing problems … Now the whole industry is based onfilms that are self-financed. They do not have a good source of financing from Arab countries … Seventy-five percent of revenues come from the

179C R E AT I V E E C O N O M Y R E P O R T 2 0 0 8
Polic
y strate
gie
s for th
e c
reative
industrie
s
8
Box 8.1 continued The Egyptian film industry: The waning of the “Hollywood of the East”?
cinema, and 25 percent from video and satellite. Revenues disappear into thin air because of inadequate intellectual property right protection, particu-larly on the international scene … The Egyptian people are the true censors … Fundamentalists are creating a serious problem for the industry, becausethey are wrapping new films up in red tape”.8
Today Egyptian cinema straddles both those films with high artistic quality attracting international attention and popular films, particularly those in thecomedy genre.
The core of Egypt’s flourishing film industry is based in Cairo, which hosts the world-class annual International Film Festival. Some films have success-fully bridged the art/individual-popular divide, such as the 2003 “Sahar el Layali” (“Sleepless Nights”) and the 2006 “Imarat Yacoubian” (“The YacoubianBuilding”). The latter is based on a novel by dentist author Alaa El-Aswani, published in 2004 and “containing all that the majority of Egyptians talk aboutin private”.9 This film with its depiction of homosexuality and other issues considered taboo as well as some newer releases indicates a film industrythat is increasingly willing to take risks. “Awkat Faragh”, for instance, is a social commentary on the decline of youth in Egypt and the sexual undertonesin today’s society, and despite being controversial and produced on a low budget, the film went on to become successful.
The Egyptian film industry is again in a delicate position not only because of societal taboos and the rise of fundamentalism but more importantly alsobecause of how film is viewed both by the authorities and society more generally as being outside of culture and heritage. As Samir Farid points out,“Arab countries, including Egypt, do not view their cinemas as part of their national heritage or an art worthy of government subsidy. Film is not taughtin colleges of fine arts and newspaper film reviews tend to be located on the entertainment pages, rather than in the arts and literature pages”.10 Thereare no negative archives, cinematheques, video libraries or film museums and copyright protection is poor. As is the case with music in much of Africa,Arab film production companies prefer up-front payment rather than waiting for possible future financial rewards, which leads to a lack of attention towhat happens to their originals and copies. As film critic, Mohamed El-Assiouty, laments, “…they are not in the least concerned with preserving theiroriginals and more often than not neglect to place a positive copy in the Egyptian National Film Centre (ENFC)’s store room”.11
The proposed Media Production City, a $200-million, 5,000-acre production venue with a development projection of 10 years will become the newEgyptian equivalent of Hollywood. It will have 13 state-of-the-art sound stages, outdoor sets (from Pharaonic cityscapes and medieval Islamic backdropsto Egyptian villages, modern Egyptian street scenes and agricultural settings), film processing laboratories, an open-air theatre, a training centre, admin-istration offices and a hotel for actors, production personnel and visitors.12 However, it will ultimately be up to the artists – from scriptwriter to directorand producer – to ensure that Arab cinema remains creative and vibrant.
1 See http://www.powerofculture.nl/uk/specials/film/egypt.html2 Samir Farid, “Lights, camera --- retrospection”, Al-Ahram Weekly, no. 462, 30 December 1999-5 January 2000. Available online at:
http://weekly.ahram.org.eg/1999/462/cinema.htm3 Peter Warg (2007), “Egypt’s Hollywood mammoth film centre going up near Giza”, in New Middle East Magazine. Available online at: http://archives.obs-us.com/obs/ger-
man/books/mem/n01a08.htm4 Guy Brown (2002), “The movie business in Egypt”, AME Info, 8 December 2002. Available online at: http://www.ameinfo.com/16692.html5 Musri Saad El-Din (2007), “Plain talk”, Al-Ahram Weekly, no. 838, 29 March-4 April 2007. Available online at:
http://weekly.ahram.org.eg/2007/838/cu3.htm6 Samir Farid (2006), “An Egyptian story”, Al-Ahram Weekly, no. 821, 23-29 November 2006. Available online at:
http://weekly.ahram.org.eg/2006/821/cu4.htm7 Advameg, Inc. (2007), “Economics and Politics, Egypt”. Available online at
http://www.filmreference.com/encyclopedia/Criticism-Ideology/Egypt-ECONOMICS-AND-POLITICS.html8 Quoted in Guy Brown (2002), ibid.9 Samir Farid, “Seven”, Al-Ahram Weekly, no. 849, 14-20 June 2007. Available online at: http://weekly.ahram.org.eg/2007/849/cu4.htm10Samir Farid, “Lights, camera – retrospection”, ibid.11Mohamed El-Assiouty, “Forgotten memories”, Al-Ahram Weekly, no. 445, 2-8 September 1999. Available online at: http://weekly.ahram.org.eg/1999/445/cu5.htm12Peter Warg (2007), ibid.
By Avril Joffe, Director, CAJ (Culture, Arts and Jobs).
8.4.4 Development of export markets
Strategies for developing domestic creative industriesthat are outward-looking and that actively target FDI andexport markets in addition to local markets for creative prod-ucts have proved successful. In this context, East Asian coun-tries stand out. For example, the Singapore strategy is aimed
at establishing a reputation for Singapore as a new Asian cre-ative hub. Among the list of international creative industriesthat it has succeeded in attracting are international filmfinancing company RGM Holdings, electronic games devel-oper Koei Company, Ltd. from Japan, and automotive andproduct design studio BMW DesignworksUSA. In addition,

180 C R E AT I V E E C O N O M Y R E P O R T 2 0 0 8
Polic
y st
rate
gie
s fo
r th
e c
reati
ve i
ndust
ries
8
53 foreign media companies have set up regional headquar-ters or hubs there in the last four years. Similarly, the indus-tries of Hong Kong SAR are highly export-oriented giventhe small size of the local market and have benefited fromtheir spatial and cultural proximity to the huge market ofmainland China. Likewise, United States’ creative industries,which are very competitive and have an established reputa-tion, vigorously pursue opportunities in export markets.
8.4.5 Protection of creators’ rights
Because creative industries are based on intellectualproperty, an important aspect of the legislative frameworkfor creative industries is the enforcement of IPRs relating tocultural activities and creative goods and services. Effectiveintellectual property regimes that protect the originators’interests and stimulate creation and innovation are thereforea pre-requisite for access to global markets. A balance needsto be struck, however, between strengthening of IPRs andstrengthening the public domain. Ensuring that this balanceis established is essential to asset management and wealthcreation in the creative economy.
A number of developing countries particularly in Asiaand Latin America have adopted legislation to protect IPRs.Examples from Africa include Algeria, Burkina Faso,Cameron, Cape Verde, Côte d’Ivoire, Djibouti, Ghana,Kenya, Madagascar, Malawi, Mali, Mauritius, Namibia,Niger, Nigeria, Seychelles, South Africa, Swaziland, Togo,United Republic of Tanzania and Zambia. Nevertheless,there are many other countries in the developing world wherecopyright protection for the products of the creative econo-my is weak or nonexistent. Furthermore, even where copy-right systems do exist, there are often problems of monitor-ing and enforcement, especially in the absence of an efficient,transparent and fully accountable structure for the collectionand management of IPRs.
Piracy is a critical challenge in many developing coun-tries. In Africa, for example, piracy is a particular problem,as it destroys the ability of African artists to have a viablecareer as an artist or, in fact, the creative industry to becomeviable. There is some evidence to suggest that in the musicindustry at least, pirate operators have a competitive advan-tage since their costs are lower and they have minimal capitalinvestment requirements, linkages with informal but highly efficient distribution networks, and, at times, the
collaboration of individual artists who want to enhance theiraudience numbers. Policy-makers, collection agencies,recording companies and artists need to be cognizant ofthese factors in formulating a response and set of policies todeal with unauthorized use.
The establishment of collecting societies where theydo not already exist is an essential step towards improving thecopyright regimes of developing countries. Even where col-lecting societies do exist, however, their successful operationis sometimes adversely affected by shortcomings in the oper-ation of sister societies in other countries. For example, anoften repeated complaint by the Caribbean music industry isthe failure of collection societies in developed countries tocapture airplay and live performance statistics for Caribbeanmusic played overseas, while the Caribbean collects and dis-tributes significant royalty payments abroad. This perceivedunfairness in treatment means that Caribbean artists receivevery little in the way of royalty payments from outside theCaribbean. Alternatively, many artists in developing coun-tries are turning to live performances because this enablesthem to capture revenues directly and some may be party tothe distribution of pirate copies of their work.
8.4.6 Establishment of creative clusters
The various subsectors of the creative economy havetheir own particular needs, identity and modes of organiza-tion – the music industry or the publishing industry, forexample. From a policy perspective, however, a small-scalepublisher is likely to have more needs and problems in com-mon with a small professional music ensemble or a smallpottery and weaving business than it has with a larger-scalepublisher, wherever these creative professionals are located.Thus, although the performance of individual drivers maydiffer from country to country, their impact on the develop-ment of the creative industries may be able to be optimizedthrough national and regional cooperation within a clusterstrategy. As discussed earlier in this Report, clustering is asystem for networking of independently functioning unitsthat optimizes the individual unit’s function and potentialinstead of exploiting them. A cluster brings together individ-uals and groups that create products that compete but mustalso cooperate within the broader context of the creativeindustries. Clusters can develop naturally or be created for a
181C R E AT I V E E C O N O M Y R E P O R T 2 0 0 8
Polic
y strate
gie
s for th
e c
reative
industrie
s
8
Box 8.2 Shanghai creative industries: The Chinese way
The concepts of “creative economy” and “creative industry” have had great impact on China’s social and economic development, the most importantbeing the discovery of the economic value of culture. The academic and public sectors in China have focused on the value of the creative economy as“a kind of newly emerging culture perspective and economic practice that stresses the support and promotion to the economy of art and culture”.Therefore, in many cities of China, instead of “creative industry”, the “cultural creative industry” is a more commonly used term.
As a country with a long history and rich cultural heritage, China has always experienced a strong demand for cultural products. The industries are man-ufacturing products for international brands, making China one of the biggest exporting countries in the world, but these products are “made in China”,not “created in China”. As a result, China’s new generation is playing Korean games and watching Japanese cartoons and Hollywood movies. Chinesepeople are increasingly surrounded by products originating in the creativity and culture of other countries. A 2006 survey on the consumption of creativeproducts in Shanghai showed that the group between 20 and 35 years of age prefers international brands much more than local brands, and this ten-dency is even stronger in younger groups. This tendency is caused by the dominant idea that culture and economy are separate entities; however, thecreative industries may help to reverse this trend. Creative industries focus on culture and creativity and then extend to other related industries in theform of a value chain, providing broader ways of generating value-added products and services.
In China, Shanghai was a pioneer city in the promotion of the creative industries, with the Municipal Government playing a key role. In the 11th Five-YearPlan of the Shanghai government, promoting creative industries has been listed as a key issue in developing modern service industries. In the past,Shanghai was very strong in manufacturing, but now it is shifting towards the service and finance industries. Hence, in 2007, it was a government priority to accelerate the development of creative industries so as to promote the structural reform of industries with a view to building a new frameworkfocused on the service economy. In the “Key Guide for the Development of Creative Industries in Shanghai”, the five main areas of creative-industry devel-opment are:
• R&D, including advertising, animation, software and industrial design;
• architectural design, including engineering and interior design;
• culture and media, including art, books, newspaper publishing, radio, television, film, music and performing arts;
• business services, including education, training and consulting services; and
• lifestyle, including fashion, leisure, tourism and sports.
Creative industries already account for about 7 per cent of Shanghai GDP. Seeking to turn Shanghai into a creative city, the government has set a targetof 10 per cent for the contribution of creative industries to total Shanghai GDP in 2010.
specific purpose; they may cover many or a few industries;and they may contribute to development in a particular geo-graphical location as in the many creative-industry parksestablished in recent years in cities such as Barcelona inSpain, Rosario in Argentina and Shanghai in China.
The promotion of cluster development has proved tobe an efficient way of organizing the creative industries andthe non-formal sector. Cluster development contributes tothe creation of synergy both within and between differentsubsectors of the creative industries. It also contributes tothe identification of needs of the sector and areas for policydevelopment, and helps to justify relatively large investmentsthat focus on the drivers (the infrastructure) needed to create the necessary enabling environment for the promotionof growth in the creative-industry sector.
8.4.7 Institution of effective data-collection measures
The analysis in this Report points to the need for theestablishment of a methodology for the collection andanalysis of universally comparable and reliable data on creative industries that mapping studies rarely meet. The cre-ative industries in the South operate mainly in the informalsector, where usually the terrain is uncharted and the infra-structure of the industries remains opaque. There is nodoubt that targeted investment and policy can go a long wayin realizing the growth potential of the creative industries,but unless the economic value of these industries can bebenchmarked and measured, few concrete policy steps can betaken towards this goal. The establishment of means withindeveloping countries to collect reliable and consistent dataon the creative economy, as discussed in chapter 4 of thisReport, should be a matter of high priority in the creative-industry development strategy of any country.

182 C R E AT I V E E C O N O M Y R E P O R T 2 0 0 8
Polic
y st
rate
gie
s fo
r th
e c
reati
ve i
ndust
ries
8
Box 8.2 continued Shanghai creative industries: The Chinese way
Stages of development of Shanghai creative industriesShanghai has divided its development of creative industries into three stages: creative-industry parks, creative-industry clusters and creative-industryprojects.
■ Stage 1: Creative-industry parks – the model of old factory warehouses plus artists. In the first stage, many old warehouses in the downtown areawere renovated and furnished to become modern office buildings while retaining some of their original equipment and appearance. These buildingsare usually spacious with high ceilings, making an ideal environment for the start-up of creative businesses by artists and entrepreneurs. Since thesebuildings were almost useless in the past, the rents were comparatively low and thus good for creative companies and individual artists. This modelhas proved to be quite successful: by the end of March 2007, 75 creative-industry parks had already been built in Shanghai.
Since most creative businesses start small and are modestly capitalized, these creative-industry parks play an important role at bringing such busi-nesses together and providing an enabling environment. In addition, they may facilitate marketing such companies since the clients may approachcreative-industry parks when searching for suppliers.
M50, an old warehouse converted into painting and sculpture galleries and studios, is a very good example of these creative-industry parks. Numerousvery creative artists are now concentrated in M50 and receive many visitors and clients. Some of the artists at M50 became very successful and nowhave their artwork listed in Sotheby auctions.
With the support of the government, owners of culture-industry parks are able to convert unprofitable warehouses into prosperous office buildings.In turn, the surrounding environment also improves. This model has proved to be very successful from a business perspective. However, it has someshortcomings. Creative-industry parks remain owners, while creative businesses are renters. As real estate values increase and rents rise, some com-panies and artists are forced to relocate, consequently hindering the industries’ development.
■ Stage 2: Creative-industry clusters – clusters formed according to the local art and cultural resources. Eventually, creative-industry parks were foundto be insufficient to fully support the development of the creative industries. The Shanghai Municipal Government has stopped building new creative-industry parks but continues to maintain and develop the existing 75 parks. Based on the latter, the government starts to explore the development ofcreative-industry clusters, which take into consideration the characteristics of the local art and culture and intentionally focus on certain industries.As a result, a full range of companies and businesses in the value chain are concentrated in these clusters so as to foster the development of thatparticular industry. The main industries include: the theatre and performance-art cluster, the film and television cluster, the comic cartoon and gamecluster, the gallery cluster and the intellectual-property cluster. For example, the Zhangjiang Culture and Technology Creative Cluster has attractedenterprises relating to comics and cartoons, games, television and movies, and post-production services. At present, this cluster concentrates 70 percent of the total production value of game software in China, including some of the top game businesses.
■ Stage 3: Creative-industry projects – big and important events and projects based on the value chain. Shanghai is also trying to promote such proj-ects in the creative industries. For the 2010 World Expo, a creative project is being carried out that will place in one service system all the elementsattractive to a participant in the World Expo, including clothing, food, accommodation, travel and entertainment. This kind of big project has greatpotential to promote the creative enterprises in Shanghai.
All these quick developments require strong support from the government. A long-term policy and related strategies are necessary for the stable promo-tion of the creative industries. Moreover, five-year plans are an effective way of informing people of the direction of development. Government initiativestake the leading role and must continue to be the main impetus, particularly when facing competition from more developed creative industries in othercountries. For China, the development of creative industries involves almost all industries, and people are increasingly aware of this trend. Our target,however, extends beyond GDP increases and includes the exploration of the potential of deeply-rooted Chinese culture for making creative products richin Chinese culture and heritage. The cultural value of the creative industries lies not solely in its products but also in the emergence of culture as a coreelement of industrial and economic activities. Much progress remains to be made, though, as Chinese industries have been mainly manufacturers.However, as exemplified by the experiences of other countries, creativity will become a driving force in the whole economy.
China is facing the twofold task of promoting new industries and improving traditional industries. Fostering cultural development is also paramount.The creative industries provide us with a new perspective on our current gap vis-à-vis developed countries and a new way to explore the potential ofdevelopment as a big country rich in cultural resources.
Awareness of the value of creativity is just beginning in China. In the last two to three years, many cities have begun to explore the creative industries.In the 16 cities that belong to the Yangtze delta, 14 are boosting creative industries. Moreover, Beijing has taken powerful measures to support its creative industries. The value of creative talents is also increasingly recognized in the society, with schools encouraging greater creativity among its students, a change that may influence China’s entire education system. To properly understand and take advantage of this trend, the Ministry of Educationhas started a three-year research project on China’s strategy towards the creative industries. This exemplifies China’s commitment and vision for devel-opment. Though its experience may not be easily replicated, it could be an interesting reference for other countries, especially developing ones.
By Prof. He Shou Chang, Executive Vice Chairman, Shanghai Creative Industry Association.
183C R E AT I V E E C O N O M Y R E P O R T 2 0 0 8
Polic
y strate
gie
s for th
e c
reative
industrie
s
8
8.5 Targeted measures for enhancing creative capacities
In this section, we return to the production structureof the creative sector as described in chapter 3 and examinesome specific policy measures that governments can under-take in respect to particular components: the non-formalsector, the creative arts, SMEs, public cultural institutionsand the corporate sector.
8.5.1 Non-formal sector
Many activities in the creative economy, especially inthe poorest countries, are (or at least start out as) small-scale,often household or cottage industries that are not targeted byexisting Government regulation and support for businessdevelopment. The fact that many of these “industries” maybe part of the non-formal sector complicates matters. Torealize the full potential of the creative-industry sector, thereis a need to formulate strategies and policies that mainstreamthe non-formal sector by providing legal support and anenabling environment for the development of these businessactivities in the same way that such facilities extend to othersectors of the economy.
8.5.2 Creative arts
Individual artists can be seen as primary sources ofcreative ideas and interpreters of traditional knowledge. Assuch, they are an indispensable element as the very first stagein the value chain for most, if not all, creative products. Yetas sole traders or as workers on casual hire or short-termcontracts, they frequently lack the industrial power or busi-ness acumen to make a reasonable living and to receive anequitable reward for their work. Areas of government assis-tance that are appropriate here include:
■ grants to support the creative activities of artists, provid-ed on a project basis (for individuals or groups) or as con-tinuing support funding;
■ assistance for education, training and skills development;
■ support for artists’ organizations that can act asspokespersons, advocates and negotiators on behalf ofmembers; and
■ copyright regulation to ensure proper remuneration forthe creation of artistic works in various art forms (see further below).
8.5.3 Small and medium-sized enterprises
The prevalence of small and medium-sized enterpris-es (SMEs) in the creative sector underlines the need for pol-icy-makers to address size-related constraints. SMEs in cre-ative industries are susceptible to the same constraints thatafflict small enterprises in other areas of the economy. Chiefamong these constraints is access to finance to develop cre-ative projects. The transformation of creative ideas intoproducts or services is usually capital-intensive and the costof technological inputs or other professional services are thesubject of significant business components of these indus-tries. In short, access to finance remains one of the key hur-dles for creative entrepreneurs looking to resize their creativeideas. Larger enterprises in the economy may be one sourceof finance to SMEs. In economies where the financial sectoris better adapted to financing small businesses and where cre-ative industries are officially recognized, SMEs are at anadvantage. This is not the case in most developing countries.
Other challenges faced by SMEs include a lack ofbusiness skills relating to marketing and financial manage-ment, information asymmetries and resource constraintsaffecting access to up-to-date technologies. Available infor-mation indicates that size-related constraints are an issue indeveloped and developing economies. For SMEs in develop-ing countries, however, these challenges are more acute, par-ticularly since the concept of “creative industries” is still verynew to most of the developing world and the supportingnetwork of local-industry participants providing comple-mentary services is largely absent when compared to moredeveloped countries. Consequently, the competitiveness andability of developing countries to grow recognizable indus-tries in the creative sector are compromised.
For instance, in many developing countries, it is morecommon that the proprietor fulfils a number of organiza-tional roles: producer, agent, marketer and retailer. This is

184 C R E AT I V E E C O N O M Y R E P O R T 2 0 0 8
significant since the level of specialization or availability oflocal specialized participants along the supply chain appearsto be highly correlated with the competitiveness of creativeindustries. On the whole, the supply chain of creative indus-tries in many developing countries appears to exhibit a num-ber of gaps and fragmentation – in particular the absence ofintermediaries who play an important role as gatekeepers.For example, there are numerous cases in the South Africanmusic industry where there remains a dearth of entertain-ment lawyers despite the fact that the music industry is fairly well established. As a result, many artists opt to selltheir rights in exchange for a one-time upfront payment, thusforgoing a regular and steady flow of income in favour of alivelihood that is dependent on a punishing schedule and theprolific release of albums.
Given the prevalence of SMEs in the creative economyof developing countries, it is not surprising that financingavenues such as microfinance will feature prominently in anypublic/private investment strategy. Successful microfinanceprogrammes operate in a number of countries, such asGrameen Bank in Bangladesh and Banco Sol, which wasestablished in Bolivia in 1992 and which operates in Latin
America and the Caribbean. For the most part, these organ-izations provide finance for small businesses in agriculture,retail, etc. and have to date had little to do with the creativesector perhaps because creative producers are unaware of theavailability of such funds.
The potential for microfinance as a source particularlyof start-up capital for SMEs in the creative sectors of devel-oping countries would appear to be strong. As argued byCunningham et al. (2007:80), microcredit is attractive as asource of investment funds for creative businesses because:
■ it is a proven and effective model;
■ it provides amounts suitable both as start-up and workingcapital;
■ it has the potential to develop small-scale enterprises to apoint where they become more attractive to investors andeligible for other forms of credit;
■ the model is flexible and adaptable to specific local condi-tions; and
■ it offers a way of overcoming some of the problems ofcommercial financing such as risk management and theintangible nature of creative assets.
Polic
y st
rate
gie
s fo
r th
e c
reati
ve i
ndust
ries
8
Box 8.3 Alphadi: The fashion caravan
Seidnaly Sidhamed, alias Alphadi, was born on 1 June 1957 to trader parents in Timbuktu, Mali. One of nine children, in Niger he grew up in the companyof his siblings and liked to put makeup on his sisters and mother. He also studied the makeup of actresses in Hindu films. At a young age, this designer-to-be was already intrigued by everything that could enhance and better showcase feminine beauty. In Niger, however, fashion was taboo for boys.
While his father had envisaged that Alphadi would pursue a medical career or work in the family business, following graduation from high school, Alphadiwent to Paris to study tourism. In this centre of fashion, he was able to attend fashion shows and he also took night courses at the Chardon Savard atel-ier. Once he had completed his studies, he accepted a director’s position at the Ministry of Tourism in Niger, but he still had a passion for fashion. Whileworking at the Ministry, he continued to perfect his fashion skills by receiving in Niger professors from Chardon Savard.
In 1985, two years after having decided to devote his life to fashion, he presented the haute couture fashion line that he had created at his first fashionshow, which was held in the City of Light during the International Tourism Tradeshow. From that time on, Alphadi has had many successes, including theBest African Designer award from the Fédération française de la couture et du prêt-à-porter in 1987. His fashion shows are familiar worldwide – inAbidjan, Brussels, New York, Niamey, Paris, Quebec, Tokyo, Washington. In 1999, he expanded his label by creating a line of sportswear called AlphadiBis. With Wrangler, he also created Alphadi Jeans, and 2000 saw the launch of l’Air d’Alphadi, the first perfume by an African couturier.
After twenty years of a career in fashion, with fashion shows organized all over the world, boutiques in Africa, Europe and the United States and, mostimportantly, an internationally respected brand, Alphadi is one of the most well-known African designers from the continent. Warm, very affable and experienced, this artist is ever ready to talk about his field. Inspired by the rich traditions and colours of Africa, Alphadi “firmly believes that fashion andculture are the industries that can lift Africa to the ranks of prosperous nations”.
Alphadi, Paris.

185C R E AT I V E E C O N O M Y R E P O R T 2 0 0 8
As this Report has demonstrated, the creative industriesare a potential source of real development gains for countriesin the developing world, but such gains cannot be achieved ina vacuum. They require carefully formulated policy strategiesthat recognize the complexities of the interaction betweeneconomic, cultural, technological and social dimensions of thedevelopment process and that are implemented on a multi-agency basis. It must be acknowledged that all countries aredifferent and that there will not be a standard or uniformpackage of policy measures that will fit every circumstance ona one-size-fits-all basis. Nevertheless, in this chapter, we havepointed to some overall features of policy strategies that arelikely to be applicable in most developing-country situations.These are:
■ the need for strengthening of the infrastructure that supports the creative economy;
■ the desirability of capacity-building to ensure that countriescan continue to oversee the development of their creativeeconomies on a sustainable basis;
■ the critical role of finance and investment in areas wherethe government can play an important facilitating role;
■ the desirability of adopting measures to expand theexports of creative products and to foster import replace-ment, especially with respect to audiovisuals;
■ the need for appropriate copyright legislation and theadministrative infrastructure to provide effective enforce-ment; and
■ the importance of protecting the fundamental artistic andcultural resources on which the creative economy depends.
In addition to domestic policy strategies, internationalaction is also required, as will be discussed in chapter 9.
Polic
y strate
gie
s for th
e c
reative
industrie
s
8
8.6 Tailoring policy action at the national level
8.5.4 Public cultural institutions
Governments in most countries play an important rolein the creative economy by their ownership and operation ofpublic cultural institutions such as art galleries, museumsand heritage sites. They are also often owners of significanttangible cultural heritage such as historic public buildingsand collections of nationally significant artworks, artefacts,etc. These cultural responsibilities of government should beseen as integral to the creative economy, especially because ofthe role of these institutions and activities in encouragingtourism, promoting social cohesion and fostering the bene-ficial aspects of cultural diversity. As such, their capital andcurrent expenditure needs should be seen not as inessentialluxury items in government outlays but as an essential contribution to the vitality of the creative industries.
8.5.5 Corporate sector
The existence of large-scale enterprises in theeconomies of developing countries arises as a result both ofthe growth and amalgamation of domestically owned compa-nies and the establishment of offshoots of transnational cor-porations. Such large corporations can be found in the cre-ative sectors especially of the more advanced countries in thedeveloping world. Since they are essentially commercial oper-ations motivated by the prospect of financial gain rather thanby any “pure” cultural objectives, they are likely to be treatedby governments in the same way as businesses in any othersector of the economy will be treated. Nevertheless, govern-ments may see some particular attraction in facilitating thegrowth of specifically creative businesses in order to “surf thewave” of growth that the creative economy appears to offer.

186 C R E AT I V E E C O N O M Y R E P O R T 2 0 0 8
Polic
y st
rate
gie
s fo
r th
e c
reati
ve i
ndust
ries
8
Box 8.4 Cultural policy in action: The Nairobi Plan of Action
As a prelude to the full implementation of the African Economic Community, cultural leaders in Nairobi in 2005 urged their governments to include in thelegal and institutional frameworks for the development of cultural products their free movement in all African countries and to detail legislative and fis-cal measures to foster cultural industries through a “policy subsidy”. The Common Market will be based in broad outline on the Nairobi Plan of Actionfor the Development of Cultural Industries adopted in December 2005.1
The objectives of the Nairobi Plan of Action are summarized in the following table.
Objective: Guarantee the organization, production, distribution, exhibition and preservation of the products of African cultural industries
Economic Social Political
Generate new resources for the Strengthen the African cultural Reduce the dependence on the wider worldeconomic development of Africa identify and creativity as well outside of Africa for the productionand the creation of new jobs and as broaden people’s participation and distribution of cultural goods.income-generation opportunities. in endogenous cultural development.
Open up new markets for African Facilitate new institutional partnerships culture in and outside of Africa. between the public sector, private sector
and civil society such as within the framework of the UNESCO Global Alliance for Cultural Diversity and the New Partnership for Africa’s Development.
Strengthen the African cultural Strengthen the acknowledgement Adopt flexible responses to initiatives from identity and creativity as well as of the cultural dimension of the African private sector towards thebroaden people’s participation in sustainable development in Africa. development of cultural industries.endogenous cultural development.
Strengthen the competitiveness of African cultural goods within the framework of globalization and the liberalization of markets.
Improve national capacities for creating, Bring about new and pluralistic Achieve better regional integration.producing, distributing and exhibiting forums of cultural expressioncultural goods. supporting the installation of
democracy in African societies.
Strengthen private and community Strengthen the role of the private sector initiatives of small and medium-sized and civil society.enterprises.
Enhance the organization and protection of creators. Develop South/North cooperation as well as
South/South cooperation and real partnership.
Set up an African Cultural Common Market and develop intra-African cooperation.
The priority recommendations arising from the Nairobi Plan of Action are fourfold:
• to map existing cultural activities, structures, resources and products in all member States;
• to identify and consider regional and sectoral specificities and strengths to enable the rationalization of legislation, policies and resources;
• to conduct research to assess the economic impact of cultural industries and initiatives; and
• to establish regional cultural think tanks to source information and debate the status of each subsector.
1 The Observatory of Cultural Policies in Africa has been assisting African governments and promoting private-sector initiatives aiming at better coordination of culturalpolicies on the continent. It has developed a network for sharing regular international information and promoting regional initiatives. See:http://ocpa.irmo.hr/resources/ref/AU_POA_Industries_2005-en.pdf .

Multilateral processes are the essence of internationalpolicies and the driving force to move forward the interna-tional economic and development agenda. As the evidencepresented in chapter 5 shows, the creative economy is grow-ing and innovating at an unprecedented rate in regions thatpreviously were lagging behind the development curve. Thecreative economy cannot be seen in isolation, however. Globalprocesses play a key role in shaping public policies at thenational and international levels. Multilateral negotiationsand intergovernmental debates taking place in internationalorganizations, particularly in the context of the UnitedNations family and the WTO, are paramount to advancinginternational action and to ensuring that the full economicand development benefits of the creative economy are realized in developing countries.
The creative economy emerged within an interna-tional policy framework highly influenced by theMillennium Declaration that was unanimously adopted atthe United Nations General Assembly in 2000 by theinternational community, comprising 192 Member States.For the achievement of the Millennium DevelopmentGoals (MDGs), a series of policy instruments have beenarticulated by the United Nations bodies to assist developing countries in the process of implementation, as
discussed in chapter 1. The most important multilateraldecisions taken at the beginning of the third millenniumand of particular relevance to the creative economy were:the Programme of Action for the Least DevelopedCountries for the Decade 2001-2010, the UNCTAD XISão Paulo Consensus, and the Declaration of Principlesand the Plan of Action of the World Summit on theInformation Society. Furthermore, the DohaDevelopment Round was launched by WTO in 2001.More recently, the UNESCO Convention on theProtection and Promotion of the Diversity of CulturalExpressions entered into force in March 2007, and theWIPO Development Agenda was adopted in October2007. All these multilateral processes have in common thefact that they have placed development at the heart of theirconcerns and actions.
In this context, the creative economy, in bringing amore holistic approach to development by dealing witheconomic, cultural, social and technological issues, offerssome possible options to support developing-countryefforts to foster development in line with the MDGs. Thischapter highlights the mandates and the work being carriedout by the United Nations organizations collaborating inthis endeavour.
187C R E AT I V E E C O N O M Y R E P O R T 2 0 0 8
The
inte
rnatio
nal
dim
ensio
nof
cre
ative
-industrie
spolic
y
9
CH
AP
TER
9 The international dimension of creative-industries policy
9.1 The international policy framework
9.2 UNCTAD: Creative industries on the economic and development agenda
UNCTAD has been proactive in promotinginternational policy action to assist developing countriesto enhance their creative industries and hence their creativeeconomy for trade and development gains.
9.2.1 UNCTAD X: Audiovisual services
At the tenth session of UNCTAD (UNCTAD X)held in Bangkok, Thailand, and attended by representativesof 168 member States, the UNCTAD secretariat was

Box 9.1 Television and soap operas
188 C R E AT I V E E C O N O M Y R E P O R T 2 0 0 8
mandated to carry out research and analysis with a view toformulating policy recommendations in the area of trade inservices, including audiovisuals.1 An intergovernmentalExpert Meeting on Audiovisual Services was convened byUNCTAD in 2002 in close collaboration with UNESCO.This intergovernmental forum provided insights to assist
developing countries to examine the issues relating to tradein audiovisual services and formulate positions in the contextof WTO negotiations, particularly as regards the GeneralAgreement on Trade in Services (GATS) and the Agreementon Trade-Related Aspects of Intellectual Property Rights(TRIPS Agreement).
The i
nte
rnati
onal
dim
ensi
on o
f cre
ati
ve-indust
ries
polic
y
9
TV Globo is a Brazilian broadcast television channel whose signals reaches 183 million viewers with its continental range. It offers a rich range of programming at no cost to millions of homes across the country, from entertainment to news, helping to spread a variety of points of view as it strives toconstantly innovate both in format and language. With its continental reach, TV Globo touches all creeds, classes and geographic regions and has emergedas one of the most valuable tools for preserving the nation’s cultural heritage not merely because of its commanding geographical presence but also asa source of inspiration for literature, theatre, film, music and the visual arts. There are no limits to exploring the frontiers of knowledge on television, onlythe challenge of making complex ideas easily comprehensible without becoming superficial, and reporting what is essential and true to the widest possible audience. This is the daily demand of television, a job that calls for both professionalism and sensitivity.
TV Globo’s rise as a major production centre (generating some 2,500 hours of entertainment programming a year) and as a training ground for actors,directors, screenwriters, technicians and producers also creates valuable spin-offs in the audiovisual industry, from independent production companiesto the growing market for Brazilian-made films. The network’s artistic footprint falls far beyond national borders. Exporting programming to over 150 coun-tries, it is no exaggeration to say that Globo has become Brazil’s cultural ambassador to the world. TV Globo employs 18,000 people and has 5 channelsand 116 affiliates.
But Globo also strives to fortify civic responsibility and awareness even as it entertains. Among privately owned networks, we are world pioneers in sys-tematically working themes of social relevance and matters of public interest into our everyday programming grid – without the slightest interferencefrom sponsors or a cent in government funding.
Today, TV Globo reaches audiences across the world. In 2006, it exported 64 programmes to 73 countries worldwide, a veritable cultural blitz representing25,000 hours of licensed airtime. Not to mention TV Globo International, the first Brazilian 24-hour channel to be beamed by satellite to Brazilians andPortuguese speakers abroad. Launched in 1999, this channel now airs in 104 countries and boasts more than 420,000 premium subscribers. More than300 productions were sold to 130 countries.
In recent years, TV Globo has also brought an innovative social dimension to its sports coverage. Whether in publicity drives, straightforward reporting orthough outright entertainment, TV Globo widens its lens beyond the thrill of competition to capture how sporting events can serve as a springboard forsocial inclusion. Calling on sports figures from famous athletes to physical education instructors, we strive to demonstrate the importance of education,discipline, dedication, respect, and solidarity as well as the need to overcome adversity.
If TV Globo’s programming plays a central role in Brazilian society, our contribution to the media industry and the national economy as a whole is no lessremarkable. Advertisers themselves tell of how TV Globo’s high programming standards raised the bar for their own industry, driving commercials to newlevels of technological sophistication and creativity. No wonder Brazilian television advertising has won applause and prizes the world over. In Brazil, thevast majority of advertisers are small and medium-sized companies and agribusiness, which together provide most of the jobs in the formal economy.
All these initiatives and the community response they generate are part of the process of creating what might be called the “public value” of broadcast tele-vision, represented here by the Globo Network. Building public value is a goal prized by institutions the world over and one that a private company such asTV Globo managed to achieve thanks to the democratic choice of our viewers – a partnership that has kept us in synch with Brazil for more than 40 years.
This record of accomplishment is what gives us the will to keep on working, to the best of our abilities, to advance social development and so to carry outour mission to create, produce and disseminate top-quality products that inform, educate and entertain to better the lives of individuals and their commu-nities. After all, in the very document that lays down our institutional vision and principles, we define the media as an instrument of a social organizationthat turns the quest for the common good into a reality.
By Luís Erlanger, Director, Central Globo de Comunicação/TV Globo, Brazil.
1 See “Audiovisual services: Improving participation of developing countries”, note by the UNCTAD secretariat (UNCTAD document TD/B/COM.1/EM.20/2), September 2002.

9.2.2 Third United NationsConference on the Least DevelopedCountries: Music
At the Third United Nations Conference on the LeastDeveloped Countries, organized by UNCTAD in its capacityas the United Nations focal point for issues relating to theLDCs and held in Brussels in May 2001, the music industrybecame part of intergovernmental debates.2 The rationale wasto sensitize governments of LDCs to the fact that the rich-ness of the poorest countries lies in the abundance of theirtalents translated into cultural expressions such as music anddance, which in turn have significant economic value.Recalling that recorded music products worldwide were partof a $50 billion market, far exceeding the markets for tradi-tional commodities, the Secretary-General of UNCTADemphasized that “the music industry feeds into a wider poli-cy discussion about how to diversify economic activity inLDCs”.3 As follow-up, a series of studies were carried out toexamine the economic potential of the music industry toimprove earnings from trade and IPRs in a number of devel-oping countries, particularly in the LDCs and SIDS.4 Thesestudies paved the way for policy initiatives and technical assistance projects to strengthen the music industry in somecountries, particularly in Africa and the Caribbean.
9.2.3 UNCTAD XI: Creative industries –A turning point
In 2004 at the UNCTAD XI Ministerial Conferenceheld in São Paulo, Brazil, the topic of creative industries wasintroduced into the international economic and developmentagenda5 for the first time on the basis of recommendationsmade by the High-level Panel on Creative Industries andDevelopment. The São Paulo Consensus, negotiated among153 countries,6 stated that:
“…Creative industries can help foster positive externalities while preserving and promoting cultural heritages and diversity. Enhancingdeveloping countries’ participation in and benefit from new and dynamicgrowth opportunities in world trade is important in realizing development
gains from international trade and trade negotiations, and represents apositive sum game for developed and developing countries” (paragraph 65).
■ “…The international community should support national efforts ofdeveloping countries to increase their participation in and benefit fromdynamic sectors and to foster, protect and promote their creative industries”(paragraph 91).
Member States “recognized that creative industries rep-resent one of the most dynamic sectors in the global tradingsystem” and that “their dual economic and cultural function-ality calls for innovative policy responses”.7 The High-levelPanel, with the presence of the United Nations Secretary-General, stated that “special measures were needed for thedevelopment of creative industries at the international level,particularly in the trade and financing arena and in ensuringcultural diversity in developing countries” and that “The needfor increased and better coordinated international effortswas highlighted with a view to the promotion of more col-laboration among different international agencies and theinvestment community”.8
In discharging its mandates, UNCTAD has been shapinga number of international and national policy initiatives inthe area of creative industries and the creative economy. Inthis regard, it built synergies among the United Nationsorganizations, aiming at exploring complementarities, under-taking joint technical cooperation projects and promotingmore effective concerted international actions. In this spirit,the United Nations Multi-Agency Informal Group onCreative Industries was set up in 2004. The Group, whichbrings together ILO, ITC, UNCTAD, UNDP, UNESCOand WIPO, maintains a regular dialogue and meets twice ayear in Geneva. This has paved the way for partnerships andprompted a new impetus for collaborative initiatives, takinginto account the competencies, mandates and differentiatedapproaches of the bodies involved. A concrete example ofsuch initiatives is this Report, which is a pioneer example ofcooperation involving contributions from five collaboratingorganizations in a joint endeavour to improve policy coher-ence and the impact of international action on issues relatingto the creative economy.
189C R E AT I V E E C O N O M Y R E P O R T 2 0 0 8
The in
tern
atio
nal d
imensio
n o
f cre
ative
-industrie
s polic
y
9
2 See Third United Nations Conference on Least Developed Countries, “Music Industry Workshop: Proceedings of the Youth Forum” (document UNCTAD/LDC/MISC.82), New York and Geneva, 2003.
3 Opening statement by R. Ricupero, Secretary-General of UNCTAD, at the Youth Forum, 19 May 2001, cited in “Music Industry Workshop: Proceedings of the Youth Forum”(document UNCTAD/LDC/MISC.82).
4 Reference to case studies by the UNCTAD/WIPO research project on the Caribbean music industry.5 Deliberations based on “Creative Industries and Development” (UNCTAD document TD(XI)BP/13), 4 June 2004.6 See São Paulo Consensus, contained in the Report of the United Nations Conference on Trade and Development on its eleventh session (UNCTAD document TD/412), 20 August 2004.7 See High-level Panel on Creative Industries, 13 June 2004, Summary prepared by UNCTAD secretariat (UNCTAD document TD/L.379), 16 June 2004, para. 4.
Available at: http://www.unctad.org/en/docs/tdl379_en.pdf .8 Ibid., para. 7.

190 C R E AT I V E E C O N O M Y R E P O R T 2 0 0 8
9.2.4 UNCTAD XII: From the creativeindustries to the creative economy
A High-level panel on creative economy and industriesfor development met on 14-15 January 2008 in Geneva as anUNCTAD XII pre-conference event. The session wasattended by eminent government officials, policy-makers,experts and practitioners from the cultural and creative community and academia from 49 countries, 19 internationalorganizations and 9 non-governmental organizations. ThePanel was convened by the Secretary-General of UNCTADwith the aim of assisting Member States in their delibera-tions on this topic at UNCTAD XII.9 The session had threemain objectives: (a) to provide a platform for progress in theintergovernmental debate in the area of the creative indus-tries and the emerging creative economy; (b) to review thework undertaken by the UNCTAD secretariat in fulfillingits mandate on this innovative topic, reassert its role andidentify areas for possible future work; and (c) take stock ofprogress made on the analytical and policy agenda surroundingthe creative economy.
It was recognized that UNCTAD XI had for the firsttime introduced the topic of creative industries into theinternational economic and development agenda. UNCTADhad, in line with its mandate (São Paulo Consensus, paras.65 and 91), played a key role in sensitizing Governments tothe potential of the creative economy to foster trade anddevelopment gains, promoting policy-oriented initiatives andenhancing cooperation with countries, institutions and theinternational community at large.10
The panel discussed policy strategies, multilateralprocesses, national experiences, assessment tools, and areasfor international cooperation aiming at enhancing creativecapacities in developing countries. The panel recognized thatUNCTAD’s work in the area of the creative economy andthe creative industries should be pursued and enhanced.Participants manifested support for UNCTAD to strengthensynergies with the United Nations agencies, in particularwith the UNDP Special Unit for South-South Cooperation,
UNESCO, WIPO and ITC. It was also felt that UNCTADshould continue to fulfill its mandates and assistGovernments on issues related to the development dimen-sion of the creative economy, in line with the three pillars ofUNCTAD’s work: (a) consensus-building, by providing aplatform for intergovernmental debates; (b) policy-orientedanalysis, by identifying key issues underlying the creativeeconomy and the dynamics of creative industries in worldmarkets; and (c) technical cooperation, by assisting develop-ing countries to enhance their creative economies for tradeand development gains.
Furthermore, two other important events will be heldin the context of the twelfth session of the quadrennialMinisterial Conference of UNCTAD in Accra, Ghana, from20 to 25 April 2008: (a) the launching of this first CreativeEconomy Report11 by the Partnership UNCTAD-UNDPSpecial Unit for South-South Cooperation as the first multi-agency study to present the United Nations perspective on this emerging topic; and (b) the CreativeAfrica Initiative.12
Creative Africa is an initiative put forward by theUNCTAD secretariat with a view to bringing greater pragmatism to the policy debates. The aim is to showcase thediversity of African culture and the vigour of African creativeindustries through a series of cultural events during the Conference. Creative Africa will mark the starting point of astrategy to strengthen the creative economy so as to fosterdevelopment in Africa. The events will spotlight the continent’s visual arts, music, dance and fashion. It will be atool for promoting government and business interests and toopen up new avenues to effective international cooperation.The Creative Africa concept is based on ownership and partnerships including all stakeholders. Famous Africanartists will perform with the aim of advancing the develop-ment cause and putting in place a sustainable strategy to builda robust creative economy in Africa. Encounters will providea platform to shape business, investments, partnerships andinternational cooperation through action-oriented initiatives.
The i
nte
rnati
onal
dim
ensi
on o
f cre
ati
ve-indust
ries
polic
y
9
9 See Secretary-General’s high-level panel on creative economy and industries for development, Background paper prepared by the UNCTAD secretariat (document TD(XII)/BP/4),17 January 2008, available at: http://www.unctad.org/en/docs/tdxiibpd4_en.pdf. For further details about the meeting, consult:http://www.unctad.org/Templates/Meeting.asp?intItemID=1942&lang=1&m=14639&year=2008&month=1
10See Outcome of the Secretary-General's high-level panel on creative economy and industries for development, Note prepared by the UNCTAD secretariat (document TD(XII)/423),7 February 2008, available at: http://www.unctad.org/en/docs/td423_en.pdf.
11http://www.unctadxii.org/en/Programme/Creative-Africa/Launch-of-the-Creative-Economy-Report/12http://www.unctadxii.org/en/Programme/Creative-Africa/

The ongoing multilateral trade negotiations under theWTO Doha Development Round, launched in 2001 andintended to be concluded in 2005, faced impasses and hasremained inconclusive to date in 2008. These negotiationsinvolve many cross-cutting issues relevant to the creativeindustries, such as trade in goods, trade in services, trade-related aspects of intellectual property rights (TRIPS) andother topics such as trade-related investment measures(TRIMs), regional integration, competition policies andtrade efficiency, with the most important among them beingspecial and differential treatment for developing countries.
The WTO framework deals with trade of goods andservices of the creative industries, including trade of digi-tized creative content associated with ICT tools.Audiovisuals, cultural and other related services are discussedunder the General Agreement on Trade in Services (GATS).However, there are problems related to definitions. Althoughthe term “cultural goods and services” is the one used inWTO negotiations, there is no specific definition for “cultural services”, which is widely considered as a subsectorin the broader category of “communication services” andvery often, data for audiovisuals are credited in other sectorssuch as telecommunications. This makes it even more difficult to articulate trade policies in this area.
IPRs and investment-related policies also have a long-lasting impact on the performance of creative industries andtherefore on the development agenda of developing countries. Trade policy-making and other ancillary govern-ment interventions are necessary to assure the implementationof bound commitments and obligations under bilateralinvestment treaties (BIT), TRIPS provisions, WTO rules,regional trade agreements (RTAs) and free trade areas(FTAs), taking advantage of the flexibilities available fordeveloping countries. The lasting effect of these instrumentsis to influence supply capacity and stimulate trade perform-ance in all sectors of the creative industries.
9.3.1 General Agreement on Trade in Services
The General Agreement on Trade in Services (GATS)governs trade in cultural and entertainment services. It hasbuilt-in flexibilities that can be used by both developed anddeveloping countries. Nevertheless, developing countries needto ensure that these flexibilities are implemented and opera-tionalized. These flexibilities may allow for the phasing in ofdisciplines according with the level of development and are animportant tool for strengthening the creative industries indeveloping countries. They include the right to regulate; theright to provide due respect for national policy objectives; thepositive list approach to undertaking commitments on mar-ket access and national treatment; the possibility of attachinglimitations and conditions to market access and nationaltreatment; the possibility of not making commitments onaudiovisual services; most-favoured-nation exemptions; andthe possibility of leaving subsidies unbound. At the negotia-tions on domestic regulations, developing countries are tryingto ensure a balance between disciplines that effectively under-pin market access commitments on the one hand, and main-taining sufficient policy space and flexibility on the other,with a view to putting in place the policies that they need inthe pursuit of development objectives, including protectionof cultural diversity.13
During 2007, little progress was made in liberalizingtrade in services in general and in audiovisuals in particular.The controversies surrounding trade in audiovisualsremain.14 One group of countries has the perception that audiovisuals deserve special treatment as they are inherentlycultural products, and this group is determined to retain itsability to use policy measures to support its domestic cultural industries as a public good. Others argue thataudiovisual services as entertainment products should betreated like any other sector, calling for greater commit-ments by members as well as for the discussion of new disciplines. This policy interface has also come up in severalregional trade agreements such as the Central American-Dominican Republic Free Trade Agreement (CAFTA), the
191C R E AT I V E E C O N O M Y R E P O R T 2 0 0 8
The in
tern
atio
nal d
imensio
n o
f cre
ative
-industrie
s polic
y
9
13“Reconciling cultural and international trade policies”, paper by E. Dos Santos, UNCTAD, presented at the Conference on Cultural Diversity organized by the German Commissionfor UNESCO, May 2007.
14See UNCTAD, Creative economy and industries newsletter, No. 5, April 2007, p. 3.
9.3 WTO multilateral negotiations and implications for creative industries

192 C R E AT I V E E C O N O M Y R E P O R T 2 0 0 8
North American Free Trade Agreement (NAFTA) and alarge number of FTAs. As a result, very few countries havemade commitments regarding cultural services. By and large,developing countries have taken the position that liberaliza-tion of services remains the way forward but that progressiveliberalization is the preferred path.15
Mobility of talent is a crucial element for the exportof creative and cultural services from developing countries to
global markets. There are four modes of supply for tradingservices. Mode 4 on the temporary movement of naturalpersons (that is, the provider of the service crosses the bor-der) is of particular relevance to developing countries sinceit would include services provided by theatrical producers,singer groups, bands and orchestras, authors, composers,sculptors, entertainers, dance instructors and other individualartists in global markets.
The i
nte
rnati
onal
dim
ensi
on o
f cre
ati
ve-indust
ries
polic
y
9
Box 9.2 Puppet planet
15UNCTAD is currently monitoring and assessing the evolution of the Doha Round and assisting developing countries to improve their skills and negotiating capacities to prepare proposals in order to obtain a balanced result and a substantive development package of benefits.
A puppet is a manmade object, usually but not necessarily representing a character, operated directly by a puppeteer or indirectly by the use of strings orby another mechanical means or by remote control. In contemporary puppet theatre, puppets are often called a “creative object”, classified under the per-forming arts. Puppetry involves manipulating these objects and is found in almost all human societies both as entertainment and ceremonially in ritualsand celebrations such as the Brazilian carnivals.
Romania figures among the European countries that have active puppet theatres. It is one of the eight co-founder countries (jointly with Austria, Bulgaria,Czechoslovakia, France, Germany, Yugoslavia and the Soviet Union) that created the International Union of Puppet Artists (UNIMA), a decision taken inPrague in May 1929. It is noteworthy that from the point of view of cultural history, UNIMA was the first international body in the world of theatre at large.UNIMA, an NGO affiliated to UNESCO, brings together people from around the world who contribute to the development of the art of puppetry with theobjective of using this art in the pursuit of human values such as peace and mutual understanding between peoples regardless of race, political or reli-gious convictions and differences in culture, in accordance with the respect for fundamental human rights as defined in the United Nations UniversalDeclaration of Human Rights of December 1948. The Romania UNIMA National Centre implemented innumerable initiatives under the leadership ofMargareta Niculescu, who was elected as a member of the International Executive Committee of UNIMA and then as President of this organization in 2000.
Its most important puppet theatre is the Tandarica Puppet Theatre, founded in 1945 in Bucharest. In 1949, Tandarica was declared a State theatre andMargareta Niculescu was nominated director of the company. She created a strong group of competent designers, directors and puppeteers who madeTandarica world-famous. The holding of the First International Festival of Puppet Theatre in Bucharest in 1958 was a very important moment in the historyof the Romanian puppet theatre. The Romanian artists had the opportunity to see the best performances of the best companies from over 50 countries.
Today, Tandarica has over 80 employers sustaining around 300 annual performances in the two theatres. As a repertory theatre subsidized by the Statebudget through the Bucharest Municipality, Tandarica Theatre has deliberately chosen to offer low ticket prices, a practice that opens wide the theatredoors to an audience stemming from all social categories. In an agreement with the Ministry of Education of Romania, the schoolchildren are allowed toattend performances during their school courses and the theatre provides transport from the school to both theatres. All these elements result in the children’s greater interest in these special performances.
During the 2005-2006 season, Tandarica gave performances to 70 000 people. Since its birth, it has produced over 200 creations. All of them draw their inspira-tion from the marvellous tales pertaining to the Romanian as well as to universal culture. In its permanent portfolio, Tandarica offers specific puppets shows for allage groups, from small children to adults. Most of the shows are presented in the Romanian regions and on almost all the continents, with over 100 tours in morethan 40 countries. The company organized six international festivals and two national ones and participated in 20 national festivals and 40 international ones,becoming one of the best-known puppet theatres, appreciated all over the world and proving to be a strong ambassador of the Romanian culture abroad.
International festivals and international tours are very important tools to stimulate a constant renewal of the puppet theatre. A number of festivals are organ-ized worldwide. The most famous in the world is the “Festival international de la marionnette de Charleville-Mézières” in northeastern France. This eventtakes place for two weeks every three years, gathering puppet companies from more than 130 countries from around the world for an international publicof over 130,000 spectators. In this regard, it must be stressed that governments should facilitate the free circulation of artists to present and promote theircreations in global markets and offer their services. The puppet theatre should remain a valuable traditional expression of cultural diversity to advance theintercultural dialogue in our society.
By Liviu Berehoi, master puppeteer who has worked for more than 25 years for the Tandarica Theatre and who is a regular collaborator on the Théâtre des marionnettes
de Genève.

Under market-access commitments, WTO membersmay inscribe in each mode of supply quantitative restrictionsor numerical quotas restricting the numbers of providers,total value of services transactions or assets, number of serv-ices operations, limitation of the total number of naturalpersons that may be employed in a particular service sector,type of legal entity or joint venture to provide a service, andlimitation on the participation of foreign capital.
Provisions on services and temporary movement oflabour are now common in many regional trade agreements.Given the nascent state of the services sector in developingcountries, the implications of North-South reciprocal open-ing of the services market for developing countries need to becarefully assessed. Adequate pacing and sequencing betweendomestic reform and regional and multilateral liberalizationare important.16
The treatment of issues related to the creative industriesincluding audiovisuals is challenging and open ended becausethere is no universal international trade agreement applied totrade in cultural goods and services that covers all the issues ofthe trade agenda. In the absence of such an agreement thatexplicitly and exclusively deals with cultural trade and investmentper se, there are instead many trade agreements administered byWTO – GATS in particular – as well as regional trade agree-ments that affect the terms by which cultural goods and/orservices are traded across borders (together with other goodsand services that are not cultural in nature).17
9.3.2 Implications of multilateral and regional trade agreements for creative industries
Trade agreements influence trade flows of culturalgoods and services as a result of the mutual granting ofmost-favoured-nation treatment among signatories, which is the fundamental principle of trade commitments andcommercial relations among countries.
The WTO rules recognize the right of contracting par-ties to liberalize trade in goods in accordance with ArticleXXIV and the enabling clause of GATT and trade in servicesin accordance with Article V of GATS within the framework ofeconomic unions such as the European Union, RTAs such as
ASEAN and MERCOSUR, and FTAs such as NAFTA. WTOhas been notified of more than 300 agreements such as RTAsand FTA among WTO members.18 The main implications ofthese agreements for creative industries is that trade flows, i.e.,imports and exports of creative industries and the IPRs, aresubject to binding commitments and multilateral disciplinesthat might be enforceable by dispute settlement. The culturalexception to audiovisual services implies the non-applicationof the “once-in-time exception” of most-favoured-nationtreatment to audiovisual services, which allowed the con-cerned countries to exclude audiovisual from their schedulesof commitments under the GATS in the commitmentsappended to the Final Act embodying the results of theUruguay Round of Multilateral Trade Negotiations signed inMarrakech in 1994.
RTAs such the Andean Community, ASEAN, CARICOM,the Central American Common Market (CACM), theCommon Market for Eastern and Southern Africa (COMESA),MERCOSUR and SADC have universal coverage and commitment to full liberalization within a reasonable lengthof time. These agreements include special provisions for cul-tural trade and common disciplines applied to many segmentsof cultural industries. FTAs such as CAFTA, NAFTA andbilateral treaties of the United States with Chile have specificprovisions or exclusions in negative lists of some sectors.
In addition to specific commitments, members may alsoinclude additional commitments. This may allow the countriesto undertake commitments on cultural services and audiovisualservices under transparent conditions of standards, licensing andadministrative procedures. These additional commitmentsrequires incumbent countries to update regulations on creativeindustries by implementing non-“trade distorting” standards,licensing requirements and administrative procedures that nullify or impair a specific commitment.
9.3.3 TRIPS Agreement
In respect to the provisions of the TRIPS Agreement,topics relating to the creative economy such as the protectionof traditional knowledge and folklore have not received promi-nent attention in the WTO Doha Round, where negotiationshave focused on biotechnology and traditional medicines.
193C R E AT I V E E C O N O M Y R E P O R T 2 0 0 8
The in
tern
atio
nal d
imensio
n o
f cre
ative
-industrie
s polic
y
9
16At the 2007 session of the UNCTAD Commission on Trade in Goods and Services and Commodities, governments considered issues relating to trade in services and development implications on the basis of a note prepared by the UNCTAD secretariat entitled “Trade in Services and Development Implications” (document TD/B/COM/1/85), 2 February 2007.
17Craig Van Grasstek, Treatment of Cultural Goods and Services in International Trade Agreements.18These agreements must meet two main conditions: the non-exclusion a priori of sector and substantive coverage in terms of volume and value of trade affected. For services, there is
the obligation to grant national treatment together with market access.

194 C R E AT I V E E C O N O M Y R E P O R T 2 0 0 8
Undoubtedly, one of the critical issues for the culturaland creative industries is copyrights and neighbouring rights,in particular the need to reinforce domestic copyright legisla-tion and institutions. This topic should remain at the core ofthe IPR debate since there is a need to push the boundariesof existing models and explore innovative solutions that willmaximize the benefit of the creative economy in developingcountries, seeking social inclusion and equitable developmentas a primary objective. Lacunae in the current IPR regimesare being dealt with at the international level by WIPO in thecontext of the Development Agenda.
The work of WIPO in the area of cooperation isclosely interwoven with governmental and intergovernmental
cooperation, including the WIPO agreement with WTO toassist developing countries in the implementation of theWTO TRIPS Agreement. The challenge of development iscompounded by rapid technological and scientific progress.WIPO assists countries to identify and to promote inter-national solutions to the legal and administrative problemsposed by digital technology to the traditional notions andpractices of intellectual property. A better interfacebetween development programmes implemented by WIPOfor developing countries and other bilateral, multilateraland international organizations involved with intellectualproperty and economic development issues is required tomaximize synergies.
The i
nte
rnati
onal
dim
ensi
on o
f cre
ati
ve-indust
ries
polic
y
9
9.4 UNESCO cultural-diversity perspective
The Intergovernmental Conference on Cultural Policiesfor Development convened by UNESCO in Stockholm in1998 after several years of research and preparation was partof the growing international interest in identifying more suc-cessful models for sustainable development. The main goal ofUNESCO for the Stockholm Conference was to transformthe ideas behind this initiative into more clearly formulatedcultural policies and modalities for international culturalcooperation. The Conference concluded that cultural policiesas the true driving force in cultural diversity must foster theproduction and dissemination of diversified cultural goodsand services, especially in terms of the promotion of culturalindustries and creative enterprise in all countries.
In recent years, the United Nations has increasinglyrecognized the inalienable role of culture in development andhas focused programming accordingly. The preoccupation inthis regard was summed up in General Assembly Resolution57/249 of 20 February 2003 on Culture and Development.The resolution directly commented on the potential ofcultural industries for poverty reduction:
5. Invites all Member States, intergovernmental bodies, organizations of the United Nations system and relevant non-governmental organizations:
… (e)(iii) To establish cultural industries that are viable and competitive at the national and international levels, in the face of the current imbalance in the flow and exchange of cultural goods at the global level;
… (i) To assess the interconnection between culture and development and the elimination of poverty in the context of the First United Nations Decade for the Eradication of Poverty (1997-2006).
The importance of culture in development strategieswas underscored with the adoption of the UniversalDeclaration on Cultural Diversity by the UNESCO GeneralConference in November 2001 and endorsed by the UnitedNations General Assembly in 2002. For the first time, culturaldiversity was acknowledged as “the common heritage ofhumanity” and its defence was deemed to be an ethical andpractical imperative, inseparable from respect for human dig-nity. The concept of “diversity” stipulated that plurality is thenecessary requirement for freedom and that, in political terms,such pluralism is inseparable from a democratic society. TheDeclaration stated that “Freedom of expression, media plu-ralism, multilingualism, equal access to art and to scientificand technological knowledge, including in digital form, andthe possibility for all cultures to have access to the means ofexpression and dissemination” constitute essential guaranteesof cultural diversity and of development. Though it also rep-resents a challenge to cultural diversity, the globalization ofthe economy and trade creates the conditions for a reneweddialogue among cultures and civilizations based on humanrights and respect for their equal dignity. The Declaration ledto the approval of the Convention on the Protection andPromotion of the Diversity of Cultural Expressions by theUNESCO General Conference on 20 October 2005.

The ultimate goal of the Convention is to give allcountries the means to protect and promote the diversity ofcultural expressions within and outside their borders.Cultural diversity is simply a mainspring of sustainabledevelopment that States must activate by adopting appropri-ate measures.19
The Convention recognizes the sovereign right ofStates to elaborate cultural policies to promote the diversityof cultural expressions within their borders, and to encour-age equitable access to all cultural expressions in the world.Parties to the Convention are committed to facilitating cul-tural exchange within their borders as well as with othercountries. In June 2007, the Conference of Parties, thesupreme decision-making body of the Convention, adoptedits rules of procedures and elected the 24 members of the
Intergovernmental Committee that will operate under itssupervision. The States Parties elected to the Committee are:Albania, Austria, Brazil, Burkina Faso, Canada, China,Croatia, Finland, France, Germany, Greece, Guatemala,India, Lithuania, Luxembourg; Mali, Mauritius, Mexico,Oman, Saint Lucia, Senegal, Slovenia, South Africa andTunisia. In order to ensure the geographical representation ofall regions and in conformity with agreements made duringthe meeting, several seats on the Committee were reserved fordeveloping countries. The Intergovernmental Committeewill be responsible for, among other things, promoting theobjectives of the Convention, encouraging and ensuring itsimplementation and preparing operational directives. Thefirst meeting of the Committee was held in December 2007in Ottawa, Canada.
195C R E AT I V E E C O N O M Y R E P O R T 2 0 0 8
The in
tern
atio
nal d
imensio
n o
f cre
ative
-industrie
s polic
y
9
Box 9.3 Cultural tourism: Impressions of the Peruvian experience
Why cultural tourism is a way to reduce poverty but also a risk for the preservation of traditional peoples’ values
Peru is a country with a rich and varied nature, a place of contrasts. People have a thousand-year-old culture of building irrigation channels, which enablesthem to cultivate areas that previously were desert. Its heritage, including the ancient Inca Empire, Cuzco and the lost city of Machu Picchu, is spectacular.
Peruvian traditions are distinctive and cultural tourism appears to be a good alternative to increase people’s quality of life and self-esteem, creating newjobs, economic growth and development. One may think it is an easy task. Peru has forests, beaches and mountains, archeological sites, indigenous peoples with a rich tradition of arts and crafts; it offers adventure. So it would seem that it is only a question of advertising – and tourists, certainly, willrespond. And they have responded. Tourism is the third most important economic activity in Peru, employing 500,000 people to serve the 1.6 million visitors who spent $1.5 million in the country in 2006. Certainly, tourism helps them to live more comfortably and thus the measured Peruvian quality-of-life indexes increase.
Cuzco is a beautiful colonial city, ranking seventh in Peru in number of inhabitants – 304,152. The historic capital of Peru, Cuzco was declared as Patrimonyof the Humanity by UNESCO in 1983. It used to be mainly a farming and mining region, but in the last several years, tourism has come to be its main eco-nomic activity. The central square of Cuzco looks like a shopping mall, and there are animated parties at night. The city is experiencing steep economicgrowth. From 2005 to 2006, employment rose 6 per cent and the tax revenue increased 168.9 per cent. From this perspective, the expansion of historicaland cultural tourism is very good news.
Machu Picchu is the hidden fortress of the ancient Inca Empire. Discovered by the western world only in 1911, it is a breathtaking experience to visit itspalaces, temples and over 150 buildings, most of them six centuries old. There, one can fully appreciate the complexity of the hybrid culture born fromthe fusion between Spanish and Inca. And it comes as no surprise that the number of visitors to Machu Picchu ruins increases by 5 per cent a year.
People who live in the little town of Ocongate, which is also atop the Andean mountains, hope to have similar fate. This because there is an image of theLord of Qoyllur Rit’i (which in Quechua means something like Snow of Stars) carved in the rock at the top of the 6,362-metre mountain Ausengate. Andthere is a traditional festival to honor the Lord of Qoyllur Rit’i that attracts more than 10,000 people from many countries every year. Investments havebeen made, the road is improving, people are building new places and restoring old ones to attract more tourists – and they are already arriving. However,such results need to be achieved without people losing something that is fundamental to their success: authenticity.
Cultural tourism is an important topic when we think about the creative economy as a way of reducing poverty, especially in developing countries. Butthere are many challenges for policy-makers in this field. What is really needed are sustainable projects, designed with a solid basis, so that real people– with unique skills and knowledge – are not transformed into actors with no substance.
By Eliana G. Simonetti, journalist.
19For more information on the Convention, see Ten Keys to the Convention on the Protection and Promotion of the Diversity of Cultural Expressions, UNESCO, 2005, and L’UNESCO et la question de la diversité culturelle 1946-2007, Bilan et Stratégies (UNESCO internal document CLT/CPD), 2007.

196 C R E AT I V E E C O N O M Y R E P O R T 2 0 0 8
At the WIPO General Assembly in 2004, two develop-ing countries, Argentina and Brazil, put forward a proposal tointroduce a Development Agenda for WIPO,20 with a view toaddressing the needs and concerns of developing countrieswith regard to IPRs. Another 12 developing countries sup-ported the proposal and negotiations have started. In June2007, WIPO Member States reached an agreement on aWIPO Development Agenda, a set of proposals aimed atcloser integration of the development dimension into policy-making in the field of intellectual property protection. The45 agreed proposals recommended to the WIPO GeneralAssembly for action are grouped into the following six broadclusters:
■ technical assistance and capacity-building;
■ norm-setting, flexibilities, public policy and public domain;
■ technology transfer, information and communicationtechnologies and access to knowledge;
■ assessment, evaluation and impact studies;
■ institutional matters, including mandate and governance; and
■ other issues.
Among the agreed proposals, many make direct refer-ence to the creative industries or to copyright and/or theprotection of creative works. For example, one proposal callsfor a greater emphasis on the cultural industries in WIPOtechnical assistance activities, and another mentions theimportance of strengthening national capacity for the pro-tection of domestic creations. In addition, several proposalsdeal with issues that are relevant to copyright and the creativeindustries without explicitly referring to them. Theseinclude, for example, proposals calling for deepening theanalysis of a rich and accessible public domain, expandingthe scope of activities aimed at bridging the digital divide,promoting pro-competitive licensing practices, initiating discussions on how to further facilitate access to knowledgeand technology, and undertaking new studies to assess the
economic, social and cultural impact of the use of intellec-tual property systems in Member States.
Furthermore, there are a number of agreed proposalsthat outline principles that WIPO is to follow when con-ducting development-related activities, such as technicalassistance or norm-setting, including in the field of copy-right and other areas that may be of relevance to the creativeindustries.
The June 2007 Meeting of the ProvisionalCommittee on Proposals Related to a WIPO DevelopmentAgenda (PCDA) also recommended the establishment of aCommittee on Development and Intellectual Property(CDIP) to plan, monitor, assess and report on the imple-mentation of the WIPO Development Agenda. Such aCommittee would also have a broader mandate to discussintellectual property and development-related issues. Itwould therefore be a forum in which Member States couldpresent new issues of concern that relate to intellectual prop-erty and development, including issues of relevance to thecreative industries.
As regards intellectual property and genetic resources,traditional knowledge and folklore, the WIPOIntergovernmental Committee on Intellectual Property andGenetic Resources, Traditional Knowledge and Folklore21
recommended that the WIPO General Assembly renew itsmandate to continue its work and the negotiations on coreissues, in particular the protection of traditional knowledgeand traditional cultural expressions, focusing on the questfor more effective protection against misuse and misappro-priation. This Committee is examining a draft sui generissystem for the protection of traditional cultural expressionsthat could perhaps provide a framework for a new interna-tional instrument.22 Another key question before the WIPOIntergovernmental Committee is what form any outcome ofits work should take. Many are calling for an “international-ly binding legal instrument”. Others are more cautious, pre-ferring to leave a decision as to the form of an outcome untilsuch time as its content is clearer.
The i
nte
rnati
onal
dim
ensi
on o
f cre
ati
ve-indust
ries
polic
y
9
9.5 WIPO Development Agenda
20See WIPO Press Release, “Member States Adopt a Development Agenda for WIPO” (PR/2007/542), 1 October 2007.21See http://www.wipo.int/tk/en/folklore/22For a summary of the draft and references to the full draft, see: http://www.wipo.int/tk/en/consultations/draft_provisions/pdf/tce_provisions_summary.pdf.

The UNDP Special Unit for South-SouthCooperation was established by the United Nations GeneralAssembly in 1978 to promote, coordinate and supportSouth-South and triangular cooperation worldwide and tofacilitate the activities of the United Nations system inSouth-South initiatives. The Special Unit works closely withthe Group of 77 (G-77) and China, the largest intergovern-mental body in the United Nations, representing 133 devel-oping countries, which provides the means for the countriesof the South to articulate and promote their collective eco-nomic interests. Therefore, many multilateral processes are setin motion via debate at the level of the G-77 with implica-tions in international and national contexts.
The Special Unit for South-South Cooperation and theG-77 engaged in the “Creative Economy for Development”agenda owing to the immense potential of developing countriesbut also of their marginal contribution to the rapid expansion ofthe global creative economy and their limited participation in theinternational flows of cultural goods and services. With the sup-port of the G-77, the Special Unit began to mobilize the UnitedNations system to substantially build capacity along the entirevalue chain in developing countries so that the full benefits oftheir innate creativity could be fully realized in the South. Hence,the mission entrusted to the Special Unit by the G-77 in thiscontext was to promote better understanding of the potential ofthe creative sector and the new opportunities that it could createfor economic growth, poverty reduction, social inclusion anddevelopment in the South.
The Creative Economy for Development agenda began tobe formulated at the Second South Summit of the G-77 andChina that was held in Doha, Qatar, in June 2005. At the open-ing session, the Minister of Foreign Affairs and Foreign Tradeof Jamaica, then the President of the G-77, recognized the glob-al trends in Southern trade and requested “that developingcountries explore new and dynamic ways of responding to thesegrowing disparities”. At the concluding session, delegates adopt-ed two documents, one containing the recommendations onSouth-South cooperation and the other, recommendations onspecific South-South projects. The document on South-Southcooperation requested the Chairman of the G-77 to submit astudy on new and dynamic sectors, including services and creative industries, and encouraged that arrangements bemade for South-South sectoral cooperation.
As a response, the Special Unit for South-SouthCooperation initiated an inter-agency dialogue in September2005, followed by the Creative Economy Forum in Shanghai atthe beginning of December of the same year. Outcomes of thisForum included a partnership with UNCTAD, the“Partnership for Technical Assistance for Enhancing theCreative Economy in Developing Countries”, and the recom-mendation for the organization of a Creative Economy Expo,which would develop and reinforce market mechanisms forSouthern creative goods and services. This initiative strength-ened the partnerships that had begun with the United NationsMulti-Agency Informal Group on Creative Industries initiatedby UNCTAD in 2004, and it reinforced commitment to thefledgling plans for an Expo. Later in 2005, the United NationsDay for South-South Cooperation highlighted creativity anddiversity and called for the United Nations bodies to coordi-nate efforts with respect to the creative economy in order tobring about real development impact for developing nations.
Since then, the Special Unit for South-SouthCooperation has continued to work with the G-77 andChina and United Nations entities on increasing Southernattention to and support for the “creative economy for devel-opment” concept. It has championed an “InternationalForum on the Creative Economy”, which had several meet-ings since the first meeting in Shanghai in December 2005,followed by another dialogue held in Jamaica in June 2006,in Rwanda in August 2006, and in Brazil in November2006. These meetings received much attention and supportand have given impetus to creative thinking, development ofpolicy platforms and network-building.
A significant benefit of both the formal and informaldialogues facilitated by the Special Unit for South-SouthCooperation is that they have created a flexible, responsiveand open environment for stakeholders at different levels ofgovernment, the United Nations system and their partnersto discuss the more sensitive or controversial topics relatingto the creative economy. For example, this dialogue processhas enabled the exploration of the critical issue of IPRs, asubject on which the G-77 countries have been very vocal. Atthe WIPO Development Agenda meeting in February 2006,the African Group laid out a seven-step plan that any mean-ingful discussion of IPRs and development should take intoaccount. The discussions at the International Forum on the
197C R E AT I V E E C O N O M Y R E P O R T 2 0 0 8
The in
tern
atio
nal d
imensio
n o
f cre
ative
-industrie
s polic
y
9
9.6 UNDP: Engaging developing countries in the creative economy for development

Box 9.4 Nollywood: A creative response
198 C R E AT I V E E C O N O M Y R E P O R T 2 0 0 8
Creative Economy for Development held in Rio de Janeiro,Brazil, in November 2006 provided an opportunity for thisframework to be discussed and helped to expose some ofthese “growing tensions” in the developing world about theIPR debate.
Multilateral recognition was given to the value of thisdialogue at the Paris Consensus, adopted by the Thirty-Ninth Meeting of the G-77 Chairman and Coordinators of
the Chapters in February 2006: “The emerging new dynamiceconomies of the South provide new and potential opportunities for takingSouth-South cooperation to a higher level of collective self-reliance throughtrade, investment and technological cooperation. In this context, we supportthe ongoing efforts by the Special Unit for South-South Cooperation organ-izing important initiatives to boost South-South cooperation … the GlobalSouth Creative Economy Expo; as well as other public-private partnershipinitiatives in new and dynamic sectors.”
The i
nte
rnati
onal
dim
ensi
on o
f cre
ati
ve-indust
ries
polic
y
9
Nollywood, the so-called Nigerian film industry, has been acknowledged as the third largest film industry in the world, after America’s Hollywood andIndia’s Bollywood. Nollywood produces more than 1,005 home video films annually. A total of 6,221 films were produced during the period 1997-2005;about 50 per cent are exported unofficially. There are well over 500,000 Home Video Distribution and Rental Clubs across the length and breadth of thecountry, thereby creating thousands of jobs as a result of the boom in the industry. Furthermore, the potential size of the Nigerian film industry has beenestimated at more than N522 billion (that is, about $2.75 billion). The industry has generated revenue for the Government through corporate income andsales taxes; its estimated contribution to GDP is over N86 billion (nairas per US dollar: 127.38 in 2006).
Although film was introduced into Nigeria in 1903, film production actually began in 1948 but was limited to documentaries and newsreels. It was not until1972 that the first commercial film was produced. The industry experienced a boom in the production of celluloid films in the 1970s but later witnessed adecline in the 1980s with the introduction of the Structural Adjustment Programme (SAP), which affected the cost of production. The Government estab-lished the Nigerian Film Corporation in 1979 to develop the sector. Through the programmes, policies and activities of the Corporation and efforts by otherrelevant institutions in the sector, the industry has grown to have a remarkable impact on the economic, social and cultural development of the country.
The socio-cultural impact of the film industry on the nation cannot be overemphasized. The benefits have been enormous as the films constitute an effective means of communication (education, entertainment, socialization, information and mobilization), projecting and promoting our national imagesuch as values, art and rich cultural heritage to the outside world (it is being used as a medium for driving the Heart of Africa project, which is a cohe-sive information programme for Nigeria’s image management and economic transformation). They also promote national cohesion and integration of thediverse cultures of the people as the Nigerian home video films have instilled a sense of national pride and patriotism in Nigerians at home and abroad.
Even though the Nigerian film industry has recorded impressive growth, the sector is still beset by challenges that impede its growth and development,constituting a major constraint to Nigeria’s home video entry into the global market. The challenges include: an informal local and international distributionand marketing network; piracy of works produced by filmmakers; poor content and production quality; lack of production, distribution and exhibition infrastructure; absence of funding opportunities in the industry; inadequate requisite professional skills and training; lack of cohesion leading to industryfragmentation; and lack of industry data for planning and decision-making.
The Government, in recognition of the potential of the film industry for the development of the country, has taken positive steps in line with its reform programmesto reposition the film sector. These steps are in the areas of institutional and policy reforms, which include: (a) the institutional restructuring and reorganization ofrelevant federal government agencies in the film industry; (b) creating the necessary policy environment for the growth of the film industry; (c) training and capacity-building; (d) promotion of the Nigerian film industry; (e) production infrastructure; (f) the Film Development Fund; and (g) professionalizing the sector.
The private sector in Nigeria has been very active in the film industry by providing content and production as well as exhibition facilities in the country.However, it can also take advantage of the huge opportunities to invest in the sector. Areas of investment include training and capacity-building, film village development, distribution and marketing, equipment leasing/sales, and local manufacture/assembly of film equipment and consumables.
Home video is unique and particular to Nigeria as a format of film production and distribution. Several factors might account for this: the high cost of celluloidproduction and post-production, decaying exhibition theatre infrastructure, lack of trained professionals in cine film tradition, etc. Nigerian producers have therefore found an alternative, the video format, to provide entertainment for the people. They have equally perfected the distribution system, usingexisting informal trade channels and retail outlets of other complementary products, e.g., electronics stores, supermarkets, and hawking of the products.
The film and video industry, if properly developed, could be a very significant source of wealth for any country, particularly its contribution to GDP. It isalso a very powerful tool for communication, education, cultural integration and image projection. It is both an art and an industry whose developmentshould be of great national interest in terms of its social as well as its economic value.
By Afolabi Adesanyam, Federal Head of the National Film Corporation and Managing Director of the Nigerian Film Corporation.

Certainly, the emerging dynamic economies of the Southprovide new opportunities for South-South cooperation intrade, investment and technological cooperation, and momen-tum is increasing with respect to South-South cooperation andthe creative economy. The 40th Meeting of the Chairman andCoordinators of the G-77 and China in 2007 stated explicitly
that “South-South cooperation needs to be intensified to ensure the effectiveparticipation of developing countries in the emerging global order and acceleratedevelopment”. Therefore, the Special Unit for South-SouthCooperation continues to consider the furthering of the creativeeconomy for development agenda to be a cornerstone of its man-date and a priority clearly identified by the member countries.
199C R E AT I V E E C O N O M Y R E P O R T 2 0 0 8
The in
tern
atio
nal d
imensio
n o
f cre
ative
-industrie
s polic
y
9
9.7 ITC: Creating business opportunities for creative industries
The International Trade Centre (ITC) is a joint tech-nical cooperation agency of UNCTAD and WTO for busi-ness aspects of trade and development. Its efforts in helpingthe developing world have traditionally included the exportof craft products. This traditional ITC contribution in thedomain of creative expression will be pursued while openingup to, and progressively embracing, new creativity forms inorder to help other creators export their art. The focus ofITC is on the craft and visual arts in developing countriesand economies in transition.
ITC assistance is concentrated in three main areas:
■ Markets: Facilitating access by the craft and visual artsenterprises to distribution networks in importing markets,particularly by leveraging new information technologies to streamline their supply chains and promote their production abroad;
■ Protection: Spreading understanding of the principles ofmarketing and of the intellectual property system alongwith recognition of the value of intellectual propertyissues in marketing, and providing practical guidance inthe proper use of them;
■ Collection: Soliciting and facilitating the gathering of inter-national sector-specific data for market analysis.
Recently, the focus of ITC work in the area of the cre-ative industries has been on ethnic fashion. The rich culture,diverse traditions and skills of Africa have long been a sourceof inspiration for the international fashion industry. Equally,the industry has benefited from African raw materials such ascotton or leather. However, it is rare that the communitiesfrom which the inspirations and inputs are derived have bene-fited from the successes of international fashion. It is necessaryto overcome obstacles faced by poor communities, designersand SMEs in entering the value chains in order to access globalmarkets. ITC has been examining positive and negative experiences, with the aim of assisting developing countries tolink designers and retailers/distributors in fashion marketswith businesses with a view to developing win-win supply-chain models.
In the context of UNCTAD XII, a free-dialogue,“From fashion to African communities and the MillenniumDevelopment Goals”,23 is being organized by ITC in collab-oration with UNCTAD, the African Federation of FashionDesigners and Agoralumiere International to address theseissues. The purpose is to identify proposals to strengthen theproduction of socially and environmentally sustainable rawmaterials and ensure that value addition takes place in Africa.
23For further details, please visit http://www.unctadxii.org/en/Programme/Creative-Africa/Free-dialogue--From-fashion-to-African-communities-and-the-Millennium-Development-Goals-/.

200 C R E AT I V E E C O N O M Y R E P O R T 2 0 0 8
The i
nte
rnati
onal
dim
ensi
on o
f cre
ati
ve-indust
ries
polic
y
9
Box 9.5The Biennale of Contemporary African Art of Dakar: A contribution to economic and cultural development in Africa
For several years, Africa has proposed a variety of events for the promotion of different forms of artistic expression. The Biennale of Contemporary AfricanArt of Dakar undoubtedly makes a critical contribution to ensuring the promotion of artists and the diffusion of contemporary creative works within andbeyond the continent.
The Biennale of Contemporary African Art was born from the desire of the Government of Senegal to position Dakar as a place of encounters and culturalexchange for the entire African continent. The event started as a Biennale of Arts and Literature in 1990, with literature occupying a predominant place.Dak’Art was organized for the first time in 1992, and since then, the visual arts component has moved to the forefront. Nowadays, 289 artists from 34African countries, with 16 representing the African Diaspora and 13 from the rest of the world participate. Among the countries with the highest rates ofparticipation in the Dak’Art exhibitions are Cameroon, the Democratic Republic of the Congo, Ivory Coast, Morocco, Nigeria, Senegal and South Africa.Furthermore, in 1996, the Biennale started to incorporate the Salon of Design, which showcases the work of talented designers from Africa; 92 creatorswere selected to represent 15 countries from the African continent during the period 1996-2006.
Dak’Art 2006 also was attended by 63 art critics, 25 specialized press agents, 19 African journalists, 32 representatives from galleries and museums,13 organizers of 7 Biennales at the international level and a dozen art collectors.
Several important events are scheduled for 2008. The first one is Africa Now, an important programme under the initiative of the World Bank and in honourof Africa. The second one is the first Foire d’art contemporain africain de Tenerife in Spain. In addition, the Biennale is associated with the UNCTAD secretariat for the launching of the “Creative Africa” initiative during the UNCTAD XII Ministerial Conference to be held in April in Accra, Ghana. For theoccasion, an exhibition of African contemporary art will reveal the breadth of African talents in the field of visual arts, showing new approaches in art anddesign and raising public awareness about contemporary creations in Africa. Creative Africa will feature the work of artists from 10 African countriesthrough paintings, sculptures and collages.
The economic spillovers of Dak’Art are linked mainly to the sales of important African art works. The event is also beneficial for several economic activitiessuch as international tourism, international transportation, local transport, the hospitality industry and other services. In brief, Dak’Art is an illustration ofthe positive impact of international cultural manifestations for socio-economic development.
By Ousseynou Wade, Secretary-General of the Biennale of Contemporary African Art, Dakar, Senegal. Website: www.biennaledakar.org .
Countries in both the developing and the developedworld are enormously rich in cultural diversity and creativetalent. Their traditions provide a unique heritage of music,craft, visual art, rituals, dance, performance, story-tellingand cultural practice. All of these manifestations of localand national cultures are assets, representing the indis-putable cultural capital, both tangible and intangible, onwhich the lives of the community are founded. Theseassets can, in turn, give rise to a complex array of creativeproducts – goods and services (both commercial and non-commercial) with cultural content that are expressions ofthe creativity and talent of the people.
In addition to their role as essential expressions oflocal, national and regional cultures, however, these creativeproducts and activities have real potential to generate eco-nomic and social gains. The production and distributionof creative goods and services can yield income, employ-ment and trade opportunities, promote growth and devel-opment, and foster social cohesion and community inter-action. Globalization and the rapid uptake of new ICTshave opened up huge possibilities for the commercialdevelopment of creative products. Indeed, it is the adop-tion of new technology and a focus on market expansionthat are distinguishing characteristics of the creative indus-tries as dynamic sectors in the economies of the industri-alized world.
How are these trends reflected in the experience ofdeveloping countries? Some parts of the developingworld, notably in Asia, are enjoying strong growth in theircreative sectors. Evidence assembled in this Report indi-cates the importance of growth in trade in creative goodsand services as indicators of the strength of the creativeindustries in these countries. In the ten years to 2005,world exports of creative goods and services grew at annu-al rates of 6 and 9 per cent, respectively, with growth rates
in developing countries as a whole exceeding those indeveloped countries. These results provide some hint ofthe potential for further expansion of their value-addedcreative exports that awaits developing countries.
Yet there is a paradox in the world today: despite therichness of their creativity and the abundance of their cul-tural resources, many developing countries are failing totake advantage of the potential for development of theircreative industries. For a variety of reasons, the possibili-ties for using these industries to generate increased output,exports and employment remain under-exploited, andopportunities for achieving genuine development gainsthrough growth in the creative economy are being missed.These problems have arisen because of a range of difficul-ties confronting countries in the developing world in thisarea, including:
■ the lack of a clear framework for understanding andanalysing the creative economy as a basis for informed,evidence-based policy-making;
■ a lack of data about the performance of the creativeeconomy upon which sound development strategies canbe based;
■ the unusual organizational characteristics of the creativeeconomy that call for country-specific rather than gener-ic policies;
■ the lack of institutional capacity to support develop-ment of the creative industries in the developing world,particularly in the protection and enforcement of intel-lectual property rights; and
■ the fact that the developed world has enormous “first-mover” advantages in the field of creative goods andservices, making it more difficult for developing coun-tries to compete in global markets for these products.
201C R E AT I V E E C O N O M Y R E P O R T 2 0 0 8
Lesso
ns le
arn
ed a
nd p
olic
y optio
ns
10
CH
AP
TER
10 Lessons learned and policy options
10.1 Lessons learned

202 C R E AT I V E E C O N O M Y R E P O R T 2 0 0 8
How do these considerations relate to culture? From apolicy viewpoint, the main aspect of culture that has beenstressed in instrumental policy terms has been its role inempowerment and social cohesion. This Report seeks toextend understanding of the importance of culture by point-ing to the additional (and sometimes separate) role of cul-ture in economic development that operates alongside thecore notion of “culture” in terms of values and identity. Itpoints to the complex interaction of formal and informal,commercial and non-commercial, instrumental and intrinsicnotions of “culture” in the process of development anddemonstrates how cultural and economic development canbe understood as a holistic process when interpreted in termsof the creative industries. Based on this understanding as well
as on a sound evidence base, the Report advocates a renewedconcern with culture and creativity in development.However, this concern must be one that relies on multi-agency action and multidisciplinary expertise.
This Report has set out to take a first step towardsclarifying the basic concepts necessary for a proper under-standing of the creative economy, putting forward objectiveevidence, providing some analytical tools and suggestingdirections for policy action. In establishing some under-standing of the nature and form of the creative economy,however, the Report also stresses that it is only a beginning,an initial step towards a more robust and comprehensiveanalysis of the creative economy.
10.2.1 Definitions and concepts
Definitions of the “creative economy” may vary, but itis generally agreed that at the heart of the creative economylie the creative industries. There is no single agreed definitionof the “creative economy” or the “creative industries”although clearly, they embrace the concept of “creativity” asan essential characteristic. In the contemporary world, cre-ativity is often referred to as a key resource in the knowledgeeconomy, leading to innovation and technological changeand conferring competitive advantage on businesses andnational economies. The association of creativity with com-modities gives rise to a class of products known as “creativegoods and services”, of which, many believe, “cultural goodsand services” constitute a subset formed by products withartistic or cultural as well as creative content. This in turnenables the definition of “creative and cultural industries” asthose industries producing creative and cultural goods,respectively. Different models of the creative economy havedifferent ways of identifying and classifying the creativeindustries, though for the purposes of this Report, the fol-lowing groups of industries are included:
■ cultural heritage;
■ visual and performing arts;
■ audiovisual industries;
■ publishing and printed media;
■ new media;
■ design; and
■ creative services, including advertising and architecture.
This Report seeks to establish a realistic benchmark ofdefinitions of the “creative economy”. A future objectivemust be the generation of a robust classification system thatis not dictated simply by statistical convenience or availabilitybut rather is based on an understanding of what evidence isrequired to develop policy.
10.2.2 Cross-cutting linkages
The “creative economy” is a multidimensional concept with linkages to a number of different sectors in theoverall economy. Different approaches to analysing the creative economy lead to different emphases on its variousaspects. For example, a sociological approach has examinedthe notion of a “creative class” in society, comprising profes-sional, scientific and artistic workers whose presence generateseconomic, social and cultural dynamism. Other approacheshave stressed the role of culture in terms of social empower-ment. Even beyond urban planning circles, the concept ofthe “creative city” has become established, while geographersfocus on the locational aspects of creative activity in theform of creative clusters, networks and districts. The multi-faceted nature of the creative economy means that it cutsacross a wide range of areas of economic and social policyin addition to any intrinsic value. Thus policy-making in
Less
ons
learn
ed a
nd p
olic
y opti
ons
10
10.2 Major findings
relation to the creative economy is not confined to a singleministry or government department; rather, it is likely toimplicate a number of different policy fields, including:
■ economic development and regional growth;
■ urban planning;
■ international trade;
■ labour and industrial relations;
■ migration;
■ domestic and foreign investment;
■ technology and communications;
■ art and culture;
■ tourism;
■ social welfare; and
■ education.
Moreover, there is a similar multiplicity of involvementacross the public sector, the corporate sector, the non-profitsector and civil society.
10.2.3 The creative economy in the developed world
In the developed world during the 1990s, the creativeindustries grew faster than other sectors, including servicesand manufacturing. One of the major drivers of this growthwas the extraordinarily rapid pace of technological change inmultimedia and telecommunications that occurred duringthis period. In particular, digital technology opened up arange of new media through which cultural content could bedelivered to consumers, and the creative industries respondedby supplying an ever-widening array of creative products tothe market. On the demand side, rising real incomes amongconsumers in developed countries, coupled with changingpreferences for modes of cultural consumption, helped tosustain the growth of the creative economy. By the middle ofthe first decade of the new millennium, the proportion ofGDP contributed by the creative industries in developedcountries averaged around 3 to 6 per cent. For example,recent estimates collated by OECD for member countriesindicate that the creative industries in France and the UnitedStates made up about 3 per cent of gross value added in2002-2003 and almost 6 per cent of gross value added inthe United Kingdom.
10.2.4 The creative economy in the developing world
The engagement of developing countries with the cre-ative economy varies dramatically around the world partlybecause of differences in the industrial and export capabili-ties of different countries but partly also because of varia-tion in the extent to which different countries have recog-nized and implemented a deliberate development agenda forthe creative sector. In Africa, for instance, there has been onlylimited commercialization of creative products. Perhaps themost obvious illustration is music, a form of cultural expres-sion that is of particular importance on the African conti-nent. Much of the music industry in Africa remains based onlive performance, with formal production and circulation ofmusic products still awaiting further development. A salientissue here is that developing countries commonly lack theinstitutional resources to manage copyright collection andpayment systems. Accordingly, star performers are frequent-ly attracted overseas in search of wider opportunities or sim-ply in pursuit of payment for what they do. Some areas ofAsia, by contrast, are at the leading edge of innovation in cre-ative production, as in the case of video games in theRepublic of Korea. Likewise, a number of Asian cities areformulating urban development strategies with a strongemphasis on cultural and creative activities. In the Caribbeanand Central and South America, the state of the creativeindustries varies considerably across the board, with differentindustries being the focus of attention in different countries,such as publishing in Argentina, music in Jamaica or the filmindustry in Mexico.
10.2.5 The value chain for creativeproducts
It is essential to understand the value chain for theproduction and distribution of creative goods and services inorder to determine optimal points of intervention for policy initiatives designed to boost the creative economy. Asystematic understanding of who the stakeholders in the cre-ative economy are, how they relate to one another, and howthe creative sector relates to other sectors of the economy iscritical for informed policy-making.
One tool that has proven useful for studying the cre-ative economy is value-chain analysis, which depicts theprogress of creative goods from an initial idea through tofinal consumption. In particular, it is important to examine
203C R E AT I V E E C O N O M Y R E P O R T 2 0 0 8
Lesso
ns le
arn
ed a
nd p
olic
y optio
ns
10
204 C R E AT I V E E C O N O M Y R E P O R T 2 0 0 8
the early stages in the chain, i.e., to understand the structureof the production sector for creative goods and services.Production units in this sector range from individual artistsand producers on the one hand to large transnational corpo-rations on the other. In between are small and medium-sizedenterprises (SMEs), which, in many developing-country sit-uations, comprise the most significant element in terms ofvolume of output and levels of employment and communityengagement. In a number of instances, these businesses offerthe best prospect for combining economic revenue potentialwith the development of authentic cultural symbols and traditions, for example in the production of craftware, fash-ion products, music recordings, etc. Indeed, SMEs maybecome the cornerstone of locally based strategies for sus-tainable development of the creative industries, enhancingthe economic, cultural and social life of the community.Value-chain analysis also enables identification of creativeproducts and services with particular competitive advantagesor that are capable of being developed as niche markets inparticular situations.
10.2.6 Data issues
Reliable data on the creative economy – on its inputs,outputs, value of production, prices, employment and trade –are in short supply among developing countries, and there isan urgent need to improve statistical collections as a basis forformulating creative-industry policy. The lack of a traditionfor economic valuation and measurement in the culturalsphere, combined with difficulties of definition in the realmof cultural activities and creative goods and services, hasmeant that there has been a dearth of reliable indicators onwhich to base assessments of the size and scope of the cre-ative economy. Moreover, the rapid pace of technologicalchange has made it difficult to keep abreast of new productsand services constantly coming onto the market.
Thus at present, we have only a limited set of meas-ures of creative-industry output, employment and trade. Inan ideal world, these are the data with which we might start.In addition, data on participation and cultural and creativeactivity time-use would help to develop a more holistic perspective. Even so, new models are required. In regard tocreative employment, for example, statistics on occupationby industry are necessary to assess the linkages between thecreative industries and other sectors while data on the loca-tional distribution of employment is important for analysis
of creative clusters. In regard to trade, although exports andimports of physical products produced by the creative indus-tries are documented (as in the statistical tables on trade increative goods and services assembled as part of thisReport), the increasing dematerialization of cultural prod-ucts has made statistical tracking of trade problematic. Inregard to audiovisual products, for example, the internationalmarket in rights and services certainly exceeds the physicalmarket in value terms, yet documentation of the volume andvalue of rights trade is difficult to obtain. Nevertheless, it ispossible to make some progress towards improving ourunderstanding of international trade of creative productsthrough a combination of existing trade data and statisticson copyright payments.
10.2.7 Trade
Despite the problems in measurement, it is possible toassemble consistent data on trends in exports and imports ofcreative products classified by region and by product category.In a pioneering exercise, this Report presents a universalcomparative analysis of trade in creative goods and services,based on national trade statistics that can serve as a startingpoint in the development of more comprehensive and moretransparent statistical collections. This exercise draws attentionto the complexity, the heterogeneity and the multidisciplinarynature of the creative economy and points to the difficulties inconceptualizing, classifying and measuring production andtrade of the creative industries. The actual figures for trade arewithout doubt an underestimate and skewed towards produc-tion, as this is where data collection concentrates.
As noted above, the material aspect of the creativeeconomy is potentially less important than itsimmaterial/rights dimension; unfortunately, however, this isthe domain on which we have the least information.Moreover, we have little knowledge of the effective modes ofgovernance of this trade. WIPO has made some useful inter-ventions in this field, but its objective is regulation; thus itfocuses on different variables. The trend analysis shows thattrade in creative goods and services over the last decade hasshown an unprecedented rate of growth as compared to themore traditional manufacturing and services. Assuming thisgrowth continues in the coming years, it will open up newopportunities for developing countries to increase their market shares of global trade in creative products.
Less
ons
learn
ed a
nd p
olic
y opti
ons
10

10.2.8 Connectivity and ICTs
As noted earlier, a major driver of the growth of thecreative economy worldwide has been the advent of newinformation and communication technologies (ICTs). Ofcourse, ICTs benefit the whole economy but their role in thecreative industries is of particular significance. They offernew distribution channels for creative content; allow theadoption of innovative entrepreneurial business models; andstrengthen the links between creativity, culture, technologyand economic development.
In the context of developing countries, ICTs have astrong potential to boost socio-economic development, espe-cially through the opportunities that they provide to SMEsto broaden their customer bases and increase their participa-tion in international supply chains. ICTs can leverage newlinks in the value chain in many creative industries, especiallyvia the phenomenon of digital convergence. Again, however,measurement issues arise, especially in assessing Internet penetration and usage, the extent of e-commerce, etc. Effortsare under way in different parts of the United Nations system to meet the challenges of new technologies throughinternational cooperation, for example in the compilation ofstandardized statistics, the promotion of a global hub fornetworking, and support for creative-economy expos toexpand understanding of the creative industries in a digitalenvironment.
10.2.9 Policy towards the creativeeconomy
The cross-cutting nature of the creative economy means thatpolicy development for the creative industries must be for-mulated on a coordinated interministerial basis. The range ofinstruments that can be used by policy-makers in chartingdevelopment strategies for the creative industries in develop-ing countries is wide indeed. In broad terms, the need is forinfrastructure development and capacity-building to rein-force the operation of fiscal policies, competition law andintellectual property regimes in addition to traditionaldebates about intrinsic value. In more specific terms, policyinitiatives may be undertaken in:
■ mapping of inventories of cultural assets and creativeindustries;
■ SME business development and finance (e.g., micro-finance);
■ copyright legislation and enforcement;
■ support for artists and the arts, both direct (via fiscalmeans) and indirect (through encouragement of private-sector support);
■ conservation of tangible and intangible cultural heritage;
■ expansion of digital capacity and know-how;
■ market development, both domestic and export;
■ tourism promotion;
■ education, training and skills development; and
■ industry assistance (e.g., via investment incentives, tax concessions, etc.).
As a result, policy development cannot be confinedto a single ministry but requires co-ordinated action acrossa range of ministerial responsibilities, and although mainlyurban in location, it is important in rural areas, too. Theappropriate development paradigm is one based on sustain-able development measured in economic, cultural, socialand environmental terms. Only by adopting such a paradigm shift can we recognize the breadth and depth ofthe potential contribution of the creative industries todeveloping countries.
10.2.10 International context
The creative economy features in a number of arenas ofinternational policy-making. The challenge is to create a pos-itive environment to optimize the potential of the creativeeconomy for development gains. Moreover, given the multi-faceted and multidisciplinary nature of the creative economy,governments can benefit from synergy and expertise from theUnited Nations system to analyse key issues to assist them inpolicy formulation.
Policy-makers need to be aware of a number of sub-tleties in dealing with the creative economy. In the area oftrade, for example, ongoing multilateral negotiations contin-ue to encounter difficulties in dealing with cultural productsalthough it should be noted that the General Agreement onTrade in Services (GATS) has built-in flexibilities that developing countries can use to strengthen their creativeindustries. The Agreement on Trade-Related Aspects ofIntellectual Property Rights (TRIPS) offers some prospectfor consideration of topics related to the creative economy,but to date, matters such as folklore and traditional knowledgehave received little attention. Undoubtedly, a major area fornational and international action is the copyright area.
205C R E AT I V E E C O N O M Y R E P O R T 2 0 0 8
Lesso
ns le
arn
ed a
nd p
olic
y optio
ns
10

206 C R E AT I V E E C O N O M Y R E P O R T 2 0 0 8
Further development of the creative sectors of many develop-ing countries depends critically on having in place an effectivecopyright regime, as well as the implementation of the WIPODevelopment Agenda. Other initiatives for trade expansionare under way, for example the development of opportunitiesfor increased South-South trade as part of the work of theUNDP Special Unit for South-South Cooperation and thefacilitation of business opportunities for creative entrepre-neurs by ITC.
An important step forward in raising the profile of the
creative sector in developing countries has been the ratificationof the UNESCO Convention on the Protection andPromotion of the Diversity of Cultural Expressions. Thistreaty draws particular attention to the role of the creativeindustries as a source of economic and cultural empowerment,particularly in the developing world, and encourages countriesto give greater prominence to policy-making in this area. Allof these international aspects should be seen in the context ofthe Millennium Development Goals. The Goals provide a setof strategic objectives and the creative industries in developingcountries are well placed to contribute to their achievement.
Less
ons
learn
ed a
nd p
olic
y opti
ons
10
10.3 Policy options
As already emphasized through the overall analysis ofthis Report, the creative economy represents a positive-sumgame for both developed and developing countries. Creativityis found everywhere in the world and is an inexhaustibleresource. However, it can be argued that some countries havebeen greatly benefiting from the dynamism of the creativeeconomy while the great majority of developing countries arenot yet doing so.
A number of questions have been raised but there areno simple answers nor a unique recipe. Why are developingcountries net importers of creative goods and services,
accumulating deficits in their trade balance of creative products? What are the structural factors limiting creativecapacities in developing countries despite the abundance ofcreative talents? How to reconcile cultural and social objec-tives with international trade and technology policies? Howto build creative capacities and make the best use of interna-tional cooperation? How to integrate local creative industriesinto national development strategies and global markets?
Previous chapters provided evidence that several obstacles have been contributing to the accentuation of theabove-mentioned asymmetries owing to both national and
Box 10.1 Summary of key messages
The key messages of this Report can be summarized as follows:
■ Evidence shows that trade in creative goods and services is important to the economies of developing countries, and the importance of this trade high-lights the strength of the creative economy in many parts of the developing world. Despite the difficult obstacles that many developing countries facein accessing global markets for creative products there is the potential for looking to export expansion as a source of growth for the creative economiesof these countries.
■ Policy strategies to encourage the development of the creative industries in Southern countries must recognize the cross-cutting and multidisciplinarynature of the creative economy, with its widespread economic, social and cultural linkages and ramifications. Key elements in any package of policymeasures are likely to emphasize the “creative nexus” between investment, technology, entrepreneurship and trade.
■ Evidence-based policy-making is hampered at present by a lack of comprehensive and reliable data on the various dimensions of the creative economy.Progress can be made in assessing production and trade in creative products in developing countries using existing statistical sources. Furtherprogress, however, requires the development of new models for gathering data (qualitative and quantitative) concerning the creative industries andhow they function within the economy as well as improvement in the quality of current data-collection processes.
■ Current IPR legislation has not been able to avoid economic asymmetries. Therefore, efforts to enforce IPR regimes should ensure that the interests ofartists and creators from developing countries are duly taken into account. Intellectual property should provide a stimulus to creators and entrepreneursin the form of a tradable economic asset that is instrumental to enhancing the potential of the creative sector for development.

international systemic biases. This concluding chapter isintended to assist policy-makers from governments as well asdecision-makers and the creative people engaged in the day-to-day dynamics of the creative economy to identify policyoptions and possible priorities to optimize the developmen-tal impact of their creative economies and to foster, protectand promote their creative industries. This is expected toshed light on the likely way ahead and prospects for thefuture course of policy action by the different groups ofstakeholders.
10.3.1 Role of governments
As evidenced by the analysis of this Report, marketsalone are unable to correct the imbalances affecting the func-
tioning of global markets for creative products. Distortionsin the market structure of most creative sectors, which ingeneral is highly vertically integrated, pose problems of dis-tribution and market access for the participation of develop-ing countries in international trade. Therefore, the role ofgovernments is crucial for the formulation of public policiesto nurture a solid, self-sustainable creative economy able tocompete at the multilateral level. The main point is notwhether governments should be leading or responding tocalls from their creative industries but how to put in place aplan of action and effective mechanisms to articulate tailor-made policies to stimulate creativity and improve the com-petitiveness of creative products with the best competitiveadvantages in world markets while preserving cultural identi-ty. Developing countries in particular need to retain policyspace to enhance their creative industries in order to be able
207C R E AT I V E E C O N O M Y R E P O R T 2 0 0 8
Lesso
ns le
arn
ed a
nd p
olic
y optio
ns
10
Table 10.1 Creative industries policy options
Policy level
Micro
Meso
Macro
Meta
Source: UNCTAD.
Objective Option
Analysis and mapping of the economic and socialimpact of the creative industries.
Supporting creative SMEs.
Comparative analysis of the relationship betweenthe creative and the related industries.
Establishment of an informed, evidence-based policy-making system.
Cross-departmental institutional mechanisms.
Socio-economic development.
Creation of national identities.
Analysis of the long-term impact of creative industries.
Situational analysis of value-chain cycles, review of the (non)existing sectoralpolicies and the ecology peculiar to each creative industry.
Creative SMEs development initiatives: financial and fiscal support, businessskills training, tools for start-up businesses and market strategies.
Establish creative clusters and creative-industry infrastructures to motivate best practices, sharing of knowledge and absorb the informal sector.
Organize networking and sectoral associations; facilitate partnerships,joint ventures involving different stakeholders including NGOs and academia.
Expand the use of ICTs and promote the use of other new technologies to benefit from new business models in all stages of the creative chain.
Identify crucial interfaces and intermediaries among all constituents.
Set up a monitoring system and collect necessary information to identify themost appropriate models.
Distinguish the gap between national statistics and real market activities forassessment tools.
Set up a multidisciplinary centre or an inter-ministerial task force to facilitatecoordination among different departments, such as culture, trade, finance,tourism, labour, technology, education and migration.
Identify the uniqueness, strengths and weaknesses of local creative industriesand opportunities for international trade.
Examine the limitations of existing copyright schemes and other IPRs and implementan appropriate competition law.
Promote cultural diversity and social inclusion policies, particular tailored for theyouth and women.
Apply creative industries “branding” as a national strategy to promote image.
Analyse the changes in aesthetics, lifestyle, commodification over a long periodand their impact on national strategies.
208 C R E AT I V E E C O N O M Y R E P O R T 2 0 0 8
to face fierce competition from large conglomerates.
In this context, governments are encouraged to create aconducive climate and the infrastructure necessary to stimu-late integrated, mutually supportive domestic policies. Table10.1 summarizes some elements of a broad national frame-work and the different levels of action and areas to reinforcepublic policies, identifying expected objectives and steps toharnessing their creative economy for development gains.
10.3.2 Role of creative entrepreneurs
All creative activities involve a high degree of risk. Thesuccess or failure of a creative product is difficult to predict.Artists and creators are rightly concerned with their own cre-ations and in an ideal environment should not be distractedwith marketing and business aspects. However, in an increas-ingly flexible structure peculiar to the creative economy,independent artists and creators are becoming much moreautonomous and compelled to deal with business aspects inorder to be able to survive from the commercial activitiesresulting from their creations. Furthermore, the so-calledcreative workforce nowadays has a high level of educationand good knowledge and skills to make use of new ICTtools and the emergence of new business models (see chapter8). In this changing environment, the role of the intermedi-aries is gradually disappearing or being replaced by that ofthe infomediaries, and creators are increasingly recognizingthe importance of developing creative entrepreneurial skillswith a view to combining art, creations and business.
Moreover, as the large majority of creative industriesare small if not micro enterprises, special attention should begiven to the development of the SMEs, with a view to ensur-ing their survival and sustainability. These micro businesses,which characterize most creative industries particularly indeveloping countries, have the capacity to create jobs andstimulate employment and income-generation despite themarket-entry barriers they face. Therefore, it is imperative topromote cultural or creative entrepreneurship through specific vocational-training initiatives. Creative practitionerscan enhance their capacities through different types of trainingthrough capacity-building activities such as formal professionaleducation, informal training and specific training programmes.
The main areas with which creators should be famil-iarized include:
■ employment, wages and working conditions, includingcontracts and regulations;
■ financing instruments and access to credit and funding forcreative or cultural projects;
■ protection for IPRs, in particular copyright legislation;
■ new technologies and ICT tools for creation, productionand distribution of creative content; and
■ continuous learning in their respective fields for upgradingof know-how.
10.3.3 Role of civil society and theplace of strategic alliances
As most creative industries are fragmented for the reasons mentioned above, the forging of strategic alliances tofacilitate interactions with all stakeholders is important inorder to overcome constraints due to a small size. Effortsshould be made to promote dialogue, synergy, exchange ofexperiences, etc. Artists and creators, whether working inde-pendently or in creative enterprises, should build allianceswith the following:
■ agents from government, both public and semi-publicsectors;
■ private-sector and profit-led enterprises and businessgroups, potential sponsors, etc;
■ lobbying groups, federations, professional associationsand unions; and
■ non-profit organizations such as foundations, NGOs andacademia.
It is important to remember that every individual isa net consumer of creative products. Every day we listen tomusic, read books and newspapers, watch television, enjoy amovie, go to theatres, visit an art exhibition, consume fash-ionable clothing, etc. Networking with civil society as awhole can be part of a marketing strategy. In a number ofcountries, associations of independent producers have beenset up to represent the interests of respective creative indus-tries with the different stakeholders.
The important role played by NGOs engaged in thecreative economy should not be neglected. They usually havean active presence at grass-roots levels, promoting socialinclusion at the community level and leading initiatives particularly adapted for the youth and creative women.
Less
ons
learn
ed a
nd p
olic
y opti
ons
10

In this concluding section, an attempt is made tosketch a future course of action by the international commu-nity to support developing countries in their efforts toenhance their creative economies for development gains. Asthe starting point, this first Report has identified a numberof issues requiring further policy-oriented analysis and moreempirical evidence. In other words, this study should be perceived as an initial step of a work in progress.
Nevertheless, the main purpose of this study was toidentify assessment tools for measuring the economic impactof the creative economy at the national level, with a view toassisting governments to formulate policies to enhance cre-ative capacities on the basis of evidence-based information.The ultimate goal, however, was to sensitize governments tothe importance of the creative economy for generating revenues, employment and trade.
10.4.1 Redefining priorities
From the research undertaken, it was clear that, at thatstage, owing to the absence of a satellite account for captur-ing quantitative and qualitative data for culture and the cre-ative sectors, the only benchmark for tracing the economicimpact of the creative economy on national economies wastrade data. This was the case despite the current gaps inreporting as well as in the level of disaggregation of the sta-tistical classification codes resulting from methodologicaland conceptual inconsistencies. Consequently, the focus ofthe research has shifted from the economic indicators of theinitial overall mapping and assessment exercise towards theanalysis of international trade flows of creative goods andservices. Certainly, the impact of the creative products on thetrade balance of individual countries is a meaningful andprobably more convincing, evidence-based economic indica-tor that is able to influence policy-making particularlybecause it shows that in broad terms, developing countrieshave impressive trade deficits as regards creative products.
Now that a pioneering work has been undertaken bythe UNCTAD secretariat to capture trade data and show theglobal picture of the recent evolution in world trade ofcreative goods and services, it is hoped that governments willnow ensure that the quality and coverage of reported tradedata are improved and that efforts will be made to compileaccurate statistics allowing for comparative analysis at theglobal level.
Furthermore, trade figures have shown that the creative industries are among the most dynamic sectors in theworld economy, and the international trade of creative goodsand services amounted to over $424.4 billion in 2005. This level of export earnings is broadly equivalent to theoverall value of exports of world minerals and metals.Against this background, this Report concludes that the priority in terms of capturing data should be to provide reliable, systematic and more disaggregated trade data tosupport policy-making.
10.4.2 Role of international cooperation
In conclusion it can be said that this exercise was aconcrete illustration of how international cooperation by theUnited Nations system can be used to assist governments tobetter grasp the overall interactions of the creative economyand to identify areas for future policy-oriented analysis.Synergy among the five collaborating agencies has improvedand there is a better understanding of the complementaritiesof the competences and mandates of each organization. Thisstudy has also helped to consolidate the work of each institution in areas relating to the creative economy, pavingthe way for enhanced cooperation in this area. This cooperativeeffort can serve as an example for intra- and inter-countrycooperation involving various ministries and other development actors.
209C R E AT I V E E C O N O M Y R E P O R T 2 0 0 8
Lesso
ns le
arn
ed a
nd p
olic
y optio
ns
10
10.4 The way ahead

210 C R E AT I V E E C O N O M Y R E P O R T 2 0 0 8

Adorno, Theodor and Horkheimer, Max (1947). Dialektikder Aufklärung: Philosophische Fragmente. Amsterdam, Querido.English translation by John Cumming, Dialectic ofEnlightenment. London, Verso, 1979.
Aksoy, A. and Robins, K. (1997). “Peripheral Vision:Cultural Industries and Cultural Identities in Turkey”,Environment and Planning A 29(11):1937-52.
Anheier, Helmut and Isar, Yudhishthir Raj (eds.) (2007).Cultures and Globalization Series: Conflicts and Tensions.London, SAGE Publications.
Atzmuller, Christian (2003). “Kreativwirtschaft-Die‘Entdeckung’ eines Wirtschaftszweiges. (CreativeIndustries: An Economic Sector is Being Discovered.With English summary)”. Wirtschaftspolitische Blatter50(3):402-08.
Audley, Paul (1983). Canada’s Cultural Industries: Broadcasting,Publishing, Records, and Film. Toronto, Lorimer.
Barrowclough, Diana and Zeljka Kozul-Wright (2007).Creative Industries and Developing Countries: Voice, Choice andEconomic Growth. London, Routledge.
Beck, Andrew (ed.) (2003). Cultural Work: Understanding theCultural Industries. London, Routledge.
Bilton, Chris (2006). Management and Creativity: From CreativeIndustries to Creative Management. Oxford, Blackwell.
Boorsma, Peter B. (2002). Privatization and Culture,Experiences in the Arts, Heritage and Cultural Industries in Europe.Kluwer Academic Publishers.
Boston’s Creative Economy. BRA/Research, United States ofAmerica. Available online at: http://www.cityof-boston.gov/bra/PDF/ResearchPublications/BostonCreativeEconomy.pdf.
Brenner-Beck, Dru (1992). Do As I Say, Not As I Did, 11UCLA PAC. BASIN L.J., 84.
Bryan, Jane, Steve Hill, Max Munday, Annette Roberts(2000). “Assessing the role of the arts and culturalindustries in a local economy”, Environment and PlanningA, 32:1391-1408.
Bustamante, Enrique (2004). “Cultural Industries in theDigital Age: Some Provisional Conclusions”, Media,Culture & Society, 26(6): 803-820.
Caves, Richard E. (2000). Creative Industries: Contracts betweenArt and Commerce. Cambridge, Massachusetts, HarvardUniversity Press.
Collins, J. (2001). “Music Awards 2001: MakingGhanaian Music Exportable”. Available online at:http://www.scientificafrican.de/scholars/collins/musawards.pdf .
Collection Mutations (2004). Diversité Culturelle. Autrement.
Cunningham, Stuart (2002). “From Cultural to CreativeIndustries: Theory, Industry, and Policy Implications”,Media International Australia incorporating Culture: Development,Industry, Distribution, 102:54-65.
______(2004). “The Creative Industries after CulturalPolicy”, International Journal of Cultural Studies 7(1):105-15.
______(2006). “What Price a Creative Economy”.Platform Paper 9. Sydney.
Cunningham, Stuart, Terry Cutler, Greg Hearn, MarkRyan and Michael Keane (2004). “An InnovationAgenda for the Creative Industries: Where is the R&D?”Media International Australia incorporating Culture and Policy,112:174-185.
Cunningham, Stuart et al. (2007). “Financing CreativeIndustries in Developing Countries”, in DianaBarrowclough and Zeljka Kozul-Wright, CreativeIndustries and Developing Countries: Voice, Choice and EconomicGrowth. London: Routledge.
Deacon, H. (2007). Unpublished presentation to theDAC Policy Review Workshop, 6-8 May, Johannesburg.
Deacon, H., Mngqolo, S. and Proselendes, S. (2003).“Protecting Our Cultural Capital: A Research Plan forthe Heritage Sector”, Social Cohesion and IntegrationResearch Programme. Occasional Paper 4, HSRC Press.Available from www.hsrcpress.ac.za .
211C R E AT I V E E C O N O M Y R E P O R T 2 0 0 8
Refe
rences
Books and journal articles
References

212 C R E AT I V E E C O N O M Y R E P O R T 2 0 0 8
De Berranger, Pascale and Meldrum, Mary C. R. (2000).“The Development of Intelligent Local Clusters toIncrease Global Competitiveness and Local Cohesion:The Case of Small Businesses in the Creative Industries”,Urban Studies, 37(10):1827-1835.
Dempster, Anna M. (2006). “Managing Uncertainty inCreative Industries: Lessons from Jerry Springer theOpera”, Creativity & Innovation Management, 15(3):224-233.
Dorland, Michael (1996). The Cultural Industries in Canada.Toronto, Lorimer.
Drahos, Peter. “Negotiating Intellectual Property Rights:Between Coercion and Dialogue”, Presented to the NinthAnnual Conference on International Intellectual PropertyLaw and Policy, Fordham University School of Law, NewYork, 19-20 April 2001.
Drake, Graham (2003). “‘This place gives me space’: Placeand Creativity in the Creative Industries”, Geoforum,34:511-524.
Felsenstein, Daniel and Barkai, Hanan (2002). ‘’IdentifyingGlobalization Trends in the Cultural Industries of TelAviv’’, Emerging Nodes in the Global Economy: Frankfurt and TelAviv Compared by D. Felsenstein, E. W. Schamp and A.Shachar. GeoJournal Library, Dordrecht; Boston andLondon, Kluwer Academic Publishers, 72:237-254.
Fink, Carsten and Maskus, Keith (2005). Intellectual Propertyand Development: Lessons from Recent Economic Research. WorldBank and Oxford University Press.
Flew, Terry (2002). ‘’Creative Industries’’, New Media: AnIntroduction. Melbourne, OVP:114-138.
______(2002). ‘’Beyond Ad Hocery: Defining CreativeIndustries’’, Cultural Sites, Cultural Theory, Cultural Policy, TheSecond International Conference on Cultural Policy Research. TePapa, Wellington, New Zealand, Media &Communication, Creative Industries Faculty, QueenslandUniversity of Technology.
Florida, Richard (2002). The Rise of the Creative Class …andHow It’sTransforming Work, Leisure, Community and Everyday Life.New York, Basic Books.
______(2005). Cities and the Creative Class. New York,Routledge.
______(2005). The Flight of the Creative Class: The New GlobalCompetition for Talent. New York, Harper Business.
Galloway, Susan and Dunlop, Steward (2007). “A Critiqueof Definitions of the Cultural and Creative Industries inPublic Policy” in International Journal of Cultural Policy,vol.13, No.1:27.
García Canclini, Néstor (2006). Las industrias culturales y eldesarrollo de México.
Garnham, Nicholas (2005). “From Cultural to CreativeIndustries: An analysis of the Implications of the ‘CreativeIndustries’ Approach to Arts and Media policy making inthe United Kingdom”, The International Journal of CulturalPolicy, 11(1):15-29.
Gates, Bill, Myhrvold, Nathan and Rinearson, Peter (1995).The Road Ahead. New York, Viking Press.
Gibson, Chris (2003). “Cultures at Work: Why ‘Culture’Matters in Research on the ‘Cultural’ Industries”, Social &Cultural Geography, 4(2):201.
Gordon, John C. and Helen Beilby-Orrin (2007).International Measurement of the Economic and Social Importance ofCulture (document STD/NAFS(2007)1). Paris, OECDStatistics Directorate. Available online at: http://www.oecd.org/dataoecd/56/54/38348526.pdf.
Hartley, John (2005). Creative Industries. Oxford, BlackwellPublishing.
Hartley, John and Michael Keane (2006). “CreativeIndustries and Innovation in China” International Journal ofCultural Studies, 9(3):259-262.
Henkel, Cathy (2006). Imagining the Future 2, Screen and CreativeIndustries in the Northern Rivers Region; Development Trends andProspects for the Next Decade. Northern Rivers, p. 247.
Hesmondhalgh, David (2002). The Cultural Industries.London, SAGE Publications.
______(2005). “Cultural Industries and Cultural Policy”,The International Journal of Cultural Policy, 11(1):1-13.
______(2007). The Cultural Industries, 2nd ed. London, SagePublications.
Higgs, Peter (2006). Taking the Ruler to the Creative Industries:How, Why and to What Effect. ARC Centre of Excellence forCreative Industries & Innovation.
Hirsch, Paul M. (1972). “Processing Fads and Fashions: AnOrganization-Set Analysis of Cultural Industry Systems”,The American Journal of Sociology, 77(4):639-659.
______(2000). “Cultural Industries Revisited”, OrganizationScience, 11(3):356-361.
Refe
rences

Howkins, John (2001). The Creative Economy: How People MakeMoney from Ideas. London, Penguin.
Hui, Desmond (2006). “From Cultural to CreativeIndustries: Strategies for Chaoyang District, Beijing”,International Journal of Cultural Studies, 9(3):317-331.
Ilczuk, Dorota and Wieczorek, Anna (2000). “On theDevelopment of Cultural Industries in Post CommunistPoland”, Journal of Arts Management, Law & Society, 30(1):53.
Jayne, Mark (2005). “Creative Industries: The RegionalDimension?” Environment and Planning C: Government andPolicy, 23:537-556.
Jeffcutt, Paul (2000). “Management and the CreativeIndustries”, Studies in Cultures, Organizations and Societies,6:123-127.
______(2004). “Knowledge Relationships and Transactionsin a Cultural Economy: Analysing the Creative IndustriesEcosystem”, Media International Australia incorporating Cultureand Policy, 112:67-82.
Jeffcutt, Paul, Pick, John and Protherough, Robert (2000).“Culture and Industry: Exploring the Debate”, Studies inCultures, Organizations & Societies, 6(2):129-143.
Jeffcutt, Paul and Pratt, Andy C. (2002). “ManagingCreativity in the Cultural Industries”, Creativity andInnovation Management, 11(4):225-233.
Jones, Peter et al. (2004). “Creative Industries: EconomicContributions, Management Challenges and SupportInitiatives”, Management Research News, 27(11/12):134-145.
Jones, Candace and Horton, Patricia H. (eds.) (2005).Transformation in Cultural Industries. Research in theSociology of Organizations. JAI Press.
Keane, Michael, Ryan, Mark David and Cunningham, Stuart(2005). “Worlds Apart? Finance and Investment inCreative Industries in the People’s Republic of China andLatin America “, Telematics and Informatics, 22(4):309-331.
Kong, Lily (2005). “The Sociality of Cultural Industries:Hong Kong’s Cultural Policy and Film Industry”, The International Journal of Cultural Policy, 11(1):61-76.
Landry, Charles (2000). The Creative City: AToolkit for UrbanInnovators, London: Comedia/Earthscan.
Lawrence, Thomas B. and Phillips, Nelson (2002).“Understanding Cultural Industries”, Journal of ManagementInquiry, 11(4):430-442.
Lilley, Anthony (2006). Inside the Creative Industries—Copyrighton the Ground. Institute for Public Policy Research.Available online at: http://www.ippr.org.uk/publication-sandreports/publication.asp?id=483.
Loew, Lauren (2006). “Creative Industries in DevelopingCountries and Intellectual Property Protection”, VanderbiltJournal of Entertainment & Technology Law, 9:171.
Maleiros, A. (2007). The Cinema Industry in the World.São Paulo.
Mansell, R. and When, U. (1998). Knowledge Societies:Information Technology for Sustainable Development, published byOxford University Press for the United NationsCommission on Science and Technology for Development.
Marcuse, Herbert (1991). One Dimensional Man: Studies in theIdeology of Advanced Industrial Society. Boston, Beacon.
Markusen, Ann et al. (2006). Defining the Cultural Economy:Industry and Occupational Approaches. North AmericanRegional Science Council Meetings, Toronto.
Marvasti, A. (1994). “International Trade in CulturalGoods: A Cross-Sectional Analysis”, Journal of CulturalEconomics, 18(2):135-148.
Maskus, Keith (2002). “Will Stronger Copyright ProtectionEncourage Development of Copyright Sectors inIndonesia? Survey Evidence”. Available online at:http://www.adb.org/Documents/Events/2002/ADF/maskus_paper.pdf.
McFadyen, Stuart, Hoskins, Colin and Finn, Adam (2000).“Cultural Industries from an Economic/BusinessResearch Perspective”, Canadian Journal of Communication,25: 127-144.
Miles, Malcolm (2005). “Interruptions: Testing theRhetoric of Culturally Led Urban Development”, UrbanStudies, 42(5/6):889-911.
Mushinga, Gloria (2007). “Zambia’s ICT Policy FinallyLaunched”. Available online at: www.thewip.net/contrib-utors/2007/04/zambia_s_ict_policy_finally_la.html,accessed on 10/06/07.
Nurse, Keith et al. (2006). The Cultural Industries in CARICOM: Trade and Development Challenges. Barbados,Caribbean Regional Negotiating Machinery.
Oakley, Kate (2004). “Not So Cool Britannia: The Role ofthe Creative Industries in Economic Development”,International Journal of Cultural Studies, 7(1):67-77.
213C R E AT I V E E C O N O M Y R E P O R T 2 0 0 8
Refe
rences

214 C R E AT I V E E C O N O M Y R E P O R T 2 0 0 8
______(2006). “Include Us Out: Economic Developmentand Social Policy in the Creative Industries”, CulturalTrends, 15(4):255-273.
O’Brien Chang, Kevin and Wayne, Chen (1998). Reggae Routes:The story of Jamaican Music. Jamaica, IRP.
O’Connor, Justin (1999). The Definition of “Cultural Industrie”,Manchester Institute for Popular Culture. Available onlineat: www.mipc.mmu.ac.uk/iciss/reports/defin/pdf.
______(2004). ‘’’A Special Kind of City Knowledge’:Innovative Clusters, Tacit Knowledge and the ‘CreativeCity’”, Media International Australia incorporating Culture andPolicy. University of Queensland, 112:131-149, August.
______(2005). “Cities, Culture and ‘TransitionalEconomies”: Developing Cultural Industries in St.Petersburg,” in John Hartley (ed.), Creative Industries.Oxford, Blackwell.
______(2005). “Creative Exports: Taking CulturalIndustries to St Petersburg”, The International Journal ofCultural Policy, 11(1):45-60.
O’Connor, Justin et al. (2007). Cultural Industries and the City.London, Sage Publications.
O’Hagan, J. (1998). The State and the Arts: An Analysis ofKey Economic Policy Issues in Europe and the UnitedStates, Edward Elgar, Cheltenham, p. 22, and Baumol, W.and Peacock, A., A Manifesto for the Arts: Six Principlesto Guide Government Arts Policies, Policy Institute,Society Series No 6. Available online at: http://www.policyinstitute.info/AllPDFs/PeacockSep05.0df 2005, p. 2.
Okediji, Ruth (2003). The International Relations of IntellectualProperty: Narratives of Developing Countries Participation in theGlobal Intellectual Property System, 7 SING. J. INTL &COMP. L. 315, 354.
Piedras Feria, Ernesto (2004). Cuanto vale la cultura?Contribución económica de las industrias rotegidas por el derecho deautor en México. CONACULTA-CANIEM-SOGEM-SACM. México.
Piedras Feria, Ernesto and Gonzalo Rojón (2005).Metodologias Mundiales para la Medicion de las Industrias Protegidaspor los Derechos de Autor. London, The CompetitiveIntelligence Unit.
Porter, Michael E. (1980). Competitive Strategy: Techniques forAnalyzing Industries and Competitors. New York, The Free Press.
______(1990). The Competitive Advantage of Nations. Basingstoke,Macmillan.
Potts, Jason (2006). “How Creative Are the Super-rich?”Agenda, 13(4):339-350.
Power, Dominic (2002). “’Cultural Industries’ in Sweden:An Assessment of their Place in the Swedish Economy”,Economic Geography, 78(2):103-127.
______(2003). “The Nordic ‘Cultural Industries’: A Cross-National Assessment of the Place of the CulturalIndustries in Denmark, Finland, Norway and Sweden”,Geografiska Annaler Series B: Human Geography, 85(3):167-180.
Pratt, Andy C. (1997). “The Cultural Industries ProductionSystem: A Case Study of Employment Change in Britain,1984-91”, Environment and Planning A, 29(11):1953-1974.
______(1998). “A ‘Third Way’ for the Creative Industries?Hybrid Cultures: The Role of Bytes and Atoms inLocating the New Cultural Economy and Society”,International Journal of Communications Law and Policy (1).
______(2004). “The cultural Economy: A Call forSpatialized ‘Production of Culture’ Perspectives”,International Journal of Cultural Studies 7(1):117-128.
______(2005). “Cultural Industries and Public Policy”, The International Journal of Cultural Policy 11(1):31-44.
______(2007). “The State of the Cultural Economy: TheRise of the Cultural Economy and the Challenges toCultural Policy Making”, in The Urgency of Theory, A.Ribeiro (ed.). Manchester, Carcanet Press/CalousteGulbenkian Foundation, pp. 166-190.
______(2008). “Cultural Commodity Chains, CulturalClusters, or Cultural Production Chains?”, Growth andChange, vol. 39, No. 1, March 2008, pp. 95-103.
Primorac, Jaka (2004). Mapping the Position of CulturalIndustries in Southeastern Europe. Cultural Transitions inSouth-eastern Europe. N. Svob-Dokiae. Zagreb, Institute forInternational Relations. Culturelink Joint PublicationSeries No. 6:59-78.
Razlogov, Kirill (1998). ‘’The Conflicts between Profits andPolitics: Cultural Industries in Europe’’, Privatization and Culture:Experiences in the Arts, Heritage and Cultural Industries in Europe. P. B.Boorsma, A. van Hemel and N. van der Wielen (eds.). Boston,Dordrecht and London, Kluwer Academic Publishers.
Reis, Fonseca and Carla, Ana (2003). Marketing Cultural: Efinanciament da cultura. Brazil, Thomson.
Reuvid, Jonathan (2006). “Industry Sectors of Opportunity:3.4 Creative Industries”, Investors’ Guide to the United Kingdom,175-182.R
efe
rences

Rogerson, Christian M. (2006). “Creative Industries andUrban Tourism: South African Perspectives”, Urban Forum,17(2):149-166.
Rossiter, Ned (2006). “Creative Industries in Beijing: InitialThoughts”, Leonardo, 39(4):367-370.
Sagnia, Burama K. (2005). Strengthening Local CreativeIndustries and Developing Cultural Capacity for PovertyAlleviation. International Network for Cultural Diversity, SixthAnnual Conference. Dakar, Senegal.
Sagnia, B. (2006) “Culture and Poverty Alleviation inAfrica: A Review of the Cultural Effectiveness of PovertyReduction Strategy Papers in West and Central Africa”.Paper presented at the Arterial Conference on VitalizingAfrican Cultural Assets, Gorée Institute, Dakar, Senegal,5-7 March 2007.
Santagata, Walter (2006). “Cultural Districts and Their Rolein Developed and Developing Countries” in Ginsburgh, V.and Throsby, D. (eds.). Handbook of the Economics of Art andCulture. Amsterdam, Elsevier/North Holland.
Schuster, J. Mark Davidson (1985). Supporting the Arts: AnInternational Comparative Study. Published by the NationalEndowment for the Arts. Available through ERICDocument Reproduction Services (www.edrs.com)(ERIC document #ED257740).
______(1987). “Making Compromises to MakeComparisons in Cross National Arts Policy Research”,Journal of Cultural Economics, vol. 11, No. 2.
Sciadas, G. (ed.) (2003). Monitoring the Digital Divide …and beyond. Orbicom. Available online at: http://www.orbicom.ca/projects/ddi2002/2003_dd_pdf_en.pdf.182 pp.
Scott, Allen J. (2005). On Hollywood. Princeton, PrincetonUniversity Press.
Scott, Allen J. and Power, Dominic (2004). Cultural Industriesand the Production of Culture. London, Routledge.
Seligman, G. (2001). “Local repertoire hits new highs todominate world music market in African music industry”.Paper presented at the Workshop on the development ofthe music industry in Africa, sponsored by the WorldBank and Policy Sciences Center, Inc., Washington, D.C.,20-21 June 2001. Available at http://siteresources.worldbank.org/INTCEERD/Resources/CWI_music_industry_in_Africa_synopsis.pdf.
______(2001). “The Market for African Music” inWorkshop on the development of the music industry inAfrica, sponsored by the World Bank and the PolicySciences Center, Inc., Washington, D.C., 20-21 June 2001.
Segers, Katia and Huijgh, Ellen (2006). ‘’Clarifying the complexity and ambivalence of the cultural industries.’’First European Communication Conference; 50 Years ofCommunication Research: Past and Future. Amsterdam, steunpunt re-creatif Vlaanderen.
Selwood, Sara (ed.) (2001). The UK Cultural Sector, Profile andPolicy Issues. London, Policy Studies Institute.
Shim, Doobo (2006). “Hybridity and the Rise of KoreanPopular Culture in Asia”, Media, Culture& Society, 28(1):25-44.
Shashikant, Sangeeta, “Intellectual Property and the WIPO‘Development Agenda’”. Available on the IDRC websiteat: http://www.twnside.org.sg/title2/FTAs/ Intellectual_Property/COPYRIGHT_and_Development/IPandtheWIPODevelopmentAgendaSangeetaShashikantWSIS.pdf.
Singh, J. P. (2007). “Culture or Commerce? A ComparativeAssessment of International Interactions and DevelopingCountries at UNESCO, WTO, and Beyond”, InternationalStudies Perspectives, 8(1):36-53.
Sithole, Jabulani (2000). “Culture can play a key role inregional integration”, South African News Features, No.23, 15 December 2000. Available online at: http://www.sardc.net/editorial/sanf/2000/Iss23/Nf2.html.
Taylor, Calvin (2006). “Beyond Advocacy: Developing anEvidence Base for Regional Creative Industry Strategies”,Cultural Trends, 15(1):3-18.
Throsby, David (2001). Economics and Culture. Cambridge.
______(2002). ‘’Modelling the Cultural Industries: NewConcepts and Their Policy Implications’’, SecondInternational Conference on Cultural Policy Research. Wellington,New Zealand.
______(2003). The Cultural Industries in the New Economy.Shifting Foundations, Perth, W.A., Craftwest.
______(2004). “Assessing the Impacts of a CulturalIndustry”, Journal of Arts Management, Law and Society,34(3):188-204.
Tong, Su (2006). “Cultural resources, creative industries andthe long economy.” International Journal of Cultural Studies9(3): 307-316.
215C R E AT I V E E C O N O M Y R E P O R T 2 0 0 8
Refe
rences

216 C R E AT I V E E C O N O M Y R E P O R T 2 0 0 8
Towse, Ruth (ed.) (1997). Cultural Economics: The Arts, the Heritageand the Media Industries, 2 vols. Cheltenham, Edward Elgar.
Towse, Ruth (2000). Cultural Economics, Copyright and the CulturalIndustries. The Long Run, Erasmus University Rotterdam.
______(2001). The Cultural Industries, Copyright andCultural Economics. Creativity, incentive and reward: An econom-ic analysis of copyright and culture in the information age. R. Towse.Cheltenham, U.K. and Northampton, Mass., Elgar.
______(2005). “Managing Copyrights in the CulturalIndustries”. Paper presented at the 8th InternationalConference on Arts and Cultural Management, Montreal,July 2005. Available online at: http://neumann.hec.ca/aimac2005/PDF_Text/Towse_Ruth.pdf.
Tschmuk, Peter (2002). How Creative Are the CreativeIndustries? The Case of the Music Industry, 12th BiennialConference of the Association of Cultural Economics International(ACEI). Rotterdam, the Netherlands.
Wiesand, Andreas and Soendermann, Michael (2005). TheCreative Sector: An Engine for Diversity, Growth and Jobsin Europe, European Cultural Foundation, 18.
Witter, Michael P. (2002). Music and the Jamaican Economy,prepared for UNCTAD/WIPO.
Wu, Qidi (2006). “Creative Industries and Innovation inChina”, International Journal of Cultural Studies, 9(3):263-266.
Wu, Weiping (2005). “Dynamic Cities and CreativeClusters”. Policy Research Working Paper Series,The World Bank.
Yired (2003). “The Kwaito Nation: An Industry Analysis”,unpublished but summary available from http://www.mio.co.za.
Yong-d’Hervé, Daphne (2005). How IP Benefits DevelopingCountries, International Chamber of Commerce, 2005.Available online at: http://www.iccwbo.org/icccjda/index.html .
Yoshimoto, Mitsuhiro (2003). The Status of Creative Industriesin Japan and Policy Recommendations for Their Promotion, NLIResearch, Social Development Research Group.
Yue, Audrey (2006). “Cultural Governance and CreativeIndustries in Singapore”, The International Journal of CulturalPolicy, 12(1):17-33.
Yusuf, Shahid and Kaoru Nabeshima (2005). CreativeIndustries in East Asia. Amsterdam, Elsevier.
Refe
rences
Major reports
“A call to improve intellectual property rights of developingcountries,” in Science in Africa. Available at: http://www.scienceinafrica.co.za/2002/october/copyright.htm.
ACCF (2005). Asia Cultural Co-operation Forum, 9-12November, Hong Kong SAR.
Americans for the Arts (2005). Creative Industries 2005: TheCongressional Report. Washington, Americans for the Arts.
Armstrong, Chris and Ford, Heather (2005). The AfricanDigital Commons: A Participant’s Guide. Johannesburg,Commons-sense Project, LINK Centre, Wits University.
Barbados, K. Nurse (2006). The Cultural Industries in CARI-COM: Trade and Development Challenges.
Boyle, Stephen (2006). Australian Creative Industries, preparedfor Austrade.
British Copyright Council, Preliminary Position Paper,WIPO Discussions on a Development Agenda, 11-13April 2005. Available online at: http://www.britishcopy-right.org/pdfs/policy/2005_023.pdf.
British Council (2006). International Young Music Entrepreneur ofthe Year Award 2006. London, British Council. Available at:http://www.britishcouncil.org/arts-music-iymey-2006.htm.
CAJ (2003). Measuring Culture: Developments Globally to InformWhat We Do Locally, a report prepared for the HSRC andDAC in South Africa as a contribution to the establish-ment of a cultural observatory.
______(2005). A Benevolent Fund for Artists: An investigation intomechanisms to protect artists, report prepared by Creativity AvrilJoffe (CAJ), commissioned by the Arts and Culture Trustfor the Department of Arts and Culture, South Africa.
______(2005). Creative Sector Research in South Africa. Researchsources, key institutions and annotated bibliography of thecultural sector in South Africa, prepared for the first phaseof the Creative Mapping Study for the British Council.
Commission on Intellectual Property Rights (2002). IntegratingIntellectual Property Rights and Development Policy. London.

Council of England (1998). International Data on Public Spendingon the Arts in Eleven Countries, Research Report Number 13.Policy Research and Planning Department.
Département des études, de la prospective et des statistiques(2006). Aperçu statistique des industries culturelles, No. 16,January. Paris, Ministry of Culture and Communication.
Department for Culture, Media and Sports, UnitedKingdom (1998). Creative Industries Mapping Document 1998.
______(2001). Creative Industries Mapping Document 2001.
______(2006). Competition and Intellectual Property. Availableonline at: http://www.cep.culture.gov.uk/index.cfm?fuseaction=main.viewSection&intSectionID=337.
______(2006). Creative Industries Economic Estimates StatisticalBulletin, 5, September.
Department of Arts and Culture, South Africa (2007). Artsand Culture Policy Review. Available online at: http://www.dac.gov.za/projects/Policy%20Review/Background%20document.doc. Accessed on May 14th 2007.
Department of Arts, Culture, Science and Technology(DACST), South Africa (1988). Creative South Africa: AStrategy for Realising the Potential of the Cultural Industries, pre-pared by the Cultural Strategy Group, November.Available online at: http://www.dacst.gov.za/arts_cul-ture/culture/industries/index.htm.
______(1998). In Short: The South African Cultural Industries.Department of Arts, Culture, Science and Technology.
Department of Communication and the Arts, Australia(1994). Creating Culture: The New Growth Industries. Canberra,Australian Government Publishing Service.
Department of Communications, Information Technologyand the Arts, Australia (2004). Creative Industries ClusterStudy, 3 vols. Canberra, Department of Communications,Information Technology and the Arts.
Development Policy Research Unit (DPRU) (2003).Cultural Statistics in South Africa, prepared for the HSCRavailable at: www.culturalobservatory.org.za/pdf_files/econ_of_culture.pdf.
Dos Santos, E. (2006). UNCTAD Statement at the 2nd Meeting ofMinistries of Culture of the African, Caribbean and Pacific Group ofStates, Santo Domingo.
______(2007). Keynotes address on Technology and Creativity:A Perfect Match, at 10th China Beijing International High-Tech Expo-CHITEC, Beijing.
______(2007). “Reconciling Cultural and InternationalTrade Policies”. Paper presented at the Conference onCultural Diversity, German Commission for UNESCO,Essen.
Dos Santos, E. and Laurencin, Henri (2006). Capturing theCreative Economy in Developing Countries, UNCTAD presenta-tion at OECD Workshop on the InternationalMeasurement of the Culture, Paris.
Dutch Guide: Creative Industry (2006). ShanghaiInternational Creative Industry Week.
ERC Services Subcommittee and Workgroup on CreativeIndustries (2002). Creative Industries Development Strategy:Propelling Singapore’s Creative Economy. Economic ReviewCommittee (ERC) Services Subcommittee, Workgroupon Creative Industries.
Gordon, John and Beilby-Orrin, Hellen (2006). InternationalMeasurement of the Economic and Social Importance of Culture.Paris, OECD.
Harare News in Zimbabwe http:// www.southafrica.info/ess_info/sa_glance/media/dvd-piracy-190506.htm.
Hong Kong Special Administrative Region of ChinaGovernment, Home Affairs Bureau (2005). A Study onCreativity Index.
IFPI (2007). Recording Industry in Numbers 2007. InternationalFederation of Phonographic Industry (IFPI).
International Network on Cultural Policy (2003). Survey ofBest Practice in the Cultural Policy Field to AdvanceDiversity in the Cultural Industries. Available online at:http://www.incp-ripc.org/meetings/2003/theme3_ci_e.shtml, accessed on 23/05/07.
James, Vanus (2001). The Caribbean Music Industry Database2000. Report prepared for UNCTAD/WIPO.
Joburg Creative Industry Sector Scoping Study (2003). Cityof Johannesburg, prepared by Monica Newton.
Joffe, A. (2004). The Sector Skills Plan: Film and Television, aresearch report prepared for MAPPP-SETA, South Africa.
Joffe, A. with Sow, A. (2004). Employment Generation andTrade Expansion in the Creative Industries: The Case ofthe Film, Video and Broadcast Industry in Senegal, pre-pared for the Joint ILO/UNCTAD project on the exportpotential of cultural industries in developing countries, 30January 2004.
217C R E AT I V E E C O N O M Y R E P O R T 2 0 0 8
Refe
rences

218 C R E AT I V E E C O N O M Y R E P O R T 2 0 0 8
Joffe, Avril and Jacklin, Natalie (2003). The Film Industry:Promoting the Cultural Sector through Job Creation andSmall Enterprise Development in the SADC Countries,for the series on Upgrading in small enterprise clustersand global value chains, 2003. See www.ilo.org/seed .
Joffe, A. et al. (2003). “Cultural Diversity and the Impact ofGlobalization”. Paper prepared for the Department ofArts and Culture, South Africa, as the Developing coun-tries’ position paper for the International Network onCultural Policy (www.incp-ripc.org) .
KEA, European Affairs (2006). The Economy of Culture inEurope, study prepared for the European Commission(Directorate-General for Education and Culture).Brussels, p. 218.
Kyser, Jack, (2007). Report on the Creative Economy of the LosAngeles Region. Los Angeles Economic DevelopmentCorporation.
Lebethe, Annabel (2003). The Performing Arts and Dance:Promoting the Cultural Sector through Job Creation andSmall Enterprise Development in the SADC Countries,for the series on “Upgrading in small enterprise clustersand global value chains”, 2003. See www.ilo.org/seed .
Marcus, Carmen (2005). Future of Creative Industries:Implications for Research Policy. European Commission.
Mega-Tech (2006). The National ICT Master Plan and E-government Network Feasibility Study in Uganda, 11August 2006, submitted by Mega-Tech, Inc. Downloadedon 20 June from http://wougnet/org.ICTpolicy/ug/ugictpolicy.html.
Ministerio da Cultura, Brazil, IBGE (2003). Sistema deinformaçoes e indicadores culturalis.
Ministerio de Cultura, VECE (2006). El valor económicode la cultura en España.
Ministerio de Cultura y Cámara de Comercio (2006).Bogota, Colombia Arte y Parte: Manual para elemprendimiento en artes e industrias creativas.
Ministry of Culture of Colombia (2006). Company Arts:Manual for Enterprise in the Arts and Creative Industries.
Naylor, Richard, Pratt, Andy and Taylor, Calvin (2006).Creating Global Statistics for Culture: Expert Scoping Study,UNESCO Institute for Statistics, Burns OwensPartnership, London School of Economics, University ofLeeds; Update by UIS.
Nurse, Keith (2006). The Cultural Industries in CARICOM:Trade and Development Challenges, Draft. Caribbean RegionalNegotiating Machinery.
Observatorio de Industrias Culturales de la Ciudad de BuenosAires (2003). Industrias Culturales en Argentina: LosAños 90 y el Nuevo Escenario Post-devaluación. GobBsAs.
Observatory for Cultural Policies in Africa (OCPA).Available online at: http://www.ocpanet.org/.
OCPA and Interarts Experts Meeting on Research Priorities(Dakar, 16-17 November 2005). Available at http://www.ocpanet.org/.
Organization of American States - CIDI (2004). Culture asan Engine for Economic Growth, Employment and Development,Washington, D.C.: Second Inter-American Meeting ofMinisters of Culture and Highest Appropriate Authorities,17-18 June.
Ouest afrique économie (2003). World Bank study of IvoryCoast, Senegal and Mali has noted that the music indus-try in these 3 West African countries is the third highestcontributor to the national economy. Available online at:http://siteresources.worldbank.org/INTCEERD/Resources/CWI_music_industry_in_Africa_synopsis.pdf.
Pontificia Universidade do Rio de Janeiro (2005). CadeiaProductiva da Economia da Musica.
Réseau international pour la diversité culturelle (RIDC). Lerenforcement des industries créatives et le développement des capacitésculturelles pour réduire la pauvreté, Carnet de route du RIDC.Available online at: http://www.incd.net/docs/ INCD_roadmap.doc_Nov06FR.htm.
SADC (1998). Report on the Sector of Culture and InformationPolicies, Priorities and Strategies, May 1998. Available online at:http://www.teledata.mz/sadccult/poling.htm.
Safact [South African Federation against Copyright Theft]piracy campaign. Available online at: http://www.southafrica.info/ess_info/sa_glance/media/dvd-piracy-190506.htm.
Sagnia, Burama (2006). Culture and Poverty Alleviation inAfrica: A Review of the Cultural Effectiveness of PovertyReduction Strategy Papers in West and Central Africa,report prepared for the ARTerial Conference on VitalizingAfrican Cultural Assets, Gorée Institute, Dakar, Senegal,5-7 March 2007. Available online at: http://www.hivox.nl/english/english/arterial/background-materials.Accessed on 19 July 2007.
Refe
rences

Seligman, George (2001). The Market for African Music,Washington, D.C.: Workshop on the Development of theMusic Industry in Africa, World Bank and Policy SciencesCenter, 20-21 June.
Siwek, Stephen E. (2004). Copyright Industries in the US Economy:The 2004 Report. Economists Incorporated.
______(2005). Engines for Growth: Economic Contribution of theUS Intellectual Property Industries. Economists Incorporated.
South African Cultural Observatory. Background documents.Available online at: www.culturalobservatory.org.za.
South African Department of Arts and Culture (2006). Arts,Culture and Food Security in Southern Africa. Draft report.
Task Force on Cultural Indicators of Human Developmentin Africa (2004). Cultural Indicators: Views from Africa, drafted for presentation at the Congress of CulturalRights and Human Development under the auspices ofthe Forum Barcelona.
219C R E AT I V E E C O N O M Y R E P O R T 2 0 0 8
Refe
rences
Publications of international organizations
ILO (2003). The Ethno-Tourism Industry: Promoting theCultural Sector through Job Creation and Small EnterpriseDevelopment in the SADC Countries, for the series on“Upgrading in small enterprise clusters and global valuechains”. Bolnick, Steven, see www.ilo.org/seed.
______(2003). The Music Industry: Promoting the Cultural Sectorthrough Job Creation and Small Enterprise Development in the SADCCountries, for the series on “Upgrading in small enterpriseclusters and global value chains”. Ambert, Cecile, seewww.ilo.org/seed.
______(2003). The Trinity Session. “Promoting theCulture Sector through Job Creation and Small EnterpriseDevelopment in SADC Countries: Craft and VisualArts”, for the series Small Enterprise Development:Value Chains and Cluster Upgrading. Seed WorkingPaper No. 51. See: www.ilo.org/seed.
ILO/UNCTAD (2004). Project on the Export Potential ofCultural Industries in Developing Countries. Prepared by Pratt,A. and Biram N’deck Ndiaye.
ITU/UNCTAD (2007). World Information Society Report2007: Beyond WSIS. Available online at: www.itu.int/wisr .
ITC/WIPO (2003). Marketing Crafts and Visual Arts: The Role ofIntellectual Property: A Practical Guide, International TradeCenter (UNCTAD/ WTO). Geneva.
OECD (2007). International Measurement of the Economic andSocial Importance of Culture (document STD/NAFS(2007)1), prepared by Gordon, John C. and HelenBeilby-Orrin. Paris: OECD Statistics Directorate.Available online at: http://www.oecd.org/dataoecd/56/54/38348526.pdf.
Orbicam-ITU (2005). From the Digital Divide to DigitalOpportunities: Measuring Infostates for Development, G. Sciadas(ed.). Orbicom. Available online at: www.itu.int/ITUD/ict/publications/dd/material/index_ict_opp.pdf.
Organisation internationale de la francophonie (2004). Lesindustries culturelles des pays du sud: enjeux du projet de conventioninternationale sur la diversité culturelle. Paris.
UNCTAD (1998). “Becoming a Globally CompetitivePlayer: The Case of Jamaican Music Industry”, by Z. Kozul-Wright and L. Stanbury. Discussion paper.UNCTAD, Geneva.
______(2002). Trade in Services and Development Implications(document TD/B/COM.1/85). UNCTAD, Geneva.
______( 2004). Creative Industries and Development (docu-ment TD(XI)/BP/13). Geneva, United Nations. Availableonline at: www.unctad.org/en/docs/tdxibpd13_en.pdfAccessed on 2 November 2007.
______(2004). E-Commerce and Development Report 2004.UNCTAD, Geneva.
______(2004). São Paulo Consensus: Report of the Eleventh Session(document TD/412).
______(2004). Summary of High-level Panel on Creative Industries(document TD/L.379).
______(2004). The Least Developed Countries Report. Geneva,UNCTAD.
______(2004). The music industry in Senegal: The Potentialfor Economic Development. Report prepared by Andy Pratt forUNCTAD. Available online at: http://www.lse.ac.uk/collections/geographyAndEnvironment/whosWho/profiles/pratt/pdf/Senegal.pdf.

220 C R E AT I V E E C O N O M Y R E P O R T 2 0 0 8
______(2004). UNCTAD XI High-level Panel on CreativeIndustries and Development Agenda. Available online athttp://www.unctad.org/en/docs/tdximisc1_en.pdf.
______(2005). The Digital Divide: ICT Development Indices2004, UNCTAD, Geneva.
______(2006). Analysis of Options for Implementing Disclosure ofOrigin Requirements in Intellectual Property Applications. Geneva,UNCTAD.
______(2006). Creative Industries Division pamphlet, “CreativeEconomy and Industries”. Geneva, UNCTAD.
______(2006). Information Economy Report 2006: TheDevelopment Perspective (document UNCTAD|SDTE|ECB| 2006|1). Geneva. (Sales no. E.06.II.D.8).
______(2006). Trade and Development Report. Geneva, UNCTAD.
______(2007). Challenging Conventional Wisdom: DevelopmentImplications of Trade in Services Liberalization, Trade, Poverty andCross-cutting Development Issues, Study Series No. 2.(document [TD]UNCTAD/DITC/TAB/POV/2006/1 UNCTAD, New York and Geneva.
______(2007). Developing Countries in International Trade 2006:Trade and Development Index (UNCTAD/DITC/TAB/2006/1). Geneva, UNCTAD.
______(2007). Trade in Services and Development Implications(document TD/B/COM.1.85), Geneva, UNCTAD.
______(2008). Secretary-General’s high-level panel on thecreative economy and industries for development. Pre-conference event, Geneva, 14-15 January 2008.Background paper prepared by the UNCTAD secretariat(document TD(XII)/BP/4, 17 January 2008).
______(2008). Outcome of the Secretary-General’s high-level panel on the creative economy and industries fordevelopment. Pre-conference event, Geneva, 14-15January 2008. Note prepared by the UNCTAD secretari-at (document TD/423, 7 February 2008).
UNCTAD-ICTSD (2005). Resource Book on TRIPS andDevelopment. UNCTAD-ICTSD: Project on IPRs andSustainable Development. Geneva.
UNDP (2004). Human Development Report: Cultural Liberty inToday’s Diverse World. New York, published for the UnitedNations Development Programme.
UNESCO (1982). Cultural Industries: A Challenge for the Futureof Culture. Paris, UNESCO.
______(1988). World cultural report. Paris, UNESCO.
______(1993). Les droits culturels: projet de déclaration”.Switzerland, Editions Universitaires, Université de Fribourg.
______(1997). UNESCO/ITC Symposium on Crafts and theInternational Market: Trade and Customs Codification. Manila.
______(1998). Culture, Creativity and Markets, UNESCOWorld Report Series.
______(1999). The Florence Agreement and Its Protocol ofNairobi. Paris.
______(2000). Copyright: Engine of Development, prepared byOman, Ralph.
______(2000). World Cultural Report. Paris, UNESCO.
______(2003). Study on International Flows of Cultural Goods:1980-1998. Paris, UNESCO.
______(2003). Workshop on Culture and Development in NEPAD’sProgramme of Action. Workshop report.
______(2004). “Take Note: The (Re)Naissance of the MusicIndustry in Sub-Saharan Africa”. Paper prepared by CecileAmbert of Development Works for The Global Alliancefor Cultural Diversity, Division of Arts and CulturalEnterprise, UNESCO, Paris.
______(2005). African Music: New Challenges, New Vocations,prepared by Tchebwa, M.
______(2005). Convention on the Protection and promo-tion of the Diversity of Cultural expressions [online].Available at: http://unesdoc.unesco.org/umages/0014/01429/142919e.pdf.
______(2005). International Flows of Selected Cultural Goods andServices, 1994-2003.
______(2005). Ten Keys to the Convention on the Protection andPromotion of the Diversity of Cultural Expressions.
______(2006). Framework for National Capacity Building Projectsfor Statistics on Cultural Industries. Revised draft (PA).
______(2006). Trends in Audiovisual Markets: Regional Perspectivesfrom the South (document CI/COM/2006/PUB/10).UNESCO, Paris.
______(2006). Understanding Creative Industries: CulturalStatistics for Public-Policy Making. UNESCO, Paris.
______(2007). L’UNESCO et la question de la diversité culturelle1946-2007, Bilan et stratégies (internal document).CLT/CPD.
Refe
rences

UNIDO (2002). Creative Industries and Micro & Small ScaleEnterprise Development: A Contribution to Poverty Alleviation.Vienna.
WIPO (2002). Study on the Economic importance of Industries andActivities Protected by Copyright and Related Rights in the MERCO-SUR Countries and Chile. Geneva, WIPO.
______(2003). Guide on Surveying the Economic Contribution of theCopyright Industries. Geneva, WIPO.
______(2003). Minding Culture: Case Studies on IntellectualProperty and Traditional Cultural Expressions. Geneva, WIPO.
______(2003). Performance of Copyright Industries in Selected ArabCountries: Egypt, Jordan, Lebanon, Morocco and Tunisia. Geneva,WIPO.
______(2003). Traditional Cultural Expressions/Expressions ofFolklore: Legal and Policy Options (document WIPO/GRTK/IC/6/3).
______(2006). National Studies on Assessing the EconomicContribution of the Copyright-based industries, Creative IndustriesSeries No. 1. Geneva, WIPO.
World Bank (2002). Cultural Industries and Intellectual PropertyRights, by Penna, Frank and Visser, Coenraad in Hoekman,Bernard et al. (eds.), Development, Trade and the WTO: A Handbook.
______(2007). World Development Report: Development and theNext Generation. Washington, D.C.
221C R E AT I V E E C O N O M Y R E P O R T 2 0 0 8
Refe
rences
Statistics
DCMS (1998). The Creative Industries Mapping Document 1998.London, HMSO.
______(2001). The Creative industries mapping document 2001.London, HMSO.
______(2005). Creative Industries Economic Estimates StatisticalBulletin. London, HMSO.
GRECE (2004). Guide for Drawing Up Regional Mapping ofCreative Industries. Centro de estudios regionales cafeteros yempresariales. Manizales.
IMF. Balance of Payments Manual. Washington, D.C.
Statistics sources from www.itu.int .
UN (2002). Manual on Statistics of International Trade in Services.
UNCTAD (2000). Tariffs, Taxes and Electronic Commerce: RevenueImplications for Developing Countries, Policy issues in interna-tional trade and commodities, study series No. 5, Geneva.
______(2005). Handbook of Statistics. Geneva.
______(2006). World Investment Report: FDI from Developing andTransition Economies: Implications for Development Report. Geneva,UNCTAD.
UNESCO Institute for Statistics (2005). International Flows ofSelected Cultural Goods and Services, 1994-2003. Montreal,UNESCO Institute for Statistics.
______(2006). Creating Global Statistics for Culture: ExpertScoping Study, Final Report. Montreal, UNESCO Institute forStatistics.
______(2007) Creating Global Statistics for Culture: Revision of theExpert Scoping Study. London, Burns Owens Partnership,and Montreal, UIS.

222 C R E AT I V E E C O N O M Y R E P O R T 2 0 0 8
Refe
rences
Key surveys and assessments: Cultural and creative industries in Latin America and the Caribbean
Country
Argentina
Caribbean
Chile
Publication
La Industria Cinematográfica en la Argentina (The Cinematographic Industry CEDEM, GCBA (Buenos Aires) 2004in Argentina). Perelman, P. & Seivach, P.
Anuario. Industrias culturales. Ciudad de Buenos Aires, 2005 Observatorio de Industrias Culturales Yearly(Yearbook. Cultural Industries. Buenos Aires, 2005). de la Ciudad de Buenos Aireswww.buenosaires.gov.ar/areas/produccion/industrias/observatorio/documentos/anuario_2005.pdf
La importancia económica del sector de videojuegos - situación actual y CEDEM 2005potencialidades en Argentina (The Economic importance of the videogames sector – current situation and potential for Argentina). Perelman, P. & Seivach, P.www.cedem.gov.ar/areas/des_economico/cedem/pdf/coyunt/19/19_17_videojuegos.pdf
Cultura, Medios e Industrias Culturales (Culture, Media and Cultural Industries). Observatorio de Industrias Culturales 2005www.buenosaires.gov.ar/areas/produccion/industrias/observatorio/ de la Ciudad de Buenos Airesdocumentos/publicacion_revista_observatorio_3
Consumos Culturales (Cultural Consumption). Observatorio de Industrias Culturales 2006www.buenosaires.gov.ar/areas/produccion/industrias/observatorio de la Ciudad de Buenos Aires/documentos/publicacion_revista_observatorio_4.pdf
Policy Paper to Inform the Propelling of Barbados’ Creative The National Task Force 2004Economy: A Cultural Industries Development Strategy on Cultural Industrieswww.lacult.org/docc/Taskforceonculturalindustries.pdf
Dinámica Económica de la Cultura en Bolivia Convenio Andrés Bello 2005(The Economic Dynamics of Culture in Bolivia)www.convenioandresbello.org/c12/index.php?page=shop.product_details&flypage=shop.flypage&product_id=163&category_id=10&option=com_phpshop&Itemid=1
Diagnóstico dos Investimentos na Cultura no Brasil Fundação João Pinheiro 1997(Diagnostic of Cultural Investments in Brazil).www.cultura.gov.br/politicas/dados_da_cultura/economia_da_cultura/index.html
A Cadeia Produtiva da Economia da Música (The Economic Chain of Music). Instituto Gênesis & PUC/RJ 2004Prestes Filho, L.C.
Sistema de Informações e Indicadores Culturais 2003 IBGE & Ministério da Cultura 2006(System of Cultural Information and Indicators 2003).www.ibge.gov.br/home/estatistica/populacao/indic_culturais/2003/indic_culturais2003.pdf
O Consumo Cultural das Famílias Brasileiras Instituto de Pesquisa Econômica 2007(Cultural Consumption of Brazilian Families). Barbosa, F. Aplicada (IPEA)www.ipea.gov.br/sites/000/2/livros/gastoeconsumov2/09_Cap03.pdf
Economia e Política Cultural – acesso, emprego e financiamento (Economics IPEA 2007and Cultural Policy – Access, Employment and Funding). Barbosa, F.www.ipea.gov.br/sites/000/2/livros/cardenosdepoliticas/caderno03.pdf
The Caribbean Music Industry Database. James, V.www.wipo.int/export/sites/www/about-ip/en/studies/pdf/study_v_james.pdf UNCTAD & WIPO 2000
The Cultural Industries in CARICOM: Trade and Development Challenges. Nurse, K. et al. Caribbean Regional 2006www.crnm.org/documents/cultural_industries/Cultural_Industries_ Negotiating MachineryReport_Final_Jan07.pdf
Anuario de Cultura y Medios de Comunicación (Culture and Media Yearbook) Consejo Nacional de la Cultura Yearly www.ine.cl/canales/chile_estadistico/estadisticas_sociales_culturales/ y las Artes & INE 1997-cultura/pdf/cultura2002.pdf 2002
Anuario de Cultura y Tiempo Libre (Culture and Leisure Time Yearbook) Consejo Nacional de la Cultura Yearlywww.ine.cl/canales/chile_estadistico/estadisticas_sociales_culturales/ y las Artes & INE fromcultura/pdf/CULTURAYTIEMPOLIBRE2005.pdf 2003
Impacto de la Cultura en la Economía Chilena (Impact of Culture on the Chilean Economy). Ministerio de Educación & 2003www.cab.int.co/cab42/downloads/libro_impacto_cultura_economia_chilena.pdf Convenio Andrés Bello (CAB)
Los Trabajadores del Sector Cultural en Chile. Estudio de Caracterización Consejo Nacional de la Cultura 2004(Cultural Sectors Workers in Chile). y las Artes & CABwww.cab.int.co/cab42/downloads/trabajadoreschile.pdf
Institution Year
Barbados
Bolivia
Brazil
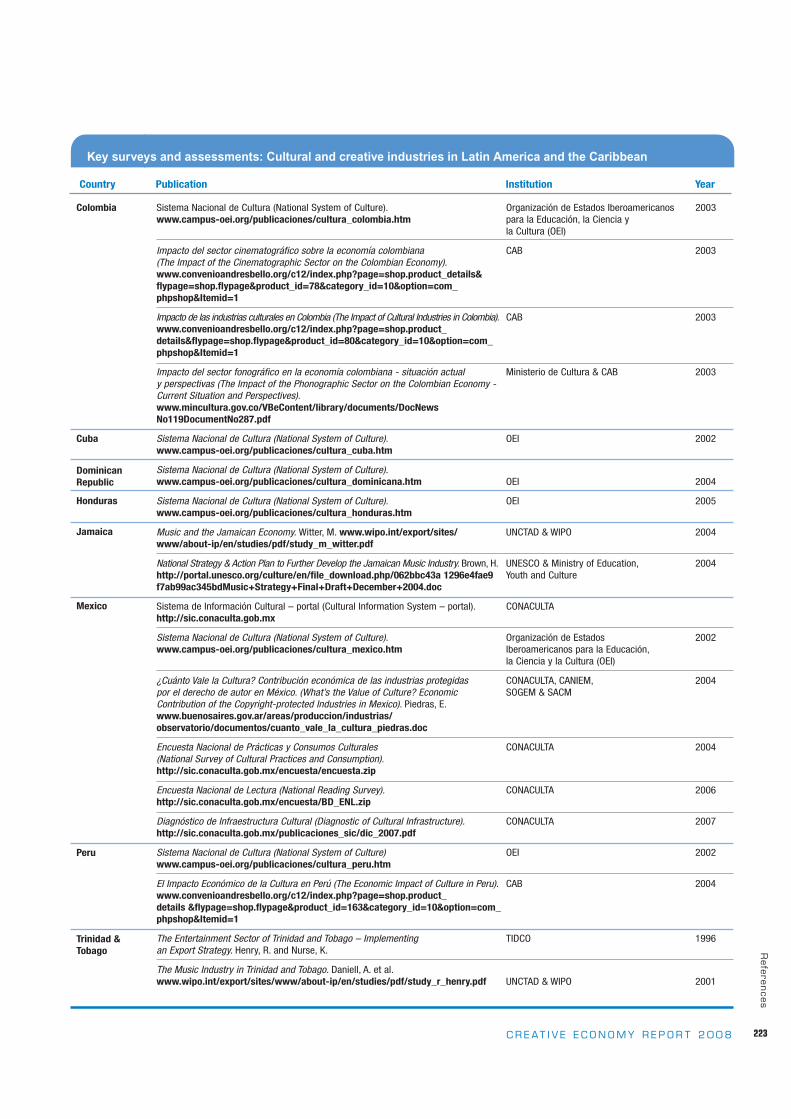
223C R E AT I V E E C O N O M Y R E P O R T 2 0 0 8
Refe
rences
Key surveys and assessments: Cultural and creative industries in Latin America and the Caribbean
Country
Colombia
Cuba
DominicanRepublic
Honduras
Jamaica
Mexico
Peru
Trinidad &Tobago
Publication
Sistema Nacional de Cultura (National System of Culture). Organización de Estados Iberoamericanos 2003www.campus-oei.org/publicaciones/cultura_colombia.htm para la Educación, la Ciencia y
la Cultura (OEI)
Impacto del sector cinematográfico sobre la economía colombiana CAB 2003(The Impact of the Cinematographic Sector on the Colombian Economy).www.convenioandresbello.org/c12/index.php?page=shop.product_details&flypage=shop.flypage&product_id=78&category_id=10&option=com_phpshop&Itemid=1
Impacto de las industrias culturales en Colombia (The Impact of Cultural Industries in Colombia). CAB 2003www.convenioandresbello.org/c12/index.php?page=shop.product_details&flypage=shop.flypage&product_id=80&category_id=10&option=com_phpshop&Itemid=1
Impacto del sector fonográfico en la economía colombiana - situación actual Ministerio de Cultura & CAB 2003y perspectivas (The Impact of the Phonographic Sector on the Colombian Economy - Current Situation and Perspectives).www.mincultura.gov.co/VBeContent/library/documents/DocNewsNo119DocumentNo287.pdf
Sistema Nacional de Cultura (National System of Culture). OEI 2002www.campus-oei.org/publicaciones/cultura_cuba.htm
Sistema Nacional de Cultura (National System of Culture).www.campus-oei.org/publicaciones/cultura_dominicana.htm OEI 2004
Sistema Nacional de Cultura (National System of Culture). OEI 2005www.campus-oei.org/publicaciones/cultura_honduras.htm
Music and the Jamaican Economy. Witter, M. www.wipo.int/export/sites/ UNCTAD & WIPO 2004www/about-ip/en/studies/pdf/study_m_witter.pdf
National Strategy & Action Plan to Further Develop the Jamaican Music Industry. Brown, H. UNESCO & Ministry of Education, 2004http://portal.unesco.org/culture/en/file_download.php/062bbc43a 1296e4fae9 Youth and Culturef7ab99ac345bdMusic+Strategy+Final+Draft+December+2004.doc
Sistema de Información Cultural – portal (Cultural Information System – portal). CONACULTAhttp://sic.conaculta.gob.mx
Sistema Nacional de Cultura (National System of Culture). Organización de Estados 2002www.campus-oei.org/publicaciones/cultura_mexico.htm Iberoamericanos para la Educación,
la Ciencia y la Cultura (OEI)
¿Cuánto Vale la Cultura? Contribución económica de las industrias protegidas CONACULTA, CANIEM, 2004por el derecho de autor en México. (What’s the Value of Culture? Economic SOGEM & SACMContribution of the Copyright-protected Industries in Mexico). Piedras, E.www.buenosaires.gov.ar/areas/produccion/industrias/observatorio/documentos/cuanto_vale_la_cultura_piedras.doc
Encuesta Nacional de Prácticas y Consumos Culturales CONACULTA 2004(National Survey of Cultural Practices and Consumption).http://sic.conaculta.gob.mx/encuesta/encuesta.zip
Encuesta Nacional de Lectura (National Reading Survey). CONACULTA 2006http://sic.conaculta.gob.mx/encuesta/BD_ENL.zip
Diagnóstico de Infraestructura Cultural (Diagnostic of Cultural Infrastructure). CONACULTA 2007http://sic.conaculta.gob.mx/publicaciones_sic/dic_2007.pdf
Sistema Nacional de Cultura (National System of Culture) OEI 2002www.campus-oei.org/publicaciones/cultura_peru.htm
El Impacto Económico de la Cultura en Perú (The Economic Impact of Culture in Peru). CAB 2004www.convenioandresbello.org/c12/index.php?page=shop.product_details &flypage=shop.flypage&product_id=163&category_id=10&option=com_phpshop&Itemid=1
The Entertainment Sector of Trinidad and Tobago – Implementing TIDCO 1996an Export Strategy. Henry, R. and Nurse, K.
The Music Industry in Trinidad and Tobago. Daniell, A. et al.www.wipo.int/export/sites/www/about-ip/en/studies/pdf/study_r_henry.pdf UNCTAD & WIPO 2001
Institution Year

224 C R E AT I V E E C O N O M Y R E P O R T 2 0 0 8
Refe
rences
Key surveys and assessments: Cultural and creative industries in Latin America and the Caribbean
Country
Uruguay
Venezuela(BolivarianRepublic of)
Publication
Industrias del copyright en Uruguay (Copyright Industries in Uruguay). Unpublished 2001Stolovich, L., Lescano, G., Pessano, R.
La Industria Cinematográfica en Uruguay (The Cinematographic Ediciones IDEAS (Montevideo) 2004Industry in Uruguay). Stolovich, Luis et al.
El consumo cultural del Venezolano (The Cultural Consumption Fundación Centro Gumilla 1998of Venezuelans). Bisbal, M. et al. y Consejo Nacional de la Cultura
La Dinámica de la Cultura en Venezuela y su Contribución al PIB CAB 2005(The Dynamics of Culture in Venezuela and Its Contribution to the GDP).www.convenioandresbello.org/c12/index.php?page=shop.product_details&flypage=shop.flypage&product_id=162&category_id=10&option=com_phpshop&Itemid=1
La Industria Cinematográfica en Uruguay Ediciones IDEAS (Montevideo) 2004(The cinematographic Industry in Uruguay). Stolovich, Luis et al.
Institution Year

Statistical Annex

General explanatory notes
This explanatory note summarizes the content of each part of this annex. The tables on trade statistics for creative goods are based on official statistics reported by national sources to the United Nations COMTRADE and further elaborated and processed by the UNCTAD secretariat.Additional, more detailed data at the country and sectoral levels are available and can be consulted through the UNCTAD Global Databank onCreative Economy & Industries, which can be accessed on the statistics portal of the UNCTAD website at http://www.unctad.org/statistics orwww.unctadxii.org/creative. In certain instances, the electronic version might contain different figures from those in this printed volume as they arepublished later and may reflect more recent data.
Efforts were made to present a universal coverage by providing trade data for all 192 Member States of the United Nations. However, some countries are missing in the tables for one of two reasons: (a) the country has not reported its trade statistics throughout the period from 1996 to2005, or (b) the country reports its figures using a different statistical code system. For example, this Report uses the 1996 edition of theHarmonized Commodity Description and Coding System, or, simply, the Harmonized System (HS 1996) while Egypt adopts HS 2006 codes; therefore, the statistics for Egypt, regrettably, are not listed in the tables.
For many developing countries, data are not available throughout the years of the full time-series 1996-2005. Therefore, the total number of report-ing countries in each year is not necessarily the same. Thus, the value of “world” in any table presents only the sums of the total number of report-ing countries in a specific year, and these figures should be treated with extreme caution when using them as an analytical tool.
The unavailability of statistics is further accentuated by the category of creative services, and this is the case even in developed countries such asthe United Kingdom and the United States. The value of total exports and imports in each table on creative services is inevitably underestimated.
Part 1. Creative goods
As noted earlier, the compilation of trade data presented in this annex is based on the 1996 version of the Harmonized System (HS 1996).A summary ofselected HS 1996 codes for creative goods in each subgroup is listed below. The decision was taken to use HS 1996 instead of HS 2006 becausethe majority of countries still report their figures under the HS 1996 version.
In the absence of a precise taxonomy, 236 codes were selected from the list of HS 1996 based on the classification methodology for atrade model for creative industries as presented in chapter 4 of this Report, taking as a starting point the UNESCO Framework for CulturalStatistics. The classification was jointly agreed upon by experts and statisticians from the secretariats of ITC and UNCTAD as “creative goods”.
Given the complexity of making clear distinctions and defining the borderline between a creative good that is exclusive and mass production,between handmade and machine-made, between decorative and functional, etc., this first exercise of compiling statistics for creative goodsincludes all the creative goods with the above characteristics since they fall under the criteria of the UNCTAD classification of “the cycle of creation,production and distribution of a tangible product with creative content, economic and cultural value and a market objective”.
The number of codes included in each subgroup is as follows: design, 139 codes; arts and crafts, 48 codes; visual arts, 19 codes; publishing, 18codes; music, 7 codes; new media, 3 codes; and audiovisuals, 2 codes, summarized as follows:
Design. This is the biggest subgroup, with 139 codes. The number of codes in each subsector is as follows: fashion, 49; interior, 50; toys, 17;jewellery,12; and graphic, 11.
■ fashion – handbags, belts, accessories (ties, shawls, scarves, gloves, hats, hairpins, etc), sunglasses, headgear, leather goods,perfumes, etc. Clothing and shoes are not included.
■ interior – furniture (living room, bedroom, kitchen, bathroom), tableware, table linen, wallpaper, glassware, porcelain, lighting sets, etc.■ toys – dolls, wheeled toys, electric trains, puzzles, games, etc.■ graphic and architecture – original drawings, architectural plans, etc.■ jewellery – articles of jewellery made from gold, silver, pearls and other precious metals as well as imitation jewellery.
Arts and crafts. This is the second largest subgroup, covering a total of 48 codes. The number of codes in each subsector is as follows:carpets, 16; yarn, 11; wickerware, 5; celebration, 2; paperware, 1; others, 13.
■ carpet – includes carpets of wool or other fine animal hair, cotton, coconut fibers and other plant fiber, knotted or woven.■ yarn – handmade lace, hand-woven and needlework rugs, embroidery, bed linen, manmade or printed, knitted or crocheted materials, etc.■ wickerware – plaits, mats, basketwork, wickerwork, etc.■ celebration – articles for Christmas, festivities, carnivals, etc.■ paperware – handmade paper.■ others – candles, tanned or dressed fur skins, artificial flowers, wood marquetry, etc.
226
Sta
tist
ical
annex
—G
enera
lexp
lanato
rynote
s
C R E AT I V E E C O N O M Y R E P O R T 2 0 0 8

General explanatory notes (continued)
Visual arts. This subgroup covers 19 codes. The number of codes in each subsector is as follows: photography, 4; painting, 1; sculpture, 9;antiques, 1; and other, 4.
■ photography – photographic plates for offset reproduction; photographic film and microfilms, exposed and developed.■ painting – paintings, pastels executed by hand, wooden frames for paintings.■ sculpture – statuettes and other ornamental articles of wood, porcelain, ceramics, ivory or other metals, worked carving materials.■ antiques – antiques more than one hundred years of age.■ other – collages and similar decorative plaques; original engravings, paintings and lithographs, and sculptures and statuary, in any material.
Publishing. There are 18 codes in this subgroup. The number of codes in each subsector is as follows: newspapers, 3; books, 3; other, 12.
■ newspapers – newspapers, journals and periodicals.■ books – books, dictionaries, encyclopedias, brochures, leaflets, children’s drawing and coloring books and other printed matter.■ others – maps, brochures, postcards, calendars, advertising materials, etc.
Music. Music has 7 codes. It covers 6 types of recorded laser discs and recorded magnetic tapes as well as printed or manuscript music.
New media. This subgroup has 3 codes: 1 code for recorded media for sound and image, and 2 codes for video games.
Audiovisuals. This subgroup has 2 codes; only 2 types of exposed cinematographic film are included in this subgroup.
Part 2. Creative services and royalties
Data on trade in services by category of service rendered are becoming more available for developing countries as well. Generally aligned with thedefinitions of the IMF Balance of Payments Manual, figures for trade in services, comparable across the world, are found mainly in the IMF Balanceof Payments (BOP) Statistics database and, more recently, in the United Nations Statistics Division Services Trade database. EUROSTAT and OECDalso collect data for their member countries, as do other regional organizations.
However, the available data disaggregated by category of services do not provide the detail necessary for drawing conclusions about the impact ofcreative-services activities on economies.
The 11 principal BOP categories of services cover many aspects of creative industries that cannot be separately extracted. The Extended Balance-of-Payments Services Classification (EBOPS) – presented in the Manual on Statistics of International Trade in Services (MSITS, 2002) – still doesnot offer categories detailed enough to enable the designation of the creative-industry services rendered.
Nevertheless, what is offered in the MSITS and further elaborated in this study are the elements of Central Product Classification (CPC) that canbe related to EBOPS categories and that directly cover creative industries. The data on such a detailed level are rarely internationally report-ed and assembled on a comparable basis (CPC 5-digit-level items are usually necessary).
What countries report at the moment that was identified as covering creative industries but not exclusively is the following categories of services:
■ advertising, market research and public opinion services (EBOPS 278, level 3);■ architectural, engineering and other technical services (EBOPS 280, level 3);■ research and development services (EBOPS 279, level 3);■ personal, cultural and recreational services (EBOPS 287, level 1);■ audiovisual and related services (EBOPS 288, level 2); and■ other personal, cultural and recreational services (EBOPS 897, level 3).
The definitions of each category of services are from the fifth edition of the IMF Balance of Payments Manual (available at http://www.imf.org/external/np/sta/bop/BOPman.pdf) and are listed below:
■ Advertising and market research and public opinion polling services (Advertising): “Advertising and market research services transacted betweenresidents and non-residents cover the design, creation, and marketing of advertisements by advertising agencies; media placement, includingthe purchase and sale of advertising space; exhibition services provided by trade fairs; the promotion of products abroad; market research; andpublic opinion polling abroad on various issues.” (p. 68)
■ Architectural, engineering and other technical services (Architectural): Architectural, engineering and other technical services cover resident andnonresident transactions related to architectural design of urban and other development projects; planning and project design and supervision ofdams, bridges, airports, turnkey projects, etc.; surveying, cartography, product testing and certification, and technical inspection services.” (ibid.)
■ Research and development services (R&D): Research and development services cover those services that are transacted between residents and
227
Sta
tistical
annex
—G
enera
lexp
lanato
rynote
s
C R E AT I V E E C O N O M Y R E P O R T 2 0 0 8

228
Sta
tist
ical
annex
—G
enera
lexp
lanato
rynote
s
C R E AT I V E E C O N O M Y R E P O R T 2 0 0 8
General explanatory notes (continued)
non-residents and associated with basic research, applied research, and experimental development of new products and processes. In princi-ple, such activities in the sciences, social sciences and humanities are covered; included is the development of operating systems that representtechnological advances.” (ibid.)
■ Personal, cultural, and recreational services (Personal recreation): “Personal, cultural, and recreational services involving transactions betweenresidents and non-residents are subdivided into two categories:” (ibid.)
(a) Audiovisual and related services (Audiovisual). “The first category comprises services and associated fees related to the production of motionpictures (on film or video tape), radio and television programs (live or on tape), and musical recordings. Included are receipts or payments forrentals; fees received by resident actors, directors, producers, etc. (or by nonresidents in the compiling economy) for productions abroad; andfees for distribution rights sold to the media for a limited number of showings in specified areas. Fees to actors, producers, etc. involved withtheatrical and musical productions, sporting events, circuses, etc. and fees for distribution rights (for television, radio, etc.) for these activitiesare included.” (pp. 68-69)
(b) other personal, cultural and recreational services (Other cultural services). “The second category comprises other personal, cultural, andrecreational services such as those associated with museums, libraries, archives, and other cultural, sporting, and recreational activities. Alsoincluded are fees for services, including provision of correspondence courses, rendered abroad by teachers or doctors.” (p. 69)
Obviously, it is not possible to arrive at conclusive comparative results on the real performance of services outputs of creative industries in inter-national trade based on incomplete figures. This is especially the case in that national statistics, when available, do not always follow precisely theinternationally accepted definitions and guidelines owing to particular priorities and data collection systems of different States.
The statistics for categories of services cover much more activity than what would belong to the creative economy alone, with the exception ofaudiovisual and related services, which can be attributed largely to creative industries. In addition, the subcategory “Other personal, cultural andrecreational services” could also be assumed to incorporate trade closely related to creativity, bearing in mind, however, that this subcategory stillincludes international services trade relating to sporting events (health and education are not covered).
All the figures used to calculate growth rates by category of services are to be viewed with caution since they refer, of course, to the limited number of countries that consistently reported on them (only to countries reporting a particular service regularly between 2000 and2005). The numbers in parentheses after percentages represent the number of countries used in the calculation.
Royalties and licence fees■ Average annual growth rate, 2000-2005, for exports of the reporting countries = 14.2% (67)■ Average annual growth rate, 2000-2005, for imports of the reporting countries = 11.1% (93)
Advertising, market research and public opinion polling services■ Average annual growth rate, 2000-2005, for exports of the reporting countries = 22.3% (33)■ Average annual growth rate, 2000-2005, for imports of the reporting countries = 13.7% (39)
Research and development services■ Average annual growth rate, 2000-2005, for exports of the reporting countries = 18.7% (22)■ Average annual growth rate, 2000-2005, for imports of the reporting countries = 14.5% (22)
Architectural, engineering and other technical services■ Average annual growth rate, 2000-2005, for exports of the reporting countries = 19.2% (27)■ Average annual growth rate, 2000-2005, for imports of the reporting countries = 15.1% (30)
Personal, cultural and recreational services■ Average annual growth rate, 2000-2005, for exports of the reporting countries = 14.7% (63)■ Average annual growth rate, 2000-2005, for imports of the reporting countries = 12.1% (68)
Audiovisual and related services■ Average annual growth rate, 2000-2005, for exports of the reporting countries = 15.9% (33)■ Average annual growth rate, 2000-2005, for imports of the reporting countries = 13.6% (41)
Other personal, cultural and recreational services■ Not enough data available.
TOTAL SERVICES■ World annual average growth rate between 2000 and 2005 for exports: 11.2%■ World annual average growth rate between 2000 and 2005 for imports: 10.5%
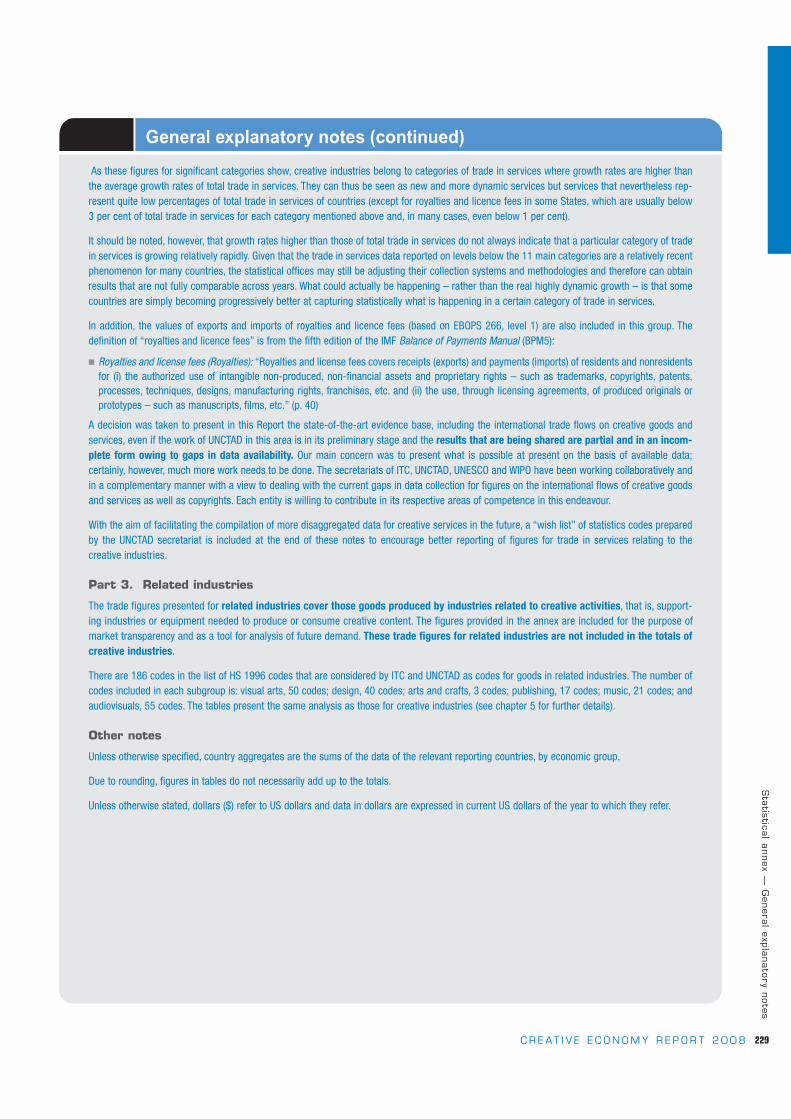
229
Sta
tistical
annex
—G
enera
lexp
lanato
rynote
s
C R E AT I V E E C O N O M Y R E P O R T 2 0 0 8
General explanatory notes (continued)
As these figures for significant categories show, creative industries belong to categories of trade in services where growth rates are higher thanthe average growth rates of total trade in services. They can thus be seen as new and more dynamic services but services that nevertheless rep-resent quite low percentages of total trade in services of countries (except for royalties and licence fees in some States, which are usually below3 per cent of total trade in services for each category mentioned above and, in many cases, even below 1 per cent).
It should be noted, however, that growth rates higher than those of total trade in services do not always indicate that a particular category of tradein services is growing relatively rapidly. Given that the trade in services data reported on levels below the 11 main categories are a relatively recentphenomenon for many countries, the statistical offices may still be adjusting their collection systems and methodologies and therefore can obtainresults that are not fully comparable across years. What could actually be happening – rather than the real highly dynamic growth – is that somecountries are simply becoming progressively better at capturing statistically what is happening in a certain category of trade in services.
In addition, the values of exports and imports of royalties and licence fees (based on EBOPS 266, level 1) are also included in this group. The definition of “royalties and licence fees” is from the fifth edition of the IMF Balance of Payments Manual (BPM5):
■ Royalties and license fees (Royalties): “Royalties and license fees covers receipts (exports) and payments (imports) of residents and nonresidentsfor (i) the authorized use of intangible non-produced, non-financial assets and proprietary rights – such as trademarks, copyrights, patents,processes, techniques, designs, manufacturing rights, franchises, etc. and (ii) the use, through licensing agreements, of produced originals orprototypes – such as manuscripts, films, etc.” (p. 40)
A decision was taken to present in this Report the state-of-the-art evidence base, including the international trade flows on creative goods andservices, even if the work of UNCTAD in this area is in its preliminary stage and the results that are being shared are partial and in an incom-plete form owing to gaps in data availability. Our main concern was to present what is possible at present on the basis of available data; certainly, however, much more work needs to be done. The secretariats of ITC, UNCTAD, UNESCO and WIPO have been working collaboratively andin a complementary manner with a view to dealing with the current gaps in data collection for figures on the international flows of creative goodsand services as well as copyrights. Each entity is willing to contribute in its respective areas of competence in this endeavour.
With the aim of facilitating the compilation of more disaggregated data for creative services in the future, a “wish list” of statistics codes preparedby the UNCTAD secretariat is included at the end of these notes to encourage better reporting of figures for trade in services relating to the creative industries.
Part 3. Related industries
The trade figures presented for related industries cover those goods produced by industries related to creative activities, that is, support-ing industries or equipment needed to produce or consume creative content. The figures provided in the annex are included for the purpose ofmarket transparency and as a tool for analysis of future demand. These trade figures for related industries are not included in the totals ofcreative industries.
There are 186 codes in the list of HS 1996 codes that are considered by ITC and UNCTAD as codes for goods in related industries. The number ofcodes included in each subgroup is: visual arts, 50 codes; design, 40 codes; arts and crafts, 3 codes; publishing, 17 codes; music, 21 codes; andaudiovisuals, 55 codes. The tables present the same analysis as those for creative industries (see chapter 5 for further details).
Other notes
Unless otherwise specified, country aggregates are the sums of the data of the relevant reporting countries, by economic group.
Due to rounding, figures in tables do not necessarily add up to the totals.
Unless otherwise stated, dollars ($) refer to US dollars and data in dollars are expressed in current US dollars of the year to which they refer.
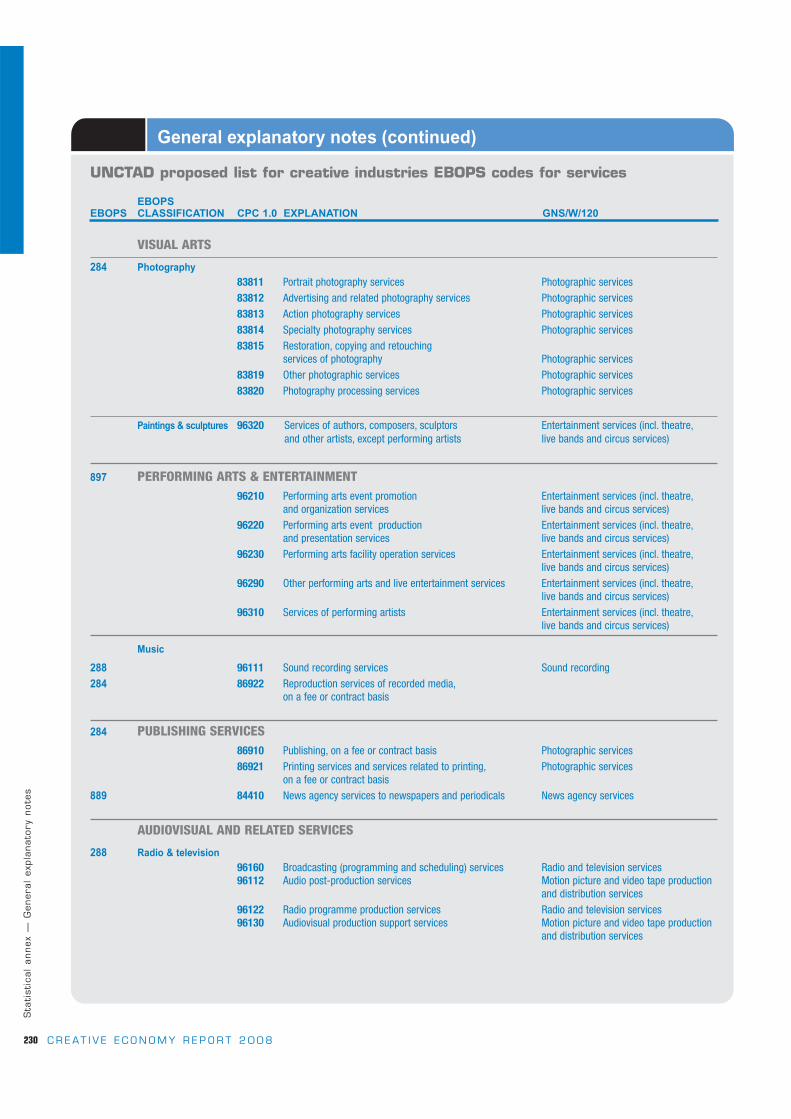
230
Sta
tist
ical
annex
—G
enera
lexp
lanato
rynote
s
C R E AT I V E E C O N O M Y R E P O R T 2 0 0 8
General explanatory notes (continued)
UNCTAD proposed list for creative industries EBOPS codes for services
EBOPS EBOPS CLASSIFICATION CPC 1.0 EXPLANATION GNS/W/120
VISUAL ARTS
284 Photography83811 Portrait photography services Photographic services
83812 Advertising and related photography services Photographic services
83813 Action photography services Photographic services
83814 Specialty photography services Photographic services
83815 Restoration, copying and retouching services of photography Photographic services
83819 Other photographic services Photographic services
83820 Photography processing services Photographic services
Paintings & sculptures 96320 Services of authors, composers, sculptors Entertainment services (incl. theatre,and other artists, except performing artists live bands and circus services)
897 PERFORMING ARTS & ENTERTAINMENT 96210 Performing arts event promotion Entertainment services (incl. theatre,
and organization services live bands and circus services)
96220 Performing arts event production Entertainment services (incl. theatre,and presentation services live bands and circus services)
96230 Performing arts facility operation services Entertainment services (incl. theatre,live bands and circus services)
96290 Other performing arts and live entertainment services Entertainment services (incl. theatre,live bands and circus services)
96310 Services of performing artists Entertainment services (incl. theatre,live bands and circus services)
Music
288 96111 Sound recording services Sound recording
284 86922 Reproduction services of recorded media,on a fee or contract basis
284 PUBLISHING SERVICES86910 Publishing, on a fee or contract basis Photographic services
86921 Printing services and services related to printing, Photographic services on a fee or contract basis
889 84410 News agency services to newspapers and periodicals News agency services
AUDIOVISUAL AND RELATED SERVICES
288 Radio & television 96160 Broadcasting (programming and scheduling) services Radio and television services96112 Audio post-production services Motion picture and video tape production
and distribution services
96122 Radio programme production services Radio and television services96130 Audiovisual production support services Motion picture and video tape production
and distribution services

231
Sta
tistical
annex
—G
enera
lexp
lanato
rynote
s
C R E AT I V E E C O N O M Y R E P O R T 2 0 0 8
General explanatory notes (continued)
EBOPS EBOPS CLASSIFICATION CPC 1.0 EXPLANATION GNS/W/120
889 84420 News agency services to audiovisual media News agency services
288 Film
96121 Motion picture, video tape and television programme Motion picture and video tape productionproduction services and distribution services
96141 Motion picture, television programme distribution services Motion picture and video tape production and distribution services
96142 Film and video post-production services Motion picture and video tape production and distribution services
96149 Other services related to the production of motion pictures, Motion picture and video tape productionvideo tapes and television and radio programmes and distribution services
96151 Motion picture projection services Motion picture projection services
96152 Video tape projection services Motion picture projection services
DESIGN
284 Interior83410 Interior design services Other
83490 Other specialty design services Photographic services
CREATIVE SERVICES
278 Advertising services 83610 Planning, creating, placement services of advertising Advertising services
83620 Purchase or sale of advertising space or time,on commission Advertising services
83690 Other advertising services Advertising services
85970 Trade fair and exhibition organization services Convention services
280 Architectural services83211 Architectural advisory and pre-design services Architectural services
83212 Architectural design and contract administration services Architectural services
83219 Other architectural services Architectural services
897 Cultural & recreational services96310 Services of performing artists
84510 Library services Libraries, archives, museums and other cultural services
84520 Archive services Libraries, archives, museums and other cultural services
96411 Museum services except for historical sites and buildings Libraries, archives, museums and other cultural services
96412 Preservation services of historical sites and buildings Libraries, archives, museums and other cultural services
96421 Botanical and zoological garden services Libraries, archives, museums and other cultural services
96422 Nature reserve services, including wildlife Libraries, archives, museumspreservation services and other cultural services
96910 Amusement park and similar attraction services Entertainment services (incl. theatre,live bands and circus services)
266 ROYALTIES AND LICENSE FEES51230 Copyrights N/A

232
Sta
tist
ical
annex
—D
istr
ibuti
on
of
deve
lopin
geconom
ies
by
geogra
phic
al
regio
nand
econom
icgro
upin
g
C R E AT I V E E C O N O M Y R E P O R T 2 0 0 8
Distribution of developing economies by geographical regionand economic grouping
1. G E O G R A P H I C A L R E G I O N
Africa
Eastern Africa
British Indian Ocean Territory Madagascar SomaliaBurundi Malawi UgandaComoros Mauritius United Republic Djibouti Mayotte of TanzaniaEritrea Mozambique ZambiaEthiopia Rwanda ZimbabweKenya Seychelles
Middle Africa
Angola Chad Equatorial GuineaCameroon Congo GabonCentral African Republic Democratic Republic of the Congo Sao Tome and Principe
Northern Africa
Algeria Morocco Western SaharaEgypt Sudan Libyan Arab Jamahiriya Tunisia
Southern Africa
Botswana Namibia SwazilandLesotho South Africa
Western Africa
Benin Guinea NigeriaBurkina Faso Guinea-Bissau Saint HelenaCape Verde Liberia SenegalCôte d’Ivoire Mali Sierra LeoneGambia Mauritania TogoGhana Niger
America
Caribbean Islands
Greater Caribbean Small Caribbean islandsCuba Anguilla MontserratDominican Republic Antigua and Barbuda Netherlands AntillesHaiti Aruba Saint Kitts and NevisJamaica Bahamas Saint Lucia
Barbados Saint Vincent and the GrenadinesBritish Virgin Islands Trinidad and TobagoCayman Islands Turks and Caicos IslandsDominica United States Virgin IslandsGrenada
Central America
Belize Guatemala NicaraguaCosta Rica Honduras PanamaEl Salvador Mexico

233
Sta
tistical
annex
—D
istributio
nof
deve
lopin
geconom
ies
by
geogra
phic
al
regio
nand
econom
icgro
upin
g
C R E AT I V E E C O N O M Y R E P O R T 2 0 0 8
Distribution of developing economies by geographical regionand economic grouping (continued)
South America
Argentina Ecuador SurinameBolivia Falkland Islands (Malvinas) UruguayBrazil Guyana Venezuela Chile Paraguay (Bolivarian Republic of)Colombia Peru
Asia
Eastern Asia
Asia, not elsewhere specified China, Macao Special Administrative Region Republic of KoreaChina Democratic People’s Republic of Korea Taiwan Province of ChinaChina, Hong Kong Special Mongolia
Administrative Region
Southern Asia
Afghanistan India NepalBangladesh Iran (Islamic Republic of) PakistanBhutan Maldives Sri Lanka
Southeastern Asia
Brunei Darussalam Malaysia ThailandCambodia Myanmar Timor-LesteIndonesia Philippines Viet NamLao People’s Democratic Republic Singapore
Western Asia
Bahrain Occupied Palestinian Territory TurkeyIraq Oman United Arab EmiratesJordan Qatar YemenKuwait Saudi ArabiaLebanon Syrian Arab Republic
Oceania
American Samoa Micronesia (Federated States of) SamoaChristmas Islands Midway Islands Solomon IslandsCocos (Keeling) Islands Nauru TokelauCook Islands New Caledonia TongaFiji Niue TuvaluFrench Polynesia Norfolk Island VanuatuGuam Northern Mariana Islands Wake IslandJohnston Island Palau Wallis and Futuna IslandsKiribati Papua New GuineaMarshall Islands Pitcairn

234
Sta
tist
ical
annex
—D
istr
ibuti
on
of
deve
lopin
geconom
ies
by
geogra
phic
al
regio
nand
econom
icgro
upin
g
Distribution of developing economies by geographical regionand economic grouping (continued)
2. E C O N O M I C G R O U P I N G
Least developed countries (LDCs) (50)
Africa and Haiti
Angola 1994 Gambia 1975 Niger 1971Benin 1971 Guinea 1971 Rwanda 1971Burkina Faso 1971 Guinea-Bissau 1981 Senegal 2001Burundi 1971 Haiti 1971 Sierra Leone 1982Central African Republic 1975 Lesotho 1971 Somalia 1971Chad 1971 Liberia 1990 Sudan 1971Democratic Republic of the Congo 1991 Madagascar 1991 Togo 1982Djibouti 1982 Malawi 1971 Uganda 1971Equatorial Guinea 1982 Mali 1971 United Republic of Tanzania 1971Eritrea 1994 Mauritania 1986 Zambia 1991Ethiopia 1971 Mozambique 1988
Asia Islands
Afghanistan 1971 Cape Verde 1977 Tuvalu 1986Bangladesh 1975 Comoros 1977 Vanuatu 1985Bhutan 1971 Kiribati 1986Cambodia 1991 Maldives 1971Lao People’s Democratic Republic 1971 Samoa 1971Myanmar 1987 Sao Tome and Principe 1982Nepal 1971 Solomon Islands 1991Yemen 1971 Timor-Leste 2003
Small island developing States (SIDS) (29)
Antigua and Barbuda Maldives SamoaBahamas Marshall Islands Sao Tome and PrincipeBarbados Mauritius SeychellesCape Verde Micronesia (Federated States of) Solomon IslandsComoros Nauru Timor-LesteDominica Palau TongaFiji Papua New Guinea Trinidad and TobagoGrenada Saint Kitts and Nevis TuvaluJamaica Saint Lucia VanuatuKiribati Saint Vincent and the Grenadines
Year ofinclusion in
the group
Year ofinclusion in
the group
Year ofinclusion in
the group

235
Sta
tistical
annex
—D
istributio
nof
deve
loped
econom
ies
and
econom
ies
intra
nsitio
nby
geogra
phic
al
regio
n
C R E AT I V E E C O N O M Y R E P O R T 2 0 0 8
Distribution of developed economies and economies in transition by geographical region
1. DEVELOPED ECONOMIES
America
Bermuda Greenland United States of America,Canada Saint Pierre and Miquelon including Puerto Rico
Asia
Israel Japan
Europe
Andorra Gibraltar PolandAustria Greece PortugalBelgium Holy See RomaniaBulgaria Hungary San MarinoCyprus Iceland SlovakiaCzech Republic Ireland SloveniaDenmark Italy SpainEstonia Latvia SwedenFaeroe Islands Lithuania Switzerland, including LiechtensteinFinland, including Åland Islands Luxembourg United Kingdom of Great BritainFrance, including French Guyana, Malta and Northern Ireland, including Channel
Guadeloupe, Martinique, Netherlands Islands and Isle of ManMonaco and Réunion Norway, including Svalbard
Germany and Jan Mayen
Oceania
Australia New Zealand
2. ECONOMIES IN TRANSITION
Asia
Armenia Kazakhstan TurkmenistanAzerbaijan Kyrgyzstan UzbekistanGeorgia Tajikistan
Europe
Albania Croatia Serbia and MontenegroBelarus Macedonia (the former Yugoslav Republic of) UkraineBosnia and Herzegovina Moldova
Russian Federation

236
Sta
tist
ical
annex
—S
tati
stic
al
annex
—D
istr
ibuti
on
of
econom
ies
by
trade
gro
up
C R E AT I V E E C O N O M Y R E P O R T 2 0 0 8
Distribution of economies by trade group
1. A M E R I C A
Year of Year of Year ofaccession accession accession
Free Trade Area of the Americas (FTAA) (34)
2. A S I A
Association of Southeast Asian Nations (ASEAN) (10)
Year of Year of Year ofaccession accession accession
Antigua and Barbuda 1994Argentina 1994Bahamas 1994Barbados 1994Belize 1994Bolivia 1994Brazil 1994Canada 1994Chile 1994Colombia 1994Costa Rica 1994Dominica 1994
Dominican Republic 1994Ecuador 1994El Salvador 1994Grenada 1994Guatemala 1994Guyana 1994Haiti 1994Honduras 1994Jamaica 1994Mexico 1994Nicaragua 1994Panama 1994
Paraguay 1994Peru 1994Saint Kitts and Nevis 1994Saint Lucia 1994Saint Vincent and
the Grenadines 1994Suriname 1994Trinidad and Tobago 1994United States of America 1994Uruguay 1994Venezuela
(Bolivarian Republic of) 1994
Brunei Darussalam 1984Cambodia 1999Indonesia 1967
Lao People’s Democratic Republic 1997
Malaysia 1967Myanmar 1997
Philippines 1967Singapore 1967Thailand 1967Viet Nam 1995
Argentina 1994Brazil 1994
Paraguay 1994Uruguay 1994
Mercado Común del Sur (MERCOSUR) (4)
Canada 1992Mexico 1992
United States of America 1992
North American Free Trade Agreement ( NAFTA) (3)

237
Sta
tistical
annex
—S
tatistic
al
annex
—D
istributio
nof
econom
ies
by
trade
gro
up
C R E AT I V E E C O N O M Y R E P O R T 2 0 0 8
Distribution of economies by trade group (continued)
3. E U R O P E
European Union (EU) (27)
Year of Year of Year ofaccession accession accession
4. I N T E R R E G I O N A L G R O U P
African, Caribbean and Pacific Group of States (ACP Group) (79)
Austria 1995Belgium 1957Bulgaria 2007Cyprus 2004Czech Republic 2004Denmark 1973Estonia 2004Finland 1995France 1957
Germany 1957Greece 1981Hungary 2004Ireland 1973Italy 1957Latvia 2004Lithuania 2004Luxembourg 1957Malta 2004
Netherlands 1957Poland 2004Portugal 1986Romania 2007Slovakia 2004Slovenia 2004Spain 1986Sweden 1995United Kingdom 1973
AngolaAntigua and BarbudaBahamasBarbadosBelizeBeninBotswanaBurkina FasoBurundiCameroonCape VerdeCentral African RepublicChadComorosCongoCook IslandsCôte d’IvoireCubaDemocratic Republic
of the CongoDjibouti
DominicaDominican RepublicEquatorial GuineaEritreaEthiopiaFijiGabonGambiaGhanaGrenadaGuineaGuinea-BissauGuyanaHaitiJamaicaKenyaKiribatiLesothoLiberiaMadagascarMalawi
MaliMarshall IslandsMauritaniaMauritiusMicronesia
(Federated States of)MozambiqueNamibiaNauruNigerNigeriaNiuePalauPapua New Guinea RwandaSaint Kitts and NevisSaint LuciaSaint Vincent and
the GrenadinesSamoaSao Tome and PrincipeSenegal
SeychellesSierra LeoneSolomon IslandsSomaliaSouth AfricaSudanSurinameSwazilandTimor-LesteTogoTongaTrinidad and TobagoTuvaluUgandaUnited Republic
of TanzaniaVanuatuZambiaZimbabwe

TA B L E
1.1 CREATIVE GOODS: EXPORTS AND IMPORTS, BY ECONOMIC GROUP, REGION AND COUNTRY/TERRITORY, 1996-2005
1996 1997 1998 1999 2000 2001 2002 2003 2004 2005
WORLD 189,214 201,761 206,999 213,271 228,695 227,634 239,487 268,061 305,408 335,494Developed economies (1) 133,195 131,037 135,192 136,220 137,378 140,650 146,020 162,070 182,534 196,109Developing economies 55,997 69,606 70,404 75,730 89,827 85,224 91,817 104,028 119,910 136,231Economies in transition (2) 21 1,118 1,402 1,320 1,490 1,760 1,650 1,963 2,964 3,154Developed economies: America 26,842 27,364 28,013 28,091 31,116 31,269 28,700 29,691 32,886 36,921Canada 9,312 8,860 9,007 9,402 10,413 10,374 9,954 10,266 10,825 11,377Greenland 1 1 1 1 1 1 1 - - -United States of America 17,529 18,503 19,005 18,688 20,703 20,894 18,744 19,424 22,061 25,544Developed economies: Asia 4,312 4,782 5,017 6,910 5,451 4,601 4,693 4,149 4,697 6,296Israel 694 642 621 644 648 700 768 750 724 749Japan 3,618 4,139 4,396 6,266 4,803 3,902 3,925 3,399 3,973 5,547Developed economies: Europe 100,924 97,834 101,181 100,231 99,936 103,913 111,641 127,093 143,593 151,489European Union (EU-27) 96,115 93,190 96,671 95,878 95,378 99,445 106,059 121,418 136,922 145,056Austria 2,355 2,960 3,221 3,230 2,952 3,208 3,604 4,233 4,510 4,883Belgium - - - - - - 6,687 8,129 9,173 9,343Belgium-Luxembourg 6,135 6,209 6,221 6,718 6,573 6,726 - - - -Bulgaria 121 125 108 102 112 124 163 212 244 258Cyprus 40 33 32 30 31 30 34 36 40 32Czech Republic 1,161 - 1,488 1,471 1,390 1,546 1,741 2,187 2,515 2,759Denmark 2,341 - 2,499 2,381 2,464 2,423 2,634 3,057 3,412 3,449Estonia 101 117 144 139 157 204 219 260 250 263Finland 1,551 1,440 1,435 1,284 1,198 1,205 1,045 1,139 1,144 1,043France 12,368 11,913 12,113 12,193 12,221 12,376 13,069 15,080 16,718 17,706Germany 13,976 13,039 14,068 13,950 12,991 14,404 16,476 19,078 22,136 24,763Greece 576 647 586 512 517 558 487 678 704 754Hungary 393 418 489 497 500 832 1,198 639 796 842Ireland 1,464 1,130 840 1,234 1,720 2,316 2,065 2,386 2,138 2,275Italy 23,654 22,042 21,878 21,480 21,931 21,705 22,322 24,191 27,493 28,008Latvia - 66 82 86 89 123 131 138 177 191Lithuania - 109 105 101 126 142 191 273 371 464Luxembourg - - - - - - 175 224 231 209Malta 158 141 135 150 139 136 157 188 208 201Netherlands 5,235 5,881 4,754 5,068 4,811 5,071 4,174 5,784 6,763 7,250Poland 1,602 1,908 1,885 1,759 1,984 2,093 2,374 3,101 3,827 4,215Portugal 1,206 1,199 1,208 1,119 1,058 1,062 1,111 1,308 1,446 1,371Romania - 621 612 580 623 724 867 1,107 1,316 1,406Slovakia - 319 347 296 336 412 490 647 833 931Slovenia 412 389 385 363 355 408 456 557 732 847Spain 5,988 6,193 6,269 6,442 6,372 6,855 7,413 8,267 9,011 9,138Sweden 2,839 2,510 2,698 2,565 2,393 2,445 2,887 3,136 3,511 3,427United Kingdom ofGreat Britain andNorthern Ireland 12,439 13,780 13,069 12,126 12,333 12,316 13,891 15,385 17,225 19,030Other European economies 4,809 4,644 4,510 4,353 4,559 4,468 5,582 5,675 6,671 6,433Andorra 16 20 25 12 13 15 8 9 11 -Faeroe Islands 5 4 4 4 3 4 3 4 3 5Iceland - 19 11 9 11 10 13 11 10 9Norway 286 280 282 324 291 297 309 325 347 366Switzerland 4,501 4,321 4,188 4,004 4,241 4,142 5,248 5,326 6,300 6,053Developed economies: Oceania 1,117 1,057 981 988 875 867 986 1,136 1,358 1,403Australia 665 682 631 681 647 608 709 823 1,006 1,054New Zealand 452 375 350 307 227 258 277 313 352 348Developing economies: Africa 33 461 510 545 973 968 1,240 1,296 1,472 1,775Eastern Africa 13 114 123 139 205 140 321 241 351 238Burundi - - - - - - - 0 0 0Eritrea - - - - - - - 0 - -Ethiopia - - - - - 1 1 6 - -Kenya - 52 52 48 29 22 68 104 48 -Madagascar 7 7 6 13 46 47 21 10 52 45Malawi 3 - - 11 3 4 3 8 9 6Mauritius - 49 48 47 51 51 67 86 82 84Mayotte - - - - 0 1 1 0 0 0Mozambique - - - - 1 2 1 3 6 18Rwanda - - - - - 0 0 0 - -Seychelles - 0 0 0 - - - 0 0 0Uganda 3 2 2 3 2 3 4 2 9 9United Republic of Tanzania - 2 8 6 4 3 8 16 16 17Zambia - 2 7 10 9 3 6 7 17 57Zimbabwe - - - - 61 4 141 - 112 -
For sources and notes, see end of table.
Economic group,region and country/territory
238
Sta
tist
ical
Annex
Part
1
C R E AT I V E E C O N O M Y R E P O R T 2 0 0 8
EXPORTS (f.o.b., in millions of $)

190,492 208,274 214,516 224,881 242,685 243,301 257,134 285,011 321,648 350,884 WORLD 163,356 168,775 177,589 185,729 194,994 196,488 209,236 232,620 261,876 284,147 Developed economies (1)27,074 37,637 35,181 38,006 46,114 44,397 44,934 48,631 54,660 60,759 Developing economies
63 1,862 1,745 1,146 1,576 2,416 2,963 3,761 5,112 5,978 Economies in transition (2)54,435 60,749 66,803 72,945 81,244 80,922 85,573 89,447 97,999 107,115 Developed economies: America
6,191 7,092 7,534 7,850 8,272 8,265 8,837 9,836 10,754 12,094 Canada16 13 17 19 13 13 18 - - - Greenland
48,227 53,644 59,252 65,076 72,958 72,643 76,718 79,612 87,244 95,021 United States of America16,062 14,849 12,614 13,638 15,516 15,680 14,891 15,942 17,806 19,714 Developed economies: Asia
1,097 1,069 1,058 1,080 1,167 1,246 1,068 966 1,066 1,122 Israel14,965 13,780 11,556 12,558 14,350 14,433 13,823 14,976 16,740 18,592 Japan88,930 89,047 94,128 95,022 93,892 96,224 104,387 122,008 139,804 150,575 Developed economies: Europe80,230 80,382 85,437 86,600 85,079 87,437 94,286 110,807 127,223 137,957 European Union (EU-27)
4,253 3,698 3,576 3,818 3,433 3,451 3,640 4,457 5,216 5,592 Austria- - - - - - 5,513 6,672 7,626 8,077 Belgium
4,974 5,002 5,345 5,843 5,749 5,395 - - - - Belgium-Luxembourg99 84 111 125 135 165 189 264 330 402 Bulgaria
224 226 263 261 267 281 306 353 415 443 Cyprus943 639 1,078 1,110 1,019 1,126 1,385 1,754 2,291 2,523 Czech Republic
1,673 907 1,944 1,971 1,891 1,960 2,064 2,499 2,613 3,071 Denmark125 172 172 143 156 184 179 211 207 236 Estonia786 803 850 873 879 868 933 1,154 1,352 1,469 Finland
11,034 10,540 11,165 11,607 11,948 11,842 12,746 15,155 17,359 18,717 France19,436 18,109 18,769 18,109 16,322 17,100 17,573 20,028 21,719 24,418 Germany1,658 1,577 1,656 1,488 1,304 1,359 1,466 2,071 2,417 2,700 Greece
494 532 667 721 732 793 947 1,219 1,448 1,393 Hungary1,181 1,181 1,238 1,401 1,364 1,444 1,597 1,762 2,119 2,399 Ireland5,099 5,106 5,366 5,651 6,020 6,025 6,684 7,917 9,541 10,448 Italy
- 139 161 162 164 182 198 237 264 319 Latvia- 168 196 171 148 167 184 246 290 340 Lithuania- - - - - - 479 613 660 634 Luxembourg
139 127 125 127 126 123 118 154 176 184 Malta5,877 6,227 5,538 5,970 5,701 5,644 5,208 6,103 6,986 7,311 Netherlands1,216 1,357 1,508 1,445 1,423 1,418 1,520 1,621 1,955 2,179 Poland1,204 1,265 1,368 1,540 1,487 1,431 1,542 1,837 1,982 2,034 Portugal
- 366 397 341 383 492 633 817 968 1,187 Romania- 312 378 278 273 342 400 503 665 711 Slovakia
243 251 276 303 281 321 354 445 559 548 Slovenia3,613 3,791 4,150 4,575 4,420 4,752 5,118 6,600 7,922 8,903 Spain2,002 1,986 2,064 2,215 2,125 2,083 2,346 2,779 3,270 3,506 Sweden
United Kingdom of Great Britain and
13,958 15,816 17,078 16,353 17,329 18,492 20,964 23,337 26,875 28,212 Northern Ireland8,699 8,665 8,691 8,422 8,813 8,787 10,101 11,201 12,581 12,618 Other European economies
149 148 160 163 154 147 153 179 196 - Andorra15 14 16 17 17 18 21 25 28 30 Faeroe Islands
- 92 109 107 103 96 92 135 161 218 Iceland1,755 1,777 1,801 1,798 1,689 1,625 1,848 2,126 2,416 2,716 Norway6,781 6,634 6,606 6,337 6,850 6,901 7,987 8,737 9,780 9,655 Switzerland3,930 4,130 4,044 4,123 4,342 3,663 4,386 5,222 6,267 6,743 Developed economies: Oceania3,140 3,317 3,498 3,366 3,641 3,001 3,617 4,275 5,139 5,473 Australia
790 813 546 757 701 662 769 947 1,127 1,270 New Zealand211 1,260 1,351 1,493 2,085 2,336 2,704 3,185 3,749 4,288 Developing economies: Africa62 281 336 412 419 612 646 675 964 812 Eastern Africa
- - - - - - - 2 4 7 Burundi- - - - - - - 8 - - Eritrea- - - - - 44 50 63 - - Ethiopia- 64 78 77 64 88 81 94 229 - Kenya
19 20 22 19 28 32 17 54 40 51 Madagascar- - - 36 19 29 36 42 48 63 Malawi- 83 82 84 88 88 106 117 124 121 Mauritius- - - - 6 8 8 10 12 13 Mayotte- - - - 42 27 29 50 63 87 Mozambique- - - - - 35 9 10 - - Rwanda- 15 19 14 - 3 5 16 14 17 Seychelles
43 30 40 41 38 39 47 58 75 84 Uganda- 32 43 42 42 45 51 51 70 81 United Republic of Tanzania- 37 51 98 91 151 165 99 266 287 Zambia- - - - - 22 42 - 20 - Zimbabwe
For sources and notes, see end of table.
Economic group,region and
country/territory
TA B L E
1.1
239
Sta
tistical
Annex
Part
1
C R E AT I V E E C O N O M Y R E P O R T 2 0 0 8
1996 1997 1998 1999 2000 2001 2002 2003 2004 2005
IMPORTS (c.i.f., in millions of $)

TA B L E
1.1
1996 1997 1998 1999 2000 2001 2002 2003 2004 2005
Middle Africa - 3 3 3 7 10 13 15 17 15Cameroon - - - - 5 8 12 13 9 9Central African Republic - 0 0 0 0 0 0 0 - 0Gabon - 2 3 3 2 2 1 2 8 7Sao Tome and Principe - - - 0 0 0 0 - - -Northern Africa 17 3 6 13 153 183 391 392 397 457Algeria 17 3 6 12 9 9 19 26 6 -Morocco - - - - - - 197 171 175 210Sudan - - - 1 1 0 0 0 0 0Tunisia - - - - 143 173 174 195 216 247Southern Africa - 337 355 348 523 548 471 594 583 747Botswana - - - - 13 15 13 10 - -Namibia - - - - 116 165 47 169 138 239South Africa - 337 355 348 355 340 380 415 446 508Swaziland - - - - 38 27 32 - - -Western Africa 3 4 23 43 85 87 43 54 124 319Benin - - 1 2 1 1 2 1 3 1Burkina Faso - - - - - 2 3 2 2 -Cape Verde - 0 0 0 0 0 0 - 0 0Côte d’Ivoire - - - - - 44 - - 76 72Gambia 0 0 1 0 2 0 0 0 0 0Ghana - - - - - - - 7 6 209Guinea - - 0 0 61 15 8 - - -Mali - - 0 3 1 2 1 1 1 -Mauritania - - - - - - - - - -Niger - - 2 2 3 0 0 0 0 0Nigeria - - - 1 0 1 4 6 - -Senegal 3 4 12 17 11 18 20 25 28 28Togo - - 7 18 5 4 5 10 8 9Developing economies: America 3,491 5,943 6,522 6,560 6,769 6,580 7,065 6,740 7,747 8,641Caribbean 3 13 24 58 72 84 50 66 149 57Anguilla - - - - - - 1 0 0 -Antigua and Barbuda - - - 1 1 - - - - 3Aruba - - - - - - 2 1 1 1Bahamas - 7 14 12 19 9 - - - -Barbados - - - - 5 6 5 5 3 13Cuba - - - 4 5 5 4 23 105 -Dominica - - - 15 14 12 10 11 11 10Dominican Republic - - - - - 22 - - - -Grenada - - - - 1 0 0 0 1 -Haiti 3 5 - - - - - - - -Jamaica - - 4 5 4 4 5 5 4 5Montserrat - - - 0 - 0 0 0 0 0Netherlands Antilles - - 5 - - - - - - -Saint Kitts and Nevis - - - 1 1 1 0 1 1 1Saint Lucia - - - - 1 1 1 1 1 2Saint Vincent and the Grenadines - - 0 0 0 0 1 1 1 0Trinidad and Tobago - - - 20 21 24 20 18 20 22Turks and Caicos Islands - - - 0 0 0 0 0 0 -Central America 2,693 3,779 4,244 4,411 4,454 4,154 4,641 4,081 4,309 4,723Belize - - 0 0 4 0 0 0 0 0Costa Rica - 139 179 163 105 90 103 105 131 160El Salvador - - 40 43 48 54 60 50 37 -Guatemala - 75 103 142 144 118 52 99 105 200Honduras - 111 78 73 52 55 55 41 79 80Mexico 2,693 3,430 3,835 3,981 4,088 3,819 4,353 3,775 3,944 4,271Nicaragua - 25 2 2 2 3 9 6 7 9Panama - - 7 7 11 15 10 5 5 3South America 795 2,151 2,255 2,092 2,243 2,342 2,375 2,592 3,290 3,860Argentina 449 393 361 291 293 288 246 257 332 394Bolivia - 82 68 60 63 61 72 69 79 83Brazil - 931 895 950 1,029 1,043 1,191 1,346 1,807 2,192Chile - 275 258 234 234 266 189 174 209 233Colombia 283 301 323 299 353 405 384 436 490 565Ecuador 19 - 29 26 30 39 39 36 40 38Guyana - 4 2 5 3 2 4 12 3 6Paraguay - - 4 5 6 8 9 10 15 15Peru - - 173 103 112 121 148 164 204 241Suriname - - - - - - - - - -
For sources and notes, see end of table.
Economic group,region and country/territory
240
Sta
tist
ical
Annex
Part
1
C R E AT I V E E C O N O M Y R E P O R T 2 0 0 8
EXPORTS (f.o.b., in millions of $)
CONTINUED

- 35 37 33 58 71 73 83 90 121 Middle Africa- - - - 28 38 48 57 59 68 Cameroon- 1 2 2 2 2 2 2 - 3 Central African Republic- 33 36 30 27 30 22 22 31 49 Gabon- - - 1 1 1 1 2 - - Sao Tome and Principe
99 88 106 151 398 445 742 819 1,102 989 Northern Africa99 88 106 133 127 125 138 139 219 - Algeria
- - - - - - 253 332 400 440 Morocco- - - 18 40 53 65 70 107 127 Sudan- - - - 231 267 286 278 377 422 Tunisia- 803 750 676 958 817 906 1,162 1,203 1,542 Southern Africa- - - - 146 146 232 372 - - Botswana- - - - 92 71 66 70 122 134 Namibia- 803 750 676 682 566 571 720 1,080 1,408 South Africa- - - - 39 34 36 - - - Swaziland
50 53 122 221 253 391 337 446 390 825 Western Africa- - 17 16 15 14 18 24 27 27 Benin- - - - - 11 16 18 27 - Burkina Faso- 9 11 11 10 9 12 14 16 21 Cape Verde- - - - - 42 - - 62 60 Côte d’Ivoire8 12 10 9 7 4 4 8 7 8 Gambia- - - - - - - 75 105 576 Ghana- - 17 12 23 10 12 - - - Guinea- - 11 13 11 16 19 27 35 - Mali- - - - 4 6 7 6 8 11 Mauritania- - 9 6 7 7 8 12 13 25 Niger- - - 100 140 221 190 194 - - Nigeria
41 32 31 33 28 40 41 56 77 83 Senegal- - 17 21 9 11 10 11 14 13 Togo
3,377 7,239 9,084 8,546 9,123 9,289 8,354 8,184 8,909 10,923 Developing economies: America- 127 461 590 748 881 606 651 644 607 Caribbean- - - - - - 5 5 6 - Anguilla- - - 17 17 - - - - 24 Antigua and Barbuda- - - - - - 52 48 58 38 Aruba- 127 154 131 157 143 - - - - Bahamas- - - - 89 85 79 87 62 120 Barbados- - - 130 140 167 122 132 134 - Cuba- - - 6 6 5 5 5 6 7 Dominica- - - - - 164 - - - - Dominican Republic- - - - 13 10 11 21 11 - Grenada- - - - - - - - - - Haiti- - 247 204 210 177 189 193 191 230 Jamaica- - - 1 - 1 1 1 1 1 Montserrat- - 51 - - - - - - - Netherlands Antilles- - - 11 10 13 19 15 14 13 Saint Kitts and Nevis- - - - 19 13 23 30 33 39 Saint Lucia- - 9 15 9 13 9 11 14 14 Saint Vincent and the Grenadines- - - 65 68 80 80 93 98 122 Trinidad and Tobago- - - 11 10 10 10 9 16 - Turks and Caicos Islands
1,912 3,036 3,987 4,116 4,530 4,702 5,042 5,027 5,039 5,709 Central America- - 10 7 13 13 13 27 19 23 Belize- 169 203 168 185 191 199 204 214 221 Costa Rica- 31 122 121 155 169 173 196 207 - El Salvador- 144 177 166 169 217 235 246 275 347 Guatemala- 60 84 96 80 79 98 111 121 162 Honduras
1,912 2,586 3,134 3,275 3,654 3,789 4,052 3,967 4,111 4,616 Mexico- 46 57 68 73 76 87 85 94 98 Nicaragua- - 201 215 201 168 186 191 - 242 Panama
1,465 4,076 4,636 3,839 3,845 3,706 2,707 2,507 3,226 4,607 South America651 879 960 880 880 733 142 243 408 560 Argentina
- 64 85 71 71 73 70 57 59 68 Bolivia- 1,427 1,268 867 784 689 564 430 557 745 Brazil- 619 622 480 568 488 457 474 571 688 Chile
377 436 414 306 293 310 312 292 331 447 Colombia159 115 202 118 108 204 257 264 305 367 Ecuador
- 20 15 15 16 17 17 24 22 21 Guyana- - 156 91 145 129 87 96 143 172 Paraguay- - 271 226 227 245 263 266 297 337 Peru- - - - - - 18 22 24 154 Suriname
For sources and notes, see end of table.
Economic group,region and
country/territory
TA B L E
1.1
241
Sta
tistical
Annex
Part
1
C R E AT I V E E C O N O M Y R E P O R T 2 0 0 8
1996 1997 1998 1999 2000 2001 2002 2003 2004 2005
IMPORTS (c.i.f., in millions of $)

TA B L E
1.1
1996 1997 1998 1999 2000 2001 2002 2003 2004 2005
Uruguay - 117 100 75 79 73 56 55 52 59Venezuela (Bolivarian Republic of) 45 49 43 43 42 37 37 32 59 33Developing economies: Asia 52,469 63,198 63,363 68,609 82,063 77,670 83,499 95,974 110,669 125,786Eastern Asia 45,979 51,509 50,850 52,690 63,058 59,412 64,646 72,294 82,148 94,608China 18,428 22,861 23,425 24,261 28,474 28,845 35,022 41,919 50,143 61,360China, SAR of Hong Kong 24,391 25,681 24,228 25,007 27,417 24,442 24,154 24,499 26,218 27,677China, SAR of Macao 115 53 43 37 45 44 40 41 52 -China, Taiwan Province of - - - - 3,533 2,882 2,709 2,597 2,725 2,622Mongolia - 2 2 2 6 3 2 4 4 7Republic of Korea 3,045 2,911 3,154 3,383 3,583 3,195 2,719 3,235 3,006 2,942Southern Asia 2,382 3,413 3,742 4,329 4,642 4,380 4,663 7,643 9,305 10,869Bangladesh - - - - - - 73 75 131 -Bhutan - - - 0 - - - - - -India 2,382 2,633 2,932 3,043 3,591 3,358 3,619 5,365 7,022 8,155Iran (Islamic Republic of) - 780 673 812 836 736 757 865 864 943Maldives - - 0 - - - 0 - 7 6Nepal - - 137 176 215 - - 89 - -Pakistan - - - - - - - 1,068 1,088 1,581Sri Lanka - - - 297 - 286 214 180 192 184Southeastern Asia 2,346 6,075 6,447 9,125 11,616 10,893 10,701 11,649 13,644 14,361Brunei Darussalam - - - - - - 15 5 - -Cambodia - - - - 283 219 445 355 646 -Indonesia 2,346 1,974 2,643 2,249 2,811 2,552 2,315 2,288 2,548 2,833Malaysia - 1,971 1,880 2,161 2,435 2,116 2,252 2,423 3,098 3,233Philippines - - - - 1,252 1,104 941 876 853 905Singapore - 2,129 1,925 1,541 1,503 1,575 1,404 2,237 2,699 3,067Thailand - - - 3,174 3,332 3,327 3,328 3,466 3,801 4,323Western Asia 1,763 2,202 2,323 2,465 2,747 2,986 3,489 4,388 5,573 5,947Bahrain - - - - - - 27 26 32 26Jordan - - 69 83 71 104 97 143 202 264Kuwait - - - - 24 25 - - - -Lebanon - 103 105 111 140 162 177 151 188 -Oman - - - - 30 23 32 42 55 81Qatar - - - - 24 4 17 9 26 20Saudi Arabia - - - 144 126 178 256 371 576 396Syrian Arab Republic - - - - - 21 36 52 55 65Turkey 1,763 2,099 2,149 2,127 2,332 2,469 2,847 3,595 4,424 5,081Yemen - - - - - - - - 14 14Developing economies: Oceania 4 3 9 16 22 6 12 18 22 29Cook Islands - - - - 0 - - 0 0 -Fiji - - - - 15 - 8 12 10 7French Polynesia 4 3 9 16 6 5 3 4 10 16Kiribati - - - - - - - - - 0New Caledonia - - - - - 1 1 1 1 7Papua New Guinea - - - - - 0 0 1 - -Samoa - - - - - 0 0 0 1 -Tuvalu - - - - - - - - - -Economies in transition: Asia - 8 9 11 23 29 26 46 63 89Armenia - 8 - 5 13 17 17 29 36 40Azerbaijan - - - 2 1 1 1 1 2 5Georgia - - 1 0 1 2 1 2 3 10Kazakhstan - - 8 - 3 7 5 11 16 30Kyrgyzstan - - - - 2 2 2 3 5 5Turkmenistan - - - 3 2 - - - - -Economies in transition: Europe 21 1,110 1,393 1,309 1,468 1,731 1,624 1,916 2,901 3,065Albania 4 5 7 11 7 9 10 15 16 20Belarus - - 244 214 276 305 323 362 470 419Bosnia and Herzegovina - - - - - - - 34 51 70Croatia - 124 132 128 118 133 154 217 382 397Macedonia, TFYR 17 19 17 16 16 13 15 16 23 26Moldova - - - - 14 15 15 19 27 35Russian Federation - 963 993 941 990 1,051 881 1,020 1,395 1,649Serbia and Montenegro - - - - 46 56 65 - 88 111Ukraine - - - - - 149 160 233 449 336
Economic group,region and country/territory
242
Sta
tist
ical
Annex
Part
1
C R E AT I V E E C O N O M Y R E P O R T 2 0 0 8
EXPORTS (f.o.b., in millions of $)
SOURCE: UNCTAD secretariat calculations based on United Nations Comtrade database data.NOTES: (1) Developed economies, including Bulgaria and Romania.
(2) Excluding Bulgaria and Romania, which are included in the European Union (EU-27).
CONTINUED

- 121 133 129 120 104 56 51 75 86 Uruguay277 396 509 656 633 714 465 288 433 963 Venezuela (Bolivarian Republic of)
23,431 29,087 24,680 27,912 34,840 32,622 33,673 37,015 41,761 45,308 Developing economies: Asia21,874 22,298 19,423 20,749 25,321 23,560 23,900 25,790 28,546 30,475 Eastern Asia
2,331 2,419 1,974 2,036 2,242 2,374 2,460 2,985 3,326 3,676 China16,992 17,830 16,657 17,557 19,455 17,711 17,525 18,473 20,217 21,136 China, SAR of Hong Kong
86 79 62 67 70 79 106 123 215 - China, SAR of Macao- - - - 1,985 1,602 1,417 1,594 2,105 2,382 China, Taiwan Province of- 11 13 14 21 15 - 28 20 36 Mongolia
2,465 1,960 717 1,075 1,548 1,779 2,392 2,587 2,663 3,245 Republic of Korea551 793 866 991 1,099 1,330 1,838 1,997 2,301 2,548 Southern Asia
- - - - - - 236 267 306 - Bangladesh- - - 3 - - - - - - Bhutan
551 702 722 783 998 1,085 1,340 1,130 1,328 1,638 India- 77 112 38 57 68 89 121 216 322 Iran (Islamic Republic of)- 15 16 19 20 21 23 27 36 35 Maldives- - 15 21 24 - - 52 - - Nepal- - - - - - - 216 203 294 Pakistan- - - 126 - 156 151 185 212 259 Sri Lanka
265 4,704 2,938 3,827 4,743 4,316 4,618 5,446 6,102 6,478 Southeastern Asia- - - - - - 63 66 - - Brunei Darussalam- - - - 59 58 64 69 73 - Cambodia
265 257 130 104 149 133 161 243 282 310 Indonesia- 914 694 685 835 763 908 980 1,122 982 Malaysia- - - - 333 300 321 328 367 384 Philippines- 3,533 2,115 2,475 2,740 2,408 2,350 2,895 3,348 3,719 Singapore- - - 562 626 655 751 865 911 1,084 Thailand
741 1,292 1,452 2,346 3,678 3,415 3,317 3,782 4,811 5,808 Western Asia- - - - - - 177 184 186 153 Bahrain- - 87 95 104 109 145 137 247 399 Jordan- - - - 541 545 - - - - Kuwait- 429 422 341 298 364 352 337 410 - Lebanon- - - - 139 192 183 177 236 258 Oman- - - - 204 161 183 215 248 480 Qatar- - - 1,050 1,180 1,168 1,273 1,434 1,662 1,957 Saudi Arabia- - - - - 18 33 45 65 84 Syrian Arab Republic
741 863 943 859 1,213 857 972 1,252 1,651 2,276 Turkey- - - - - - - - 106 200 Yemen
55 50 66 55 66 150 203 247 240 239 Developing economies: Oceania- - - - - - - 3 4 - Cook Islands- - - - - - 42 55 66 71 Fiji
55 50 66 55 66 58 63 77 81 83 French Polynesia- - - - - - - - - 1 Kiribati- - - - - 53 59 70 81 84 New Caledonia- - - - - 35 35 36 - - Papua New Guinea- - - - - 4 5 6 8 - Samoa- 0 0 0 - - - - - - Tuvalu- 12 113 113 242 232 291 376 550 686 Economies in transition: Asia- 12 - 22 22 26 20 24 31 40 Armenia- - - 26 27 30 45 51 74 91 Azerbaijan- - 15 16 15 17 25 28 51 78 Georgia- - 98 - 113 146 186 252 370 448 Kazakhstan- - - - 16 14 15 21 24 30 Kyrgyzstan- - - 48 50 - - - - - Turkmenistan
63 1,850 1,632 1,034 1,334 2,185 2,672 3,385 4,562 5,292 Economies in transition: Europe 31 30 43 43 46 50 72 87 95 119 Albania
- - 105 79 112 106 114 160 205 197 Belarus- - - - - - - 152 190 263 Bosnia and Herzegovina- 304 301 262 281 366 477 608 796 877 Croatia
31 30 32 32 35 32 42 53 71 97 Macedonia, TFYR- - - - 22 28 38 49 69 102 Moldova- 1,487 1,151 618 782 1,279 1,520 1,958 2,383 2,680 Russian Federation- - - - 55 87 148 - 314 296 Serbia and Montenegro- - - - - 236 261 316 439 662 Ukraine
Economic group,region and
country/territory
TA B L E
1.1
243
Sta
tistical
Annex
Part
1
C R E AT I V E E C O N O M Y R E P O R T 2 0 0 8
1996 1997 1998 1999 2000 2001 2002 2003 2004 2005
IMPORTS (c.i.f., in millions of $)
SOURCE: UNCTAD secretariat calculations based on United Nations Comtrade database data.NOTES: (1) Developed economies, including Bulgaria and Romania.
(2) Excluding Bulgaria and Romania, which are included in the European Union (EU-27).

244
Sta
tist
ical
Annex
Part
1
C R E AT I V E E C O N O M Y R E P O R T 2 0 0 8
TA B L E
1.2.A CREATIVE GOODS: TOTAL WORLD EXPORTS, BY ORIGIN AND PRODUCT GROUP, 1996, 2000 AND 2005
All Creative Industries 1996 189,214 133,195 100,924 96,115 9,312 17,529 3,618 1,812 212000 228,695 137,378 99,936 95,378 10,413 20,703 4,803 1,523 1,4902005 335,494 196,109 151,489 145,056 11,377 25,544 5,547 2,152 3,154
ARTS AND CRAFTS 1996 14,738 7,043 5,897 4,696 188 660 96 203 52000 17,707 6,873 5,482 4,253 248 861 120 163 782005 23,244 9,227 7,606 7,404 343 977 88 212 137
CARPETS 1996 2,869 1,751 1,589 781 13 114 2 34 12000 3,459 1,479 1,336 627 43 81 2 16 332005 4,071 1,588 1,426 1,390 30 108 5 19 30
CELEBRATION 1996 2,711 553 433 395 17 96 2 5 02000 3,569 632 470 409 33 127 1 1 12005 3,118 875 697 692 47 127 2 3 9
PAPERWARE 1996 49 32 23 12 0 7 1 0 02000 87 46 18 15 0 26 2 1 02005 62 30 16 15 0 11 2 0 0
WICKERWARE 1996 1,065 149 128 115 2 18 1 0 02000 1,055 146 119 94 2 23 2 0 82005 1,640 259 213 213 8 35 2 1 10
YARN 1996 2,193 1,262 1,072 892 9 89 66 26 92000 2,784 1,428 1,117 931 12 213 64 22 312005 4,808 1,752 1,448 1,350 12 204 57 32 66
OTHER 1996 5,851 3,296 2,653 2,502 147 336 23 137 02000 6,754 3,142 2,423 2,176 157 391 48 123 112005 9,546 4,723 3,807 3,744 246 492 21 158 46
AUDIOVISUALS 1996 355 226 116 113 65 36 4 5 02000 374 285 121 117 100 35 5 25 12005 664 607 249 247 318 28 2 10 2
FILM 1996 355 226 116 113 65 36 4 5 02000 374 285 121 117 100 35 5 25 12005 664 607 249 247 318 28 2 10 2
DESIGN 1996 119,706 76,778 65,099 58,416 2,202 7,165 1,323 989 132000 146,725 78,566 62,816 56,396 3,509 8,915 2,518 809 5462005 218,173 114,025 94,309 89,932 3,692 11,224 3,678 1,122 1,735
GRAPHIC 1996 9,617 8,594 8,336 8,225 51 87 96 24 02000 10,069 8,192 7,852 7,746 116 106 86 32 982005 16,422 11,270 10,909 10,884 157 108 55 41 198
FASHION 1996 33,871 17,224 14,476 13,617 254 2,164 210 121 62000 40,374 17,426 14,494 13,445 304 2,333 182 113 1162005 60,100 28,075 25,076 24,476 341 2,351 171 135 161
GLASSWARE 1996 4,357 3,744 3,427 3,122 30 218 63 6 02000 4,583 3,556 3,241 2,930 15 226 66 9 232005 6,016 4,238 3,919 3,696 20 201 78 19 42
INTERIOR 1996 35,816 28,981 24,599 21,355 1,434 2,262 479 208 62000 45,113 28,849 22,850 20,070 2,512 2,907 407 173 2782005 66,597 39,219 32,927 32,341 2,632 3,084 302 274 820
JEWELLERY 1996 16,355 12,259 10,205 8,504 135 1,259 94 566 02000 21,962 13,185 10,129 8,590 274 2,144 211 427 142005 38,612 20,187 14,624 11,923 238 4,321 435 568 475
TOYS 1996 19,690 5,977 4,057 3,593 299 1,176 381 65 12000 24,623 7,357 4,249 3,613 289 1,199 1,567 54 182005 30,425 11,036 6,853 6,612 303 1,159 2,636 84 40
MUSIC (CDs, tapes) 1996 5,100 4,878 3,713 3,572 172 806 152 35 02000 7,076 6,212 4,750 4,318 225 991 156 90 222005 14,924 13,449 11,198 10,945 376 1,491 297 88 63
RECORDS 1996 5,011 4,790 3,654 3,515 172 779 151 34 82000 7,000 6,138 4,704 4,274 224 966 155 88 262005 14,805 13,333 11,120 10,869 375 1,455 296 87 88
PRINTED 1996 88 88 58 56 0 27 1 1 02000 76 74 46 44 0 25 1 2 02005 119 116 77 76 0 35 1 2 0
NEW MEDIA 1996 6,804 5,938 2,018 1,644 122 2,240 1,493 64 02000 6,936 5,563 2,724 2,465 96 1,344 1,288 111 22005 12,035 6,476 3,966 3,940 171 1,805 235 300 50
DIGITAL RECORDS 1996 2,629 2,444 714 425 61 1,545 101 24 02000 2,475 2,005 1,197 1,028 46 652 72 38 12005 2,282 2,046 1,508 1,494 7 465 50 16 6
VIDEO GAMES 1996 4,176 3,494 1,304 1,219 61 696 1,392 40 02000 4,461 3,558 1,527 1,437 50 692 1,216 74 12005 9,752 4,430 2,458 2,447 164 1,340 185 284 44
Product group Total EU-27
Developed economies (1)
(In millions of $)
Year Total CanadaUnited States Japan
OtherdevelopedeconomiesWorld
Europe Economies in transition
(2)
Origin

245
Sta
tistical
Annex
Part
1
C R E AT I V E E C O N O M Y R E P O R T 2 0 0 8
TA B L E
1.2.A
55,997 33 3,491 52,469 50,706 18,428 1,763 4 20 - 1996 All Creative Industries89,827 973 6,769 82,063 79,316 28,474 2,747 22 648 133 2000
136,231 1,775 8,641 125,786 119,839 61,360 5,947 29 211 153 20057,690 8 421 7,261 6,713 2,460 548 0 9 - 1996 ARTS AND CRAFTS
10,756 129 727 9,891 9,310 3,012 581 8 190 32 200013,881 296 624 12,959 11,832 5,602 1,127 2 54 25 2005
1,117 0 9 1,108 820 334 288 0 0 - 1996 CARPETS1,947 13 21 1,914 1,669 297 245 0 146 1 20002,452 37 21 2,394 2,078 378 316 0 0 4 20052,158 0 65 2,094 2,092 601 1 - 0 - 1996 CELEBRATION2,936 3 66 2,868 2,867 947 1 0 0 2 20002,234 2 73 2,159 2,157 1,221 2 0 0 1 2005
17 - 0 17 17 12 0 - - - 1996 PAPERWARE40 0 0 40 40 13 0 0 0 0 200032 0 0 32 28 3 4 0 0 0 2005
916 2 3 911 911 629 0 0 2 - 1996 WICKERWARE906 11 5 890 890 565 0 0 7 0 2000
1,374 18 6 1,351 1,349 1,125 2 0 9 0 2005929 2 156 772 675 308 97 - 3 - 1996 YARN
1,352 19 187 1,139 974 337 165 7 12 8 20003,048 15 110 2,923 2,446 1,438 477 0 2 0 20052,552 4 189 2,359 2,197 576 162 0 4 - 1996 OTHER3,575 85 449 3,040 2,870 852 169 1 24 21 20004,741 224 414 4,101 3,775 1,438 326 2 43 19 2005
129 0 7 122 122 7 0 0 0 - 1996 AUDIOVISUALS88 1 20 67 66 2 1 0 0 1 200055 1 16 38 37 0 1 0 0 0 2005
129 0 7 122 122 7 0 0 0 - 1996 FILM88 1 20 67 66 2 1 0 0 1 200055 1 16 38 37 0 1 0 0 0 2005
42,914 20 2,222 40,671 39,509 14,447 1,162 2 7 - 1996 DESIGN67,613 485 4,531 62,585 60,546 22,440 2,039 12 97 78 2000
102,413 826 6,280 95,288 90,614 47,078 4,674 19 94 88 20051,023 0 211 812 582 214 229 - 0 - 1996 GRAPHIC1,780 39 624 1,117 770 246 347 0 0 1 20004,954 63 1,397 3,494 2,485 1,865 1,008 0 3 3 2005
16,641 16 432 16,193 15,739 6,222 454 0 3 - 1996 FASHION22,832 128 665 22,038 21,567 8,937 471 1 85 19 200031,864 331 543 30,989 30,374 17,524 616 1 70 19 2005
614 0 103 511 357 96 154 - 0 - 1996 GLASSWARE1,004 6 131 867 640 195 227 0 0 0 20001,737 6 146 1,585 1,266 854 319 0 0 1 20056,828 2 813 6,013 5,810 2,687 203 0 2 - 1996 INTERIOR
15,986 209 2,077 13,695 13,211 5,283 484 5 6 17 200026,558 253 2,795 23,508 22,263 14,525 1,245 2 17 11 20054,096 1 193 3,901 3,785 1,010 116 2 1 - 1996 JEWELLERY8,763 89 581 8,087 7,591 1,790 497 6 4 35 2000
17,951 149 1,006 16,780 15,317 2,819 1,463 16 3 51 200513,712 0 471 13,241 13,235 4,216 5 0 1 - 1996 TOYS17,248 14 453 16,781 16,768 5,988 13 0 1 6 200019,350 25 393 18,932 18,909 9,490 23 0 0 3 2005
222 0 82 140 128 5 12 0 0 - 1996 MUSIC (CDs, tapes)841 8 151 683 666 58 17 0 2 0 2000
1,412 7 336 1,069 1,049 135 20 0 0 2 2005221 0 81 139 128 5 12 0 0 - 1996 RECORDS840 8 150 682 665 58 17 0 2 0 2000
1,409 7 336 1,065 1,046 135 20 0 0 2 20051 - 1 0 0 0 0 - - - 1996 PRINTED1 0 0 1 1 0 0 - 0 0 20004 0 0 3 3 0 0 - 0 0 2005
866 0 92 774 773 233 1 0 0 - 1996 NEW MEDIA1,371 5 59 1,307 1,305 343 2 0 0 0 20005,508 8 77 5,423 5,413 3,940 10 0 0 1 2005
185 0 5 180 179 30 1 - 0 - 1996 DIGITAL RECORDS469 2 8 459 458 16 1 0 0 0 2000230 4 1 225 216 24 9 0 0 1 2005682 0 88 594 594 203 0 0 0 - 1996 VIDEO GAMES902 3 51 848 847 328 1 0 0 0 2000
5,278 4 76 5,198 5,197 3,916 0 0 0 0 2005
YearTotal ChinaWestern
Asia LDCs SIDSTotal America OceaniaAfrica
Eastern, Southernand Southeastern
Asia Product group
Developing economies (1)
Asia
Origin
(In millions of $)

246
Sta
tist
ical
Annex
Part
1
C R E AT I V E E C O N O M Y R E P O R T 2 0 0 8
TA B L E
1.2.A
SOURCE: UNCTAD secretariat calculations based on United Nations Comtrade database data.NOTES: (1) Developed economies, including Bulgaria and Romania.
(2) Excluding Bulgaria and Romania, which are included in the European Union (EU-27).
PUBLISHING 1996 32,180 30,483 18,378 16,707 6,434 4,802 410 458 32000 33,378 28,120 16,549 14,916 5,937 4,946 450 239 8222005 44,304 36,642 24,231 23,463 5,965 5,496 650 301 1,096
BOOKS 1996 8,739 7,846 5,485 4,948 213 1,865 169 113 02000 9,835 7,636 5,150 4,689 275 2,007 127 75 2502005 12,881 9,713 7,079 6,874 369 2,033 89 142 203
NEWSPAPERS 1996 14,670 14,437 6,857 6,507 5,783 1,525 65 206 02000 13,253 11,859 5,381 5,071 4,888 1,434 113 44 4832005 15,324 13,654 7,351 7,154 4,534 1,570 150 50 709
OTHER 1996 8,772 8,199 6,036 5,252 437 1,412 175 139 22000 10,290 8,625 6,018 5,156 773 1,505 210 120 892005 16,099 13,275 9,800 9,435 1,062 1,892 411 109 184
VISUAL ARTS 1996 10,331 7,850 5,702 4,833 129 1,820 141 58 02000 16,501 11,759 7,494 6,340 299 3,611 267 87 202005 22,149 15,683 9,932 9,125 512 4,523 598 119 71
PAINTING 1996 410 192 173 159 4 13 0 2 02000 810 222 191 163 7 21 0 2 42005 955 265 226 224 7 29 0 2 22
PHOTOGRAPHY 1996 725 521 377 331 7 64 72 3 02000 899 564 308 269 5 88 162 2 12005 1,494 980 342 336 8 110 519 2 1
SCULPTURE 1996 3,618 1,706 1,473 1,351 36 152 39 7 02000 5,180 1,618 1,392 1,227 32 153 35 7 192005 6,078 1,836 1,586 1,573 45 167 23 15 57
ANTIQUES 1996 1,291 1,227 1,008 873 18 187 8 7 02000 2,054 1,956 1,467 1,348 21 430 23 15 02005 2,536 2,352 1,972 1,830 17 338 12 12 0
OTHER 1996 4,286 4,203 2,671 2,119 65 1,404 22 40 02000 7,557 7,399 4,137 3,332 233 2,920 48 61 02005 11,087 10,251 5,805 5,162 435 3,878 44 88 0
Product group Total EU-27
Developed economies (1)
(In millions of $)
Year Total CanadaUnited States Japan
OtherdevelopedeconomiesWorld
Europe Economies in transition
(2)
Origin
CONTINUED

247
Sta
tistical
Annex
Part
1
C R E AT I V E E C O N O M Y R E P O R T 2 0 0 8
TA B L E
1.2.A
SOURCE: UNCTAD secretariat calculations based on United Nations Comtrade database data.NOTES: (1) Developed economies, including Bulgaria and Romania.
(2) Excluding Bulgaria and Romania, which are included in the European Union (EU-27).
1,695 4 457 1,233 1,214 197 19 0 2 - 1996 PUBLISHING4,435 307 868 3,260 3,193 433 67 0 350 18 20006,567 480 1,018 5,062 4,972 1,146 90 7 58 35 2005
892 0 206 686 685 114 1 0 0 - 1996 BOOKS1,949 27 315 1,607 1,570 311 37 0 3 10 20002,965 44 389 2,531 2,504 680 27 1 2 14 2005
232 2 79 151 146 5 5 - 0 - 1996 NEWSPAPERS911 65 249 598 593 6 4 0 0 1 2000961 40 227 694 676 18 18 0 0 1 2005570 2 173 396 383 79 13 0 2 - 1996 OTHER
1,575 216 304 1,055 1,030 116 25 0 346 7 20002,641 396 402 1,836 1,792 447 44 6 56 20 20052,481 2 209 2,269 2,248 1,079 21 2 1 - 1996 VISUAL ARTS4,722 38 414 4,270 4,229 2,186 40 1 8 3 20006,395 157 289 5,948 5,922 3,459 26 1 4 2 2005
218 0 71 146 146 39 0 - 0 - 1996 PAINTING588 2 148 438 437 104 1 0 0 0 2000688 6 84 598 597 305 1 0 0 0 2005203 0 13 191 188 46 3 0 0 - 1996 PHOTOGRAPHY334 1 11 322 319 74 3 0 0 0 2000514 1 8 505 500 139 5 0 0 0 2005
1,912 2 114 1,797 1,779 979 18 0 1 - 1996 SCULPTURE3,549 12 216 3,320 3,301 1,994 19 1 2 2 20004,177 126 169 3,882 3,865 2,972 17 1 2 1 2005
64 - 0 64 64 1 0 - - - 1996 ANTIQUES98 0 1 96 86 1 10 - 0 0 2000
183 1 1 181 180 2 1 0 0 0 200584 0 11 71 70 14 1 2 0 - 1996 OTHER
153 21 37 94 86 13 8 0 6 1 2000833 24 27 782 780 40 2 0 2 1 2005
YearTotal ChinaWestern
Asia LDCs SIDSTotal America OceaniaAfrica
Eastern, Southernand Southeastern
Asia Product group
Developing economies (1)
Asia
Origin
(In millions of $)
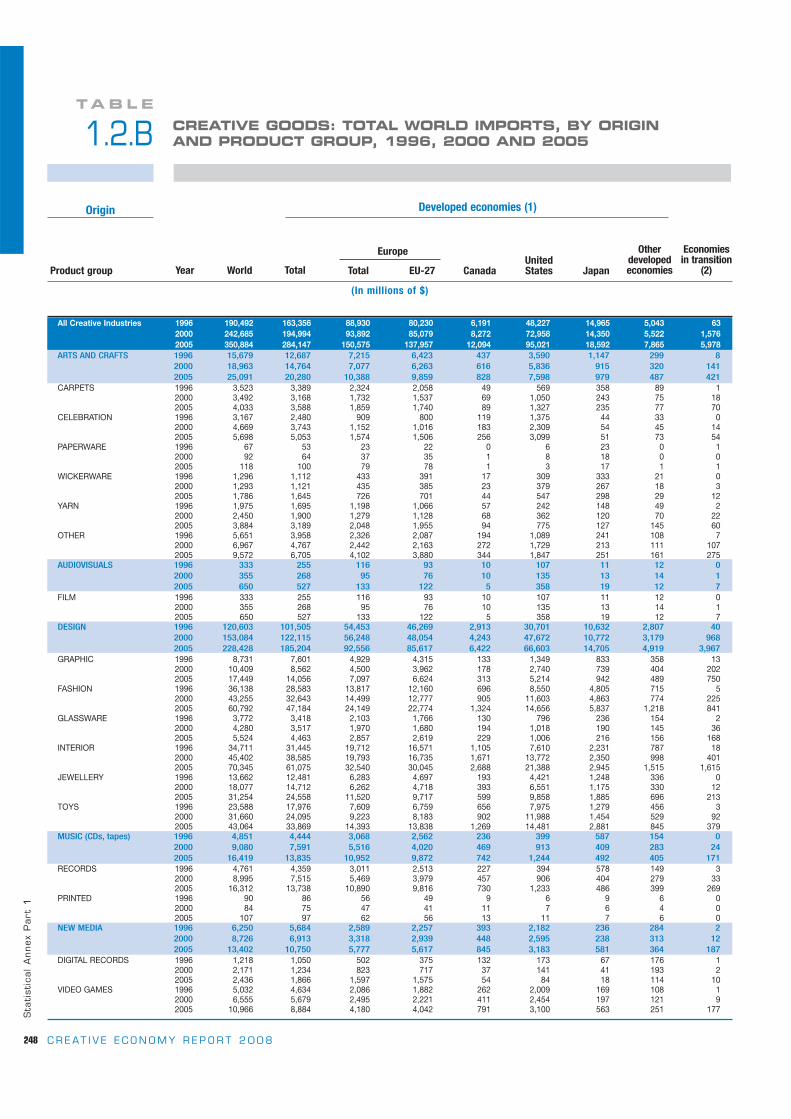
248
Sta
tist
ical
Annex
Part
1
C R E AT I V E E C O N O M Y R E P O R T 2 0 0 8
TA B L E
1.2.B CREATIVE GOODS: TOTAL WORLD IMPORTS, BY ORIGIN AND PRODUCT GROUP, 1996, 2000 AND 2005
All Creative Industries 1996 190,492 163,356 88,930 80,230 6,191 48,227 14,965 5,043 632000 242,685 194,994 93,892 85,079 8,272 72,958 14,350 5,522 1,5762005 350,884 284,147 150,575 137,957 12,094 95,021 18,592 7,865 5,978
ARTS AND CRAFTS 1996 15,679 12,687 7,215 6,423 437 3,590 1,147 299 82000 18,963 14,764 7,077 6,263 616 5,836 915 320 1412005 25,091 20,280 10,388 9,859 828 7,598 979 487 421
CARPETS 1996 3,523 3,389 2,324 2,058 49 569 358 89 12000 3,492 3,168 1,732 1,537 69 1,050 243 75 182005 4,033 3,588 1,859 1,740 89 1,327 235 77 70
CELEBRATION 1996 3,167 2,480 909 800 119 1,375 44 33 02000 4,669 3,743 1,152 1,016 183 2,309 54 45 142005 5,698 5,053 1,574 1,506 256 3,099 51 73 54
PAPERWARE 1996 67 53 23 22 0 6 23 0 12000 92 64 37 35 1 8 18 0 02005 118 100 79 78 1 3 17 1 1
WICKERWARE 1996 1,296 1,112 433 391 17 309 333 21 02000 1,293 1,121 435 385 23 379 267 18 32005 1,786 1,645 726 701 44 547 298 29 12
YARN 1996 1,975 1,695 1,198 1,066 57 242 148 49 22000 2,450 1,900 1,279 1,128 68 362 120 70 222005 3,884 3,189 2,048 1,955 94 775 127 145 60
OTHER 1996 5,651 3,958 2,326 2,087 194 1,089 241 108 72000 6,967 4,767 2,442 2,163 272 1,729 213 111 1072005 9,572 6,705 4,102 3,880 344 1,847 251 161 275
AUDIOVISUALS 1996 333 255 116 93 10 107 11 12 02000 355 268 95 76 10 135 13 14 12005 650 527 133 122 5 358 19 12 7
FILM 1996 333 255 116 93 10 107 11 12 02000 355 268 95 76 10 135 13 14 12005 650 527 133 122 5 358 19 12 7
DESIGN 1996 120,603 101,505 54,453 46,269 2,913 30,701 10,632 2,807 402000 153,084 122,115 56,248 48,054 4,243 47,672 10,772 3,179 9682005 228,428 185,204 92,556 85,617 6,422 66,603 14,705 4,919 3,967
GRAPHIC 1996 8,731 7,601 4,929 4,315 133 1,349 833 358 132000 10,409 8,562 4,500 3,962 178 2,740 739 404 2022005 17,449 14,056 7,097 6,624 313 5,214 942 489 750
FASHION 1996 36,138 28,583 13,817 12,160 696 8,550 4,805 715 52000 43,255 32,643 14,499 12,777 905 11,603 4,863 774 2252005 60,792 47,184 24,149 22,774 1,324 14,656 5,837 1,218 841
GLASSWARE 1996 3,772 3,418 2,103 1,766 130 796 236 154 22000 4,280 3,517 1,970 1,680 194 1,018 190 145 362005 5,524 4,463 2,857 2,619 229 1,006 216 156 168
INTERIOR 1996 34,711 31,445 19,712 16,571 1,105 7,610 2,231 787 182000 45,402 38,585 19,793 16,735 1,671 13,772 2,350 998 4012005 70,345 61,075 32,540 30,045 2,688 21,388 2,945 1,515 1,615
JEWELLERY 1996 13,662 12,481 6,283 4,697 193 4,421 1,248 336 02000 18,077 14,712 6,262 4,718 393 6,551 1,175 330 122005 31,254 24,558 11,520 9,717 599 9,858 1,885 696 213
TOYS 1996 23,588 17,976 7,609 6,759 656 7,975 1,279 456 32000 31,660 24,095 9,223 8,183 902 11,988 1,454 529 922005 43,064 33,869 14,393 13,838 1,269 14,481 2,881 845 379
MUSIC (CDs, tapes) 1996 4,851 4,444 3,068 2,562 236 399 587 154 02000 9,080 7,591 5,516 4,020 469 913 409 283 242005 16,419 13,835 10,952 9,872 742 1,244 492 405 171
RECORDS 1996 4,761 4,359 3,011 2,513 227 394 578 149 32000 8,995 7,515 5,469 3,979 457 906 404 279 332005 16,312 13,738 10,890 9,816 730 1,233 486 399 269
PRINTED 1996 90 86 56 49 9 6 9 6 02000 84 75 47 41 11 7 6 4 02005 107 97 62 56 13 11 7 6 0
NEW MEDIA 1996 6,250 5,684 2,589 2,257 393 2,182 236 284 22000 8,726 6,913 3,318 2,939 448 2,595 238 313 122005 13,402 10,750 5,777 5,617 845 3,183 581 364 187
DIGITAL RECORDS 1996 1,218 1,050 502 375 132 173 67 176 12000 2,171 1,234 823 717 37 141 41 193 22005 2,436 1,866 1,597 1,575 54 84 18 114 10
VIDEO GAMES 1996 5,032 4,634 2,086 1,882 262 2,009 169 108 12000 6,555 5,679 2,495 2,221 411 2,454 197 121 92005 10,966 8,884 4,180 4,042 791 3,100 563 251 177
Product group Total EU-27
Developed economies (1)
(In millions of $)
Year Total CanadaUnited States Japan
OtherdevelopedeconomiesWorld
Europe Economies in transition
(2)
Origin

249
Sta
tistical
Annex
Part
1
C R E AT I V E E C O N O M Y R E P O R T 2 0 0 8
TA B L E
1.2.B
27,074 211 3,377 23,431 22,691 2,331 741 55 111 - 1996 All Creative Industries46,114 2,085 9,123 34,840 31,162 2,242 3,678 66 520 717 200060,759 4,288 10,923 45,308 39,501 3,676 5,808 239 1,214 833 20052,984 30 242 2,709 2,593 175 116 3 23 - 1996 ARTS AND CRAFTS4,059 180 816 3,059 2,638 201 422 4 61 64 20004,390 295 816 3,262 2,745 400 517 16 108 60 2005
133 2 43 89 70 13 19 0 1 - 1996 CARPETS306 18 64 224 90 9 134 0 2 14 2000375 37 55 282 95 10 187 1 8 8 2005686 0 40 645 643 4 2 1 0 - 1996 CELEBRATION912 6 107 798 785 1 12 1 1 5 2000591 12 153 424 414 3 10 2 2 5 200515 6 0 8 8 5 0 0 2 - 1996 PAPERWARE27 4 1 21 13 3 8 0 3 1 200018 2 1 15 8 2 6 0 2 0 2005
184 1 6 177 174 3 3 0 1 - 1996 WICKERWARE169 6 15 148 136 1 12 0 1 2 2000131 10 21 98 77 3 22 1 1 2 2005280 3 67 210 175 22 36 0 2 - 1996 YARN538 40 248 249 161 19 88 1 15 6 2000657 68 212 374 276 55 98 3 20 6 2005
1,687 19 86 1,580 1,524 128 56 2 16 - 1996 OTHER2,107 105 381 1,619 1,452 167 168 2 39 37 20002,619 165 375 2,070 1,875 327 194 10 76 39 2005
78 0 5 73 72 1 1 0 0 - 1996 AUDIOVISUALS85 3 14 67 62 2 5 0 0 1 2000
116 4 15 96 84 2 13 1 0 2 200578 0 5 73 72 1 1 0 0 - 1996 FILM85 3 14 67 62 2 5 0 0 1 2000
116 4 15 96 84 2 13 1 0 2 200519,057 93 1,837 17,096 16,762 1,647 334 31 44 - 1996 DESIGN30,001 1,000 5,146 23,820 21,454 1,155 2,366 36 228 479 200039,257 2,150 6,239 30,719 26,725 1,642 3,994 150 438 526 2005
1,117 33 107 974 948 243 26 3 15 - 1996 GRAPHIC1,646 184 446 1,012 700 128 312 4 61 70 20002,644 364 581 1,681 1,007 43 674 18 118 96 20057,550 21 586 6,938 6,855 732 82 5 12 - 1996 FASHION
10,387 318 1,448 8,616 7,974 504 642 5 64 117 200012,767 716 1,684 10,334 9,250 442 1,084 33 86 88 2005
352 7 76 269 226 17 43 1 4 - 1996 GLASSWARE727 60 183 482 377 34 104 1 16 17 2000892 101 195 592 467 50 125 4 22 14 2005
3,248 26 577 2,635 2,507 249 128 10 11 - 1996 INTERIOR6,416 277 1,730 4,395 3,623 321 772 13 75 155 20007,655 661 1,982 4,958 3,860 567 1,098 54 190 164 20051,180 1 104 1,067 1,046 79 21 8 0 - 1996 JEWELLERY3,353 48 368 2,929 2,582 87 347 8 2 97 20006,483 116 616 5,726 4,983 268 742 26 6 141 20055,610 5 388 5,213 5,180 327 33 4 2 - 1996 TOYS7,473 113 970 6,385 6,196 81 189 4 10 22 20008,816 192 1,181 7,428 7,157 271 272 15 16 23 2005
406 3 126 275 271 19 4 2 0 - 1996 MUSIC (CDs, tapes)1,465 71 247 1,143 1,023 293 120 4 5 5 20002,413 163 318 1,914 1,798 1,052 116 18 7 6 2005
402 3 125 272 268 19 4 2 0 - 1996 RECORDS1,456 71 246 1,135 1,015 293 120 4 5 5 20002,404 163 316 1,907 1,791 1,052 116 18 7 6 2005
4 0 1 3 3 0 0 0 0 - 1996 PRINTED9 0 1 7 7 0 0 0 0 0 2000
10 1 2 7 7 0 0 0 0 0 2005564 6 83 474 455 139 19 0 1 - 1996 NEW MEDIA
1,802 85 238 1,477 1,372 228 105 0 3 19 20002,465 128 450 1,882 1,691 57 191 5 5 24 2005
167 5 40 121 119 42 3 - 1 - 1996 DIGITAL RECORDS935 40 72 823 744 169 78 0 1 15 2000560 47 37 475 314 9 160 2 2 16 2005398 1 43 353 337 97 16 0 0 - 1996 VIDEO GAMES867 45 167 655 628 59 27 0 2 3 2000
1,905 82 413 1,407 1,376 49 31 3 3 8 2005
YearTotal ChinaWestern
Asia LDCs SIDSTotal America OceaniaAfrica
Eastern, Southernand Southeastern
Asia Product group
Developing economies (1)
Asia
Origin
(In millions of $)

250
Sta
tist
ical
Annex
Part
1
C R E AT I V E E C O N O M Y R E P O R T 2 0 0 8
TA B L E
1.2.B
PUBLISHING 1996 31,242 28,258 16,640 13,791 2,024 6,852 1,489 1,252 112000 34,366 27,151 14,960 12,435 2,223 7,580 1,245 1,143 4002005 45,783 34,924 21,486 19,245 2,839 8,134 1,112 1,354 1,124
BOOKS 1996 8,490 7,665 4,492 3,575 898 1,443 296 536 22000 10,227 7,738 4,142 3,382 962 1,849 307 478 992005 13,836 10,337 5,868 5,173 1,187 2,390 312 579 234
NEWSPAPERS 1996 14,834 13,378 7,000 6,054 650 4,457 737 534 42000 14,866 12,060 5,911 5,060 741 4,265 638 505 1852005 17,081 13,466 7,889 7,291 1,005 3,621 380 571 518
OTHER 1996 7,919 7,215 5,148 4,162 475 952 457 183 62000 9,273 7,354 4,907 3,994 520 1,466 300 161 1162005 14,866 11,122 7,728 6,781 647 2,122 420 204 373
VISUAL ARTS 1996 11,534 10,523 4,849 3,862 179 4,397 863 235 12000 18,111 16,194 6,677 5,542 264 8,228 757 268 302005 21,111 18,627 9,283 7,625 413 7,902 704 324 102
PAINTING 1996 519 461 169 141 12 215 49 17 02000 757 658 219 182 27 353 44 15 22005 963 871 322 302 40 445 49 15 8
PHOTOGRAPHY 1996 789 588 325 275 23 173 44 23 02000 1,116 714 317 276 26 311 28 33 22005 1,674 852 403 386 22 332 66 30 8
SCULPTURE 1996 4,122 3,524 1,865 1,661 75 1,253 241 91 12000 5,291 4,267 2,081 1,859 118 1,724 238 107 202005 5,691 4,828 2,511 2,362 142 1,718 320 137 81
ANTIQUES 1996 1,659 1,617 554 457 17 897 102 46 02000 2,726 2,531 784 649 30 1,648 35 34 02005 2,617 2,448 839 751 21 1,506 51 31 0
OTHER 1996 4,446 4,331 1,936 1,327 51 1,859 428 58 02000 8,221 8,024 3,277 2,577 64 4,192 412 79 62005 10,166 9,628 5,209 3,824 188 3,900 219 112 6
SOURCE: UNCTAD secretariat calculations based on United Nations Comtrade database data.NOTES: (1) Developed economies, including Bulgaria and Romania.
(2) Excluding Bulgaria and Romania, which are included in the European Union (EU-27).
CONTINUED
Product group Total EU-27
Developed economies (1)
(In millions of $)
Year Total CanadaUnited States Japan
OtherdevelopedeconomiesWorld
Europe Economies in transition
(2)
Origin

251
Sta
tistical
Annex
Part
1
C R E AT I V E E C O N O M Y R E P O R T 2 0 0 8
TA B L E
1.2.B
2,973 76 1,002 1,883 1,636 327 247 13 43 - 1996 PUBLISHING6,815 678 2,461 3,664 3,198 342 467 12 213 134 20009,735 1,466 2,804 5,424 4,552 488 871 41 649 200 2005
823 26 378 413 392 38 21 6 15 - 1996 BOOKS2,390 265 954 1,166 1,074 55 93 5 48 71 20003,266 436 1,098 1,711 1,596 72 115 21 102 120 20051,452 27 326 1,095 910 212 185 4 9 - 1996 NEWSPAPERS2,621 121 924 1,573 1,287 158 286 4 37 34 20003,098 158 854 2,073 1,609 192 464 13 42 38 2005
698 23 298 375 334 78 41 2 18 - 1996 OTHER1,803 292 583 926 837 129 88 3 128 28 20003,372 873 853 1,640 1,347 224 293 7 505 43 20051,011 2 82 922 901 22 21 5 1 - 1996 VISUAL ARTS1,887 67 201 1,610 1,417 20 193 10 10 17 20002,382 81 281 2,012 1,906 35 105 9 8 14 2005
57 0 2 55 54 1 1 0 0 - 1996 PAINTING98 2 7 88 74 1 14 0 0 1 200085 4 8 73 66 0 7 0 1 1 2005
201 0 13 187 186 5 1 0 0 - 1996 PHOTOGRAPHY400 4 22 374 367 5 7 0 1 2 2000815 6 13 796 791 6 6 0 2 2 2005597 2 48 544 528 14 17 4 1 - 1996 SCULPTURE
1,006 21 145 832 781 14 51 8 2 10 2000795 38 172 580 505 25 75 6 4 9 200542 0 2 40 39 0 1 0 0 - 1996 ANTIQUES
195 4 5 186 84 0 102 0 0 1 2000168 6 2 160 156 2 4 0 0 0 2005114 0 17 95 94 2 1 1 0 - 1996 OTHER188 36 21 130 112 0 18 1 6 3 2000519 28 86 403 389 2 14 2 1 2 2005
SOURCE: UNCTAD secretariat calculations based on United Nations Comtrade database data.NOTES: (1) Developed economies, including Bulgaria and Romania.
(2) Excluding Bulgaria and Romania, which are included in the European Union (EU-27).
YearTotal ChinaWestern
Asia LDCs SIDSTotal America OceaniaAfrica
Eastern, Southernand Southeastern
Asia Product group
Developing economies (1)
Asia
Origin
(In millions of $)

TA B L E
1.3.1.A CREATIVE GOODS: TOTAL WORLD EXPORTS, BY PRODUCT GROUP, 1996, 2000 AND 2005
252
Sta
tist
ical
Annex
Part
1
C R E AT I V E E C O N O M Y R E P O R T 2 0 0 8
ALL CREATIVE INDUSTRIES 189,214 100.00 100.00 228,695 100.00 100.00 335,494 100.00 100.00 6.0 8.7
ARTS AND CRAFTS 14,738 7.79 100.00 17,707 7.74 100.00 23,244 6.93 100.00 4.3 6.5
CARPETS 2,869 1.52 100.00 3,459 1.51 100.00 4,071 1.21 100.00 1.3 4.8
CELEBRATION 2,711 1.43 100.00 3,569 1.56 100.00 3,118 0.93 100.00 1.7 -2.0
PAPERWARE 49 0.03 100.00 87 0.04 100.00 62 0.02 100.00 4.9 -4.9
WICKERWARE 1,065 0.56 100.00 1,055 0.46 100.00 1,640 0.49 100.00 6.8 10.5
YARN 2,193 1.16 100.00 2,784 1.22 100.00 4,808 1.43 100.00 8.0 12.3
OTHER 5,851 3.09 100.00 6,754 2.95 100.00 9,546 2.85 100.00 5.0 8.1
AUDIOVISUALS 355 0.19 100.00 374 0.16 100.00 664 0.20 100.00 7.6 14.4
FILM 355 0.19 100.00 374 0.16 100.00 664 0.20 100.00 7.6 14.4
DESIGN 119,706 63.26 100.00 146,725 64.16 100.00 218,173 65.03 100.00 6.3 9.1
GRAPHIC 9,617 5.08 100.00 10,069 4.40 100.00 16,422 4.89 100.00 5.7 11.3
FASHION 33,871 17.90 100.00 40,374 17.65 100.00 60,100 17.91 100.00 6.4 9.0
GLASSWARE 4,357 2.30 100.00 4,583 2.00 100.00 6,016 1.79 100.00 3.5 7.0
INTERIOR 35,816 18.93 100.00 45,113 19.73 100.00 66,597 19.85 100.00 6.8 9.3
JEWELLERY 16,355 8.64 100.00 21,962 9.60 100.00 38,612 11.51 100.00 8.9 12.8
TOYS 19,690 10.41 100.00 24,623 10.77 100.00 30,425 9.07 100.00 3.3 4.8
MUSIC (CDs, tapes) 5,100 2.70 100.00 7,076 3.09 100.00 14,924 4.45 100.00 13.5 17.0
PRINTED 88 0.05 100.00 76 0.03 100.00 119 0.04 100.00 3.2 10.0
RECORDS 5,011 2.65 100.00 7,000 3.06 100.00 14,805 4.41 100.00 13.6 17.1
NEW MEDIA 6,804 3.60 100.00 6,936 3.03 100.00 12,035 3.59 100.00 6.5 10.0
DIGITAL RECORDS 2,629 1.39 100.00 2,475 1.08 100.00 2,282 0.68 100.00 1.1 -4.0
VIDEO GAMES 4,176 2.21 100.00 4,461 1.95 100.00 9,752 2.91 100.00 8.6 15.7
PUBLISHING 32,180 17.01 100.00 33,378 14.59 100.00 44,304 13.21 100.00 3.4 6.3
BOOKS 8,739 4.62 100.00 9,835 4.30 100.00 12,881 3.84 100.00 3.7 6.2
NEWSPAPERS 14,670 7.75 100.00 13,253 5.79 100.00 15,324 4.57 100.00 0.4 3.0
OTHER 8,772 4.64 100.00 10,290 4.50 100.00 16,099 4.80 100.00 7.1 10.0
VISUAL ARTS 10,331 5.46 100.00 16,501 7.22 100.00 22,149 6.60 100.00 7.9 6.4
ANTIQUES 1,291 0.68 100.00 2,054 0.90 100.00 2,536 0.76 100.00 5.7 5.0
PAINTING 410 0.22 100.00 810 0.35 100.00 955 0.28 100.00 10.1 4.1
PHOTOGRAPHY 725 0.38 100.00 899 0.39 100.00 1,494 0.45 100.00 9.3 11.5
SCULPTURE 3,618 1.91 100.00 5,180 2.27 100.00 6,078 1.81 100.00 5.4 4.2
OTHER 4,286 2.27 100.00 7,557 3.30 100.00 11,087 3.30 100.00 9.9 7.8
SOURCE: UNCTAD secretariat calculations based on United Nations Comtrade database data.
Product group
1996
Value (in millions
of $)
As % oftotal worldexports ofall creative
goods
As % of total worldexports of
the creativegood
2000
Value (in millions
of $)
As % oftotal worldexports ofall creative
goods
As % of total worldexports of
the creativegood
2005
Value (in millions
of $)
As % oftotal worldexports ofall creative
goods
As % of total worldexports of
the creativegood
1996-2005
2000-2005
Growth rate (%)

TA B L E
1.3.1.BCREATIVE GOODS: TOTAL WORLD IMPORTS, BY PRODUCT GROUP, 1996, 2000 AND 2005
253
Sta
tistical
Annex
Part
1
C R E AT I V E E C O N O M Y R E P O R T 2 0 0 8
ALL CREATIVE INDUSTRIES 190,492 100.00 100.00 242,685 100.00 100.00 350,884 100.00 100.00 6.5 8.3
ARTS AND CRAFTS 15,679 8.23 100.00 18,963 7.81 100.00 25,091 7.15 100.00 5.2 6.7
CARPETS 3,523 1.85 100.00 3,492 1.44 100.00 4,033 1.15 100.00 0.7 3.7
CELEBRATION 3,167 1.66 100.00 4,669 1.92 100.00 5,698 1.62 100.00 6.6 4.7
PAPERWARE 67 0.04 100.00 92 0.04 100.00 118 0.03 100.00 8.5 10.9
WICKERWARE 1,296 0.68 100.00 1,293 0.53 100.00 1,786 0.51 100.00 4.8 7.3
YARN 1,975 1.04 100.00 2,450 1.01 100.00 3,884 1.11 100.00 7.2 10.9
OTHER 5,651 2.97 100.00 6,967 2.87 100.00 9,572 2.73 100.00 6.0 7.7
AUDIOVISUALS 333 0.17 100.00 355 0.15 100.00 650 0.19 100.00 9.3 12.7
FILM 333 0.17 100.00 355 0.15 100.00 650 0.19 100.00 9.3 12.7
DESIGN 120,603 63.31 100.00 153,084 63.08 100.00 228,428 65.10 100.00 6.8 9.2
GRAPHIC 8,731 4.58 100.00 10,409 4.29 100.00 17,449 4.97 100.00 7.3 11.8
FASHION 36,138 18.97 100.00 43,255 17.82 100.00 60,792 17.33 100.00 5.7 7.6
GLASSWARE 3,772 1.98 100.00 4,280 1.76 100.00 5,524 1.57 100.00 4.0 6.7
INTERIOR 34,711 18.22 100.00 45,402 18.71 100.00 70,345 20.05 100.00 7.9 10.3
JEWELLERY 13,662 7.17 100.00 18,077 7.45 100.00 31,254 8.91 100.00 9.0 12.6
TOYS 23,588 12.38 100.00 31,660 13.05 100.00 43,064 12.27 100.00 5.7 7.1
MUSIC (CDs, tapes) 4,851 2.55 100.00 9,080 3.74 100.00 16,419 4.68 100.00 15.5 13.4
PRINTED 90 0.05 100.00 84 0.03 100.00 107 0.03 100.00 2.2 5.3
RECORDS 4,761 2.50 100.00 8,995 3.71 100.00 16,312 4.65 100.00 15.7 13.5
NEW MEDIA 6,250 3.28 100.00 8,726 3.60 100.00 13,402 3.82 100.00 6.7 6.9
DIGITAL RECORDS 1,218 0.64 100.00 2,171 0.89 100.00 2,436 0.69 100.00 9.3 3.8
VIDEO GAMES 5,032 2.64 100.00 6,555 2.70 100.00 10,966 3.13 100.00 6.2 7.7
PUBLISHING 31,242 16.40 100.00 34,366 14.16 100.00 45,783 13.05 100.00 3.8 6.2
BOOKS 8,490 4.46 100.00 10,227 4.21 100.00 13,836 3.94 100.00 4.7 6.7
NEWSPAPERS 14,834 7.79 100.00 14,866 6.13 100.00 17,081 4.87 100.00 1.1 2.9
OTHER 7,919 4.16 100.00 9,273 3.82 100.00 14,866 4.24 100.00 7.0 10.3
VISUAL ARTS 11,534 6.05 100.00 18,111 7.46 100.00 21,111 6.02 100.00 5.6 3.1
ANTIQUES 1,659 0.87 100.00 2,726 1.12 100.00 2,617 0.75 100.00 3.0 0.3
PAINTING 519 0.27 100.00 757 0.31 100.00 963 0.27 100.00 6.8 5.5
PHOTOGRAPHY 789 0.41 100.00 1,116 0.46 100.00 1,674 0.48 100.00 8.8 8.8
SCULPTURE 4,122 2.16 100.00 5,291 2.18 100.00 5,691 1.62 100.00 3.5 2.5
OTHER 4,446 2.33 100.00 8,221 3.39 100.00 10,166 2.90 100.00 7.4 3.2
SOURCE: UNCTAD secretariat calculations based on United Nations Comtrade database data.
Product group
1996
Value (in millions
of $)
As % oftotal worldimports ofall creative
goods
As % of total worldimports of
the creativegood
2000
Value (in millions
of $)
As % oftotal worldimports ofall creative
goods
As % of total worldimports of
the creativegood
2005
Value (in millions
of $)
As % oftotal worldimports ofall creative
goods
As % of total worldimports of
the creativegood
1996-2005
2000-2005
Growth rate (%)

TA B L E
1.3.2.A CREATIVE GOODS: EXPORTS BY DEVELOPED ECONOMIES (1), BY PRODUCT GROUP, 1996, 2000 AND 2005
254
Sta
tist
ical
Annex
Part
1
C R E AT I V E E C O N O M Y R E P O R T 2 0 0 8
ALL CREATIVE INDUSTRIES 133,195 100.00 70.39 137,378 100.00 60.07 196,109 100.00 58.45 4.2 7.8
ARTS AND CRAFTS 7,043 5.29 47.79 6,873 5.00 38.82 9,227 4.70 39.70 2.6 7.1
CARPETS 1,751 1.31 60.89 1,479 1.08 42.34 1,588 0.81 38.74 -2.4 2.5
CELEBRATION 553 0.41 20.38 632 0.46 17.53 875 0.45 27.79 4.8 7.2
PAPERWARE 32 0.02 64.69 46 0.03 53.50 30 0.02 48.27 1.4 -6.0
WICKERWARE 149 0.11 14.02 146 0.11 13.39 259 0.13 15.59 7.6 14.5
YARN 1,262 0.95 57.20 1,428 1.04 50.18 1,752 0.89 35.18 2.8 5.0
OTHER 3,296 2.47 56.28 3,142 2.29 46.45 4,723 2.41 49.21 4.4 9.5
AUDIOVISUALS 226 0.17 63.59 285 0.21 75.31 607 0.31 89.20 13.3 18.0
FILM 226 0.17 63.59 285 0.21 75.31 607 0.31 89.20 13.3 18.0
DESIGN 76,778 57.64 64.06 78,566 57.19 53.11 114,025 58.14 51.61 4.3 8.4
GRAPHIC 8,594 6.45 89.18 8,192 5.96 81.21 11,270 5.75 68.43 3.3 7.9
FASHION 17,224 12.93 50.80 17,426 12.68 42.95 28,075 14.32 46.30 5.6 10.5
GLASSWARE 3,744 2.81 85.82 3,556 2.59 76.23 4,238 2.16 69.39 1.4 5.1
INTERIOR 28,981 21.76 80.81 28,849 21.00 62.98 39,219 20.00 57.41 3.1 7.2
JEWELLERY 12,259 9.20 74.95 13,185 9.60 60.04 20,187 10.29 52.27 5.5 8.8
TOYS 5,977 4.49 30.30 7,357 5.36 29.71 11,036 5.63 35.96 6.4 8.7
MUSIC (CDs, tapes) 4,878 3.66 95.50 6,212 4.52 87.74 13,449 6.86 89.94 12.8 17.6
PRINTED 88 0.07 99.05 74 0.05 98.21 116 0.06 96.89 3.1 9.9
RECORDS 4,790 3.60 95.43 6,138 4.47 87.63 13,333 6.80 89.89 12.9 17.7
NEW MEDIA 5,938 4.46 87.25 5,563 4.05 80.20 6,476 3.30 53.77 -0.3 0.5
DIGITAL RECORDS 2,444 1.83 92.95 2,005 1.46 81.00 2,046 1.04 89.64 1.2 -2.5
VIDEO GAMES 3,494 2.62 83.66 3,558 2.59 79.75 4,430 2.26 45.38 -0.5 2.1
PUBLISHING 30,483 22.89 94.71 28,120 20.47 84.22 36,642 18.68 82.60 2.2 5.9
BOOKS 7,846 5.89 89.78 7,636 5.56 77.62 9,713 4.95 75.36 2.1 5.7
NEWSPAPERS 14,437 10.84 98.40 11,859 8.63 89.43 13,654 6.96 88.94 -0.2 3.1
OTHER 8,199 6.16 93.45 8,625 6.28 83.80 13,275 6.77 82.35 5.7 9.5
VISUAL ARTS 7,850 5.89 75.98 11,759 8.56 71.18 15,683 8.00 70.66 7.0 6.0
ANTIQUES 1,227 0.92 95.04 1,956 1.42 95.21 2,352 1.20 92.77 5.5 4.5
PAINTING 192 0.14 46.90 222 0.16 26.96 265 0.13 25.70 2.7 2.7
PHOTOGRAPHY 521 0.39 71.92 564 0.41 62.69 980 0.50 65.52 9.1 13.2
SCULPTURE 1,706 1.28 47.14 1,618 1.18 31.05 1,836 0.94 30.02 0.7 3.7
OTHER 4,203 3.16 98.05 7,399 5.39 97.91 10,251 5.23 92.45 9.1 6.3
SOURCE: UNCTAD secretariat calculations based on United Nations Comtrade database data.NOTE: (1) Developed economies, including Bulgaria and Romania.
Product group
1996
Value (in millions
of $)
As % of totalexports ofcreativegoods bydevelopedeconomies
As % of total worldexports of
the creativegood
2000
Value (in millions
of $)
As % of totalexports ofcreativegoods bydevelopedeconomies
As % of total worldexports of
the creativegood
2005
Value (in millions
of $)
As % of totalexports ofcreativegoods bydevelopedeconomies
As % of total worldexports of
the creativegood
1996-2005
2000-2005
Growth rate (%)

TA B L E
1.3.2.BCREATIVE GOODS: IMPORTS BY DEVELOPED ECONOMIES (1), BY PRODUCT GROUP, 1996, 2000 AND 2005
255
Sta
tistical
Annex
Part
1
C R E AT I V E E C O N O M Y R E P O R T 2 0 0 8
ALL CREATIVE INDUSTRIES 163,356 100.00 85.75 194,994 100.00 80.35 284,147 100.00 80.98 6.1 8.4
ARTS AND CRAFTS 12,687 7.77 80.87 14,764 7.57 77.62 20,280 7.14 80.40 5.2 7.6
CARPETS 3,389 2.07 96.17 3,168 1.62 90.56 3,588 1.26 88.47 -0.1 3.4
CELEBRATION 2,480 1.52 78.31 3,743 1.92 80.13 5,053 1.78 88.54 8.4 6.9
PAPERWARE 53 0.03 77.03 64 0.03 69.72 100 0.04 83.83 9.3 16.5
WICKERWARE 1,112 0.68 85.82 1,121 0.58 86.68 1,645 0.58 91.98 5.9 8.7
YARN 1,695 1.04 85.69 1,900 0.97 77.12 3,189 1.12 81.50 6.7 11.9
OTHER 3,958 2.42 69.99 4,767 2.44 68.06 6,705 2.36 69.52 5.9 8.4
AUDIOVISUALS 255 0.16 76.65 268 0.14 75.55 527 0.19 80.99 9.8 13.9
FILM 255 0.16 76.65 268 0.14 75.55 527 0.19 80.99 9.8 13.9
DESIGN 101,505 62.14 84.12 122,115 62.62 79.52 185,204 65.18 80.57 6.7 9.6
GRAPHIC 7,601 4.65 86.99 8,562 4.39 81.79 14,056 4.95 79.15 6.6 11.3
FASHION 28,583 17.50 79.02 32,643 16.74 75.00 47,184 16.61 76.99 5.7 8.2
GLASSWARE 3,418 2.09 90.57 3,517 1.80 81.96 4,463 1.57 80.10 3.0 6.5
INTERIOR 31,445 19.25 90.56 38,585 19.79 84.78 61,075 21.49 86.28 7.6 10.8
JEWELLERY 12,481 7.64 91.36 14,712 7.54 81.38 24,558 8.64 78.55 7.9 11.6
TOYS 17,976 11.00 76.17 24,095 12.36 75.99 33,869 11.92 78.43 6.2 7.8
MUSIC (CDs, tapes) 4,444 2.72 91.57 7,591 3.89 83.50 13,835 4.87 83.66 14.5 13.7
PRINTED 86 0.05 95.40 75 0.04 89.21 97 0.03 90.69 1.3 6.1
RECORDS 4,359 2.67 91.50 7,515 3.85 83.45 13,738 4.83 83.62 14.7 13.7
NEW MEDIA 5,684 3.48 90.93 6,913 3.54 79.19 10,750 3.78 79.97 5.1 6.1
DIGITAL RECORDS 1,050 0.64 86.16 1,234 0.63 56.79 1,866 0.66 76.53 9.3 10.0
VIDEO GAMES 4,634 2.84 92.08 5,679 2.91 86.60 8,884 3.13 80.73 4.4 5.3
PUBLISHING 28,258 17.30 90.34 27,151 13.92 78.80 34,924 12.29 75.88 2.4 5.6
BOOKS 7,665 4.69 90.25 7,738 3.97 75.55 10,337 3.64 74.48 3.0 6.7
NEWSPAPERS 13,378 8.19 90.03 12,060 6.18 80.94 13,466 4.74 78.50 0.0 2.3
OTHER 7,215 4.42 91.02 7,354 3.77 78.95 11,122 3.91 74.17 5.3 9.3
VISUAL ARTS 10,523 6.44 91.22 16,194 8.30 89.40 18,627 6.56 88.16 5.3 2.7
ANTIQUES 1,617 0.99 97.47 2,531 1.30 92.83 2,448 0.86 93.55 2.7 0.3
PAINTING 461 0.28 88.94 658 0.34 86.89 871 0.31 90.38 6.9 6.4
PHOTOGRAPHY 588 0.36 74.54 714 0.37 63.98 852 0.30 50.82 4.7 4.3
SCULPTURE 3,524 2.16 85.48 4,267 2.19 80.60 4,828 1.70 84.59 3.5 3.6
OTHER 4,331 2.65 97.43 8,024 4.12 97.61 9,628 3.39 94.70 7.1 2.5
SOURCE: UNCTAD secretariat calculations based on United Nations Comtrade database data.NOTE: (1) Developed economies, including Bulgaria and Romania.
Product group
1996
Value (in millions
of $)
As % of totalimports ofcreativegoods bydevelopedeconomies
As % of total worldimports of
the creativegood
2000
Value (in millions
of $)
As % of totalimports ofcreativegoods bydevelopedeconomies
As % of total worldimports of
the creativegood
2005
Value (in millions
of $)
As % of totalimports ofcreativegoods bydevelopedeconomies
As % of total worldimports of
the creativegood
1996-2005
2000-2005
Growth rate (%)

TA B L E
1.3.3.A CREATIVE GOODS: EXPORTS BY DEVELOPING ECONOMIES, BY PRODUCT GROUP, 1996, 2000 AND 2005
256
Sta
tist
ical
Annex
Part
1
C R E AT I V E E C O N O M Y R E P O R T 2 0 0 8
ALL CREATIVE INDUSTRIES 55,997 100.00 29.59 89,827 100.00 39.28 136,231 100.00 40.61 9.0 9.7
ARTS AND CRAFTS 7,690 13.73 52.18 10,756 11.97 60.75 13,881 10.19 59.72 5.5 6.1
CARPETS 1,117 1.99 38.94 1,947 2.17 56.30 2,452 1.80 60.24 5.0 6.7
CELEBRATION 2,158 3.85 79.62 2,936 3.27 82.27 2,234 1.64 71.65 0.8 -4.6
PAPERWARE 17 0.03 35.16 40 0.04 46.36 32 0.02 51.69 9.4 -3.6
WICKERWARE 916 1.64 85.97 906 1.01 85.85 1,374 1.01 83.82 6.8 9.8
YARN 929 1.66 42.38 1,352 1.51 48.57 3,048 2.24 63.38 13.0 18.4
OTHER 2,552 4.56 43.62 3,575 3.98 52.93 4,741 3.48 49.66 5.5 6.5
AUDIOVISUALS 129 0.23 36.41 88 0.10 23.54 55 0.04 8.25 -13.6 -7.9
FILM 129 0.23 36.41 88 0.10 23.54 55 0.04 8.25 -13.6 -7.9
DESIGN 42,914 76.64 35.85 67,613 75.27 46.08 102,413 75.18 46.94 8.7 9.7
GRAPHIC 1,023 1.83 10.63 1,780 1.98 17.67 4,954 3.64 30.17 16.0 23.1
FASHION 16,641 29.72 49.13 22,832 25.42 56.55 31,864 23.39 53.02 7.0 7.6
GLASSWARE 614 1.10 14.09 1,004 1.12 21.91 1,737 1.28 28.87 11.1 12.9
INTERIOR 6,828 12.19 19.07 15,986 17.80 35.44 26,558 19.49 39.88 14.9 12.0
JEWELLERY 4,096 7.31 25.04 8,763 9.75 39.90 17,951 13.18 46.49 14.6 17.6
TOYS 13,712 24.49 69.64 17,248 19.20 70.05 19,350 14.20 63.60 1.8 2.9
MUSIC (CDs, tapes) 222 0.40 4.35 841 0.94 11.89 1,412 1.04 9.46 23.3 12.6
PRINTED 1 0.00 0.95 1 0.00 1.77 4 0.00 3.01 12.5 12.2
RECORDS 221 0.39 4.41 840 0.94 12.00 1,409 1.03 9.51 23.3 12.6
NEW MEDIA 866 1.55 12.73 1,371 1.53 19.77 5,508 4.04 45.77 28.5 33.5
DIGITAL RECORDS 185 0.33 7.02 469 0.52 18.95 230 0.17 10.09 1.6 -13.1
VIDEO GAMES 682 1.22 16.33 902 1.00 20.22 5,278 3.87 54.12 35.3 44.3
PUBLISHING 1,695 3.03 5.27 4,435 4.94 13.29 6,567 4.82 14.82 12.9 8.7
BOOKS 892 1.59 10.21 1,949 2.17 19.82 2,965 2.18 23.02 11.0 9.0
NEWSPAPERS 232 0.41 1.58 911 1.01 6.87 961 0.71 6.27 8.1 0.2
OTHER 570 1.02 6.50 1,575 1.75 15.31 2,641 1.94 16.41 18.8 12.3
VISUAL ARTS 2,481 4.43 24.02 4,722 5.26 28.62 6,395 4.69 28.87 10.2 7.3
ANTIQUES 64 0.11 4.96 98 0.11 4.78 183 0.13 7.21 8.8 12.7
PAINTING 84 0.15 53.10 153 0.17 72.55 833 0.61 72.03 13.8 4.2
PHOTOGRAPHY 218 0.39 28.08 588 0.65 37.18 688 0.50 34.39 9.9 8.2
SCULPTURE 203 0.36 52.85 334 0.37 68.52 514 0.38 68.73 8.1 4.2
OTHER 1,912 3.41 1.95 3,549 3.95 2.02 4,177 3.07 7.52 29.4 49.2
SOURCE: UNCTAD secretariat calculations based on United Nations Comtrade database data.
Product group
1996
Value (in millions
of $)
As % oftotal exportsof creativegoods by
developingeconomies
As % of total worldexports of
the creativegood
2000
Value (in millions
of $)
As % oftotal exportsof creativegoods by
developingeconomies
As % of total worldexports of
the creativegood
2005
Value (in millions
of $)
As % oftotal exportsof creativegoods by
developingeconomies
As % of total worldexports of
the creativegood
1996-2005
2000-2005
Growth rate (%)
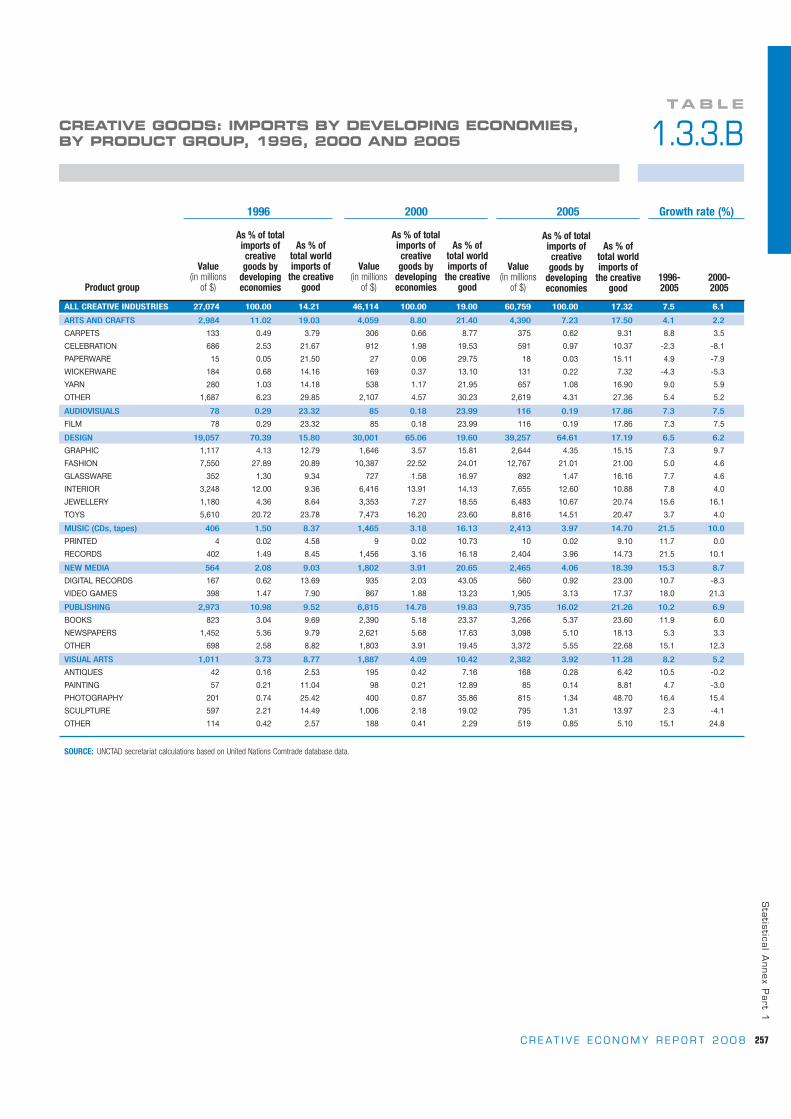
TA B L E
1.3.3.BCREATIVE GOODS: IMPORTS BY DEVELOPING ECONOMIES, BY PRODUCT GROUP, 1996, 2000 AND 2005
257
Sta
tistical
Annex
Part
1
C R E AT I V E E C O N O M Y R E P O R T 2 0 0 8
ALL CREATIVE INDUSTRIES 27,074 100.00 14.21 46,114 100.00 19.00 60,759 100.00 17.32 7.5 6.1
ARTS AND CRAFTS 2,984 11.02 19.03 4,059 8.80 21.40 4,390 7.23 17.50 4.1 2.2
CARPETS 133 0.49 3.79 306 0.66 8.77 375 0.62 9.31 8.8 3.5
CELEBRATION 686 2.53 21.67 912 1.98 19.53 591 0.97 10.37 -2.3 -8.1
PAPERWARE 15 0.05 21.50 27 0.06 29.75 18 0.03 15.11 4.9 -7.9
WICKERWARE 184 0.68 14.16 169 0.37 13.10 131 0.22 7.32 -4.3 -5.3
YARN 280 1.03 14.18 538 1.17 21.95 657 1.08 16.90 9.0 5.9
OTHER 1,687 6.23 29.85 2,107 4.57 30.23 2,619 4.31 27.36 5.4 5.2
AUDIOVISUALS 78 0.29 23.32 85 0.18 23.99 116 0.19 17.86 7.3 7.5
FILM 78 0.29 23.32 85 0.18 23.99 116 0.19 17.86 7.3 7.5
DESIGN 19,057 70.39 15.80 30,001 65.06 19.60 39,257 64.61 17.19 6.5 6.2
GRAPHIC 1,117 4.13 12.79 1,646 3.57 15.81 2,644 4.35 15.15 7.3 9.7
FASHION 7,550 27.89 20.89 10,387 22.52 24.01 12,767 21.01 21.00 5.0 4.6
GLASSWARE 352 1.30 9.34 727 1.58 16.97 892 1.47 16.16 7.7 4.6
INTERIOR 3,248 12.00 9.36 6,416 13.91 14.13 7,655 12.60 10.88 7.8 4.0
JEWELLERY 1,180 4.36 8.64 3,353 7.27 18.55 6,483 10.67 20.74 15.6 16.1
TOYS 5,610 20.72 23.78 7,473 16.20 23.60 8,816 14.51 20.47 3.7 4.0
MUSIC (CDs, tapes) 406 1.50 8.37 1,465 3.18 16.13 2,413 3.97 14.70 21.5 10.0
PRINTED 4 0.02 4.58 9 0.02 10.73 10 0.02 9.10 11.7 0.0
RECORDS 402 1.49 8.45 1,456 3.16 16.18 2,404 3.96 14.73 21.5 10.1
NEW MEDIA 564 2.08 9.03 1,802 3.91 20.65 2,465 4.06 18.39 15.3 8.7
DIGITAL RECORDS 167 0.62 13.69 935 2.03 43.05 560 0.92 23.00 10.7 -8.3
VIDEO GAMES 398 1.47 7.90 867 1.88 13.23 1,905 3.13 17.37 18.0 21.3
PUBLISHING 2,973 10.98 9.52 6,815 14.78 19.83 9,735 16.02 21.26 10.2 6.9
BOOKS 823 3.04 9.69 2,390 5.18 23.37 3,266 5.37 23.60 11.9 6.0
NEWSPAPERS 1,452 5.36 9.79 2,621 5.68 17.63 3,098 5.10 18.13 5.3 3.3
OTHER 698 2.58 8.82 1,803 3.91 19.45 3,372 5.55 22.68 15.1 12.3
VISUAL ARTS 1,011 3.73 8.77 1,887 4.09 10.42 2,382 3.92 11.28 8.2 5.2
ANTIQUES 42 0.16 2.53 195 0.42 7.16 168 0.28 6.42 10.5 -0.2
PAINTING 57 0.21 11.04 98 0.21 12.89 85 0.14 8.81 4.7 -3.0
PHOTOGRAPHY 201 0.74 25.42 400 0.87 35.86 815 1.34 48.70 16.4 15.4
SCULPTURE 597 2.21 14.49 1,006 2.18 19.02 795 1.31 13.97 2.3 -4.1
OTHER 114 0.42 2.57 188 0.41 2.29 519 0.85 5.10 15.1 24.8
SOURCE: UNCTAD secretariat calculations based on United Nations Comtrade database data.
Product group
1996
Value (in millions
of $)
As % of totalimports ofcreativegoods by
developingeconomies
As % of total worldimports of
the creativegood
2000
Value (in millions
of $)
As % of totalimports ofcreativegoods by
developingeconomies
As % of total worldimports of
the creativegood
2005
Value (in millions
of $)
As % of totalimports ofcreativegoods by
developingeconomies
As % of total worldimports of
the creativegood
1996-2005
2000-2005
Growth rate (%)

TA B L E
1.3.4.A CREATIVE GOODS: EXPORTS BY ECONOMIES IN TRANSITION(1), BY PRODUCT GROUP, 1996, 2000 AND 2005
258
Sta
tist
ical
Annex
Part
1
C R E AT I V E E C O N O M Y R E P O R T 2 0 0 8
ALL CREATIVE INDUSTRIES 21 100.00 0.01 1,490 100.00 0.65 3,154 100.00 0.94 39.1 17.0
ARTS AND CRAFTS 5 23.02 0.03 78 4.33 0.44 137 7.74 0.59 29.8 12.2
CARPETS 1 2.42 0.02 33 0.96 0.94 30 1.51 0.74 39.7 -0.3
CELEBRATION 0 0.00 0.00 1 0.29 0.02 9 1.56 0.29 24.2 53.5
PAPERWARE 0 0.09 0.04 0 0.00 0.13 0 0.04 0.01 -23.3 -60.9
WICKERWARE 0 0.52 0.01 4 0.21 0.34 7 0.46 0.41 21.1 14.5
YARN 1 6.49 0.06 4 0.25 0.14 8 1.22 0.17 20.2 11.4
OTHER 3 13.51 0.05 37 2.62 0.54 83 2.95 0.87 31.4 17.9
AUDIOVISUALS 0 0.01 0.00 1 0.07 0.24 2 0.16 0.35 71.4 28.4
FILM 0 0.01 0.00 1 0.07 0.24 2 0.16 0.35 71.4 28.4
DESIGN 13 63.84 0.01 546 55.01 0.37 1,735 64.16 0.80 48.3 29.3
GRAPHIC 0 2.24 0.00 98 6.27 0.97 198 4.40 1.20 55.4 15.3
FASHION 6 28.91 0.02 116 5.10 0.29 161 17.65 0.27 35.5 14.2
GLASSWARE 0 0.00 0.00 23 1.32 0.50 42 2.00 0.69 133.3 13.2
INTERIOR 6 29.39 0.02 278 26.00 0.62 820 19.73 1.23 46.6 25.7
JEWELLERY 0 0.74 0.00 14 15.06 0.06 475 9.60 1.23 103.1 119.7
TOYS 1 2.56 0.00 18 1.27 0.07 40 10.77 0.13 36.4 19.0
MUSIC (CDs, tapes) 0 0.37 0.00 22 2.00 0.31 63 3.09 0.42 46.9 12.2
PRINTED 0 0.00 0.00 0 0.00 0.01 0 0.03 0.10 66.2 48.5
RECORDS 0 0.37 0.00 22 2.00 0.31 63 3.06 0.43 46.9 12.1
NEW MEDIA 0 0.12 0.00 2 1.58 0.02 50 3.03 0.41 74.6 105.8
DIGITAL RECORDS 0 0.05 0.00 1 0.19 0.03 6 1.08 0.26 63.4 54.0
VIDEO GAMES 0 0.07 0.00 1 1.39 0.02 44 1.95 0.45 79.3 131.7
PUBLISHING 3 12.30 0.01 822 34.74 2.46 1,096 14.59 2.47 39.9 5.2
BOOKS 0 0.26 0.00 250 6.45 2.54 203 4.30 1.58 58.7 -4.5
NEWSPAPERS 0 2.14 0.00 483 22.46 3.64 709 5.79 4.62 53.0 6.7
OTHER 2 9.91 0.02 89 5.82 0.87 184 4.50 1.14 23.0 18.4
VISUAL ARTS 0 0.34 0.00 20 2.27 0.12 71 7.22 0.32 55.1 23.5
ANTIQUES 0 0.00 0.00 0 0.02 0.01 0 0.90 0.02 31.5 -15.1
PAINTING 0 0.00 0.00 0 0.08 0.06 2 0.35 0.25 42.5 51.3
PHOTOGRAPHY 0 0.04 0.00 0 0.02 0.05 0 0.39 0.03 9.9 11.2
SCULPTURE 0 0.20 0.00 13 2.06 0.25 65 2.27 1.07 59.3 35.0
OTHER 0 0.10 0.00 5 0.10 0.07 3 3.30 0.03 62.9 -12.7
SOURCE: UNCTAD secretariat calculations based on United Nations Comtrade database data.NOTE: (1) Excluding Bulgaria and Romania, which are included in the European Union (EU-27).
Product group
1996
Value (in millions
of $)
As % oftotal exportsof creativegoods by
economiesin transition
As % of total worldexports of
the creativegood
2000
Value (in millions
of $)
As % oftotal exportsof creativegoods by
economiesin transition
As % of total worldexports of
the creativegood
2005
Value (in millions
of $)
As % oftotal exportsof creativegoods by
economiesin transition
As % of total worldexports of
the creativegood
1996-2005
2000-2005
Growth rate (%)

TA B L E
1.3.4.BCREATIVE GOODS: IMPORTS BY ECONOMIES IN TRANSITION(1), BY PRODUCT GROUP, 1996, 2000 AND 2005
259
Sta
tistical
Annex
Part
1
C R E AT I V E E C O N O M Y R E P O R T 2 0 0 8
ALL CREATIVE INDUSTRIES 63 100.00 0.03 1,576 100.00 0.65 5,978 100.00 1.70 39.7 29.9
ARTS AND CRAFTS 8 12.47 0.05 141 8.94 0.74 421 7.05 1.68 33.3 24.9
CARPETS 1 1.55 0.03 18 1.13 0.51 70 1.17 1.74 32.4 29.2
CELEBRATION 0 0.49 0.01 14 0.91 0.31 54 0.90 0.95 42.0 32.5
PAPERWARE 0 0.05 0.05 0 0.02 0.38 0 0.01 0.26 4.4 -5.3
WICKERWARE 0 0.21 0.01 3 0.16 0.20 11 0.18 0.60 40.9 33.7
YARN 1 0.89 0.03 12 0.74 0.47 38 0.64 0.99 37.1 26.0
OTHER 6 9.28 0.10 94 5.98 1.35 248 4.15 2.59 32.8 22.1
AUDIOVISUALS 0 0.02 0.00 1 0.08 0.37 7 0.12 1.06 70.4 37.9
FILM 0 0.02 0.00 1 0.08 0.37 7 0.12 1.06 70.4 37.9
DESIGN 40 64.56 0.03 968 61.42 0.63 3,967 66.35 1.74 40.8 31.4
GRAPHIC 13 20.78 0.15 202 12.81 1.94 750 12.54 4.30 35.9 30.1
FASHION 5 7.35 0.01 225 14.26 0.52 841 14.07 1.38 47.9 26.7
GLASSWARE 2 3.20 0.05 36 2.30 0.85 168 2.82 3.05 38.0 33.9
INTERIOR 18 28.27 0.05 401 25.44 0.88 1,615 27.02 2.30 40.0 32.1
JEWELLERY 0 0.68 0.00 12 0.79 0.07 213 3.56 0.68 64.5 91.8
TOYS 3 4.29 0.01 92 5.81 0.29 379 6.35 0.88 41.0 30.4
MUSIC (CDs, tapes) 0 0.28 0.00 24 1.54 0.27 171 2.86 1.04 72.0 52.7
PRINTED 0 0.00 0.00 0 0.00 0.03 0 0.00 0.18 22.1 38.7
RECORDS 0 0.28 0.00 24 1.54 0.27 171 2.85 1.05 72.1 52.7
NEW MEDIA 2 3.47 0.03 12 0.74 0.13 187 3.12 1.39 64.1 75.1
DIGITAL RECORDS 1 2.22 0.11 2 0.15 0.11 10 0.16 0.39 24.7 57.0
VIDEO GAMES 1 1.25 0.02 9 0.59 0.14 177 2.96 1.61 81.5 77.9
PUBLISHING 11 18.23 0.04 400 25.38 1.16 1,124 18.80 2.46 35.5 21.9
BOOKS 2 2.51 0.02 99 6.27 0.97 234 3.91 1.69 36.4 16.9
NEWSPAPERS 4 6.75 0.03 185 11.73 1.24 518 8.66 3.03 36.5 21.1
OTHER 6 8.98 0.07 116 7.37 1.25 373 6.24 2.51 35.6 27.5
VISUAL ARTS 1 0.97 0.01 30 1.90 0.17 102 1.71 0.48 51.5 30.0
ANTIQUES 0 0.00 0.00 0 0.02 0.01 1 0.01 0.03 17.8 25.9
PAINTING 0 0.17 0.02 1 0.09 0.20 7 0.11 0.69 38.3 37.2
PHOTOGRAPHY 0 0.15 0.01 2 0.11 0.15 7 0.11 0.41 45.8 25.6
SCULPTURE 0 0.62 0.01 18 1.14 0.34 68 1.14 1.20 53.9 32.5
OTHER 0 0.02 0.00 9 0.54 0.10 20 0.33 0.19 67.2 28.6
SOURCE: UNCTAD secretariat calculations based on United Nations Comtrade database data.NOTE: (1) Excluding Bulgaria and Romania, which are included in the European Union (EU-27).
Product group
1996
Value (in millions
of $)
As % oftotal exportsof creativegoods by
economiesin transition
As % of total worldimports of
the creativegood
2000
Value (in millions
of $)
As % oftotal exportsof creativegoods by
economiesin transition
As % of total worldimports of
the creativegood
2005
Value (in millions
of $)
As % oftotal exportsof creativegoods by
economiesin transition
As % of total worldimports of
the creativegood
1996-2005
2000-2005
Growth rate (%)

TA B L E
1.4.1.A CREATIVE GOODS: TOP 10 WORLD EXPORTERS, BY PRODUCT GROUP, 2005
260
Sta
tist
ical
Annex
Part
1
C R E AT I V E E C O N O M Y R E P O R T 2 0 0 8
ALL CREATIVE INDUSTRIES ARTS AND CRAFTSWorld 335,494 100.00 - 100.00 World 23,244 6.93 - 100.00Developed economies (1) 196,109 100.00 - 58.45 Developed economies (1) 9,118 4.69 - 39.23Developing economies 136,231 100.00 - 40.61 Developing economies 13,881 10.19 - 59.72Economies in transition (2) 3,154 100.00 - 0.94 Economies in transition (2) 137 7.74 - 0.59China 61,360 100.00 - 18.29 China 5,602 9.13 - 24.10Italy 28,008 100.00 - 8.35 China, SAR of Hong Kong 2,266 8.19 - 9.75China, SAR of Hong Kong 27,677 100.00 - 8.25 Belgium 1,381 14.79 - 5.94United States 25,544 100.00 - 7.61 India 1,063 13.04 - 4.57Germany 24,763 100.00 - 7.38 Germany 1,048 4.23 - 4.51United Kingdom 19,030 100.00 - 5.67 United States 977 3.83 - 4.20France 17,706 100.00 - 5.28 Turkey 951 18.72 - 4.09Canada 11,377 100.00 - 3.39 Italy 748 2.67 - 3.22Belgium 9,343 100.00 - 2.78 United Kingdom 685 3.60 - 2.95Spain 9,138 100.00 - 2.72 Pakistan 626 39.59 - 2.69
Carpets CelebrationWorld 4,071 1.21 - 100.00 World 3,118 0.93 - 100.00Developed economies (1) 1,577 0.81 - 38.74 Developed economies (1) 867 0.45 - 27.79Developing economies 2,452 1.80 - 60.24 Developing economies 2,234 1.64 - 71.65Economies in transition (2) 30 1.51 - 0.74 Economies in transition (2) 9 1.56 - 0.29India 756 9.27 - 18.56 China 1,221 1.99 - 39.14Belgium 673 7.20 - 16.53 China, SAR of Hong Kong 726 2.62 - 23.28Iran (Islamic Republic of) 599 63.54 - 14.72 Netherlands 144 1.99 - 4.62China 378 0.62 - 9.27 United States 127 0.50 - 4.06Pakistan 287 18.13 - 7.04 Germany 116 0.47 - 3.72Turkey 238 4.68 - 5.84 Belgium 98 1.05 - 3.15United Kingdom 147 0.77 - 3.61 China, Taiwan Province of 73 2.77 - 2.33Germany 127 0.51 - 3.13 United Kingdom 64 0.34 - 2.05United States 108 0.42 - 2.66 Thailand 58 1.33 - 1.85Saudi Arabia 72 18.19 - 1.77 Philippines 57 6.32 - 1.84
Paperware WickerwareWorld 62 0.02 - 100.00 World 1,640 0.49 - 100.00Developed economies (1) 30 0.02 - 48.27 Developed economies (1) 256 0.13 - 15.59Developing economies 32 0.02 - 51.69 Developing economies 1,374 1.01 - 83.82Economies in transition (2) 0 0.00 - 0.01 Economies in transition (2) 7 0.46 - 0.41India 18 0.21 - 28.42 China 1,125 1.83 - 68.61United States 11 0.04 - 18.28 Philippines 95 10.53 - 5.81France 6 0.04 - 10.36 Indonesia 61 2.15 - 3.71China 3 0.01 - 5.35 Belgium 48 0.52 - 2.95China, Taiwan Province of 3 0.10 - 4.18 China, SAR of Hong Kong 40 0.14 - 2.41United Kingdom 2 0.01 - 4.02 Germany 38 0.15 - 2.29Japan 2 0.04 - 3.36 United States 35 0.14 - 2.14Saudi Arabia 2 0.51 - 3.29 Netherlands 35 0.48 - 2.14Italy 2 0.01 - 2.87 Poland 30 0.71 - 1.81Netherlands 2 0.02 - 2.64 France 12 0.07 - 0.71
Yarn Other arts and craftsWorld 4,808 1.43 - 100.00 World 9,546 2.85 - 100.00Developed economies (1) 1,692 0.87 - 35.18 Developed economies (1) 4,698 2.42 - 49.21Developing economies 3,048 2.24 - 63.38 Developing economies 4,741 3.48 - 49.66Economies in transition (2) 8 1.22 - 0.17 Economies in transition (2) 83 2.95 - 0.87China 1,438 2.34 - 29.90 China 1,438 2.34 - 15.06Turkey 469 9.22 - 9.75 China, SAR of Hong Kong 1,384 5.00 - 14.50Pakistan 334 21.14 - 6.95 Germany 631 2.55 - 6.61Republic of Korea 246 8.36 - 5.12 United States 492 1.92 - 5.15Italy 206 0.74 - 4.29 Belgium 468 5.01 - 4.90United States 204 0.80 - 4.25 Italy 447 1.60 - 4.68France 201 1.14 - 4.18 United Kingdom 420 2.21 - 4.40Austria 149 3.04 - 3.09 Spain 356 3.90 - 3.73Germany 135 0.55 - 2.82 Poland 302 7.16 - 3.16Portugal 126 9.18 - 2.62 Indonesia 281 9.92 - 2.94
AUDIOVISUALS FilmWorld 664 0.20 - 100.00 World 664 0.20 - 100.00Developed economies (1) 592 0.30 - 89.20 Developed economies (1) 592 0.30 - 89.20Developing economies 55 0.04 - 8.25 Developing economies 55 0.04 - 8.25Economies in transition (2) 2 0.16 - 0.35 Economies in transition (2) 2 0.16 - 0.35Canada 318 2.79 - 47.86 Canada 318 2.79 - 47.86Italy 160 0.57 - 24.07 Italy 160 0.57 - 24.07United Kingdom 29 0.15 - 4.37 United Kingdom 29 0.15 - 4.37United States 28 0.11 - 4.25 United States 28 0.11 - 4.25France 21 0.12 - 3.23 France 21 0.12 - 3.23India 16 0.20 - 2.46 India 16 0.20 - 2.46Mexico 11 0.25 - 1.62 Mexico 11 0.25 - 1.62Republic of Korea 10 0.33 - 1.47 Republic of Korea 10 0.33 - 1.47Australia 10 0.92 - 1.47 Australia 10 0.92 - 1.47Romania 9 0.61 - 1.29 Romania 9 0.61 - 1.29
Exporter
As %2005
Value (f.o.b. in
millions of $)of country
total –of world
total Exporter
As %2005
Value (f.o.b. in
millions of $)of country
total –of world
total

TA B L E
1.4.1.A
261
Sta
tistical
Annex
Part
1
C R E AT I V E E C O N O M Y R E P O R T 2 0 0 8
DESIGN GraphicWorld 218,173 65.03 - 100.00 World 16,422 4.89 - 100.00Developed economies (1) 112,595 57.91 - 51.61 Developed economies (1) 11,237 5.78 - 68.43Developing economies 102,413 75.18 - 46.94 Developing economies 4,954 3.64 - 30.17Economies in transition (2) 1,735 64.16 - 0.80 Economies in transition (2) 198 4.40 - 1.20China 47,078 76.72 - 21.58 Italy 5,699 20.35 - 34.70Italy 24,801 88.55 - 11.37 Spain 3,247 35.53 - 19.77China, SAR of Hong Kong 21,817 78.83 - 10.00 China 1,865 3.04 - 11.36France 12,864 72.65 - 5.90 Turkey 942 18.55 - 5.74Germany 12,838 51.84 - 5.88 Brazil 852 38.87 - 5.19United States 11,224 43.94 - 5.14 Germany 516 2.08 - 3.14Spain 6,747 73.83 - 3.09 Mexico 370 8.67 - 2.26United Kingdom 6,632 34.85 - 3.04 Portugal 365 26.61 - 2.22India 6,192 75.93 - 2.84 France 224 1.27 - 1.37Belgium 5,499 58.86 - 2.52 Canada 157 1.38 - 0.96
Fashion GlasswareWorld 60,100 17.91 - 100.00 World 6,016 1.79 - 100.00Developed economies (1) 27,825 14.31 - 46.30 Developed economies (1) 4,175 2.15 - 69.39Developing economies 31,864 23.39 - 53.02 Developing economies 1,737 1.28 - 28.87Economies in transition (2) 161 17.65 - 0.27 Economies in transition (2) 42 2.00 - 0.69China 17,524 28.56 - 29.16 France 943 5.33 - 15.68China, SAR of Hong Kong 7,845 28.34 - 13.05 China 854 1.39 - 14.20Italy 7,277 25.98 - 12.11 Germany 567 2.29 - 9.42France 7,217 40.76 - 12.01 Italy 395 1.41 - 6.56Germany 2,767 11.17 - 4.60 Czech Republic 341 12.35 - 5.66United States 2,351 9.20 - 3.91 Turkey 304 5.99 - 5.06United Kingdom 1,586 8.33 - 2.64 Poland 278 6.59 - 4.62India 1,523 18.67 - 2.53 Switzerland 220 3.63 - 3.65Belgium 1,378 14.75 - 2.29 United States 201 0.79 - 3.35Spain 1,182 12.93 - 1.97 Austria 166 3.41 - 2.76
Interior JewelleryWorld 66,597 19.85 - 100.00 World 38,612 11.51 - 100.00Developed economies (1) 38,235 19.66 - 57.41 Developed economies (1) 20,183 10.38 - 52.27Developing economies 26,558 19.49 - 39.88 Developing economies 17,951 13.18 - 46.49Economies in transition (2) 820 19.73 - 1.23 Economies in transition (2) 475 9.60 - 1.23China 14,525 23.67 - 21.81 Italy 5,087 18.16 - 13.17Germany 5,871 23.71 - 8.82 United States 4,321 16.92 - 11.19Italy 5,842 20.86 - 8.77 China, SAR of Hong Kong 4,275 15.45 - 11.07United States 3,084 12.07 - 4.63 India 3,821 46.86 - 9.90Belgium 2,873 30.76 - 4.31 China 2,819 4.59 - 7.30Canada 2,632 23.13 - 3.95 Switzerland 2,694 44.51 - 6.98France 2,461 13.90 - 3.70 United Kingdom 2,671 14.03 - 6.92Poland 2,207 52.37 - 3.31 Thailand 1,809 41.86 - 4.69Denmark 1,929 55.93 - 2.90 France 1,398 7.90 - 3.62Netherlands 1,795 24.76 - 2.70 Germany 1,180 4.76 - 3.06
Toys MUSIC (CDS, TAPES, PRINTED)World 30,425 9.07 - 100.00 World 14,924 4.45 - 100.00Developed economies (1) 10,941 5.63 - 35.96 Developed economies (1) 13,424 6.90 - 89.94Developing economies 19,350 14.20 - 63.60 Developing economies 1,412 1.04 - 9.46Economies in transition (2) 40 10.77 - 0.13 Economies in transition (2) 63 3.09 - 0.42China 9,490 15.47 - 31.19 Germany 3,481 14.06 - 23.32China, SAR of Hong Kong 8,293 29.96 - 27.26 United Kingdom 1,596 8.39 - 10.70Japan 2,636 47.53 - 8.67 United States 1,491 5.84 - 9.99Germany 1,937 7.82 - 6.37 Austria 1,347 27.58 - 9.02United States 1,159 4.54 - 3.81 Netherlands 1,325 18.28 - 8.88France 620 3.50 - 2.04 Ireland 801 35.22 - 5.37Netherlands 613 8.45 - 2.01 France 644 3.64 - 4.32Belgium 607 6.50 - 2.00 Canada 376 3.30 - 2.52United Kingdom 589 3.09 - 1.94 Sweden 347 10.12 - 2.32Italy 502 1.79 - 1.65 Belgium 313 3.34 - 2.09
Records PrintedWorld 14,805 4.41 - 100.00 World 119 0.04 - 100.00Developed economies (1) 13,308 6.84 - 89.89 Developed economies (1) 116 0.06 - 96.89Developing economies 1,409 1.03 - 9.51 Developing economies 4 0.00 - 3.01Economies in transition (2) 63 3.06 - 0.43 Economies in transition (2) 0 0.00 - 0.10Germany 3,449 13.93 - 23.30 United States 35 0.14 - 29.47United Kingdom 1,575 8.27 - 10.64 Germany 32 0.13 - 26.53United States 1,455 5.70 - 9.83 United Kingdom 22 0.11 - 18.17Austria 1,340 27.45 - 9.05 Italy 8 0.03 - 7.05Netherlands 1,324 18.26 - 8.94 Austria 6 0.13 - 5.29Ireland 801 35.22 - 5.41 France 5 0.03 - 4.59France 639 3.61 - 4.32 China, SAR of Hong Kong 3 0.01 - 2.43Canada 375 3.30 - 2.54 Australia 2 0.16 - 1.44Sweden 347 10.12 - 2.34 Switzerland 1 0.02 - 1.12Belgium 312 3.34 - 2.11 Japan 1 0.02 - 0.93
Exporter
As %2005
Value (f.o.b. in
millions of $)of country
total –of world
total Exporter
As %2005
Value (f.o.b. in
millions of $)of country
total –of world
total

TA B L E
1.4.1.A CREATIVE GOODS: TOP 10 WORLD EXPORTERS, BY PRODUCT GROUP, 2005
262
Sta
tist
ical
Annex
Part
1
C R E AT I V E E C O N O M Y R E P O R T 2 0 0 8
NEW MEDIA Digital recordsWorld 12,035 3.59 - 100.00 World 2,282 0.68 - 100.00Developed economies (1) 6,471 3.33 - 53.77 Developed economies (1) 2,046 1.05 - 89.64Developing economies 5,508 4.04 - 45.77 Developing economies 230 0.17 - 10.09Economies in transition (2) 50 3.03 - 0.41 Economies in transition (2) 6 0.13 - 0.27China 3,940 6.42 - 32.74 Ireland 670 29.47 - 29.37United States 1,805 7.07 - 15.00 United States 465 1.82 - 20.39China, SAR of Hong Kong 1,020 3.68 - 8.47 United Kingdom 225 1.18 - 9.87Ireland 698 30.69 - 5.80 Germany 151 0.61 - 6.61Germany 691 2.79 - 5.74 Netherlands 122 1.68 - 5.32United Kingdom 600 3.15 - 4.98 Belgium 92 0.98 - 4.02Austria 579 11.86 - 4.81 Republic of Korea 86 2.94 - 3.79Netherlands 330 4.55 - 2.74 France 77 0.43 - 3.36Australia 290 27.55 - 2.41 Austria 69 1.41 - 3.02Japan 235 4.23 - 1.95 Japan 50 0.89 - 2.17
Video games PUBLISHINGWorld 9,752 2.91 - 100.00 World 44,304 13.21 - 100.00Developed economies (1) 4,426 2.28 - 45.38 Developed economies (1) 36,593 18.82 - 82.60Developing economies 5,278 3.87 - 54.12 Developing economies 6,567 4.82 - 14.82Economies in transition (2) 44 1.95 - 0.45 Economies in transition (2) 1,096 14.59 - 2.47China 3,916 6.38 - 40.15 Canada 5,965 52.43 - 13.46United States 1,340 5.24 - 13.74 Germany 5,894 23.80 - 13.30China, SAR of Hong Kong 1,020 3.68 - 10.46 United States 5,496 21.51 - 12.40Germany 540 2.18 - 5.54 United Kingdom 4,134 21.73 - 9.33Austria 510 10.45 - 5.23 France 2,490 14.06 - 5.62United Kingdom 374 1.97 - 3.84 Italy 1,676 5.98 - 3.78Australia 281 26.62 - 2.88 Belgium 1,552 16.61 - 3.50Netherlands 209 2.88 - 2.14 China, SAR of Hong Kong 1,552 5.61 - 3.50Japan 185 3.33 - 1.90 Spain 1,327 14.52 - 2.99Spain 173 1.89 - 1.77 Sweden 1,225 35.75 - 2.77
Books NewspapersWorld 12,881 3.84 - 100.00 World 15,324 4.57 - 100.00Developed economies (1) 9,707 4.99 - 75.36 Developed economies (1) 13,629 7.01 - 88.94Developing economies 2,965 2.18 - 23.02 Developing economies 961 0.71 - 6.27Economies in transition (2) 203 4.30 - 1.58 Economies in transition (2) 709 5.79 - 4.62United States 2,033 7.96 - 15.79 Canada 4,534 39.85 - 29.59United Kingdom 2,017 10.60 - 15.66 Germany 1,771 7.15 - 11.56Germany 1,297 5.24 - 10.07 United States 1,570 6.15 - 10.24China, SAR of Hong Kong 1,104 3.99 - 8.57 United Kingdom 979 5.15 - 6.39Spain 773 8.46 - 6.00 Sweden 966 28.18 - 6.30China 680 1.11 - 5.28 France 940 5.31 - 6.13France 647 3.65 - 5.02 Russian Federation 635 38.49 - 4.14Italy 541 1.93 - 4.20 Finland 394 37.76 - 2.57Singapore 442 14.43 - 3.43 Netherlands 376 5.19 - 2.45Belgium 403 4.31 - 3.13 Belgium 351 3.76 - 2.29
Other publishing VISUAL ARTSWorld 16,099 4.80 - 100.00 World 22,149 6.60 - 100.00Developed economies (1) 13,257 6.82 - 82.35 Developed economies (1) 15,651 8.05 - 70.66Developing economies 2,641 1.94 - 16.41 Developing economies 6,395 4.69 - 28.87Economies in transition (2) 184 4.50 - 1.14 Economies in transition (2) 71 7.22 - 0.32Germany 2,826 11.41 - 17.55 United Kingdom 5,354 28.13 - 24.17United States 1,892 7.41 - 11.75 United States 4,523 17.71 - 20.42United Kingdom 1,138 5.98 - 7.07 China 3,459 5.64 - 15.62Canada 1,062 9.33 - 6.60 France 1,019 5.76 - 4.60France 903 5.10 - 5.61 China, SAR of Hong Kong 839 3.03 - 3.79Italy 889 3.17 - 5.52 Germany 803 3.24 - 3.62Belgium 798 8.54 - 4.96 Switzerland 785 12.97 - 3.54Netherlands 595 8.21 - 3.70 Japan 598 10.78 - 2.70Czech Republic 546 19.81 - 3.39 Canada 512 4.50 - 2.31China 447 0.73 - 2.78 India 503 6.17 - 2.27
Painting PhotographyWorld 955 0.28 - 100.00 World 1,494 0.45 - 100.00Developed economies (1) 245 0.13 - 25.70 Developed economies (1) 979 0.50 - 65.52Developing economies 688 0.50 - 72.03 Developing economies 514 0.38 - 34.39Economies in transition (2) 2 0.35 - 0.25 Economies in transition (2) 0 0.39 - 0.03China 305 0.50 - 31.98 Japan 519 9.36 - 34.74Thailand 94 2.17 - 9.83 China, SAR of Hong Kong 160 0.58 - 10.74Indonesia 83 2.92 - 8.66 China 139 0.23 - 9.31Italy 65 0.23 - 6.76 United States 110 0.43 - 7.36China, SAR of Hong Kong 63 0.23 - 6.65 China, Taiwan Province of 108 4.13 - 7.25Mexico 57 1.35 - 6.02 Germany 89 0.36 - 5.97Belgium 34 0.36 - 3.55 United Kingdom 89 0.47 - 5.94Malaysia 34 1.04 - 3.51 Republic of Korea 54 1.85 - 3.64United States 29 0.11 - 3.06 France 45 0.26 - 3.02Poland 24 0.57 - 2.53 Singapore 28 0.92 - 1.88
Exporter
As %2005
Value (f.o.b. in
millions of $)of country
total –of world
total Exporter
As %2005
Value (f.o.b. in
millions of $)of country
total –of world
total
CONTINUED

TA B L E
1.4.1.A
263
Sta
tistical
Annex
Part
1
C R E AT I V E E C O N O M Y R E P O R T 2 0 0 8
Sculpture AntiquesWorld 6,078 1.81 - 100.00 World 2,536 0.76 - 100.00Developed economies (1) 1,825 0.94 - 30.02 Developed economies (1) 2,352 1.21 - 92.77Developing economies 4,177 3.07 - 68.73 Developing economies 183 0.13 - 7.21Economies in transition (2) 65 2.27 - 1.07 Economies in transition (2) 0 0.01 - 0.02China 2,972 4.84 - 48.90 United Kingdom 1,404 7.38 - 55.36China, SAR of Hong Kong 406 1.47 - 6.68 United States 338 1.32 - 13.35Belgium 265 2.83 - 4.35 France 246 1.39 - 9.70Germany 232 0.94 - 3.82 China, SAR of Hong Kong 169 0.61 - 6.67Italy 189 0.67 - 3.11 Switzerland 142 2.34 - 5.58Spain 173 1.89 - 2.84 Germany 62 0.25 - 2.46United States 167 0.65 - 2.74 Belgium 40 0.43 - 1.58Netherlands 159 2.20 - 2.62 Netherlands 18 0.25 - 0.72France 137 0.77 - 2.26 Canada 17 0.15 - 0.68Mexico 124 2.90 - 2.04 Denmark 17 0.48 - 0.65
Other visual artWorld 11,087 3.30 - 100.00Developed economies (1) 10,250 5.27 - 92.45Developing economies 833 0.61 - 7.52Economies in transition (2) 3 3.30 - 0.03United States 3,878 15.18 - 34.98United Kingdom 3,757 19.74 - 33.89Switzerland 625 10.32 - 5.63France 580 3.28 - 5.24India 459 5.63 - 4.14Canada 435 3.82 - 3.92Germany 410 1.65 - 3.69Republic of Korea 173 5.87 - 1.56Italy 135 0.48 - 1.22Austria 67 1.37 - 0.61
SOURCE: UNCTAD secretariat calculations based on United Nations Comtrade database data.NOTES: (1) Developed economies, including Bulgaria and Romania.
(2) Excluding Bulgaria and Romania, which are included in the European Union (EU-27).
Exporter
As %2005
Value (f.o.b. in
millions of $)of country
total –of world
total Exporter
As %2005
Value (f.o.b. in
millions of $)of country
total –of world
total

TA B L E
1.4.1.B CREATIVE GOODS: TOP 10 WORLD IMPORTERS, BY PRODUCT GROUP, 2005
264
Sta
tist
ical
Annex
Part
1
C R E AT I V E E C O N O M Y R E P O R T 2 0 0 8
ALL CREATIVE INDUSTRIES ARTS AND CRAFTSWorld 350,884 100.00 - 100.00 World 25,091 7.15 - 100.00Developed economies (1) 284,147 100.00 - 80.53 Developed economies (1) 20,174 7.14 - 80.40Developing economies 60,759 100.00 - 17.32 Developing economies 4,390 7.23 - 17.50Economies in transition (2) 5,978 100.00 - 1.70 Economies in transition (2) 421 7.05 - 1.68United States 95,021 100.00 - 27.08 United States 7,598 8.00 - 30.28United Kingdom 28,212 100.00 - 8.04 Germany 1,911 7.83 - 7.62Germany 24,418 100.00 - 6.96 China, SAR of Hong Kong 1,677 7.94 - 6.68China, SAR of Hong Kong 21,136 100.00 - 6.02 United Kingdom 1,589 5.63 - 6.33France 18,717 100.00 - 5.33 France 1,226 6.55 - 4.89Japan 18,592 100.00 - 5.30 Japan 979 5.27 - 3.90Canada 12,094 100.00 - 3.45 Italy 917 8.78 - 3.65Italy 10,448 100.00 - 2.98 Canada 828 6.84 - 3.30Switzerland 9,655 100.00 - 2.75 Belgium 613 7.59 - 2.44Spain 8,903 100.00 - 2.54 Spain 545 6.12 - 2.17
Carpets CelebrationWorld 4,033 1.15 - 100.00 World 5,698 1.62 - 100.00Developed economies (1) 3,568 1.26 - 88.47 Developed economies (1) 5,045 1.79 - 88.54Developing economies 375 0.62 - 9.31 Developing economies 591 0.97 - 10.37Economies in transition (2) 70 1.17 - 1.74 Economies in transition (2) 54 0.90 - 0.95United States 1,327 1.40 - 32.91 United States 3,099 3.26 - 54.39Germany 482 1.97 - 11.95 China, SAR of Hong Kong 372 1.76 - 6.53United Kingdom 289 1.03 - 7.17 United Kingdom 344 1.22 - 6.04Japan 235 1.26 - 5.83 Canada 256 2.11 - 4.49Italy 164 1.57 - 4.08 Germany 213 0.87 - 3.74France 149 0.80 - 3.70 France 193 1.03 - 3.38Switzerland 83 0.86 - 2.07 Italy 147 1.41 - 2.59Canada 89 0.74 - 2.22 Belgium 122 1.51 - 2.13Saudi Arabia 78 3.98 - 1.93 Netherlands 92 1.26 - 1.62Spain 77 0.87 - 1.92 Spain 73 0.83 - 1.29
Paperware WickerwareWorld 118 0.03 - 100.00 World 1,786 0.51 - 100.00Developed economies (1) 99 0.04 - 83.83 Developed economies (1) 1,643 0.58 - 91.98Developing economies 18 0.03 - 15.11 Developing economies 131 0.22 - 7.32Economies in transition (2) 0 0.01 - 0.26 Economies in transition (2) 11 0.18 - 0.60France 55 0.29 - 46.26 Canada 44 0.36 - 2.45Japan 17 0.09 - 14.05 United States 547 0.58 - 30.63Netherlands 5 0.07 - 4.60 Japan 298 1.60 - 16.70United Kingdom 3 0.01 - 2.83 Germany 157 0.64 - 8.78United States 3 0.00 - 2.60 France 99 0.53 - 5.54Ireland 3 0.13 - 2.57 United Kingdom 89 0.31 - 4.97Republic of Korea 2 0.08 - 2.06 Italy 68 0.65 - 3.78Oman 2 0.89 - 1.94 Spain 65 0.73 - 3.64Belgium 2 0.03 - 1.92 Netherlands 51 0.70 - 2.88Italy 2 0.02 - 1.72 Belgium 51 0.63 - 2.87
Yarn Other arts and craftsWorld 3,884 1.11 - 100.00 World 9,572 2.73 - 100.00Developed economies (1) 3,166 1.12 - 81.50 Developed economies (1) 6,654 2.35 - 69.52Developing economies 657 1.08 - 16.90 Developing economies 2,619 4.31 - 27.36Economies in transition (2) 38 0.64 - 0.99 Economies in transition (2) 248 4.15 - 2.59United States 775 0.82 - 19.95 United States 1,847 1.94 - 19.29Germany 349 1.43 - 8.99 China, SAR of Hong Kong 1,169 5.53 - 12.21France 335 1.79 - 8.61 Germany 709 2.91 - 7.41United Kingdom 252 0.89 - 6.48 United Kingdom 612 2.17 - 6.39Italy 173 1.65 - 4.45 France 396 2.12 - 4.14Spain 153 1.72 - 3.94 Italy 363 3.47 - 3.79Mexico 150 3.24 - 3.85 Canada 344 2.85 - 3.60Belgium 131 1.62 - 3.38 China 327 8.90 - 3.42Japan 127 0.68 - 3.28 Japan 251 1.35 - 2.62Australia 109 2.00 - 2.82 Belgium 239 2.96 - 2.50
AUDIOVISUALS FilmWorld 650 0.19 - 100.00 World 650 0.19 - 100.00Developed economies (1) 526 0.19 - 80.99 Developed economies (1) 526 0.19 - 80.99Developing economies 116 0.19 - 17.86 Developing economies 116 0.19 - 17.86Economies in transition (2) 7 0.12 - 1.06 Economies in transition (2) 7 0.12 - 1.06United States 358 0.38 - 55.09 United States 358 0.38 - 55.09Republic of Korea 60 1.84 - 9.19 Republic of Korea 60 1.84 - 9.19France 33 0.18 - 5.07 France 33 0.18 - 5.07Spain 22 0.25 - 3.43 Spain 22 0.25 - 3.43United Kingdom 21 0.07 - 3.21 United Kingdom 21 0.07 - 3.21Japan 19 0.10 - 2.90 Japan 19 0.10 - 2.90Germany 14 0.06 - 2.16 Germany 14 0.06 - 2.16Australia 9 0.16 - 1.38 Australia 9 0.16 - 1.38Turkey 9 0.38 - 1.33 Turkey 9 0.38 - 1.33Austria 8 0.15 - 1.29 Austria 8 0.15 - 1.29
Importer
As %2005
Value (c.i.f. in
millions of $)of country
total –of world
total Importer
As %2005
Value (c.i.f. in
millions of $)of country
total –of world
total

TA B L E
1.4.1.B
265
Sta
tistical
Annex
Part
1
C R E AT I V E E C O N O M Y R E P O R T 2 0 0 8
DESIGN GraphicWorld 228,428 65.10 - 100.00 World 17,449 4.97 - 100.00Developed economies (1) 184,052 65.14 - 80.57 Developed economies (1) 13,810 4.89 - 79.15Developing economies 39,257 64.61 - 17.19 Developing economies 2,644 4.35 - 15.15Economies in transition (2) 3,967 66.35 - 1.74 Economies in transition (2) 750 12.54 - 4.30United States 66,603 70.09 - 29.16 United States 5,214 5.49 - 29.88United Kingdom 16,695 59.18 - 7.31 France 1,415 7.56 - 8.11China, SAR of Hong Kong 16,315 77.19 - 7.14 Germany 1,087 4.45 - 6.23Germany 15,059 61.67 - 6.59 Japan 942 5.07 - 5.40Japan 14,705 79.09 - 6.44 United Kingdom 924 3.27 - 5.29France 12,527 66.93 - 5.48 Belgium 396 4.90 - 2.27Italy 6,713 64.25 - 2.94 Switzerland 359 3.72 - 2.06Canada 6,422 53.10 - 2.81 Saudi Arabia 342 17.50 - 1.96Spain 5,956 66.90 - 2.61 Canada 313 2.59 - 1.80Switzerland 5,219 54.06 - 2.28 Australia 286 5.23 - 1.64
Fashion GlasswareWorld 60,792 17.33 - 100.00 World 5,524 1.57 - 100.00Developed economies (1) 46,802 16.56 - 76.99 Developed economies (1) 4,425 1.57 - 80.10Developing economies 12,767 21.01 - 21.00 Developing economies 892 1.47 - 16.16Economies in transition (2) 841 14.07 - 1.38 Economies in transition (2) 168 2.82 - 3.04United States 14,656 15.42 - 24.11 United States 1,006 1.06 - 18.21China, SAR of Hong Kong 6,070 28.72 - 9.99 Germany 478 1.96 - 8.65Japan 5,837 31.39 - 9.60 United Kingdom 340 1.21 - 6.16Germany 4,043 16.56 - 6.65 France 302 1.62 - 5.47United Kingdom 3,591 12.73 - 5.91 Italy 259 2.48 - 4.68France 3,262 17.43 - 5.37 Canada 229 1.89 - 4.15Italy 2,726 26.09 - 4.48 Spain 217 2.44 - 3.93Spain 2,114 23.75 - 3.48 Japan 216 1.16 - 3.90Belgium 1,335 16.52 - 2.20 Switzerland 171 1.77 - 3.10Canada 1,324 10.95 - 2.18 Netherlands 151 2.06 - 2.73
Interior JewelleryWorld 70,345 20.05 - 100.00 World 31,254 8.91 - 100.00Developed economies (1) 60,693 21.48 - 86.28 Developed economies (1) 24,549 8.69 - 78.55Developing economies 7,655 12.60 - 10.88 Developing economies 6,483 10.67 - 20.74Economies in transition (2) 1,615 27.02 - 2.30 Economies in transition (2) 213 3.56 - 0.68United States 21,388 22.51 - 30.40 United States 9,858 10.37 - 31.54United Kingdom 5,335 18.91 - 7.58 United Kingdom 3,732 13.23 - 11.94Germany 5,300 21.70 - 7.53 China, SAR of Hong Kong 2,641 12.50 - 8.45France 4,243 22.67 - 6.03 Japan 1,885 10.14 - 6.03Japan 2,945 15.84 - 4.19 Switzerland 1,675 17.35 - 5.36Canada 2,688 22.22 - 3.82 France 1,444 7.71 - 4.62Netherlands 1,934 26.45 - 2.75 Germany 1,219 4.99 - 3.90Spain 1,868 20.98 - 2.66 Singapore 1,155 31.05 - 3.69Belgium 1,855 22.97 - 2.64 Italy 833 7.97 - 2.66Switzerland 1,601 16.58 - 2.28 Canada 599 4.95 - 1.92
Toys MUSICWorld 43,064 12.27 - 100.00 World 16,419 4.68 - 100.00Developed economies (1) 33,773 11.95 - 78.43 Developed economies (1) 13,737 4.86 - 83.66Developing economies 8,816 14.51 - 20.47 Developing economies 2,413 3.97 - 14.70Economies in transition (2) 379 6.35 - 0.88 Economies in transition (2) 171 2.86 - 1.04United States 14,481 15.24 - 33.63 Germany 2,376 9.73 - 14.47China, SAR of Hong Kong 6,004 28.40 - 13.94 United Kingdom 1,689 5.99 - 10.29Germany 2,932 12.01 - 6.81 United States 1,244 1.31 - 7.57Japan 2,881 15.50 - 6.69 China 1,052 28.61 - 6.41United Kingdom 2,773 9.83 - 6.44 France 1,003 5.36 - 6.11France 1,860 9.94 - 4.32 Canada 742 6.14 - 4.52Canada 1,269 10.49 - 2.95 Switzerland 732 7.58 - 4.46Italy 1,093 10.46 - 2.54 Italy 719 6.88 - 4.38Spain 971 10.90 - 2.25 Belgium 655 8.11 - 3.99Belgium 847 10.48 - 1.97 Netherlands 618 8.46 - 3.77
Records PrintedWorld 16,312 4.65 - 100.00 World 107 0.03 - 100.00Developed economies (1) 13,639 4.83 - 83.62 Developed economies (1) 97 0.03 - 90.69Developing economies 2,404 3.96 - 14.73 Developing economies 10 0.02 - 9.10Economies in transition (2) 171 2.85 - 1.05 Economies in transition (2) 0 0.00 - 0.21Germany 2,368 9.70 - 14.52 United Kingdom 17 0.06 - 15.79United Kingdom 1,672 5.93 - 10.25 Canada 13 0.10 - 11.68United States 1,233 1.30 - 7.56 United States 11 0.01 - 9.80China 1,052 28.61 - 6.45 Austria 8 0.15 - 7.64France 995 5.31 - 6.10 Germany 8 0.03 - 7.52Canada 730 6.04 - 4.47 France 8 0.04 - 7.41Switzerland 727 7.53 - 4.46 Japan 7 0.04 - 6.27Italy 715 6.85 - 4.38 Switzerland 5 0.05 - 4.47Belgium 653 8.08 - 4.00 Australia 5 0.08 - 4.26Netherlands 615 8.42 - 3.77 Italy 4 0.03 - 3.38
Importer
As %2005
Value (c.i.f. in
millions of $)of country
total –of world
total Importer
As %2005
Value (c.i.f. in
millions of $)of country
total –of world
total

TA B L E
1.4.1.B CREATIVE GOODS: TOP 10 WORLD IMPORTERS, BY PRODUCT GROUP, 2005
266
Sta
tist
ical
Annex
Part
1
C R E AT I V E E C O N O M Y R E P O R T 2 0 0 8
NEW MEDIA Digital recordsWorld 13,402 3.82 - 100.00 World 2,436 0.69 - 100.00Developed economies (1) 10,718 3.79 - 79.97 Developed economies (1) 1,865 0.66 - 76.53Developing economies 2,465 4.06 - 18.39 Developing economies 560 0.92 - 23.00Economies in transition (2) 187 3.12 - 1.39 Economies in transition (2) 10 0.15 - 0.39United States 3,183 3.35 - 23.75 Italy 518 4.96 - 21.25Germany 1,084 4.44 - 8.09 United Kingdom 203 0.72 - 8.34China, SAR of Hong Kong 1,015 4.80 - 7.58 Germany 184 0.75 - 7.56United Kingdom 905 3.21 - 6.75 France 167 0.89 - 6.86Canada 845 6.98 - 6.30 Turkey 140 6.15 - 5.75Italy 680 6.51 - 5.08 Greece 122 4.53 - 5.02Japan 581 3.12 - 4.33 China, Taiwan Province of 101 4.25 - 4.16France 521 2.78 - 3.88 Netherlands 93 1.27 - 3.81Spain 510 5.72 - 3.80 United States 84 0.09 - 3.43Austria 361 6.45 - 2.69 Belgium 66 0.81 - 2.69
Video games PUBLISHINGWorld 10,966 3.13 - 100.00 World 45,783 13.05 - 100.00Developed economies (1) 8,853 3.12 - 80.73 Developed economies (1) 34,740 12.29 - 75.88Developing economies 1,905 3.13 - 17.37 Developing economies 9,735 16.02 - 21.26Economies in transition (2) 177 2.96 - 1.61 Economies in transition (2) 1,124 18.80 - 2.46United States 3,100 3.26 - 28.27 United States 8,134 8.56 - 17.77China, SAR of Hong Kong 1,015 4.80 - 9.26 United Kingdom 3,669 13.01 - 8.01Germany 900 3.68 - 8.20 Germany 3,008 12.32 - 6.57Canada 791 6.54 - 7.21 Canada 2,839 23.47 - 6.20United Kingdom 701 2.49 - 6.40 France 2,638 14.09 - 5.76Japan 563 3.03 - 5.13 Switzerland 1,716 17.78 - 3.75Spain 454 5.10 - 4.14 Belgium 1,378 17.06 - 3.01France 353 1.89 - 3.22 China, SAR of Hong Kong 1,141 5.40 - 2.49Austria 308 5.51 - 2.81 Japan 1,112 5.98 - 2.43Netherlands 266 3.64 - 2.42 Italy 1,088 10.41 - 2.38
Books NewspapersWorld 13,836 3.94 - 100.00 World 17,081 4.87 - 100.00Developed economies (1) 10,305 3.65 - 74.48 Developed economies (1) 13,409 4.75 - 78.50Developing economies 3,266 5.37 - 23.60 Developing economies 3,098 5.10 - 18.13Economies in transition (2) 234 3.91 - 1.69 Economies in transition (2) 518 8.66 - 3.03United States 2,390 2.52 - 17.28 United States 3,621 3.81 - 21.20United Kingdom 1,241 4.40 - 8.97 Germany 1,237 5.06 - 7.24Canada 1,187 9.81 - 8.58 United Kingdom 1,231 4.36 - 7.21France 717 3.83 - 5.18 Canada 1,005 8.31 - 5.88China, SAR of Hong Kong 666 3.15 - 4.81 France 910 4.86 - 5.32Germany 632 2.59 - 4.57 Italy 639 6.12 - 3.74Switzerland 545 5.64 - 3.94 Belgium 528 6.54 - 3.09Austria 463 8.27 - 3.34 Spain 514 5.77 - 3.01Belgium 431 5.34 - 3.12 Switzerland 465 4.81 - 2.72Australia 414 7.57 - 2.99 India 443 27.05 - 2.59
Other publishing VISUAL ARTSWorld 14,866 4.24 - 100.00 World 21,111 6.02 - 100.00Developed economies (1) 11,027 3.90 - 74.17 Developed economies (1) 18,610 6.59 - 88.16Developing economies 3,372 5.55 - 22.68 Developing economies 2,382 3.92 - 11.28Economies in transition (2) 373 6.24 - 2.51 Economies in transition (2) 102 1.71 - 0.48United States 2,122 2.23 - 14.27 United States 7,902 8.32 - 37.43United Kingdom 1,197 4.24 - 8.05 United Kingdom 3,645 12.92 - 17.26Germany 1,139 4.67 - 7.66 Switzerland 1,575 16.31 - 7.46France 1,012 5.40 - 6.80 Germany 966 3.96 - 4.57Switzerland 707 7.32 - 4.75 China, SAR of Hong Kong 835 3.95 - 3.96Canada 647 5.35 - 4.36 France 770 4.11 - 3.65Czech Republic 555 21.99 - 3.73 Japan 704 3.79 - 3.34Netherlands 421 5.76 - 2.83 Spain 449 5.05 - 2.13Japan 420 2.26 - 2.83 Canada 413 3.42 - 1.96Belgium 418 5.18 - 2.81 Netherlands 353 4.83 - 1.67
Painting PhotographyWorld 963 0.27 - 100.00 World 1,674 0.48 - 100.00Developed economies (1) 870 0.31 - 90.38 Developed economies (1) 851 0.30 - 50.82Developing economies 85 0.14 - 8.81 Developing economies 815 1.34 - 48.70Economies in transition (2) 7 0.10 - 0.69 Economies in transition (2) 7 0.10 - 0.41United States 445 0.47 - 46.25 United States 332 0.35 - 19.85Germany 61 0.25 - 6.30 China, SAR of Hong Kong 226 1.07 - 13.50Japan 49 0.26 - 5.05 China, Taiwan Province of 219 9.21 - 13.11United Kingdom 46 0.16 - 4.83 Republic of Korea 209 6.43 - 12.46China, SAR of Hong Kong 46 0.22 - 4.81 Singapore 120 3.23 - 7.18France 44 0.24 - 4.62 France 102 0.54 - 6.09Canada 40 0.33 - 4.21 Germany 93 0.38 - 5.58Belgium 30 0.37 - 3.10 Japan 66 0.35 - 3.92Spain 22 0.24 - 2.26 United Kingdom 49 0.18 - 2.95Netherlands 18 0.24 - 1.85 Netherlands 28 0.38 - 1.68
Importer
As %2005
Value (c.i.f. in
millions of $)of country
total –of world
total Importer
As %2005
Value (c.i.f. in
millions of $)of country
total –of world
total
CONTINUED

TA B L E
1.4.1.B
267
Sta
tistical
Annex
Part
1
C R E AT I V E E C O N O M Y R E P O R T 2 0 0 8
Sculpture AntiquesWorld 5,691 1.62 - 100.00 World 2,617 0.75 - 100.00Developed economies (1) 4,814 1.70 - 84.59 Developed economies (1) 2,448 0.87 - 93.55Developing economies 795 1.31 - 13.97 Developing economies 168 0.28 - 6.42Economies in transition (2) 68 1.14 - 1.20 Economies in transition (2) 1 0.01 - 0.03United States 1,718 1.81 - 30.19 United States 1,506 1.59 - 57.56Germany 491 2.01 - 8.63 United Kingdom 583 2.07 - 22.28China, SAR of Hong Kong 324 1.53 - 5.69 China, SAR of Hong Kong 128 0.61 - 4.91Japan 320 1.72 - 5.62 Switzerland 84 0.87 - 3.21France 307 1.64 - 5.39 France 65 0.35 - 2.47United Kingdom 296 1.05 - 5.20 Japan 51 0.27 - 1.94Netherlands 211 2.89 - 3.71 Australia 27 0.50 - 1.04Italy 205 1.96 - 3.60 Belgium 26 0.32 - 1.00Spain 183 2.05 - 3.21 Germany 25 0.10 - 0.94Belgium 176 2.18 - 3.09 Canada 21 0.17 - 0.80
Other visual artsWorld 10,166 2.90 - 100.00Developed economies (1) 9,628 3.41 - 94.70Developing economies 519 0.85 - 5.10Economies in transition (2) 20 0.33 - 0.19United States 3,900 4.10 - 38.36United Kingdom 2,670 9.46 - 26.26Switzerland 1,364 14.13 - 13.42Germany 296 1.21 - 2.91France 252 1.35 - 2.48Spain 219 2.46 - 2.16Japan 219 1.18 - 2.15Canada 188 1.56 - 1.85China, SAR of Hong Kong 111 0.52 - 1.09Iran (Islamic Republic of) 99 30.85 - 0.98
SOURCE: UNCTAD secretariat calculations based on United Nations Comtrade database data.NOTES: (1) Developed economies, including Bulgaria and Romania.
(2) Excluding Bulgaria and Romania, which are included in the European Union (EU-27).
Importer
As %2005
Value (c.i.f. in
millions of $)of country
total –of world
total Importer
As %2005
Value (c.i.f. in
millions of $)of country
total –of world
total

TA B L E
1.4.2.A CREATIVE GOODS: TOP 10 EXPORTERS AMONG DEVELOPEDECONOMIES, BY PRODUCT GROUP, 2005
268
Sta
tist
ical
Annex
Part
1
C R E AT I V E E C O N O M Y R E P O R T 2 0 0 8
ALL CREATIVE INDUSTRIES ARTS AND CRAFTSWorld 335,494 100.00 - 100.00 World 23,244 6.93 - 100.00Developed economies (1) 196,109 100.00 - 58.45 Developed economies (1) 9,118 4.69 - 39.23Developing economies 136,231 100.00 - 40.61 Developing economies 13,881 10.19 - 59.72Economies in transition (2) 3,154 100.00 - 0.94 Economies in transition (2) 137 7.74 - 0.59Italy 28,008 100.00 14.28 8.35 Belgium 1,381 14.79 15.15 5.94United States 25,544 100.00 13.03 7.61 Germany 1,048 4.23 11.49 4.51Germany 24,763 100.00 12.63 7.38 United States 977 3.83 10.72 4.20United Kingdom 19,030 100.00 9.70 5.67 Italy 748 2.67 8.21 3.22France 17,706 100.00 9.03 5.28 United Kingdom 685 3.60 7.51 2.95Canada 11,377 100.00 5.80 3.39 Netherlands 555 7.65 6.09 2.39Belgium 9,343 100.00 4.76 2.78 France 541 3.05 5.93 2.33Spain 9,138 100.00 4.66 2.72 Poland 533 12.65 5.85 2.29Netherlands 7,250 100.00 3.70 2.16 Spain 482 5.28 5.29 2.08Switzerland 6,053 100.00 3.09 1.80 Canada 343 3.02 3.76 1.48
Carpets CelebrationWorld 4,071 1.21 - 100.00 World 3,118 0.93 - 100.00Developed economies (1) 1,577 0.81 - 38.74 Developed economies (1) 867 0.45 - 27.79Developing economies 2,452 1.80 - 60.24 Developing economies 2,234 1.64 - 71.65Economies in transition (2) 30 1.51 - 0.74 Economies in transition (2) 9 1.56 - 0.29Belgium 673 7.20 42.67 16.53 Netherlands 144 1.99 16.62 4.62United Kingdom 147 0.77 9.31 3.61 United States 127 0.50 14.63 4.06Germany 127 0.51 8.08 3.13 Germany 116 0.47 13.37 3.72United States 108 0.42 6.86 2.66 Belgium 98 1.05 11.34 3.15Netherlands 70 0.96 4.42 1.71 United Kingdom 64 0.34 7.37 2.05France 58 0.33 3.70 1.43 Italy 51 0.18 5.93 1.65Poland 53 1.25 3.35 1.30 Poland 48 1.13 5.49 1.53Portugal 37 2.73 2.37 0.92 Canada 47 0.41 5.39 1.50Sweden 37 1.07 2.33 0.90 Austria 26 0.53 3.00 0.83Spain 37 0.40 2.33 0.90 Denmark 25 0.74 2.94 0.82
Paperware WickerwareWorld 62 0.02 - 100.00 World 1,640 0.49 - 100.00Developed economies (1) 30 0.02 - 48.27 Developed economies (1) 256 0.13 - 15.59Developing economies 32 0.02 - 51.69 Developing economies 1,374 1.01 - 83.82Economies in transition (2) 0 0.00 - 0.01 Economies in transition (2) 7 0.46 - 0.41United States 11 0.04 37.88 18.28 Belgium 48 0.52 18.91 2.95France 6 0.04 21.47 10.36 Germany 38 0.15 14.72 2.29United Kingdom 2 0.01 8.32 4.02 United States 35 0.14 13.71 2.14Japan 2 0.04 6.96 3.36 Netherlands 35 0.48 13.70 2.14Italy 2 0.01 5.95 2.87 Poland 30 0.71 11.63 1.81Netherlands 2 0.02 5.47 2.64 France 12 0.07 4.52 0.71Austria 1 0.02 2.51 1.21 Spain 10 0.11 3.88 0.60Germany 1 0.00 2.10 1.01 Canada 8 0.07 3.28 0.51Switzerland 1 0.01 1.95 0.94 Denmark 7 0.20 2.72 0.42Belgium 0 0.01 1.65 0.80 United Kingdom 7 0.04 2.61 0.41
Yarn Other arts and craftsWorld 4,808 1.43 - 100.00 World 9,546 2.85 - 100.00Developed economies (1) 1,692 0.87 - 35.18 Developed economies (1) 4,698 2.42 - 49.21Developing economies 3,048 2.24 - 63.38 Developing economies 4,741 3.48 - 49.66Economies in transition (2) 8 1.22 - 0.17 Economies in transition (2) 83 2.95 - 0.87Italy 206 0.74 12.21 4.29 Germany 631 2.55 13.42 6.61United States 204 0.80 12.09 4.25 United States 492 1.92 10.47 5.15France 201 1.14 11.89 4.18 Belgium 468 5.01 9.96 4.90Austria 149 3.04 8.79 3.09 Italy 447 1.60 9.51 4.68Germany 135 0.55 8.00 2.82 United Kingdom 420 2.21 8.95 4.40Portugal 126 9.18 7.44 2.62 Spain 356 3.90 7.59 3.73Poland 101 2.40 5.97 2.10 Poland 302 7.16 6.42 3.16Switzerland 96 1.59 5.68 2.00 Netherlands 278 3.84 5.92 2.91Belgium 93 1.00 5.52 1.94 Canada 246 2.16 5.23 2.57Japan 57 1.03 3.38 1.19 France 241 1.36 5.13 2.52
AUDIOVISUALS FilmWorld 664 0.20 - 100.00 World 664 0.20 - 100.00Developed economies (1) 592 0.30 - 89.20 Developed economies (1) 592 0.30 - 89.20Developing economies 55 0.04 - 8.25 Developing economies 55 0.04 - 8.25Economies in transition (2) 2 0.16 - 0.35 Economies in transition (2) 2 0.16 - 0.35Canada 318 2.79 53.66 47.86 Canada 318 2.79 53.66 47.86Italy 160 0.57 26.99 24.07 Italy 160 0.57 26.99 24.07United Kingdom 29 0.15 4.90 4.37 United Kingdom 29 0.15 4.90 4.37United States 28 0.11 4.76 4.25 United States 28 0.11 4.76 4.25France 21 0.12 3.62 3.23 France 21 0.12 3.62 3.23Australia 10 0.92 1.64 1.47 Australia 10 0.92 1.64 1.47Germany 8 0.03 1.41 1.26 Germany 8 0.03 1.41 1.26Belgium 4 0.04 0.71 0.63 Belgium 4 0.04 0.71 0.63Spain 2 0.02 0.38 0.34 Spain 2 0.02 0.38 0.34Portugal 2 0.16 0.37 0.33 Portugal 2 0.16 0.37 0.33
Exporter
As %2005
Value (f.o.b. in
millions of $)of country
total
of total fordevelopedeconomies
of worldtotal Exporter
As %2005
Value (f.o.b. in
millions of $)of country
total
of total fordevelopedeconomies
of worldtotal

TA B L E
1.4.2.A
269
Sta
tistical
Annex
Part
1
C R E AT I V E E C O N O M Y R E P O R T 2 0 0 8
DESIGN GraphicWorld 218,173 65.03 - 100.00 World 16,422 4.89 - 100.00Developed economies (1) 112,595 57.91 - 51.61 Developed economies (1) 11,237 5.78 - 68.43Developing economies 102,413 75.18 - 46.94 Developing economies 4,954 3.64 - 30.17Economies in transition (2) 1,735 64.16 - 0.80 Economies in transition (2) 198 4.40 - 1.20Italy 24,801 88.55 22.03 11.37 Italy 5,699 20.35 50.72 34.70France 12,864 72.65 11.43 5.90 Spain 3,247 35.53 28.90 19.77Germany 12,838 51.84 11.40 5.88 Germany 516 2.08 4.59 3.14United States 11,224 43.94 9.97 5.14 Portugal 365 26.61 3.25 2.22Spain 6,747 73.83 5.99 3.09 France 224 1.27 2.00 1.37United Kingdom 6,632 34.85 5.89 3.04 Canada 157 1.38 1.40 0.96Belgium 5,499 58.86 4.88 2.52 Belgium 143 1.53 1.27 0.87Switzerland 4,191 69.23 3.72 1.92 Poland 140 3.32 1.25 0.85Canada 3,692 32.45 3.28 1.69 United States 108 0.42 0.96 0.66Japan 3,678 66.31 3.27 1.69 United Kingdom 97 0.51 0.86 0.59
Fashion GlasswareWorld 60,100 17.91 - 100.00 World 6,016 1.79 - 100.00Developed economies (1) 27,825 14.31 - 46.30 Developed economies (1) 4,175 2.15 - 69.39Developing economies 31,864 23.39 - 53.02 Developing economies 1,737 1.28 - 28.87Economies in transition (2) 161 17.65 - 0.27 Economies in transition (2) 42 2.00 - 0.69Italy 7,277 25.98 26.15 12.11 France 943 5.33 22.60 15.68France 7,217 40.76 25.94 12.01 Germany 567 2.29 13.58 9.42Germany 2,767 11.17 9.94 4.60 Italy 395 1.41 9.45 6.56United States 2,351 9.20 8.45 3.91 Czech Republic 341 12.35 8.16 5.66United Kingdom 1,586 8.33 5.70 2.64 Poland 278 6.59 6.65 4.62Belgium 1,378 14.75 4.95 2.29 Switzerland 220 3.63 5.26 3.65Spain 1,182 12.93 4.25 1.97 United States 201 0.79 4.83 3.35Netherlands 906 12.50 3.26 1.51 Austria 166 3.41 3.98 2.76Switzerland 582 9.61 2.09 0.97 Belgium 144 1.54 3.44 2.39Canada 341 3.00 1.23 0.57 Netherlands 136 1.88 3.27 2.27
Interior JewelleryWorld 66,597 19.85 - 100.00 World 38,612 11.51 - 100.00Developed economies (1) 38,235 19.66 - 57.41 Developed economies (1) 20,183 10.38 - 52.27Developing economies 26,558 19.49 - 39.88 Developing economies 17,951 13.18 - 46.49Economies in transition (2) 820 19.73 - 1.23 Economies in transition (2) 475 9.60 - 1.23Germany 5,871 23.71 15.36 8.82 Italy 5,087 18.16 25.20 13.17Italy 5,842 20.86 15.28 8.77 United States 4,321 16.92 21.41 11.19United States 3,084 12.07 8.07 4.63 Switzerland 2,694 44.51 13.35 6.98Belgium 2,873 30.76 7.51 4.31 United Kingdom 2,671 14.03 13.23 6.92Canada 2,632 23.13 6.88 3.95 France 1,398 7.90 6.93 3.62France 2,461 13.90 6.44 3.70 Germany 1,180 4.76 5.85 3.06Poland 2,207 52.37 5.77 3.31 Japan 435 7.84 2.16 1.13Denmark 1,929 55.93 5.05 2.90 Israel 402 53.67 1.99 1.04Netherlands 1,795 24.76 4.70 2.70 Belgium 355 3.80 1.76 0.92United Kingdom 1,620 8.51 4.24 2.43 Austria 328 6.71 1.62 0.85
Toys MUSICWorld 30,425 9.07 - 100.00 World 14,924 4.45 - 100.00Developed economies (1) 10,941 5.63 - 35.96 Developed economies (1) 13,424 6.90 - 89.94Developing economies 19,350 14.20 - 63.60 Developing economies 1,412 1.04 - 9.46Economies in transition (2) 40 10.77 - 0.13 Economies in transition (2) 63 3.09 - 0.42Japan 2,636 47.53 24.10 8.67 Germany 3,481 14.06 25.93 23.32Germany 1,937 7.82 17.70 6.37 United Kingdom 1,596 8.39 11.89 10.70United States 1,159 4.54 10.59 3.81 United States 1,491 5.84 11.10 9.99France 620 3.50 5.67 2.04 Austria 1,347 27.58 10.03 9.02Netherlands 613 8.45 5.60 2.01 Netherlands 1,325 18.28 9.87 8.88Belgium 607 6.50 5.55 2.00 Ireland 801 35.22 5.97 5.37United Kingdom 589 3.09 5.38 1.94 France 644 3.64 4.80 4.32Italy 502 1.79 4.58 1.65 Canada 376 3.30 2.80 2.52Spain 430 4.71 3.93 1.41 Sweden 347 10.12 2.58 2.32Canada 303 2.67 2.77 1.00 Belgium 313 3.34 2.33 2.09
Records PrintedWorld 14,805 4.41 - 100.00 World 119 0.04 - 100.00Developed economies (1) 13,308 6.84 - 89.89 Developed economies (1) 116 0.06 - 96.89Developing economies 1,409 1.03 - 9.51 Developing economies 4 0.00 - 3.01Economies in transition (2) 63 3.06 - 0.43 Economies in transition (2) 0 0.00 - 0.10Germany 3,449 13.93 25.92 23.30 United States 35 0.14 30.42 29.47United Kingdom 1,575 8.27 11.83 10.64 Germany 32 0.13 27.38 26.53United States 1,455 5.70 10.94 9.83 United Kingdom 22 0.11 18.75 18.17Austria 1,340 27.45 10.07 9.05 Italy 8 0.03 7.27 7.05Netherlands 1,324 18.26 9.95 8.94 Austria 6 0.13 5.46 5.29Ireland 801 35.22 6.02 5.41 France 5 0.03 4.73 4.59France 639 3.61 4.80 4.32 Australia 2 0.16 1.49 1.44Canada 375 3.30 2.82 2.54 Switzerland 1 0.02 1.16 1.12Sweden 347 10.12 2.61 2.34 Japan 1 0.02 0.96 0.93Belgium 312 3.34 2.35 2.11 Netherlands 1 0.01 0.83 0.81
Exporter
As %2005
Value (f.o.b. in
millions of $)of country
total
of total fordevelopedeconomies
of worldtotal Exporter
As %2005
Value (f.o.b. in
millions of $)of country
total
of total fordevelopedeconomies
of worldtotal

TA B L E
1.4.2.A CREATIVE GOODS: TOP 10 EXPORTERS AMONG DEVELOPEDECONOMIES, BY PRODUCT GROUP, 2005
270
Sta
tist
ical
Annex
Part
1
C R E AT I V E E C O N O M Y R E P O R T 2 0 0 8
NEW MEDIA Digital recordsWorld 12,035 3.59 - 100.00 World 2,282 0.68 - 100.00Developed economies (1) 6,471 3.33 - 53.77 Developed economies (1) 2,046 1.05 - 89.64Developing economies 5,508 4.04 - 45.77 Developing economies 230 0.17 - 10.09Economies in transition (2) 50 3.03 - 0.41 Economies in transition (2) 6 0.13 - 0.27United States 1,805 7.07 27.89 15.00 Ireland 670 29.47 32.77 29.37Ireland 698 30.69 10.79 5.80 United States 465 1.82 22.75 20.39Germany 691 2.79 10.68 5.74 United Kingdom 225 1.18 11.01 9.87United Kingdom 600 3.15 9.26 4.98 Germany 151 0.61 7.38 6.61Austria 579 11.86 8.95 4.81 Netherlands 122 1.68 5.94 5.32Netherlands 330 4.55 5.10 2.74 Belgium 92 0.98 4.49 4.02Australia 290 27.55 4.49 2.41 France 77 0.43 3.75 3.36Japan 235 4.23 3.62 1.95 Austria 69 1.41 3.37 3.02Spain 190 2.08 2.94 1.58 Japan 50 0.89 2.42 2.17Belgium 177 1.89 2.73 1.47 Denmark 21 0.60 1.01 0.90
Video games PUBLISHINGWorld 9,752 2.91 - 100.00 World 44,304 13.21 - 100.00Developed economies (1) 4,426 2.28 - 45.38 Developed economies (1) 36,593 18.82 - 82.60Developing economies 5,278 3.87 - 54.12 Developing economies 6,567 4.82 - 14.82Economies in transition (2) 44 1.95 - 0.45 Economies in transition (2) 1,096 14.59 - 2.47United States 1,340 5.24 30.27 13.74 Canada 5,965 52.43 16.30 13.46Germany 540 2.18 12.20 5.54 Germany 5,894 23.80 16.11 13.30Austria 510 10.45 11.53 5.23 United States 5,496 21.51 15.02 12.40United Kingdom 374 1.97 8.46 3.84 United Kingdom 4,134 21.73 11.30 9.33Australia 281 26.62 6.34 2.88 France 2,490 14.06 6.80 5.62Netherlands 209 2.88 4.71 2.14 Italy 1,676 5.98 4.58 3.78Japan 185 3.33 4.18 1.90 Belgium 1,552 16.61 4.24 3.50Spain 173 1.89 3.90 1.77 Spain 1,327 14.52 3.63 2.99Canada 164 1.44 3.70 1.68 Sweden 1,225 35.75 3.35 2.77Czech Republic 130 4.72 2.94 1.34 Netherlands 1,205 16.62 3.29 2.72
Books NewspapersWorld 12,881 3.84 - 100.00 World 15,324 4.57 - 100.00Developed economies (1) 9,707 4.99 - 75.36 Developed economies (1) 13,629 7.01 - 88.94Developing economies 2,965 2.18 - 23.02 Developing economies 961 0.71 - 6.27Economies in transition (2) 203 4.30 - 1.58 Economies in transition (2) 709 5.79 - 4.62United States 2,033 7.96 20.95 15.79 Canada 4,534 39.85 33.27 29.59United Kingdom 2,017 10.60 20.78 15.66 Germany 1,771 7.15 12.99 11.56Germany 1,297 5.24 13.36 10.07 United States 1,570 6.15 11.52 10.24Spain 773 8.46 7.97 6.00 United Kingdom 979 5.15 7.19 6.39France 647 3.65 6.67 5.02 Sweden 966 28.18 7.09 6.30Italy 541 1.93 5.57 4.20 France 940 5.31 6.90 6.13Belgium 403 4.31 4.15 3.13 Finland 394 37.76 2.89 2.57Canada 369 3.24 3.80 2.86 Netherlands 376 5.19 2.76 2.45Netherlands 234 3.23 2.41 1.82 Belgium 351 3.76 2.58 2.29Switzerland 171 2.83 1.77 1.33 Spain 273 2.99 2.00 1.78
Other publishing VISUAL ARTSWorld 16,099 4.80 - 100.00 World 22,149 6.60 - 100.00Developed economies (1) 13,257 6.82 - 82.35 Developed economies (1) 15,651 8.05 - 70.66Developing economies 2,641 1.94 - 16.41 Developing economies 6,395 4.69 - 28.87Economies in transition (2) 184 4.50 - 1.14 Economies in transition (2) 71 7.22 - 0.32Germany 2,826 11.41 21.32 17.55 United Kingdom 5,354 28.13 34.21 24.17United States 1,892 7.41 14.27 11.75 United States 4,523 17.71 28.90 20.42United Kingdom 1,138 5.98 8.59 7.07 France 1,019 5.76 6.51 4.60Canada 1,062 9.33 8.01 6.60 Germany 803 3.24 5.13 3.62France 903 5.10 6.81 5.61 Switzerland 785 12.97 5.01 3.54Italy 889 3.17 6.71 5.52 Japan 598 10.78 3.82 2.70Belgium 798 8.54 6.02 4.96 Canada 512 4.50 3.27 2.31Netherlands 595 8.21 4.49 3.70 Italy 431 1.54 2.75 1.94Czech Republic 546 19.81 4.12 3.39 Belgium 416 4.45 2.66 1.88Japan 411 7.41 3.10 2.55 Netherlands 250 3.45 1.60 1.13
Painting PhotographyWorld 955 0.28 - 100.00 World 1,494 0.45 - 100.00Developed economies (1) 245 0.13 - 25.70 Developed economies (1) 979 0.50 - 65.52Developing economies 688 0.50 - 72.03 Developing economies 514 0.38 - 34.39Economies in transition (2) 2 0.35 - 0.25 Economies in transition (2) 0 0.39 - 0.03Italy 65 0.23 26.30 6.76 Japan 519 9.36 53.02 34.74Belgium 34 0.36 13.80 3.55 United States 110 0.43 11.24 7.36United States 29 0.11 11.92 3.06 Germany 89 0.36 9.11 5.97Poland 24 0.57 9.84 2.53 United Kingdom 89 0.47 9.06 5.94France 11 0.06 4.40 1.13 France 45 0.26 4.62 3.02Netherlands 11 0.15 4.31 1.11 Italy 28 0.10 2.84 1.86United Kingdom 10 0.05 4.05 1.04 Belgium 25 0.26 2.52 1.65Czech Republic 10 0.35 3.89 1.00 Netherlands 21 0.29 2.17 1.42Germany 9 0.04 3.64 0.94 Canada 8 0.07 0.77 0.51Spain 8 0.09 3.43 0.88 Sweden 7 0.20 0.70 0.46
Exporter
As %2005
Value (f.o.b. in
millions of $)of country
total
of total fordevelopedeconomies
of worldtotal Exporter
As %2005
Value (f.o.b. in
millions of $)of country
total
of total fordevelopedeconomies
of worldtotal
CONTINUED

TA B L E
1.4.2.A
271
Sta
tistical
Annex
Part
1
C R E AT I V E E C O N O M Y R E P O R T 2 0 0 8
Sculpture AntiquesWorld 6,078 1.81 - 100.00 World 2,536 0.76 - 100.00Developed economies (1) 1,825 0.94 - 30.02 Developed economies (1) 2,352 1.21 - 92.77Developing economies 4,177 3.07 - 68.73 Developing economies 183 0.13 - 7.21Economies in transition (2) 65 2.27 - 1.07 Economies in transition (2) 0 0.01 - 0.02Belgium 265 2.83 14.51 4.35 United Kingdom 1,404 7.38 59.68 55.36Germany 232 0.94 12.74 3.82 United States 338 1.32 14.39 13.35Italy 189 0.67 10.36 3.11 France 246 1.39 10.46 9.70Spain 173 1.89 9.47 2.84 Switzerland 142 2.34 6.02 5.58United States 167 0.65 9.14 2.74 Germany 62 0.25 2.65 2.46Netherlands 159 2.20 8.73 2.62 Belgium 40 0.43 1.71 1.58France 137 0.77 7.51 2.26 Netherlands 18 0.25 0.77 0.72Portugal 106 7.70 5.79 1.74 Canada 17 0.15 0.73 0.68United Kingdom 94 0.50 5.16 1.55 Denmark 17 0.48 0.71 0.65Denmark 72 2.09 3.96 1.19 Italy 14 0.05 0.60 0.56
Other visual artsWorld 11,087 3.30 - 100.00Developed economies (1) 10,250 5.27 - 92.45Developing economies 833 0.61 - 7.52Economies in transition (2) 3 3.30 - 0.03United States 3,878 15.18 37.84 34.98United Kingdom 3,757 19.74 36.65 33.89Switzerland 625 10.32 6.09 5.63France 580 3.28 5.66 5.24Canada 435 3.82 4.24 3.92Germany 410 1.65 4.00 3.69Italy 135 0.48 1.32 1.22Austria 67 1.37 0.65 0.61Belgium 53 0.56 0.51 0.48Japan 44 0.79 0.43 0.40
SOURCE: UNCTAD secretariat calculations based on United Nations Comtrade database data.NOTES: (1) Developed economies, including Bulgaria and Romania.
(2) Excluding Bulgaria and Romania, which are included in the European Union (EU-27).
Exporter
As %2005
Value (f.o.b. in
millions of $)of country
total
of total fordevelopedeconomies
of worldtotal Exporter
As %2005
Value (f.o.b. in
millions of $)of country
total
of total fordevelopedeconomies
of worldtotal

TA B L E
1.4.2.B CREATIVE GOODS: TOP 10 IMPORTERS AMONG DEVELOPEDECONOMIES, BY PRODUCT GROUP, 2005
272
Sta
tist
ical
Annex
Part
1
C R E AT I V E E C O N O M Y R E P O R T 2 0 0 8
ALL CREATIVE INDUSTRIES ARTS AND CRAFTSWorld 350,884 100.00 - 100.00 World 25,091 7.15 - 100.00Developed economies (1) 284,147 100.00 - 80.53 Developed economies (1) 20,174 7.14 - 80.40Developing economies 60,759 100.00 - 17.32 Developing economies 4,390 7.23 - 17.50Economies in transition (2) 5,978 100.00 - 1.70 Economies in transition (2) 421 7.05 - 1.68United States 95,021 100.00 33.44 27.08 United States 7,598 8.00 37.66 30.28United Kingdom 28,212 100.00 9.93 8.04 Germany 1,911 7.83 9.47 7.62Germany 24,418 100.00 8.59 6.96 United Kingdom 1,589 5.63 7.87 6.33France 18,717 100.00 6.59 5.33 France 1,226 6.55 6.08 4.89Japan 18,592 100.00 6.54 5.30 Japan 979 5.27 4.85 3.90Canada 12,094 100.00 4.26 3.45 Italy 917 8.78 4.55 3.65Italy 10,448 100.00 3.68 2.98 Canada 828 6.84 4.10 3.30Switzerland 9,655 100.00 3.40 2.75 Belgium 613 7.59 3.04 2.44Spain 8,903 100.00 3.13 2.54 Spain 545 6.12 2.70 2.17Belgium 8,077 100.00 2.84 2.30 Netherlands 538 7.37 2.67 2.15
Carpets CelebrationWorld 4,033 1.15 - 100.00 World 5,698 1.62 - 100.00Developed economies (1) 3,568 1.26 - 88.47 Developed economies (1) 5,045 1.79 - 88.54Developing economies 375 0.62 - 9.31 Developing economies 591 0.97 - 10.37Economies in transition (2) 70 1.17 - 1.74 Economies in transition (2) 54 0.90 - 0.95United States 1,327 1.40 37.20 32.91 United States 3,099 3.26 61.43 54.39Germany 482 1.97 13.50 11.95 United Kingdom 344 1.22 6.82 6.04United Kingdom 289 1.03 8.10 7.17 Canada 256 2.11 5.07 4.49Japan 235 1.26 6.59 5.83 Germany 213 0.87 4.22 3.74Italy 164 1.57 4.61 4.08 France 193 1.03 3.82 3.38France 149 0.80 4.18 3.70 Italy 147 1.41 2.92 2.59Canada 89 0.74 2.51 2.22 Belgium 122 1.51 2.41 2.13Switzerland 83 0.86 2.34 2.07 Netherlands 92 1.26 1.82 1.62Spain 77 0.87 2.17 1.92 Spain 73 0.83 1.46 1.29Netherlands 77 1.05 2.15 1.90 Australia 59 1.07 1.17 1.03
Paperware WickerwareWorld 118 0.03 - 100.00 World 1,786 0.51 - 100.00Developed economies (1) 99 0.04 - 83.83 Developed economies (1) 1,643 0.58 - 91.98Developing economies 18 0.03 - 15.11 Developing economies 131 0.22 - 7.32Economies in transition (2) 0 0.01 - 0.26 Economies in transition (2) 11 0.18 - 0.60France 55 0.29 55.18 46.26 United States 547 0.58 33.31 30.63Japan 17 0.09 16.76 14.05 Japan 298 1.60 18.15 16.70Netherlands 5 0.07 5.49 4.60 Germany 157 0.64 9.55 8.78United Kingdom 3 0.01 3.38 2.83 France 99 0.53 6.02 5.54United States 3 0.00 3.10 2.60 United Kingdom 89 0.31 5.41 4.97Ireland 3 0.13 3.06 2.57 Italy 68 0.65 4.11 3.78Belgium 2 0.03 2.29 1.92 Spain 65 0.73 3.96 3.64Italy 2 0.02 2.05 1.72 Netherlands 51 0.70 3.13 2.88Austria 1 0.02 1.29 1.08 Belgium 51 0.63 3.12 2.87Greece 1 0.04 0.99 0.83 Canada 44 0.36 2.66 2.45
Yarn Other arts and craftsWorld 3,884 1.11 - 100.00 World 9,572 2.73 - 100.00Developed economies (1) 3,166 1.12 - 81.50 Developed economies (1) 6,654 2.35 - 69.52Developing economies 657 1.08 - 16.90 Developing economies 2,619 4.31 - 27.36Economies in transition (2) 38 0.64 - 0.99 Economies in transition (2) 248 4.15 - 2.59United States 775 0.82 24.47 19.95 United States 1,847 1.94 27.75 19.29Germany 349 1.43 11.03 8.99 Germany 709 2.91 10.66 7.41France 335 1.79 10.57 8.61 United Kingdom 612 2.17 9.19 6.39United Kingdom 252 0.89 7.95 6.48 France 396 2.12 5.96 4.14Italy 173 1.65 5.46 4.45 Italy 363 3.47 5.45 3.79Spain 153 1.72 4.83 3.94 Canada 344 2.85 5.17 3.60Belgium 131 1.62 4.14 3.38 Japan 251 1.35 3.76 2.62Japan 127 0.68 4.02 3.28 Belgium 239 2.96 3.59 2.50Australia 109 2.00 3.46 2.82 Netherlands 225 3.08 3.38 2.35Austria 101 1.81 3.20 2.61 Greece 206 7.63 3.10 2.15
AUDIOVISUALS FilmWorld 650 0.19 - 100.00 World 650 0.19 - 100.00Developed economies (1) 526 0.19 - 80.99 Developed economies (1) 526 0.19 - 80.99Developing economies 116 0.19 - 17.86 Developing economies 116 0.19 - 17.86Economies in transition (2) 7 0.12 - 1.06 Economies in transition (2) 7 0.12 - 1.06United States 358 0.38 68.02 55.09 United States 358 0.38 68.02 55.09France 33 0.18 6.25 5.07 France 33 0.18 6.25 5.07Spain 22 0.25 4.24 3.43 Spain 22 0.25 4.24 3.43United Kingdom 21 0.07 3.97 3.21 United Kingdom 21 0.07 3.97 3.21Japan 19 0.10 3.58 2.90 Japan 19 0.10 3.58 2.90Germany 14 0.06 2.66 2.16 Germany 14 0.06 2.66 2.16Australia 9 0.16 1.70 1.38 Australia 9 0.16 1.70 1.38Austria 8 0.15 1.60 1.29 Austria 8 0.15 1.60 1.29Switzerland 7 0.07 1.33 1.08 Switzerland 7 0.07 1.33 1.08Canada 5 0.04 0.96 0.78 Canada 5 0.04 0.96 0.78
Importer
As %2005
Value (c.i.f. in
millions of $)of country
total
of total fordevelopedeconomies
of worldtotal Importer
As %2005
Value (c.i.f. in
millions of $)of country
total
of total fordevelopedeconomies
of worldtotal

TA B L E
1.4.2.B
273
Sta
tistical
Annex
Part
1
C R E AT I V E E C O N O M Y R E P O R T 2 0 0 8
DESIGN GraphicWorld 228,428 65.10 - 100.00 World 17,449 4.97 - 100.00Developed economies (1) 184,052 65.14 - 80.57 Developed economies (1) 13,810 4.89 - 79.15Developing economies 39,257 64.61 - 17.19 Developing economies 2,644 4.35 - 15.15Economies in transition (2) 3,967 66.35 - 1.74 Economies in transition (2) 750 12.54 - 4.30United States 66,603 70.09 36.19 29.16 United States 5,214 5.49 37.76 29.88United Kingdom 16,695 59.18 9.07 7.31 France 1,415 7.56 10.25 8.11Germany 15,059 61.67 8.18 6.59 Germany 1,087 4.45 7.87 6.23Japan 14,705 79.09 7.99 6.44 Japan 942 5.07 6.82 5.40France 12,527 66.93 6.81 5.48 United Kingdom 924 3.27 6.69 5.29Italy 6,713 64.25 3.65 2.94 Belgium 396 4.90 2.87 2.27Canada 6,422 53.10 3.49 2.81 Switzerland 359 3.72 2.60 2.06Spain 5,956 66.90 3.24 2.61 Canada 313 2.59 2.27 1.80Switzerland 5,219 54.06 2.84 2.28 Australia 286 5.23 2.07 1.64Belgium 4,969 61.52 2.70 2.18 Greece 280 10.38 2.03 1.61
Fashion GlasswareWorld 60,792 17.33 - 100.00 World 5,524 1.57 - 100.00Developed economies (1) 46,802 16.56 - 76.99 Developed economies (1) 4,425 1.57 - 80.10Developing economies 12,767 21.01 - 21.00 Developing economies 892 1.47 - 16.16Economies in transition (2) 841 14.07 - 1.38 Economies in transition (2) 168 2.82 - 3.04United States 14,656 15.42 31.32 24.11 United States 1,006 1.06 22.73 18.21Japan 5,837 31.39 12.47 9.60 Germany 478 1.96 10.80 8.65Germany 4,043 16.56 8.64 6.65 United Kingdom 340 1.21 7.69 6.16United Kingdom 3,591 12.73 7.67 5.91 France 302 1.62 6.83 5.47France 3,262 17.43 6.97 5.37 Italy 259 2.48 5.85 4.68Italy 2,726 26.09 5.82 4.48 Canada 229 1.89 5.18 4.15Spain 2,114 23.75 4.52 3.48 Spain 217 2.44 4.90 3.93Belgium 1,335 16.52 2.85 2.20 Japan 216 1.16 4.87 3.90Canada 1,324 10.95 2.83 2.18 Switzerland 171 1.77 3.87 3.10Netherlands 1,138 15.56 2.43 1.87 Netherlands 151 2.06 3.41 2.73
Interior JewelleryWorld 70,345 20.05 - 100.00 World 31,254 8.91 - 100.00Developed economies (1) 60,693 21.48 - 86.28 Developed economies (1) 24,549 8.69 - 78.55Developing economies 7,655 12.60 - 10.88 Developing economies 6,483 10.67 - 20.74Economies in transition (2) 1,615 27.02 - 2.30 Economies in transition (2) 213 3.56 - 0.68United States 21,388 22.51 35.24 30.40 United States 9,858 10.37 40.16 31.54United Kingdom 5,335 18.91 8.79 7.58 United Kingdom 3,732 13.23 15.20 11.94Germany 5,300 21.70 8.73 7.53 Japan 1,885 10.14 7.68 6.03France 4,243 22.67 6.99 6.03 Switzerland 1,675 17.35 6.82 5.36Japan 2,945 15.84 4.85 4.19 France 1,444 7.71 5.88 4.62Canada 2,688 22.22 4.43 3.82 Germany 1,219 4.99 4.97 3.90Netherlands 1,934 26.45 3.19 2.75 Italy 833 7.97 3.39 2.66Spain 1,868 20.98 3.08 2.66 Canada 599 4.95 2.44 1.92Belgium 1,855 22.97 3.06 2.64 Spain 575 6.46 2.34 1.84Switzerland 1,601 16.58 2.64 2.28 Australia 478 8.73 1.95 1.53
Toys MUSICWorld 43,064 12.27 - 100.00 World 16,419 4.68 - 100.00Developed economies (1) 33,773 11.95 - 78.43 Developed economies (1) 13,737 4.86 - 83.66Developing economies 8,816 14.51 - 20.47 Developing economies 2,413 3.97 - 14.70Economies in transition (2) 379 6.35 - 0.88 Economies in transition (2) 171 2.86 - 1.04United States 14,481 15.24 42.88 33.63 Germany 2,376 9.73 17.30 14.47Germany 2,932 12.01 8.68 6.81 United Kingdom 1,689 5.99 12.30 10.29Japan 2,881 15.50 8.53 6.69 United States 1,244 1.31 9.05 7.57United Kingdom 2,773 9.83 8.21 6.44 France 1,003 5.36 7.30 6.11France 1,860 9.94 5.51 4.32 Canada 742 6.14 5.40 4.52Canada 1,269 10.49 3.76 2.95 Switzerland 732 7.58 5.33 4.46Italy 1,093 10.46 3.24 2.54 Italy 719 6.88 5.23 4.38Spain 971 10.90 2.87 2.25 Belgium 655 8.11 4.77 3.99Belgium 847 10.48 2.51 1.97 Netherlands 618 8.46 4.50 3.77Netherlands 741 10.13 2.19 1.72 Austria 553 9.88 4.02 3.37
Records PrintedWorld 16,312 4.65 - 100.00 World 107 0.03 - 100.00Developed economies (1) 13,639 4.83 - 83.62 Developed economies (1) 97 0.03 - 90.69Developing economies 2,404 3.96 - 14.73 Developing economies 10 0.02 - 9.10Economies in transition (2) 171 2.85 - 1.05 Economies in transition (2) 0 0.00 - 0.21Germany 2,368 9.70 17.36 14.52 United Kingdom 17 0.06 17.42 15.79United Kingdom 1,672 5.93 12.26 10.25 Canada 13 0.10 12.88 11.68United States 1,233 1.30 9.04 7.56 United States 11 0.01 10.80 9.80France 995 5.31 7.29 6.10 Austria 8 0.15 8.43 7.64Canada 730 6.04 5.35 4.47 Germany 8 0.03 8.30 7.52Switzerland 727 7.53 5.33 4.46 France 8 0.04 8.17 7.41Italy 715 6.85 5.24 4.38 Japan 7 0.04 6.91 6.27Belgium 653 8.08 4.79 4.00 Switzerland 5 0.05 4.93 4.47Netherlands 615 8.42 4.51 3.77 Australia 5 0.08 4.69 4.26Austria 544 9.73 3.99 3.34 Italy 4 0.03 3.73 3.38
Importer
As %2005
Value (c.i.f. in
millions of $)of country
total
of total fordevelopedeconomies
of worldtotal Importer
As %2005
Value (c.i.f. in
millions of $)of country
total
of total fordevelopedeconomies
of worldtotal

TA B L E
1.4.2.B CREATIVE GOODS: TOP 10 IMPORTERS AMONG DEVELOPEDECONOMIES, BY PRODUCT GROUP, 2005
274
Sta
tist
ical
Annex
Part
1
C R E AT I V E E C O N O M Y R E P O R T 2 0 0 8
NEW MEDIA Digital recordsWorld 13,402 3.82 - 100.00 World 2,436 0.69 - 100.00Developed economies (1) 10,718 3.79 - 79.97 Developed economies (1) 1,865 0.66 - 76.53Developing economies 2,465 4.06 - 18.39 Developing economies 560 0.92 - 23.00Economies in transition (2) 187 3.12 - 1.39 Economies in transition (2) 10 0.15 - 0.39United States 3,183 3.35 29.70 23.75 Italy 518 4.96 27.77 21.25Germany 1,084 4.44 10.11 8.09 United Kingdom 203 0.72 10.90 8.34United Kingdom 905 3.21 8.44 6.75 Germany 184 0.75 9.88 7.56Canada 845 6.98 7.88 6.30 France 167 0.89 8.97 6.86Italy 680 6.51 6.35 5.08 Greece 122 4.53 6.56 5.02Japan 581 3.12 5.42 4.33 Netherlands 93 1.27 4.98 3.81France 521 2.78 4.86 3.88 United States 84 0.09 4.49 3.43Spain 510 5.72 4.76 3.80 Belgium 66 0.81 3.51 2.69Austria 361 6.45 3.37 2.69 Spain 56 0.62 2.98 2.28Netherlands 359 4.91 3.35 2.68 Canada 54 0.44 2.88 2.21
Video games PUBLISHINGWorld 10,966 3.13 - 100.00 World 45,783 13.05 - 100.00Developed economies (1) 8,853 3.12 - 80.73 Developed economies (1) 34,740 12.29 - 75.88Developing economies 1,905 3.13 - 17.37 Developing economies 9,735 16.02 - 21.26Economies in transition (2) 177 2.96 - 1.61 Economies in transition (2) 1,124 18.80 - 2.46United States 3,100 3.26 35.01 28.27 United States 8,134 8.56 23.41 17.77Germany 900 3.68 10.16 8.20 United Kingdom 3,669 13.01 10.56 8.01Canada 791 6.54 8.93 7.21 Germany 3,008 12.32 8.66 6.57United Kingdom 701 2.49 7.92 6.40 Canada 2,839 23.47 8.17 6.20Japan 563 3.03 6.35 5.13 France 2,638 14.09 7.59 5.76Spain 454 5.10 5.13 4.14 Switzerland 1,716 17.78 4.94 3.75France 353 1.89 3.99 3.22 Belgium 1,378 17.06 3.97 3.01Austria 308 5.51 3.48 2.81 Japan 1,112 5.98 3.20 2.43Netherlands 266 3.64 3.00 2.42 Italy 1,088 10.41 3.13 2.38Australia 182 3.33 2.06 1.66 Netherlands 1,017 13.91 2.93 2.22
Books NewspapersWorld 13,836 3.94 - 100.00 World 17,081 4.87 - 100.00Developed economies (1) 10,305 3.65 - 74.48 Developed economies (1) 13,409 4.75 - 78.50Developing economies 3,266 5.37 - 23.60 Developing economies 3,098 5.10 - 18.13Economies in transition (2) 234 3.91 - 1.69 Economies in transition (2) 518 8.66 - 3.03United States 2,390 2.52 23.20 17.28 United States 3,621 3.81 27.01 21.20United Kingdom 1,241 4.40 12.04 8.97 Germany 1,237 5.06 9.22 7.24Canada 1,187 9.81 11.51 8.58 United Kingdom 1,231 4.36 9.18 7.21France 717 3.83 6.96 5.18 Canada 1,005 8.31 7.49 5.88Germany 632 2.59 6.13 4.57 France 910 4.86 6.78 5.32Switzerland 545 5.64 5.29 3.94 Italy 639 6.12 4.77 3.74Austria 463 8.27 4.49 3.34 Belgium 528 6.54 3.94 3.09Belgium 431 5.34 4.18 3.12 Spain 514 5.77 3.83 3.01Australia 414 7.57 4.02 2.99 Switzerland 465 4.81 3.47 2.72Japan 312 1.68 3.03 2.25 Australia 402 7.34 3.00 2.35
Other publishing VISUAL ARTSWorld 14,866 4.24 - 100.00 World 21,111 6.02 - 100.00Developed economies (1) 11,027 3.90 - 74.17 Developed economies (1) 18,610 6.59 - 88.16Developing economies 3,372 5.55 - 22.68 Developing economies 2,382 3.92 - 11.28Economies in transition (2) 373 6.24 - 2.51 Economies in transition (2) 102 1.71 - 0.48United States 2,122 2.23 19.24 14.27 United States 7,902 8.32 42.46 37.43United Kingdom 1,197 4.24 10.85 8.05 United Kingdom 3,645 12.92 19.58 17.26Germany 1,139 4.67 10.33 7.66 Switzerland 1,575 16.31 8.46 7.46France 1,012 5.40 9.17 6.80 Germany 966 3.96 5.19 4.57Switzerland 707 7.32 6.41 4.75 France 770 4.11 4.14 3.65Canada 647 5.35 5.87 4.36 Japan 704 3.79 3.78 3.34Czech Republic 555 21.99 5.03 3.73 Spain 449 5.05 2.41 2.13Netherlands 421 5.76 3.82 2.83 Canada 413 3.42 2.22 1.96Japan 420 2.26 3.81 2.83 Netherlands 353 4.83 1.90 1.67Belgium 418 5.18 3.79 2.81 Italy 330 3.16 1.77 1.56
Painting PhotographyWorld 963 0.27 - 100.00 World 1,674 0.48 - 100.00Developed economies (1) 870 0.31 - 90.38 Developed economies (1) 851 0.30 - 50.82Developing economies 85 0.14 - 8.81 Developing economies 815 1.34 - 48.70Economies in transition (2) 7 0.10 - 0.69 Economies in transition (2) 7 0.10 - 0.41United States 445 0.47 51.18 46.25 United States 332 0.35 39.06 19.85Germany 61 0.25 6.97 6.30 France 102 0.54 11.98 6.09Japan 49 0.26 5.59 5.05 Germany 93 0.38 10.98 5.58United Kingdom 46 0.16 5.34 4.83 Japan 66 0.35 7.72 3.92France 44 0.24 5.11 4.62 United Kingdom 49 0.18 5.81 2.95Canada 40 0.33 4.65 4.21 Netherlands 28 0.38 3.30 1.68Belgium 30 0.37 3.43 3.10 Canada 22 0.18 2.55 1.30Spain 22 0.24 2.50 2.26 Belgium 17 0.21 1.96 1.00Netherlands 18 0.24 2.04 1.85 Italy 17 0.16 1.95 0.99Sweden 15 0.43 1.73 1.56 Israel 15 1.36 1.80 0.91
Importer
As %2005
Value (c.i.f. in
millions of $)of country
total
of total fordevelopedeconomies
of worldtotal Importer
As %2005
Value (c.i.f. in
millions of $)of country
total
of total fordevelopedeconomies
of worldtotal
CONTINUED

TA B L E
1.4.2.B
275
Sta
tistical
Annex
Part
1
C R E AT I V E E C O N O M Y R E P O R T 2 0 0 8
Sculpture AntiquesWorld 5,691 1.62 - 100.00 World 2,617 0.75 - 100.00Developed economies (1) 4,814 1.70 - 84.59 Developed economies (1) 2,448 0.87 - 93.55Developing economies 795 1.31 - 13.97 Developing economies 168 0.28 - 6.42Economies in transition (2) 68 1.14 - 1.20 Economies in transition (2) 1 0.01 - 0.03United States 1,718 1.81 35.69 30.19 United States 1,506 1.59 61.53 57.56Germany 491 2.01 10.20 8.63 United Kingdom 583 2.07 23.82 22.28Japan 320 1.72 6.65 5.62 Switzerland 84 0.87 3.43 3.21France 307 1.64 6.37 5.39 France 65 0.35 2.64 2.47United Kingdom 296 1.05 6.15 5.20 Japan 51 0.27 2.08 1.94Netherlands 211 2.89 4.38 3.71 Australia 27 0.50 1.11 1.04Italy 205 1.96 4.25 3.60 Belgium 26 0.32 1.07 1.00Spain 183 2.05 3.79 3.21 Germany 25 0.10 1.01 0.94Belgium 176 2.18 3.66 3.09 Canada 21 0.17 0.86 0.80Canada 142 1.17 2.94 2.49 Austria 13 0.23 0.53 0.50
Other visual artsWorld 10,166 2.90 - 100.00Developed economies (1) 9,628 3.41 - 94.70Developing economies 519 0.85 - 5.10Economies in transition (2) 20 0.33 - 0.19United States 3,900 4.10 40.51 38.36United Kingdom 2,670 9.46 27.73 26.26Switzerland 1,364 14.13 14.17 13.42Germany 296 1.21 3.07 2.91France 252 1.35 2.62 2.48Spain 219 2.46 2.28 2.16Japan 219 1.18 2.27 2.15Canada 188 1.56 1.96 1.85Australia 88 1.61 0.92 0.87Netherlands 88 1.20 0.91 0.86
SOURCE: UNCTAD secretariat calculations based on United Nations Comtrade database data.NOTES: (1) Developed economies, including Bulgaria and Romania.
(2) Excluding Bulgaria and Romania, which are included in the European Union (EU-27).
Importer
As %2005
Value (c.i.f. in
millions of $)of country
total
of total fordevelopedeconomies
of worldtotal Importer
As %2005
Value (c.i.f. in
millions of $)of country
total
of total fordevelopedeconomies
of worldtotal

TA B L E
1.4.3.A CREATIVE GOODS: TOP 10 EXPORTERS AMONG DEVELOPINGECONOMIES, BY PRODUCT GROUP, 2005
276
Sta
tist
ical
Annex
Part
1
C R E AT I V E E C O N O M Y R E P O R T 2 0 0 8
ALL CREATIVE INDUSTRIES ARTS AND CRAFTSWorld 335,494 100.00 - 100.00 World 23,244 6.93 - 100.00Developed economies (1) 196,109 100.00 - 58.45 Developed economies (1) 9,118 4.69 - 39.23Developing economies 136,231 100.00 - 40.61 Developing economies 13,881 10.19 - 59.72Economies in transition (2) 3,154 100.00 - 0.94 Economies in transition (2) 137 7.74 - 0.59China 61,360 100.00 45.04 18.29 China 5,602 9.13 40.36 24.10China, SAR of Hong Kong 27,677 100.00 20.32 8.25 China, SAR of Hong Kong 2,266 8.19 16.33 9.75India 8,155 100.00 5.99 2.43 India 1,063 13.04 7.66 4.57Turkey 5,081 100.00 3.73 1.51 Turkey 951 18.72 6.85 4.09Thailand 4,323 100.00 3.17 1.29 Pakistan 626 39.59 4.51 2.69Mexico 4,271 100.00 3.13 1.27 Iran (Islamic Republic of) 621 65.81 4.47 2.67Malaysia 3,233 100.00 2.37 0.96 Indonesia 387 13.67 2.79 1.67Singapore 3,067 100.00 2.25 0.91 Thailand 301 6.97 2.17 1.30Republic of Korea 2,942 100.00 2.16 0.88 Republic of Korea 286 9.73 2.06 1.23Indonesia 2,833 100.00 2.08 0.84 Malaysia 265 8.21 1.91 1.14
Carpets CelebrationWorld 4,071 1.21 - 100.00 World 3,118 0.93 - 100.00Developed economies (1) 1,577 0.81 - 38.74 Developed economies (1) 867 0.45 - 27.79Developing economies 2,452 1.80 - 60.24 Developing economies 2,234 1.64 - 71.65Economies in transition (2) 30 1.51 - 0.74 Economies in transition (2) 9 1.56 - 0.29India 756 9.27 30.81 18.56 China 1,221 1.99 54.63 39.14Iran (Islamic Republic of) 599 63.54 24.43 14.72 China, SAR of Hong Kong 726 2.62 32.50 23.28China 378 0.62 15.39 9.27 China, Taiwan Province of 73 2.77 3.25 2.33Pakistan 287 18.13 11.69 7.04 Thailand 58 1.33 2.58 1.85Turkey 238 4.68 9.70 5.84 Philippines 57 6.32 2.56 1.84Saudi Arabia 72 18.19 2.94 1.77 Mexico 52 1.22 2.33 1.67Morocco 20 9.42 0.81 0.49 Guatemala 13 6.28 0.56 0.40Indonesia 16 0.55 0.64 0.39 India 8 0.09 0.34 0.24South Africa 12 2.30 0.48 0.29 Indonesia 6 0.22 0.28 0.20Brazil 11 0.51 0.46 0.28 Sri Lanka 3 1.61 0.13 0.10
Paperware WickerwareWorld 62 0.02 - 100.00 World 1,640 0.49 - 100.00Developed economies (1) 30 0.02 - 48.27 Developed economies (1) 256 0.13 - 15.59Developing economies 32 0.02 - 51.69 Developing economies 1,374 1.01 - 83.82Economies in transition (2) 0 0.00 - 0.01 Economies in transition (2) 7 0.46 - 0.41India 18 0.21 54.99 28.42 China 1,125 1.83 81.86 68.61China 3 0.01 10.35 5.35 Philippines 95 10.53 6.93 5.81China, Taiwan Province of 3 0.10 8.08 4.18 Indonesia 61 2.15 4.43 3.71Saudi Arabia 2 0.51 6.36 3.29 China, SAR of Hong Kong 40 0.14 2.88 2.41Thailand 2 0.04 5.00 2.58 Thailand 11 0.25 0.79 0.66Qatar 2 7.70 4.84 2.50 China, Taiwan Province of 9 0.35 0.66 0.56Republic of Korea 1 0.03 3.07 1.59 Madagascar 7 15.11 0.49 0.41Philippines 0 0.05 1.40 0.72 Morocco 4 1.98 0.30 0.25Indonesia 0 0.01 1.33 0.69 South Africa 4 0.75 0.28 0.23Jordan 0 0.15 1.24 0.64 Republic of Korea 4 0.13 0.28 0.23
Yarn Other arts and craftsWorld 4,808 1.43 - 100.00 World 9,546 2.85 - 100.00Developed economies (1) 1,692 0.87 - 35.18 Developed economies (1) 4,698 2.42 - 49.21Developing economies 3,048 2.24 - 63.38 Developing economies 4,741 3.48 - 49.66Economies in transition (2) 8 1.22 - 0.17 Economies in transition (2) 83 2.95 - 0.87China 1,438 2.34 47.17 29.90 China 1,438 2.34 30.32 15.06Turkey 469 9.22 15.38 9.75 China, SAR of Hong Kong 1,384 5.00 29.20 14.50Pakistan 334 21.14 10.97 6.95 Indonesia 281 9.92 5.93 2.94Republic of Korea 246 8.36 8.07 5.12 Malaysia 254 7.85 5.35 2.66India 126 1.54 4.12 2.61 Turkey 243 4.79 5.14 2.55China, SAR of Hong Kong 106 0.38 3.47 2.20 India 155 1.90 3.26 1.62Thailand 84 1.95 2.77 1.76 Thailand 137 3.17 2.89 1.44China, Taiwan Province of 54 2.04 1.76 1.11 Mexico 116 2.72 2.45 1.22Brazil 48 2.19 1.58 1.00 Brazil 81 3.72 1.72 0.85Mexico 43 1.02 1.42 0.90 Ghana 80 38.50 1.70 0.84
AUDIOVISUALS FilmWorld 664 0.20 - 100.00 World 664 0.20 - 100.00Developed economies (1) 592 0.30 - 89.20 Developed economies (1) 592 0.30 - 89.20Developing economies 55 0.04 - 8.25 Developing economies 55 0.04 - 8.25Economies in transition (2) 2 0.16 - 0.35 Economies in transition (2) 2 0.16 - 0.35India 16 0.20 29.87 2.46 India 16 0.20 29.87 2.46Mexico 11 0.25 19.68 1.62 Mexico 11 0.25 19.68 1.62Republic of Korea 10 0.33 17.77 1.47 Republic of Korea 10 0.33 17.77 1.47Thailand 8 0.17 13.74 1.13 Thailand 8 0.17 13.74 1.13Argentina 5 1.21 8.67 0.72 Argentina 5 1.21 8.67 0.72China, SAR of Hong Kong 3 0.01 5.20 0.43 China, SAR of Hong Kong 3 0.01 5.20 0.43Chile 0 0.21 0.90 0.07 Chile 0 0.21 0.90 0.07Turkey 0 0.01 0.90 0.07 Turkey 0 0.01 0.90 0.07South Africa 0 0.09 0.83 0.07 South Africa 0 0.09 0.83 0.07Singapore 0 0.01 0.51 0.04 Singapore 0 0.01 0.51 0.04
Exporter
As %2005
Value (f.o.b. in
millions of $)of country
total
of total fordevelopingeconomies
of worldtotal Exporter
As %2005
Value (f.o.b. in
millions of $)of country
total
of total fordevelopingeconomies
of worldtotal

TA B L E
1.4.3.A
277
Sta
tistical
Annex
Part
1
C R E AT I V E E C O N O M Y R E P O R T 2 0 0 8
DESIGN GraphicWorld 218,173 65.03 - 100.00 World 16,422 4.89 - 100.00Developed economies (1) 112,595 57.91 - 51.61 Developed economies (1) 11,237 5.78 - 68.43Developing economies 102,413 75.18 - 46.94 Developing economies 4,954 3.64 - 30.17Economies in transition (2) 1,735 64.16 - 0.80 Economies in transition (2) 198 4.40 - 1.20China 47,078 76.72 45.97 21.58 China 1,865 3.04 37.65 11.36China, SAR of Hong Kong 21,817 78.83 21.30 10.00 Turkey 942 18.55 19.02 5.74India 6,192 75.93 6.05 2.84 Brazil 852 38.87 17.20 5.19Turkey 4,036 79.44 3.94 1.85 Mexico 370 8.67 7.48 2.26Thailand 3,673 84.96 3.59 1.68 Indonesia 130 4.60 2.63 0.79Mexico 3,109 72.81 3.04 1.43 India 121 1.49 2.45 0.74Malaysia 2,640 81.66 2.58 1.21 Thailand 107 2.48 2.17 0.65Indonesia 2,075 73.23 2.03 0.95 Malaysia 92 2.83 1.85 0.56Brazil 1,939 88.42 1.89 0.89 Iran (Islamic Republic of) 67 7.15 1.36 0.41China, Taiwan Province of 1,858 70.88 1.81 0.85 Argentina 57 14.48 1.15 0.35
Fashion GlasswareWorld 60,100 17.91 - 100.00 World 6,016 1.79 - 100.00Developed economies (1) 27,825 14.31 - 46.30 Developed economies (1) 4,175 2.15 - 69.39Developing economies 31,864 23.39 - 53.02 Developing economies 1,737 1.28 - 28.87Economies in transition (2) 161 17.65 - 0.27 Economies in transition (2) 42 2.00 - 0.69China 17,524 28.56 55.00 29.16 China 854 1.39 49.18 14.20China, SAR of Hong Kong 7,845 28.34 24.62 13.05 Turkey 304 5.99 17.52 5.06India 1,523 18.67 4.78 2.53 Indonesia 105 3.72 6.07 1.75Pakistan 767 48.54 2.41 1.28 China, SAR of Hong Kong 90 0.32 5.16 1.49Singapore 757 24.66 2.37 1.26 Thailand 61 1.42 3.53 1.02Republic of Korea 584 19.84 1.83 0.97 Brazil 59 2.70 3.41 0.99Turkey 542 10.67 1.70 0.90 Malaysia 58 1.79 3.34 0.96China, Taiwan Province of 424 16.15 1.33 0.70 Mexico 54 1.26 3.10 0.89Thailand 359 8.29 1.13 0.60 Iran (Islamic Republic of) 31 3.33 1.81 0.52Indonesia 277 9.79 0.87 0.46 China, Taiwan Province of 28 1.06 1.59 0.46
Interior JewelleryWorld 66,597 19.85 - 100.00 World 38,612 11.51 - 100.00Developed economies (1) 38,235 19.66 - 57.41 Developed economies (1) 20,183 10.38 - 52.27Developing economies 26,558 19.49 - 39.88 Developing economies 17,951 13.18 - 46.49Economies in transition (2) 820 19.73 - 1.23 Economies in transition (2) 475 9.60 - 1.23China 14,525 23.67 54.69 21.81 China, SAR of Hong Kong 4,275 15.45 23.82 11.07Mexico 1,481 34.69 5.58 2.22 India 3,821 46.86 21.29 9.90Malaysia 1,365 42.21 5.14 2.05 China 2,819 4.59 15.71 7.30Indonesia 1,317 46.51 4.96 1.98 Thailand 1,809 41.86 10.08 4.69China, SAR of Hong Kong 1,303 4.71 4.91 1.96 Turkey 1,170 23.03 6.52 3.03Thailand 1,137 26.30 4.28 1.71 Malaysia 954 29.52 5.32 2.47Turkey 1,061 20.89 4.00 1.59 Singapore 664 21.66 3.70 1.72China, Taiwan Province of 891 33.98 3.35 1.34 Mexico 600 14.05 3.34 1.55Brazil 857 39.11 3.23 1.29 Republic of Korea 547 18.60 3.05 1.42India 703 8.62 2.65 1.06 Jordan 175 66.21 0.97 0.45
Toys MUSICWorld 30,425 9.07 - 100.00 World 14,924 4.45 - 100.00Developed economies (1) 10,941 5.63 - 35.96 Developed economies (1) 13,424 6.90 - 89.94Developing economies 19,350 14.20 - 63.60 Developing economies 1,412 1.04 - 9.46Economies in transition (2) 40 10.77 - 0.13 Economies in transition (2) 63 3.09 - 0.42China 9,490 15.47 49.05 31.19 Mexico 249 5.84 17.66 1.67China, SAR of Hong Kong 8,293 29.96 42.86 27.26 China, Taiwan Province of 238 9.08 16.86 1.60China, Taiwan Province of 358 13.67 1.85 1.18 India 185 2.27 13.09 1.24Mexico 346 8.11 1.79 1.14 China, SAR of Hong Kong 181 0.65 12.82 1.21Thailand 199 4.61 1.03 0.66 China 135 0.22 9.59 0.91Republic of Korea 186 6.32 0.96 0.61 Singapore 119 3.88 8.43 0.80Indonesia 147 5.17 0.76 0.48 Malaysia 81 2.49 5.70 0.54Malaysia 119 3.68 0.61 0.39 Republic of Korea 80 2.73 5.69 0.54Singapore 55 1.81 0.29 0.18 Argentina 34 8.66 2.42 0.23Brazil 20 0.92 0.10 0.07 Colombia 20 3.56 1.43 0.14
Records PrintedWorld 14,805 4.41 - 100.00 World 119 0.04 - 100.00Developed economies (1) 13,308 6.84 - 89.89 Developed economies (1) 116 0.06 - 96.89Developing economies 1,409 1.03 - 9.51 Developing economies 4 0.00 - 3.01Economies in transition (2) 63 3.06 - 0.43 Economies in transition (2) 0 0.00 - 0.10Mexico 249 5.84 17.70 1.68 China, SAR of Hong Kong 3 0.01 80.53 2.43China, Taiwan Province of 238 9.08 16.90 1.61 Malaysia 0 0.00 3.99 0.12India 185 2.27 13.12 1.25 Colombia 0 0.01 2.31 0.07China, SAR of Hong Kong 178 0.64 12.64 1.20 China, Taiwan Province of 0 0.00 1.74 0.05China 135 0.22 9.61 0.91 Mexico 0 0.00 1.70 0.05Singapore 119 3.88 8.45 0.80 Singapore 0 0.00 1.59 0.05Malaysia 80 2.49 5.71 0.54 South Africa 0 0.01 1.57 0.05Republic of Korea 80 2.73 5.70 0.54 Argentina 0 0.01 1.41 0.04Argentina 34 8.65 2.42 0.23 China 0 0.00 1.34 0.04Colombia 20 3.55 1.42 0.14 Thailand 0 0.00 1.02 0.03
Exporter
As %2005
Value (f.o.b. in
millions of $)of country
total
of total fordevelopingeconomies
of worldtotal Exporter
As %2005
Value (f.o.b. in
millions of $)of country
total
of total fordevelopingeconomies
of worldtotal

TA B L E
1.4.3.A CREATIVE GOODS: TOP 10 EXPORTERS AMONG DEVELOPINGECONOMIES, BY PRODUCT GROUP, 2005
278
Sta
tist
ical
Annex
Part
1
C R E AT I V E E C O N O M Y R E P O R T 2 0 0 8
NEW MEDIA Digital recordsWorld 12,035 3.59 - 100.00 World 2,282 0.68 - 100.00Developed economies (1) 6,471 3.33 - 53.77 Developed economies (1) 2,046 1.05 - 89.64Developing economies 5,508 4.04 - 45.77 Developing economies 230 0.17 - 10.09Economies in transition (2) 50 3.03 - 0.41 Economies in transition (2) 6 0.13 - 0.27China 3,940 6.42 71.54 32.74 Republic of Korea 86 2.94 37.52 3.79China, SAR of Hong Kong 1,020 3.68 18.52 8.47 India 44 0.54 19.13 1.93Singapore 193 6.29 3.50 1.60 Singapore 34 1.11 14.81 1.49Republic of Korea 100 3.39 1.81 0.83 China 24 0.04 10.61 1.07China, Taiwan Province of 77 2.95 1.40 0.64 Turkey 9 0.18 3.97 0.40Mexico 65 1.52 1.18 0.54 China, Taiwan Province of 9 0.35 3.95 0.40India 46 0.56 0.83 0.38 Pakistan 5 0.30 2.07 0.21Thailand 15 0.34 0.27 0.12 Thailand 5 0.11 2.07 0.21Turkey 9 0.18 0.17 0.08 Malaysia 5 0.15 2.05 0.21Malaysia 8 0.24 0.14 0.06 Philippines 3 0.35 1.37 0.14
Video games PUBLISHINGWorld 9,752 2.91 - 100.00 World 44,304 13.21 - 100.00Developed economies (1) 4,426 2.28 - 45.38 Developed economies (1) 36,593 18.82 - 82.60Developing economies 5,278 3.87 - 54.12 Developing economies 6,567 4.82 - 14.82Economies in transition (2) 44 1.95 - 0.45 Economies in transition (2) 1,096 14.59 - 2.47China 3,916 6.38 74.20 40.15 China, SAR of Hong Kong 1,552 5.61 23.63 3.50China, SAR of Hong Kong 1,020 3.68 19.32 10.46 China 1,146 1.87 17.45 2.59Singapore 159 5.18 3.01 1.63 Singapore 932 30.38 14.19 2.10China, Taiwan Province of 68 2.60 1.29 0.70 Republic of Korea 487 16.55 7.42 1.10Mexico 65 1.52 1.23 0.67 Mexico 417 9.77 6.35 0.94Republic of Korea 13 0.45 0.25 0.14 Namibia 216 90.21 3.28 0.49Thailand 10 0.23 0.19 0.10 Malaysia 190 5.88 2.90 0.43Indonesia 6 0.22 0.12 0.07 Indonesia 175 6.19 2.67 0.40Colombia 4 0.76 0.08 0.04 Chile 172 73.53 2.61 0.39South Africa 4 0.79 0.08 0.04 Colombia 169 29.95 2.58 0.38
Books NewpapersWorld 12,881 3.84 - 100.00 World 15,324 4.57 - 100.00Developed economies (1) 9,707 4.99 - 75.36 Developed economies (1) 13,629 7.01 - 88.94Developing economies 2,965 2.18 - 23.02 Developing economies 961 0.71 - 6.27Economies in transition (2) 203 4.30 - 1.58 Economies in transition (2) 709 5.79 - 4.62China, SAR of Hong Kong 1,104 3.99 37.25 8.57 Republic of Korea 303 10.31 31.56 1.98China 680 1.11 22.94 5.28 Chile 137 58.82 14.29 0.90Singapore 442 14.43 14.92 3.43 Indonesia 136 4.79 14.12 0.89Mexico 140 3.27 4.71 1.08 Philippines 67 7.37 6.95 0.44Colombia 121 21.37 4.08 0.94 Singapore 58 1.90 6.07 0.38Malaysia 107 3.31 3.61 0.83 South Africa 38 7.48 3.96 0.25Republic of Korea 81 2.75 2.73 0.63 China, SAR of Hong Kong 37 0.13 3.85 0.24Argentina 39 9.84 1.31 0.30 Mexico 35 0.83 3.68 0.23Thailand 36 0.82 1.20 0.28 Colombia 24 4.21 2.48 0.16China, Taiwan Province of 30 1.14 1.01 0.23 China 18 0.03 1.90 0.12
Other publishing VISUAL ARTSWorld 16,099 4.80 - 100.00 World 22,149 6.60 - 100.00Developed economies (1) 13,257 6.82 - 82.35 Developed economies (1) 15,651 8.05 - 70.66Developing economies 2,641 1.94 - 16.41 Developing economies 6,395 4.69 - 28.87Economies in transition (2) 184 4.50 - 1.14 Economies in transition (2) 71 7.22 - 0.32China 447 0.73 16.94 2.78 China 3,459 5.64 54.09 15.62Singapore 431 14.06 16.33 2.68 China, SAR of Hong Kong 839 3.03 13.11 3.79China, SAR of Hong Kong 411 1.48 15.55 2.55 India 503 6.17 7.87 2.27Mexico 242 5.67 9.17 1.51 Republic of Korea 262 8.90 4.10 1.18Namibia 215 90.08 8.15 1.34 Mexico 198 4.63 3.09 0.89India 129 1.58 4.88 0.80 Thailand 189 4.36 2.95 0.85South Africa 105 20.57 3.96 0.65 Indonesia 182 6.44 2.85 0.82Republic of Korea 103 3.49 3.89 0.64 China, Taiwan Province of 180 6.86 2.81 0.81Thailand 74 1.70 2.79 0.46 Ghana 109 52.40 1.71 0.49Malaysia 66 2.03 2.48 0.41 Philippines 107 11.86 1.68 0.48
Painting PhotographyWorld 955 0.28 - 100.00 World 1,494 0.45 - 100.00Developed economies (1) 245 0.13 - 25.70 Developed economies (1) 979 0.50 - 65.52Developing economies 688 0.50 - 72.03 Developing economies 514 0.38 - 34.39Economies in transition (2) 2 0.35 - 0.25 Economies in transition (2) 0 0.39 - 0.03China 305 0.50 44.40 31.98 China, SAR of Hong Kong 160 0.58 31.23 10.74Thailand 94 2.17 13.64 9.83 China 139 0.23 27.07 9.31Indonesia 83 2.92 12.02 8.66 China, Taiwan Province of 108 4.13 21.09 7.25China, SAR of Hong Kong 63 0.23 9.23 6.65 Republic of Korea 54 1.85 10.57 3.64Mexico 57 1.35 8.36 6.02 Singapore 28 0.92 5.46 1.88Malaysia 34 1.04 4.87 3.51 Mexico 7 0.16 1.36 0.47Brazil 24 1.09 3.48 2.51 Saudi Arabia 3 0.82 0.63 0.22China, Taiwan Province of 12 0.46 1.74 1.26 Indonesia 3 0.11 0.61 0.21India 4 0.05 0.57 0.41 Malaysia 2 0.07 0.43 0.15Morocco 3 1.40 0.43 0.31 India 2 0.03 0.43 0.15
Exporter
As %2005
Value (f.o.b. in
millions of $)of country
total
of total fordevelopingeconomies
of worldtotal Exporter
As %2005
Value (f.o.b. in
millions of $)of country
total
of total fordevelopingeconomies
of worldtotal
CONTINUED

TA B L E
1.4.3.A
279
Sta
tistical
Annex
Part
1
C R E AT I V E E C O N O M Y R E P O R T 2 0 0 8
Sculpture AntiquesWorld 6,078 1.81 - 100.00 World 2,536 0.76 - 100.00Developed economies (1) 1,825 0.94 - 30.02 Developed economies (1) 2,352 1.21 - 92.77Developing economies 4,177 3.07 - 68.73 Developing economies 183 0.13 - 7.21Economies in transition (2) 65 2.27 - 1.07 Economies in transition (2) 0 0.01 - 0.02China 2,972 4.84 71.15 48.90 China, SAR of Hong Kong 169 0.61 92.51 6.67China, SAR of Hong Kong 406 1.47 9.72 6.68 Singapore 8 0.25 4.24 0.31Mexico 124 2.90 2.96 2.04 China 2 0.00 1.17 0.08Ghana 109 52.30 2.62 1.80 Saudi Arabia 1 0.23 0.50 0.04Philippines 102 11.21 2.43 1.67 Argentina 1 0.13 0.29 0.02Thailand 93 2.14 2.22 1.52 Republic of Korea 1 0.02 0.28 0.02Indonesia 90 3.18 2.16 1.48 Peru 1 0.21 0.28 0.02China, Taiwan Province of 58 2.21 1.38 0.95 South Africa 0 0.07 0.19 0.01Pakistan 39 2.44 0.92 0.64 Chile 0 0.10 0.13 0.01India 38 0.47 0.91 0.63 China, Taiwan Province of 0 0.01 0.11 0.01
Other visual artsWorld 11,087 3.30 - 100.00Developed economies (1) 10,250 5.27 - 92.45Developing economies 833 0.61 - 7.52Economies in transition (2) 3 3.30 - 0.03India 459 5.63 55.07 4.14Republic of Korea 173 5.87 20.72 1.56Singapore 50 1.61 5.94 0.45China 40 0.07 4.80 0.36China, SAR of Hong Kong 40 0.14 4.76 0.36South Africa 16 3.25 1.98 0.15Mexico 10 0.22 1.15 0.09Malaysia 6 0.20 0.77 0.06Indonesia 6 0.23 0.77 0.06Brazil 6 0.25 0.66 0.05
SOURCE: UNCTAD secretariat calculations based on United Nations Comtrade database data.NOTES: (1) Developed economies, including Bulgaria and Romania.
(2) Excluding Bulgaria and Romania, which are included in the European Union (EU-27).
Exporter
As %2005
Value (f.o.b. in
millions of $)of country
total
of total fordevelopingeconomies
of worldtotal Exporter
As %2005
Value (f.o.b. in
millions of $)of country
total
of total fordevelopingeconomies
of worldtotal

TA B L E
1.4.3.B CREATIVE GOODS: TOP 10 IMPORTERS AMONG DEVELOPINGECONOMIES, BY PRODUCT GROUP, 2005
280
Sta
tist
ical
Annex
Part
1
C R E AT I V E E C O N O M Y R E P O R T 2 0 0 8
ALL CREATIVE INDUSTRIES ARTS AND CRAFTSWorld 350,884 100.00 - 100.00 World 25,091 7.15 - 100.00Developed economies (1) 284,147 100.00 - 80.53 Developed economies (1) 20,174 7.14 - 80.40Developing economies 60,759 100.00 - 17.32 Developing economies 4,390 7.23 - 17.50Economies in transition (2) 5,978 100.00 - 1.70 Economies in transition (2) 421 7.05 - 1.68China, SAR of Hong Kong 21,136 100.00 34.79 6.02 China, SAR of Hong Kong 1,677 7.94 38.21 6.68Mexico 4,616 100.00 7.60 1.32 China 400 10.88 9.11 1.59Singapore 3,719 100.00 6.12 1.06 Mexico 350 7.58 7.97 1.40China 3,676 100.00 6.05 1.05 Turkey 231 10.17 5.27 0.92Republic of Korea 3,245 100.00 5.34 0.92 Republic of Korea 205 6.31 4.66 0.82China, Taiwan Province of 2,382 100.00 3.92 0.68 Saudi Arabia 198 10.10 4.50 0.79Turkey 2,276 100.00 3.75 0.65 Singapore 106 2.86 2.42 0.42Saudi Arabia 1,957 100.00 3.22 0.56 South Africa 79 5.61 1.80 0.31India 1,638 100.00 2.70 0.47 China, Taiwan Province of 71 2.96 1.61 0.28South Africa 1,408 100.00 2.32 0.40 Venezuela (Bolivarian Republic of) 62 6.48 1.42 0.25
Carpets CelebrationWorld 4,033 1.15 - 100.00 World 5,698 1.62 - 100.00Developed economies (1) 3,568 1.26 - 88.47 Developed economies (1) 5,045 1.79 - 88.54Developing economies 375 0.62 - 9.31 Developing economies 591 0.97 - 10.37Economies in transition (2) 70 1.17 - 1.74 Economies in transition (2) 54 0.90 - 0.95Saudi Arabia 78 3.98 20.77 1.93 China, SAR of Hong Kong 372 1.76 62.95 6.53Turkey 77 3.37 20.41 1.90 Mexico 63 1.37 10.71 1.11South Africa 25 1.76 6.59 0.61 Colombia 16 3.65 2.76 0.29Singapore 18 0.49 4.89 0.46 Chile 12 1.72 2.00 0.21China, SAR of Hong Kong 18 0.08 4.67 0.43 Venezuela (Bolivarian Republic of) 11 1.09 1.78 0.18Qatar 16 3.41 4.36 0.41 Republic of Korea 10 0.31 1.71 0.18Republic of Korea 15 0.45 3.90 0.36 Brazil 10 1.30 1.65 0.17Mexico 14 0.31 3.83 0.36 Singapore 9 0.26 1.61 0.17Chile 12 1.77 3.25 0.30 Ecuador 8 2.15 1.33 0.14Malaysia 12 1.19 3.11 0.29 China, Taiwan Province of 7 0.31 1.24 0.13
Paperware WickerwareWorld 118 0.03 - 100.00 World 1,786 0.51 - 100.00Developed economies (1) 99 0.04 - 83.83 Developed economies (1) 1,643 0.58 - 91.98Developing economies 18 0.03 - 15.11 Developing economies 131 0.22 - 7.32Economies in transition (2) 0 0.01 - 0.26 Economies in transition (2) 11 0.18 - 0.60Republic of Korea 2 0.08 13.65 2.06 Republic of Korea 27 0.84 20.87 1.53Oman 2 0.89 12.81 1.94 China, SAR of Hong Kong 25 0.12 19.40 1.42India 2 0.12 10.75 1.62 Saudi Arabia 11 0.57 8.61 0.63Qatar 2 0.36 9.74 1.47 China, Taiwan Province of 10 0.44 8.00 0.59China 2 0.04 8.58 1.30 Turkey 8 0.35 6.11 0.45Saudi Arabia 1 0.07 7.34 1.11 South Africa 8 0.56 5.99 0.44China, SAR of Hong Kong 1 0.00 5.59 0.84 Mexico 8 0.17 5.97 0.44China, Taiwan Province of 1 0.04 4.88 0.74 Brazil 3 0.43 2.44 0.18Yemen 1 0.39 4.40 0.67 Chile 3 0.44 2.30 0.17Tunisia 1 0.14 3.20 0.48 Thailand 3 0.27 2.24 0.16
Yarn Other arts and craftsWorld 3,884 1.11 - 100.00 World 9,572 2.73 - 100.00Developed economies (1) 3,166 1.12 - 81.50 Developed economies (1) 6,654 2.35 - 69.52Developing economies 657 1.08 - 16.90 Developing economies 2,619 4.31 - 27.36Economies in transition (2) 38 0.64 - 0.99 Economies in transition (2) 248 4.15 - 2.59Mexico 150 3.24 22.77 3.85 China, SAR of Hong Kong 1,169 5.53 44.62 12.21China, SAR of Hong Kong 93 0.44 14.15 2.39 China 327 8.90 12.50 3.42China 55 1.50 8.38 1.42 Republic of Korea 118 3.63 4.50 1.23Saudi Arabia 48 2.47 7.37 1.25 Mexico 115 2.49 4.39 1.20Turkey 44 1.95 6.74 1.14 Turkey 97 4.24 3.69 1.01Republic of Korea 32 1.00 4.92 0.83 Saudi Arabia 57 2.92 2.18 0.60Singapore 28 0.75 4.24 0.72 Singapore 48 1.29 1.83 0.50Morocco 22 5.01 3.35 0.57 Philippines 46 11.95 1.75 0.48Thailand 20 1.85 3.05 0.52 Venezuela (Bolivarian Republic of) 41 4.24 1.56 0.43Malaysia 12 1.21 1.82 0.31 China, Taiwan Province of 40 1.69 1.54 0.42
AUDIOVISUALS FilmWorld 650 0.19 - 100.00 World 650 0.19 - 100.00Developed economies (1) 526 0.19 - 80.99 Developed economies (1) 526 0.19 - 80.99Developing economies 116 0.19 - 17.86 Developing economies 116 0.19 - 17.86Economies in transition (2) 7 0.12 - 1.06 Economies in transition (2) 7 0.12 - 1.06Republic of Korea 60 1.84 51.46 9.19 Republic of Korea 60 1.84 51.46 9.19Turkey 9 0.38 7.44 1.33 Turkey 9 0.38 7.44 1.33Mexico 5 0.10 4.10 0.73 Mexico 5 0.10 4.10 0.73India 4 0.25 3.58 0.64 India 4 0.25 3.58 0.64China, Taiwan Province of 4 0.17 3.54 0.63 China, Taiwan Province of 4 0.17 3.54 0.63Thailand 4 0.37 3.43 0.61 Thailand 4 0.37 3.43 0.61South Africa 3 0.25 2.99 0.53 South Africa 3 0.25 2.99 0.53Indonesia 3 1.09 2.92 0.52 Indonesia 3 1.09 2.92 0.52Chile 3 0.47 2.77 0.50 Chile 3 0.47 2.77 0.50Venezuela (Bolivarian Republic of) 2 0.26 2.13 0.38 Venezuela (Bolivarian Republic of) 2 0.26 2.13 0.38
Importer
As %2005
Value (c.i.f. in
millions of $)of country
total
of total fordevelopingeconomies
of worldtotal Importer
As %2005
Value (c.i.f. in
millions of $))of country
total
of total fordevelopingeconomies
of worldtotal

TA B L E
1.4.3.B
281
Sta
tistical
Annex
Part
1
C R E AT I V E E C O N O M Y R E P O R T 2 0 0 8
DESIGN GraphicWorld 228,428 65.10 - 100.00 World 17,449 4.97 - 100.00Developed economies (1) 184,052 65.14 - 80.57 Developed economies (1) 13,810 4.89 - 79.15Developing economies 39,257 64.61 - 17.19 Developing economies 2,644 4.35 - 15.15Economies in transition (2) 3,967 66.35 - 1.74 Economies in transition (2) 750 12.54 - 4.30China, SAR of Hong Kong 16,315 77.19 41.56 7.14 Saudi Arabia 342 17.50 12.95 1.96Mexico 2,928 63.43 7.46 1.28 Republic of Korea 268 8.27 10.16 1.54Singapore 2,647 71.17 6.74 1.16 China, Taiwan Province of 126 5.29 4.77 0.72Republic of Korea 2,130 65.62 5.42 0.93 China, SAR of Hong Kong 125 0.59 4.74 0.72China 1,642 44.68 4.18 0.72 Mexico 116 2.52 4.39 0.67Saudi Arabia 1,495 76.39 3.81 0.65 Turkey 116 5.08 4.38 0.66Turkey 1,322 58.09 3.37 0.58 India 105 6.42 3.98 0.60China, Taiwan Province of 1,313 55.12 3.34 0.57 South Africa 104 7.38 3.93 0.60South Africa 790 56.11 2.01 0.35 Singapore 81 2.17 3.05 0.46Thailand 642 59.20 1.63 0.28 Qatar 73 15.28 2.77 0.42
Fashion GlasswareWorld 60,792 17.33 - 100.00 World 5,524 1.57 - 100.00Developed economies (1) 46,802 16.56 - 76.99 Developed economies (1) 4,425 1.57 - 80.10Developing economies 12,767 21.01 - 21.00 Developing economies 892 1.47 - 16.16Economies in transition (2) 841 14.07 - 1.38 Economies in transition (2) 168 2.82 - 3.04China, SAR of Hong Kong 6,070 28.72 47.55 9.99 China, SAR of Hong Kong 110 0.52 12.38 2.00Singapore 881 23.70 6.90 1.45 Republic of Korea 67 2.07 7.52 1.22Republic of Korea 805 24.80 6.30 1.32 Iran (Islamic Republic of) 60 18.75 6.75 1.09Mexico 709 15.36 5.55 1.17 Mexico 56 1.20 6.22 1.00Saudi Arabia 458 23.40 3.59 0.75 China 50 1.37 5.65 0.91China, Taiwan Province of 447 18.77 3.50 0.74 Turkey 50 2.19 5.58 0.90China 442 12.02 3.46 0.73 South Africa 47 3.30 5.21 0.84Turkey 421 18.52 3.30 0.69 Saudi Arabia 42 2.17 4.75 0.77Tunisia 264 62.61 2.07 0.43 Malaysia 37 3.78 4.15 0.67South Africa 217 15.41 1.70 0.36 India 35 2.16 3.96 0.64
Interior JewelleryWorld 70,345 20.05 - 100.00 World 31,254 8.91 - 100.00Developed economies (1) 60,693 21.48 - 86.28 Developed economies (1) 24,549 8.69 - 78.55Developing economies 7,655 12.60 - 10.88 Developing economies 6,483 10.67 - 20.74Economies in transition (2) 1,615 27.02 - 2.30 Economies in transition (2) 213 3.56 - 0.68China, SAR of Hong Kong 1,364 6.46 17.82 1.94 China, SAR of Hong Kong 2,641 12.50 40.74 8.45Mexico 1,102 23.87 14.39 1.57 Singapore 1,155 31.05 17.81 3.69China 567 15.43 7.41 0.81 Mexico 379 8.20 5.84 1.21Republic of Korea 502 15.46 6.55 0.71 China, Taiwan Province of 269 11.30 4.15 0.86Saudi Arabia 433 22.12 5.66 0.62 China 268 7.30 4.14 0.86Singapore 380 10.22 4.96 0.54 Turkey 239 10.48 3.68 0.76Turkey 361 15.88 4.72 0.51 Thailand 209 19.31 3.23 0.67China, Taiwan Province of 246 10.32 3.21 0.35 India 177 10.82 2.73 0.57South Africa 222 15.80 2.91 0.32 Republic of Korea 174 5.35 2.68 0.56Malaysia 193 19.65 2.52 0.27 Jordan 161 40.18 2.48 0.51
Toys MUSICWorld 43,064 12.27 - 100.00 World 16,419 4.68 - 100.00Developed economies (1) 33,773 11.95 - 78.43 Developed economies (1) 13,737 4.86 - 83.66Developing economies 8,816 14.51 - 20.47 Developing economies 2,413 3.97 - 14.70Economies in transition (2) 379 6.35 - 0.88 Economies in transition (2) 171 2.86 - 1.04China, SAR of Hong Kong 6,004 28.40 68.10 13.94 China 1,052 28.61 43.58 6.41Mexico 567 12.27 6.43 1.32 Republic of Korea 235 7.23 9.73 1.43Republic of Korea 314 9.67 3.56 0.73 China, SAR of Hong Kong 149 0.70 6.17 0.91China 271 7.38 3.08 0.63 Mexico 145 3.15 6.03 0.89China, Taiwan Province of 198 8.29 2.24 0.46 Thailand 122 11.28 5.06 0.74Turkey 135 5.95 1.54 0.31 South Africa 118 8.38 4.89 0.72South Africa 133 9.43 1.51 0.31 China, Taiwan Province of 95 4.00 3.95 0.58Singapore 125 3.37 1.42 0.29 Turkey 70 3.06 2.88 0.42Chile 97 14.12 1.10 0.23 Singapore 68 1.83 2.81 0.41Brazil 93 12.47 1.05 0.22 Venezuela (Bolivarian Republic of) 36 3.75 1.50 0.22
Records PRINTEDWorld 16,312 4.65 - 100.00 World 107 0.03 - 100.00Developed economies (1) 13,639 4.83 - 83.62 Developed economies (1) 97 0.03 - 90.69Developing economies 2,404 3.96 - 14.73 Developing economies 10 0.02 - 9.10Economies in transition (2) 171 2.85 - 1.05 Economies in transition (2) 0 0.00 - 0.21China 1,052 28.61 43.75 6.45 China, SAR of Hong Kong 3 0.01 25.83 2.35Republic of Korea 234 7.20 9.72 1.43 Singapore 1 0.04 13.77 1.25China, SAR of Hong Kong 146 0.69 6.09 0.90 Republic of Korea 1 0.04 12.21 1.11Mexico 145 3.14 6.03 0.89 South Africa 1 0.05 6.99 0.64Thailand 122 11.24 5.07 0.75 Mexico 1 0.01 6.29 0.57South Africa 117 8.34 4.88 0.72 Malaysia 1 0.06 6.05 0.55China, Taiwan Province of 95 3.98 3.95 0.58 Aruba 1 1.45 5.70 0.52Turkey 70 3.06 2.89 0.43 China, Taiwan Province of 0 0.02 4.47 0.41Singapore 67 1.79 2.77 0.41 Thailand 0 0.03 3.86 0.35Venezuela (Bolivarian Republic of) 36 3.75 1.50 0.22 Trinidad and Tobago 0 0.24 3.03 0.28
Importer
As %2005
Value (c.i.f. in
millions of $)of country
total
of total fordevelopingeconomies
of worldtotal Importer
As %2005
Value (c.i.f. in
millions of $)of country
total
of total fordevelopingeconomies
of worldtotal

TA B L E
1.4.3.B CREATIVE GOODS: TOP 10 IMPORTERS AMONG DEVELOPINGECONOMIES, BY PRODUCT GROUP, 2005
282
Sta
tist
ical
Annex
Part
1
C R E AT I V E E C O N O M Y R E P O R T 2 0 0 8
CONTINUED
NEW MEDIA Digital recordsWorld 13,402 3.82 - 100.00 World 2,436 0.69 - 100.00Developed economies (1) 10,718 3.79 - 79.97 Developed economies (1) 1,865 0.66 - 76.53Developing economies 2,465 4.06 - 18.39 Developing economies 560 0.92 - 23.00Economies in transition (2) 187 3.12 - 1.39 Economies in transition (2) 10 0.15 - 0.39China, SAR of Hong Kong 1,015 4.80 41.19 7.58 Turkey 140 6.15 24.99 5.75Singapore 194 5.22 7.87 1.45 China, Taiwan Province of 101 4.25 18.08 4.16Mexico 185 4.01 7.51 1.38 Malaysia 52 5.35 9.37 2.15China, Taiwan Province of 181 7.61 7.35 1.35 South Africa 40 2.86 7.19 1.65Turkey 151 6.62 6.11 1.12 Thailand 36 3.36 6.50 1.50South Africa 112 7.94 4.53 0.83 India 34 2.10 6.15 1.41Malaysia 67 6.78 2.70 0.50 Sri Lanka 34 12.95 5.98 1.38China 57 1.56 2.33 0.43 Pakistan 24 8.30 4.35 1.00Argentina 55 9.84 2.24 0.41 Saudi Arabia 20 1.01 3.51 0.81Peru 40 11.85 1.62 0.30 Singapore 15 0.41 2.71 0.62
Video games PUBLISHINGWorld 10,966 3.13 - 100.00 World 45,783 13.05 - 100.00Developed economies (1) 8,853 3.12 - 80.73 Developed economies (1) 34,740 12.29 - 75.88Developing economies 1,905 3.13 - 17.37 Developing economies 9,735 16.02 - 21.26Economies in transition (2) 177 2.96 - 1.61 Economies in transition (2) 1,124 18.80 - 2.46China, SAR of Hong Kong 1,015 4.80 53.31 9.26 China, SAR of Hong Kong 1,141 5.40 11.72 2.49Mexico 183 3.96 9.59 1.67 Mexico 904 19.58 9.28 1.97Singapore 179 4.81 9.39 1.63 India 892 54.47 9.17 1.95China, Taiwan Province of 80 3.35 4.19 0.73 Singapore 498 13.39 5.11 1.09South Africa 71 5.07 3.75 0.65 China 488 13.27 5.01 1.07Argentina 55 9.76 2.87 0.50 Venezuela (Bolivarian Republic of) 482 50.09 4.96 1.05China 49 1.33 2.56 0.45 Turkey 444 19.51 4.56 0.97Peru 40 11.79 2.08 0.36 China, Taiwan Province of 444 18.63 4.56 0.97Chile 24 3.52 1.27 0.22 Ghana 425 73.68 4.36 0.93Paraguay 24 14.00 1.27 0.22 Brazil 303 40.72 3.12 0.66
Books NewspapersWorld 13,836 3.94 - 100.00 World 17,081 4.87 - 100.00Developed economies (1) 10,305 3.65 - 74.48 Developed economies (1) 13,409 4.75 - 78.50Developing economies 3,266 5.37 - 23.60 Developing economies 3,098 5.10 - 18.13Economies in transition (2) 234 3.91 - 1.69 Economies in transition (2) 518 8.66 - 3.03China, SAR of Hong Kong 666 3.15 20.39 4.81 India 443 27.05 14.31 2.59Mexico 389 8.43 11.91 2.81 Turkey 335 14.71 10.81 1.96Singapore 263 7.07 8.05 1.90 China, Taiwan Province of 268 11.26 8.66 1.57South Africa 207 14.68 6.33 1.49 China, SAR of Hong Kong 229 1.09 7.40 1.34Venezuela (Bolivarian Republic of) 199 20.68 6.10 1.44 Venezuela (Bolivarian Republic of) 203 21.10 6.56 1.19Republic of Korea 147 4.52 4.49 1.06 Brazil 203 27.24 6.55 1.19China, Taiwan Province of 111 4.66 3.40 0.80 China 192 5.22 6.20 1.12Malaysia 104 10.60 3.19 0.75 Mexico 144 3.13 4.66 0.85India 84 5.10 2.56 0.60 Singapore 105 2.84 3.40 0.62China 72 1.96 2.21 0.52 Thailand 103 9.51 3.33 0.60
Other publishing VISUAL ARTSWorld 14,866 4.24 - 100.00 World 21,111 6.02 - 100.00Developed economies (1) 11,027 3.90 - 74.17 Developed economies (1) 18,610 6.59 - 88.16Developing economies 3,372 5.55 - 22.68 Developing economies 2,382 3.92 - 11.28Economies in transition (2) 373 6.24 - 2.51 Economies in transition (2) 102 1.71 - 0.48Ghana 375 65.10 11.13 2.52 China, SAR of Hong Kong 835 3.95 35.07 3.96Mexico 370 8.02 10.98 2.49 Republic of Korea 339 10.46 14.25 1.61India 366 22.31 10.84 2.46 China, Taiwan Province of 274 11.51 11.51 1.30China, SAR of Hong Kong 246 1.16 7.30 1.66 Singapore 204 5.48 8.56 0.97Zambia 240 83.48 7.11 1.61 Iran (Islamic Republic of) 103 31.96 4.31 0.49China 224 6.08 6.63 1.50 Mexico 99 2.14 4.15 0.47Yemen 134 67.39 3.99 0.90 South Africa 54 3.85 2.27 0.26Singapore 129 3.48 3.84 0.87 Turkey 50 2.18 2.08 0.24Suriname 125 81.18 3.71 0.84 Venezuela (Bolivarian Republic of) 49 5.10 2.06 0.23Malaysia 85 8.68 2.53 0.57 Saudi Arabia 36 1.83 1.50 0.17
Painting PhotographyWorld 963 0.27 - 100.00 World 1,674 0.48 - 100.00Developed economies (1) 870 0.31 - 90.38 Developed economies (1) 851 0.30 - 50.82Developing economies 85 0.14 - 8.81 Developing economies 815 1.34 - 48.70Economies in transition (2) 7 0.10 - 0.69 Economies in transition (2) 7 0.10 - 0.41China, SAR of Hong Kong 46 0.22 54.64 4.81 China, SAR of Hong Kong 226 1.07 27.71 13.50Republic of Korea 6 0.18 7.07 0.62 China, Taiwan Province of 219 9.21 26.91 13.11China, Taiwan Province of 5 0.22 6.07 0.53 Republic of Korea 209 6.43 25.59 12.46Mexico 5 0.10 5.37 0.47 Singapore 120 3.23 14.73 7.18Saudi Arabia 3 0.14 3.17 0.28 China 6 0.17 0.78 0.38South Africa 2 0.14 2.33 0.21 Mexico 6 0.13 0.75 0.36Turkey 2 0.08 2.21 0.19 Malaysia 5 0.54 0.64 0.31Thailand 2 0.16 2.10 0.18 Turkey 2 0.10 0.27 0.13Singapore 2 0.05 1.99 0.17 South Africa 2 0.15 0.26 0.13Malaysia 2 0.16 1.87 0.16 Saudi Arabia 2 0.10 0.24 0.12
Importer
As %2005
Value (c.i.f. in
millions of $)of country
total
of total fordevelopingeconomies
of worldtotal Importer
As %2005
Value (c.i.f. in
millions of $))of country
total
of total fordevelopingeconomies
of worldtotal

TA B L E
1.4.3.B
283
Sta
tistical
Annex
Part
1
C R E AT I V E E C O N O M Y R E P O R T 2 0 0 8
Sculpture AntiquesWorld 5,691 1.62 - 100.00 World 2,617 0.75 - 100.00Developed economies (1) 4,814 1.70 - 84.59 Developed economies (1) 2,448 0.87 - 93.55Developing economies 795 1.31 - 13.97 Developing economies 168 0.28 - 6.42Economies in transition (2) 68 1.14 - 1.20 Economies in transition (2) 1 0.01 - 0.03China, SAR of Hong Kong 324 1.53 40.72 5.69 China, SAR of Hong Kong 128 0.61 76.39 4.91Mexico 76 1.64 9.52 1.33 Republic of Korea 11 0.33 6.46 0.41Turkey 39 1.72 4.92 0.69 Singapore 10 0.26 5.85 0.38China, Taiwan Province of 38 1.59 4.76 0.66 South Africa 5 0.38 3.20 0.21Pakistan 25 8.50 3.14 0.44 Turkey 4 0.17 2.30 0.15China 25 0.68 3.13 0.44 Malaysia 3 0.30 1.74 0.11Singapore 24 0.65 3.04 0.42 China, Taiwan Province of 2 0.08 1.13 0.07Saudi Arabia 24 1.23 3.02 0.42 China 2 0.04 0.98 0.06South Africa 19 1.38 2.44 0.34 Mexico 1 0.02 0.52 0.03Brazil 18 2.43 2.28 0.32 Brazil 1 0.07 0.31 0.02
Other visual artsWorld 10,166 2.90 - 100.00Developed economies (1) 9,628 3.41 - 94.70Developing economies 519 0.85 - 5.10Economies in transition (2) 20 0.33 - 0.19China, SAR of Hong Kong 111 0.52 21.38 1.09Iran (Islamic Republic of) 99 30.85 19.11 0.98Republic of Korea 96 2.97 18.58 0.95Singapore 48 1.29 9.27 0.47Venezuela (Bolivarian Republic of) 42 4.35 8.07 0.41South Africa 25 1.79 4.87 0.25Argentina 15 2.74 2.96 0.15India 15 0.90 2.85 0.15Mexico 12 0.25 2.24 0.11China, Taiwan Province of 10 0.41 1.90 0.10
SOURCE: UNCTAD secretariat calculations based on United Nations Comtrade database data.NOTES: (1) Developed economies, including Bulgaria and Romania.
(2) Excluding Bulgaria and Romania, which are included in the European Union (EU-27).
Importer
As %2005
Value (c.i.f. in
millions of $)of country
total
of total fordevelopingeconomies
of worldtotal Importer
As %2005
Value (c.i.f. in
millions of $)of country
total
of total fordevelopingeconomies
of worldtotal

TA B L E
1.4.4.A CREATIVE GOODS: TOP 10 EXPORTERS AMONG ECONOMIES IN TRANSITION, BY PRODUCT GROUP, 2005
284
Sta
tist
ical
Annex
Part
1
C R E AT I V E E C O N O M Y R E P O R T 2 0 0 8
ALL CREATIVE INDUSTRIES ARTS AND CRAFTSWorld 335,494 100.00 - 100.00 World 23,244 6.93 - 100.00Developed economies (1) 196,109 100.00 - 58.45 Developed economies (1) 9,118 4.69 - 39.23Developing economies 136,231 100.00 - 40.61 Developing economies 13,881 10.19 - 59.72Economies in transition (2) 3,154 100.00 - 0.94 Economies in transition (2) 137 7.74 - 0.59Russian Federation 1,649 100.00 52.29 0.49 Russian Federation 45 2.72 32.80 0.19Belarus 419 100.00 13.28 0.12 Ukraine 32 9.40 23.04 0.14Croatia 397 100.00 12.60 0.12 Belarus 15 3.67 11.23 0.07Ukraine 336 100.00 10.65 0.10 Moldova 13 37.96 9.81 0.06Serbia and Montenegro 111 100.00 3.53 0.03 Croatia 11 2.77 8.04 0.05Bosnia and Herzegovina 70 100.00 2.22 0.02 Serbia and Montenegro 6 5.18 4.22 0.02Armenia 40 100.00 1.26 0.01 Bosnia and Herzegovina 5 6.96 3.55 0.02Moldova 35 100.00 1.12 0.01 Kazakhstan 4 11.59 2.56 0.02Kazakhstan 30 100.00 0.96 0.01 Macedonia, TFYR 3 11.31 2.17 0.01Macedonia, TFYR 26 100.00 0.83 0.01 Armenia 2 5.46 1.58 0.01
Carpets CelebrationWorld 4,071 1.21 - 100.00 World 3,118 0.93 - 100.00Developed economies (1) 1,577 0.81 - 38.74 Developed economies (1) 867 0.45 - 27.79Developing economies 2,452 1.80 - 60.24 Developing economies 2,234 1.64 - 71.65Economies in transition (2) 30 1.51 - 0.74 Economies in transition (2) 9 1.56 - 0.29Moldova 13 36.94 43.58 0.32 Ukraine 8 2.25 84.00 0.24Belarus 11 2.53 35.34 0.26 Russian Federation 1 0.04 7.35 0.02Serbia and Montenegro 4 3.41 12.68 0.09 Croatia 0 0.13 5.55 0.02Armenia 2 5.19 6.87 0.05 Albania 0 0.69 1.56 0.00Russian Federation 0 0.02 0.86 0.01 Armenia 0 0.17 0.77 0.00Bosnia and Herzegovina 0 0.21 0.49 0.00 Macedonia, TFYR 0 0.11 0.33 0.00Macedonia, TFYR 0 0.37 0.32 0.00 Serbia and Montenegro 0 0.03 0.33 0.00Ukraine 0 0.02 0.23 0.00 Kazakhstan 0 0.07 0.22 0.00Azerbaijan 0 1.29 0.22 0.00 Georgia 0 0.15 0.16 0.00Croatia 0 0.01 0.14 0.00 Belarus 0 0.00 0.14 0.00
Paperware WickerwareWorld 62 0.02 - 100.00 World 1,640 0.49 - 100.00Developed economies (1) 30 0.02 - 48.27 Developed economies (1) 256 0.13 - 15.59Developing economies 32 0.02 - 51.69 Developing economies 1,374 1.01 - 83.82Economies in transition (2) 0 0.00 - 0.01 Economies in transition (2) 7 0.46 - 0.41Albania 0 0.02 12.05 0.01 Croatia 2 0.51 28.88 0.12Kyrgyzstan 0 0.02 4.12 0.00 Bosnia and Herzegovina 2 2.83 28.28 0.12Serbia and Montenegro 0 0.00 1.36 0.00 Russian Federation 2 0.11 25.41 0.11Russian Federation 0 0.00 0.39 0.00 Belarus 0 0.11 6.80 0.03Macedonia, TFYR 0 0.00 0.35 0.00 Serbia and Montenegro 0 0.19 3.01 0.01Kazakhstan 0 0.00 0.01 0.00 Kazakhstan 0 0.48 2.07 0.01Armenia 0 0.00 0.00 0.00 Ukraine 0 0.01 0.44 0.00Azerbaijan 0 0.00 0.00 0.00 Macedonia, TFYR 0 0.01 0.05 0.00Georgia 0 0.00 0.00 0.00 Albania 0 0.01 0.04 0.00Turkmenistan 0 0.00 0.00 0.00 Georgia 0 0.01 0.01 0.00
Yarn Other arts and craftsWorld 4,808 1.43 - 100.00 World 9,546 2.85 - 100.00Developed economies (1) 1,692 0.87 - 35.18 Developed economies (1) 4,698 2.42 - 49.21Developing economies 3,048 2.24 - 63.38 Developing economies 4,741 3.48 - 49.66Economies in transition (2) 8 1.22 - 0.17 Economies in transition (2) 83 2.95 - 0.87Ukraine 2 0.66 27.88 0.05 Russian Federation 42 2.52 50.04 0.44Belarus 2 0.39 20.30 0.03 Ukraine 22 6.45 26.12 0.23Bosnia and Herzegovina 1 2.12 18.51 0.03 Croatia 8 1.99 9.53 0.08Macedonia, TFYR 1 2.93 9.60 0.02 Kazakhstan 3 10.95 3.99 0.03Russian Federation 1 0.04 8.87 0.01 Belarus 3 0.64 3.23 0.03Serbia and Montenegro 1 0.49 6.78 0.01 Macedonia, TFYR 2 7.88 2.49 0.02Croatia 1 0.14 6.71 0.01 Bosnia and Herzegovina 1 1.78 1.50 0.01Moldova 0 0.25 1.09 0.00 Serbia and Montenegro 1 1.07 1.43 0.01Kyrgyzstan 0 0.40 0.24 0.00 Georgia 0 4.49 0.52 0.00Albania 0 0.10 0.24 0.00 Moldova 0 0.77 0.33 0.00
AUDIOVISUALS FilmWorld 664 0.20 - 100.00 World 664 0.20 - 100.00Developed economies (1) 592 0.30 - 89.20 Developed economies (1) 592 0.30 - 89.20Developing economies 55 0.04 - 8.25 Developing economies 55 0.04 - 8.25Economies in transition (2) 2 0.16 - 0.35 Economies in transition (2) 2 0.16 - 0.35Russian Federation 1 0.09 70.49 0.21 Russian Federation 1 0.09 70.49 0.21Croatia 1 0.14 28.30 0.09 Croatia 1 0.14 28.30 0.09Serbia and Montenegro 0 0.15 8.11 0.02 Serbia and Montenegro 0 0.15 8.11 0.02Ukraine 0 0.02 3.49 0.01 Ukraine 0 0.02 3.49 0.01Belarus 0 0.02 3.16 0.01 Belarus 0 0.02 3.16 0.01Bosnia and Herzegovina 0 0.04 1.33 0.00 Bosnia and Herzegovina 0 0.04 1.33 0.00Armenia 0 0.06 1.15 0.00 Armenia 0 0.06 1.15 0.00Kazakhstan 0 0.01 0.08 0.00 Kazakhstan 0 0.01 0.08 0.00Albania 0 0.00 0.03 0.00 Albania 0 0.00 0.03 0.00Macedonia, TFYR 0 0.00 0.03 0.00 Macedonia, TFYR 0 0.00 0.03 0.00
Exporter
As %2005
Value (f.o.b. in
millions of $)of country
total
of total foreconomies
in transitionof world
total Exporter
As %2005
Value (f.o.b. in
millions of $))of country
total
of total foreconomies
in transitionof world
total

TA B L E
1.4.4.A
285
Sta
tistical
Annex
Part
1
C R E AT I V E E C O N O M Y R E P O R T 2 0 0 8
DESIGN GraphicWorld 218,173 65.03 - 100.00 World 16,422 4.89 - 100.00Developed economies (1) 112,595 57.91 - 51.61 Developed economies (1) 11,237 5.78 - 68.43Developing economies 102,413 75.18 - 46.94 Developing economies 4,954 3.64 - 30.17Economies in transition (2) 1,735 64.16 - 0.80 Economies in transition (2) 198 4.40 - 1.20Russian Federation 567 34.38 32.69 0.26 Belarus 75 17.97 38.02 0.46Belarus 353 84.17 20.32 0.16 Russian Federation 42 2.56 21.30 0.26Croatia 299 75.18 17.22 0.14 Croatia 26 6.64 13.32 0.16Ukraine 255 75.98 14.71 0.12 Ukraine 20 6.07 10.29 0.12Serbia and Montenegro 73 65.85 4.23 0.03 Serbia and Montenegro 15 13.31 7.49 0.09Bosnia and Herzegovina 56 79.77 3.21 0.03 Kazakhstan 8 27.12 4.15 0.05Armenia 36 90.05 2.06 0.02 Macedonia, TFYR 5 19.06 2.53 0.03Kazakhstan 23 76.41 1.33 0.01 Bosnia and Herzegovina 2 3.36 1.19 0.01Moldova 20 57.86 1.18 0.01 Moldova 1 4.16 0.74 0.01Macedonia, TFYR 20 78.03 1.18 0.01 Albania 1 3.16 0.32 0.00
Fashion GlasswareWorld 60,100 17.91 - 100.00 World 6,016 1.79 - 100.00Developed economies (1) 27,825 14.31 - 46.30 Developed economies (1) 4,175 2.15 - 69.39Developing economies 31,864 23.39 - 53.02 Developing economies 1,737 1.28 - 28.87Economies in transition (2) 161 17.65 - 0.27 Economies in transition (2) 42 2.00 - 0.69Russian Federation 42 2.53 25.94 0.07 Belarus 17 4.11 40.99 0.29Ukraine 29 8.69 18.13 0.05 Russian Federation 12 0.72 28.16 0.20Croatia 29 7.34 18.12 0.05 Ukraine 6 1.74 13.93 0.10Serbia and Montenegro 14 12.84 8.89 0.02 Serbia and Montenegro 5 4.08 10.82 0.08Belarus 14 3.26 8.48 0.02 Croatia 2 0.46 4.34 0.03Moldova 12 33.41 7.35 0.02 Bosnia and Herzegovina 0 0.13 0.21 0.00Macedonia, TFYR 10 38.14 6.22 0.02 Kyrgyzstan 0 1.78 0.20 0.00Albania 6 31.50 3.95 0.01 Moldova 0 0.15 0.13 0.00Bosnia and Herzegovina 3 3.94 1.71 0.00 Azerbaijan 0 0.63 0.08 0.00Georgia 1 9.56 0.57 0.00 Kazakhstan 0 0.10 0.07 0.00
Interior JewelleryWorld 66,597 19.85 - 100.00 World 38,612 11.51 - 100.00Developed economies (1) 38,235 19.66 - 57.41 Developed economies (1) 20,183 10.38 - 52.27Developing economies 26,558 19.49 - 39.88 Developing economies 17,951 13.18 - 46.49Economies in transition (2) 820 19.73 - 1.23 Economies in transition (2) 475 9.60 - 1.23Belarus 230 55.01 28.10 0.35 Russian Federation 290 17.57 61.01 0.75Ukraine 190 56.44 23.13 0.28 Croatia 126 31.61 26.45 0.33Russian Federation 174 10.57 21.26 0.26 Armenia 35 88.05 7.36 0.09Croatia 110 27.62 13.39 0.16 Kazakhstan 7 23.67 1.51 0.02Bosnia and Herzegovina 50 71.63 6.10 0.08 Ukraine 7 2.01 1.42 0.02Serbia and Montenegro 36 32.39 4.40 0.05 Georgia 4 43.56 0.88 0.01Kazakhstan 7 23.84 0.88 0.01 Kyrgyzstan 3 55.22 0.56 0.01Moldova 6 16.57 0.72 0.01 Serbia and Montenegro 2 2.23 0.52 0.01Albania 6 28.70 0.71 0.01 Albania 1 5.30 0.23 0.00Macedonia, TFYR 5 18.19 0.58 0.01 Moldova 0 0.42 0.03 0.00
Toys MUSICWorld 30,425 9.07 - 100.00 World 14,924 4.45 - 100.00Developed economies (1) 10,941 5.63 - 35.96 Developed economies (1) 13,424 6.90 - 89.94Developing economies 19,350 14.20 - 63.60 Developing economies 1,412 1.04 - 9.46Economies in transition (2) 40 10.77 - 0.13 Economies in transition (2) 63 3.09 - 0.42Belarus 16 3.82 39.95 0.05 Russian Federation 32 1.94 50.88 0.21Russian Federation 7 0.44 18.03 0.02 Belarus 9 2.26 15.03 0.06Croatia 6 1.51 14.97 0.02 Croatia 7 1.83 11.52 0.05Albania 4 18.57 9.38 0.01 Serbia and Montenegro 7 6.50 11.50 0.05Ukraine 4 1.04 8.76 0.01 Azerbaijan 3 62.09 5.02 0.02Serbia and Montenegro 1 1.01 2.81 0.00 Kazakhstan 1 4.73 2.27 0.01Moldova 1 3.14 2.78 0.00 Bosnia and Herzegovina 1 1.57 1.74 0.01Macedonia, TFYR 1 2.44 1.60 0.00 Macedonia, TFYR 1 3.02 1.26 0.01Bosnia and Herzegovina 0 0.58 1.02 0.00 Ukraine 0 0.15 0.79 0.00Kazakhstan 0 0.49 0.37 0.00 Moldova 0 0.03 0.02 0.00
Records PRINTEDWorld 14,805 4.41 - 100.00 World 119 0.04 - 100.00Developed economies (1) 13,308 6.84 - 89.89 Developed economies (1) 116 0.06 - 96.89Developing economies 1,409 1.03 - 9.51 Developing economies 4 0.00 - 3.01Economies in transition (2) 63 3.06 - 0.43 Economies in transition (2) 0 0.00 - 0.10Russian Federation 32 1.94 50.86 0.22 Croatia 0 0.02 77.76 0.08Belarus 9 2.26 15.03 0.06 Russian Federation 0 0.00 14.24 0.01Serbia and Montenegro 7 6.49 11.49 0.05 Serbia and Montenegro 0 0.01 6.41 0.01Croatia 7 1.80 11.37 0.05 Belarus 0 0.00 0.42 0.00Azerbaijan 3 62.09 5.02 0.02 Ukraine 0 0.00 0.03 0.00Kazakhstan 1 4.73 2.27 0.01 Armenia 0 0.00 0.00 0.00Bosnia and Herzegovina 1 1.57 1.74 0.01 Azerbaijan 0 0.00 0.00 0.00Macedonia, TFYR 1 3.02 1.26 0.01 Georgia 0 0.00 0.00 0.00Ukraine 0 0.15 0.79 0.00 Kazakhstan 0 0.00 0.00 0.00Moldova 0 0.03 0.02 0.00 Kyrgyzstan 0 0.00 0.00 0.00
Exporter
As %2005
Value (f.o.b. in
millions of $)of country
total
of total foreconomies
in transitionof world
total Exporter
As %2005
Value (f.o.b. in
millions of $)of country
total
of total foreconomies
in transitionof world
total

TA B L E
1.4.4.A CREATIVE GOODS: TOP 10 EXPORTERS AMONG ECONOMIES IN TRANSITION, BY PRODUCT GROUP, 2005
286
Sta
tist
ical
Annex
Part
1
C R E AT I V E E C O N O M Y R E P O R T 2 0 0 8
NEW MEDIA Digital recordsWorld 12,035 3.59 - 100.00 World 2,282 0.68 - 100.00Developed economies (1) 6,471 3.33 - 53.77 Developed economies (1) 2,046 1.05 - 89.64Developing economies 5,508 4.04 - 45.77 Developing economies 230 0.17 - 10.09Economies in transition (2) 50 3.03 - 0.41 Economies in transition (2) 6 0.13 - 0.27Russian Federation 19 1.18 38.81 0.16 Russian Federation 5 0.32 85.16 0.23Belarus 15 3.52 29.46 0.12 Croatia 0 0.12 7.52 0.02Croatia 8 1.90 15.11 0.06 Serbia and Montenegro 0 0.11 1.92 0.01Bosnia and Herzegovina 3 3.92 5.48 0.02 Moldova 0 0.14 0.80 0.00Ukraine 3 0.78 5.21 0.02 Kazakhstan 0 0.07 0.32 0.00Kazakhstan 1 4.88 2.95 0.01 Ukraine 0 0.01 0.29 0.00Serbia and Montenegro 1 0.98 2.19 0.01 Belarus 0 0.00 0.17 0.00Georgia 0 0.91 0.17 0.00 Bosnia and Herzegovina 0 0.01 0.10 0.00Moldova 0 0.16 0.11 0.00 Albania 0 0.02 0.07 0.00Albania 0 0.28 0.11 0.00 Macedonia, TFYR 0 0.01 0.03 0.00
Video games PUBLISHINGWorld 9,752 2.91 - 100.00 World 44,304 13.21 - 100.00Developed economies (1) 4,426 2.28 - 45.38 Developed economies (1) 36,593 18.82 - 82.60Developing economies 5,278 3.87 - 54.12 Developing economies 6,567 4.82 - 14.82Economies in transition (2) 44 1.95 - 0.45 Economies in transition (2) 1,096 14.59 - 2.47Belarus 15 3.51 33.45 0.15 Russian Federation 926 56.14 84.48 2.09Russian Federation 14 0.86 32.17 0.15 Croatia 65 16.30 5.91 0.15Croatia 7 1.78 16.11 0.07 Ukraine 45 13.36 4.10 0.10Bosnia and Herzegovina 3 3.91 6.21 0.03 Belarus 26 6.19 2.37 0.06Ukraine 3 0.77 5.88 0.03 Serbia and Montenegro 23 20.57 2.09 0.05Kazakhstan 1 4.81 3.31 0.01 Bosnia and Herzegovina 5 6.90 0.44 0.01Serbia and Montenegro 1 0.88 2.22 0.01 Macedonia, TFYR 2 6.87 0.16 0.00Georgia 0 0.91 0.20 0.00 Armenia 2 4.22 0.15 0.00Albania 0 0.26 0.12 0.00 Moldova 1 3.71 0.12 0.00Armenia 0 0.07 0.07 0.00 Kazakhstan 1 2.05 0.06 0.00
Books NewspapersWorld 12,881 3.84 - 100.00 World 15,324 4.57 - 100.00Developed economies (1) 9,707 4.99 - 75.36 Developed economies (1) 13,629 7.01 - 88.94Developing economies 2,965 2.18 - 23.02 Developing economies 961 0.71 - 6.27Economies in transition (2) 203 4.30 - 1.58 Economies in transition (2) 709 5.79 - 4.62Russian Federation 149 9.03 73.38 1.16 Russian Federation 635 38.49 89.53 4.14Belarus 21 5.07 10.47 0.16 Croatia 37 9.19 5.15 0.24Croatia 17 4.40 8.61 0.14 Ukraine 19 5.58 2.64 0.12Ukraine 7 2.21 3.65 0.06 Serbia and Montenegro 14 12.58 1.98 0.09Serbia and Montenegro 5 4.67 2.56 0.04 Bosnia and Herzegovina 3 3.76 0.37 0.02Bosnia and Herzegovina 1 1.63 0.56 0.01 Belarus 1 0.33 0.20 0.01Moldova 1 1.97 0.34 0.01 Macedonia, TFYR 0 1.13 0.04 0.00Armenia 0 1.05 0.21 0.00 Moldova 0 0.40 0.02 0.00Kazakhstan 0 1.16 0.17 0.00 Kazakhstan 0 0.07 0.00 0.00Azerbaijan 0 3.36 0.08 0.00 Georgia 0 0.07 0.00 0.00
Other publishing VISUAL ARTSWorld 16,099 4.80 - 100.00 World 22,149 6.60 - 100.00Developed economies (1) 13,257 6.82 - 82.35 Developed economies (1) 15,651 8.05 - 70.66Developing economies 2,641 1.94 - 16.41 Developing economies 6,395 4.69 - 28.87Economies in transition (2) 184 4.50 - 1.14 Economies in transition (2) 71 7.22 - 0.32Russian Federation 142 8.62 77.22 0.88 Russian Federation 59 3.55 82.43 0.26Ukraine 19 5.58 10.18 0.12 Croatia 7 1.88 10.53 0.03Croatia 11 2.71 5.85 0.07 Albania 2 8.49 2.42 0.01Serbia and Montenegro 4 3.33 2.02 0.02 Ukraine 1 0.32 1.53 0.00Belarus 3 0.78 1.78 0.02 Serbia and Montenegro 1 0.77 1.20 0.00Macedonia, TFYR 1 5.11 0.73 0.01 Belarus 1 0.18 1.04 0.00Armenia 1 3.16 0.68 0.01 Bosnia and Herzegovina 1 0.85 0.83 0.00Bosnia and Herzegovina 1 1.50 0.57 0.01 Macedonia, TFYR 0 0.69 0.26 0.00Moldova 0 1.34 0.26 0.00 Kazakhstan 0 0.33 0.14 0.00Albania 0 1.66 0.18 0.00 Moldova 0 0.27 0.14 0.00
Painting PhotographyWorld 955 0.28 _ 100.00 World 1,494 0.45 _ 100.00Developed economies (1) 245 0.13 _ 25.70 Developed economies (1) 979 0.50 _ 65.52Developing economies 688 0.50 _ 72.03 Developing economies 514 0.38 _ 34.39Economies in transition (2) 22 0.69 _ 2.27 Economies in transition (2) 1 0.05 _ 0.10Albania 2 8.07 7.53 0.17 Russian Federation 0 0.02 21.91 0.02Ukraine 1 0.16 2.56 0.06 Croatia 0 0.03 8.74 0.01Russian Federation 0 0.01 0.65 0.01 Serbia and Montenegro 0 0.02 1.90 0.00Belarus 0 0.01 0.27 0.01 Ukraine 0 0.00 0.40 0.00Serbia and Montenegro 0 0.02 0.11 0.00 Bosnia and Herzegovina 0 0.01 0.25 0.00Croatia 0 0.00 0.06 0.00 Macedonia, TFYR 0 0.01 0.20 0.00Georgia 0 0.03 0.02 0.00 Georgia 0 0.03 0.17 0.00Bosnia and Herzegovina 0 0.00 0.01 0.00 Belarus 0 0.00 0.10 0.00Kazakhstan 0 0.00 0.01 0.00 Kyrgyzstan 0 0.03 0.09 0.00Macedonia, TFYR 0 0.00 0.00 0.00 Kazakhstan 0 0.00 0.04 0.00
Exporter
As %2005
Value (f.o.b. in
millions of $)of country
total
of total foreconomies
in transitionof world
total Exporter
As %2005
Value (f.o.b. in
millions of $))of country
total
of total foreconomies
in transitionof world
total
CONTINUED

TA B L E
1.4.4.A
287
Sta
tistical
Annex
Part
1
C R E AT I V E E C O N O M Y R E P O R T 2 0 0 8
Sculpture AntiquesWorld 6,078 1.81 - 100.00 World 2,536 0.76 - 100.00Developed economies (1) 1,825 0.94 - 30.02 Developed economies (1) 2,352 1.21 - 92.77Developing economies 4,177 3.07 - 68.73 Developing economies 183 0.13 - 7.21Economies in transition (2) 65 2.27 - 1.07 Economies in transition (2) 0 0.01 - 0.02Russian Federation 57 3.44 87.38 0.93 Bosnia and Herzegovina 0 0.65 93.57 0.02Croatia 6 1.55 9.49 0.10 Ukraine 0 0.01 5.12 0.00Belarus 1 0.15 0.97 0.01 Croatia 0 0.00 1.09 0.00Ukraine 0 0.14 0.75 0.01 Armenia 0 0.00 0.00 0.00Serbia and Montenegro 0 0.36 0.62 0.01 Azerbaijan 0 0.00 0.00 0.00Bosnia and Herzegovina 0 0.16 0.18 0.00 Georgia 0 0.00 0.00 0.00Macedonia, TFYR 0 0.28 0.11 0.00 Kazakhstan 0 0.00 0.00 0.00Moldova 0 0.16 0.08 0.00 Kyrgyzstan 0 0.00 0.00 0.00Kazakhstan 0 0.13 0.06 0.00 Turkmenistan 0 0.00 0.00 0.00Albania 0 0.18 0.06 0.00 Albania 0 0.00 0.00 0.00
Other visual artsWorld 11,087 3.30 - 100.00Developed economies (1) 10,250 5.27 - 92.45Developing economies 833 0.61 - 7.52Economies in transition (2) 3 3.30 - 0.03Russian Federation 1 0.08 42.23 0.01Croatia 1 0.29 38.77 0.01Serbia and Montenegro 0 0.36 13.23 0.00Macedonia, TFYR 0 0.40 3.52 0.00Kazakhstan 0 0.20 1.97 0.00Belarus 0 0.01 1.70 0.00Albania 0 0.25 1.66 0.00Moldova 0 0.12 1.41 0.00Georgia 0 0.35 1.11 0.00Armenia 0 0.07 0.93 0.00
SOURCE: UNCTAD secretariat calculations based on United Nations Comtrade database data.NOTES: (1) Developed economies, including Bulgaria and Romania.
(2) Excluding Bulgaria and Romania, which are included in the European Union (EU-27).
Exporter
As %2005
Value (f.o.b. in
millions of $)of country
total
of total foreconomies
in transitionof world
total Exporter
As %2005
Value (f.o.b. in
millions of $)of country
total
of total foreconomies
in transitionof world
total

TA B L E
1.4.4.B CREATIVE GOODS: TOP 10 IMPORTERS AMONG ECONOMIES IN TRANSITION, BY PRODUCT GROUP, 2005
288
Sta
tist
ical
Annex
Part
1
C R E AT I V E E C O N O M Y R E P O R T 2 0 0 8
ALL CREATIVE INDUSTRIES ARTS AND CRAFTSWorld 350,884 100.00 - 100.00 World 25,091 7.15 - 100.00Developed economies (1) 284,147 100.00 - 80.53 Developed economies (1) 20,174 7.14 - 80.40Developing economies 60,759 100.00 - 17.32 Developing economies 4,390 7.23 - 17.50Economies in transition (2) 5,978 100.00 - 1.70 Economies in transition (2) 421 7.05 - 1.68Russian Federation 2,680 100.00 44.82 0.76 Russian Federation 190 7.08 45.06 0.76Croatia 877 100.00 14.66 0.25 Croatia 48 5.46 11.36 0.19Ukraine 662 100.00 11.07 0.19 Ukraine 46 6.91 10.86 0.18Kazakhstan 448 100.00 7.50 0.13 Kazakhstan 30 6.76 7.20 0.12Serbia and Montenegro 296 100.00 4.95 0.08 Belarus 24 12.08 5.64 0.09Bosnia and Herzegovina 263 100.00 4.41 0.08 Serbia and Montenegro 20 6.63 4.66 0.08Belarus 197 100.00 3.29 0.06 Bosnia and Herzegovina 18 6.68 4.18 0.07Albania 119 100.00 1.99 0.03 Macedonia, TFYR 14 14.16 3.28 0.05Moldova 102 100.00 1.71 0.03 Georgia 7 8.90 1.64 0.03Macedonia, TFYR 97 100.00 1.63 0.03 Albania 7 5.74 1.62 0.03
Carpets CelebrationWorld 4,033 1.15 - 100.00 World 5,698 1.62 - 100.00Developed economies (1) 3,568 1.26 - 88.47 Developed economies (1) 5,045 1.79 - 88.54Developing economies 375 0.62 - 9.31 Developing economies 591 0.97 - 10.37Economies in transition (2) 70 1.17 - 1.74 Economies in transition (2) 54 0.90 - 0.95Russian Federation 27 1.02 38.93 0.68 Russian Federation 35 1.30 64.68 0.61Ukraine 16 2.45 23.16 0.40 Croatia 7 0.84 13.67 0.13Croatia 10 1.16 14.50 0.25 Ukraine 4 0.53 6.52 0.06Bosnia and Herzegovina 4 1.60 6.03 0.10 Serbia and Montenegro 2 0.55 3.00 0.03Serbia and Montenegro 4 1.37 5.81 0.10 Kazakhstan 1 0.27 2.25 0.02Kazakhstan 2 0.43 2.74 0.05 Bosnia and Herzegovina 1 0.37 1.83 0.02Macedonia, TFYR 2 1.70 2.36 0.04 Belarus 1 0.45 1.64 0.02Kyrgyzstan 1 3.59 1.51 0.03 Albania 1 0.62 1.36 0.01Azerbaijan 1 1.16 1.50 0.03 Macedonia, TFYR 1 0.75 1.35 0.01Moldova 1 0.69 1.00 0.02 Georgia 1 0.77 1.11 0.01
Paperware WickerwareWorld 118 0.03 _ 100.00 World 1,786 0.51 - 100.00Developed economies (1) 99 0.04 _ 83.83 Developed economies (1) 1,643 0.58 - 91.98Developing economies 18 0.03 _ 15.11 Developing economies 131 0.22 - 7.32Economies in transition (2) 1 0.02 _ 1.05 Economies in transition (2) 11 0.18 - 0.60Macedonia, TFYR 0 0.10 8.01 0.08 Russian Federation 5 0.20 48.99 0.30Kazakhstan 0 0.01 4.89 0.05 Croatia 3 0.30 23.59 0.15Russian Federation 0 0.00 4.33 0.05 Serbia and Montenegro 1 0.34 9.12 0.06Croatia 0 0.00 2.72 0.03 Ukraine 1 0.10 6.07 0.04Serbia and Montenegro 0 0.01 1.86 0.02 Bosnia and Herzegovina 0 0.16 3.81 0.02Albania 0 0.01 1.01 0.01 Belarus 0 0.07 1.20 0.01Belarus 0 0.00 0.74 0.01 Macedonia, TFYR 0 0.13 1.11 0.01Ukraine 0 0.00 0.50 0.01 Kazakhstan 0 0.02 0.89 0.01Bosnia and Herzegovina 0 0.00 0.13 0.00 Albania 0 0.08 0.83 0.01Kyrgyzstan 0 0.00 0.09 0.00 Georgia 0 0.06 0.44 0.00
Yarn Other arts and craftsWorld 3,884 1.11 - 100.00 World 9,572 2.73 - 100.00Developed economies (1) 3,166 1.12 - 81.50 Developed economies (1) 6,654 2.35 - 69.52Developing economies 657 1.08 - 16.90 Developing economies 2,619 4.31 - 27.36Economies in transition (2) 38 0.64 - 0.99 Economies in transition (2) 248 4.15 - 2.59Russian Federation 14 0.54 37.98 0.37 Russian Federation 108 4.02 43.40 1.12Croatia 6 0.68 15.78 0.15 Kazakhstan 26 5.86 10.58 0.27Ukraine 5 0.82 14.29 0.14 Croatia 22 2.47 8.75 0.23Belarus 5 2.57 13.30 0.13 Ukraine 20 3.01 8.02 0.21Bosnia and Herzegovina 3 0.95 6.61 0.06 Belarus 17 8.72 6.91 0.18Macedonia, TFYR 2 1.65 4.23 0.04 Serbia and Montenegro 11 3.84 4.58 0.12Serbia and Montenegro 2 0.52 4.05 0.04 Macedonia, TFYR 10 9.83 3.86 0.10Kazakhstan 1 0.17 2.05 0.02 Bosnia and Herzegovina 9 3.59 3.82 0.10Moldova 0 0.41 1.09 0.01 Georgia 5 7.02 2.19 0.06Albania 0 0.20 0.61 0.01 Albania 5 4.36 2.09 0.05
AUDIOVISUALS FilmWorld 650 0.19 - 100.00 World 650 0.19 - 100.00Developed economies (1) 526 0.19 - 80.99 Developed economies (1) 526 0.19 - 80.99Developing economies 116 0.19 - 17.86 Developing economies 116 0.19 - 17.86Economies in transition (2) 7 0.12 - 1.06 Economies in transition (2) 7 0.12 - 1.06Ukraine 3 0.43 37.85 0.43 Ukraine 3 0.43 37.85 0.43Serbia and Montenegro 1 0.44 17.42 0.20 Serbia and Montenegro 1 0.44 17.42 0.20Russian Federation 1 0.04 16.13 0.18 Russian Federation 1 0.04 16.13 0.18Croatia 1 0.09 10.54 0.12 Croatia 1 0.09 10.54 0.12Belarus 0 0.23 6.18 0.07 Belarus 0 0.23 6.18 0.07Kazakhstan 0 0.04 2.28 0.03 Kazakhstan 0 0.04 2.28 0.03Albania 0 0.07 1.06 0.01 Albania 0 0.07 1.06 0.01Bosnia and Herzegovina 0 0.02 0.88 0.01 Bosnia and Herzegovina 0 0.02 0.88 0.01Macedonia, TFYR 0 0.02 0.32 0.00 Macedonia, TFYR 0 0.02 0.32 0.00Georgia 0 0.01 0.10 0.00 Georgia 0 0.01 0.10 0.00
Importer
As %2005
Value (c.i.f. in
millions of $)of country
total
of total foreconomies
in transitionof world
total Importer
As %2005
Value (c.i.f. in
millions of $)of country
total
of total foreconomies
in transitionof world
total

TA B L E
1.4.4.B
289
Sta
tistical
Annex
Part
1
C R E AT I V E E C O N O M Y R E P O R T 2 0 0 8
DESIGN GraphicWorld 228,428 65.10 - 100.00 World 17,449 4.97 - 100.00Developed economies (1) 184,052 65.14 - 80.57 Developed economies (1) 13,810 4.89 - 79.15Developing economies 39,257 64.61 - 17.19 Developing economies 2,644 4.35 - 15.15Economies in transition (2) 3,967 66.35 - 1.74 Economies in transition (2) 750 12.54 - 4.30Russian Federation 1,764 65.83 44.47 0.77 Russian Federation 250 9.35 33.40 1.44Croatia 640 73.01 16.13 0.28 Ukraine 102 15.42 13.60 0.58Ukraine 421 63.56 10.60 0.18 Croatia 100 11.43 13.36 0.57Kazakhstan 287 64.08 7.24 0.13 Kazakhstan 67 15.00 8.97 0.39Serbia and Montenegro 184 62.26 4.64 0.08 Albania 47 39.62 6.27 0.27Bosnia and Herzegovina 172 65.24 4.33 0.08 Bosnia and Herzegovina 44 16.52 5.80 0.25Belarus 107 54.35 2.69 0.05 Serbia and Montenegro 35 11.90 4.70 0.20Albania 97 81.41 2.44 0.04 Belarus 31 15.87 4.16 0.18Moldova 73 71.32 1.83 0.03 Macedonia, TFYR 19 19.03 2.47 0.11Macedonia, TFYR 64 65.39 1.61 0.03 Azerbaijan 17 18.66 2.25 0.10
Fashion GlasswareWorld 60,792 17.33 - 100.00 World 5,524 1.57 - 100.00Developed economies (1) 46,802 16.56 - 76.99 Developed economies (1) 4,425 1.57 - 80.10Developing economies 12,767 21.01 - 21.00 Developing economies 892 1.47 - 16.16Economies in transition (2) 841 14.07 - 1.38 Economies in transition (2) 168 2.82 - 3.04Russian Federation 419 15.65 49.86 0.69 Russian Federation 98 3.66 58.33 1.77Ukraine 121 18.30 14.40 0.20 Croatia 19 2.20 11.47 0.35Croatia 110 12.52 13.05 0.18 Ukraine 11 1.63 6.41 0.19Serbia and Montenegro 41 13.99 4.92 0.07 Serbia and Montenegro 9 3.00 5.28 0.16Kazakhstan 30 6.77 3.61 0.05 Kazakhstan 7 1.63 4.34 0.13Bosnia and Herzegovina 26 9.71 3.04 0.04 Bosnia and Herzegovina 6 2.43 3.81 0.12Moldova 22 21.07 2.56 0.04 Azerbaijan 4 3.99 2.15 0.07Macedonia, TFYR 19 19.06 2.21 0.03 Belarus 3 1.76 2.06 0.06Belarus 18 9.40 2.20 0.03 Macedonia, TFYR 3 2.77 1.61 0.05Albania 15 12.65 1.79 0.02 Albania 3 2.12 1.50 0.05
Interior JewelleryWorld 70,345 20.05 - 100.00 World 31,254 8.91 - 100.00Developed economies (1) 60,693 21.48 - 86.28 Developed economies (1) 24,549 8.69 - 78.55Developing economies 7,655 12.60 - 10.88 Developing economies 6,483 10.67 - 20.74Economies in transition (2) 1,615 27.02 - 2.30 Economies in transition (2) 213 3.56 - 0.68Russian Federation 729 27.20 45.13 1.04 Croatia 127 14.48 59.60 0.41Croatia 243 27.76 15.07 0.35 Russian Federation 26 0.99 12.42 0.08Kazakhstan 154 34.35 9.53 0.22 Ukraine 19 2.93 9.09 0.06Ukraine 140 21.09 8.64 0.20 Kazakhstan 18 4.02 8.45 0.06Bosnia and Herzegovina 83 31.44 5.13 0.12 Moldova 6 5.84 2.80 0.02Serbia and Montenegro 74 24.92 4.57 0.10 Serbia and Montenegro 5 1.66 2.30 0.02Belarus 44 22.13 2.69 0.06 Bosnia and Herzegovina 3 1.31 1.62 0.01Azerbaijan 33 35.99 2.02 0.05 Georgia 3 3.96 1.44 0.01Moldova 27 26.68 1.69 0.04 Macedonia, TFYR 2 1.73 0.79 0.01Georgia 25 31.74 1.52 0.03 Armenia 1 3.22 0.61 0.00
Toys MUSICWorld 43,064 12.27 - 100.00 World 16,419 4.68 - 100.00Developed economies (1) 33,773 11.95 - 78.43 Developed economies (1) 13,737 4.86 - 83.66Developing economies 8,816 14.51 - 20.47 Developing economies 2,413 3.97 - 14.70Economies in transition (2) 379 6.35 - 0.88 Economies in transition (2) 171 2.86 - 1.04Russian Federation 241 8.99 63.58 0.56 Russian Federation 38 1.41 22.12 0.23Croatia 40 4.62 10.68 0.09 Croatia 35 3.95 20.26 0.21Ukraine 28 4.19 7.32 0.06 Kazakhstan 34 7.59 19.89 0.21Serbia and Montenegro 20 6.80 5.31 0.05 Belarus 15 7.60 8.74 0.09Kazakhstan 10 2.32 2.75 0.02 Serbia and Montenegro 14 4.87 8.43 0.09Belarus 10 5.19 2.69 0.02 Ukraine 12 1.83 7.07 0.07Bosnia and Herzegovina 10 3.83 2.66 0.02 Bosnia and Herzegovina 10 3.66 5.64 0.06Albania 7 5.52 1.73 0.02 Moldova 4 4.09 2.44 0.03Georgia 4 5.63 1.15 0.01 Albania 3 2.65 1.84 0.02Macedonia, TFYR 3 3.13 0.81 0.01 Macedonia, TFYR 3 3.05 1.74 0.02
Records PrintedWorld 16,312 4.65 - 100.00 World 107 0.03 - 100.00Developed economies (1) 13,639 4.83 - 83.62 Developed economies (1) 97 0.03 - 90.69Developing economies 2,404 3.96 - 14.73 Developing economies 10 0.02 - 9.10Economies in transition (2) 171 2.85 - 1.05 Economies in transition (2) 0 0.00 - 0.21Russian Federation 38 1.41 22.08 0.23 Russian Federation 0 0.00 31.18 0.07Croatia 35 3.95 20.25 0.21 Ukraine 0 0.01 21.19 0.04Kazakhstan 34 7.59 19.89 0.21 Croatia 0 0.00 9.99 0.02Belarus 15 7.60 8.73 0.09 Bosnia and Herzegovina 0 0.01 6.36 0.01Serbia and Montenegro 14 4.87 8.42 0.09 Belarus 0 0.01 5.54 0.01Ukraine 12 1.82 7.04 0.07 Serbia and Montenegro 0 0.00 4.66 0.01Bosnia and Herzegovina 10 3.65 5.63 0.06 Kazakhstan 0 0.00 3.09 0.01Moldova 4 4.08 2.44 0.03 Georgia 0 0.00 1.51 0.00Albania 3 2.65 1.84 0.02 Armenia 0 0.01 1.10 0.00Macedonia, TFYR 3 3.05 1.74 0.02 Kyrgyzstan 0 0.01 1.06 0.00
Importer
As %2005
Value (c.i.f. in
millions of $)of country
total
of total foreconomies
in transitionof world
total Importer
As %2005
Value (c.i.f. in
millions of $)of country
total
of total foreconomies
in transitionof world
total

TA B L E
1.4.4.B CREATIVE GOODS: TOP 10 IMPORTERS AMONG ECONOMIES IN TRANSITION, BY PRODUCT GROUP, 2005
290
Sta
tist
ical
Annex
Part
1
C R E AT I V E E C O N O M Y R E P O R T 2 0 0 8
NEW MEDIA Digital recordsWorld 13,402 3.82 - 100.00 World 2,436 0.69 - 100.00Developed economies (1) 10,718 3.79 - 79.97 Developed economies (1) 1,865 0.66 - 76.53Developing economies 2,465 4.06 - 18.39 Developing economies 560 0.92 - 23.00Economies in transition (2) 187 3.12 - 1.39 Economies in transition (2) 10 0.15 - 0.39Russian Federation 86 3.21 45.94 0.64 Kazakhstan 5 1.14 51.11 0.21Ukraine 39 5.94 21.01 0.29 Croatia 1 0.17 14.62 0.06Croatia 28 3.15 14.75 0.21 Russian Federation 1 0.05 14.50 0.06Kazakhstan 11 2.55 6.12 0.09 Azerbaijan 1 0.55 5.02 0.02Bosnia and Herzegovina 5 1.99 2.80 0.04 Serbia and Montenegro 0 0.08 2.48 0.01Serbia and Montenegro 5 1.57 2.49 0.03 Moldova 0 0.20 2.07 0.01Macedonia, TFYR 3 3.20 1.67 0.02 Bosnia and Herzegovina 0 0.08 1.99 0.01Belarus 3 1.55 1.63 0.02 Belarus 0 0.08 1.65 0.01Albania 3 2.25 1.43 0.02 Albania 0 0.10 1.18 0.00Moldova 1 1.44 0.78 0.01 Macedonia, TFYR 0 0.07 0.64 0.00
Video games PUBLISHINGWorld 10,966 3.13 - 100.00 World 45,783 13.05 - 100.00Developed economies (1) 8,853 3.12 - 80.73 Developed economies (1) 34,740 12.29 - 75.88Developing economies 1,905 3.13 - 17.37 Developing economies 9,735 16.02 - 21.26Economies in transition (2) 177 2.96 - 1.61 Economies in transition (2) 1,124 18.80 - 2.46Russian Federation 84 3.15 47.72 0.77 Russian Federation 543 20.27 48.33 1.19Ukraine 39 5.93 22.19 0.36 Ukraine 131 19.81 11.66 0.29Croatia 26 2.98 14.76 0.24 Croatia 114 12.95 10.10 0.25Kazakhstan 6 1.41 3.58 0.06 Kazakhstan 83 18.42 7.35 0.18Bosnia and Herzegovina 5 1.91 2.84 0.05 Serbia and Montenegro 67 22.64 5.96 0.15Serbia and Montenegro 4 1.49 2.49 0.04 Bosnia and Herzegovina 56 21.21 4.97 0.12Macedonia, TFYR 3 3.13 1.72 0.03 Belarus 46 23.37 4.09 0.10Belarus 3 1.46 1.63 0.03 Azerbaijan 22 24.61 1.98 0.05Albania 3 2.15 1.44 0.02 Moldova 19 18.54 1.68 0.04Moldova 1 1.23 0.71 0.01 Macedonia, TFYR 13 13.01 1.13 0.03
Books NewspapersWorld 13,836 3.94 - 100.00 World 17,081 4.87 - 100.00Developed economies (1) 10,305 3.65 - 74.48 Developed economies (1) 13,409 4.75 - 78.50Developing economies 3,266 5.37 - 23.60 Developing economies 3,098 5.10 - 18.13Economies in transition (2) 234 3.91 - 1.69 Economies in transition (2) 518 8.66 - 3.03Russian Federation 99 3.71 42.50 0.72 Russian Federation 232 8.67 44.87 1.36Croatia 29 3.26 12.20 0.21 Ukraine 69 10.44 13.34 0.40Ukraine 25 3.79 10.72 0.18 Croatia 49 5.62 9.50 0.29Kazakhstan 24 5.28 10.12 0.17 Serbia and Montenegro 43 14.46 8.26 0.25Serbia and Montenegro 15 4.90 6.20 0.10 Kazakhstan 38 8.58 7.42 0.23Bosnia and Herzegovina 14 5.20 5.86 0.10 Bosnia and Herzegovina 33 12.69 6.45 0.20Belarus 9 4.82 4.05 0.07 Belarus 26 13.28 5.04 0.15Azerbaijan 7 7.35 2.85 0.05 Macedonia, TFYR 7 7.03 1.32 0.04Moldova 3 3.12 1.36 0.02 Moldova 5 5.01 0.99 0.03Macedonia, TFYR 3 3.08 1.28 0.02 Georgia 4 5.39 0.81 0.02
Other publishing VISUAL ARTSWorld 14,866 4.24 - 100.00 World 21,111 6.02 - 100.00Developed economies (1) 11,027 3.90 - 74.17 Developed economies (1) 18,610 6.59 - 88.16Developing economies 3,372 5.55 - 22.68 Developing economies 2,382 3.92 - 11.28Economies in transition (2) 373 6.24 - 2.51 Economies in transition (2) 102 1.71 - 0.48Russian Federation 211 7.89 56.67 1.42 Russian Federation 58 2.16 56.63 0.27Ukraine 37 5.58 9.90 0.25 Croatia 12 1.39 11.95 0.06Croatia 36 4.08 9.59 0.24 Ukraine 10 1.53 9.94 0.05Kazakhstan 20 4.56 5.49 0.14 Serbia and Montenegro 5 1.59 4.60 0.02Azerbaijan 12 13.05 3.17 0.08 Armenia 3 8.50 3.37 0.02Moldova 11 10.41 2.85 0.07 Bosnia and Herzegovina 3 1.20 3.09 0.01Belarus 10 5.27 2.78 0.07 Kazakhstan 2 0.55 2.41 0.01Serbia and Montenegro 10 3.27 2.60 0.07 Albania 2 1.85 2.16 0.01Bosnia and Herzegovina 9 3.32 2.35 0.06 Azerbaijan 2 1.82 1.62 0.01Georgia 7 8.71 1.81 0.05 Belarus 2 0.82 1.58 0.01
Painting PhotographyWorld 963 0.27 - 100.00 World 1,674 0.48 - 100.00Developed economies (1) 870 0.31 - 90.38 Developed economies (1) 851 0.30 - 50.82Developing economies 85 0.14 - 8.81 Developing economies 815 1.34 - 48.70Economies in transition (2) 7 0.10 - 0.69 Economies in transition (2) 7 0.10 - 0.41Russian Federation 4 0.16 61.78 0.45 Russian Federation 2 0.09 34.14 0.14Croatia 1 0.07 8.30 0.06 Ukraine 1 0.22 20.86 0.09Kazakhstan 0 0.10 6.23 0.05 Croatia 1 0.09 10.72 0.04Albania 0 0.33 5.56 0.04 Albania 1 0.60 10.12 0.04Serbia and Montenegro 0 0.08 3.56 0.03 Serbia and Montenegro 0 0.16 6.94 0.03Ukraine 0 0.04 3.51 0.03 Bosnia and Herzegovina 0 0.18 6.71 0.03Bosnia and Herzegovina 0 0.07 2.73 0.02 Kazakhstan 0 0.03 1.76 0.01Belarus 0 0.04 1.25 0.01 Macedonia, TFYR 0 0.12 1.64 0.01Georgia 0 0.08 0.93 0.01 Belarus 0 0.06 1.56 0.01Macedonia, TFYR 0 0.05 0.67 0.00 Georgia 0 0.14 1.55 0.01
Importer
As %2005
Value (c.i.f. in
millions of $)of country
total
of total foreconomies
in transitionof world
total Importer
As %2005
Value (c.i.f. in
millions of $)of country
total
of total foreconomies
in transitionof world
total
CONTINUED

TA B L E
1.4.4.B
291
Sta
tistical
Annex
Part
1
C R E AT I V E E C O N O M Y R E P O R T 2 0 0 8
Sculpture AntiquesWorld 5,691 1.62 - 100.00 World 2,617 0.75 - 100.00Developed economies (1) 4,814 1.70 - 84.59 Developed economies (1) 2,448 0.87 - 93.55Developing economies 795 1.31 - 13.97 Developing economies 168 0.28 - 6.42Economies in transition (2) 68 1.14 - 1.20 Economies in transition (2) 1 0.01 - 0.03Russian Federation 37 1.36 53.75 0.64 Russian Federation 1 0.03 82.16 0.03Croatia 10 1.13 14.56 0.17 Croatia 0 0.01 10.02 0.00Ukraine 8 1.17 11.39 0.14 Armenia 0 0.12 5.65 0.00Serbia and Montenegro 4 1.28 5.58 0.07 Albania 0 0.01 1.06 0.00Bosnia and Herzegovina 2 0.75 2.91 0.03 Serbia and Montenegro 0 0.00 0.46 0.00Kazakhstan 2 0.37 2.45 0.03 Ukraine 0 0.00 0.35 0.00Azerbaijan 2 1.76 2.35 0.03 Bosnia and Herzegovina 0 0.00 0.13 0.00Belarus 1 0.71 2.06 0.02 Moldova 0 0.00 0.10 0.00Albania 1 0.84 1.46 0.02 Georgia 0 0.00 0.01 0.00Macedonia, TFYR 1 0.95 1.36 0.02 Azerbaijan 0 0.00 0.00 0.00
Other visual artsWorld 10,166 2.90 - 100.00Developed economies (1) 9,628 3.41 - 94.70Developing economies 519 0.85 - 5.10Economies in transition (2) 20 0.33 - 0.19Russian Federation 14 0.52 69.63 0.14Armenia 3 7.64 15.57 0.03Croatia 1 0.10 4.41 0.01Ukraine 1 0.10 3.43 0.01Bosnia and Herzegovina 1 0.20 2.61 0.01Kazakhstan 0 0.05 1.17 0.00Serbia and Montenegro 0 0.05 0.81 0.00Albania 0 0.08 0.49 0.00Georgia 0 0.10 0.40 0.00Macedonia, TFYR 0 0.05 0.25 0.00
SOURCE: UNCTAD secretariat calculations based on United Nations Comtrade database data.NOTES: (1) Developed economies, including Bulgaria and Romania.
(2) Excluding Bulgaria and Romania, which are included in the European Union (EU-27).
Importer
As %2005
Value (c.i.f. in
millions of $)of country
total
of total foreconomies
in transitionof world
total Importer
As %2005
Value (c.i.f. in
millions of $)of country
total
of total foreconomies
in transitionof world
total

TA B L E
1.5.A1 CREATIVE GOODS: EXPORTS, BY TRADE GROUP, 1996-2005
1996 1997 1998 1999 2000 2001 2002 2003 2004 2005
AMERICAFTAA 30,332 33,306 34,530 34,646 37,879 37,843 35,757 36,406 40,526 45,560MERCOSUR 449 1,440 1,360 1,321 1,407 1,412 1,502 1,669 2,206 2,661NAFTA 29,534 30,793 31,848 32,071 35,203 35,087 33,052 33,466 36,830 41,192ASIAASEAN 2,346 6,075 6,447 9,125 11,616 10,893 10,701 11,649 13,644 14,361ASEAN plus China, Japan 27,437 35,986 37,422 43,035 48,476 46,834 52,367 60,202 70,766 84,210and Republic of KoreaEUROPEEU-27 96,115 93,190 96,671 95,878 95,378 99,445 106,059 121,418 136,922 145,056INTERNATIONALACP 20 474 524 595 915 871 907 994 1,236 1,387
Trade group
292
Sta
tist
ical
Annex
Part
1
C R E AT I V E E C O N O M Y R E P O R T 2 0 0 8
EXPORTS (f.o.b., in millions of $)
SOURCE: UNCTAD secretariat calculations based on United Nations Comtrade database data.
TA B L E
1.5.A2 CREATIVE GOODS: EXPORTS, BY TRADE GROUP, AS % OF TOTAL EXPORTSOF CREATIVE GOODS BY ALL TRADE GROUPS, 1996-2005
1996 1997 1998 1999 2000 2001 2002 2003 2004 2005
AMERICAFTAA 16.03 16.51 16.68 16.25 16.56 16.62 14.93 13.58 13.27 13.58MERCOSUR 0.24 0.71 0.66 0.62 0.62 0.62 0.63 0.62 0.72 0.79NAFTA 15.61 15.26 15.39 15.04 15.39 15.41 13.80 12.48 12.06 12.28ASIAASEAN 1.24 3.01 3.11 4.28 5.08 4.79 4.47 4.35 4.47 4.28ASEAN plus China, Japan 14.50 17.84 18.08 20.18 21.20 20.57 21.87 22.46 23.17 25.10and Republic of KoreaEUROPEEU-27 50.80 46.19 46.70 44.96 41.71 43.69 44.29 45.30 44.83 43.24INTERNATIONALACP 0.01 0.24 0.25 0.28 0.40 0.38 0.38 0.37 0.40 0.41
Trade group
EXPORTS (f.o.b., in millions of $)
SOURCE: UNCTAD secretariat calculations based on United Nations Comtrade database data.

AMERICA57,795 67,975 75,819 81,329 90,204 90,019 93,719 97,436 106,693 117,998 FTAA
651 2,427 2,517 1,967 1,929 1,655 849 821 1,184 1,563 MERCOSUR56,330 63,322 69,920 76,201 84,884 84,697 89,607 93,415 102,109 111,731 NAFTA
ASIA265 4,704 2,938 3,827 4,743 4,316 4,618 5,446 6,102 6,478 ASEAN
20,026 22,863 17,185 19,496 22,882 22,903 23,294 25,994 28,832 31,991 ASEAN plus China, Japan and Republic of Korea
EUROPE80,230 80,382 85,437 86,600 85,079 87,437 94,286 110,807 127,223 137,957 EU-27
INTERNATIONAL111 1,319 1,680 1,960 2,489 2,874 2,686 3,186 3,447 4,249 ACP
Trade group
TA B L E
1.5.B1
293
Sta
tistical
Annex
Part
1
C R E AT I V E E C O N O M Y R E P O R T 2 0 0 8
CREATIVE GOODS: IMPORTS, BY TRADE GROUP, 1996-2005
1996 1997 1998 1999 2000 2001 2002 2003 2004 2005
IMPORTS (c.i.f., in millions of $)
SOURCE: UNCTAD secretariat calculations based on United Nations Comtrade database data.
AMERICA30.34 32.64 35.34 36.17 37.17 37.00 36.45 34.19 33.17 33.63 FTAA0.34 1.17 1.17 0.87 0.79 0.68 0.33 0.29 0.37 0.45 MERCOSUR
29.57 30.40 32.59 33.89 34.98 34.81 34.85 32.78 31.75 31.84 NAFTAASIA
0.14 2.26 1.37 1.70 1.95 1.77 1.80 1.91 1.90 1.85 ASEAN10.51 10.98 8.01 8.67 9.43 9.41 9.06 9.12 8.96 9.12 ASEAN plus China, Japan and
Republic of KoreaEUROPE
42.12 38.59 39.83 38.51 35.06 35.94 36.67 38.88 39.55 39.32 EU-27INTERNATIONAL
0.06 0.63 0.78 0.87 1.03 1.18 1.04 1.12 1.07 1.21 ACP
Trade group
TA B L E
1.5.B2CREATIVE GOODS: IMPORTS, BY TRADE GROUP, AS % OF TOTAL IMPORTSOF CREATIVE GOODS BY ALL TRADE GROUPS, 1996-2005
1996 1997 1998 1999 2000 2001 2002 2003 2004 2005
IMPORTS (c.i.f., in millions of $)
SOURCE: UNCTAD secretariat calculations based on United Nations Comtrade database data.

294
Sta
tist
ical
Annex
Part
1
C R E AT I V E E C O N O M Y R E P O R T 2 0 0 8

TA B L E
2.1.A
295
Sta
tistical
Annex
Part
2
C R E AT I V E E C O N O M Y R E P O R T 2 0 0 8
CATEGORIES OF SERVICES THAT INCLUDE CREATIVE INDUSTRIES: EXPORTS OF ALL CREATIVE SERVICES (1), BY COUNTRY/TERRITORY, 1996-2005
TOTAL - REPORTING COUNTRIES 38,237 36,168 43,551 46,651 52,170 52,321 61,789 71,215 80,455 88,933Albania - - - - - - 2 5 8 18Angola* - - - - - - 1 1 3 5Argentina 18 30 24 32 54 89 200 255 328 377Armenia 2 3 7 5 2 2 2 2 6 6Australia 595 672 689 786 1,548 736 876 1,018 1,005 1,192Austria* 202 211 212 224 193 212 204 266 327 355Azerbaijan - - - - - - - 2 3 3Bangladesh 0 0 1 0 1 11 13 21 19 19Barbados* 0 0 0 0 0 0 1 1 - 0Belarus - - - - 75 82 82 24 31 37Belgium - - - - - - 3,789 5,224 5,609 5,984Benin 0 0 0 0 0 0 0 0 1 -Bolivia* - - - 1 1 1 1 1 1 1Botswana - 3 8 5 15 9 10 5 9 9Brazil 334 983 1,404 1,154 1,919 1,732 1,754 1,664 2,171 2,960Bulgaria - - - - 36 51 57 66 74 105Burkina Faso - - - - 0 0 - - - -Cambodia* - - 0 1 1 1 1 1 1 1Cameroon* - - 0 0 1 1 2 11 - -Canada 4,438 4,790 5,370 5,326 6,423 5,590 5,822 6,577 7,083 7,800Cape Verde - - - 0 0 0 0 0 0 0Chile* 28 28 28 23 22 29 39 68 73 86China - 594 744 508 590 1,194 1,687 2,405 890 1,210China, SAR of Hong Kong* - - 113 85 51 99 112 137 290 -Colombia 25 22 29 36 52 56 61 83 117 143Congo* 2 2 5 7 12 17 21 9 11 -Costa Rica - 5 4 6 1 1 4 2 2 3Côte d’Ivoire 4 4 4 4 3 4 4 5 5 -Croatia 50 83 127 154 177 196 247 334 413 441Cyprus 5 5 5 6 6 10 50 57 101 122Czech Republic 131 281 501 441 371 364 325 221 260 273Ecuador* 17 14 17 12 39 24 32 34 36 39Egypt 16 20 19 24 26 43 69 84 82 102El Salvador - - - 1 2 1 1 1 1 1Eritrea* - - - 0 - - - - - -Estonia 0 0 1 1 1 2 1 67 95 102Ethiopia 2 2 4 7 8 8 7 5 4 2Faeroe Islands* - - 0 0 1 0 1 1 - -Finland 130 151 140 4 524 487 510 784 16 924France 9,357 1,411 1,428 1,344 1,591 1,429 1,520 1,868 2,298 2,158Georgia* - - - - - - 0 0 2 3Germany 7,244 8,322 8,703 8,175 8,367 8,203 9,176 14,514 17,558 20,624Greece - - - 279 351 326 343 548 1,253 433Guatemala - - - - - 1 2 9 3 4Guinea* - 0 - - - 0 0 - - -Hungary 46 61 89 91 207 600 527 845 1,662 1,863Iceland* 3 5 6 10 7 8 5 4 9 16Indonesia* - - - - - - - - 47 57Ireland - - - 166 163 1,649 1,483 1,228 442 871Italy 2,020 1,951 1,947 4,166 3,759 3,832 4,284 4,511 5,088 5,432Jamaica 9 9 11 10 11 10 9 20 29 30Japan* 178 234 429 239 116 118 315 140 72 97Kazakhstan 7 9 27 73 24 25 31 28 40 60Kenya* - - - - 0 0 0 0 0 0Kyrgyzstan 10 8 7 5 4 8 15 19 36 55Latvia 0 0 1 0 37 52 61 79 108 142Lebanon* - - - - - - 0 - - 0Lithuania - 7 16 8 26 37 55 77 67 69Luxembourg* 177 190 338 340 376 330 164 165 190 237Macedonia, TFYR 4 2 3 2 3 2 10 34 46 45Madagascar 12 - - - 0 0 1 2 3 1Malaysia - - - 1,499 1,537 1,911 1,566 1,835 1,657 1,562Mali - - 0 0 0 0 0 0 1 -Malta - - - - - - - - 47 57Mauritius* - - - - 2 3 5 5 4 2Mexico* 5 5 5 209 328 318 400 293 358 373Moldova, Republic of - - 1 1 1 2 2 2 2 5Mongolia* - - - - - - - 0 1 -Mozambique - - - - - - 28 8 0 11Myanmar* - - - - - - 0 0 - -Namibia - - - 1 0 - - 0 2 -Netherlands 4,061 4,036 4,602 4,677 4,473 3,940 4,303 618 771 902Netherlands Antilles 3 3 4 4 3 4 1 5 5 5New Zealand* 21 34 48 100 135 117 111 143 226 175Niger 0 0 0 0 0 0 0 0 - -Norway 616 830 1,243 1,171 1,287 1,173 1,150 1,272 1,432 2,235
Country/territory 1996 1997 1998 1999 2000 2001 2002 2003 2004 2005
EXPORTS (in millions of $)

TA B L E
2.1.A
296
Sta
tist
ical
Annex
Part
2
C R E AT I V E E C O N O M Y R E P O R T 2 0 0 8
SOURCE: UNCTAD calculations based on IMF balance of payments statistics on CD-ROM.NOTES: (1) “All creative services” is composed of the following categories of services: “advertising, market research and public opinion polling services”; “architectural, engineering and other technical services”;
“research and development services”; and "personal, cultural and recreational services". “Audiovisual and related services” and "other personal, cultural and recreational services" are sub-items of "personal,cultural and recreational services". Please refer to the General explanatory notes, paragraph 14, for definitions.(2) The figures in this table cannot be used for international comparisons or ranking because most countries do not report all categories of creative services and the reported categories vary with countries.Therefore, the figures present only the aggregation of reported categories by country.(3) Countries that report only “personal, cultural and recreational services” (a category that includes “audiovisual and related services” and “other personal, cultural and recreational services”) are marked with an asterisk (*).
CONTINUED
Country/territory 1996 1997 1998 1999 2000 2001 2002 2003 2004 2005
EXPORTS (in millions of $)
Occupied Palestinian Territory* - - 1 5 9 2 1 3 1 -Pakistan 26 22 54 21 19 15 25 35 38 75Papua New Guinea* - - - - - - - - 0 0Paraguay 12 14 14 15 16 14 15 14 16 20Philippines* - - - 19 18 15 7 9 7 20Poland 239 257 272 198 209 261 312 350 669 1,044Portugal 300 269 347 321 345 396 499 496 654 694Republic of Korea* - 5 14 29 137 138 185 76 128 261Romania 65 78 83 120 143 157 217 264 378 401Russian Federation - - - - - 1,044 1,370 2,183 2,628 3,384Samoa* - - - - - - - - 0 1Senegal 1 1 4 1 1 0 0 2 - -Singapore* 9 9 9 18 19 34 127 154 189 197Slovakia 48 70 154 116 129 - 120 162 - -Slovenia 76 81 90 98 99 111 130 189 305 324Solomon Islands* - - 1 0 - - - - - -South Africa* - - - - - 37 38 60 88 114Spain 1,878 2,095 2,565 2,351 2,686 3,052 3,553 4,389 5,386 5,745Sudan* - - - - 1 - - 0 - -Swaziland - - - - - - - 1 22 2Sweden 813 1,117 1,888 2,018 2,272 2,092 3,190 3,861 4,127 4,476Switzerland* 10 5 10 7 7 5 4 4 4 5Syrian Arab Republic* - - - - - - - - 75 95Tajikistan - - - - - - 1 0 1 1Togo 0 0 1 0 0 0 0 0 0 -Tonga* - - - - - 0 0 - - -Tunisia 3 2 28 36 3 4 3 5 10 4Turkey* 949 2,225 3,579 2,615 2,591 1,074 1,355 781 1,418 1,079Ukraine - - - - 97 80 96 198 295 458United Kingdom* 1,204 1,342 1,458 1,555 1,973 1,954 2,410 3,086 3,928 3,583United Republic of Tanzania* - - 3 1 0 0 1 1 0 1United States* 2,830 3,530 4,560 5,628 6,379 6,618 6,534 7,137 7,511 7,060Uruguay* - - 0 0 5 4 0 0 1 1Venezuela - 25 52 59 55 58 40 36 43 45

TA B L E
2.1.B
297
Sta
tistical
Annex
Part
2
C R E AT I V E E C O N O M Y R E P O R T 2 0 0 8
CATEGORIES OF SERVICES THAT INCLUDE CREATIVE INDUSTRIES: IMPORTS OF ALL CREATIVE SERVICES (1), BY COUNTRY/TERRITORY, 1996-2005
TOTAL - REPORTING COUNTRIES 43,803 40,907 46,989 53,817 55,031 63,870 70,248 73,994 79,397 85,736Albania - - - - - - 7 8 30 107Angola* - - - - - - 15 11 28 45Argentina 133 197 220 189 266 313 157 176 243 246Armenia 0 3 4 3 1 5 5 6 7 8Australia 899 994 853 967 863 720 848 1,000 1,185 1,261Austria* 228 248 229 208 174 191 213 292 395 366Azerbaijan - - - - - - - 5 5 5Bahamas 19 17 12 19 24 20 2 24 40 63Bangladesh 1 1 - - 0 45 29 37 40 69Barbados* 0 0 0 0 0 0 - 0 1 0Belarus - - - - 38 24 22 38 39 61Belgium - - - - - - 3,557 4,393 4,896 5,139Belize 19 17 12 19 24 20 2 25 42 64Benin 0 0 0 0 0 0 0 0 0 -Bolivia* - 5 6 2 2 2 2 4 5 6Botswana - 54 94 48 25 27 26 37 44 21Brazil 692 1,119 1,424 1,339 1,490 1,493 1,277 1,435 1,678 2,159Bulgaria - - - - 48 125 99 172 148 215Burkina Faso - - - - 0 0 - - - -Burundi 0 0 0 0 0 0 0 0 9 15Cambodia* - - 1 2 2 3 3 3 4 4Cameroon* - - 1 1 1 1 1 10 - -Canada 3,007 3,119 3,491 3,646 4,199 3,842 3,929 4,739 5,224 5,503Cape Verde - - 0 1 2 1 2 3 4 3Chile* 25 30 45 42 44 36 44 47 52 56China - 753 1,062 777 880 1,810 3,121 3,977 874 869China, SAR of Hong Kong* - - 51 47 65 70 68 68 52 -Colombia 352 301 321 274 258 285 254 253 359 386Congo* 6 5 2 3 5 5 5 3 4 -Costa Rica 1 6 6 7 30 18 41 36 32 27Côte d’Ivoire 1 3 3 3 3 1 2 2 2 -Croatia 124 140 234 237 239 227 296 379 488 537Cyprus 10 10 11 12 13 10 54 76 135 134Czech Republic 178 470 627 506 462 512 565 482 566 666Dominican Republic 0 0 0 0 0 0 2 11 10 11Ecuador* 34 29 28 34 52 71 86 92 98 106Egypt* 7 21 22 20 21 22 14 15 15 22El Salvador - - - 0 2 2 2 2 3 3Eritrea* - - 0 0 0 - - - - -Estonia 1 3 2 1 2 3 1 41 48 51Ethiopia 19 25 19 14 25 27 18 28 28 27Faeroe Islands* - - 0 1 1 1 1 1 - -Finland 444 459 478 43 432 365 632 1,000 1,017 1,542France 8,120 1,818 1,800 1,711 1,976 2,058 2,079 2,332 2,624 2,821Georgia - - - - - - 1 2 2 2Germany 12,283 12,611 13,541 15,655 15,193 17,970 16,191 17,353 19,439 20,748Greece - - - 241 256 321 308 338 552 415Guatemala - - 0 - - 2 7 5 2 1Guinea 0 0 1 0 0 0 1 0 1 -Haiti* - - - - - - - - - 17Honduras* 3 4 7 7 8 8 9 6 5 6Hungary 31 38 48 43 151 563 491 845 1,911 2,209Iceland* 11 10 11 13 15 13 12 11 12 13Indonesia* - - - - - - - - 184 166Ireland - - - 32 26 3,679 5,152 5,663 3,992 4,550Italy 2,786 2,700 3,285 5,219 4,790 4,257 3,808 4,444 5,450 6,155Jamaica 28 41 35 34 43 44 54 47 30 36Japan* 1,209 1,086 1,261 1,137 1,275 1,391 1,190 946 1,081 1,115Kazakhstan 133 38 30 24 178 299 458 709 1,354 1,634Kenya - 15 - 0 2 1 4 2 1 1Kyrgyzstan 21 6 10 8 21 12 25 32 31 64Latvia - 0 0 0 40 43 44 38 70 85Lebanon* - - - - - - 0 - - 0Lesotho - - - 0 0 0 0 0 0 -Libyan Arab Jamahiriya* 0 0 0 0 0 0 1 9 9 10Lithuania - 14 20 20 22 25 26 28 41 44Luxembourg* 414 370 465 509 481 435 311 420 476 329Macedonia, TFYR 3 4 3 3 3 5 15 51 62 72Madagascar 0 0 0 0 0 0 0 29 7 5Malawi 3 3 3 6 7 6 9 - - -Malaysia - - - 2,117 2,184 2,418 2,790 2,922 1,899 1,855Mali - 0 0 0 0 0 0 0 14 -Malta 2 5 5 4 4 4 6 8 37 39Mauritius* - - - - 4 5 10 14 21 31Mexico* 5 6 6 227 245 198 260 221 225 275Moldova, Republic of - - 2 3 9 3 8 4 9 10
Country/territory 1996 1997 1998 1999 2000 2001 2002 2003 2004 2005
IMPORTS (in millions of $)

TA B L E
2.1.B
298
Sta
tist
ical
Annex
Part
2
C R E AT I V E E C O N O M Y R E P O R T 2 0 0 8
SOURCE: UNCTAD calculations based on IMF balance of payments statistics on CD-ROM.NOTES: (1) “All creative services” is composed of the following categories of services: “advertising, market research and public opinion polling services”; “architectural, engineering and other technical services”;
“research and development services”; and "personal, cultural and recreational services". “Audiovisual and related services” and "other personal, cultural and recreational services" are sub-items of "personal,cultural and recreational services". Please refer to the General explanatory notes, paragraph 14, for definitions.(2) The figures in this table cannot be used for international comparisons or ranking because most countries do not report all categories of creative services and the reported categories vary with countries.Therefore, the figures present only the aggregation of reported categories by country.(3) Countries that report only “personal, cultural and recreational services” (a category that includes “audiovisual and related services” and “other personal, cultural and recreational services”) are marked with an asterisk (*).
CONTINUED
Country/territory 1996 1997 1998 1999 2000 2001 2002 2003 2004 2005
IMPORTS (in millions of $)
Mongolia* - - - - - - - 0 - -Mozambique - - - - - 23 65 46 0 18Myanmar* - - - 0 0 0 0 6 3 -Namibia - - - 69 38 34 24 20 62 -Netherlands 3,386 3,533 3,787 4,089 4,493 4,895 5,207 746 880 946Netherlands Antilles 2 3 3 4 2 1 1 3 2 2New Zealand 10 13 136 25 36 155 65 254 299 342Niger 0 0 0 0 0 0 0 1 0 -Norway 355 469 812 827 815 619 551 664 858 1,460Occupied Palestinian Territory* - - 14 13 13 22 38 36 16 -Pakistan 11 12 45 42 64 86 71 55 23 50Papua New Guinea* - - - - - - - - 0 0Paraguay - - 1 2 1 3 5 7 3 1Philippines* 0 0 0 27 32 37 17 15 15 9Poland 337 347 387 498 606 577 782 831 917 1,107Portugal 485 502 691 644 574 522 537 627 820 859Republic of Korea* 121 137 92 153 160 206 283 261 376 473Romania 75 100 121 181 194 201 263 327 350 385Russian Federation - - - - - 1,599 1,808 1,752 2,232 2,444Samoa - - - - - - - - - -Senegal 1 1 0 1 1 1 0 3 0 -Sierra Leone - - - - - - 1 1 2 0Singapore* 35 41 34 51 82 171 265 241 267 278Slovakia 101 119 255 165 193 - 156 331 - -Slovenia 138 139 158 158 154 163 194 256 314 404Solomon Islands* - - - 0 - - - - - -South Africa* - - - - - 3 3 3 5 8Spain 2,584 2,808 2,787 3,233 3,428 3,146 3,612 4,527 5,593 5,581Sudan - 0 - 2 - - - 0 - -Swaziland 28 41 4 4 33 6 8 7 38 27Sweden 1,102 1,488 3,161 3,568 4,138 4,868 4,915 5,298 5,875 5,650Switzerland * 78 80 71 69 61 65 67 90 96 87Syrian Arab Republic* - - - - - - - - 1 1Tajikistan - - - - - - 1 0 1 2Togo 0 0 1 0 0 0 0 - 0 -Tonga* - - - - - 0 0 - - -Tunisia 10 10 100 110 9 10 5 4 6 6Turkey 1,798 2,634 3,163 3,050 1,547 293 207 117 186 107Ukraine - - - - 246 789 926 303 424 413United Kingdom* 867 894 810 983 1,181 1,041 1,198 1,396 1,655 1,441United Republic of Tanzania* - - 0 0 0 0 - 1 0 0United States* 180 150 122 119 132 121 137 206 409 915Uruguay* - - 26 27 13 16 18 10 7 7Venezuela 845 586 415 225 160 140 147 135 266 210Yemen - - - - - - - - 0 0

TA B L E
2.2.A
299
Sta
tistical
Annex
Part
2
C R E AT I V E E C O N O M Y R E P O R T 2 0 0 8
CATEGORIES OF SERVICES THAT INCLUDE CREATIVE INDUSTRIES: EXPORTS OF ADVERTISING, MARKET RESEARCH AND PUBLIC OPINION POLLINGSERVICES, BY ECONOMIC GROUP AND COUNTRY/TERRITORY, 1996-2005
TOTAL - REPORTING ECONOMIES 5,008 4,545 4,553 4,249 5,117 6,346 8,809 11,040 13,349 15,703
DEVELOPED ECONOMIES 4,899 4,143 4,129 3,805 4,587 5,297 7,531 9,278 10,738 12,418Australia 44 59 62 64 69 63 71 79 65 80Belgium - - - - - - 1,899 2,617 2,470 2,569Canada 164 215 248 217 334 326 350 256 258 371Cyprus - - - - - - 31 22 40 52Czech Republic 21 48 88 65 76 66 45 44 60 57Estonia - - - - - - - 47 65 72Finland 96 116 106 - 52 50 73 128 - 162France 809 - - - - - - - - -Germany 1,287 1,252 1,217 1,077 1,134 1,233 1,352 1,561 2,415 3,252Greece - - - 48 64 99 89 158 206 175Hungary - - - - - - - - 182 204Ireland - - - - - 570 244 199 - -Italy 780 817 934 935 1,052 1,045 1,036 1,073 1,340 1,361Latvia - - - - 28 41 49 61 86 113Lithuania - 5 10 5 11 22 30 46 47 45Malta - - - - - - - - 3 2Norway 77 81 92 92 153 71 74 84 108 173Poland 38 58 56 29 45 57 37 104 235 411Portugal 81 68 92 75 98 127 181 179 218 225Romania 7 11 11 25 30 40 53 49 57 147Slovakia 10 8 19 14 18 - 16 26 - -Slovenia 35 42 48 46 42 48 61 99 183 192Spain 638 671 760 717 952 1,028 1,407 1,881 2,106 2,096Sweden 813 694 386 394 429 410 434 566 594 659DEVELOPING ECONOMIES 95 376 389 402 446 508 565 689 1,103 1,397Argentina 2 3 4 6 14 20 35 39 79 107Bangladesh - - - - - 4 5 8 10 8Benin - - - 0 0 0 0 0 0 -Botswana - 0 0 0 1 1 0 1 1 2Brazil 63 101 131 138 170 157 110 102 111 128Burkina Faso - - - - - 0 - - - -Cape Verde - - - - - 0 0 0 0 0China - 238 211 221 223 277 373 486 849 1,076Colombia 16 14 19 14 13 12 9 13 19 24Costa Rica - 5 4 6 1 1 4 2 2 2Côte d’Ivoire 4 3 4 3 3 4 4 4 5 -Egypt 9 9 7 5 11 24 16 12 13 19El Salvador - - - 1 1 1 1 1 1 1Ethiopia - 0 0 0 0 0 0 0 0 2Guatemala - - - - - 1 2 9 2 3Guinea - - - - - 0 - - - -Jamaica 1 0 1 1 1 1 - - 0 0Madagascar - - - - 0 0 0 0 0 0Mali - - 0 0 - 0 0 0 0 -Mozambique - - - - - - 1 0 - 7Netherlands Antilles 0 0 0 0 - - - 0 0 0Niger 0 0 0 0 0 0 0 0 - -Pakistan - - 4 5 6 6 6 9 10 17Paraguay - - - - 0 - - - - -Senegal 1 1 4 1 1 0 0 2 - -Swaziland - - - - - - - 0 0 0Togo 0 0 0 0 0 0 0 0 0 -ECONOMIES IN TRANSITION 14 26 35 42 84 541 713 1,073 1,508 1,889Albania - - - - - - - 0 - 0Armenia - - - - 1 - - 0 1 1Azerbaijan - - - - - - - - - 0Belarus - - - - 5 9 9 14 5 6Bulgaria - - - - 4 5 5 6 13 19Croatia 14 25 34 41 58 81 97 158 193 191Georgia - - - - - - - - - -Kazakhstan - - - - 2 3 6 12 15 19Kyrgyzstan - - - - - 0 0 - - 3Macedonia, TFYR 1 1 1 1 1 1 3 11 13 15Moldova, Republic of - - 1 1 1 1 1 2 2 5Russian Federation - - - - - 432 584 856 1,220 1,567Ukraine - - - - 12 10 9 14 45 63
country/territory 1996 1997 1998 1999 2000 2001 2002 2003 2004 2005
EXPORTS (in millions of $)
Economic group and
SOURCE: UNCTAD calculations based on IMF balance of payments statistics on CD-ROM.

TOTAL - REPORTING COUNTRIES 9,196 8,030 8,407 8,807 9,062 11,186 13,541 15,956 15,026 16,954
DEVELOPED ECONOMIES 8,943 7,482 7,808 8,279 8,272 10,166 11,969 14,358 12,960 14,791Australia 128 122 101 80 70 70 88 95 97 135Belgium - - - - - - 1,787 2,394 2,091 2,174Bulgaria - - - - 4 4 7 16 11 22Canada 357 375 343 348 360 342 330 393 388 551Cyprus - - - - - - 24 34 47 41Czech Republic 50 89 104 99 73 71 76 90 126 129Estonia - - - - - - - 25 30 34Finland 300 286 292 - 177 129 284 424 521 847France 1,307 - - - - - - - - -Germany 3,364 3,533 3,590 4,059 3,730 4,036 3,487 3,663 4,394 4,755Greece - - - 60 56 72 66 90 122 137Hungary - - - - - - - - 121 144Ireland - - - - - 1,706 2,264 2,855 - -Italy 1,313 1,124 1,351 1,241 1,199 1,106 1,008 1,174 1,441 1,575Latvia - - - - 22 28 29 17 36 50Lithuania - 4 5 7 11 14 13 13 14 20Malta - - - - - - - - 20 23New Zealand - - 74 - - 62 - 87 124 126Norway 48 87 51 58 127 76 52 56 74 156Poland 55 55 58 93 111 103 100 146 141 205Portugal 82 99 105 151 119 108 130 150 194 207Romania 11 11 14 42 45 25 31 36 44 99Slovakia 24 32 34 23 22 - 29 52 - -Slovenia 59 64 75 73 69 79 92 125 164 191Spain 745 657 724 906 938 927 1,074 1,269 1,481 1,891Sweden 1,102 944 885 1,038 1,137 1,208 999 1,155 1,279 1,281DEVELOPING ECONOMIES 201 494 512 444 546 534 626 702 973 1,057Argentina 21 21 31 24 26 27 17 19 24 21Aruba - - - - - - - - - -Bahamas 17 15 10 17 22 18 - 22 38 61Bangladesh - - - - - 2 2 2 1 4Belize - - - - - 0 0 0 1 1Benin - - - 0 0 0 0 0 0 -Botswana - 2 3 2 1 2 2 2 2 4Brazil 41 59 77 65 130 99 66 62 87 103Burkina Faso - - - - 0 0 - - - -Cape Verde - - 0 1 0 0 1 1 1 2China - 241 265 219 202 258 394 458 698 715Colombia 66 62 66 60 47 44 26 21 25 22Costa Rica - 6 6 7 29 17 41 36 31 26Côte d’Ivoire 0 3 3 3 2 0 2 1 2 -Dominican Republic - - - - - - 2 9 8 9El Salvador - - - 0 1 1 0 0 2 1Ethiopia 2 2 5 3 1 2 2 2 2 3Guatemala - - - - - 1 2 4 1 1Guinea - 0 0 0 0 0 0 0 0 -Jamaica 25 38 31 30 39 40 50 45 27 34Lesotho - - - 0 0 - 0 0 0 -Madagascar - - - - 0 0 0 0 0 0Mali - - 0 0 0 0 0 0 0 -Mozambique - - - - - 7 0 1 - 11Netherlands Antilles 0 0 1 1 - - - 0 1 0Niger 0 0 0 0 0 0 0 0 0 -Pakistan - - 3 - 2 1 1 1 6 14Paraguay - - - 0 0 0 5 5 1 1Senegal 1 1 0 0 1 1 0 3 - -Sierra Leone - - - - - - 1 0 0 0Swaziland 28 41 4 4 32 5 7 4 1 3Togo 0 0 0 0 0 0 0 - 0 -Turkey - - 5 7 6 5 2 - 10 19Venezuela (Bolivarian Republic of) - 2 1 1 2 2 2 2 2 2Yemen - - - - - - - - 0 0ECONOMIES IN TRANSITION 51 54 87 84 245 487 945 897 1,093 1,107Albania - - - - - - - 0 - 3Armenia - - - - 0 0 0 0 1 2Azerbaijan - - - - - - - - - 0Belarus - - - - 5 5 5 5 2 1Croatia 50 52 84 80 98 95 112 163 181 180Georgia - - - - - - 1 1 1 1Kazakhstan - - - - 1 2 5 6 9 9Kyrgyzstan - - - - - 0 0 0 0 1Macedonia, TFYR 2 2 1 1 1 2 4 12 17 18Moldova, Republic of - - 2 3 9 3 8 4 9 9Russian Federation - - - - - 309 642 591 653 796Ukraine - - - - 130 70 169 114 221 86
1996 1997 1998 1999 2000 2001 2002 2003 2004 2005Economic group and country/territory
IMPORTS (in millions of $)
SOURCE: UNCTAD calculations based on IMF balance of payments statistics on CD-ROM.
TA B L E
2.2.BCATEGORIES OF SERVICES THAT INCLUDE CREATIVE INDUSTRIES: IMPORTS OF ADVERTISING, MARKET RESEARCH AND PUBLIC OPINION POLLINGSERVICES, BY ECONOMIC GROUP AND COUNTRY/TERRITORY, 1996-2005
300
Sta
tist
ical
Annex
Part
2
C R E AT I V E E C O N O M Y R E P O R T 2 0 0 8

TA B L E
2.3.A
301
Sta
tistical
Annex
Part
2
C R E AT I V E E C O N O M Y R E P O R T 2 0 0 8
CATEGORIES OF SERVICES THAT INCLUDE CREATIVE INDUSTRIES: EXPORTS OF ARCHITECTURAL, ENGINEERING AND OTHER TECHNICAL SERVICES,BY ECONOMIC GROUP AND COUNTRY/TERRITORY, 1996-2005
TOTAL - REPORTING ECONOMIES 9,828 10,878 13,653 16,554 17,368 17,754 18,565 19,589 23,014 27,722
DEVELOPED ECONOMIES 9,552 10,034 12,283 13,902 13,865 13,718 16,164 16,745 19,508 23,081Australia 241 235 274 312 444 294 314 358 349 494Belgium - - - - - - 807 1,015 1,145 1,303Canada 2,124 2,200 2,166 1,565 1,788 1,898 2,596 2,666 3,194 3,366Cyprus - - - - - - 3 7 12 16Czech Republic - 102 89 97 85 91 76 56 46 48Estonia - - - - - - - 6 11 12Finland - - - - 270 204 237 307 - 408Germany 2,461 2,228 2,663 2,701 2,718 2,968 3,079 6,959 8,381 9,754Hungary - - - - - - - - 85 126Ireland - - - - - 405 536 263 - -Italy 29 25 8 2,087 1,594 1,402 1,550 1,765 1,910 2,318Latvia - - - - 4 6 5 7 11 13Lithuania - 1 3 2 3 4 5 11 7 11Malta - - - - - - - - 7 8Netherlands 3,561 3,580 4,134 4,140 3,921 3,407 3,765 - - -Norway 285 497 908 826 837 797 747 827 939 1,392Poland 151 136 107 85 94 109 176 150 246 371Portugal 109 83 90 119 97 114 174 155 214 226Romania 3 6 5 21 30 30 51 87 93 128Slovakia 14 21 67 51 49 - 30 56 - -Slovenia 20 17 18 25 32 34 37 50 66 75Spain 553 621 687 721 790 940 962 1,104 1,547 1,690Sweden - 283 1,065 1,150 1,108 1,016 1,013 896 1,245 1,323DEVELOPING ECONOMIES 243 799 1,311 2,579 3,307 3,524 1,737 1,684 2,238 2,998Argentina 4 3 4 5 8 12 39 51 50 52Bangladesh - - - - - 4 4 4 3 4Benin - - - - - - - - 1 -Botswana - 2 7 5 14 7 8 2 4 4Brazil 210 753 1,157 975 1,686 1,517 1,586 1,509 2,014 2,739Burkina Faso - - - - 0 0 - - - -Cape Verde - - - 0 0 0 0 - - -Colombia 2 2 3 6 15 19 25 39 59 78Costa Rica - - - - 0 - - - - -Côte d’Ivoire - 1 0 0 0 0 0 0 0 -Ethiopia 2 2 0 2 1 4 1 1 0 0Madagascar 12 - - - - - - 2 3 1Malaysia - - - 1,467 1,504 1,882 - - - -Mali - - - - - 0 - - 0 -Mozambique - - - - - - 4 2 - 1Namibia - - - 1 0 - - 0 2 -Netherlands Antilles 1 1 1 2 1 3 0 4 4 5Niger - - - - 0 - - - - -Pakistan - - 50 16 13 9 19 25 26 54Paraguay 12 14 14 15 16 14 15 14 16 20Senegal 0 0 0 0 - 0 - - - -Swaziland - - - - - - - 0 18 1Tunisia - - 26 34 - - - - - -Venezuela (Bolivarian Republic of) - 20 46 53 49 52 35 31 38 40ECONOMIES IN TRANSITION 33 46 59 73 197 512 664 1,159 1,268 1,643Albania - - - - - - - 0 - 0Belarus - - - - 63 64 64 - 16 18Croatia 25 39 58 72 80 79 112 128 171 202Kazakhstan - - - - 17 15 19 12 16 34Kyrgyzstan 8 7 1 1 1 5 13 14 27 45Macedonia, TFYR - - - - - - 3 13 20 17Russian Federation - - - - - 321 415 904 906 1,148Tajikistan - - - - - - 1 0 1 1Ukraine - - - - 35 28 37 88 111 177
1996 1997 1998 1999 2000 2001 2002 2003 2004 2005Economic group and country/territory
EXPORTS (in millions of $)
SOURCE: UNCTAD calculations based on IMF balance of payments statistics on CD-ROM.

TA B L E
2.3.BCATEGORIES OF SERVICES THAT INCLUDE CREATIVE INDUSTRIES: IMPORTS OF ARCHITECTURAL, ENGINEERING AND OTHER TECHNICAL SERVICES, BY ECONOMIC GROUP AND COUNTRY/TERRITORY, 1996-2005
1996 1997 1998 1999 2000 2001 2002 2003 2004 2005
IMPORTS (in millions of $)
TOTAL - REPORTING COUNTRIES 9,487 10,600 13,607 18,758 19,055 21,552 21,137 17,258 20,531 23,344
DEVELOPED ECONOMIES 7,951 8,955 11,699 15,110 15,155 16,471 18,013 13,767 15,784 17,939Australia 209 301 210 327 274 198 212 235 265 307Belgium - - - - - - 747 753 1,015 1,208Canada 876 848 1,032 922 1,040 1,076 1,371 1,774 1,849 2,093Cyprus - - - - - - 6 5 19 20Czech Republic - 161 220 217 132 120 189 216 236 346Estonia - - - - - - - 6 8 11Finland - - - - 81 79 65 87 114 168Germany 2,803 2,970 3,405 3,917 3,845 5,001 5,064 5,833 6,536 7,399Hungary - - - - - - - - 111 143Ireland - - - - - 66 94 119 - -Italy 24 18 8 2,414 1,976 1,644 1,419 1,687 1,829 2,314Latvia - - - - 10 8 7 13 18 20Lithuania - 3 8 6 7 5 10 13 24 21Malta - - - - - - - - 7 7Netherlands 2,866 2,999 3,290 3,591 3,896 4,314 4,590 - - -New Zealand - - 35 - - 39 - 75 91 132Norway 58 113 506 488 387 239 188 201 272 512Poland 228 219 239 265 327 287 464 476 564 665Portugal 220 235 320 246 202 150 172 188 249 284Romania 22 22 32 15 69 90 139 186 161 158Slovakia 37 40 155 85 113 - 101 173 - -Slovenia 39 26 28 28 24 27 42 53 51 104Spain 568 656 553 653 692 677 681 1,066 1,623 1,441Sweden - 346 1,656 1,934 2,080 2,449 2,451 608 742 585DEVELOPING ECONOMIES 1,500 1,613 1,840 3,573 3,573 3,891 1,439 1,591 1,846 2,233Argentina 7 13 22 34 46 42 31 33 39 44Bangladesh - - - - - 43 25 34 38 65Botswana - 52 91 46 23 25 24 35 33 14Brazil 370 764 1,013 899 998 1,029 902 1,036 1,182 1,597Burundi - - - - - - - - 9 15Cape Verde - - - 0 1 0 0 1 2 1Colombia 277 234 238 192 185 213 200 202 303 320Costa Rica - - - - 1 1 0 - 1 0Ethiopia 18 23 13 9 23 25 15 26 26 24Guinea - - - - 0 0 0 - - -Kenya - 15 - - - - - - - -Madagascar - - - - - - - 28 7 5Malaysia - - - 2,049 2,114 2,312 - - - -Mali - - - 0 - - - - 0 -Mozambique - - - - - 16 64 39 - 2Namibia - - - 69 38 34 24 20 62 -Netherlands Antilles 1 1 1 0 0 0 0 1 1 1Pakistan - - 42 42 62 85 70 54 13 17Paraguay - - 1 2 0 2 0 2 2 -Sierra Leone - - - - - - - 1 2 -Swaziland - - - - 1 1 1 2 36 22Tunisia - - 86 100 - - - - - -Venezuela (Bolivarian Republic of) 829 511 333 132 80 63 82 76 92 107ECONOMIES IN TRANSITION 35 32 68 75 327 1,191 1,685 1,900 2,901 3,173Albania - - - - - - - 0 - 0Belarus - - - - 27 11 11 25 27 43Croatia 15 26 61 69 65 67 112 143 210 208Georgia - - - - - - 0 1 1 1Kazakhstan - - - - 172 289 450 688 1,335 1,599Kyrgyzstan 20 6 8 6 18 9 24 28 25 41Macedonia, TFYR - - - - - - 4 19 26 39Russian Federation - - - - - 648 838 872 1,168 1,095Tajikistan - - - - - - 1 0 1 2Ukraine - - - - 45 166 245 124 108 144
Economic group and country/territory
SOURCE: UNCTAD calculations based on IMF balance of payments statistics on CD-ROM.
302
Sta
tist
ical
Annex
Part
2
C R E AT I V E E C O N O M Y R E P O R T 2 0 0 8

TA B L E
2.4.A
303
Sta
tistical
Annex
Part
2
C R E AT I V E E C O N O M Y R E P O R T 2 0 0 8
CATEGORIES OF SERVICES THAT INCLUDE CREATIVE INDUSTRIES: EXPORTS OF AUDIOVISUAL AND RELATED SERVICES, BY ECONOMIC GROUPAND COUNTRY/TERRITORY, 1996-2005
TOTAL - REPORTING ECONOMIES 6,327 7,560 9,176 10,549 13,214 13,012 13,637 16,138 18,720 17,518
DEVELOPED ECONOMIES 6,280 7,492 9,097 10,252 12,744 12,472 12,939 15,496 17,941 16,499Australia 95 107 89 99 726 47 57 108 104 97Belgium - - - - - - 240 297 385 444Canada 784 950 997 1,265 1,324 1,221 1,138 1,169 1,229 1,461Cyprus 1 1 0 - - 1 1 1 3 6Czech Republic - 39 59 31 25 23 26 20 35 50Estonia - - - - - - - 1 1 1Finland - - - 4 - 4 6 26 5 7France 900 936 951 923 1,121 975 1,022 1,287 1,639 1,424Germany 144 146 245 206 395 523 534 1,007 961 705Greece - - - 10 48 42 80 262 879 93Hungary 23 33 35 39 155 540 463 803 1,143 1,265Ireland - - - - 163 286 320 400 - -Italy 216 213 209 199 268 210 228 180 336 328Japan 86 119 322 133 57 61 79 84 62 82Latvia 0 0 - - 0 0 0 3 1 2Lithuania - 0 - 0 9 5 6 11 5 3Malta - - - - - - - - 0 14Netherlands 247 196 178 180 194 151 179 - - -Norway 30 32 45 48 43 74 58 70 97 192Poland 15 25 58 36 21 22 19 29 32 36Portugal 11 13 20 16 20 19 21 23 43 28Romania 10 8 5 6 9 6 19 23 48 64Slovakia - - 18 5 7 - 3 8 - -Slovenia 4 4 4 5 5 5 4 6 11 11Spain 114 118 151 157 205 246 257 308 424 478Sweden - 17 79 97 90 85 81 145 130 149United Kingdom 771 1,004 1,072 1,164 1,479 1,308 1,565 2,089 2,857 2,499United States 2,830 3,530 4,560 5,628 6,379 6,618 6,534 7,137 7,511 7,060DEVELOPING ECONOMIES 42 60 63 282 464 494 663 570 671 877Argentina 9 20 11 14 18 37 92 112 127 139Bangladesh - 0 0 - - 0 0 4 0 1Barbados - - - - - - - - - 0Benin 0 0 0 0 - 0 0 - 0 -Bolivia - - - - - - - 1 1 1Brazil 3 - - 7 17 27 28 29 15 16Cape Verde - - - 0 0 0 0 - - -China - 10 15 7 11 28 30 33 41 134Colombia 7 6 6 4 12 24 24 20 26 24Costa Rica - 0 0 - - - - - - -Côte d’Ivoire - - 0 0 0 0 - - - -Ecuador 17 14 17 12 39 24 32 34 36 39Ethiopia 0 0 2 2 1 1 3 1 0 -Guatemala - - - - - 0 0 1 0 0Jamaica 0 1 1 1 1 1 - - - -Madagascar - - - - - - - 0 - -Mali - - - - - 0 - 0 0 -Mauritius - - - - - 0 1 0 0 1Mexico 5 5 5 209 328 318 400 293 358 373Niger 0 0 0 0 0 0 - 0 - -Pakistan - - - - - - - 1 - -Philippines - - - 14 15 6 6 9 7 19Republic of Korea - 1 1 8 13 24 44 28 56 127Senegal - - - - - - 0 0 - -Swaziland - - - - - - - 0 - -Uruguay - - - - 5 - - 0 - -Venezuela (Bolivarian Republic of) - 4 5 4 4 4 4 4 4 4ECONOMIES IN TRANSITION 5 8 16 15 7 46 35 72 108 142Albania - - - - - - - 0 - 0Armenia - 2 5 4 1 1 1 1 3 3Belarus - - - - - - - - 2 1Croatia 5 7 11 11 6 7 9 9 5 7Georgia - - - - - - 0 0 0 0Kazakhstan - - - - 0 0 0 0 0 0Macedonia, TFYR - - - - - - 0 2 3 3Moldova, Republic of - - 0 0 0 1 1 1 1 1Russian Federation - - - - - 36 24 59 93 127
1996 1997 1998 1999 2000 2001 2002 2003 2004 2005Economic group and country/territory
EXPORTS (in millions of $)
SOURCE: UNCTAD calculations based on IMF balance of payments statistics on CD-ROM.

TA B L E
2.4.BCATEGORIES OF SERVICES THAT INCLUDE CREATIVE INDUSTRIES: IMPORTS OF AUDIOVISUAL AND RELATED SERVICES, BY ECONOMIC GROUPAND COUNTRY/TERRITORY, 1996-2005
1996 1997 1998 1999 2000 2001 2002 2003 2004 2005
IMPORTS (in millions of $)
TOTAL - REPORTING ECONOMIES 9,054 9,384 9,800 11,257 12,448 13,321 12,266 13,626 16,152 16,392
DEVELOPED ECONOMIES 8,698 8,918 9,382 10,423 11,499 12,223 11,140 12,515 14,686 14,702Australia 387 401 385 411 389 327 399 459 562 541Belgium - - - - - - 332 394 443 372Canada 1,105 1,097 1,153 1,217 1,536 1,379 1,480 1,612 1,857 1,773Cyprus 5 5 5 6 6 6 3 8 13 16Czech Republic - 123 152 25 7 18 22 24 20 16Estonia - - - - - - - 0 0 1Finland - - 16 34 52 29 55 7 7 12France 1,362 1,345 1,398 1,321 1,554 1,630 1,622 1,766 1,804 1,840Germany 2,556 2,575 2,479 3,552 3,558 4,033 2,273 2,955 3,185 2,809Greece - - - 38 37 45 63 74 225 60Hungary 13 13 20 20 128 539 461 813 1,010 1,144Ireland - - - - 26 21 74 87 - -Italy 720 689 874 690 629 607 585 695 1,083 1,268Japan 585 581 770 739 866 1,058 832 748 861 903Latvia - 0 - - 2 2 3 5 10 9Lithuania - 0 0 0 0 1 0 0 0 1Malta 2 4 4 3 3 3 5 7 3 1Netherlands 248 210 159 166 225 190 244 - - -Norway 59 68 85 113 124 140 153 208 271 335Poland 24 38 44 68 108 92 126 100 69 99Portugal 63 39 81 90 105 123 102 122 148 116Romania 2 6 15 13 11 14 16 25 40 88Slovakia - - 7 8 7 - 6 7 - -Slovenia 9 13 15 15 18 17 17 25 25 23Spain 650 773 796 847 1,020 960 1,098 1,231 1,272 1,142Sweden - 13 63 61 67 65 47 88 128 129United Kingdom 728 773 738 867 890 803 984 851 1,238 1,090United States 180 150 122 119 132 121 137 206 409 915DEVELOPING ECONOMIES 347 460 408 824 940 971 954 919 1,176 1,256Argentina 91 149 155 113 171 228 93 108 140 153Bahamas 2 2 2 2 2 2 2 2 2 2Bangladesh 0 - - - - - 1 0 0 0Barbados - - - - - - - - - 0Benin 0 0 0 0 0 0 0 0 0 -Bolivia - 5 6 2 2 2 2 4 5 5Brazil 75 76 68 264 260 256 215 250 300 314Cape Verde - - 0 0 0 0 1 0 0 1China - 44 39 34 37 50 96 70 176 154Colombia 9 5 15 21 26 27 27 29 31 41Costa Rica 1 - - - - - - - - -Côte d’Ivoire 1 1 1 1 1 1 1 1 1 -Ecuador 34 29 28 34 52 71 86 92 98 106Egypt - - - - - - - - - -Ethiopia 0 0 0 0 0 1 0 0 0 0Guatemala - - - - - 0 0 0 0 0Guinea - - - - - - 0 0 1 -Honduras 3 3 7 7 8 8 9 6 5 6Jamaica 2 0 0 3 3 3 2 - 2 1Madagascar - - - - - - - 0 - -Malawi 0 0 - 0 0 0 0 - - -Mali - - - - - - 0 0 1 -Mauritius - - - - - 1 5 6 7 6Mexico 5 6 6 227 245 198 260 221 225 275Niger 0 0 - - - - 0 0 - -Pakistan - - - - - - - - 2 8Philippines - - - 17 24 16 16 14 11 5Republic of Korea 107 116 65 80 79 89 124 90 152 159Senegal 0 0 - 0 - - 0 0 0 -Solomon Islands - - - 0 - - - - - -Swaziland - - - - - - - 0 0 0Togo - - 0 - - - - - - -Tunisia 10 10 - - - - - - - -Uruguay - - - 13 - - 10 - -Venezuela (Bolivarian Republic of) 6 14 16 18 17 18 16 15 17 19ECONOMIES IN TRANSITION 10 6 10 11 9 127 172 192 291 434Albania - - - - - - - 0 - 1Armenia - 0 1 2 0 3 3 3 3 4Belarus - - - - - - - - 4 7Croatia 10 6 9 9 7 10 11 17 22 23Kazakhstan - - - - 2 2 3 12 6 16Macedonia, TFYR - - - - - - 0 3 4 3Moldova, Republic of - - 0 0 0 0 0 1 0 1Russian Federation - - - - - 112 155 155 251 379
Economic group and country/territory
SOURCE: UNCTAD calculations based on IMF balance of payments statistics on CD-ROM.
304
Sta
tist
ical
Annex
Part
2
C R E AT I V E E C O N O M Y R E P O R T 2 0 0 8

TA B L E
2.5.A
305
Sta
tistical
Annex
Part
2
C R E AT I V E E C O N O M Y R E P O R T 2 0 0 8
CATEGORIES OF SERVICES THAT INCLUDE CREATIVE INDUSTRIES: EXPORTS OF RESEARCH AND DEVELOPMENT SERVICES, BY ECONOMICGROUP AND COUNTRY/TERRITORY, 1996-2005
TOTAL - REPORTING ECONOMIES 13,336 7,968 8,924 8,544 9,640 9,587 12,570 15,926 15,581 17,990
DEVELOPED ECONOMIES 13,332 7,614 8,396 8,251 9,191 8,384 10,818 13,528 14,974 17,097Australia 103 133 105 144 137 131 149 205 258 282Belgium - - - - - - 795 1,224 1,540 1,592Canada 1,249 1,309 1,849 2,159 2,850 2,016 1,605 2,331 2,224 2,404Cyprus - - - - - - 1 19 24 13Czech Republic 13 13 39 36 21 46 39 11 13 12Estonia - - - - - - - 13 15 13Finland 34 35 34 - 199 222 188 319 - 341France 7,130 - - - - - - - - -Germany 3,351 4,696 4,579 4,190 4,121 3,479 4,211 4,987 5,800 6,913Greece - - - 29 40 38 60 57 81 93Hungary - - - - - - - - 228 232Ireland - - - - - 388 383 366 442 458Italy 815 665 572 662 569 842 978 952 1,091 995Latvia - - - - 4 4 6 7 8 12Lithuania - - - - - - - 2 3 2Malta - - - - - - - - 3 3Norway 150 142 140 140 158 133 154 150 200 319Poland 14 15 17 24 20 28 38 38 97 168Portugal 17 15 26 18 14 15 29 28 29 36Romania 1 1 2 9 7 20 15 10 14 34Slovakia 4 4 7 6 8 - 6 10 - -Slovenia 11 12 12 10 11 12 17 19 27 29Spain 438 457 680 469 410 455 512 590 767 870Sweden - 118 334 355 622 555 1,631 2,191 2,109 2,278DEVELOPING ECONOMIES 3 349 525 289 374 915 1,349 1,953 81 120Argentina 3 3 4 5 13 20 34 50 62 68Bangladesh - - - - - 2 4 5 6 6Benin - - - - - 0 - 0 - -Botswana - 0 1 1 1 1 1 3 4 3Brazil - - - - - - - - - 38Burkina Faso - - - - 0 - - - - -China - 346 518 280 356 889 1,285 1,885 - -Costa Rica - 0 - - - - - - - 0Ethiopia - - 2 3 4 2 2 4 3 0Madagascar - - - - - - - 0 - -Mali - - - - - - - 0 1 -Mozambique - - - - - - 23 6 - 2Niger - - - - - - 0 - - -Pakistan - - - - - - - - 2 2Senegal 0 0 - 0 - 0 - - - -Swaziland - - - - - - - 1 3 1ECONOMIES IN TRANSITION 1 4 3 5 76 288 403 445 526 773Belarus - - - - 5 8 8 8 8 10Bulgaria - - - - 10 18 21 23 19 47Croatia 1 4 3 5 8 8 10 14 19 20Kazakhstan - - - - 5 7 7 4 8 7Kyrgyzstan - - - - - 0 0 0 0 1Macedonia, TFYR - - - - - - 2 6 6 6Russian Federation - - - - - 207 308 298 339 481Ukraine - - - - 47 39 47 92 128 202
1996 1997 1998 1999 2000 2001 2002 2003 2004 2005Economic group and country/territory
EXPORTS (in millions of $)
SOURCE: UNCTAD calculations based on IMF balance of payments statistics on CD-ROM.

TA B L E
2.5.BCATEGORIES OF SERVICES THAT INCLUDE CREATIVE INDUSTRIES: IMPORTS OF RESEARCH AND DEVELOPMENT SERVICES, BY ECONOMICGROUP AND COUNTRY/TERRITORY, 1996-2005
1996 1997 1998 1999 2000 2001 2002 2003 2004 2005
IMPORTS (in millions of $)
TOTAL - REPORTING ECONOMIES 10,277 6,101 7,650 7,527 8,234 12,839 15,681 18,366 18,487 19,745
DEVELOPED ECONOMIES 10,254 5,584 6,818 6,924 7,453 10,274 12,336 14,684 18,210 19,386Australia 118 110 79 78 47 56 64 107 124 133Belgium - - - - - - 642 804 1,297 1,313Bulgaria - - - - 40 112 81 139 122 177Canada 563 694 859 1,051 1,151 932 630 821 977 912Cyprus - - - - - - 11 15 21 18Czech Republic 20 10 17 37 130 186 125 22 37 20Estonia - - - - - - - 8 6 2Finland 144 174 169 - 114 122 222 464 352 503France 4,976 - - - - - - - - -Germany 3,561 3,533 4,067 4,127 4,059 4,899 5,368 4,902 5,324 5,786Greece - - - 28 40 53 60 63 73 94Hungary - - - - - - - - 631 733Ireland - - - - - 1,886 2,720 2,602 3,992 4,445Italy 437 469 661 451 459 417 449 549 673 628Latvia - - - - 4 2 4 2 3 3Lithuania - - - - - - - 1 2 1Malta - - - - - - - - 4 3New Zealand - - 9 - - 18 - 24 26 39Norway 142 119 106 114 122 104 93 103 129 272Poland 13 16 24 39 29 67 63 81 81 80Portugal 25 17 21 21 14 9 9 25 16 27Romania 3 5 2 16 6 3 11 4 2 20Slovakia 8 8 6 5 5 - 4 8 - -Slovenia 16 20 22 21 25 20 22 27 40 48Spain 229 226 237 423 373 265 366 494 585 503Sweden - 182 539 513 834 1,123 1,394 3,420 3,694 3,627DEVELOPING ECONOMIES 15 496 784 555 670 1,524 2,650 3,481 63 58Argentina 14 14 12 17 23 15 13 15 41 28Bangladesh - - - - - 1 1 0 0 0Benin - - - - - - - 0 0 -Botswana - 0 0 0 0 0 0 0 9 3Brazil - - - - - - - - - 7China - 468 758 524 640 1,502 2,631 3,450 - -Costa Rica - - - - - - - - - 0Dominican Republic - - - - - - - 2 2 3Ethiopia - - - 1 0 0 0 0 - 0Jamaica - - - - - - - - 0 0Madagascar - - - - - - - 0 - 0Malawi 0 0 1 1 1 1 0 - - -Mozambique - - - - - 1 0 7 - 3Pakistan - - - - - - - - 2 11Swaziland - - - - - - - 1 1 2Venezuela (Bolivarian Republic of) - 13 13 12 6 4 5 5 7 -ECONOMIES IN TRANSITION 9 21 48 48 111 1,041 694 201 213 302Belarus - - - - 3 4 3 3 3 5Croatia 9 21 48 48 45 33 40 32 45 92Kazakhstan - - - - 3 5 0 3 3 9Kyrgyzstan - - - - - 0 0 0 0 1Macedonia, TFYR - - - - - - 4 15 13 8Russian Federation - - - - - 476 155 101 102 112Ukraine - - - - 60 523 492 47 47 74
Economic group and country/territory
SOURCE: UNCTAD calculations based on IMF balance of payments statistics on CD-ROM.
306
Sta
tist
ical
Annex
Part
2
C R E AT I V E E C O N O M Y R E P O R T 2 0 0 8

TA B L E
2.6.A
307
Sta
tistical
Annex
Part
2
C R E AT I V E E C O N O M Y R E P O R T 2 0 0 8
CATEGORIES OF SERVICES THAT INCLUDE CREATIVE INDUSTRIES: EXPORTS OF PERSONAL, CULTURAL AND RECREATIONAL SERVICES, BY ECONOMIC GROUP AND COUNTRY/TERRITORY, 1996-2005
TOTAL - REPORTING ECONOMIES 10,064 12,776 16,420 17,304 20,044 18,634 21,845 24,660 28,511 27,517
DEVELOPED ECONOMIES 8,905 10,244 12,388 14,006 16,581 16,494 17,563 20,650 23,503 22,838Australia 207 245 248 266 897 248 343 376 333 337Austria 202 211 212 224 193 212 204 266 327 355Belgium - - - - - - 289 368 454 520Bulgaria - - - - 22 28 31 37 42 39Canada 901 1,066 1,107 1,385 1,451 1,350 1,271 1,325 1,406 1,658Cyprus 5 5 5 6 6 10 15 10 25 41Czech Republic 97 118 284 244 189 161 165 111 141 156Estonia 0 0 1 1 1 2 1 2 3 5Faeroe Islands - - 0 0 1 0 1 1 - -Finland - - - 4 4 11 12 29 16 13France 1,419 1,411 1,428 1,344 1,591 1,429 1,520 1,868 2,298 2,158Germany 144 146 245 206 395 523 534 1,007 961 705Greece - - - 202 246 189 194 332 966 166Hungary 46 61 89 91 207 600 527 845 1,167 1,302Iceland 3 5 6 10 7 8 5 4 9 16Ireland - - - 166 163 286 320 400 - 413Italy 395 444 433 482 544 543 720 720 747 758Japan 178 234 429 239 116 118 315 140 72 97Latvia 0 0 1 0 1 1 1 4 3 5Lithuania - 1 3 1 11 10 20 18 9 10Luxembourg 177 190 338 340 376 330 164 165 190 237Malta - - - - - - - - 35 44Netherlands 501 456 468 536 552 534 538 618 771 902New Zealand 21 34 48 100 135 117 111 143 226 175Norway 104 111 104 113 139 172 175 210 185 351Poland 36 48 92 60 50 67 61 58 91 94Portugal 93 103 140 109 136 140 115 135 193 206Romania 54 60 65 65 76 67 98 118 214 92Slovakia 19 38 61 44 54 - 67 69 - -Slovenia 9 11 12 16 14 16 15 21 30 28Spain 249 346 439 444 535 630 671 814 966 1,089Sweden - 22 102 119 113 111 112 208 179 216Switzerland 10 5 10 7 7 5 4 4 4 5United Kingdom 1,204 1,342 1,458 1,555 1,973 1,954 2,410 3,086 3,928 3,583United States 2,830 3,530 4,560 5,628 6,379 6,618 6,534 7,137 7,511 7,060DEVELOPING ECONOMIES 1,135 2,504 3,959 3,178 3,422 2,017 4,177 3,826 4,766 4,401Angola - - - - - - 1 1 3 5Argentina 10 20 11 16 18 38 92 116 136 149Bangladesh 0 0 1 0 1 0 0 4 1 1Barbados 0 0 0 0 0 0 1 1 - 0Benin 0 0 0 0 - 0 0 - 0 -Bolivia - - - 1 1 1 1 1 1 1Brazil 61 129 116 41 63 58 58 54 47 56Cambodia - - 0 1 1 1 1 1 1 1Cameroon - - 0 0 1 1 2 11 - -Cape Verde - - - 0 0 0 0 0 0 0Chile 28 28 28 23 22 29 39 68 73 86China - 10 15 7 11 28 30 33 41 134China, SAR of Hong Kong - - 113 85 51 99 112 137 290 -Colombia 8 6 6 16 23 25 27 31 39 41Congo 2 2 5 7 12 17 21 9 11 -Costa Rica - 0 0 - - - - - - -Côte d’Ivoire - - 0 0 0 0 - 0 0 -Ecuador 17 14 17 12 39 24 32 34 36 39Egypt 7 11 12 19 15 19 54 72 69 83El Salvador - - - - 1 0 0 - 0 -Eritrea - - - 0 - - - - - -Ethiopia 0 0 2 2 1 1 3 1 0 -Guatemala - - - - - 0 0 1 0 0Guinea - 0 - - - - 0 - - -Indonesia - - - - - - - - 47 57Jamaica 8 9 10 10 10 9 9 20 28 30Kenya - - - - 0 0 0 0 0 0Lebanon - - - - - - 0 - - 0Madagascar - - - - 0 0 0 0 - -Malaysia - - - 32 33 29 1,566 1,835 1,657 1,562Mali - - - - 0 0 - 0 0 -Mauritius - - - - 2 3 5 5 4 2Mexico 5 5 5 209 328 318 400 293 358 373Mongolia - - - - - - - 0 1 -Mozambique - - - - - - - 0 0 0Myanmar - - - - - - 0 0 - -Netherlands Antilles 2 2 2 2 2 1 1 1 1 0Niger 0 0 0 0 0 0 - 0 - -Occupied Palestinian Territory - - 1 5 9 2 1 3 1 -Pakistan 26 22 - - - - - 1 0 2
1996 1997 1998 1999 2000 2001 2002 2003 2004 2005Economic group and country/territory
EXPORTS (in millions of $)

TA B L E
2.6.ACATEGORIES OF SERVICES THAT INCLUDE CREATIVE INDUSTRIES: EXPORTS OF PERSONAL, CULTURAL AND RECREATIONAL SERVICES, BY ECONOMIC GROUP AND COUNTRY/TERRITORY, 1996-2005
1996 1997 1998 1999 2000 2001 2002 2003 2004 2005
EXPORTS (in millions of $)
Papua New Guinea - - - - - - - - 0 0Philippines - - - 19 18 15 7 9 7 20Republic of Korea - 5 14 29 137 138 185 76 128 261Samoa - - - - - - - - 0 1Senegal 0 0 0 - - - 0 0 - -Singapore 9 9 9 18 19 34 127 154 189 197Solomon Islands - - 1 0 - - - - - -South Africa - - - - - 37 38 60 88 114Sudan - - - - 1 - - 0 - -Swaziland - - - - - - - 0 0 0Syrian Arab Republic - - - - - - - - 75 95Togo 0 0 1 - - - - - - -Tonga - - - - - 0 0 - - -Tunisia 3 2 2 3 3 4 3 5 10 4Turkey 949 2,225 3,579 2,615 2,591 1,074 1,355 781 1,418 1,079United Republic of Tanzania - - 3 1 0 0 1 1 0 1Uruguay - - 0 0 5 4 0 0 1 1Venezuela (Bolivarian Republic of) - 5 6 6 6 6 5 5 5 5ECONOMIES IN TRANSITION 24 28 73 120 40 123 105 184 241 278Albania - - - - - - 2 5 8 18Armenia 2 3 7 5 1 2 2 2 5 5Azerbaijan - - - - - - - 2 3 3Belarus - - - - 2 1 2 2 3 2Croatia 11 15 32 37 30 27 28 33 30 29Georgia - - - - - - 0 0 2 3Kazakhstan 7 9 27 73 0 0 0 0 0 0Kyrgyzstan 2 1 6 4 3 3 2 6 9 7Macedonia, TFYR 3 1 2 2 1 2 2 4 7 7Moldova, Republic of - - 0 0 0 1 1 1 1 1Russian Federation - - - - - 85 63 125 164 187Tajikistan - - - - - - - - - -Ukraine - - - - 3 3 3 4 11 16
Economic group and country/territory
SOURCE: UNCTAD calculations based on IMF balance of payments statistics on CD-ROM.
308
Sta
tist
ical
Annex
Part
2
C R E AT I V E E C O N O M Y R E P O R T 2 0 0 8
CONTINUED

TA B L E
2.6.B
309
Sta
tistical
Annex
Part
2
C R E AT I V E E C O N O M Y R E P O R T 2 0 0 8
CATEGORIES OF SERVICES THAT INCLUDE CREATIVE INDUSTRIES: IMPORTS OF PERSONAL, CULTURAL AND RECREATIONAL SERVICES, BY ECONOMIC GROUP AND COUNTRY/TERRITORY, 1996-2005
TOTAL - REPORTING COUNTRIES 14,824 16,159 17,313 18,706 18,656 18,274 19,886 22,388 25,310 25,629
DEVELOPED ECONOMIES 12,172 12,575 13,101 14,216 15,548 15,991 14,883 17,365 20,411 20,462Australia 445 461 464 482 471 396 484 563 698 687Austria 228 248 229 208 174 191 213 292 395 366Belgium - - - - - - 380 443 494 444Bulgaria - - - - 4 9 10 17 15 16Canada 1,211 1,202 1,256 1,324 1,647 1,492 1,598 1,750 2,010 1,947Cyprus 10 10 11 12 13 10 13 22 49 56Czech Republic 108 211 286 153 127 136 175 155 166 171Estonia 1 3 2 1 2 3 1 2 2 5Faeroe Islands - - 0 1 1 1 1 1 - -Finland - - 16 43 59 36 61 25 29 23France 1,837 1,818 1,800 1,711 1,976 2,058 2,079 2,332 2,624 2,821Germany 2,556 2,575 2,479 3,552 3,558 4,033 2,273 2,955 3,185 2,809Greece - - - 154 160 196 182 184 357 185Hungary 31 38 48 43 151 563 491 845 1,048 1,190Iceland 11 10 11 13 15 13 12 11 12 13Ireland - - - 32 26 21 74 87 - 105Italy 1,012 1,089 1,265 1,114 1,157 1,090 933 1,034 1,507 1,638Japan 1,209 1,086 1,261 1,137 1,275 1,391 1,190 946 1,081 1,115Latvia - 0 0 0 4 5 5 7 15 13Lithuania - 7 6 6 4 6 4 1 1 2Luxembourg 414 370 465 509 481 435 311 420 476 329Malta 2 5 5 4 4 4 6 8 6 6Netherlands 520 534 496 498 597 580 616 746 880 946New Zealand 10 13 19 25 36 37 65 68 57 44Norway 108 149 148 168 179 200 218 304 383 521Poland 41 57 66 101 139 120 155 128 131 157Portugal 158 150 246 225 239 255 227 264 360 340Romania 39 62 73 108 74 83 82 101 143 108Slovakia 32 40 60 51 53 - 22 98 - -Slovenia 23 29 33 36 36 37 38 50 59 61Spain 1,041 1,269 1,272 1,250 1,425 1,277 1,491 1,699 1,905 1,746Sweden - 16 81 82 88 87 70 116 161 157Switzerland 78 80 71 69 61 65 67 90 96 87United Kingdom 867 894 810 983 1,181 1,041 1,198 1,396 1,655 1,441United States 180 150 122 119 132 121 137 206 409 915DEVELOPING ECONOMIES 2,466 3,499 4,133 4,419 3,056 2,040 4,757 4,730 4,423 4,390Angola - - - - - - 15 11 28 45Argentina 91 149 155 114 171 228 95 108 140 153Bahamas 2 2 2 2 2 2 2 2 2 2Bangladesh 1 1 - - 0 0 1 0 0 0Barbados 0 0 0 0 0 0 - 0 1 0Belize - - - - - 0 0 0 0 0Benin 0 0 0 0 0 0 0 0 0 -Bolivia - 5 6 2 2 2 2 4 5 6Brazil 281 296 334 375 363 365 309 337 409 451Burkina Faso - - - - 0 - - - - -Cambodia - - 1 2 2 3 3 3 4 4Cameroon - - 1 1 1 1 1 10 - -Cape Verde - - 0 1 0 0 1 0 0 1Chile 25 30 45 42 44 36 44 47 52 56China - 44 39 34 37 50 96 70 176 154China, SAR of Hong Kong - - 51 47 65 70 68 68 52 -Colombia 9 5 17 22 27 27 28 29 31 44Congo 6 5 2 3 5 5 5 3 4 -Costa Rica 1 0 - 0 0 0 0 0 0 0Côte d’Ivoire 1 1 1 1 1 1 1 1 1 -Ecuador 34 29 28 34 52 71 86 92 98 106Egypt 7 21 22 20 21 22 14 15 15 22El Salvador - - - - 1 1 2 1 2 2Eritrea - - 0 0 0 - - - - -Ethiopia 0 0 0 0 0 1 0 0 0 0Guatemala - - 0 - - 0 5 0 0 0Guinea 0 - 1 - 0 0 0 0 1 -Haiti - - - - - - - - - 17Honduras 3 4 7 7 8 8 9 6 5 6Indonesia - - - - - - - - 184 166Jamaica 3 3 4 4 4 4 4 2 3 2Kenya - - - 0 2 1 4 2 1 1Lebanon - - - - - - 0 - - 0Libyan Arab Jamahiriya - - - - - - 1 9 9 10Madagascar 0 0 0 0 0 0 0 0 - -Malawi 3 3 3 5 6 5 9 - - -Malaysia - - - 68 70 106 2,790 2,922 1,899 1,855Mali - 0 - - - 0 0 0 13 -Mauritius - - - - 4 5 10 14 21 31
1996 1997 1998 1999 2000 2001 2002 2003 2004 2005Economic group and country/territory
IMPORTS (in millions of $)
SOURCE: UNCTAD calculations based on IMF balance of payments statistics on CD-ROM.

TA B L E
2.6.B
1996 1997 1998 1999 2000 2001 2002 2003 2004 2005
IMPORTS (in millions of $)
Mexico 5 6 6 227 245 198 260 221 225 275Mongolia - - - - - - - 0 - -Mozambique - - - - - - 0 0 0 1Myanmar - - - 0 0 0 0 6 3 -Netherlands Antilles 1 2 2 3 1 1 1 2 1 1Niger 0 0 - - - 0 0 0 - -Pakistan 11 12 - - - - - - 2 8Palestinian - - 14 13 13 22 38 36 16 -Papua New Guinea - - - - - - - - 0 0Philippines - - - 27 32 37 17 15 15 9Republic of Korea 121 137 92 153 160 206 283 261 376 473Senegal 0 0 0 0 - 0 0 0 0 -Singapore 35 41 34 51 82 171 265 241 267 278Solomon Islands - - - 0 - - - - - -South Africa - - - - - 3 3 3 5 8Sudan - 0 - 2 - - - 0 - -Swaziland - - - - - - - 0 0 0Syrian Arab Republic - - - - - - - - 1 1Togo - 0 0 - - - - - - -Tonga - - - - - 0 0 - - -Tunisia 10 10 14 9 9 10 5 4 6 6Turkey 1,798 2,634 3,158 3,043 1,541 288 205 117 176 88United Republic of Tanzania - - 0 0 0 0 - 1 0 0Uruguay - - 26 27 13 16 18 10 7 7Venezuela (Bolivarian Republic of) 16 60 68 80 72 71 58 52 165 101ECONOMIES IN TRANSITION 185 85 79 71 52 243 246 293 476 776Albania - - - - - - 7 8 30 104Armenia 0 3 4 3 1 5 5 5 6 7Azerbaijan - - - - - - - 5 5 5Belarus - - - - 3 4 4 5 7 11Croatia 50 41 42 40 30 32 32 41 53 56Georgia - - - - - - - - - -Kazakhstan 133 38 30 24 2 2 3 12 7 16Kyrgyzstan 0 0 2 3 3 2 0 3 6 21Macedonia, TFYR 1 2 2 1 2 3 3 6 5 6Moldova, Republic of - - 0 0 0 0 0 1 0 1Russian Federation - - - - - 166 173 188 309 440Tajikistan - - - - - - - - - -Ukraine - - - - 11 30 20 18 48 109
Economic group and country/territory
SOURCE: UNCTAD calculations based on IMF balance of payments statistics on CD-ROM.
310
Sta
tist
ical
Annex
Part
2
C R E AT I V E E C O N O M Y R E P O R T 2 0 0 8
CONTINUED

TA B L E
2.7.A
311
Sta
tistical
Annex
Part
2
C R E AT I V E E C O N O M Y R E P O R T 2 0 0 8
CATEGORIES OF SERVICES THAT INCLUDE CREATIVE INDUSTRIES: EXPORTS OF OTHER PERSONAL, CULTURAL AND RECREATIONAL SERVICES, BY ECONOMIC GROUP AND COUNTRY/TERRITORY, 1996-2005
TOTAL - REPORTING COUNTRIES 1,022 2,307 3,691 2,779 2,802 1,314 2,065 3,315 3,854 3,544
DEVELOPED ECONOMIES 73 82 106 149 197 203 660 611 591 700Bulgaria - - - - - 28 31 37 42 39Cyprus - - - - - - - 7 12 19Czech Republic - - - - - - 111 47 50 49Estonia - - - - - - - 1 2 4Hungary - - - - - - - - 7 15Italy - - - - - - 276 320 272 275Latvia - - - - - - - - 1 2Lithuania - - - - - - - 7 1 0Malta - - - - - - - - 34 29Norway - - - 65 96 97 117 140 88 159Portugal 73 82 106 84 102 106 78 89 122 148Romania - - - - - - 79 - - -DEVELOPING ECONOMIES 950 2,225 3,580 2,627 2,603 1,079 1,371 2,663 3,214 2,788Bangladesh - - - - - - - - - 0Barbados - - - - - - - - - 0Colombia 1 0 1 12 12 1 3 11 13 17Congo - - - - - - - 9 11 -Guatemala - - - - - - 0 0 0 0Jamaica - - - - - - 9 20 28 28Lebanon - - - - - - - - - 0Malaysia - - - - - - - 1,835 1,657 1,562Mali - - - - - - - - 0 0Mozambique - - - - - - - 0 0 0Pakistan - - - - - - - - 0 -Papua New Guinea - - - - - - - - 0 0Syrian Arab Republic - - - - - - - - 75 95Tunisia - - - - - 4 3 5 10 4Turkey 949 2,225 3,579 2,615 2,591 1,074 1,355 781 1,418 1,079United Republic of Tanzania - - - - - 0 1 1 0 1Uruguay - - - - - - - - 1 1ECONOMIES IN TRANSITION 0 0 6 4 2 31 34 41 49 55Albania - - - - - - - 1 2 11Belarus - - - - - 1 2 2 1 1Georgia - - - - - - - - 2 3Kazakhstan - - - - - - - - - 0Kyrgyzstan - - 6 4 2 2 1 2 2 1
1996 1997 1998 1999 2000 2001 2002 2003 2004 2005Economic group and country/territory
EXPORTS (in millions of $)
SOURCE: UNCTAD calculations based on IMF balance of payments statistics on CD-ROM.
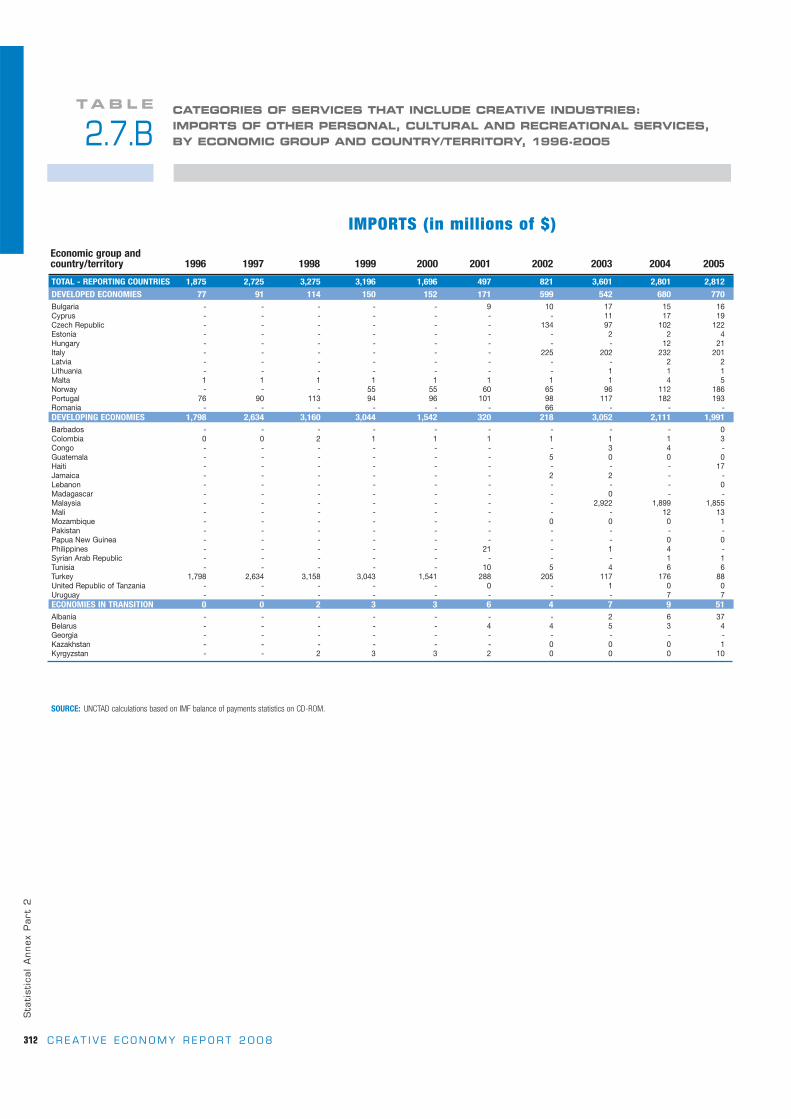
TA B L E
2.7.BCATEGORIES OF SERVICES THAT INCLUDE CREATIVE INDUSTRIES: IMPORTS OF OTHER PERSONAL, CULTURAL AND RECREATIONAL SERVICES, BY ECONOMIC GROUP AND COUNTRY/TERRITORY, 1996-2005
1996 1997 1998 1999 2000 2001 2002 2003 2004 2005
IMPORTS (in millions of $)
TOTAL - REPORTING COUNTRIES 1,875 2,725 3,275 3,196 1,696 497 821 3,601 2,801 2,812
DEVELOPED ECONOMIES 77 91 114 150 152 171 599 542 680 770Bulgaria - - - - - 9 10 17 15 16Cyprus - - - - - - - 11 17 19Czech Republic - - - - - - 134 97 102 122Estonia - - - - - - - 2 2 4Hungary - - - - - - - - 12 21Italy - - - - - - 225 202 232 201Latvia - - - - - - - - 2 2Lithuania - - - - - - - 1 1 1Malta 1 1 1 1 1 1 1 1 4 5Norway - - - 55 55 60 65 96 112 186Portugal 76 90 113 94 96 101 98 117 182 193Romania - - - - - - 66 - - -DEVELOPING ECONOMIES 1,798 2,634 3,160 3,044 1,542 320 218 3,052 2,111 1,991Barbados - - - - - - - - - 0Colombia 0 0 2 1 1 1 1 1 1 3Congo - - - - - - - 3 4 -Guatemala - - - - - - 5 0 0 0Haiti - - - - - - - - - 17Jamaica - - - - - - 2 2 - -Lebanon - - - - - - - - - 0Madagascar - - - - - - - 0 - -Malaysia - - - - - - - 2,922 1,899 1,855Mali - - - - - - - - 12 13Mozambique - - - - - - 0 0 0 1Pakistan - - - - - - - - - -Papua New Guinea - - - - - - - - 0 0Philippines - - - - - 21 - 1 4 -Syrian Arab Republic - - - - - - - - 1 1Tunisia - - - - - 10 5 4 6 6Turkey 1,798 2,634 3,158 3,043 1,541 288 205 117 176 88United Republic of Tanzania - - - - - 0 - 1 0 0Uruguay - - - - - - - - 7 7ECONOMIES IN TRANSITION 0 0 2 3 3 6 4 7 9 51Albania - - - - - - - 2 6 37Belarus - - - - - 4 4 5 3 4Georgia - - - - - - - - - -Kazakhstan - - - - - - 0 0 0 1Kyrgyzstan - - 2 3 3 2 0 0 0 10
Economic group and country/territory
SOURCE: UNCTAD calculations based on IMF balance of payments statistics on CD-ROM.
312
Sta
tist
ical
Annex
Part
2
C R E AT I V E E C O N O M Y R E P O R T 2 0 0 8

TA B L E
2.8.A
313
Sta
tistical
Annex
Part
2
C R E AT I V E E C O N O M Y R E P O R T 2 0 0 8
CATEGORIES OF SERVICES THAT INCLUDE CREATIVE INDUSTRIES: EXPORTS OF ROYALTIES AND LICENCE FEES, BY ECONOMIC GROUP AND COUNTRY/TERRITORY, 1996-2005
TOTAL - REPORTING ECONOMIES 58,215 60,254 64,244 71,292 78,583 76,217 83,239 93,664 112,369 123,842
DEVELOPED ECONOMIES 57,068 58,954 62,908 68,842 76,678 73,956 80,949 90,614 107,879 119,714Australia 265 325 275 343 358 298 304 401 478 508Austria 182 185 99 120 162 138 111 158 169 177Belgium - - - - - - 649 882 1,021 1,107Canada 877 1,164 1,401 1,544 2,259 2,412 2,496 2,838 3,270 3,471Cyprus 6 10 12 13 16 26 43 15 18 15Czech Republic 43 34 57 43 44 36 45 50 57 63Estonia 1 1 1 2 2 2 5 5 4 5Faeroe Islands - - 0 0 0 0 0 0 - -Finland 66 93 106 648 886 584 560 501 839 1,207France 1,884 2,046 2,338 1,923 2,310 2,602 3,339 4,066 5,268 5,924Germany 3,365 3,222 3,345 3,108 2,910 3,325 3,871 4,492 5,229 6,828Greece - - - 13 5 14 13 18 32 60Hungary 45 100 46 62 112 96 349 313 540 834Iceland 0 0 0 - 0 - 0 - 2 -Ireland 101 117 249 583 638 185 282 211 352 589Israel 158 177 216 254 496 425 404 425 535 610Italy 381 490 477 563 563 443 539 525 770 1,131Japan 6,681 7,303 7,388 8,190 10,227 10,462 10,422 12,271 15,701 17,655Latvia 0 0 2 10 2 3 3 4 8 10Lithuania - 1 0 0 0 0 0 1 1 2Luxembourg 61 75 100 122 134 202 115 128 193 287Malta 1 0 1 - 2 0 1 1 3 3Netherlands 2,427 2,199 2,515 2,435 2,171 1,740 1,963 2,930 4,205 3,866New Zealand - - 50 - 49 58 79 108 112 101Norway 118 103 89 149 161 159 171 195 242 524Poland 24 27 22 25 34 48 34 28 30 61Portugal 20 27 43 25 29 25 29 36 41 60Slovakia 18 17 14 15 16 - 38 50 - -Slovenia 6 5 9 8 12 14 8 11 12 16Spain 214 212 242 343 421 365 370 528 500 561Sweden 997 1,003 1,114 1,386 1,275 1,427 1,516 2,336 3,459 3,324United Kingdom 6,655 6,790 7,071 8,244 8,151 8,167 8,681 10,100 12,276 13,303United States 32,470 33,228 35,626 39,670 43,233 40,696 44,508 46,988 52,512 57,410DEVELOPING ECONOMIES 883 1,101 1,259 1,315 1,731 2,064 2,036 2,802 4,134 3,699Angola 17 6 9 3 16 4 - - 227 49Anguilla 0 - 0 - - - - - - -Argentina 16 18 26 25 37 47 33 52 61 54Bangladesh - 0 - 0 0 0 0 0 0 0Barbados - - 0 0 0 0 1 1 2 2Benin - - - - - 0 0 0 - -Bolivia - - - 2 2 2 2 2 2 2Botswana - 0 0 0 - 0 0 3 5 0Brazil 78 97 142 133 125 112 100 108 114 102Cambodia - - - - - - - 0 0 0Cameroon 0 0 0 2 2 0 0 0 - -Cape Verde 0 0 0 0 0 0 1 0 - -Chile 10 10 5 6 10 25 41 45 48 54China - 55 63 75 80 110 133 107 236 157China, SAR of Hong Kong - - 155 78 107 196 229 341 218 -Colombia 1 1 4 6 5 3 4 6 7 10Costa Rica 2 0 0 1 0 1 2 0 1 -Côte d’Ivoire 0 0 0 0 0 13 - - 0 -Dominica - - 0 0 0 - - - - -Egypt 55 54 56 47 59 46 38 121 100 136El Salvador - - - 1 2 1 2 0 0 2Eritrea - - 0 0 0 - - - - -Ethiopia - - - - - - - - 0 0Guatemala - - - - - - - - 0 -Guinea - - - - - 0 0 0 - -Guyana 14 17 17 16 15 23 34 32 34 35India 7 12 19 23 83 37 20 25 - -Indonesia - - - - - - - - 221 263Jamaica 4 7 7 6 6 6 6 12 10 13Kenya 5 4 2 1 7 5 10 12 17 18Korea, Republic of 185 252 260 455 688 924 835 1,311 1,861 1,827Lesotho - 44 20 13 12 11 11 15 17 18Libyan Arab Jamahiriya - - - - 4 2 10 - - -Madagascar 1 1 1 1 1 1 0 1 0 1Malaysia - - - 15 18 21 12 20 41 27Maldives 1 3 3 2 4 4 4 6 7 3Mali - - - - - 0 0 - 0 -Mauritius - - - - 0 - - - 0 0Mexico 122 130 138 42 43 41 48 84 92 70Mongolia - - - 1 - - - - - -Morocco 5 4 7 6 22 15 11 26 16 13
1996 1997 1998 1999 2000 2001 2002 2003 2004 2005Economic group and country/territory
EXPORTS (in millions of $)

TA B L E
2.8.A
1996 1997 1998 1999 2000 2001 2002 2003 2004 2005
EXPORTS (in millions of $)
Mozambique - - - - - - 0 15 1 2Myanmar - - - 2 0 0 - - - -Namibia 7 7 6 6 5 5 4 - - -Netherlands Antilles 4 4 5 6 6 3 2 1 0 0Niger - - - - - 0 - - - -Occupied Palestinian Territory - - - - 0 - - 0 0 -Pakistan 18 2 1 6 - 2 6 8 10 15Paraguay 157 182 183 192 203 180 187 193 208 196Peru 0 7 1 1 3 2 2 2 2 2Philippines 5 18 - 6 7 1 1 4 12 6Rwanda 0 0 1 - - - - - - -Saint Kitts and Nevis, and Anguilla - - - - - - - 0 - -Saint Vincent and the Grenadines 0 - - - - - - - - -Senegal 0 - 0 2 0 0 0 - - -Singapore 74 64 58 61 85 176 204 196 494 544Solomon Islands - - 0 0 - - - - - -South Africa 67 52 49 44 49 21 19 27 37 45Sudan - 0 0 - - - - - - -Swaziland 0 0 0 0 0 0 0 0 0 0Thailand 25 44 7 19 9 9 7 7 14 17Tunisia 1 1 11 10 15 15 16 18 18 14United Republic of Tanzania - 3 1 1 0 0 - - - -Uruguay - - - - 0 - - - 0 0ECONOMIES IN TRANSITION 264 198 77 134 174 197 254 248 356 429Albania - - - - - - - 5 15 1Azerbaijan - - - - - - - - - 0Belarus - 2 1 1 1 1 1 1 2 3Bulgaria - - - - 4 3 4 5 7 5Croatia 3 19 42 82 66 106 85 35 41 73Georgia - - - - - - 6 6 8 9Kazakhstan - - - - - - - 0 0 0Kyrgyzstan - - 3 3 5 1 1 1 1 2Macedonia, TFYR 1 2 1 2 3 3 3 2 3 3Moldova, Republic of 1 - 0 0 1 1 1 1 2 2Romania 101 - 3 4 3 16 3 3 8 48Russian Federation 159 176 27 43 91 60 147 174 227 260Tajikistan - - - - - - 0 1 1 1Ukraine - - - - 1 5 4 14 40 22
Economic group and country/territory
SOURCE: UNCTAD calculations based on IMF balance of payments statistics on CD-ROM.
314
Sta
tist
ical
Annex
Part
2
C R E AT I V E E C O N O M Y R E P O R T 2 0 0 8
CONTINUED

TA B L E
2.8.B
315
Sta
tistical
Annex
Part
2
C R E AT I V E E C O N O M Y R E P O R T 2 0 0 8
CATEGORIES OF SERVICES THAT INCLUDE CREATIVE INDUSTRIES: IMPORTS OF ROYALTIES AND LICENCE FEES, BY ECONOMIC GROUP AND COUNTRY/TERRITORY, 1996-2005
TOTAL - REPORTING ECONOMIES 56,165 59,482 67,119 74,299 82,159 83,178 91,917 106,926 127,741 134,548
DEVELOPED ECONOMIES 47,935 49,709 57,039 60,206 65,134 65,887 73,140 83,888 99,185 104,114Australia 1,069 1,100 1,010 1,132 1,017 869 1,014 1,267 1,450 1,645Austria 696 691 817 625 566 756 1,056 1,118 1,249 1,334Belgium - - - - - - 741 984 1,036 1,107Canada 1,951 2,327 2,708 3,339 3,768 3,777 4,487 5,632 6,411 6,649Cyprus 17 15 18 21 21 20 15 39 53 45Czech Republic 98 78 113 137 82 93 119 176 172 216Estonia 3 5 7 6 8 11 14 14 18 25Faeroe Islands - - 3 3 3 3 3 3 - -Finland 465 504 411 375 565 534 605 616 800 1,123France 2,653 2,477 2,717 2,277 2,043 1,890 1,886 2,427 3,169 3,230Germany 5,884 5,734 5,649 5,140 5,673 5,506 5,310 5,318 5,817 6,589Greece 57 58 - 205 203 225 287 335 466 442Hungary 132 192 215 307 259 269 417 464 1,054 1,068Iceland 1 1 1 1 1 1 1 2 2 4Ireland 3,418 4,090 7,935 7,244 8,329 9,468 11,001 16,077 18,847 19,426Israel 184 196 213 263 354 453 455 434 491 537Italy 1,027 1,004 1,155 1,382 1,198 1,312 1,272 1,698 1,751 1,942Japan 9,829 9,620 8,947 9,855 11,007 11,099 11,021 11,003 13,644 14,654Latvia 1 1 7 10 12 7 7 10 14 14Lithuania 4 5 6 14 12 10 11 18 18 21Luxembourg 61 100 99 107 122 243 99 110 148 130Malta 11 13 12 14 10 10 12 14 18 18Netherlands 2,945 2,655 3,061 3,462 2,505 2,321 2,612 3,360 3,339 3,692New Zealand - - 293 - 313 317 362 452 531 555Norway 290 364 348 342 439 329 329 394 485 465Poland 144 175 195 491 555 508 557 745 883 1,036Portugal 274 288 304 303 276 250 315 306 355 328Slovakia 83 85 55 54 58 - 63 91 - -Slovenia 27 33 39 47 49 60 78 90 123 113Spain 1,447 1,644 1,878 1,864 1,681 1,678 1,814 2,520 3,037 2,639Sweden 1,006 957 939 1,147 900 860 892 1,277 1,420 1,498United Kingdom 6,320 6,137 6,652 6,933 6,637 6,470 6,930 7,861 9,174 9,069United States 7,837 9,161 11,235 13,107 16,468 16,538 19,353 19,033 23,211 24,501DEVELOPING ECONOMIES 8,137 9,698 10,002 13,990 16,146 16,600 18,096 21,746 26,850 27,901Angola - 0 1 2 6 0 - - 2 3Anguilla 0 0 0 - - - 0 0 0 0Antigua and Barbuda 0 - 0 0 0 0 1 1 1 1Argentina 482 544 590 582 580 564 351 399 518 635Aruba - - - 0 0 1 3 4 5 7Bahamas 6 10 9 12 14 13 14 15 19 16Bangladesh 5 8 5 6 4 6 3 4 5 3Barbados 18 21 22 23 24 24 25 25 20 29Belize 0 1 0 2 3 2 0 0 0 0Benin 0 0 2 1 0 1 1 2 2 -Bolivia 4 5 5 5 5 5 6 8 10 11Botswana - 3 9 6 6 9 8 12 11 12Brazil 797 887 1,075 1,283 1,415 1,244 1,229 1,228 1,197 1,404Burkina Faso - - - - 0 0 - - - -Burundi 0 - - - - - - - - -Cambodia - - 5 7 4 5 5 6 6 7Cameroon 1 3 0 3 5 2 1 2 - -Cape Verde 0 0 0 0 - 0 0 0 0 0Chile 117 140 223 324 297 269 251 257 283 322China - 543 420 792 1,281 1,938 3,114 3,548 4,497 5,321China, SAR of Hong Kong - - 537 281 461 491 696 864 1,111 -Colombia 61 60 62 69 73 73 86 76 82 118Costa Rica 24 27 32 31 50 49 51 64 51 57Côte d’Ivoire 16 16 26 15 9 23 6 11 22 -Dominica 0 0 0 0 0 0 0 0 0 0Dominican Republic 29 16 25 30 30 22 30 30 30 31Ecuador 68 64 68 70 62 52 44 43 43 42Egypt 40 365 392 329 401 361 171 165 108 182El Salvador 0 - - 20 21 22 20 22 18 30Eritrea - - 0 0 0 - - - - -Ethiopia 0 - - 0 0 0 0 0 0 1Grenada 1 1 1 1 1 1 0 1 1 1Guatemala - - - - - - - - 0 -Guinea - - 0 0 - 1 1 1 0 -Guyana 10 1 12 14 11 5 22 18 19 19Honduras 4 5 9 10 10 11 11 17 18 22India, including Sikkim 118 150 201 315 282 317 345 421 - -Indonesia - - - - - - - - 990 961Jamaica 28 28 30 41 41 38 32 11 9 11Kenya - 39 40 44 77 62 42 39 50 37Lebanon - - - - - - - - 0 -
1996 1997 1998 1999 2000 2001 2002 2003 2004 2005Economic group and country/territory
IMPORTS (in millions of $)

TA B L E
2.8.B
1996 1997 1998 1999 2000 2001 2002 2003 2004 2005
IMPORTS (in millions of $)
Lesotho 0 1 1 - - 0 - - - -Madagascar 3 11 10 10 11 8 13 4 8 3Malawi 0 1 1 0 0 0 0 - - -Malaysia - - - 481 546 751 628 782 911 1,370Mali 2 2 1 1 1 1 1 1 1 -Mauritius - - - - 1 1 2 2 4 5Mexico 360 501 454 554 407 419 720 608 805 111Montserrat - - 0 0 0 0 0 0 0 0Morocco 133 123 172 201 19 35 41 29 37 45Mozambique - - - - 0 0 0 1 3 5Namibia 3 3 3 3 8 0 2 4 3 -Netherlands Antilles 5 5 7 6 4 5 7 5 5 6Niger - - 0 0 0 0 1 0 0 -Occupied Palestinian Territory - - 0 - 0 0 2 0 2 -Pakistan 14 19 11 22 28 19 18 36 86 110Panama 17 16 26 30 42 36 47 42 46 42Paraguay 1 2 2 3 9 7 5 5 2 1Peru 79 54 63 61 62 61 65 66 68 69Philippines 82 158 70 110 197 159 236 278 273 265Republic of Korea 2,431 2,414 2,369 2,661 3,221 3,053 3,002 3,570 4,446 4,398Rwanda 1 1 1 1 1 0 0 - - -Saint Kitts and Nevis, and Anguilla 0 0 0 1 1 1 1 1 2 2Saint Lucia 1 1 2 2 2 1 2 2 2 2Saint Vincent and the Grenadines 0 0 0 1 1 1 0 0 0 0Samoa 0 0 0 0 - - - - 0 0Senegal 0 2 4 5 5 3 3 1 7 -Seychelles 1 1 0 0 0 0 1 1 1 1Singapore 1,997 1,908 1,867 4,295 5,044 4,829 4,793 6,635 7,851 8,647Solomon Islands 0 0 0 0 - - - - - -South Africa 309 258 228 213 246 330 447 617 891 1,071Sudan - 0 0 - 0 - - - - -Swaziland 15 39 39 40 35 43 54 114 76 88Syrian Arab Republic - - - - - - - 10 10 12Thailand 717 804 514 583 710 823 1,104 1,268 1,584 1,674Togo 1 1 0 1 1 1 0 1 2 -Trinidad and Tobago 0 1 0 - - - - - - -Tunisia 3 4 3 3 3 6 6 6 8 8Turkey 124 275 242 186 173 119 107 167 362 439United Republic of Tanzania - 0 5 4 4 4 0 1 1 0Uruguay 6 7 9 9 7 10 7 14 4 4Venezuela (Bolivarian Republic of) 2 146 94 186 184 260 211 183 219 239Zambia - 0 0 0 0 - - - - -ECONOMIES IN TRANSITION 94 75 78 103 879 691 681 1,293 1,706 2,533Albania - - - - - - - 8 5 4Azerbaijan - - - - - - 2 0 - 0Belarus - 2 1 1 3 4 3 6 9 20Bulgaria - - - - 10 11 23 24 31 79Croatia 33 31 47 50 61 62 77 131 146 193Georgia - - - - - - 11 11 6 5Kazakhstan - - - - 12 14 20 20 26 31Kyrgyzstan - - 4 3 9 7 0 0 2 2Macedonia, TFYR 3 2 2 3 6 6 10 7 9 10Moldova, Republic of 2 0 0 0 2 1 1 3 3 2Romania 12 29 21 38 45 60 85 80 108 173Russian Federation 44 11 3 8 69 343 338 711 1,094 1,593Tajikistan - - - - - - 1 0 0 0Ukraine - - - - 663 183 110 292 268 421
Economic group and country/territory
SOURCE: UNCTAD calculations based on IMF balance of payments statistics on CD-ROM.
316
Sta
tist
ical
Annex
Part
2
C R E AT I V E E C O N O M Y R E P O R T 2 0 0 8
CONTINUED

317
Sta
tistical
Annex
Part
2
C R E AT I V E E C O N O M Y R E P O R T 2 0 0 8
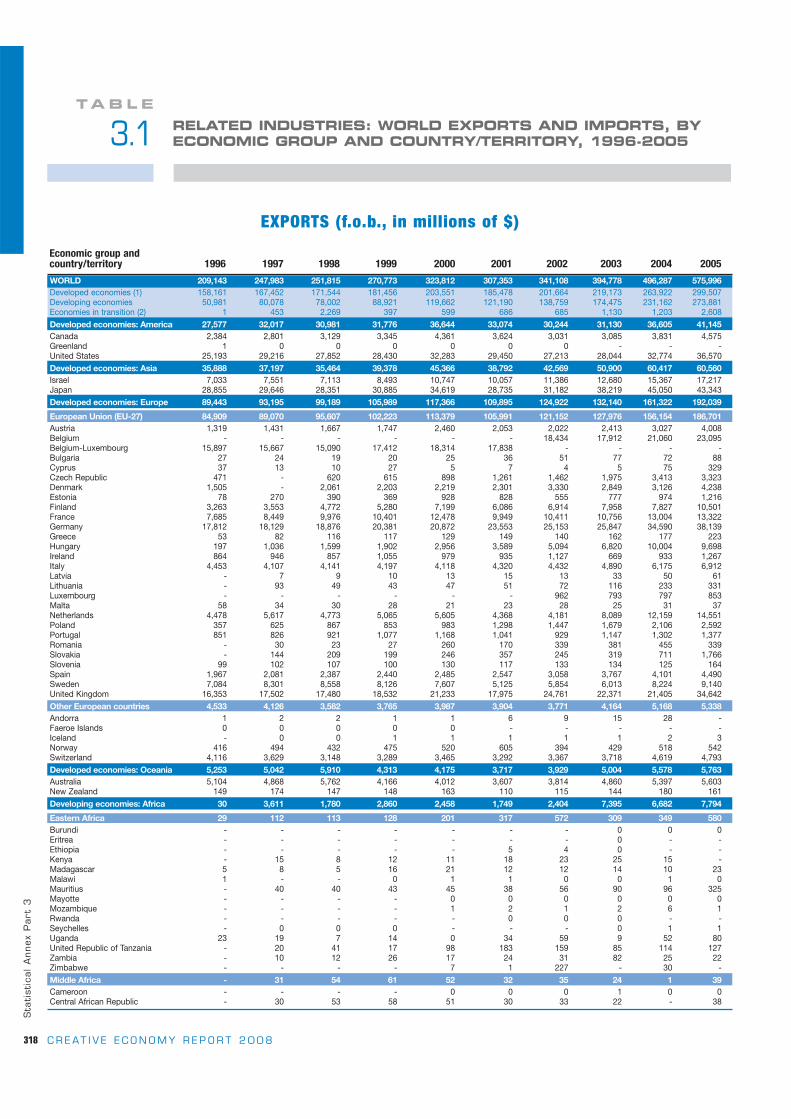
WORLD 209,143 247,983 251,815 270,773 323,812 307,353 341,108 394,778 496,287 575,996Developed economies (1) 158,161 167,452 171,544 181,456 203,551 185,478 201,664 219,173 263,922 299,507Developing economies 50,981 80,078 78,002 88,921 119,662 121,190 138,759 174,475 231,162 273,881Economies in transition (2) 1 453 2,269 397 599 686 685 1,130 1,203 2,608Developed economies: America 27,577 32,017 30,981 31,776 36,644 33,074 30,244 31,130 36,605 41,145Canada 2,384 2,801 3,129 3,345 4,361 3,624 3,031 3,085 3,831 4,575Greenland 1 0 0 0 0 0 0 - - -United States 25,193 29,216 27,852 28,430 32,283 29,450 27,213 28,044 32,774 36,570Developed economies: Asia 35,888 37,197 35,464 39,378 45,366 38,792 42,569 50,900 60,417 60,560Israel 7,033 7,551 7,113 8,493 10,747 10,057 11,386 12,680 15,367 17,217Japan 28,855 29,646 28,351 30,885 34,619 28,735 31,182 38,219 45,050 43,343Developed economies: Europe 89,443 93,195 99,189 105,989 117,366 109,895 124,922 132,140 161,322 192,039
European Union (EU-27) 84,909 89,070 95,607 102,223 113,379 105,991 121,152 127,976 156,154 186,701Austria 1,319 1,431 1,667 1,747 2,460 2,053 2,022 2,413 3,027 4,008Belgium - - - - - - 18,434 17,912 21,060 23,095Belgium-Luxembourg 15,897 15,667 15,090 17,412 18,314 17,838 - - - -Bulgaria 27 24 19 20 25 36 51 77 72 88Cyprus 37 13 10 27 5 7 4 5 75 329Czech Republic 471 - 620 615 898 1,261 1,462 1,975 3,413 3,323Denmark 1,505 - 2,061 2,203 2,219 2,301 3,330 2,849 3,126 4,238Estonia 78 270 390 369 928 828 555 777 974 1,216Finland 3,263 3,553 4,772 5,280 7,199 6,086 6,914 7,958 7,827 10,501France 7,685 8,449 9,976 10,401 12,478 9,949 10,411 10,756 13,004 13,322Germany 17,812 18,129 18,876 20,381 20,872 23,553 25,153 25,847 34,590 38,139Greece 53 82 116 117 129 149 140 162 177 223Hungary 197 1,036 1,599 1,902 2,956 3,589 5,094 6,820 10,004 9,698Ireland 864 946 857 1,055 979 935 1,127 669 933 1,267Italy 4,453 4,107 4,141 4,197 4,118 4,320 4,432 4,890 6,175 6,912Latvia - 7 9 10 13 15 13 33 50 61Lithuania - 93 49 43 47 51 72 116 233 331Luxembourg - - - - - - 962 793 797 853Malta 58 34 30 28 21 23 28 25 31 37Netherlands 4,478 5,617 4,773 5,065 5,605 4,368 4,181 8,089 12,159 14,551Poland 357 625 867 853 983 1,298 1,447 1,679 2,106 2,592Portugal 851 826 921 1,077 1,168 1,041 929 1,147 1,302 1,377Romania - 30 23 27 260 170 339 381 455 339Slovakia - 144 209 199 246 357 245 319 711 1,766Slovenia 99 102 107 100 130 117 133 134 125 164Spain 1,967 2,081 2,387 2,440 2,485 2,547 3,058 3,767 4,101 4,490Sweden 7,084 8,301 8,558 8,126 7,607 5,125 5,854 6,013 8,224 9,140United Kingdom 16,353 17,502 17,480 18,532 21,233 17,975 24,761 22,371 21,405 34,642Other European countries 4,533 4,126 3,582 3,765 3,987 3,904 3,771 4,164 5,168 5,338Andorra 1 2 2 1 1 6 9 15 28 -Faeroe Islands 0 0 0 0 0 - - - - -Iceland - 0 0 1 1 1 1 1 2 3Norway 416 494 432 475 520 605 394 429 518 542Switzerland 4,116 3,629 3,148 3,289 3,465 3,292 3,367 3,718 4,619 4,793Developed economies: Oceania 5,253 5,042 5,910 4,313 4,175 3,717 3,929 5,004 5,578 5,763Australia 5,104 4,868 5,762 4,166 4,012 3,607 3,814 4,860 5,397 5,603New Zealand 149 174 147 148 163 110 115 144 180 161Developing economies: Africa 30 3,611 1,780 2,860 2,458 1,749 2,404 7,395 6,682 7,794
Eastern Africa 29 112 113 128 201 317 572 309 349 580Burundi - - - - - - - 0 0 0Eritrea - - - - - - - 0 - -Ethiopia - - - - - 5 4 0 - -Kenya - 15 8 12 11 18 23 25 15 -Madagascar 5 8 5 16 21 12 12 14 10 23Malawi 1 - - 0 1 1 0 0 1 0Mauritius - 40 40 43 45 38 56 90 96 325Mayotte - - - - 0 0 0 0 0 0Mozambique - - - - 1 2 1 2 6 1Rwanda - - - - - 0 0 0 - -Seychelles - 0 0 0 - - - 0 1 1Uganda 23 19 7 14 0 34 59 9 52 80United Republic of Tanzania - 20 41 17 98 183 159 85 114 127Zambia - 10 12 26 17 24 31 82 25 22Zimbabwe - - - - 7 1 227 - 30 -Middle Africa - 31 54 61 52 32 35 24 1 39Cameroon - - - - 0 0 0 1 0 0Central African Republic - 30 53 58 51 30 33 22 - 38
1996 1997 1998 1999 2000 2001 2002 2003 2004 2005Economic group and country/territory
EXPORTS (f.o.b., in millions of $)
318
Sta
tist
ical
Annex
Part
3
C R E AT I V E E C O N O M Y R E P O R T 2 0 0 8
TA B L E
3.1 RELATED INDUSTRIES: WORLD EXPORTS AND IMPORTS, BYECONOMIC GROUP AND COUNTRY/TERRITORY, 1996-2005

319
Sta
tistical
Annex
Part
3
C R E AT I V E E C O N O M Y R E P O R T 2 0 0 8
1996 1997 1998 1999 2000 2001 2002 2003 2004 2005Economic group and
country/territory
206,946 236,942 243,118 271,350 325,269 303,111 333,595 382,150 488,917 562,546 WORLD163,498 167,201 180,180 200,835 231,837 212,398 232,257 257,992 326,898 367,778 Developed economies (1)43,413 68,152 61,715 69,441 91,856 88,401 98,286 120,716 157,042 186,809 Developing economies
34 1,589 1,223 1,074 1,576 2,313 3,052 3,443 4,978 7,959 Economies in transition (2)49,951 54,648 61,291 69,474 86,163 81,113 86,322 91,678 110,825 124,549 Developed economies: America
5,198 6,275 6,585 7,022 8,307 7,515 7,780 8,456 9,947 11,149 Canada12 9 10 8 6 7 8 - - - Greenland
44,740 48,364 54,696 62,444 77,851 73,591 78,533 83,223 100,879 113,400 United States 19,715 17,754 14,763 17,833 21,085 19,758 20,667 22,846 28,373 30,748 Developed economies: Asia
6,305 6,208 5,452 7,234 8,303 6,922 8,482 8,853 10,681 11,144 Israel13,410 11,546 9,311 10,599 12,783 12,836 12,185 13,993 17,692 19,604 Japan89,336 90,389 98,739 108,264 118,871 106,913 120,284 136,855 179,175 203,285 Developed economies: Europe
83,103 83,979 92,049 101,892 111,670 100,198 114,224 130,034 170,494 194,234 European Union (EU-27)1,993 2,091 2,400 2,598 2,561 2,292 2,493 3,106 3,775 4,623 Austria
- - - - - - 17,668 16,561 19,912 22,639 Belgium14,235 14,461 13,640 16,032 17,269 14,828 - - - - Belgium-Luxembourg
81 103 91 155 146 225 232 310 389 525 Bulgaria135 118 122 119 117 133 131 157 254 525 Cyprus906 137 849 923 1,288 1,216 1,287 1,819 2,604 2,814 Czech Republic
1,829 255 2,034 2,067 2,207 2,091 3,089 2,793 3,440 4,830 Denmark160 199 264 232 377 552 308 548 462 570 Estonia
1,121 1,104 1,331 1,440 2,315 1,999 1,869 2,272 2,849 4,316 Finland8,991 9,468 10,444 10,773 11,718 11,214 11,412 13,331 16,569 18,780 France
14,386 12,991 14,275 15,472 16,375 18,220 19,681 21,605 29,413 33,796 Germany1,072 937 1,290 1,222 1,052 967 1,227 1,425 1,764 1,835 Greece
527 787 1,197 1,523 1,785 1,628 2,137 2,996 4,378 4,222 Hungary1,088 1,081 911 1,015 1,254 1,374 1,528 1,332 1,719 2,171 Ireland6,216 6,781 7,660 8,083 8,387 7,964 8,609 10,388 14,496 14,639 Italy
- 76 92 100 93 118 131 178 236 287 Latvia- 188 179 123 140 194 259 312 427 558 Lithuania- - - - - - 735 717 829 879 Luxembourg
84 75 68 78 82 67 80 87 98 97 Malta5,181 5,447 5,280 6,194 7,114 7,221 6,733 8,641 14,024 15,593 Netherlands1,110 1,518 1,937 1,991 2,173 1,948 1,959 2,301 3,002 4,086 Poland1,012 1,161 1,244 1,533 1,599 1,463 1,442 1,695 1,956 2,079 Portugal
- 321 394 290 344 419 472 693 1,013 1,288 Romania- 326 367 286 294 369 419 561 796 1,219 Slovakia
187 217 255 310 276 237 260 298 414 405 Slovenia4,062 4,018 4,915 5,988 5,980 5,510 5,966 7,756 10,118 11,287 Spain3,031 3,225 3,686 3,364 3,632 3,262 3,508 4,286 5,579 6,018 Sweden
15,696 16,894 17,125 19,981 23,097 14,688 20,589 23,865 29,979 34,155 United Kingdom 6,233 6,410 6,689 6,372 7,201 6,715 6,060 6,821 8,681 9,051 Other European countries
67 67 81 86 82 101 124 162 198 - Andorra7 7 8 9 11 13 14 14 14 14 Faeroe Islands- 76 102 93 107 76 72 102 143 167 Iceland
1,092 1,094 1,283 1,203 1,256 1,192 1,261 1,563 2,097 2,200 Norway5,066 5,165 5,215 4,981 5,744 5,333 4,589 4,980 6,230 6,670 Switzerland4,496 4,410 5,387 5,264 5,718 4,614 4,984 6,612 8,524 9,196 Developed economies: Oceania3,789 3,728 4,862 4,551 4,851 3,908 4,297 5,732 7,409 7,991 Australia
708 682 525 713 867 706 688 880 1,115 1,205 New Zealand202 2,281 2,688 2,568 3,242 2,852 3,949 5,167 6,225 6,478 Developing economies: Africa
37 214 293 266 273 406 466 551 629 755 Eastern Africa- - - - - - - 1 4 6 Burundi- - - - - - - 8 - - Eritrea- - - - - 39 42 100 - - Ethiopia- 68 106 66 55 87 81 81 98 - Kenya
15 12 11 10 12 16 10 31 50 30 Madagascar- - - 10 20 9 10 15 18 14 Malawi- 79 75 110 86 73 86 134 167 396 Mauritius- - - - 3 6 5 7 9 10 Mayotte- - - - 23 10 26 27 77 38 Mozambique- - - - - 7 7 11 - - Rwanda- 5 10 4 - 1 2 6 12 8 Seychelles
22 18 29 21 29 58 43 50 68 85 Uganda- 18 29 24 22 38 30 36 54 111 United Republic of Tanzania- 15 33 21 24 30 24 44 29 55 Zambia- - - - - 32 101 - 45 - Zimbabwe- 19 23 21 52 49 48 69 79 87 Middle Africa- - - - 27 30 34 41 56 55 Cameroon- 1 1 2 1 1 1 6 - 3 Central African Republic
IMPORTS (c.i.f., in millions of $)
TA B L E
3.1

Gabon - 1 1 3 1 2 2 1 1 1Sao Tome and Principe - - - 0 - - 0 - - -Northern Africa 1 0 0 0 33 33 90 84 96 96Algeria 1 0 0 0 0 0 0 0 2 -Morocco - - - - - - 27 29 32 30Sudan - - - 0 0 - 23 - - -Tunisia - - - - 33 33 40 54 62 66Southern Africa - 3,466 1,428 2,497 1,994 1,203 1,704 6,971 6,182 6,165Botswana - - - - 20 5 12 2,957 - -Namibia - - - - 516 467 425 190 718 755South Africa - 3,466 1,428 2,497 1,456 728 1,263 3,823 5,464 5,410Swaziland - - - - 3 3 3 - - -Western Africa 1 1 184 174 179 163 4 7 54 913Benin - - 0 0 0 0 0 0 0 0Burkina Faso - - - - - 2 2 3 3 -Cape Verde - 0 0 0 0 - - - - 0Côte d’Ivoire - - - - - 1 - - 46 40Gambia 0 0 0 0 0 0 0 0 0 0Ghana - - - - - - - 2 0 867Guinea - - 5 0 0 0 0 - - -Mali - - 176 158 175 159 0 1 1 -Mauritania - - - - - - - - - -Niger - - 0 0 0 0 0 0 0 0Nigeria - - - 13 0 0 0 0 - -Senegal 1 1 1 1 2 1 1 2 3 5Togo - - 1 0 0 0 0 0 0 0Developing economies: America 8,612 11,511 13,231 15,749 19,996 19,984 18,653 16,943 21,029 26,622
Caribbean 0 1 17 15 21 28 21 53 56 42Anguilla - - - - - - 0 0 2 -Antigua and Barbuda - - - 2 7 - - - - 5Aruba - - - - - - 3 2 2 2Bahamas - 0 2 5 4 3 - - - -Barbados - - - - 2 3 1 3 3 15Cuba - - - 0 0 1 0 30 33 -Dominica - - - 0 0 0 0 0 0 0Dominican Republic - - - - - 1 - - - -Grenada - - - - 0 0 1 1 1 -Haiti 0 0 - - - - - - - -Jamaica - - 0 1 1 0 1 1 2 1Montserrat - - - 0 - 0 0 0 0 0Netherlands Antilles - - 15 - - - - - - -Saint Kitts and Nevis - - - 0 0 1 1 0 0 1Saint Lucia - - - - 0 0 3 7 4 3Saint Vincent and the Grenadines - - 0 0 0 0 0 0 0 1Trinidad and Tobago - - - 6 5 17 9 8 6 14Turks and Caicos Islands - - - 0 1 0 0 1 2 -Central America 8,327 9,653 11,452 13,845 17,139 17,093 16,020 14,390 18,534 22,476Belize - - 0 0 1 - 0 0 0 0Costa Rica - 24 14 17 13 24 24 40 180 212El Salvador - - 9 9 12 8 9 9 12 -Guatemala - 4 6 8 8 10 11 12 14 23Honduras - 2 2 2 0 0 0 2 6 9Mexico 8,327 9,603 11,420 13,808 17,105 17,047 15,972 14,324 18,319 22,230Nicaragua - 19 0 0 1 0 2 1 2 0Panama - - 1 1 1 3 2 1 1 2South America 285 1,858 1,763 1,890 2,836 2,862 2,613 2,500 2,439 4,104Argentina 66 79 68 65 78 72 93 76 85 85Bolivia - 1 1 2 3 2 4 2 3 3Brazil - 1,594 1,463 1,553 2,451 2,560 2,312 2,218 2,076 3,742Chile - 16 15 16 20 24 22 22 29 30Colombia 204 154 99 124 128 126 143 145 152 161Ecuador 5 - 4 4 4 5 7 5 9 18Guyana - 0 0 109 120 44 3 6 53 6Paraguay - - 2 1 1 0 2 2 1 1Peru - - 98 5 14 11 5 9 14 41Suriname - - - - - - - - - -Uruguay - 3 4 4 5 7 2 3 5 7Venezuela (Bolivarian Republic of) 11 11 8 7 11 10 20 11 13 9
1996 1997 1998 1999 2000 2001 2002 2003 2004 2005Economic group and country/territory
EXPORTS (f.o.b., in millions of $)
320
Sta
tist
ical
Annex
Part
3
C R E AT I V E E C O N O M Y R E P O R T 2 0 0 8
TA B L E
3.1 RELATED INDUSTRIES: WORLD EXPORTS AND IMPORTS, BYECONOMIC GROUP AND COUNTRY/TERRITORY, 1996-2005
CONTINUED

321
Sta
tistical
Annex
Part
3
C R E AT I V E E C O N O M Y R E P O R T 2 0 0 8
1996 1997 1998 1999 2000 2001 2002 2003 2004 2005Economic group and
country/territory
- 17 22 19 25 18 13 21 23 30 Gabon- - - 1 0 0 0 1 - - Sao Tome and Principe
141 153 154 221 460 434 871 1,250 1,815 1,069 Northern Africa141 153 154 205 256 219 323 462 769 - Algeria
- - - - - - 340 417 612 660 Morocco- - - 16 26 26 32 40 51 110 Sudan- - - - 178 190 176 331 383 299 Tunisia- 1,869 2,138 1,869 2,266 1,619 2,179 2,539 3,380 4,109 Southern Africa- - - - 138 80 137 151 - - Botswana- - - - 51 48 30 50 85 74 Namibia- 1,869 2,138 1,869 2,060 1,479 1,993 2,337 3,295 4,035 South Africa- - - - 16 12 18 - - - Swaziland
24 25 81 192 191 343 384 758 322 459 Western Africa- - 9 12 8 6 4 6 9 10 Benin- - - - - 7 7 11 19 - Burkina Faso- 5 6 4 5 5 5 5 8 8 Cape Verde- - - - - 44 - - 92 130 Côte d’Ivoire4 4 3 3 3 2 2 2 4 3 Gambia- - - - - - - 65 113 234 Ghana- - 22 6 5 4 6 - - - Guinea- - 6 8 11 18 9 24 20 - Mali- - - - 4 3 7 4 7 7 Mauritania- - 3 3 4 4 3 7 6 11 Niger- - - 114 129 224 321 605 - - Nigeria
20 17 25 38 21 24 18 24 40 50 Senegal- - 7 4 2 2 2 3 4 5 Togo
5,557 12,563 14,310 14,438 17,225 16,734 14,430 15,212 21,264 27,503 Developing economies: America
- 22 114 266 380 542 525 580 619 404 Caribbean- - - - - - 1 1 2 - Anguilla- - - 13 15 - - - - 12 Antigua and Barbuda- - - - - - 53 52 59 49 Aruba- 22 27 28 30 27 - - - - Bahamas- - - - 42 31 36 62 77 85 Barbados- - - 105 115 129 130 145 171 - Cuba- - - 4 4 4 4 6 7 9 Dominica- - - - - 126 - - - - Dominican Republic- - - - 7 7 7 16 10 - Grenada- - - - - - - - - - Haiti- - 63 61 93 149 185 174 163 113 Jamaica- - - 0 - 0 1 1 1 0 Montserrat- - 21 - - - - - - - Netherlands Antilles- - - 2 4 2 3 4 5 7 Saint Kitts and Nevis- - - - 11 7 21 38 17 16 Saint Lucia- - 3 3 4 4 6 14 8 7 Saint Vincent and the Grenadines- - - 47 51 51 74 66 94 105 Trinidad and Tobago- - - 3 4 4 4 3 6 - Turks and Caicos Islands
3,490 4,839 6,186 7,351 9,467 9,721 9,117 9,202 12,034 14,639 Central America- - 5 1 8 7 8 8 10 14 Belize- 125 158 133 144 142 180 191 223 249 Costa Rica- 14 81 117 114 102 102 152 234 - El Salvador- 107 134 135 206 245 295 287 422 444 Guatemala- 53 62 70 14 14 16 93 134 152 Honduras
3,490 4,474 5,566 6,711 8,808 9,044 8,362 8,296 10,914 13,544 Mexico- 64 30 45 51 49 61 90 97 101 Nicaragua- - 150 140 123 119 92 85 - 137 Panama
2,067 7,701 8,011 6,821 7,378 6,470 4,788 5,430 8,611 12,460 South America1,072 1,713 1,647 1,584 1,881 1,046 189 500 1,488 2,098 Argentina
- 69 30 38 68 62 52 46 58 68 Bolivia- 3,429 2,721 2,412 2,312 2,127 1,594 1,634 2,468 3,280 Brazil- 831 985 888 984 813 780 798 1,093 1,365 Chile
588 785 975 487 605 722 766 934 1,209 1,923 Colombia110 191 244 99 129 308 383 504 645 815 Ecuador
- 11 12 7 10 11 7 6 6 5 Guyana- - 160 121 134 121 99 101 245 352 Paraguay- - 431 367 405 434 423 537 570 679 Peru- - - - - - 16 13 14 20 Suriname- 147 149 150 124 99 41 38 75 159 Uruguay
297 526 657 669 726 727 438 319 739 1,695 Venezuela (Bolivarian Republic of)
IMPORTS (c.i.f., in millions of $)
TA B L E
3.1

Developing economies: Asia 42,181 64,816 62,848 70,155 97,023 99,320 117,559 150,008 203,329 239,332
Eastern Asia 35,298 38,004 38,153 40,579 59,438 63,129 79,163 107,309 149,721 181,267China 8,814 10,229 10,693 12,031 17,897 21,440 28,664 41,141 63,357 88,208China, SAR of Hong Kong 16,554 16,440 15,587 15,610 19,931 19,250 23,230 28,214 35,843 41,250China, SAR of Macao 13 18 9 14 28 17 21 23 25 -China, Taiwan Province of - - - - 6,460 5,906 6,603 9,340 11,428 13,527Mongolia - 4 1 1 1 0 76 119 97 210Republic of Korea 9,918 11,313 11,863 12,922 15,122 16,515 20,570 28,472 38,971 38,072Southern Asia 4,394 4,676 5,153 7,000 6,721 6,653 8,258 9,173 11,267 12,929Bangladesh - - - - - - 1 5 6 -Bhutan - - - 0 - - - - - -India 4,394 4,672 5,151 6,854 6,717 6,481 7,939 8,916 10,975 12,522Iran (Islamic Republic of) - 5 2 2 2 5 6 16 6 8Maldives - - - - - - - - 0 0Nepal - - 0 0 1 - - 0 - -Pakistan - - - - - - - 18 48 84Sri Lanka - - - 145 - 167 312 218 233 315Southeastern Asia 2,115 21,596 18,651 21,762 29,803 28,397 28,378 31,344 39,181 41,722Brunei Darussalam - - - - - - 3 10 - -Cambodia - - - - 7 13 13 12 1 -Indonesia 2,115 1,855 1,499 1,723 3,282 3,420 3,836 3,365 3,445 3,155Malaysia - 9,300 8,116 8,813 11,921 11,552 10,451 10,526 12,388 13,344Philippines - - - - 1,304 1,197 1,227 1,312 1,453 1,298Singapore - 10,441 9,036 8,255 9,480 8,822 8,742 11,498 16,113 18,012Thailand - - - 2,971 3,810 3,392 4,106 4,623 5,782 5,912Western Asia 374 539 891 814 1,061 1,141 1,761 2,182 3,160 3,413Bahrain - - - - - - 6 7 12 7Jordan - - 12 25 27 42 34 52 92 114Kuwait - - - - 9 10 - - - -Lebanon - 8 9 8 7 16 18 27 37 -Oman - - - - 67 48 59 49 40 31Qatar - - - - 4 0 8 9 7 5Saudi Arabia - - - 12 20 24 44 34 44 64Syrian Arab Republic - - - - - - 0 1 0 1Turkey 374 530 870 769 928 1,000 1,590 2,003 2,927 3,190Yemen - - - - - - - - 0 0Developing economies: Oceania 158 140 143 157 185 137 142 129 121 132Cook Islands - - - - 7 - - 2 2 -Fiji - - - - 1 - 1 1 1 2French Polynesia 158 140 143 157 177 117 118 98 116 129Kiribati - - - - - - - - - -New Caledonia - - - - - 1 1 1 2 2Papua New Guinea - - - - - 19 22 28 - -Samoa - - - - - 0 0 0 0 -Tuvalu - - - - - - - - - -Economies in transition: Asia - 47 11 99 282 183 328 668 639 412Armenia - 47 - 97 109 111 257 346 269 302Azerbaijan - - - 1 1 0 1 1 1 0Georgia - - 0 2 1 15 30 21 19 35Kazakhstan - - 10 - 157 47 37 53 63 74Kyrgyzstan - - - - 13 10 3 247 288 1Turkmenistan - - - 0 1 - - - - -Economies in transition: Europe 1 406 2,259 298 317 503 357 462 564 2,196Albania 0 0 3 3 1 2 1 1 3 2Belarus - - 61 61 87 93 77 79 103 105Bosnia and Herzegovina - - - - - - - 2 3 2Croatia - 18 16 15 43 43 48 66 61 67Macedonia, TFYR 1 1 1 1 1 1 1 1 2 3Moldova - - - - 1 2 1 2 4 2Russian Federation - 387 2,178 217 181 189 159 173 235 1,896Serbia and Montenegro - - - - 2 4 6 - 10 12Ukraine - - - - - 169 64 138 145 108
1996 1997 1998 1999 2000 2001 2002 2003 2004 2005Economic group and country/territory
EXPORTS (f.o.b., in millions of $)
322
Sta
tist
ical
Annex
Part
3
C R E AT I V E E C O N O M Y R E P O R T 2 0 0 8
TA B L E
3.1 RELATED INDUSTRIES: WORLD EXPORTS AND IMPORTS, BYECONOMIC GROUP AND COUNTRY/TERRITORY, 1996-2005
CONTINUED

SOURCE: UNCTAD secretariat calculations based on United Nations Comtrade database data.NOTES: (1) Developed economies, including Bulgaria and Romania.
(2) Excluding Bulgaria and Romania, which are included in the European Union (EU-27).
323
Sta
tistical
Annex
Part
3
C R E AT I V E E C O N O M Y R E P O R T 2 0 0 8
1996 1997 1998 1999 2000 2001 2002 2003 2004 2005Economic group and
country/territory
37,630 53,285 44,689 52,411 71,354 68,728 79,793 100,197 129,431 152,699 Developing economies: Asia
31,441 31,648 28,009 29,491 42,975 41,193 48,105 60,173 76,166 89,248 Eastern Asia5,457 5,404 6,948 7,813 9,577 9,641 12,551 18,830 25,005 30,629 China
21,507 22,150 18,275 18,151 23,775 23,378 26,535 30,736 38,061 43,927 China, SAR of Hong Kong61 59 51 87 84 145 173 199 262 - China, SAR of Macao
- - - - 5,015 3,636 3,716 4,468 5,331 6,490 China, Taiwan Province of- 12 17 9 11 9 - 20 13 22 Mongolia
4,416 4,023 2,717 3,430 4,513 4,384 5,131 5,920 7,495 8,180 Republic of Korea3,545 4,693 5,547 7,338 6,688 6,774 9,108 13,666 18,884 24,263 Southern Asia
- - - - - - 160 189 309 - Bangladesh- - - 2 - - - - - - Bhutan
3,545 4,401 5,123 6,625 6,361 6,125 8,185 11,899 16,829 21,089 India- 281 398 267 291 386 470 703 780 1,068 Iran (Islamic Republic of)- 11 11 15 13 11 11 15 20 27 Maldives- - 15 140 23 - - 50 - - Nepal- - - - - - - 465 523 1,607 Pakistan- - - 289 - 252 282 346 424 472 Sri Lanka
1,263 15,276 9,249 12,559 17,579 17,113 18,708 21,167 27,553 31,855 Southeastern Asia- - - - - - 29 42 - - Brunei Darussalam- - - - 57 33 38 40 52 - Cambodia
1,263 1,035 412 249 447 411 612 762 1,339 1,450 Indonesia- 4,074 2,094 2,822 4,195 3,934 4,332 4,114 5,606 5,885 Malaysia- - - - 1,407 1,221 1,166 1,481 1,525 1,423 Philippines- 10,167 6,743 7,490 8,706 8,134 8,522 10,406 13,984 16,181 Singapore- - - 1,998 2,769 3,380 4,010 4,323 5,046 6,915 Thailand
1,381 1,668 1,884 3,022 4,113 3,649 3,871 5,191 6,828 7,333 Western Asia- - - - - - 84 111 98 68 Bahrain- - 59 64 128 192 176 224 336 449 Jordan- - - - 283 260 - - - - Kuwait- 265 255 210 191 300 251 259 338 - Lebanon- - - - 100 111 105 114 166 149 Oman- - - - 55 55 83 89 119 200 Qatar- - - 655 765 874 1,237 1,346 1,803 2,665 Saudi Arabia- - - - - 24 50 73 101 168 Syrian Arab Republic
1,381 1,403 1,571 2,093 2,592 1,833 1,885 2,974 3,828 3,582 Turkey- - - - - - - - 41 52 Yemen
25 23 27 24 35 87 115 140 122 128 Developing economies: Oceania- - - - - - - 4 2 - Cook Islands- - - - - - 21 27 34 47 Fiji
25 23 26 24 35 30 32 36 43 39 French Polynesia- - - - - - - - - 1 Kiribati- - - - - 32 29 38 40 42 New Caledonia- - - - - 24 30 33 - - Papua New Guinea- - - - - 2 3 3 3 - Samoa- 0 0 0 - - - - - - Tuvalu- 51 146 186 408 298 423 611 694 880 Economies in transition: Asia- 51 - 97 128 119 229 357 310 379 Armenia- - - 35 54 26 37 38 55 88 Azerbaijan- - 23 11 27 17 29 26 43 67 Georgia- - 123 - 106 129 120 173 263 315 Kazakhstan- - - - 11 7 9 17 23 30 Kyrgyzstan- - - 43 82 - - - - - Turkmenistan
34 1,538 1,077 888 1,168 2,014 2,629 2,832 4,284 7,079 Economies in transition: Europe 17 9 8 16 16 36 33 26 35 41 Albania
- - 96 90 125 112 146 167 184 196 Belarus- - - - - - - 54 86 113 Bosnia and Herzegovina- 238 171 164 200 279 375 469 505 601 Croatia
18 19 22 31 40 35 43 77 74 80 Macedonia, TFYR- - - - 16 11 16 22 32 51 Moldova- 1,273 779 588 706 1,116 1,436 1,575 2,478 4,653 Russian Federation- - - - 65 98 202 - 343 260 Serbia and Montenegro- - - - - 327 379 442 547 1,085 Ukraine
IMPORTS (c.i.f., in millions of $)
TA B L E
3.1
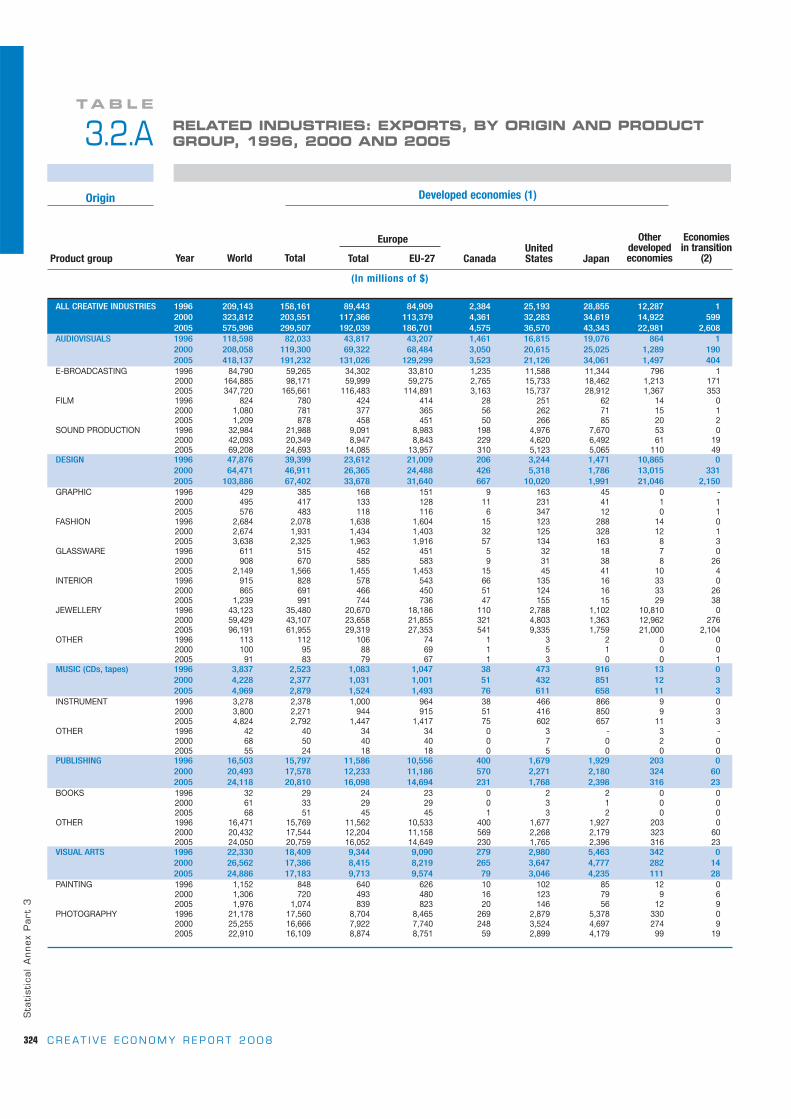
324
Sta
tist
ical
Annex
Part
3
C R E AT I V E E C O N O M Y R E P O R T 2 0 0 8
TA B L E
3.2.A RELATED INDUSTRIES: EXPORTS, BY ORIGIN AND PRODUCTGROUP, 1996, 2000 AND 2005
Product group Total EU-27
Developed economies (1)
(In millions of $)
Year Total CanadaUnited States Japan
OtherdevelopedeconomiesWorld
Europe Economies in transition
(2)
Origin
ALL CREATIVE INDUSTRIES 1996 209,143 158,161 89,443 84,909 2,384 25,193 28,855 12,287 12000 323,812 203,551 117,366 113,379 4,361 32,283 34,619 14,922 5992005 575,996 299,507 192,039 186,701 4,575 36,570 43,343 22,981 2,608
AUDIOVISUALS 1996 118,598 82,033 43,817 43,207 1,461 16,815 19,076 864 12000 208,058 119,300 69,322 68,484 3,050 20,615 25,025 1,289 1902005 418,137 191,232 131,026 129,299 3,523 21,126 34,061 1,497 404
E-BROADCASTING 1996 84,790 59,265 34,302 33,810 1,235 11,588 11,344 796 12000 164,885 98,171 59,999 59,275 2,765 15,733 18,462 1,213 1712005 347,720 165,661 116,483 114,891 3,163 15,737 28,912 1,367 353
FILM 1996 824 780 424 414 28 251 62 14 02000 1,080 781 377 365 56 262 71 15 12005 1,209 878 458 451 50 266 85 20 2
SOUND PRODUCTION 1996 32,984 21,988 9,091 8,983 198 4,976 7,670 53 02000 42,093 20,349 8,947 8,843 229 4,620 6,492 61 192005 69,208 24,693 14,085 13,957 310 5,123 5,065 110 49
DESIGN 1996 47,876 39,399 23,612 21,009 206 3,244 1,471 10,865 02000 64,471 46,911 26,365 24,488 426 5,318 1,786 13,015 3312005 103,886 67,402 33,678 31,640 667 10,020 1,991 21,046 2,150
GRAPHIC 1996 429 385 168 151 9 163 45 0 -2000 495 417 133 128 11 231 41 1 12005 576 483 118 116 6 347 12 0 1
FASHION 1996 2,684 2,078 1,638 1,604 15 123 288 14 02000 2,674 1,931 1,434 1,403 32 125 328 12 12005 3,638 2,325 1,963 1,916 57 134 163 8 3
GLASSWARE 1996 611 515 452 451 5 32 18 7 02000 908 670 585 583 9 31 38 8 262005 2,149 1,566 1,455 1,453 15 45 41 10 4
INTERIOR 1996 915 828 578 543 66 135 16 33 02000 865 691 466 450 51 124 16 33 262005 1,239 991 744 736 47 155 15 29 38
JEWELLERY 1996 43,123 35,480 20,670 18,186 110 2,788 1,102 10,810 02000 59,429 43,107 23,658 21,855 321 4,803 1,363 12,962 2762005 96,191 61,955 29,319 27,353 541 9,335 1,759 21,000 2,104
OTHER 1996 113 112 106 74 1 3 2 0 02000 100 95 88 69 1 5 1 0 02005 91 83 79 67 1 3 0 0 1
MUSIC (CDs, tapes) 1996 3,837 2,523 1,083 1,047 38 473 916 13 02000 4,228 2,377 1,031 1,001 51 432 851 12 32005 4,969 2,879 1,524 1,493 76 611 658 11 3
INSTRUMENT 1996 3,278 2,378 1,000 964 38 466 866 9 02000 3,800 2,271 944 915 51 416 850 9 32005 4,824 2,792 1,447 1,417 75 602 657 11 3
OTHER 1996 42 40 34 34 0 3 - 3 -2000 68 50 40 40 0 7 0 2 02005 55 24 18 18 0 5 0 0 0
PUBLISHING 1996 16,503 15,797 11,586 10,556 400 1,679 1,929 203 02000 20,493 17,578 12,233 11,186 570 2,271 2,180 324 602005 24,118 20,810 16,098 14,694 231 1,768 2,398 316 23
BOOKS 1996 32 29 24 23 0 2 2 0 02000 61 33 29 29 0 3 1 0 02005 68 51 45 45 1 3 2 0 0
OTHER 1996 16,471 15,769 11,562 10,533 400 1,677 1,927 203 02000 20,432 17,544 12,204 11,158 569 2,268 2,179 323 602005 24,050 20,759 16,052 14,649 230 1,765 2,396 316 23
VISUAL ARTS 1996 22,330 18,409 9,344 9,090 279 2,980 5,463 342 02000 26,562 17,386 8,415 8,219 265 3,647 4,777 282 142005 24,886 17,183 9,713 9,574 79 3,046 4,235 111 28
PAINTING 1996 1,152 848 640 626 10 102 85 12 02000 1,306 720 493 480 16 123 79 9 62005 1,976 1,074 839 823 20 146 56 12 9
PHOTOGRAPHY 1996 21,178 17,560 8,704 8,465 269 2,879 5,378 330 02000 25,255 16,666 7,922 7,740 248 3,524 4,697 274 92005 22,910 16,109 8,874 8,751 59 2,899 4,179 99 19

325
Sta
tistical
Annex
Part
3
C R E AT I V E E C O N O M Y R E P O R T 2 0 0 8
TA B L E
3.2.A
YearTotal ChinaWestern
Asia LDCs SIDSTotal America OceaniaAfrica
Eastern, Southernand Southeastern
Asia Product group
SOURCE: UNCTAD secretariat calculations based on United Nations Comtrade database data.NOTES: (1) Developed economies, including Bulgaria and Romania.
(2) Excluding Bulgaria and Romania, which are included in the European Union (EU-27).
50,981 30 8,612 42,181 41,808 8,814 374 158 30 - 1996 ALL CREATIVE INDUSTRIES119,662 2,458 19,996 97,023 95,962 17,897 1,061 185 375 66 2000273,881 7,794 26,622 239,332 235,918 88,208 3,413 132 299 368 2005
36,564 2 7,787 28,772 28,434 6,784 338 3 1 - 1996 AUDIOVISUALS88,568 234 17,454 70,879 69,897 14,223 982 1 4 13 2000
226,500 651 24,530 201,317 198,040 82,105 3,277 2 15 305 200525,525 1 6,590 18,931 18,686 4,662 246 2 1 - 1996 E-BROADCASTING66,544 206 15,194 51,143 50,184 9,868 959 1 3 10 2000
181,706 588 22,717 158,398 155,218 61,316 3,181 2 12 302 200543 0 11 32 32 9 0 0 0 - 1996 FILM
299 3 12 284 279 30 5 0 1 1 2000329 2 38 288 287 82 1 0 1 0 2005
10,996 1 1,187 9,808 9,715 2,113 93 0 0 - 1996 SOUND PRODUCTION21,726 26 2,248 19,452 19,434 4,324 18 0 1 3 200044,466 61 1,774 42,630 42,535 20,707 94 0 2 3 20058,477 28 342 7,952 7,940 630 11 155 28 - 1996 DESIGN
17,230 2,162 814 14,071 14,047 1,084 24 183 368 43 200034,334 7,047 836 26,322 26,257 2,683 65 129 282 55 2005
44 0 3 41 41 13 1 0 0 - 1996 GRAPHIC78 0 4 73 73 28 0 0 0 0 200092 0 4 88 87 58 1 0 0 0 2005
605 0 15 590 588 87 2 0 0 - 1996 FASHION742 3 16 723 721 163 2 0 0 2 2000
1,311 6 12 1,293 1,288 347 5 0 0 1 200597 0 4 93 89 40 4 - 0 - 1996 GLASSWARE
212 0 10 201 196 79 5 0 0 0 2000580 2 9 569 561 315 8 0 0 0 200587 0 16 72 69 9 2 - 0 - 1996 INTERIOR
148 4 10 134 126 16 8 0 0 0 2000211 1 5 204 175 90 30 0 0 0 2005
7,643 28 305 7,155 7,153 481 3 155 28 - 1996 JEWELLERY16,046 2,155 775 12,934 12,926 794 8 183 367 41 200032,133 7,038 806 24,161 24,139 1,867 21 129 282 54 2005
1 - 0 1 1 0 0 - - - 1996 OTHER5 0 0 5 5 4 0 - 0 - 20008 0 0 7 7 6 1 0 - 0 2005
1,313 0 81 1,232 1,231 329 1 0 0 - 1996 MUSIC (CDs, tapes)1,848 7 117 1,723 1,720 473 3 1 1 3 20002,088 3 97 1,987 1,981 932 6 0 1 2 2005
900 0 79 821 820 233 1 0 0 - 1996 INSTRUMENT1,526 2 103 1,421 1,418 391 2 0 1 3 20002,029 3 72 1,955 1,949 924 6 0 1 2 2005
2 - 0 1 1 0 0 - - - 1996 OTHER19 3 14 2 2 0 0 1 0 1 200031 0 25 6 6 0 0 0 0 0 2005
706 0 57 648 630 59 18 0 0 - 1996 PUBLISHING2,855 40 581 2,234 2,206 80 28 0 1 4 20003,284 45 173 3,065 3,022 466 44 0 0 3 2005
3 - 0 3 3 1 0 - - - 1996 BOOKS27 0 0 27 27 2 0 0 - 0 200017 0 0 17 17 6 0 - 0 0 2005
703 0 57 645 628 58 18 0 0 - 1996 OTHER2,828 40 581 2,207 2,179 79 28 0 1 4 20003,268 45 173 3,049 3,005 460 43 0 0 3 20053,921 0 344 3,577 3,572 1,012 5 0 0 - 1996 VISUAL ARTS9,161 15 1,030 8,116 8,092 2,036 24 0 2 3 20007,675 48 986 6,641 6,619 2,022 22 0 0 4 2005
303 0 11 292 290 142 3 0 0 - 1996 PAINTING581 4 67 510 506 212 4 0 0 1 2000893 9 128 756 749 471 7 0 0 3 2005
3,618 0 333 3,285 3,283 870 3 0 0 - 1996 PHOTOGRAPHY8,581 11 964 7,606 7,586 1,824 20 0 1 2 20006,782 39 858 5,884 5,869 1,550 15 0 0 1 2005
Developing economies (1)
Asia
Origin
(In millions of $)

326
Sta
tist
ical
Annex
Part
3
C R E AT I V E E C O N O M Y R E P O R T 2 0 0 8
TA B L E
3.2.B RELATED INDUSTRIES: IMPORTS, BY ORIGIN AND PRODUCTGROUP, 1996, 2000 AND 2005
ALL CREATIVE INDUSTRIES 1996 209,143 158,161 89,443 84,909 2,384 25,193 28,855 12,287 12000 323,812 203,551 117,366 113,379 4,361 32,283 34,619 14,922 5992005 575,996 299,507 192,039 186,701 4,575 36,570 43,343 22,981 2,608
AUDIOVISUALS 1996 118,598 82,033 43,817 43,207 1,461 16,815 19,076 864 12000 208,058 119,300 69,322 68,484 3,050 20,615 25,025 1,289 1902005 418,137 191,232 131,026 129,299 3,523 21,126 34,061 1,497 404
E-BROADCASTING 1996 84,790 59,265 34,302 33,810 1,235 11,588 11,344 796 12000 164,885 98,171 59,999 59,275 2,765 15,733 18,462 1,213 1712005 347,720 165,661 116,483 114,891 3,163 15,737 28,912 1,367 353
FILM 1996 824 780 424 414 28 251 62 14 02000 1,080 781 377 365 56 262 71 15 12005 1,209 878 458 451 50 266 85 20 2
SOUND PRODUCTION 1996 32,984 21,988 9,091 8,983 198 4,976 7,670 53 02000 42,093 20,349 8,947 8,843 229 4,620 6,492 61 192005 69,208 24,693 14,085 13,957 310 5,123 5,065 110 49
DESIGN 1996 47,876 39,399 23,612 21,009 206 3,244 1,471 10,865 02000 64,471 46,911 26,365 24,488 426 5,318 1,786 13,015 3312005 103,886 67,402 33,678 31,640 667 10,020 1,991 21,046 2,150
GRAPHIC 1996 429 385 168 151 9 163 45 0 -2000 495 417 133 128 11 231 41 1 12005 576 483 118 116 6 347 12 0 1
FASHION 1996 2,684 2,078 1,638 1,604 15 123 288 14 02000 2,674 1,931 1,434 1,403 32 125 328 12 12005 3,638 2,325 1,963 1,916 57 134 163 8 3
GLASSWARE 1996 611 515 452 451 5 32 18 7 02000 908 670 585 583 9 31 38 8 262005 2,149 1,566 1,455 1,453 15 45 41 10 4
INTERIOR 1996 915 828 578 543 66 135 16 33 02000 865 691 466 450 51 124 16 33 262005 1,239 991 744 736 47 155 15 29 38
JEWELLERY 1996 43,123 35,480 20,670 18,186 110 2,788 1,102 10,810 02000 59,429 43,107 23,658 21,855 321 4,803 1,363 12,962 2762005 96,191 61,955 29,319 27,353 541 9,335 1,759 21,000 2,104
OTHER 1996 113 112 106 74 1 3 2 0 02000 100 95 88 69 1 5 1 0 02005 91 83 79 67 1 3 0 0 1
MUSIC (CDs, tapes) 1996 3,837 2,523 1,083 1,047 38 473 916 13 02000 4,228 2,377 1,031 1,001 51 432 851 12 32005 4,969 2,879 1,524 1,493 76 611 658 11 3
INSTRUMENT 1996 3,278 2,378 1,000 964 38 466 866 9 02000 3,800 2,271 944 915 51 416 850 9 32005 4,824 2,792 1,447 1,417 75 602 657 11 3
OTHER 1996 42 40 34 34 0 3 - 3 -2000 68 50 40 40 0 7 0 2 02005 55 24 18 18 0 5 0 0 0
PUBLISHING 1996 16,503 15,797 11,586 10,556 400 1,679 1,929 203 02000 20,493 17,578 12,233 11,186 570 2,271 2,180 324 602005 24,118 20,810 16,098 14,694 231 1,768 2,398 316 23
BOOKS 1996 32 29 24 23 0 2 2 0 02000 61 33 29 29 0 3 1 0 02005 68 51 45 45 1 3 2 0 0
OTHER 1996 16,471 15,769 11,562 10,533 400 1,677 1,927 203 02000 20,432 17,544 12,204 11,158 569 2,268 2,179 323 602005 24,050 20,759 16,052 14,649 230 1,765 2,396 316 23
VISUAL ARTS 1996 22,330 18,409 9,344 9,090 279 2,980 5,463 342 02000 26,562 17,386 8,415 8,219 265 3,647 4,777 282 142005 24,886 17,183 9,713 9,574 79 3,046 4,235 111 28
PAINTING 1996 1,152 848 640 626 10 102 85 12 02000 1,306 720 493 480 16 123 79 9 62005 1,976 1,074 839 823 20 146 56 12 9
PHOTOGRAPHY 1996 21,178 17,560 8,704 8,465 269 2,879 5,378 330 02000 25,255 16,666 7,922 7,740 248 3,524 4,697 274 92005 22,910 16,109 8,874 8,751 59 2,899 4,179 99 19
Product group Total EU-27
Developed economies (1)
(In millions of $)
Year Total CanadaUnited States Japan
OtherdevelopedeconomiesWorld
Europe Economies in transition
(2)
Origin
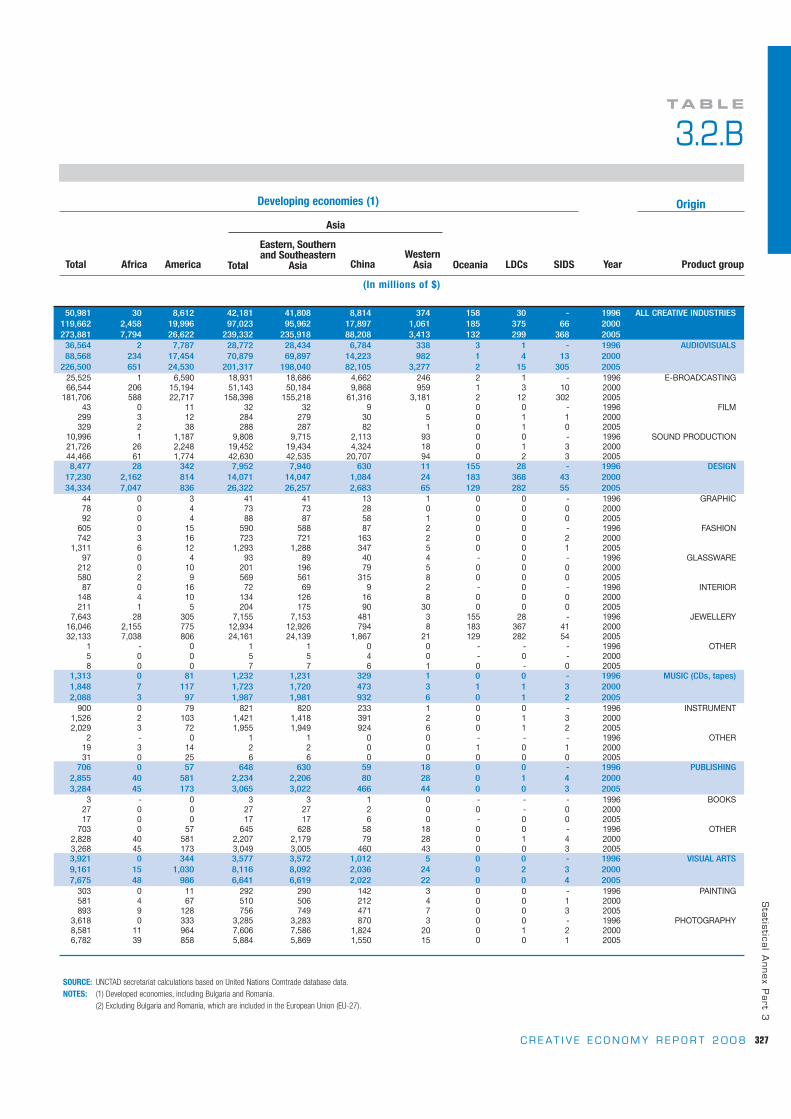
327
Sta
tistical
Annex
Part
3
C R E AT I V E E C O N O M Y R E P O R T 2 0 0 8
TA B L E
3.2.B
SOURCE: UNCTAD secretariat calculations based on United Nations Comtrade database data.NOTES: (1) Developed economies, including Bulgaria and Romania.
(2) Excluding Bulgaria and Romania, which are included in the European Union (EU-27).
50,981 30 8,612 42,181 41,808 8,814 374 158 30 - 1996 ALL CREATIVE INDUSTRIES119,662 2,458 19,996 97,023 95,962 17,897 1,061 185 375 66 2000273,881 7,794 26,622 239,332 235,918 88,208 3,413 132 299 368 2005
36,564 2 7,787 28,772 28,434 6,784 338 3 1 - 1996 AUDIOVISUALS88,568 234 17,454 70,879 69,897 14,223 982 1 4 13 2000
226,500 651 24,530 201,317 198,040 82,105 3,277 2 15 305 200525,525 1 6,590 18,931 18,686 4,662 246 2 1 - 1996 E-BROADCASTING66,544 206 15,194 51,143 50,184 9,868 959 1 3 10 2000
181,706 588 22,717 158,398 155,218 61,316 3,181 2 12 302 200543 0 11 32 32 9 0 0 0 - 1996 FILM
299 3 12 284 279 30 5 0 1 1 2000329 2 38 288 287 82 1 0 1 0 2005
10,996 1 1,187 9,808 9,715 2,113 93 0 0 - 1996 SOUND PRODUCTION21,726 26 2,248 19,452 19,434 4,324 18 0 1 3 200044,466 61 1,774 42,630 42,535 20,707 94 0 2 3 20058,477 28 342 7,952 7,940 630 11 155 28 - 1996 DESIGN
17,230 2,162 814 14,071 14,047 1,084 24 183 368 43 200034,334 7,047 836 26,322 26,257 2,683 65 129 282 55 2005
44 0 3 41 41 13 1 0 0 - 1996 GRAPHIC78 0 4 73 73 28 0 0 0 0 200092 0 4 88 87 58 1 0 0 0 2005
605 0 15 590 588 87 2 0 0 - 1996 FASHION742 3 16 723 721 163 2 0 0 2 2000
1,311 6 12 1,293 1,288 347 5 0 0 1 200597 0 4 93 89 40 4 - 0 - 1996 GLASSWARE
212 0 10 201 196 79 5 0 0 0 2000580 2 9 569 561 315 8 0 0 0 200587 0 16 72 69 9 2 - 0 - 1996 INTERIOR
148 4 10 134 126 16 8 0 0 0 2000211 1 5 204 175 90 30 0 0 0 2005
7,643 28 305 7,155 7,153 481 3 155 28 - 1996 JEWELLERY16,046 2,155 775 12,934 12,926 794 8 183 367 41 200032,133 7,038 806 24,161 24,139 1,867 21 129 282 54 2005
1 - 0 1 1 0 0 - - - 1996 OTHER5 0 0 5 5 4 0 - 0 - 20008 0 0 7 7 6 1 0 - 0 2005
1,313 0 81 1,232 1,231 329 1 0 0 - 1996 MUSIC (CDs, tapes)1,848 7 117 1,723 1,720 473 3 1 1 3 20002,088 3 97 1,987 1,981 932 6 0 1 2 2005
900 0 79 821 820 233 1 0 0 - 1996 INSTRUMENT1,526 2 103 1,421 1,418 391 2 0 1 3 20002,029 3 72 1,955 1,949 924 6 0 1 2 2005
2 - 0 1 1 0 0 - - - 1996 OTHER19 3 14 2 2 0 0 1 0 1 200031 0 25 6 6 0 0 0 0 0 2005
706 0 57 648 630 59 18 0 0 - 1996 PUBLISHING2,855 40 581 2,234 2,206 80 28 0 1 4 20003,284 45 173 3,065 3,022 466 44 0 0 3 2005
3 - 0 3 3 1 0 - - - 1996 BOOKS27 0 0 27 27 2 0 0 - 0 200017 0 0 17 17 6 0 - 0 0 2005
703 0 57 645 628 58 18 0 0 - 1996 OTHER2,828 40 581 2,207 2,179 79 28 0 1 4 20003,268 45 173 3,049 3,005 460 43 0 0 3 20053,921 0 344 3,577 3,572 1,012 5 0 0 - 1996 VISUAL ARTS9,161 15 1,030 8,116 8,092 2,036 24 0 2 3 20007,675 48 986 6,641 6,619 2,022 22 0 0 4 2005
303 0 11 292 290 142 3 0 0 - 1996 PAINTING581 4 67 510 506 212 4 0 0 1 2000893 9 128 756 749 471 7 0 0 3 2005
3,618 0 333 3,285 3,283 870 3 0 0 - 1996 PHOTOGRAPHY8,581 11 964 7,606 7,586 1,824 20 0 1 2 20006,782 39 858 5,884 5,869 1,550 15 0 0 1 2005
YearTotal ChinaWestern
Asia LDCs SIDSTotal America OceaniaAfrica
Eastern, Southernand Southeastern
Asia Product group
Developing economies (1)
Asia
Origin
(In millions of $)
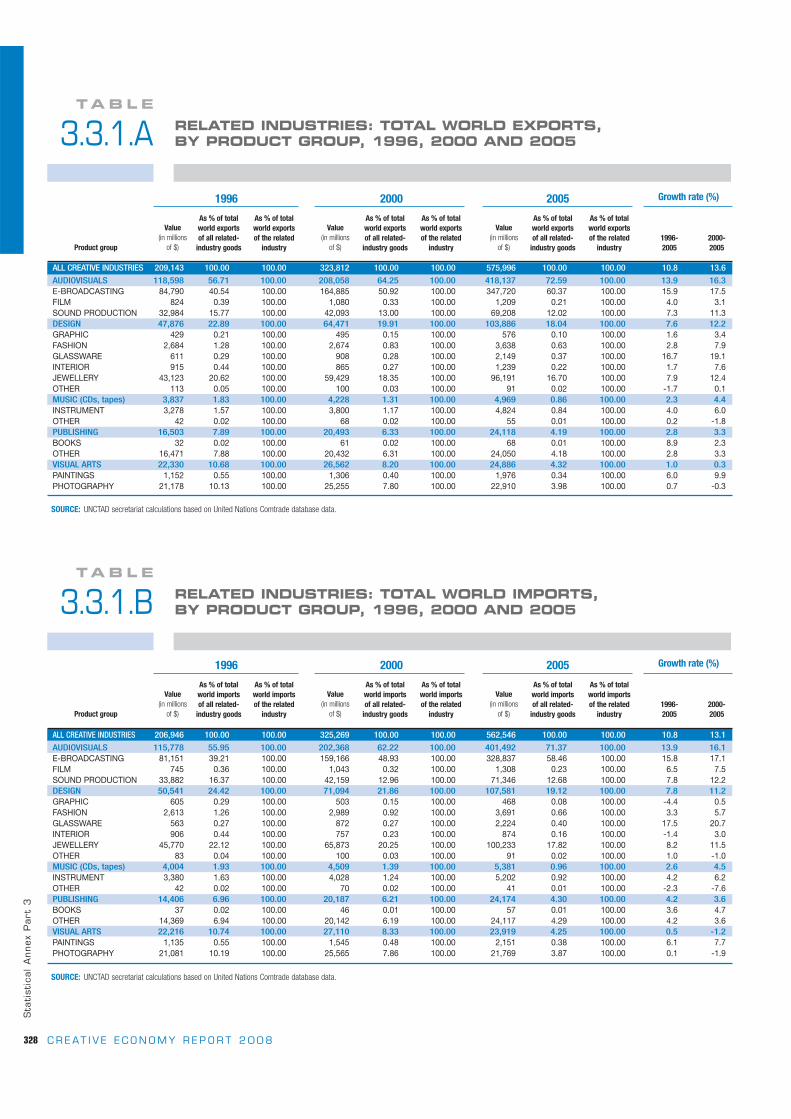
2000
328
Sta
tist
ical
Annex
Part
3
C R E AT I V E E C O N O M Y R E P O R T 2 0 0 8
TA B L E
3.3.1.A RELATED INDUSTRIES: TOTAL WORLD EXPORTS, BY PRODUCT GROUP, 1996, 2000 AND 2005
TA B L E
3.3.1.B RELATED INDUSTRIES: TOTAL WORLD IMPORTS, BY PRODUCT GROUP, 1996, 2000 AND 2005
Product group
Value(in millions
of $)
As % of total world exports of all related-
industry goods
As % of totalworld exports of the related
industry
1996
Value(in millions
of $)
As % of total world exports of all related-
industry goods
As % of totalworld exports of the related
industry
2005
Value(in millions
of $)
As % of total world exports of all related-
industry goods
As % of totalworld exports of the related
industry
Growth rate (%)
1996-2005
2000-2005
SOURCE: UNCTAD secretariat calculations based on United Nations Comtrade database data.
ALL CREATIVE INDUSTRIES 209,143 100.00 100.00 323,812 100.00 100.00 575,996 100.00 100.00 10.8 13.6
AUDIOVISUALS 118,598 56.71 100.00 208,058 64.25 100.00 418,137 72.59 100.00 13.9 16.3E-BROADCASTING 84,790 40.54 100.00 164,885 50.92 100.00 347,720 60.37 100.00 15.9 17.5FILM 824 0.39 100.00 1,080 0.33 100.00 1,209 0.21 100.00 4.0 3.1SOUND PRODUCTION 32,984 15.77 100.00 42,093 13.00 100.00 69,208 12.02 100.00 7.3 11.3DESIGN 47,876 22.89 100.00 64,471 19.91 100.00 103,886 18.04 100.00 7.6 12.2GRAPHIC 429 0.21 100.00 495 0.15 100.00 576 0.10 100.00 1.6 3.4FASHION 2,684 1.28 100.00 2,674 0.83 100.00 3,638 0.63 100.00 2.8 7.9GLASSWARE 611 0.29 100.00 908 0.28 100.00 2,149 0.37 100.00 16.7 19.1INTERIOR 915 0.44 100.00 865 0.27 100.00 1,239 0.22 100.00 1.7 7.6JEWELLERY 43,123 20.62 100.00 59,429 18.35 100.00 96,191 16.70 100.00 7.9 12.4OTHER 113 0.05 100.00 100 0.03 100.00 91 0.02 100.00 -1.7 0.1MUSIC (CDs, tapes) 3,837 1.83 100.00 4,228 1.31 100.00 4,969 0.86 100.00 2.3 4.4INSTRUMENT 3,278 1.57 100.00 3,800 1.17 100.00 4,824 0.84 100.00 4.0 6.0OTHER 42 0.02 100.00 68 0.02 100.00 55 0.01 100.00 0.2 -1.8PUBLISHING 16,503 7.89 100.00 20,493 6.33 100.00 24,118 4.19 100.00 2.8 3.3BOOKS 32 0.02 100.00 61 0.02 100.00 68 0.01 100.00 8.9 2.3OTHER 16,471 7.88 100.00 20,432 6.31 100.00 24,050 4.18 100.00 2.8 3.3VISUAL ARTS 22,330 10.68 100.00 26,562 8.20 100.00 24,886 4.32 100.00 1.0 0.3PAINTINGS 1,152 0.55 100.00 1,306 0.40 100.00 1,976 0.34 100.00 6.0 9.9PHOTOGRAPHY 21,178 10.13 100.00 25,255 7.80 100.00 22,910 3.98 100.00 0.7 -0.3
2000
Product group
Value(in millions
of $)
As % of total world imports of all related-
industry goods
As % of totalworld imports of the related
industry
1996
Value(in millions
of $)
As % of total world imports of all related-
industry goods
As % of totalworld imports of the related
industry
2005
Value(in millions
of $)
As % of total world imports of all related-
industry goods
As % of totalworld imports of the related
industry
Growth rate (%)
1996-2005
2000-2005
SOURCE: UNCTAD secretariat calculations based on United Nations Comtrade database data.
ALL CREATIVE INDUSTRIES 206,946 100.00 100.00 325,269 100.00 100.00 562,546 100.00 100.00 10.8 13.1
AUDIOVISUALS 115,778 55.95 100.00 202,368 62.22 100.00 401,492 71.37 100.00 13.9 16.1E-BROADCASTING 81,151 39.21 100.00 159,166 48.93 100.00 328,837 58.46 100.00 15.8 17.1FILM 745 0.36 100.00 1,043 0.32 100.00 1,308 0.23 100.00 6.5 7.5SOUND PRODUCTION 33,882 16.37 100.00 42,159 12.96 100.00 71,346 12.68 100.00 7.8 12.2DESIGN 50,541 24.42 100.00 71,094 21.86 100.00 107,581 19.12 100.00 7.8 11.2GRAPHIC 605 0.29 100.00 503 0.15 100.00 468 0.08 100.00 -4.4 0.5FASHION 2,613 1.26 100.00 2,989 0.92 100.00 3,691 0.66 100.00 3.3 5.7GLASSWARE 563 0.27 100.00 872 0.27 100.00 2,224 0.40 100.00 17.5 20.7INTERIOR 906 0.44 100.00 757 0.23 100.00 874 0.16 100.00 -1.4 3.0JEWELLERY 45,770 22.12 100.00 65,873 20.25 100.00 100,233 17.82 100.00 8.2 11.5OTHER 83 0.04 100.00 100 0.03 100.00 91 0.02 100.00 1.0 -1.0MUSIC (CDs, tapes) 4,004 1.93 100.00 4,509 1.39 100.00 5,381 0.96 100.00 2.6 4.5INSTRUMENT 3,380 1.63 100.00 4,028 1.24 100.00 5,202 0.92 100.00 4.2 6.2OTHER 42 0.02 100.00 70 0.02 100.00 41 0.01 100.00 -2.3 -7.6PUBLISHING 14,406 6.96 100.00 20,187 6.21 100.00 24,174 4.30 100.00 4.2 3.6BOOKS 37 0.02 100.00 46 0.01 100.00 57 0.01 100.00 3.6 4.7OTHER 14,369 6.94 100.00 20,142 6.19 100.00 24,117 4.29 100.00 4.2 3.6VISUAL ARTS 22,216 10.74 100.00 27,110 8.33 100.00 23,919 4.25 100.00 0.5 -1.2PAINTINGS 1,135 0.55 100.00 1,545 0.48 100.00 2,151 0.38 100.00 6.1 7.7PHOTOGRAPHY 21,081 10.19 100.00 25,565 7.86 100.00 21,769 3.87 100.00 0.1 -1.9

329
Sta
tistical
Annex
Part
3
C R E AT I V E E C O N O M Y R E P O R T 2 0 0 8
2000
TA B L E
3.3.2.ARELATED INDUSTRIES: EXPORTS OF DEVELOPED ECONOMIES,BY PRODUCT GROUP, 1996, 2000 AND 2005
TA B L E
3.3.2.BRELATED INDUSTRIES: IMPORTS OF DEVELOPED ECONOMIES,BY PRODUCT GROUP, 1996, 2000 AND 2005
Product group
Value(in millions
of $)
As % of total exports of related
industries bydevelopedeconomies
As % of totalworld exports of the related
industry
1996
Value(in millions
of $)
As % of total exports of related
industries bydevelopedeconomies
As % of totalworld exports of the related
industry
2005
Value(in millions
of $)
As % of total exports of related
industries bydevelopedeconomies
As % of totalworld exports of the related
industry
Growth rate (%)
1996-2005
2000-2005
SOURCE: UNCTAD secretariat calculations based on United Nations Comtrade database data.NOTES: (1) Developed economies, including Bulgaria and Romania.
(2) Excluding Bulgaria and Romania, which are included in the European Union (EU-27).
ALL CREATIVE INDUSTRIES 158,161 100.00 75.62 203,551 100.00 62.86 299,507 100.00 52.00 6.5 9.2
AUDIOVISUALS 82,033 51.87 69.17 119,300 58.61 57.34 191,232 63.85 45.73 8.7 10.9E-BROADCASTING 59,265 37.47 69.90 98,171 48.23 59.54 165,661 55.31 47.64 11.0 12.1FILM 780 0.49 94.72 781 0.38 72.28 878 0.29 72.65 0.9 3.4SOUND PRODUCTION 21,988 13.90 66.66 20,349 10.00 48.34 24,693 8.24 35.68 -0.2 4.4DESIGN 39,399 24.91 82.29 46,911 23.05 72.76 67,402 22.50 64.88 5.9 9.4GRAPHIC 385 0.24 89.68 417 0.21 84.24 483 0.16 83.88 0.4 2.8FASHION 2,078 1.31 77.44 1,931 0.95 72.21 2,325 0.78 63.90 0.5 5.5GLASSWARE 515 0.33 84.20 670 0.33 73.79 1,566 0.52 72.85 15.3 18.4INTERIOR 828 0.52 90.47 691 0.34 79.86 991 0.33 79.95 0.3 7.5JEWELLERY 35,480 22.43 82.28 43,107 21.18 72.54 61,955 20.69 64.41 6.2 9.5OTHER 112 0.07 99.12 95 0.05 94.63 83 0.03 90.67 -2.6 -0.7MUSIC (CDs, tapes) 2,523 1.60 65.77 2,377 1.17 56.22 2,879 0.96 57.94 0.5 5.1INSTRUMENT 2,378 1.50 72.55 2,271 1.12 59.76 2,792 0.93 57.88 0.8 5.4OTHER 40 0.03 96.04 50 0.02 72.74 24 0.01 43.59 -6.8 -11.9PUBLISHING 15,797 9.99 95.72 17,578 8.64 85.78 20,810 6.95 86.29 1.4 3.4BOOKS 29 0.02 90.42 33 0.02 54.98 51 0.02 75.28 7.6 8.8OTHER 15,769 9.97 95.73 17,544 8.62 85.87 20,759 6.93 86.32 1.4 3.4VISUAL ARTS 18,409 11.64 82.44 17,386 8.54 65.45 17,183 5.74 69.05 -0.9 1.5PAINTING 848 0.54 73.66 720 0.35 55.10 1,074 0.36 54.34 3.1 10.0PHOTOGRAPHY 17,560 11.10 82.92 16,666 8.19 65.99 16,109 5.38 70.32 -1.1 1.1
2000
Product group
Value(in millions
of $)
As % of total imports of related
industries bydevelopedeconomies
As % of totalworld imports of the related
industry
1996
Value(in millions
of $)
As % of total imports of related
industries bydevelopedeconomies
As % of totalworld imports of the related
industry
2005
Value(in millions
of $)
As % of total imports of related
industries bydevelopedeconomies
As % of totalworld imports of the related
industry
Growth rate (%)
1996-2005
2000-2005
SOURCE: UNCTAD secretariat calculations based on United Nations Comtrade database data.NOTES: (1) Developed economies, including Bulgaria and Romania.
(2) Excluding Bulgaria and Romania, which are included in the European Union (EU-27).
ALL CREATIVE INDUSTRIES 163,498 100.00 79.01 231,837 100.00 71.28 367,778 100.00 65.38 8.9 11.1
AUDIOVISUALS 89,497 54.74 77.30 143,116 61.73 70.72 265,763 72.26 66.19 12.6 14.4E-BROADCASTING 61,259 37.47 75.49 111,306 48.01 69.93 216,636 58.90 65.88 14.7 15.5FILM 640 0.39 85.98 674 0.29 64.61 829 0.23 63.38 1.9 5.1SOUND PRODUCTION 27,598 16.88 81.45 31,136 13.43 73.85 48,298 13.13 67.70 6.3 10.4DESIGN 41,547 25.41 82.20 54,073 23.32 76.06 67,285 18.30 62.54 4.8 7.1GRAPHIC 530 0.32 87.52 326 0.14 64.88 250 0.07 53.47 -10.9 -2.0FASHION 2,241 1.37 85.75 2,434 1.05 81.43 2,928 0.80 79.33 2.7 5.1GLASSWARE 321 0.20 56.91 470 0.20 53.94 992 0.27 44.61 14.3 16.5INTERIOR 791 0.48 87.31 534 0.23 70.61 527 0.14 60.32 -5.4 0.0JEWELLERY 37,601 23.00 82.15 50,241 21.67 76.27 62,533 17.00 62.39 5.1 7.2OTHER 63 0.04 76.22 67 0.03 67.09 54 0.01 59.49 -1.7 -3.2MUSIC (CDs, tapes) 3,373 2.06 84.25 3,602 1.55 79.89 4,440 1.21 82.53 2.4 5.3INSTRUMENT 2,960 1.81 87.57 3,305 1.43 82.05 4,308 1.17 82.80 3.6 6.4OTHER 39 0.02 93.18 63 0.03 89.51 33 0.01 81.10 -3.6 -9.1PUBLISHING 11,546 7.06 80.15 13,482 5.82 66.79 15,618 4.25 64.61 1.4 2.6BOOKS 28 0.02 74.81 26 0.01 58.12 36 0.01 63.00 3.2 6.8OTHER 11,518 7.05 80.16 13,456 5.80 66.81 15,583 4.24 64.61 1.4 2.6VISUAL ARTS 17,534 10.72 78.93 17,563 7.58 64.78 14,671 3.99 61.34 -2.1 -2.2PAINTING 968 0.59 85.26 1,194 0.52 77.29 1,689 0.46 78.52 5.6 8.1PHOTOGRAPHY 16,566 10.13 78.58 16,369 7.06 64.03 12,983 3.53 59.64 -2.8 -3.1

330
Sta
tist
ical
Annex
Part
3
C R E AT I V E E C O N O M Y R E P O R T 2 0 0 8
2000
TA B L E
3.3.3.A RELATED INDUSTRIES: EXPORTS OF DEVELOPING ECONOMIES,BY PRODUCT GROUP, 1996, 2000 AND 2005
TA B L E
3.3.3.B RELATED INDUSTRIES: IMPORTS OF DEVELOPING ECONOMIES,BY PRODUCT GROUP, 1996, 2000 AND 2005
Product group
Value(in millions
of $)
As % of total exports of related
industries bydeveloping economies
As % of totalworld exports of the related
industry
1996
Value(in millions
of $)
As % of total exports of related
industries bydeveloping economies
As % of totalworld exports of the related
industry
2005
Value(in millions
of $)
As % of total exports of related
industries bydeveloping economies
As % of totalworld exports of the related
industry
Growth rate (%)
1996-2005
2000-2005
SOURCE: UNCTAD secretariat calculations based on United Nations Comtrade database data.
ALL CREATIVE INDUSTRIES 50,981 100.00 24.38 119,662 100.00 36.95 273,881 100.00 47.55 18.4 19.7
AUDIOVISUALS 36,564 71.72 30.83 88,568 74.02 42.57 226,500 82.70 54.17 21.1 22.3E-BROADCASTING 25,525 50.07 30.10 66,544 55.61 40.36 181,706 66.34 52.26 23.0 24.1FILM 43 0.09 5.28 299 0.25 27.65 329 0.12 27.18 20.1 1.4SOUND PRODUCTION 10,996 21.57 33.34 21,726 18.16 51.61 44,466 16.24 64.25 15.2 16.6DESIGN 8,477 16.63 17.71 17,230 14.40 26.73 34,334 12.54 33.05 12.3 17.7GRAPHIC 44 0.09 10.32 78 0.06 15.65 92 0.03 15.96 9.1 5.9FASHION 605 1.19 22.56 742 0.62 27.74 1,311 0.48 36.02 8.9 13.1GLASSWARE 97 0.19 15.80 212 0.18 23.30 580 0.21 26.97 22.3 23.0INTERIOR 87 0.17 9.51 148 0.12 17.11 211 0.08 17.02 8.2 8.3JEWELLERY 7,643 14.99 17.72 16,046 13.41 27.00 32,133 11.73 33.41 12.4 18.0OTHER 1 0.00 0.81 5 0.00 5.13 8 0.00 8.55 26.8 11.9MUSIC (CDs, tapes) 1,313 2.58 34.23 1,848 1.54 43.70 2,088 0.76 42.01 5.1 3.3INSTRUMENT 900 1.76 27.45 1,526 1.28 40.16 2,029 0.74 42.07 10.3 6.9OTHER 2 0.00 3.96 19 0.02 27.24 31 0.01 56.31 20.4 13.5PUBLISHING 706 1.38 4.28 2,855 2.39 13.93 3,284 1.20 13.62 16.8 3.1BOOKS 3 0.01 9.54 27 0.02 44.97 17 0.01 24.66 16.0 -9.7OTHER 703 1.38 4.27 2,828 2.36 13.84 3,268 1.19 13.59 16.8 3.2VISUAL ARTS 3,921 7.69 17.56 9,161 7.66 34.49 7,675 2.80 30.84 6.5 -2.3PAINTING 303 0.59 26.32 581 0.49 44.45 893 0.33 45.19 10.9 9.8PHOTOGRAPHY 3,618 7.10 17.08 8,581 7.17 33.98 6,782 2.48 29.60 6.0 -3.3
2000
Product group
Value(in millions
of $)
As % of total imports of related
industries bydeveloping economies
As % of totalworld imports of the related
industry
1996
Value(in millions
of $)
As % of total imports of related
industries bydeveloping economies
As % of totalworld imports of the related
industry
2005
Value(in millions
of $)
As % of total imports of related
industries bydeveloping economies
As % of totalworld imports of the related
industry
Growth rate (%)
1996-2005
2000-2005
SOURCE: UNCTAD secretariat calculations based on United Nations Comtrade database data.
ALL CREATIVE INDUSTRIES 43,413 100.00 20.98 91,856 100.00 28.24 186,809 100.00 33.21 15.2 16.9
AUDIOVISUALS 26,258 60.48 22.68 58,275 63.44 28.80 129,438 69.29 32.24 16.7 19.1E-BROADCASTING 19,872 45.77 24.49 46,990 51.16 29.52 106,706 57.12 32.45 17.9 19.8FILM 104 0.24 13.99 364 0.40 34.90 466 0.25 35.65 17.7 10.5SOUND PRODUCTION 6,282 14.47 18.54 10,921 11.89 25.90 22,265 11.92 31.21 11.9 16.3DESIGN 8,991 20.71 17.79 16,812 18.30 23.65 39,543 21.17 36.76 16.0 21.0GRAPHIC 75 0.17 12.43 171 0.19 33.92 212 0.11 45.32 12.9 4.3FASHION 372 0.86 14.25 543 0.59 18.18 731 0.39 19.81 5.9 7.6GLASSWARE 243 0.56 43.08 399 0.43 45.73 1,214 0.65 54.61 20.7 24.6INTERIOR 115 0.26 12.66 171 0.19 22.57 209 0.11 23.91 5.6 3.2JEWELLERY 8,166 18.81 17.84 15,499 16.87 23.53 37,142 19.88 37.06 16.4 21.6OTHER 20 0.05 23.68 30 0.03 30.04 35 0.02 38.41 6.4 3.8MUSIC (CDs, tapes) 630 1.45 15.75 894 0.97 19.82 900 0.48 16.73 3.0 0.5INSTRUMENT 420 0.97 12.43 712 0.77 17.67 857 0.46 16.47 6.8 4.3OTHER 3 0.01 6.82 7 0.01 10.23 7 0.00 18.32 8.9 1.5PUBLISHING 2,855 6.58 19.82 6,460 7.03 32.00 7,913 4.24 32.73 10.1 4.7BOOKS 9 0.02 24.22 18 0.02 40.07 20 0.01 35.82 5.1 1.9OTHER 2,846 6.56 19.81 6,442 7.01 31.98 7,893 4.23 32.73 10.1 4.7VISUAL ARTS 4,679 10.78 21.06 9,415 10.25 34.73 9,014 4.83 37.69 6.4 0.1PAINTING 167 0.38 14.69 330 0.36 21.38 431 0.23 20.06 7.7 6.0PHOTOGRAPHY 4,512 10.39 21.40 9,084 9.89 35.53 8,583 4.59 39.43 6.3 -0.1

331
Sta
tistical
Annex
Part
3
C R E AT I V E E C O N O M Y R E P O R T 2 0 0 8
2000
TA B L E
3.3.4.ARELATED INDUSTRIES: EXPORTS OF ECONOMIES IN TRANSITION,BY PRODUCT GROUP, 1996, 2000 AND 2005
TA B L E
3.3.4.BRELATED INDUSTRIES: IMPORTS OF ECONOMIES IN TRANSITION,BY PRODUCT GROUP, 1996, 2000 AND 2005
Product group
Value(in millions
of $)
As % of total exports of related
industries by economies in transition
As % of totalworld exports of the related
industry
1996
Value(in millions
of $)
As % of total exports of related
industries by economies in transition
As % of totalworld exports of the related
industry
2005
Value(in millions
of $)
As % of total exports of related
industries by economies in transition
As % of totalworld exports of the related
industry
Growth rate (%)
1996-2005
2000-2005
SOURCE: UNCTAD secretariat calculations based on United Nations Comtrade database data.NOTES: (1) Excluding Bulgaria and Romania, which are included in the European Union (EU-27).
ALL CREATIVE INDUSTRIES 1 100.00 0.00 599 100.00 0.18 2,608 100.00 0.45 36.6 27.7
AUDIOVISUALS 1 58.41 0.00 190 31.75 0.09 404 15.50 0.10 36.8 16.5E-BROADCASTING 1 46.41 0.00 171 28.54 0.10 353 13.53 0.10 40.3 15.9FILM 0 0.98 0.00 1 0.12 0.06 2 0.08 0.16 48.7 77.3SOUND PRODUCTION 0 11.02 0.00 19 3.09 0.04 49 1.89 0.07 21.3 16.5DESIGN 0 22.07 0.00 331 55.26 0.51 2,150 82.43 2.07 51.9 46.8GRAPHIC - - - 1 0.09 0.11 1 0.04 0.16 52.4 48.2FASHION 0 0.43 0.00 1 0.23 0.05 3 0.11 0.08 25.3 34.4GLASSWARE 0 0.24 0.00 26 4.41 2.91 4 0.14 0.17 36.7 -12.6INTERIOR 0 12.24 0.02 26 4.37 3.03 38 1.44 3.03 18.5 7.6JEWELLERY 0 3.36 0.00 276 46.12 0.46 2,104 80.67 2.19 94.2 52.1OTHER 0 5.80 0.07 0 0.04 0.24 1 0.03 0.77 18.9 21.0MUSIC (CDs, tapes) 0 0.20 0.00 3 0.52 0.07 3 0.10 0.05 19.5 11.0INSTRUMENT 0 0.20 0.00 3 0.51 0.08 3 0.10 0.05 19.8 11.0OTHER - - - 0 0.00 0.02 0 0.00 0.11 37.7 87.3PUBLISHING 5 13.80 0.03 245 15.52 1.21 642 8.07 2.66 31.1 17.5BOOKS 0 0.84 0.04 0 0.00 0.04 0 0.00 0.06 -18.1 -14.4OTHER 0 5.04 0.00 60 10.04 0.29 23 0.88 0.10 27.1 -24.5VISUAL ARTS 0 13.45 0.00 14 2.42 0.05 28 1.08 0.11 21.7 14.5PAINTING 0 8.73 0.01 6 0.98 0.45 9 0.35 0.47 19.5 14.2PHOTOGRAPHY 0 4.72 0.00 9 1.45 0.03 19 0.73 0.08 22.2 14.6
2000
Product group
Value(in millions
of $)
As % of total imports of related
industries by economies in transition
As % of totalworld imports of the related
industry
1996
Value(in millions
of $)
As % of total imports of related
industries by economies in transition
As % of totalworld imports of the related
industry
2005
Value(in millions
of $)
As % of total imports of related
industries by economies in transition
As % of totalworld imports of the related
industry
Growth rate (%)
1996-2005
2000-2005
SOURCE: UNCTAD secretariat calculations based on United Nations Comtrade database data.NOTES: (1) Excluding Bulgaria and Romania, which are included in the European Union (EU-27).
ALL CREATIVE INDUSTRIES 34 100.00 0.02 1,576 100.00 0.48 7,959 100.00 1.41 40.3 34.0
AUDIOVISUALS 23 66.70 0.02 977 62.01 0.48 6,291 79.04 1.57 43.4 39.5E-BROADCASTING 20 58.19 0.02 870 55.19 0.55 5,495 69.04 1.67 43.2 38.8FILM 0 0.61 0.03 5 0.32 0.49 13 0.16 0.97 28.9 19.9SOUND PRODUCTION 3 7.90 0.01 102 6.50 0.24 783 9.84 1.10 45.1 45.8DESIGN 3 10.09 0.01 208 13.22 0.29 753 9.45 0.70 42.4 28.6GRAPHIC 0 0.94 0.05 6 0.38 1.20 6 0.07 1.21 25.6 5.8FASHION 0 0.41 0.01 11 0.73 0.38 32 0.40 0.86 30.3 22.4GLASSWARE 0 0.14 0.01 3 0.19 0.33 17 0.22 0.78 51.7 39.8INTERIOR 0 0.80 0.03 52 3.27 6.82 138 1.73 15.77 27.4 19.1JEWELLERY 3 7.55 0.01 133 8.46 0.20 558 7.01 0.56 60.8 34.4OTHER 0 0.25 0.10 3 0.18 2.87 2 0.02 2.10 16.9 -6.7MUSIC (CDs, tapes) 0 0.41 0.00 13 0.81 0.28 40 0.50 0.74 37.2 26.3INSTRUMENT 0 0.41 0.00 11 0.71 0.28 38 0.48 0.73 40.4 28.8OTHER 0 0.00 0.00 0 0.01 0.25 0 0.00 0.58 1.9 9.0PUBLISHING 0 5.88 0.00 60 10.04 0.29 23 0.88 0.10 26.6 -24.5BOOKS 0 1.06 0.97 1 0.05 1.81 1 0.01 1.17 3.1 -2.1OTHER 4 12.74 0.03 244 15.47 1.21 642 8.06 2.66 31.3 17.6VISUAL ARTS 3 9.00 0.01 133 8.43 0.49 234 2.94 0.98 25.6 13.2PAINTING 1 1.83 0.06 21 1.31 1.33 31 0.39 1.43 24.6 10.1PHOTOGRAPHY 2 7.17 0.01 112 7.13 0.44 203 2.55 0.93 25.8 13.8

332
Sta
tist
ical
Annex
Part
3
C R E AT I V E E C O N O M Y R E P O R T 2 0 0 8

A new development paradigm is emerging that links the economy andculture, embracing economic, cultural, technological and social aspectsof development at both the macro and micro levels. Central to the newparadigm is the fact that creativity, knowledge and access to informationare increasingly recognized as powerful engines driving economicgrowth and promoting development in a globalizing world.
The emerging creative economy has become a leading component ofeconomic growth, employment, trade and innovation, and socialcohesion in most advanced economies. Unfortunately, however, thelarge majority of developing countries are not yet able to harness theircreative capacity for development. This is a reflection of weaknessesboth in domestic policy and in the business environment, and globalsystemic biases. Nevertheless, the creative economy offers to developingcountries a feasible option and new opportunities to leapfrog intoemerging high-growth areas of the world economy.
This Report is the first to present the perspectives of the UnitedNations as a whole on this exciting new topic. It provides empiricalevidence that the creative industries are among the most dynamicemerging sectors in world trade. It also shows that the interfaceamong creativity, culture, economics and technology, as expressed inthe ability to create and circulate intellectual capital, has the potentialto generate income, jobs and export earnings while at the same timecontributing to social inclusion, cultural diversity and human development. This Report addresses the challenge of assessing thecreative economy with a view to informed policy-making by outliningthe conceptual, institutional and policy framework in which thiseconomy can flourish.
Creative Economy Report 2008