Distributed Database for Multi Mediation N - DiVA Portal
52
Thesis no: MEE-2015-06 Faculty of Computing Blekinge Institute of Technology SE-371 79 Karlskrona Sweden Distributed Database for Multi Mediation N Scalability, Availability & Performance NSR Sankaran Kuruganti
-
Upload
khangminh22 -
Category
Documents
-
view
2 -
download
0
Transcript of Distributed Database for Multi Mediation N - DiVA Portal

Thesis no: MEE-2015-06
Faculty of Computing
Blekinge Institute of Technology
SE-371 79 Karlskrona
Sweden
Distributed Database for Multi Mediation
N Scalability, Availability & Performance
NSR Sankaran Kuruganti

i
i
This thesis is submitted to the Faculty of Computing at Blekinge Institute of Technology in partial
fulfillment of the requirements for the degree of Master of Science in Electrical Engineering. The
thesis is equivalent to 20 weeks of full time studies.
Contact Information: Author(s):
NSR Sankaran Kuruganti
E-mail: [email protected]
External advisor:
Neeraj Garg
E-mail: [email protected]
University advisor:
Professor Lars Lundberg
Faculty of Computing
Blekinge Institute of Technology, Sweden
Faculty of Computing
Blekinge Institute of Technology
SE-371 79 Karlskrona, Sweden
Internet : www.bth.se
Phone : +46 455 38 50 00
Fax : +46 455 38 50 57

III
ABSTRACT
Context: Multi Mediation is a process of collecting data from network(s) & network elements, pre-
processing this data and distributing it to various systems like Big Data analysis, Billing Systems,
Network Monitoring Systems, and Service Assurance etc. With the growing demand for networks and
emergence of new services, data collected from networks is growing. There is need for efficiently
organizing this data and this can be done using databases. Although RDBMS offers Scale-up solutions to
handle voluminous data and concurrent requests, this approach is expensive. So, alternatives like
distributed databases are an attractive solution. Suitable distributed database for Multi Mediation, needs
to be investigated.
Objectives: In this research we analyze two distributed databases in terms of performance, scalability
and availability. The inter-relations between performance, scalability and availability of distributed
databases are also analyzed. The distributed databases that are analyzed are MySQL Cluster 7.4.4 and
Apache Cassandra 2.0.13. Performance, scalability and availability are quantified, measurements are
made in the context of Multi Mediation system.
Methods: The methods to carry out this research are both qualitative and quantitative. Qualitative
study is made for the selection of databases for evaluation. A benchmarking harness application is
designed to quantitatively evaluate the performance of distributed database in the context of Multi
Mediation. Several experiments are designed and performed using the benchmarking harness on the
database cluster.
Results: Results collected include average response time & average throughput of the distributed
databases in various scenarios. The average throughput & average INSERT response time results favor
Apache Cassandra low availability configuration. MySQL Cluster average SELECT response time is
better than Apache Cassandra for greater number of client threads, in high availability and low availability
configurations.
Conclusions: Although Apache Cassandra outperforms MySQL Cluster, the support for transaction
and ACID compliance are not to be forgotten for the selection of database. Apart from the contextual
benchmarks, organizational choices, development costs, resource utilizations etc. are more influential
parameters for selection of database within an organization. There is still a need for further evaluation of
distributed databases.
Keywords: Availability, Benchmarking, Distributed databases,
Performance, Scalability.

IV
ACKNOWLEDGMENTS
I am indebted to my advisor Prof. Lars Lundberg and his valuable ideas which helped in the
completion of this work. In fact he has guided on every crucial and important stages of this
research work.
I sincerely thank Prof. Markus Fiedler & Prof. Kurt Tutschku for their endless support during
the work.
I am grateful to Neeraj Garg, Sourab, Saket & Kulbir at Ericsson, for providing me necessary
equipment and helping me financially during my work.
To my family members and friends who one way or the other shared their support. Thank
you.
Above all I would like to thank the Supreme Personality of Godhead, the author of
everything.

V
LIST OF FIGURES
Figure 1.1: Architecture of Multi Mediation ............................................................................... 1 Figure 2.1: Data Sharding or Horizontal fragmentation ............................................................. 7 Figure 2.2: Vertical fragmentation .............................................................................................. 7 Figure 2.3: MySQL Cluster architecture ..................................................................................... 9 Figure 2.4: Example of Table in MySQL Cluster ....................................................................... 9 Figure 2.5: A record/row/tuple from Table shown in the Figure 2.4 ........................................ 10 Figure 2.6: A column/attribute from Table shown in the Figure 2.4. ....................................... 10 Figure 2.7: Cassandra peer-peer architecture ............................................................................ 11 Figure 2.8: Column in Apache Cassandra ................................................................................. 11 Figure 2.9: Row Structure in Apache Cassandra ...................................................................... 12 Figure 3.1: Database Schema .................................................................................................... 14 Figure 3.2: Physical topology ................................................................................................... 15 Figure 3.3: Only one contact from Client(s) ............................................................................. 16 Figure 3.4: Experiment-1 .......................................................................................................... 18 Figure 3.5: Experiment-2 part 1 ................................................................................................ 19 Figure 3.6: Experiment-2 part 2 ................................................................................................ 20 Figure 4.1: SELECT operations average response time ........................................................... 21 Figure 4.2: INSERT operations average response time ............................................................ 22 Figure 4.3: Average throughput for batch INSERT operations for different client threads. ..... 23 Figure 4.4: Average response time for event INSERT operations ............................................ 24 Figure 4.5: Average response time for SELECT operations ..................................................... 25 Figure 4.6: Average throughput for batch INSERT operations, on a four node cluster ............ 26 Figure 4.7: Average response time for event INSERT operations, on a four node cluster ....... 26 Figure 4.8: Average response time for event SELECT operations, on a four node cluster ...... 27

VI
LIST OF TABLES
Table 1: Average event SELECT response time in four node database cluster at workload mix of
50% INSERTS, 50% SELECTS ..................................................................................................... 34
Table 2: Average event INSERT response time in four node database cluster at workload mix of
50% INSERTS, 50% SELECTS ..................................................................................................... 34
Table 3: Average throughput for 5687680 batch INSERT operations at threads=1 ........................ 35
Table 4: Average throughput for 5687680 batch INSERT operations at threads=2 ........................ 35
Table 5: Average throughput for 5687680 batch INSERT operations at threads=4 ........................ 35
Table 6: Average throughput for 5687680 batch INSERT operations at threads=8 ........................ 36
Table 7: Average throughput for 5687680 batch INSERT operations at threads=16 ...................... 36
Table 8: Average response time considering 320000 event INSERT operations at threads=1 ....... 37
Table 9: Average response time considering 320000 event INSERT operations at threads=2 ....... 37
Table 10: Average response time considering 320000 event INSERT operations at threads=4 ..... 37
Table 11: Average response time considering 320000 event INSERT operations at threads=8 ..... 38
Table 12: Average response time considering 320000 event INSERT operations at threads=16 ... 38
Table 13: Average response time considering 320000 event SELECT operations at threads=1 ..... 39
Table 14: Average response time considering 320000 event SELECT operations at threads=2 ..... 39
Table 15: Average response time considering 320000 event SELECT operations at threads=4 ..... 39
Table 16: Average response time considering 320000 event SELECT operations at threads=8 ..... 40
Table 17: Average response time considering 320000 event SELECT operations at threads=16 ... 40
Table 18: Average throughput for 5687680 batch INSERT operations on four node database cluster
......................................................................................................................................................... 41
Table 19: Average response time considering 320000 event INSERT operations on four node
database cluster ................................................................................................................................ 42
Table 20: Average response time considering 320000 event SELECT operations on four node
database cluster ................................................................................................................................ 43

VII
ABBREVIATIONS
ACID Atomicity, Consistency, Isolation and Durability
API Application Program Interface
BUSS Business Unit Support Solutions
CAP Consistency, Availability & Partition tolerance
CDR Call Detail Record
CLI Command Line Interface
CPU Central Processing Unit
CQL Cassandra Query Language
DB Database
DBMS Database Management Systems
DDBMS Distributed Database Management Systems
DDL Data Definition Language
DHT Distributed Hash Tables
DML Data Manipulation Language
Gbps Gigabits per sec
HA High Availability
HS Horizontal Scaling
I/O Input/Output
JSON JavaScript Object Notation
JDBC Java Database Connectivity
JVM Java Virtual Machine
MA Moderate Availability
LA Low availability
NDB Network Database
NOSQL Not Only SQL
OS Operating System
RAM Random Access Memory
RDBMS Relational Database Management Systems
RHEL Red Hat Enterprise Linux
RQ Research Question
SQL Structured Query Language
SSD Solid State Drive
VS Vertical Scaling
XML Extensible Markup Language

VIII
Contents
ABSTRACT........................................................................................................................................... III
ACKNOWLEDGMENTS .................................................................................................................... IV
ABBREVIATIONS .............................................................................................................................. VII
1 INTRODUCTION ................................................................................................................................ 1
1.1 ERICSSON .............................................................................................................................................. 1 1.2 MULTI MEDIATION ............................................................................................................................... 1 1.3PROBLEM STATEMENT ........................................................................................................................... 2 1.4 MULTI MEDIATION DATABASE REQUIREMENTS ................................................................................... 2 1.5RESEARCH QUESTIONS .......................................................................................................................... 3 1.6 THESIS OUTLINE ................................................................................................................................... 3
2 BACKGROUND ................................................................................................................................... 4
2.1 DISTRIBUTED DATABASES DEFINITION & TERMINOLOGY ..................................................................... 4 2.1.1 Scalability ......................................................................................................................................... 4 2.1.2 Performance ..................................................................................................................................... 4 2.1.3 Availability ........................................................................................................................................ 5 2.2 DISTRIBUTED DATABASES HISTORY ..................................................................................................... 5 2.3 TYPES OF DATABASES .......................................................................................................................... 5 2.3.1 Relational Database Management Systems ...................................................................................... 5 2.3.2 Non-Relational Database Management Systems .............................................................................. 5 2.3.3 NewSQL database Systems ............................................................................................................... 6 2.4 DATA HANDLING IN DISTRIBUTED DATABASES ................................................................................... 7 2.4.1 Data Fragmentation ......................................................................................................................... 7 2.4.2 Data Replication ............................................................................................................................... 8 2.4.3 MySQL Cluster Architecture & Data Model .................................................................................... 8 2.4.4 Apache Cassandra Architecture & Data Model ............................................................................. 10 2.4.5 Replication and Fragmentation ...................................................................................................... 12
3 EXPERIMENTAL METHODOLOGY ............................................................................................ 14
3.1 DATABASE SCHEMA ........................................................................................................................... 14 3.2 HARDWARE & SOFTWARE SPECIFICATIONS ........................................................................................ 14 3.3 ARCHITECTURE MIDDLE GROUND ...................................................................................................... 15 3.4 DATA DISTRIBUTION .......................................................................................................................... 15 3.5 ASSUMPTIONS ..................................................................................................................................... 16 3.6 BENCHMARKING HARNESS ................................................................................................................. 16 3.6.1 Database Drivers ............................................................................................................................ 17 3.6.2 Type of Queries Performed in Benchmark ...................................................................................... 17 3.7 EXPERIMENTAL SETUP ........................................................................................................................ 18 3.7.1 Experiment-1 Setup & Procedure ................................................................................................... 18 3.7.2 Experiment-2 Setup & Procedure ................................................................................................... 19
4 RESULTS AND ANALYSIS ............................................................................................................. 21
4.1 RESULTS FROM EXPERIMENT-1 ........................................................................................................... 21 4.2 RESULTS FROM EXPERIMENT-2 ........................................................................................................... 22 4.2.1 Results from Experiment -2 part 1 .................................................................................................. 22 4.2.2 Results from Experiment 2 part 2 ................................................................................................... 25
5 DISCUSSIONS .................................................................................................................................... 28
5.1 RELATED WORKS ............................................................................................................................... 28 5.2 VALIDITY THREATS ............................................................................................................................ 29 5.2.1 Internal Validity Threats ................................................................................................................. 29 5.2.2 External Validity Threats ................................................................................................................ 29 5.2.3 Construct Validity Threats .............................................................................................................. 29 5.2.4 Conclusion Validity Threats ........................................................................................................... 29

IX
6 CONCLUSION AND FUTURE WORK .......................................................................................... 30
6.1 ANSWERING RESEARCH QUESTIONS ................................................................................................... 30 6.2 SUMMARY OF CONTRIBUTIONS ........................................................................................................... 31 6.3 LIMITATIONS ...................................................................................................................................... 31 6.4 FUTURE WORKS .................................................................................................................................. 31
REFERENCES ...................................................................................................................................... 32
APPENDIX A ......................................................................................................................................... 34

1
1 INTRODUCTION
This chapter gives an overview of entire thesis document and its organization. The research
work has been carried at Ericsson. Initially an introduction to Ericsson organization is presented
followed by Multi Mediation concepts, problem statement, Multi Mediation database
requirements, Research Questions, and the thesis outline.
1.1 Ericsson
Ericsson is one of the companies that shape the field of telecommunications. It has been
established in 1876 in Sweden. Ericsson has headquarters at Stockholm and functions in about
180 countries. Ericsson holds about 37,000 patents grants, its research interests are Radio Access
Technologies (HSPA, LTE, 5G etc.), Software Defined Networking, Cloud Networking,
routing, Multi Mediation, reliable networks, innovative solutions in GSM, IP networks, core
networks, energy efficient networks, etc. Forty percent of global mobile traffic runs through the
Ericsson supplied networks [1]. Telecommunications account for 55% of Ericsson net sales and
is chosen by half the operators around the world. Ericsson’s IT services is in worlds top ten IT
service providers. Ericsson BUSS (Business Unit Support Solutions) provide software based
solutions for Operation Support Systems, as well as solutions and services for the emerging m-
commerce ecosystem [2].
1.2 Multi Mediation
In a telecom environment the functions like Service Assurance, Billing, Service Control, and
Big Data analytics can be subsided with the concept of Multi Mediation. The process of
collecting raw data from the network(s) or its elements (SGSN, GGSN etc.), pre-processing this
data and distributing it for downstream systems in an intelligible and usable form is called Multi
Mediation [3] . The downstream systems (also called Multi mediation applications) can be Big
Data analysis, Billing Systems, Network Monitoring Systems, and Service Assurance etc. The
architecture of Multi Mediation is as shown in the Figure 1.1.
Figure 1.1: Architecture of Multi Mediation

2
With diverse ways to collect information from network(s) and diversity in the information
collected makes the Multi Mediation platform an extremely complex system. The data can be
periodic or aperiodic. Data can be Call Detail Records (CDRs), System up time, Power
consumption, Network health statistics etc. Each type of the data has its own format. The
collected data is pre-processed. Pre-processing may include one or more subsystems like
decoder/encoder, de-duplicator (duplicate detection), consolidator (consolidates data), value
router (routes different types of data to different subsystems), formatter (changes data format to
make it intelligible for Multi Mediation applications), log point (serves as a data log). This pre-
processing and storing of the data is done using databases. Then data is made available to
distributor which distributes data to Multi Mediation applications. So, the databases have an
integral role within the Multi Mediation systems.
The data collected from telecom environment that a Multi Mediation platform handles are
classified as follows.
Event Data: It is also called online data. Single query is submitted to database and awaited
response. Submission of multiple queries is done sequentially.
Batch Data: It is also called as offline data. Multiple queries are submitted to database, all at
once, as opposed to sequential submission of queries.
1.3 Problem Statement
The database which stores the data must be efficient within Mediation. Multi Mediation
applications impose a strict restriction on availability and performance of database within Multi
Mediation system. The restrictions are that, the Multi Mediation system must be highly available
and it must provide high performance. The concept of distributed databases handle these
imposed restrictions. They can increase the availability and also improve the performance when
scaled [4] and distributed database are much suitable for business needs [5].
Not all distributed databases available can ensure performance, availability and scalability
requirements in the same way or even could not handle the inter-relations among them in same
way. So there is a need of identifying appropriate distributed database for Multi Mediation
systems.
1.4 Multi Mediation Database Requirements
With the growing data and emergence of new Multi Mediation applications to serve users,
the requirements of Multi Mediation database are dynamic. However, future predictions about
the data in telecom environment have raised curtains for Multi Mediation requirements to be
formulated. Ericsson has formulated these requirements. Some of these requirements may seem
contrary to one another, but the database which matches most of these requirements is most
suitable. Requirements are as follows.
•Single distributed database for event as well as for batch data.
•Database is desired to be ACID compliant.
•Database must efficiently handle voluminous data.
•Database must be ready for cloud deployment.
•Database should be able to resist single/multipoint failures (Availability).
•Database must scale efficiently as new resources are added (Scalability).
•Database nodes must be in shared nothing architecture (Promotes availability)
•Equal reads and writes.

3
•Distributed reads and writes.
•Database could work as key value pair.
•Throughput of 50K Operations/sec is desired (Performance)
•Database must have a Java Interface.
•Distributed database must be Open Source.
Choosing an appropriate database from many available distributed databases, can be done by
benchmarking the databases to identify their suitability in this context. Benchmarking all the
databases against all the requirements is not possible, considering time constraints. So, databases
were selected for evaluation. The selection of distribution databases for evaluation was done
qualitatively by analyzing research articles and product documentations. Apart from
requirements for selection, other parameters like support available, dependence of performance
tuning are also considered. The distributed databases selected for evaluation are MySQL Cluster
7.4.4 & Apache Cassandra 2.0.13. We had also gone through other databases like Apache
CouchDB, Memcached, Scalaris, Apache HBase, ScaleDB & VoltDB.
1.5 Research Questions
The aim of this research is to answer the research questions as shown below. The research
questions are investigated in the context of Multi Mediation. RQ1, RQ2 & RQ3 are answered
using experimentation performed.
RQ1) What is the average response time behaviour of event data, for the two databases
considered?
RQ2) What is the effect on average throughput of batch data for two databases, considering
node scaling & availability configurations?
RQ3) What is the effect on average response time of event data for two databases, considering
node scaling & availability configurations?
1.6 Thesis Outline
Rest of the thesis is organized as mentioned below.
Chapter 2: It is about the background knowledge, it explains the concepts related to
distributed databases, popular types of distributed databases, various methods of handling data
in distributed databases, the architectures of MySQL Cluster and Apache Cassandra are also
discussed.
Chapter 3: It gives the details of experimentation conducted, schema that has been used,
hardware and software specifications of experimental setup, mitigation of architectural
diversities, assumptions, benchmarking harness & its details.
Chapter4: The results from the experimentation are presented in this chapter and these results
are also analyzed.
Chapter 5: The discussions about results, previous related works and validity analysis is
presented in this chapter.
Chapter 6: Conclusions drawn out of this research work, contributions, limitations and future
works which can extend this work, are presented in this chapter.

4
2 BACKGROUND
This chapter gives readers, the background knowledge about distributed databases. The
architectures and data models of both the databases are also discussed.
2.1 Distributed Databases definition & terminology
“A distributed database is a collection of multiple, logically interrelated databases
distributed over a computer network” [6]. A distributed database management system
(DDBMS) is then defined as the “software system that permits the management of the
distributed database and makes the distribution transparent to the users” [6]. In this thesis, the
term distributed database is used to represent combination of distributed database and DDBMS.
2.1.1 Scalability
The generic definition of the term is unavailable. The system is said to be scalable if its
performance model predicts that there are possible deployments that can be made to meet
required performance or load offered, within scalability limits. The limit beyond which the
required performance cannot be attained by the system even by adding resources is called
scalability limit.
Scalability in the context of distributed databases is classified in two ways. They are as
follows.
Vertical Scaling (VS): The offered amount of load is met or required performance is obtained
by increasing the hardware ability within the system. This is also called as Scale-up. This
approach is expensive and cannot be resilient, in case of single point failures.
Horizontal Scaling (HS): This is also called as Scale-out. The performance gains or offered
loads are met by adding greater number of machines.
2.1.2 Performance
Distributed databases performance can be categorized into two types, they are external and
internal performance measurements. Internal performance measurements, measure the
performance internally within the distributed database system. E.g. average number of nodes
accessed for distributed transactions, calculating average number of messages per sec for
distributed reads and writes, etc.
External performance measurements are end-user evaluation for distributed database. The
two common external perceivable metrics used in this thesis, for measuring the performance of
distributed databases are throughput & response time [7].
Throughput: It is ratio of total number of operations performed to the total time taken.
Response time: It is the amount of time taken to perform one single operation on the
distributed database.
5
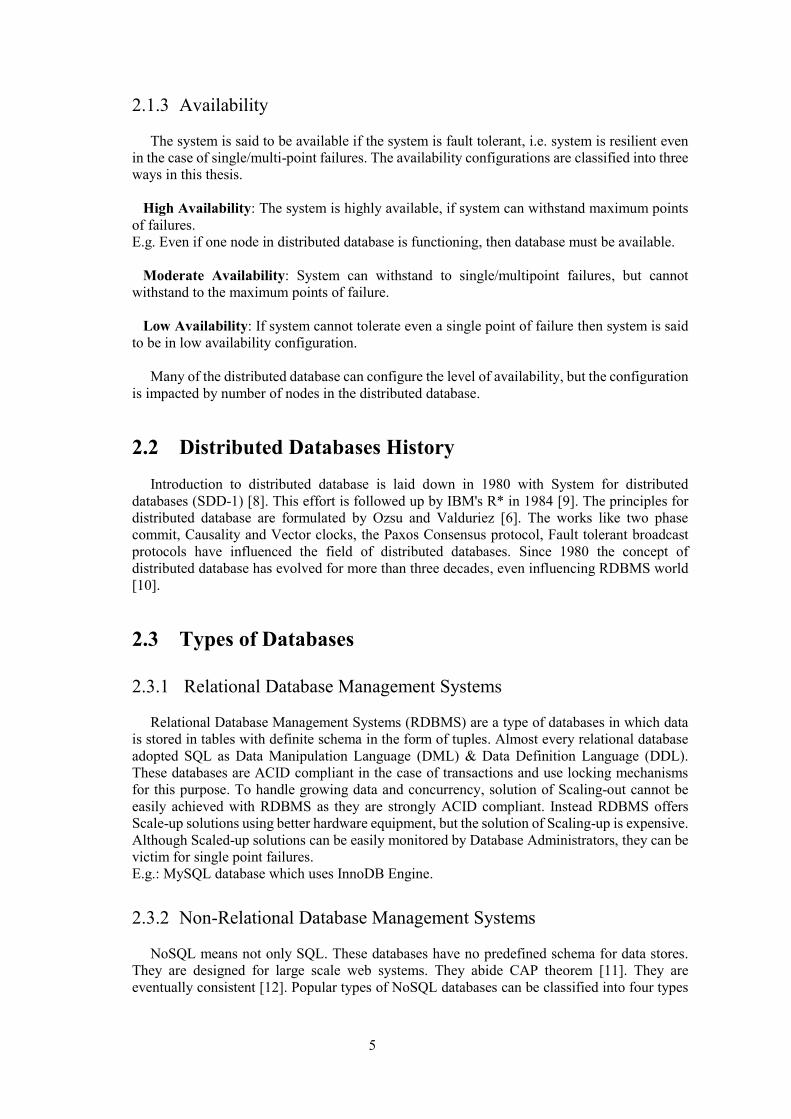
2.1.3 Availability
The system is said to be available if the system is fault tolerant, i.e. system is resilient even
in the case of single/multi-point failures. The availability configurations are classified into three
ways in this thesis.
High Availability: The system is highly available, if system can withstand maximum points
of failures.
E.g. Even if one node in distributed database is functioning, then database must be available.
Moderate Availability: System can withstand to single/multipoint failures, but cannot
withstand to the maximum points of failure.
Low Availability: If system cannot tolerate even a single point of failure then system is said
to be in low availability configuration.
Many of the distributed database can configure the level of availability, but the configuration
is impacted by number of nodes in the distributed database.
2.2 Distributed Databases History
Introduction to distributed database is laid down in 1980 with System for distributed
databases (SDD-1) [8]. This effort is followed up by IBM's R* in 1984 [9]. The principles for
distributed database are formulated by Ozsu and Valduriez [6]. The works like two phase
commit, Causality and Vector clocks, the Paxos Consensus protocol, Fault tolerant broadcast
protocols have influenced the field of distributed databases. Since 1980 the concept of
distributed database has evolved for more than three decades, even influencing RDBMS world
[10].
2.3 Types of Databases
2.3.1 Relational Database Management Systems
Relational Database Management Systems (RDBMS) are a type of databases in which data
is stored in tables with definite schema in the form of tuples. Almost every relational database
adopted SQL as Data Manipulation Language (DML) & Data Definition Language (DDL).
These databases are ACID compliant in the case of transactions and use locking mechanisms
for this purpose. To handle growing data and concurrency, solution of Scaling-out cannot be
easily achieved with RDBMS as they are strongly ACID compliant. Instead RDBMS offers
Scale-up solutions using better hardware equipment, but the solution of Scaling-up is expensive.
Although Scaled-up solutions can be easily monitored by Database Administrators, they can be
victim for single point failures.
E.g.: MySQL database which uses InnoDB Engine.
2.3.2 Non-Relational Database Management Systems
NoSQL means not only SQL. These databases have no predefined schema for data stores.
They are designed for large scale web systems. They abide CAP theorem [11]. They are
eventually consistent [12]. Popular types of NoSQL databases can be classified into four types

6
Key-Value stores, Document stores, Wide column stores, Graph databases. Each of them are
explained below.
2.3.2.1 Key-Value stores
Key-Value stores relate with the old concept of hash tables or maps where key is used to store
or retrieve values. The concept of distributed hash tables (DHT) are used by Key-Value stores.
They are designed for simple read/write queries. They provide scalability and performance. As
opposed to RDBMS which are strongly consistent, Key-Value stores attain eventual
consistency. However eventual consistency is handled using vector clocks for conflict
resolution.
E.g. Apache Cassandra [13]
2.3.2.2 Document stores
Document stores are similar to Key-Value stores, where Values use formats like JSON or
XML (called documents). Document stores schema is said to be flexible means the schema can
change over time. They are suitable for processing complex queries.
E.g. CouchDB
2.3.2.3 Wide Column stores.
They are also called column oriented database systems. Most influential in this is Google’s
Big Table [14]. They support multidimensional maps (maps of maps) hence nested data models.
Rows can have arbitrary number of columns in each column family. These databases in general
provide better performance than Key-Values stores in terms of indexing and querying [15].
E.g. HBase
2.3.2.4 Graph database
They rely on graph theory. They use graph structures to model data. Nodes contain data and
edges describe the relationships. They are most widely used in location based services. They
support multiple relationships between entities. They purely are an associated data structures,
so they do not need any primary keys. They are often faced upon by scalability challenges.
E.g.: Neo4j
2.3.3 NewSQL database Systems
NewSQL is distributed version of RDBMS systems, on shared nothing nodes. These
databases are scalable and have performance comparable with NoSQL databases. Almost all the
properties of RDBMS are retained in NewSQL databases including ACID transaction support.
They share SQL as the interface to various applications.
E.g.: MySQL Cluster

7
2.4 Data Handling in Distributed Databases
2.4.1 Data Fragmentation
Data fragmentation is a process of breaking data into small manageable fragments and storing
across multiple nodes. Databases fragment data in three ways, described as follows.
2.4.1.1 Data sharding or horizontal fragmentation
Data sharding is a process of horizontally fragmenting data into disjoint fragments. Each
fragment is a subset of tuples within the database. The fragments are stored at different nodes.
The process of horizontal fragmentation of data is shown in the Figure 2.1.
Figure 2.1: Data sharding or horizontal fragmentation
2.4.1.2 Vertical fragmentation
Vertical fragmentation is process of splitting data, based on columns and storing these
fragments at different nodes. The process of vertical fragmentation of data is shown in the Figure
2.2.
Figure 2.2: Vertical fragmentation
2.4.1.3 Data partitioning
Data partitioning is often confused with data sharding, in this different tables of data are
stored at different nodes.

8
In many distributed databases one or more of these approaches are used. These approaches
increases the performance of the databases as each of the nodes handle only a portion of data as
opposed to centralized system, where the entire data is stored as a single fragment and in one
node.
2.4.2 Data Replication
The data in one node is cloned in multiple nodes so to resist single/multi-point failures,
thereby increasing availability [10]. Using data replication strategies, databases will be resilient
in the event of failure of one or more nodes. Generally databases use two types of replication
strategies, as explained below.
2.4.2.1 Synchronous replication
In Synchronous replication, modification in one replica will update all other replicas before
returning to application which caused the modification. It is also called as eager application.
Data will be always consistent with this type of replication. With more replicas present in the
system there will be profound impact on performance of database.
E.g. MySQL Cluster 7.4.4
2.4.2.2 Asynchronous replication
In Asynchronous replication, modification in one replica will return immediately and
modification propagation will be started. Asynchronous replication is also called as lazy
application [16]. Data in the database may be inconsistent with other replicas since all
replication updates cannot happen within the same time. Some mitigations for consistency issues
can be like if queries are redirected to node which makes first update, meanwhile the
asynchronous update happens in rest of the other nodes. As all replicas could not update with
same speed, data consistency issues tie up with slowest update node.
E.g. Apache Cassandra 2.0.13
2.4.3 MySQL Cluster Architecture & Data Model
2.4.3.1 MySQL Cluster architecture
MySQL Cluster is a shared nothing system. Shared nothing in the sense that all the node in
the cluster has their own disk and RAM. MySQL Cluster uses in-memory persistence engine
called Network database (NDB). The architecture of MySQL Cluster is shown in the Figure 2.3.
All the nodes in MySQL Cluster must be homogenous even the bandwidth between them must
be same. The nodes in MySQL cluster are classified as Data nodes, SQL nodes, Management
nodes [17].
Data Nodes (ndbd): They are the nodes that actually contain the data. All the tables are stored
in data nodes. Data is uniformly distributed across data nodes and uneven distribution of data is
not supported.
SQL Nodes (mysqld): The data present in the data nodes is only accessible through SQL
nodes in the cluster. It is also called as API node. SQL is used to access the information.

9
Management Nodes (ndb_mgmd): Management nodes are responsible for performing
management functions like configuration provisioning, starting or stopping nodes, running
backup etc. This is the first node to be started in the cluster.
Figure 2.3: MySQL Cluster architecture
So by above MySQL Cluster has hierarchical architecture for data access.
2.4.3.2 Data model
Data in MySQL Cluster is organized in the form of tables. Each table in MySQL Cluster has
a predefined schema. The following describe the basic terminology of data model in MySQL
Cluster.
Database: It is collection of one or more tables.
Table: Table contains set of rows/records/tuples which are related as shown in the Figure 2.4.
Figure 2.4: Example of table in MySQL Cluster
Primary Key: It is used to uniquely identify a record/tuple/row in a table. ID is primary key
in the table shown in the Figure 2.4.

10
Record/row/tuple: An entry in the table, it is defined by a set of attributes/columns.
Considering table in Figure 2.4, record can be an entry with in the table as shown in Figure 2.5.
Figure 2.5: A record/row/tuple from table shown in the Figure 2.4
Columns/attributes: It is a vertical entity that contains all the information about the
records. A column from Figure 2.4 is given in the Figure 2.6.
Figure 2.6: A column/attribute from table shown in the Figure 2.4.
2.4.4 Apache Cassandra Architecture & Data Model
2.4.4.1 Apache Cassandra architecture
Apache Cassandra is a shared nothing system. Every node in Cassandra is equal, inter-
connections assume a ring topology, as shown in the Figure 2.7. Nodes can be non-homogenous
in Apache Cassandra. Node in Apache Cassandra will be termed as Cassandra node just to avoid
confusion. Data distribution can be configurable, data can be unevenly distributed across
Cassandra nodes.
Cassandra Node: Cassandra nodes contain data. Data can be accessed by connecting to any
of Cassandra nodes using Cassandra Query Language (CQL).
Datacenter: Datacenter can have one or more Cassandra nodes, replication can be set within
a datacenter.
Seed nodes: These are nodes that are used to discover other Cassandra nodes within the
cluster. One or more Cassandra nodes can act as seed nodes.

11
Figure 2.7: Cassandra peer-peer architecture
So Cassandra's architecture is peer to peer, for data access.
2.4.4.2 Data model
Apache Cassandra data store has customizable schema [18], as shown in the Figure 2.9. The
following describe the basic terminology of data model in Apache Cassandra.
Column: It is basic unit of information and is expressed in form of Name: Value: Timestamp
as shown in the Figure 2.8.
Figure 2.8: Column in Apache Cassandra
Row: Row groups column values together. Every row is uniquely identified by the row key.
Row key is analogous to Primary Key in MySQL Cluster. The structure of row in Apache
Cassandra is shown in Figure 2.9.

12
Figure 2.9: Row Structure in Apache Cassandra
Column family: Keyed rows are grouped together to form column families, it is analogous to
table in MySQL Cluster.
Keyspace: Group of column families form a keyspace. Replication and data distribution
strategy can be configured at keyspace level, it is analogous to database in MySQL Cluster.
2.4.5 Replication and Fragmentation
2.4.5.1 Fragmentation & replication in MySQL Cluster
Number of data shards in MySQL Cluster is shown below. Before understanding
fragmentation & replication in MySQL we will see about node groups.
𝑁𝑢𝑚𝑏𝑒𝑟 𝑜𝑓 𝑑𝑎𝑡𝑎 𝑠ℎ𝑎𝑟𝑑𝑠 = 𝑁𝑢𝑚𝑏𝑒𝑟 𝑜𝑓 𝑑𝑎𝑡𝑎 𝑛𝑜𝑑𝑒𝑠
Node Groups: A node group is a group of one or more data nodes that stores one or more
data shards [19]. The data shards allocated to the node group is replicated within the node group.
Number of Node groups in MySQL Cluster is given by formula as shown below. All node groups
contain equal Number of data nodes.
𝑁𝑢𝑚𝑏𝑒𝑟 𝑜𝑓 𝑁𝑜𝑑𝑒 𝑔𝑟𝑜𝑢𝑝𝑠 = 𝑁𝑢𝑚𝑏𝑒𝑟 𝑜𝑓 𝑑𝑎𝑡𝑎 𝑛𝑜𝑑𝑒𝑠 𝑁𝑢𝑚𝑏𝑒𝑟 𝑜𝑓 𝑅𝑒𝑝𝑙𝑖𝑐𝑎𝑠⁄
Number of Replicas is the total number of data clones within the cluster and this parameter
can be configured. However, the Number of Node groups must be a natural number, for a given
Number of data nodes. Changing the Number of Replicas leads to various availability
configurations.
Primary Replica: The data shard itself is called as primary replica. Each data node in the
cluster has at least one primary replica assigned to it.
Backup Replica: A copy of primary replica is backup replica. Apart from the primary replica
depending on number of nodes within a node group, zero or more backup replicas are stored on
each node.
High Availability configuration: In high availability configuration, Number of Replicas in
database cluster is equal to the Number of data nodes in the cluster. So, there is only one node
group, with all data nodes belonging to this one node group. As the data shards allocated to the

13
node group are replicated within a node group, all the data nodes in the node group contain same
data. This configuration is called high availability configuration.
Moderate Availability configuration: In moderate availability configuration, each node
group contains multiple data nodes but not all data nodes. Data is available only when at least
one data node in every node group is functional. The range of Number of Replicas is as shown
below.
1< 𝑁𝑢𝑚𝑏𝑒𝑟 𝑜𝑓 𝑅𝑒𝑝𝑙𝑖𝑐𝑎𝑠 < 𝑁𝑢𝑚𝑏𝑒𝑟 𝑜𝑓 𝑑𝑎𝑡𝑎 𝑛𝑜𝑑𝑒𝑠
As mentioned earlier, Number of Node groups must be a natural number this limits the
numbers possible Number of Replicas selectable within this range.
Low Availability configuration: In low availability configuration, Number of Replicas in
database cluster is set to one. So, Number of Node groups is equal to the Number of data nodes
in the cluster and each node group contains only one data node. There are no backup replicas as
each node groups contain exactly one data node. Failure of any one data node will lead to loss
of data shard resulting in unavailability.
2.4.5.2 Fragmentation & replication in Apache Cassandra
Apache Cassandra uses row key as an input to hash algorithm to partition the data. Number of
data shards in Apache Cassandra is given by formula as shown below.
𝑁𝑢𝑚𝑏𝑒𝑟 𝑜𝑓 𝑑𝑎𝑡𝑎 𝑠ℎ𝑎𝑟𝑑𝑠 = 𝑁𝑢𝑚𝑏𝑒𝑟 𝑜𝑓 𝐶𝑎𝑠𝑠𝑎𝑛𝑑𝑟𝑎 𝑛𝑜𝑑𝑒𝑠
The size of each shard stored in each node can be changed, allowing uneven distribution of
data across Cassandra nodes. This can be done using uneven token distribution across Cassandra
nodes.
Replication in Cassandra depends on Replication factor, which is determined at keyspace
level. Based on the Replication factor each shard and replica shards are placed clock wisely on
Cassandra ring. Replication factor in Cassandra is analogous to Number of Replicas in MySQL
Cluster. Replication factor cannot exceed Number of Cassandra nodes.
High Availability configuration: In high availability configuration, Replication factor is
equal to the Number of Cassandra nodes in the cluster.
Moderate Availability configuration: In moderate availability configuration, the range of
Replication factor is shown below.
1< 𝑅𝑒𝑝𝑙𝑖𝑐𝑎𝑡𝑖𝑜𝑛 𝑓𝑎𝑐𝑡𝑜𝑟 < 𝑁𝑢𝑚𝑏𝑒𝑟 𝑜𝑓 𝐶𝑎𝑠𝑠𝑎𝑛𝑑𝑟𝑎 𝑛𝑜𝑑𝑒𝑠
Low Availability configuration: In low availability configurations, the Replication factor is
set to one. There is no replicated data, thereby causing unavailability in case of any failure.
14
3 EXPERIMENTAL METHODOLOGY
To draw out conclusions from the results, the databases chosen must be comparable, in order
to do that both the databases must be drawn to a middle ground for comparison. The following
sections show how major dissimilarities among the databases are mitigated and also explain the
experimental setup.
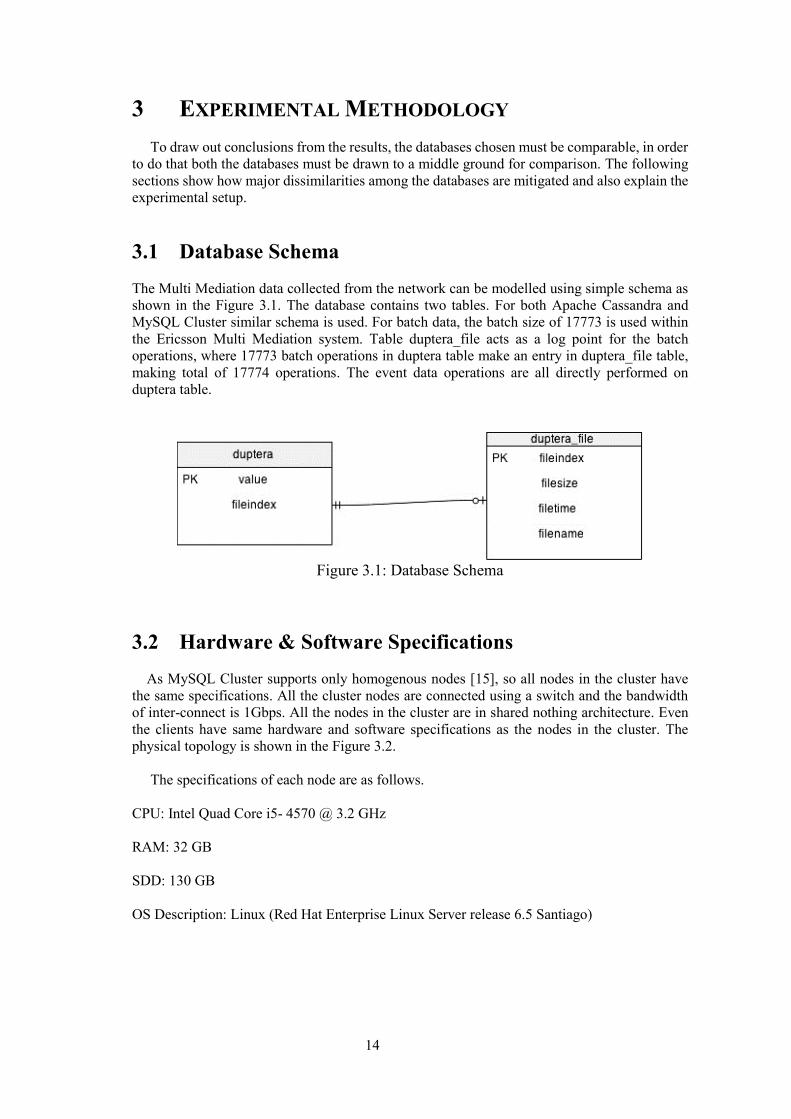
3.1 Database Schema
The Multi Mediation data collected from the network can be modelled using simple schema as
shown in the Figure 3.1. The database contains two tables. For both Apache Cassandra and
MySQL Cluster similar schema is used. For batch data, the batch size of 17773 is used within
the Ericsson Multi Mediation system. Table duptera_file acts as a log point for the batch
operations, where 17773 batch operations in duptera table make an entry in duptera_file table,
making total of 17774 operations. The event data operations are all directly performed on
duptera table.
Figure 3.1: Database Schema
3.2 Hardware & Software Specifications
As MySQL Cluster supports only homogenous nodes [15], so all nodes in the cluster have
the same specifications. All the cluster nodes are connected using a switch and the bandwidth
of inter-connect is 1Gbps. All the nodes in the cluster are in shared nothing architecture. Even
the clients have same hardware and software specifications as the nodes in the cluster. The
physical topology is shown in the Figure 3.2.
The specifications of each node are as follows.
CPU: Intel Quad Core i5- 4570 @ 3.2 GHz
RAM: 32 GB
SDD: 130 GB
OS Description: Linux (Red Hat Enterprise Linux Server release 6.5 Santiago)

15
Figure 3.2: Physical topology
3.3 Architecture Middle Ground
As seen in section 2.4.3 & 2.4.4 the architecture of MySQL Cluster is hierarchical and
Apache Cassandra is peer to peer. In order to compare them both of them must have common
architectural base. For E.g. Apache Cassandra with four Cassandra nodes need just four nodes
in total. Whereas MySQL Cluster with four data nodes will need six total number of nodes, as
at least one management node and one SQL node are needed. Comparison in this configuration
is not valid as the latter has more resources. So to overcome these type of problems, SQL node
and Management node in MySQL Cluster are made to run on one of the data nodes, this makes
total of four nodes making it comparable with Apache Cassandra. One of the data node have
SQL node and Management node running on it, this approach cannot over burden the node as
the Management node consumes minimal amount of resources after the cluster initialization.
The contact nodes for both databases clusters, from the client(s) is, only one. This is shown in
the Figure 3.3. Client(s) can only communicate with contact nodes.
3.4 Data Distribution
As stated in section 2.4.3.1, MySQL Cluster supports even distribution of data across the
data nodes. The distribution of data in Apache Cassandra is dependent on number of tokens
assigned to each Cassandra node. Apache Cassandra is configured in such a way that the token
space is equally divided among the nodes, in this way the Apache Cassandra is made to
distribute data evenly across Cassandra nodes.

16
Figure 3.3: Only one contact from Client(s)
3.5 Assumptions
Availability configuration depends on number of nodes in the database cluster, the
availability configurations only apply for two or more nodes in the cluster. Considering one
node in distributed database we have classified it under low availability configuration as well as
high availability configuration, because in high availability configuration at least one node in
distributed database must be working. So availability configuration for node one is represented
as both high availability and low availability.
3.6 Benchmarking Harness
Database benchmarking tools like YCSB [20], HammerDB [21], etc. have not been built in
the context of Multi Mediation. So, benchmarking harness program is developed. Java
programming language (Java SE development kit 8 [22]) is used for building benchmarking
harness. Appropriate latest drivers are used for interfacing with respective distributed databases.
The benchmarking harness application developed, takes various arguments as detailed below.
Client thread count: Number of concurrent requests submitted to database cluster.
Number of operations per thread: Number of operations to be performed for each thread.
Database credentials: Application connect to database cluster based on database credentials.
Type of Query: Type of Query submitted to database cluster.
Seed numbers: Two numbers, fileindex and value. The range of fileindex & value numbers
are internally divided among multiple threads so that they do not overlap. The value number is
incremented for every operation performed on the database as it is primary key.
After each benchmarking harness, the state of database is restored by dropping database
tables or populating tables accordingly.
17
Benchmark harness measures time spent for each benchmark. For time measurements
difference between start time and end time is obtained with the degree of millisecond accuracy
using method System.currentTimeMillis(). In case of any error, the errors are
displayed and benchmarking harness fails. To improve the reliability of the results obtained the
benchmark harness is run for three times and the average calculated from these three attempts
is taken into consideration.
3.6.1 Database Drivers
To connect to the databases corresponding latest Java drivers have been used. The drivers
used are as follows.
3.6.1.1 MySQL Connector/J
The MySQL Connector/J provides connectivity for client applications using Java
programming language, it implements JDBC API [23]. The version of driver used for
connection is 5.1.24. Connection is established using class DriverManager as shown below.
DriverManager.getConnection("jdbc:mysql:loadbalance://"+ip+":"+
port+"/"+dbname,login,password);
3.6.1.2 Datastax Java Driver
Datastax Java driver has been used to connect to Apache Cassandra. It can pass CQL
commands from client to Apache Cassandra cluster to retrieve, manipulate or remove data. The
version of driver used is 2.1.3. Connection is established as shown below.
cluster=Cluster.builder().withPort(Integer.parseInt(port)).
addContactPoints(ip).build();
cluster.connect(dbname);
3.6.2 Type of Queries Performed in Benchmark
As the Multi Mediation system must deliver high performance, queries used by Multi-
Mediation platform are simple queries. Only three types of queries are performed by Multi-
Mediation system. They are event INSERT or SELECT & batch INSERT.
The queries used for an event INSERT and SELECT in SQL are shown below, similar
queries are used in CQL for Apache Cassandra. For event operations fileindex value is
incremented for each operation performed on database.
INSERT INTO duptera VALUES ( <value>,<fileindex>);
SELECT * FROM duptera WHERE value=<primary key>;
The query used for batch INSERT is done using addBatch() method in corresponding
database drivers. For batch operations a log point entry is made in duptera_file table for every
17773 entries in duptera table. The query for log point entry in duptera_file table is as shown
below. For batch INSERT operations the <fileindex> value is incremented for every 17773
operations. The <filename> is made to store <filetime> in string format.

18
INSERT INTO duptera_file (filesize,fileindex,filetime,filename) VALUES (17773, <fileindex>,
<filetime>, <filename>);
Queries are made using synchronous calls, as both the databases Java driver supports these.
Moreover it aids the measurement of response time saving boundaries between queries.
3.7 Experimental Setup
This part describes the experimental setup and procedures used for experimentation. Before
performing INSERT (event/batch) operations, the database is ensured that it does not contain
any data. Before running event SELECT operations, the database is populated using event
INSERT operations.
3.7.1 Experiment-1 Setup & Procedure
Experiment-1 is shown in the Figure 3.4. This experiment is performed on four node database
cluster to find the event INSERT and SELECT response time. Workload imposed is 50%
INSERTS & 50% SELECTS, for the total number of operations. The desired workload could
have been implemented from a single client, but it cannot reflect the practical scenario. So, the
desired workload is imposed by two different clients, Client A & Client B. The availability
configuration is left to default configuration, i.e. moderate availability configuration.
Figure 3.4: Experiment-1
Client A makes SELECT queries and Client B makes INSERT queries to the database cluster.
Benchmarking harness program is run on both Client A and B but with different query type
argument. Client A and Client B are started simultaneously. Also the individual client side
thread count is varied from 1 to 16, by increasing the thread count by a factor of 2. After
performing every benchmark harness the databases state is restored. Each harness is repeated

19
for three times and the average INSERT response time and average SELECT response time are
calculated from these repetitions.
Number of operations performed by clients on database cluster are as follows.
Number of event SELECT operations performed by Client A= 160000 (50%)
Number of event INSERT operations performed by Client B=160000 (50%)
Total number of operations performed on database cluster=320000 (100%)
3.7.2 Experiment-2 Setup & Procedure
This experiment is divided into two parts. Common Availability configuration for both
databases (MySQL Cluster 7.4.4 and Apache Cassandra 2.0.13) are taken into account for
evaluation. Thread count is varied from 1 to 16, doubling each time. The experiments are
performed to measure throughput of batch INSERT operations and response time of event
operations, considering scaling & availability.
3.7.2.1 Experiment -2 part 1
The experiment setup is as shown in the Figure 3.5. The client performs only one of batch
INSERT/event INSERT or SELECT queries in exclusion by running benchmarking harness.
This can be thought of 100% workload. High availability & low availability configurations are
common for 1,2,3,4 node clusters, so they are taken into account. The benchmarking is repeated
changing the number of nodes in the cluster, for these availability configurations and various
thread counts. Each harness is repeated three times, restoring the state of database every time.
Average of three repetitions is taken as metric of measurement.
Figure 3.5: Experiment-2 part 1

20
Number of operations performed by client on database cluster are as follows.
Number of batch INSERT operations performed by Client = 5687680
Number of event INSERT operations performed by Client= 320000
Number of event SELECT operations performed by Client = 320000
3.7.2.2 Experiment -2 part 2
The experiment setup is as shown in the Figure 3.6. The number of nodes in distributed
database is maintained at four. For four number of nodes in the cluster three common availability
configurations are supported by both databases, they are high availability, moderate availability
& low availability. The client performs only one of batch INSERT/event INSERT or SELECT
queries in exclusion by running benchmarking harness. This can be thought of 100% workload.
The benchmarking is repeated for various thread counts for three availability configurations.
Each harness is repeated three times, restoring the state of database every time. Average of three
repetitions is taken as metric of measurement.
Number of operations performed by client on database cluster are as follows.
Number of batch INSERT operations performed by Client = 5687680
Number of event INSERT operations performed by Client= 320000
Number of event SELECT operations performed by Client = 320000
Figure 3.6: Experiment-2 part 2

21
4 RESULTS AND ANALYSIS
The results obtained during experimentation are showcased in this section. The results are
displayed using graphs, to aid analysis. MySQL cluster and Apache Cassandra are called as
MySQL & Cassandra for simplicity. Some of the statements in this section are not obvious
unless the supporting tables for the graphs (given in Appendix A) are viewed.
4.1 Results from Experiment-1
From Experiment -1 the Average SELECT response times for event operations are obtained
at the imposed workload of 50% INSERTS & 50% SELECTS. The graph is plotted based on
the results in Table 1. Number of operations performed by clients on database cluster are as
follows.
Number of event SELECT operations performed by Client A= 160000 (50%)
Number of event INSERT operations performed by Client B=160000 (50%)
Total number of operations performed on database cluster=320000 (100%)
As shown in the Figure 4.1, Cassandra’s average SELECT response time is lower than
MySQL at lower Threads/Client. But average SELECT response time of MySQL is lower than
Cassandra, at 16 Threads/Client.
Figure 4.1: SELECT operations average response time
Average INSERT response time observed from the same experiment is shown in the Figure
4.2. The graph is plotted based on results in Table 2.
Cassandra’s average INSERT response time is always lower than MySQL. The increase in
average INSERT response time from 8 to 16 threads, is more in Cassandra than MySQL.

22
Figure 4.2: INSERT operations average response time
4.2 Results from Experiment-2
Experiment takes various common availability configurations in to account. Simplified
notations used in explanation and graphs are as follows.
Low availability configuration is denoted using “LA”.
High Availability configuration is denoted using “HA”.
Moderate Availability configuration is denoted using “MA”.
Average throughput is called throughput.
Average event INSERT response time is called INSERT response time.
Average event SELECT response time is called as SELECT response time.
Client thread count is called as thread count.
Number of nodes in cluster is called as number of nodes.
4.2.1 Results from Experiment -2 part 1
In Experiment-2 part 1, three type of queries are performed by the client in exclusion. So, for
each type of query graphs has been plotted seperatly aiding analysis of results.
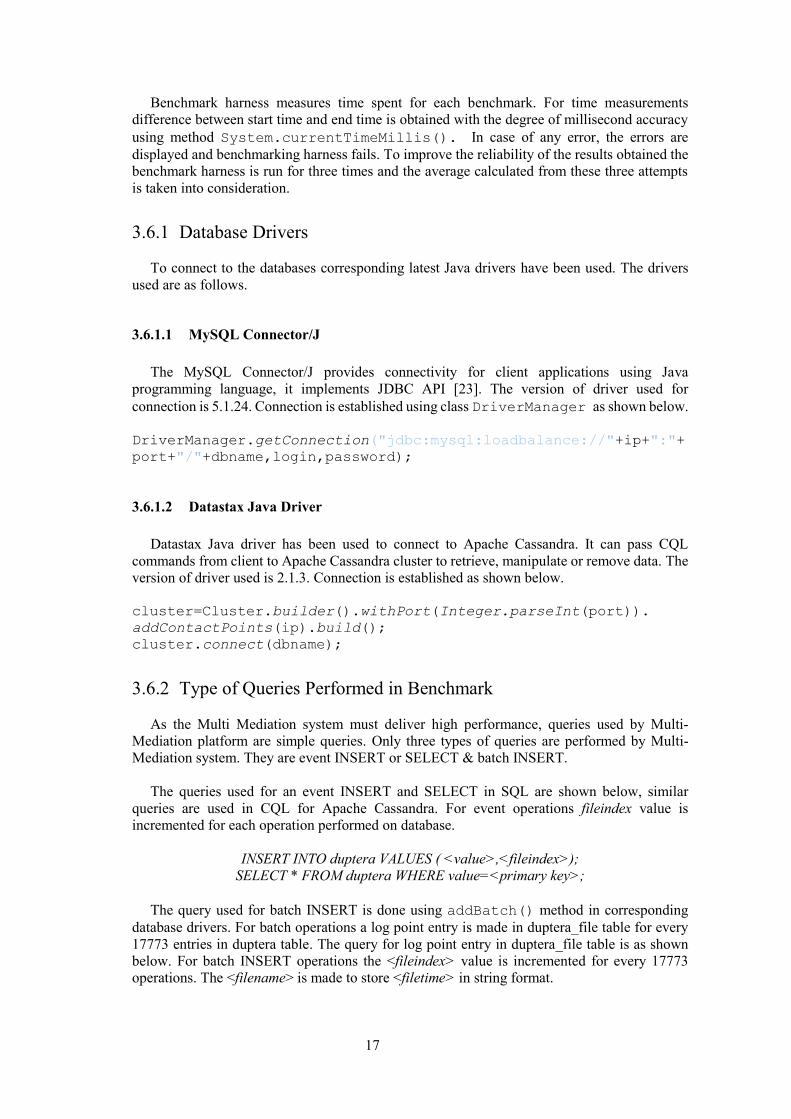
4.2.1.1 Batch INSERT Operations throughput
Average throughput for batch INSERT operations is show in the Figure 4.3. And the
supporting tables are shown in Table 3 to Table 7. Number of operations performed by client
on database cluster are as follows.
Number of batch INSERT operations performed by Client = 5687680
The throughput of Cassandra LA at all the thread counts is found to be increasing when
scaled. The throughput of Cassandra HA has irregular pattern when scaled, seems to be
23
dependent on number of nodes and thread counts. Irrespective of thread count the throughput of
Cassandra LA is always higher than Cassandra HA, condsidering scaling.
At lower thread count, the throughput of MySQL LA and HA increases as nodes are scaled.
Also the throughput of MySQL LA is higher than the MySQL HA. At higher thread count, LA
and HA of MySQL have almost the same throughput even when nodes are scaled.
Cassandra LA & HA have better throughput compared with MySQL LA & HA, irrespective
of thread counts. The throughput gains when nodes are scaled are higher in Cassandra over
MySQL.
Figure 4.3: Average throughput for batch INSERT operations for different client threads
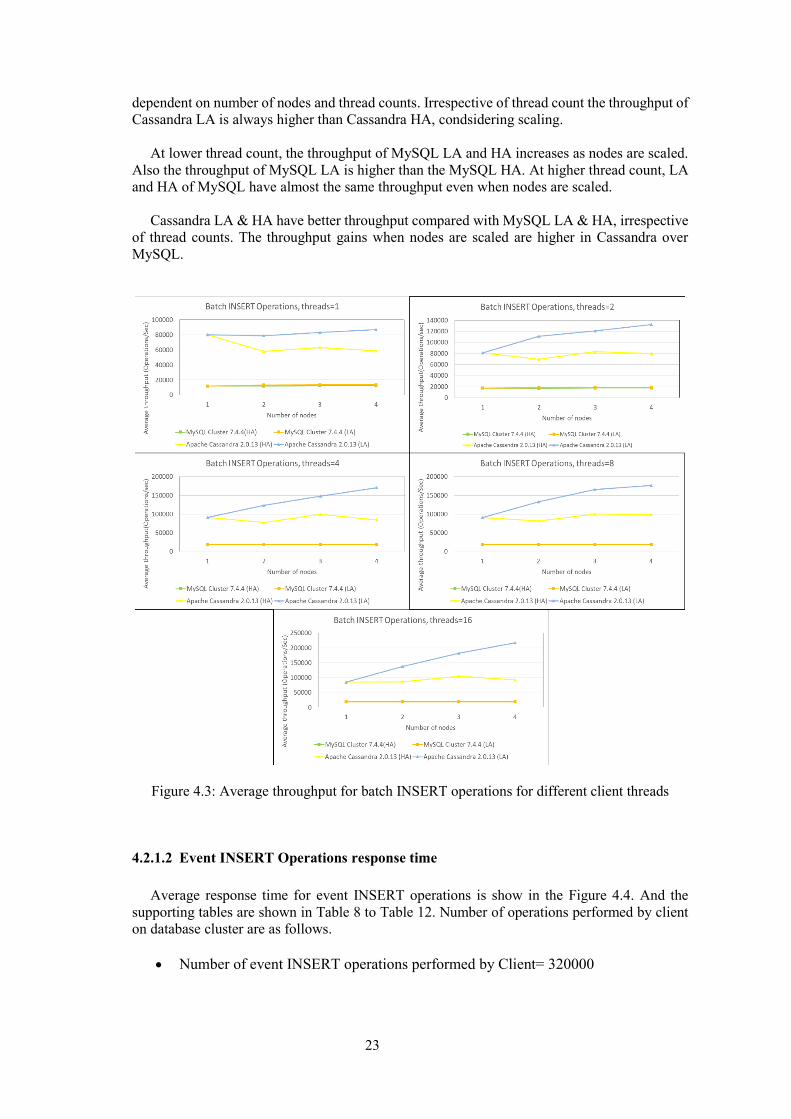
4.2.1.2 Event INSERT Operations response time
Average response time for event INSERT operations is show in the Figure 4.4. And the
supporting tables are shown in Table 8 to Table 12. Number of operations performed by client
on database cluster are as follows.
Number of event INSERT operations performed by Client= 320000

24
Response time of Cassandra HA is better than LA, for lower threads. Cassandra LA
configuration has better response time than HA at thread count of 16.
At all thread counts, MySQL HA & LA has increasing response times as the nodes are scaled.
Response time of MySQL LA is better than HA irrespective of thread counts.
Response time of Cassandra is lower than MySQL for both HA & LA, irrespective of thread
counts.
Figure 4.4: Average response time for event INSERT operations
4.2.1.3 Event SELECT Operations response time
Average response time for event SELECT operations is show in the Figure 4.5. And the
supporting tables are shown in Table 13 to Table 17. Number of operations performed by client
on database cluster are as follows.
Number of event SELECT operations performed by Client = 320000
In Cassandra HA & LA, response time for SELECT operations seems to be dependent on
number of nodes and thread counts.
At all thread counts, MySQL HA & LA, response time for SELECT operations increases as
the number of nodes are increased. At all thread counts MySQL LA & HA has almost same
SELECT response time.
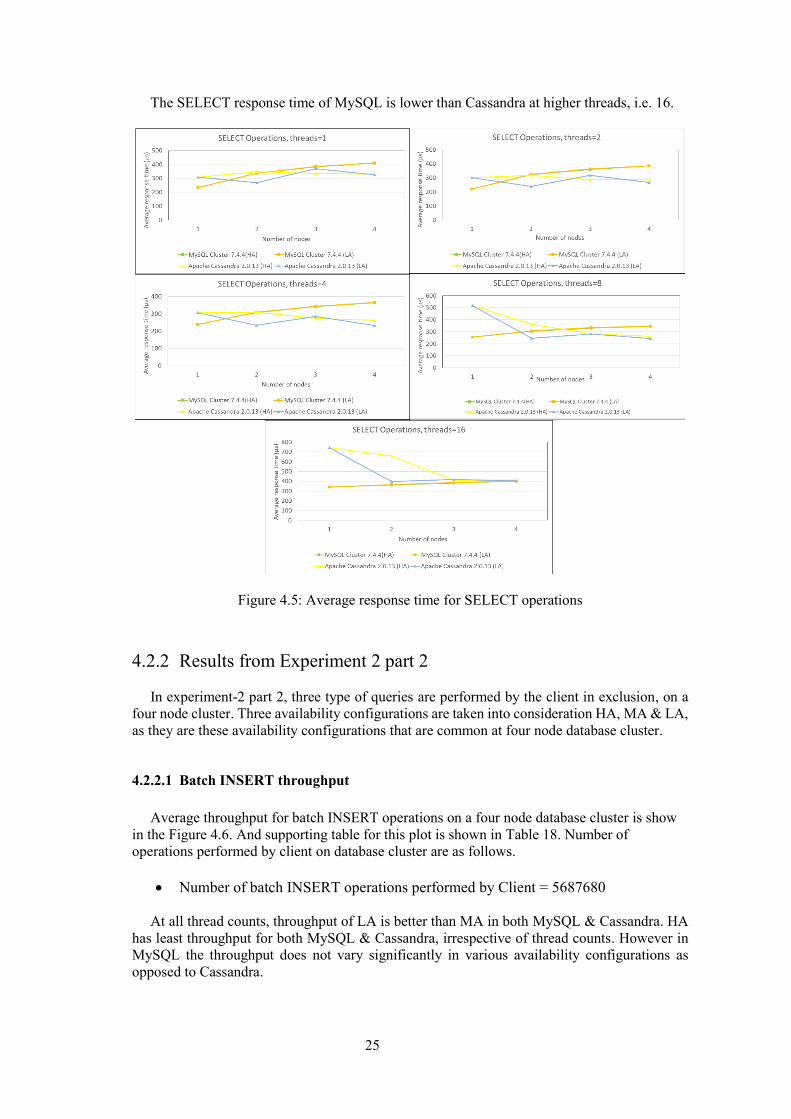
25
The SELECT response time of MySQL is lower than Cassandra at higher threads, i.e. 16.
Figure 4.5: Average response time for SELECT operations
4.2.2 Results from Experiment 2 part 2
In experiment-2 part 2, three type of queries are performed by the client in exclusion, on a
four node cluster. Three availability configurations are taken into consideration HA, MA & LA,
as they are these availability configurations that are common at four node database cluster.
4.2.2.1 Batch INSERT throughput
Average throughput for batch INSERT operations on a four node database cluster is show
in the Figure 4.6. And supporting table for this plot is shown in Table 18. Number of
operations performed by client on database cluster are as follows.
Number of batch INSERT operations performed by Client = 5687680
At all thread counts, throughput of LA is better than MA in both MySQL & Cassandra. HA
has least throughput for both MySQL & Cassandra, irrespective of thread counts. However in
MySQL the throughput does not vary significantly in various availability configurations as
opposed to Cassandra.
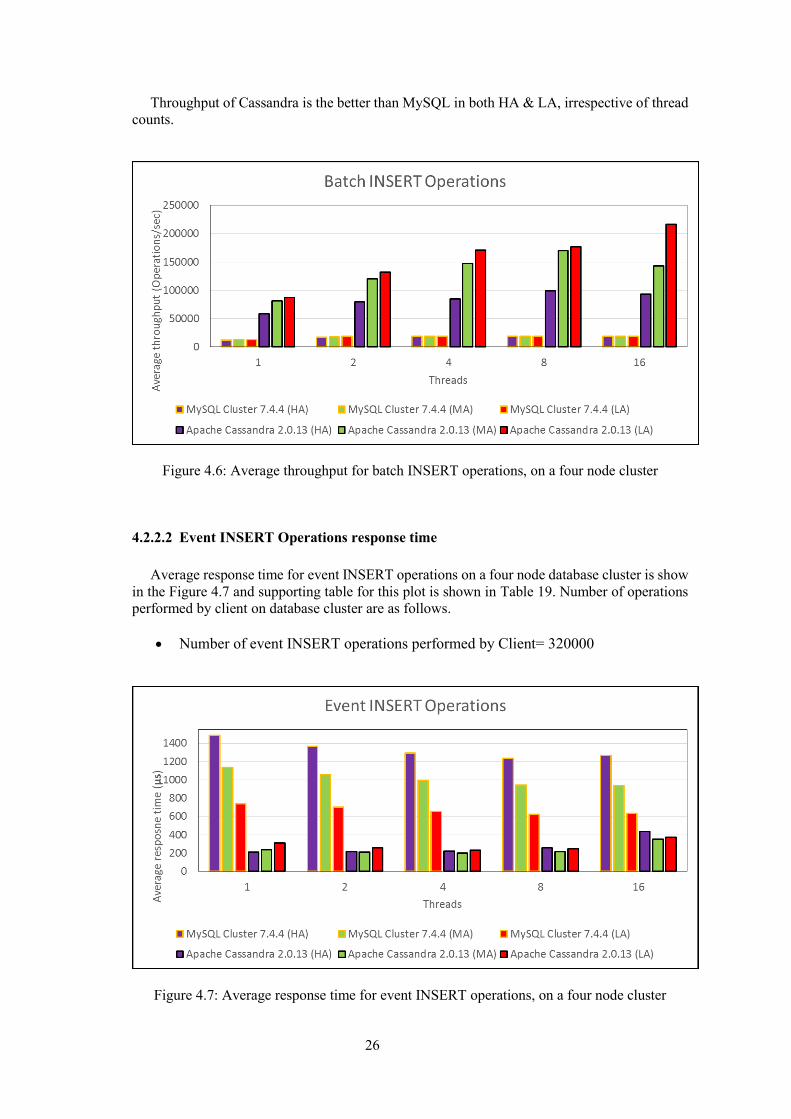
26
Throughput of Cassandra is the better than MySQL in both HA & LA, irrespective of thread
counts.
Figure 4.6: Average throughput for batch INSERT operations, on a four node cluster
4.2.2.2 Event INSERT Operations response time
Average response time for event INSERT operations on a four node database cluster is show
in the Figure 4.7 and supporting table for this plot is shown in Table 19. Number of operations
performed by client on database cluster are as follows.
Number of event INSERT operations performed by Client= 320000
Figure 4.7: Average response time for event INSERT operations, on a four node cluster

27
In Cassandra the order of INSERT response time for lower thread count is LA>MA>HA. At
16 threads the order of average response time is HA>LA>MA.
In MySQL the order of INSERT response time is HA>MA>LA, irrespective of thread count.
Cassandra has better INSERT response time than MySQL in both HA & LA, irrespective of
thread count.
4.2.2.3 SELECT Opeartions response time
Average response time for event SELECT operations is show in the Figure 4.8. And
supporting table for this plot is shown in Table 20. Number of operations performed by client
on database cluster are as follows.
Number of event SELECT operations performed by Client = 320000
At all thread counts, order of SELECT response time in Cassandra is HA>LA>MA with
minor exceptions.
In MySQL, SELECT response time is almost the same in HA, MA & LA.
Cassandra has better average response time than MySQL in both HA & LA configurations
for lower thread count. MySQL average response time is better than Cassandra at higher thread
count, i.e. 16.
Figure 4.8: Average response time for event SELECT operations, on a four node cluster

28
5 DISCUSSIONS
Considering the results, it may appear that Apache Cassandra is more suitable for Multi
Mediation platform, but the choice of database is also dependent on Multi Mediation
applications. For E.g. If the organization has billing systems as one of the application then the
organization may want transactional support in this case MySQL Cluster may be preferred over
Apache Cassandra.
Although the benchmarking gives an assessment of the databases performance, selection of
suitable database also relies on many other parameters like organizational choices, development
costs, operational costs, resource utilizations etc. These parameters may have even more
influence on selection.
The following sections present related works & validity analysis.
5.1 Related Works
Although none of the works match exactly with this research work, the works similar or
works which aided this work are presented in this section.
In [24], Cattell conducted a survey of SQL and NoSQL databases along with benchmarks.
In this paper, the author predicts that “Many developers will be willing to abandon globally
ACID transactions in order to gain scalability, availability and other advantages”. This paper
aided the selection of distributed databases for evaluation.
Sorapak et al. [25], evaluated the performance of MySQL Cluster when scaled, for various
types of SELECT queries and proved that not all queries are benefitted when scaled. The
benchmark used for this purpose is Benchw.
Chen et al. [26] compared the performance of various architectures using TPC-C an
industrial standard benchmark. The authors compare centralized, partitioned and replicated
architectures and concludes that the performance of partitioned architecture is greater than
centralized. Authors also concludes that partitioning architectures outperform even replicated
architectures, as the latter suffers synchronization overheads. Microsoft SQL server has been
used for this comparison. In our research, the throughput of low availability configuration
(partitioning architecture) is found to be greater than high availability configuration (replicated
architecture) in both MySQL Cluster and Apache Cassandra.
Hadjigeorgiou [27], has compared performance and scaling of RDBMS against NoSQL
databases. The author has taken MySQL Cluster & MongoDB as a representation of RDBMS
and NoSQL databases respectively. Author’s experimentation results that MongoDB performs
better in the case of complex queries and MySQL Cluster performs better in case of nested
queries. The author concludes that the performance of both databases for SELECT queries
converges with the number of concurrent connections increasing, irrespective of complexity of
the query, going in line with this research.
In thesis [28], the authors chose two distributed databases, which have support for distributed
computation framework for the sake of sensor data analysis project at Scania. They are MySQL
Cluster and HBase. Quantitative comparison of MySQL cluster and HBase is done. The author
concludes that MySQL Cluster performs better than HBase. However in this work author
doesn’t take availability and scalability of databases into account.

29
In thesis [29], Rafique investigates a suitable database for handling historical financial data
efficiently. Three database taken into consideration were Apache Cassandra, Apache Lucene &
MySQL. Benchmarking of databases are made in the context of handling historical financial
data. Based on the results the author concludes that Apache Cassandra to be more suited for
handling historical financial data efficiently.
From the above works it can be seen there is still a need of comparison of distributed
databases in terms of performance, scalability & availability, especially in the field of Multi
Mediation.
5.2 Validity Threats
5.2.1 Internal Validity Threats
The validity of the results is highly dependent on the hardware & software specifications as
mentioned in section 3.2. Many other parameters like CPU utilization, network utilization, disk
usage, I/O could also affect the validity of the results. This threat has been reduced by
performing the experiment in isolation, restoring database state for each harness.
5.2.2 External Validity Threats
The architectural dissimilarities was a threat in our experiment this has been reduced by
concept mentioned in section 3.3. Similar schema & similar type of queries has been used for
both the databases for the sake of external validity.
Selection of number of operations to be performed on database cluster, if the number of
operations performed on database are too low then the results suffer from Java Virtual Machine
(JVM) warm-up phase. If the number of operations performed on the database is too high then
it results in very high run times. In order to reduce the threat posed, initial tests were conducted
on database cluster, these initial tests revealed the optimum number of operations to be
performed on the database cluster.
The degree of generalization may be limited to specific databases and also even to the
specific versions. The benchmarking harness uses Java interface to the database cluster, so use
of any other interface may threaten the validity.
5.2.3 Construct Validity Threats
To relate experiment better with theory, the experimental setup and process of evaluation are
studied in minute detail, from reliable sources like diva-portal, Compendex, ACM digital
library, IEEE Xplore etc. Staff at Ericsson are asked to supervise the research.
5.2.4 Conclusion Validity Threats
Result from this experimentation are related with those of previous works to reduce
conclusion validity threats. The threat of drawing out wrong conclusions is alleviated by
repeating each benchmark harness for three times and the averages are used to make out best
possible values.

30
6 CONCLUSION AND FUTURE WORK
This research work is to find a suitable database for Multi Mediation needs. The factors like
performance, scalability & availability are considered as distributed databases, selection
parameters. And how one parameter effects the other is studied.
Multi Mediation database requirements are used for the selection of distributed databases for
evaluation. Database selection is done qualitatively by analyzing research articles, related works
and support available. MySQL Cluster 7.4.4 and Apache Cassandra 2.0.13 are two databases
which were selected for evaluation. The metrics considered for evaluation are throughput &
response time. These metrics are observed with respect to scalability & availability
configurations. Queries and schema specific to Multi Mediation are used for evaluation, so to
reflect the practical scenario. Many dissimilarities between databases are mitigated to aid
comparison. The benchmarking harness application is developed in this context. Benchmarking
harness is performed on these databases to reveal their relations between scalability,
performance and availability configurations, so to answer the framed research questions
discussed below.
6.1 Answering Research Questions
The research questions framed are answered in the context of Multi Mediation as follows.
RQ1) What is the average response time behaviour of event data, for the two databases
considered?
Initial conditions: Workload of 50% INSERTS & 50% SELECTS is imposed, default
availability configuration, i.e. moderate availability configuration has been used, four node
database cluster has been used.
Experiment-1 is performed to answer this research question. Average response time for event
INSERT and SELECT operations are measured separately under workload of 50% SELECTS
& 50% INSERTS on a four node database cluster. All measurements are made from Clients.
Thread count from clients is also taken into consideration. Results and comparisons are
presented in section 4.1.
RQ2) What is the effect on average throughput of batch data for two databases,
considering scaling & availability configurations?
Initial conditions: Workload of 100% batch INSERT operations, are imposed.
Experiment-2 is performed on batch data, to find the average throughput for MySQL Cluster
and Apache Cassandra, in various availability configurations and considering scaling of nodes.
Results and comparison are presented in section 4.2.1.1. At four node database cluster, there are
three common availability configurations, the throughput in these availability configurations is
presented in section 4.2.2.1.
RQ3) What is the effect on average response time of event data for two databases,
considering scaling & availability configurations?
Initial conditions: Workload of 100% event INSERT or SELECT operations, are imposed
Experiment-2 is performed on event data, to find the average response time for MySQL
Cluster and Apache Cassandra in various availability configurations, and considering scaling of

31
nodes. Results and comparison are presented in 4.2.1.2 & 4.2.1.3. At four node database cluster,
there are three common availability configurations, the average response time in in these
availability configurations is presented in section 4.2.2.2 & 4.2.2.3.
6.2 Summary of Contributions
The thesis contributions are as follows.
Multi Mediation requirements in telecom environment are identified.
Presents literature survey of related works.
It compares two distributed databases MySQL Cluster and Apache Cassandra, in order to
point out the differences concerning performance, scalability and availability.
Aids in the selection of appropriate distributed database based on needs.
Design of Multi Mediation contextual benchmarking harness.
It exposes the inter-relations among availability, scalability and performance which are
crucial parameters in database dimensioning or database deployment strategies.
The research may aid distributed database developers.
6.3 Limitations
Due to resource limitations the experiment was performed on maximum of four nodes, but the
real world scenario uses much larger number of nodes.
As seen from section 4.1, at 50% INSERTS and 50% SELECTS workload, from 8 to 16
threads, the average response time for INSERT operations in Apache Cassandra increases more
than MySQL Cluster. More research has to be done on this phenomenon. This phenomenon
could hinder the selection of distributed database as of now.
The experiment was performed with client(s) interacting to database using a single contact
point.
6.4 Future Works
The phenomenon discussed above can be investigated as one of the future works. Resource
utilizations of distributed databases in various availability configurations can also be taken into
account, as this is crucial for medium sizes enterprises. Resource utilizations may include CPU
utilizations, disk utilization, memory utilization or any internal parameters as mentioned in the
section 2.1.2. Future experiments can be performed on more number of nodes. One can increase
the number of contact points in a database cluster and load balance them for evaluation of
distributed databases, as it gives more insights into the performance aspects.

32
REFERENCES
[1] “Company Facts - Ericsson.” [Online]. Available:
http://www.ericsson.com/thecompany/company_facts. [Accessed: 06-May-2015].
[2] “Our Businesses - Ericsson.” [Online]. Available:
http://www.ericsson.com/thecompany/company_facts/businesses. [Accessed: 14-May-
2015].
[3] “Multi Mediation,” Ericsson.com. [Online]. Available:
http://www.ericsson.com/ourportfolio/products/multi-mediation. [Accessed: 09-Feb-
2015].
[4] Amir Shahzed Khokhar and A. Imran, “Principles for Distributed Databases in Telecom
Environment,” 2010.
[5] M. Kaur and H. Kaur, “Concurrency Control in Distributed Database System,” Int. J.
Adv. Res. Comput. Sci. Softw. Eng., vol. 3, no. 7, p. 5, Jul. 2013.
[6] M. T. Özsu and P. Valduriez, Principles of distributed database systems. Springer
Science & Business Media, 2011.
[7] M. Nicola and M. Jarke, “Performance modeling of distributed and replicated
databases,” Knowl. Data Eng. IEEE Trans. On, vol. 12, no. 4, pp. 645–672, 2000.
[8] J. B. Rothnie Jr., P. A. Bernstein, S. Fox, N. Goodman, M. Hammer, T. A. Landers, C.
Reeve, D. W. Shipman, and E. Wong, “Introduction to a System for Distributed
Databases (SDD-1),” ACM Trans Database Syst, vol. 5, no. 1, pp. 1–17, Mar. 1980.
[9] C. Mohan, B. Lindsay, and R. Obermarck, “Transaction Management in the R*
Distributed Database Management System,” ACM Trans Database Syst, vol. 11, no. 4,
pp. 378–396, Dec. 1986.
[10] S. Das, “Scalable and elastic transactional data stores for cloud computing platforms,”
Citeseer, 2011.
[11] A. B. M. Moniruzzaman, “NewSQL: Towards Next-Generation Scalable RDBMS for
Online Transaction Processing (OLTP) for Big Data Management,” ArXiv Prepr.
ArXiv14117343, 2014.
[12] S. Weber, “Nosql databases,” Univ. Appl. Sci. HTW Chur Switz., 2010.
[13] “NoSQL Databases Defined & Explained | Planet Cassandra.” [Online]. Available:
http://planetcassandra.org/what-is-nosql/. [Accessed: 12-Jun-2015].
[14] F. Chang, J. Dean, S. Ghemawat, W. C. Hsieh, D. A. Wallach, M. Burrows, T. Chandra,
A. Fikes, and R. E. Gruber, “Bigtable: A Distributed Storage System for Structured
Data,” ACM Trans Comput Syst, vol. 26, no. 2, pp. 4:1–4:26, Jun. 2008.
[15] K. Grolinger, W. A Higashino, T. Abhinav, and A. C. Miriam, “Data management in
cloud environments: NoSQL and NewSQL data stores,” J. Cloud Comput., p. 24, 2013.
[16] B. Kemme and G. Alonso, “Don’t be lazy, be consistent: Postgres-R, A new way to
implement Database Replication *,” presented at the 26th International Conference on
Very Large Databases, 2000, pp. pp. 134 – 143.
[17] “MySQL :: MySQL 5.0 Reference Manual :: 17.1.1 MySQL Cluster Core Concepts.”
[Online]. Available: https://dev.mysql.com/doc/refman/5.0/en/mysql-cluster-
basics.html. [Accessed: 14-May-2015].
[18] S. Wang, “Towards Cloud Data Management for Online Games - A Prototype
Platform,” University of Magdeburg, 2013.
[19] “MySQL :: MySQL 5.0 Reference Manual :: 17.1.2 MySQL Cluster Nodes, Node
Groups, Replicas, and Partitions.” [Online]. Available:
https://dev.mysql.com/doc/refman/5.0/en/mysql-cluster-nodes-groups.html. [Accessed:
14-May-2015].
[20] C. Brian F., S. Adam, T. Erwin, R. Raghu, and S. Russell, “Benchmarking Cloud
Serving Systems with YCSB,” in ACM symposium on Cloud computingben, 2010.
[21] “HammerDB.” [Online]. Available: http://www.hammerdb.com/. [Accessed: 10-Jun-
2015].

33
[22] “Java SE Development Kit 8 - Downloads.” [Online]. Available:
http://www.oracle.com/technetwork/java/javase/downloads/jdk8-downloads-
2133151.html. [Accessed: 11-Jun-2015].
[23] “MySQL :: MySQL Connector/J Developer Guide.” [Online]. Available:
http://dev.mysql.com/doc/connector-j/en/index.html. [Accessed: 11-Jun-2015].
[24] R. Cattell, “Scalable SQL and NoSQL data stores,” ACM SIGMOD Rec., vol. 39, no. 4,
pp. 12–27, 2011.
[25] P. Sorapak, L. Vitalwonhyo, and S. Parinya, “Performance Evaluation of Distributed
Database on PC Cluster Computers using MySQL Cluster,” presented at the World
Congress on Engineering and Computer Science, San Francisco, USA, 2010, vol. Vol I,
pp. 97–100.
[26] S. Chen, A. Ng, and P. Greenfield, “A performance evaluation of distributed database
architectures,” Concurr. Comput. Pract. Exp., vol. 25, no. 11, pp. 1524–1546, 2013.
[27] C. Hadjigeorgiou, “RDBMS vs NoSQL: Performance and Scaling Comparison,” The
University Of Edinburgh, Edinburgh, 2013.
[28] P. Murugan and A. Sentraya, “A Study of NoSQL and NewSQL databases for data
aggregation on Big Data,” 2013.
[29] A. Rafique, “Evaluating NOSQL Technologies for Historical Financial Data,” 2013.

34
APPENDIX A
Experiment-1 Results
Trail1 Trail2 Trail3
MySQL Cluster 7.4.4 1 399.606 400.888 403.119 401.204
MySQL Cluster 7.4.4 2 386.712 386.123 389.000 387.278
MySQL Cluster 7.4.4 4 382.475 376.725 378.875 379.358
MySQL Cluster 7.4.4 8 396.600 396.800 396.600 396.667
MySQL Cluster 7.4.4 16 519.400 524.700 522.400 522.167
Apache Cassandra 2.0.13 1 355.619 356.844 357.263 356.575
Apache Cassandra 2.0.13 2 351.113 352.613 348.387 350.704
Apache Cassandra 2.0.13 4 329.300 317.550 323.227 323.359
Apache Cassandra 2.0.13 8 338.500 341.200 340.900 340.200
Apache Cassandra 2.0.13 16 535.500 541.200 556.300 544.333
SELECT Response timeDatabase Average SELECT response time Threads/Client
Table 1: Average event SELECT response time in four node database cluster at workload mix
of 50% INSERTS, 50% SELECTS
Trail1 Trail2 Trail3
MySQL Cluster 7.4.4 1 1118.901 1116.601 1116.564 1117.355
MySQL Cluster 7.4.4 2 1034.800 1035.800 1034.175 1034.925
MySQL Cluster 7.4.4 4 965.850 967.375 973.925 969.050
MySQL Cluster 7.4.4 8 946.150 945.700 945.000 945.617
MySQL Cluster 7.4.4 16 1027.300 1036.700 1030.300 1031.433
Apache Cassandra 2.0.13 1 226.950 226.538 226.769 226.752
Apache Cassandra 2.0.13 2 212.950 212.550 212.850 212.783
Apache Cassandra 2.0.13 4 208.900 209.700 209.400 209.333
Apache Cassandra 2.0.13 8 244.150 247.650 243.600 245.133
Apache Cassandra 2.0.13 16 514.500 519.600 530.000 521.367
INSERT Response timeDatabase Threads/Client Average INSERT response time
Table 2: Average event INSERT response time in four node database cluster at workload mix
of 50% INSERTS, 50% SELECTS

35
Experiment -2 part 1 Results
Batch INSERT operations throughput
HA LA HA LA
1 11944.324 11944.324 80192.503 80192.503
2 11969.687 13102.345 58175.867 78951.328
3 12465.638 13416.628 63085.927 83336.785
4 12477.032 13401.528 58838.475 87101.210
Batch INSERT Operations
MySQL Cluster 7.4.4 Apache Cassandra 2.0.13
Average throughput (Operations/sec)Number of nodes
Table 3: Average throughput for 5687680 batch INSERT operations at threads=1
HA LA HA LA
1 17165.501 17165.501 81043.402 81043.402
2 16952.611 17984.683 69659.277 111108.478
3 17451.421 18454.310 83238.808 120551.073
4 17660.805 18628.688 79513.498 132408.142
Batch INSERT Operations
MySQL Cluster 7.4.4 Apache Cassandra 2.0.13
Average throughput (Operations/sec)Number of nodes
Table 4: Average throughput for 5687680 batch INSERT operations at threads=2
HA LA HA LA
1 18693.322 18693.322 91394.291 91394.291
2 18820.041 19014.434 77680.737 123461.814
3 18857.001 19172.063 99311.694 147655.244
4 19098.864 19167.282 84728.876 170780.687
Batch INSERT Operations
MySQL Cluster 7.4.4 Apache Cassandra 2.0.13
Average throughput (Operations/sec)Number of nodes
Table 5: Average throughput for 5687680 batch INSERT operations at threads=4

36
Experiment-2 part 1 Results
Batch INSERT operations throughput
HA LA HA LA
1 18806.455 18806.455 90550.370 90550.370
2 18771.200 18865.069 81564.458 133099.112
3 18835.061 18866.571 99904.212 165766.802
4 18871.871 18844.380 98822.794 176897.892
Batch INSERT Operations
MySQL Cluster 7.4.4 Apache Cassandra 2.0.13
Average throughput (Operations/sec)Number of nodes
Table 6: Average throughput for 5687680 batch INSERT operations at threads=8
HA LA HA LA
1 18595.576 18595.576 84937.652 84937.652
2 18589.680 18596.143 85589.514 137031.618
3 18605.694 18617.936 104981.358 181796.331
4 18598.555 18621.837 92840.377 216745.084
Batch INSERT Operations
MySQL Cluster 7.4.4 Apache Cassandra 2.0.13
Average throughput (Operations/sec)Number of nodes
Table 7: Average throughput for 5687680 batch INSERT operations at threads=16

37
Experiment-2 part 1 results
Event INSERT operations response time
HA LA HA LA
1 423.477 423.477 218.442 218.442
2 974.438 612.940 203.552 248.582
3 1236.864 695.706 203.143 359.417
4 1484.447 740.651 211.831 311.745
Event INSERT Operations
MySQL Cluster 7.4.4 Apache Cassandra 2.0.13
Average response time (μ sec)Number of nodes
Table 8: Average response time considering 320000 event INSERT operations at threads=1
HA LA HA LA
1 432.783 432.783 227.271 227.271
2 948.810 593.758 206.994 233.067
3 1148.883 663.079 208.527 305.894
4 1368.675 701.258 213.492 254.806
Event INSERT Operations
MySQL Cluster 7.4.4 Apache Cassandra 2.0.13
Average response time (μ sec)Number of nodes
Table 9: Average response time considering 320000 event INSERT operations at threads=2
HA LA HA LA
1 430.642 430.642 242.600 242.600
2 908.338 562.038 212.325 229.075
3 1081.313 621.717 217.442 272.321
4 1290.838 655.900 219.658 229.658
Event INSERT Operations
MySQL Cluster 7.4.4 Apache Cassandra 2.0.13
Average response time (μ sec)Number of nodes
Table 10: Average response time considering 320000 event INSERT operations at threads=4

38
Experiment-2 part 1 results
Event INSERT operations response time
HA LA HA LA
1 452.967 452.967 274.367 274.367
2 883.892 542.533 241.317 252.158
3 1049.742 594.325 247.242 275.092
4 1237.475 623.758 257.283 244.600
Event INSERT Operations
MySQL Cluster 7.4.4 Apache Cassandra 2.0.13
Average response time (μ sec)Number of nodes
Table 11: Average response time considering 320000 event INSERT operations at threads=8
HA LA HA LA
1 513.600 513.600 357.683 357.683
2 923.500 578.000 408.050 353.867
3 1083.667 614.733 418.100 371.767
4 1268.350 636.133 436.017 369.950
Event INSERT Operations
MySQL Cluster 7.4.4 Apache Cassandra 2.0.13
Average response time (μ sec)Number of nodes
Table 12: Average response time considering 320000 event INSERT operations at threads=16

39
Experiment-2 part 1 results
Event SELECT operations response time
HA LA HA LA
1 233.168 233.168 308.292 308.292
2 337.175 337.574 347.125 268.674
3 383.063 385.294 334.919 370.121
4 410.285 410.770 331.145 324.589
Event SELECT Operations
MySQL Cluster 7.4.4 Apache Cassandra 2.0.13
Average response time (μ sec)Number of nodes
Table 13: Average response time considering 320000 event SELECT operations at threads=1
HA LA HA LA
1 220.206 220.206 301.442 301.442
2 323.142 325.506 319.083 238.281
3 360.592 363.521 287.781 318.967
4 385.473 385.023 287.100 267.731
Event SELECT Operations
MySQL Cluster 7.4.4 Apache Cassandra 2.0.13
Average response time (μ sec)Number of nodes
Table 14: Average response time considering 320000 event SELECT operations at threads=2
HA LA HA LA
1 237.208 237.208 305.508 305.508
2 307.604 308.542 307.829 233.213
3 340.483 342.383 272.433 284.421
4 363.300 363.808 262.029 232.083
Event SELECT Operations
MySQL Cluster 7.4.4 Apache Cassandra 2.0.13
Average response time (μ sec)Number of nodes
Table 15: Average response time considering 320000 event SELECT operations at threads=4

40
Experiment-2 part 1 results
Event SELECT operations response time
HA LA HA LA
1 255.117 255.117 518.317 518.317
2 303.717 306.558 362.583 246.358
3 330.750 333.983 283.133 280.125
4 345.675 346.108 262.142 243.200
Event SELECT Operations
MySQL Cluster 7.4.4 Apache Cassandra 2.0.13
Average response time (μ sec)Number of nodes
Table 16: Average response time considering 320000 event SELECT operations at threads=8
HA LA HA LA
1 340.417 340.417 742.833 742.833
2 363.950 366.283 658.117 396.433
3 383.367 386.717 406.817 417.650
4 400.800 398.583 413.017 403.400
Event SELECT Operations
MySQL Cluster 7.4.4 Apache Cassandra 2.0.13
Average response time (μ sec)Number of nodes
Table 17: Average response time considering 320000 event SELECT operations at threads=16

41
Experiment-2 part 2 results
Batch INSERT operations throughput
HA MA LA HA MA LA
1 12477.032 13260.561 13401.528 58838.475 81260.311 87101.210
2 17660.805 18448.704 18628.688 79513.498 120005.908 132408.142
4 19098.864 19211.825 19167.282 84728.876 147297.071 170780.687
8 18871.871 18847.544 18844.380 98822.794 169991.233 176897.892
16 18598.555 18617.915 18621.837 92840.377 143368.819 216745.084
Batch INSERT Operations
MySQL Cluster 7.4.4 Apache Cassandra 2.0.13
Average throughput (Operations/sec)
Number
of
Threads
Table 18: Average throughput for 5687680 batch INSERT operations on four node database
cluster

42
Experiment-2 part 2 results
Event INSERT operations response time
HA MA LA HA MA LA
1 1484.447 1138.063 740.651 211.831 237.813 311.745
2 1368.675 1056.319 701.258 213.492 211.533 254.806
4 1290.838 993.238 655.900 219.658 200.021 229.658
8 1237.475 942.975 623.758 257.283 216.842 244.600
16 1268.350 937.200 636.133 436.017 351.150 369.950
Event INSERT Operations
MySQL Cluster 7.4.4 Apache Cassandra 2.0.13
Average response time ( μ sec)
Number
of
Threads
Table 19: Average response time considering 320000 event INSERT operations on four node
database cluster

43
Experiment-2 part 2 results
Event SELECT operations response time
HA MA LA HA MA LA
1 410.285 411.888 410.770 331.145 302.358 324.589
2 385.473 386.775 385.023 287.100 267.298 267.731
4 363.300 364.763 363.808 262.029 233.454 232.083
8 345.675 345.525 346.108 262.142 234.458 243.200
16 400.800 403.550 398.583 413.017 403.117 403.400
Event SELECT Operations
MySQL Cluster 7.4.4 Apache Cassandra 2.0.13
Average response time ( μ sec)
Number
of
Threads
Table 20: Average response time considering 320000 event SELECT operations on four node
database cluster