Distinct expression and activity profiles of largemouth bass (Micropterus salmoides) estrogen...
15
Distinct expression and activity profiles of largemouth bass (Micropterus salmoides) estrogen receptors in response to estradiol and nonylphenol Tara Sabo-Attwood 1,7 , Jason L Blum 1 , Kevin J Kroll 2,3 , Vishal Patel 2,3 , Detlef Birkholz 8 , Nancy J Szabo 3,4 , Suzanne Z Fisher 5 , Robert McKenna 5 , Martha Campbell-Thompson 6 and Nancy D Denslow 2,3,5 1 Department of Pharmacology and Therapeutics, 2 Department of Physiological Sciences, 3 Center of Environmental and Human Toxicology, 4 Analytical Toxicology Core Laboratory, 5 Department of Biochemistry and Molecular Biology and 6 Department of Pathology, Immunology and Laboratory Medicine, University of Florida, PO Box 110885, Gainesville, Florida 32611, USA 7 Department of Environmental Health Sciences, University of South Carolina, Columbia, South Carolina, USA 8 Enviro-Test Laboratories, Edmonton, Alberta, Canada (Correspondence should be addressed to N D Denslow; Email: ndenslow@ufl.edu) T Sabo-Attwood and J L Blum contributed equally to this work Abstract The estrogen receptor (ER) signaling cascade is a vulnerable target of exposure to environmental xenoestrogens, like nonylphenol (NP), which are causally associated with impaired health status. However, the impact of xenoestrogens on the individual receptor isotypes (a, ba, and bb) is not well understood. The goal of these studies was to determine the impact of NP on largemouth bass (Micropterus salmoides) ER isotype expression and activity. Here, we show that hepatic expression levels of three receptors are not equivalent in male largemouth bass exposed to NP by injection. Transcript levels of the ERa subtype were predominantly induced in concert with vitellogenin similarly to fish exposed to 17b-estradiol (E 2 ) as measured by quantitative real-time PCR. NP also induced circulating plasma levels of estrogen, which may contribute to overall activation of the ERs. To measure the activation of each receptor isotype by E 2 and NP, we employed reporter assays using an estrogen response element (ERE)–luciferase construct. Results from these studies show that ERa had the greatest activity following exposure to E 2 and NP. This activity was inhibited by the antagonists ICI 182 780 and ZM 189 154. Furthermore, both bb and ba subtypes depressed ERa activation, suggesting that the cellular composition of receptor isotypes may contribute to the overall actions of estrogen and estrogenic contaminants via the receptors. Results from these studies collectively reveal the differential response of fish ER isotypes in response to xenoestrogens. Journal of Molecular Endocrinology (2007) 39, 223–237 Introduction One synthetic chemical found in the environment that functions as a weak xenoestrogen is 4-nonylphenol (NP). NP is a microbial breakdown product of NP polyethoxylates (NPEs) that are most commonly found in industrial non-ionic surfactants and also used in the production of plastics, textiles, paints, emulsifiers, paper products, and cosmetics (Scott & Jones 2000, Sabik et al. 2003). It is estimated that more than 500 000 tons of NPEs are used annually (Scott & Jones 2000) with O60% entering the environment via sewage outflows (White et al. 1994, Nimrod & Benson 1996, Canadian 2000). In fish, the estrogenic effects of NP in vivo are well documented. These include the induction of estrogen- responsive genes in males such as vitellogenins (vtgs) and choriogenins that are involved in normal female reproduction (Allen et al. 1999, Arukwe et al. 2001, Kannan et al. 2003), impaired gonadal development (Lin & Janz 2006), altered steroidogenesis (Harris et al. 2001), and intersex (Gray et al. 1997, Metcalfe et al. 2001, Schwaiger et al. 2002, Seki et al. 2003). These conditions have been induced in fish in controlled laboratory studies and have also been seen in wild fish found in the vicinity of sewage outflows (Allen et al. 1999, Jobling et al. 2002, Legler et al. 2002, Pettersson et al. 2005) where the main contaminants include NP. NP has also been shown to behave as a weak estrogen in a variety of standard in vitro tests including proliferation assays using the breast cancer MCF-7 cell line (Soto et al. 1995, Blom et al. 1998, Laws et al. 2000), gene expression (Arukwe et al. 2000a, 2001, Thorpe et al. 2001), and recombinant reporter gene assays 223 Journal of Molecular Endocrinology (2007) 39, 223–237 DOI: 10.1677/JME-07-0038 0952–5041/07/039–223 q 2007 Society for Endocrinology Printed in Great Britain Online version via http://www.endocrinology-journals.org
-
Upload
independent -
Category
Documents
-
view
3 -
download
0
Transcript of Distinct expression and activity profiles of largemouth bass (Micropterus salmoides) estrogen...

223
Distinct expression and activit
y profiles of largemouth bass(Micropterus salmoides) estrogen receptors in response toestradiol and nonylphenolTara Sabo-Attwood1,7, Jason L Blum1, Kevin J Kroll2,3, Vishal Patel2,3, Detlef Birkholz8,Nancy J Szabo3,4, Suzanne Z Fisher5, Robert McKenna5, Martha Campbell-Thompson6 andNancy D Denslow2,3,5
1Department of Pharmacology and Therapeutics, 2Department of Physiological Sciences, 3Center of Environmental and Human Toxicology, 4Analytical Toxicology Core Laboratory,5Department of Biochemistry andMolecular Biology and 6Department of Pathology, Immunology and Laboratory Medicine, University of Florida, PO Box 110885, Gainesville, Florida32611, USA
7Department of Environmental Health Sciences, University of South Carolina, Columbia, South Carolina, USA
8Enviro-Test Laboratories, Edmonton, Alberta, Canada
(Correspondence should be addressed to N D Denslow; Email: [email protected])
T Sabo-Attwood and J L Blum contributed equally to this work
Abstract
The estrogen receptor (ER) signaling cascade is a vulnerable target of exposure to environmental xenoestrogens, like
nonylphenol (NP), which are causally associated with impaired health status. However, the impact of xenoestrogens on
the individual receptor isotypes (a, ba, and bb) is not well understood. The goal of these studies was to determine the
impact of NP on largemouth bass (Micropterus salmoides) ER isotype expression and activity. Here, we show that
hepatic expression levels of three receptors are not equivalent in male largemouth bass exposed to NP by injection.
Transcript levels of the ERa subtype were predominantly induced in concert with vitellogenin similarly to fish exposed to
17b-estradiol (E2) as measured by quantitative real-time PCR. NP also induced circulating plasma levels of estrogen,
which may contribute to overall activation of the ERs. To measure the activation of each receptor isotype by E2 and NP,
we employed reporter assays using an estrogen response element (ERE)–luciferase construct. Results from these
studies show that ERa had the greatest activity following exposure to E2 and NP. This activity was inhibited by the
antagonists ICI 182 780 and ZM 189 154. Furthermore, both bb and ba subtypes depressed ERa activation, suggesting
that the cellular composition of receptor isotypes may contribute to the overall actions of estrogen and estrogenic
contaminants via the receptors. Results from these studies collectively reveal the differential response of fish ER isotypes
in response to xenoestrogens.
Journal of Molecular Endocrinology (2007) 39, 223–237
Introduction
One synthetic chemical found in the environment thatfunctions as a weak xenoestrogen is 4-nonylphenol(NP). NP is a microbial breakdown product of NPpolyethoxylates (NPEs) that are most commonly foundin industrial non-ionic surfactants and also used in theproduction of plastics, textiles, paints, emulsifiers,paper products, and cosmetics (Scott & Jones 2000,Sabik et al. 2003). It is estimated that more than 500 000tons of NPEs are used annually (Scott & Jones 2000)with O60% entering the environment via sewageoutflows (White et al. 1994, Nimrod & Benson 1996,Canadian 2000).
In fish, the estrogenic effects of NP in vivo are welldocumented. These include the induction of estrogen-responsive genes in males such as vitellogenins (vtgs)
Journal of Molecular Endocrinology (2007) 39, 223–2370952–5041/07/039–223 q 2007 Society for Endocrinology Printed in Great Britain
and choriogenins that are involved in normal femalereproduction (Allen et al. 1999, Arukwe et al. 2001,Kannan et al. 2003), impaired gonadal development(Lin & Janz 2006), altered steroidogenesis (Harris et al.2001), and intersex (Gray et al. 1997, Metcalfe et al.2001, Schwaiger et al. 2002, Seki et al. 2003). Theseconditions have been induced in fish in controlledlaboratory studies and have also been seen in wild fishfound in the vicinity of sewage outflows (Allen et al.1999, Jobling et al. 2002, Legler et al. 2002, Petterssonet al. 2005) where the main contaminants include NP.
NP has also been shown to behave as a weak estrogenin a variety of standard in vitro tests includingproliferation assays using the breast cancer MCF-7 cellline (Soto et al. 1995, Blom et al. 1998, Laws et al. 2000),gene expression (Arukwe et al. 2000a, 2001, Thorpeet al. 2001), and recombinant reporter gene assays
DOI: 10.1677/JME-07-0038Online version via http://www.endocrinology-journals.org
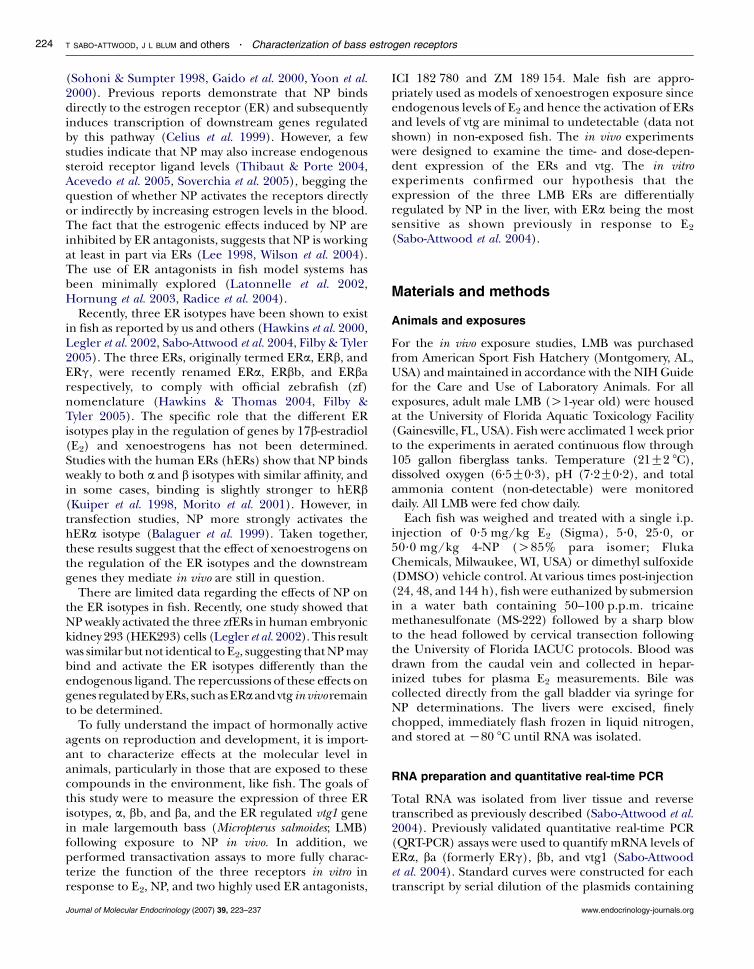
T SABO-ATTWOOD, J L BLUM and others . Characterization of bass estrogen receptors224
(Sohoni & Sumpter 1998, Gaido et al. 2000, Yoon et al.2000). Previous reports demonstrate that NP bindsdirectly to the estrogen receptor (ER) and subsequentlyinduces transcription of downstream genes regulatedby this pathway (Celius et al. 1999). However, a fewstudies indicate that NP may also increase endogenoussteroid receptor ligand levels (Thibaut & Porte 2004,Acevedo et al. 2005, Soverchia et al. 2005), begging thequestion of whether NP activates the receptors directlyor indirectly by increasing estrogen levels in the blood.The fact that the estrogenic effects induced by NP areinhibited by ER antagonists, suggests that NP is workingat least in part via ERs (Lee 1998, Wilson et al. 2004).The use of ER antagonists in fish model systems hasbeen minimally explored (Latonnelle et al. 2002,Hornung et al. 2003, Radice et al. 2004).
Recently, three ER isotypes have been shown to existin fish as reported by us and others (Hawkins et al. 2000,Legler et al. 2002, Sabo-Attwood et al. 2004, Filby & Tyler2005). The three ERs, originally termed ERa, ERb, andERg, were recently renamed ERa, ERbb, and ERbarespectively, to comply with official zebrafish (zf)nomenclature (Hawkins & Thomas 2004, Filby &Tyler 2005). The specific role that the different ERisotypes play in the regulation of genes by 17b-estradiol(E2) and xenoestrogens has not been determined.Studies with the human ERs (hERs) show that NP bindsweakly to both a and b isotypes with similar affinity, andin some cases, binding is slightly stronger to hERb(Kuiper et al. 1998, Morito et al. 2001). However, intransfection studies, NP more strongly activates thehERa isotype (Balaguer et al. 1999). Taken together,these results suggest that the effect of xenoestrogens onthe regulation of the ER isotypes and the downstreamgenes they mediate in vivo are still in question.
There are limited data regarding the effects of NP onthe ER isotypes in fish. Recently, one study showed thatNP weakly activated the three zfERs in human embryonickidney 293 (HEK293) cells (Legler et al. 2002). This resultwas similar but not identical toE2, suggesting thatNPmaybind and activate the ER isotypes differently than theendogenous ligand. The repercussions of these effects ongenes regulatedbyERs, suchasERaandvtg invivo remainto be determined.
To fully understand the impact of hormonally activeagents on reproduction and development, it is import-ant to characterize effects at the molecular level inanimals, particularly in those that are exposed to thesecompounds in the environment, like fish. The goals ofthis study were to measure the expression of three ERisotypes, a, bb, and ba, and the ER regulated vtg1 genein male largemouth bass (Micropterus salmoides; LMB)following exposure to NP in vivo. In addition, weperformed transactivation assays to more fully charac-terize the function of the three receptors in vitro inresponse to E2, NP, and two highly used ER antagonists,
Journal of Molecular Endocrinology (2007) 39, 223–237
ICI 182 780 and ZM 189 154. Male fish are appro-priately used as models of xenoestrogen exposure sinceendogenous levels of E2 and hence the activation of ERsand levels of vtg are minimal to undetectable (data notshown) in non-exposed fish. The in vivo experimentswere designed to examine the time- and dose-depen-dent expression of the ERs and vtg. The in vitroexperiments confirmed our hypothesis that theexpression of the three LMB ERs are differentiallyregulated by NP in the liver, with ERa being the mostsensitive as shown previously in response to E2
(Sabo-Attwood et al. 2004).
Materials and methods
Animals and exposures
For the in vivo exposure studies, LMB was purchasedfrom American Sport Fish Hatchery (Montgomery, AL,USA) andmaintained in accordance with the NIHGuidefor the Care and Use of Laboratory Animals. For allexposures, adult male LMB (O1-year old) were housedat the University of Florida Aquatic Toxicology Facility(Gainesville, FL,USA). Fish were acclimated 1 week priorto the experiments in aerated continuous flow through105 gallon fiberglass tanks. Temperature (21G2 8C),dissolved oxygen (6.5G0.3), pH (7.2G0.2), and totalammonia content (non-detectable) were monitoreddaily. All LMB were fed chow daily.
Each fish was weighed and treated with a single i.p.injection of 0.5 mg/kg E2 (Sigma), 5.0, 25.0, or50.0 mg/kg 4-NP (O85% para isomer; FlukaChemicals, Milwaukee, WI, USA) or dimethyl sulfoxide(DMSO) vehicle control. At various times post-injection(24, 48, and 144 h), fish were euthanized by submersionin a water bath containing 50–100 p.p.m. tricainemethanesulfonate (MS-222) followed by a sharp blowto the head followed by cervical transection followingthe University of Florida IACUC protocols. Blood wasdrawn from the caudal vein and collected in hepar-inized tubes for plasma E2 measurements. Bile wascollected directly from the gall bladder via syringe forNP determinations. The livers were excised, finelychopped, immediately flash frozen in liquid nitrogen,and stored at K80 8C until RNA was isolated.
RNA preparation and quantitative real-time PCR
Total RNA was isolated from liver tissue and reversetranscribed as previously described (Sabo-Attwood et al.2004). Previously validated quantitative real-time PCR(QRT-PCR) assays were used to quantify mRNA levels ofERa, ba (formerly ERg), bb, and vtg1 (Sabo-Attwoodet al. 2004). Standard curves were constructed for eachtranscript by serial dilution of the plasmids containing
www.endocrinology-journals.org

Characterization of bass estrogen receptors . T SABO-ATTWOOD, J L BLUM and others 225
the cloned segments for each gene. All samples werenormalized to 18S rRNA as previously described(Sabo-Attwood et al. 2004). The 18S ribosomal primersand a labeled probe were purchased as a kit (PE AppliedBiosystems, Foster City, CA, USA). All data were log10transformed and graphed as the log10 of the copynumber of each gene per mg of total RNA.
Plasma E2 measurements
Plasma was isolated from whole blood by centrifugation.E2 was extracted from the plasma with ether following apreviously published method (Oakes et al. 2005). Briefly,500 ml diethyl ether were mixed with 75 ml plasma.Following vortexing, the sample was frozen in anethanol/dry ice bath, and the ether fraction containingthe organic phase was decanted into a clean, acid-washedglass tube. The process was repeated two more times andthe ether fractions were pooled. Ether was allowed toevaporate and the dried residue was dissolved in 225 mlElisa Immunoassay (EIA) buffer (1 Mphosphate solution(pH 7.4), containing 1% BSA, 4 M NaCl, 10 mM EDTA,and 0.1% sodium azide). Detection of E2 was measuredusing an EIA kit specific for E2 (Cayman Chemicals, AnnArbor, MI, USA) following the instructions supplied bythe manufacturer. A standard curve was constructed withE2 supplied by the kit, and was used to determine theconcentration of plasma E2 in each of the samples.Sample concentrationswere diluted appropriately so thatvalues could be interpolated from the standard curve andrun in duplicate. All values are presented as ng/ml ofplasma.
Measurements of NP in bile samples
To detect NP in bile fluids, 100 ml pooled samples pertreatment group (nZ5) were enzymatically hydrolyzed,extracted with dichloromethane, derivatized to thecorresponding acetates, and analyzed by gas chromato-graphy/mass spectrometry (GC/MS) at the Enviro-TestLaboratories/Xenos Division (Nepean, Ont, Canada).Each fish bile sample was fortified with 10 mg4-nitrophenyl-b-D-glucopyranoside as an enzymatichydrolysis surrogate and placed in 1 ml of 4 M acetatebuffer (pH 5) with 10 000 units of b-glucuronidase.Samples were incubated for 24 h at 50 8C in a sand bathwith occasional shaking. After cooling, samples werefortified with 2 mg 4-cumylphenol and 1.5 ml dichloro-methane. The samples were vortexed and centrifuged for5 min. The bottomphase was extracted and placed over asodium sulfate column. The eluate from the column wascollected and pooled from three repeated extractions.The extracts were concentrated and dried under aconstant stream of nitrogen. To each sample was added2,4,6-tribromophenol as an internal standard, pyridine,
www.endocrinology-journals.org
andacetic anhydride.Sampleswere incubatedat90 8Cfor1 h, cooled, and concentrated. Each sample was thendissolved in1.0 ml toluene and analyzedbyGC/MSusinga DB5-MS capillary column (30 m!0.25 mm!1.0 mM).Quantitation standards were prepared from the 4-NPinjected into the fish (Fluka Chemicals, Buchs,Switzerland).Quantitationwasperformedby the internalstandardmethodusing extracted ion chromatograms.Allvalues were corrected for extraction and expressed as mgNP per mg of total protein.
Construction of LMB ER expression constructs
The cDNAs for each LMB ER (previously isolated inSabo-Attwood et al. 2004) were cloned into the pCMV4mammalian expression vector (Stratagene, La Jolla, CA,USA). The p Cytomegalovirus (pCMV)–ER constructs,a luciferase reporter driven by a two tandem repeat ofthe Xenopus vtg A2 promoter ERE (AGGTCAcagT-GACCT; gift from Dr Pierre Chambon) and a renillaluciferase construct (pRL-TK, Promega) were purifiedusing an endotoxin-free maxi-prep kit (Qiagen).
Growth and maintenance of hepatocellular carcinoma(HepG2) cells
HepG2 cells purchased from American Type CultureCollection were maintained in Earle’s minimal essentialmedium (EMEM) supplemented with 0.1 mM essentialamino acids (Sigma-Aldrich, StLouis,MO,USA), 2.0 mML-glutamine, 1.0 mM sodium pyruvate, 1.5 g/l sodiumbicarbonate, antibiotic/antimycotic (Hyclone, Logan,UT, USA), and 10% fetal bovine serum (Fisher Scientific,Hampton, NH, USA). The cells were cultured in ahumidified incubator at 37 8C in an atmosphere of 5%CO2 and air.
Transient transfection assay in HepG2 cells
HepG2 cells were seeded at a density of 100 000 cells perwell in a 24-well plate in normal medium. Twenty fourhours following plating, the culture medium wasaspirated, the cell monolayers were washed once withHank’s balanced salt solution, and the medium wasreplaced with media containing 10% charcoal-strippedserum. The transfection mix was made up in serum-freemedium. The vector transfection mix consisted of 0.5 mgER construct and 1 mg ERE–luciferase construct per wellwhile the Renilla construct was used at 0.2 mg per well.Fugene6 (Roche)was the transfectant and it wasused at aratio of 3:1 mg (Fugene:DNA). Each transfectionmix wasmade up to 100 ml per well and was incubated for 15 minat room temperature. One hundred microlitres of eachtransfection mixture were added dropwise to the wells asdirected by the manufacturer. Experiments testing the
Journal of Molecular Endocrinology (2007) 39, 223–237

T SABO-ATTWOOD, J L BLUM and others . Characterization of bass estrogen receptors226
effect of ER mixtures were prepared similarly, except thetotal amount of DNA in the ER tube was increased to atotal of 2 mg using the empty pCMV4 expression vector tomaintain a constant mass of DNA.
Eighteen hours following transfection, the mediumwas aspirated and replaced with charcoal-strippedmedium containing the respective treatments (E2 (10,25, 50, 75, 100, 500, and 1000 nM), NP (0.1, 0.5, 1, 5,and 10 mM), ICI 182 780 (5 mM), ZM 189 154 (5 or10 mM)) keeping the amount of vehicle constant ateither 0.1% for single chemicals or 0.2% for multiplechemicals in the ER antagonist assays. Treatments wereallowed to continue for 48 h at which time the mediumwas removed, and the cells rinsed once with PBS(137 mM NaCl, 2.9 mM KCl, 8.1 mM Na2PO4, and1.5 mM KH2PO4 (pH 7.5)). The cells were then lysed atroom temperature using passive lysis buffer (Promega,Fitchburg, WI, USA) for about 20 min on a shaker.Twenty microliters of lysate were then added to wells ofa 96-well Lumitrac 200 plate (Greiner Bio-One,Germany) for assay of both firefly and renilla luciferaseactivities using the Dual Luciferase Reporter assaysystem (Promega). The lysates were measured on aPlateLumino luminometer (Stratec Biomedical SystemsAG, Birkenfeld, Germany) with two reagent injectors.
Model construction
The amino acid sequences used to make the structuralmodels of LMB ERa, ERbb, and ERba were obtainedfrom the National Center for Biotechnology Infor-mation (NCBI) database (accession numbersAAG44622, AAO39210, and AAO39211 respectively).Models of the LMB ER ligand-binding domains (LBDs)were built with the program Swiss-Model using theExpasy web server, http://swissmodel.expasy.org(Peitsch 1996, Guex et al. 1999, Schwede et al. 2003).The template used for the construction of all threeLMB ER domains was the crystal structure of hERa(PDB accession code: 1A52; Tanenbaum et al. 1998).Modeling of E2 into the LMB ER LBDs was performedby least-squares fitting of each individual model ontothe crystal structure of hERa in complex with E2. Allmodel visualization and manipulation were done withthe interactive graphics program Coot (Emsley &Cowtan 2004). The molecular interactions of hERaand E2 were determined with BobScript and renderedwith Raster3D (Esnouf 1999).
Statistical analysis
For QRT-PCR, the 18S rRNA-normalized copy numberfor each gene was log10 transformed. The transformedvalues were then compared by ANOVA using treatment,
Journal of Molecular Endocrinology (2007) 39, 223–237
time, and the interaction effect treatment!time (whereappropriate). Where the effect of treatment was found tobe significant (P%0.05), differences between the treat-ments were determined by Duncan’s multiple range test(DMRT). When the effect of the treatment!timeinteraction was significant, the data were sorted by timeand the treatments were compared by DMRT (aZ0.05).
Firefly luciferase values were normalized to therespective Renilla luciferase values. For single chemicals,the fold change of the normalized luciferase values wascomputed by dividing each reading by the average of thevehicle response. For experiments looking at ERinteractions, the fold changes were computed as withthe single chemical experiments but used the emptypCMV4 expression as control. In experiments using ERinhibitors, the values of the double vehicle were used asthe control.
After the fold changes were computed, the data wereanalyzed by ANOVA using treatment, experiment, andthe interaction as the main effects using the StatisticalAnalysis System 8.1 (SAS Institute Inc., Cary, NC, USA).When the treatment value was found to be significant(P%0.05), further testing was done by DMRT. Datapresented are meansGS.E.M. and are the result of atleast three independent experiments with three wellsper treatment per plate.
Results
NP increases the expression of ERa and vtg1 in LMBliver tissue
Previously, we have shown that E2 enhances theexpression of ERa and vtg1 in LMB liver tissue in adose-dependent manner, and induced ERba (previouslycalled ERg) expression only at the highest dose of E2
tested (2.5 mg/kg). E2 did not enhance the expression ofERbb in those studies (Sabo-Attwood et al. 2004). Todetermine whether NP would have a similar effect on thetranscription of these genes, we treated LMB with threedoses NP (5.0, 25.0, or 50.0 mg/kg) and compared theeffects with 0.5 mg/kg E2. Exposure to 25 and 50 mg/kgNP significantly increased levels of ERa, with the highestdose of NP increasing levels comparable with 0.5 mg/kgE2 (Fig. 1A). No significant differences were observed inthe expression levels of ERba or ERbb at any of the dosesof NP tested (Fig. 1B and C).
vtg1, a gene known to be regulated by ERs and acommon biomarker of estrogenic exposure, haspreviously been shown to be dose-responsive to E2 inLMB (Bowman et al. 2002, Sabo-Attwood et al. 2004).Figure 1D shows that NP also increased the expressionof vtg1 in a dose–responsive manner, with the twohighest doses (25 and 50 mg/kg) giving statisticallysignificant changes when compared with control. The
www.endocrinology-journals.org

C 5 25 50 0·50
2
4
6
8
10
Log
norm
aliz
ed c
opy
#
E2 (mg/kg)NP (mg/kg)
A
a
bc
a
bcd
ERα
C 5 25 50 0·50
2
4
6
8
10
E2 (mg/kg)NP (mg/kg)
D
a a
ab
bc
Log
norm
aliz
ed c
opy
#
Vtg1
Log
norm
aliz
ed c
opy
#
C 5 25 50 0·50
2
4
6
8
E2 (mg/kg)NP (mg/kg)
C
aa
a a a
ERβb
10
C 5 25 50 0·50
2
4
6
8
E2 (mg/kg)NP (mg/kg)
Log
norm
aliz
ed c
opy
#
B
aa
aa a
ERβa
10
Figure 1 Expression of ER isotypes and vtg1 in LMB livers following exposure to varying doses of NP or asingle dose of E2. Livers of LMB males (nZ5 per group) were injected with the control vehicle DMSO (C)(clear bars), NP (5.0, 25.0, and 50.0 mg/kg; solid bars), or 0.5 mg/kg E2 (cross-hatched bars) by injection(i.p.) were assayed after 24 h for the expression of (A) ERa, (B) ERba, (C) ERbb, and (D) vtg1 by QRT-PCR. Raw data were first normalized to 18S rRNA, converted to copy number and then log10 transformed.Data are presented as mean log10 of the normalized copy number per mg of total RNAGS.E.M. Treatmentswhose means were significantly different are represented with different letters.
Characterization of bass estrogen receptors . T SABO-ATTWOOD, J L BLUM and others 227
highest levels of vtg1 observed overall occurredfollowing exposure to 0.5 mg/kg E2.
Time-course profiles of LMB ERs and vtg1 in
response to E2 and NP
Expression levels of the three ERs in the liver weremeasured as a function of time at 24-, 48-, and 144-h post-exposure to single injections ofNP (5, 25, and 50 mg/kg)or E2 (0.5, 1.0, and 2.5 mg/kg; Fig. 2). These times wereselected based on previous studies that show peakexpression of ERa between 24 and 48 h, returning tobasal levels by 5–7 days post-treatment (Bowman et al.2002).We also wanted to assess whether the ERb isoformswere responsive to E2 and NP at other time points.Figure 2 shows that ERa transcriptional levels aresignificantly increased at all of the time points analyzedfollowing exposure to the highest dose of E2 (2.5 mg/kg;Fig. 2A). Although peak levels were seen at 24 h, theexpression levels remained elevated at 48 and 144 hwhen
www.endocrinology-journals.org
compared with controls. Significantly increased levelswere also observed for the mid (1.0 mg/kg) and low(0.5 mg/kg)doses ofE2withpeak levels occurringat 24-hpost-exposure. Levels of ERa were also significantlyinduced by NP, but only at the two highest doses tested(Fig. 2B). In addition, the levels of ERa were sustained byNP since peak levels were observed at 24 and 48 hcompared with the pattern elicited by E2.
ERba was upregulated by E2 only at the highest dose(2.5 mg/kg) and only at 24-h post-exposure (Fig. 2C).The other concentrations of E2 and all concentrationsof NP failed to significantly induce the expression ofthis receptor (Fig. 2C and D). ERbb was unaltered at alltimes and doses of both E2 and NP (Fig. 2E and F).While the overall pattern of induction for ERa wassimilar in NP and E2 exposed fish, the magnitude ofinduction with NP was comparatively less. The datareveal that a dose of NP that is 100 times higher than E2
elicits a similar magnitude of induction of ERatranscriptional levels.
Journal of Molecular Endocrinology (2007) 39, 223–237

0 20 40 60 80 100 120 140 1600
1
2
3
4
5
6NP
0 20 40 60 80 100 120 140 1600
1
2
3
4
5
6
E2
A
0 20 40 60 80 100 120 140 1600
1
2
3
4
5
6
ERα
ERβa
ERα
C
0 20 40 60 80 100 120 140 1600
1
2
3
4
5
6 ERβa
0 20 40 60 80 100 120 140 1600
1
2
3
4
5
ERβb
0 20 40 60 80 100 120 140 1600
1
2
3
4
5
6ERβbE
D
Log
norm
aliz
ed c
opy
#Lo
g no
rmal
ized
cop
y #
Log
norm
aliz
ed c
opy
#
Log
norm
aliz
ed c
opy
#Lo
g no
rmal
ized
cop
y #
Log
norm
aliz
ed c
opy
#
Time (hours)
**
**
**
*
* *
* *
6 F
B
Figure 2 Time course of ER isotype expression following exposure to E2 and NP. Livers frommale LMB (nZ5 per group) injected with vehicle (DMSO), 0.5 mg/kg E2 (circles), 1.0 mg/kg E2
(triangles), 2.5 mg/kg E2 (squares) or 5 mg/kg NP (circles), 25 mg/kg NP (triangles), and50.0 mg/kg NP (squares) by injection (i.p.) were assayed at 24, 48, and 144 h following treatmentfor the expression of ERa (A and B), ERba (B and C), and ERbb (E and F) by QRT-PCR. Alldata are presented as the log10 transformed mean number of copies per mg of total RNA.Statistically significant differences between control and treated fish (P%0.05) for each time pointare represented with an asterisk.
T SABO-ATTWOOD, J L BLUM and others . Characterization of bass estrogen receptors228
Figure 3 shows that NP increased the expressionof vtg1 mRNA by 24 h and then further increased itat 48-h post-injection, indicating that the effect ofNP on this gene was sustained similarly to theeffects on ERa. With 0.5 mg/kg E2 on the otherhand, vtg1 expression peaked within the first 24 hand then significantly declined by 48 h, although itremained elevated when compared with controlvalues. At 48 h, the levels of vtg1 in response toE2 were comparable with the expression elicited by50 mg/kg NP at 24 h. As seen for ERa, the peaklevels of vtg1 obtained following exposure to E2 and
Journal of Molecular Endocrinology (2007) 39, 223–237
NP were similar, indicating that a dose of NP 100times greater than E2 is required to elicit similartranscriptional levels of this gene. By 144 h, theexpression of vtg1 returned to control levels forboth chemicals.
Determination of NP metabolites in LMB bile
We measured concentrations of NP metabolites inpooled samples of bile from fish exposed to 50 mg/kgNP and the results are presented in Table 1. The levels
www.endocrinology-journals.org

Log
norm
aliz
ed c
opy
#
0 20 40 60 80 100 120 140 1605
6
7
8
9
10
E2NP*
**
*
Time (hours)Figure 3 Time course of expression for vtg1 following treatmentwith E2 and NP. The livers of male LMB (nZ5 per group) injectedwith vehicle control (DMSO), 50.0 mg/kg NP (triangles), or2.5 mg/kg E2 (circles) were assayed at 24, 48, and 144 h forchanges in the expression of the vtg1 mRNA by QRT-PCR.Changes in expression are presented as the log10 of thetransformed number of copies per mg of total RNA. Statisticallysignificant differences (P%0.05) between control and treated fishfor each time point are represented with an asterisk.
E2(mg/kg)NP (mg/kg)
Ng/
ml
C 5 25 50 0·5 1 2·50
1
2
3
4
5
6
aab
a
b
a
b
c
Figure 4 Quantification of plasma E2 in LMB exposed to E2
and NP. Plasma was isolated from LMB males (nZ5 pergroup) injected with the vehicle control DMSO (C) (clear bar),NP (5.0, 25.0, and 50.0 mg/kg; solid bars) or E2 (0.5, 1.0,and 2.5 mg/kg; hatched bars) 24-h post-exposure. The levelsof E2 were measured by EIA and are expressed as meanng/ml plasma. Statistically significant differences (P%0.05)between treatments are represented with letters.
Characterization of bass estrogen receptors . T SABO-ATTWOOD, J L BLUM and others 229
were similar at 24 (1083.6 mg NP/mg total bile protein)and 48 h (995.5 mg NP/mg total bile protein),suggesting slow clearance of NP via biliary excretion.
Plasma levels of E2 are increased by NP
Although it has been suggested that xenoestrogens binddirectly to ERs to activate gene transcription, it has alsobeen shown that they can alter the synthesis orbiotransformation of endogenous hormones by alterna-tive pathways. Figure 4 shows that the highest dose of NPused in these experiments significantly increased E2
concentrations in the blood to w1.0 ng/ml by 24 h.This was the dose and timewhere peak expression of ERaandvtg1wasobserved.Asexpected, therewas a significantdose-dependent increase in plasma E2 levels when fishwere injected with E2 (0.5, 1.0, and 2.5 mg/kg).
Activation of LMB ERa, ERba, and ERbb in HepG2
cells by E2
To assess the activity of the ERs in response to varyingconcentrations of E2, each ER in combination with an
Table 1 Measurement of 4-nonylphenol (NP) in mg/g in the bile
Control 50mg/kg NP
24 h 1.12 105048 h 2.28 905
www.endocrinology-journals.org
ERE–luciferase reporter plasmid was transfected intohuman HepG2 cells. This cell line contains undetect-able levels of endogenous hERs (data not shown) so it isan appropriate cell line in which to assess the activity ofLMB ERs. Following exposure to E2 (10–1000 nM) orethanol as a control (0.1%), each of the three ERs wasresponsive in a dose-dependent manner as measured byactivation of transcription of the luciferase reportergene (Fig. 5A). ERa was the most sensitive receptorbecoming distinct from vehicle at 25 nM, and it went onto reach the greatest magnitude over the ethanolcontrol. Each of the ERbs required 50 nM E2 forreceptor activity, with ERbb reaching a greater level oftranscriptional activation than ERba. The EC50 valueobtained for ERa was 106.8 nM with a 95% confidenceinterval (CI) of 76.66–148.9 nM. For the ERbs, the EC50
values were similar with ERba at 125.7 nM and ERbb at134.8 nM. ERba and ERbb had 95% CIs at the EC50 of67.82–232.9 and 88.24–205.8 nM respectively.
Activation of LMB ERa, ERba, and ERbb in HepG2
cells by NP
In order to determine the effect of NP on ER activity,the LMB ERs were transfected into HepG2 cells asdescribed previously and the cells were treated with0.1–10 mM NP or ethanol vehicle (0.1%). Figure 5Bshows the results of these experiments. ERa and ERbbwere most sensitive to NP. ERa responded at 0.1 mMandcontinued to rise in activity through 5 mM where itreached a plateau of about 9.5-fold activity over vehicle.ERbb also responded at 0.1 mM and reached a plateauat 1.0 mM resulting in 7.5-fold activity over vehicle. ERbadid not respond as the dose–response curve was not
Journal of Molecular Endocrinology (2007) 39, 223–237

0
10
20
30
40ERα
Fol
d ch
ange
from
eth
anol
a
cd
e
ff
R2=0·9541
ab
CE2(nM)10 100 1000
E2(nM)
ERβa
a a a bb bc c
R2=0·8824
C 10 100 1000
ERβb
a a a bcc,d d
e
R2=0·9385
CE2(nM)
10 100 1000
A
Fol
d ch
ange
from
eth
anol
NP(µM) NP(µM)NP(µM)
0
2
4
6
8
10
ab
c
d
b
ERαR2=0·9647
C 0·1 1·0 10·0
B
c,d
a
b
c
dd
ERβbR2=0·9602
C 0·1 1·0 10·0
a a a a ab
ERβaR2=0·8794
C 0·1 1·0 10·0
CEC 50Value E2 95% CI of EC 50
ERα 106·8nM 76·66–148·9nMERβa 125·7nM 67·82–232·9nMERβb
ERαERβaERβb
134·8nM 88·24–205·8nM
EC 50 Value NP 95% CI of EC 50
1052nM 684·8–1617nM–
270·3nM 169·5–430·8nM–
Figure 5 Activation of LMB ERs in response to E2 and NP. Eighteen hours following transfection, cellswere treated with (A) E2 (10, 25, 50, 75, 100, 500, or 1000 nM) or (B) NP (0.1, 0.5, 1, 5, or 10 mM) in avehicle of ethanol (0.1%) in charcoal-stripped serum containing medium. Cells were lysed 48 hfollowing treatment with 100 ml passive lysis buffer and 20 ml cellular lysate were assayed for firefly andrenilla luciferase activities. The ratio of firefly luciferase to renilla luciferase was computed for eachsample, and the fold change of each chemical concentration was calculated compared with vehicle.The data were analyzed by ANOVA and differences between concentrations were determined byDuncan’s multiple range test (aZ0.05). Data presented are the meansGS.E.M. from triplicate wells fromthree independent experiments. Means with different letters were found to be significantly different.(C) Calculated EC50 from the curves presented above.
T SABO-ATTWOOD, J L BLUM and others . Characterization of bass estrogen receptors230
different to that of the empty pCMV expression vector(data not shown).
ERa was found to have an EC50 of 1.05 mMwith a 95%CI of 0.69–1.62 mM. No EC50 value could be calculatedfor ERba, due to both the lack of significant effectof treatment and the near linear horizontal slope ofthe dose–response curve. ERbb, on the other hand, hadan EC50 of 0.27 mMwith a range of 0.17–0.43 mM. Basedon EC50 values, NP was found to be about 10% as potentan agonist for ERa as E2, while it was found to be about50% as potent as E2 for ERbb (Fig. 5C).
Journal of Molecular Endocrinology (2007) 39, 223–237
Effects of antagonists ICI 182 780 or ZM 189 154 on ERactivation by E2
To further characterize the LMB ERs, transfectedHepG2 cells were treated with 500 nM E2 with orwithout the ER antagonists ICI 182 780 (ICI; 5 mM) orZM 189 154 (ZM; 5 or 10 mM) based on concen-trations used in other fish models (Hornung et al.2003), or with ethanol as vehicle (0.2%). Figure 6shows that ICI at 5 mM (tenfold molar excess over E2)was able to completely inhibit ERa activity to the levelof vehicle alone. ICI was unable to significantly
www.endocrinology-journals.org

ERβb
a
aa
a
b
c
EtOH+
EtOH
E2 +
EtOH
E2+
5µMICI
E2+
5µMZM
E2+
10µMZM
EtOH+
10µMZM
a aa
a
b
b
aa a a
a
b
Fol
d ch
ange
from
eth
anol
Fol
d ch
ange
from
eth
anol
Fol
d ch
ange
from
eth
anol
A
ERα
ERβa
0
2
4
6
8
10
0
2
4
6
8
10
0
2
4
6
8
10 B
HO
OH
S
O
FF
F
FF
HO
S
O
F
F
F
F
OH
ICI 182 780
ZM 189 154
F
Figure 6 Inhibition of LMB ER activity by antagonists. (A) Cells were transfected as described inFig. 5. Eighteen hours after transfection, the cells were treated with 0.5 mM E2 with or without theinhibitors ICI 182 780 (5 mM) or ZM 189 154 (5 or 10 mM) in a vehicle of ethanol (0.2%). The foldchange values were compared by ANOVA and when the treatment effect was found to besignificant (P%0.05), differences between the treatments were determined by Duncan’s multiplerange test with aZ0.05. Data are presented as the meanGS.E.M. from triplicate wells from threeindependent experiments. Bars with different letters were found to be significantly different.(B) Chemical structures of the antagonists.
Characterization of bass estrogen receptors . T SABO-ATTWOOD, J L BLUM and others 231
decrease the activity of ERba, while it was able todecrease ERbb activity by w55% versus E2 alone. ZMat either concentration (10- or 20-fold molar excessover E2) was able to completely inhibit the transcrip-tional activation for all three ERs stimulated by E2. Onits own, ZM was unable to stimulate transactivation ofany of the ERs, showing that it acts as a pureantagonist for this response.
Modulation of ERa activity by ERba or ERbb
In certain tissue types, both ERa and ERb are foundco-expressed and it has been hypothesized that theirdifferential response to estrogenic ligands in control
www.endocrinology-journals.org
of downstream transcriptional activity is regulated, inpart, by the formation of ER heterodimers. Toaddress this possibility, a set of experiments wereperformed to measure the effect of increasing theamount of either ERba or ERbb against a constantamount of ERa. Figure 7 shows that in both sets ofexperiments, ERa alone stimulated a 16-fold increasein transcriptional activity whereas ERba and ERbbalone were each able to stimulate a four- and eight-fold increase in activity respectively. The addition of0.1 mg (20% of ERa) ERba resulted in w37.5%decrease in activity, while the addition of 0.1 mgERbb resulted in w25% decrease in activity. Adding0.25 mg (50% of ERa) ERba resulted in a 44.4%decrease of overall activity, while the addition of
Journal of Molecular Endocrinology (2007) 39, 223–237

pCMV 1·0 0·5 0·4 0·25 -- 0·5ERα -- 0·5 0·5 0·5 0·5 --ERβa -- -- 0·1 0·25 0·5 0·5
e
a
b
c d d
pCMV 1·0 0·5 0·4 0·25 -- 0·5ERα -- 0·5 0·5 0·5 0·5 --ERβb -- -- 0·1 0·25 0·5 0·5
a
b
c c,d
dc,d
Fol
d ch
ange
from
eth
anol
Fol
d ch
ange
from
eth
anol
0
2
4
6
8
10
12
14
16
18
0
2
4
6
8
10
12
14
16
18
Figure 7 LMB ERba and ERbb modulate ERa activity. Cells were transfected with varying amounts of thethree LMB ERs as described in Fig. 5. Following transfection, the cells were treated with 0.5 mM E2 inethanol (0.1%) or with ethanol alone in charcoal-stripped serum containing medium. The data wereanalyzed for the effect of treatment by ANOVA and when differences were found, the different expressionvector combinations were compared by Duncan’s multiple range test (aZ0.05). Vector combinations withdifferent letters were found to be significantly different. Data are presented as the meanGS.E.M. fromtriplicate wells from two independent experiments.
T SABO-ATTWOOD, J L BLUM and others . Characterization of bass estrogen receptors232
0.25 mg ERbb resulted in no greater loss in activity.Co-transfection of an equal amount of either ERb orERa resulted in no further significant decrease inactivity.
Model of ERa with E2
Structural models of proteins may help us explaindifferences in ER activity in response to estrogens.The percentage sequence identity among the LMBERa, ERbb, and ERba LBDs compared with that ofthe hERa is 46, 45, and 44% respectively. A least-squares fit of the three LMB ER LBD modelsresulted in an average root-mean-square deviation,for all atoms, of !1.0 A. Using the hER as a modelreceptor, we show which amino acids make contactwith E2 (Fig. 8). This model predicts residues fromhERa that make hydrogen bonding interactions(yellow ball-and-stick) and form a hydrophobic-binding pocket for E2 (red half-moons). Respectiveresidues that contact E2 in the LMB ERs are identicalto hERa except the bass ERa contains a methionine(M) instead of a leucine (L) at position 349.
Discussion
We have previously shown that injection of LMB withincreasing concentrations of E2 resulted in theinduction of ERa, ERba (to a smaller extent), andvtg1 in liver tissue (Sabo-Attwood et al. 2004), indicatingthat the impact of E2 on the transcriptional regulationand activation of the different ER isotypes are notidentical. The goal of this study was to observe changesin the expression and activity of three LMB ER isotypes
Journal of Molecular Endocrinology (2007) 39, 223–237
and vtg1 following exposure to the environmentalcontaminant NP. Based on previous studies, wehypothesized that NP would act as a weak estrogenand induce transcription of E2-activated genes (ERaand vtg1) through an ER-mediated process. Theproduction of vtg in male fish has been clearly linkedto reproductive impacts in multiple species andpopulations (Miller et al. 2007). Altered reproductivebiomarkers of LMB from contaminated field sites havebeen documented (Sepulveda et al. 2002, 2003, Schmittet al. 2005) and causally linked to xenoestrogenexposures (at least in part).
Regulation of LMB ER isotype and vtg1 expression byNP in vivo
Results from our studies reveal that vtg1 and only ERamRNA levels were significantly increased followingexposure to NP (25 and 50 mg/kg), whereas no changein the levels of ERba and ERbb was observed for any ofthe doses at the time points measured. This is consistentwith our previous report showing a strong correlationbetween the induction of vtg1 and ERa mRNA duringthe reproductive cycle of female LMB and in malesinjected with E2 (Sabo-Attwood et al. 2004). Interest-ingly, in our previous study, ERba levels were signi-ficantly increased only by our highest dose, 2.5 mg/kgE2 (Sabo-Attwood et al. 2004). None of the NP dosestested stimulated ERba levels in the present study,indicating that even the highest dose of NP was muchless potent than 2.5 mg/kg E2. Similar levels of ERa andvtg1 induction were noted in response to 0.5 mg/kg E2
and 50 mg/kg NP, indicating that NP is w100-fold lesspotent by comparison. Based on this observation, ourhighest dose of NP would unlikely produce a similar
www.endocrinology-journals.org

A
H524
R394E353
estradiolI424
M343
M388
L391
F404
L346
L387
L525
L384
W383
A350
L349
L402
B
Figure 8 Predicted model of LMB ERa with ligand. (A) Ribbondiagram of LMB ERa with E2 bound. Backbone with predictedsecondary structure is shown in grey with estradiol in yellow ball-and-stick. Figure was generated with PyMOL. (B) Molecularinteractions of hERa and E2. E2 and residues from hERa that makehydrogen bonding interactions are shown in yellow ball-and-stickand are as labeled. Residues that form a hydrophobic-bindingpocket are indicated as red half-moons and are also as labeled.The model was generated with BobScript and rendered withRaster3D. For readers of the printed journal a colour version of thisfigure can be found at http://dx.doi.org/10.1677/JME-07-0038.
Characterization of bass estrogen receptors . T SABO-ATTWOOD, J L BLUM and others 233
response as 2.5 mg/kg E2. In a recent study (Filby &Tyler 2005), aqueous exposures of fathead minnows toE2 failed to induce transcription of ERba in the liver,suggesting that this isotype is not strongly regulated atthe transcriptional level by E2 at the concentrationsnaturally found in fish throughout the reproductivecycle. It is noteworthy to mention that we have
www.endocrinology-journals.org
documented high levels of ERba (and ERbb) in LMBovarian tissue when plasma levels of E2 were low,indicating that the transcriptional regulation of theERbs may not be steroidal in nature and is cell-typespecific (Sabo-Attwood et al. 2004). In contrast, goldfishERba mRNA was inducible by NP in the liver (Soverchiaet al. 2005) following chronic water exposure. Thereason for this discrepancy is unclear but may be relatedto route and duration of exposure in the twoexperiments, or alternatively using primers that didnot distinguish the different receptor isotypes. Theexpression of ERa mRNA was not measured in thoseprevious reports, which seems to be the most highlyexpressed receptor in response to both E2 and NP inbass and other fish (Filby & Tyler 2005).
Overall, the similar expression profiles for the threeERs and vtg1 in LMB liver tissue exposed to NPcompared with E2, albeit at lower magnitudes, confirmsNP is weakly estrogenic. Furthermore, these datasuggest that ERa is the only isotype strongly auto-regulated by estrogens at the transcriptional level in theliver, an observation that may be due to variedpromoter-response elements and cell-specific pools ofco-effector proteins. Although the transcriptionalresponse of the ERs and vtg1 was similar between E2
and NP, the time-course plots suggest that activation ofERa and vtg1 by NP is more sustained. Differences indistribution and clearance of E2 and NPmay contributeto this observation. Increased levels of NP metaboliteswere detected in LMB bile, consistent with otherobservations that show biliary excretion is a majorroute of NP removal from fish (Coldham et al. 1998,Arukwe et al. 2000b). A chief clearance pathway of E2
and NP includes the generation of glucuronideconjugates and it is possible that exposure to NP,especially at high doses, saturates this pathway, resultingin prolonged circulation of E2. This may contribute tothe increased levels of plasma E2 observed in NP-treatedLMB. This level of induction (1 ng/ml) is similar tophysiological levels seen in female LMB during activereproduction and corresponds to peak levels observedin this species during the annual reproductive cycle.Although NP has been shown to interact directly withthe ERs of numerous species (White et al. 1994, Kuiperet al. 1998, Balaguer et al. 1999, Nishikawa et al. 1999,Gale et al. 2004), a few reports have suggested that theestrogenic effects of NP in vivo are the result fromaltered levels of endogenous steroids (Acevedo et al.2005, Matsumura et al. 2005, Soverchia et al. 2005).Exposure of fathead minnows to NP also resulted inincreased levels of plasma E2 with a concomitantdecrease in testosterone (Soverchia et al. 2005). Othershave shown that NP enhanced 20a- and 20b-hydroxy-steroid dehydrogenase activities and inhibited glucur-onidation pathways involved in the clearance of E2 incarp microsomes (Thibaut & Porte 2004), and
Journal of Molecular Endocrinology (2007) 39, 223–237

T SABO-ATTWOOD, J L BLUM and others . Characterization of bass estrogen receptors234
increased the expression of aromatase (CytochromeP450-19; CYP19) in fish (Min et al. 2003, Kazeto et al.2004) but not in mammalian models (Odum et al.2001). These observations suggest that NP-inducedalterations in steroid synthesis, metabolism, andclearance, in addition to direct activation of ERacontribute to the estrogenic effects of this compoundin fish. The role of these individual components inNP-induced endocrine alterations remains to bedetermined.
Differential activation of LMB ER subtypes by E2
and NP
To understand potential functional differences of theER isotypes, a reporter gene assay was developed toassess their activity in liver cells. Using this system, weobserved little difference for the computed EC50 valuesamong the bass ERs (106.8–134.8 nM). This is similar towork with zfERs by Bardet et al. (2002). These values aremuch higher than those reported for the hERs whereEC50 values for the hERa and hERb range from 0.1 to 4nM and from 5 to 10 nM respectively, depending on thereporter assay employed (Hall & McDonnell 1999,Gaido et al. 2000). In general, fish have highercirculating concentrations of E2 (600–3900 pg/ml forfemales (Orlando et al. 1999, Gross et al. 2002,Sabo-Attwood et al. 2004)) in comparison with humanfemales which range from 23 to 361 pg/ml dependingon time of the menstrual cycle (during pregnancy,normal concentration can be as high as 35 000 pg/ml;Simpson & MacDonald 1981). Previous studies haveshown that the rainbow trout ER binds E2 with tenfoldless affinity than hER, which may be a result of variedprotein structure, andmay explain why higher levels arenoted in fish. Furthermore, it has been suggested thatsince the body temperature of fish is generally less thanin humans, compelling the bass ERs to fold andfunction normally at 37 8C in the HepG2 assays maycause them to need far more ligand than what mayusually be required by warm-blooded species (Matthewset al. 2001).
Although the EC50 values were similar, the level ofactivity varied for each ER. ERa was most responsive toE2, followed by ERbb; whereas ERba was minimallyaffected. At equivalent concentrations, ERbb activitywas approximately half that observed for ERa. This isconsistent with the differences in activity for the hERsreported previously in HepG2 cells, where the activity ofhERb was 20–60% of hERa (Hall & McDonnell 1999).Since ERa and ERb of other species, includingmammals and fish, bind E2 with similar affinity, andamino acids that directly interact with E2 are almostidentical (Fig. 8), their differential activity is more likelydue to distinct interactions with endogenous co-acti-vator and co-repressor proteins.
Journal of Molecular Endocrinology (2007) 39, 223–237
The effects of the model endocrine disruptor, NP, ontranscriptional activation of the bass ERs showed thatERa and ERbb respond to NP in a dose-dependentmanner, however, ERba did not. This finding isdifferent from data published by Legler et al. (2002)who found that all three of the zf ERs, including ERba(ERg in their report) were responsive. The pattern ofER inducibility was also different between bass and zf.Bass ERa and bass ERbb had EC50 values of 1.052 and0.27 respectively, compared to values of 1.48 and 0.42respectively for the zf homologs. Legler et al. (2002) alsocompared the zf ER response with NP with hERsfinding EC50 values of 0.11 and 0.145 mM for ERa andERb respectively. One reason for the differences inthese two reports may be the use of different cell types.Legler et al. used HEK293 cells, while HepG2 cells wereused in the present study. Also using HepG2 cells, Yoonet al. (2000) showed that NP can stimulate activity ofhERa via either AF-1 or AF-2 domains using receptordeletion mutants, finding that the AF-1 domain can beactivated by lower concentrations of NP than the AF-2domain. However, the wild-type full-length ERaresponded more like the AF-2 domain. Taking thesefindings into account, the differences in the amino acidcomposition of the receptor isotypes in the AF domainsmay be responsible for the lack of response throughERba.
Inhibition of ER activity by the antagonists ICI 182 780
and ZM 189 154
ERa was inhibited in activity by the ER antagonist ICI182 780 when the cells were treated with tenfold molarexcess over E2. When the same treatment was done withthe ERbs, we did not see a significant decrease in ERbaactivity and only a 55% decrease in receptor activity forERbb, where the activity still remained significantlyhigher than vehicle. When the receptors were chal-lenged with ZM 189 154, we found the receptors fullyinhibited with a tenfold molar excess of inhibitor toligand. In addition, the ZM compound did not exhibitany agonist activity in these assays. The differencesobserved in the abilities of the two ‘pure’ estrogenantagonists to inhibit transactivation of the bass ERs wasnot anticipated, since amino acid residues known to beinvolved directly in E2 binding in the LBDs are identicalin the three receptors (Fig. 8). There must be otheramino acid residues which directly interact with theantagonists and recruit variable pools of co-repressorproteins that contribute to these differences.
Modulation of ERa activity by ERba and ERbb
Tremblay et al. (1999) first demonstrated that hERa/bheterodimers can occur following treatment in gel shift
www.endocrinology-journals.org

Characterization of bass estrogen receptors . T SABO-ATTWOOD, J L BLUM and others 235
assays from transfected cells. They then showed thatwhen transfected in combination, a 33% decrease intranscriptional activity through a basal ERE promoteroccurred. Hall & McDonnell (1999) went on to showthat by increasing the amount of hERb, the overallactivity of hERa can be decreased in direct relation tothe concentration of hERb, and that this only occurs atsub-saturating concentrations of E2. This is similar toour findings where the addition of increasing concen-trations of either of the ERbs with ERa reduced theamount of transcriptional activity observed with ERaalone. These observations imply that the ratio of ERs ina given cell plays a role in target gene activation. It hasbeen suggested that the AF-1 domain of hERb has arepressor function that is the cause of the overalldecrease in activity of the ERa/ERb heterodimericcomplex (Hall & McDonnell 1999). Further studies areneeded to address the molecular basis of theseobservations, but these results stress the importanceof cellular composition for ER transcriptionalregulation of downstream target genes. We arecurrently in the process of validating antibodiesdesigned to specifically distinguish the three ERs.These will be useful for many applications in vivoincluding tissue and subcellular localization of the ERs,dimerization complexes, and assessment of activationby gel shift assays.
Overall conclusions
Based on the data presented, there is evidence showingthat the two ERb subtypes in bass are non-redundant,having differing responses to different ligands, and thatthese in turn are different from ERa. Although themechanistic in vitro data compliment the in vivoobservations observed in this study, we realize thecomplexity of the mechanism in vivo and are aware oftwo assumptions, which require further testing in vivo.These assumptions are that an increase in mRNA levelsof the ERs translates to protein and that the ERisoforms are present in the same cells therebymodulating each others activity in response to ligands.If these assumptions are correct, by altering theamount(s) of receptor present, as well as their activityby agonists and antagonists in the environment,homeostasis in the fish can be seriously compromised,affecting not only the reproductive health, but also thevisceral health of this species. The finding that NP didnot stimulate ERba in the assays in this report, indicatesthat the deleterious effects occurring through ER-mediated pathways does not occur through directactivation of ERba in the liver. Even more broadly, thecombinatorial complexity possible with having threedistinct ERs in nearly every organ system in the bodydoes suggest that further study of other endocrineactive compounds is necessary as proposed by the EPA
www.endocrinology-journals.org
in the Endocrine Disruptor Screening and TestingAdvisory Committee.
Acknowledgements
The authors would like to thank Pierre Chambon forproviding us with the ERE–luciferase construct andTomHutchinson and Astra Zeneca, UK for supplying uswith the ZM 189 154 compound.
Funding
These studies were supported by the Superfund BasicResearch Program from the National Institute ofEnvironmental Health Sciences, P42 ES 07375 andNIEHS RO1 ES015449 to ND and NIH grant GM25154to RM for salary support of ZF. The authors declare noconflict of interest.
References
Acevedo R, Parnell PG, Villanueva H, Chapman LM, Gimenez T,Gray SL & Baldwin WS 2005 The contribution of hepatic steroidmetabolism to serum estradiol and estriol concentrations innonylphenol treated MMTVneu mice and its potential effects onbreast cancer incidence and latency. Journal of Applied Toxicology 25339–353.
Allen Y, Matthiessen P, Scott AP, Haworth S, Feist S & Thain JE 1999The extent of oestrogenic contamination in the UK estuarine andmarine environments-further surveys of flounder. Science of the TotalEnvironment 233 5–20.
Arukwe A, Celius T, Walther BT & Goksoyr A 2000a Effects ofxenoestrogen treatment on zona radiata protein and vitellogeninexpression in Atlantic salmon (Salmo salar). Aquatic Toxicology 49159–170.
Arukwe A, Thibaut R, Ingebrigtsen K, Celius T, Goksoyr A & Cravedi J2000b In vivo and in vitro metabolism and organ distribution ofnonylphenol in Atlantic salmon (Salmo salar). Aquatic Toxicology 49289–304.
Arukwe A, Yadetie F, Male R & Goksoyr A 2001 In vivo modulation ofnonylphenol-induced zonagenesis and vitellogenesis by the anti-estrogen. 3,3 04,4 0-tetrachlorobiphenyl (PCB-77) in juvenile fish.Environmental Toxicology and Pharmacology 10 5–15.
Balaguer P, Francois F, Comunale F, Fenet H, Boussioux AM, Pons M,Nicolas JC & Casellas C 1999 Reporter cell lines to study theestrogenic effects of xenoestrogens. Science of the Total Environment233 47–56.
Bardet PL, Horard B, Robinson-Rechavi M, Laudet V & Vanacker JM2002 Characterization of oestrogen receptors in zebrafish (Daniorerio). Journal of Molecular Endocrinology 28 153–163.
Blom A, Ekman E, Johannisson A, Norrgren L & Pesonen M 1998Effects of xenoestrogenic environmental pollutants on theproliferation of a human breast cancer cell line (MCF-7). Archives ofEnvironmental Contamination and Toxicology 34 306–310.
Bowman CJ, Kroll KJ, Gross TG & Denslow ND 2002 Estradiol-inducedgene expression in largemouth bass (Micropterus salmoides).Molecular and Cellular Endocrinology 196 67–77.
Canadian Environmental Protection Act, 2000 (http://www.ec.gc.ca/CEPARegistry/the_act/contents.cfm).
Journal of Molecular Endocrinology (2007) 39, 223–237

T SABO-ATTWOOD, J L BLUM and others . Characterization of bass estrogen receptors236
Celius T, Haugen TB, Grotmol T & Walther BT 1999 A sensitivezonagenetic assay for rapid in vitro assessment of estrogenic potencyof xenobiotics and mycotoxins. Environmental Health Perspectives 10763–68.
Coldham NG, Sivapathasundaram S, Dave M, Ashfield LA, PottingerTG, Goodall C & Sauer MJ 1998 Biotransformation, tissuedistribution, and persistence of 4-nonylphenol residues in juvenilerainbow trout (Oncorhynchus mykiss). Drug Metabolism and Disposition26 347–354.
Emsley P & Cowtan K 2004 Coot: model-building tools for moleculargraphics. Acta Crystallographica. Section D. Biological Crystallography 602126–2132.
Esnouf RM 1999 Further additions to MolScript version 1.4, includingreading and contouring of electron-density maps. Acta Crystal-lographica. Section D. Biological Crystallography 55 938–940.
Filby AL & Tyler CR 2005 Molecular characterization of estrogenreceptors 1, 2a and 2b and their tissue and ontogenic expressionprofiles in fathead minnow (Pimephales promelas). Biology ofReproduction 73 648–662.
Gaido KW, Maness SC, McDonnell DP, Dehal SS, Kupfer D & Safe S2000 Interaction of methoxychlor and related compounds withestrogen receptor alpha and beta, and androgen receptor:structure-activity studies. Molecular Pharmacology 58 852–858.
Gale WL, Patino R & Maule AG 2004 Interaction of xenobiotics withestrogen receptors alphaandbetaandaputativeplasmasexhormone-binding globulin from channel catfish (Ictalurus punctatus). Generaland Comparative Endocrinology 136 338–345.
Gray LE Jr, Kelce WR, Wiese T, Tyl R, Gaido K, Cook J, Klinefelter G,Desaulniers D, Wilson E, Zacharewski T et al. 1997 EndocrineScreening Methods Workshop report: detection of estrogenic andandrogenic hormonal and antihormonal activity for chemicals thatact via receptor or steroidogenic enzyme mechanisms. ReproductiveToxicology 11 719–750.
Gross TS, Wieser CM, Sepulveda MS, Wiebe JJ, Schoeb TR &Denslow ND 2002 Characterization of annual reproductivecycles for pond-reared Florida largemouth bass (Micropterussalmoides floridanus). In Black Bas: Ecology, Conservation, andManagement, pp 205–212. Eds DP Philipp & MS Ridgway.Bethesda, MD: American Fisheries Society pp 205–212.
Guex N, Diemand A & Peitsch MC 1999 Protein modelling for all.Trends in Biochemical Science 24 364–367.
Hall JM & McDonnell DP 1999 The estrogen receptor beta-isoform(ERb) of the human estrogen receptor modulates ERa transcrip-tional activity and is a key regulator of the cellular response toestrogens and antiestrogens. Endocrinology 140 5566–5578.
Harris CA, Santos EM, Janbakhsh A, Pottinger TG, Tyler CR &Sumpter JP 2001 Nonylphenol affects gonadotropin levels in thepituitary gland and plasma of female rainbow trout. EnvironmentalScience and Technology 35 2909–2916.
Hawkins MB & Thomas P 2004 The unusual binding properties of thethird distinct teleost estrogen receptor subtype ERb are accom-panied by highly conserved amino acid changes in the ligandbinding domain. Endocrinology 145 2968–2977.
Hawkins MB, Thornton JW, Crews D, Skipper JK, Dotte A &Thomas P 2000 Identification of a third distinct estrogenreceptor and reclassification of estrogen receptors in teleosts.PNAS 97 10751–10756.
Hornung MW, Ankley GT & Schmieder PK 2003 Induction of anestrogen-responsive reporter gene in rainbow trout hepatoma cells(RTH 149) at 11 or 18 degrees C. Environmental Toxicology andChemistry 22 866–871.
Jobling S, Beresford N, Nolan M, Rodgers-Gray T, Brighty GC,Sumpter JP & Tyler CR 2002 Altered sexual maturation andgamete production in wild roach (Rutilus rutilus) living in riversthat receive treated sewage effluents. Biology of Reproduction 66272–281.
Journal of Molecular Endocrinology (2007) 39, 223–237
Kannan K, Keith TL, Naylor CG, Staples CA, Snyder SA &Giesy JP 2003Nonylphenol and nonylphenol ethoxylates in fish, sediment, andwater from the Kalamazoo River, Michigan. Archives of EnvironmentalContamination and Toxicology 44 77–82.
Kazeto Y, Place AR & Trant JM 2004 Effects of endocrine disruptingchemicals on the expression of CYP19 genes in zebrafish (Daniorerio) juveniles. Aquatic Toxicology 69 25–34.
Kuiper GG, Lemmen JG, Carlsson B, Corton JC, Safe SH, van der SaagPT, van der Burg B, Gustafsson JA, van der Saag PT, van der Burg Bet al. 1998 Interaction of estrogenic chemicals and phytoestrogenswith estrogen receptor beta. Endocrinology 139 4252–4263.
Latonnelle K, Le Menn F, Kaushik SJ & Bennetau-Pelissero C 2002Effects of dietary phytoestrogens in vivo and in vitro in rainbow troutand Siberian sturgeon: interests and limits of the in vitro studies ofinterspecies differences. General and Comparative Endocrinology 12639–51.
Laws SC, Carey SA, Ferrell JM, Bodman GJ & Cooper RL 2000Estrogenic activity of octylphenol, nonylphenol, bisphenol A andmethoxychlor in rats. Toxicological Sciences 54 154–167.
Lee PC 1998 Disruption of male reproductive tract development byadministration of the xenoestrogen, nonylphenol, to male newbornrats. Endocrine 9 105–111.
Legler J, Zeinstra LM, Schuitemaker F, Lanser PH, Bogerd J, BrouwerA, Vethaak AD, De Voogt P, Murk AJ & Van der Burg B 2002Comparison of in vivo and in vitro reporter gene assays for short-term screening of estrogenic activity. Environmental Science andTechnology 36 4410–4415.
Lin LL & Janz DM 2006 Effects of binary mixtures of xenoestrogens ongonadal development and reproduction in zebrafish. AquaticToxicology 80 382–395.
Matsumura N, Ishibashi H, Hirano M, Nagao Y, Watanabe N,Shiratsuchi H, Kai T, Nishimura T, Kashiwagi A & Arizono K2005 Effects of nonylphenol and triclosan on production ofplasma vitellogenin and testosterone in male South Africanclawed frogs (Xenopus laevis). Biological and PharmaceuticalBulletin 28 1748–1751.
Matthews JB, Clemons JH & Zacharewski TR 2001 Reciprocalmutagenesis between human alpha(L349, M528) and rainbowtrout (M317, I496) estrogen receptor residues demonstratestheir importance in ligand binding and gene expression atdifferent temperatures. Molecular and Cellular Endocrinology 183127–139.
Metcalfe CD, Metcalfe TL, Kiparissis Y, Koenig BG, Khan C, Hughes RJ,Croley TR, March RE & Potter T 2001 Estrogenic potency ofchemicals detected in sewage treatment plant effluents asdetermined by in vivo assays with Japanese medaka (Oryzias latipes).Environmental Toxicology and Chemistry 20 297–308.
Miller DH, Jensen KM, Villeneuve DL, Kahl MD, Makynen EA,Durhan EJ & Ankley GT 2007 Linkage of biochemicalresponses to population-level effects: a case study withvitellogenin in the fathead minnow (Pimephales promelas).Environmental Toxicology and Chemistry 26 521–527.
Min J, Lee SK &GuMB 2003 Effects of endocrine disrupting chemicalson distinct expression patterns of estrogen receptor, cytochromeP450 aromatase and p53 genes in oryzias latipes liver. Journal ofBiochemical and Molecular Toxicology 17 272–277.
Morito K, Hirose T, Kinjo J, Hirakawa T, Okawa M, Nohara T, Ogawa S,Inoue S, Muramatsu M & Masamune Y 2001 Interaction ofphytoestrogens with estrogen receptors a and b. Biological andPharmaceutical Bulletin 24 351–356.
Nimrod AC & Benson WH 1996 Environmental estrogenic effects ofalkylphenol ethoxylates. Critical Reviews in Toxicology 26 335–364.
Nishikawa J, Saito K, Goto J, Dakeyama F, Matsuo M & Nishihara T1999 New screening methods for chemicals with hormonal activitiesusing interaction of nuclear hormone receptor with coactivator.Toxicology and Applied Pharmacology 154 76–83.
www.endocrinology-journals.org

Characterization of bass estrogen receptors . T SABO-ATTWOOD, J L BLUM and others 237
Oakes KD, Hewitt LM, McMaster ME, Wood C, Munkittrick KR &Van Der Kraak GJ 2005 Oxidative stress and sex steroid levels in fishfollowing short-term exposure to pulp-mill effluents. Journal ofToxicology and Environmental Health. Part A A68 267–286.
Odum J, Tinwell H, Van Miller J, Joiner R & Ashby J 2001 Theuterotrophic activity of nonylphenol in the rat is not mediated byaromatase enzyme induction. Toxicology Letters 118 165–169.
Orlando EF, Denslow ND, Folmar LC & Guillette LJ Jr. 1999A comparison of the reproductive physiology of largemouthbass. Micropterus salmoides, collected from the Escambia andBlackwater Rivers in Florida. Environmental Health Perspectives107 199–204.
Peitsch MC 1996 ProMod and Swiss-Model: internet-based tools forautomated comparative protein modelling. Biochemical SocietyTransactions 24 274–279.
Pettersson M, Adolfsson-Erici M, Parkkonen J, Forlin L & Asplund L2005 Fish bile used to detect estrogenic substances in treatedsewage water. Science of the Total Environment 366 174–186.
Radice S, Fumagalli R, Chiesara E, Ferraris M, Frigerio S & Marabini L2004 Estrogenic activity of procymidone in rainbow trout(Oncorhynchus mykiss) hepatocytes: a possible mechanism of action.Chemico-Biological Interactions 147 185–193.
Sabik H, Gagne F, Blaise C, Marcogliese DJ & Jeannot R 2003Occurrence of alkylphenol polyethoxylates in the St Lawrence Riverand their bioconcentration by mussels (Elliptio complanata). Chemo-sphere 51 349–356.
Sabo-Attwood T, Kroll KJ & Denslow ND 2004 Differential expressionof largemouth bass (Micropterus salmoides) estrogen receptorisotypes alpha, beta, and gamma by estradiol. Molecular and CellularEndocrinology 218 107–118.
Schmitt CJ, Hinck JE, Blazer VS, Denslow ND, Dethloff GM, BartishTM, Coyle JJ & Tillitt DE 2005 Environmental contaminants andbiomarker responses in fish from the Rio Grande and its UStributaries: spatial and temporal trends. Science of the TotalEnvironment 350 161–193.
Schwaiger J, Mallow U, Ferling H, Knoerr S, Braunbeck T, Kalbfus W &Negele RD 2002 How estrogenic is nonylphenol? A transgenera-tional study using rainbow trout (Oncorhynchus mykiss) as a testorganism Aquatic Toxicology 59 177–189.
Schwede T, Kopp J, Guex N & Peitsch MCSWISS-MODEL: 2003 Anautomated protein homology-modeling server. Nucleic Acid Research31 3381–3385.
Scott MJ & Jones MN 2000 The biodegradation of surfactants in theenvironment. Biochimica et Biophysica Acta 1508 235–251.
Seki M, Yokota H, Maeda M, Tadokoro H& Kobayashi K 2003 Effects of4-nonylphenol and 4-tert-octylphenol on sex differentiation andvitellogenin induction in medaka (Oryzias latipes). EnvironmentalToxicology and Chemistry 22 1507–1516.
Sepulveda MS, Johnson WE, Higman JC, Denslow ND, Schoeb TR &Gross TS 2002 An evaluation of biomarkers of reproductivefunction and potential contaminant effects in Florida largemouthbass (Micropterus salmoidesfloridanus) sampled from the St JohnsRiver. Science of the Total Environment 289 133–144.
www.endocrinology-journals.org
Sepulveda MS, Quinn BP, Denslow ND, Holm SE & Gross TS 2003Effects of pulp and paper mill effluents on reproductive success oflargemouth bass. Environmental Toxicology and Chemistry 22 205–213.
Simpson ER & MacDonald PC 1981 Endocrine physiology of theplacenta. Annual Review of Physiology 43 163–188.
Sohoni P & Sumpter JP 1998 Several environmental oestrogens arealso anti-androgens. Journal of Endocrinology 158 327–339.
Soto AM, Sonnenschein C, Chung KL, Fernandez MF, Olea N &Serrano FO 1995 The E-SCREEN assay as a tool to identifyestrogens: an update on estrogenic environmental pollutants.Environmental Health Perspectives 103 113–122.
Soverchia L, Ruggeri B, Palermo F, Mosconi G, Cardinaletti G,Scortichini G, Gatti G & Polzonetti-Magni AM 2005 Modulationof vitellogenin synthesis through estrogen receptor beta-1 ingoldfish (Carassius auratus) juveniles exposed to 17-b estradioland nonylphenol. Toxicology and Applied Pharmacology 209236–243.
Tanenbaum DM, Wang Y, Williams SP & Sigler PB 1998 Crystallo-graphic comparison of the estrogen and progesterone receptor’sligand binding domains. PNAS A95 5998–6003.
Thibaut R & Porte C 2004 Effects of endocrine disrupters on sexsteroid synthesis and metabolism pathways in fish. Journal SteroidBiochemistry and Molecular Biology 92 485–494.
Thorpe KL, Hutchinson TH, Hetheridge MJ, Scholze M, Sumpter JP &Tyler CR 2001 Assessing the biological potency of binary mixtures ofenvironmental estrogens using vitellogenin induction in juvenilerainbow trout (Oncorhynchus mykiss). Environmental Science andTechnology 35 2476–2481.
Tremblay GB, Tremblay A, Labrie F & Giguere V 1999 Dominantactivity of activation function 1 (AF-1) and differentialstoichiometric requirements for AF-1 and -2 in the estrogenreceptor a-b heterodimeric complex. Molecular and CellularBiology 19 1919–1927.
White R, Jobling S, Hoare SA, Sumpter JP & Parker MG 1994Environmentally persistent alkylphenolic compounds are estro-genic. Endocrinology 135 175–182.
Wilson VS, Bobseine K & Gray LE Jr. 2004 Development andcharacterization of a cell line that stably expresses anestrogen-responsive luciferase reporter for the detection ofestrogen receptor agonist and antagonists. Toxicological Sciences81 69–77.
Yoon K, Pellaroni L, Ramamoorthy K, Gaido K & Safe S 2000 Ligandstructure-dependent differences in activation of estrogen receptoralpha in human HepG2 liver and U2 osteogenic cancer cell lines.Molecular and Cellular Endocrinology 162 211–220.
Received in final form 3 June 2007Accepted 20 July 2007Made available online as an Accepted Preprint2 August 2007
Journal of Molecular Endocrinology (2007) 39, 223–237