Dissertation- Chap 2: Literature Review and Theoretical Framework
75
17 CHAPTER II LITERATURE REVIEW AND THEORETCAL FRAMEWORK Who are English Learners? Els are students who speak a language other than English at home and are learning English at school. In 201112, Els comprised slightly more than 9% of students in the public K12 system across the nation (NCES, 2012). This percentage varies by state; for example, in the 201112 school year, less then 1% of students in West Virginia were classified as Els, whereas in California 23% of students were Els. Reports document that elementary school Els tend to be concentrated in a relatively small number of schools (Whittenberg, 2011) and that 39% of schools across the country do not enroll any El students (NCES, 2012). The majority of Els in the US, about 73%, come from Spanish speaking homes (Pandya, McHugh, & Batalova, 2011; Gandara & Contreras, 2009). Most of the Spanish speaking Els in public schools are of Mexican origin, but the number of Central American students has been steadily increasing (Flores, Batalova, & Fix, 2012). Across the US, 37.6 million people speak Spanish at home and over 1 million people speak each of the following languages: Chinese (2.9 million), Tagalog (1.6 million), Vietnamese (1.4 million), French (1.3 million), German (1.1 million) and Korean (1.1 million) (Ryan, 2013). The language most frequently spoken after Spanish varies by state and region: in California and Nevada it is Tagalog while in North Carolina, Minnesota, and Wisconsin it is Hmong (Batalova & McHugh, 2010). Researchers describe immigrant students as being of the first, 1.5, second, or third generation (Tellez & Ortiz, 2008). In the US context, first generation immigrants are those who
Transcript of Dissertation- Chap 2: Literature Review and Theoretical Framework

17
CHAPTER II
LITERATURE REVIEW AND THEORETCAL FRAMEWORK
Who are English Learners? Els are students who speak a language other than English at home and are learning
English at school. In 2011-‐12, Els comprised slightly more than 9% of students in the public K-‐12
system across the nation (NCES, 2012). This percentage varies by state; for example, in the
2011-‐12 school year, less then 1% of students in West Virginia were classified as Els, whereas in
California 23% of students were Els. Reports document that elementary school Els tend to be
concentrated in a relatively small number of schools (Whittenberg, 2011) and that 39% of
schools across the country do not enroll any El students (NCES, 2012).
The majority of Els in the US, about 73%, come from Spanish speaking homes (Pandya,
McHugh, & Batalova, 2011; Gandara & Contreras, 2009). Most of the Spanish speaking Els in
public schools are of Mexican origin, but the number of Central American students has been
steadily increasing (Flores, Batalova, & Fix, 2012). Across the US, 37.6 million people speak
Spanish at home and over 1 million people speak each of the following languages: Chinese (2.9
million), Tagalog (1.6 million), Vietnamese (1.4 million), French (1.3 million), German (1.1
million) and Korean (1.1 million) (Ryan, 2013). The language most frequently spoken after
Spanish varies by state and region: in California and Nevada it is Tagalog while in North
Carolina, Minnesota, and Wisconsin it is Hmong (Batalova & McHugh, 2010).
Researchers describe immigrant students as being of the first, 1.5, second, or third
generation (Tellez & Ortiz, 2008). In the US context, first generation immigrants are those who
18
were born in a foreign country and moved to the US themselves as teenagers or adults. The 1.5
generation also immigrated to the US themselves, but are distinguished from the first
generation because they immigrated when they were young and so received the majority of
their schooling in the US. Rumbaut (2004) explains that immigrants in the 1.5 generation
typically identify more strongly with the host culture than immigrants who arrive as adults, but
hold on to their native identity more strongly than second-‐generation immigrants. Second
generation immigrants are those who were born in the US, but whose parents were first
generation immigrants. Finally, third generation immigrants were also born in the US, and have
parents who were second-‐generation immigrants. Only about 22% percent of Els enrolled in
public schools are of the first or 1.5 generation; perhaps surprisingly, the rest are second or
third generation immigrants who have received all of their education in the US (Terrazas &
Batalova, 2010; Suarez, 2007).
Unlike other sub-‐groups used for federal accountability purposes, such as those defined
by race or gender, El describes a temporary status rather than a permanent characteristic of a
student. Students who are learning English are referred to as English learners3 until they reach a
threshold for proficiency in English set by a particular state or district, and are then reclassified
as English proficient (Abedi & Liquanti, 2013). These students, typically labeled as “former Els”
or “reclassified Els”, are informally monitored for several years to ensure their successful
transition away from specialized instruction.
3 There are many terms describing Els. Government agencies tend to use the term LEP, or Limited English Proficient to describe Els. This moniker is problematic as it describes students in terms of their deficits. In this paper I will use the term English learner to refer to students who have been identified as needing language support at school.
19
Els at risk. Els are consistently on the wrong side of the achievement gap. On average,
they perform worse on standardized tests, have higher drop out rates, and have lower college
enrollment rates than native English speaking students (NESs). On the 8th grade National
Assessment for Educational Progress (NAEP) test of reading and math, students can score
below basic, basic, proficient, or advanced. On the 2005 NAEP reading assessment, 27% of NESs
scored below basic compared to 71% of Els. At the other end of the spectrum, 28% of NESs
scored proficient and 3% scored advanced, while only 4% of Els scored proficient and 0% scored
advanced (Batalova, Fix, & Murray, 2007). The gap between Els and NESs on math and reading
scores tends to increase from 4th grade to 8th grade (Hemphill, Vanneman & Rahman, 2011).
Some authors have critiqued the use of comparisons of test score between Els and NESs as the
former is not a static group (Grissom, 2004; Parrish et al., 2006; Saunders & Marcelletti, 2012). The highest
achieving language learners exit El status the most quickly, adding to the pool of non-‐Els. At the same
time, each year recent immigrant students who are not yet proficient in English enroll in public schools
and join the El subgroup. The highest achieving students exit El status in earlier grades, leaving lower
achieving Els and recent immigrants in the El subgroup in later grades, a trend that may help explain why
the achievement gap between Els and non-‐Els increases as students become older. Saunders and
Marcelletti (2013) find no significant achievement gap between native English speakers and Els that have
been reclassified on the California standards test of English Language Arts in grades 5, 8, or 10. When they
compare current Els and native English speakers, their results replicate the large achievement gaps found
in other studies. The same results were found when comparing achievement gaps between reclassified Els
and NESs on the NAEP exam (Hemphill, Vanneman & Rahman, 2011) indicating that the distinction
between reclassified and current Els is important not only in California, but across the country.

20
These findings indicate a need to create appropriate comparison groups when identifying
achievement gaps. Additionally, they suggest a need to focus attention on how to help students become
proficient in English and exit quickly from El status in order to avoid becoming “long term Els”. While
definitions vary, long term Els are students who are unable to achieve English proficiency after several
years of specialized instruction and persist as Els beyond elementary school. Studies that disaggregate the
achievement of Els that have been classified for different periods of time find the risk of below grade level
achievement and high school dropout is highest for long term Els (Flores & Park, 2014; Flores, Batalova, &
Fix, 2012; Olsen, 2010)
Despite the imperfect quantification of the achievement gap between Els and NESs due
to the impermanent nature of the El subgroup, we do know that Els are an at-‐risk student
population both because of their background characteristics as well as the schools they
typically attend (Sheng, Sheng & Anderson, 2011). English learners begin their US schooling
experience at a disadvantage compared to their native English speaking peers because they
must master both content and the English language at the same time (Fuller, Bein, Kim, Rabe-‐
Hesketh, 2015). This disadvantage is exacerbated for students who immigrate at a later age. Els
who arrive in middle and high school have more ground to cover in a shorter amount of time in
terms of learning content and meeting language demands, as well as adapting to American
culture, than those who arrive as young children or who are second generation immigrant
students (Hooker, Fix & McHugh, 2014).
On average, Els come from families categorized as having low socio-‐economic status by
virtue of their parents’ income, employment, and educational attainment. Foreign-‐born
immigrant adults tend to have less formal education and earn less money than native-‐born
21
Americans, factors that are strongly correlated with student achievement (Gandara &
Contreras, 2009). In 2009, 32% of foreign-‐born immigrants had not received a high school
diploma compared to only 11% of native-‐born Americans (Terrazas & Batalova, 2010). The
median household income for immigrant families from Central America, South America, and
Africa is about 5,000 to 7,000 dollars lower than that of native-‐born American families (Portes &
Rumbaut, 2014). Immigrant families from these regions are also more likely to live below the
poverty line (Capps, et al., 2005; Portes & Rumbaut, 2014).
Aggregate trends notwithstanding, the immigrant population, and thus the El
population, is not monolithic. Many adult immigrants are highly educated and skilled and
migrate in order to participate in the growing knowledge economies of industrialized nations,
such as the US (OECD, 2012; Portes & Zhou, 1993; Portes & Rumbaut, 2014). These immigrants
tend to be more likely than the average native-‐ born American to have an advanced degree and
typically they and their families thrive in the host country (Suarez-‐Orozco, 2001). The
advantages of this group of immigrants are more than offset by the larger and more typical
group of immigrants described above who have less formal education and who possess fewer
professional or specialized skills (Massey & Sanchez, 2010; Portes & Rumbaut, 2014).
Regardless of socio-‐economic status, unfamiliarity with the language and culture of the
receiving nation can be an obstacle for the academic success of immigrant youth. Language
barriers make it more difficult for parents and children to access programs as well as
community based support programs (Sattin-‐Bajaj, 2011; Delgado-‐Gaitan, 1992). Parents of
immigrant children are often unfamiliar with the expectations of the schools and the
opportunities available to their children (Patel, 2012). Further, both immigrant adults and

22
children face discrimination because of their race, ethnicity, or foreign-‐born status that can
hinder social and academic growth (Becker, 1990; Massey & Sanchez, 2010).
An immigrant’s documentation status can also place him or her at risk of academic
failure (Patel, 2012; Massey & Sanchez, 2010). Being undocumented can impact a parent’s
ability to obtain stable or well paid employment, can create a climate of instability within a
home, and can force families to be more mobile as adults look for housing and jobs.
Importantly, undocumented students cannot access federal financial aid and in most states
must pay out of state tuition rates, impinging on their ability to attend college (Flores, 2010).
Knowing that they may not have the opportunity to go to college, or even obtain well paying or
stable employment, can impact the aspirations and achievement of undocumented immigrant
students (Patel, 2012).
It takes an El in optimal educational settings about 5-‐7 years to acquire the academic
language proficiency he or she needs to be on par with native English speakers (Hakuta, et al,
2000). Unfortunately, the vast majority of Els are not being educated in ideal school settings.
Numerous studies have documented the systematic inequalities that confront Els because of
their immigrant background, race/ethnicity, and socioeconomic status (Abedi, Herman,
Courtney, Leon, & Kao, 2004; Gándara, Rumberger, Maxwell-‐Jolly, & Callahan, 2003). Els,
especially those from low income families, are likely to attend schools located in segregated,
high poverty neighborhoods that have lower quality teachers and principals, higher rates of
teacher and principal turnover, fewer resources, and ultimately, lower academic achievement
(Ingersoll, 2004; Corcoran & Evans, 2008; Portes, & MacLeod, 1996; Rothstein, 2004)

23
Els: A special population with unique schooling experiences. Following several court
rulings, Els have been deemed a special population who are to be accorded instructional
supports while they are learning English. Due to their unique status, Els are often educated in
distinct classroom settings by teachers with specialized credentials for some or all of the school
day. In this section I review how Els came to be treated as a special population, what we know
about the implications of Els’ special status on the composition of their classroom peer group
and the quality of their teachers, and how these two variables are related to their academic
achievement.
Federal laws and Supreme Court decisions. A series of federal actions and court decisions
have shaped how English learners are educated. The first was the 1947 Federal District Court
ruling in Mendez vs. Westminster. A group of parents sued the Westminster, California school
district for segregating Mexican immigrant students into a different school based on perceived
language and academic deficiencies, a widespread practice in the southwest at that time
(Menchaca & Valencia, 1990; San Miguel, 1987). The court ruled that segregating students
based on language, race, or nativity violated the 14th amendment and was therefore
unconstitutional.
Twenty-‐seven years later, in the case Lau v. Nichols (414 U.S. 563, 1974), the Supreme
Court decreed that schools had the obligation to support English language acquisition so that
Els would have equal access to educational content. They also ruled that identical education did
not mean equal education. Justice Douglas wrote in his opinion:
Basic English skills are at the very core of what the public schools teach. Imposition of a
requirement that, before a child can effectively participate in the educational program, he

24
must already have acquired those basic skills is to make a mockery of public education.
We know that those who do not understand English are certain to find their classroom
experience totally incomprehensible and in no way meaningful (Lau v. Nichols, 1974).
As a result, new federal policy required that states take proactive steps in educating English
learners, including offering bilingual education or English as a Second Language (ESL) programs.
The third important ruling was made in the case Castañeda vs. Pickard (648 F.2d 989,
1981), which was tried in a Federal District Court. Plaintiffs argued that the Raymondsville
Independent School District in Texas was discriminating against Mexican-‐American students by
using a within-‐school tracking system to segregate students, by not hiring Mexican-‐American
faculty and administrators, and by not providing adequate bilingual education to ensure that Els
could access the curriculum. The district court ruled in the plaintiffs’ favor and created the
“Castañeda test” which outlined three requirements schools must follow in supporting Els.
First, “the school must pursue a program based on an educational theory recognized as sound”;
next, “the school must actually implement the program with instructional practices, resources,
and personnel necessary to transfer theory to reality”; and finally, “the school must not persist
in a program that fails to produce results" (Casteñeda v. Pickard, 1981).
Most recently, the 2001 No Child Left Behind (NCLB) act mandated that states must
disaggregate student achievement data to highlight the academic progress of various sub-‐
groups, including English learners, in order to be held accountable for these students’ progress.
NCLB shed light on the academic gap between of English learners and native English speakers
and mandated that schools close that gap. At the same time, NCLB dictated that the Federal
Office of Bilingual Education be replaced with the Federal Office of English Acquisition,
25
indicating an emerging preference for English only language instruction that mirrored
increasing public antipathy towards public schools providing bilingual education (Crawford,
2002).
Based on these rulings, schools today are required to provide research-‐based instruction
delivered by a competent teacher in a non-‐segregated environment. However, states and
school districts have flexibility in defining the structure of their ELD programs and the
qualifications of the personnel equipped to teach Els. As such, Els across the country find
themselves in vastly different learning environments, with different rates of segregation from
native-‐English speaking students, and with teachers with varying characteristics.
How are Els Segregated from NES? In the context of American education, segregation refers to the separation of minority
students from White students. The way that segregation is typically addressed in the literature
is vestige of the history of racial subjugation and discrimination in the United States. Blacks,
Latinos, Native Americans, and other minority groups have existed as marginalized groups
struggling to attain equality with Whites and so segregation is most often understood as a
separation of students according to their race. In this study I move away from the
conceptualization of segregation as based by race and instead consider how students are
segregated according to their English language proficiency. Below I explain how minorities in
general, and Els in particular, are segregated both between and within schools. Between-‐school
segregation refers to the separation of students who are different in terms of a particular
characteristic, be it race/ethnicity, socioeconomic status, or English proficiency, into different
26
schools. Within-‐school segregation refers to how students are separated from other students
into different classes within a particular school.
Between-‐school segregation. Multiple studies and reports have documented the
segregation of minority students from White students between schools, especially in urban
settings (Clotfelter et al, 2002; Frankenberg, 2013; Orfield, Kucsera, & Siegel-‐Hawley 2012;
Orfield & Lee, 2005). Orfield and his colleagues (2012) analyzed data obtained from the Office
of Civil Rights from 1968 to 1981 and from the National Center for Education Statistics from
1991 to 2010 to document trends in segregation by race and class between schools across the
country. They find that segregation, as measured by the percent of minorities attending high
minority schools, the dissimilarity index4, and the exposure index5, has been increasing for
Latino students over the last several decades and that the vast majority, about 80%, of these
students attend majority-‐minority schools (i.e. schools where minorities comprise more than
50% of the school population). They describe evidence of what they term “double segregation”
by race and class for Latino students, citing a 71% correlation between the percent of Latinos in
a school and the percent of students who are eligible for free or reduced priced lunch, a
common indicator of low socioeconomic status. While they do not have data on the number of
Els, based on previous research (Gandara & Orfield, 2010; Rothstein, 2004), they speculate that
many Latinos additionally face “triple segregation” by race, class, and language proficiency.
4 The dissimilarity index measures the proportion of group A within a larger unit (i.e., a district or city) that would have to re-‐locate in order to achieve the same neighborhood racial distribution as Group B (Massey & Denton, 1988). 5 The exposure index measures the probability that a random member of group A shares a smaller unit (i.e. classroom, neighborhood) with a member of Group B, conditional on the number of members of Group A and B in the larger unit (school, city) (Massey & Denton, 1988).

27
Schools serving a higher concentration of El students differ from those that serve lower
concentrations or no Els. de Cohen and her colleagues (2005) compare the school conditions,
teacher characteristics, and principal qualities in schools with high or low concentrations of Els,
or no Els, using data culled from the 1999-‐2000 Schools and Staffing survey, a nationally
representative survey administered to teachers and principals. High concentration El schools
are larger, more likely to receive Title 1 money, more likely to be in urban areas, and less likely
to enroll White students. Principals of high concentration El schools are more likely to report
that poverty and health related issues are a problem than those of low concentration El
schools. High El schools tend to offer more student support services, such as pre-‐K and after-‐
school programs, as well as parent outreach and support programs. Schools with high
proportions of Els are much more likely than those with low proportions to provide bilingual
programs, but just as likely as other schools to offer English only language support. Teachers in
high El schools tend to have fewer years of experience, be less academically prepared, be more
likely to hold a provisional or emergency license; but are more likely to have an ESL/Bilingual
certification even if teaching ESL is not their main assignment. These differences speak to the
impacts of triple segregation, by race, class, and language proficiency on the quality of schools
for Els (Orfield et al, 2012): Els are likely to be minorities from low income families, as well as
linguistic minorities, and so it is unsurprising that they attend high poverty schools that have
less experienced, fewer credentialed, and less prepared teachers.
Schools with a high concentration of Els, immigrants, or Latinos might be beneficial for
these students because they can foster positive identity formation and academic attitudes.
Goldsmith (2003) uses NELS (National Education Longitudinal Study) data from 1988 and 1992
28
combined with 1990 Census data to test whether the proportions of Latino and Black students
in a school differentially impacted the test scores of Black, Latino, and White students. Using an
HLM (Hierarchical Linear Modeling) strategy that controls for student, school, and
neighborhood factors, the author shows that proportion Latino is positively correlated to Latino
student test scores in reading and science, and does not significantly influence White or Black
student test scores. One limitation to this study is that the sample is comprised of students who
have valid 12th grade scores in reading, math, science, and history, and thus results may be
positively biased due to sample selection. The authors control for 8th grade achievement and
factors related with the probability of dropout to try to overcome this limitation.
The authors posit several explanations for the positive correlation between proportion of
Latino students and Latino achievement. First, Latino students are more likely to come from
two-‐parent and immigrant families than Black students (Goldsmith, 2003; Wildsmith, Scott,
Guzman, & Cook, 2014). Two parent families are likely to have more financial and social capital
available to support their children’s achievement (Dronkers & Hampden, 2003). Similarly,
research suggests that students and parents in immigrant families have higher aspirations than
native-‐born parents (Kao & Tienda, 1995; Schmid, 2001), and so may be more resilient to the
impacts of attending schools with fewer resources. Aggregated to the school level, the higher
levels of financial, social, and cultural capital, as well as resilience, might create a more positive
and academically focused climate. Finally, Latinos in predominantly Latino schools may suffer
less discrimination from White peers and adults and may be able to build more positive ethnic
identities that can positively impact their achievement.
Callahan and various colleagues (2008, 2009) conducted two studies, using propensity

29
score matching and data from the nationally representative Add Health Survey that found that
being labeled an El is positively related to achievement in schools with high concentrations of
Els. The authors use school and neighborhood context variables, English proficiency, and prior
achievement to match Mexican immigrant students (2008) or immigrant students of any
nationality (2009) who were placed in ESL classes to those who were not. They then compared
the academic achievement of these two groups of students conditional on their generational
status and whether they were enrolled in a high-‐El school (>55% El students) or low-‐El school
(<55% El students).
Mexican-‐American immigrant students enrolled in low-‐concentration schools and placed
in ESL classes had lower GPAs and were less likely to enroll in college prerequisite courses than
their matched counterparts who were not enrolled in ESL classes. This negative relationship
was highly significant for first generation immigrants. These findings were mostly reversed in
high El concentration schools, where second and third generation students received the most
positive benefit of enrolling in ESL classes, but first generation immigrants in ESL classes saw no
improvement in academic outcomes. The authors suggest that in high El concentration schools,
the large co-‐ethnic community (e.g., the community comprised of students from similar racial,
ethnic, or native country background) protects immigrant students from the negative
repercussions that are expected to arise when students attend linguistically or racially isolated
schools (Callahan, 2004). The findings may be biased due to sample selection. The authors
restrict the overall, nationally representative sample to include only Mexican-‐American
students attending one of the 23 (out of 78) schools participating in the Add Health Survey that
offered ESL, and who also had complete transcript data for both the 1995 and 2001
30
implementation of the survey.
Some schools segregate Els and/or immigrant students by design. These schools can
create a safe environment where Els feel better able to participate in academics and develop
their own identity (Harklau, 1994a; Patel, 2012). Patel (2012) profiles students attending
Franklin, a public international high school designed to educate recent immigrants. So called
“newcomer schools” are perhaps the most segregated setting an El can encounter, but also the
most likely to be structured to meet the needs of Els who are recent immigrants. Students
attending Franklin High School were able to take up to 6 years to pass their standardized exit
exams and graduate, allowing students more time to both acquire a new language and master
high school content. Besides being trained to teach ESL, most of the teachers were bilingual and
many were immigrants, giving them both skills and a personal connection that could aid them
in supporting students. The explicit mission to serve Els and their isolation from NESs allowed
students to feel more comfortable. One student explained why she favored Franklin over her
neighborhood school saying, “And here, everybody is like me cuz they are from another
country. So nobody makes fun of me for having an accent. I talk more here, so my English gets
better here” (Patel, 2012, p.4).
Despite the findings above, most research has found that high concentrations of minority
or disadvantaged youth in a school is correlated with low academic achievement. Schools with
high concentrations of minority or disadvantaged students tend to have fewer resources, less
qualified or experienced teachers, and higher teacher and principal turnover (Ingersoll, 2011;
Rothstein, 2004; Kozol, 1991; Gandara & Contreras, 2009). Adults in these schools tend to have
lower expectations for minority and disadvantaged students, and these expectations are often
31
translated into less rigorous course work and lower achievement (Jussim & Harber, 2005;
Rosenthal & Jacobsen, 1968).
Many studies find that socioeconomic status, and not race, ethnicity, or linguistic
proficiency, accounts for negative academic outcomes in schools that enroll a high population
of minority students (Ellen, Regan, Schwartz, & Steifel, 2001; Southword, 2010; Ryerbov, et al,
2007). For instance, Ellen and her colleagues (2001) find the impact of segregated school
contexts on academic achievement is driven by the socioeconomic status of the student. In
their study of immigrants in New York City, they find that while Russian immigrants are highly
segregated between schools, they attend higher SES, lower racial minority schools with more
experienced teachers. In contrast, Dominican immigrants, who were also segregated across
schools, attend mostly low SES, high minority schools with less experienced teachers and
perform less well than the Russian students.
Within-‐school segregation. Unlike de jure race-‐based segregation between schools,
which is illegal and nearly universally decried, there are conflicting views about the merits or
disadvantages of separating students within schools because of perceived intellectual or
academic needs (Faltis & Arias, 2013; Reeves, 2004). Reflecting these conflicting views, two
dueling philosophies exist for how to best structure programs that differentiate instruction for
English learners: inclusion or separation (Platt, Harper, & Mendoza, 2003; Rios-‐Aguilar, et al.,
2010). In inclusion settings, Els are exclusively educated in the same classrooms as NESs. In
these cases, the teacher either differentiates instruction for Els or there is a co-‐teacher within
the classroom tasked with scaffolding instruction for Els. In separated settings, Els receive
targeted language support or content instruction in classrooms with other Els.
32
Whether Els are included or separated can be determined by several factors, including the
school El population or teacher capacity to support Els. To a certain extent, the type of English
language development (ELD) program being implemented by a particular school will constrain
the potential exposure Els have to NESs. ELD programs are broadly categorized as either
bilingual or English immersion programs. Table A1 in the Appendix A shows the characteristics
of the most common English language development programs used in schools (see Rolstad, et
al., 2005, for more detailed information regarding each program type).
The extent to which a school practices formal or informal academic tracking will also
impact the classroom composition of Els. Academic tracking refers to the practice of
segregating students into different classes according to their prior achievement or perceived
ability (Oakes, 1986). High track classes tend to be more academically rigorous and enroll higher
achieving students, whereas low track classes are less academically rigorous and enroll lower
achieving students. Els who have not yet reclassified as English proficient are more often than
not low-‐achieving students; thus, if a school has a strong academic tracking system, Els are
likely to find themselves in the same classroom as other Els or with other low achieving
students.
The composition of the school itself will also have a heavy influence on the level of
exposure an El will have to NES. For instance, in a school where there are few Els, it is highly
unlikely or even impossible for Els to be segregated from NES for most of their day.
Regardless of whether or not segregating Els from NESs is justified for academic reasons,
there is evidence that this type of segregation does occur (Conger, 2005; Faltis & Arias, 2013).
Conger (2005) measured within-‐school segregation by race, class, and immigrant status in New

33
York City elementary schools in 1995-‐96 and 2000-‐2001 using the exposure index (a measure
that gives the probability that one type of student will encounter a different type of student in
their classroom or school). She finds that segregation by nativity is different than segregation by
race or class. Segregation by race and class is much more severe between schools than within
schools, but this trend is reversed when measuring segregation of foreign-‐born from native-‐
born students. Foreign-‐born students are much more likely to be concentrated in particular
classrooms within a school then particular schools within the city.
Positive repercussions of within-‐school segregation of Els. There are potential
advantages to separating Els from NESs for instructional purposes. In a separate setting, Els may
be more likely to receive specialized support from a trained ESL teacher, whereas several
qualitative studies have documented how mainstream teachers (those without specialized
training to teach Els) are not willing or capable of differentiating instruction for Els (Becker,
1990; Harklau, 1994a; Hincken, 2006; Reeves, 2004; Platt, Harper, & Beatriz Mendoza, 2003;
Walker, Shafer, Iiams, 2004). Platt and her colleagues (2003) interviewed 29 district leaders in a
Florida school district to understand how they perceived ELD programs that either segregated
Els or included NES students. They found a wide variety of responses, however about 57% of
administrators favored segregating Els for instructional purposes. One administrator explained
that she was reluctant to move towards an inclusive program for Els because students taught
by mainstream teachers “don't get nearly what they get with ESL teachers” (Platt, et al., 2003,
p120).
While Els in mainstream classes may be more likely to be exposed to grade level, rigorous
content, they may not benefit from that exposure. One study found that Els in an inclusive

34
mainstream algebra class experienced less opportunity to learn, defined as how much content
was covered throughout the year, than their English proficient peers in the same classroom.
The difference arose not because Els were receiving different instruction, but because they
were unable to understand teacher’s directions or instruction throughout the year (Abedi &
Herman, 2010). In this case, Els might be better served in an environment where teachers
explicitly scaffold instruction to support language acquisition.
Along with access to special teachers, Els in separated classroom environments might
also have increased access to comprehensible input and special resources. In Harklau’s studies
comparing inclusive and segregated classrooms (1994a; 1994b), the ESL teacher of the
segregated classroom had procured books at different reading levels, books adapted for Els,
and books representing the cultural and ethnic backgrounds of her students. In contrast, the
reading materials in the inclusive classrooms were more likely to be on grade level and not
adapted to support comprehension (e.g., by having simpler grammatical phrases, picture cues,
or glossaries of terms).
A special case of a segregated setting is the bilingual classroom. While dual-‐immersion
models allow for settings that integrate NESs and Els, other common bilingual programs (e.g.
developmental, transitional) are specifically designed to help Els learn English in a settings
where NESs are excluded (NC DPI, 2014; Roberts, 1995). Proponents of bilingual models believe
that the benefits of segregating Els in order to facilitate instruction in the student’s home
language outweigh the potential negative repercussions, described in detail below (Platt, et. al,
2003). Several large scale meta-‐analyses have been conducted over the last 30 years,
suggesting that bilingual programs result in English and native language proficiency (Greene,

35
1998; Rolstad, et al., 2005; Willig, 1985), and at the very least do not impede the development
of English skills (August & Hakuta, 1997). In a recent review, Goldenberg (2008) points out that
after five major meta-‐analyses of research comparing bilingual settings to English only settings,
all agree that use of students’ first language facilitates and aids academic achievement. Further,
the Supreme Court Justices’ ruling in the Casteñeda vs. Pickard (1981) case stated that
segregating Els in order to provide bilingual services was allowable because “the benefits which
would accrue to [Els] by remedying the language barriers which impede their ability to realize
their academic potential in an English language educational institution may outweigh the
adverse effects of such segregation”.
Negative repercussions of within-‐school segregation of Els. For all the benefits of
segregated classrooms for Els described above, there are as many disadvantages, which include
those that inhibit language acquisition as well as those that reify existing racial and social class
boundaries. One advantage of educating Els in inclusive, mainstream settings is that students
will have access to English speaking peers who can serve as models for what English sounds like.
According to second language acquisition theories grounded in sociocultural frameworks,
language is a tool for social interaction and language acquisition is a social process shaped by
the learner’s environment. Krashen’s Input Hypothesis (1982) posits that language learners
must have direct contact with the new language that is comprehensible in order for second
language acquisition to occur. Building on this theory is the Interaction Hypothesis (Long, 1996)
that proposes that language acquisition occurs when language learners negotiate meaning with
a more linguistically advanced other. Interaction scaffolds acquisition by providing learners with
feedback and models of language use.

36
It should be noted that while both the Input hypothesis and Interaction Hypothesis
suggest that English learners would learn English faster if exposed to language models, it is not
a given that students in in a mainstream setting are willing or able to serve as those models.
Antagonism towards English learners from NESs, or even more advanced English learners, has
been documented in several ethnographic studies (Harklau, 1994; Valenzuela, 1999; Becker,
1992). Likewise, immigrant students often choose not to interact with native English speaking
peers. In her ethnography of a high school composed of predominantly Mexican immigrant and
Mexican-‐American students, Valenzuela (1999) finds that country of origin, time in the US,
language proficiency, and generational status cleave students into different peer groupings that
seldom interact even when in the same setting. In any case, inclusive settings allow an
opportunity for interaction that is impossible in segregated settings.
Els are often sorted into low track classes based on both their English proficiency and
academic achievement. First, ESL classes are remedial in nature and so El-‐only classes can be
considered similar to content area low-‐track classes. When Els are placed in these classes, they
are likely to be surrounded by peers who are also learning English and who are probably low
achieving. Next, Els who are still learning English and those who reach proficiency in English and
exit the ELD program are likely to be placed in low track content-‐area classes (Callahan, 2004;
Kanno & Kangas, 2014). Findings from a recent case study of Els in a suburban high school
suggest that school structures, teacher opinions, and student and parent disengagement were
related to Els’ placement into low track courses (Kanno & Kangas, 2014). Because track
placement was determined largely by achievement on standardized assessments, low achieving
Els were barred from access to courses in the higher tracks. Teachers and other adults
37
encouraged Els not to enroll in high track classes as a way to protect them from potential
failure. Finally, Els and their parents in the study were not empowered to make or change
decisions in the school, and so generally acquiesced to their placement. The authors conclude
that even when students exit El status, they are generally placed in low track classes and
seldom able to make their way to higher track courses.
Several studies have described in detail the differences between high and low track
classes and the impact placement in one track or the other has on academic outcomes (Argys,
Rees & Brewer, 1996). In an ethnographic study of twenty-‐five middle and high schools, Oakes
(1985, 2005) found that compared to high track classes, low track classes were
disproportionality populated by minority children, were less rigorous, exposed children to
fewer concepts and topics, and allowed for less opportunity for collaborative work. Children in
low track classes were also treated differently than those in higher track classes. Teachers of
low track classes were more authoritative and were constantly battling students for control,
whereas in high track classes teachers emphasized mutual respect and personal autonomy. The
results of the more authoritative approach to discipline was less time for teaching and learning,
and fewer opportunities for students to collaborate or construct meaning with the teacher or
with each other. Oakes states clearly,
Tracking seems to retard the academic progress of many students—those in average and
low groups. Tracking seems to foster low self-‐esteem among these same students and
promote school misbehavior and dropping out. Tracking also appears to lower the
aspirations of students who are not in the top groups. And perhaps most important, in
view of all the above, is that tracking separates students along socioeconomic lines,
38
separating rich from poor, Whites from non Whites. …[Students in low-‐tracks] are likely to
suffer far more negative consequences of schooling than are their more fortunate peers
(p.40).
Low track settings can have an especially pernicious impact on linguistic minority
students. Callahan (2004) used data from a California high school with a large (35%) proportion
of Els to study how El status (i.e., recent immigrant who had missed a year or more of schooling
prior to enrolling in study high school, recent immigrant with uninterrupted prior schooling in
their native country, and Els who had not been reclassified after 7 years) and track level
interacted and were related to academic achievement as measured by grades, standardized
achievement scores, and credits. She found that being placed in a lower track, rather than El
status or language proficiency, had a greater impact on the academic achievement of long-‐
term Els. In explaining her results, Callahan points to the differences in pedagogy and
curriculum in high and low class courses. In high track science classes, for instance, students
worked in groups to conduct experiments whereas in low track science classes students
typically listened to lectures and completed bookwork. Thus, in addition to not being exposed
to challenging and engaging materials, Els in low track classes had fewer opportunities to
negotiate understanding, receive feedback, and practice English.
Finally, one purported advantage of segregated settings is that Els will have access to
teachers with specialized ESL training. Yet there is very little evidence supporting the benefits of
a specialized teacher teaching a homogenous group of Els, and so access to a specialized
teacher may not justify segregating Els from NESs. Several authors note that in ESL courses, ESL
teachers sometimes hold lower expectations for their students than in mainstream classes

39
(Harklau, 1994; Reeves, 2004; Platt 2003). In the name of differentiation, ESL teachers may
reduce workload and give other accommodations to Els without increasing the rigor over time.
Table 2 summarizes the potential advantages and disadvantages of segregating students
within schools.
Table 2 Summary of the Advantages and Disadvantages of Within-‐School Segregation.
Segregation Inclusion
++
- Access to specialized teachers and curricula - Safe environment - Strong co-‐ethnic community - Access to comprehensible input (Becker, 1990; Harklau, 1994a; Hinkcen, 2006; Patel, 2012; Portes & Zhou)
- Access to language models - Teachers have same expectations of Els as
they have for all students (Krashen, 1982; Long, 1996; Reeves, 2004)
_-‐
- Classes are less rigorous - Teachers lower expectations (Callahan, 2004; Oakes, 2005)
- Students might not understand instruction - Students face more discrimination (Abedi & Herman, 2010; Becker, 1990)
Conclusion
It is an open question as to how segregation from native English speakers impacts the
achievement of Els. Confusing the findings in the studies cited above is the interrelationship
between race, class, and linguistic minority status. Additionally, it is unclear whether Els are
being segregated from NESs in order to receive special resources, because of their previous
academic achievement, or for other reasons unrelated to their linguistic proficiency. Contextual
factors within the school as well as a student’s own background may confound any relationship
between segregation and achievement.
Finally, most of the studies cited above were conducted within one school or one
district, limiting the generalizability of their findings. For instance, the Callahan (2004) and
Harklau (1994a, 1994b) studies, which give the clearest descriptions of how Els experience
40
schools, are both conducted in single high schools in California, the state with the highest
proportion of Els in the country. Oakes’ (2005) and Conger’s (2005) studies cover larger areas,
but do not focus specifically on the experiences of Els. The exceptions are the studies using data
from the nationally representative ADD-‐Health Survey (Callahan et al, 2008a, 2008b); however,
the analytical sample used in these papers only include a small number (less then 30) of high
schools and the findings do not provide any information on the contexts of elementary or
middle schools. Thus, the extant research suggests what might be occurring for Els in schools
across the country, but leaves room for further investigation.
What is the Current Condition of the ESL Teacher Workforce? Beyond the characteristics of the other students in classes with Els, the characteristics
and qualifications of the teacher may impact the academic outcomes of Els. Across the country,
Els are taught by certified ESL teachers, trained mainstream teachers, and/or untrained
mainstream teachers. I define ESL teachers as any teacher who has completed the
requirements to earn an ESL credential. A trained mainstream teacher is one who may have
received pre-‐service training or professional development related to teaching Els, but who has
not completed the requirements to receive a credential. An untrained mainstream teacher is
one who has not had any formal training related to teaching Els.
There is a large literature base describing characteristics of the teacher work force (e.g.
age, years of experience, and number of teachers), how those characteristics are related to
student achievement, and how teachers with different characteristics are distributed across
schools (Aaronson, Barrow, & Sander, 2007; Loeb & Beteille, 2008; Lankford, Hamilton, Loeb, &
Wyckoff, 2002; Ladd, 2008; Kane, Rockoff, & Staiger, 2007; Clotfelter, Ladd, & Vigdor, 2007).
41
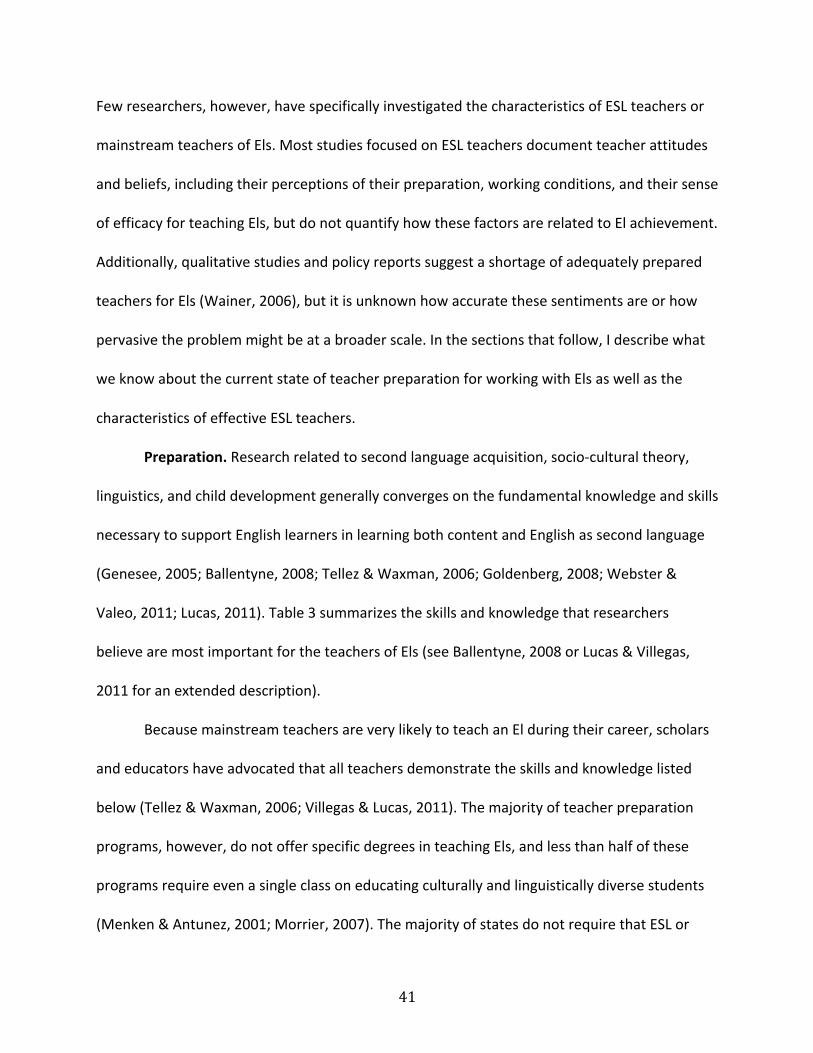
Few researchers, however, have specifically investigated the characteristics of ESL teachers or
mainstream teachers of Els. Most studies focused on ESL teachers document teacher attitudes
and beliefs, including their perceptions of their preparation, working conditions, and their sense
of efficacy for teaching Els, but do not quantify how these factors are related to El achievement.
Additionally, qualitative studies and policy reports suggest a shortage of adequately prepared
teachers for Els (Wainer, 2006), but it is unknown how accurate these sentiments are or how
pervasive the problem might be at a broader scale. In the sections that follow, I describe what
we know about the current state of teacher preparation for working with Els as well as the
characteristics of effective ESL teachers.
Preparation. Research related to second language acquisition, socio-‐cultural theory,
linguistics, and child development generally converges on the fundamental knowledge and skills
necessary to support English learners in learning both content and English as second language
(Genesee, 2005; Ballentyne, 2008; Tellez & Waxman, 2006; Goldenberg, 2008; Webster &
Valeo, 2011; Lucas, 2011). Table 3 summarizes the skills and knowledge that researchers
believe are most important for the teachers of Els (see Ballentyne, 2008 or Lucas & Villegas,
2011 for an extended description).
Because mainstream teachers are very likely to teach an El during their career, scholars
and educators have advocated that all teachers demonstrate the skills and knowledge listed
below (Tellez & Waxman, 2006; Villegas & Lucas, 2011). The majority of teacher preparation
programs, however, do not offer specific degrees in teaching Els, and less than half of these
programs require even a single class on educating culturally and linguistically diverse students
(Menken & Antunez, 2001; Morrier, 2007). The majority of states do not require that ESL or

42
mainstream teachers demonstrate competency in ESL methods, curricula, or assessment; and,
only 21 states ask that teachers participate in a student-‐teaching experience in a bilingual or
ESL setting (Lopez, 2013). Furthermore, only half of states require that teachers obtain a special
Table 3 Essential Knowledge and Skills for Teachers of Els
Knowledge Skills Linguistics Teachers need to know how English is structured and used. Important linguistic knowledge includes grammar, syntax, morphology, and semantics.
How to Differentiate Instruction Teachers need to be able to differentiate instruction for students at varying levels of proficiency in the four language domains as well as in content mastery. Teachers should be able to scaffold instruction by providing comprehensible input.
Second Language Acquisition Teachers need to know the process of second language acquisition and the factors that impact the rate of learning. Teachers should understand the differences between academic and conversational English, the role of interaction in promoting language acquisition, the need to provide comprehensible input, how first and second language acquisition is similar or different, how the first language knowledge can promote second language learning, and how anxiety hinders language development.
How to Create and Adapt Assessments Teachers need to know to develop content area assessments that are appropriate for different stages of language development, how to identify and alter the language demands of content area assessments, and how to assess proficiency and growth across the four language domains.
Sociocultural Theory Teachers need to understand how language is used as a tool for social interaction and relationship between language, culture, and identity.
How to Communicate Teachers must be able to interact and collaborate with culturally and linguistically diverse students, parents, and stakeholders.
Cultural competence Teachers need to understand the diverse backgrounds of students and understand how background shapes the learning process.
How to Collaborate Teachers must be able to collaborate with non-‐ESL teachers to provide adequate instruction and ensure that the needs of Els are being acknowledged and met in all school settings.
certification to teach Els and only 20 states require that mainstream teachers take any courses
related to teaching linguistically diverse students (Lopez, 2013). Being certified by no means
guarantees that a teacher will be more effective with her Els; however, teachers with
certification at least have been exposed to the foundational knowledge recommended for
teaching Els
43
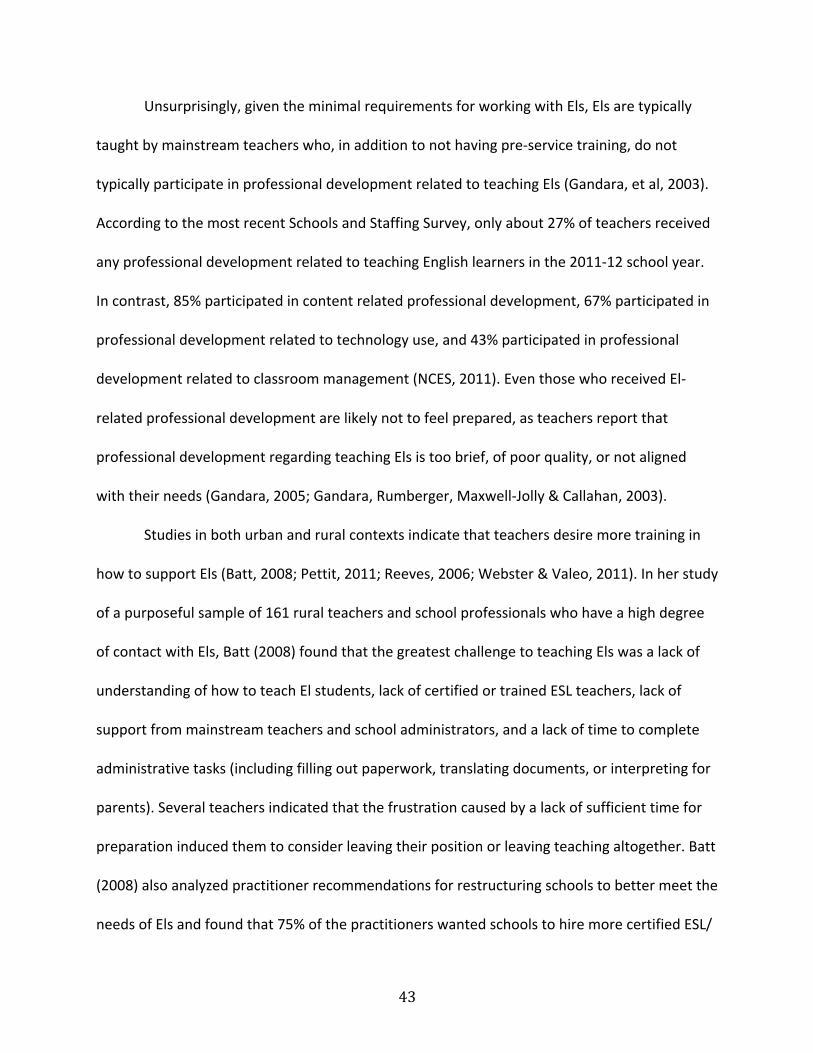
Unsurprisingly, given the minimal requirements for working with Els, Els are typically
taught by mainstream teachers who, in addition to not having pre-‐service training, do not
typically participate in professional development related to teaching Els (Gandara, et al, 2003).
According to the most recent Schools and Staffing Survey, only about 27% of teachers received
any professional development related to teaching English learners in the 2011-‐12 school year.
In contrast, 85% participated in content related professional development, 67% participated in
professional development related to technology use, and 43% participated in professional
development related to classroom management (NCES, 2011). Even those who received El-‐
related professional development are likely not to feel prepared, as teachers report that
professional development regarding teaching Els is too brief, of poor quality, or not aligned
with their needs (Gandara, 2005; Gandara, Rumberger, Maxwell-‐Jolly & Callahan, 2003).
Studies in both urban and rural contexts indicate that teachers desire more training in
how to support Els (Batt, 2008; Pettit, 2011; Reeves, 2006; Webster & Valeo, 2011). In her study
of a purposeful sample of 161 rural teachers and school professionals who have a high degree
of contact with Els, Batt (2008) found that the greatest challenge to teaching Els was a lack of
understanding of how to teach El students, lack of certified or trained ESL teachers, lack of
support from mainstream teachers and school administrators, and a lack of time to complete
administrative tasks (including filling out paperwork, translating documents, or interpreting for
parents). Several teachers indicated that the frustration caused by a lack of sufficient time for
preparation induced them to consider leaving their position or leaving teaching altogether. Batt
(2008) also analyzed practitioner recommendations for restructuring schools to better meet the
needs of Els and found that 75% of the practitioners wanted schools to hire more certified ESL/
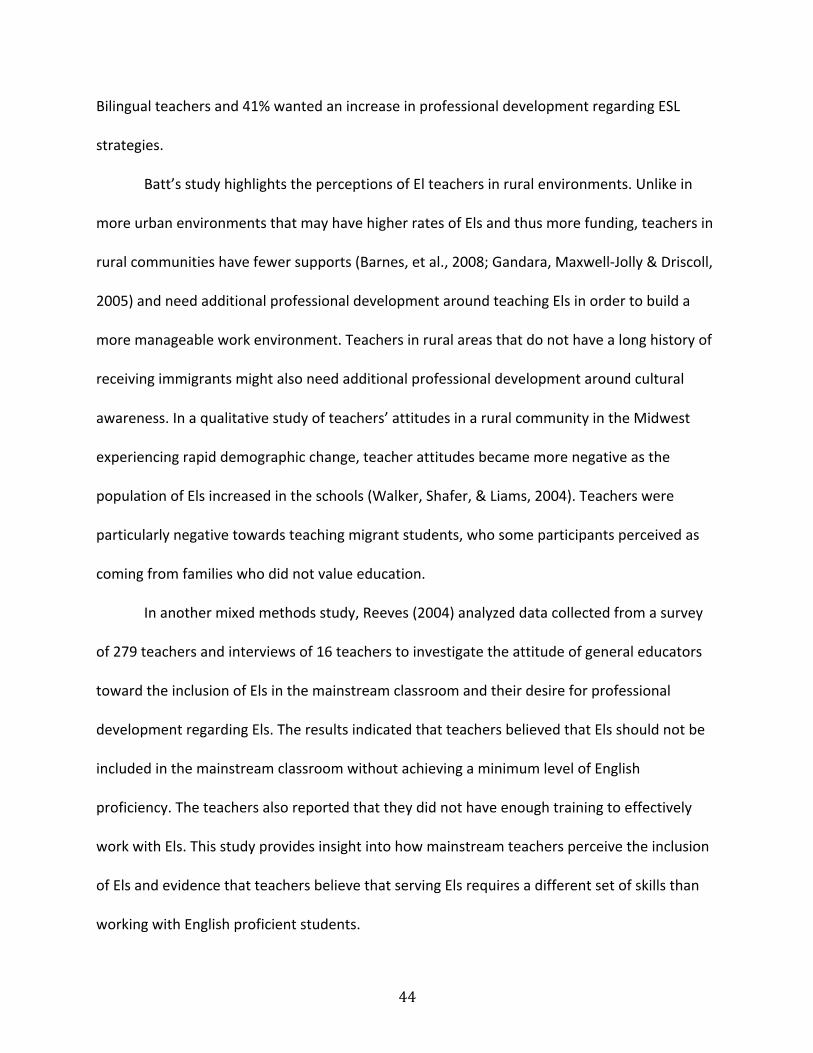
44
Bilingual teachers and 41% wanted an increase in professional development regarding ESL
strategies.
Batt’s study highlights the perceptions of El teachers in rural environments. Unlike in
more urban environments that may have higher rates of Els and thus more funding, teachers in
rural communities have fewer supports (Barnes, et al., 2008; Gandara, Maxwell-‐Jolly & Driscoll,
2005) and need additional professional development around teaching Els in order to build a
more manageable work environment. Teachers in rural areas that do not have a long history of
receiving immigrants might also need additional professional development around cultural
awareness. In a qualitative study of teachers’ attitudes in a rural community in the Midwest
experiencing rapid demographic change, teacher attitudes became more negative as the
population of Els increased in the schools (Walker, Shafer, & Liams, 2004). Teachers were
particularly negative towards teaching migrant students, who some participants perceived as
coming from families who did not value education.
In another mixed methods study, Reeves (2004) analyzed data collected from a survey
of 279 teachers and interviews of 16 teachers to investigate the attitude of general educators
toward the inclusion of Els in the mainstream classroom and their desire for professional
development regarding Els. The results indicated that teachers believed that Els should not be
included in the mainstream classroom without achieving a minimum level of English
proficiency. The teachers also reported that they did not have enough training to effectively
work with Els. This study provides insight into how mainstream teachers perceive the inclusion
of Els and evidence that teachers believe that serving Els requires a different set of skills than
working with English proficient students.

45
Even teachers who are trained to work with culturally and linguistically diverse students
often feel ill prepared to teach Els. Durgunoğlu and Hughes (2010) collected survey responses
from 62 pre-‐service teachers being prepared to work with diverse students and observed 4 of
these teachers during their pre-‐service training. The descriptive results from the survey
indicated that the pre-‐service teachers felt that they were prepared to teach. However, on
survey items that tested teacher’s knowledge of ESL pedagogy, teachers’ mean score correct
was only 25%. Classroom observations of the four teachers revealed that pre-‐service teachers
tended to interact infrequently with Els and that they received no support from mentor
teachers. In follow up interviews, these teachers were not aware of the evident disengagement
and lack of comprehension expressed by the El students. In this study, there was only 1 El
student in each teacher’s classroom, and so each student may have been easier to neglect or
miss.
There are several studies that go beyond documenting what skills teachers possess or
require and instead portray differences in classrooms taught by ESL and mainstream teachers.
In her ethnographic studies of Chinese Els in California, Harlkau (1994a, 1994b), found that
mainstream teachers did not alter their speech to facilitate comprehension, rarely called on Els
or elicited speech from these students, and often asked for only single word or short answers in
written responses. Mainstream teachers did not have the linguistics background to diagnose
common grammatical errors made by Els, and so the teachers would make general remarks on
the students’ papers, such as telling them to re-‐read to fix grammatical mistakes (Harklau,
1994b) or to work on “usage” (Harklau, 1994a, p.261).
Mainstream teachers express being uncomfortable treating Els differently than NESs. In

46
one study documenting mainstream teacher perceptions, teachers were reluctant to adapt
curriculum or instructional techniques in their classrooms in order to support Els’ language
acquisition because they felt differentiation meant they would not be treating all of their
students equally (Reeves, 2004). Teachers were more likely to make procedural
accommodations, such as allowing students extra time to complete assignments or the use of a
bilingual dictionary6 to complete assignments, instead of curricular or pedagogical changes.
One of the case study teachers refused to allow students to use their first language in school
and actively discouraged them from using their first language at home, indicating lack of
knowledge of commonly accepted second language acquisition theories (Cummins, 1979,
1981). Another teacher in this study explained that she believed Els should not receive any
special curricular or instructional accommodations because at the end of the year they would
have to take the same exam as everyone else. Thus, teachers’ ignorance or misunderstandings
of second language acquisition theories shaped their expectations and perceptions of Els as
well as the way they taught these students (Reeves, 2004).
While providing a portrait of the working conditions of El teachers, the qualitative
studies cited above (Batt, 2008; Durgunoğlu & Hughes, 2010; Harlkau, 1994a, 1994b; Reeves,
2004; Walker, Shafer, & Liams, 2004), share the following limitations: they are based on non-‐
representative, non-‐random, and relatively small samples of El educators and they rely on
descriptive or case study analysis that do not control for teacher or school characteristics.
Moreover, none of these studies looks specifically at the question of whether teacher
characteristics, knowledge, or perceptions are related to El achievement.
6 A bilingual dictionary provides translations between words in a student’s native language and English. Typically, it does not provide definitions of words.

47
Teacher effectiveness for Els. The studies conducted by Harklau (1994a, 1994b) and
Reeves (2004) cited above indicate there may be important differences in how ESL and
mainstream teachers differentiate instruction to support the Els’ language development.
Unfortunately, they do not describe what training, characteristics, or experiences distinguished
ESL and mainstream teachers in their studies. In general, research on teachers of English
learners has provided a framework for what teachers should know and be able to do, but has
not tested the relationship between specific teacher characteristics or behaviors and student
achievement on a large scale. The broad literature on teacher effectiveness can offer some
insights into the teacher characteristics, including teacher credentialing, experience,
educational background, and individual characteristics, which might make a difference for El
achievement.
Certification. Teachers can be certified to teach particular content areas (e.g., math,
science, or social studies), grade levels (e.g. elementary or secondary grades), or special
populations (e.g. Els, deaf students). Typically there is a continuum that defines the level of
certification, from no certification, to emergency, provisional, standard, and continuing
certification. Teachers can follow either a traditional or alternative route to certification. In
most states, teachers who obtain a traditional certification graduate from an accredited
undergraduate or graduate program in education; pass a general teaching knowledge exam in
the areas of reading, math, and writing; and then received additional training and/or pass
additional exams in order to receive a credential to teach a particular content area or special
population. Teachers receive an alternative a credential by participating in alternative teacher
preparation programs such as Teach for America or city Teaching Fellows programs.
48
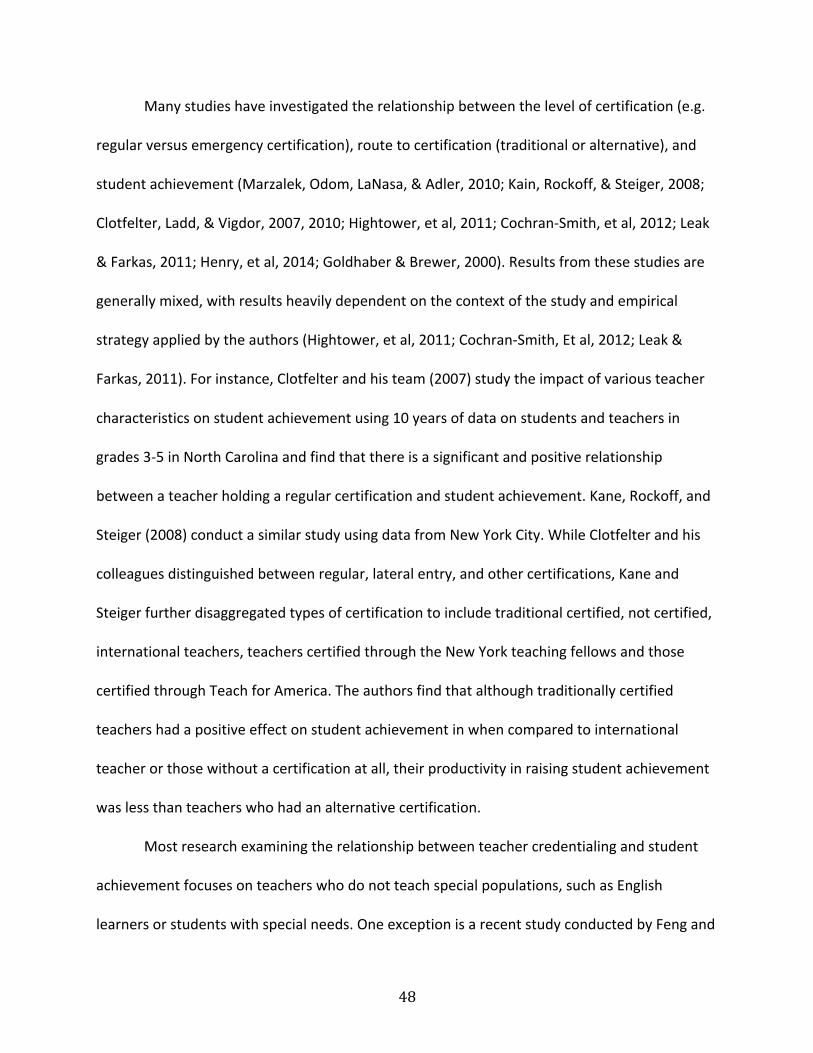
Many studies have investigated the relationship between the level of certification (e.g.
regular versus emergency certification), route to certification (traditional or alternative), and
student achievement (Marzalek, Odom, LaNasa, & Adler, 2010; Kain, Rockoff, & Steiger, 2008;
Clotfelter, Ladd, & Vigdor, 2007, 2010; Hightower, et al, 2011; Cochran-‐Smith, et al, 2012; Leak
& Farkas, 2011; Henry, et al, 2014; Goldhaber & Brewer, 2000). Results from these studies are
generally mixed, with results heavily dependent on the context of the study and empirical
strategy applied by the authors (Hightower, et al, 2011; Cochran-‐Smith, Et al, 2012; Leak &
Farkas, 2011). For instance, Clotfelter and his team (2007) study the impact of various teacher
characteristics on student achievement using 10 years of data on students and teachers in
grades 3-‐5 in North Carolina and find that there is a significant and positive relationship
between a teacher holding a regular certification and student achievement. Kane, Rockoff, and
Steiger (2008) conduct a similar study using data from New York City. While Clotfelter and his
colleagues distinguished between regular, lateral entry, and other certifications, Kane and
Steiger further disaggregated types of certification to include traditional certified, not certified,
international teachers, teachers certified through the New York teaching fellows and those
certified through Teach for America. The authors find that although traditionally certified
teachers had a positive effect on student achievement in when compared to international
teacher or those without a certification at all, their productivity in raising student achievement
was less than teachers who had an alternative certification.
Most research examining the relationship between teacher credentialing and student
achievement focuses on teachers who do not teach special populations, such as English
learners or students with special needs. One exception is a recent study conducted by Feng and

49
Sass (2013) that focuses on the teachers of special needs students. Using five years of student
and teacher data from Florida and controlling for a multitude of school and student
characteristics, including prior achievement, the authors find a positive and significant
relationship between a teacher having a special education certification and reading and math
achievement gains for special needs students. The authors find that other measures of pre-‐
service training in special education, such as hours of coursework, also have a significant and
positive relationship on student achievement. While the findings of this study are limited
because the authors do not include controls for unobserved variables that may be related to
the sorting of special needs teachers into different classrooms, the study supports the idea that
certification may matter with special populations of students.
Teachers generally gain an ESL certification in addition to a regular content area or
grade level credential. Lopez and her colleagues (2013) used a hierarchical linear model to
assess the relationship between state requirements for ESL teacher preparation and
credentialing (i.e., requiring a specialist certification or requiring an undergraduate course on
ESL strategies) and 4th grade Latino El achievement using 2009 NAEP reading scores. The
authors’ empirical analysis showed that Els in states that require teachers to hold a specialized
certification tend to perform better than those in states where there is no such requirement.
This study is potentially biased, however, as the authors do not have access to data linking
students to their teachers, classrooms, or schools and so they were unable to adequately
control for individual or contextual factors that might be related to student achievement and
they cannot control for the variables related to states’ decisions to adopt such requirements.

50
Darling Hammond and her colleagues (2005) used OLS regression to analyze the
relationship between teacher credentials and student achievement using a longitudinal data set
that included all students and teachers in the Houston Independent School District from 1995-‐
2001. Because Texas allows Spanish-‐speaking Els in grades 1-‐9 to take state mandated
standardized achievement tests in Spanish until they reach a certain level of English proficiency,
the authors were able to investigate how teacher certification was related to the achievement
of Spanish-‐dominant English learners. They found that alternatively certified teachers had the
most positive impact on these students, and that uncertified teachers had an even more
negative impact on the achievement of Spanish-‐dominant students than English-‐proficient
students. They posit that the positive correlation between alternative certification and Spanish
reading achievement might be explained by the high proportion of Spanish speaking teachers
who take part in the alternative certification program in the Texas setting. They also
hypothesize that the negative impact of non-‐certified teachers on Spanish dominant student
achievement is likely because teachers need specific knowledge and skills to teach Els and non-‐
certified teachers are less likely to have gained these skills on their own. This study, however,
does not examine the relationship between teachers who hold an ESL or Bilingual certification
and student achievement.
Two recent studies suggest that in certain contexts, a credential in either ESL or Bilingual
education is correlated with increased El student achievement. Master and his colleagues
(Master, Loeb, Whitney, & Wyckoff, 2012) use longitudinal data from New York City to estimate
a teacher fixed-‐effects model that distinguishes the effectiveness of individual teachers for
improving outcomes for both their El and non-‐El students. Loeb and her colleagues

51
(forthcoming) also found differences in teacher effectiveness for Els and NESs using a value-‐
added model. However, the results of these studies should be interpreted with caution because
New York City and Florida are unique and traditional destination contexts with regards to their
immigration history and immigrant population.
Experience. Experience in the classroom is one of few teacher attributes consistently
shown to be related to student achievement gains (Harris & Sass, 2011; Steiger & Rockoff,
2010; Cloftfelter, 2010). New teachers experience the most growth in effectiveness in the first
two years of teaching and returns to experience generally taper by a teacher’s 5th year (Henry,
Bastian, & Fortner, 2011; Kane, et al, 2008). On average, while teachers with 20 years of
experience are more effective than first year teachers, they are not more effective than 5th year
teachers (Rice, 2010). Further, one study found that high school math teachers with more than
25 years of experience were less effective in raising achievement than their colleagues with
fewer than five years of experience (Ladd, 2008). In sum, studies suggest that all experience is
not equal and that simply being in a classroom for more years is not a guarantee that a teacher
will be more effective in raising their students’ test scores.
The number of years of experience a teacher has specifically teaching Els can have
positive or negative repercussions on El achievement. Master and his team (2012) find that a
teacher’s total years of experience does not have a differential impact on the achievement Els
compared to non-‐Els. However, experience teaching Els not only predicts higher achievement
for all students; it has an even stronger impact on the achievement of El students. The authors
operationalized “experience teaching Els” as having taught 6 Els in any given year she was
included in the data. Future studies should investigate whether alternative measures of

52
experience, such as having taught at least 1 student, or year of experience teaching a certain
number of students, produce similar results.
Educational background. Another facet of teachers that has received attention by the
research community is their educational background, which includes performance on aptitude
exams in high school (i.e., SAT and ACT), performance on teacher entrances exams (i.e.,
PRAXIS), the quality of the undergraduate or graduate institution, undergraduate and graduate
course work and grade point average, and highest degree earned (Hightower, et al, 2011). The
basic assumption undergirding these studies “smart” teachers are good teachers.
Studies focusing on mainstream teachers have found some significant relationships
between educational background and student achievement. Ferguson (1991) analyzed the
impact of educational background of a large sample of teachers on the achievement of children
across the state of Texas and found that the largest single predictor of increased achievement
was performance on the Texas teacher licensure exam. More recent studies indicate mixed
results. Rockoff, Jacob, Kane, & Steiger use data collected from a survey of new math teachers
in New York City in 2006-‐2007 to model relationship between the SAT exam, other tests of
cognitive ability, whether a teacher passed their certification exam, college selectivity and 4-‐8th
grade student achievement in math (Rockoff, Jacob, Kane, & Staiger, 2008). They find that none
of these indicators of cognitive ability are significantly related to achievement gains. Clotefelter
and his colleagues (2007) find slightly different results in their study using 10 years of data and
models that include student or teacher fixed effects. The authors conclude that while the
selectivity of a teacher’s undergraduate institution is marginally related to student achievement
and having a master’s degree is unrelated to student achievement, a teacher’s licensure exam
53
test scores are positively and significantly related to student achievement in math across all of
their models.
Reviews of literature conclude that the only consistent relationship between
coursework at the undergraduate level and student achievement in a particular subject is for
secondary math and science teachers who have had relevant math or science coursework
(Hightower, 2011; Goe, 2007). Additionally, Feng and Sass (2013) find a positive relationship
between various measures of pre-‐professional training and the achievement in math and
reading of special needs students.
Some studies suggest that having a post graduate degree is also a significant predictor of
student achievement (Ferguson & Ladd, 1996). However, others conclude that results are
mixed and dependent on the subject and grade level being taught (Henry et al, 2014). For
example, Henry and his colleagues (2014) find that teachers who enter the profession with a
master’s degree are actually less effective at teaching middle school math and reading than
teachers who hold only bachelors, but are more effective at teaching high school science.
The existing research specific to El achievement has found that pre-‐service and in-‐
service training on particular strategies for educating Els has a positive impact on El
achievement (Master et al, 2012; Loeb, et al, 2014). Unlike the findings from the Ferguson
(1991) study of the mainstream teacher population, Master and his team found that that pre-‐
service test scores on the LAST (Liberal Arts and Sciences Test) needed for certification in New
York had no differential impact for El student achievement. Similarly, a study of the
effectiveness of the SIOP (Sheltered Instruction Observation Protocol) English language
development model found that students taught by teachers who participated in an extensive

54
in-‐service SIOP training performed better on an expository writing task (Echeverria, Short, &
Powers, 2010). The results from the SIOP effectiveness study should be interpreted with
caution, however, as the teachers volunteered to participate in the study and the authors did
not adequately control for selection bias.
Individual characteristics. Teachers are predominantly White, monolingual, and female
(Cochran-‐Smith & Zeichner, 2005; Shen, 1997), and researchers have tried to uncover and
explain the impact these characteristics have on minority students. Some demonstrate that
minority teachers connect better with minority students (Flores & Clark, 1997). Minority
teachers can act as cultural brokers between a minority student’s home and the school, which
can facilitate stronger home-‐school relationships (Stanton-‐Salazar, 2010, Marschall, Shan, &
Donato, 2012). Evidence suggests that minority students prefer to have teachers of the same
ethnicity and gender (Galguera, 2008). Using data form the Tennessee STAR randomized
experiment, conducted originally to analyze the impact of class size on student achievement,
Dee (2004) investigated whether student achievement is related to whether they are taught by
same-‐race teachers. He finds that Black students perform better when taught by Black
teachers, and that this positive relationship is strongest in schools that have a high
concentration of Black students and low-‐income students. Clotfelter and his colleagues (2007)
also found positive achievement gains for students who were taught by teachers of the same
race.
Other evidence suggests there may be negative repercussions for minority students who
are taught by teachers from different racial or ethnic backgrounds. An ethnography of a Texas
high school with a predominantly Latino student body illustrates the cultural disconnect
55
between the White, American teachers and students who were immigrants from Mexico or US
born Mexicans. The study describes how this disconnect creates mistrust, resentment, and
disengagement in the form of low achievement and drop-‐out (Valenzuela, 1999). Overall,
studies analyzing the impact of teacher race do not adequately address whether it is a teacher’s
race or other characteristics of the teacher that explain differential achievement. For instance,
Dee (2004) points out that teachers might be differentially assigned to teach minority students
based on their race and other characteristics, and thus differential assignment could be
confounding results.
Following the logic that minority teachers may be better equipped to teach minority
students, both Master and his colleagues (2012) and Loeb and her collaborators (2014) tested
whether teachers who speak Spanish are better able to increase achievement for Els. Speaking
Spanish does not indicate that a teacher is a minority, and not all Els are from Spanish speaking
backgrounds; nonetheless, the authors’ intention was to model if cultural similarity between
student and teacher might be related to academic achievement. The two studies are
inconclusive on the impact of fluency in Spanish, the predominant language spoken by Els in
public schools. In the New York context (Master, et al, 2012), language proficiency did not
differentially predict El student achievement; however, in the Florida setting (Loeb et al, 2014),
there was a positive relationship between Spanish fluency and El student achievement. These
findings illustrate the importance of context: Florida has a more developed bilingual education
system than New York City, and so Spanish fluency might be more important. The neutral
finding in the study by Master and his associates may be more generalizable to other urban
districts across the US where bilingual education is less common.

56
Master and his associates did uncover that a teacher’s desire to teach Els before
beginning of his or her career did have a positive impact on El achievement. This finding
indicates the importance of perception and motivation for teacher success, and suggests that
pre-‐service programs that help cultivate positive perceptions of El students among teachers
may reap benefits for El student achievement. Additionally, it suggests the role of selection into
particular teaching roles: teachers who want to work in a particular setting or with a particular
population seem to be more effective than those who are teaching outside of their comfort or
interest zone.
Conclusion
In sum, researchers know little about who teaches Els and what characteristics of these
teachers are most important for El achievement. The essential take-‐away from the literature is
that mainstream teachers are not being prepared adequately and generally do not feel
prepared to accommodate the needs of Els in their classrooms. More troubling, it also seems
that the teachers who are being trained to instruct Els also do not feel prepared.
The evidence available regarding teacher characteristics that are related to achievement
is narrow and context specific. Not only do the studies focused on El teachers fail to test the
impact of qualities that teacher educators have posited are most important, but they are also
limited to contexts that are not particularly generalizable to the settings where a growing
proportion of the El population is located.
How are Immigration Patterns Related to the Education of Els? Defining new and traditional destinations. More than 12 million school age children
speak a language other than English in the home, an increase from around 3.7 million in 2000,

57
and this number is projected to surpass 17 million by 2020 (Whittenberg, 2011). In absolute
terms, traditional immigrant destinations still have the largest share of recent migrants (Suro &
Singer, 2002); however, the growth rate has been much higher in new destinations that
previously had very small immigrant populations (Hall, 2012).
Increased settlement in new destinations is the result of emerging labor market
conditions and federal and state policies, notably the Immigration Reform and Control Act
(IRCA) of 1986 (Hirschman & Massey, 2008). Settlement in new destination areas persisted and
grew as a result of a phenomenon called “chain migration”, which describes how social
networks prompt migrants from different countries to settle in areas where established
populations of co-‐ethnics already exist (MacDonald, 1964; Massey, 2010; Massey, 1993).
Mexican participants in a qualitative study of migration to Marshalltown, Iowa, described how
only about 1,000 of the 8,00 residents of their hometown of Villachuato, Mexico lived there
year round, with the rest spending most of the year living and working in Marhsalltown (Grey &
Woodrick, 2005). Chain migration prompts the development of ethnic enclaves, areas “where
information on employment, housing, and other functional requirements is accessible and
plentiful, and that provide a social environment rich in ethnic and linguistic resources that help
ease the transition into the new land” (Hall, 2013, p.1876). These ethnic enclaves can serve an
important function in helping immigrants adapt and assimilate to their new homes (Portes &
Zhou, 1993).
When discussing both traditional and new immigrant destinations, states are too large a
unit of analysis, and it is more appropriate to discuss immigration to towns, cities, or counties
(Griffith, 2006). In new immigrant destinations immigrants have flocked to small towns and
58
cities to work in manufacturing, food processing, and agriculture (Drever, 2006; Donato,
Tolbert, Nucci, Kawano, 2008). When disaggregated to a smaller level, a particular geographic
area may be a new destination for a particular immigrant population but a traditional
destination for another (Hall, 2012).
Education of Els in new and traditional destinations. The largest modern wave of new
immigrants to the US ended by the early 2000s. Since that time, many immigrants who arrived
in the 1990s, who tended to be single men, have reunited with their families or have begun
new families in the US leading to an increase in the number of second generation immigrant
children needing ESL services in schools (Durand, Massey, & Capoferro, 2005; Shutika, 2005;
Griffith, 2005). O’neal and Tienda (2010, p.730) explain the challenge many communities face in
providing adequate services: “In the new immigrant destinations, immigration is neither a
relatively familiar process (as it is in the traditional destinations) nor a distant abstraction (as it
remains in much of the country), but a dynamic and challenging part of everyday life… [P]ublic
and private institutions in these places are now compelled to serve an ethnically distinct and
rapidly growing population segment”.
Like Els in traditional immigrant destinations, in new immigrant destinations Els are
predominantly Latino and Spanish-‐speaking. Most new immigrants are Mexican, although the
most prevalent nation of origin differs across states and counties (Drever, 2006). There are also
a substantial number of immigrants from Mexico and Central American countries who speak
indigenous languages, such as Mixtec or Mayan dialects, which complicates the provision of
services as they necessitate translators of low-‐incidence languages (Griffith, 2006).
Els in traditional destinations are more likely to be part of the second or third generations
59
and thus better incorporated into the fabric of the existing community (Payan & Nettles, 2007).
In contrast, Els in new destinations are more likely to be first or second generation immigrants,
and so they, or their parents, are likely to be “younger, …have limited English skills, to earn
lower incomes and to be undocumented” (Fix, Passel, & Velasquez, 2005). Because of their
generational status, Els and their parents in new destination states are less likely to have the
social and cultural capital that a large body of research has found is requisite for navigating and
excelling in American public schools (Coleman, 1988; Bourdieu, 1977; Sattin-‐Bajaj, 2011). Some
research finds that new destinations tend to have more undocumented immigrants than
traditional destinations (Marrow, 2011; Hooker, Fix, & McHugh, 2014), which can have a
profound effect on students daily lives and access to post-‐secondary education.
In new destination areas, Els are more likely than Els in traditional destinations to live in
rural communities or in the suburbs (Johnson & Lichter, 2008; Fry, 2010). Differences in where
immigrant families settle have important ramifications for students, as resources are not
distributed evenly across specific areas. Drever (2006, pp. 20) explains, “just as immigrants
themselves are not evenly distributed throughout the landscape, there is also a geography to
where immigrants with more and less human capital settle. Further, different places provide
different opportunities for upward mobility”.
Compared to schools in traditional destinations, schools in new destinations are “less likely
to have the infrastructure in place that can meet the needs of the immigrant and LEP students
such as networks for hiring bilingual teachers, or established curricula or assessment
instruments” (Fix, et al., 2005, pp.11-‐12). Bohon, Macpherson, and Atiles (2005) conducted a
series of focus groups with educators, parents, and community workers in districts across
60
Georgia, a new immigrant destination, to investigate the barriers to Latino immigrant student
success. They highlight the following six barriers:
1. Lack of understanding of the U.S. school system,
2. Low parental involvement in the schools,
3. Lack of residential stability among the Latino population,
4. Little school support for the needs of Latino students,
5. Few incentives for the continuation of Latino education, and
6. Barred immigrant access to higher education (p.43)
Perhaps unsurprisingly, these mirror the barriers that have been found to stall Latino and
immigrant academic achievement across the nation, including in traditional destination states
(Gandara & Contreras, 2009; Rumberger & Gandara, 2004). One notable difference between
the obstacles present in new and traditional destinations, however, is how race plays into
assimilation and acceptance in the school system (Wainer, 2006). Studies have found that the
influx of Latino students has disrupted a Black-‐White racial paradigm that exists in many new
destinations (Griffith, 2005; Marchall, Shah, & Donato, 2012; Beck & Allexsaht, 2001; O’Neal &
Tienda, 2010; Marrow, 2009). One Latino respondent explained that she felt like a non-‐person
within the school community: “In Georgia there are Black people and White people. [Teachers]
don’t know what to do. You’re not White, so they either treat you like you’re Black, or they just
ignore you” (Bohon et al, p 52).
Els in traditional destination states are 20% more likely than those in new destination
areas to attend a linguistically isolated school (defined as a school in which the population of Els
is over 30%) (Fry, 2006). This trend is likely because the population of Els is smaller in new
61
destinations, making high concentration in any one school less possible. However, in new
destination areas, the rate of Els attending linguistically isolated schools is still nearly 40% (Fix,
et al., 2005) and children in new destination areas are more likely than those in traditional
destinations to live in segregated, linguistically isolated neighborhoods (Hall, 2001).
The lower level of segregation from native English-‐speaking students between schools
for Els in new immigrant destinations may mean these students have access to more resources
and attend schools with more affluent peers. Dondero and Muller (2012) sought to gauge
access to educational opportunities for Latino students and Els in both new and traditional
destination states using data on 3,600 public schools from the NCES School District
Demographic System. On the one hand, they found that students in new destinations on
average attend schools that are more affluent and have a lower concentration of minority
students. Schools in new destinations typically have more teachers that are certified in the
subject area in which they are teaching. On the other hand, schools in new destinations tend to
have less developed systems for identifying Els and offer fewer opportunities to learn English in
a bilingual setting. Finally, the authors analyze the course taking behaviors of Latinos in new
and traditional destinations and find that students are less likely to take higher level math
courses in new destinations than their counterparts in traditional destinations.
How is Immigration Related to Schooling in North Carolina? This study is situated in North Carolina, a new immigrant destination. Many researchers
have been drawn to North Carolina because of its rapid demographic change and their studies,
based primarily on qualitative interviewing, paint a picture of how North Carolina is changing
and why research on the education of children in this state is important (Clotfelter, Ladd,
62
Vigdor, 2012; Griffith, 2005; Kandel & Parrado, 2005; Mahon, 2007; Thomas & Collier, 2009,
2010; Whittenberg, 2011; Weeks, Weeks, & Weeks, 2007; Bacallao & Smokowski, 2009;
Valencia & Johnson, 2006; O’Neal, Ringler, & Rodriguez, 2008; O’Neal & Tienda, 2010). North
Carolina is an appropriate and interesting site for additional study for myriad reasons. First, it is
a predominantly rural state. Currently, there is a dearth of research detailing how Els are
educated in such areas. Given that one third of all US schools are located in rural areas and one
fourth of all students are educated in rural areas (Keaton, 2013) it is imperative that research
investigate issues of access and equity to ensure that students are not being denied
opportunities simply because of where they live.
Second, North Carolina is a southern state, where the predominant narrative related to
schooling has been focused on the segregation, desegregation, and resegregation of Black
students from White students for at least 60 years (Ayscue, Woodward, Kucsera & Siegel-‐
Hawley, 2014). Investigations into the educational lives of other groups of students are
important in updating this focus to reflect the growing diversity of the school population.
Finally, North Carolina is growing and diversifying economically, as well as
demographically (Frey, 2014). As a state, North Carolina has the 9th largest GDP and was ranked
the 3rd best “State for Business” by Forbes magazine (Badenhausen, 2014). Thus, research
situated in North Carolina can help document how and whether economic change is “lifting all
boats”; that is, contributing to improvements in schooling for all students. In the sections below
I detail patterns of immigration to North Carolina, and what we know about how immigration is
related to the education of Els.
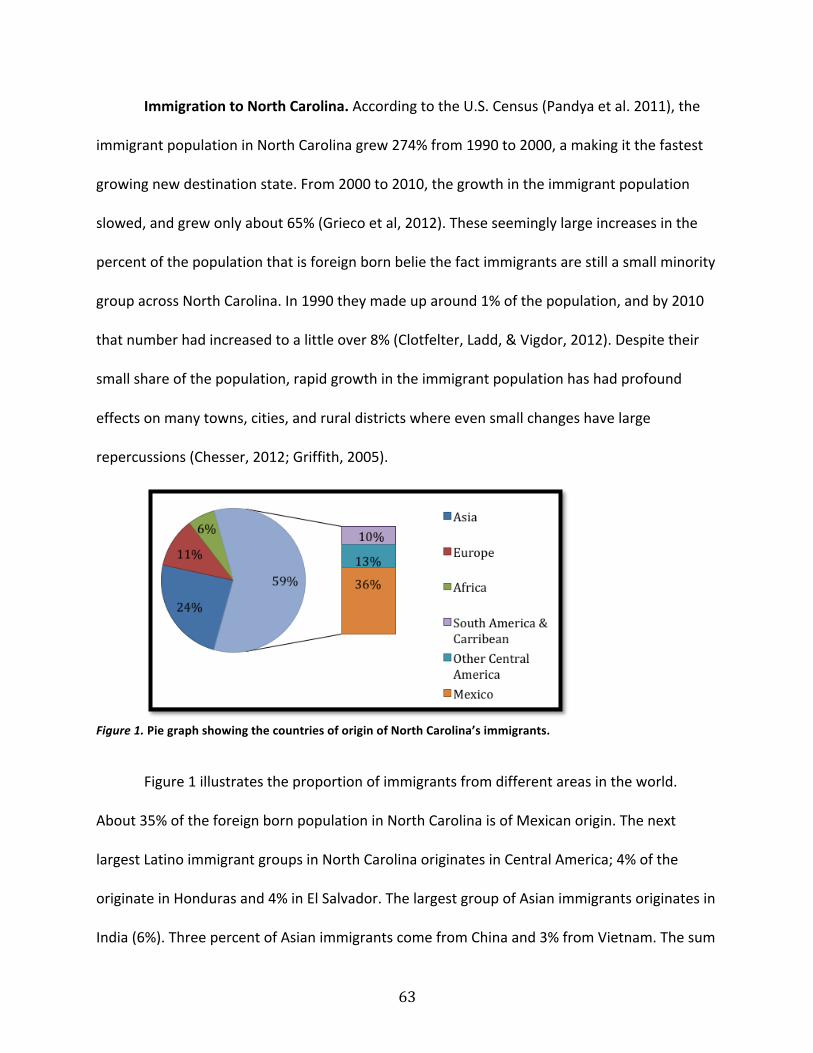
63
Immigration to North Carolina. According to the U.S. Census (Pandya et al. 2011), the
immigrant population in North Carolina grew 274% from 1990 to 2000, a making it the fastest
growing new destination state. From 2000 to 2010, the growth in the immigrant population
slowed, and grew only about 65% (Grieco et al, 2012). These seemingly large increases in the
percent of the population that is foreign born belie the fact immigrants are still a small minority
group across North Carolina. In 1990 they made up around 1% of the population, and by 2010
that number had increased to a little over 8% (Clotfelter, Ladd, & Vigdor, 2012). Despite their
small share of the population, rapid growth in the immigrant population has had profound
effects on many towns, cities, and rural districts where even small changes have large
repercussions (Chesser, 2012; Griffith, 2005).
Figure 1. Pie graph showing the countries of origin of North Carolina’s immigrants.
Figure 1 illustrates the proportion of immigrants from different areas in the world.
About 35% of the foreign born population in North Carolina is of Mexican origin. The next
largest Latino immigrant groups in North Carolina originates in Central America; 4% of the
originate in Honduras and 4% in El Salvador. The largest group of Asian immigrants originates in
India (6%). Three percent of Asian immigrants come from China and 3% from Vietnam. The sum

64
of the foreign born population comes from diverse nations around the world (US Census,
2011a).
The US Census (2010a) also describes the languages that immigrant groups speak at
home. About 67% of the population that speaks a language other than English at home speaks
Spanish and 12% speaks an Asian language. Speakers of different languages vary in their English
language proficiency: 57% of Spanish speakers speak English less than very well, compared to
48% of Chinese speakers and 63% of Vietnamese speakers. Differences in the ability of not only
children, but also adults, to speak English very well impact the relationship immigrant families
might have with the school (Suarez Orozco et al., 2011).
Regional differences. North Carolina is a diverse state demographically and
geographically. Differences across various regions of the state have shaped the flow of
immigrants into and across North Carolina over time. Figure 2 shows the proportion of foreign-‐
born people in each North Carolina counties. The foreign-‐born population is not evenly
distributed across North Carolina’s counties. Gates County and Bertie County, located in the
upper East portion of the state, have a foreign born population of less than 1%. In contrast, the
five counties with the highest proportion of foreign born residents each have a population that
is over 12% foreign born.

65
Figure 2. Map showing percent of foreign-‐born population in each North Carolina county7.
Both available jobs and educational opportunities help explain settlement patterns.
Table 4 lists the top employers in each of the five counties with the largest foreign-‐born
population. Three of these counties – Wake, Orange, and Durham-‐-‐ are part of North Carolina’s
Research Triangle. The Research Triangle is the home to three large research universities as well
as the site of many high tech industries. This area has seen an influx of immigrants seeking both
education and employment (Frey, 2014). Similarly, Mecklenburg County is a large urban center
whose largest employers include two large banks. Indeed, Bank of America is headquartered in
Charlotte, located in Mecklenburg County.
Duplin County, a rural county located in South Central North Carolina, stands in stark
contrast to counties located in the Research Triangle and Mecklenburg County. Three of the 5
7 Source: North Carolina Justice Center, 2007-‐2011 ACS estimates

66
largest employers in Duplin are poultry or pork processing plants, industries that have been
major employers of new immigrant populations (“Major Employers in Duplin County”, 2014).
Table 4 Largest Employers in Counties with the Largest Share of the Foreign-‐Born Populations
County % Foreign Born Top 5 Employers Industry Durham County 14 Duke University
IBM Corporation Durham Public Schools Glaxosmithkline Veterans Administration
Education Manufacturing Education Health Services Public Administration
Mecklenburg County
13.6 Charlotte Mecklenburg Hospital Wells Fargo Bank Charlotte Mecklenburg Schools Bank of America US Air
Health Services Financial Services Education Financial Services Transportation
Wake County 13.8 Wake County Public Schools NC State at Raleigh Wake Med Sas Institute Rex Hospital
Education Education Health Services Information Technology Health Services
Orange County 13.4 UNC Chapel Hill UNC Health Care Chapel Hill-‐Carrboro Public Schools Orange County Schools Orange County
Education Health Services Education Education Public Administration
Duplin County 12.7 Butterball Smithfield Foods Duplin County schools (Education); House of Raeford Murphy Family Ventures
Food processing Food processing Education Food processing Food processing
Source: North Carolina Justice Center, 2007-‐2011 ACS estimates; NC Commerce, Labor, and Economic Analysis Division (http://accessnc.commerce.state.nc.us/EDIS/business.html). It is no surprise that the immigrant and El populations in Duplin compared to say, Wake
County, are quite different given their contrasting economies. Table 5 shows select
characteristics of the foreign born population in both Duplin and Wake County. The differences
in the educational attainment of adult immigrants across the two counties are striking. The
overwhelming majority of immigrants in Duplin have not graduated high school, whereas in
Wake almost half of the immigrant population has completed college or beyond (Figure 3) (US
Census, 2011c). In fact, in Wake County, a higher proportion of immigrants have a graduate or
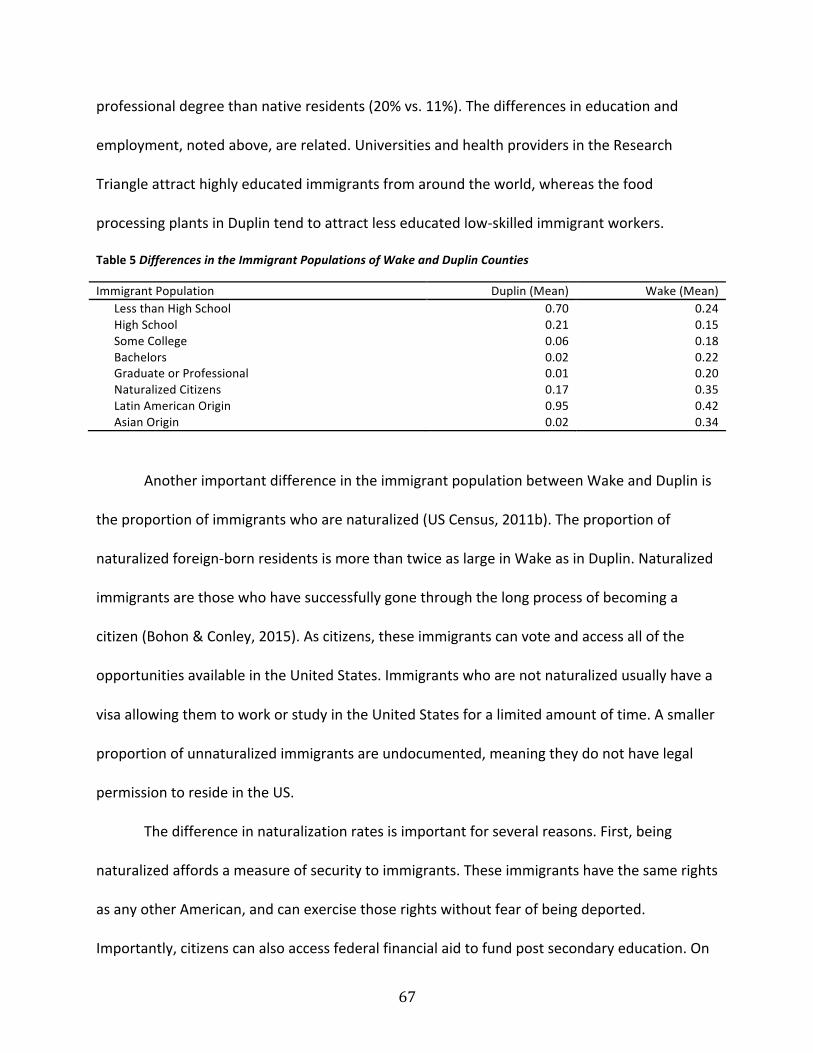
67
professional degree than native residents (20% vs. 11%). The differences in education and
employment, noted above, are related. Universities and health providers in the Research
Triangle attract highly educated immigrants from around the world, whereas the food
processing plants in Duplin tend to attract less educated low-‐skilled immigrant workers.
Table 5 Differences in the Immigrant Populations of Wake and Duplin Counties
Immigrant Population Duplin (Mean) Wake (Mean) Less than High School 0.70 0.24 High School 0.21 0.15 Some College 0.06 0.18 Bachelors 0.02 0.22 Graduate or Professional 0.01 0.20 Naturalized Citizens 0.17 0.35 Latin American Origin 0.95 0.42 Asian Origin 0.02 0.34
Another important difference in the immigrant population between Wake and Duplin is
the proportion of immigrants who are naturalized (US Census, 2011b). The proportion of
naturalized foreign-‐born residents is more than twice as large in Wake as in Duplin. Naturalized
immigrants are those who have successfully gone through the long process of becoming a
citizen (Bohon & Conley, 2015). As citizens, these immigrants can vote and access all of the
opportunities available in the United States. Immigrants who are not naturalized usually have a
visa allowing them to work or study in the United States for a limited amount of time. A smaller
proportion of unnaturalized immigrants are undocumented, meaning they do not have legal
permission to reside in the US.
The difference in naturalization rates is important for several reasons. First, being
naturalized affords a measure of security to immigrants. These immigrants have the same rights
as any other American, and can exercise those rights without fear of being deported.
Importantly, citizens can also access federal financial aid to fund post secondary education. On

68
the other hand, non-‐naturalized citizens live in a more precarious position. Those with work or
student visas are at the whim of employers or educational institutions for sponsorship, a
requirement for their continued residence. Immigrants who are undocumented can be
apprehended and deported at any time. The fear of losing the protection of a work or student
visa or of deportation can make non-‐naturalized immigrants less engaged with public
institutions, such as schools (Suarez-‐Orozco, et al, 2011).
Figure 3. Bar graph showing educational attainment of immigrants in Wake and Duplin counties.
Immigration and Els. The growth of the immigrant population in North Carolina is
directly correlated to growth in the proportion of students learning English. Figure 4 shows the
percent growth in both the public school El population and NES population since the 2005-‐2006
school year. While the El population more than doubled since 2005-‐2006, the NES population
has remained almost constant. This figure also demonstrates that growth in the El population
has not been linear. Demographers reported that following the 2008 recession, many
immigrants returned to their countries of origin or migrated within the country in search for
0.00
0.10
0.20
0.30
0.40
0.50
0.60
0.70
0.80
Less than High School
High School Some College
Bachelors Graduate or Professional
Wake
Duplin
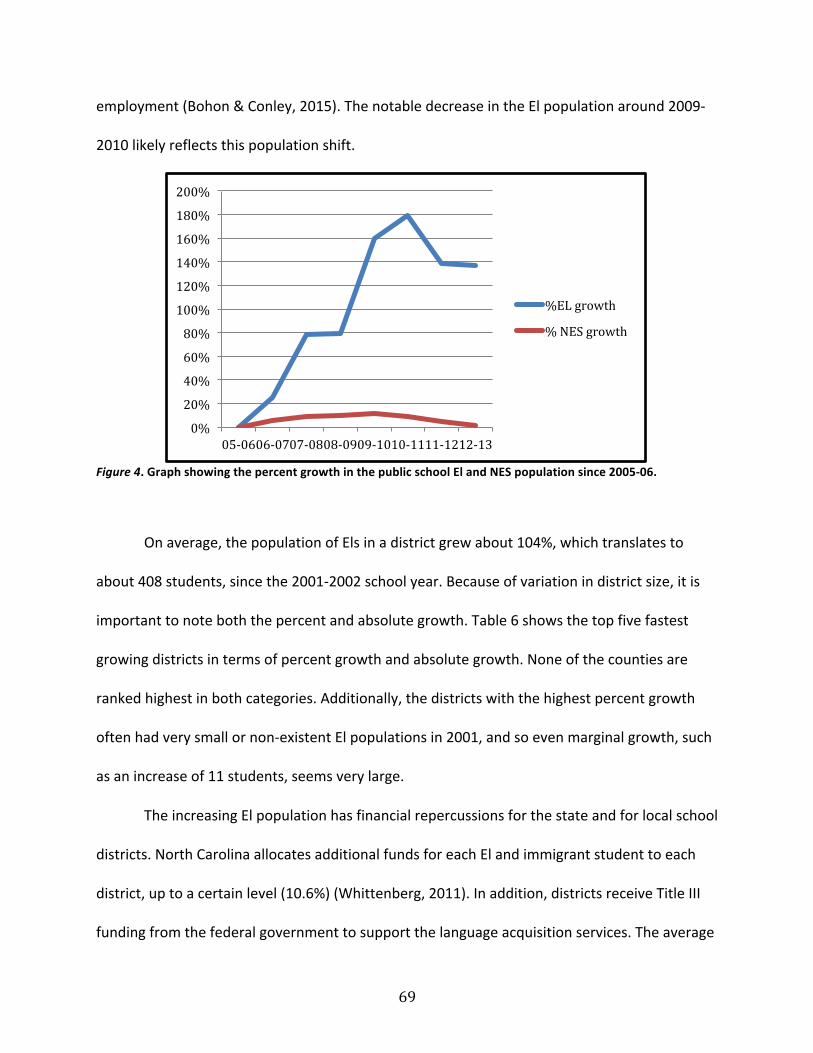
69
employment (Bohon & Conley, 2015). The notable decrease in the El population around 2009-‐
2010 likely reflects this population shift.
Figure 4. Graph showing the percent growth in the public school El and NES population since 2005-‐06.
On average, the population of Els in a district grew about 104%, which translates to
about 408 students, since the 2001-‐2002 school year. Because of variation in district size, it is
important to note both the percent and absolute growth. Table 6 shows the top five fastest
growing districts in terms of percent growth and absolute growth. None of the counties are
ranked highest in both categories. Additionally, the districts with the highest percent growth
often had very small or non-‐existent El populations in 2001, and so even marginal growth, such
as an increase of 11 students, seems very large.
The increasing El population has financial repercussions for the state and for local school
districts. North Carolina allocates additional funds for each El and immigrant student to each
district, up to a certain level (10.6%) (Whittenberg, 2011). In addition, districts receive Title III
funding from the federal government to support the language acquisition services. The average
0%
20%
40%
60%
80%
100%
120%
140%
160%
180%
200%
05-‐06 06-‐07 07-‐08 08-‐09 09-‐10 10-‐11 11-‐12 12-‐13
%EL growth
% NES growth

70
increase in the allotment provided to each year to each district since 2001-‐02 has been around
$458, 417 (Angela McNeill, Personal Communication, May 28, 2014). The average increase in
allotment provided to the five counties listed above with the largest absolute increase in Els
was around 10 times as much, at about $4,971,707 (Angela McNeill, Personal Communication,
May 28, 2014).
Table 6 Districts with Fastest Growing El Populations, 2001-‐02 to 2012-‐13
# Increase Rank % Increase Rank Mecklenburg County 9440 1 140.79 25 Wake County 7515 2 168.99 21 Forsyth County 3877 3 141.65 24 Durham Public 2583 4 129.09 27 Guilford County 2449 5 69.02 54 Perquimans County 11 88 1100.00 1 Clay County 19 84 633.33 2 Pasquotank County 104 54 611.76 3 Pamlico County 16 87 400.00 4 Currituck County 23 81 383.33 5
Regional Variation. The above descriptive summary makes it evident that changes in
the El population vary considerably by county. Returning to our two example counties, Wake
and Duplin, there are clear connections between the characteristics of the local immigrant
population and the local school population. The demographics of the foreign born adult
population explain some of the differences in the El populations in both counties, shown in
Table 7.
While about 13% of the population of both counties is foreign born, the proportion of
Els enrolled in Duplin public schools is more than double than the proportion of Els in Wake
public schools. In Duplin immigrant parents may be more likely to send their children to public
schools whereas in Wake, more affluent and educated immigrant parents may be more
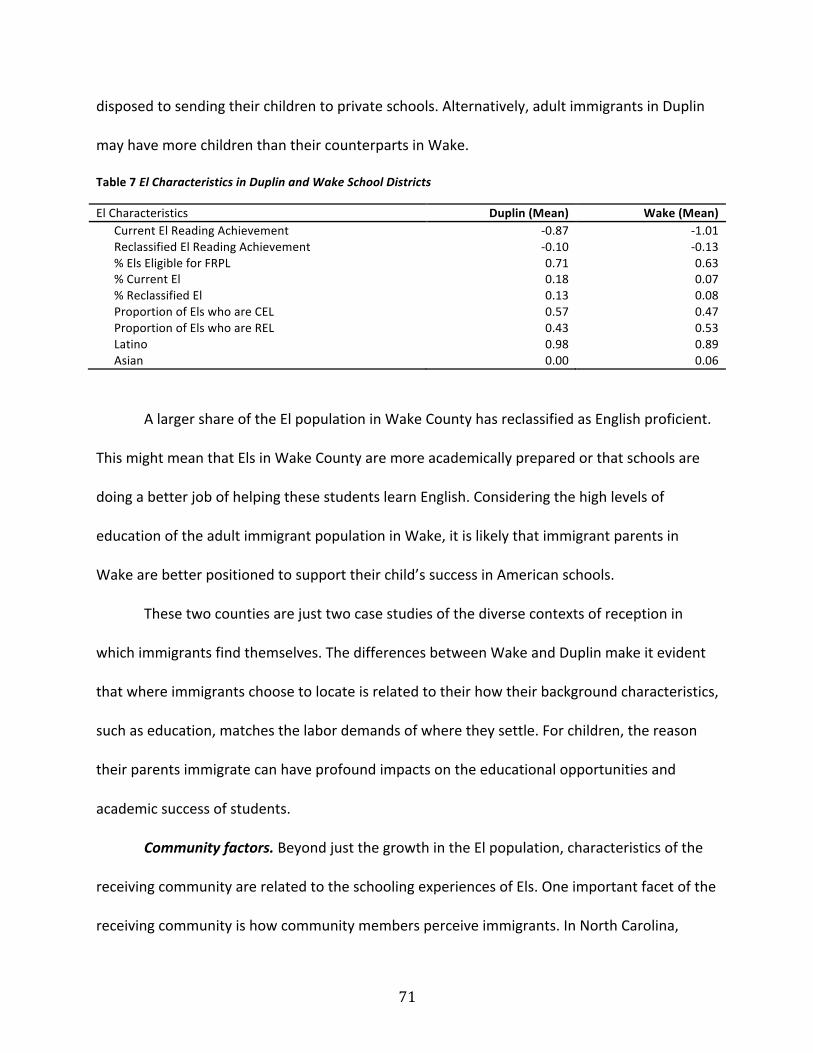
71
disposed to sending their children to private schools. Alternatively, adult immigrants in Duplin
may have more children than their counterparts in Wake.
Table 7 El Characteristics in Duplin and Wake School Districts
El Characteristics Duplin (Mean) Wake (Mean) Current El Reading Achievement -‐0.87 -‐1.01 Reclassified El Reading Achievement -‐0.10 -‐0.13 % Els Eligible for FRPL 0.71 0.63 % Current El 0.18 0.07 % Reclassified El 0.13 0.08 Proportion of Els who are CEL 0.57 0.47 Proportion of Els who are REL 0.43 0.53 Latino 0.98 0.89 Asian 0.00 0.06
A larger share of the El population in Wake County has reclassified as English proficient.
This might mean that Els in Wake County are more academically prepared or that schools are
doing a better job of helping these students learn English. Considering the high levels of
education of the adult immigrant population in Wake, it is likely that immigrant parents in
Wake are better positioned to support their child’s success in American schools.
These two counties are just two case studies of the diverse contexts of reception in
which immigrants find themselves. The differences between Wake and Duplin make it evident
that where immigrants choose to locate is related to their how their background characteristics,
such as education, matches the labor demands of where they settle. For children, the reason
their parents immigrate can have profound impacts on the educational opportunities and
academic success of students.
Community factors. Beyond just the growth in the El population, characteristics of the
receiving community are related to the schooling experiences of Els. One important facet of the
receiving community is how community members perceive immigrants. In North Carolina,

72
researchers have uncovered how income, nativity, and geography are related to the
community’s acceptance of new immigrants. O’Neal and Tienda (2010) surveyed non-‐
immigrant adults and found that low-‐income, non-‐immigrant adults and parents of non-‐
immigrant school age children had more negative attitudes towards immigrants than others.
These negative attitudes can have important implications for how children are received in
schools in counties that have experienced a large increase in the immigrant population. In their
comparison of two counties, one with high immigration growth and the other with low
immigrant growth, the authors find some evidence that more growth in the immigrant
population within a county is correlated with more positive attitudes towards immigrants
(O’Neal & Tienda, 2010). The findings in their study are limited as data are cross-‐sectional and
many measures are based on self-‐report. However, the study suggests that perceptions of
immigrants are malleable and related to certain characteristics of the native population.
The perception school leaders have of immigrants and Els, coupled with access to
sufficient resources, can have important impacts on how schools receive Els. A North Carolina
school district profiled in one study took an “aggressive and family-‐centered” approach to
accommodating Els and their families (Kandel & Parrado, 2006, p. 126). Programs included a
welcome center for new immigrant families that provided English and GED classes for adults,
tours of local institutions such as hospitals, and legal assistance. Importantly, the authors
explain that because this North Carolina district is located in an urban area, it had access to
more funding and human capital and enrolled a less mobile and higher income immigrant
population than existed in the rural Mississippi district they also profiled. Additionally, efforts to
provide programming and services for immigrant students and their families were the result of

73
localized efforts, not mandates from the state or district. In the district, the receiving
community demonstrated that they valued the contributions of immigrants and welcomed
immigrants and children into the school.
North Carolina policies related to Els. An important facet of an immigrant’s new
community is the government policies that shape the community in which an immigrant lives
(Portes & Zhou, 1993). Federal, state, and local policies dictate both how immigrants will be
received in the community and how immigrant students will be received in school. As described
above, Federal laws and court decisions broadly dictate the services that must be provided in
public schools for Els. North Carolina as a state has leeway to create and implement policies
that directly impact the lives of Els. These include how Els are identified, taught, and
reclassified; they type of English language development programs that can be used; and
requirements for how teachers will be trained and certified to teach Els. At the community
level, state and local immigration polices impact students and their families. In the following
sections I detail policies relevant to how Els are educated in North Carolina.
Student related policies. According to Title III of No Child Left Behind each state must
report the number of Els that have been identified and the percent that have been reclassified
as English proficient each year (NCLB, 2002; Garcia, 2007). The federal government mandates
the use of a standardized process for identifying and reclassifying English learners in order to
minimize misclassifying students and thus misallocating resources. Over-‐identifying students or
keeping students labeled as an El longer than necessary diverts scarce school resources towards
unnecessary services, while the opposite impedes a student access to services mandated by
federal law. In spite of the mandate to create standardized processes, the federal government

74
leaves it up to each state to devise their own rules for identifying and reclassifying English
learners.
Identification. Identification is typically based on two pieces of data: the student’s native
language and English proficiency. Schools typically assess the student’s native language using a
“Home Language Survey” (HLS) which consists of 3-‐ 10 questions aimed at assessing which
language a student first learned to speak, which language they speak most often, and whether
they are exposed to languages other than English in the home. North Carolina, along with forty-‐
two other states, allow individual districts to design their own home language surveys, ensuring
that variability in the construction of home language surveys occurs not only across states but
also across districts within states.
Students flagged by the HLS in North Carolina take the W-‐APT (WIDA8 – ACCESS
Placement Test) that assesses student proficiency in English across the four language domains
of reading, writing, speaking, and listening. Parents can waive the right for their children to
enroll in an ELD program even if they are identified as not proficient in English by the WIDA
assessment. In the case that a student’s parents waives services, the student is still considered
an El for accountability purposes and must still take the WIDA ACCESS test on a yearly basis
until they pass the proficiency thresholds.
Reclassification. Reclassification refers to the process by which El students are
determined to be English proficient and thus no longer eligible for services. It is important to
8 World-‐class Instructional Design and Assessment (WIDA) is an organization that develops standards and assessments for English learners. The WIDA consortium is a group of 33 states that use the WIDA developed assessments for identification and yearly language assessments. North Carolina joined the WIDA consortium in 2008.

75
remember that Els are expected to become proficient in English during their time in school and
join the mainstream population. Reclassification typically depends not only on English
proficiency, but also on other factors such as academic proficiency and teacher perception
(Mavrogordato, 2012; Grissom, 2004).
The first benchmark for reclassification as English Proficient is tied to the annual
assessments Els are mandated to take according to NCLB. Each state has adopted or created an
English language proficiency exam used to measure the progress Els make on the four language
domains. Els in North Carolina take the WIDA ACCESS (Assessing Comprehension and
Communication in English State-‐to-‐State for English Language Learners) exam, which measures
English, proficiency in the four language domains (reading, writing, listening, and speaking). An
El in North Carolina must reach a level of 4.0 out of 6.0 in reading and writing as well as a
composite score of 4.8 (an average of all language domain proficiencies) in order to be eligible
to exit. After a student exits, they are then monitored for two years to insure they are making
adequate progress.
ELD Instruction. North Carolina allows for districts and schools to choose from among a
wide variety of ELD programs, including sheltered English instruction (e.g., SIOP), Pull out ESL
instruction, co-‐teaching models, one way bilingual programs, and dual immersion programs.
Bilingual programs of any type are very uncommon; in 2014 there were only 95 bilingual
schools across the state and were mostly charter schools located in urban areas (NC DPI, 2014).
El testing. Els in North Carolina participate in several standardized assessments each
year. As mentioned above, Els take the WIDA ACCESS test each year until they reach proficiency
and are reclassified. Els who enter the school system after Kindergarten and receive below a 4

76
on the reading subtest on the W-‐APT are not required to take the English Language Arts End of
Grade Assessment for one year. Except for this waiver, Els must take the same standardized
achievement tests as their native English speaking (NES) peers, regardless of their language
proficiency. Students in grades 3-‐8 take a standardized reading and math End of Grade exam
each year. Additionally, students in grade 5 and 8 take an End of Grade science test. Students in
10th grade take End of Course exams if they are enrolled in classes that require them. Currently,
there are End of Course exams for Biology, Algebra I/Integrated I, and English II (NC DPI, 2015).
Undocumented students. A recent report from the Pew Hispanic Center estimates that
3.5% of the immigrant population in North Carolina is undocumented (Passel & Cohn, 2013).
While Els are not necessarily undocumented students, documentation status is an important
impediment to academic achievement for many immigrant students. The Supreme Court case
Plyler vs. Doe (457 U.S. 202, 1982) guarantees undocumented students the right to a free K-‐12
public education. In response to Alabama’s HB 56 law that restricted many of the rights and
freedoms of undocumented immigrants, a federal district court has also decided that schools
can not ask students for social security numbers or any other evidence of legal status (United
States v Alabama, 2013). However, there have been at least two lawsuits brought against
school districts that have barred undocumented immigrants from enrolling in public schools
(Southern Poverty Law Center, 2014). The Southern Poverty Law Center claims that some
immigrant students:
…are being turned away at the schoolhouse door for reasons such as immigration
status, limited English proficiency, and age. Enrollment is also significantly delayed for
many unaccompanied children due to inability to verify domiciles or prove that sponsors
77
are legal guardians. Further, unaccompanied children and their sponsors are being
discouraged from enrolling due to inadequate language access in schools and an
unwelcoming, hostile environment”.
Additionally, the right to a free public education does not extend to post-‐secondary
institutions, where undocumented students are denied federal financial aid and in most cases
have to pay international or out of state tuition to attend public universities or community
colleges. To date, 18 states, not including North Carolina, have enacted provisions to allow in-‐
state tuition rates for undocumented students. As of the 2012 DACA decree (Deferred Action
for Child Arrivals), undocumented students who graduated from a North Carolina high school
are able to enroll in public universities and colleges, but must pay out of state tuition (“NC Nixes
Cheaper Tuition”, 2014). Restrictive polices towards undocumented students are problematic
because they can discourage youth from enrolling in college preparatory courses, finishing high
school, or pursuing academic endeavors (Patel, 2012).
Teacher related policies.
Certification. A teacher working in North Carolina must complete the following
requirements in order to become certified as an ESL teacher: 1. Complete a state approved
teacher education program OR complete another state’s alternative certification route, meet
federal requirements to be designated as “highly qualified” AND earn a bachelor’s degree from
accredited university 2. Pass the Praxis 1 Reading, Writing, and Math Exam, and 3. Pass the
Praxis 2 Teaching Exam. This structure allows teachers to earn an ESL endorsement by simply
passing a test, without having to complete any ESL specific program of study or any hours of
clinical observation. Teachers must score a 141/200 in order to pass the Praxis 2 ESL test. This

78
cut-‐off is slightly below the average cut-‐off of 145/200 set by the 21 other states that use this
test (ETS, 2015).
Accountability. Teachers in North Carolina are evaluated using the Education Value-‐
Added Assessment System (EVAAS), a measure that is intended to measure the average growth
made by each teacher’s students that is attributable to the teacher and not student or
community characteristics. EVAAS scores are calculated using student achievement scores on
the standardized End-‐of-‐Course exams, End-‐Of-‐Grade assessments, and, beginning in the 2012-‐
2013 school year, Measures of Student Learning Exams. End-‐of-‐Grade exams are administered
in the last 10 days of the school year and assess student learning in English Language
Arts/Reading and Math in grades 3-‐8 and Science in grades 5 and 8. End-‐of –Course exams are
used to assess student learning in Math in 9th grade and English and Biology in 10th grade (NC
DPI, 2015). The new Measures of Student Learning are meant to provide assessment data to
evaluate teachers in otherwise non-‐tested subjects and grades. They include assessments of
English Language Arts, Math, Science, and Social Studies in grades 4-‐12. NC DPI developed a
system of analyzing student work for ESL teachers that will count as their Measure of Student
Learning assessment that they piloted for the first time in 2013 (NC DPI, 2015).
It is not clear who is considered an ESL teacher-‐ if it is any teacher with an ESL license, or
only those teaching a certain proportion of Els in each class.
Pupil Teacher Ratio. North Carolina has established student teacher ratios that are used
for funding purposes. This ranges from 1 teacher to 19 students in Kindergarten to 1 teacher for
every 29 students in high school (highlights of the north Carolina public school budget
February). There are no state policies mandating the pupil-‐teacher ratio for ESL classes or ESL

79
teachers. According to district documents, some districts are attempting to keep the pupil-‐
teacher ratio to less than 50 Els per ESL teacher (DPS, 2015). In contrast, Tennessee has a
mandated statewide staffing policy that requires a pupil-‐teacher-‐ratio of 40 Els to 1 ESL
teacher.
School, district, state, and other policies. Title III funds. The federal government
provides categorical grants to districts for the education of English learners and immigrant
students through the Title III program. This money is distributed to districts based on both the
number of Els in the district as well as the percent increase in immigrant students. In order to
receive Title III grants to support language acquisition services, districts must enroll at least 20
Els or 2.5% of the average daily membership must be Els. Districts can receive Title III significant
increase grants if the population of Els increases by 4% over a period of two years. Districts that
do not qualify for Title III funding can join with other districts to create a consortium that shares
resources. The amount of monetary support comes to about 1,452 dollars per El.
Districts that receive Title III funds must develop Annual Measureable Achievement
Objectives (AMAOs) in order to track the progress of Els. The three AMAOs, created by the
state, are to monitor the proportion of Els making progress in learning English, attaining English
proficiency, and making AYP for the El subgroup.
Title I Funding. In order for a school to be mandated to report sub-‐group data for Els and
receive Title I funding to support this population, the school population of Els must be greater
or equal to 40 students or 1% of the tested population (AIR, 2012).
State Funds. The state of North Carolina also provides districts with money to support
the education of Els according to both the number and concentration of Els in the district (NC
80
DPI, 2015). This funding is capped: if the population of Els surpasses 10.6% of the average daily
membership, the district does not receive additional per pupil funds. About 40% of districts had
an El population that exceeded this cap in 2013, meaning that they had to make up the
difference using local resources. This cap creates a structure whereby districts with the highest
El populations are systematically underfunded.
In 2013-‐2014, state funding amounted to about 779 additional dollars per El, in addition
to the base per student allotment of about 5,075 dollars. In comparison, schools are allotted an
additional 338 dollars for each low-‐income student and an additional 3,761 dollars for each
special needs student.
Immigration policies. North Carolina is certainly not the most restrictive southern state
in terms of its immigration policy, and many communities have created structures to welcome
new immigrants (Immigration Policy Center, 2014). In North Carolina, undocumented
immigrants are entitled to emergency services, health care, and other programs that the state
deems necessary for safety (“North Carolina State Immigration Laws”, 2015). Like in most
states, a social security number is required for obtaining a drivers license, but young adults
eligible for DACA (Deferred Action for Childhood Arrivals) are eligible to apply for this
documentation (National Immigration Law Center, 2013). State agencies and private businesses
with more than six people are required to use the E-‐verify system, created to verify a person’s
documentation status, when hiring.
North Carolina participates in the ICE ACCESS program, in which local law enforcement
partners with the Federal Immigration and Customs Enforcement office to enforce immigration
regulations and facilitate deportation of immigrant criminals (Nguyen & Gill, 2010). An

81
evaluation of the implementation of the ACCESS program found that most immigrants were
detained for traffic violations and other misdemeanors, and that the program was hurting the
relationship between the Latino immigrant community and law enforcement. In recent years,
the American Civil Liberties Union and the US Department of Justice have investigate police
departments in North Carolina accused of racial profiling (North Carolina Justice Center, 2010;
Santiago, 2013). These programs sometimes lead to a culture of fear among immigrants which
might be associated with less family engagement with the school.
Conclusion. Several conclusions emerge across studies of schooling in new destinations.
First, Els in North Carolina tend to enroll in qualitatively different schools in new destinations
than in traditional destinations. Evidence suggests that Latinos are more likely to be attending
schools outside of urban centers with more affluent peers and more credentialed teachers
(Dondero & Meuller; Fry, 2010). However, these findings largely come from analyses limited to
descriptions of school level characteristics culled from information from large metropolitan
areas, and they tend to focus on Latino students. Qualitative studies in North Carolina and
elsewhere have shed light specifically on the education of Els, and show that schools and
communities in new destinations are facing many of the same obstacles to educating Els
documented in traditional destination areas and that they are reacting to growing populations
of Els differently according to their capacity.
Evidence from research and policy reports suggest that North Carolina is only just
beginning to think on a large scale in terms of its policies regarding the education of Els. The
clearest policies are those related to testing, identification, and reclassification, and are directly
related to the federal mandates stipulated in No Child Left Behind. Before the enactment of

82
NCLB, there were no consistent policies regarding accountability and districts were essentially
left to their own devices.
That being said, there has been little thought as to how Els should be assessed for
accountability purposes. Besides allowing recent immigrant arrivals to opt out of taking the
standardized ELA exam during the first year they are attending an American school, Els take the
same regimen of standardized tests (in addition to standardized tests that judge their language
proficiency) as native English speakers. Thus both Els, and their teachers, are held accountable
for their performance on a test that research has shown is not a valid assessment of Els
(Solórzano, 2008).
Policies describing how teachers should be prepared to teach Els are almost non-‐
existent. In fact, nowhere on the NC Department of Public Instruction website are the
requirements for teacher Els listed (because in essence there are no requirements). There is
little evidence that public universities across the state have filled this vacuum, as most do not
provide programs for teachers who want to specialized in teaching Els.
In North Carolina, the largest impediment to El success is school indifference. There are
few policies that prescribe how Els can be supported, and so in practice, schools have
substantial freedom to shape the educational contexts for Els. As evidence by research cited
above (Bennet, 2012; Kandel & Parrado, 2006; Franklin, 2012), this can be tremendously
beneficial if school leaders make supporting Els and their families as they transition to a new
community a priority. However, there are likely to be at least as many instances where Els are
not afforded the support they need to be successful simply because educators are not aware of
what they could be doing.

83
Theoretical Framework The literature cited above suggests some of the important community, school, and
classroom factors that may be related to El achievement. In this section, I rely on theories of
assimilation and social and cultural capital development to explain why segregation and teacher
training might help or hinder the academic trajectories of Els. I conclude by describing two
hypotheses specifically related to classroom level factors that I subsequently test.
Achievement as Assimilation For English learners, who are immigrants or the children of immigrants, long-‐term
success depends on how successful they are at assimilating into American culture. The idea of
assimilation has a long and contentious history related to deficit views of immigrants and
government policies aimed at eradicating immigrants’ native identity and culture (Alba & Nee,
1997). In recent scholarly work, assimilation has been conceptualized in a more neutral manner
and defined “as the decline, and at its endpoint the disappearance, of an ethni-‐racial distinction
and the cultural and social differences that express it” (Alba & Nee, 1997, p.863) that “occurs
spontaneously and often unintendedly in the course of interaction between majority and
minority groups” (Alba & Nee, 1997, p.827). For students in schools, learning English and the
“language of schooling” is arguably the most important indicator of assimilation.
The earliest theory describing the assimilation process is straight-‐line assimilation, which
posits that immigrants assimilate in three stages: acculturation, structural assimilation, and
intermarriage (Gordon, 1964; Massey, 2010). Acculturation is when immigrants learn the
language and superficial cultural aspects of their host nation. Structural assimilation is when
immigrants share social networks with natives of the host nation, and intermarriage, which
84
assumes diminished prejudice and discrimination, is when immigrants are so ingrained in the
host nation that they intermarry with native residents.
Gordon’s theory has been criticized for being ethnocentric and not supported by data
(Alba & Nee, 1997). In a subsequent iteration of assimilation theory, Portes and Zhou (1993)
advanced the model of segmented assimilation. This theory posits that there are multiple
assimilation trajectories that are conditional on characteristics of the individual immigrant and
structural characteristics of the receiving country, or what they call the context of reception.
Immigrants can follow the upward path delineated by Gordon’s theory of straight-‐line
assimilation, and integrate into “mainstream” American culture over time. Another possibility is
that immigrants follow a path of downward assimilation, characterized by “permanent poverty
and assimilation into the underclass” (Portes & Zhou, 1993, p. 82). In a third trajectory,
immigrants follow a path by which they advance economically and are able to maintain their
ethnic identity and community. Salient immigrant characteristics that are related to different
paths of assimilation include employment status (e.g., manual laborer, entrepreneur, or
professional), English proficiency, race/ethnicity, and documentation status. For students, both
their individual characteristics and those of their parents impact their assimilation trajectory. As
noted above, on average Els and their parents are characterized by attributes such as low-‐
income status, low educational attainment, and minority identification that predict downward
assimilation.
Equally important in explaining how immigrants assimilate is their context of reception,
which is defined by the following modes of incorporation: “the policies of the host government;
the values or prejudices of the receiving society; and the characteristics of the co-‐ethnic

85
community” (Portes & Zhou, 1993, p. 83). According to the segmented assimilation framework,
government policies can be receptive, indifferent, or hostile; members of the receiving society
can either harbor feelings of prejudice, ambivalence, or non-‐prejudice towards a particular
immigrant group; and the co-‐ethnic community can be weak or strong (for examples, see Portes
& Zhou, 1993). Strong co-‐ethnic communities are those that have an established place in the
local community and economy, where immigrants or co-‐ethnics own or run businesses, and
where social networks can provide material and social capital to newly arrived immigrants.
For students, the context of reception is not only the community in which they live, but
also the school they attend and the particular classes in which they are enrolled. Extending the
typology of modes of incorporation to the school community, school or class policies can be
receptive, hostile, or indifferent towards immigrant and El students; adults and peers can be
prejudiced, ambivalent, or non-‐prejudiced towards immigrants; and Els can be in a school or
class with a strong or weak co-‐ethnic community.
Within schools and classrooms, receptive policies could be the school providing bilingual
services for children and their families, the school offering heritage language classes, teachers
using culturally relevant curricula, teachers using pedagogical practices that attend to both the
academic and sociocultural needs of students, or any other policy that is implemented by
teachers or in schools that helps create a school community that treats cultural diversity as an
asset. The North Carolina school district profiled above by Kandel and Parrado (2005) is an
example of a receptive school district. On the other hand, a hostile school environment may
include policies that deny resources or opportunities to immigrant students or marginalize
immigrant students and families.

86
Both peers and adults can be prejudiced towards immigrant students, and can manifest
that prejudice by lowering expectations, treating immigrant students as inferior, or teasing and
excluding immigrant students. Ambivalence towards immigrant students can be as harmful as
overt prejudice. For instance, the teachers profiled in Reeves (1994) study were ambivalent
about the particular instructional needs of Els, and thus refused to provide certain
accommodations.
Finally, a strong co-‐ethnic community is comprised of adults, e.g. teachers, principals, or
other school staff, who act as institutional agents (Stanton-‐Salazar, 1997) connecting immigrant
students with opportunities and resources for academic advancement. The co-‐ethnic
community is also comprised of other students who can act as role models that support an
immigrant’s adaptation to the school culture. Co-‐ethnic teacher and student communities can
be measured by the proportion of a school that shares the student’s race or language
background. Neither race or language background is a perfect indicator of whether two
individuals come from the same ethnic or cultural backgrounds. However, previous research
supports the use of race or native language as a proxy for cultural background (Donato, Shan &
Marschal, 2011; Stanton-‐Salazar, 2010).
Teachers as Institutional Agents Stanton-‐Salazar (1997) suggests that for minority children, teachers act as important
institutional agents, defined as “individuals who have the capacity and commitment to transmit
directly, or negotiate the transmission of, institutional resources and opportunities ….[which]
include information about school programs, academic tutoring and mentoring, as well as
assistance with career decision-‐making and college admission” (p.6). According to his

87
framework, institutional agents help students access several forms of institutional support:
knowledge of the discourse of schools, connections to mainstream social networks and
opportunities, advocates and role models, evaluative feedback, and guidance on managing the
school institution.
A critical role that teachers can play in the lives of Els is in teaching the discourse, or
“language of schooling”, that students need in order to succeed. This language includes not
only academic English, but also the values and ways of being associated with the White, middle
class, non-‐immigrant culture (Delpit & Dowdy, 2008).
A second important part of Stanton-‐Salazar’s framework (1997) is an explanation of the
ways that schools, and other institutions, are structured to impede the ability of minority
students to accumulate social capital and institutional resources. He explains that schools are
structured in a way that encourages distrust and detachment, superficial relationships, and race
and class based divisions. Inside the classroom, teachers help students overcome these
structural barriers by cultivating caring and personalized relationships. To develop personalized
learning connections based on an ethic of caring, teachers must show interest in their students,
be enthusiastic, and attend to their needs (Whitney, Leonard, Leonard, Camelio & Camelio,
2005). Their interactions with students must occur both formally and informally. Teachers
demonstrate caring by listening to students, treating students with respect, validating student
feelings, helping students develop their own sense of efficacy, and giving students
opportunities to make responsible choices (Collier, 2005). When teachers successfully create
caring and personal learning connections students feel more attached to school (Wilson, 2014).
88
Hypotheses The primary purpose of this study is to test how two classroom level factors, within-‐
school segregation and teacher training, are related to achievement. I posit two hypotheses
regarding how classroom context is related to achievement to be tested derived from the
theories and literature reviewed above
Relationship between being taught by an ESL trained teacher and achievement. Based
on the literature related to teacher effectiveness and preparation and Stanton-‐Salazar’s theory
of Institutional agents, I suggest that teachers with specific training or experience with Els will
be better prepared and more willing to teach students the discourse of schools, as well as give
appropriate feedback and guidance to students based on knowledge of how students learn a
second language. I also posit that teachers who decide to work with Els will be more likely to
serve as advocates and role models, and, because they may better understand the contexts
from which Els come from and the needs of these students, they may be more likely to provide
emotional and moral support (Patel, 2013).
Second, I conjecture that teachers who care about the academic success of Els may be
more likely to have sought out training in how to teach Els or have gone through the process of
receiving a credential to teach ESL. While these indicators certainly will not capture all of what
researchers have found to be attributes of a caring teacher, they do reveal a certain motivation
a teacher has to specifically address the needs of the El population. This may be especially true
in a place like North Carolina, where training and credentialing are not required of most
teachers who teach Els. While a teacher with experience teaching Els may not be more or less
89
caring towards these students than those who do not, they will have had more opportunities to
develop the capacity to be a positive institutional agent.
Hypothesis 1: Els who are taught by a positive institutional agent, in the form of a
credentialed ESL teacher or a teacher with experience teaching Els, will perform better in math
and reading than those who do not.
Relationship between classroom exposure to NES and achievement. As suggested by
previous research and segmented assimilation theory, the relationship between the level
classroom exposure of Els to NES and achievement can be positive or negative. Els learn the
language and culture of the host nation from their peers and teachers. However, if English
learners are isolated from native English speaking students or non-‐immigrant students, the
ability for them to acculturate may be diminished. If Els are segregated from native English
speakers at school, it follows that their ability to become part of the social networks of non-‐
immigrants is also diminished. In this case we would expect students in segregated classes to
have lower achievement than students in integrated (i.e. mainstream) classes.
At the same time, a segregated class might allow for the development of a strong co-‐
ethnic community. Students from a similar language or cultural background, or even who
simply share the experience of learning a new language, might develop a strong social network
that that allows them to follow a path of positive assimilation. In this case we would expect
students in segregated classes to have higher achievement than students in integrated classes.
Els in segregated classes are more likely to be taught by an ESL trained teacher who is
positioned to act as a positive institutional agent. Access to a positive institutional agent may

90
offset the disadvantage of being isolated form native English speaker peers or compound the
positive effect of being in a classroom with a strong co-‐ethnic community.
Hypothesis 2: Els in segregated settings will perform differently than those in integrated
settings. The relationship between segregation, in terms of exposure, and achievement will be
conditional on whether an El has access to a positive institutional agent, as described above.
Student, class, and school factors. Prior research and theoretical contributions suggest
other important student, classroom, and school factors that should be accounted for in
subsequent analyses. The theory of segmented assimilation provides a framework for
categorizing class and school factors as indicators of welcoming polices or practices, indicators
of a positive reception of immigrants by peers and adults, and indicators of the size and
strength of the co-‐ethnic community.
Important student factors include demographic characteristics such as gender,
race/ethnicity, country of origin, and prior achievement. Class factors include teacher
experience, class size, and course level and school factors include the percentage of teachers
who are certified, have a national board certification, or have an advanced degree, the size and
demographic composition of the school, school funding, and school level. Figure 5 depicts the
relationships among all relevant variables described above.
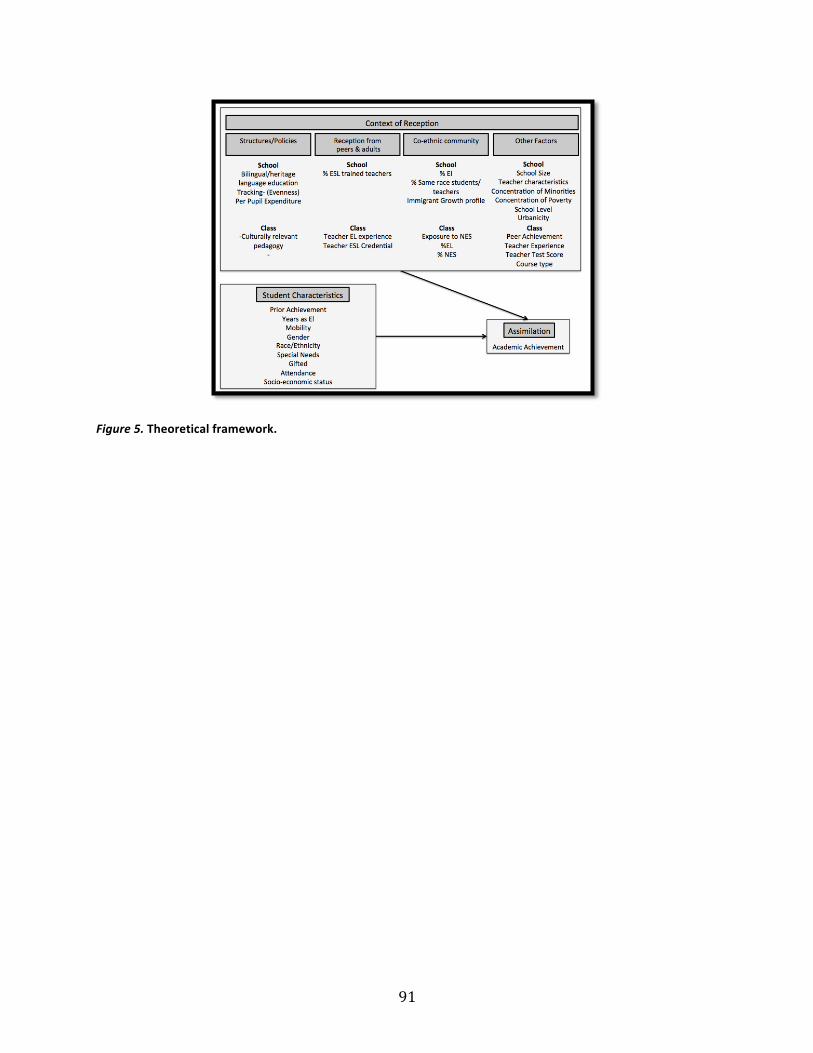
91
Figure 5. Theoretical framework.