Dismantling and copper recovery from Waste Printed Circuit ...
192
Dottorato in Ingegneria dell’Innovazione Tecnologica – Ciclo XXXI Dipartimento dell’Innovazione Industriale e Digitale Chimica Fisica Applicata Dismantling and copper recovery from Waste Printed Circuit Boards (WPCBs) using an integrated hydro-electrometallurgical approach Ph.D Candidate Evaluation Committee Chief CRISTINA COCCHIARA Prof. ANTONIO CHELLA Supervisor Co-Supervisor Prof. CARMELO SUNSERI Prof. Rosalinda Inguanta CICLO XXXI Anno Accademico 2019
-
Upload
khangminh22 -
Category
Documents
-
view
1 -
download
0
Transcript of Dismantling and copper recovery from Waste Printed Circuit ...

Dottorato in Ingegneria dell’Innovazione Tecnologica – Ciclo XXXI
Dipartimento dell’Innovazione Industriale e Digitale
Chimica Fisica Applicata
Dismantling and copper recovery from Waste Printed Circuit Boards
(WPCBs) using an integrated hydro-electrometallurgical approach
Ph.D Candidate Evaluation Committee Chief
CRISTINA COCCHIARA Prof. ANTONIO CHELLA
Supervisor Co-Supervisor Prof. CARMELO SUNSERI Prof. Rosalinda Inguanta
CICLO XXXI
Anno Accademico 2019

“Science knows no country, because knowledge belongs to humanity,
and is the torch which illuminates the world”
-Louis Pasteur, chemist and microbiologist

Summary
The well-being of modern society greatly depends on knowledge and
technology. The technology’s irrepressible march in parallel to the urbanization
and industrialization of many developing countries are leading to growing diffusion
of electrical and electronic equipment and consequently, of technological wastes.
Printed Circuit Boards (PCBs) are essential components in almost every
electrical and electronic equipment. Usually, it contains hazardous substances as
well as valuable materials; therefore, the development of recycling strategies is of
paramount importance in order to convert PCBs waste from pollution source to
valuable resource of secondary raw materials. PCB is a predominantly copper-rich
material (up to 29% by weight), which makes the recovery of this metal a priority
for recycling processes.
The first part of the PhD thesis provides an extensive literature review on
Waste Printed Circuit Boards (WPCBs) recycling in order to highlight the main
issues related to the existing technologies. The current processes to recover and
recycle metals from WPCBs are either pyrometallurgical or hydrometallurgical
with the consequent release of toxic gasses or high volumes of acid wastewaters.
Besides, the heterogeneous materials present in PCBs lead to very complex
recycling processes constituted by several unit operations. Therefore, the
development of simple and environmentally acceptable recycling processes is of
primary importance in a future perspective of sustainable developing.
In this PhD research, a novel method for copper recovering from WPCBs was
investigated. Emphasis was given to electrochemical methods which have shown
vast potential in terms of low energy consumption, low environmental impact, high
output and simple flowsheet. In particular, an integrated hydro-electrometallurgical
approach was used for recovering as much copper as possible from WPCBs.

The PhD work can be divided in two parts. The first one was devoted to
dismantling of WPCBs by a hydrometallurgical route. An H2SO4-CuSO4-NaCl
solution of well-defined composition was used in the presence of blowing air for
dissolving all solders and contacts that maintain electrical and electronic
components connected to the board. An efficient components’ detachment was
achieved at low temperature without releasing toxic gases and damaging
components, which can be easily recycled or sent to further treatment. The
feasibility of electrochemical recovery of copper from the resulting solution was
verified through a preliminary cyclic voltammetry study aimed at finding the
optimum process parameters. After this, an electrochemical cell directly fed with
the solution coming from WPCBs dismantling was employed for investigating the
simultaneous copper deposition and leaching solution restoration. The results were
highly encouraging because indicate the possibility to obtain pure copper operating
in both galvanostatic and potentiostatic mode after the removal of the surface
impurities by dipping in slightly acidified NaCl solution.
The second part of the research activity focuses on recovering copper from
disassembled PCBs waste. According to the most recent innovations in the field of
WPCBs recycling, the attention was directed towards the development of an
entirely electrometallurgical method. In order to simplify the overall process,
pieces of PCB were used instead of pulverized samples. The same PCB pieces
resulting from the dismantling/leaching stage in H2SO4-CuSO4-NaCl solution
could be used in order to recover copper from both the PCB structure and oxidation
of electronic components’ contacts. The PCB pieces were directly used for a
simultaneous electroleaching-electrodeposition process after the solder mask
removal. The dissolution of solder mask by NaOH is fundamental to expose
metallic copper to the electrolytic solution. Two different configurations of the
electrochemical cell were investigated, both operating in galvanostatic mode.

Nomenclature
Acronyms and abbreviations
ATA Advanced Technology Attachment
BFR Brominated Flame Retardant
CFC Chlorofluorocarbon
CMB Computer motherboard
CPU Central Processing Unit
CRT Cathode Ray Tube
CV Cyclic Voltammetry
D-sub D-subminiature
ECs Electronic Components
EDS Energy Disperse Spectroscopy
EEE Electric and Electronic Equipment
ENIG Electroless Nickel Immersion Gold
EPA Environmental Protection Agency
e-waste Electronic waste
HASL Hot Air Solder Leveling
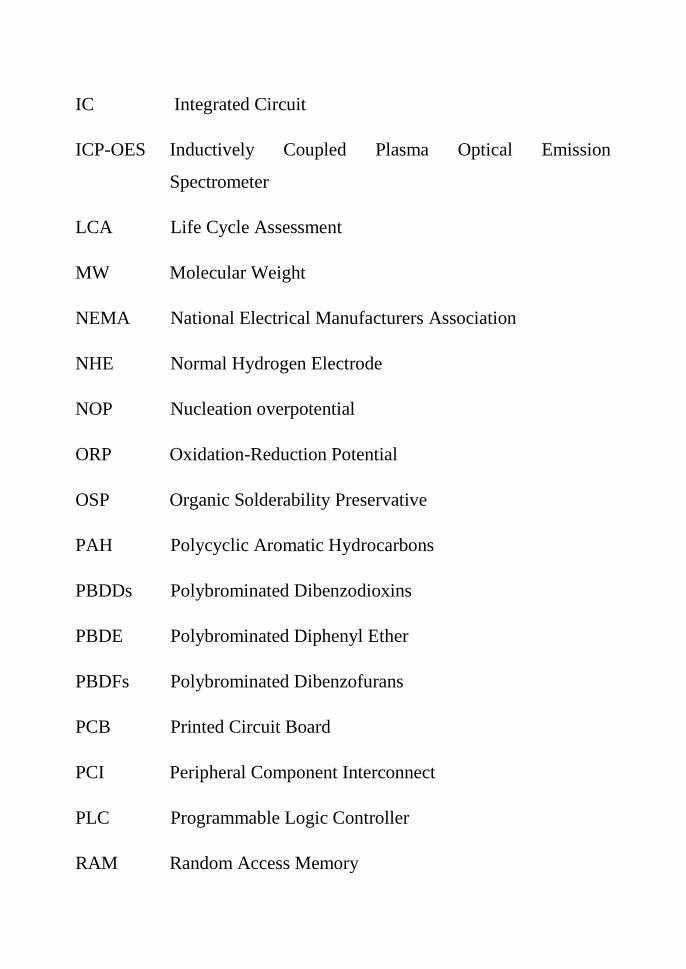
IC Integrated Circuit
ICP-OES Inductively Coupled Plasma Optical Emission
Spectrometer
LCA Life Cycle Assessment
MW Molecular Weight
NEMA National Electrical Manufacturers Association
NHE Normal Hydrogen Electrode
NOP Nucleation overpotential
ORP Oxidation-Reduction Potential
OSP Organic Solderability Preservative
PAH Polycyclic Aromatic Hydrocarbons
PBDDs Polybrominated Dibenzodioxins
PBDE Polybrominated Diphenyl Ether
PBDFs Polybrominated Dibenzofurans
PCB Printed Circuit Board
PCI Peripheral Component Interconnect
PLC Programmable Logic Controller
RAM Random Access Memory

REE Rare-Earth Element
RJD Rivet Joint Devise
RoHS Restriction of Hazardous Substances
SCE Saturated Calomel Electrode
SEM Scanning Electron Microscope
SJD Screw Joint Devise
SMD Surface Mounted Devise
SPD Socket Pedestal Device
SWV Square Wave Voltammetry
TBBA Tetrabromobisphenol A
TBE Tetrabromoethane
THD Through-Hole Device
WEEE Waste Electric and Electronic Equipment
WPCBs Waste Printed Circuit Board
XRD X-Ray Diffraction

Table of contents
Waste Printed Circuit Boards (WPCBs): from pollution to resource .... 1
Introduction ....................................................................................................................... 1
1.1 What is e-waste? .......................................................................................................... 2
1.1.1 Definition, classification and legislation .............................................................. 2
1.1.2 Composition .......................................................................................................... 4
1.1.3 Global status and trends ....................................................................................... 6
1.1.4 Intrinsic value ....................................................................................................... 8
1.1.5 Italian scenario ..................................................................................................... 9
1.2 WPCBs: a challenge for the future ............................................................................ 10
1.2.1 Global status and trends in WPCBs production ................................................. 10
1.2.2 Characterization of WPCBs: structure and composition ................................... 12
1.2.3 Intrinsic value of WPCBs ................................................................................... 20
Recycling of WPCBs ............................................................................ 26
Introduction ..................................................................................................................... 26
2.1 Disassembly ............................................................................................................... 27
2.2 Liberation of metallic fraction ................................................................................... 29
2.3 Separation/recovery of non-metallic fraction ............................................................ 30
2.3.1 Physical processes .............................................................................................. 30
2.3.2 Chemical processes ............................................................................................ 33
2.4 Metal recovery ........................................................................................................... 35
2.4.1 Hydrometallurgical route ................................................................................... 35
2.4.2 Pyrometallurgical route ..................................................................................... 40
2.4.3 Biometallurgical route ........................................................................................ 45
2.5 Purification and recovery of metals .......................................................................... 48
2.6 Concluding remarks .................................................................................................. 52
Copper recovery from the urban mine of WPCBs ............................... 61
Introduction ..................................................................................................................... 61

3.1 About copper ............................................................................................................. 62
3.2 Copper mining ........................................................................................................... 67
3.3 Recycling of copper from WPCBs ............................................................................. 73
3.3.1 Pyrometallurgical route ..................................................................................... 75
3.3.2 Hydrometallurgical route ................................................................................... 77
3.3.3 Electometallurgical route ................................................................................... 85
3.3.4 Biometallurgical route ........................................................................................ 88
Dismantling and electrochemical copper recovery from WPCBs in
H2SO4–CuSO4–NaCl solutions ............................................................ 96
4.1 H2SO4–CuSO4–NaCl leaching solution: state of the art ........................................... 97
4.2 Electronic components detachment from WPCBs by metals leaching in H2SO4–
CuSO4–NaCl solution .................................................................................................... 101
4.2.1 Material and methods ....................................................................................... 101
4.2.2 Results and discussion ...................................................................................... 104
4.3 Cyclic voltammetry study ........................................................................................ 111
4.3.1 Material and methods ....................................................................................... 112
4.3.2 Results and discussion ...................................................................................... 113
4.4 Copper recovery from the leach solution ................................................................ 128
4.4.1 Electrochemical recovery of copper simultaneously with dismantling/leaching of
WPCB ........................................................................................................................ 129
4.4.2 Electrochemical recovery of copper separately from dismantling/leaching of
WPCB ........................................................................................................................ 133
Copper recovery from pieces of disassembled WPCBs by an
electrochemical route.......................................................................... 150
Introduction ................................................................................................................... 150
5.1 Copper recovery from PCB pieces: state of the art ................................................. 151
5.2 Chemical characterization of disassembled WPCBs ............................................... 154
5.2.1 Material and methods ....................................................................................... 154
5.2.2 Results and discussion ..................................................................................... 155
5.3 Electrochemical recovery of copper from disassembled WPCBs ............................ 159

5.3.1 Material and methods ....................................................................................... 159
5.3.2 Results and discussion ...................................................................................... 163
5.4 Conclusions ............................................................................................................. 172
Conclusions ........................................................................................ 178

1
Chapter 1
Waste Printed Circuit Boards (WPCBs): from pollution to
resource
Introduction
The fast and continuous growth of the electronic market has led to an
improvement of the people’s lifestyle with the production of new goods that are
always more accessible to everyone, but have shorter lifetime. This, in parallel to
the urbanization and industrialization of many developing countries, is causing an
increase of both technological waste volume and global demand of raw materials
for their construction. This is a key problem in the light of the progressive natural
resource depletion. According to the most reliable estimates, about 20-50 million
tons of electronic wastes are produced globally every year, with consequent
negative impact on both environment and humans, if are sent to landfill without
proper recycling. The new challenge for the future is to shift the paradigm of e-
waste from toxic pollution source to valuable resource in the context of circular
economy and sustainable development.
The first section of the chapter intends to provide a definition and classification
of e-waste, reporting also the global situation in matter of hi-tech wastes. The
second section focuses on wastes of PCBs, which constitutes about 3-5% of the
total e-waste generated. WPCBs will be presented, providing information about
their composition determining the economic and environmental attractiveness
which justifies the continuous research for their efficient management.

2
1.1 What is e-waste?
1.1.1 Definition, classification and legislation
There is not a standard definition for e-waste (electronic waste) or WEEE
(Waste Electric and Electronic Equipment), generally, various types of EEE are
included by the term. The European WEEE Directive 2012/19/EU provides the
following definition: “Electrical or electronic equipment which the holder discards
or intends or is required to discard including all components, sub-assemblies and
consumables, which are part of the product at the time of discarding” [1]. The
current e-waste comprises a particularly complex waste flow in terms of the variety
of products. According to Directive 2012/19/EU, from 15 August 2018, e-waste is
divided into the following six categories:
1. Temperature exchange equipment (e.g. refrigerators, freezers, air conditioners,
heat pumps);
2. Screens, monitors, and equipment containing screens having a surface greater
than 100 cm2
(e.g. televisions, monitors, laptops, notebooks);
3. Lamps (e.g. fluorescent lamps, LED lamps);
4. Large equipment (any external dimension more than 50 cm) such as washing
machines, clothes dryers, dish-washing machines, large printing machines and
photovoltaic panels;
5. Small equipment (no external dimension more than 50 cm) such as ventilation
equipment, microwaves, toasters, electric shavers, calculators, radio sets,
video cameras, electrical and electronic toys, small electrical and electronic
tools, small medical devices, small monitoring and control instruments;

3
6. Small IT and telecommunication equipment (no external dimension more than
50 cm) such as mobile phones, GPS, pocket calculators, routers, personal
computers, printers, telephones.
The European Directive 2012/19/EU, which replaced the previous 2002/96/EU
and 2003/108/EU [2, 3], represents the only notable example of specific and clear
legislation on WEEE recycling around the world. Except for Europe, the others
countries seem to be slow in initiating and adopting WEEE regulations. Currently,
only 66% of the world population is covered by national e-waste management laws
that, however, represents an increase compared to 44% estimated in 2014 (Figure
1.1.1.1). This considerable increase was mainly due to India, where legislation was
adopted in 2016. It is important to note that many countries with national WEEE
legislation do not always enforce the law or do not have measurable collection and
recycling targets that are essential for effective policies [4]. This is a serious
problem because e-waste contains toxic substances as well as valuable materials so
that its management is relevant both in terms of wastefulness of resources and
environmental impact.
Figure 1.1.1.1 World population (and number of countries) covered by e-waste legislation in 2014 and 2017 [4]
In this regard, European WEEE Directive aims primarily to prevent the generation
of WEEE and secondly, to promote reuse, recycling and other forms of recovery of
WEEE in order to reduce the disposal of wastes and to contribute to the efficient

4
use of the resources and recovery of valuable secondary raw materials. This
principle is often identified as that of the “3 Rs”, referring to Reduce, Reuse and
Recycle. The directive also seeks to promote the design and production of EEE in
the perspective of reducing the use of hazardous substances and facilitating re-use,
dismantling and recovery of WEEE. Indeed, it is strictly connected with RoHS
(Restriction of Hazardous Substances) regulation, also known as Directive
2002/95/EU [5], which restricts the use of six hazardous materials in the production
of electrical and electronic equipment, including lead, mercury, cadmium,
hexavalent chromium, polybrominated diphenyl ethers and polybrominated
biphenyls [6-7].
In addition to take action upstream of the problem, the directive imposes also some
minimum collection rates. In particular, starting from 2019, each Member State of
UE will have to ensure the achievement of a minimum annual collection rate equal
to 65% of the average weight of EEE placed on the market in the three preceding
years in the Member State concerned, or alternatively 85% of WEEE generated on
the territory of that Member State. Several countries around the world have
followed the good example of Europe but certainly not with the same effort.
1.1.2 Composition
In terms of composition, e-waste can be defined as a mixture of various metals
with various types of plastics and ceramics. The composition depends strongly on
several factors such as the type of electronic device, the model, manufacturer, date
of manufacture, and the age of the scrap [7-9]. For instance, scraps from IT
(Information Technology) and telecommunication systems contain a higher amount
of precious metals than scraps from household appliances [7, 10]. Besides, old
WEEEs have more value because concentration of nonferrous metals and precious
metals has gradually decreased over the years in EEE.
Metals in e-waste can be grouped into precious metals such as Au and Ag;
platinum group metals such as Pd and Pt; base metals such as Cu, Fe, Zn, Al and

5
Ni; metals of concern such as Hg, Be, Pb, Cd and As; and scarce metals such as
Te, Ga, Se, Ta and Ge [11]. The percentage of plastic contained in WEEE is around
10-30 % and may include more than 15 different polymers, mainly polystyrene,
acrylonitrile-butadiene-styrene, polycarbonate blends, high-impact polystyrene and
polypropylene [12]. In the case of the small WEEE, may be present 21 different
types of polymers. Figure 1.1.2.1 shows the typical fraction of materials generally
found in a WEEE.
Figure 1.1.2.1 Material fraction in a WEEE [4]
This large variety of composition makes WEEE a possible source of secondary
raw materials. A mobile phone can contain more than 40 different elements. The
main recovery attractiveness comes from precious and base metals. It is important
to note that some materials such as gold and copper can be mined more effectively
from e-waste compared to mining from ore. Copper and gold content in WEEE is
13-26 and 35-50 times more concentrated than in their ores, respectively [7].
By contrast, e-waste contains various hazardous material such as heavy metals
and brominated flame retardants (BFRs) including polybrominated diphenyl ethers
(PBDEs) and tetrabromobisphenol A (TBBA) [6, 12-13]. Soil, water and air around
e-waste processing sites are 100 times more contaminated by PBDEs, heavy metals
and polycyclic aromatic hydrocarbons (PAHs) than other places [14]. Thanks to the
new emerging regulations on e-waste subject, future electronic wastes are expected

6
to contain significantly lower amount of hazardous materials. However, to date the
market has not still detected a reliable replacement for halogenated flame
retardants. In Table 1.1.2.1, some of the major hazardous components found in
WEEE are shown. Obsolete freezers, air conditioners, refrigerators contain ozone
depleting chlorofluorocarbons (CFCs). Circuit boards found in most of the
electronic devices may contain arsenic, cadmium, chromium, mercury, lead, and
other toxic chemicals. A typical printed circuit board contains approximately 50 g
of tin-lead solder per square meter [15]. The cathode ray tubes (CRTs) widely used
as a video display component of both old televisions and computers contain great
amounts of lead [4, 12].
Table 1.1.2.1 Major hazardous components and materials in WEEE [11]
1.1.3 Global status and trends
The relevance of the WEEE problem is strictly connected to the amount of hi-
tech wastes globally generated. In Figure 1.1.3.1 the trend in the production of
WEEE is reported. Estimations say that the quantity of e-waste generated in 2016

7
was around 44.7 million metric tonnes (Mt), or 6.1 kg per inhabitant, which is the
equivalent of almost 4.500 Eiffel Towers. The quantity is expected to grow to 52.2
Mt in 2021, with an annual growth rate of 3 to 4%. In 2016, Asia was the first
producer of e-waste (18,2 Mt), followed by Europe (12,3 Mt), America (11,3 Mt),
Africa (2,2 Mt) and Oceania (0,7 Mt) [4]. Europe is the second largest producer;
but has the highest collection rate (35%). America collects only 17% that is
comparable to the collection rate in Asia (15%). The low collection rate compared
to the total amount of e-waste generated is partly due to the absence of official e-
waste statistics in many countries. In particular, only the 20% of 44.7 Mt of wastes
produced in 2016 is documented to be properly collected and recycled, whereas the
majority (76%) is untraced and unreported; the remaining 4% (1.7 Mt) ends up in
waste bins from the richest countries without being differentiated.
Figure 1.1.3.1 Global e-waste generated (note: 2017-2021 are estimates) [4]
E-waste generated in developed countries is often exported for recycling in
developing countries, especially in China, India, and Pakistan, where labor is
relatively cheap and the lack of national regulations permits the treatment of e-
waste with rudimental methods such as open burning. Incineration of WEEE leads

8
to the release of toxic substances such as polybrominated dibenzo-dioxins (PBBD)
and polybrominated dibenzo-furans (PBDF) coming from flame retardants [15-17].
Traditionally, e-waste is disposed in landfills or incinerated. It was estimated that
emissions from waste incineration produce 36 metric tonnes per year of Hg and 16
metric tonnes per year of Cd in EU [8].
Therefore, a correct e-waste management is of primary importance to protect the
environment and human health, also because e-waste recycling has the potential to
become an attractive business.
1.1.4 Intrinsic value
The value of the raw materials present in e-waste globally produced in 2016 was
estimated at approximately 55 billion Euros, which is more than the 2016 Gross
Domestic Product of most countries in the world [4]. The recovery of precious and
base metals represents the main economic drive toward recycling of e-waste owing
to their associated value. As it can be seen in Table 1.1.4.1, copper is the highest
value metal in all types of e-scrap, after precious metals.
Table 1.1.4.1 Weight vs value distribution [11] (note: metals prices from which value-share of each metal was calculated are related to 2006)

9
According to the data supplied by U.S Environmental Protection Agency (EPA), a
significant energy saving results from using recycled materials than virgin
materials. Energy saving for some of the most common materials is shown in Table
1.1.4.2.
Table 1.1.4.2 Recycled materials energy saving over virgin materials [11]
The circular economy concept could offer huge economic and employment
opportunities. All countries would have to adopt strategies to sensitize people to the
important of e-waste management, for example disclosing data and statistics
showing the environmental and economic benefits resulting from a better
management of such wastes.
1.1.5 Italian scenario
Legislation in Italy is harmonized with European Directive 2012/19/EU, which
increases the responsibility of producers that would have to finance the collection
from collection facilities of the waste from their own products at least, and also
their treatment, recovery and disposal. 4.107 municipal collection centers for
household WEEE were operative in Italy during 2016. Each collection center was
member of the WEEE Coordination Centre [18]. The total quantity of WEEE
collected in 2016 was 283.075 tons, 13,5% higher than in 2015 [18]. The highest
collection rate was reached in the northern regions. Despite the positive data, the
percentage of collection estimated at about 40% is not still enough to attain the

10
European target of 45% of EEE placed on market in the period 2016-2018 [19].
However, the correct management of WEEE has led to many social and
environmental benefits. It has been estimated that 110-120 million Euros were
saved in 2015 for the purchase of raw materials due to the recovery of materials
from WEEE. The emissions of climate-altering gases avoided in the same year
were estimated at 1.1 million tons of CO2 equivalent [19]. These values could
significantly increase if the targets imposed by WEEE European Directive will be
achieved.
It can be concluded that an efficient management of e-waste, in addition to lead
economic benefits, can also contribute to i) decrease volume of generated wastes;
ii) decrease consume of natural resources; iii) preserve environment and human
health.
1.2 WPCBs: a challenge for the future
1.2.1 Global status and trends in WPCBs production
Great relevance in terms of economic and environmental impact have the wastes
coming from Printed Circuit Boards (PCBs). Practically, all electronic devices
contain printed circuit boards as basic building block.
A PCB mechanically supports and electrically connects through conductive
tracks all electrical and electronic components mounted on the board such as
integrated circuit, capacitors, resistors, inductors, relays, etc. PCBs represent
approximately 3% by weight of the mass of WEEE generated globally [6, 14, 20].
Figure 1.2.1.1 shows the trend of the PCB industries’ investments in millions of
US$. The continuous growth in PCBs production, which is strictly connected with
the growth of electronic market, will lead to enormous generation of waste PCBs.

11
Figure 1.2.1.1 Trends in global PCB production in millions of $US (note: the period 2012-2016 is a forecast) [14]
As it can be seen in Figure 1.2.1.2, China is leader in PCB production reaching
almost half of the total PCB market, followed by South Korea and Taiwan [21].
These countries, in addition to be the main producers, have also become the final
destination for illegal e-waste traffic. About 12,75 millions of personal computers
were thrown away in the US in 2012, about 10,2 millions of these were exported to
either China or others Asian countries [22]. In China, like in other developing
countries, many cities have been transformed into open air dumps.
Figure 1.2.1.2 PCB production by major producing countries and regions in 2015 reported by WECC-Member Associations [21]

12
1.2.2 Characterization of WPCBs: structure and composition
All PCBs essentially consist of three parts:
• A non-conducting substrate or laminate;
• Conducting substrate printed on or inside the laminate;
• Components mounted to the substrate.
PCBs have to guarantee excellent mechanical, electrical and thermal properties.
The non-conducting substrate provides mechanical properties. FR-4 is the most
common substrate used for computers and communication equipment, while FR-2
is predominantly used for home electronic and television [13]. FR is the acronym
for "Flame Retardants" and indicates some chemicals which are added either to
prevent fire onset or to slow its propagation.
FR-2 is a composite material made of paper impregnated with a plasticized
phenol formaldehyde resin, while FR-4 is a composite material composed of
woven fiberglass cloth impregnated with an epoxy resin. Some of the common
types of substrate are shown in Table 1.2.2.1. The nomenclature for each type of
material is given by the National Electrical Manufacturers Association (NEMA), in
Virginia, USA [23].
Table 1.2.2.1 Some of the common types of substrate used for PCBs construction [23]
Today, high-value devices contain preferentially FR4 substrate due to the high
thermal resistance and negligible water absorption. For higher temperatures
13
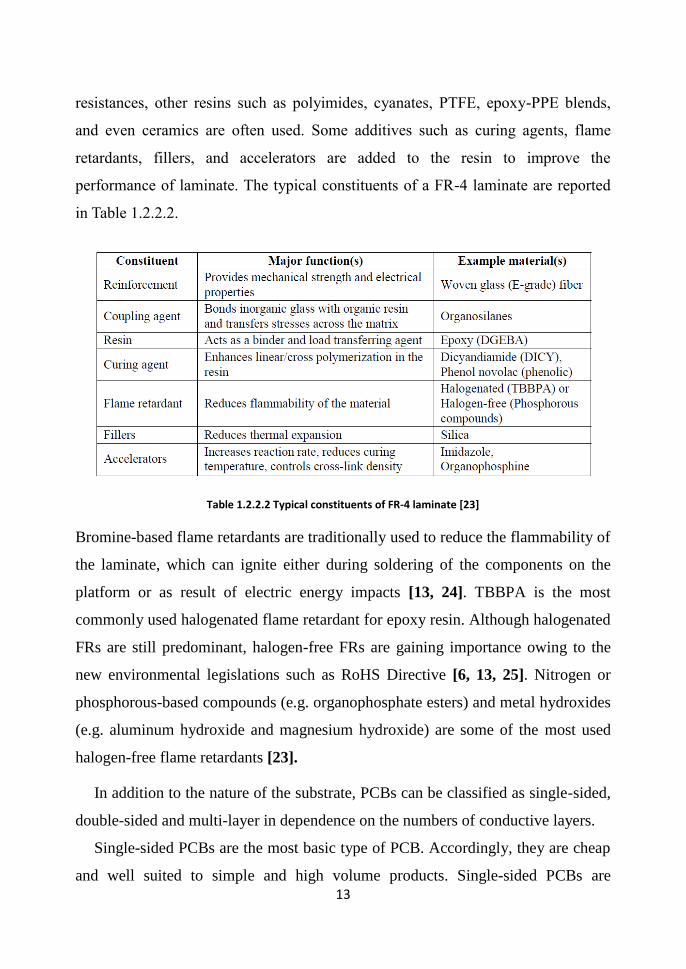
resistances, other resins such as polyimides, cyanates, PTFE, epoxy-PPE blends,
and even ceramics are often used. Some additives such as curing agents, flame
retardants, fillers, and accelerators are added to the resin to improve the
performance of laminate. The typical constituents of a FR-4 laminate are reported
in Table 1.2.2.2.
Table 1.2.2.2 Typical constituents of FR-4 laminate [23]
Bromine-based flame retardants are traditionally used to reduce the flammability of
the laminate, which can ignite either during soldering of the components on the
platform or as result of electric energy impacts [13, 24]. TBBPA is the most
commonly used halogenated flame retardant for epoxy resin. Although halogenated
FRs are still predominant, halogen-free FRs are gaining importance owing to the
new environmental legislations such as RoHS Directive [6, 13, 25]. Nitrogen or
phosphorous-based compounds (e.g. organophosphate esters) and metal hydroxides
(e.g. aluminum hydroxide and magnesium hydroxide) are some of the most used
halogen-free flame retardants [23].
In addition to the nature of the substrate, PCBs can be classified as single-sided,
double-sided and multi-layer in dependence on the numbers of conductive layers.
Single-sided PCBs are the most basic type of PCB. Accordingly, they are cheap
and well suited to simple and high volume products. Single-sided PCBs are

14
constituted by only one conductive copper layer placed on one side of the substrate
(core). Above the copper layer, which provides conducting path for the various
components on the board, a solder mask layer is present in order to protect the
board against environmental damage and solder shorts (also known as solder
bridges), which take place when two or more pins become connected through an
excessive application of solder, as in Figure 1.2.2.1. Finally, a silkscreen layer lies
on the top of solder mask for adding information such as company logos, serial
numbers, or helpful instructions in assembling, testing, and servicing the circuit
board. Single-sided PCBs are the ideal choice for low density design.
Figure 1.2.2.1 A close up of a solder bridge formed between two of the pins on an integrated circuit
Double-sided PCB, is a type of PCB which has conductive copper layers on
both sides of the substrate (core). Figure 1.2.2.2 shows a schematization of a
double-sided PCB.
Figure 1.2.2.2 Structure of a double-sided PCB with plated through holes
The layers are electrically connected by holes drilled on the board and made
conductive by electroplating. A solder mask lies above the two copper layers and a
silkscreen above solder mask on both side of the board. Double-sided PCBs feature

15
moderate level of complexity, allowing higher circuit density than single-sided
PCBs and lower costs than multilayer PCBs.
Multi-layer PCBs are developed by incorporating more double-sided PCBs
together using an insulating material (pre-peg) as a binder. Figure 1.2.2.3 shows the
structure of a multilayer PCB. Core and pre-peg layers are made by the same
materials but pre-peg is not fully cured, which makes it more malleable and flexible
than the core. In order to fabricate a multilayer PCB, alternating layers are stacked
and pressed at high temperature to remove any air bubble trapped between the
layers. Often two layers work as power supply and ground planes, while the other
ones are used for signal wiring between components. Sometimes, more layers than
one are used for both power and ground planes, especially if the different
components on the PCB require different supply voltages. In a multi-layer PCB, the
number of conductive layers is generally between 4 and 8 but some applications
can require a greater number. For instance, some smartphones are equipped with 12
layer PCBs.
Figure 1.2.2.3 Structure of a multi-layer PCB
The placing on the market of multi-layer PCBs allowed the miniaturization of the
circuits and consequently that of many electronic devices such as smartphones and
computers. However, multilayer PCB requires higher manufacturing costs and time
than single layer or double layer PCB.
16
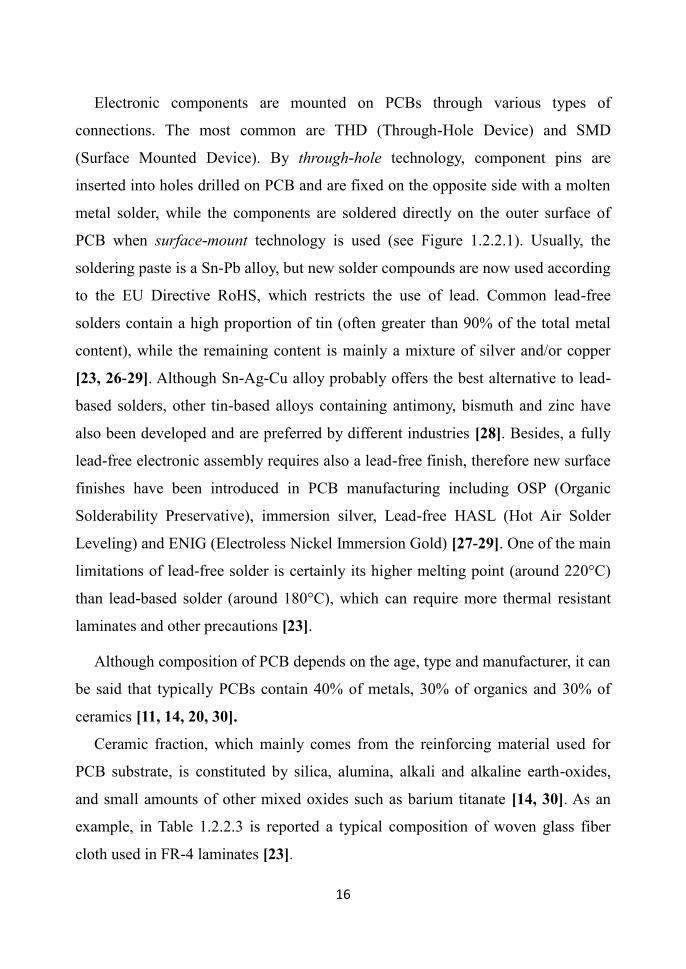
Electronic components are mounted on PCBs through various types of
connections. The most common are THD (Through-Hole Device) and SMD
(Surface Mounted Device). By through-hole technology, component pins are
inserted into holes drilled on PCB and are fixed on the opposite side with a molten
metal solder, while the components are soldered directly on the outer surface of
PCB when surface-mount technology is used (see Figure 1.2.2.1). Usually, the
soldering paste is a Sn-Pb alloy, but new solder compounds are now used according
to the EU Directive RoHS, which restricts the use of lead. Common lead-free
solders contain a high proportion of tin (often greater than 90% of the total metal
content), while the remaining content is mainly a mixture of silver and/or copper
[23, 26-29]. Although Sn-Ag-Cu alloy probably offers the best alternative to lead-
based solders, other tin-based alloys containing antimony, bismuth and zinc have
also been developed and are preferred by different industries [28]. Besides, a fully
lead-free electronic assembly requires also a lead-free finish, therefore new surface
finishes have been introduced in PCB manufacturing including OSP (Organic
Solderability Preservative), immersion silver, Lead-free HASL (Hot Air Solder
Leveling) and ENIG (Electroless Nickel Immersion Gold) [27-29]. One of the main
limitations of lead-free solder is certainly its higher melting point (around 220°C)
than lead-based solder (around 180°C), which can require more thermal resistant
laminates and other precautions [23].
Although composition of PCB depends on the age, type and manufacturer, it can
be said that typically PCBs contain 40% of metals, 30% of organics and 30% of
ceramics [11, 14, 20, 30].
Ceramic fraction, which mainly comes from the reinforcing material used for
PCB substrate, is constituted by silica, alumina, alkali and alkaline earth-oxides,
and small amounts of other mixed oxides such as barium titanate [14, 30]. As an
example, in Table 1.2.2.3 is reported a typical composition of woven glass fiber
cloth used in FR-4 laminates [23].

17
Plastic fraction mainly consists of polymers such as polyethylene,
polypropylene, polyesters, polycarbonates, phenols, epoxies, formaldehyde, etc.,
whereas the rest of the plastics are mainly halogenated and nitrogen-containing
polymers [14, 30].
Table 1.2.2.3 Typical constituents of woven glass (E-glass) fiber cloth used in FR-4 laminates [23]
Finally, the metallic fraction in PCB is constituted by many different elements
covering great part of the periodic table. It is reported that there are up to 60 kinds
of elements contained in WPCBs [31], some of which are summarized in Figure
1.2.2.4 and classified as normal, precious, heavy, rare-earth metals and non-metals.
As shown in the figure, there are more than 40 kinds of metals in WPCBs.
Figure 1.2.2.4 Content of elements in WPCBs [31]
18
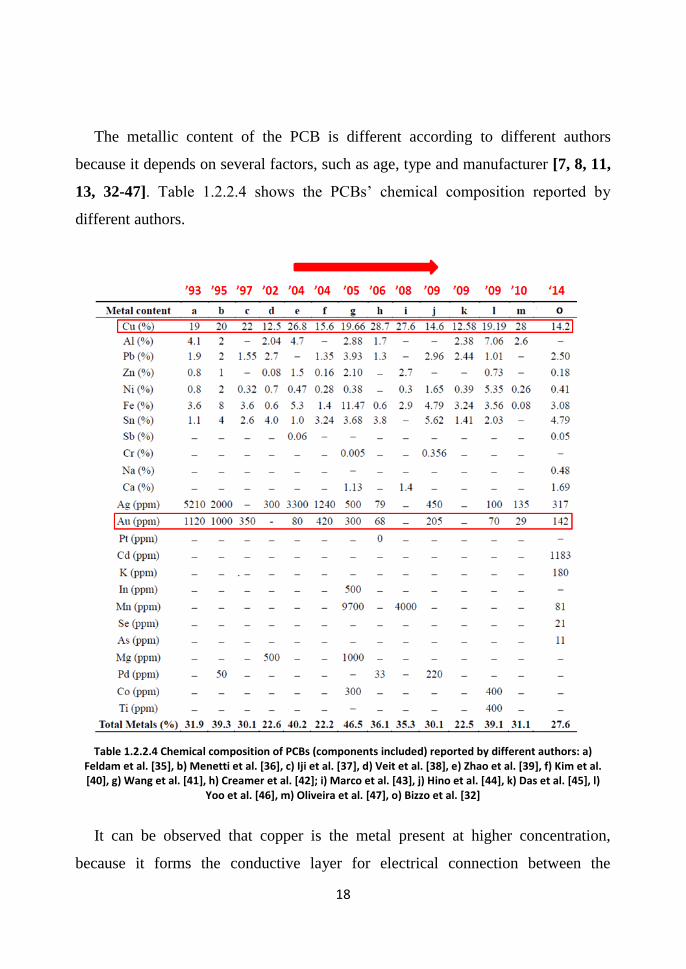
The metallic content of the PCB is different according to different authors
because it depends on several factors, such as age, type and manufacturer [7, 8, 11,
13, 32-47]. Table 1.2.2.4 shows the PCBs’ chemical composition reported by
different authors.
Table 1.2.2.4 Chemical composition of PCBs (components included) reported by different authors: a) Feldam et al. [35], b) Menetti et al. [36], c) Iji et al. [37], d) Veit et al. [38], e) Zhao et al. [39], f) Kim et al. [40], g) Wang et al. [41], h) Creamer et al. [42]; i) Marco et al. [43], j) Hino et al. [44], k) Das et al. [45], l)
Yoo et al. [46], m) Oliveira et al. [47], o) Bizzo et al. [32]
It can be observed that copper is the metal present at higher concentration,
because it forms the conductive layer for electrical connection between the

19
components. Abundant amounts of other base metals such as Fe, Al, Pb and Sn are
also present. In particular, great attention must be turned to lead that belongs to the
category of hazardous compounds and it is present in almost all data reported by
the different authors without evident reduction of its concentration over time.
However, elsewhere [48] it is reported that Pb concentration in WPCBs was two
orders of magnitude higher before 2005 than in the period 2005–2009. Other toxic
metals such as Cd, As, Cr and Sb are present in PCBs. Antimony trioxide, which
may be present with polymers as a flame retardant, is suspected to be carcinogenic
[14]. Cadmium is toxic at very low exposure levels and has acute and chronic
effects on health and environment. Once Cd enters into the body causes multi-
system and multi-organ injury [14]. Elevated levels of Cr in umbilical cord blood
in infants owing to mother's exposure to e-waste recycling are correlated with DNA
damage [14, 49].
Precious metals are also present, mainly gold and silver. However, it is
important to note that their content has fallen in recent years (see Table 1.2.2.4).
Gold concentration is decreased of two orders of magnitude from 1993 to 2010.
Gold is mainly used as a finish material for electric contacts. Cui et al. [20]
reported that contact layer thickness in the ’80 was in the region of 1-1.25 µm
interval, while in modern appliances it is between 300 and 600 nm. Contrarily,
copper content remained constant over the years between 12% and 29% by weight
because to date, it does not exist a metal having the same electrical properties at the
same price of copper.
Platinum group metals, rare and rare-earth metals are prevalently contained in
electronic components mounted on PCBs. The platinum group metals are present in
relays, switches or in sensors; tantalum in capacitors; indium and gallium in
transistors; cobalt in batteries and steel alloys; etc. Besides, small amounts of rare-
earth elements (REEs) such as La, Eu, Nd and Ce can be contained in capacitors,
integrated circuits, resistors, transistors, LEDs, switches etc. [50]. However, the

20
extraction of REEs from WPCBs was generally considered to be economically
unviable due to their low content in the PCBs.
1.2.3 Intrinsic value of WPCBs
The intrinsic value of PCBs certainly increases considering that some metals are
found in discarded PCBs in concentrations higher or equal to those found in natural
deposits. Indeed, WPCBs have been defined as "urban mine". Table 1.2.3.1 shows
the amounts of various metals found in nature as mineral deposits and the content
of the same metals in PCBs [30]. The content of some valuable metals such as
copper, tin, gold and silver is much higher in PCBs than in their respective
ores/concentrates. This comparison justifies the growing importance of WPCBs as
a possible source of secondary raw materials and the economic incentive to develop
processes aimed to recover metals from discarded PCBs.
Table 1.2.3.1 Metal content of ores and PCBs [32]
The intrinsic value of PCBs is mainly due to precious metals and copper according
to Table 1.2.3.2. However, it is important to note that owing to the progressive
reduction of the precious metals content in PCBs, copper could gain a greater share
of value in the future. This could lead to prefer the developing of processes based
on base metals recovery, mainly copper, rather than precious metals. Indeed, a
recovery process becomes more complicated and unprofitable when the elements

21
are available in small concentration and gold concentration is expected to further
decrease in the future.
Table 1.2.3.2 Compositions and the intrinsic values of PCB metals [34]
1 ton of WPCBs with all components is worth about 1.000-5.000 Euros in Europe
[51]. However, the mix of plastics, ceramics and metals, which makes difficult the
separation of each fraction, has hindered the diffusion of industrial process based
on the recovery of metals from WPCBs. Besides, the few examples of industrial
processes for recovering metals from WPCBs are complex and not environment-
friendly. For all these reasons, WPCBs represent a challenge in the field of the
circular economy and sustainable development. The challenge mainly concerns the
development of both cleaner and simpler recycling processes, which should also be
more flexible than the current ones because WPCBs composition is continuously
changing.
In the following chapter the typical approach adopted for PCB recycling will be
presented and each stage discussed in more detail.

22
Bibliography
[1] European Parliament. Directive 2012/19/EU of the European Parliament and of the
Council of 4 July 2012 on waste electrical and electronic equipment (WEEE), Official
Journal of the European Union 2012, L197, 38-71
[2] European Parliament. Directive 2002/96/EU of the European Parliament and of the
Council of 27 January 2003 on waste electrical and electronic equipment (WEEE) -
Joint declaration of the European Parliament, the Council and the Commission relating
to Article 9, Official Journal of the European Union 2003, L37, 24-39
[3] European Parliament. Directive 2003/108/EU of the European Parliament and of
the Council of 8 December 2003 amending Directive 2002/96/EC on waste electrical
and electronic equipment (WEEE), Official Journal of the European Union 2003,
L345, 106-107
[4] C.P. Baldé, V. Forti, V. Gray, R. Kuehr, P. Stegmann, The Global E-waste Monitor
2017, United Nations University (UNU), International Telecommunication Union
(ITU) & International Solid Waste Association (ISWA), Bonn/Geneva/Vienna
[5] European Parliament. Directive 2002/95/EU of the European Parliament and of the
Council of 27 January 2003 on the restriction of the use of certain hazardous
substances in electrical and electronic equipment, Official Journal of the European
Union 2003, L37, 19-23
[6] M.P. Luda, 2011, Recycling of Printed Circuit Boards. In: S. Kumar (Ed),
Integrated Waste Management 2nd Edition (pp. 285-298), InTech, Shanghai, China
[7] A. Akcil, C. Erust, C.S. Gahn, M. Ozgun, M. Sahin, A. Tuncuk, 2015, Precious
metal recovery from waste printed circuit boards using cynide and non-cynide
lixiviants- A review, Waste Management 45, 258-271
[8] J. Cui, L. Zhang, 2008, Metallurgical recovery of metals from electronic waste: A
review, Journal of Hazardous Materials 158, 228-256
[9] D. Mmereki, B. Li, A. Baldwin, L. Hong, 2016, The Generation, Composition,
Collection, Treatment and Disposal System, and Impact of E-Waste. In F.-C. Mihai
(Ed), E-Waste in Transition from pollution to resource (pp. 65-93), IntechOpen
[10] P. Chancerel, C.E. Meskers, C. Hageluken, V.S. Poterr, 2009, Assessment of
precious metal flows during preprocessing of waste electrical and electronic
equipment, Journal of Industrial Ecology 13, 791-810
[11] A. Kaliq, M.A. Rhamdhani, G. Brooks, S. Masood, 2014, Metal Extraction
processes for Electronic Waste and Existing Industrial Routes: A Review and
Australian Perspective, Resources 3, 152-179
[12] R. Wang, Z. Xu, 2014, Recycling of non-metallic fractions from waste electrical
and electronic equipment (WEEE): A review, Waste Management 34, 1455-1469
[13] P. Hadi, M. Xu, C.S.K Lin, C.-W. Hui, G. McKay, 2015, Waste printed circuit
board recycling techniques and product utilization, Journal of Hazardous Materials
283, 234-243
[14] B. Ghosh, M.K. Ghosh, P. Parthi, P.S. Mukherjee, B.K. Mishra, 2015, Waste
Printe Circuit Boards recycling: an extensive assessment of current status, Journal of
Cleaner Production 94, 5-19
23
[15] R. Widmer, H. Oswald-Krapf, D. Sinha-Khetriwal, H. Boni, M. Schnellmann,
2005, Global perspective on e-waste, Environmental Impact Assessment Review 25,
436-458
[16] L. Zhang, Z. Xu, 2016, A review of current progress of recycling technologies for
metals from waste electrical and electronic equipment, Journal of Cleaner Production
127, 19-36
[17] V. Ari, 2016, A Review of Technology of Metal Recovery from Electroni Waste.
In: F.-C. Mihai (Ed), E-Waste in Transition from pollution to resource (pp. 121-152),
IntechOpen
[18] WEEE annual report 2016 – Collection and Treatment of WEEE in Italy from
WEEE Cordination Centre (CdC), available on
https://www.cdcraee.it/GetPage.pub_do?id=2ca980954c369c25014ce55c67350385
[19] E. Croci, F. Colelli, 2017, Research Report N.27 of IEFE Bocconi University in
collaboration with Remedia, available on
http://www.iefe.unibocconi.it/wps/wcm/connect/Cdr/Centro_IEFEen/Home
[20] H. Cui, C.G. Anderson, 2016, Literature Review of Hydrometallurgical Recycling
of Printed Circuit Boards (PCBs), Journal of Advanced Chemical Engineering 6:142
[21] World Electronic Circuit Council (WECC), 2016, WECC Global PCB Production
Report For 2015
[22] K. Huang, J. Guo, Z. Xu, 2008, Reclying of waste printed circuit boards: A review
of current technologies and treatment status in China. Journal of Hazardous materials
164, 399-408
[23] R. Sanapala, 2008, Characterization of FR-4 Printed Circuit Board Laminates
before and after Exposure to Lead-free soldering conditions, available on
https://drum.lib.umd.edu/bitstream/handle/1903/8362/umi-umd-5671.pdf;sequence=1
[24] G. Grause, M. Furusawa, A. Okuwaki, T. Yoshioka, 2008, Pyrolysis of
tetrabromobisphenol-A containing paper laminated printed circuit boards,
Chemosphere 71, 872-878
[25] M. Goosey, R. Kellner, 2003, Recycling technologies for the treatment of end of
life printed circuit boards (PCBs), Circuit World 29, 33
[26] Y. Xia, X. Xie, 2008, Reliability of lead-free solder joints with different PCB
surface finishes under thermal cycling, Journal of Alloys and Compounds 454, 174-
179
[27] EPA United State Environmental Protection Agency, 2014, Flame Retardants in
Printed Circuit Boards, available on https://www.epa.gov/sites/production/files/2015-
01/documents/pcb_updated_draft_report.pdf
[28] NICe-Nordic Innovation Centre, 2004, NoNE Lead-Free Guideline, available on
http://nordicinnovation.org/Global/_Publications/Reports/2004/Lead-
free%20soldering%20guideline%20(NoNE).pdf
[29] S. Oresjo, C. Jacobsen, 2005, Pb-Free PCB Finishes for ICT. Circuits Assembly,
available on http://circuitsassembly.com/cms/content/view/2278/95
[30] S. A. Shuey, P. Taylor, 2004, A Review of Pyrometallurgical Treatment of
Electronic Scrap. In Proceedings of the SME Annual Meeting, Denver, CO, USA

24
[31] H. Lia, J. Eksteena, E. Orabya, 2018, Hydrometallurgical recovery of metals from
waste printed circuit boards (WPCBs): Current status and perspectives – A review,
Resources, Conservation & Recycling 139, 122–139
[32] W. A. Bizzo, R. A. Figueiredo, V. F. de Andrade, 2014, Characterization of
Printed Circuit Boards for Metal and Energy Recovery after Milling and Mechanical
Separation, Materials, 7, 4555-4566
[33] Y. Zhang, S. Liu, H. Xie, X. Zeng, J. Li, 2012, Current status on leaching precious
metals from waste printed circuit boards, Procedia Environmental Sciences 16, 560-
568
[34] Y.J. Park, D.J. Fray, 2009, Recovery of high purity precious metals from printed
circuit boards, Journal of Hazardous Materials 164, 1152-1158
[35] A.V. Feldman, 1993, Method for Processing Scrap of Electronic Instruments. U.S.
Patent 5217171A
[36] R.P. Menetti, S.A.J. Tenório, 1995, Recycling of Precious Metals from Electronic
Scraps. In Proceedings of the 50th Annual Congress of ABM, São Pedro, SP, Brazil,
625–634
[37] M. Iji, S. Yokoyama, 1997, Recycling of printed wiring boards with mounted
electronic components. Circuit World 23, 10–15
[38] H.M. Veit, C.C. Pereira, A.M. Bernardes, 2002, Using mechanical processing in
recycling printed wiring boards, JOM 54, 45–47
[39] Y. Zhao, X. Wen, Y. Cao, B. Li, D. Tao, 2004, Recovery of copper from printed
circuit board. Minerals & Metallurgical Processing 21, 99–102
[40] B. Kim, J. Lee, S. Seo, Y. Park, H. Sohn, 2004, A process for extracting precious
metals from spent printed circuit boards and automobile catalysts, JOM 56, 55–58
[41] H. Wang, G. Gu, Y. Qi, 2005, Crushing performance and resource characteristic
of printed circuit board scrap, Journal of Central South University of Technology 12,
552–555
[42] N.J. Creamer, V.S. Baxter, J. Henderson, M. Potter, L.E. Macaskie, 2006,
Palladium and gold removal and recovery from precious metal solutions and electronic
scrap leachates by desulfovibrio desulfuricans, Biotechnology Letters 28, 1475–1484
[43] I. Marco, B.M. Caballero, M.J. Chomón, M.F. Laresgoiti, A. Torres, G.
Fernández, S. Arnaiz, 2008, Pirolysis of electrical and electronic wastes, Journal of
Analytical and Applied Pyrolysis 82, 179–183
[44] T. Hino, R. Agawa, Y. Moriya, M. Nishida, Y. Tsugita, T. Araki, 2009,
Techniques to separate metal from waste printed circuit boards from discarded
personal computers, Journal of Material Cycles and Waste Management 11, 42–54
[45] A. Das, A. Vidyadhar, S.P. Mehrotra, 2009, A novel flowsheet for the recovery of
metal values from waste printed circuit boards, Resources, Conservation and Recycling
53, 464–469
[46] J.M. Yoo, J. Jeong, K. Yoo, J.C. Lee, W. Kim, 2009, Enrichment of the metallic
components from waste printed circuit boards by a mechanical separation process
using a stamp mill, Waste Management 29, 1132–1137
[47] P.C. Oliveira, M. Cabral, C.A. Nogueira, F. Margarido, 2010, Printed circuit
boards recycling: Characterization of granulometric fractions from shredding process,
Material Science Forum 636–637:1434–1439

25
[48] M. Chen, O.A. Ogunseitan, J. Wanga, H. Chen, B. Wanga, S. Chen, 2016,
Evolution of electronic waste toxicity: Trends in innovation
and regulation, Environment International 89–90, 147–154
[49] Y. Li, X. Xu, J. Liu, K. Wu, C. Gu, G. Shao, S. Chen, G. Chen, X. Huo, 2008,
The hazard of chromium exposure to neonates in Guiyu of China, Science of the Total
Environment 403, 99-104
[50] R. Khanna, G. Ellamparuthy, R. Cayumil, S.K. Mishra, P.S.Mukherjee, 2018,
Concentration of rare earth elements during high temperature pyrolysis of waste
printed circuit boards, Waste Management 78, 602-610
[51] M. Kaya, 2018, Current WEEE recycling solution, in F. Vegliò, I. Birloaga (Ed.),
Waste Electrical and Electronic Equipment Recycling Aqueous Recovery Methods
(pp. 33-93), Woodhead Publishing

26
Chapter 2
Recycling of WPCBs
Introduction
For several years, waste PCBs have been poorly managed and their handling has
been carried out mainly through disposing in landfill or incineration along with
other municipal wastes. However, the new legislations on e-waste have encouraged
the development of recycling processes. Currently, recycling processes result very
complex due to the heterogeneous composition of WPCBs. A typical recycling
process consists of pre-treatment, metal extraction by metallurgical route and
purification. Dismantling, liberation of metals from non-metals and
separation/recovery of non-metallic fraction through physical or chemical
processes constitute the pre-treatment of WPCBs and allow to increase the
concentration of metals in the residue in order to facilitate their subsequent
recovery. The metallic fraction of WPCBs can be further processed by
pyrometallurgical, hydrometallurgical or biometallurgical processes. Currently, e-
waste recycling is dominated by pyrometallurgical route mainly due to its ability to
accept any forms of scrap. However, it suffers from important limits, such as high
environmental impact and partial separation of metals resulting in a limited metal
grade. Consequently, hydrometallurgical and biometallurgical routes have been
much investigated in the last years. The purpose of the present chapter is to provide
a comprehensive description of each step of the recycling chain of WPCBs,
reporting also some examples of industrial recycling processes.

27
2.1 Disassembly
Disassembly/dismantling is the first step in recycling chain of waste PCBs and
consists of the removal of components from the board in order to simplify the
subsequent recovery of materials. Such operation allows to selectively separate
reusable components as well as hazardous components, such as batteries and
capacitors, which have to be treated differently in a dedicated facility or disposed in
appropriate way [1-5]. Electronic components are mounted on PCB by various
types of connections. These connections are typical of following type: through-hole
device (THD), surface mounted device (SMD), socket pedestal device (SPD),
screw joint devise (SJD) and rivet joint devise (RJD) [6]. The last two act only as a
mechanical connection, while THD, SMD, and socket pedestal act as mechanical
and electrical connections. THD and SMD components are soldered to the board,
while socket pedestal is a solder-free connection. There are several methods by
which these connections can be removed. For instance, socket pedestal connection
can be broken by applying a small and nondestructive force; but, the methods used
for dismantling components with SMD and THD connections are always
destructive and involve the melting or leaching of the solder. This can be achieved
by either a chemical treatment using a liquid reagent or thermal treatment using
direct heating, high-temperature gas, and liquid heating medium [7]. In the
literature are reported different examples of using infrared rays, hot air, special
liquids (such as methylphenyl silicone oil and some ionic liquids) as heating
medium and also as leaching agent (e.g. fluoroboric acid containing H2O2) to
remove solder from the PCB assemblies [8-10]. It is important to note that the
current disassembling methods require the use of potentially polluting liquids or the
heating of the board with the possible release of toxic gases due to thermal
degradation of plastics. Besides, the addition of external forces (e.g. impact,
vibration, scraping etc.) for the separation of unsoldered components can lead to
damage of reusable components [11]. Several research projects are in progress for

28
developing less energetic and more environmentally friendly dismantling processes
which allow to preserve the components and the board.
The disassembly process may be manual, automatic or semiautomatic.
Currently, manual disassembly is the most common technique adopted in most of
the recycling plants. However, the current manual disassembly is totally
insufficient and unprofitable in the light of the expected mass of WPCBs which
will have to be recycled in the future [12-13]. Besides, it requires direct human
contact with waste [14]. Two methods can be used for automatic disassembly:
selective or simultaneous disassembly. In selective disassembly, some specific
components are identified and removed individually. This principle is named “look
and pick”. In simultaneous disassembly, the whole flat board is heated and all
components are “wiped off” simultaneously and then identified and sorted on the
basis of geometry, density, or using magnetic effect. This method is also named
“evacuate and sort” and leads to higher efficiency, but also higher risks of
damaging the components. An image-processing and database are used to identify
the components and then, different PLC (Programmable Logic Controller)
modules can be adopted in designing further route for dismantling. Modern
identification systems use optical measures such as 1-D, 2-D or 3-D pictures,
radiograph, or infrared pictures for recognition of the components. For
simultaneous disassembly, the 1-D signals are suitable to obtain good results, while
selective disassembly needs 3-D signals.
Feldmann et al. [12-13] developed an automatic disassembly unit module in
1994, which consisted of a preliminary selective dismantling unit with a 3-D
picturing process to remove reusable and hazardous components followed by a
simultaneous dismantling unit using an infrared radiator to remove all the
remaining components that were transferred to an identification unit. However,
automatic disassemblers still remain expensive and therefore recommended for
high-metal content waste.

29
2.2 Liberation of metallic fraction
After dismantling of WPCBs and removal of the hazardous components,
different unit operations such as shredding, crushing and grinding can be applied to
liberate metals from plastics and ceramics [2]. Various types of hammer, rotary,
disc crushers, cutters, and shredders equipped with a bottom sieve are used for
liberation [15]. Generally, WPCBs are first cut into roughly fragments with
shredders or granulators and then further reduced into fine particles with various
types of mills such as cutting, ball, disc, hammer mills, etc. [4, 15-16]. The
liberation degree of metals from non-metals is mainly affected by particles size.
Zhang and Forssberg [17] found that metallic particles below 2 mm achieve an
almost complete liberation. According to their results, ferromagnetic and copper
below 6 mm sized particles were completely liberated, whereas aluminum was
found to be liberated in much coarser fraction (> 6.7 mm). Generally, metal
liberation degree increases with decreasing particle size; however, for superfine
particles (-0.074 mm), the subsequent operation of separating metals from non-
metals through physical methods becomes more difficult [18]. For example, in
electrostatic separation of metallic particles from non-metallic ones, the particles
are easily repelled, attracted or agglomerated together with the decrease in size
[18]. Besides, fine grinding can lead to an excessive generation of dangerous fine
dust. Indeed, one of the major problems related to the mechanical pre-treatment of
WPCBs is the generation of fine dust during crushing and grinding containing
plastics, metals, ceramic and silica. Furthermore, the local temperature of WPCBs
can increase during crushing, leading to localized pyrolysis with possible release of
toxic substances. Another important drawback of mechanical processing concerns
the loss of metals during shredding and grinding, which can cause a negative effect
on the economy of the whole recycling process.

30
2.3 Separation/recovery of non-metallic fraction
After liberation, the metallic fraction can be separated from the non-metallic one
by physical or chemical methods. The main purpose of chemical processes is to
convert polymers contained in PCBs into chemical feedstocks or fuels. At variance,
in physical processes, plastics and ceramics contained in PCBs are separated and
sent to landfill, incineration or reused as very low cost fillers in the construction
industry [19]. The separation/recovery of non-metals from more valuable metallic
fraction is of primary importance in the hydrometallurgical route, but it is not
always required in the pyrometallurgical one. Indeed, integrated metal smelters use
organic fraction of WPCBs directly in smelting process to partially replace coke as
a fuel [20].
Physical recycling process is generally preferred to the chemical one because
more environmentally friendly. Besides, since chemical process involves reactions
at high temperature, it results more convenient from an industrial point of view to
treat WPCBs directly by the pyrometallurgical route. For this reason, many projects
are in progress to find alternative uses for non-metallic fraction
2.3.1 Physical processes
Physical processes include magnetic separation, density based separation,
electrostatic separation, shape based separation, flotation or a combination of these
techniques.
Magnetic separation can be used to separate magnetic particles such as Fe, Ni
and steel from non-magnetic particles such as plastics, glass, Al and Cu. Low-
intensity drum magnetic separators are generally used to recover ferrous materials.
Over the past decade, there have been many advancements in the design and
operation of high-intensity magnetic separators, mainly as a result of the
introduction of rare earth alloy-based permanent magnets capable of providing very
high field strengths and gradients [14]. However, magnetic separators are not very

31
useful for crushed PCBs due to agglomeration of the particles during the process
that leads non-ferrous materials to escape together with ferrous ones. Veit et al.
[21] employed a magnetic field of 6.000–6.500 Gauss to separate the ferromagnetic
elements. The concentration of Fe and Ni in the magnetic fraction was, on average,
43% and 15.2%, respectively. However, there was a considerable amount of Cu
impurity in the magnetic fraction as well. Generally, magnetic separation is applied
before electrostatic separation.
Gravity is widely used to separate lighter fraction from the heavier one
according to their density difference. WPCBs consists essentially of plastic having
a density less than 2.0 g/cm3; light metals, primarily Al, and glass having a density
of about 2.7 g/cm3; and heavy metals, essentially Cu and ferromagnetics, having a
density greater than 7 g/cm3
[15]. Zheng et al. [22] used an air classification
method in which separation is based on the settling velocity of the particles in air
and reported a maximum copper content in non-metallic fraction of only 1.6%.
Also water or heavy liquids (e.g. tetrabromoethane) can be used as viscous media
for separating metals from plastics and ceramics. One of the major disadvantages
of this methodology is that efficiency of separation strongly depends on size and
shape of the particles, therefore, a close size control of feed to gravity separation
equipment is required to minimize size effects [23].
Electrostatic separation can be used to separate materials of different electrical
conductivity (or resistivity). The two main techniques are: corona electrostatic
separation and eddy current separation. The first one separates metals (conductive)
from non-metals (non-conductive), while the eddy current method separates ferrous
metals from non-metals. In corona electrostatic separation Figure 2.3.1.1a, small
particles are passed along a vibratory feeder to a rotating roll to which is applied a
high voltage electrostatic field using a corona and an electrostatic electrode. The
non-metallic particles become charged and remain attached to the drum eventually
falling off into storage bins; whereas the metallic particles discharge rapidly in the
direction of an earthed electrode [23]. Li et al. [24] found that the best particle size

32
range is between 0.6 and 1.2 mm and that productivity decreases for finer particles.
The method has the advantage of being environmentally friendly, producing no
wastewater and no gaseous emissions. Eddy current separators operates using a
rotating drum with rare-earth permanent magnets which induce eddy current in
non-ferrous metallic particles with a resultant repulsive force between particles and
drum magnet that moves particles away from the drum Figure 2.3.1.1b. The typical
particle size range is between 3 and 150 mm [23].
Figure 2.3.1.1 a) Corona electrostatic separator [25]; b) Eddy current separator [26]
In shape based separation, metallic particles can be separated from the non-
metallic ones because they assume a spherical shape during grinding due to their
malleability and ductility while ceramics and plastics remain non-spherical due to
their brittle fracture. Flottation has also been investigated to separate plastics,
which are naturally hydrophobic, from metals in the case of fine particles because
the other separation methods cannot be effective when the particles are too fine.
Physical processes are relatively simple, convenient, and environmentally
friendly. However, a consistent loss of metals occurs during mechanical processing
and physical liberation is estimated at about 10-35% of the total metal content.
Usually, more techniques of physical separation are coupled in recycling process
of WPCBs to maximize the recovery of materials. For example, magnetic
separation can be followed by eddy current and density-based separation in order to

33
sequentially separate ferrous metals, then non-ferrous metals, and finally separate
plastics from ceramics for density difference.
In recent years, many papers have been published on potential uses of non-
metallic fraction resulting from physical processes [27-29]. Non-metallic fraction
can be used as an either reinforcing filler in both polyester and polypropylene
composites, or in high density polyethylene. The glass fibers and resins powder
contained in the non-metallic fraction can also be used to strengthen the asphalt or
as sound and thermal insulation materials. Hadi et al. [28] tested the use of non-
metallic fraction as an adsorbent material for heavy metals after chemical
activation with potassium hydroxide. Ke et al. [29] produced porous carbon from
non-metallic fraction of FR-3 type of waste PCBs via physical and chemical
activation techniques. The recovery/recycle of non-metals has gained much
attention because they constitute the major fraction of material present in WPCBs
and their reuse greatly increases the feasibility of hydrometallurgical route for
WPCBs recycling.
2.3.2 Chemical processes
In chemical processes, WPCBs are depolymerized into smaller useful molecules
by several techniques such as pyrolysis, gasification and depolymerization using
supercritical fluids. Unlike physical processes where the organic fraction is simply
separated, in chemical processes, it is converted into chemical feedstocks and fuels.
Pyrolysis is carried out in the absence of oxygen or in the presence of some inert
gases at a temperature between 400 and 700°C. During pyrolysis, the polymers are
decomposed to low molecular weight products and finally converted into gas, oil
and char. According to the study of Hall et al. [30], pyrolysis of waste computer
PCBs leads to approximately 22.7% oil, 4.7% gas and 70% copper-rich residue.
The pyro-gases have high heating value resulting valuable for combustion, the oils
can be recycled as raw materials for chemical /petrochemical industries, and the
solid residue can be sent to metallurgical processes for metals recovery. Compared

34
with incineration, the quantity of greenhouse gases produced during pyrolysis and
released in environment is notably reduced [31-32]. Nevertheless, the presence of
dioxins and furans precursors in the pyrolysis oil represents a serious problem. The
quantity of halogenated compounds in the oil decreases with increasing
temperature and time of reaction. Also the particles size influences the quality of
pyrolysis oil; large particles (4 cm2) lead to contamination of oil that will have to
be purged for further utilization [4]. A size of 1.5–2 cm2 is typically used, which
require a simpler mechanical pre-treatment than that employed in physical
processes [33]. Some of the recent studies suggest that the addition of CaCO3 and
Fe2O3 during pyrolysis can control the release of brominated compounds and other
organic compounds like benzene.
Gasification converts organic materials into carbon monoxide and hydrogen
(syngas) by reactions at high temperature with a controlled amount of oxygen
and/or steam. The gasification can be described as a partial oxidation of
hydrocarbons and the temperature might up to 1600 °C at a pressure of up to 150
bar [31]. CO2, H2O, CH4 and soot might be the byproducts. In gasification, a small
amount of bromine is present in the char, but the major part ends up into syngas,
which has to be cleaned before using for energy recovery or chemical synthesis.
However, it was found that after high temperature treatment (1150°C) and shock
cooling of gas at about 50°C, the emission of PBDFs (polybrominated
dibenzofurans) and PBDDs (polybrominated dibenzodioxins) is minimized [31].
This indicates that gasification could be an eco-efficient technology to dispose the
WEEE plastics if proper control of the gas emission is designed.
In recent years, supercritical fluids have been used as an effective medium to
oxidize organic materials to CO2 and H2O. Supercritical water and methanol have
been used for depolymerization of thermoset resins in WPCBs [34-36]. The lower
critical temperature and pressure of methanol (Tc=240°C, Pc=8.09 MPa) compared
to those of water (Tc=374°C, Pc=22.1 MPa) allow milder operative conditions.
During the process, alkali cations are used to capture bromine and make the process

35
more environmentally friendly. In the study by Chien et al. [36], the resin
conversion in supercritical water at 520°C for 10 min was 0.90 and the solid
residue was mainly constituted by copper in the form of Cu2O, CuO and Cu(OH)2.
The resin conversion is defined as the ratio between carbon content in the residue
and carbon content originally present in waste PCB. The authors also found that
NaOH enhanced the PCBs oxidation and Br retention in the liquid phase. Xiu et al.
[35] studied the use of supercritical methanol to separate polymers and metals from
comminuted PCBs (<1 mm). The highest conversion was obtained at 380°C for
120 min. The oil did not contain brominated compounds due to the complete
decomposition and the content of copper in the solid residue was approximately
three time of that in the original material.
Supercritical fluids and gasification technology have a potentially smaller
environmental impact than pyrolysis process due to the high debromination
efficiency, but the energy consumption is higher.
2.4 Metal recovery
The metallic fraction separated from WPCBs during preprocessing can be
further treated using three different techniques: hydrometallurgical,
pyrometallurgical and biometallurgical. Each methodology will be discussed in
more detail in the following.
2.4.1 Hydrometallurgical route
Hydrometallurgical route involves metals leaching by means of a solvent from
the residue resulting from WPCBs pre-treatment. The leach solution is then
subjected to separation and purification procedures such as adsorption, solvent
extraction, precipitation and ion-exchange to isolate and concentrate the metal of
interest. This route is based on traditional hydrometallurgical technology of metals
extraction from their primary ores. The main goal of the process consists in
recovering precious metals, which have the highest value in waste PCBs.

36
Generally, base metals are firstly leached to enrich the solid residue of precious
metals and therefore enhance their subsequent recovery. Besides, base metals
recovery has a substantial impact on the economics of the process due to their high
content in WPCBs. Among base metals, copper is the metal of greatest interest.
The leaching of base metals is usually conducted using different acids such as
H2SO4, HNO3, aqua regia (HCl:HNO3=3:1, v/v) and HClO with various oxidants
including H2O2, O2, Fe3+
and Cl2 [19, 37-42]. Recently, a lot of alternatives to the
use of such corrosive acids have been tested including ionic liquids. For instance,
copper can also be effectively extracted through ammoniacal leaching [43-45]. The
solution from the leaching of the base metals mainly contains copper. After a solid-
liquid separation, it can be further treated by purification or directly sent to the
electrochemical copper recovery. Comparison between the most used reagents for
the leaching of the base metals is shown in Table 2.4.1.1.
Table 2.4.1.1 Comparison of potential leaching reagents for base metals [19]
Precious metals, mainly Au, Ag and Pd, are chemically stable and in WPCBs,
they are also combined with other materials so that their extraction is very
challenging. Therefore, leaching solution with high oxidizing power must be used.
Sheng and Etsell [46] tested the recovery of gold from WPCBs by leaching of base
metals in HNO3 followed by leaching of Au in aqua regia and finally, precipitation
of Au with ferrous sulphate. The reactions involved during leaching in aqua regia
are

37
2HNO3 + 6HCl → 2NO + 4H2O + 3Cl2 (2.4.1.1)
2Au + 9HCl + 3HNO3 → 2AuCl3 + 3NOCl + 6H2O (2.4.1.2)
3HCl + HNO3 → Cl2 + NOCl + 2H2O (2.4.1.3)
However, the construction of a leaching reactor suitable for highly corrosive HNO3
and aqua regia, limits its industrial feasibility. Senanayake [47] studied the kinetics
of gold oxidation using different extracting systems, and also reported the
following stability order of Au(I)-complexes with different ligands: CN- > HS
- >
S2O32-
> SC(NH2)2 > OH- > I
- > SCN
- > SO3
2- > NH3 > Br
- > Cl
- > CH3CN. In the
case of Au(III)-complexes, the stability order was CN- > OH
- > SCN
- > Br
- > Cl
-.
From the study, it emerges that cyanide is certainly the best extracting reagent for
gold, in fact, it has been used in the mining industry for more than one century. The
overall gold cyanidation reaction is
4Au + 8CN- + O2 + 2H2O → 4Au(CN)2
- + 4OH
- (2.4.1.4)
The maximum dissolution of gold, silver, palladium, and platinum in cyanide
solution can be obtained at pH 10-10.5 and the order of activity for metals is Au >
Ag > Pd > Pt [48]. Nevertheless, the rising environmental issues regarding the use
of cyanide has led to find new gold leaching agents. Table 2.4.1.2 summarizes the
alternatives to cyanide, but some of them have been scarcely investigated. The
most realistic alternatives to cyanide are thiourea and thiosulfate.
Unlike cyanide, thiourea (SC(NH2)2) forms a cationic complex with gold in
acidic solution of H2SO4 as described by the following reaction
Au + 2SC(NH2)2 → Au(SC(NH2)2)2+ + e- (2.4.1.5)
It was found that the addition of ferric ion, usually in the form of Fe2(SO4)3, into
leaching system is advantageous for gold and silver recovery [49]. Using this
leaching system, Lee et al. [50] obtained complete gold and silver extraction in 24
h at 20°C after roasting, size reduction (0.84 mm) and magnetic separation.

38
Nevertheless, the high cost and rapid consumption of thiourea have hindered its
extensive use. Indeed, in the presence of ferric sulphate, thiourea rapidly disappears
in form of (FeSO4·CS(NH2)2)+. Besides, thiourea has low selectivity which
involves the need to remove base metals before leaching of the precious ones.
Ficeriova et al. [51-52] obtained dissolution in single step of Au, Cu, Fe, Pb and Zn
equal to 90%, 68%, 45%, 43%, and 28%, respectively at ambient temperature using
a leaching solution having 10 g/L of CS(NH2)2, 10 g/L of H2SO4 and 5 g/L of
Fe2(SO4)3·9 H2O.
Table 2.4.1.2 Suggested alternatives for leaching of gold to cyanide [48]
Another non-toxic and non-corrosive reagent along with thiourea is the
thiosulfate (S2O32-
). Gold dissolution in ammoniacal thiosulfate solution is an
electrochemical reaction catalyzed by small concentrations of Cu2+
that can be
described as following
Au + 5S2O32-
+ Cu(NH3)42+
→ Au(S2O3)23-
+ 4NH3 + Cu(S2O3)35-
(2.4.1.6)
2Cu(S2O3)35-
+ 8NH3 + ½ O2 + H2O → 2Cu(NH3)42+
+ 2OH- + 6S2O3
2- (2.4.1.7)

39
The above reactions could proceed very slowly without cupric ions. However, too
much copper in solution could adversely affect the leaching process because copper
as well as other metals can increase the decomposition of thiosulfate. Therefore, a
pre-leaching stage aimed to remove copper and other metals from WPCBs is
suggested before thiosulfate leaching. At ambient temperature, pH has to be
maintained at about 9-10 to avoid degradation of thiosulfate and ensure the stability
of Cu(II)-ammonia complex. Oh et al. [53] extracted 95% Au within 48 h and
100% Ag within 24 h by leaching in 0.2 M (NH4)2S2O3-0.02 M CuSO4-0.4 M
NH4OH solution at 40°C after physical pre-treatment and removal of the base
metals. The main drawback related to thiosulfate leaching is its high consumption
which makes the process economically unfavourable, despite the potential
environmental benefits.
The use of halides has been widely investigated as an alternative to cyanide
leaching. Gold can form both Au(I) and Au(II) complexes with chloride, bromide
and iodide. Different authors have found electrogenerated Cl2 as a promising
oxidant for gold leaching from WPCBs [54-56]. However, the handling of chlorine
gas and the requirement of special reactors hinders the application of
chlorine/chloride leaching system. Iodide leaching is considered non-toxic, non-
corrosive and very selective towards gold. It was found that addition of an oxidant
to iodide leaching enhances the gold recovery and decreases the consumption of
reagent. Xu et al. [57] achieved 95% of gold recovery after 4 h at ambient
temperature using H2O2 as an oxidant in I2/I-
leaching system. Xiu et al. [58]
obtained good extractions of Au, Ag and Pd by leaching in I2/KI solution after
supercritical water pre-treatment of WPCBs. The main obstacles in iodine/iodide
leaching process are the high consumption and cost of reagent. A comparison
between the main leaching reagents for gold is shown in Table 2.4.1.3.
Some studies reported the use of non-cyanide lixiviants for the extraction of Ag
and Pd, such as acidic solutions containing an oxidant (e.g. HCl/Cu2+
, HCl/ClO-3,
H2SO4/Cu2+
, H2SO4/Fe3+
). All have been developed at laboratory scale and have

40
low selectivity [59-63]. At present, thiourea and thiosulfate seem to be the most
realistic alternatives.
Table 2.4.1.3 Comparison of potential leaching reagents for gold [19]
2.4.2 Pyrometallurgical route
Pyrometallurgy is the traditional approach for metal recovery from WPCBs.
Currently, more than 70% of WPCBs are treated by pyrometallurgical route [2]; the
remaining part is treated by mechanical and physical processing. The main
advantage of pyrometallurgical treatment consists in its flexibility, i.e. the ability to
accept any forms of scrap. Hence, e-waste can be simultaneously treated with other
types of metal scraps and incorporated into smelting process of copper or lead
concentrates. Copper and lead smelters have been successfully used by different
companies as installations for the recovery of base and precious metals from
electronics waste. Regarding these smelters, waste PCBs are fed directly into a
smelting furnace after a minimum pre-processing that includes the removal of
hazardous components and coarse crushing. The crushed scraps are burned to
remove the organic material, which contribute as a source of energy during
smelting, while the refractory oxides form a slag phase together with some metal
oxides. This approach does not allow the aluminum and iron recovery because they
are transferred into the slag. Besides, individual recovery of metals at high purity

41
can hardly achieved by pyrometallurical route with the consequent need to
integrate the technique with hydrometallurgical or electrometallurgical operations,
such as the electrorefining. Currently, various industrial processes are used globally
for extracting metals from e-waste, including the Noranda process in Quebec,
Umicore integrate smelting and refining facility in Belgium, Rönnskär smelters in
Sweden, Kosaka’s recycling plant in Japan, the Kayser recycling system in Austria
and the Metallo-Chimique N.V plants operating in Belgium and Spain [20].
In the Noranda process, about 100.000 tons of e-waste per year are recycled. A
scheme of the process is shown in Figure 2.4.2.1. Copper concentrate and scraps
are fed together into a molten metal bath (1250°C) which is churned by oxygen.
The combustion of plastics contained in e-scrap, including WPCBs, reduces the
energy cost of the process.
Figure 2.4.2.1 Schematic diagram for the Noranda smelting process [48]
The purpose of the smelting stage is to convert impurities including iron, lead and
zinc into oxides which segregate into a silica-based slag, and produce the so-called
copper matte which mainly consists of copper and iron sulphides with a copper

42
content in the range of 50-75% by weight. The slag is cooled and processed to
recover more metals before disposal; instead, the copper matte is transferred to the
converters to reach a purity of 98%. The obtained copper, known as a blister
copper, is put into an anode furnace that refines the blister copper to anode-grade
copper (99.1%). The remaining impurities mainly contain precious metals along
with other recoverable metals such as selenium, tellurium, and nickel. The
subsequent electrorefining of the product coming from fire-refining allows the
recovery of these valuable metals.
Another application for pyrometallurgical process to recover metals from e-
waste is practiced at the Boliden Ltd. Rönnskär Smelter in Sweden. In Figure
2.4.2.2 is reported a block diagram of the process. Electronic scraps are treated
together with both copper and lead concentrates. In particular, high copper
containing scraps are fed into the smelting process directly, but low-grade scraps
are fed into the Kaldo furnace. This last produces a mixed copper alloy that is sent
to the copper converting while the dusts containing Pb, Sb, In and Cd are sent to
other operations for lead recovery. The main steps for producing copper and
precious metals are roasting, smelting, converting, refining in anode furnaces and
electrorefining.
Figure 2.4.2.2 Schematic diagram for the Rönnskär Smelter [48]

43
In recent years, Umicore developed an integrated process composed of several
pyrometallurgical, hydrometallurgical and electrochemical operations for precious
and base metals recovery from various industrial wastes as well as consumer
recyclables such as car exhaust catalyst and PCBs. On average, 250.000 tons of
feed material are treated annually. It is the world’s largest recycling facility with an
annual production of over 50 tons of platinum group metals, 100 tons of gold and
2.400 tons of silver. Figure 2.4.2.3 shows the process flow diagram.
Figura 2.4.2.3 Flow sheet for Umicore’s integrated metals smelter and refinery [20]
The heart of the process is the IsaSmelt furnace where plastics partially replace
coke as a reducing agent and source of energy for smelting. In the Umicore
process, the input material is different from ores/concentrates and usually does not
contain sulfur. Therefore, the roasting stage to remove sulfur as SO2 is no longer
required and the smelting operates under reducing conditions to produce crude
copper directly, also known as black copper or bullion copper, rather than copper

44
matte. The copper content in black copper usually varies in the range of 60-85% by
weight. In principle, this product could be sent subsequently to the traditional
converting and refining stages. On the contrary, in Umicore process, the bullion
copper is treated by copper-leaching followed by electrowinning for obtaining pure
copper while copper-leached residue is sent to precious metal refinery. The
oxidized slag resulting from IsaSmelt furnace is further treated into the lead blast
furnace that produces impure lead bullion, nickel speiss, copper matter and
depleted slag. The Harris process (lead refinery) is used to refine lead bullion that
contains fewer precious metals. Pure lead, sodium antimonite and special metals
(indium, selenium and tellurium) are produced during the Harris process. Bismuth
and tin are sold to other companies to produce pure metals. Nickel is leached out
from nickel speiss as a sulfate. The remaining residue is sent to the precious metals
refinery unit. Overall, the Umicore integrated smelter and refinery can recover a
total of 17 metals.
The high calorific value of WPCBs makes their incineration feasible. Indeed,
incineration is a widespread disposal method of WPCBs. Unlike smelting,
formation of melts is avoided during incineration. Typically, rotary furnaces are
used in such a process; however, stationary fluidized bed has also been tested for e-
waste incineration at laboratory scale. Samples of PCBs were heated for 3 min at
840–850 °C and 6.2 vol% of oxygen. Weight loss of the incinerated material was
equal to about 21 wt % and the final product was then pulverized below 0.2 mm
and treated by hydrometallurgical route for copper recovery [64]. In order to reduce
the emission of polluting gases, e-waste is burnt at temperatures above 800°C and
then gaseous products are heated above 1100°C. It was found that small amounts of
e-waste, especially organic components, can be safely added to municipal waste to
generate energy [65]. However, the presence of brominated flame retardants in e-
waste makes incineration a not wise choice for WPCBs recycling.
Recently, molten salt recycling processes have been investigated to reduce the
air pollution problems encountered in traditional pyrometallurgical route. The
45
process can be performed at low temperatures (<500°C) using eutectic salt
composition. Molten mixtures of inorganic salts, such as KOH-NaOH and NaOH-
NaNO3 have been used to recovery metals from WPCBs obtaining very
encouraging results [66-67]. Non-metallic part is dissolved in the molten salt and
remains trapped there, leaving a copper-rich residue. The main advantage of the
technology consists in trapping halogens in the molten salt as alkali metal halides,
reducing the environmental impact of the process. In addition, a considerable
energy saving occurs due to the lower temperature of the process compared to the
traditional pyrometallurgical one. In brief, molten salt process represents a
significant advancement in the area of pyrometallurgical processes for metal
recovery from WPCBs.
2.4.3 Biometallurgical route
Biometallurgy is one of the most promising technologies in metallurgical
processing of WPCBs due to the lower investment cost, environmental impact,
energy consumption than conventional pyrometallurgical and hydrometallurgical
routes [2]. In the mining industry, biometallurgy is well established for recovering
metals, especially copper and gold, from very low-grade ores and concentrates.
However, most of applications of the biometallurgy for WPCBs recycling are still
at laboratory scale. Bioleaching and biosorption are the two main areas of
biometallurgical route for metal recovery.
In bioleaching, metals present in the environment are oxidized by bacteria-
assisted reactions and brought into solution. Acidophilic group of bacteria such as
Acidithiobacillus ferrooxidans, Acidithiobacillus thiooxidans, Leptospirillum
ferrooxidans, and Sulfolobus sp plays an important role in bioleaching of base
metals. Wang et al. [68] used A. ferrooxidans and A. thiooxidans as bioleaching
bacteria to solubilize Cu, Pb and Zn from printed wire boards. The solubilizing
capability for metals increased when a mixed culture of A. ferrooxidans and A.
thiooxidans was used, reaching a copper extraction of 99.9% under specific
46
operative conditions. Other studies [69-70] showed that the mechanism of copper
solubilization can be divided into two phases as described by the following
reactions
4Fe2+
+ O2 + 4H+ = 4Fe
3+ + 2H2O (2.4.3.1)
Cu + 2Fe3+
= Cu2+
+ 2Fe2+
(2.4.3.2)
In the first phase, the ferrous ions are used from bacteria as an energy source and
oxidized to ferric ions. In the second phase, copper is dissolved by ferric ions
which are reduced regenerating the ferrous ions according to a cyclical
mechanism. Besides, the leaching mechanism shows the influence of Fe3+
on the
leaching rate. In particular, the rate of copper extraction increases with increasing
of Fe3+
concentration. Faramarzi et al. [71] used different cyanogenic bacterial
strains (Chromobacterium violaceum, Pseudomonas fluorescens, Bacillus
megaterium) to recover gold from electronic scrap and found a 14.9% maximum
gold dissolution in the form of dicyanoaurate [Au(CN)2 −
]. The major drawbacks
associated to bioleaching process are the very slow reaction rate and precipitation
of metals, mainly copper, which was observed by several researchers during
microbial leaching of e-waste. The addition of elevated amounts of scrap facilitates
metal precipitation and also leads to an increase in pH due to the alkalinity of e-
waste with consequent toxic effects on the microorganisms. However, it was found
that the addition of complexing agent like citric acid can increase the solubility of
copper and the efficiency of the process [48].
Biosorption is a passive physico-chemical interaction between the charged
surface groups of microorganisms (algae, fungi or bacteria) and ions present in a
leach solution. Ion-exchange, complexation, coordination and chelation are the
main interactions established between metal ions present in the environment and
ligands present on the cell surface. Also dead or inactive microbial biomass can
bind and concentrate metal ions from solutions. Au(III) was successfully recovered

47
in the form of metallic gold nanoparticles using dead biomass of the brown alga
Fucus vesiculosus. The greatest gold uptakes were obtained at pH 7. The marine
alga Sargassum natans and the fungal cells of Aspergillus niger, Mucor rouxii and
Rhizopus arrihus were also found to uptake precious metals like gold [72].
However, recovery of metals from e-waste by biosorption is only just beginning.
Cramer et al. [73] demonstrated the bioseparation procedure to recover Au and Pd
from e-waste leach solution using Desulfovibrio desulfuricans biomass. The
method allows the recovery of Au and Pd in the presence of an excess of Cu
through a 3-steps process. Au(0) and Pd(0) were recovered by bacteria-mediated
precipitation during the 1-st and 2-nd step, respectively; while copper was removed
from the precious metal-depleted solution as a mixture of hydroxide and sulfate in
the 3-rd step by biogas generated through K. pneumoniae or E. coli. Table 2.4.3.1
summarizes some results on metals extraction by biometallurgy.
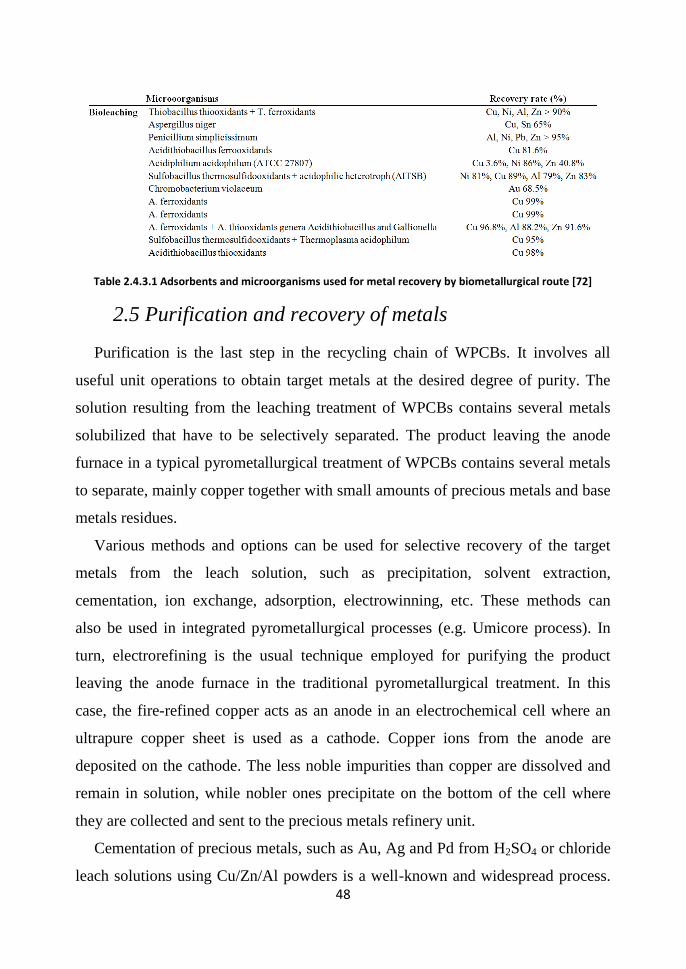
48
Table 2.4.3.1 Adsorbents and microorganisms used for metal recovery by biometallurgical route [72]
2.5 Purification and recovery of metals
Purification is the last step in the recycling chain of WPCBs. It involves all
useful unit operations to obtain target metals at the desired degree of purity. The
solution resulting from the leaching treatment of WPCBs contains several metals
solubilized that have to be selectively separated. The product leaving the anode
furnace in a typical pyrometallurgical treatment of WPCBs contains several metals
to separate, mainly copper together with small amounts of precious metals and base
metals residues.
Various methods and options can be used for selective recovery of the target
metals from the leach solution, such as precipitation, solvent extraction,
cementation, ion exchange, adsorption, electrowinning, etc. These methods can
also be used in integrated pyrometallurgical processes (e.g. Umicore process). In
turn, electrorefining is the usual technique employed for purifying the product
leaving the anode furnace in the traditional pyrometallurgical treatment. In this
case, the fire-refined copper acts as an anode in an electrochemical cell where an
ultrapure copper sheet is used as a cathode. Copper ions from the anode are
deposited on the cathode. The less noble impurities than copper are dissolved and
remain in solution, while nobler ones precipitate on the bottom of the cell where
they are collected and sent to the precious metals refinery unit.
Cementation of precious metals, such as Au, Ag and Pd from H2SO4 or chloride
leach solutions using Cu/Zn/Al powders is a well-known and widespread process.

49
Since the 1890, zinc cementation has been used to recover gold from cyanide
solutions at commercial scale [48]. The major reactions involved during
cementation are the cathodic deposition of gold and anodic corrosion of zinc that
occurs at the surface of zinc particles.
2Au(CN)2- +2e
- → 2Au + 4CN
- (2.5.1)
Zn + 4CN- → Zn(CN)4
2- + 2e
- (2.5.2)
Cementation can also be employed for copper extraction by adding metallic iron in
leach solutions [19]. A widely experienced problem during displacement reaction is
the passivation of the reductant metal surface by forming a layer of metal oxide or
hydroxide, which inhibits the further advancement of redox reaction [74]. Others
significant drawbacks are the large consumption of cementing metal and the H2
generation in acidic environment.
One of the most common method to purify a solution from metals consists in
precipitating metal-ions by addition of NaOH, lime, etc. In the study by Yang et al.
[75], about 99% of Sn, Fe, Cu and Zn were precipitated at pH values of 1.5 for Sn,
3 for Fe, 6 for Cu and 8 for Zn, respectively. Besides, precipitation of PbSO4
occurred by adjusting the SO42-
/Pb2+
molar ratio at 1.4. Gold recovery by
precipitation from thiourea, thiosulfate and thiocyanate solutions is generally
conducted using sodium borohydride (NaBH4) as a reducing agent [76-77]. Several
reducing agents has been tested for gold precipitation from aqua regia leach
solution, such as ferrous sulfate (FeSO4), oxalic acid (H2C2O4), hydrazine (N2H4),
stannous chloride (SnCl2), sulfur dioxide (SO2), sodium sulfite (Na2SO3) and
sodium nitrite (NaNO2) [46, 78-80]. The reductants FeSO4, H2C2O4, and N2H4 were
compared in the study by Saadatjoo et al. [79]. The authors concluded that ferrous
sulfate reduces gold ions to metallic gold rapidly with high purity, but for higher
purities, oxalic acid could be a better choice. Guo et al. [67] reported the
purification of an alkaline leach solution using glucose for Cu precipitation, lime
for Sn, and finally, Na2S for Pb and Zn. Copper precipitation in the form of

50
CuSO4·5H2O starting from a sulphate leach solution can also be induced by an
evaporative crystallization rather than electrochemically [81-82].
Solvent extraction is a technique widely used both for base and precious metals
extraction from leach solutions. Compared to the other techniques, solvent
extraction has the advantage to be high selective towards specific metals. In the
mining sector, several systems have been investigated for gold extraction from
cyanide solutions, including organophosphorus derivatives, guanidine derivations,
and mixture of amines-organophosphorus derivatives [48]. Similar extractants have
also been investigated in the field of WPCBs recycling. LIX-79 diluted in cumene
and Cyanex 921 diluted in xylene are commercial extractants of gold from cyanide
solutions. The subsequent stripping of gold from the resulting solution can be
performed using NaOH or NaCN for LIX-79 and water or KCN for Cyanex 921.
Park and Fray [83] used toluene for gold extraction from aqua regia solutions
coming from leaching of WPCBs and then, dodecanethiol and sodium borohydride
solutions were used for gold nanoparticle formation. Chmielewski et al. [84]
selected diethyl malonate (C7H12O4) as the best extractant of gold from aqua regia
solutions with a saturation capacity of 140 g/l. As regards copper, extractants based
on oximes are widely used for its extraction from acidic sulfate-based leach
solutions in mining. In particular, modified aldoximes and aldoxime-ketoxime
mixtures are the most widely used copper extracting systems [85]. Generally, in
order to obtain high purity copper, solvent extraction is followed by stripping with
sulfuric acid and electrowinning, which is an electrolytic process for recovering
dissolved copper using an applied potential. Some specific oximes such as LIX 54
and LIX 64N were also used for extracting copper from ammonia-based leach
solutions. The same approach was tested in the field of WPCBs management. Yang
et al. [86] have recovered 99.6% of copper from ammonia-based leach solutions
using LIX 84 diluted in kerosene and copper was then stripped by sulfuric acid.
Finally, the authors obtained ultrafine copper particles with approximately 1.5 μm
diameter from the stripped solution using oleic acid as a surfactant and sodium
51
hypophosphite as a reductant. LIX 984 diluted in kerosene was successfully used
for copper extraction from acidic leach solution of HNO3 and the subsequent
stripping was carried out with either HNO3 or H2SO4 [87-88]. LIX 26 in decanol
was used to remove impurities such as Co, Ni, Zn, Al, Mn and Pb from
ammoniacal solution containing large amount of monovalent copper. Copper was
then recovered from the purified solution by electrowinning, while base metals
were stripped from the organic phase by sulfuric acid and recovered as their
respective sulfate [89].
Activated carbon has been used for gold adsorption from cynide solutions since
1946 in mining. Altansukh et al. [90] have extended the use of activated carbon to
the treatment of WPCBs. In particular, 98% of gold was adsorbed onto the
activated carbon from a pregnant solution resulting from a iodine/iodide leaching
of WPCBs under the following conditions: particle size of carbon, < 75 µm; carbon
dose, 1 g/L; pH of pregnant solution, 3.2; shaking speed, 140 rpm; temperature,
20°C; and time, 30 min. In the study, base metals were leached before precious
ones. Indeed, a previous step of base metal removing is often required because
activated carbon can also partially adsorb base metal ions [74]. Overall, adsorption
is still poorly applied in the field of WPCBs recycling.
In comparison with activated carbon, ion exchange allows to obtain higher
adsorption and Au recovery rates [74]. Commercial IEX resins have been
successful used in recovering gold from thiosulfate leach solution in mining. Gel
type resins with a polystyrene divinylbenzene matrix and quaternary ammonium
functional groups (e.g. Dowex G51, Dowex 21 K and amberlite IRA-410) have
also been investigated. Kim et al. [91] used Amberlite XAD-7HP to adsorb Au
from chlorine solution coming from leaching of WPCBs and reported that small
amount of copper was also co-loaded. To achieve higher selectivity of ion
exchange, many researchers are testing new resins, especially modified by
functional groups.

52
A few studies exist on the use of electrochemical techniques for gold recovery
from WPCBs. Lekka et al. [92] investigated direct electrodeposition of gold from
aqua regia leach solution in the presence of copper as possible interferent. They
obtained a compact deposit of pure gold by electrodeposition at 0.55 V vs
Ag/AgCl/KCl3M, but with low efficiency owing to the competitive reduction of
Cu2+
to CuCl2-. Kasper et al. [93] reported that 99% Au could be selectively
deposited over Cu from ammoniacal thiosulfate leach solution by controlling
potential in a range between -400 and -500 mV vs Ag/AgCl. Contrarily,
electrochemical methods, i.e. electrowinning and electrorefining, are the most used
techniques for obtaining pure copper from WPCBs, as seen above. From the
environmental point of view, electrochemical methods are superior in comparison
to the other purification techniques because the main reagent is electron that is
clean. However, the drawback of these methods is the selectivity.
2.6 Concluding remarks
Pryrometallurgical process is currently the most used method for WPCBs
recycling. The main driving force which has led some companies to invest in
pyrometallurgical processes is the possibility to treat e-waste directly in smelting
process together with other types of waste or with copper and lead concentrates.
However, the traditional smelting technologies give rise to the following limits:
1. Recovery of Fe and Al is not possible because they end up in the slag phase;
2. Recovery of plastic is not possible because it is burned and utilized as a
source of energy or as a reducing agent;
3. Ceramic component of e-waste can increase the volume of slag in the blast
furnaces increasing the risk of losing metals;
4. Only partial separation of metals can be achieved using pyrometallurgy.
Other complementary either hydrometallurgical or electrometallurgical steps
are subsequently necessary to obtain high-grade metals;

53
5. Great investments are required to maximize the recovery of valuable metals
and to control gas emission to protect the environment;
6. There is generation of hazardous gasses containing chlorinated and
brominated dioxins and furans. Besides, the flue dust can contain some
fraction of Zn, Pb, Sn, Cd and Hg due to the high processing temperatures.
Although pyrometallurgy has been improved in the last years, for example
adding a mechanical-physical pretreatment of e-waste, some pollution problems
are still inevitable. Biometallurgy could be a promising alternative; however, it
suffers from low reaction rate and low recovery efficiency. Certain
microorganisms treat only specific metals and the metal content that can be
treated is also limited. Besides, the reaction mechanisms at the base of
bioleaching and biosorption processes are still discussed. Therefore, the more
realistic alternative to the traditional pyrometallurgical approach is
hydrometallurgy. It is more selective towards metal recovery, easier to be
controlled and creates less environmental hazards than pyrometallurgical route.
The process does not generate gas emission, dust or slag to further treat. The
investment and operating costs are lower than the traditional pyrometallurgical
process. However, some limits still have to be overcome such as the consistent
loss of metals during mechanical and physical pretreatment of WPCBs, the
toxicity of cyanide-based leaching solutions and the high consumption of
reagent in the leaching not cyanide-based solutions. Besides, the removal of
base metals before leaching of precious ones involves the use of different
solvents resulting in large volumes of effluents to be disposed. The research
efforts are mainly focused on finding new less-polluting and low cost leaching
agents and reducing metal losses during operations. Probably, different
technologies should be integrated to meet the requirements of environmental
protection and industrial feasibility of WPCBs recycling.

54
Bibliography
[1] H. Duan, K. Hou, J. Li, X. Zhu, 2011, Examining the technology acceptance for
dismantling of waste printed circuit boards in light of recycling and environmental
concerns, Journal of Environmental Management 92, 392-399
[2] B. Ghosh, M.K. Ghosh, P. Parthi, P.S. Mukherjee, B.K. Mishra, 2015, Waste Printe
Circuit Boards recycling: an extensive assessment of current status, Journal of Cleaner
Production 94, 5-19
[3] J. Li, P. Shrivastava, Z. Gao, H.-C. Zhang, 2004, Printed Circuit Board Recycling:
A State-of-the-Art Survay, IEEE Transaction on Electronics Packaging Manufacturing
27, 33-42
[4] M.P. Luda, 2011, Recycling of Printed Circuit Boards. In: S. Kumar (Ed),
Integrated Waste Management 2nd Edition (pp. 285-298), InTech, Shanghai, China
[5] M. Kaya, 2018, Current WEEE recycling solution. In: F. Vegliò, I. Birloaga (Eds),
Waste Electrical and Electronic Equipment Recycling Aqueous Recovery Methods
(pp. 33-93), Woodhead Publishing
[6] S. Park, S. Kim, Y. Han, J. Park, 2015, Apparatus for electronic component
disassembly from printed circuit board assembly in e-waste, International Journal of
Mineral Processing 144, 11-15
[7] J. Lee, Y. Kim, J-C. Lee, 2012, Disassembly and physical separation of
electric/electronic components layered in printed circuit boards (PCB), Journal of
Hazardous Materials 241-242, 387-394
[8] P. Zhu, Y. Chen, L.Y. Wang, G.Y. Qian, M. Zhou, J. Zhou, 2012, A new
technology for separation and recovery of materials from waste printed circuit boards
by dissolving bromine epoxy resins using ionic liquid, Journal of Hazardous Materials
239-240, 270-278
[9] H. Huang, J. Pan, Z. Liu, S. Song, G. Liu, 2007, Study on Disassembling
Approaches of Electronic Components Mounted on PCBs. In: S. Takata, Y. Umeda
(eds) Advances in Life Cycle Engineering for Sustainable Manufacturing Businesses,
Springer, London
[10] X. Zhang, J. Guan, Y. Guo, X. Yan, H. Yuan, J. Xu, J. Guo, Y. Zhou, R. Su, Z.
Guo, 2015, Selective desoldering separation of Tin-Lead Alloy for Disamntling of
Electronic Components from Printed Circuit Boards, ACS Sustainable Chemistry &
Engineering 3, 1696-1700
[11] W. Layiding, X. Dong, M. Peng, D. Guanghong, 2005, Disassembling
Approaches and Quality Assurance of Electronic Components Mounted on PCBs,
Proceedings of the 2005 IEEE International Symposium on Electronics and the
Environment, 116-120
[12] K. Feldmann, H. Scheller, 1994, Disassembly of electronic products, electronics
and the environment, Proceedings of the 1994 IEEE International Symposium on
Electronics and The Environment, 81-86
[13] K. Feldmann, H. Scheller, 1995, The printed circuit board-A challenge for
automated disassembly and for the design of recyclable interconnect devices,
International Conference on Clean Electronics Products and Technology 415, 186-190

55
[14] J. Szalatkiewicz, 2011, Robotic disassembly of the waste of electrical and
electronic equipment (WEEE), based on the criteria of identification and analysis of
waste characteristics, presented on the example of computer hard disk drives, PLM11
8th International Conference on Product Lifecycle Management
[15] M. Kaya, 2016, Recovery of metals and nonmetals from electronic waste by
physical and chemical recycling processes, Waste Management 57, 64-90
[16] J. Hanafi, E. Jobiliong, A. Christiani, D.C. Soenarta, J. Kurniawan, J. Irawan,
2012, Material recovery and characterization of PCB from electronic waste, Procedia-
Social and Behavioral Sciences 57, 331-338
[17] S. Zhang, E. Forssberg, 1997, Mechanical separation-oriented characterization of
electronic scrap, Resources, Conservation and Recycling 21, 247-269
[18] C.L. Duan, Z.J. Diao, Y.M. Zhao, W. Huang, 2015, Liberation of valuable
materials in waste printed circuit boards by high-voltage electrical pulses, Minerals
Engineering 70, 170-177
[19] H. Cui, C.G. Anderson, 2016, Literature Review of Hydrometallurgical Recycling
of Printed Circuit Boards (PCBs), Journal of Advanced Chemical Engineering 6:142
[20] A. Kaliq, M.A. Rhamdhani, G. Brooks, S. Masood, 2014, Metal Extraction
processes for Electronic Waste and Existing Industrial Routes: A Review and
Australian Perspective, Resources 3, 152-179
[21] H.M. Veit, T.R. Diehl, A.P. Salami, J.S. Rodrigues, A.M. Bernardes, J.A.S.
Tenório, 2005, Utilization of magnetic and electrostatic separation in the recycling of
printed circuit boards scrap, Waste Management, 25, 67–74
[22] Y. Zheng, Z. Shen, C. Cai, S. Ma, Y. Xing, 2009, The reuse of nonmetals recycled
from waste printed circuir boards as reinforcing fillers in the polypropylene
composites, Journal of Hazardous Materials 163, 600-606
[23] D. Kell, 2008, Recycling and Recovery. In: R.E. Hester and R.M Harrison (Eds),
Electronic Waste Management (pp. 285-298), RSC Publishing
[24] J. Li, Z. Xu, Y. Zhou, 2007, Application of corona discharge and electrostatic
force to separate metals and nonmetals from crushed particles of waste printed circuit
boards, Journal of Electrostatic 65, 233-238
[25] K.C. Lai, S.K. Lim, P.C. The, K.H. Yeap, 2016, Modeling Electrostatic
Separation Process Using Artificial Neural Network (ANN), Procedia Computer
Science 91, 372-381
[26] E. Yazici, H. Deveci, I. Alp, 2010, Eddy Current Separation of Metals from E-
wastes, Proceedings of the XIIth International Mineral Processing Symposium, 1207-
1215
[27] P. Hadi, M. Xu, C.S.K Lin, C.-W. Hui, G. McKay, 2015, Waste printed circuit
board recycling techniques and product utilization, Journal of Hazardous Materials
283, 234-243
[28] P. Hadi, P. Gao, J.P. Barford, G. McKay, 2013, Novel application of the
nonmetallic fraction of the recycled printed circuit boards as a toxic heavy metal
adsorbent, Journal of Hazardous Materials 252-253, 166-170
[29] Y.-H Ke, E.-T. Yang, X. Liu, C.-L. Liu, W.-S. Dong, 2013, Preparation of porous
carbons from non-metallic fractions of waste printed circuit boards by chemical and
physical activation, New Carbon Materials 28, 108-114

56
[30] W.J. Hall, P.T. Williams, 2007, Separation and recovery of materials from scrap
printed circuit boards, Resource, Conservation and Recycling 51, 691-709
[31] R. Wang, Z. Xu, 2014, Recycling of non-metallic fractions from waste electrical
and electronic equipment (WEEE): A review, Waste Management 34, 1455-1469
[32] G. Bidini, F. Fantozzi, P. Bartocci, B. D’Alessandro, M. D’Amico, P. Laranci,
2015, Recovery of precious metals from scrap printed circuit boards through pyrolysis,
Journal of Analytical and Applied Pyrolysis 111, 140-147
[33] X. Guo, F.G.F. Qin, X. Yang, R. Jiang, 2014, Study on low-temperature pyrolysis
of large-size printed circuit boards, Journal of Analytical and Applied Pyrolysis 105,
151-156
[34] F.R Xiu, Y. Qi, F.S. Zhang, 2013, Recovery of metals from waste printed circuit
boards by supercritical water pre-treatment combined with acid leaching process,
Waste Management 33, 1251-1257
[35] F.R. Xiu, F.S. Zhang, 2010, Materials recovery from waste printed circuit boards
by supercritical methanol, Journal of Hazardous Materials 178, 628-634
[36] Y. Chen, H. Wang, K. Lin, Y. Yang, 2000, Oxidation of printed circuit board
wastes in supercritical water, Water Research34, 4279-4283
[37] A. Mecucci and K. Scott, 2002, Leaching and electrochemical recovery of copper,
lead and tin from scrap printed circuit boards, Journal of Chemical Technology and
Biotechnology 77, 449-457
[38] T. Kinoshita, S. Akita, N. Kobayashi, S. Nii, F. Kawaizumi, K. Takahashi, 2003,
Metal recovery from non-mounted printed wiring boards via hydrometallurgical
processing, Hydrometallurgy 69, 73-79
[39] H.M. Veit, A.M. Bernardes, J. Z. Ferreira, J.A.S. Tenorio, C. de Fraga Malfatti,
2006, Recovery of copper from printed circuit boards scraps by mechanical processing
and electrometallurgy, Journal of Hazardous Materials B137, 1704-1709
[40] E.-Y. Kim, M.-S. Kim, J.-C. Lee, J. Jeong, B.D. Pandey, 2011, Leaching kinetics
of copper from waste printed circuit boards by electro-generated chlorine in HCl
solution, Hydrometallurgy 107, 124–132
[41] I. Birlonga, I. De Michelis, F. Ferella, M. Buzatu, F. Vegliò, 2013, Study on the
influence of various factors in the hydrometallurgical processing of waste printed
circuit boards for copper and gold recovery, Waste Management 33, 935-941
[42] S. Fogarasi, F. Imre-Lucaci, P. Ilea, A. Imre-Lucaci, 2013, The environmental
assessment of two new copper recovery processes from waste printed circuit boards,
Journal of Cleaner Production 54, 264-269
[43] K. Koyama, M. Tanaka, J.-C. Lee, 2006, Copper Leaching Behaviour from Waste
Printed Circuit Board in Ammoniacal Alkaline Solution, Materials Transaction 47, No.
7, 1788-1792
[44] R. Liu, R.S Shieh, Ruth Y. L. Yeh, C. H. Lin, 2009, The general utilization of
scrapped PC board, Waste Management 29, 2842-2845
[45] M.S. Alam, M. Tanaka, K. Koyama, T. Oishi, J.-C. Lee, 2007, Electrolyte
purification in energy-saving monovalent copper electrowinning processes,
Hydrometallurgy 87, 36-44
[46] P.P. Sheng and T.H. Etsell, 2007, Recovery of gold from computer circuit board
scrap using aqua regia, Waste Management & Research 25, 380-383

57
[47] G. Senanayake, 2004, Gold leaching in non-cyanide lixiviant systems: critical
issues on fundamentals and applications, Minerals Engineering 17, 785-801
[48] J. Cui, L. Zhang, 2008, Metallurgical recovery of metals from electronic waste: A
review, Journal of Hazardous Materials 158, 228-256
[49] A. Akcil, C. Erust, C.S. Gahn, M. Ozgun, M. Sahin, A. Tuncuk, 2015, Precious
metal recovery from waste printed circuit boards using cynide and non-cynide
lixiviants- A review, Waste Management 45, 258-271
[50] C.H Lee, L.W. Tang, S.R Popuri, 2011, A study on the recycling of scrap
integrated circuits by leaching, Waste Management & Research 29, 677-685
[51] J. Ficeriova, P. Balaz, E. Dutkova, E. Gock, 2008, Leaching of gold and silver
from crushed Au-Ag wastes, Open Chemistry Journal 2, 6-9
[52] J. Ficeriova, P. Balaz, E. Gock, 2011, Leaching of gold, silver and accompanying
metals from circuit boards (PCBs) waste, Acta Montanistica Slovaca 16, 128-131
[53] C.J. Oh, S.O. Lee, H.S. Yang, T.J. Ha, T.J. Kim, 2003, Selective leaching of
valuable metals from waste printed circuit boards, Journal of the Air & Waste
Management Association 53, 897-902
[54] E.-Y. Kim, M.-S. Kim, J.-C. Lee, B. Pandey, 2011, Selective recovery of gold
from waste mobile phone PCBs by hydrometallurgical process, Journal of Hazardous
Material 198, 206-215
[55] D. Pilone, G.H. Kelsall, 2013, Metal Recovery from Electronic Scrap by Leaching
and Electrowinning IV. In: C. Young, A. Alfantazi, C. Anderson, A.J.D. Dreisinger,
B. Harris (Eds), Electrometallurgy and Environmental Hydrometallurgy (pp. 1565-
1575), John Wiley & Sons
[56] E.T Lister, P. Wang, A. Anderko, 2014, Recovery of critical and value metals
from mobile electronics enabled by electrochemical processing, Hydrometallurgy 149,
228-237
[57] Q. Xu, D.H. Chen, L. Chen, M.H. Huang, 2009, Iodine leaching process for
recovery of gold from waste PCB, Chinese Journal of Envionmental Engineering 3,
911–914.
[58] F.-R. Xiu, Y. Qi, F.-S. Zhang, Leaching of Au, Ag, and Pd from waste printed
circuit boards of mobile phone by iodide lixiviant after supercritical water pre-
treatment, Waste Management 41, 134-141
[59] E.Y. Yazici, H. Deveci, 2015, Cupric chloride leaching (HCl–CuCl2–NaCl) of
metals from waste printed circuit boards (WPCBs), International Journal of Mineral
Processing 134, 89-96
[60] P. Zhou, Z. Zheng, J. Tie, 2005, Technological process for extracting gold, silver
and palladium from electronic industry waste, Chinese Patent, CN1603432A (C22B
11/00)
[61] E.Y. Yazici, H. Deveci, 2014, Ferric sulphate leaching of metals from waste
printed circuit boards, International Journal of Mineral Processing 133, 39–45
[62] E.Y. Yazici, H. Deveci, 2013, Extraction of metals from waste printed circuit
boards (WPCBs) in H2SO4-CuSO4-NaCl solutions, Hydrometallurgy 139, 30-38

58
[63] E.Y. Yazici, H. Deveci, 2016, Extraction of Metals from Waste of Printed Circuit
Boards (WPCB) in Sulphate and Chloride Solutions, 15th International Mineral
Processing Symposium, 1231-1245
[64] A. Gurgul, W. Szczepaniak, M. Zabłocka-Malicka, 2018, Incineration and
pyrolysis vs. steam gasification of electronic waste, Science of the Total Environment
624, 1119–1124
[65] B.Ebin, M.I. Isik, 2016, Pyrometallurgical Processes for the Recovery of Metals
from WEEE. In: A. Chagnes, C. Ekberg, T. Retegan, G. Cote, M. Nilsson (Eds),
WEEE Recycling Research, Development, and Policies (pp. 107-137), Elsevier
[66] L. Flandinet, F. Tedjar, V. Ghetta, J. Fouletier, 2012, Metals recovering from
waste printed circuit boards (WPCBs) using molten salts, Journal of Hazardous
Material 213, 485-490
[67] X. Guo, J. Liu, H. Qin, Y. Liu, Q. Tian, D. Li, 2015, Recovery of metal values
from waste printed circuit boards using an alkali fusion-leaching-separation process,
Hydrometallurgy 156, 199-205
[68] J. Wang, J. Bai, J. Xu, B. Liang, 2009, Bioleaching of metals from printed wire
boards by Acidithiobacillus ferrooxidans and Acidithiobacillus thiooxidans and their
mixture, Journal of Hazardous Materials 172, 1100-1105
[69] T. Yang, Z. Xu, J. Wen, L. Yang, 2009, Factors influencing bioleaching copper
from waste printed circuit boards by Acidithiobacillus ferrooxidans, Hydrometallurgy
97, 29-32
[70] E. Karwowska, D. Andrzejewska-Morzuch, M. Łebkowska, A. Tabernacka, M.
Wojtkowska, A. Telepko, A. Konarzewska, 2014, Bioleaching of metals from printed
circuit boards supported with surfactant-producing bacteria, Journal of Hazardous
Materials 264, 203-210
[71] M.A. Faramarzi, M. Stagars, E. Pensini, W. Krebs, H. Brandl, 2004, Metal
solubilization from metal-containing solid materials by cyanogenic Chromobacterium
violaceum, Journal of Biotechnology 113, 321-326
[72] L. Zhang, Z. Xu, 2016, A review of current progress of recycling technologies for
metals from waste electrical and electronic equipment, Journal of Cleaner Production
127, 19-36
[73] N.J. Creamer, V.S. Baxter-Plant, J. Henderson, M. Potter, M. Macaskie, 2006,
Palladium and gold removal and recovery from precious metal solutions and electronic
scrap leachates by Desulfovibrio desulfuricans, Biotechnology Letters 28, 1475-1484
[74] H. Li, J. Eksteen, E. Oraby, 2018, Hydrometallurgical recovery of metals from
waste printed circuit boards (WPCBs): Current status and perspectives- A review,
Resources, Conservation & Recycling 139, 122-139
[75] C. Yang, J. Li, Q. Tan, L. Liu, Q. Dong, 2017, Green process of metal recycling:
co-processing waste printed circuit boards and spent tin stripping solution, ACS
sustainable chemistry & engineering 5 (4), 3524-3534
[76] A. Behnamfard, M.M. Salarirad, F. Veglio, 2013, Process development for
recovery of copper and precious metals from waste printed circuit boards with
emphasize on palladium and gold leaching and precipitation, Waste Management 33
(11), 2354-2363

59
[77] F.T Awadalla, G.M Ritcey, 1991, Recovery of gold from thiourea thiocyanate or
thiosulfate solutions by reduction-precipitation with a stabilized form of sodium
borohydrate, Separation Science and Technology 26 (9), 1207-1228
[78] S. Dimitrijević, V. Trujić, A. Ivanović, S. Dimitrijević, M. Mirić, 2013, Recycling
of Precious Metals from E-scrap, Iranian Journal of Chemistry and Chemical
Engineering 32 (4), 17-23
[79] N. Saadatjoo, H. Heyndari, A. Abdullahi, M. Behzad, 2013, Recovery of gold
from computer board scraps: the study of the effect of different reductants, Journal of
Applied Chemistry 8 (27), 55-60
[80] J. Brug, E. Heidelberg, 1974, Recovery of gold from solution in aqua regia,
United State Patent, US 3856507 A
[81] Z. Ping, F. ZeYun, L. Jie, L. Qianga, Q. GuangRena, Z. Ming, 2009,
Enhancement of leaching copper by electro-oxidation from metal powders of waste
printed circuit board, Journal of Hazardous Materials 166, 746–750
[82] H.Yang, J. Liu, J. Yang, 2011, Leaching copper from shredded particles of waste
printed circuit boards, Journal of Hazardous Materials 187 (1-3), 393-400
[83] Y.J. Park, D.J. Fray, 2009, Recovery of high purity precious metals from printed
circuit boards, Journal of Hazardous Material 164, 1152-1158
[84] A.G. Chmielewski, T.S Urbanski, W. Migdal, 1997, Separation technologies for
metals recovery from industrial waste, Hydrometallurgy 45 (3), 333-344
[85] K.C. Sole, 2008, Solvent extraction in the hydrometallurgical processing and
purification of metals: process design and selected applications. In: M. Aguilar, J.L.
Cortina (Eds), Solvent Extraction and Liquid Membranes Fundamentals and
Applications in New Materials (pp. 141-200), CRC Press
[86] J.-G. Yang, Y.-T. Wu, J. Li, 2012, Recovery of ultrafine copper particles from
metal components of waste printed circuit boards, Hydrometallurgy 121–124, 1–6
[87] T. Kinoshitaa, S. Akita, N. Kobayashi, S. Niib, F. Kawaizumi, K. Takahashi,
2003, Metal recovery from non-mounted printed wiring boards via hydrometallurgical
processing, Hydrometallurgy 69, 73–79
[88] H.L Le, J. Jeong, J.-C. Lee, B.D. Pandey, J.-M. Yoo, T.H. Huyunh, 2011,
Hydrometallurgical process for copper recovery from waste printed circuit boards
(PCBs), Mineral Processing & Extractive Metallurgy Review 32, 90–104
[89] M.S. Alam, M. Tanaka, K. Koyama, T. Oishi, J.-C. Lee, 2007, Electrolyte
purification in energy-saving monovalent copper electrowinning processes,
Hydrometallurgy 87 (2007) 36–44
[90] B. Altansukh, K. Haga, N. Ariunbolo, S. Kawamura, A. Shibayama, 2016,
Leaching and Adsorption of Gold from Waste Printed Circuit Boards Using Iodine
Iodide Solution and Activated Carbon, Engineering Journal 20 (4), 30-40
[91] E.-Y. Kim, M.-S. Kim, J.-C. Lee, B. Pandey, 2011, Selective recovery of gold
from waste mobile phone PCBs by hydrometallurgical process, Journal of Hazardous
Material 198, 206-215
[92] M. Lekka, I. Masavetas, A.V. Benedetti, A. Moutsatsou, L. Fedrizzi, 2015, Gold
recovery from waste electrical and electrochemical equipment by electrodeposition: A
feasibility study, Hydrometallurgy 157, 97-106

60
[93] A.C. Kasper, J. Carrillo Abad, M. Garcia Gabaldn, H.M. Veit, V. Perez Herranz,
2016, Determination of the potential gold electrowinning from an ammoniacal
thiosuphate solution applied to recycling of printed circuit board scraps, Waste
Management & Research 34 (1), 45-57

61
Chapter 3
Copper recovery from the urban mine of WPCBs
Introduction
Electronic waste, in particular discarded PCBs, is a promising secondary source
of metals. Cu is the predominant metal by weight along with substantial amounts of
other base and precious metals. Copper content in WPCBs ranges between 12%
and 29% by weight while that in ore deposits between 0.5% and 3%, therefore
WPCBs can be considered as a modern urban mine of copper.
In the last few years, the demand of copper has increased dramatically. Copper
is widely used in a multitude of different applications due to its unique and
exceptional properties. In order to meet the future demand of copper and preserve
the natural resources, a key role could be played by WPCBs recycling.
The first section of the chapter deals with the importance of copper for human
life, reporting updated data on copper production, consumption and long-term
availability. The second section of the chapter is dedicated to the description of the
methods currently used in the mining industry for copper extraction from the
natural deposits. This part is relevant because most of the techniques used in the
primary copper production subsequently have been extended to the treatment of
WPCBs. The third section provides a comprehensive review of all methodologies
used for the recovery of copper from WPCBs, reporting the main innovations in the
field of pyrometallurgy, hydrometallurgy and biometallurgy. Besides, the new
entirely electrometallurgical processes will be presented.

62
3.1 About copper
Copper is one of the few metals that can be found in nature in a directly usable
metallic form (native metal). This led to very early human use in several regions. It
is estimated that copper has been in use by civilization for over 10.000 years. A
copper pendant discovered in what is now northern Iraq has been dated to about
8,700 B.C. Copper was the first metal to be smelted from sulfide ores, c. 5000
B.C., the first metal to be cast into a shape in a mold, c. 4000 B.C. and the first
metal to be purposefully alloyed with another metal, tin, to create bronze, c. 3500
B.C. Currently, over 400 copper alloys are in use, each with a unique combination
of properties to suit many applications, manufacturing processes and environments.
The Egyptians had many uses of copper and in their culture, copper represented
eternal life. In the Roman era, copper was principally mined on Cyprus, indeed, the
name of the metal comes from the Latin word cuprum, meaning “from the island of
Cyprus.”
Copper is vital to the health of humans, animals and plants and is an essential
part of the human diet. Copper-rich foods include dried beans, almonds, broccoli,
chocolate, garlic, soybeans, peas, whole wheat products and seafood. Virtually,
every cell in the body utilizes copper and, together with iron and zinc, copper
makes up the trio of minerals essential to our well-being. The adult body contains
between 1.4 and 2.1 mg of copper per kilogram of body weight [1].
Copper boasts of a combination of properties that make it versatile, unique and
irreplaceable in many applications. Copper is the best conductor of electricity
except for silver. Its electrical and thermal conductivity, along with properties of
high ductility and malleability make it one of the most demanded metals by
industry, eclipsed only by iron and aluminum. From common household electrical
wiring to boat propellers and from photovoltaic cells to saxophones, copper and its
alloys are employed in a multitude of end-uses. Copper is also corrosion resistant,
antimicrobial and infinitely recyclable without any loss of performance. It is

63
estimated that 80 percent of all mined copper during the past 10,000 years is still in
use somewhere today [2]. About 33% of the current world annual copper demand is
supplied by recycled copper.
The Copper Development Association (CDA) [1, 3] classified the applications
of copper in four end-use sectors: electrical, construction, transport, and other. The
percentage of global copper production consumed by each sector is estimated by
the CDA to be:
65% Electrical, copper is used in electronic connectors, printed circuit
boards, semi-conductors, micro-chips, circuitry wiring and contacts, etc.;
25% Construction, copper is used in the tubes for drinking water, in
seawater feed lines, in the tubes for heat exchangers in chemical plants,
etc.;
7% Transport, copper is used in motors and wiring, springs, steering
systems, avionics, etc.;
3% Other, copper is used in musical instruments, coinage, art,
architecture, etc.
As it can be seen, copper application areas cover a wide variety of different
disciplines. For example, the total weight of copper in a vehicle ranges from 15 Kg
for a small car to 28 kg for a luxury car; high-speed trains use 10 tonnes of copper
per km of track; 2% of an airliner's weight can be attributed to copper [2].
In nature, copper occurs in a variety of minerals, including native copper, copper
sulfides such as chalcopyrite (CuFeS2), bornite (Cu5FeS4), digenite (Cu9S5),
covellite (CuS), and chalcocite (Cu2S), copper carbonates such as azurite
(Cu3(CO3)2(OH)2), and malachite (Cu2CO3(OH)2), and copper oxides such as
cuprite (Cu2O) and tenorite (CuO). The most abundant minerals are chalcopyrite
and bornite, which cover 80% of currently known deposits. Ore grade and mineral
composition vary depending on the type of mineralization. Most mines operate
with copper concentrations between 0.2 and 0.8%, some of the richest ore bodies,

64
located in central to South Africa, can contain 5-6% of copper. A broad
classification of copper deposits is on the ways of deposits formation. According to
this classification, there are two important types of copper deposits: porphyry
copper and sediment-hosted copper. Porphyry copper deposits, which are
associated with igneous intrusions, yield about two-thirds of the world's copper and
are therefore the most important types of copper deposit [4]. Sediment-hosted
copper deposits, which are contained in sedimentary rocks, account for
approximately one-fourth of the world's identified copper resources. In Figure 3.1.1
a global copper map is reported showing the distribution of porphyry copper and
sediment-hosted copper deposits around the world. As it can be seen, large
porphyry copper deposits are found in mountainous regions of western North
America and in the Andes Mountains of South America.
Figure 3.1.1 Distribution of known porphyry copper deposits and sediment-hosted copper deposits around the world. Released by USGS in July 2016 [5]
United States were the largest producers of copper until 2000 then the primacy
passed to Chile. As it can be seen from Figure 3.1.2, North America copper
production declined from 36% in 1960 to 13% in 2017. In contrast, Latin America
exhibited a significant growth during the same period. In 2017, about 42% of the
total copper mine production was attributed to Andes Mountains.
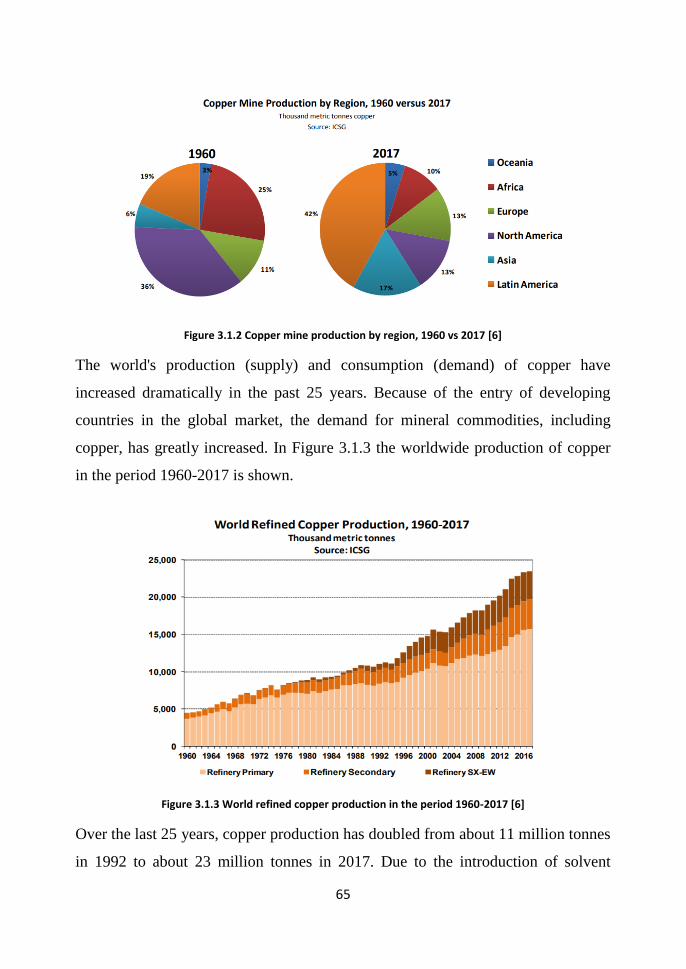
65
Figure 3.1.2 Copper mine production by region, 1960 vs 2017 [6]
The world's production (supply) and consumption (demand) of copper have
increased dramatically in the past 25 years. Because of the entry of developing
countries in the global market, the demand for mineral commodities, including
copper, has greatly increased. In Figure 3.1.3 the worldwide production of copper
in the period 1960-2017 is shown.
Figure 3.1.3 World refined copper production in the period 1960-2017 [6]
Over the last 25 years, copper production has doubled from about 11 million tonnes
in 1992 to about 23 million tonnes in 2017. Due to the introduction of solvent

66
extraction‐electrowinning technology, refined copper worldwide production from
leaching ores has increased from less than 1% in the late 1960’s to 16% in 2017.
Besides, secondary copper refined production reached 17% of the total copper
refined production in 2017. About copper consumption by region, interesting
results are reported by the United States Geological Survey (USGS) for the period
1980-2012 [5]. Copper consumption in emerging economies, such as China and India,
increased considerably from 1980 to 2012 (Figure 1.3.4). Until 2002, the United
States were the leading copper consumer and annually used about 16% of total
world refined copper, but have been overtaken by China from 2002. The booming
economy in China contributed to quadrupling its annual refined copper
consumption during the 12 years from 2000 to 2012.
Figure 3.1.4 Global copper consumption [5]
The future availability of minerals is based on the distinction between reserves and
resources. Reserves are deposits that have been discovered, evaluated and assessed
to be economically profitable. Resources are far greater and include reserves,
discovered deposits which are potentially profitable and undiscovered deposits that
are predicted, based on preliminary geological surveys [2].

67
Figure 3.1.5 2017 World copper reserves and mine production
According to the USGS data [5], copper reserves currently amount to around 790
million tonnes while identified and undiscovered copper resources are estimated to
be around 2,100 Mt and 3,500 Mt, respectively (Figure 3.1.5). The latter does not
consider the vast amounts of copper found in deep sea nodules and land‐based and
submarine massive sulfides. On average, 40 years of copper reserves and over 200
years of resources left have always been estimated since 1950 [5]. It is important to
note that current and future exploration will increase both reserves and resources.
Besides, a significant contribute will also be supplied from the amount of copper
that is already in use today thanks to recycling of end of life products. Indeed, to
ensure that a sufficient quantity of copper will be available to meet the future
demand, it is necessary to increase the level of recycling. In this context, copper-
rich wastes, such as PCBs wastes, will become ever more important in the future.
3.2 Copper mining
Copper ore is extracted using three different techniques depending on the
characteristic and geographic location of the ore body. Open-pit mining is the most
common technique and consists in extracting rock or minerals from the earth by

68
their removal from an open pit. This technique is appropriate for near-surface
(<100m) ore [7]. Underground mining methods are used to extract minerals from
deep in the earth, sinking a vertical shaft into the earth to reach the copper ore and
driving horizontal tunnels into the earth. The third method consists in pumping a
weak sulfuric acid leaching solution through boreholes drilled into a deposit to
dissolve copper. The solution containing the dissolved ore is then pumped up to the
surface and processed.
After extraction, the ore is crushed, ground into powder and concentrated up to
25-35% copper content. The ore is enriched using a process called froth flotation
where the undesired material (named gangue) sinks to the bottom and is removed.
Once the copper has been concentrated, it can be converted into pure metal by
Pyrometallurgical processes, including smelting and electrolytic refining;
Hydrometallurgical processes, including leaching, solvent extraction and
electrowinning.
Currently, hydrometallurgy is primarily used only for oxide ores. However, some
studies on extraction of copper from primary sulfides by hydrometallurgy are
ongoing. Hydrometallurgical processes have many advantages over
pyrometallurgical ones, including: i) the possibility of processing lower grade ore,
ii) the possibility of operating at low temperatures obtaining higher energy
efficiencies, iii) a lower environmental impact because no waste gases are given
off, iv) low capital and operational costs which make hydrometallurgy more
economical for smaller scale operations.
The following stages are involved in pyrometallurgical process: roasting,
smelting, converting and fire refining. Matte copper (35-68 wt.% Cu) is firstly
produced by smelting. It consists mainly of copper and iron sulphides, then blister
copper (97-99 wt.% Cu) is produced by converting and finally anode copper (99.5
wt.% Cu) by fire refining. The anode copper can be further purified to 99.95-
99.96% by electrolytic refining. The roasting process is generally conducted in

69
reverberatory furnaces. In the roaster, the copper concentrates are heated to about
650°C and partially oxidized to remove most of the sulfur as SO2 gas, which can be
captured and converted in sulfuric acid. This operation is no longer used and direct
smelting is now preferred. Smelting is carried out at 1000-1500°C in the presence
of air or oxygen-enriched air in a variety of furnaces such as reverberatory
furnaces, flash furnaces, IsaSmelt furnaces etc. The purpose of such operation is
that to eliminate as much of the undesired iron, sulfur and gangue minerals (such as
silica, magnesia, alumina and limestone) as possible. This is achieved by adding
silica, which traps iron oxide formed during oxidation of iron sulfides in a separate
slag. The slag forming reaction is
FeO + SiO2 → FeO·SiO2 (3.2.1)
Slag is less dense than matte, so it can be easily removed and discarded because it
forms a layer that floats on top of the matte. The so obtained matte copper contains
mainly copper and iron sulfides which are converted to oxides by blowing air
through the molten matte in the converter. This produces so much SO2 that can be
captured to make sulfuric acid. A silica and lime flux is added to separate iron with
the slag leaving blister copper. The blister copper is put into an anode furnace
where it is converted to anode-grade copper in two stages by removing most of the
remaining sulfur and iron, and then removing oxygen introduced during the first
stage. The second stage is carried out by blowing natural gas, or some other
reducing agent, through the molten copper oxide. The anodes cast during the fire
refining are immersed in an aqueous solution of copper sulfate and sulfuric acid
and refined by electrolysis. At the anode, copper and less noble metals dissolve.
Nobler metals such as silver, gold, selenium, and tellurium settle to the bottom of
the cell as an anode slime. Copper(II) ions move through the electrolyte to the
cathode where they are deposited on a pure copper foil. Less noble metals than
copper remain dissolved in solution without interfering at cathode.

70
The production of high-purity copper by a combination of leaching, solvent
extraction and electrowinning for the primary processing of copper has enjoyed
spectacular growth over the past 35 years. Approximately 20% of all copper
currently produced worldwide is obtained by leaching mainly of oxide ores. The
operating cost of this process is typically 30% less per kg of cathodic copper than
conventional pyrometallurgical production [8]. Generally, weak sulfuric acid is
used as a leaching agent for copper dissolution from its minerals. The resulting
solution, known as pregnant leach solution, is recovered and then contacted with
an organic solvent, referred to as the extractant in the solvent extraction stage.
Here, the copper is extracted away from the leach solution leaving behind most of
the impurities. The most used extractantans of copper from sulphate liquors are
known as oximes. The basic structures of the oximes are shown in Figure 3.2.1,
where A = H is for aldoximes and A = CH3 for ketoximes. The R-chain is usually
C9H19 and occasionally C12H25. The complexation of copper by these extractants is
shown in Figure 3.2.1.
Figure 3.2.1 Copper oxime extractants and mechanism of copper complexation by oxime extractants [8]
Since the complexation is an un-complete reaction, copper can be stripped from the
organic phase by the contact with a strongly acidified aqueous solution according
to Le Chatelier’s principle. The resulting purified solution can be transferred to the

71
final electrowinning stage for obtaining pure copper deposits at the cathode of the
electrolytic cell. The first commercial extractants were all based on ketoximes (e.g.
LIX 63, LIX 65, LIX 65N etc.), but they were replaced by the second generation of
extractants based on aldoximes. Aldoximes exhibit very fast extraction kinetics,
high selectivity towards copper and high loading capacity. Copper selectivity over
iron is about 2000:1, while that of ketoximes is about 300:1. However, they extract
at pH values below 1 making the stripping of copper difficult. Aldoximes are
therefore combined with polar organic compounds, known as modifiers, so that
copper can be stripped at the typical acid strength of spent electrolyte coming from
electrowinning (~180 g/l H2SO4) [8]. A third class of extractants is represented by
mixtures of aldoximes and ketoximes. Today, modified aldoximes and aldoxime–
ketoxime mixtures are the most widely used copper extractants. The most common
copper extractants in commercial use today are shown in Table 3.2.1.
Table 3.2.1 Main copper extractants in commercial use today [8]
Leaching of copper has also been performed by either ammoniacal solutions or
particular strains of bacteria. The Arbiter plant in Anaconda, Montana, used an
ammoniacal leaching solution to dissolve copper from sulfide concentrates and LIX
64N asan extractant of copper from the leach solution [8]. More recently, BHP

72
Minerals (now BHPBilliton) developed the Escondida process in which copper
concentrates are leached with ammonia and ammonium sulfate, and then purified
by solvent extraction with LIX 54, which is a β-diketone having an higher copper
loading capacity (~30 g/l) than ketoximes. Bioleaching is used in synergy with
solvent extraction/electrowinning process for low-grade sulfide copper minerals.
Modern commercial application of bacterial leaching began in the 1950s at
Kennecott's Bingham mine near Salt Lake City, Utah [1]. Following early
development work and application in the United States, Chile has become a major
developer of bioleaching on an industrial scale. Generally, the capital cost of a
bioleaching operation is considerably less, by about 50%, than that of a
conventional pyrometallurgical process. Sulphide minerals are insoluble in water or
acid solutions unless they are first oxidized. The kinetics of the oxidation process
can be considerably improved by the introduction of Thiobacillus
ferrooxan and Thiobacillus thiooxan bacteria into the system. The former catalyzes
the oxidation of iron whereas the latter catalyzes the oxidation of sulphur. There are
two dominant views on the mechanisms involved in bioleaching. According to the
first one, the overall leaching process occurs by microbial oxidation of ferrous ions
to ferric followed by the chemical oxidation of the sulphide mineral by the ferric
ions. The microorganisms play also the role of regenerating Fe3+
from Fe2+
. This is
known as the indirect mechanism and can be described by the following equations
[9]
MS + 2Fe3+→ M
2+ +2Fe
2+ +S
0 (3.2.2)
2Fe2+
+0.5O2 +2H+→ 2Fe
3+ +H2O (3.2.3)
According to the second view, microorganisms directly oxidize minerals and
solubilize metals. The reactions are [9]
MS + H2SO4 +0.5O2→ MSO4 +S0 +H2O (3.2.4)
S0 +1.5O2 +H2O → H2SO4 (3.2.5)

73
In practice, metals can be dissolved from minerals directly by the metabolism of
the cell or indirectly by the metabolic products. However, the model of direct and
indirect leaching is still under discussion. Several researches reported that some
fungal strains such as Aspergillus niger and Penicillium simplicissimum can be
used for bioleaching of copper from primary resources. Fungi-assisted leaching
does not rely on microbial oxidation of metal but rather uses microbial metabolism
as a source of acids that directly dissolve the metal.
Most of the techniques used to extract copper from the minerals have been
extended also for its extraction from wastes, being well-known and consolidated. A
comprehensive description of all techniques applied for copper extraction from
waste of PCBs will be reported in the following.
3.3 Recycling of copper from WPCBs
WPCBs can contain up to 40 different metallic elements [10]. Among these,
copper is the most abundant. Copper concentration in WPCBs ranges between 12%
and 29% by weight. Considering that copper concentration in ores ranges between
0.5% and 3% [11], WPCBs can be considered as an urban copper mine. Due to its
high content in WPCBs, copper recovery could play a key role in economic balance
of recycling plants, although it has lower added value than precious metals. From
industrial point of view, the typical approach adopted for WPCBs recycling
consists in pyrometallurgical processes. However, the relevant problems associated
to this approach, discussed in the second chapter, have encouraged the research to
develop new processes based on hydrometallurgical, biometallurgical and
electrometallurgical techniques or on a combination of these. From the literature, it
can be found a typical approach adopted for copper recovery from WPCBs that
generally includes the phases reported in the scheme of Figure 3.3.1. It is important
to point out that several variations to the flowsheet of Figure 3.3.1 can be found in
the literature, such as the processes based on biometallurgy. However, the most

74
used technique consists in dissolving copper by means of a leaching agent and then
recovering copper from the leach liquor directly by electrowinning or after a
purification step.
Figure 3.3.1 Possible paths of a typical copper recovery process from WPCBs
According to the literature [12-14], electrolysis is an ideal process to recover
copper due to its simple flowsheet, low energy consumption, high output and low
environmental pollution. For this reason, new and entirely electrometallurgical
processes have been developed in the last few years in order to minimizing the
number of unit operations involved in WPCBs recycling, the use of solvents and
therefore, the environmental impact and energy consumption. Besides, Figure 3.3.1
shows that both mechanical processing of WPCBs and separation/recovery of the
non-metallic fraction through either physical or chemical methods can be avoided.
Indeed, in order to simplify the recovery process and to avoid the loss of metals
during the pre-treatment of WPCBs, some authors reported the use of large pieces

75
of WPCBs having a surface ranging from 10 to 25 cm2
[15-19], which can be
directly processed either by leaching [16, 17] or electrochemically [15] after the
solder mask removal by means of NaOH or H2SO4 concentrated solutions. In other
cases, the large pieces of WPCBs are pre-treated by pyrolysis before leaching [18]
or bioleached directly [19].
The current technologies on copper recovery from WPCBs will be better
discussed in the following with particular attention towards the hydrometallurgical
and earlier electrometallurgical routes.
3.3.1 Pyrometallurgical route
The classical approach industrially adopted for copper recovery from WPCBs
consists in combining pyrometallurgical stage with electrochemical refining unit.
The recycling plants introduce WPCBs into the smelting stage of copper or lead
concentrates after a minimum pre-treatment. Contrarily, the new smelting plants
use an integrated approach in which pyrometallurgical, hydrometallurgical and
electrometallurgical techniques are combined together [9, 20-21]. The Umicore
process represents an example of integrated pyrometallurgical approach. In the new
plants, the e-waste is thermally treated together with other metallic scrap and not
with copper or lead concentrates. The smelting stage is carried out under reducing
conditions and the product is impure copper named black copper, containing
approximately 60-85% by weight of copper. A schematic representation of a
pyrometallurgical process for e-waste recycling is shown in Figure 3.3.1.1. After
smelting, the stages of the process are equivalent to those of primary copper
production and include refining of the black copper by oxidation in a converter,
fire-refining to produce anode-grade copper and electrolytic refining to reach a
copper purity of more than 99.9%. The anodic slime leaving the electrorefining unit
is further treated for the recovery of precious metals. In Umicore process, the black
copper is treated by leaching followed by electrowinning.

76
In the last few years, pyrometallurgical technology has been significantly up-
dated mainly in improving treatment of waste gas in smelting and refining stages
and addition of the mechanical-physical pre-treatment of e-waste.
Figure 3.3.1.1 A schematic flow sheet of a typical pyrometallurgical process for WPCBs recycling
However, although pyrometallurgy has been further improved, some pollution
problems are still inevitable. This has been the driving force for the development of
the new molten salts technology. Molten salts allow to operate at lower
temperatures (T<500°C) using eutectic salt compositions. Molten salts process
reduces the energy cost, corrosion of the installation and harmful gas emission.
Flandinet et al. [22] reported a process in which molten KOH-NaOH eutectic bath
(Tmelting=170°C) was used to dissolve non-metallic fraction from crashed PCBs
samples at 300°C, leaving a copper-rich residue. The carbon dioxide produced
during the molten salt oxidation of resin and plastics was trapped in the melt by
forming molten carbonates and silicates. In addition, halogens were converted to
alkali metal halides, which remained in the molten salt. Finally, operating without
oxygen, the flue gas contained almost 30% of hydrogen and therefore, it was

77
potentially usable as a fuel gas or synthesis gas. Guo et al. [23] proposed an alkali
fusion-leaching-separation process for metals recovery from WPCBs using a low-
cost oxidizing flux of NaOH–NaNO3 as a reaction medium at a temperature of
500°C. In the alkali fusion–leaching process, amphoteric metals such as Sn, Pb, Zn
and Al were converted into sodium salts and dissolved in solution, thus they were
separated from Cu and precious metals which remained in the residue.
Subsequently, metals in solution were further extracted via precipitation processes,
and metals in the residue were recovered using an acid leaching-electrowinning
process. Recoveries of metals were 98.66% of Cu, 96.08% of Sn, 91.25% of Zn,
and 78.78% of Pb, respectively. Molten salts process represents the most
significant progress in the area of pyrometallurgy, but further studies are required
because it is still a recent technology in the field of WPCBs recycling.
3.3.2 Hydrometallurgical route
A great number of papers have been published about leaching of copper from
waste PCBs. Hydrometallurgical route is the most investigated technique in the
field of copper recovery from e-waste. Copper can be effectively leached using
either acidic or ammoniacal solutions. Besides, some novel leaching systems have
been proposed in recent years, such as ionic liquids and chelating agents.
3.3.2.1 Acidic leaching
Traditional leaching methods employ mineral acids, such as H2SO4, HNO3 and
HCl as lixiviants. Base metals such as Zn, Sn, Fe, Ni, Pb and Al are successfully
dissolved in such acids, however, Cu needs of oxidizing acids (e.g. HNO3) or non-
oxidizing acids (e.g. H2SO4, HCl) in the presence of an oxidant such as air/O2,
H2O2, Cl2, Cu2+
and Fe3+
[24].

78
The use of nitric acid as a leaching agent for copper extraction from WPCBs has
been investigated by different authors [25-30]. The reaction of copper with aqueous
nitric acid solution can be expressed as follows
Cu + 4HNO3 = Cu(NO3)2 + 2H2O + 2NO2 (3.3.2.1.1)
Le et al. [30] reported that dissolution of copper from pre-treated WPCBs increased
with temperature, HNO3 concentration and with decreasing in pulp density.
However, acid concentration cannot be increased excessively to avoid reduction of
pH that can hinder further operations such as solvent extraction and electrowinning.
A copper dissolution of 99% was achieved in 1 h along with other metals such as
Ni, Fe, Zn and Pb with 3.5 mol/L HNO3 at 323 K and 120 g/L pulp density, while
Sn dissolution was found to be negligible even at high concentration of HNO3 and
elevated temperature. Copper was then extracted from the leach solution by solvent
extraction with LIX 984N in kerosene, stripped with sulfuric acid and recovered by
electrowinning. In the study by Mecucci et al. [25], tin was precipitated in the form
H2SnO3 during leaching of WPCBs in HNO3 for acid concentrations higher than 4
M. Copper and lead were directly recovered electrochemically from the leach
solution using a simple undivided cell where Cu was deposited at cathode and
PbO2 at the anode without any preliminary purification step. Generally, the current
efficiency obtained in copper electrolysis from nitric acid solutions is quite low and
decreases with HNO3 concentration increasing. Mecucci et al. [25] explained the
low current efficiency with both re-dissolution of deposited copper and competitive
hydrogen evolution at cathode. Indeed, a pH correction is suggested before
electrolysis. Maguyon et al. [27] concluded that leaching of WPCBs with nitric
acid shows better Cu recovery than in aqua regia and diluted the leach solution
before electrodeposition for pH correction.
HCl is less common for copper extraction from WPCBs. Havlik et al. [31] used
2 M HCl solution to extract more than 80% of tin after 120 min. at 80°C from pre-
treated WPCBs by mechanical-physical route. However, copper extracted was less
79
than 1% due to the non-oxidizing environment. According to the authors, this was
valid for the whole range of temperature 0-100°C, because the values of ΔG0 in this
temperature range were positive.
Cu + 2HCl(aq) = CuCl2 + H2(g) ΔG0
80=92.58 KJ/mol (3.3.2.1.2)
2Cu + 2HCl(aq) = 2CuCl + H2(g) ΔG0
80=1.68 KJ/mol (3.3.2.1.3)
The small amounts of copper found in solution were probably due to the leaching
of copper oxides which naturally cover copper particles. Thermodynamically, this
was possible according to the following reactions
Cu2O + 2HCl(aq) = 2CuCl + H2O ΔG0
80=-81.306 KJ/mol (3.3.2.1.4)
CuO + 2HCl(aq) = CuCl2 + H2O ΔG0
80=-33.73 KJ/mol (3.3.2.1.5)
Similar considerations can be also made for extraction of copper in H2SO4 acid
solutions. Castro et al. [32] tested the following leaching solutions for the
extraction of copper and tin from a WPCBs powder: 2.18 N H2SO4, 2.18 N H2SO4
+ 3 N HCl, 3 N HCl, and 3 N HCl + 1 N HNO3. After 120 min. at 60°C, the 3 N
HCl + 1 N HNO3 leaching solution exhibited the highest extraction power for both
tin (98%) and copper (93%), while the lowest values were obtained with 2.18 N
H2SO4 (2.7% Sn and <0.01% Cu) solution. Copper extraction by 2.18 N H2SO4 + 3
N HCl and 3 N HCl leaching solutions was 8.9% and 33.2%, respectively. An
improvement of the leaching performances of copper in H2SO4 and HCl solutions
can be achieved after a thermal pre-treatment of WPCBs [33-34] because copper
oxide can be more efficiently leached in a non-oxidizing environment than copper
metal. Masavetas et al. [33] obtained Cu recovery of 97.5%, 65% and 76.5% in
HNO3, HCl and H2SO4, respectively after a thermal pre-treatment at 500°C for 1 h
in both air and nitrogen atmosphere of WPCBs small pieces (~1x2 cm). More than
98% of copper was then recovered by electrowinning from the three different
leaching solutions. An almost complete extraction of copper can also be achieved

80
with only H2SO4 operating under pressure (2 MPa) and at high temperature
(~120°C) [24].
Although nitric acid and aqua regia are more suitable for copper leaching than
sulfuric acid, they are extremely corrosive and lead to the release of harmful
gaseous reaction products such as NOx mixtures. Similar problems are also
associated with HCl solutions, which have also low copper recovery efficiencies.
For all these reasons, sulfuric acid is the most preferred leaching agent for copper
dissolution from WPCBs. However, an oxidant has to be added to the sulfuric acid
solution to operate in milder conditions of temperature and pressure. H2O2 is the
most common oxidant coupled with H2SO4 for the extraction of copper by the
reaction [35-36].
Cu0 + H2O2 + H2SO4 = Cu
2+ + SO4
2- + 2H2O ΔG
080=-77.941 Kcal/mol (3.3.2.1.6)
Oh et al. [35] reported an extraction greater than 95% for copper and other base
metals (Fe, Zn, Ni and Al) by leaching for 12 h, at 85°C with 2 M H2SO4, and 0.2
M H2O2. H2O2 has been extensively used as an oxidant mainly due to its high
reduction potential of 1.77 V vs SHE. However, it suffers from high cost and
remarkably high consumption due to its high decomposition rate particularly at
high temperatures and in the presence of metal ions [37]. Therefore, Fe3+
has been
investigated as an alternative oxidant due to its low cost, easy regeneration and
high reduction potential (+0.771 V vs SHE) [38-44]. The reaction of metal leaching
can be described as follows
Me + nFe3+
= Men+
+ nFe2+
(3.3.2.1.7)
One of the main drawbacks related to the use of ferric ions is the consequent
contamination of the leach solution which can reduce the current efficiency of the
final electrochemical copper recovery. However, it was found that the downstream
can be purified by goethite and jarosite precipitation before electrowinning [42,
45]. Fe3+
can be used both in HCl and H2SO4 solutions. Diaz et al. [43] tested two

81
different leaching systems: 0.1 M Fe2(SO4)3-1 M H2SO4 and 0.2 M FeCl3-0.5 M
HCl. Base metals extraction efficiencies for the leaching with sulfate and chloride
matrix were 97.5% and 99.6% for Cu, 43% and 100% for Sn, 97.1% and 94.4% for
Zn, 6.41% and 100% for Pb, respectively. The low extraction efficiencies for Sn
and Pb in sulfate media were due to the precipitation of SnO2 and PbSO4,
respectively. Generally, the regeneration of the oxidant is always included in the
leaching processes mediated by Fe3+
. Fogarasi et al. [39-41] used FeCl3-HCl as a
leaching solution in a reactor combined with a divided electrochemical cell in
which electrowwining of copper occurred in parallel with the leaching agent
restoration. In particular, the solution leaving the leaching reactor was directly fed
to the cathodic compartment for copper deposition and then passed to the anodic
one for the oxidation of Fe2+
to Fe3+
, which was recycled into chemical reactor. The
laboratory scale leaching plant allowed the recovery of pure copper with a current
efficiency of 63.84% and an energy consumption of 1.75 KWh/Kg copper. Deveci
et al. [42] performed the leaching of Cu, Ni, Ag and Pd from a powder of WPCBs
using a H2SO4-NaCl-Fe2(SO4)3 solution, achieving 99.9% of copper extraction in
120 min. at 80°C and a solid ratio of 1% w/v. The extraction of Ni, Ag and Pd was
88.1%, 16% and 60.4%, respectively, in identical conditions. Besides, the authors
found that the introduction of oxygen for the in-situ regeneration of Fe3+
led to a
significant improvement in the leaching efficiency of metals particularly at high
solid ratios.
Recently, the use of Cu2+
as an oxidizing agent for extraction of copper from
WPCBs has attracted attention because it allows avoiding the contamination from
iron and reducing the costs compared to H2O2 [46-50]. Barbieri et al. [38] evaluated
in terms of efficiency and kinetics both FeCl3-HCl and CuCl2-HCl leaching
solutions for copper dissolution from WPCBs. They concluded that etching time
was lower with ferric than cupric chloride; however, in the case of CuCl2, a
complete restoration of the leaching solution was achieved by air oxidation. Cu2+
can be used both in chloride and sulphate media; however, Deveci et al. [46-47]

82
found that chloride media was more corrosive and determined a more difficult
electrowinning of copper than sulphate media.
3.3.2.2 Alkaline leaching
Several studies using alkaline solutions for leaching of base metals from
WPCBs have been reported [51-56]. Unlike mineral inorganic acids, ammoniacal
leaching solutions showed high selectivity towards copper. Sun et al. [51] reported
that copper dissolution in ammonia-ammonium solution can be described as
follows
2Cu + O2 = 2CuO (3.3.2.2.1)
CuO + 2NH3·H2O + 2NH4+ = Cu(NH3)4
2+ + 3H2O
(3.3.2.2.2)
Copper is firstly oxidized by means of dissolved oxygen (or H2O2) and then, CuO
is dissolved by ammonia-ammonium solution as a soluble Cu(I)-ammine complex.
The mechanism is quite different in the absence of either oxygen or air atmosphere.
Koyama et al. [52] demonstrated the feasibility of Cu leaching from WPCBs under
a nitrogen atmosphere using a leaching solution containing CuSO4·5H2O, Cu2O,
NH3 and (NH4)2SO4. The Cu(NH3)42+
species played the role of oxidant rather than
oxygen. Indeed, the oxidation-reduction reactions of Cu(II)/Cu(I) and Cu(I)/Cu are
expressed as follows
Cu(NH3)42+
+ e- = Cu(NH3)2
+ + 2NH3 (3.3.2.2.3)
Cu(NH3)2+
+ e- = Cu + 2NH3 (3.3.2.2.4)
Taking into account that oxidation-reduction potential of Cu(NH3)42+
/ Cu(NH3)2+
is
nobler than that of Cu(NH3)2+/ Cu, Cu(NH3)4
2+ can work as an oxidizing agent for
metallic copper in ammoniacal alkaline solution. Besides, the oxidation-reduction
potential of Cu(NH3)2+/Cu is nobler than that of hydrogen evolution, therefore it is
possible to recover copper by electrowinning from the leach solution. The reaction
of copper dissolution in ammoniacal media can be described as follows

83
Cu + Cu(NH3)42+
= 2Cu(NH3)2+
(3.3.2.2.5)
The authors found that the effect of temperature on leaching rate was negligible
while a significant enhancement of the leaching rate with the initial concentration
of Cu(II) was found. Besides, according to the authors, the theoretical power
consumption for electrowinning was lower compared to the conventional process
in acid solution. Bari et al. [55] tested the use of different leaching agents for
copper extraction from WPCBs including acidic and alkaline solutions. The best
results in terms of selectivity and leachability were found with 5 M NH3-0.5 M
(NH4)2S2O8 solution, achieving an almost complete copper extraction (~ 99%). The
extraction of Zn, Ni and Fe was 60%, 9%, and 0%, respectively, which is lower
than that obtained with acidic solutions. Despite the higher selectivity for copper
recovery by ammoniacal leaching solutions, generally a purification of the leach
solution is performed before any further treatment. Alam et al. [54] proposed a
method to remove impurities from ammoniacal leach solution (pH 9-11) containing
large amount of copper. Silver was removed by cementation with copper powder
followed by the removal of other base metals (e.g. Co, Ni, Zn, Al, Mn, Pb, etc.) by
solvent extraction with LIX 26 which was not able to extract copper. The loaded
organic was regenerated by stripping the metals using sulfuric acid. Copper
remained in the leach solution in the form of monovalent copper, and it was
recovered by electrowinning. An original procedure to recover copper from
WPCBs was developed by Liu et al. [53], who used a NH3/NH5CO3 solution in the
presence of oxygen to dissolve copper according to the reaction
Cu + 3NH3 + NH5CO3 + 0.5O2 = Cu(NH3)4CO3 + H2O (3.3.2.2.6)
The leach solution was then heated in order to evaporate NH3 and precipitate
CuCO3 according to the equation
Cu(NH3)4CO3 = CuCO3 + 4 NH3 (3.3.2.2.7)

84
Ammonia was recovered and recycled while CuCO3 was calcinated at 550°C to
recover copper in the form of copper oxide
CuCO3 = CuO + CO2 (3.3.2.2.8)
The solid residue after filtration of the leach solution was treated with 6 N HCl to
dissolve tin and lead. The final residue was used as a filler in the PVC plastics.
Except for this process in which ammonia is recovered by distillation, generally,
one of the major problems related to the alkaline leaching concerns the risks for
human and environment due to the high volatility of the ammonia.
3.3.2.3 Novel leaching methods
Some novel leaching methods for WPCBs recycling have been proposed in the
last few years, such as chelating, ionic liquid and sub-/supercritical leaching.
Chelating leaching involves the use of a lixiviant with multi-dentate ligands that
form complexes with metals or metal ions [24]. Chelation technology is well
known in the field of the extraction of heavy metals from contaminated soils and
industrial waste. Jadhao et al. [57] used EDTA as a leaching agent for copper
extraction from WPCBs powders and reported a copper dissolution degree of about
84% in 3 h with 0.5 M EDTA at 100°C and pH 7. According to the authors, more
than 96% of EDTA can be recovered by precipitation adding sulfuric acid to the
chelating solution. However, it is important to point out that a significant
consumption of alkali and acid occurs since chelating leaching requires alkaline
environment (pH 8-9), while de-chelation requires acidic environment (pH 2-3).
This area of research is completely new, and several studies are in progress to find
new chelating agents, preferentially biodegradable.
Another field of interest concerns the use of ionic liquids for copper extraction
from WPCBs due to their negligible volatility and high conductivity. Huang et al.
[58] used [bmim]H2SO4 along with H2O2 for Cu extraction from WPCBs. Almost
100% extraction was obtained at 70°C within 2 retention hours by 25 mL of 80%

85
(v/v) ionic liquid, 10 mL of 30% H2O2, and a solid/liquid ratio of 1/25. Similar
performances were obtained by Chen et al. [59] with five different ionic liquids
including [BSO4HPy]H2SO4, [MIm]H2SO4, [BSO3HMIm]OTf, [BSO3HMIm]OTf
and [BSO3HPy]OTf. The use of ionic liquids for leaching was also tested for
dismantling WPCBs [60-61]. [EMIM+][BF4
-] is suitable to completely separate
electronic components and solders from WPCBs at 240°C; while [BMIm]BF4 is
suitable to remove 90% of components at 250°C and 45 rpm in 12 h. However, the
use of ionic liquids in the field of PCB recycling needs further investigations
concerning mainly the interference of the other metals and the separation of metals
from the leach solution.
3.3.3 Electometallurgical route
One of the major advancement on copper recovery from WPCBs is the
development of entirely electrometallurgical processes. Currently, electrochemical
techniques are integrated in pyrometallurgical and hydrometallurgical processes as
a final step for the recovery of pure copper. However, some papers have been
published on copper recovery from WPCBs by simultaneous electroleaching-
electrodeposition processes [15, 62-65]. There are many advantages related to this
technology such as the reduction of unit operations required for metal recovery
because copper extraction and its deposition occur simultaneously in the same
equipment. Besides, the technology allows the minimization of the use of solvents,
gas emissions and energy consumptions.
Kim et al. [62] used two different configurations of the electrochemical reactor to
investigate the dissolution of Cu along with other base metals such as Pb, Sn, and
Zn from WPCBs. In particular, they employed a combined electrochemical reactor
(Figure 3.3.3.1a) in which metals leaching occurred simultaneously with Cl2
generation at the anode; and a separate leaching reactor (Figure 3.3.3.1b) connected
to the anode of an electrochemical cell where Cl2 was anodically produced. Waste
PCBs was firstly pre-treated by crushing and magnetic separation. The non-

86
magnetic fraction containing 18-20% by weight of copper was used for the tests.
The sample of waste PCBs was directly fed either into the anodic compartment of
the combined reactor or into the leaching reactor of the separate reactor.
Figure 3.3.3.1 Schematic diagram of the apparatus used by Kim et al. [52]: (a) combined reactor and (b) separate reactor
The anodic reaction was the generation of Cl2 (E0= 1.35V vs SHE). However,
oxidation from Cu+ to Cu
2+ also occurred in the combined reactor due to the
presence of Cu+ in solution produced by leaching of copper mediated by Cu
2+ ions
Cu2+
+ Cu → 2Cu+ (3.3.2.1)
When the concentration of Cu+ available in solution was high enough to consume
the applied current, the main anodic reaction changed from Cl2 generation to the
only cuprous oxidation due to the lower oxidation potential of cuprous ions than
that of chloride ions. For this reason, leaching efficiency of copper was found to be
lower in the combined reactor than in the separate reactor. Leaching rate increased
with current and temperature in both reactors. The extraction of Cu, Zn, Sn and Pb
in the separate reactor was 71%, 98%, 96% and 96%, respectively in 240 min.
using 2.0 mol/L HCl solution at a current density of 714 A/m2, 323 K temperature
and 400 rpm. Copper extraction was limited owing to the passivation of copper
particles by a layer of CuCl that occurred when copper dissolution was around 20-

87
25% in the combined and separate reactor, respectively. Indeed, higher rates of
copper leaching were obtained with 3.0 mol/L HCl, which dissolved CuCl more
rapidly.
Chu et al. [63] produced micro-copper powders by direct electrolysis from
concentrated metal scrap coming from the pre-treatment of WPCBs. In particular,
concentrated metal scraps were pressed in a steel die of rectangular section by a
hydraulic press at 20 MPa and the obtained plates were directly used as an anode
for electrolysis. The electrolyte was a mixture of copper sulphate, sodium chloride
and sulfuric acid. The authors investigated the effect of CuSO4·5H2O, NaCl and
H2SO4 concentration, current density and time on current efficiency and copper
powder size. They found that current efficiency increased with CuSO4·5H2O and
H2SO4 concentration, and current density, while copper powder became finer with
the increase of current density and NaCl concentration. The optimum found
condition was: 50g/L CuSO4·5H2O, 40g/L NaCl, 118g/L H2SO4, 80mA/cm2 and 3
h. Under these conditions, a current efficiency of 98.12% was found and a particle
size of 9.35 μm.
Guimarães et al. [64] and Fogarasi et al. [15] employed a similar apparatus for
direct copper electrolysis from WPCBs, which consisted of an undivided
electrochemical cell where a pre-treated sample of WPCBs was directly used as an
anode. In particular, Guimarães et al. used a powder of WPCBs supported by an AISI
304 stainless steel basket as an anode; while Fogarasi et al. used large pieces of
WPCBs (20-25 cm2) supported by a perforated Pb cage as an anode. The cathode
was a stainless steel plate in both studies, whereas the electrolyte was a CuSO4-
H2SO4 solution and an H2SO4 solution in the study of Guimarães et al. and Fogarasi
et al., respectively. At the end of the process, Guimarães et al. achieved a copper
recovery of 96% while Fogarasi et al. of 77%. However, the process developed by
Fogarasi et al. was less energy consuming since WPCBs was pre-treated only through
cutting and dissolution of the solder mask with concentrated H2SO4 instead of being
ground into powder.

88
3.3.4 Biometallurgical route
Biological processes are a promising eco-friendly and economically feasible
approach for WPCBs recycling. Among the biological technologies, microbial
leaching is the most common method for extracting the metallic portion from e-
waste, because it is suitable to convert the compounds into a soluble form. Mainly
three microbial groups are involved in this process: autotrophic bacteria,
heterotrophic bacteria, and heterotrophic fungi [66]. Bacteria such as
Acidithiobacillus ferrooxidans, Acidithiobacillus thiooxidans, Leptospirillum
ferrooxidans, and Sulfolobus sp., are well known consortia for the bioleaching
activity while fungi such as Penicillium simplicissimum and Aspergillus niger also
take part in metal leaching process. Cu bioleaching efficiencies from e-waste vary
widely from 50% to 100% for times typically exceeding 5 days and pulp densities
of 1-3% (w/v) [67]. The main influencing parameters are pH, redox potential,
microbial activity, and pulp density. Several studies have demonstrated that metal
leaching efficiency can be improved through addition of acid and iron, because the
whole process is controlled by the initial pH, Fe2+
concentration and the rate of
ferric ions generation [66]. This confirms the occurrence of an indirect leaching
mechanism by means of biogenic sulfuric acid and ferric iron, similar to that of
sulphide minerals.
4Fe2+
+ O2 + 4H+ = 4Fe
3+ + 2H2O (3.3.4.1)
Cu + 2Fe3+
= Cu2+
+ 2Fe2+
(3.3.4.2)
Fe2+
in the solution plays a role as an electron donor and is oxidized to Fe3+
by
iron-oxidizing bacteria. Fe3+
then acts as an oxidizing agent catalyzing the leaching
of metals. However, the mechanism of metal dissolution from electronic waste
material has been long debated and recently the occurrence of both direct and
indirect mechanisms was proposed [68]. Metal removal efficiencies are reported to
decrease significantly with increasing pulp density. This can be due to the alkaline

89
nature of the waste material, which creates a high pH environment where the
microorganisms do not thrive. Besides, metal precipitation was found to occur at
high pulp density and a toxic effect on bacteria was revealed owing to the non-
metallic fraction of WPCBs (i.e. epoxy-coated substrate and organic fraction). Choi
et al. [69] added citric acid to increase the solubility of copper and improve the
efficiency of the bioleaching process. The results showed that in the absence of
citric acid only about 37 wt% of the total leached copper remained dissolved;
however, it increased more than 80 wt% in the presence of citric acid that acts as a
ligand.
Several researchers reported that fungi have an impressive ability to produce
different types of amino acids, organic acids (e.g. citric and oxalic acid) and other
metabolites in the process of metals dissolution from e-waste, and the organic acids
play an important role as proton generators and ligands. Brandl et al. [70] used
bacteria (Thiobacillus thiooxidans, T. ferrooxidans) and fungi (Aspergillus niger,
Penicillium simplicissimum) to leach metals from e-scrap. According to the
authors, the formation of inorganic and organic acids caused the mobilization of
metals. The leaching results showed that both fungal strains were able to mobilize
Cu and Sn by 65%, and Al, Ni, Pb, and Zn by more than 95%. At scrap
concentrations of 5–10 g/L, Thiobacilli were able to leach more than 90% of Cu,
Zn, Ni, and Al. Pb precipitated in the form of PbSO4 while Sn precipitated
probably in the form of SnO. For a more efficient metal mobilization, the authors
proposed a two-step leaching process where biomass growth was separated from
metal leaching.
Other than addition of iron and acid or the development of multi-stage
processes, different procedures have been experienced to increase the efficiency of
bioleaching, such as the use of ligands (e.g. EDTA) in combining with microbes
(e.g. A. ferrooxidants) for copper extraction. It was found that addition of sulphur
can enhance the extraction of copper owing to the increase of sulfuric acid

90
production by bacteria. Ilyas et al. [71] reported 90% of copper extraction in 12
days with the addition of FeS + S0.
Recent developments in biotechnology have also concerned the acclimatization
of microbes to extreme bioleaching conditions, the understanding of the metal
mobilization mechanism, and toxicity characteristics. However, one of the most
promising solution seems to be the use of an hybrid (integrated) technique, for
instance, combining both chemical and biological methods. Harikrushnan et al. [72]
recovered copper, nickel and zinc from WPCBs using a combined approach of
biometallurgical (biological) and hydrometallurgical (chemical) techniques. The hybrid
method was compared against the individual chemical and biological methods and
proved to be a better method than the other two, being rapid, efficient, economical and
eco-friendly. The optimum found combination was 4 days of Acidithiobacillus
ferrooxidans leaching, followed by 30 minutes of nitric acid leaching. The
microorganisms provide sulfuric acid for a proton attack and oxidise ferrous iron (Fe2+)
to ferric iron (Fe3+) for an oxidative attack of the metals
2 FeSO4 + H2SO4 + 0.5 O2 + bacteria = Fe2(SO4)3 + H2O (2.3.4.1)
M + Fe2(SO4)3 = M2+ + 2 Fe2+ + 3 SO42- (2.3.4.2)
The integrated method removed nearly 100% of Cu, Ni and Zn for 10 g/L of e-waste
and approximately 85% of Cu and 98% of Ni and Zn at 50 g/L. The integrated method
was the most efficient for the recovery of Cu, Ni and Zn, followed by the chemical and
biological methods, respectively at 50 g/L. Adversely, the three methods were found to
be almost equally efficient for 10 g/L concentration of e-waste
It can be concluded that biological methods have a great potential in the treatment
of waste for metal recovery, particularly if integrated with chemical methods.
Certainly, it will play a significant role in WPCBs recycling in the future.

91
Bibliography
[1] Copper development association Inc. (USA), https://www.copper.org/
[2] Copper Alliance - The International Copper Association, LTD,
http://copperalliance.org/
[3] T. Bell (2016) What are the common uses of copper, Ten biggest copper producer
2010, www.thebalance.com
[4] J. Doebrich, K. Johnson, J. Hammarstrom, M. Zientek and C. Dicken, 2014, Facts
About Copper: Copper Uses, Resources, Supply, Demand and Production Information,
USGS United States Geological Survey, http://geology.com/usgs/uses-of-copper/
[5] U.S. Geological Survey (USGS), USGS Puts Global Copper Assessments on the
Map https://minerals.usgs.gov/global/index.html
[6] International Copper Study Group (ICSG), http://www.icsg.org/
[7] British Geological Survey- Natural Environment Research Council,
http://www.bgs.ac.uk
[8] Kathryn C. Sole, 2016, Solvent extraction in the hydrometallurgical processing and
purification of metals: process design and selected applications. In: M. Aguilar, J.L.
Cortina (Eds), Solvent Extraction and Liquid Membranes Fundamentals and
Applications in New Materials (pp. 141-200), CRC Press Taylor & Francis Group,
New York
[9] J. Cui, L. Zhang, 2008, Metallurgical recovery of metals from electronic waste: A
review, Journal of Hazardous Materials 158, 228-256
[10] H. Lia, J. Eksteena, E. Orabya, 2018, Hydrometallurgical recovery of metals from
waste printed circuit boards (WPCBs): Current status and perspectives – A review,
Resources, Conservation & Recycling 139, 122–139
[11] W. A. Bizzo, R. A. Figueiredo, V. F. de Andrade, 2014, Characterization of
Printed
Circuit Boards for Metal and Energy Recovery after Milling and Mechanical
Separation, Materials, 7, 4555-4566
[12] M.Wang, Z. Wang, Z. Guo, 2010, Preparation of electrolytic copper powders with
high current efficiency enhanced by super gravity field and its mechanism,
Transactions of Nonferrous Metals Society of China 20, 1154-1160
[13] L.J.J. Janssen, L. Koene, 2002, The role of electrochemistry and electrochemical
technology in environmental protection, Chemical Engineering Journal 85, 137-146
[14] B. Ghosh, M.K. Ghosh, P. Parthi, P.S. Mukherjee, B.K. Mishra, 2015, Waste
Printe Circuit Boards recycling: an extensive assessment of current status, Journal of
Cleaner Production 94, 5-19
[15] F. Imre-Lucaci, S. Fogarasi, P. Ilea, M. Tamasan, 2012, Copper recovery from
real samples of WPCBs by anodic dissolution, Environmental Engineering and
Management Journal 11, 1439-1444
[16] U. Jadhav, H. Hocheng, 2015, Hydrometallurgical Recovery of Metals from Large
Printed Circuit Board Pieces, Scientific Reports 5, 14574

92
[17] U. Jadhav, C. Su, H. Hocheng, 2016, Leaching of metals from large pieces of
printed circuit boards using citric acid and hydrogen peroxide, Environmental Science
and Pollution Research 23, 24384-24392
[18] X. Guo, F.G.F Qin, X. Yang, R. Jiang, 2014, Study on low-temperature pyrolysis
of large-size printed circuit boards, Journal of Analytical and Applied Pyrolysis 105,
151-156
[19] N.N Adhapure, P.K. Dhakephalkar, A.P. Dhakephalkar, V.R. Tembhurkar, A.V.
Rajgure, A.M. Deshmukh, 2014, Use of large pieces of printed circuit boards for
bioleaching to avoid ‘precipitate contamination problem’ and to simplify overall metal
recovery, MethodsX 1, 181-186
[20]A. Kaliq, M.A. Rhamdhani, G. Brooks, S. Masood, 2014, Metal Extraction
processes for Electronic Waste and Existing Industrial Routes: A Review and
Australian Perspective, Resources 3, 152-179
[21] L. Zhang, Z. Xu, 2016, A review of current progress of recycling technologies for
metals from waste electrical and electronic equipment, Journal of Cleaner Production
127, 19-36
[22] L. Flandinet, F. Tedjar, V. Ghetta, J. Fouletier, 2012, Metals recovering from
waste printed circuit boards (WPCBs) using molten salts, Journal of Hazardous
Material 213, 485-490
[23] X. Guo, J. Liu, H. Qin, Y. Liu, Q. Tian, D. Li, 2015, Recovery of metal values
from waste printed circuit boards using an alkali fusion-leaching-separation process,
Hydrometallurgy 156, 199-205
[24] H. Li, J. Eksteen, E. Oraby, 2018, Hydrometallurgical recovery of metals from
waste printed circuit boards (WPCBs): Current status and perspectives- A review,
Resources, Conservation & Recycling 139, 122-139
[25] A. Mecucci, K. Scott, 2002, Leaching and electrochemical recovery of copper,
lead and tin from scrap printed circuit boards, Journal of Chemical Technology and
Biotechnology 77, 449-457
[26] M.-S. Lee, J.-G. Ahn, J.W. Ahn, 2003, Recovery of copper, tin and lead from the
spent nitric etching solutions of printed circuit board and regeneration of the etching
solution, Hydrometallurgy 70, 23-29
[27] M.C.C. Maguyon, C.G. Alfafara, V.P. Migo, J.L. Movillon, C.M. Rebancos,
2012, Recovery of Copper from Spent Solid Printed-Circuit-Board (PCB) Wastes of a
PCB Manufacturing Facility by Two-Step Sequential Acid Extraction and
Electrochemical Deposition, Journal of Environmental Science and Management 15,
17-27
[28] T. Kinoshita, S. Akita, N. Kobayashi, S. Nii, F. Kawaizumi, K. Takahashi, 2003,
Metal recovery from non-mounted printed wiring boards via hydrometallurgical
processing, Hydrometallurgy 69, 73-79
[29] T.R. Mankhand, K.K. Singh, S.K. Gupta, S. Das, 2012, Pyrolysis of Printed
Circuit Boards, International Journal of Metallurgical Engineering 1 (6), 102-107
[30] H.L. Le, J. Jeong, J.-C. Lee, B.D. Pandey, J.-M. Yoo, T.H. Huyunh, 2011,
Hydrometallurgical process for copper recovery from waste Printed Circuit Boards
(PCBs), Mineral Processing and Extractive Metallurgy Review 32, 90–104

93
[31] T. Havlik, D. Orac, M. Berwanger, A. Maul, 2014, The effect of mechanical-
physical pretreatment on hydrometallurgical extraction of copper and tin in residue
from printed circuit boards from used consumer equipment, Minerals Engineering 65,
163-171
[32] L.A. Castro, A.H. Martins, 2009, Recovery of tin and copper by recycling of
printed circuit boards from obsolete computers, Brazilian Journal of Chemical
Engineering 26, 649-657
[33] I Masavetas, A. Moutsatsou, E. Nikolaou, S. Spanou, A. Zoikis-Karathanasis,
E.A. Pavlatou, N. Spyrellis, 2009, Production of copper powder from printed circuit
boards by electrodeposition, Global NEST Journal 11, 241-247
[34] T. Havlik, D. Orac, M. Petranikova, A. Miskufova, F. Kukurugya, 2010, Leaching
of copper and tin from used printed circuit boards after thermal treatment, Waste
Management 31, 2536-2545
[35] C.J. Oh, S.O. Lee, H.S. Yang, T.J. Ha, T.J. Kim, 2003, Selective leaching of
valuable metals from waste printed circuit boards, Journal of the Air & Waste
Management Association 53, 897-902
[36] I. Birlonga, I. De Michelis, F. Ferella, M. Buzatu, F. Vegliò, 2013, Study on the
influence of various factors in the hydrometallurgical processing of waste printed
circuit boards for copper and gold recovery, Waste Management 33, 935-941
[37] H. Deveci, E.Y. Yazici, U. Aydin, A.U. Akcil, 2010, Extraction of copper from
scrap TV boards by sulphuric acid leaching under oxidizing conditions, Proceeding of
the Going Green-Care Innovation 2010 Conference, Vienna, Austria
[38] L. Barbieri, R. Giovanardi, I. Lancellotti, M. Michelazzi, 2010, A new
environmentally friendly process for the recovery of gold from electronic waste,
Environmental Chemistry Letters 8, 171-178
[39] S. Fogarasi, F. Imre-Lucaci, P. Ilea, A. Imre-Lucaci, 2013, The environmental
assessment of two new copper recovery processes from waste printed circuit boards,
Journal of Cleaner Production 54, 264-269
[40] S. Fogarasi, F. Imre-Lucaci, A. Egedy, A. Imre-Lucaci, P. Ilea, 2015, Eco-friendly
copper recovery process from waste printed circuit boards using Fe3+/Fe2+ redox
system, Waste Management 40, 136-143
[41] S. Fogarasi, F. Imre-Lucaci, A. Imre-Lucaci, P. Ilea (2014) Copper recovery and
gold enrichment from waste printed circuit boards by mediated electrochemical
oxidation, Journal of Hazardous Material 273, 215-221
[42] E.Y. Yazici, H. Deveci, 2014, Ferric sulphate leaching of metals from waste
printed circuit boards, International Journal of Mineral Processing 133, 39–45
[43] L.A. Diaz, T.E. Lister, J.A. Parkman, G.G. Clark, 2016, Comprehensive process
for the recovery of value and critical materials from electronic waste, Journal of
Cleaner Production 125, 236-244
[44] T.E. Lister, P. Wang, A. Anderko, 2014, Recovery of critical and value metals
from mobile electronics enabled by electrochemical processing, Hydrometallurgy 149,
228–237
94
[45] H. Cui, C.G. Anderson, 2016, Literature Review of Hydrometallurgical Recycling
of Printed Circuit Boards (PCBs), Journal of Advanced Chemical Engineering 6:142
[46] E.Y. Yazici, H. Deveci, 2013, Extraction of metals from waste printed circuit
boards (WPCBs) in H2SO4-CuSO4-NaCl solutions, Hydrometallurgy 139, 30-38
[47] E.Y. Yazici, H. Deveci, 2015, Cupric chloride leaching (HCl–CuCl2–NaCl) of
metals from waste printed circuit boards (WPCBs), International Journal of Mineral
Processing 134, 89–96
[48] M. Somasundaram, R. Saravanathamizhan, C. Ahmed Basha, V. Nandakumar, S.
Nathira Begumd, T. Kannadasan, 2014, Recovery of copper from scrap printed circuit
board: modelling and optimization using response surface methodology, Powder
Technology 266, 1–6
[49] O. Herreros, R. Quiroz, A. Restovic, J. Vinals, 2005, Dissolution kinetics of
metallic copper with CuSO4–NaCl–HCl, Hydrometallurgy 77, 183–190
[50] Z. Ping, F. ZeYun, L. Jie, L. Qianga, Q. GuangRena, Z. Ming, 2009,
Enhancement of leaching copper by electro-oxidation from metal powders of waste
printed circuit board, Journal of Hazardous Materials 166, 746–750
[51] Z.H.I. Suna, Y.Xiao, J.Sietsma, H.Agterhuis, G.Visser, Y.Yang, 2015, Selective
copper recovery from complex mixtures of end-of-life electronic products with
ammonia-based solution, Hydrometallurgy 152, 91-92
[52] K. Koyama, M. Tanaka, J.-C. Lee, 2006, Copper Leaching Behaviour from Waste
Printed Circuit Board in Ammoniacal Alkaline Solution, Materials Transactions 47 (7),
1788-1792
[53] R. Liu, R.S. Shieh, R.Y.L. Yeh, C.H. Lin, 2009, The general utilization of
scrapped PC board, Waste Management 29, 2842-2845
[54] M.S. Alam, M. Tanaka, K. Koyama, T. Oishi, J.-C. Lee, 2007, Electrolyte
purification in energy-saving monovalent copper electrowinning processes,
Hydrometallurgy 87, 36-44
[55] Md F. Bari, N. Begum, S.B. Jamaludin, K. Hussin, 2009, Selective leaching for
the recovery of copper from PCB, proceedings of the Malaysian Metallurgical
Conference ‘09
[56] J.-G Yang, Y.-T Wu, J. Li, 2012, Recovery of ultrafine copper particles from
metal components of waste printed circuit boards, Hydrometallurgy 121–124, 1–6
[57] P. Jadhao, G. Chauhan, K. Pant, K. Nigam, 2016, Greener approach for the
extraction of copper metal from electronic waste, Waste Management 57, 102-112
[58] J. Huang, M. Chen, H. Chen, S. Chen, Q. Sun, 2014, Leaching behavior of copper
from waste printed circuit boards with Bronsted acidic ionic liquid, Waste
Management 34 (2), 483-488
[59] M. Chen, S. Zhang, J. Huang, H. Chen, 2015, Lead during the leaching process of
copper from waste printed circuit boards by five typical ionic liquid acids, Journal of
Cleaner Production 95, 142-147
[60] P. Zhu, Y. Chen, L.Y. Wang, M. Zhou, 2012, Treatment of waste printed circuit
board by green solvent using ionic liquid, Waste Management 32, 1914-1918.
[61] X. Zeng, J. Li, H. Xie, L. Liu, 2013, A novel dismantling process of waste printed
circuit boards using water-soluble ionic liquid, Chemosphere 93, 1288-1294.
95
[62] E.-Y. Kim, M.-S. Kim, J.-C. Lee, J. Jeong, B.D. Pandey, 2011, Leaching kinetics
of copper from waste printed circuit boards by electro-generated chlorine in HCl
solution, Hydrometallurgy 107, 124–132
[63] Y. Chu, M. Chen, B. Wang, K. Fu, H. Chen, 2015, Micro-copper powders
recovered from waste printed circuit boards by electrolysis, Hydrometallurgy 156, 152-
157
[64] Y.F. Guimarães, I.D. Santos, A.J.B. Dutra, 2014, Direct recovery of copper from
printed circuit boards (PCBs) powder concentrate by a simultaneous electroleaching–
electrodeposition process, Hydrometallurgy 149, 63–70
[65] S.P. Kumar, S. Govindaradjane, T. Sundararajan, 2013, Recovery of copper from
printed circuit boards through electrolytic process- A case study, International Journal
of Engineering Research and Applications 3, 469-473
[66] A.K. Awasthi, X. Zeng, J. Li, 2016, Integrated bioleaching of copper metal from
waste printed circuit board-a comprehensive review of approaches and challenges,
Environmental Science and Pollution Research 23, 21141-21156
[67] A. Isildar, 2016, Biological versus chemical leaching of electronic waste for
copper and gold recovery, PhD thesis in Environmental Technology, Université Paris-
Est, available on https://tel.archives-ouvertes.fr/tel-01738056
[68] R.A. Silva, J. Park, E. Lee, J. Park, S.Q. Choi, H. Kim, 2015, Influence of
bacterial adhesion on copper extraction from printed circuit boards. Separation and
Purification Technology 143, 169–176
[69] M.-S. Choi, K.-S. Cho, D.-S. Kim, D.-J. Kim 2004, Microbial recovery of copper
from printed circuit boards of waste computer by Acidithiobacillus ferrooxidans,
Journal of Environmental Science and Health – Part A Toxic/Hazardous Substances
and Environmental Engineering 39 (11–12) 2973–2982
[70] H. Brandl, R. Bosshard, M. Wegmann, 2001, Computer-munching microbes:
metal leaching from electronic scrap by bacteria and fungi, Hydrometallurgy 59, 319–
326
[71] S. Ilyas, J.C. Lee, R.A Chi, 2013, Bioleaching of metals from electronic scrap and
its potential for commercial exploitation, Hydrometallurgy 131-132, 138-143
[72] B. Harikrushnan, G. Shreyass, G. Hemant, M. Pandimadevi, 2016, Recovery of
Metals from Printed Circuit boards (PCBs) Using a Combination of
Hydrometallurgical and Biometallurgical Processes, International Journal of
Environmental Research 10, 511-518
96
Chapter 4
Dismantling and electrochemical copper recovery from
WPCBs in H2SO4–CuSO4–NaCl solutions
Introduction
Dismantling is the first and most delicate step in recycling chain of WPCBs. The
current technologies for electronic components (ECs) detachment involve either the
use of potential polluting liquids or the heating of the solders above the melting
point with the possible release of toxic gases, consumption of energy and damage
of some reusable components.
In this work, the use of a few aggressive and cheap leaching solution for
WPCBs dismantling was investigated. In particular, a H2SO4-CuSO4-NaCl solution
of well-defined composition was used to leach out all exposed metals from not pre-
treated WPCBs to disassemble ECs without damaging. In the acidic solution, Cu2+
behaves as an oxidant while Cl- as a ligand to stabilize Cu
+ by chloro-complexes
formation. The feasibility of electrochemical recovering of copper from the
resulting solution was verified through a preliminary cyclic voltammetry study
aimed at investigating the electrochemistry of copper deposition in sulfate-chloride
solutions in the presence of other metal ions. Then, a divided electrochemical cell
was employed to investigate simultaneous copper recovery and oxidant restoration.
Part of the work of this chapter has been conducted in the Lab of the Faculty of
Chemistry and Chemical Engineering at Babeş-Bolyai University, Cluj-Napoca,
under the supervision of Professors P. Ilea, S.-A. Dorneanu and G.L Turdean.

97
4.1 H2SO4–CuSO4–NaCl leaching solution: state of the
art
In recent years, a large number of papers have been published dealing with the
leaching of copper from WPCBs due to its relevant abundance. Copper can be
effectively leached using either acidic or ammoniacal solutions. The last ones have
demonstrated high selectivity towards copper [1-3]. However, traditional leaching
method employs mineral acids, mainly H2SO4 for its easy regeneration and low
cost, but also aqua regia, HCl, and HNO3 [4-6]. Generally, an oxidizing agent, such
as Cl2, O2, H2O2, Fe3+
, is added to the leaching solution to enhance extraction
efficiency [7-12]. Hydrogen peroxide is extensively used for its high redox
potential (1.78 V) despite the high cost and consumption particularly at high
temperatures [11]. Ferric ion represents a cheap alternative and it can be easily
regenerated [13]. The use of Fe3+
was investigated by different authors achieving
high dissolution rate for metals. The principal drawback is the contamination of
the leach solution, which can, however, be purified by goethite and jarosite
precipitation before electrodeposition [13].
Recently, the use of Cu2+
as an oxidizing agent for the extraction of copper from
WPCBs was tested to avoid the contamination from iron and reduce the costs
compared to H2O2 [14-16]. The leaching of copper mediated by Fe3+
or Cu2+
ions in
chloride solutions was also investigated for the treatment of copper concentrates in
the mining industry. HydroCopper® process (at pilot scale) is a recent technology
developed to leach copper from chalcopyrite concentrates with the use of HCl–
CuCl2–NaCl solutions [15].
In the field of waste management, Deveci et al. investigated both HCl-CuCl2-
NaCl and H2SO4-CuSO4-NaCl solutions for highly effective leaching of Cu, Fe, Ni
and Ag [14, 15] from pulverized samples of WPCBs. However, the HCl-CuCl2-
NaCl solution was found to be extremely corrosive and determining a difficult
electrowinning of copper. The presence of chloride in H2SO4/CuSO4 solutions is

98
crucial because Cl- acts as a ligand stabilizing the Cu
+ ions in the form of copper-
chloro complexes and hence, activates the Cu2+
/Cu+ redox couple. The mechanism
of copper dissolution is
Cu0 + Cu
2+ → 2Cu
+ (4.1.1)
Cu+ + nCl
- → CuCln
1-n (1 ≤ n ≤ 4) (4.1.2)
Depending on chloride concentration, cupric copper (Cu2+
) may also present as
CuCln2-n
complexes. From equation (4.1.2), it is evident that a sufficient level of
chloride should be maintained in the leaching solution to prevent the precipitation
of Cu+ in the form of CuCl (for n=1).
According to the authors [14], Cu2+
is electrochemically faster than Fe3+
and can
become more powerful than Fe3+
as an oxidant at high chloride concentrations (e.g.
≥ ~ 4.2 M). Indeed, although the standard reduction potential of the Cu2+
/Cu+
couple is relatively low (0.16 V/NHE), an increase of the chloride concentration
can elevate the value. This is due to the increase of the Cu+-Cl complexes stability
compared to Cu2+
-Cl with the increase of chloride concentration, particularly at
[Cl-] > 0.1 M. On the contrary, Fe
3+-Cl complexes become more stable than Fe
2+-Cl
with [Cl-] increase, reducing the potential of Fe
3+/Fe
2+ redox couple.
Interesting results have been reported by Herreros et al. [17], who studied the
dissolution kinetics of metallic copper with NaCl-CuSO4 in HCl rather than H2SO4,
determining the influence of stirring, temperature, and total copper and chloride
concentrations. Dissolution kinetics of copper was positively influenced by an
increase in temperature while it was insensitive to stirring for velocities above 350
rpm, suggesting a chemical reaction control. The reaction rate was found to
increase in proportion to the total copper concentration. On the contrary, a decrease
of the reaction rate was observed increasing the concentration of Cl- owing to the
lower availability of free Cu2+
ions in solution, which were identified as the main
active species. Based on the experimental results, the authors suggested that copper
dissolution occurs in the following steps

99
Cu(s) + Cu2+
(aq) → 2Cu+
(ads)
(4.1.3)
Cu+
(ads) + 2Cl-(aq) → CuCl2
− (4.1.4)
When the ratio of the total chloride concentration and that of copper (Ccl/CCu) is
high, reaction (4.1.3) is the overall controlling step. On the contrary, when the ratio
is low, reaction (4.14) is limited and CuCl precipitation occurs on the copper
surface hindering the leaching process, in accordance with the following reaction
Cu+
(ads) + Cl-(aq) → CuCl(s) (4.1.5)
The authors recommend a Ccl/CCu ratio not less than 8 and not higher than 16.5 to
avoid the decrease of free Cu2+
ions availability.
In the study by Deveci et al. [14], the extraction of metals from WPCBs with
H2SO4-CuSO4-NaCl was investigated changing temperature (20-80°C), solid ratio
(1-15% w/v), initial concentration of both cupric (0.5-7.5 g/L Cu2+
) and chloride
(4.7-46.6 g/L Cl-) ion. PCBs wastes were initially subjected to a manual separation
of the components and then to a two-stage crushing until a dimension of 250 µm.
The leaching tests were performed in a glass reactor equipped with a four-blade
mechanical stirrer, setting time and speed to 120 minutes and 675 rpm,
respectively. H2SO4 concentration was maintained constant at 0.5 M. The results
showed that temperature and initial concentration of Cu2+
are the most influential
factors and their increase improves the extraction of copper. Similarly to the study
of Herreros et al. [17], the authors found a strong interaction between the
concentration of copper and chloride. In particular, the Cl-/Cu
2+ ratio must be
maintained sufficiently high to achieve high metal extractions but not too much to
avoid a decrease in Cu2+
availability. The best experimental conditions found were
a temperature of 80°C, a solid ratio of 1% w/v and a Cl-/Cu
2+ ratio of 21 (46.6 g/L
of Cl- and 4 g/L of Cu
2+). Under these conditions, a complete extraction of copper
from WPCBs was achieved, and higher to 90% for Fe, Ni, Ag and 58% for Pd.

100
The increase of the solid ratio adversely influenced the leaching of metals with no
copper extraction for values higher than 10% w/v. However, the introduction of
either air or oxygen led to a significant improvement due to the in-situ regeneration
of the Cu2+
oxidant through the following reactions
4CuCl-2 +
O2(aq) + 4H
+ → 4Cu
2+ + 8Cl
- + 2H2O
(4.1.6)
4CuCl-2 + O2(aq) + 4H
+ → 4CuCl
+ + 4Cl
- + 2H2O (4.1.7)
4CuCl-2 + O2(aq) + 4H
+ → 4CuCl2 + 2H2O (4.1.8)
Besides, oxygen can contribute to the oxidation of metals, particularly that of
palladium, both directly and indirectly by activation of the Fe3+
/Fe2+
redox couple.
The presence of iron in solution was determined by its dissolution from WPCBs.
Ping et al. [16] carried out a leaching of copper from WPCBs at room
temperature using a dilute solution of sulfuric acid in which Cl- acted as a
complexing agent while Cu2+
and O2 as oxidants. WPCBs were pretreated by a
mechanical process to obtain a metal powder with high copper content. A lot of
tests were carried out to study the influence of some parameters on the leaching
rate. The optimum conditions were: 40 g/L NaCl, 30 g/L CuSO4·5H2O, 1.12 M
H2SO4, 1/15 (g/mL) solid–liquid ratio and 5.5 h. The reaction mechanism in the
presence of blowing air is
Cu2+
+ Cu → 2Cu+
(4.1.9)
Cu+ + Cl
- → CuCl
CuCl + Cl
- → CuCl2
- (4.1.10)
4CuCl2- + O2 + 2H2O → 2[Cu(OH)2 · CuCl2] + 4Cl
- (4.1.11)
4CuCl2- + O2 + 2H2O → 2[Cu(OH)2 · CuCl2] (4.1.12)
2[Cu(OH)2 · CuCl2] + H2SO4 → CuSO4 + CuCl2 + 2H2O (4.1.13)
CuSO4 + 5H2O → CuSO4 · 5H2O (4.1.14)
Therefore, copper is recovered in the form of pure CuSO4·5H2O by an evaporative
crystallization of the leach solution. Besides, Cl- behaves as a catalyst in leaching

101
copper process because it is consumed and then regenerated from equation (4.1.11).
The authors claim that the leaching time can be reduced of 2 h performing an
electro-extraction of copper in a divided electrochemical cell where a graphite
anode and a stainless steel cathode were used. The powder of mechanically
pretreated waste PCBs was directly put into the anodic compartment and oxygen
was generated in-situ as a product of anodic reactions. In this case, the
improvement in leaching performances was determined by the anodic oxidation of
Cl- to Cl2, which was dissolved in water to form the strong oxidant HClO.
These studies suggest that H2SO4-CuSO4-NaCl leaching solution can represent a
few aggressive and cheaper alternative for the efficient extraction of copper and
other metals from WPCBs. In this work, H2SO4-CuSO4-NaCl solution was tested to
disassemble ECs by leaching all exposed metals from not pre-treated WPCBs.
Then, the recovery of copper from the resulting solution was also investigated after
a preliminary electrochemical characterization of the leach solution by cyclic
voltammetry (CV). The treatment of WPCBs investigated in the present work
consists in only two stages: i) ECs detachment by metals leaching; ii)
electrochemical recovery of copper from the leach solution.
4.2 Electronic components detachment from WPCBs by
metals leaching in H2SO4–CuSO4–NaCl solution
The first step of the study was aimed at finding the exact composition of the
leaching solution for the complete dissolution of all exposed metallic parts from
not pre-treated WPCBs and simultaneous detachment of all ECs. Experimental
procedure and results will be reported in the following.
4.2.1 Material and methods
In order to find the best composition for H2SO4-CuSO4-NaCl leaching solution,
some experiments were conducted at different concentration of H2SO4,

102
CuSO4·5H2O, and NaCl. The experiments layout is shown in Table (4.2.1.1). All
the chemical reagents were of analytical grade. Each experiment of Table (4.2.1.1)
was repeated 3 times at least.
Experiment
number
Leaching
Solution
number
NaCl
(mol/L)
CuSO4·5H2O
(mol/L)
H2SO4
(mol/L)
Ccl/Ccu
ratio
1
1
2
3
2
2
2
0.2
0.2
0.2
0.5
1
2
10
10
10
2
1
2
3
2
2
2
0.05
0.1
0.4
0.5
0.5
0.5
40
20
5
3
1
2
3
1
3
4
0.4
0.4
0.4
0.5
0.5
0.5
2.5
7.5
10
Table 4.2.1.1 Leaching experiments layout
During each experiment, three reactors containing three leaching solution of
different composition simultaneously worked for better observing the effects on
WPCBs induced by variation in the concentrations of H2SO4 (experiment 1),
CuSO4·5H2O (experiment 2) and NaCl (experiment 3), respectively. A scheme of
the experimental setup is shown in Figure 4.2.1.1. Each reactor was a cylindrical
glass vessel filled with 500 mL of leaching solution. Air was blown into the
reactors through an air pump equipped with a polyethylene diffuser with a flux of 4
L/min. The time of each test was of 12 h.
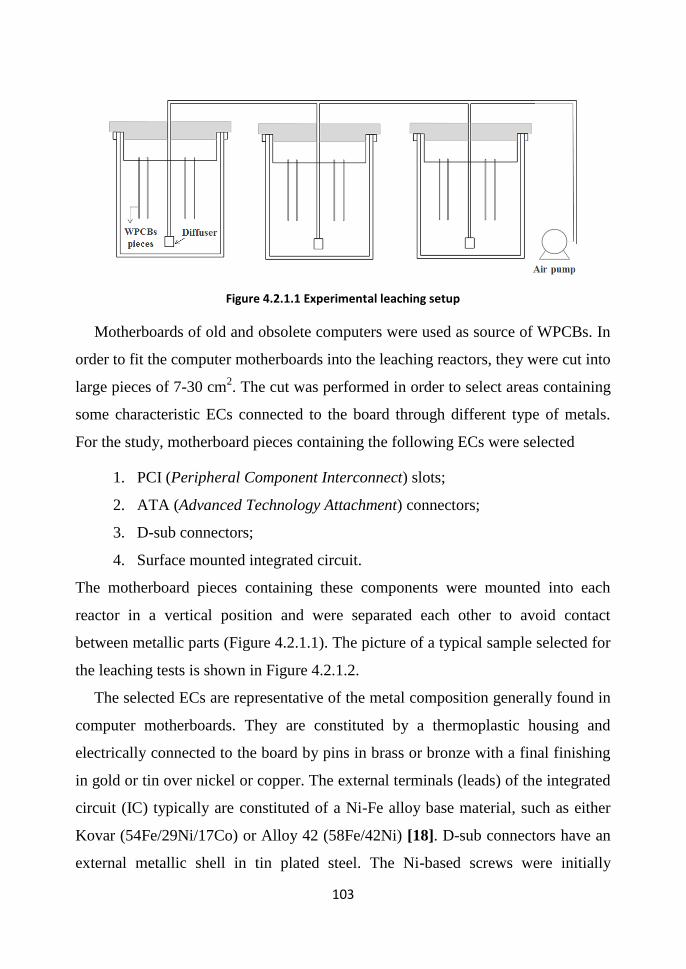
103
Figure 4.2.1.1 Experimental leaching setup
Motherboards of old and obsolete computers were used as source of WPCBs. In
order to fit the computer motherboards into the leaching reactors, they were cut into
large pieces of 7-30 cm2. The cut was performed in order to select areas containing
some characteristic ECs connected to the board through different type of metals.
For the study, motherboard pieces containing the following ECs were selected
1. PCI (Peripheral Component Interconnect) slots;
2. ATA (Advanced Technology Attachment) connectors;
3. D-sub connectors;
4. Surface mounted integrated circuit.
The motherboard pieces containing these components were mounted into each
reactor in a vertical position and were separated each other to avoid contact
between metallic parts (Figure 4.2.1.1). The picture of a typical sample selected for
the leaching tests is shown in Figure 4.2.1.2.
The selected ECs are representative of the metal composition generally found in
computer motherboards. They are constituted by a thermoplastic housing and
electrically connected to the board by pins in brass or bronze with a final finishing
in gold or tin over nickel or copper. The external terminals (leads) of the integrated
circuit (IC) typically are constituted of a Ni-Fe alloy base material, such as either
Kovar (54Fe/29Ni/17Co) or Alloy 42 (58Fe/42Ni) [18]. D-sub connectors have an
external metallic shell in tin plated steel. The Ni-based screws were initially

104
removed from these last components to avoid an increase in leaching time due to
their high thickness. Besides, the ECs were positioned on the board through a Pb-
Sn soldering paste having usually a composition of 62 wt.% Sn and 38 wt.% Pb
[19].
Figure 4.2.1.2 Picture of the motherboard pieces selected for the leaching tests containing the following ECs: (1) PCI slot, (2) ATA connector, (3) SMT integrated circuit, (4) D-sub connector
Therefore, Pb, Sn, Fe, Zn, Cu, and Ni were the main base metals that it was
expected to find in the solution resulting from dismantling/leaching of WPCBs
[20]. The average initial weight of the selected motherboard pieces was about 43.3
g with a solid to liquid ratio (S/L) of 0.0866 g/mL, which corresponds to 11.55 mL
of solution per g of solid.
4.2.2 Results and discussion
H2SO4-CuSO4-NaCl solution was already used for the successful leaching of
metals from disassembled and pulverized WPCBs, while never it was used before
to disassemble ECs directly from not pre-treated boards. The reactions involved in
metal leaching are
nCu2+
+ Me = nCu+ + Me
n+ (4.2.2.1)
Cu+ + nCl
- → CuCln
1-n
(1 ≤ n ≤ 4) (4.2.2.2)
Reaction 4.2.2.1 shows that the leaching process occurs by a displacement reaction
driven by Cu2+
ions in solution; while reaction 4.2.2.2 evidences the key role of Cl-

105
in stabilizing Cu+. In addition, the availability of Cu
2+ ions is of fundamental
importance, therefore, it needs to restore those consumed in 4.2.2.1. A possible
way consists in blowing air into the solution [14-16], according to
4Cu+ + O2 + 4H
+ = 4Cu
2+ + 2H2O (4.2.2.3)
The key role of oxygen was immediately evident from a preliminary leaching test
conducted without air blowing. Indeed, being the components placed in vertical
position into the reactor, the metallic parts dissolved easier were those near to the
air/solution interface, where the concentration of oxygen was higher. As shown in
Figure 4.2.2.1, the pins of PCI slot are completely dissolved in the upper region (on
the right in the picture) and just corroded in the lower region (on the left in the
picture).
Figure 4.2.2.1 Photo of a PCI slot after leaching without air blowing in H2SO4-CuSO4-NaCl solution
The first leaching experiment was carried out setting the concentration of NaCl
and CuSO4·5H2O at 2 M and 0.2 M respectively, with a Ccl/Ccu ratio of 10
according with other studies [14, 17]. H2SO4 concentrations of 0.5 M, 1 M, and 2
M were used for the three leaching solutions inside the three different reactors of
Figure 4.2.1.1. It was found that higher acid concentrations were reducing the
dissolving action of the solution, likely due to passivation effect on steel and solder
parts. Accordingly, Figure 4.2.2.2 a-b shows that connector and inserted pins
remained on WPCB after treatment in 1 M H2SO4, whereas complete detachment of
the connector and dissolution of the pins occurred in 0.5 M. Besides, damages to

106
the plastic housing of ECs were observed at acid concentrations higher than 0.5 M
hindering their future recycling.
Figure 4.2.2.2 D-sub connectors after leaching in 0.1 M CuSO4-2 M NaCl solution containing different concentrations of H2SO4: a) 0.5 M and b) 1 M, respectively
In Figure 4.2.2.2, the soldering alloy surface appears of white color probably due to
its partial passivation by precipitation of lead sulfate, according to
Pb-Sn + 4Cu2+
= Sn2+
+ Pb2+
+ 4Cu+ (4.2.2.4)
SO42-
+ Pb2+
= PbSO4 (4.2.2.5)
Reaction 4.2.2.4 schematises the oxidation of both Sn and Pb that in the presence
of sulfate precipitates in the form of PbSO4 owing to a solubility in cold water of
only 4.56 mg per 0.1 L of water, while SnSO4 is largely more soluble with 33 g per
0.1 L [21]. Passivation occurrence of the soldering alloy due to PbSO4 precipitation
is supported by the EDS analysis performed in these white areas. Figure 4.2.2.3
confirms the presence there of lead, whereas tin is almost completely dissolved.
Indeed, the atomic fraction of lead (Pb/(Pb+Sn)) was of about 0.93 (Figure 4.2.2.3).
The thickness of the passive film was lower in the test at 0.5 M H2SO4.
Another important experimental evidence emerged from the first set of
leaching/dismantling tests was the instantaneous copper cementation on less noble

107
metal surfaces, which can lead to a drastically reduction of Cu concentration in
solution.
Figure 4.2.2.3 EDS spectrum and elemental composition related to the white area of the soldering alloy shown in Figure 4.2.2.2
A second leaching experiment was conducted to deeply investigate the effect of
a different initial concentration of copper on the extraction efficiency. Three
solutions at 0.05 M, 0.1 M and 0.4 M of CuSO4·5H2O were used for the test with
concentration of NaCl at 2 M and that of H2SO4 at the best value found during the
first leaching experiment (0.5 M). A picture of the samples after 12 h of leaching is
shown in Figure 4.2.2.4.
The results obtained at 0.05 M were similar to those obtained at 0.1 M of
CuSO4. On the contrary, significant differences were observed at 0.4 M. In
particular, only at this initial concentration of Cu it is possible to disassemble ATA
connector and dissolve all metallic part of D-sub connector (Figure 4.2.2.4). This
can be due to the large excess of chloride with respect to copper in the tests at 0.05
M CuSO4 with Ccl/Ccu=40 and 0.1 M CuSO4 with Ccl/Ccu=20, which leads to a
decrease in the activity of free Cu2+
within the medium.
It was found that 0.4 M CuSO4 is adequate to provide enough Cu2+
ions in
solution to sustain reaction 4.2.2.1, according to Herreros et al. [17] who showed

108
that the rate of copper dissolution was increasing with initial Cu2+
concentration.
Besides, a bigger amount of copper since the beginning of the leaching process can
contribute to compensate that lost owing to cementation. Nevertheless, when 0.4 M
CuSO4 was used, traces of a white precipitate were found on the reactor bottom.
The white compound was probably CuCl generated by the low concentration of
chloride in the media. Indeed, at low initial CCl/CCu ratios, the formation of chloro-
complexes is limited with consequent poor stabilization of Cu+
ions in solution
which leads to the following reaction
Cu(s) + Cu
2+(aq) + 2Cl
- (aq) 2CuCl(s) (4.2.2.6)
where (s) and (aq) indicate solid and aqueous phase, respectively. Therefore, for
working with 0.4 M of copper, a higher concentration of Cl- should be selected to
guarantee a CCl/CCu ratio higher than 5, thus avoiding CuCl precipitation.
Figure 4.2.2.4 Samples after leaching test in 0.5 M H2SO4-2 M NaCl solution containing different concentrations of CuSO4·5H2O: a) 0.05 M, b) 0.1 M, and c) 0.4 M

109
In order to better investigate the strong interaction between total copper and
total chloride concentration, a third leaching experiment was performed at different
concentrations of NaCl. Three solutions containing 1 M, 3 M and 4 M respectively
of NaCl were used for the tests. The concentration of H2SO4 was set at 0.5 M and
that of CuSO4·5H2O at 0.4 M. A picture of the samples after 12 h of leaching is
shown in Figure 4.2.2.5.
Figure 4.2.2.5 Samples after leaching test in 0.4 M CuSO4·5H2O -0.5 M H2SO4 solution containing different concentrations of NaCl: a) 1 M, b) 3 M, and c) 4 M
When NaCl concentration in the bath was lowered from 4 M to 1 M, an
abundant white precipitate of CuCl was formed owing to the low Ccl/Ccu ratio
(~2.5). Therefore, a very low extraction of metals was found in the test with 1 M
NaCl. After 12 hours of dismantling/leaching, D-sub connector was still assembled
to the board and its metallic shell just corroded; also the ATA connector was still
linked to the board and its pins not dissolved (Figure 4.2.2.5a). The best results

110
were obtained with 4 M NaCl leaching solution. Indeed, Figure 4.2.2.5c shows that
the components are completely disassembled from the board included also the
ATA connector, which is the hardest component to dismantle. Starting from 4 M
chloride concentration, also the soldering paste appears to be dissolved better,
likely due to the increase in lead solubility at higher chloride concentrations. The
measured weight loss of WPCBs after 12 h was of about 9%, 20% and 23% for the
leaching solution containing 1 M, 3 M, and 4 M of NaCl, respectively.
Even if the board pieces appeared almost completely free from metals after 12 h
in 4 M NaCl-0.5 M H2SO4-0.4 M CuSO4 leaching solution, it should be noted that
the removal of Pb-Sn solders was not complete. The passivation of Pb-Sn solders
can also hinder pins dissolution inside the through holes. However, a complete
removal of the soldering alloy was possible by alternating 12 h of leaching with 12
h of dipping in 4 M NaCl solution for two times. It was found that the amount of
soldering alloy was decreasing over each washing up to complete dissolution
(Figure 4.2.2.6). The action of concentrated NaCl solution in dissolving lead
sulphate can be attributed to the formation of chloro-complexes [22-23].
Figure 4.2.2.6 Pictures of WPCBs pieces: a) after 12 h of leaching in 4 M NaCl-0.5 M H2SO4-0.4 M CuSO4 solution; b) after a time of 48 h alternating 12 h of leaching to 12 h of dipping in 4 M NaCl for two times
Besides, it should be noted that, although oxygen contributes to maintain
oxidizing conditions, its presence determines pH increase. For this reason, the pH
was monitored during leaching in 0.5 M H2SO4-0.4 M CuSO4-4 M NaCl solution
and an increase was found from -0.2 to +0.53 after 12 hours (Table 4.2.2.1). Thus,
pH correction is necessary for longer time to avoid that Fe3+
generated from the

111
oxidation of Fe2+
in the presence of oxygen precipitates when pH raises above 1
[13, 15].
Time t0 t3h t6h t9h t12h
pH value -0.2 -0.02 +0.01 +0.36 +0.53
Table 4.2.2.1 pH values during leaching in 4 M NaCl-0.5 M H2SO4-0.4 M CuSO4·5H2O solution
On the whole, leaching testes indicated that an efficient dismantling/leaching of
WPCBs can be conducted at low temperature using a H2SO4-CuSO4-NaCl solution
in the presence of blowing air for the in-situ regeneration of the oxidant. In
particular, the composition which gave the best results was: 4 M NaCl, 0.4 M
CuSO4·5H2O and 0.5M H2SO4 with a CCl/CCu ratio of 10.
Both disassembled components and remaining board maintain their structural
integrity therefore, they can be easily separated and sent to recycle or further
treatments. This is a key point because the current technologies use high
temperatures and external forces (impact, shearing, vibration, etc.) for dismantling
WPCBs with the consequence of i) damaging the components, ii) releasing toxic
substances, and iii) consuming energy. Simultaneously to dismantling, leaching of
copper and other minor metals occurs. The recovery of copper from the leach
solution was investigated by electrolysis. As reported in Chapter 3, electrolysis is
an ideal process for copper recovery. This is a key point because the most current
WPCBs recycling technologies allow the recovery of the copper contained in PCBs
structure, while that present in electronic components’ contacts (pins and leads) is
usually lost. In the following, it will be shown the results concerning the recovery
of copper from the leach solution after a preliminary cyclic voltammetry study.
4.3 Cyclic voltammetry study
A systematic study focused on leach solution electrochemical characterization
by cyclic voltammetry (CV) was undertaken to detect the best operative conditions
for copper recovery. In particular, the study was aimed at investigating the

112
electrochemistry of copper deposition in sulfate-chloride solutions in the presence
of other metal ions such as Ni2+
, Fe2+
, Zn2+
, Pb2+
, Sn2+
because similar studies were
not found in literature. Experimental procedure and results will be reported in the
following.
4.3.1 Material and methods
The copper recovering was studied by cyclic voltammetry. Initially, copper
deposition and dissolution were studied in 0.5 M H2SO4-4 M NaCl synthetic
solution adding 0.4 M of Cu that is the same concentration used for
dismantling/leaching. The electrochemical behaviour of Fe, Ni, Zn, Sn, and Pb in
the same 0.5 M H2SO4-4 M NaCl synthetic solution was also investigated. Then,
the modification of the copper voltammetric curve was investigated when Zn, Fe,
Ni, Pb, and Sn were added to the copper solution, one at a time. At this aim, the
solutions reported in Table 4.3.1.1 were exploited.
Solution number
NaCl (M)
H2SO4
(M) CuSO4· 5H2O (M)
ZnSO4· 7H2O (M)
FeSO4· 7H2O (M)
NiSO4· 7H2O (M)
PbSO4
(M) SnCl2·5H2O (M)
1 4 0.5 0.1 0.1 0 0 0 0
2 4 0.5 0.1 0 0.1 0 0 0
3 4 0.5 0.1 0 0 0.1 0 0
4 4 0.5 0.033 0 0 0 0.033 0
5 4 0.5 0.033 0 0 0 0 0.033
6 4 0.5 0 0 0 0 0.033 0.033
7 4 0.5 0.033 0 0 0 0.033 0.033
Table 4.3.1.1 List of solutions prepared for cyclic voltammetry study of copper in the presence of other metal ions
The possible interference of such metals on the copper voltammogram was
studied using an unitary Men+
/Cu2+
concentration ratio. In the case of Pb2+
, a lower
concentration (33 mM) was used due to the scarce solubility of PbSO4 in the
electrolyte. A concentration equal to that of lead was used also for tin in order to
study the interference between these two elements (solution #6 in Table 4.3.1.1)
since their voltammetric peaks are very close.

113
Finally, CV of a real leach solution was performed, which was interpreted in the
light of the CV of the synthetic solutions.
The CV study was conducted in a standard three-electrode cell with a glassy
carbon disk (3 mm diameter) as a working electrode, a coiled platinum wire (0.8
mm diameter and 10 cm long) as a counter electrode, and a silver/silver-chloride
electrode in saturated KCl solution as a reference (E0=0.197 V vs. NHE). In the
following, all the potentials are referred to it.
The working electrode was mechanically polished with alumina slurry on cloth
until a mirror-bright finishing was obtained, and then washed ultrasonically in
doubly distilled water with HNO3 (1:1 v/v), and ethanol (1:1 v/v) [24]. Accurate
polishing was necessary to obtain good reproducibility.
All experiments were performed in stagnant solution. The electrode potential
was linearly swept at 50 mV/s for three consecutive cycles mainly from +1 V to
-0.7 V and vice-versa, which is the interval for obtaining a complete and well
defined voltammetric curve for copper.
For better understanding the electrochemical behaviour of the different species
in solution, a square wave voltammetry (SVW) was also performed. In this case,
the potential was mainly swept from +1.1 V to -0.8 V and vice-versa using the
following parameters: pulse height 0.050 V, step height 0.002 V, and pulse width
20 ms.
4.3.2 Results and discussion
4.3.2.1 Cyclic voltammetry study of Cu in synthetic H2SO4–
NaCl solution
Figure 4.3.2.1.1 shows the differences between the electrochemical behavior of
copper in a solution containing only sulfate and that in a solution containing both
sulfate and chloride. In the absence of chloride (Figure 4.3.2.1.1a), the
voltammetric curve of a glassy carbon electrode in 0.5 M H2SO4 solution is flat

114
without copper addition, while there are two peaks (Ia and Ic) when 0.4 M
CuSO4·5H2O (MW 249.88 g/mole) was added. Oxidation (Ia) and reduction (Ic)
peaks are associated to the following reaction
Cu2+
+ 2e-
Cu0 (4.3.2.1.1)
This reaction proceeds via a single two electron transfer, which is the typical
mechanism of copper deposition and dissolution in a sulfuric acid medium [25]. At
approximately +0.11 V, the cathodic current starts to sharply increase indicating
the start of copper deposition and forms Ic peak. The decaying cathodic current
past the Ic peak represents the reaction (4.3.2.1.1) in diffusion controlled regime.
Figure 4.3.2.1.1 CV of a glassy carbon electrode in a) 0.5 M H2SO4 and b) 0.5 M H2SO4 -4 M NaCl solution without and with addition of 0.4 M CuSO4·5H2O
A different electrochemical behavior of copper is observed in solution
containing both 0.5 M H2SO4 and 4 M NaCl (Figure 4.3.2.1.1b). In the absence of
copper, the voltammetric curve of a glassy carbon electrode in 0.5 M H2SO4-4 M
NaCl solution is flat, while there are two oxidation and reduction peaks when 0.4
M CuSO4·5H2O was added. The peaks labelled Ia1 and Ic1 are associated to the
reaction
Cu2+
+ 2Cl- + e
- CuCl2
- (4.3.2.1.2)

115
While Ia2 and Ic2 peaks are due to
CuCl2- + e
- Cu
0 + 2Cl
- (4.3.2.1.3)
In practice, a double one-electron transfer occurs owing to the stabilization of Cu+
in solution as a chloro-complex, because Cu+ is not stable in solution of only
sulfate. Reduction from Cu+ to Cu
0 starts at about -0.216 V when the cathodic
current starts to sharply increase and then forms Ic2 peak. This value is more
negative than that measured for Cu2+
/Cu0 couple in 0.5 M H2SO4 (+0.11 V). Such a
potential indicates the strong polarization effect of chloride ion on the
electrodeposition of copper [26].
Similar behavior was also observed in square wave voltammetry, as shown in
Figure 4.3.2.1.2a where the SWV curve of a glassy carbon electrode in 0.5 M H2SO4-4
M NaCl solution without and with addition of 0.4 M CuSO4·5H2O is reported.
The copper voltammetric curves at different concentrations of NaCl are shown
in Figure 4.3.2.1.2b. The more negative potential at which copper deposition starts
as chloride concentration increases, confirms the polarization effect of chloride ion
on copper electrodeposition.
Figure 4.3.2.1.2 a) SWV of a glassy carbon electrode in 0.5 M H2SO4 + 4 M NaCl solution without and with addition of 0.4 M CuSO4·5H2O, b) CV of a glassy carbon electrode in 0.5 M H2SO4 + 0.4 M CuSO4·5H2O
solution containing different concentrations of NaCl

116
As it can be seen, an evident increase in Ia1 and Ic2 peaks intensity is observed
when NaCl concentration decreases from 4 M to 1 M. This was due to the
formation of an insoluble CuCl film on the electrode surface during oxidation from
Cu0 to Cu
+ (represented by Ia2) which occurs through the two following steps [26-
28]
Cu + Cl- CuClads + e
- (4.3.2.1.4)
CuClads + Cl- CuCl2
- (4.3.2.1.5)
Both species undergo a successive oxidation (represented by Ia1) through these two
electrochemical reactions
CuCl2-
Cu2+
+ Cl- + e
- (4.3.2.1.6)
CuClads Cu2+
+ Cl- + e
- (4.3.2.1.7)
At higher NaCl concentration (i.e. higher CCl/CCu ratio), the adsorbed CuCl film
is converted into soluble CuCl2- chloro-complex, while oxidation to Cu
2+ occurs
exclusively via reaction 4.3.2.1.6. At lower NaCl concentration (i.e. lower CCl/CCu
ratio), reaction 4.3.2.1.5 is slower leading to accumulation of CuCl on the electrode
so that, oxidation to Cu2+
occurs via reactions 4.3.2.1.6 and 4.3.2.1.7 with
consequent increase of Ia1 peak intensity. Similarly, also the intensity of Ic2 peak
increases because the current response includes both reduction from CuClads to Cu0
and from CuCl2- to Cu
0. Indeed, although the reduction mechanism is still unclear
owing to the effect of a large number of parameters influencing the stability of
chloro-complexes that can be formed in the first stage of the reduction, some
authors [27-28] claim that also Cu2+
reduction occurs with intermediate formation
of CuCl according to
Cu2+
+ Cl- + e
- CuClads
(4.3.2.1.8)
CuClads + Cl- CuCl2
- (4.3.2.1.9)

117
Then, both CuCl and CuCl2- can be further reduced to Cu
0. This is a key point
because in a copper recovery process, copper deposit could result contaminated by
CuCl in dependence on CCl/CCu ratio.
The effect of different Cu concentrations on CV of a glassy carbon electrode in
0.5 M H2SO4-4 M NaCl solution is shown in Figure 4.3.2.1.3a-b. An increase in
peaks intensity with the increase of copper concentration is revealed, in accordance
with Randles-Sevcik’s equation [29]. Copper deposition starts at about -0.285 V,
-0.245 V and -0.216 V for Cu concentrations of 32 mM, 0.12 M and 0.4 M,
respectively.
Figure 4.3.2.1.3 (a-b) CV of a glassy carbon electrode in 0.5 M H2SO4-4 M NaCl solution at different concentrations of CuSO4·5H2O
The plateau of current next to Ia2, which becomes clearer as the copper
concentration increases (i.e. as the CCl/CCu ratio decreases), is probably due to a
CuCl layer of increasing thickness in equilibrium with its simultaneous dissolution
[30]. The significant increase in Ia1 peak intensity passing from 0.12 M to 0.4 M
that partially covers the plateau could be due to an excessive reduction of the
CCl/CCu ratio with consequent accumulation of CuCl on the electrode surface
according to Eq. 4.3.2.1.4. In a process of recovering copper from the solution
resulting from WPCBs dismantling, this could result in a lower purity of the
deposit because the leaching solution starts from a copper concentration of 0.4 M.

118
Despite this eventuality, leaching/dismantling tests proved that the initial copper
concentration had to be sufficiently high to guarantee the complete dissolution of
the metallic fraction from waste PCBs.
4.3.2.2 Cyclic voltammetry study of Pb, Sn, Fe, Zn and Ni in
synthetic H2SO4–NaCl solution
CV of a glassy carbon electrode scanned from +0 V to -1.25 V and vice-versa in
0.5 M H2SO4-4 M NaCl solution with addition of ZnSO4·7H2O (MW 287.55
g/mol) at different concentrations is reported in Figure 4.3.2.2.1a. The redox
process involved during the scan of potential can be described by the following
electrochemical reaction
Zn2+
+ 2e- Zn
0 (4.3.2.2.1)
The anodic curve shows a peak (Ia1) whose intensity increases with zinc
concentration, according to Randles-Sevcik’s equation [29]. The cathodic curve
sharply increases at -1.16 V and -1.09 V for a Zn concentration of 35 mM and 0.14
M, respectively, without generating a peak. This can be due to the simultaneous
hydrogen evolution reaction which accompanies zinc deposition [31-35].
Figure 4.3.2.2.1 CV of a glassy carbon electrode in 0.5 M H2SO4-4 M NaCl solution with addition of ZnSO4·7H2O: a) at different concentrations; b) at 140 mM

119
The voltammetric curve related to a Zn concentration of 0.14 M is shown in
Figure 4.3.2.2.1b. The point A corresponds to the dissolution of the cathodically-
deposited zinc while point C corresponds to the potential of nucleation starting.
The crossover in D is typical of the formation of a new phase involving a
nucleation process. Instead, the crossover in B at zero net current represents the
equilibrium potential of the couple Zn2+
/Zn0 [33]. The potential difference between
the reduction potential at point C and the equilibrium potential at point B is a
measure of the nucleation overpotential (NOP) for zinc deposition on a foreign
substrate in glass carbon [35].
CV of a glassy carbon electrode scanned from +0.8 V to -0.8 V and vice-versa
in 4 M NaCl-0.5 M H2SO4 solution with addition of PbSO4 (MW 303.26 g/mol) at
different concentrations is shown in Figure 4.3.2.2.2a. Despite PbSO4 is poorly
soluble in water (44 mg/L), it was found that about 10 g/L of PbSO4 can be
dissolved at room temperature in 4 M NaCl-0.5 M H2SO4 solution. The value can
increase to 12 g/L by means of a bland heating (T=50°C). The increase in solubility
can be due to the formation of chloro-complexes according to
Pb2+
+ nCl- = PbCln
2-n (n=1,2,3) (4.3.2.2.2)
The highest concentration used for the CV study of lead was 33 mM, which
corresponds to the maximum quantity of PbSO4 that can be dissolved in 50 mL of 4
M NaCl+0.5 M H2SO4. The peak labelled Ic1 in Figure 4.3.2.2.2a is associated to
the reduction from Pb2+
to Pb, which starts at about -0.515 V for the CV curve at
33 mM of Pb. Mehta et al. [36] attributed the more negative value than the formal
one for the redox couple Pb2+
/Pb to the complexation of Pb2+
by means of chloride
ion. Besides, Figure 4.3.2.2.2a shows an increase in peaks intensity with Pb
concentration, according to the theory on CV [29].

120
Figure 4.3.2.2.2 CV of a glassy carbon electrode in 0.5 M H2SO4-4 M NaCl solution with addition of different concentrations of a) PbSO4 and b) SnCl2·5H2O
Cyclic voltammetry of a glassy carbon electrode in synthetic 0.5 M H2SO4-4 M
NaCl solution with addition of SnCl2·5H2O (MW 279.69 g/mol) at different
concentrations is shown in Figure 4.3.2.2.2b. The potential was scanned within the
interval 1.1 V÷ -0.9 V. The existence of two redox reactions is revealed, which are
Sn4+
+ 2e- Sn
2+ (4.3.2.2.3)
Sn2+
+ 2e- Sn
0 (4.3.2.2.4)
The Ia1 peak is due to reaction 4.3.2.2.3 while the absence of the corresponding
reduction peak reveals a strong irreversibility of the process [37]. The peaks
labelled Ia2 and Ic2 are associated to reaction 4.3.2.2.4. For the 35 mM Sn solution,
a sharp onset of the cathodic current occurs at about -0.553 V, which is very similar
to the value found for the Pb2+
/Pb couple at 33 mM of Pb. The presence of a
crossover between the cathodic and anodic curve indicates nuclei formation on the
electrode surface [38].
Figure 4.3.2.2.3a shows CV curves of a glassy carbon electrode scanned from
+1 V to -1.2 V and vice-versa in 0.5 M H2SO4-4 M NaCl solution added with
different amounts of FeSO4·7H2O (MW 278 g/mol).

121
Figure 4.3.2.2.3 CV of a glassy carbon electrode in in 0.5 M H2SO4-4 M NaCl solution with addition of a) FeSO4·7H2O and b) NiSO4·7H2O at different concentrations
The two redox reactions revealed by the voltammetric curves are
Fe3+
+ e- Fe
2+ (4.3.2.2.5)
Fe2+
+ 2e- Fe (4.3.2.2.6)
Ia1 and Ic1 peaks of Figure 4.3.2.2.3a are associated to reaction 4.3.2.2.5. The
oxidation peak labelled Ia2 is related to reaction 4.3.2.2.6. For all concentrations of
Fe, the cathodic current starts to sharply increase at about -1 V without a clear
reduction peak coupled to Ia2 likely because iron nucleation starts in parallel with
hydrogen evolution [39]. The Ia2 peak appears when iron concentration is 0.14 M,
at least. Therefore, for lower Fe concentrations, the quantity of iron deposited on
the electrode surface is negligible likely because hydrogen gas hinders iron
deposition.
Figure 4.3.2.2.3b shows CV curves of a glassy carbon electrode scanned from
+0.2 V to -1.3 V and vice-versa in 0.5 M H2SO4-4M NaCl solution added with
different amounts of NiSO4·7H2O (MW 280.76 g/mol). The electrochemical
behavior is similar to that observed for iron. The Ia1 peak is associated to the
reaction
Ni0 Ni
2+ + 2e
- (4.3.2.2.7)

122
The corresponding reduction peak does not appear due to reduction of H+
to H2
that, according to some authors [40], shields nickel deposition peak. The final
cathodic potential was limited until -1.3 V in order to reveal the Ia1 peak, probably
because hydrogen gas hinders nickel deposition [41]. The cathodic current starts to
sharply increase at -0.95 V and -0.85 V for a Ni concentration of 35 mM and 0.14
M, respectively.
It should be noted that all the voltammograms (Figures 4.3.2.1.3, 4.3.2.2.1-
4.3.2.2.3) show an increase of the peak-to-peak separation (ΔEp=Epox
- Epred
,
where Epox
and Epred
are the oxidation and reduction peak potentials, respectively)
as the concentration of the electroactive species in solution increases. According to
the literature [42], this is due to the fact that the diffusion layer becomes thinner
and the concentration gradient steeper with increasing concentration or scan rate.
In 0.5 M H2SO4-4 M NaCl, deposition of copper starts enough before than other
metal ions, favouring the possibility to obtain a pure copper deposit. For instance,
deposition of copper starts at about -0.285 V while that of Pb, Sn, Ni, Fe and Zn at
about -0.515 V, -0.553 V, -0.95 V, -1 V and -1.16 V, respectively when Men+
concentration in solution is approximately the same (32-35 mM). To confirm this
results, the interference of such metals on the copper voltammogram was
investigated.
4.3.2.3 Cyclic voltammetry study of copper with other metal
ions in synthetic H2SO4–NaCl solution
A list of the solutions prepared to investigate the influence of other metals such
as Pb, Sn, Zn, Fe and Ni on CV of copper is shown in Table 4.3.1.1.
It was found that zinc and nickel do not have any influence when the potential is
scanned within the range +1 to -0.7 V, which is the best interval to have a complete
and well defined copper voltammetric curve.
In Figure 4.3.2.3.1a a square wave voltammetry of a glassy carbon electrode in
0.5 M H2SO4-0.1 M CuSO4·5H2O-4 M NaCl with addition of ZnSO4·7H2O at

123
different concentrations is reported. In this case, SWV was preferred to CV because
the resultant curve does not present any crossover between the anodic and the
cathodic curve making easier the comparison of the curves obtained under different
conditions.
Figure 4.3.2.3.1 SWV of a glassy carbon electrode in 4 M NaCl-0.5 M H2SO4-0.1 M CuSO4·5H2O solution with addition of ZnSO4·7H2O: a) at different concentrations; b) at 0.1 M and different values of the final cathodic
potential
As shown, the addition of 0.1 M Zn does not determine any modification on the
copper voltammetric curve within the investigated interval of potential. Two
specific peaks (Ia3 and Ic3) attributable to the Zn2+
/Zn couple appear in Figure
4.3.2.3.1b starting from a final cathodic potential (Ef) of -0.9 V. A further reduction
of Ef leads to an increase in Ia3 peak intensity, likely due to the increased amount of
zinc deposited on electrode surface because deposition partially continues even
after Ic3 peak together with hydrogen evolution.
Similar results were obtained also for the couple Cu/Ni. Figure 4.3.2.3.2a shows
that no modification on square wave copper voltammogram in 0.5 M H2SO4-0.1 M
CuSO4·5H2O-4 M NaCl is determined in the interval 1÷ -0.7 V by addition of 0.1
M NiSO4·7H2O.
In the same interval of potential, the addition of 0.1 M FeSO4·7H2O in 0.5 M
H2SO4-0.1 M CuSO4·5H2O-4 M NaCl solution determined the appearance of a

124
peak (Ia3) at +0.549 V related to the Fe3+
/Fe2+
couple and an increase in Ic1 peak
intensity (Figure 4.3.2.3.2b). Nevertheless, no simultaneous electrodeposition of
iron together with copper is revealed in the investigated interval of potential. The
plateau of current next to Ia2 peak is likely due to reduction of copper concentration
from 0.4 M to 0.1 M, as shown in Figure 4.3.2.1.3.
Figure 4.3.2.3.2 a) SWV of a glassy carbon electrode in 4 M NaCl-0.5 M H2SO4-0.1 M CuSO4·5H2O solution without and with addition of NiSO4·7H2O; b) CV of a glassy carbon electrode in 4 M NaCl-0.5 M H2SO4-0.1
M CuSO4·5H2O solution without and with addition of FeSO4·7H2O
Figure 4.3.2.3.3 shows the voltammetric curves obtained in 4 M NaCl-0.5 M
H2SO4-33 mM CuSO4·5H2O solution with addition of either PbSO4 or SnCl2·5H2O
(see solution number 4 and 5 in Table 4.3.1.1).
Figure 4.3.2.3.3 CV of a glassy carbon electrode scanned from 1 V to -0.8 V and from 1 V to -0.5 V in 4 M NaCl-0.5 M H2SO4-33 mM CuSO4·5H2O solution without and with addition of a) 33 mM PbSO4; b) 33 mM
SnCl2·5H2O
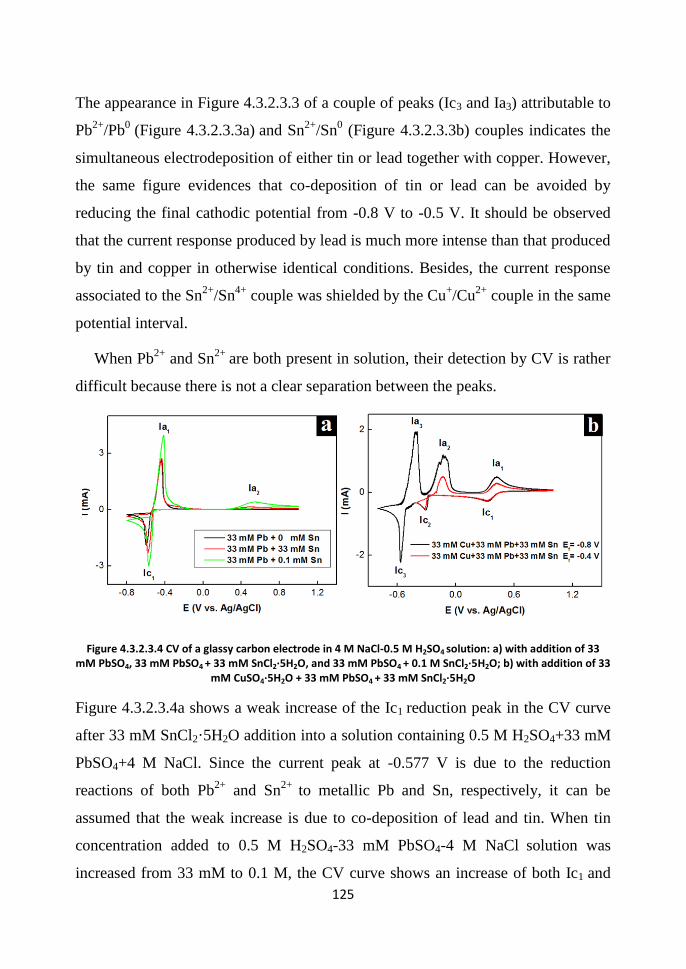
125
The appearance in Figure 4.3.2.3.3 of a couple of peaks (Ic3 and Ia3) attributable to
Pb2+
/Pb0
(Figure 4.3.2.3.3a) and Sn
2+/Sn
0 (Figure 4.3.2.3.3b) couples indicates the
simultaneous electrodeposition of either tin or lead together with copper. However,
the same figure evidences that co-deposition of tin or lead can be avoided by
reducing the final cathodic potential from -0.8 V to -0.5 V. It should be observed
that the current response produced by lead is much more intense than that produced
by tin and copper in otherwise identical conditions. Besides, the current response
associated to the Sn2+
/Sn4+
couple was shielded by the Cu+/Cu
2+ couple in the same
potential interval.
When Pb2+
and Sn2+
are both present in solution, their detection by CV is rather
difficult because there is not a clear separation between the peaks.
Figure 4.3.2.3.4 CV of a glassy carbon electrode in 4 M NaCl-0.5 M H2SO4 solution: a) with addition of 33 mM PbSO4, 33 mM PbSO4 + 33 mM SnCl2·5H2O, and 33 mM PbSO4 + 0.1 M SnCl2·5H2O; b) with addition of 33
mM CuSO4·5H2O + 33 mM PbSO4 + 33 mM SnCl2·5H2O
Figure 4.3.2.3.4a shows a weak increase of the Ic1 reduction peak in the CV curve
after 33 mM SnCl2·5H2O addition into a solution containing 0.5 M H2SO4+33 mM
PbSO4+4 M NaCl. Since the current peak at -0.577 V is due to the reduction
reactions of both Pb2+
and Sn2+
to metallic Pb and Sn, respectively, it can be
assumed that the weak increase is due to co-deposition of lead and tin. When tin
concentration added to 0.5 M H2SO4-33 mM PbSO4-4 M NaCl solution was
increased from 33 mM to 0.1 M, the CV curve shows an increase of both Ic1 and

126
Ia1 peaks, and the appearance of a peak at +0.532 V (Ia2) due to Sn2+
/Sn4+
irreversible oxidation.
The interaction between Pb, Sn and Cu was also investigated. The CV of a
glassy carbon electrode in 0.5 M H2SO4-4 M NaCl-33 mM CuSO4·5H2O-33 mM
PbSO4-33 mM SnCl2·5H2O solution is shown in Figure 4.3.2.3.4b. As it can be
seen, there is no a clear separation between peaks of Pb and Sn. The couple of
Ia3/Ic3 peaks can be attributed to both these two elements. However, the figure
shows that co-deposition of Pb and Sn together with copper can be avoided
reducing the final cathodic potential from -0.8 V to -0.4 V without altering
deposition process of copper represented by Ic2 peak.
Table 4.3.2.3.1 shows the values of potential at which metals deposition starts
(Ed) in the CV curves obtained coupling Cu with another metal ion such as Pb, Sn,
Ni, Fe and Zn in synthetic 0.5 H2SO4-4 M NaCl solution (see solutions 1-5 in Table
4.3.1.1). All the values are extracted assuming as Ed the value of potential at which
the cathodic curve starts to abruptly increase.
Cu/Zn Cu/Fe Cu/Ni Cu/Pb Cu/Sn
Ed,Cu
(V vs Ag/AgCl) -0.243
-0.244
-0.263 -0.285
-0.275
Ed,Me
(V vs Ag/AgCl) -0.858 -0.740 -0.682 -0.491 -0.510
Table 4.3.2.3.1 Potential values from the CV curves of a glassy carbon electrode in the solutions reported in Table 4.3.1.1
According with Table 4.3.2.3.1, pure copper could be theoretically recovered
maintaining a potential just under -0.285 V. In a next step, also lead and tin could
be theoretically recovered from the leach solution reducing the potential just under
-0.5 V. For the recovery of Ni, Zn and Fe, a further reduction of the potential
would be necessary with the risk of hydrogen evolution.
Besides, the electrochemical characterization of the synthetic solutions indicates
the possibility of low current efficiency in the copper recovery process from the

127
leach solution due to the consumption of charge at cathode related to the Sn2+
/Sn4+
and Fe2+
/Fe3+
redox couples.
4.3.2.4 Cyclic voltammetry study of a real solution resulting
from the leaching step
The electrochemical characterization of glassy carbon electrode in synthetic
solutions made possible to exhaustively characterize the solution coming from the
dismantling/leaching of the WPCB to detect the operative conditions for effective
copper recovery [4, 43].
Figure 4.3.2.4.1a shows the CV curve obtained in the leach solution when the
potential was scanned in the interval 1÷ -0.7 V. For comparison, the CV curve
obtained in 4 M NaCl-0.5 M H2SO4-0.4 M CuSO4·5H2O synthetic solution (blank
solution) is also reported.
Figure 4.3.2.4.1 a) CV of a glassy carbon electrode in leach solution; b) SWV of a glassy carbon electrode in leach solution with addition of 7 mM Pb, 33 mM Pb and 33 mM Sn
To identify the new appeared couple of peaks, small concentrations of Pb or Sn
ions were added to the leach solution for investigating the effect produced on the
voltammetric curve. In this case, a square wave voltammetry was preferred since it
allows a clearer view of Ia3 peak. Figure 4.3.2.4.1b shows as the addition of either
Pb or Sn to the leach solution increases the intensity of both peaks Ic3 and Ia3
without any other modifications. The increase in Ia3 peak intensity is higher for

128
lead than tin with a possible doubling in otherwise identical conditions. Therefore,
the leach solution probably contained both lead and tin, but lead in lower
concentrations than tin as also confirmed by the leaching tests that showed a not
complete removal of Pb from the soldering paste due to passivation effect.
However, the CV curve marked in green in Figure 4.3.2.4.1a shows that
reducing the final cathodic potential from -0.7 V to -0.56 V, it is possible to
remove the couple of peaks without influencing the Cu+/Cu reduction peak (Ic2)
and then, without influencing the copper recovery. Besides, electrochemical
characterization of the leach solution suggests to maintain the potential between
-0.24 and -0.45 V, i.e. between the potential at which copper deposition starts and
that of the cathodic peak for the Cu+/Cu couple, in order to obtain a pure deposit in
the copper recovery process.
4.4 Copper recovery from the leach solution
Copper, in the form of ions, is the most abundant element in the solution
from dismantling/leaching of the WPCB. This solution contains several other ions
such as Zn2+
, Fe2+
, Ni2+
, Sn2+
, Pb2+
coming from oxidation of the EC pins and
soldering paste. In principle, such ions could interfere with the copper recovery via
cathodic deposition, but the electrochemical characterization by CV showed the
possibility of selectively recovering metallic copper at high purity. To confirm
these findings, specific tests of copper recovering were conducted.
Since in a possible real process the dismantling/leaching of WPCBs could
occur simultaneously to the copper recovery, initially, these two steps were coupled
for the treatment of an entire computer motherboard. However, due to some
difficulties encountered in managing different working parameters for optimization
of both leaching and recovery process, it was preferred to study electrochemical
deposition of copper separately from leaching. At this purpose, a divided
electrochemical cell was assembled with graphite and a pure copper sheet, acting as
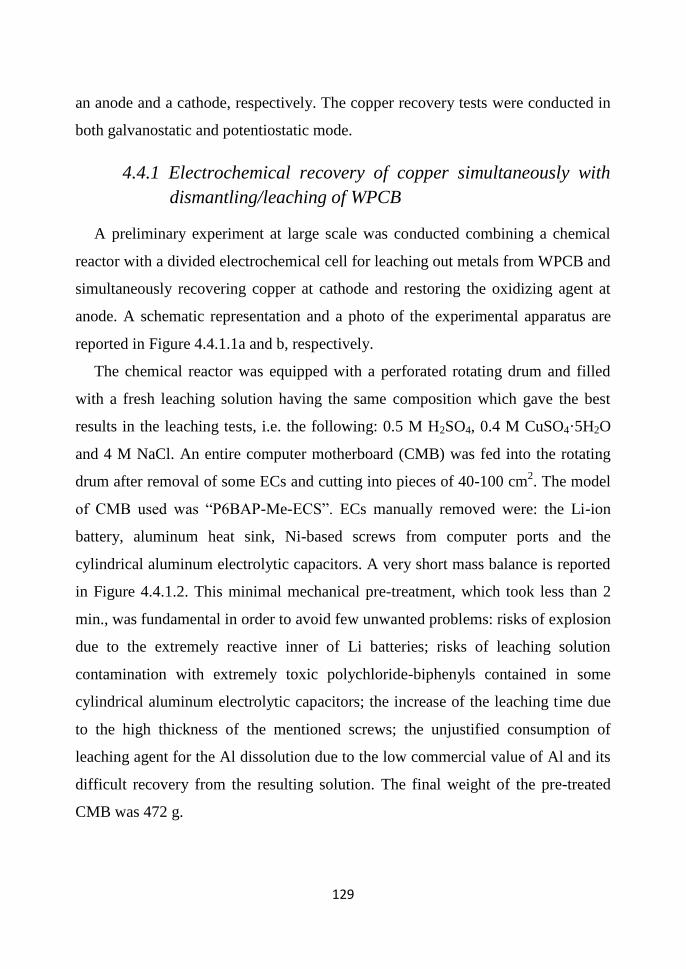
129
an anode and a cathode, respectively. The copper recovery tests were conducted in
both galvanostatic and potentiostatic mode.
4.4.1 Electrochemical recovery of copper simultaneously with
dismantling/leaching of WPCB
A preliminary experiment at large scale was conducted combining a chemical
reactor with a divided electrochemical cell for leaching out metals from WPCB and
simultaneously recovering copper at cathode and restoring the oxidizing agent at
anode. A schematic representation and a photo of the experimental apparatus are
reported in Figure 4.4.1.1a and b, respectively.
The chemical reactor was equipped with a perforated rotating drum and filled
with a fresh leaching solution having the same composition which gave the best
results in the leaching tests, i.e. the following: 0.5 M H2SO4, 0.4 M CuSO4·5H2O
and 4 M NaCl. An entire computer motherboard (CMB) was fed into the rotating
drum after removal of some ECs and cutting into pieces of 40-100 cm2. The model
of CMB used was “P6BAP-Me-ECS”. ECs manually removed were: the Li-ion
battery, aluminum heat sink, Ni-based screws from computer ports and the
cylindrical aluminum electrolytic capacitors. A very short mass balance is reported
in Figure 4.4.1.2. This minimal mechanical pre-treatment, which took less than 2
min., was fundamental in order to avoid few unwanted problems: risks of explosion
due to the extremely reactive inner of Li batteries; risks of leaching solution
contamination with extremely toxic polychloride-biphenyls contained in some
cylindrical aluminum electrolytic capacitors; the increase of the leaching time due
to the high thickness of the mentioned screws; the unjustified consumption of
leaching agent for the Al dissolution due to the low commercial value of Al and its
difficult recovery from the resulting solution. The final weight of the pre-treated
CMB was 472 g.
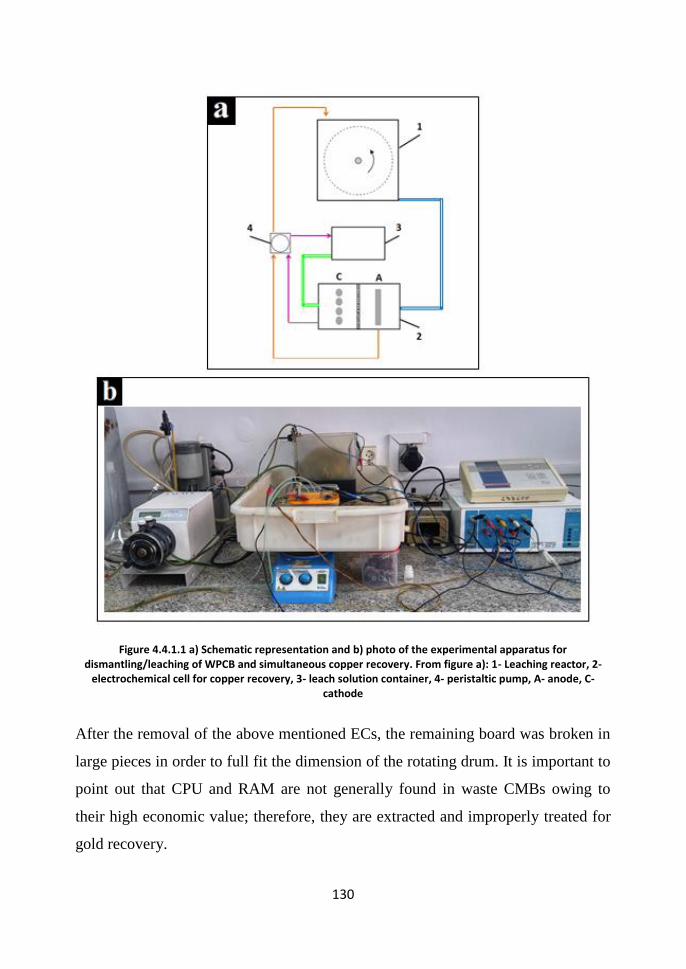
130
Figure 4.4.1.1 a) Schematic representation and b) photo of the experimental apparatus for dismantling/leaching of WPCB and simultaneous copper recovery. From figure a): 1- Leaching reactor, 2-
electrochemical cell for copper recovery, 3- leach solution container, 4- peristaltic pump, A- anode, C- cathode
After the removal of the above mentioned ECs, the remaining board was broken in
large pieces in order to full fit the dimension of the rotating drum. It is important to
point out that CPU and RAM are not generally found in waste CMBs owing to
their high economic value; therefore, they are extracted and improperly treated for
gold recovery.

131
Figure 4.4.1.2 Mass balance of mechanical pre-treatment
The electrochemical reactor consisted of a two
compartment cell divided by a ceramic
membrane. The anode was a graphite block of
dimension 8x7x2 cm, the cathode consisted of
four graphite rods each having 1 cm of
diameter and 8 cm of length (see the figure on
the left).
As shown in Figure 4.4.1.1a, the anodic compartment was in communication with
the leaching reactor through a tube (in blue in Figure 4.4.1.1a) and 2.5 L of fresh
leaching solution was used to fill them both. The anolyte was pumped from the
anodic chamber to the leaching reactor through a peristaltic pump with a flow rate
of 300 mL of solution per minute (Qa). In this way, the anode played the same role
than oxygen in the leaching tests, which is that of regenerating the oxidizing agent
(Cu2+
) to guarantee an effective extraction of metals from WPBC. The cathodic
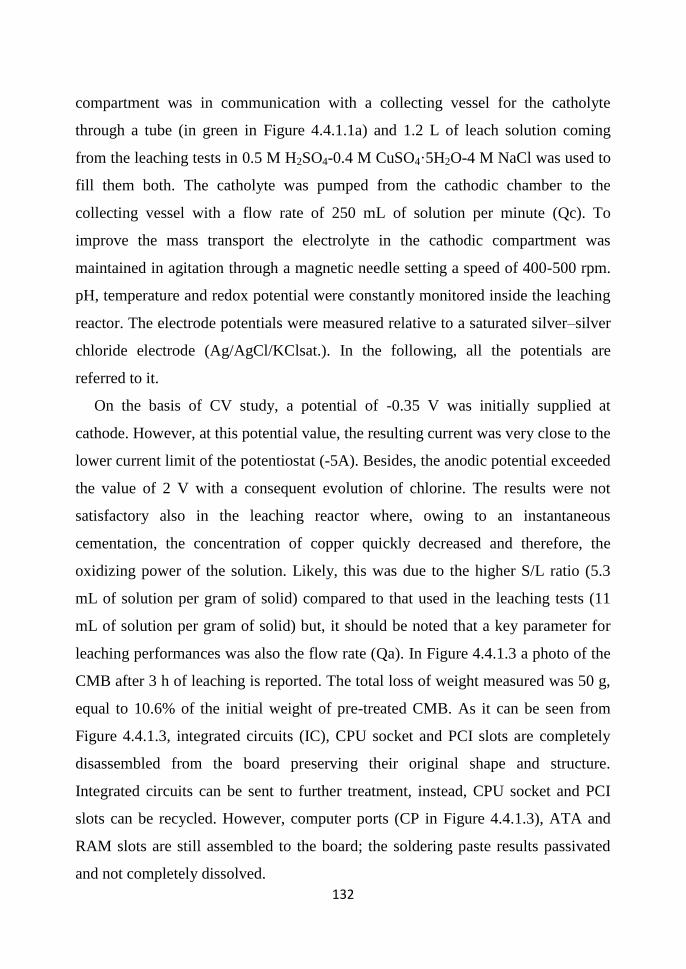
132
compartment was in communication with a collecting vessel for the catholyte
through a tube (in green in Figure 4.4.1.1a) and 1.2 L of leach solution coming
from the leaching tests in 0.5 M H2SO4-0.4 M CuSO4·5H2O-4 M NaCl was used to
fill them both. The catholyte was pumped from the cathodic chamber to the
collecting vessel with a flow rate of 250 mL of solution per minute (Qc). To
improve the mass transport the electrolyte in the cathodic compartment was
maintained in agitation through a magnetic needle setting a speed of 400-500 rpm.
pH, temperature and redox potential were constantly monitored inside the leaching
reactor. The electrode potentials were measured relative to a saturated silver–silver
chloride electrode (Ag/AgCl/KClsat.). In the following, all the potentials are
referred to it.
On the basis of CV study, a potential of -0.35 V was initially supplied at
cathode. However, at this potential value, the resulting current was very close to the
lower current limit of the potentiostat (-5A). Besides, the anodic potential exceeded
the value of 2 V with a consequent evolution of chlorine. The results were not
satisfactory also in the leaching reactor where, owing to an instantaneous
cementation, the concentration of copper quickly decreased and therefore, the
oxidizing power of the solution. Likely, this was due to the higher S/L ratio (5.3
mL of solution per gram of solid) compared to that used in the leaching tests (11
mL of solution per gram of solid) but, it should be noted that a key parameter for
leaching performances was also the flow rate (Qa). In Figure 4.4.1.3 a photo of the
CMB after 3 h of leaching is reported. The total loss of weight measured was 50 g,
equal to 10.6% of the initial weight of pre-treated CMB. As it can be seen from
Figure 4.4.1.3, integrated circuits (IC), CPU socket and PCI slots are completely
disassembled from the board preserving their original shape and structure.
Integrated circuits can be sent to further treatment, instead, CPU socket and PCI
slots can be recycled. However, computer ports (CP in Figure 4.4.1.3), ATA and
RAM slots are still assembled to the board; the soldering paste results passivated
and not completely dissolved.

133
Figure 4.4.1.3 Computer motherboard after 3 h of leaching
Since process optimization required the study of different operating parameters
(S/L ratio, Qa, Qc, applied potential etc.), of their interaction and their influence
both on the leaching and electrochemical process, it was decided to investigate
copper recovery separately from dismantling/leaching.
4.4.2 Electrochemical recovery of copper separately from
dismantling/leaching of WPCB
A divided electrochemical cell operating in either galvanostatic or potentiostatic
mode was employed to investigate copper recovery. Despite copper recovery was
investigated separately from dismantling/leaching, the configuration of the
electrochemical reactor was designed to allow copper recovery at cathode and
leaching solution restoration at anode in order to simulate a real process in which
leaching reactor and electrochemical cell operate in continuous. Experimental
procedure and results will be reported in the following.

134
4.4.2.1 Material and methods
A schematic representation of the electrochemical cell used for copper recovery
tests is shown in Figure 4.4.2.1.1. A 99.8% purity copper sheet was used as a
cathode, and a graphite block (8x7x2 cm) as an anode. To improve the primary
current distribution, one side of the cathode was coated with an insulating resin in
order to expose to the electrolyte only the side opposite to the anode.
Figure 4.4.2.1.1 Schematic representation of the electrochemical cell used for copper recovery tests
The electrode potentials were referenced to saturated silver–silver chloride
electrodes (Ag/AgCl/KClsat.). The anodic and the cathodic compartments were
divided by a ceramic membrane, and both filled with the solution resulting from
the leaching. The cathodic solution was magnetically stirred at 500 rpm. The
electrolyte was the same for both compartments of the cell to simulate a real
process in which copper deposition occurs simultaneously to dismantling/leaching.

135
A possible real process is schematized in Figure 4.4.2.1.2. As it can be seen, the
leach solution is directly fed to the cathodic compartment and then passed to the
anodic one for the leaching solution restoration. Before use as an electrolyte,
Cu2+
/Cu+ ratio of the leach solution was decreased to avoid excessive electrical
charge consume at cathode due to the reduction of Cu2+
to Cu+.
Figure 4.4.2.1.2 Block diagram of a possible real process of WPCBs disassembling and simultaneous copper recovery
At this aim, 50 g of copper from waste
electric cables was added to 0.5 L of leach
solution. In Figure 4.4.2.1.3 it can be seen
as the oxidation-reduction potential
(ORP) of the solution decreases from
+0.49 V to +0.335 V in 3600 s. During
the chemical reduction, the leach solution
changed from green to brown.
Figure 4.4.2.1.3 Redox potential profile during chemical reduction of the leach solution
It should be note that, in an industrial perspective, this process could be carried out
using the same WPCBs before sending them to the leaching reactor. In this way,
the problem of copper cementation in the leaching reactor would be also reduced.
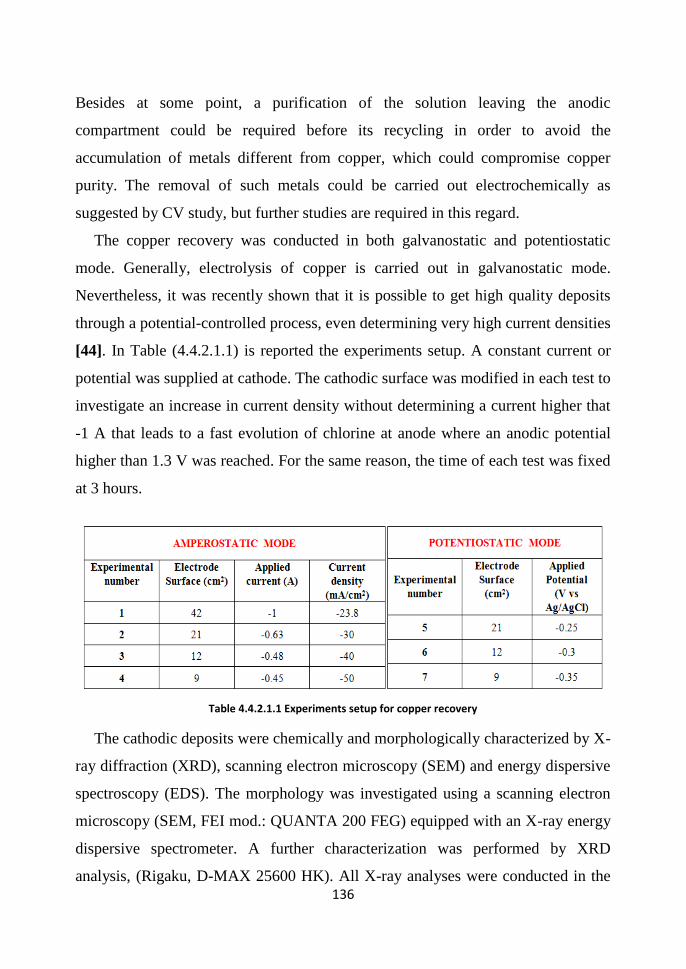
136
Besides at some point, a purification of the solution leaving the anodic
compartment could be required before its recycling in order to avoid the
accumulation of metals different from copper, which could compromise copper
purity. The removal of such metals could be carried out electrochemically as
suggested by CV study, but further studies are required in this regard.
The copper recovery was conducted in both galvanostatic and potentiostatic
mode. Generally, electrolysis of copper is carried out in galvanostatic mode.
Nevertheless, it was recently shown that it is possible to get high quality deposits
through a potential-controlled process, even determining very high current densities
[44]. In Table (4.4.2.1.1) is reported the experiments setup. A constant current or
potential was supplied at cathode. The cathodic surface was modified in each test to
investigate an increase in current density without determining a current higher that
-1 A that leads to a fast evolution of chlorine at anode where an anodic potential
higher than 1.3 V was reached. For the same reason, the time of each test was fixed
at 3 hours.
Table 4.4.2.1.1 Experiments setup for copper recovery
The cathodic deposits were chemically and morphologically characterized by X-
ray diffraction (XRD), scanning electron microscopy (SEM) and energy dispersive
spectroscopy (EDS). The morphology was investigated using a scanning electron
microscopy (SEM, FEI mod.: QUANTA 200 FEG) equipped with an X-ray energy
dispersive spectrometer. A further characterization was performed by XRD
analysis, (Rigaku, D-MAX 25600 HK). All X-ray analyses were conducted in the

137
2ϑ range from 5° to 100° using the Cu Kα radiation (λ=1.54 Å). Diffraction
patterns were analysed by comparison with ICDD database [45].
The current efficiency of copper deposition was determined by the following
equation
ηCu
=We
Wt (4.4.2.1.1)
where We is the experimental weight of copper deposited on the cathode and Wt is
the theoretical weight of deposited copper calculated with Faraday's law
Wt=MCuI t
zCuF (4.4.2.1.2)
where MCu is the molar mass of copper; I the applied current; t the time of the
electrolysis; zCu the valence of copper; F the Faraday’s constant.
4.4.2.2 Results and discussion
In Figure 4.4.2.2.1 a photo of the copper deposits obtained in galvanostatic and
potentiostatic modes after 3 h is reported.
Figure 4.4.2.2.1 Photo of the deposits obtained by copper electrolysis at different operating conditions
Deposits obtained in potentiostatic mode appear dendritic along the edges where
the higher local current density favours the dendritic growth [46-47]. It's likely that
at the edges, copper deposition becomes mass transfer limited or very close to the

138
mass transfer limit. The average cathodic current density was about 60, 80 and 90
mA/cm2
for cathode polarization at -0.25 V, -0.3 V and -0.35 V, respectively. On
the contrary, the current density referred at cathode geometrical area ranged from
23.8 to 50 mA/cm2 in the galvanostatic mode. Therefore, the current density on the
edges was higher in potentiostatic mode than galvanostatic one. The key role of the
local current density is further evidenced by the enhancement of the dendritic
morphology as the electrode potential was growing from -0.25 V to -0.35 V. The
dendritic structure is undesired because the copper deposit must be melted prior to
any further working. Of course, this would be a severe disadvantage for
technological application.
The deposits of Figure 4.4.2.2.1 appear of a green color especially those obtained at
-0.63, -0.48 and -0.45 A. For this reason, an XRD and EDS characterization was
conducted. In Table 4.4.2.2.1 the results of the EDS analysis are reported. The as
obtained deposits are not pure because contain elements such as Cl and O, in
addition to Cu. The atomic composition of the deposits obtained at -0.63, -0.48 and
-0.45 A is very similar to that obtained at -0.30 V and -0.35 V. The deposit at
higher purity is that obtained at -1 A and, to a lesser extent, the one at -0.25 V.
Element
POWER SUPPLY
AMPEROSTATIC MODE
A
POTENTIOSTATIC MODE
V vs Ag/AgCl
-1 -0.63 -0.48 -0.45 -0.25V -0.3V -0.35V
O 15.42% 32.37% 31.05% 31.39% 28.58% 34.75% 40.44%
Cl 16.06% 22.47% 25.92% 25.97% 14.35% 24.12% 21.33%
Cu 68.52% 45.16% 43.02% 42.64% 57.07% 41.13% 38.22%
Table 4.4.2.2.1 Elemental composition (at. %) by EDS analysis of the copper deposits obtained by electrodeposition from the solution resulting from dismantling/leaching of WPCBs
An XRD analysis was performed for identifying the species present in the
deposits, the results are shown in Table 4.4.2.2.2. By analogy with EDS results, the
deposits obtained at -1 A and -0,25 V contain a fewer number of phases different

139
from copper. The main impurities in all deposits are represented by CuO and CuCl,
this last probably determines the greenish color observed in Figure 4.4.2.2.1 in
presence of CuCl2. Diffraction patterns were analyzed by comparison with ICDD
database [45].
POWER SUPPLY
AMPEROSTATIC MODE
A
POTENTIOSTATIC MODE
V vs Ag/AgCl
-1 -0.63 -0.48 -0.45 -0.25V -0.3V -0.35V
Cu
CuO
CuCl
Cu
CuO
CuCl
Cu2O
CuCl2
Cu
CuO
CuCl
Cu2O
CuCl2
Cu(OH)2
Cu
CuO
CuCl
Cu2O
CuCl2
Cu(OH)2
Cu
CuO
CuCl
Cu2O
Cu
CuO
CuCl
Cu2O
CuCl2
Cu(OH)2
Cu3Cl4(OH)2
Cu
CuO
CuCl
Cu2O
CuCl2
CuCl2·3Cu(OH)2
Table 4.4.2.2.2 Phases detected by XRD analysis on the deposits obtained by copper recovery tests
The presence of CuCl on deposits had already been suggested by CV study,
investigating on mechanism of copper deposition in chloride-sulphate solutions
(Eq. 4.3.2.1.8 and 4.3.2.1.9). It's likely that, owing to copper dissolution from
WPCBs, copper concentration in solution exceeds the initial value of 0.4 M leading
to a Cu2+
deposition controlled by CuCl formation since Cl- is not enough to
guarantee the conversion in chloro-complexes. As for the presence of CuO, its
formation is due to the pH raising at the electrode/electrolyte interface owing to the
parasitic reaction of hydrogen evolution, which can accompany copper deposition
especially in those points of the electrode surface where high current densities were
reached. In fact, in the deposits obtained at -0.3 and -0.35 V, where the average
current density is the highest, copper hydroxide and copper-chloride hydroxides
appeared.
Tables 4.4.2.2.1 and 4.4.2.2.2 clearly evidence that the purity of the deposit is
decaying as the deposition rate is increasing, i.e. when applied current or potential
were increasing [44, 48]. An exception to this trend is represented by the deposit
obtained at -0.25 V, which shows the highest purity together with that obtained at

140
-1 A, as also confirmed by the less greenish color of deposits obtained under these
conditions (Figure 4.4.2.2.1).
In order to obtain pure copper, all deposits were treated to remove the
impurities. At this purpose, each sample was held for few minutes (~10 min.)
within a concentrated solution of NaCl (4 M) acidified to pH 1 by addition of HCl,
washed ultrasonically in doubly distilled water and then cleaned with ethanol. It is
important to note that no significant changes of weight were revealed after the
cleaning of the samples. In Figure 4.4.2.2.2 is reported a photo of the deposit
obtained at -0.45 A before and after the cleaning. As it can be seen, the deposit
turns from green to the typical color of electrodeposited copper.
Figure 4.4.2.2.2 Photo of a deposit obtained at -0.45A: a) before and b) after cleaning in 4 M NaCl solution at pH 1
In Figure 4.4.2.2.3 a-b is reported a comparison between EDS spectra before
and after the cleaning in NaCl for the deposit obtained at -1 A. The EDS spectrum
of Figure 4.4.2.2.3b confirms the disappearance of the peak due to Cl. The same
comparison was performed by XRD analysis (Figure 4.4.2.2.3 c-d). Diffraction
pattern of Figure 4.4.2.2.3d confirms the absence of CuCl, and the presence of CuO
as a unique impurity. When the copper deposits are dipped in 4 M NaCl, CuCl is
rapidly converted into soluble chloro-complexes according to the reaction
CuCl(s) + (n-1)Cl-(aq) CuCln
-(n-1)(aq) (2 ≤ n ≤ 4) (4.4.2.2.1)

141
In principle, CuO might be dissolved on dipping the deposit in 4 M NaCl at pH 1.
Likely, the acid-base reaction involving a solid phase is not very fast like the
formation of the chloro-complexes, therefore, longer dipping time should need,
with the risk of copper loss due to
CuO(S1)+Cu(S2)+2nCl-(aq)+2H
+(aq) 2CuCln
-(n-1)(aq) +H2O(liq) (2 ≤ n ≤ 4) (4.4.2.2.2)
where (s1) and (s2) indicate two distinct solid phases.
Although the deposits weight was not modified by the removal of impurities,
starting from a deposit as pure as possible is preferred. In this regard, the better
deposits were obtained at -1 A and -0.25 V. This finding suggests the possibility to
operate at higher current density through a potential-controlled process making
copper deposition faster.
Figure 4.4.2.2.3 EDS spectra (a, b), and diffraction patterns (c, d) of the deposits obtained at -1 A just
deposited (a, c); and after dipping in 4 M NaCl at pH 1(b, d)

142
The morphology of the copper deposit formed at -1 A and -0.25 V is shown in
Figure 4.4.2.2.4 a, c, and b, d, respectively, after dipping in 4 M NaCl at pH 1. All
deposits showed a planar morphology made of grain conglomerates similar to those
found in the literature for electrodeposited copper [44, 49, 50].
Figure 4.4.2.2.4 SEM micrographs at different magnifications of the copper deposit dipped in 4 M NaCl at pH 1. a), c) galvanostatic deposition at -1 A; b), d) potentiostatic deposition at -0.25 V
In potentiostatic mode (Figure 4.4.2.2.4 b, d), the average size of the grains is
larger than that in galvanostatic mode (Figure 4.4.2.2.4 a, c). Normally, grain size
decreases with the increase of the current density. However, some authors have
reported that the addition of chloride into acidic sulfate solutions increases grain
size of the electrodeposited copper [51]. It is likely that the concentration of

143
chloride in proximity of the electrode surface increases with the current density
leading to larger grains. The deposit obtained at -1 A results more compact than
that obtained at -0.25 V where crevices between the particles are observed (circled
in red in Figure 4.4.2.2.4d). Likely, this was due to a lower uniformity of the grain
size.
The current efficiency of copper deposition was evaluated as ratio of the
deposited weight after the cleaning step to the expected one according to Faraday's
law (Eq. 4.4.2.1.1 and 4.4.2.1.2). It has been found that the current efficiency was
about 45% for deposition at -1 A and 50% at -0.25 V. The low efficiency is mainly
due to the competitive reduction from Cu2+
to Cu+ owing to a non-complete
chemical reduction of the leaching solution. It should be note that the redox
potential profile of Figure 4.4.2.1.3 reaches a plateau after 3 h, likely due to a
passivation of waste copper cables by CuCl determined by the high increase in Cu+
concentration at the electrode/solution interface during copper dissolution. Besides,
even iron (Fe3+
/Fe2+
) and tin (Sn4+
/Sn2+
) couples can contribute to the low current
efficiency, according to the CV results.
In Figure 4.4.2.2.5 a-b the counter electrode potential profiles are reported for
deposition at -1 A and -0.25 V.
Figure 4.4.2.2.5 Counter electrode potential (Ece) vs time for a) potentiostatic deposition at -0.25 V and for b) galvanostatic deposition at -1 A
144
As it can be seen, the anodic potential during deposition at -0.25 V remains
constant at around 1.3 V, at this value evolution of chlorine at anode occurred.
However, during the 3 h, chlorine was consumed as oxidizing agent without being
released into the atmosphere leading to a fast regeneration of the Cu2+
species.
During deposition at -1 A, the anodic potential is lower and reaches the value of 1.2
V after more than 2 h with a consequence slower regeneration of the leaching
solution. In fact, at the end of deposition, the anodic solution turned to green for the
potentiostatic test and remained brown for the galvanostatic test. Finally, the
energy consumption for copper deposition was 2.78 KWh/Kg for the test at -1 A
and 3.27 KWh/Kg for the test at -0.25 V. It is important to point out that a typical
copper electrowinning consumes 3.45 KWh per Kg of deposited copper [52].
According to these findings, it can be concluded that the better deposit in terms
of purity and morphology is obtained in galvanostatic mode at a constant cathodic
current of -1 A, even if the current efficiency is lower than 50%. Nevertheless, the
potentiostatic mode represents a promising solution from industrial point of view
because it allows operating at higher current density and restoring more effectively
the leaching solution that could be recycled.
4.4 Conclusions
On the whole, the results indicate that an efficient dismantling/leaching of
WPCBs can be conducted using a NaCl-H2SO4-CuSO4 solution in the presence of
blowing air for the in-situ regeneration of the oxidizing agent. In particular, the
composition which gave the best results was: 4 M NaCl, 0.4 M CuSO4·5H2O, and
0.5 M H2SO4. The disassembled ECs maintain their structural integrity and
therefore, they can be easily separated and sent to recycle or further treatments.
This is a key point because the current technologies use high temperatures and
external actions (impact, shearing, vibration, etc.) for dismantling WPCBs with
consequent i) damage of the components, ii) release of toxic substances, and iii)

145
consume of energy. Besides, the dismantling method could be applied to entire
WPCBs rather than large pieces containing only some specific components.
Simultaneously to dismantling, leaching of copper and other minor metals
occurs. Therefore, copper, which is the most abundant and valuable metal, can be
recovered at the cathode of an electrochemical cell fed with the solution coming
from dismantling/leaching of WPCBs simultaneously with the oxidant regeneration
at the anode. This is a key point because copper contained as a base material in
electronic components’ contacts is usually lost in most of the recycling
technologies.
The current-controlled deposition permits to obtain a deposit of better quality in
terms of purity and morphology. On the contrary, the potential-controlled
deposition permits to work at higher current density so to shortening the deposition
time and leaching solution restoration, but gives worse morphology and slightly
lower purity.
In all investigated operating conditions, the copper deposit contained some
impurities, mainly of copper(I) chloride, which can be removed by dipping in
concentrated NaCl solution slightly acidified with HCl without significant changes
in the weight of deposits. Chemical analysis performed on the deposits after the
cleaning confirmed that pure copper, with some minor CuO impurity, was obtained
from the leach solution.
Further works are currently in progress to improve the deposition current
efficiency, recover electrochemically also the other base metals from the leach
solution for improving the recycling efficiency of the leaching solution and
combine leaching reactor with electrochemical cell for the simultaneous
dismantling/leaching and copper recovery.

146
Bibliography
[1] K. Koyama, M. Tanaka, Jae-chun Lee, 2006, Copper Leaching Behavior from
Waste Printed Circuit Board in Ammoniacal Alkaline Solution, Materials Transaction
47, No. 7, 1788-1792
[2] R. Liu, R.S Shieh, R.Y.L. Yeh, C.H. Lin, 2009, The general utilization of scrapped
PC board, Waste Management 29, 2842-2845
[3] M.S. Alam, M. Tanaka, K. Koyama, T. Oishi, J.-C. Lee, 2007, Electrolyte
purification in energy-saving monovalent copper electrowinning processes,
Hydrometallurgy 87, 36-44
[4] A. Mecucci and K. Scott, 2002, Leaching and electrochemical recovery of copper,
lead and tin from scrap printed circuit boards, Journal of Chemical Technology and
Biotechnology 77, 449-457
[5] T. Kinoshita, S. Akita, N. Kobayashi, S. Nii, F. Kawaizumi, K. Takahashi, 2003,
Metal recovery from non-mounted printed wiring boards via hydrometallurgical
processing, Hydrometallurgy 69, 73-79
[6] H.M. Veit, A.M. Bernardes, J. Z. Ferreira, J.A.S. Tenorio, C. de Fraga Malfatti,
2006, Recovery of copper from printed circuit boards scraps by mechanical processing
and electrometallurgy, Journal of Hazardous Materials B137, 1704-1709
[7] Eun-young Kim, Min-seuk Kim, Jae-chun Lee, Jinki Jeong, B.D. Pandey, 2011,
Leaching kinetics of copper from waste printed circuit boards by electro-generated
chlorine in HCl solution, Hydrometallurgy 107, 124–132
[8] I. Birlonga, I. De Michelis, F. Ferella, M. Buzatu, F. Vegliò, 2013, Study on the
influence of various factors in the hydrometallurgical processing of waste printed
circuit boards for copper and gold recovery, Waste Management 33, 935-941
[9] S. Fogarasi, F. Imre-Lucaci, P. Ilea, A. Imre-Lucaci, 2013, The environmental
assessment of two new copper recovery processes from waste printed circuit boards,
Journal of Cleaner Production 54, 264-269
[10] S. Fogarasi, F. Imre-Lucaci, A. Egedy, A. Imre-Lucaci, P. Ilea, 2015, Eco-friendly
copper recovery process from waste printed circuit boards using Fe3+/Fe2+ redox
system, Waste Management 40, 136-143
[11] E.Y. Yazici, H. Deveci, 2014, Ferric sulphate leaching of metals from waste
printed circuit boards, International Journal of Mineral Processing 133, 39–45
[12] L.A. Diaz, T.E. Lister, J.A. Parkman, G.G. Clark, 2016, Comprehensive process
for the recovery of value and critical materials from electronic waste, Journal of
Cleaner Production 125, 236-244
[13] H. Cui and C.G. Anderson, 2016, Literature Review of Hydrometallurgical
Recycling of Printed Circuit Boards (PCBs), Journal of Advanced Chemical
Engineering 6:142
[14] E.Y. Yazici, H. Deveci, 2013, Extraction of metals from waste printed circuit
boards (WPCBs) in H2SO4-CuSO4-NaCl solutions, Hydrometallurgy 139, 30-38
[15] E.Y. Yazici, H. Deveci, 2015, Cupric chloride leaching (HCl–CuCl2–NaCl) of
metals from waste printed circuit boards (WPCBs), International Journal of Mineral
Processing 134, 89–96

147
[16] Z. Ping, F. ZeYun, L. Jie, L. Qianga, Q. GuangRena, Z. Ming, 2009,
Enhancement of leaching copper by electro-oxidation from metal powders of waste
printed circuit board, Journal of Hazardous Materials 166, 746–750
[17] O. Herreros, R. Quiroz, A. Restovic, J. Vinals, 2005, Dissolution kinetics of
metallic copper with CuSO4–NaCl–HCl, Hydrometallurgy 77, 183–190
[18] D. Kwon (2007) Packaging Architecture and Assembly Technology, in: J.W.
Evans, W. Engelmaier (Ed.), A Guide to Lead-free Solders: Physical Metallurgy and
Reliability. Springer, London, pp. 29-51
[19] S.K. Kang, A.K. Sarkel (1994) Lead (Pb)-free solders for electronic packaging,
Journal of Electronic materials 23, 701-707
[20] R.A. Mesquita, R.A.F Silva, D. Majuste, 2018, Chemical mapping and analysis of
electronic components from waste PCB with focus on metal recovery, Process Safety
and Environmental Protection 120, 107–117
[21] Handbook of Chemistry and Physics, 56th edition, R. Weast editor, CRC Press:
Cleveland, OH 1975 pp.B-106, 152
[22] D. Sinadinovic, Z. Kamberovic, A. Sutic, 1997, Leaching kinetics of lead from
lead ( II) sulphate in aqueous calcium chloride and magnesium chloride solutions,
Hydrometaliurgy 47, 137- 147
[23] A.A. Geidarov, M.M. Akhmedov, M.A. Karimov, B.S. Valiev, and S.G.
Efendieva, 2009, Kinetics of Leaching of Lead Sulfate in Sodium Chloride Solutions,
Russian Metallurgy (Metally) No. 6, 469–472
[24] R. L. McCreery, 2008, Advanced Carbon Electrode Materials for Molecular
Electrochemistry, Chemical Reviews 108, 2646–2687
[25] D. Grujicic, B. Pesic, 2002, Electrodeposition of copper: the nucleation
mechanisms, Electrochimica Acta 47, 2901-2912
[26] C. T. J. Low, C. Ponce de Leon, F. C. Walsh, 2015, Copper deposition and
dissolution in mixed chloride–sulphate acidic electrolytes: cyclic voltammetry at static
disc electrode, Transactions of the IMF, 93:2, 74-81
[27] L. M. Abrantes, L. V. Araujo, M. D. Levi, 1995, Voltammetric studies on copper
deposition/dissolution reactions in aqueous chloride solutions, Minerals Engineering 8,
No. 12, 1467-1475
[28] N. Touabi, S. Martinez, M. Bounoughaz, 2015, Optimization of Electrochemical
Copper Recovery Process: Effect of the Rotation Speed in Chloride Medium of pH=3,
International Journal of Electrochemistry Science 10, 7227-7240
[29] J. Wang, Analytical Electrochemistry, Second Edition, 2000, Wiley-VCH
[30] J. Crousier, L. Pardessus, J.-P. Crousier, 1988, Voltammetry study of copper in
chloride solution, Electrochimica Acta 33, 1039-1042
[31] A.E. Saba, A.E. Elsherief, 2000, Continuous electrowinning of zinc,
Hydrometallurgy 54, 91–106
[32] A.M. Alfantazi, D.B. Dreisinger, 2001, The role of zinc and sulfuric acid
concentrations on zinc electrowinning from industrial sulfate based electrolyte, Journal
of Applied Electrochemistry 31, 641-646
[33] L.H. Mendoza-Huízar, C.H. Rios-Reyes, M.G Gómez-Villegas, 2009, Zinc
Electrodeposition from Chloride Solutions onto Glassy Carbon Electrode, Journal of
the Mexican Chemical Society 53, 243-247

148
[34] V.F.C. Lins, M.M.R. Castro, C.R. Araújo, D.B. Oliveira, 2011, Effect of nickel
and magnesium on zinc electrowinning using sulfate solutions, Brazilian Journal of
Chemical Engineering 28, No. 03, 475 – 482
[35] M.A.M. Ibrahim, M. Messali, 2011, Ionic Liquid [BMPy]Br as an Effective
Additive During Zinc Electrodeposition from an Aqueous Sulfate Bath, NASF
SURFACE TECHNOLOGY YEARBOOK
[36] P. Mehta, R.S. Sindal, 2010, Cyclic Voltammetric study of Pb(II) in different
sodium salts as supporting electrolysis, International Journal of Chemical Sciences 8,
345-350
[37] D. Mandler, A.J. Bard, 1991, The effect of tin(II) chloride adsorption on the
electrochemical oxidation of tin(II) and other reactions at gold and platinum electrodes,
Journal of Electroanalytical Chemistry 307, 217-228
[38] S. Bakkali, A. Benabida, M. Cherkaoui, 2017, Tin electrodeposition from sulfate
solution containing a benzimidazolone derivative, Mediterranean Journal of Chemistry
6(2), 15-22
[39] D. Grujicic, B. Pesic (2005) Iron nucleation mechanisms on vitreous carbon
during electrodeposition from sulfate and chloride solutions, Electrochimica Acta 50,
4405–4418
[40] U.S. Mohanty, B.C. Tripathy, S.C. Das, P. Singh, V.N. Misra, 2009, Effect of
sodium lauryl sulphate (SLS) on nickel electrowinning from acidic sulphate solutions,
Hydrometallurgy 100, 60–64
[41] E. Gomez, C. Muller, W.G. Proud, E. Valli, 1992, Electrodeposition of nickel on
vitreous carbon: influence of potential on deposit morphology, Journal of applied
electrochemistry 22, 872-876
[42] N. Elgrishi, K.J. Rountree, B.D. McCarthy, E.S. Rountree, T.T. Eisenhart, J.L.
Dempsey, 2018, A Practical Beginner’s Guide to Cyclic Voltammetry, Journal of
Chemical Education 95, 197-206
[43] Ma. I.R.-Valderrama, E.S.-Rodríguez, J.F.M.-Hernández, I.R.-Landero, E.C.-
Sáenz, J.H.-Ávila A.A.-Flores, 2017, Urban Mining and Electrochemistry: Cyclic
Voltammetry Study of Acidic Solutions from Electronic Wastes (Printed Circuit
Boards) for Recovery of Cu, Zn, and Ni, Metals 7, 55
[44] Los, A. Lukomska, S. Kowalska, M. Kwartnik, 2014, Laboratory and Pilot Scale
Tests of a New Potential-Controlled Method of Copper Industrial Electrolysis, Journal
of The Electrochemical Society 161, D593-D599
[45] International Centre for Diffraction Data, 2007, Power Diffraction File,
Philadelphia, PA. The ICDD cards used for identifying Cu, CuO, CuCl, Cu2O, CuCl2,
Cu(OH)2, Cu3Cl4(OH)2 and CuCl2·3Cu(OH)2 were 03-1018, 03-0867, 09-0017, 03-
0898, 34-0198, 03-0310, 23-0953 and 18-0439 respectively
[46] N.D. Nikolić, K.I. Popov, Lj. J. Pavlović, M.G. Pavlović, 2006, Morphologies of
copper deposits obtained by the electrodeposition at high overpotentials, Surface &
Coatings Technology 201, 560-566
[47] A. Ibanez, E. Fatas, 2005, Mechanical and structural properties of
electrodeposited copper and their relation with the electrodeposition parameters,
Surface & Coatings Technology 191, 7-16

149
[48] N. J. Aslin, D. Stone, W. Webb, Current Distribution in Modern Copper Refining,
available at the website:
www.isaprocess.com/EN/Downloads?Pages/TechnicalPapers.aspx
[49] C. Cocchiara, S. Piazza, C. Sunseri, R. Inguanta, 2017, Study of a Novel
Electrochemical Method for Copper Recovery from Waste Printed Circuit Boards,
Chemical Engineering Transactions 57, 1621-1626
[50] S. Fogarasi, F. Imre-Lucaci, A. Imre-Lucaci, P. Ilea, 2014, Copper recovery and
gold enrichment from waste printed circuit boards by mediated electrochemical
oxidation, Journal of Hazardous Material 273, 215-221
[51] W. Shao and G. Zangari (2009) Dendritic Growth and Morphology Selection in
Copper Electrodeposition from Acidic Sulfate Solutions Containing Chlorides, The
Journal of Physical Chemistry C 113, 10097-10102
[52] M.L. Free, 2013, Hydrometallurgy Fundamentals and Appliceations, John
Wiley & Sons, Inc., Hoboken, New Jersey

150
Chapter 5
Copper recovery from pieces of disassembled WPCBs by
an electrochemical route
Introduction
In the fourth chapter, an innovative method has been presented for WPCBs
dismantling by leaching of all exposed metallic parts in H2SO4–CuSO4–NaCl
solution. The results have shown how electronic components can be effectively
removed from WPCBs and copper recovered from the leach solution by an
electrochemical route. The remaining fiberglass reinforced epoxy board holds its
integrity and can be further treated for metal recovery. In particular, a preliminary
chemical and morphological characterization carried out on disassembled WPCBs,
guided the work towards the development of copper recovery processes. Indeed,
most of copper is still contained in the PCB structure under the solder mask layer.
According to the most recent innovations in the field of WPCBs recycling, an
entirely electrometallurgical approach was used for copper recovery. To simplify
the overall process, pieces of PCB were used instead of pulverized samples. The
PCB pieces were directly used for a simultaneous electroleaching-electrodeposition
process after the solder mask removal. Two different configurations of the
electrochemical cell were investigated, both operating in constant current mode.
151
5.1 Copper recovery from PCB pieces: state of the art
In order to develop an effective process for recovering metals from WPCBs, the
most investigated methodology is certainly the hydrometallurgical one, which
mainly consists of leaching, purification and recovery of metals [1-3]. Currently,
leaching is conducted on pulverized WPCBs obtained after some pretreatments
consisting in dismantling, grinding and separation of non-metallic fraction from the
metallic one through either chemical or physical processes. The pre-treated WPCBs
can be subjected to either acidic or alkaline leaching in order to dissolve copper,
which is finally recovered from the leach solution by electrochemical route either
directly or after a purification step consisting of solvent extraction followed by
stripping [4-5].
In recent years, many researchers have investigated innovative methods for
metals recovery from WPCBs aimed to simplify the recycling processes and reduce
their environmental impact. One of these new approaches consists in using pieces
of WPCBs rather than pulverized samples [6-14]. The use of pieces allows also to
avoid both the loss of metals during mechanical processing of WPCBs and the
generation of dangerous fine dusts. Adhapure et al. [6] used PCB pieces of 4x2.5
cm for a bioleaching process. Before to place PCB pieces in contact with the
microorganism, solder mask was removed by dipping PCB overnight in a 10 M
NaOH solution. This step is mandatory because the presence of the solder mask
makes metals inaccessible to bacteria (or Fe3+
). A complete metals removal with
the exception of solder traces was achieved after 10 days of incubation. According
to the authors, the use of PCB pieces can eliminate the contamination problem of
the PCB powder by metal-containing precipitate. All bioleaching processes that use
PCB powder for metal recovery encounter problems of precipitate formation. The
precipitate, which is composed of Sn, Cu, Pb and Fe, contaminates the powder of
PCB, making the overall metal recovery more difficult and complicated. Jadhav et
al. [7-8] investigated the use of different leaching solutions for metals recovery
152
from PCB pieces after solder mask removal by NaOH. The results showed that 1 M
HCl solution was able to dissolve all metals (Cu, Zn, Sn, Ni, Pb, Fe, Al, Ag, Au
and Pd) in 22 h from 4x4 cm PCB pieces at room temperature and 150 rpm shaking
speed. HNO3 also solubilized 100% of the metals, but in 96 h. Contrarily, H2SO4,
C2H4O2 (acetic acid) and C6H8O7 (citric acid) showed poor metal solubilization with
only 8.8%, 9.89% and 19.57% recovery of copper in H2SO4 (96 h), C2H4O2 (96 h)
and C6H8O7 (364 h), respectively. In order to reduce the environmental impact of
the process, the same authors tested a combination of citric acid (0.5 M) and
hydrogen peroxide (1.76 M) to leach metals from 4x4 cm PCB pieces. The
mechanism of dissolution proposed was
R-COOH + H2O2 R-COOOH + H2O (5.1.1)
R-COOOH + M + 2H+ R-COOH + H2O + M
2+ (5.1.2)
The organic acid reacts with H2O2 generating the peroxy carboxylic acid (5.1.1),
which is a powerful oxidants that readily oxidizes metals by reaction 5.1.2. Total
metals removal from PCB pieces was achieved after only 4 h through a cheap,
simple, and environmentally acceptable procedure. Fogarasi et al. [9-12] proposed
two original processes for copper recovery from large pieces of WPCBs by an
electrometallurgical route. In one of the processes [9-11], copper was recovered
from 40-100 cm2 PCB pieces employing two different types of reactor in series: a
leaching reactor using HCl-FeCl3 and a divided electrochemical reactor for
simultaneous copper deposition and leaching solution regeneration. The optimal
operating conditions for the combined chemical-electrochemical process were
ensured at the current density of 4 mA/cm2 and 0.37 M initial FeCl3 concentration.
High purity copper deposit (99.04%) was obtained with a current efficiency of
63.84% and a specific energy consumption of 1.75 KWh/Kg. In a different study
[12], the authors investigated the use of 20-25 cm2
PCB pieces directly as an anode
in an undivided electrochemical cell in which deposition of copper occurred on a
153
stainless steel cathode simultaneously to its anodic dissolution. After removal of
the solder mask by concentrated H2SO4 (~18 M), the PCB pieces were placed into a
perforated lead cage together with graphite granules which acted as a current
collector. The electrolytic solution was a 2 M H2SO4 solution and the electrolysis
tests were conducted at a constant current of 20 mA. A total dissolution of metals
from PCB pieces was achieved with an energy consumption of 1.06 KWh/Kg and a
current efficiency less than 90%. The copper deposit contained some impurities of
other metals, mainly tin, and further treatments (e.g. electrorefining) were needed
to reach a grade purity. Comparing the two processes, Fogarasi et al. concluded that
the mediated dissolution of copper using Fe3+
/Fe2+
redox couple had a lower
environmental impact than the direct one because the regenerated leaching solution
could be used for further processing of WPCBs. Besides, concentrated sulfuric acid
was extremely dangerous to be handled. Small-size PCBs (1.5-2 cm2) are widely
used in thermal treatments of WPCBs, however, Guo et al. [13] tested the use of
large-size PCB sample (16-20 cm2) for a low-temperature (500°C) pyrolysis
process carried out in a fixed-bed reactor. The pyrolysis products consisted of
71.60 wt.% of solid residue, 18.23 wt.% of tar and 10.71 wt.% of gas. The solid
residue consisted of metals, fiberglass and residual ash from the organic resins.
Fiberglass was easily separated via manual operation from the metallic fraction
which could be further treated for copper recovery, for example by
hydrometallurgical route.
The main obstacle in using large pieces of PCB is the lower surface area
exposed to the lixiviant, electrolyte or bacteria. In particular, most of the metals are
incorporated inside the structure of PCB and thus, are not easily accessible even
after solder mask removal. However, the above studies show how all metals can be
effectively removed also from PCB pieces with significant advantages including
the simplification of the overall recovery process, and elimination of both the costs
and environmental risks related to powder preparation. According to Adhapure et

154
al. [6], the use of PCB pieces can facilitate the reuse of the remaining board (non-
metallic part). In the light of these findings, the research activity was focused on
using PCB pieces instead of pulverized samples. It is important to note that the
same PCB pieces resulting from the dismantling process proposed in Chapter 4
could be used. A preliminary morphological and chemical characterization was
carried out on disassembled WPCBs in order to decide towards which metal to
focus the research activity.
5.2 Chemical characterization of disassembled WPCBs
The first step of the study was aimed to investigate the structure and
composition of the disassembled WPCBs. In particular, the attention was focused
on the metallic fraction of WPCBs. The acquisition of detailed information about
structure and chemical composition is fundamental for developing new either
recycling methodologies or strategies to improve the current ones. As shown in the
first chapter, the composition of PCBs is continuously changing, and different
authors reported different results. For this reason, an accurate qualitative and
quantitative characterization of the feed material was carried out. The experimental
procedure and results will be reported in the following.
5.2.1 Material and methods
Motherboards of either obsolete or disused computers were used as a source of
PCBs. The structure of PCB was investigated using a scanning electron microscopy
(SEM, FEI mod.: QUANTA 200 FEG) equipped with an X-ray energy dispersive
spectrometer, while the chemical composition was determined by Inductively
Coupled Plasma Optical Emission Spectrometer (ICP-OES, Perkin Elmer Optima
2100 DV). The ICP-OES analysis was carried out on a sample of pulverized PCBs.
To have significant results from a statistical point of view, three PCBs coming
from different models of waste computers were dusted to obtain a representative
average chemical composition. Before grinding, the electronic components were

155
disassembled from the boards by heating above the melting point of the solder.
Then, disassembled PCBs were cut into small pieces (~1x1 cm) and milled using a
cutting mill (Pulverisette 15, Fritsch) obtaining an homogeneous powder with
particle size of about 1 mm. According to the literature [8, 14-19], an acid digestion
was performed dissolving 100 mg of powder in 10 mL of hot aqua regia
(HCl:HNO3=3:1, v/v) until the complete dissolution of all metals and subsequently
making up to the mark with distilled water in a 100 mL flask. In this way, the
concentrations of the analytes were reported in the linearity range of the calibration
curve, which was built preparing appropriate multi-standard solutions. These latter
were prepared on the basis of a preliminary Energy Dispersive Spectroscopy (EDS)
analysis conducted on a pulverized sample of PCBs. The solid residue obtained
after acid digestion was also analyzed by EDS to confirm that all metals were
dissolved in aqua regia. All the chemical reagents were of analytical grade. The
concentrations of Cu, Pb, Sn, Fe, Zi, Ni, Al, Fe, Au, Ba, Ti, and Pd from the leach
solution were determined.
5.2.2 Results and discussion
A small piece of PCBs was thermally and mechanically delaminated, then the
section was analyzed by SEM, revealing the existence of a multilayer structure
constituted by the alternation of compact and fibrous layers. Figure 5.2.2.1 shows a
SEM micrograph evidencing a fibrous layer overlying a compact one. EDS
analysis revealed that the compact layer is constituted mainly by copper (80.44
wt.%) while the fibrous one is constituted by organic and ceramic materials
containing copper traces (0.39 wt.%). EDS analysis of the fibrous layer revealed
the presence of Si and Ca along with other elements such as Na, K and Fe which
are the typical constituents of the woven glass fiber (see Table 1.2.2.3 in Chapter 1)
[20]. The glass fibers are also clearly visible in the figure. Likely, the sectioned
PCB was a multilayer type and the two layers shown in Figure 5.2.2.1 are the
copper foil and the substrate of epoxy resin reinforced with woven glass fibers.

156
Indeed, according to the literature [5, 14, 21-23], the alternation of these layers
constitutes the structure of multilayer PCBs.
Figure 5.2.2.1 SEM micrograph of the sectioned PCB, showing different composition layers
A preliminary EDS analysis was carried out on the powder resulting from the
grinding of three different disassembled computer motherboards. The EDS
spectrum of Figure 5.2.2.2 reveals the presence of hazardous elements, such as Br
coming from the brominated flame retardants, and Pb coming from the Pb-Sn
solders. Copper is the most abundant metal present in the powder of PCBs, other
elements were found at higher magnifications in traces including Au, Ni, Zn, K,
Na, Ti and S. The first three probably are due to some residues of the electronic
components’ contacts; while K, Na, and Ti are constituents of the woven glass fiber
[20]. Sulphur is likely present in the solder mask in combination with barium,

157
which is also revealed from EDS spectrum of Figure 5.2.2.1 and 5.2.2.2, as barium
sulfate that is a typical fire retardant [24]. Solder mask is an organic material
containing also Si, which is used to control the viscosity of the liquid prior to
curing. Iron may result from both the substrate and the residue of components’
contacts.
Figure 5.2.2.2 Typical EDS spectrum of the PCBs powder
Based on the results obtained by EDS, a more accurate determination of metal
concentrations was carried out by ICP-OES. The analytes investigated were the
metals revealed by EDS, such as Cu, Pb, Sn, Ni, Fe, Ba, Zn, Au, and Ti along with
other metals that are expected in PCBs according to the literature, such as Al and
Pd [17, 25-28]. The results of the analysis are shown in Table 5.2.2.1. The metal
present at higher percentage composition was copper followed by tin and lead. In
comparison with the literature [16-17], the found quantity of tin and lead found
were greater, likely due to excessive solder residue after disassembly step. As it can
be seen, the percentage of precious metals such as gold and palladium is very low,

158
but similar to that reported in other studies [9, 18, 26, 29]. Unlike EDS results,
small amounts of aluminum were found from acid digestion of PCBs powder.
Elements Percentage composition (wt.%)
Cu 65.39
Sn 21.48
Pb 12.29
Fe 0.23
Al 0.23
Ba 0.21
Zn 0.1
Ni 0.04
Others 0.03
Table 5.2.2.1 Major metals contained in WPCBs powders
The residue from acid digestion was analyzed by EDS after washing with distilled
water. Except for iron, all metals among those investigated by ICP-OES were
completely dissolved in aqua regia. Traces of iron remained in the residue, likely
coming from the glass fibers which are difficult to dissolve.
The chemical characterization was relevant to understand towards which metal
was more profittable to focus the research activity of recovery from disassebled
PCBs. In particular, copper was found to be the most abundant metal among those
detected by ICP-OES, while precious metals were found only in traces in the
powder of WPCBs. According to these results, copper is the most interesting metal
and therefore, the study was aimed at developing a copper recovery method which
was simple and environmental acceptable. The results related to the recovery of
copper from disassembled PCBs will be reported in the following.

159
5.3 Electrochemical recovery of copper from
disassembled WPCBs
In order to simplify the overall copper recovery process, pieces of disassembled
PCBs were used rather than pulverized samples. The large pieces could be those
resulted from the dismantling process proposed in the previous chapter. In the light
of the most recent innovations in the field of WPCBs recycling, it was decided to
adopt an entirely electrochemical method for the recovery of copper due to its low
environmental impact, low energy consumption, simple flowsheet and high output
[5, 10, 30-31]. Currently, copper electrolysis is the final step in the recycling chain
of WPCBs both in the pyrometallurgical and hydrometallurgical processes.
However, in this work, an entirely electrometallurgical process was investigated
using an electrochemical cell in which electroleaching of copper from PCB pieces
occurs simultaneously to its electrodeposition [12, 16, 32-34]. Experimental
procedure and results will be reported in the following.
5.3.1 Material and methods
For the tests, motherboards of waste computers were used. Before undergoing
the electrochemical process, all electronic components were disassembled from the
board by heating above the melting point of the solder. Then, PCB was cut into
pieces of about 10x10 cm and every piece was chemically treated to remove the
solder mask, which covers the external surface of PCB hindering the contact
between copper and the electrolyte. The coating was removed using sodium
hydroxide as a chemical reagent [6-8]. In particular, PCB pieces were dipped in 10
M NaOH for 24 hours, washed with distilled water to remove any trace of NaOH,
and then mounted as an anode for the electrolysis process. A piece of PCB without
solder mask was pulverized and analyzed by ICP-OES for determining metal
content after NaOH treatment. The alkaline solution used for solder mask removal
can be recycled several times before to be disposed.

160
After pre-treatment, large pieces of PCB were directly mounted as an anode for
copper electrolysis using the apparatus schematized in Figure 5.3.1.1. Each PCB
piece was sandwiched between two plexiglass slabs with a rubber gasket in the
middle to ensure the seal. Ensuring a good seal was important to protect the current
collector from the acidic electrolytic solution. Two current collectors were used,
one for each side of PCB piece, and were cut perimeter to the board for ensuring
the contact with the maximum number of copper tracks. The sandwich structure
was tightened through stainless steel bolts covered with an insulating resin to avoid
their corrosion during the process.
Figure 5.3.1.1 Lateral view and front view of a PCB piece used as an anode
The bench scale experimental setup used for the electrolysis experiments is
sketched in Figure 5.3.1.2. A parallel-plate electrode design similar to that used in
industrial electrolytic refining of copper was employed [35-36]. Each side of PCB
was opposite and parallel to a high purity copper cathode (99.8%) having the same
dimension of the PCB piece (i.e. 10x10 cm). Both cathode plates were coated on
one side with an insulating resin in order to expose to the electrolyte only the side

161
opposite to the anode. The surface of the cathodes was polished before electrolysis
using a cloth soaked in slightly acidified water and then washed with water and
ethanol in order to remove copper oxides and other impurities which could lead to
irregular and imperfect deposits. The electrodes were assembled in the cell at a
distance of 3 cm.
Figure 5.3.1.2 Scheme of the electrochemical cell for copper recovery from large pieces of WPCBs
The cell was a cylindrical glass vessel filled with 3 L of solution. The electrolyte
was a mixture of copper sulphate pentahydrate (CuSO4·5H2O) and sulfuric acid
(H2SO4) with concentrations of 0.7 M and 2 M, respectively. Unlike the industrial
copper electrorefining, no other chemicals or additives were added to the
electrolyte [35]. All the chemical reagents were of analytical grade. Electrolyte
temperature was monitored and maintained at 60°C with an external bath of
ethylene glycol that was used as a heating fluid. A constant cathodic current of
-900 mA was supplied using a PAR Potentiostat/Galvanostat (mod. PARSTAT
2273). The resulting current density was -4.5 mA/cm2, which was selected for
obtaining high quality deposits in terms of purity and structure [37]. The cathodic
potential was measured relative to a saturated calomel electrode
(Hg/Hg2Cl2/KClsat.) acting as a reference.

162
Owing to some problems encountered during electrolysis of large pieces of
PCBs, a second configuration of cell was also investigated, and a schematic
representation is shown in Figure 5.3.1.3. All the operating conditions were left
unchanged, such as composition of the electrolyte, temperature, applied current and
total anodic and cathodic surface area. However, in the new configuration, the
10x10 cm PCB piece was cut into smaller pieces of about 2-4 cm2
, which were put
inside a stainless steel basket acting as a support and current collector. Besides, the
cut pieces of PCB were mixed with an equal weight of graphite granules to reduce
the resistivity of the PCB pieces. A 99.8% purity copper sheet was used as a
cathode and was placed coaxial to the anodic support. One side of the copper sheet
was covered with an insulating material.
Figure 5.3.1.3 Scheme of the electrochemical cell for copper recovery from small pieces of WPCBs
The current efficiency of copper deposition was evaluated as a ratio of the
deposited weight to the expected one according to Faraday's law (see Eq.s
4.4.2.1.1-4.4.2.1.2 in Chapter 4). The copper deposit was chemically and
morphologically characterized by X-ray diffraction (XRD), scanning electron
microscopy (SEM) and energy dispersive spectroscopy (EDS). The morphology

163
was investigated using a scanning electron microscopy (SEM, FEI mod.:
QUANTA 200 FEG) equipped with an X-ray energy dispersive spectrometer. A
further characterization was performed by XRD analysis, (Rigaku, D-MAX 25600
HK). All X-ray analyses were conducted in the 2ϑ range from 5° to 100° using the
Cu Kα radiation (λ=1.54 Å). Diffraction patterns were analyzed by comparison
with ICDD database (ICDD, 2007) [38]. Copper dissolution degree from the PCB
pieces was determined by Inductively Coupled Plasma Optical Emission
Spectrometer (ICP-OES, Perkin Elmer Optima 2100 DV) analysis dissolving in
aqua regia all the metals contained in the PCB pieces before and after experiments.
5.3.2 Results and discussion
The electroleaching of copper from motherboards of waste computers was
carried out using directly large pieces of PCBs. For this purpose, the motherboard
was thermally dismantled, cut into 10x10 cm pieces and chemically treated for
solder mask removal by means of 10 M NaOH solution. A flow diagram of the
proposed method for copper recovery is shown in Figure 5.3.2.1.
Figure 5.3.2.1 Flow diagram of the copper recovery process

164
After a solid/liquid separation, the alkaline solution can be reused several times
before to be diluted with water and disposed after removal of the epoxy residue by
filtration. Figure 5.3.2.2 shows a PCB piece before and after NaOH treatment.
Figure 5.3.2.2 Photo of PCB piece a) before and b) after removal of solder mask
The solder mask was completely removed from the PCB. This step is of primary
importance because the coating does not allow the electrolyte to penetrate through
the board for extraction of the metals [6-8]. The PCB piece was analyzed for
determination of the metal content after NaOH treatment. As for the most abundant
metals present in PCBs, ICP-OES analysis showed that during NaOH treatment the
dissolution of Cu, Pb and Sn was about 6%, 38.7% and 43%, respectively. A
dissolution degree similar to that of Pb and Sn was also measured for Ba (42.5%),
which is mainly present in the solder mask. The amount of copper leached was
very small compared to the average metal content in PCB. A slight swelling of the
PCB piece was observed after dipping in the alkaline solution. This could make
easier the access of the electrolyte through the board also thanks to the presence of
many holes drilled on the PCB for the assembly of electronic components (see
Figures 1.2.2.2-1.2.2.3 in Chapter 1).

165
After solder mask removal, each PCB piece was directly used as an anode for
the electrolysis process. A constant cathodic current of -900 mA was supplied at
the cathode. The performance of the process was evaluated by means of copper
dissolution degree from the PCB piece, quality of the copper deposit, current
efficiency, and energy consumption.
Figure 5.3.2.3 Photo of PCB piece a) before and b) after electrolysis process
Figure 5.3.2.3 shows one side of a PCB piece before (Figure 5.3.2.3a) and after
(Figure 5.3.2.3b) the anodic dissolution. As it can be seen, copper was not totally
removed from the board. After electrolysis, each PCB piece was reduced into
powder and metals dissolved in aqua regia for ICP-OES analysis. The dissolution
degree of copper from the PCB pieces ranged between 46% and 50%. The limited
copper dissolution was mainly determined by the increase of the copper dissolution
overvoltage. Indeed, the insulating nature of the PCB substrate led to a rapid
increase of the cell voltage. Generally, after a time of 8 h the cell voltage became
unstable with sudden increases up to -8 V. The overvoltage was significant since
the beginning of the process. Indeed, the cell voltage remained at about 1.8-2 V
except for the first hour in which it did not exceed 0.15-0.2 V. The average value
was significantly higher than the cell voltage of a copper electrorefining process

166
(0.23-0.27 V) [35]. Indeed, in an electrorefining process, the cathode reaction is the
reverse of that one at the anode; therefore, the cell voltage is exclusively due to
voltage drops. In this case, the ohmic drop was more relevant and increased with
time up to unacceptable values. The loss of the electrical contact between some
copper tracks and current collector was another problem occurring during copper
dissolution. However, the experiments revealed that dissolution of some tracks
occurred even without being in contact with the current collector, likely because
copper was partially converted into copper oxides during NaOH treatment, which
can be chemically dissolved by the acidic electrolyte.
After electrolysis, the cathode plates were washed, dried, and then weighed to
measure the overall increase of weight and estimate the current efficiency of copper
deposition. The current efficiency was about 84%. This value is consistent with
other studies reported in the literature concerning the electrolysis of copper from
sulfuric acid solution resulting from the treatment of WPCBs [12, 39-41]. Likely,
some eddy reactions consumed charge for processes different from copper
deposition. To have a better idea of what happened at the cathode, a chemical
characterization was made on the deposits. The purity of the deposit was
determined by EDS and XRD analysis. Figure 5.3.2.4a shows the EDS spectrum of
the deposit revealing the presence of only copper without any metallic impurities.
Figura 5.3.2.4 EDS spectrum (a) and diffraction pattern (b) of the copper deposit

167
The diffraction pattern of the deposit (Figure 5.3.2.4b) evidences that copper is the
only phase present even if some diffraction peaks of CuO are also identified. It’s
well know that copper is easily oxidized in proper conditions, but some undesired
reactions could play an important role in copper oxide generation. In particular,
hydrogen evolution and oxygen reduction reactions could increase the pH at the
cathode/solution interface determining the formation of copper hydroxide, which,
however, is dehydrated to generate the more stable copper oxide [42]. This was in
accordance with both low efficiency and the absence of metallic impurity at the
cathode. The cathodic reactions likely occurring at cathode are
4H+ + O2 + 4e
- 2H2O (E°=1.23 V/NHE) (5.3.2.1)
Cu2+
+ 2e- Cu (E°=0.34 V/NHE) (5.3.2.2)
2H+ + 2e
- H2 (E°=0 V/NHE) (5.3.2.3)
Oxygen reduction is the most favoured reaction, but the absence of solution
stirring limited the oxygen transport to cathode. Therefore, the low efficiency was
mainly determined by hydrogen evolution reaction. During the electrolysis, the
cathodic potential assumed values just upper 0 V/NHE that likely was sufficient to
activate hydrogen evolution reaction.
The morphology of the deposits was investigated by SEM. Figure 5.3.2.5a
shows a SEM micrograph of the copper deposit with a compact morphology
similar to that found in the literature for electrodeposited copper from sulphate
solutions [9, 33, 43]. Figures 5.3.2.5 b-c show the cross section of the copper
deposit. The thickness of the Cu layer is uniform along the entire section analysed
at a value of about 32.35 μm. Although the top view shows a very compact deposit,
several cavities are present through the thickness of the deposit (Figure 5.3.2.5c)
likely due to hydrogen evolution.

168
Figure 5.3.2.5 SEM micrographs at different magnifications of the copper deposit: (a) top view, (b, c) cross section
In addition to the high purity of the copper deposit, another relevant advantage
of the process consists in the easy removal of the deposit from the support. Figure
5.3.2.6 shows that the copper deposit was in the form of a compact foil easily
peeled from the support without damaging it therefore, the support can be easily
reused. In the industrial process of copper electrorefining, the easy removal of the
cathodic deposit is achieved by smearing the support with mineral oils which can
lead to irregularities in the formation of the deposits [44]. Besides, additives (e.g.
thiourea, gelatin, organosulfonates, chloride etc.) are added to the electrolyte in the
industrial process to control the chemical and physical properties of deposits [37,
45]. Figure 5.3.2.6 shows that no dendritic structure was formed.
The energy consumption for the process was about 1.7 KWh/Kg. This value is
higher than that for the current electrorefining of copper, which consumes 0.25

169
KWh/Kg, but is significantly lower than that for the copper electrowinning, which
currently consumes 3.4 KWh/Kg [46].
Figure 5.3.2.6 Pictures of the copper deposit
A chemical analysis was carried out both on the electrolytic solution and the
solid residue precipitated on the tank bottom (Figure 5.3.2.7a). EDS spectrum of
the solid residue (Figure 5.3.2.7b) shows the presence of only lead and tin, with tin
traces compared to lead. The atomic fraction of lead (Pb/(Pb+Sn)) was equal to
0.89. Contrarily, the ICP-OES analysis showed that the fraction of lead and tin in
the electrolytic solution was 1.66% and 98.34%, respectively. Therefore, tin
remained dissolved in CuSO4-H2SO4 solution while lead formed the solid residue
on the tank bottom. This result suggests the possibility of an easy separation of lead
that could be partially recovered in addition to copper. Besides, the recovery of tin
from the electrolytic solution by an electrochemical route could be also
investigated for improving the recycling efficiency of the electrolyte. Alternatively,
the same procedure followed in the industrial copper electrorefining could be used
for electrolyte purification. After removal of copper by electrolysis using PbO2 as
an anode and Cu as a cathode, the solution is fed into an evaporative stage where
the precipitation of metallic impurities occurs, mainly in the form of sulphides.
Then, the purified solution is recycled to the process [35]. In the light of these
findings, the PCB pieces resulting from the dismantling process described in the
fourth chapter could be directly used for the electrolysis rather than being treated
with NaCl solution for the complete dissolution of the Pb-Sn solders.

170
Figure 5.3.2.7 (a) Picture of the solid residue recovered at the end of the electrolysis process; (b) EDS spectrum
High purity copper easily removable from the support was obtained in one-step
process after PCB disassembly and solder mask removal. The removal of copper
from PCB was limited to about 46-50%. However, the resulting PCB could be a
good feed material for a biological treatment where the contents of metal that can
be processed are limited [7, 47-48]. In particular, copper was found to be the main
inhibitor of microorganisms’ metabolism followed by nickel and cobalt [47-48].
Xiang et al. [47] reported that high concentrations of copper extracted from PCBs
could inhibit both the rate and degree of the oxidation of ferrous ions by bacterial
consortium.
In order to increase copper dissolution degree, a second configuration of the
electrochemical cell was investigated. In particular, the 10x10 cm PCB piece was
cut into smaller pieces of about 2-4 cm2
and mixed with an equal weight of graphite
granules in order to reduce the resistivity of the PCB material. To directly use small
pieces of PCB as an anode for the electroleaching process, a cylindrical stainless-
steel basket was used as a support for the PCB pieces and also as a current
collector. The cathode was a copper sheet placed coaxial to the cylindrical basket.
A scheme of the experimental apparatus is shown in Figure 5.3.1.3. The addition of
conductive granules to small PCB pieces allowed to enhance the electrical contact
between copper tracks and current collector and reduce the overvoltage related to

171
the insulating nature of the PCB substrate. After 8 h of electrolysis, the copper
removal from the board was about 51%, which is similar to the value obtained in
the tests with large pieces of PCB. However, after this time, the cell voltage did not
increase sudden but remained constant to the initial value. Therefore, it was
possible to increase the electrolysis time to 16 h, achieving a total copper removal
of 73%. Cell voltage remained constant at about 1.08 V with an energy
consumption of about 1.6 KWh/Kg. After 16 h, the cell voltage increased to about
1.8-2 V and the main anodic reaction became oxygen evolution, while copper
dissolution stopped. This was due to the very low content of copper remained in
PCB pieces. Besides, graphite is a good electrode for oxygen evolution. Pictures of
the small PCB pieces before and after electrolysis are shown in Figure 5.3.2.8.
Copper appears completely removed from the PCB pieces.
Figure 5.3.2.8 Pictures of the small PCB pieces before (a), and after (b) the electrolysis process
The current efficiency determined by Faraday’s law was about 60%. The lower
value obtained compared to the electrolysis from large PCB pieces was mainly due
to the dissolution of the steel basket which led to the activation of the Fe3+
/Fe2+
redox couple, which is a troublesome acceptor/donor of electrons. Therefore, in
addition to the reactions described by equations 5.3.2.1, 5.3.2.2 and 5.3.2.3, the
parasitic side reaction of reduction of Fe3+
to Fe2+
was also responsible for the loss
of faradaic efficiency. The reduction of ferric ions (E0= +0.77 V/NHE) is more
favoured than that of cupric ions (E0= +0.34 V/NHE). ICP-OES analysis showed a

172
concentration of iron in the electrolyte two orders of magnitude higher than the
value of 48 mg/L measured in the tests with large PCB pieces. EDS and XRD
analysis performed on the electrodeposited copper gave the same results obtained
in the tests with large pieces of PCB.
In order to avoid both the cut into small pieces and corrosion of the support,
carbon foam could be used as a current collector in the first configuration of the
electrochemical cell investigated. Carbon foam is an innovative material having the
advantage to be permeable and inert to the electrolytic solution and therefore, it
could be directly placed in contact with the large PCB piece covering its entire
surface on both sides. In this way, all copper tracks would be in contact with the
current collector enhancing copper dissolution from the board and simplifying the
apparatus used as an anode, which no longer requires the use of plexiglass slabs,
gaskets and bolts. A set of experiments has already been planned for investigating
the use of carbon foam in the cell design.
5.4 Conclusions
In this work, PCB pieces like those that could result from the dismantling step
proposed in Chapter 4 were directly used for copper recovery instead of pulverized
samples. In particular, the PCB pieces were directly mounted as an anode in an
undivided electrochemical cell in which copper electroleaching occurred
simultaneously to its cathodic deposition. This is a key point because the current
technologies require several operations before recovering copper. Besides, the use
of PCB pieces allows also to eliminate both the costs and environmental risks
related to powder preparation.
Before undergoing the electrochemical process, the solder mask has to be
removed from PCB pieces by chemical treatment in order to expose copper to the
electrolytic solution. Two different configurations of the cell were investigated.
The first one allows to use large pieces of PCB but, in principle, can be extended to

173
the use of an entire PCB minimizing the number of steps needed for copper
recovery. However, the copper dissolution degree from the PCB pieces was limited
to 46-50% and thus, the remaining pieces required further treatments. For instance,
they could be a good feed material for bioleaching in the perspective to minimize
the environmental impact of the global recovery process. The copper removal was
increased to 75% with a second configuration of the cell, which however required
the cutting of PCB into small pieces. In the future it is planned to investigate the
use of carbon foam as a current collector in the first configuration of the
electrochemical cell for improving copper dissolution efficiency from large PCB
pieces.
Both configurations allow to obtain in a single step high purity copper easily
removable from its support. This is a relevant advantage because copper purity is
the main issue in WPCBs recycling where the presence of many different metals
reduce the selectivity of the recovery. Another benefit from both configurations is
the low energy consumption required for the recovery process.
Encouraging findings were obtained from the chemical analysis of both
electrolytic solution and solid residue found on the tank bottom showing the
possibility of an easy recovery of lead by filtration. Further works are currently in
progress regarding the electrochemical recovery of tin from the electrolytic solution
in order to maximize the recovery of material from WPCBs and improve the
efficiency of the electrolyte recycling. Based on these results, the PCB pieces
resulting from the dismantling/leaching step showed in Chapter 4 could be directly
used for the electrolysis rather than being treated with NaCl solution for the
complete dissolution of the Pb-Sn solders.

174
Bibliography
[1] M.P. Luda, 2011, Recycling of Printed Circuit Boards. In: S. Kumar (Ed),
Integrated Waste Management 2nd Edition (pp. 285-298), InTech, Shanghai, China
[2] M. Kaya, 2018, Current WEEE recycling solution. In: F. Vegliò, I. Birloaga (Eds),
Waste Electrical and Electronic Equipment Recycling Aqueous Recovery Methods
(pp. 33-93), Woodhead Publishing
[3] J. Cui, L. Zhang, 2008, Metallurgical recovery of metals from electronic waste: A
review, Journal of Hazardous Materials 158, 228-256
[4] H. Cui, C.G. Anderson, 2016, Literature Review of Hydrometallurgical Recycling
of Printed Circuit Boards (PCBs), Journal of Advanced Chemical Engineering 6:142
[5] B. Ghosh, M.K. Ghosh, P. Parthi, P.S. Mukherjee, B.K. Mishra, 2015, Waste Printe
Circuit Boards recycling: an extensive assessment of current status, Journal of Cleaner
Production 94, 5-19
[6] N.N Adhapure, P.K. Dhakephalkar, A.P. Dhakephalkar, V.R. Tembhurkar, A.V.
Rajgure, A.M. Deshmukh, 2014, Use of large pieces of printed circuit boards for
bioleaching to avoid ‘precipitate contamination problem’ and to simplify overall metal
recovery, MethodsX 1, 181-186
[7] U. Jadhav, H. Hocheng, 2015, Hydrometallurgical Recovery of Metals from Large
Printed Circuit Board Pieces, Scientific Reports 5, 14574
[8] U. Jadhav, C. Su, H. Hocheng, 2016, Leaching of metals from large pieces of
printed circuit boards using citric acid and hydrogen peroxide, Environmental Science
and Pollution Research 23, 24384-24392
[9] S. Fogarasi, F. Imre-Lucaci, A. Imre-Lucaci, P. Ilea, 2014, Copper recovery and
gold enrichment from waste printed circuit boards by mediated electrochemical
oxidation, Journal of Hazardous Material 273, 215-221
[10] S. Fogarasi, F. Imre-Lucaci, P. Ilea, A. Imre-Lucaci, 2013, The environmental
assessment of two new copper recovery processes from waste printed circuit boards,
Journal of Cleaner Production 54, 264-269
[11] S. Fogarasi, F. Imre-Lucaci, A. Egedy, A. Imre-Lucaci, P. Ilea, 2015, Eco-friendly
copper recovery process from waste printed circuit boards using Fe3+/Fe2+ redox
system, Waste Management 40, 136-143
[12] F. Imre-Lucaci, S. Fogarasi, P. Ilea, M. Tamasan, 2012, Copper recovery from
real samples of WPCBs by anodic dissolution, Environmental Engineering and
Management Journal 11, 1439-1444
[13] X. Guo, F.G.F Qin, X. Yang, R. Jiang, 2014, Study on low-temperature pyrolysis
of large-size printed circuit boards, Journal of Analytical and Applied Pyrolysis 105,
151-156
[14] J. Li, P. Shrivastava, Z. Gao, H.-C. Zhang, 2004, Printed Circuit Board Recycling:
A State-of-the-Art Survay, IEEE Transaction on Electronics Packaging Manufacturing
27, 33-42
[15] F.P.C. Silavs, M.M.J. Correa, M.P.K. Caldas, V.T. de Moraes, D.C.R. Espinosa,
J.A.S. Tenorio, 2015, Printed circuit board recycling: Physical processing and copper
extraction by selective leaching, Waste Management 46, 503-510

175
[16] Y. Chu, M. Chen, B. Wang, K. Fu, H. Chen, 2015, Micro-copper powders
recovered from waste printed circuit boards by electrolysis, Hydrometallurgy 156, 152-
157
[17] E.Y. Yazici, H. Deveci, 2013, Extraction of metals from waste printed circuit
boards (WPCBs) in H2SO4-CuSO4-NaCl solutions, Hydrometallurgy 139, 30-38
[18] Y.J. Park, D.J. Fray, 2009, Recovery of high purity precious metals from printed
circuit boards, Journal of Hazardous Material 164, 1152-1158
[19] A. Mecucci and K. Scott, 2002, Leaching and electrochemical recovery of copper,
lead and tin from scrap printed circuit boards, Journal of Chemical Technology and
Biotechnology 77, 449-457
[20] R. Sanapala, 2008, Characterization of FR-4 Printed Circuit Board Laminates
before and after Exposure to Lead-free soldering conditions, available on
https://drum.lib.umd.edu/bitstream/handle/1903/8362/umi-umd-5671.pdf;sequence=1
[21] A. Khaliq, M.A. Rhamdhani, G. Brooks, S. Masood, 2014, Metal Extraction
processes for Electronic Waste and Existing Industrial Routes: A Review and
Australian Perspective, Resources 3, 152-179
[22] H. Li, J. Eksteen, E. Oraby, 2018, Hydrometallurgical recovery of metals from
waste printed circuit boards (WPCBs): Current status and perspectives- A review,
Resources, Conservation & Recycling 139, 122-139
[23] P. Hadi, M. Xu, C.S.K Lin, C.-W. Hui, G. McKay, 2015, Waste printed circuit
board recycling techniques and product utilization, Journal of Hazardous Materials
283, 234-243
[24] M. Woolley, 2013, Corrosives on a PCB: Finding the source, available on
www.edn.com
[25] T.E. Lister, P. Wang, A. Anderko, 2014, Recovery of critical and value metals
from mobile electronics enabled by electrochemical processing, Hydrometallurgy 149,
228–237
[26] C.J. Oh, S.O. Lee, H.S. Yang, T.J. Ha, T.J. Kim, 2003, Selective leaching of
valuable metals from waste printed circuit boards, Journal of the Air & Waste
Management Association 53, 897-902
[27] E.Y. Yazici, H. Deveci, 2014, Ferric sulphate leaching of metals from waste
printed circuit boards, International Journal of Mineral Processing 133, 39–45
[28] E.Y. Yazici, H. Deveci, 2015, Cupric chloride leaching (HCl–CuCl2–NaCl) of
metals from waste printed circuit boards (WPCBs), International Journal of Mineral
Processing 134, 89–96
[29] Z. Ping, F. ZeYun, L. Jie, L. Qianga, Q. GuangRena, Z. Ming, 2009,
Enhancement of leaching copper by electro-oxidation from metal powders of waste
printed circuit board, Journal of Hazardous Materials 166, 746–750
[30] M.Wang, Z. Wang, Z. Guo, 2010, Preparation of electrolytic copper powders with
high current efficiency enhanced by super gravity field and its mechanism,
Transactions of Nonferrous Metals Society of China 20, 1154-1160
[31] L.J.J. Janssen, L. Koene, 2002, The role of electrochemistry and electrochemical

176
technology in environmental protection, Chemical Engineering Journal 85, 137-146
[32] E.-Y. Kim, M.-S. Kim, J.-C. Lee, J. Jeong, B.D. Pandey, 2011, Leaching kinetics
of copper from waste printed circuit boards by electro-generated chlorine in HCl
solution, Hydrometallurgy 107, 124–132
[33] Y.F. Guimarães, I.D. Santos, A.J.B. Dutra, 2014, Direct recovery of copper from
printed circuit boards (PCBs) powder concentrate by a simultaneous electroleaching–
electrodeposition process, Hydrometallurgy 149, 63–70
[34] S.P. Kumar, S. Govindaradjane, T. Sundararajan, 2013, Recovery of copper from
printed circuit boards through electrolytic process- A case study, International Journal
of Engineering Research and Applications 3, 469-473
[35] Pletcher D., Walsh F.C., 2012, Electrorefining of copper. In: Springer Science &
Business Media LLC, Industrial Electrochemistry Second Edition, New York, USA
[36] A. Filzwieser, I. Filzwieser, S. Konetschnik, 2012, New Technology for
Electrorefining of Copper, Journal of Operation Management 64 (11), 1290-1295
[37] Los, A. Lukomska, S. Kowalska, M. Kwartnik, 2014, Laboratory and Pilot Scale
Tests of a New Potential-Controlled Method of Copper Industrial Electrolysis, Journal
of The Electrochemical Society 161, D593-D599 [38] International Centre for Diffraction Data, 2007, Power Diffraction File,
Philadelphia, PA. The ICDD cards used for identifying Cu and CuO, were 04-0836 and
02-1041respectively
[39] H.M. Veit, A.M. Bernardes, J.Z. Ferreira, J.A.S. Tenorio, C. de Fraga Malfatti,
2006, Recovery of copper from printed circuit boards scraps by mechanical processing
and electrometallurgy, Journal of Hazardous Materials B137, 1704–1709
[40] X. Guo, J. Liu, H. Qin, Y. Liu, Q. Tian, D. Li, 2015, Recovery of metal values
from waste printed circuit boards using an alkali fusion-leaching-separation process,
Hydrometallurgy 156, 199-205
[41] I. Masavetas, A. Moutsatsou, E. Nikolaou, S. Spanou, A. Zoikis-Karathanasis,
E.A. Pavlatou, N. Spyrellis, 2009, Production of copper powder from printed circuit
boards by electrodeposition, Global NEST Journal 11, 241-247
[42] T. Gao, G. Meng, Y. Wang, S. Sun, L. Zhang, 2002, Electrochemical synthesis of
copper nanowires, Journal of Physics: Condensed Matter 14, 355-363
[43] A.M. Alfantazi, D. Valic, 2003, A study of copper electrowinning parameters
using a statistically designed methodology, Journal of Applied Electrochemistry 33,
217-225
[44] P. Gallone, 1973, Trattato di ingegneria elettrochimica, Tamburini Editore,
Milano
[45] S. Acharya, 2013, Copper refining electrolyte and slime processing-Emerging
techniques, Advanced Materials Research 828, 93-115
[46] M.L. Free, 2013, Hydrometallurgy Fundamentals and Appliceations, John Wiley
& Sons, Inc., Hoboken, New Jersey

177
[47] Y. Xiang, P. Wu, N. Zhu, T. Zhang, W. Liu, J. Wu, P. Li, 2010, Bioleaching of
copper from waste printed circuit boards by bacterial consortium enriched from acid
mine drainage, Journal of Hazardous Materials 184, 812–818
[48] M.I. Sampson, C.V. Phillips, 2001, Influence of base metals on the oxidising
ability of acidophilic bacteria during the oxidation of ferrous sulphate and mineral
sulfide concentrates, using mesophiles and moderate thermophiles, Minerals
Engineering 14 (No. 3), 317-340

178
Conclusions
In this PhD work, it has been successfully investigated both dismantling of
WPCBs and recovering of copper, which is the predominant metal present in
discarded PCBs, using a novel integrated hydro-electrometallurgical approach. The
electronic components detachment was achieved via hydrometallurgy dissolving all
exposed metallic parts by means of a H2SO4-CuSO4-NaCl solution in the presence
of blowing air for in-situ regeneration of the oxidizing agent. In addition to the
dissolution of Pb-Sn solders, all copper-based contacts (pins and leads) were also
effectively leached. In this way, a copper-rich solution suitable for electrolysis
process was obtained. The electrochemical recovery of copper from the leach
solution was investigated after a preliminary cyclic voltammetry study aimed at
finding the optimum operating conditions for electrolysis. A divided
electrochemical cell was employed for the cathodic copper deposition simultaneous
to the anodic regeneration of the oxidant for the leaching solution recycling. The
results show that ECs can be removed without any damaging at low temperature
using a less polluting solution, which can be anodically restored and recycled to the
process. ECs along with the remaining board maintain their integrity and therefore,
they can be easily separated and sent to recycle or further treatments. Besides, high
copper purity can be obtained electrochemically from the leach solution with the
possibility to operate both in galvanostatic and potentiostatic mode. This is a key
point because the most current recycling technologies allow the recovery of the
copper contained in the PCB structure, while that present as a base material in all
electronic components’ contacts is lost.
The second part of the PhD work was aimed at finding a destination for the
remaining fiberglass reinforced epoxy board after removal of the ECs. A
preliminary chemical characterization suggested as the selective recovery of copper
had to be prioritized because copper is both the main and most valuable material in
disassembled PCBs. In order to guarantee a simple flowsheet, low energy

179
consumption, and low environmental impact, it was decided to employ an entirely
electrometallurgical method using directly large pieces of disassembled WPCBs.
The process involved the use of an undivided electrochemical cell operating in
galvanostatic mode in which electroextraction of copper from PCB pieces occurred
simultaneously to its cathodic deposition. Prior to using PCB pieces as an anode,
the solder mask was removed by chemical treatment in NaOH to expose metallic
copper to the electrolytic solution. Several challenges have been faced in order to
maximize the recovery of copper from the board because the insulating nature of
the PCB substrate did not allow extending the electrolysis time until complete
copper dissolution. However, the benefit to obtain in a single step copper of
commercial grade could be interesting from an economic point of view. Besides,
the remaining PCB pieces could be a good feed material for a biological treatment
in the perspective to reduce the environmental impact.
The two methods developed for dismantling and treating of disassembled
WPCBs use pieces of PCB, but in principle they could use entire PCBs. In
perspective of a large scale application, the entire WPCBs could be directly dipped
in H2SO4-CuSO4-NaCl solution for ECs removal then dipped in NaOH for solder
mask removal and finally transferred to the electrochemical cell. In this way, the
number of operations needed for copper recovery is minimized.
The PhD work was aimed at giving not only an original contribute on WPCBs
recycling but also an answer to the emerging requirements of new cleaner and
simpler recovery processes. On the whole, the proposed method satisfy the criteria
of simple flowsheet and acceptable pollution, but it is still in an early stage and
further investigations are required to evaluate the techno-economic feasibility and
environmental sustainability, particularly for large scale applications.

180
List of publications, conferences and internships
Papers
C. Cocchiara, R. Inguanta, S. Piazza and C. Sunseri, 2016, Nanostructured
anode material for Li-ion battery obtained by galvanic process, Chemical
Engineering Transactions, 47, 73-78
C. Sunseri, C. Cocchiara, F. Ganci, A. Moncada, R.L. Oliveri, B. Patella,
S. Piazza, R. Inguanta, 2016, Nanostructured electrochemical devices for
sensing, energy conversion and storage, Chemical Engineering
Transactions, 47, 43-48
L. Genovese, C. Cocchiara, S. Piazza, C. Sunseri and R. Inguanta, 2017,
Electrochemical deposition of Ag2Se Nanostructures, Materials Research
Bullettin, 86, 10-18
C. Cocchiara, S. Piazza, C. Sunseri and R. Inguanta, 2017, Study of a
Novel Electrochemical Method for Copper Recovery from Waste Printed
Circuit Boards, Chemical Engineering Transactions, 57, 1621-1626
C. Cocchiara, S. Piazza, C. Sunseri and R. Inguanta, 2019, Pb-PbOHCl
composite nanowires synthesized by galvanic deposition in template,
Journal of Nanoscience and Nanotechnology 19, 1-9
C. Cocchiara, B. Patella, F. Ganci, M.G. Insinga, S. Piazza, C. Sunseri, R.
Inguanta, 2019, Nanostructured materials obtained by electrochemical
methods: from fabrication to application in sensing, energy conversion and
storage. In: K.D. Sattler (Ed.), 21st Century Nanoscience- A Handbook,
Taylor & Francis Books, Inc.
C. Cocchiara, S.-A. Dorneanu, R. Inguanta, C. Sunseri, P. Ilea,
Dismantling and copper recovery from Waste Printed Circuit Boards
(WPCBs) in H2SO4–CuSO4–NaCl solutions, Under submission
L. Genovese, C. Cocchiara, B. Patella, C. Sunseri, R. Inguanta, AgGaSe2
Nanostructures obtained by template electrosynthesis, Under submission

181
Patents
C. Cocchiara, R. Inguanta, C. Sunseri, Apparato e metodo per il recupero
di rame a partire da scarti di dispositivi elettrici ed elettronici, Italian patent
102017000110569 del 03/10/2017
G. Aiello, C. Cocchiara, R. Inguanta, B. Patella, C. Sunseri, Metodo per la
realizzazione di sensori elettrochimici con materiali recuperati da dispositivi
di memorizzazione di scarto e sensore elettrochimico ottenibile con tale
metodo, Italian patent 102017000121268 del 25/10/2017
C. Cocchiara, R. Inguanta, M. Insinga, C. Sunseri, Metodo e kit per il
recupero di piombo metallico da componenti di un accumulatore esausto al
Piombo-acido, Italian patent 102017000141056 del 06/12/2017
Conferences
INSTM CONFERENCE, Favignana (TP) 28th June- 1st July 2015
“Nanostructured materials for Sensing, energy conversion and storage” R.
Inguanta, C. Cocchiara, F. Ganci, A. Moncada, B. Patella, S. Piazza, C.
Sunseri S. Lombardo
International conference on nanotechnology based innovative application
for the environment (NINE) 20-23 March, Rome, Italy. “Nanostructured
electrochemical devices for sensing, energy conversion and storage” C.
Sunseri, C. Cocchiara, F. Ganci, A. Moncada, R.L. Oliveri, B. Patella, S.
Piazza and R. Inguanta
International conference on nanotechnology based innovative application
for the environment (NINE) 20-23 March, Rome, Italy. “Nanostructured
anode material for Li-ion battery obtained by galvanic process” C.
Cocchiara, R. Inguanta, C.Sunseri and S. Piazza
ICheaP13- 13th International conference on chemical and process
engineering, 28-31 May 2017, Milan, Italy. “Study of a novel
electrochemical method for copper recovery from waste printed circuit
boards”, C. Cocchiara, S. Piazza, C. Sunseri and R. Inguanta

182
Internships
Babeş-Bolyai University, Faculty of Chemistry and Chemical Engineering,
Cluj-Napoca, Romania, from 1-10-2017 to 1-02-2018, under supervision of
Professors Petru Ilea, Sorin-Aurel Dorneanu and Graziella Liana Turdean
ESI S.p.A Ecological Scrap Industry, Pace del Mela (ME), Italy, from 20-3-
2017 to 20-5-2017, under supervision of engineer Mariateresa Amodeo