
Discrimination of vegetation strata in a multi-layered Mediterranean forest ecosystem using height...
13
Discrimination of vegetation strata in a multi-layered Mediterranean forest ecosystem using height and intensity information derived from airborne laser scanning Felix Morsdorf a, ⁎, Anders Mårell b,d , Benjamin Koetz a , Nathalie Cassagne b , Francois Pimont b , Eric Rigolot b , Britta Allgöwer c a Remote Sensing Laboratories, Universität Zürich, Zürich, Switzerland b INRA, URFM, Ecologie des Forêts Méditerranéennes, UR 629, F-84914 Avignon, France c Wissensstadt Davos/Science City Davos, Davos Platz, Switzerland d Cemagref, UR EFNO, F-45290 Nogent-sur-Vernisson, France abstract article info Article history: Received 23 July 2009 Received in revised form 27 January 2010 Accepted 30 January 2010 Available online xxxx Keywords: Airborne laser scanning LiDAR Shrubland Wildland fires Cluster analysis Canopy profile Supervised classification Vertical stratification Gaussian mixture models Multi-layered ecosystems Height and intensity information derived from Airborne Laser Scanning (ALS) was used to obtain a quantitative vertical stratification of vegetation in a multi-layered Mediterranean ecosystem. A new methodology for the separation of different vegetation strata was implemented using supervised classification of a two- dimensional feature space spanned by ALS return height (terrain corrected) and intensity. The classification was carried out using Gaussian mixture models tuned on a control plot. The approach was validated using extensive field measurements from treated plots, ranging from single vegetation strata to a more complex multi-layered ecosystem. Plot-level canopy profiles derived from ALS and from a geometric reconstruction based on field measurements were in very good agreement, with correlation coefficients ranging from 0.73 (for complex, 3-layered) to 0.96 (simple, single-layered). In addition, it was possible to derive plot-level information on layer height, vertical extent and coverage with absolute accuracies of some decimetres (simple plots) to a meter (complex plots) for both height and vertical extent and about 10 to 15% for layer coverage. The approach was then used to derive maps of the layer height, vertical extent and percentage of ground cover for a larger area, and classification accuracy was evaluated on a per-pixel basis. The method performed best for single-layered plots or dominant layers on multi-layered plots, obtaining an overall accuracy of 80 to 90%. For subdominant layers in the more complex plots, accuracies obtained were as low as 48%. Our results demonstrate the possibility of deriving qualitative (presence and absence of specific vegetation layers) and quantitative, physical data (height, vertical extent and ground cover) describing the vertical structure of complex multi-layered forest ecosystems using ALS-based height and intensity information. © 2010 Elsevier Inc. All rights reserved. 1. Introduction Vegetation stands can be described in many ways using properties related to composition, function and structure, where the descriptors to be used are determined by management objectives. Knowledge on vegetation structure is central to forest stand descriptive work and provides essential information on the vertical and horizontal organisation of plants. Certain structural properties such as basal area, canopy height, leaf area index, and vertical stratification (itself being a function of canopy geometry and foliar arrangement) are related to important ecosystem processes, and are fundamental to the under- standing of forest dynamics. The risk of fire, and damages due to wind and pest depend to a certain degree on canopy structure (Bergeron et al., 2009; MacLean, 1996; Sandberg et al., 2001), where the presence/ absence of different vertical stratification layers and the continuity/ discontinuity between them can determine stand vulnerability. Methods evaluating vertical forest stand properties are thus impor- tant tools in risk assessment schemes. Furthermore, the vertical structure of forests is a vital attribute that determines habitat quality for many forest-dwelling organisms (Camprodon & Brotons, 2006a; Humphrey et al., 1999), and the species composition of the ground flora (Ferris et al., 2000). Consequently, vertical structure has been used for habitat assessments (Graf et al., 2009b), and could be used as a quantitative indicator of biodiversity for the assessment of sus- tainable forest management (Ferris & Humphrey, 1999). Vegetation structure is affected by complex interactions of many ecosystem parameters. Some of these are inherent to the system (e.g. com- petition for light), others are external as effects of topography or disturbances. Our interest is in mapping structural properties that Remote Sensing of Environment xxx (2010) xxx–xxx ⁎ Corresponding author. Remote Sensing Laboratories, Geographisches Institut, Universität Zürich, Winterthurerstr. 190, 8057 Zürich, Switzerland. E-mail address: [email protected] (F. Morsdorf). RSE-07605; No of Pages 13 0034-4257/$ – see front matter © 2010 Elsevier Inc. All rights reserved. doi:10.1016/j.rse.2010.01.023 Contents lists available at ScienceDirect Remote Sensing of Environment journal homepage: www.elsevier.com/locate/rse ARTICLE IN PRESS Please cite this article as: Morsdorf, F., et al., Discrimination of vegetation strata in a multi-layered Mediterranean forest ecosystem using height and intensity information derived from airborne laser scanning, Remote Sensing of Environment (2010), doi:10.1016/j.rse.2010.01.023
Transcript of Discrimination of vegetation strata in a multi-layered Mediterranean forest ecosystem using height...

Remote Sensing of Environment xxx (2010) xxx–xxx
RSE-07605; No of Pages 13
Contents lists available at ScienceDirect
Remote Sensing of Environment
j ourna l homepage: www.e lsev ie r.com/ locate / rse
ARTICLE IN PRESS
Discrimination of vegetation strata in a multi-layered Mediterranean forestecosystem using height and intensity information derived from airbornelaser scanning
Felix Morsdorf a,⁎, Anders Mårell b,d, Benjamin Koetz a, Nathalie Cassagne b, Francois Pimont b,Eric Rigolot b, Britta Allgöwer c
a Remote Sensing Laboratories, Universität Zürich, Zürich, Switzerlandb INRA, URFM, Ecologie des Forêts Méditerranéennes, UR 629, F-84914 Avignon, Francec Wissensstadt Davos/Science City Davos, Davos Platz, Switzerlandd Cemagref, UR EFNO, F-45290 Nogent-sur-Vernisson, France
⁎ Corresponding author. Remote Sensing LaboratoUniversität Zürich, Winterthurerstr. 190, 8057 Zürich, S
E-mail address: [email protected] (F. Morsd
0034-4257/$ – see front matter © 2010 Elsevier Inc. Aldoi:10.1016/j.rse.2010.01.023
Please cite this article as: Morsdorf, F., et aheight and intensity information derived fr
a b s t r a c t
a r t i c l e i n f oArticle history:Received 23 July 2009Received in revised form 27 January 2010Accepted 30 January 2010Available online xxxx
Keywords:Airborne laser scanningLiDARShrublandWildland firesCluster analysisCanopy profileSupervised classificationVertical stratificationGaussian mixture modelsMulti-layered ecosystems
Height and intensity information derived fromAirborne Laser Scanning (ALS)was used to obtain a quantitativevertical stratification of vegetation in a multi-layered Mediterranean ecosystem. A new methodology forthe separation of different vegetation strata was implemented using supervised classification of a two-dimensional feature space spanned by ALS return height (terrain corrected) and intensity. The classificationwas carried out using Gaussian mixture models tuned on a control plot. The approach was validated usingextensive field measurements from treated plots, ranging from single vegetation strata to a more complexmulti-layered ecosystem. Plot-level canopy profiles derived from ALS and from a geometric reconstructionbased on field measurements were in very good agreement, with correlation coefficients ranging from 0.73(for complex, 3-layered) to 0.96 (simple, single-layered). In addition, it was possible to derive plot-levelinformation on layer height, vertical extent and coverage with absolute accuracies of some decimetres (simpleplots) to ameter (complex plots) for both height and vertical extent and about 10 to 15% for layer coverage. Theapproachwas then used to derivemaps of the layer height, vertical extent and percentage of ground cover for alarger area, and classification accuracy was evaluated on a per-pixel basis. The method performed best forsingle-layered plots or dominant layers on multi-layered plots, obtaining an overall accuracy of 80 to 90%. Forsubdominant layers in the more complex plots, accuracies obtained were as low as 48%.Our results demonstrate the possibility of deriving qualitative (presence and absence of specific vegetationlayers) and quantitative, physical data (height, vertical extent and ground cover) describing the verticalstructure of complex multi-layered forest ecosystems using ALS-based height and intensity information.
ries, Geographisches Institut,witzerland.orf).
l rights reserved.
l., Discrimination of vegetation strata in a mom airborne laser scanning, Remote Sensing of
© 2010 Elsevier Inc. All rights reserved.
1. Introduction
Vegetation stands can be described in many ways using propertiesrelated to composition, function and structure, where the descriptorsto be used are determined by management objectives. Knowledgeon vegetation structure is central to forest stand descriptive workand provides essential information on the vertical and horizontalorganisation of plants. Certain structural properties such as basal area,canopy height, leaf area index, and vertical stratification (itself being afunction of canopy geometry and foliar arrangement) are related toimportant ecosystem processes, and are fundamental to the under-standing of forest dynamics. The risk of fire, and damages due to wind
and pest depend to a certain degree on canopy structure (Bergeron etal., 2009; MacLean, 1996; Sandberg et al., 2001), where the presence/absence of different vertical stratification layers and the continuity/discontinuity between them can determine stand vulnerability.Methods evaluating vertical forest stand properties are thus impor-tant tools in risk assessment schemes. Furthermore, the verticalstructure of forests is a vital attribute that determines habitat qualityfor many forest-dwelling organisms (Camprodon & Brotons, 2006a;Humphrey et al., 1999), and the species composition of the groundflora (Ferris et al., 2000). Consequently, vertical structure has beenused for habitat assessments (Graf et al., 2009b), and could be used asa quantitative indicator of biodiversity for the assessment of sus-tainable forest management (Ferris & Humphrey, 1999). Vegetationstructure is affected by complex interactions of many ecosystemparameters. Some of these are inherent to the system (e.g. com-petition for light), others are external as effects of topography ordisturbances. Our interest is in mapping structural properties that
ulti-layered Mediterranean forest ecosystem usingEnvironment (2010), doi:10.1016/j.rse.2010.01.023
2 F. Morsdorf et al. / Remote Sensing of Environment xxx (2010) xxx–xxx
ARTICLE IN PRESS
are relevant in the context of managing a forested ecosystem, e.g. bymonitoring fuel build-up of the understory, which is of high societalrelevance in many fire prone countries. Unfortunately, the verticalstructure is a forest stand property that cannot be directly mappedusing passive remote sensing techniques.
Wildland fires are a threat to socio-economic values in manycountries and are controlled by spatially and temporally varyingboundary conditions, e.g. such as weather, fuel, and topography(Countryman, 1972; Pyne et al., 1996). Fuel has a strong influenceon fire behaviour, so that its characterisation and mapping are keyissues for fire behaviour assessment through modelling but alsofor management planning and fuel hazard mapping (Andersen et al.,2005; Riano et al., 2003). Several fuel characteristics are required toassess fire behaviour, including moisture content, fuel load, size of thefine particles but also its horizontal and vertical spatial distributions.Such data can be used in spatially explicit fire models to assess firebehaviour. These models (Farsite (Finney, 1998), Behave (Andrews,1986) and FIRETEC (Linn et al., 2005)) provide estimates of fireintensity and rate of spread to be expected with the given fuel loadand distribution and prescribed atmospheric conditions. Fuel verticalstratification is an important component in determining potentialwildland fire behaviour, especially the transition from surface tocrown fires (e.g. by the presence of a shrub layer in between), whichrepresents a significant change in terms of fire behaviour and firefighting opportunities (Pimont et al., 2006; Van Wagner, 1977).
As pointed out earlier, fuel maps are essential for planning themanaging (e.g. manual shrub removal) and fuel hazardmapping (verydifferent from basic fuel maps) in the context of fire prevention. InFrance, the elaboration of fire prevention plans has been required bylaw or local regulation in many communities since 1985. In addition,because fuel is almost the only fire factor (opposed to weather andtopography) that can be managed, a significant part of fire preventionis based on fuel treatments. Fuel management techniques includemechanical treatments, controlled grazing and prescribed burning(Xanthopoulos et al., 2006). Subsequent fuel treatments may consistof maintaining low shrub fuel loads at fuel breaks as well as in securitybuffer zones around road networks, or by shrub clearance aroundhouses situated in the wildland–urban interface (WUI). In France,the State Forest Service (Office National des Forêts, ONF) and localcommunities are the principle actors responsible for maintainingfuel breaks, for example by shrub clearance based on phytovolumethreshold values (Etienne et al., 1994). Additionally, France hasintroduced a legislation for human settlements in the WUI that obligeowners of properties located in high fire risk regions to clear the shrublayer within a minimum distance of 50 m around buildings and otherinstallations (French Forestry Act 2001, art. L-321-5.3). The possibilityof efficiently monitoring extensive areas and mapping the status ofthe shrub layer could significantly improve the elaboration ofprevention plans, as well as the fuel management planning and theidentification of strategic areas to be fuel treated in theWUI or on fuelbreaks. It would be especially true if an extensive mapping of shrublayer properties was possible.
LiDAR (Light Detection And Ranging) remote sensing is uniqueamong optical earth observation technologies in that it provides adirect methodology for assessing the elevations on the earth's surface.Using a time-of-flight measurement of a laser pulse in combinationwith known orientation and position of a measurement platform, thethree-dimensional locations of scattering objects can be estimated.Application of this data was mainly for surveying purposes, howeverother applications such as forest inventory have been tested as well(Ginzler et al., 2007; Næsset, 2002, 2004; Popescu & Wynne, 2004).ALS (Lefsky et al., 2002; Næsset, 2002; Popescu &Wynne, 2004;Wehr& Lohr, 1999) have proven efficient at the landscape level to providethree-dimensional information and stand properties of various forestecosystems (Hyde et al., 2005). Large footprint (N10 m) LiDARsystems are suitable for estimating common forest parameters (e.g.
Please cite this article as: Morsdorf, F., et al., Discrimination of vegetatheight and intensity information derived from airborne laser scanning, R
forest height, forest biomass and vertical structure of forest canopies)at the stand level with high accuracies (Dubayah & Drake, 2000),while small-footprint (b1 m) LiDAR systems can be used to estimateforest properties down to the level of single trees (Hyyppä et al., 2001;Morsdorf et al., 2004, 2006). Up to now, ALS data has been lesssuccessful in providing accurate information about vertical compo-nents of grasslands and shrublands where vegetation height iscommonly underestimated due to difficulties discriminating betweenthe ground and low shrubs (Jason & Bork, 2007; Rango et al., 2000).Shrubland communities and forest ecosystems with important shrublayers are dominant wildland fuel types in the Mediterranean region,for which data about height and cover density are valuableinformation in predicting potential fire behaviour. A first attempt inthe Mediterranean region at exploiting the structural information ofALS in combination with imaging spectrometry has been carried outby Koetz et al. (2008). Multiband images of ALS-based height anddensity metrics were generated and combined in that study withairborne imaging spectrometry data to form a multi-dimensionaldataset containing distinct features of a number of land-cover types,including build-up areas. This unique approach increased the accuracyof a support vector machine (SVM) based classification of fuel relatedland-cover types opposed to using imaging spectrometry data alone.
In the present study airborne laser scanning data was used toexplore the possibilities to detect and characterise the verticalstratification of vegetation types in the French Mediterranean region,including lower vegetation layers such as the shrub layer. It focuseson the structural information comprised in the ALS data, based onassessing its explanatory value in comparison with detailed fieldmeasurements in a controlled environment. The main objectives ofthis study are to use small-footprint airborne laser scanning data (i) totest algorithms for automatically describing the vertical stratificationof plant communities, and (ii) to develop a robust methodologyfor mapping forest fuel layer properties, including fuel treatments.Special considerations are given to the possibility of using ALS inten-sity measurements for improved classification of fuel layers. Themethods will be tested and validated on treated field plots, where thedifferent vertical strata were either isolated or combined.
2. Study area
2.1. Description
Our surveyed area consists of a forested area situated in thecalcareous Provence in the FrenchMediterranean region: the Lamanonstudy area (Bouches-du-Rhône). The study area comprises of similarvegetation types ranging fromopen shrublands to densemulti-layeredforest ecosystems. The area has been selected because it containsgradients from simple single-layered ecosystemswith distinct verticalstratification layers to complex multi-layered ecosystems with acontinuous vertical stratification, thus making them suitable fortesting LiDAR under difficult conditions and identifying possiblelimitations due to the density or complexity of the plant cover. TheLamanon study area is an experimental study site in a mixedMediterranean pine–evergreen oak woodland with Aleppo pine(Pinus halepensis) in the upper and holm oak (Quercus ilex) in thelower tree canopy layer, and the shrub layer dominated by box (Buxussempervirens). All three species are evergreen with foliar abscissionoccurring all-year-round although distinct seasonal peaks do occur. Atthe study site, shoot and leaf development mainly occurs during earlyspring (March–May) for all three species, while foliar abscission peaksshortly after shoot development for Q. ilex (June–July), and during thedry season (July–August) for B. sempervirens and P. halepensis. Foliarbiomass had not recovered to their maximum values in October at thetime of ALS data collection, but the fluctuations (all vegetation stratataken together) observed at a similar study sitewithin the same regionshow small variations with aminimum in June–December (R. Huc and
ion strata in a multi-layered Mediterranean forest ecosystem usingemote Sensing of Environment (2010), doi:10.1016/j.rse.2010.01.023
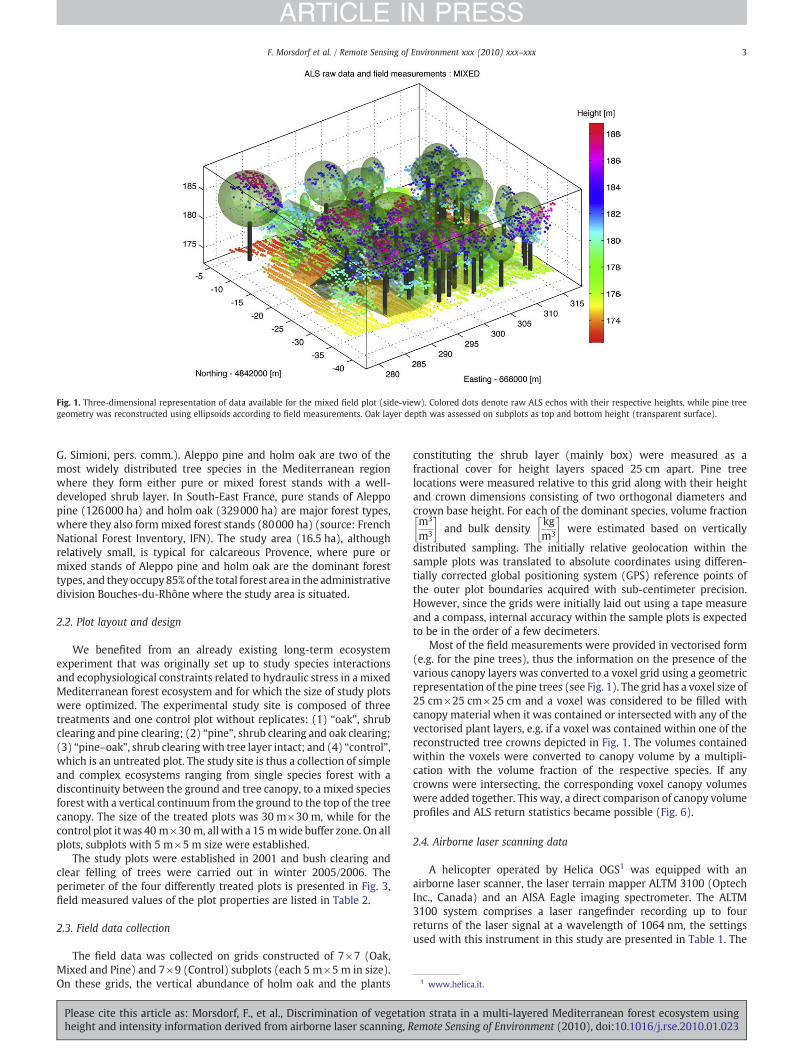
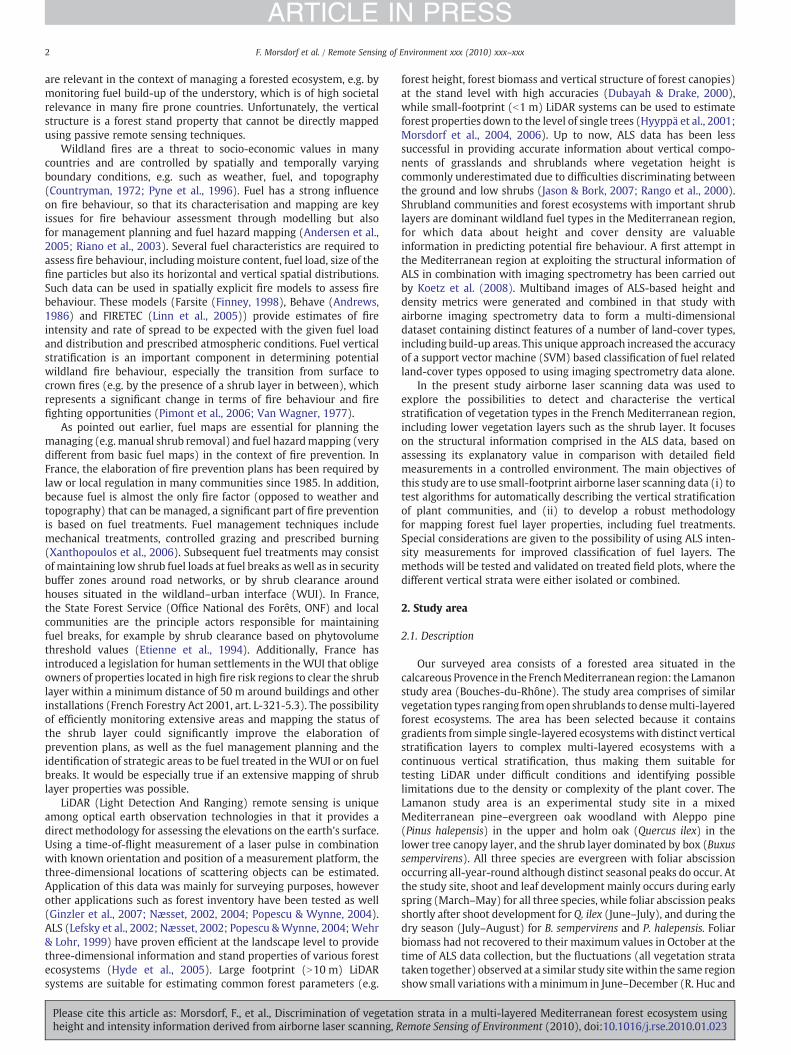
Fig. 1. Three-dimensional representation of data available for the mixed field plot (side-view). Colored dots denote raw ALS echos with their respective heights, while pine treegeometry was reconstructed using ellipsoids according to field measurements. Oak layer depth was assessed on subplots as top and bottom height (transparent surface).
1 www.helica.it.
3F. Morsdorf et al. / Remote Sensing of Environment xxx (2010) xxx–xxx
ARTICLE IN PRESS
G. Simioni, pers. comm.). Aleppo pine and holm oak are two of themost widely distributed tree species in the Mediterranean regionwhere they form either pure or mixed forest stands with a well-developed shrub layer. In South-East France, pure stands of Aleppopine (126000 ha) and holm oak (329000 ha) are major forest types,where they also formmixed forest stands (80000 ha) (source: FrenchNational Forest Inventory, IFN). The study area (16.5 ha), althoughrelatively small, is typical for calcareous Provence, where pure ormixed stands of Aleppo pine and holm oak are the dominant foresttypes, and they occupy85% of the total forest area in the administrativedivision Bouches-du-Rhône where the study area is situated.
2.2. Plot layout and design
We benefited from an already existing long-term ecosystemexperiment that was originally set up to study species interactionsand ecophysiological constraints related to hydraulic stress in a mixedMediterranean forest ecosystem and for which the size of study plotswere optimized. The experimental study site is composed of threetreatments and one control plot without replicates: (1) “oak”, shrubclearing and pine clearing; (2) “pine”, shrub clearing and oak clearing;(3) “pine–oak”, shrub clearingwith tree layer intact; and (4) “control”,which is an untreated plot. The study site is thus a collection of simpleand complex ecosystems ranging from single species forest with adiscontinuity between the ground and tree canopy, to a mixed speciesforest with a vertical continuum from the ground to the top of the treecanopy. The size of the treated plots was 30 m×30 m, while for thecontrol plot it was 40 m×30 m, all with a 15 mwide buffer zone. On allplots, subplots with 5 m×5 m size were established.
The study plots were established in 2001 and bush clearing andclear felling of trees were carried out in winter 2005/2006. Theperimeter of the four differently treated plots is presented in Fig. 3,field measured values of the plot properties are listed in Table 2.
2.3. Field data collection
The field data was collected on grids constructed of 7×7 (Oak,Mixed and Pine) and 7×9 (Control) subplots (each 5 m×5 m in size).On these grids, the vertical abundance of holm oak and the plants
Please cite this article as: Morsdorf, F., et al., Discrimination of vegetatheight and intensity information derived from airborne laser scanning, R
constituting the shrub layer (mainly box) were measured as afractional cover for height layers spaced 25 cm apart. Pine treelocations were measured relative to this grid along with their heightand crown dimensions consisting of two orthogonal diameters andcrown base height. For each of the dominant species, volume fractionm3
m3
� �and bulk density
kgm3
� �were estimated based on vertically
distributed sampling. The initially relative geolocation within thesample plots was translated to absolute coordinates using differen-tially corrected global positioning system (GPS) reference points ofthe outer plot boundaries acquired with sub-centimeter precision.However, since the grids were initially laid out using a tape measureand a compass, internal accuracy within the sample plots is expectedto be in the order of a few decimeters.
Most of the field measurements were provided in vectorised form(e.g. for the pine trees), thus the information on the presence of thevarious canopy layers was converted to a voxel grid using a geometricrepresentation of the pine trees (see Fig. 1). The grid has a voxel size of25 cm×25 cm×25 cm and a voxel was considered to be filled withcanopy material when it was contained or intersected with any of thevectorised plant layers, e.g. if a voxel was contained within one of thereconstructed tree crowns depicted in Fig. 1. The volumes containedwithin the voxels were converted to canopy volume by a multipli-cation with the volume fraction of the respective species. If anycrowns were intersecting, the corresponding voxel canopy volumeswere added together. This way, a direct comparison of canopy volumeprofiles and ALS return statistics became possible (Fig. 6).
2.4. Airborne laser scanning data
A helicopter operated by Helica OGS1 was equipped with anairborne laser scanner, the laser terrain mapper ALTM 3100 (OptechInc., Canada) and an AISA Eagle imaging spectrometer. The ALTM3100 system comprises a laser rangefinder recording up to fourreturns of the laser signal at a wavelength of 1064 nm, the settingsused with this instrument in this study are presented in Table 1. The
ion strata in a multi-layered Mediterranean forest ecosystem usingemote Sensing of Environment (2010), doi:10.1016/j.rse.2010.01.023
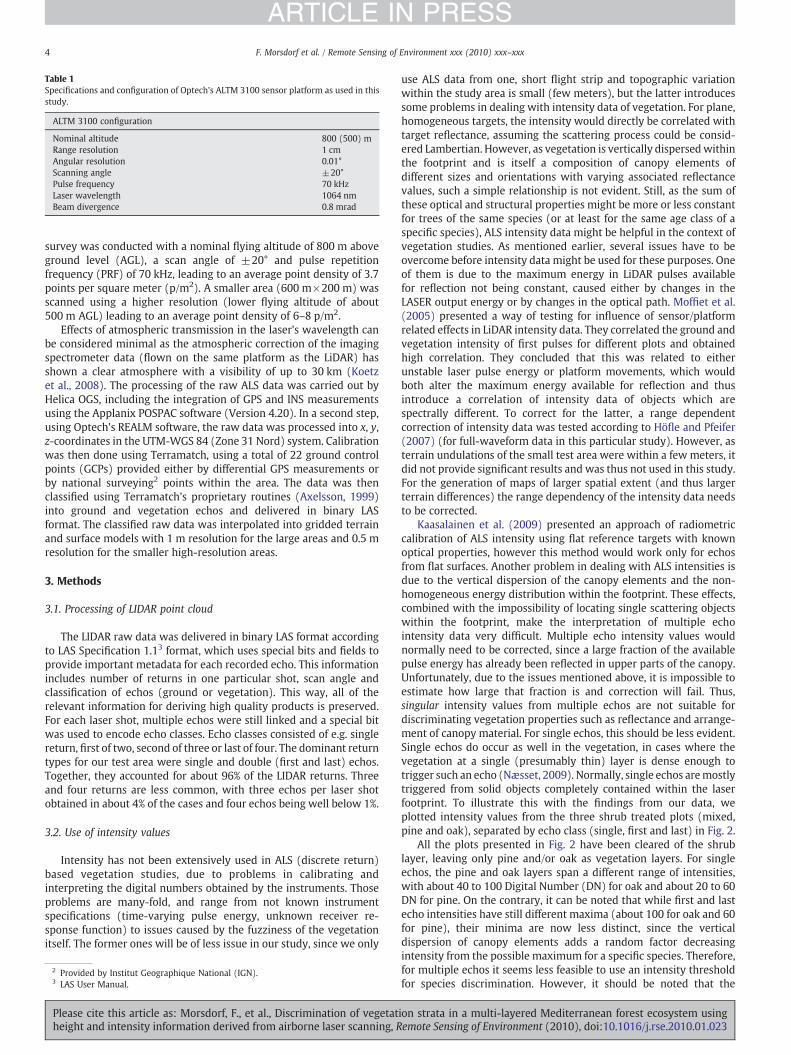
Table 1Specifications and configuration of Optech's ALTM 3100 sensor platform as used in thisstudy.
ALTM 3100 configuration
Nominal altitude 800 (500) mRange resolution 1 cmAngular resolution 0.01°Scanning angle ±20°Pulse frequency 70 kHzLaser wavelength 1064 nmBeam divergence 0.8 mrad
4 F. Morsdorf et al. / Remote Sensing of Environment xxx (2010) xxx–xxx
ARTICLE IN PRESS
survey was conducted with a nominal flying altitude of 800 m aboveground level (AGL), a scan angle of ±20° and pulse repetitionfrequency (PRF) of 70 kHz, leading to an average point density of 3.7points per square meter (p/m2). A smaller area (600 m×200 m) wasscanned using a higher resolution (lower flying altitude of about500 m AGL) leading to an average point density of 6–8 p/m2.
Effects of atmospheric transmission in the laser's wavelength canbe considered minimal as the atmospheric correction of the imagingspectrometer data (flown on the same platform as the LiDAR) hasshown a clear atmosphere with a visibility of up to 30 km (Koetzet al., 2008). The processing of the raw ALS data was carried out byHelica OGS, including the integration of GPS and INS measurementsusing the Applanix POSPAC software (Version 4.20). In a second step,using Optech's REALM software, the raw data was processed into x, y,z-coordinates in the UTM-WGS 84 (Zone 31 Nord) system. Calibrationwas then done using Terramatch, using a total of 22 ground controlpoints (GCPs) provided either by differential GPS measurements orby national surveying2 points within the area. The data was thenclassified using Terramatch's proprietary routines (Axelsson, 1999)into ground and vegetation echos and delivered in binary LASformat. The classified raw data was interpolated into gridded terrainand surface models with 1 m resolution for the large areas and 0.5 mresolution for the smaller high-resolution areas.
3. Methods
3.1. Processing of LIDAR point cloud
The LIDAR raw data was delivered in binary LAS format accordingto LAS Specification 1.13 format, which uses special bits and fields toprovide important metadata for each recorded echo. This informationincludes number of returns in one particular shot, scan angle andclassification of echos (ground or vegetation). This way, all of therelevant information for deriving high quality products is preserved.For each laser shot, multiple echos were still linked and a special bitwas used to encode echo classes. Echo classes consisted of e.g. singlereturn, first of two, second of three or last of four. The dominant returntypes for our test area were single and double (first and last) echos.Together, they accounted for about 96% of the LIDAR returns. Threeand four returns are less common, with three echos per laser shotobtained in about 4% of the cases and four echos being well below 1%.
3.2. Use of intensity values
Intensity has not been extensively used in ALS (discrete return)based vegetation studies, due to problems in calibrating andinterpreting the digital numbers obtained by the instruments. Thoseproblems are many-fold, and range from not known instrumentspecifications (time-varying pulse energy, unknown receiver re-sponse function) to issues caused by the fuzziness of the vegetationitself. The former ones will be of less issue in our study, since we only
2 Provided by Institut Geographique National (IGN).3 LAS User Manual.
Please cite this article as: Morsdorf, F., et al., Discrimination of vegetatheight and intensity information derived from airborne laser scanning, R
use ALS data from one, short flight strip and topographic variationwithin the study area is small (few meters), but the latter introducessome problems in dealing with intensity data of vegetation. For plane,homogeneous targets, the intensity would directly be correlated withtarget reflectance, assuming the scattering process could be consid-ered Lambertian. However, as vegetation is vertically dispersedwithinthe footprint and is itself a composition of canopy elements ofdifferent sizes and orientations with varying associated reflectancevalues, such a simple relationship is not evident. Still, as the sum ofthese optical and structural properties might be more or less constantfor trees of the same species (or at least for the same age class of aspecific species), ALS intensity data might be helpful in the context ofvegetation studies. As mentioned earlier, several issues have to beovercome before intensity data might be used for these purposes. Oneof them is due to the maximum energy in LiDAR pulses availablefor reflection not being constant, caused either by changes in theLASER output energy or by changes in the optical path. Moffiet et al.(2005) presented a way of testing for influence of sensor/platformrelated effects in LiDAR intensity data. They correlated the ground andvegetation intensity of first pulses for different plots and obtainedhigh correlation. They concluded that this was related to eitherunstable laser pulse energy or platform movements, which wouldboth alter the maximum energy available for reflection and thusintroduce a correlation of intensity data of objects which arespectrally different. To correct for the latter, a range dependentcorrection of intensity data was tested according to Höfle and Pfeifer(2007) (for full-waveform data in this particular study). However, asterrain undulations of the small test area were within a few meters, itdid not provide significant results and was thus not used in this study.For the generation of maps of larger spatial extent (and thus largerterrain differences) the range dependency of the intensity data needsto be corrected.
Kaasalainen et al. (2009) presented an approach of radiometriccalibration of ALS intensity using flat reference targets with knownoptical properties, however this method would work only for echosfrom flat surfaces. Another problem in dealing with ALS intensities isdue to the vertical dispersion of the canopy elements and the non-homogeneous energy distribution within the footprint. These effects,combined with the impossibility of locating single scattering objectswithin the footprint, make the interpretation of multiple echointensity data very difficult. Multiple echo intensity values wouldnormally need to be corrected, since a large fraction of the availablepulse energy has already been reflected in upper parts of the canopy.Unfortunately, due to the issues mentioned above, it is impossible toestimate how large that fraction is and correction will fail. Thus,singular intensity values from multiple echos are not suitable fordiscriminating vegetation properties such as reflectance and arrange-ment of canopy material. For single echos, this should be less evident.Single echos do occur as well in the vegetation, in cases where thevegetation at a single (presumably thin) layer is dense enough totrigger such an echo (Næsset, 2009). Normally, single echos aremostlytriggered from solid objects completely contained within the laserfootprint. To illustrate this with the findings from our data, weplotted intensity values from the three shrub treated plots (mixed,pine and oak), separated by echo class (single, first and last) in Fig. 2.
All the plots presented in Fig. 2 have been cleared of the shrublayer, leaving only pine and/or oak as vegetation layers. For singleechos, the pine and oak layers span a different range of intensities,with about 40 to 100 Digital Number (DN) for oak and about 20 to 60DN for pine. On the contrary, it can be noted that while first and lastecho intensities have still different maxima (about 100 for oak and 60for pine), their minima are now less distinct, since the verticaldispersion of canopy elements adds a random factor decreasingintensity from the possible maximum for a specific species. Therefore,for multiple echos it seems less feasible to use an intensity thresholdfor species discrimination. However, it should be noted that the
ion strata in a multi-layered Mediterranean forest ecosystem usingemote Sensing of Environment (2010), doi:10.1016/j.rse.2010.01.023
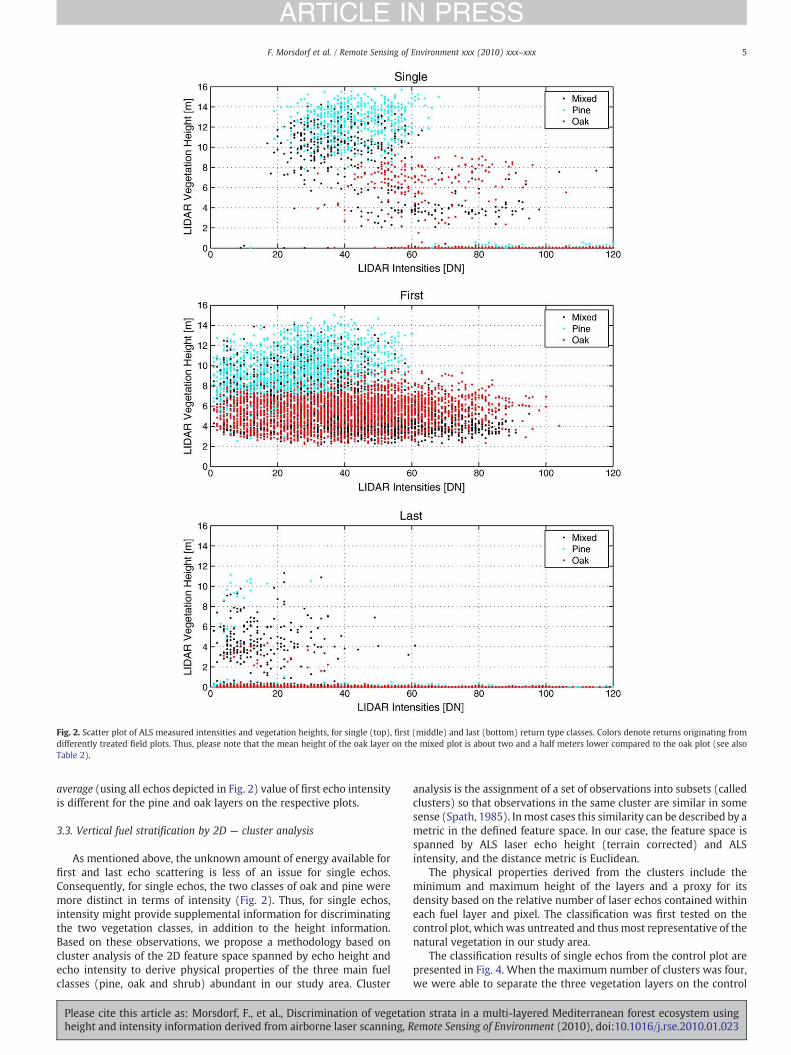
Fig. 2. Scatter plot of ALS measured intensities and vegetation heights, for single (top), first (middle) and last (bottom) return type classes. Colors denote returns originating fromdifferently treated field plots. Thus, please note that the mean height of the oak layer on the mixed plot is about two and a half meters lower compared to the oak plot (see alsoTable 2).
5F. Morsdorf et al. / Remote Sensing of Environment xxx (2010) xxx–xxx
ARTICLE IN PRESS
average (using all echos depicted in Fig. 2) value of first echo intensityis different for the pine and oak layers on the respective plots.
3.3. Vertical fuel stratification by 2D — cluster analysis
As mentioned above, the unknown amount of energy available forfirst and last echo scattering is less of an issue for single echos.Consequently, for single echos, the two classes of oak and pine weremore distinct in terms of intensity (Fig. 2). Thus, for single echos,intensity might provide supplemental information for discriminatingthe two vegetation classes, in addition to the height information.Based on these observations, we propose a methodology based oncluster analysis of the 2D feature space spanned by echo height andecho intensity to derive physical properties of the three main fuelclasses (pine, oak and shrub) abundant in our study area. Cluster
Please cite this article as: Morsdorf, F., et al., Discrimination of vegetatheight and intensity information derived from airborne laser scanning, R
analysis is the assignment of a set of observations into subsets (calledclusters) so that observations in the same cluster are similar in somesense (Spath, 1985). In most cases this similarity can be described by ametric in the defined feature space. In our case, the feature space isspanned by ALS laser echo height (terrain corrected) and ALSintensity, and the distance metric is Euclidean.
The physical properties derived from the clusters include theminimum and maximum height of the layers and a proxy for itsdensity based on the relative number of laser echos contained withineach fuel layer and pixel. The classification was first tested on thecontrol plot, which was untreated and thus most representative of thenatural vegetation in our study area.
The classification results of single echos from the control plot arepresented in Fig. 4. When the maximum number of clusters was four,we were able to separate the three vegetation layers on the control
ion strata in a multi-layered Mediterranean forest ecosystem usingemote Sensing of Environment (2010), doi:10.1016/j.rse.2010.01.023

Fig. 3. ALS-derived intensity values for the small test area and location of field plots. Intensity values are uncorrected digital numbers of single echos interpolated into a raster with0.5 m resolution. Note that the ground within the shrub cleared plots (mixed, pine and oak) appears brighter than areas still containing shrub as lowest layer. The geometric featuresin the upper right are vineyards.
6 F. Morsdorf et al. / Remote Sensing of Environment xxx (2010) xxx–xxx
ARTICLE IN PRESS
plot. The pine layer tops out at about 16 m height and extends downto 10 m and covers a rather low intensity range of about 20 to 60 DN.Beneath the pine layer, the oak layer is visible as a distinct layertopping out at about 8 m and reaching down to about 4 m, to thebeginning of the shrub layer. The shrub layer reaches down to theground of the control plot, rendering a simple echo height thresholdproblematic for a robust discrimination of low shrubs and ground.However, single echo intensity distribution at ground level is groupedinto two distinct peaks, with a relative minimum of number of echosat about 80 DN in between (small panel in Fig. 4). This effect can aswell be observed in Fig. 3, where the ground within the shrub clearedplots appears to be brighter (green polygons). Hence, we tested usingthis effect to separate very low shrubs (b0.5 m height) from bare and/or littered ground. However, it was found that the classification ofpoints in the terrain model generation process provided an overallmore robust way in discriminating low shrubs from bare ground.Therefore, we applied the cluster analysis only on points classified asvegetation returns by Terramatch (Axelsson, 1999).
Fig. 4. Scatter plot of ALSmeasured intensities and vegetation heights, for control plot includisupervised classification of the point cloud using four seedpoints. All laser echos, including
Please cite this article as: Morsdorf, F., et al., Discrimination of vegetatheight and intensity information derived from airborne laser scanning, R
Traditional k-means clustering algorithms (as used in Morsdorfet al. (2004)) need prescribing a fixed number (k) of clusters (Xu &Wunsch, 2005), obtaining best results with some wisely chosenstarting locations for these clusters. This approach, however, isunfeasible in our case as we wanted to detect the presence or absenceof single classes in our study area. Thus, the number of classes tosegment will vary in between data traps. In addition, a Euclideandistance-based cluster analysis might fail for smaller data traps, as onevegetation layer might only be represented by few laser echos, whichare more likely to be assigned to larger clusters containing echos froma different class instead of composing its own cluster. Since some ofthe features of the classes to be segmented were already known, weopted for using a supervised cluster analysis based on multivariatenormal distributions. For each of the four classes identified in Fig. 4,we computed mean values and covariance matrices. These valueswere then used to construct a four component Gaussian mixturemodel within the two-dimensional feature space, abstracting thepoint cloud as classified in Fig. 4. This model was then used with a
ng shrub and ground layers. Colors represent assignment to different clusters based on athose classified as ground return, have been used for this analysis.
ion strata in a multi-layered Mediterranean forest ecosystem usingemote Sensing of Environment (2010), doi:10.1016/j.rse.2010.01.023
7F. Morsdorf et al. / Remote Sensing of Environment xxx (2010) xxx–xxx
ARTICLE IN PRESS
specialized cluster function for a supervised classification of thefeature space in smaller data trap sizes. Using this approach offers theadvantage of working with smaller data traps, since a robustclassification with fewer points (as opposed to e.g. simple k-meansclustering) is feasible. Clustering and generation of Gaussian mixturemodels were performed using the statistics tool box of MATLAB 7.6(Mathworks, Natick, Massachusetts, USA); the functions used arebased on McLachlan and Peel (2000). For the proper computation ofcovariance matrices and Gaussian mixture model, the feature spaceneeded to be scaled so that clusters will have close to spherical shape.As intensity and echo height have very different ranges (0–16 m forterrain corrected echo height and 20–110 [DN] for ALS intensity), wedivided the values of intensity by 10. The pixel size (or horizontal datatrap size) has to be chosen depending on the amount of single echosavailable, with the efficiency of the classification being better forlarger number of single echos. We started off using non-overlapping5 m sized data traps, but initial tests showed that the number of singleechos within those 5×5 m might not be enough (average of 48 totaland 25 within vegetation) to support a robust classification. Fordifferent ecosystems and vegetation layers, the number of recordedsingle echos from vegetation may vary.
Thus, we increased the pixel size of our data traps to 10 m, but keptthe resolution of the destination grid at 5 meter resolution, establish-ing an overlap of 50%. This overlap will introduce some smoothing inthe final data products, but still be sensitive to finer spatial scalescompared to using the larger data trap size with no overlap. From thesegmented clusters, we computed physical properties of each of thedifferent vegetation strata such as mean height, vertical extent andpercentage of cover, as depicted in Fig. 5.
4. Results
4.1. Canopy volume profiles
In Fig. 6, the canopy volume profiles computed from the fieldmeasurements (methodology was described in Section 2.2) areplotted along with the respective ALS return distribution. Profileshave been converted to be relative to terrain height by subtracting theheight information provided by the DTM. In the pine plot (Fig. 6, topleft), only one vegetation layer remained after the clearing; its upperand lower boundaries at 15 and 5 m, respectively, seem to be verywell captured by the ALS return statistics. The general shape of theprofiles is in good agreement, which was not necessarily expected,since the reconstruction of the field measurement was carried out
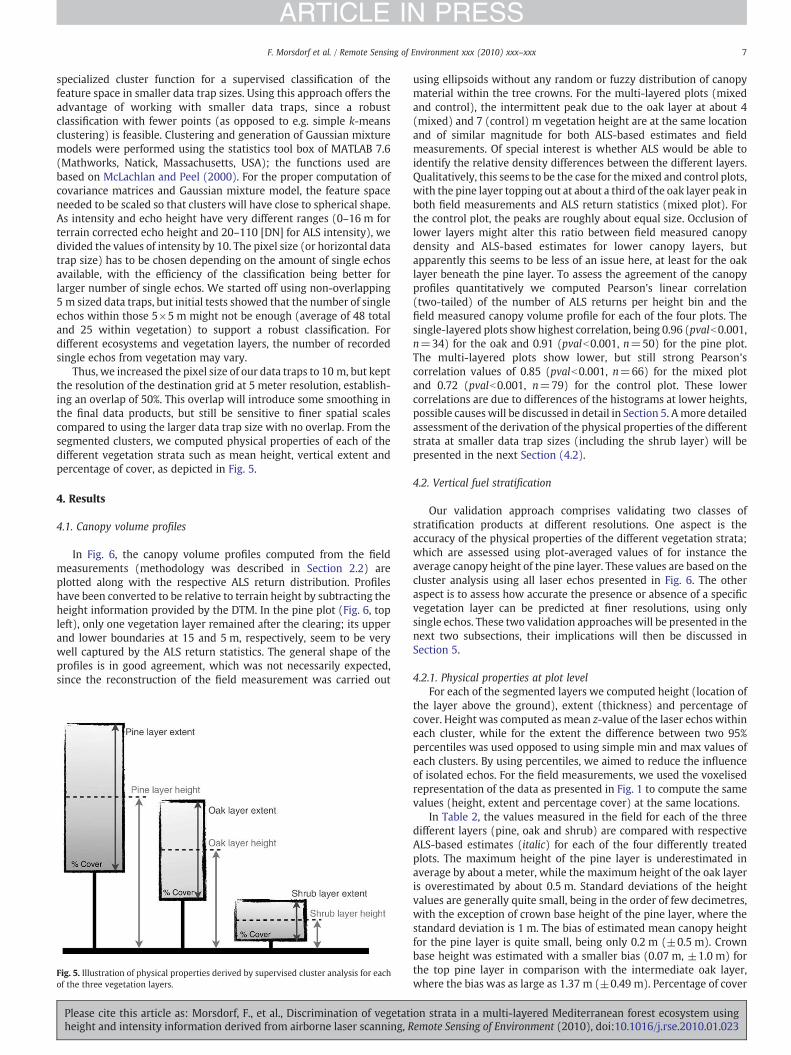
Fig. 5. Illustration of physical properties derived by supervised cluster analysis for eachof the three vegetation layers.
Please cite this article as: Morsdorf, F., et al., Discrimination of vegetatheight and intensity information derived from airborne laser scanning, R
using ellipsoids without any random or fuzzy distribution of canopymaterial within the tree crowns. For the multi-layered plots (mixedand control), the intermittent peak due to the oak layer at about 4(mixed) and 7 (control) m vegetation height are at the same locationand of similar magnitude for both ALS-based estimates and fieldmeasurements. Of special interest is whether ALS would be able toidentify the relative density differences between the different layers.Qualitatively, this seems to be the case for themixed and control plots,with the pine layer topping out at about a third of the oak layer peak inboth field measurements and ALS return statistics (mixed plot). Forthe control plot, the peaks are roughly about equal size. Occlusion oflower layers might alter this ratio between field measured canopydensity and ALS-based estimates for lower canopy layers, butapparently this seems to be less of an issue here, at least for the oaklayer beneath the pine layer. To assess the agreement of the canopyprofiles quantitatively we computed Pearson's linear correlation(two-tailed) of the number of ALS returns per height bin and thefield measured canopy volume profile for each of the four plots. Thesingle-layered plots show highest correlation, being 0.96 (pvalb0.001,n=34) for the oak and 0.91 (pvalb0.001, n=50) for the pine plot.The multi-layered plots show lower, but still strong Pearson'scorrelation values of 0.85 (pvalb0.001, n=66) for the mixed plotand 0.72 (pvalb0.001, n=79) for the control plot. These lowercorrelations are due to differences of the histograms at lower heights,possible causes will be discussed in detail in Section 5. Amore detailedassessment of the derivation of the physical properties of the differentstrata at smaller data trap sizes (including the shrub layer) will bepresented in the next Section (4.2).
4.2. Vertical fuel stratification
Our validation approach comprises validating two classes ofstratification products at different resolutions. One aspect is theaccuracy of the physical properties of the different vegetation strata;which are assessed using plot-averaged values of for instance theaverage canopy height of the pine layer. These values are based on thecluster analysis using all laser echos presented in Fig. 6. The otheraspect is to assess how accurate the presence or absence of a specificvegetation layer can be predicted at finer resolutions, using onlysingle echos. These two validation approaches will be presented in thenext two subsections, their implications will then be discussed inSection 5.
4.2.1. Physical properties at plot levelFor each of the segmented layers we computed height (location of
the layer above the ground), extent (thickness) and percentage ofcover. Height was computed as mean z-value of the laser echos withineach cluster, while for the extent the difference between two 95%percentiles was used opposed to using simple min and max values ofeach clusters. By using percentiles, we aimed to reduce the influenceof isolated echos. For the field measurements, we used the voxelisedrepresentation of the data as presented in Fig. 1 to compute the samevalues (height, extent and percentage cover) at the same locations.
In Table 2, the values measured in the field for each of the threedifferent layers (pine, oak and shrub) are compared with respectiveALS-based estimates (italic) for each of the four differently treatedplots. The maximum height of the pine layer is underestimated inaverage by about a meter, while the maximum height of the oak layeris overestimated by about 0.5 m. Standard deviations of the heightvalues are generally quite small, being in the order of few decimetres,with the exception of crown base height of the pine layer, where thestandard deviation is 1 m. The bias of estimated mean canopy heightfor the pine layer is quite small, being only 0.2 m (±0.5 m). Crownbase height was estimated with a smaller bias (0.07 m, ±1.0 m) forthe top pine layer in comparison with the intermediate oak layer,where the bias was as large as 1.37 m (±0.49 m). Percentage of cover
ion strata in a multi-layered Mediterranean forest ecosystem usingemote Sensing of Environment (2010), doi:10.1016/j.rse.2010.01.023
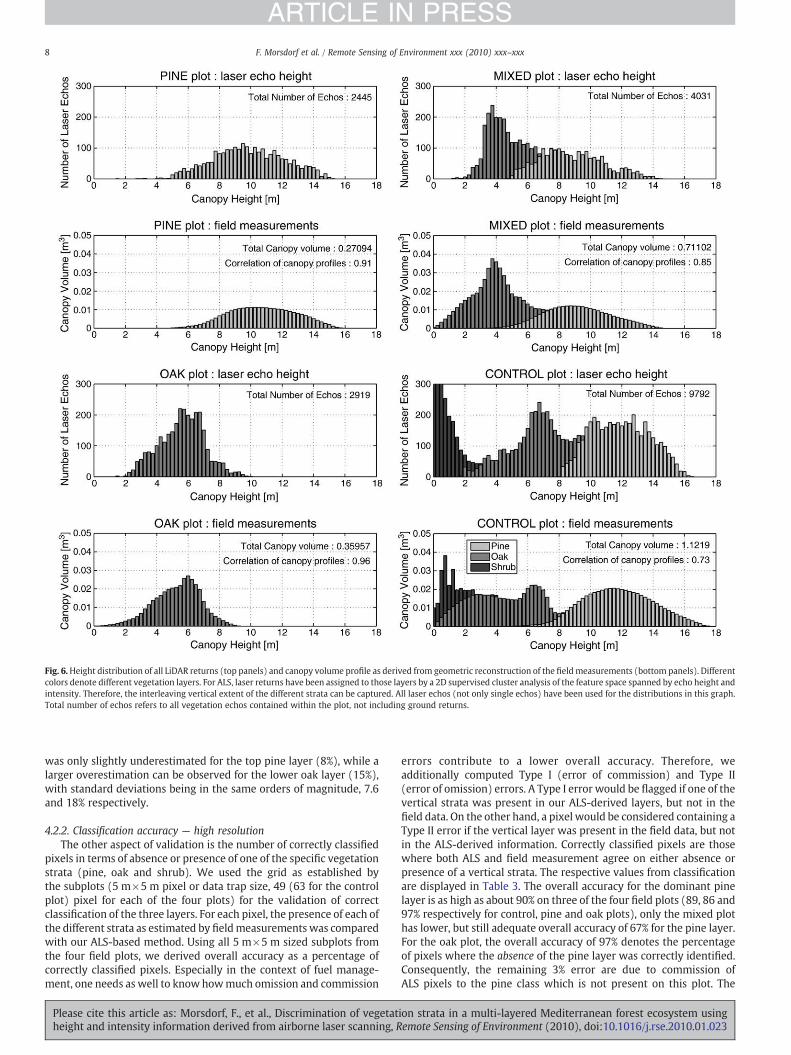
Fig. 6.Height distribution of all LiDAR returns (top panels) and canopy volume profile as derived from geometric reconstruction of the fieldmeasurements (bottom panels). Differentcolors denote different vegetation layers. For ALS, laser returns have been assigned to those layers by a 2D supervised cluster analysis of the feature space spanned by echo height andintensity. Therefore, the interleaving vertical extent of the different strata can be captured. All laser echos (not only single echos) have been used for the distributions in this graph.Total number of echos refers to all vegetation echos contained within the plot, not including ground returns.
8 F. Morsdorf et al. / Remote Sensing of Environment xxx (2010) xxx–xxx
ARTICLE IN PRESS
was only slightly underestimated for the top pine layer (8%), while alarger overestimation can be observed for the lower oak layer (15%),with standard deviations being in the same orders of magnitude, 7.6and 18% respectively.
4.2.2. Classification accuracy — high resolutionThe other aspect of validation is the number of correctly classified
pixels in terms of absence or presence of one of the specific vegetationstrata (pine, oak and shrub). We used the grid as established bythe subplots (5 m×5 m pixel or data trap size, 49 (63 for the controlplot) pixel for each of the four plots) for the validation of correctclassification of the three layers. For each pixel, the presence of each ofthe different strata as estimated by fieldmeasurements was comparedwith our ALS-based method. Using all 5 m×5 m sized subplots fromthe four field plots, we derived overall accuracy as a percentage ofcorrectly classified pixels. Especially in the context of fuel manage-ment, one needs as well to knowhowmuch omission and commission
Please cite this article as: Morsdorf, F., et al., Discrimination of vegetatheight and intensity information derived from airborne laser scanning, R
errors contribute to a lower overall accuracy. Therefore, weadditionally computed Type I (error of commission) and Type II(error of omission) errors. A Type I error would be flagged if one of thevertical strata was present in our ALS-derived layers, but not in thefield data. On the other hand, a pixel would be considered containing aType II error if the vertical layer was present in the field data, but notin the ALS-derived information. Correctly classified pixels are thosewhere both ALS and field measurement agree on either absence orpresence of a vertical strata. The respective values from classificationare displayed in Table 3. The overall accuracy for the dominant pinelayer is as high as about 90% on three of the four field plots (89, 86 and97% respectively for control, pine and oak plots), only the mixed plothas lower, but still adequate overall accuracy of 67% for the pine layer.For the oak plot, the overall accuracy of 97% denotes the percentageof pixels where the absence of the pine layer was correctly identified.Consequently, the remaining 3% error are due to commission ofALS pixels to the pine class which is not present on this plot. The
ion strata in a multi-layered Mediterranean forest ecosystem usingemote Sensing of Environment (2010), doi:10.1016/j.rse.2010.01.023

Table 2Maximum, minimum, mean height and percentage of cover of the three strata on the four field plots, as measured in the field and estimated by ALS (italic). For each of the vegetationlayers, a bias and a standard deviation was computed (bold values).
Field plot Control Mixed Pine Oak Field–ALS
As estimated by: Field ALS Field ALS Field ALS Field ALS Mean Std.
Pine tree layerALS echos per class 3957 1952 2445 –
Maximum canopy height [m] 17.8 16.5 14.8 14.4 16.3 15.2 – – 1.1 0.45Average canopy height [m] 11.8 11.9 9.0 8.9 10.8 9.9 – – 0.2 0.51Crown base height [m] 8.3 9.2 5.8 5.8 7.2 6.1 – – 0.07 1.0Cover [%] 52 61 43 43 44 59 – – −8 7.6
Oak tree layerALS echos per class 3075 2079 – 2919Maximum canopy height [m] 8.6 9.7 7.7 7.7 – – 9.4 9.9 −0.53 0.55Average canopy height [m] 6.4 6.3 4.6 4.3 – – 6.2 5.6 0.33 0.25Crown base height [m] 4.8 3.2 3.6 2.8 – – 4.8 3.1 1.37 0.49Cover [%] 46 51 72 43 – – 74 15 18
Shrub layerALS echos per class 2760 – – –
Maximum shrub height [m] 4.0 3.0 – – – – – – −1.0 –
Average shrub height [m] 1.2 0.6 0.2a –a 0.3a –a 0.2a –a −0.6 –
Cover [%] 61 50 8a –a 12a –a 8a –a −11 –
a Please note that the shrub layer on the mixed, pine and oak plot was removed by the time of the ALS survey.
9F. Morsdorf et al. / Remote Sensing of Environment xxx (2010) xxx–xxx
ARTICLE IN PRESS
subdominant oak layer is less accurately classified with overallaccuracies around 60%, except for the pine plot, where the absenceof the oak layer could be predicted with an accuracy of 91%. Thedominant error for the oak layer are omission errors, where the ALS-based method failed to detect the oak layers present in our field data.This is especially evident in the complex control plot, where the loweroak layer and shrub layer may have been confused for several pixels.The classification accuracy of shrub layer presence is again lower,being 48% on the control plot. To the contrary, the absence of theshrub layer on the pine, oak and mixed plot can be very wellpredicted, with overall accuracies of 86%, 94% and 100%, respectively.
The produced maps of the physical properties of each layer (seeFig. 5) such as mean, minimum and maximum height and percentageof cover are presented in Fig. 7. Please note that the results for thesingle plots might be slightly different as for the evaluation of
Table 3Classification accuracies regarding presence and absence of a particular vegetation layeron the 5×5 m subplots. Overall accuracies, Cohen's kappa coefficient κ, type I errors(strata present in ALS data, but not in field data) and type II errors (strata present infield data, but not in ALS data) are presented for each of the four differently treated fieldplots.
Classification accuracies [%]
Layer Pine Oak Shrub
Control plot — 63 pixel — κ=0.5034Overall Acc. 89 63 48Type I error (α) 0 8 38Type II error (β) 10 29 14
Pine plot— 42 pixel — κ=0.8194Overall Acc. 86 91 86Type I error (α) 0 8 14Type II error (β) 14 0 0
Oak plot — 42 pixel — κ=0.7350Overall Acc. 97 56 94Type I error (α) 3 8 6Type II error (β) 0 36 0
Mixed plot — 42 pixel — κ=0.6838Overall Acc. 67 69 100Type I error (α) 0 0 0Type II error (β) 33 30 0
Please cite this article as: Morsdorf, F., et al., Discrimination of vegetatheight and intensity information derived from airborne laser scanning, R
classification accuracy in Table 3, as we used the original, tilted gridfor that evaluation and the maps in Fig. 7 were produced using astandard 2D coordinate grid with north–south and east–west ascoordinate axes. Still, the maps do agree very well with the findings ofTable 3 as can for instance be seen at the shrub layer, in which absenceis predicted with high accuracy on the three manually treated plots.
5. Discussion
A new approach for deriving the vertical stratification of canopyelements for a multi-layered Mediterranean ecosystem was imple-mented and validated using extensive field measurements fromsouthern France. ALS-based canopy profiles derived using all recordedechos from the sample plots were in very good agreement with fieldmeasurements, with higher correlations for the simpler, single-layered plots (0.91 and 0.96) and somewhat lower, but still significantvalues for the double- (0.85) and three-layered (0.73) plot. The lowerpart of the oak layer in the mixed plot (0.5–3 m) is not very wellrepresented in the ALS return statistics. The reasons for this may bethe instrument dead-time, which is about 2 m and would result in alower number of distinct first and last echos from a layer close to theground. Still, single echos should be able to provide some informationon this layer and there are many echos in that height range in thecontrol plot (Fig. 6, bottom right). Other causes might be consideredhere as well, such as occlusion by taller vegetation, inappropriategeometric reconstruction of the oak layer and/or inconsistencies infield measurements. An automated methodology of deriving physicalproperties of different vegetation strata using a two-dimensionalfeature space spanned by ALS echo height (terrain corrected) andsingle echo intensity was applied. Including ALS echo intensity asan additional feature helped in separating layers that could not beseparated by pure echo height based thresholds, and the interleavingnature of those layers was captured (Fig. 6). At the plot level, themethod provided high accuracies of height and extent of thedominant layers, with biases and standard deviations in the order ofsome decimetres and up to about a meter of systematic underesti-mation of maximum canopy height at the pine layer. As for otherLiDAR-based studies of vegetation, error sources for this underesti-mation could be laser pulse penetration in combinationwith samplingissues (Gaveau & Hill, 2003). However, only the maximum canopyheight is affected by this problem, and consequently shows larger bias
ion strata in a multi-layered Mediterranean forest ecosystem usingemote Sensing of Environment (2010), doi:10.1016/j.rse.2010.01.023
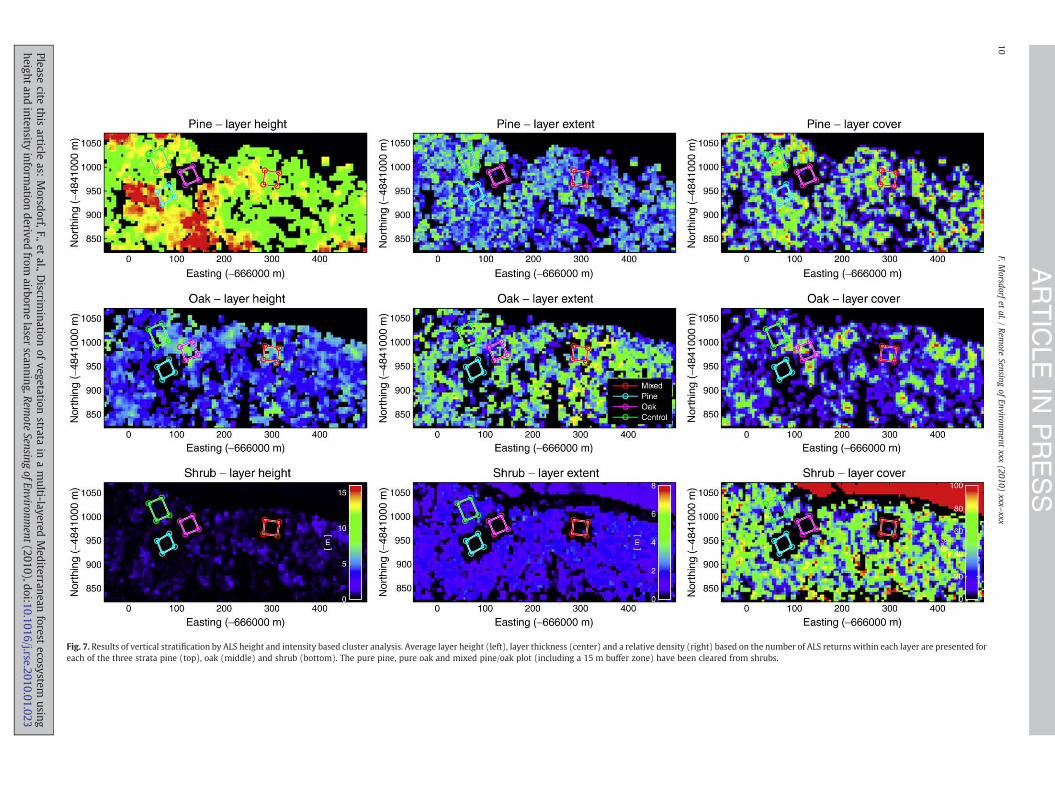
Fig. 7. Results of vertical stratification by ALS height and intensity based cluster analysis. Average layer height (left), layer thickness (center) and a relative density (right) ba n the number of ALS returns within each layer are presented foreach of the three strata pine (top), oak (middle) and shrub (bottom). The pure pine, pure oak and mixed pine/oak plot (including a 15 m buffer zone) have been cleared m shrubs.
10F.M
orsdorfet
al./Rem
oteSensing
ofEnvironm
entxxx
(2010)xxx–xxx
ARTICLE
INPRESS
Pleasecite
thisarticle
as:Morsdorf,F.,et
al.,Discrim
inationof
vegetationstrata
inamulti-layered
Mediterranean
forestecosystem
usingheight
andintensity
information
derivedfrom
airbornelaser
scanning,Remote
SensingofEnvironm
ent(2010),doi:10.1016/j.rse.2010.01.023
sed ofro
11F. Morsdorf et al. / Remote Sensing of Environment xxx (2010) xxx–xxx
ARTICLE IN PRESS
of 1 m. The mean canopy height of the tree layers are estimated withmuch higher accuracies (some decimetres), even on the complexcontrol plot. This proves that our methodology is capable to providethe physical properties of the different strata with accuracies that areclose to those of the time- and cost-consuming field work. Height ofthe shrub layer was underestimated by about a meter, however, onehas to take into account that the voxelised shrub layer descriptionwasonly available for 8 subplots on the control plot, and therefore thenumbers regarding the presence and properties of the shrub layerneed to be treated with a bit of caution. Still, the methodologyprovided good results to generally infer the presence or absence of thedifferent vegetation layers at 5 m resolution, performing best at thesimpler plots and for the dominant layers with high overall accuracies(N80%). The results were lower for the complex plots e.g. classificationaccuracy of the shrub layer on the three-layered control plot was only48%. This decrease was expected, and is most likely caused byocclusion, which is generally a problem in ALS-based vegetationstudies (Harding et al., 2001). Other factors contributing to lowerperformance of some plots might be due to the interleaving nature ofthe different classes in the two-dimensional feature space, whichnegatively influences separability of those classes. Such confusionbetween classes might as well explain the modest overestimation ofthe intermediate oak layer cover, paired with the slight underestima-tion of the top pine layer and the bottom shrub layer cover. Additionalinformation (such as echowidth) provided by a full-waveform systemcould be used to increase the dimensionality of the feature space andultimately provide more explanatory value in separating the differentclasses. This study used ALS intensity as an additional source ofinformation for the segmentation of different classes, which has beenused to discriminate species in a segmented point cloud, as e.g. by asingle tree extraction method (Holmgren et al., 2008).
5.1. Implications for fire prevention planning and fire hazard mapping
The methodology presented offers the advantage of providingexplicit information on physical properties of vertically dispersedvegetation strata at the plot-level and information on their presenceand absence at higher spatial resolution (5 m pixel size). Thisinformation cannot be directly retrieved with passive optical remotesensing methods and delivers information even on those strata thatwould normally be occluded in passive optical data. On one hand, thephysical properties of vegetation are important input factors for firebehaviour modelling, which in turn would lead to new inputs into anadvanced fuel management plan, e.g. new directives for manual fueltreatment. On the other hand, the classification of absence/presenceof vegetation layers is of high relevance in terms of supervising fuelmanagement directives that are already in practice. For instance, atthe wildland–urban interface the presented method can be used tosurvey if the house owners do not clear their surroundings of theshrub layer as demanded by local policies. For fuel managementin wildland, vegetation phytovolume and namely shrub stratumphytovolume is an important field indicator for assessing fuelencroachment. By giving access to cover and height of the mainvegetation stratum, i.e. the basic inputs to calculate vegetationphytovolumes, this ALS-based approach can thus assist for mappingfuel break networks on a given area. This methodology could be usefulto estimate understory fuel encroachment in these strategic fuelisolation areas especially if tree layer is thinned enough as required byFrench fuel break treatment standards (Xanthopoulos et al., 2006).This would be valuable information for estimating appropriate fueltreatment interval and for planning fuel management operations.
5.2. Implications for wildlife management and biodiversity conservation
Our results demonstrate that ALS can discriminate betweenseveral vegetation strata and provide important structural informa-
Please cite this article as: Morsdorf, F., et al., Discrimination of vegetatheight and intensity information derived from airborne laser scanning, R
tion (such as height and cover) in multi-layered Mediterraneanecosystems, which could be of value to wildlife management andbiodiversity conservation (Turner et al., 2003). For example, thevegetation understory layer is an important ecosystem componentdetermining habitat quality for many forest-dwelling species suchas birds and ungulates for which it provides forage and shelter(Farmer et al., 2006; Michel et al., 2008; Vospernik & Reimoser, 2008).ALS-based methodologies could thus be incorporated in wildlifemanagement and biodiversity conservation schemes with the aim toimprove habitat suitability assessments at the landscape level. Grafet al. (2009a), for example, were able to provide a more fine-grainedpicture of habitat suitability for Capercaillie in the Swiss Alps usingALS-based measures of horizontal and vertical structure as comparedto prior habitat suitability models based on large-scale passivesensor data. Furthermore, competition for light, water and nutrientsbetween different vegetation strata play a role in determining localunderstory plant community dynamics (Mitchell & Kirby, 1989),and ultimately local plant species composition and diversity (Berger &Puettmann, 2000). Changes caused by natural (e.g. fire and ungulates)or anthropogenic (e.g. forestry practices) disturbances to the under-story vegetation could further have cascading effects at higher trophiclevels (Allombert et al., 2005a,b; Camprodon & Brotons, 2006b;Mitchell and Kirby, 1989; Slik & Van Balen, 2006). Descriptors ofthe vertical stratification of forest ecosystems could thus be used asquantitative indicators for the assessment of biodiversity (Ferris &Humphrey, 1999) related to certain taxonomic groups such as plants,insects and birds (Bergs, 2004). Goetz et al. (2007) showed as anexample that canopy vertical distribution information could be usedto predict bird species richness in eastern temperate forests of theUnited States.
6. Conclusion and outlook
We were able to successfully demonstrate that small-footprintairborne laser scanning height and intensity information could be usedto discriminate between three different vegetation strata in a multi-layered Mediterranean ecosystem. It was possible to validate physicalproperties derived for those strata at plot level, and we obtainedsatisfying accuracies for the classification of vegetation strata at higherresolutions using ALS-based intensity as an additional predictorvariable. Small-footprint full-waveformdatawould very likely provideeven more explanatory value for the discrimination of differentvegetation classes by providing not only the intensity, but also theecho width, while keeping the high spatial resolution generallyobtained by small-footprint systems. Even for full-waveform systems,the intensity will suffer from the unknown area of vertically dispersedcanopy within the footprint. On the other hand, echo width hasproven to be useful for classifying ground and vegetation returns(Ducic et al., 2006;Wagner et al., 2008). The echowidth is not affectedby scattering objects above or below the recorded echo for whichthe width information is exploited; rather it is directly related to thephysical properties of the scattering object, and thus should provide amuch more robust classifier than intensity. This only holds true, ofcourse, if differences in echowidth can be linked to a single species. Toapply the method to larger areas, we propose a two-step procedure.First, a land-cover classification should be carried out combining LiDARand imaging spectrometry data (method described in Koetz et al.(2008)). Second, the method described in this study can be used for adedicated assessment of the vertical structure of the vegetationcontainedwithin the vegetated areas,where a traditional classificationapproach as in Koetz et al. (2008) would not be capable of e.g.providing physical properties of different vegetation strata. Of muchgreater benefit for a study like this would be the use of amulti-spectralcanopy LiDAR with wisely chosen wavelengths, which would registerthe unique spectral signatures of the different strata of vegetation.Several studies pointed at the potential benefits of such a system
ion strata in a multi-layered Mediterranean forest ecosystem usingemote Sensing of Environment (2010), doi:10.1016/j.rse.2010.01.023
12 F. Morsdorf et al. / Remote Sensing of Environment xxx (2010) xxx–xxx
ARTICLE IN PRESS
(Rall & Knox, 2004; Tan & Narayanan, 2004), and a prototype of suchan instrument was developed at the University of Edinburgh (I.H.Woodhouse, pers. comm.). Amodelling study highlighted the ability ofsuch instruments to assess both the physiology and structure ofvegetation canopies (Morsdorf et al., 2009).
Acknowledgements
This work was funded by the EC integrated project FireParadox(www.fireparadox.org). The authors acknowledge the field assistanceprovided by Philippe Petit and Denis Portier. The authors wish tothank Lamanon municipality for access to its property, and StateForest Service (Office National des Forêts, ONF) for technicalassistance. Vegetation treatments have been carried out in theframework of a National research project from GIS Incendies deForêts coordinated by Roland Huc and supported by French Ministryof Agriculture. We would like to thank the three anonymousreviewers for their help in improving the manuscript and AdrianSchubert for language related editing.
References
Allombert, S., Gaston, A. J., & Martin, J. L. (2005). A natural experiment on the impact ofoverabundant deer on songbird populations. Biological Conservation, 126, 1−13.
Allombert, S., Stockton, S., & Martin, J. L. (2005). A natural experiment on the impact ofoverabundant deer on forest invertebrates. Conservation Biology, 19, 1917−1929.
Andersen, H. -E., McGaughey, R. J., & Reutebuch, S. E. (2005). Estimating forest canopyfuel parameters using lidar data. Remote Sensing of Environment, 94(4), 441−449.
Andrews, P. (1986). BEHAVE: Fire behaviour prediction and fuel modelling system— BURNsubsystem, part 1. Tech. rep., USDA Forest Service, Research paper INT-194.
Axelsson, P. (1999). Processing of laser scanner data — Algorithms and applications.ISPRS Journal of Photogrammetry & Remote Sensing, 54(2–3), 138−147.
Berger, A. L., & Puettmann, K. J. (2000). Overstory composition and stand structureinfluence herbaceous plant diversity in the mixed aspen forest of northernMinnesota. American Midland Naturalist, 143, 111−125.
Bergeron, C., Ruel, J., Elie, J., & Mitchell, S. (2009). Root anchorage and stem strength ofblack spruce (Picea mariana) trees in regular and irregular stands. Forestry, 82,29−41.
Bergs, L. (2004). Rle des coupes, de la stratification verticale et du mode de traitementdans la conservation de la biodiversit. In M. Gosselin & O. Laroussinie (Eds.),Biodiversit et gestion forestire. Connatre pour prserver. Paris: GIP-ECOFOR.
Camprodon, J., & Brotons, L. (2006). Effects of undergrowth clearing on the birdcommunities of the Northwestern Mediterranean Coppice Holm oak forests. ForestEcology and Management, 221, 72−82.
Camprodon, J., & Brotons, L. (2006). Effects of undergrowth clearing on the birdcommunities of the Northwestern Mediterranean Coppice Holm oak forests. ForestEcology and Management, 221, 72−82.
Countryman, C. M. (1972). The fire environment concept.Berkley, CA: Pacific SouthwestForest and Range Experiment Station 12 pp.
Dubayah, R., & Drake, J. (2000). Lidar remote sensing for forestry. Journal of Forestry, 98,44−46.
Ducic, V., Hollaus, M., Ullrich, A., Wagner, W., & Melze, T. (2006). 3d vegetationmapping and classification using full-waveform laser scanning. Internationalworkshop 3D remote sensing in forestry, Vienna, Feb. 14–15, 2006 (pp. 211−217).
Etienne, M., Mas, I., & Rigolot, E. (21/24 November, 1994). Combining techniques of fuelreduction for fuel-break maintenance in the French Mediterranean region. 2ndinternational conference on forestfire research, Coimbra, Portugal,Vol. 2. (pp. 713−721).
Farmer, C. J., Person, D. K., & Bowyer, R. T. (2006). Risk factors and mortality of black-tailed deer in a managed forest landscape. Journal of Wildlife Management, 70,1403−1415.
Ferris, R., & Humphrey, J. (1999). A review of potential biodiversity indicators forapplication in British forests. Forestry, 72, 313−328.
Ferris, R., Peace, A., Humphrey, J., & Broome, A. (2000). Relationships betweenvegetation, site type and stand structure in coniferous plantations in Britain. ForestEcology and Management, 136, 35−51.
Finney, M. (1998). FARSITE: Fire area simulator-model. Development and evaluation.USDA Forest Service Research Paper, RMRS-RP-4.
Gaveau, D., & Hill, R. (2003). Quantifying canopy height underestimation by laser pulsepenetration in small-footprint airborne laser scanning data. Canadian Journal ofRemote Sensing, 29, 650−657.
Ginzler, C., Boehl, J., Boesch, R., & Waser, L. (2007). Accuracy of forest parametersderived from medium footprint lidar under operational constraints. InternationalArchives of Photogrammetry and Remote Sensing, Vol. XXXVI, Part 3 / W52.
Goetz, S., Steinberg, D., Dubayah, R., & Blair, B. (2007). Laser remote sensing of canopyhabitat heterogeneity as a predictor of bird species richness in an easterntemperate forest, USA. Remote Sensing of Environment, 108, 254−263.
Graf, R., Mathys, L., & Bollmann, K. (2009). Habitat assessment for forest dwellingspecies using LiDAR remote sensing: Capercaillie in the Alps. Forest Ecology andManagement, 257, 160−167.
Please cite this article as: Morsdorf, F., et al., Discrimination of vegetatheight and intensity information derived from airborne laser scanning, R
Graf, R. F., Mathys, L., & Bollmann, K. (2009). Habitat assessment for forest dwellingspecies using LiDAR remote sensing: Capercaillie in the Alps. Forest Ecology andManagement, 257, 160−167.
Harding, D., Lefsky, M., Parker, G., & Blair, J. (2001). Laser altimeter canopy heightprofiles: Methods and validation for closed-canopy, broadleaf forests. RemoteSensing of Environment, 76, 283−297.
Höfle, B., & Pfeifer, N. (Dec. 2007). Correction of laser scanning intensity data: Dataandmodel-driven approaches. ISPRS Journal of Photogrammetry and Remote Sensing,62(6), 415−433.
Holmgren, J., Persson, A., & Söderman, U. (2008). Species identification of individualtrees by combining high resolution LiDAR data with multi-spectral images.International Journal of Remote Sensing, 29(5), 1537−1552.
Humphrey, J., Hawes, C., Peace, A., Ferris-Kaan, R., & Jukes, M. (1999). Relationshipsbetween insect diversity and habitat characteristics in plantation forests. ForestEcology and Management, 113, 11−21.
Hyde, P., Dubayah, R., Peterson, B., Blair, J., Hofton, M., Hunsaker, C., et al. (Jun. 2005).Mapping forest structure for wildlife habitat analysis using waveform LiDAR:Validationofmontaneecosystems.Remote Sensingof Environment,96(3–4), 427−437.
Hyyppä, J., Kelle, O., Lehikoinen, M., & Inkinen, M. (2001). A segmentation-basedmethod to retrieve stem volume estimates from 3-d tree height models producedby laser scanners. IEEE Transactions on Geoscience and Remote Sensing, 39, 969−975.
Jason, S., & Bork, E. (2007). Characterization of diverse plant communities in AspenParkland rangeland using LiDAR data. Applied Vegetation Science, 10, 407−416.
Kaasalainen, S., Hyyppa, H., Kukko, A., Litkey, P., Ahokas, E., Hyyppa, J., et al. (Feb. 2009).Radiometric calibration of LiDAR intensity with commercially available referencetargets. IEEE Transactions on Geoscience and Remote Sensing, 47(2), 588−598.
Koetz, B., Morsdorf, F., van der Linden, S., Curt, T., & Allgöwer, B. (Jul. 2008). Multi-source land cover classification for forest fire management based on imagingspectrometry and LiDAR data. Forest Ecology and Management, 256(3), 263−271.
Lefsky, M. A., Cohen,W. B., Parker, G. G., & Harding, D. J. (2002). Lidar remote sensing forecosystem studies. BioScience, 52(1), 19−30.
Linn, R.,Winterkamp, J., Colman, J., Edminster, C., & Bailey, J. (2005).Modeling interactionsbetween fire and atmosphere in discrete element fuel beds. International Journal ofWildland Fire, 14, 37−48.
MacLean, D. (1996). Forest management strategies to reduce spruce budworm damagein the Fundy Model Forest. Forestry Chronicle, 72, 399−405.
McLachlan, G., & Peel, D. (2000). Finite mixture models. John Wiley & Sons Inc.Michel, P., Jenkins, J., Mason, N., Dickinson, K. J. M., & Jamieson, I. G. (2008). Assessing
the ecological application of lasergrammetric techniques to measure fine-scalevegetation structure. Ecological Informatics, 3, 309−320.
Mitchell, P., & Kirby, K. (1989). Ecological effects of forestry practices in long-establishedwoodland and their implications for nature conservation. Oxford: Oxford ForestryInstitute.
Moffiet, T.,Mengersen,K.,Witte, C., King, R., &Denham, R. (2005). Airborne laser scanning:Exploratory data analysis indicates potential variables for classification of individualtrees or forest stands according to species. ISPRS Journal of Photogrammetry & RemoteSensing, 59, 289−309.
Morsdorf, F., Meier, E., Kötz, B., Itten, K. I., Dobbertin, M., & Allgöwer, B. (2004). Lidar-based geometric reconstruction of boreal type forest stands at single tree level forforest and wildland fire management. Remote Sensing of Environment, 3(92),353−362.
Morsdorf, F., Kötz, B., Meier, E., Itten, K., & Allgöwer, B. (2006). Estimation of LAI andfractional cover from small footprint airborne laser scanning data based on gapfraction. Remote Sensing of Environment, 104(1), 50−61.
Morsdorf, F., Nichol, C., Malthus, T., & Woodhouse, I. H. (2009). Assessing foreststructural and physiological information content of multi-spectral LiDAR wave-forms by radiative transfer modelling. Remote Sensing of Environment, 113(10),2152−2163.
Næsset, E. (2002). Predicting forest stand characteristics with airborne scanning laserusing a practical two-stage procedure and field data. Remote Sensing of Environment,80(1), 88−99.
Næsset, E. (2004). Accuracy of forest inventory using airborne laser-scanning:Evaluating the First Nordic Full-Scale Operational Project. Scandinavian Journal ofForest Research, 19, 554−557.
Næsset, E. (2009). Effects of different sensors, flying altitudes, and pulse repetitionfrequencies on forest canopy metrics and biophysical stand properties derivedfrom small-footprint airborne laser data. Remote Sensing of Environment, 113(1),148−159.
Pimont, F., Linn, R., Dupuy, J., & Morvan, D. (2006). Effects of vegetation descriptionparameters on forest fire behavior with FIRETEC. Forest Ecology and Management,234, 120−134.
Popescu, S. C., & Wynne, R. H. (2004). Seeing the trees in the forest: Using LiDARand multispectral data fusion with local filtering and variable window size forestimating tree height. Photogrammetric Engineering & Remote Sensing, 70, 589−604.
Pyne, S., Andrews, P., & Laven, R. (Eds.). (1996). Introduction to wildland fire. New York:Wiley.
Rall, J., & Knox, R. (Sept. 2004). Spectral ratio biospheric LiDAR. Geoscience and remotesensing symposium, 2004. IGARSS '04Proceedings 2004 IEEE International, Vol. 3.(pp. 1951−1954).
Rango, A., Chopping, M., Ritchie, J., Havstad, K., Kustas, W., & Schmugge, T. (Oct. 2000).Morphological characteristics of shrub coppice dunes in desert grasslands ofsouthern NewMexico derived from scanning LIDAR. Remote Sensing of Environment,74(1), 26−44.
Riano, D., Meier, E., Allgöwer, B., Chuvieco, E., & Ustin, S. L. (2003). Modeling airbornelaser scanning data for the spatial generation of critical forest parameters in firebehavior modeling. Remote Sensing of Environment, 86(2), 177−186.
ion strata in a multi-layered Mediterranean forest ecosystem usingemote Sensing of Environment (2010), doi:10.1016/j.rse.2010.01.023

13F. Morsdorf et al. / Remote Sensing of Environment xxx (2010) xxx–xxx
ARTICLE IN PRESS
Sandberg, D., Ottmar, R., & Cushon, G. (2001). Characterizing fuels in the 21st century.International Journal of Wildland Fire, 10, 381−387.
Slik, J. W. F., & Van Balen, S. (2006). Bird community changes in response to single andrepeated fires in a lowland tropical rainforest of eastern Borneo. Biodiversity andConservation, 15, 4425−4451.
Spath, H. (1985). Cluster dissection and analysis: Theory, FORTRAN programs, examples.New York: Halsted Press 226 pp.
Tan, S., & Narayanan, R. M. (2004). Design and performance of a multiwavelengthairborne polarimetric lidar for vegetation remote sensing. Applied Optics, 43(11),2360−2368.
Turner, W., Spector, S., Gardiner, N., Fladeland, M., Sterling, E., & Steininger, M. (2003).Remote sensing for biodiversity science and conservation. Trends in Ecology &Evolution, 18, 306−314.
Van Wagner, C. E. (1977). Conditions for the start and spread of crown fire. CanadianJournal of Forest Research, 7, 23−44.
Please cite this article as: Morsdorf, F., et al., Discrimination of vegetatheight and intensity information derived from airborne laser scanning, R
Vospernik, S., & Reimoser, S. (2008). Modelling changes in roe deer habitat in responseto forest management. Forest Ecology and Management, 255, 530−545.
Wagner, W., Hollaus, M., Briese, C., & Ducic, V. (2008). 3d vegetation mapping usingsmall-footprint full-waveform airborne laser scanners. International Journal ofRemote Sensing, 29(5), 1433−1452.
Wehr, A., & Lohr, U. (1999). Airborne laser scanning — An introduction and overview.ISPRS Journal of Photogrammetry & Remote Sensing, 54(2–3), 68−82.
Xanthopoulos, G., Caballero, D., Galante, M., Alexandrian, D., Rigolot, E., & Marzano, R.(28–30 March 2006). Forest fuels management in Europe. In P. L. Andrews & B.W.Butler (Eds.), Fuels management — How to measure success: Conference proceedings.Proceedings RMRS-P-41 (pp. 29−46). Fort Collins, CO: U.S. Department ofAgriculture, Forest Service, Rocky Mountain Research Station.
Xu, R., & Wunsch, D. C. (2005). Survey of clustering algorithms. IEEE Transactions onNeural Networks, 16, 645−678.
ion strata in a multi-layered Mediterranean forest ecosystem usingemote Sensing of Environment (2010), doi:10.1016/j.rse.2010.01.023