Disaster risk index: How far should it take account of local attributes
12
Disaster risk index: How far should it take account of local attributes? Mohammed Shariful Islam n , Mohammad Shahidul Hasan Swapan, Shamim Mahabubul Haque Urban and Rural Planning Discipline, Khulna University, Khulna 9208, Bangladesh article info Article history: Received 14 June 2012 Received in revised form 18 October 2012 Accepted 18 October 2012 Available online 12 November 2012 Keywords: Disaster risk index Hazard identification Participatory risk assessment Coastal area Bangladesh GIS abstract The coastal areas of Bangladesh are disaster prone. Along with natural hazards there are persisting local hazards (e.g., salinity, river bank erosion) in the coastal parts. An approach to disaster reduction strategy, therefore, varies here highly with other areas and also with other disasters. Disaster risk that comes from hazard, vulnerability and local capacity can only be applied here if the assessment addresses socio-political aspects as well. In this study we identified prevailing hazards including the ones which are particularly important for the study area. All hazards are then assessed based on local vulnerability and coping capacity. Participatory appraisal has been taken into account to understand the level of devastation of the disasters. All these qualitative aspects are then categorized to fit in mathematical model of disaster risk estimation. A GIS based approach of multi-criteria analysis has been applied to incorporate the spatial factors in the index. Therefore, the final output is enumerated for each land parcel (locally called mouza) where spatial variability is represented and shown on maps. There are 11 identified hazards in the study area which have association with 11 social factors of vulnerability. The disaster risk index (DRI) also takes account of three geographic factors of vulnerability that are aggregated with the social factors to calculate a reliable DRI. The aggregated outcome is finally validated with historical data of disaster occurrences in the study area and found significant correspondence. & 2012 Elsevier Ltd. All rights reserved. 1. Introduction Disaster reduction strategies include an assessment of vulnerability and risk, as well as assessment of institu- tional capacities describing an operational framework [1]. The assessment of vulnerability essentially includes the characteristics of critical facilities, social and economic infrastructure, the use of effective early warning systems, and the application of scientific, technical, and other skilled abilities [2]. Risk is the probability of harmful consequences, or expected loss (of lives, people injured, property, livelihoods, economic activity disrupted or envir- onment damaged) resulting from interactions between natural or human induced hazards and vulnerable/capable conditions [1]. Beyond expressing a probability of physical harm, it is crucial to appreciate that risks are always created or exist within social systems. It is important to consider the social contexts in which risks occur because people do not necessarily share the same perceptions of risk and their underlying causes [2]. A fundamental principle of risk assessment is that it can be assessed within an acceptable range of uncertainty if reliable historical and location specific data is available. Risk assessment of disasters has two components: hazard and vulnerability. Hazard is a potentially damaging physical Contents lists available at SciVerse ScienceDirect journal homepage: www.elsevier.com/locate/ijdrr International Journal of Disaster Risk Reduction 2212-4209/$ - see front matter & 2012 Elsevier Ltd. All rights reserved. http://dx.doi.org/10.1016/j.ijdrr.2012.10.001 n Corresponding author. E-mail addresses: [email protected] (M.S. Islam), [email protected] (M.S.H. Swapan), [email protected] (S.M. Haque). International Journal of Disaster Risk Reduction 3 (2013) 76–87
-
Upload
independent -
Category
Documents
-
view
2 -
download
0
Transcript of Disaster risk index: How far should it take account of local attributes

Contents lists available at SciVerse ScienceDirect
International Journal of Disaster Risk Reduction
International Journal of Disaster Risk Reduction 3 (2013) 76–87
2212-42
http://d
n Corr
E-m
eswapa
shamim
journal homepage: www.elsevier.com/locate/ijdrr
Disaster risk index: How far should it take accountof local attributes?
Mohammed Shariful Islam n, Mohammad Shahidul Hasan Swapan,Shamim Mahabubul Haque
Urban and Rural Planning Discipline, Khulna University, Khulna 9208, Bangladesh
a r t i c l e i n f o
Article history:
Received 14 June 2012
Received in revised form
18 October 2012
Accepted 18 October 2012Available online 12 November 2012
Keywords:
Disaster risk index
Hazard identification
Participatory risk assessment
Coastal area
Bangladesh
GIS
09/$ - see front matter & 2012 Elsevier Ltd.
x.doi.org/10.1016/j.ijdrr.2012.10.001
esponding author.
ail addresses: [email protected] (M.S.
[email protected] (M.S.H. Swapan),
[email protected] (S.M. Haque).
a b s t r a c t
The coastal areas of Bangladesh are disaster prone. Along with natural hazards there are
persisting local hazards (e.g., salinity, river bank erosion) in the coastal parts. An
approach to disaster reduction strategy, therefore, varies here highly with other areas
and also with other disasters. Disaster risk that comes from hazard, vulnerability and
local capacity can only be applied here if the assessment addresses socio-political aspects
as well. In this study we identified prevailing hazards including the ones which are
particularly important for the study area. All hazards are then assessed based on local
vulnerability and coping capacity. Participatory appraisal has been taken into account to
understand the level of devastation of the disasters. All these qualitative aspects are then
categorized to fit in mathematical model of disaster risk estimation. A GIS based
approach of multi-criteria analysis has been applied to incorporate the spatial factors
in the index. Therefore, the final output is enumerated for each land parcel (locally called
mouza) where spatial variability is represented and shown on maps. There are
11 identified hazards in the study area which have association with 11 social factors
of vulnerability. The disaster risk index (DRI) also takes account of three geographic factors
of vulnerability that are aggregated with the social factors to calculate a reliable DRI.
The aggregated outcome is finally validated with historical data of disaster occurrences in
the study area and found significant correspondence.
& 2012 Elsevier Ltd. All rights reserved.
1. Introduction
Disaster reduction strategies include an assessment ofvulnerability and risk, as well as assessment of institu-tional capacities describing an operational framework [1].The assessment of vulnerability essentially includes thecharacteristics of critical facilities, social and economicinfrastructure, the use of effective early warning systems,and the application of scientific, technical, and otherskilled abilities [2]. Risk is the probability of harmful
All rights reserved.
Islam),
consequences, or expected loss (of lives, people injured,property, livelihoods, economic activity disrupted or envir-onment damaged) resulting from interactions betweennatural or human induced hazards and vulnerable/capableconditions [1]. Beyond expressing a probability of physicalharm, it is crucial to appreciate that risks are alwayscreated or exist within social systems. It is important toconsider the social contexts in which risks occur becausepeople do not necessarily share the same perceptions ofrisk and their underlying causes [2].
A fundamental principle of risk assessment is that it canbe assessed within an acceptable range of uncertainty ifreliable historical and location specific data is available. Riskassessment of disasters has two components: hazard andvulnerability. Hazard is a potentially damaging physical

M.S. Islam et al. / International Journal of Disaster Risk Reduction 3 (2013) 76–87 77
event, phenomenon or human activity that may cause theloss of life or injury, property damage, social and economicdisruption or environmental degradation [1]. Vulnerabilityhas two elements: exposure and susceptibility [3]. Exposureis determined by people’s dwelling and work places inrelation to the hazard. Susceptibility takes into accountthose social, economic, political, psychological and environ-mental variables that work together in producing suscep-tible impacts amongst people within the same exposure [4].Risk assessment is aimed at providing a model of thedisaster risk and generally based on mathematical model-ing. The mathematical models which rely only upon thequantitative interpretation, lack in qualitative interpretationof factors which are steamed from the social and politicalbackground.
In this study, attempts have been made to develop amethodology that considered both quantitative and qualita-tive aspects of hazards and vulnerability factors. Participa-tory appraisal that takes account of people’s perception hasbeen employed to identify locally intervening hazards andfactors of vulnerability. A participatory GIS based approachhas been involved to integrate social dimensions with thegeographic variables of risk assessment. The final productis a disaster risk index which incorporates socio-politicaldimension of vulnerability for a specific type of hazardprevailing in Assasuni sub-district of Satkhira district ofBangladesh. However, this experience of indexing disasterrisk is replicable elsewhere in terms of the con-ceptual framework exercised and the methods of variableselection used.
2. Context
The study has been taken in a coastal area of Bangladeshcalled Assasuni Upazila (sub-district) of Satkhira district(Fig. 1). Total land area of Assasuni is 220.96 km2.Tidal Surge and Cyclone are the leading natural disastersin this region. Specially thousands of fishermen’s, woodcollectors’ and marginal people’s lives of the study areaare under extreme risk due to lack of adequate warningsystem and essential lifesaving equipment. The study areais relatively free from seasonal flooding which is differentfrom the upstream regions of Bangladesh that experienceseasonal flooding almost every year. However, this area ishighly vulnerable to the flash flood due to its geo-physicalsettings characterized by low-lying tidal plain and criss-crossed by a number of rivers and tributaries [5,6]. Severalreasons are attributed as major factors for flooding in thisarea. During 1960s Water Development Board (called asEWAPDA) divided the total district into some polders bycreating embankment beside the river to get protectionfrom salinity. This contributed to reduce the natural flowof water and creates water logging during monsoon.There are two international rivers flowing around thestudy area namely Ichamoti and Sonai. Flood water comesfrom the neighboring Indian portion by these two riversand tributaries. Moreover, to drain out the additionalstored water, India opens the sluice gate frequently andit creates flash flood [7]. In 2002, 2003, 2004 and 2011 thestudy area was significantly affected by the flood. In theyear 2000 a massive flood occurred in the study area and
water remained stagnant for almost 60 days caused agreat havoc for life, crops and properties.
Basic facts and figures of the study area.
Source: [8,9].
Area
220.96 km2No of union
11No. of Mouzas (an administrative unit of land parcel)
144No. of villages
242Total male population
121,000Total female population
123,000Density of population
606/km2According to a joint study conducted by British GeologicalSurvey (BGS) and Department of Public Health Engineering(DPHE) of Bangladesh, the average arsenic concentrationin ground water for shallow tube wells of Assasuni is100–200 mg/l [10] which is far above of acceptable level.i.e., 50 mg/l prescribed by World Health Organization (WHO)[11]. Therefore, the arsenic contamination in the study areacan be regarded as the biggest calamity in last decade. Riverbank erosion is another major hazard for the study area.Every year hundreds of hectares of agricultural and settle-ment land adjacent to the river is grabbed by the river;especially the area adjacent to the river Kholpetua is highlyvulnerable for river bank erosion. Cyclone is another hazardprevailing in the study area. Cyclone Aila affected AssasuniUpazila in 2009 causing damage to around 10,000 house-holds [12]. The study area is highly vulnerable to climatechange as well. Assasuni Upazila has been identified as one ofthe eight hotspots that are vulnerable to climate relatedhazards by a study titled economics of climate changeconducted by the World Bank [13].
3. Concept
Disaster risk index (DRI) monitors the evolution of risk[14] which aims at outlining the relationship in which anarea is indexed for each hazard type according to theirdegree of physical exposure, their degree of relativevulnerability and their degree of risk [2]. Within a DRIframework, vulnerability is seen as a factor that describeswhy people in a same exposure can be more or less atrisk [15]. Therefore, indicators of risk and vulnerabilitycan provide a tool to examine the root causes of risk andvulnerability [16]. The Community-Based Risk Index aimsat identifying and quantifying the main risk characteris-tics within a community [3,17]. This research has under-taken two elements that are essential in the formulationof risk: the probability of occurrence for a given threat—hazard; and the degree of susceptibility of the elementexposed to that source—vulnerability [18]. They alsoargue that risk of a disaster is the compounded functionof a hazard and the number of people, characterized bytheir hazard specific vulnerability. Risk and vulnerabilityare distinguished by Alexander [19] by stating risk to bethe probable loss caused by a hazard and vulnerability tobe the potential for loss or disruption. Wisner et al. [18]explained the relationship between risk, vulnerability andhazards by saying that a disaster is the intersection of two

Fig. 1. Map of study area [9 and googlemaps].
M.S. Islam et al. / International Journal of Disaster Risk Reduction 3 (2013) 76–8778
opposing forces; vulnerability on the one side and hazardson the other.
The disaster risk index accounts for hazard identifica-tion and vulnerability assessment. In this study hazardshave been identified using a set of historic data analysisand social survey in the study area. Since, risk has beenconsidered as an output of multiple hazard issues [3,20].Therefore, risk of a community is the risk that is an outputof a set of vulnerability, exposure and hazard function.The model for multiple risk is
Risk total¼XðRiskfloodþRiskEarthquakeþ � � � þRisknÞ
þX
VulnerabilityðFactor1þFactor2
þ � � � þFactornÞ�X
Capacity
We considered vulnerability as a manifestation ofsocial, economic and political structures. It is mainlydealing with two elements such as exposure to hazardand coping capacity of the people. People having morecapability to cope the extreme events are naturallyless vulnerable to hazard [21]. In other words, a set ofconditions and processes resulting from physical, social,economical and environmental factors, which increase thesusceptibility of a community to the impact of hazards.Positive factors, that increase the ability of people and thesociety they live in, to cope effectively with hazards, thatincrease their resilience, or that otherwise reduce theirsusceptibility, are considered as capacities [1].
Methods that come from mathematically inducedhazard identification does not take into account all theaspects related to the social, economic and political
spheres [22]. In order to give a holistic nature, peoples’perception and evaluation results were included in hazardidentification and vulnerability assessment in this study.Socio-economic survey and participatory rural appraisal(PRA) (qualitative judgment) were used within a frame-work of Delphi [23] method to identify the frequency anddevastation of a hazard and its associated vulnerability.Scoring system for a hazard and associated factors ofvulnerability has followed an analytical hierarchy process(AHP) [24] categorizing information into three levels ofassessment: low, medium and high. Hazard identificationinvolves frequency and level of devastation which aremultiplied and then reclassified to make them fit for usein the hazard index. Vulnerability index includes socialand geographic factors of vulnerability. The factors ofvulnerability used in this calculation were selected exam-ining their applicability for the study area and consultingprimary and secondary sources of data and literature.The disaster risk index is the sum of hazard index andvulnerability index.
The risk analysis procedure is divided into two stages(Fig. 2) adopting the concepts of participatory disaster riskanalysis and GIS based risk analysis. A global scale wasused to measure to assess the level of risk, where scoreranges from zero to one referring zero to be less criticalcondition and one to be extreme condition. Hazard andvulnerability index have been measured in a scale of zeroto 0.5 each which summed up to be one to give value ofrisk index. GIS based disaster risk reduction strategy hasbeen employed by many past studies. The strength ofGIS is to store and analyze data in different layers with

Hazard identification and impact evaluation
Vulnerability assessment
Social factors
Geographic factors
Disaster risk index (DRI)
Wei
ghin
g in
a ra
nk su
m m
etho
d
Wei
ghin
g in
a ra
nk su
m m
etho
d
GIS based approach
Vulnerability index
Hazard index
Participatory assessment and
historic data
Fig. 2. Overall approach for the assessment method.
0.167= low 0.333= medium 0.500= high
0.167= low 0.333= medium 0.500= high
DRI Hazard Index (0.5000)
Vulnerability Index (0.5000)
Fig. 3. Risk analysis method.
M.S. Islam et al. / International Journal of Disaster Risk Reduction 3 (2013) 76–87 79
a facility to identify influence of interacting variables [25].Therefore, GIS is effective in risk analysis for planningdisaster mitigation strategies as well as managing emer-gency situation [26]. For risk mapping, the hazard indexand the social factors of vulnerability have been stored inmouza (an administrative unit of land parcel) level vectorGIS. The geographic factors of vulnerability have beenanalyzed through buffering technique of GIS. The vectordata has been transferred to raster GIS to represent thebuffered region into the mouzas. The final DRI maps havebeen produced in raster based GIS.
4. Method: risk analysis framework
4.1. Scoring for assessing disaster risk
The assessment process involves breaking down theprincipal goals (risk analysis) into lower level sub-goals(analysis of vulnerability and hazard scores). The conceptof exposure which is traditionally referred to is includedin that of vulnerability and exposed sites. The procedurerelies on a multi-criteria method of support for thedecision-making the analytical hierarchy process (AHP)method that breaks down a macro-problem into moreeasily solved micro-problems and can manage a certaindegree of incoherency in the manager within limitsjudged to be acceptable, so that it does not requireperfect rationality [24]. Each element of hierarchy isassigned to a local weight or indicator score. The globalscore of each subordinate is a product of the mean scoreof all elements.
The disaster risk of Assasuni Upazila is measured on a0–1 scale. To calculate the disaster risk index in the study
area, hazard and vulnerability scores are derived from thefactors that are locally applicable and manageable interms of data collection and time. The value of hazardthreat and vulnerability factors is categorized under low(0.167), medium (0.333) and high (0.500) and assignstheir respective score. The hierarchical scheme adapted toassess the risk is as follows (Fig. 3).
The indicators and their order of importance used inhazard and vulnerability calculation followed multi-criteria analysis (MCA). The data were collected fromthe social survey, participatory rural appraisal (PRA) studyand different published materials. To assign weight the‘rank sum method’ was applied. Several studies werefound where such methods had been successfully usedin the different part of the world [22,27].
4.2. General equation for the disaster risk index (DRI)
The following Eq. (1) is used to calculate the overallrisk index of Assasuni Upazila. At the first stage in DRIcalculation, lowest calculation unit was mouza. For thisreason, the DRI produced from the social vulnerabi-lity factors is mapped at mouza level. The DRI whichis produced in the raster based GIS is mapped fromtransferring mouza data to pixel level. The equations are

M.S. Islam et al. / International Journal of Disaster Risk Reduction 3 (2013) 76–8780
as follows:
DRIðIRÞ ¼XfDRIðH1ÞþDRIðH2Þþ � � � þDRIðHnÞg
h i.N ð1Þ
DRIðHÞ ¼ IHþ IV ð2Þ
(Adapted from [12].)
IH¼X
WH1=nþWH2=nþ � � � þWHn=n� �n o.
N ð3Þ
IV¼X
WV1=nþWV2=nþ � � � þWVn=n� �n o.
N ð4Þ
The notations describe: DRI (IR), Disaster Risk Index atGlobal Risk Index (measured on 0–1 scale); DRI (H1),Disaster Risk Index for Hazard 1; DRI (H), Disaster RiskIndex for a Hazard; IH, hazard index (measured on0–0.500 scale); IV, vulnerability index (based on social andgeographic factors) (measured on 0–0.500 scale); WH1,local weight of hazard factor for Hazard 1 (measuredon 0–0.500 scale); WV1, local weight of vulnerabilityfactors for vulnerability 1 (measured on 0–0.500 scale);N, number of hazard occurred or number of factorsof vulnerability; n, frequency of data (mouza/pixel).
4.3. Hazard index
For identifying hazard, the score of hazard is determinedby multiplying the frequency of hazard occurrence andintensity of devastation as rated by the local people.A participatory rural appraisal (PRA) has been conducted inthe study area coordinated by a team consisting facultymembers of Urban and Rural Planning Discipline of KhulnaUniversity. The Delphi method has been employed for datacollection [23]. The local people includes public representa-tives, i.e., chairman of every union council (11 union coun-cils), every member of ward (nine wards in each unioncouncil), local experts like experienced school teachers andsocial leaders, government officials from Upazila Headquar-ters, Department of Public Health Engineering, Hospitalsand also other enthusiastic social activists. The PRA hasbeen conducted in every union council differently to identifyhazards. Hazard score is enumerated taking account offrequency of hazard and their level of devastation countedin a scale of 1–4 for past 10 years. The spatial unit ofenumeration was mouza. The highest score possible fora hazard was 4�4¼16 and hazards that fail to reflect acommunity phenomenon was omitted. The method of omis-sion was determined based on the hazards’ spatial extent. Forexample, water logging in a smaller area causing a devasta-tion level of one describing loss of one to couple of house-holds has been omitted. Then, the hazard score is reclassifiedfor general weighting system of hazard index ranging from0 to 0.5. Score of 1–3 is given a reclassified score of 0.167(low); 4–7, 0.333 (medium); and 8–16, 0.500 (high).
According to the PRA conducted in January 2008, therepresentative hazards of the study area are: Flood,Cyclone, Rainfall, Water logging, Hailstorm, Tornado,Drought, Thunderstorm, Storm flood, Epidemic, Salinity,Erosion and Arsenic. The above 11 hazards were deter-mined from the social and PRA surveys conducted underthis project, where people reported and identified theextent of devastation in their livelihoods. The data were
collected at mouza level, so the lowest indexing unit ismouza under a union.
Seasonal flood occurs due to the rainfall; excessiverainfall causes river water to spill over every year Assasuni.During the flood period the agricultural lands get affectedfor the intrusion of saline water. As the flood water risesagricultural lands go under water. The fish cultivation alsogets affected during this period of year as the boundary ofthe water reservoirs collapses following inundation of seawater in the reservoirs. A tiger borne virus also spreadsrapidly. However, the indigenous knowledge of the localpeople helps them to combat the devastation. They usuallyavoid paddy cultivation during this period of time. On theother hand, people construct a net dam in the reservoirswhich allows water to enter but keeps the boundary inplace. Consequently fish cannot jump from one reservoir toanother. Hence, the devastation of the seasonal flood is nottoo severe because experiencing every year, people getadapted to the phenomenon.
Water logging is also an event that is very frequent inthis area which is caused by the natural as well as manmadefactors. During the rainy season water level rises in theriver looking for flowing through the canals. Under a leasingsystem of Government owned canals to the private entre-preneurs, the person who leases the canal regulates the flowof canal for his own interest and disrupt the flow of water.As a result many of the areas get water logged in Assasuni.While conducting the PRA in Baradal, a group of youngpeople identified water logging be the most importantdisaster management issue. Similar concerns were alsoreceived from most of the other unions of Assasuni.
Hailstorm is found to be not very frequent in Assasunibut when it occurs it damages the harvest in fruit plants. Infact hailstorm occurs during the summer which is theharvesting season for most of the fruits that grow in thearea. According to the local people, the hailstorm reduces upto 40% of fruit harvests. Still the damage is insignificant,because cultivating fruit is not their main source of income.Similarly, thunderstorm is also a non-frequent event whichcauses less damage. However, isolated cases of human deathand casualties have been found. Although the frequency ofdamage is limited, the intensity of damage is considerable asit takes human lives. According to the people in AssasuniUpazila, at least 20 people have been died over the last 10years by the strike of thunders.
Cyclone has found to be relatively less frequent butthis hazard has been the most violent for the people.The people have described the Cyclone of 1988 as themost significant devastation in Assasuni. Cyclone is thesingle event that affected every union of Assasuni impact-ing the livelihood severely. Many people are of an opinionthat it took 10–12 years to recover the financial damagethat was caused by the cyclone.
Salinity intrusion has become a severe problem in themost of the areas of Assasuni. People now bring drinkablewater from adjacent areas. Only a few deep tube-wells arethe sources of drinking water. Unfortunately some of thedeep tube-wells have recently become unusable becauseof the salinity in water. The level of salinity has increasedover the last 10 years. People of the area have claimedthat over cultivation of fish and use of saline water in fish

M.S. Islam et al. / International Journal of Disaster Risk Reduction 3 (2013) 76–87 81
reservoirs is one of the major causes for such highintrusion of salinity. On the other hand arsenic contam-ination was identified in the tube wells. In some areaspeople have been attacked by arsenic borne skin diseases.Fortunately severe attacks of arsenic contamination havenot been found out in the study area.
River bank erosion and dam collapse have been found tobe an acute problem in the areas that are near to the rivers.Due to poor maintenance of dams and inadequate protec-tion of river bank, erosion has been common to all areas ofAssasuni. The worst case has been identified in Pratapnagarwhere people lost everything over night. The erosion takesaway people’s homesteads, land and assets.
4.4. Vulnerability index
Disaster risk depends on the socio-economic condition ofthe local communities as well as their geographic location.We have considered two types of factors to constructvulnerability index—social and geographical factors. A seriesof 11 social and three geographic factors (total 14) were
Table 1Vulnerability factors (social) and corresponding scoring method.
Sl Factors (data are presented at mouza level) Data classificat
system
1 Unemployment level (% at mouza level) 0–15
15–25
25þ
2 No. of Kutcha households 0–20
20–60
60þ
3 Literacy rate (% at mouza level) 0–30
30–50
50þ
4 Density of population per sq. km. Less than 500
500–700
Greater than 7
5 % of people use sanitary latrine Less than 25
25–40
Greater than 4
6 % of population having disaster and
warning knowledge
50
50–80
80þ
7 % of agricultural labor 0–5
5–10
10þ
8 Average income per household
(under upper and lower poverty line)
(BDT)
4586
586–690
690þ
9 Average income per household (BDT) 4586
586–690
690þ
10 Ratio of Loan-income per household o0.5
0.5–1
41
11 % of dependent population 0–10
10–17
417
selected from the PRA and social survey carried out under aproject conducted by funded by Comprehensive DisasterManagement Programme (CDMP). Number of standardliterature and expert’s opinion have been used to structurethe issues under discussion for the PRA and later substan-tiated following the Delphi method of data synthesis to getthe final scores for factors of vulnerability. Unlike hazardscore the factors of vulnerability have been scored followinga three level data classification system. For instance, literacyrate of 0–30% has given the highest score, i.e., 0.5 as a factorof vulnerability; likewise, 30–50% has given a medium score,i.e., 0.33 and for the rate above 50% has been given thelowest score (0.167) as a factor of vulnerability. The follow-ing table describes the factors of vulnerability used in thisstudy with their reclassification procedure (Table 1). Again,uniform values of vulnerability factors are summed up atunion level for better understanding and mapping.
The hazards that are influenced by geographical factorssuch as flood risk is attributed by the proximity of river.So the vulnerability of flood and other hazards havingsimilar characteristics have been recalculated based on their
ion Weight or
reclassification
score
Source of assessment
0.167 CDMP Social Survey and PRA
0.333
0.500
0.167 Local assessment (Social Survey)
0.333
0.500
0.500 National Average (BBS, 2001)
0.333
0.167
0.167 National Rural average (BBS, 2001)
0.333
00 0.500
0.500 National average (BBS, 2001)
0.333
0 0.167
0.500 Local assessment (Social Survey)
0.333
0.167
0.167 Local assessment (Social Survey)
0.333
0.500
0.500 National average (BBS, 2001)
0.333
0.167
0.500 National Rural Average (BBS, 2001)
0.333
0.167
0.167 Local assessment (Social Survey)
0.333
0.500
0.167 National average (17%) (BBS, 2001)
0.333
0.500
M.S. Islam et al. / International Journal of Disaster Risk Reduction 3 (2013) 76–8782
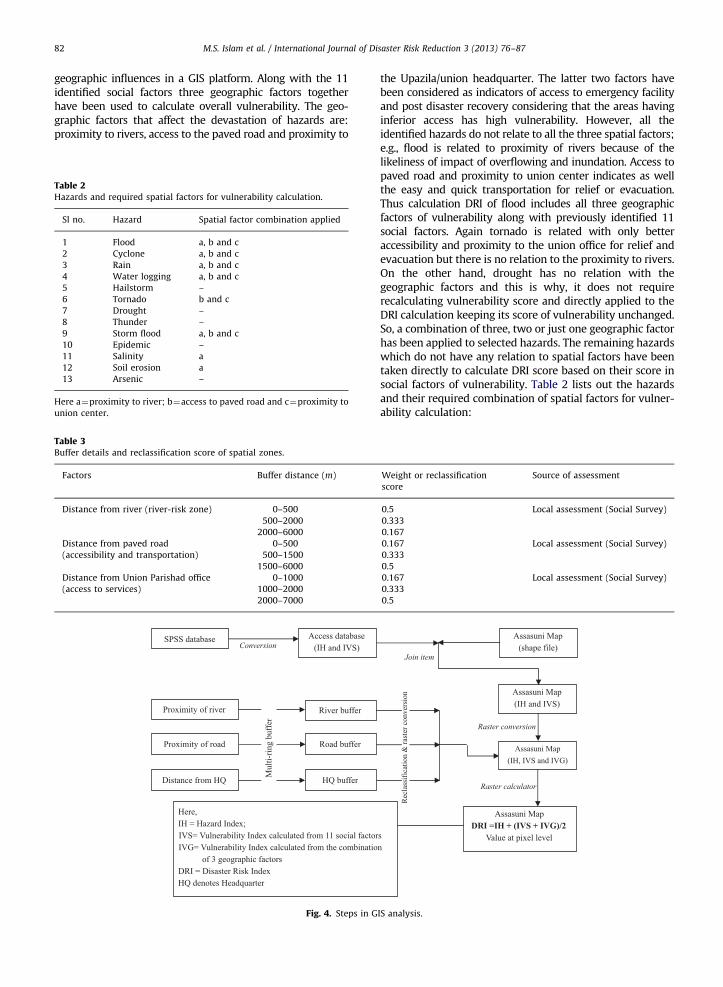
geographic influences in a GIS platform. Along with the 11identified social factors three geographic factors togetherhave been used to calculate overall vulnerability. The geo-graphic factors that affect the devastation of hazards are:proximity to rivers, access to the paved road and proximity to
Table 2Hazards and required spatial factors for vulnerability calculation.
Sl no. Hazard Spatial factor combination applied
1 Flood a, b and c
2 Cyclone a, b and c
3 Rain a, b and c
4 Water logging a, b and c
5 Hailstorm –
6 Tornado b and c
7 Drought –
8 Thunder –
9 Storm flood a, b and c
10 Epidemic –
11 Salinity a
12 Soil erosion a
13 Arsenic –
Here a¼proximity to river; b¼access to paved road and c¼proximity to
union center.
Table 3Buffer details and reclassification score of spatial zones.
Factors Buffer distance (m)
Distance from river (river-risk zone) 0–500
500–2000
2000–6000
Distance from paved road
(accessibility and transportation)
0–500
500–1500
1500–6000
Distance from Union Parishad office
(access to services)
0–1000
1000–2000
2000–7000
SPSS database Access database (IH and IVS)
Proximity of river
Proximity of road
Distance from HQ
River buffer
Road buffer
HQ buffer
Conversion
Here,IH = Hazard Index; IVS= Vulnerability Index calculated from 11 social factorIVG= Vulnerability Index calculated from the combinatio
of 3 geographic factors DRI = Disaster Risk Index HQ denotes Headquarter
Mul
ti-rin
g bu
ffer
Fig. 4. Steps in G
the Upazila/union headquarter. The latter two factors havebeen considered as indicators of access to emergency facilityand post disaster recovery considering that the areas havinginferior access has high vulnerability. However, all theidentified hazards do not relate to all the three spatial factors;e.g., flood is related to proximity of rivers because of thelikeliness of impact of overflowing and inundation. Access topaved road and proximity to union center indicates as wellthe easy and quick transportation for relief or evacuation.Thus calculation DRI of flood includes all three geographicfactors of vulnerability along with previously identified 11social factors. Again tornado is related with only betteraccessibility and proximity to the union office for relief andevacuation but there is no relation to the proximity to rivers.On the other hand, drought has no relation with thegeographic factors and this is why, it does not requirerecalculating vulnerability score and directly applied to theDRI calculation keeping its score of vulnerability unchanged.So, a combination of three, two or just one geographic factorhas been applied to selected hazards. The remaining hazardswhich do not have any relation to spatial factors have beentaken directly to calculate DRI score based on their score insocial factors of vulnerability. Table 2 lists out the hazardsand their required combination of spatial factors for vulner-ability calculation:
Weight or reclassification
score
Source of assessment
0.5 Local assessment (Social Survey)
0.333
0.167
0.167 Local assessment (Social Survey)
0.333
0.5
0.167 Local assessment (Social Survey)
0.333
0.5
Assasuni Map (shape file)
Rec
lass
ifica
tion
& ra
ster
con
vers
ion
Assasuni Map (IH and IVS)
Assasuni Map (IH, IVS and IVG)
Raster conversion
Join item
Assasuni Map DRI =IH + (IVS + IVG)/2
Value at pixel level
Raster calculator
s n
IS analysis.
M.S. Islam et al. / International Journal of Disaster Risk Reduction 3 (2013) 76–87 83
The social data have been stored in SPSS system and thecalculated hazard index and vulnerability score have beenconverted into Microsoft Access database to make themuseable for analysis in GIS software (ESRI product ArcGIShas been used). The database was joined with the Assasuniunion map in vector based GIS and it produced the hazard,vulnerability and risk map of the study area. In the nextstage, the maps were reproduced for outlining the spatialfactors using buffer function to identify the river risk zone,accessibility map and administrative center buffer zone.River risk zone defines three types of areas at fixed distancefrom the river. Obviously closer areas have higher risk thanthat of farther areas. Accessibility map shows the areas withthree levels of accessibility from the paved road. Unioncenter buffer zone illustrates the proximity of different areasfrom Upazila/union headquarters. The areas close to theAssasuni town have the opportunity to get support morequickly than the community living in remote areas. Con-sidering the zone characteristics, the buffers were assignedweight score and reclassified accordingly. Table 3 describesthe details of buffer and reclassification of scoring.
Table 4Hazard score at union level (from Eq. (3)).
Union name Hazard Index
Sobhnali 0.37
Budhhata 0.38
Kulla 0.37
Durgapur 0.38
Baradal 0.36
Assasuni 0.35
Sreeula 0.41
Khajra 0.36
Anulia 0.38
Pratapnagar 0.41
Kadakati 0.40
0.00
0.05
0.10
0.15
0.20
0.25
0.30
0.35
0.40
0.45
0.50
Floo
d
Cyc
lone
Exte
nsiv
e R
ain
Wat
er lo
ggin
g
Hai
lsto
rm
Torn
ado
Fig. 5. Hazard Index
The geographical extent delineated from buffer functiondoes not necessarily get limited to the mouza boundary.Therefore, the problem with the selection of lowest spatialunit for analysis was raised. The problem was solved byconverting the mouza map (including DRI database) andspatial zones into raster layers with a pixel dimension of30 m�30 m. At the end raster calculator function of ArcGISwas used to calculate the scores in a raster environment andDRI was produced at this 30 m�30 m pixel. Fig. 4 showsthe steps followed in GIS analysis.
Drought, thunderstorm, epidemic and arsenic do notrequire any recalculation of vulnerability score. So the DRIof these hazards directly participate in the overall DRIcalculation (Eq. (1)). The remaining hazards’ vulnerabilityscore has gone under the recalculation process followingthe above combination (Tables 2 and 3). The followingequation has been used to calculate vulnerability indexthat integrates both social and geographic factors:
The combined vulnerability index (IV)¼[{(IVS�numberof involved social factors)/14þ(IVG�number of involvedgeographic factors)/14}/2]. Here IVS is the vulnerability indexcalculated from 11 factors (measured on 0–0.500 scale)(from Eq. (4)), IVG is the vulnerability score of calculatedfrom three geographic factors (measured in a scale of0–0.500). IVG is calculated using the following equation:
IVG¼X
WV1=nþWV2=nþWV3=n� �n o
=N ð5Þ
Here IVG is the vulnerability index for geographic factors(measured on 0–0.500 scale), WV1 is the local weight ofvulnerability factor 1 (for reclassification), N the numberof vulnerability factors considered (here N¼3), and n isthe no. of pixels (raster map).
New DRI is developed considering 14 (11þ3) vulner-ability factors. In this way, DRI of all hazards are calculatedconsidering the combination of social and geographic factors
Dro
ught
Thun
der S
torm
Stor
m F
lood
Epid
emic
Salin
ity
Eros
ion
Arse
nic
of Assasuni.

Shobnali
Budhhata
Kulla
Kadakati Dargapur
Assasunni Baradal
M.S. Islam et al. / International Journal of Disaster Risk Reduction 3 (2013) 76–8784
of vulnerability using ‘raster calculator’ function of ArcGISsoftware.
4.5. Calculation of DRI
From the above analysis hazard index and consideringthe score of vulnerability index 14 factors are identified.So DRI for each hazard¼ IHþ IV where IV comprises bothgeographic (IVG) and social factors (IVS).
Finally, the DRI of multi-hazard (measured on 0–1scale) in Assasuni is (from Eq. (1)):X
DRIflood*þDRICyclone*þDRIRain*þDRIWaterlog*ð
n
þDRIHailstormþDRITornado*þDRIDrought
þDRIThunderþDRIStormflood*þDRIEpidemic
þDRISalinity*þDRISoilerosion*þDRIArsenicÞg=14
Here n denotes disaster risk index that involves bothgeographic and social factors of vulnerability.
Table 5Vulnerability score at union level (from Eq. (4)).
Union name Vulnerability Index
of Assasuni Upazila
Sobhnali 0.36
Budhhata 0.38
Kulla 0.36
Durgapur 0.32
Baradal 0.39
Assasuni 0.35
Sreeula 0.38
Khajra 0.38
Anulia 0.37
Pratapnagar 0.38
Kadakati 0.31
0
0.05
0.1
0.15
0.2
0.25
0.3
0.35
0.4
0.45
0.5
Une
mpl
oym
ent
No.
of K
utch
a H
H
Lite
racy
rate
Den
sity
per
sq.
km.
% o
f peo
ple
use
sani
tary
latri
ne
% o
f pop
ulat
ion
Fig. 6. Vulnerability (social fac
5. Results and discussion
Table 4 and Fig. 5 present the multi-hazard index in ascale of 0.5 of Assasuni at union level. It has beenidentified that Pratapnagar and Sreeula unions are the
awar
enes
s
% o
f agr
icul
tura
lla
bor
Aver
age
inco
me
(pov
erty
line
)
Aver
age
inco
me
Loan
-inco
me
ratio
% d
epen
dent
popu
latio
n
tors) Index of Assasuni.
0 4 8 122Kilometers
LegendUnion boundary
ValueHigh : 0.450000
Low : 0.270000
Sreeula
Protapnagar
Anulia
Khajra
Fig. 7. Disaster vulnerability of Assasuni Upazila based on social factors.

M.S. Islam et al. / International Journal of Disaster Risk Reduction 3 (2013) 76–87 85
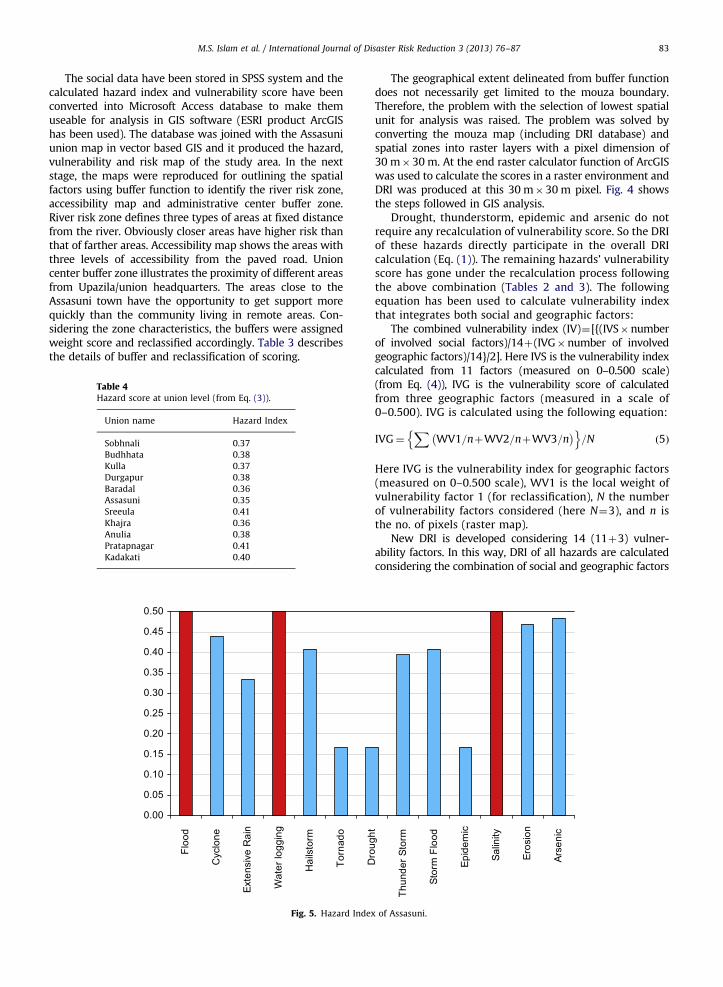
places where the score is higher compared to other areas.On the other hand, flood, water logging and salinity areidentified as the most critical hazards in the study areahaving score of 0.5000 (Fig. 5).
Vulnerability score calculated from social factors arepresented in Table 5.
Fig. 6 illustrates that people in Assasuni are mostlyvulnerable because poor housing structure, large number
0 4 8 122Kilometers
LegendUnion boundary
ValueHigh : 0.3375
Low : 0.189321
Shobnali
Budhhata
Kulla
Kadakati Dargapur
Assasunni
Sreeula
Baradal
Protapnagar
Anulia
Khajra
Fig. 8. Disaster vulnerability of Assasuni based on geographic factors
(Eq. (5)).
0
0.1
0.2
0.3
0.4
0.5
0.6
0.7
0.8
0.9
1
Floo
d
Cyc
lone
Rai
n
Wat
erlo
ggin
g
Hai
lsto
rm
Torn
ado
Fig. 9. DRI of A
of dependent population and lower rate of using sanitarylatrine
Maps 7 and 8 show the spatial distribution of vulner-able communities in Assasuni. The higher value representsincreased vulnerability indicating higher risk of disasterphenomena (Figs. 7–9).
Table 6 provides the risk of disasters in differentunions of Assasuni Upazila. It has been identified thatPratapnagar (0.79 on a scale 0–1) and Sreeula are themost vulnerable places in terms of disaster occurrence,socio-economic and locational condition of the people.It is also concluded that people are at higher risk withrespect to flood, salinity, river erosion and arsenic.
Face validity has been employed to test how reason-able the result is [28]. The result of risk index was foundsignificantly reasonable. The Cyclone Aila affected thestudy area in 2009 after conducting this study. The cycloneAila damaged 100% households of Pratapnagar and 80%of Sreeula [12]. In our risk index we have also foundPratapnagar and Sreeula having the highest DRI.
Fig. 10 represents the spatial distribution of disasterrisk in Assasuni considering social factors of vulnerability.The overall disaster risk considering both geographic andsocial factors is presented in Fig. 11.
Dro
ught
Thun
der
Sto
rm fl
ood
Epi
dem
ic
Sal
inity
Ero
sion
Ars
enic
ssasuni.
Table 6DRI of Assasuni Upazila (based on non-spatial factors)
(from Eq. (2)).
Union name Final DRI for Assasuni Upazila
(aggregate from 13 hazards)
Sobhnali 0.73
Budhhata 0.76
Kulla 0.74
Durgapur 0.71
Baradal 0.75
Assasuni 0.70
Sreeula 0.79
Khajra 0.73
Anulia 0.76
Pratapnagar 0.79
Kadakati 0.71

0 4 8 122Kilometers
LegendUnion boundary
ValueHigh : 0.860000
Low : 0.630000
Shobnali
Budhhata
Kulla
Kadakati Dargapur
Assasunni
Sreeula
Baradal
Protapnagar
Anulia
Khajra
Fig. 10. Disaster risk index of Assasuni based on hazard index and social
factors of vulnerability.
0 4 8 122Kilometers
LegendUnion boundary
ValueHigh : 0.756429
Low : 0.564907
Shobnali
Budhhata
Kulla
Kadakati Dargapur
Assasunni
Sreeula
Baradal
Protapnagar
Anulia
Khajra
Fig. 11. Combined DRI based on social and geographic factors (from
Eq. (1)).
M.S. Islam et al. / International Journal of Disaster Risk Reduction 3 (2013) 76–8786
6. Conclusion
The task of disaster risk assessment is not only to findout where risk related problems are located, but also toquantitatively and qualitatively determine the signifi-cance of risks [29]. In consequence, a spatially orientedrisk assessment has to take into account all risks that arerelated to a specific area. This is an indispensable basis fora spatially organized management of risks. However, thegeneral concept and calculations of risk assessment maynot be capable enough to demonstrate the situation atlocal context. Especially for countries like Bangladesh,there are various complex phenomena which are unique.For that reason, there should be a risk assessmentapproach that suits the local conditions of Bangladesh.That is why the risk assessment procedure is designedcorresponding to the standard methods applied by UNorganizations where calculations is done on the hazardsand vulnerability factors that really matter for the localpeople. An integrated assessment method, GIS techniqueis applied to measure vulnerability with respect to spatialfactors which is important for several disasters such asflood, water logging, and river erosion. Apart from spatialanalysis, GIS is also used to produce various thematicmaps (e.g., hazard map, vulnerability map and risk map)derived from the calculation. Along with secondary dataretrieved from the National survey (e.g., BBS), socialsurvey and PRA study were conducted to determine thedevastation intensity of hazards as well as the factors ofvulnerability. The measured DRI further validated withthe historical data of disaster occurrences.
References
[1] ISDR (International Strategy for Disaster Reduction). Living withrisk: a global review of disaster reduction initiatives, vol. 2. Geneva;2004.
[2] UNDP (United Nations Development Programme). Reducing disasterrisk: a challenge for development, a global report. New York; 2004.
[3] ADPC (Asian Disaster Preparedness Center). Critical guidelines:community-based disaster risk management. Bankok; 2006.
[4] DFID (Department for International Development). Disaster riskreduction: a development concern. Norwich: Overseas Develop-ment Group, School of Development Studies, University of EastAnglia; 2004.
[5] Alam Tutu Ashraful. River management in Bangladesh: a people’sinitiative to solve water-logging. Participatory Learning and Action2005;51:117–23.
[6] Uttaran. Flood 2009: situation assessment—climate change wor-sens disaster risks for communities in Southwest Coastal Region ofBangladesh, Dhaka. 2009.
[7] Uttaran. Flood and water logging in south west Bangladesh.Assessment report, Dhaka; 2011.
[8] BBS (Bangladesh Bureau of Statistics). Community series 2001.Satkhira District, Dhaka; 2001.
[9] Banglapedia. Banglapedia: national encyclopedia of Bangladesh,vol. 1. Dhaka: Asiatiac Society of Bangladesh; 2003.
[10] BGS and DPHE (British Geological Survey and Department of PublicHealth Engineering, Bangladesh). Arsenic contamination of ground-water in Bangladesh. In: Kinniburgh DG, Smedley PL, editors.British geological survey technical report WC/00/19. Keyworth;2001.
[11] WHO (World Health Organization). Arsenic, drinking-water andhealth risk substitution in arsenic mitigation. A discussion paper,retrieved on 10 October 2012 from /http://www.who.int/water_sanitation_health/dwq/wsh0306/en/index3.htmlS.
[12] UNDP. Field visit report on selected Aila affected areas in Bangladesh,Dhaka; 2009.

M.S. Islam et al. / International Journal of Disaster Risk Reduction 3 (2013) 76–87 87
[13] World Bank, Economics of adaptation to climate change. Bangladeshstudy report. Washington, 2010.
[14] Peduzzi1 P, Dao H, Herold C, Mouton F. Assessing global exposure
and vulnerability towards natural hazards: the Disaster Risk Index.Natural Hazards and Earth System Sciences 2009;9:1149–59.
[15] Peduzzi P. The disaster risk index: overview of a quantitative
approach. In: Birkmann J, editor. Measuring vulnerability to naturalhazards—towards disaster resilient societies. Tokyo, New York,Paris: UNU-Press; 2006.
[16] Birkmann Joern. Risk and vulnerability indicators at differentscales: applicability, usefulness and policy implications. Environ-mental Hazards 2007;7:20–31.
[17] Bollin C, Hidajat R. Community-based disaster risk index: pilot
implementation in Indonesia. In: Birkmann J, editor. Measuringvulnerability to natural hazards towards disaster resilient societies.Tokyo, New York, Paris: UNU-Press; 2006.
[18] Wisner B, Blaikie P, Cannon T, Davis I. At risk. 2nd ed.London:Routledge; 2006.
[19] Alexander D. Confronting catastrophe: new perspectives on naturaldisasters.New York: Oxford University Press; 2000.
[20] Cutter S.Vulnerability to environmental hazards. Progress in
Human Geography 20(4);529–39.
[21] Hossain SMN. Assessing human vulnerability due to environmentalchange: concepts and assessment methodologies.Stockholm: RoyalInstitute of Technology; 2001.
[22] Orlando G, Selicato F, Torre CM. The use of GIS as a tool to supportrisk assessment. In: van Oosterom Peter, Zlatanova Siyka, FendelElfriede M, editors. Geo-information for disaster management. NewJersey: Springer; 2005. p. 1381–400.
[23] Okoli Chitu, Pawlowski Suzanne D. The Delphi method as aresearch tool: an example, design considerations and applications.Information & Management 2004;42:15–29.
[24] Saaty Thomas L. How to make a decision: the analytic hierarchyprocess. European Journal of Operational Research 1990;48:9–26.
[25] Kemp Randall B. Public participatory GIS in community-baseddisaster risk reduction. Triplec 2008;6(2):88–104.
[26] Russ Johnson GIS. Technology for disasters and emergency man-agement, an ESRI White Paper, New York; 2000.
[27] Nahiduzzaman KM, Saroar MM, Ahmed SJ. Assessing the urbanenvironmental quality of khulna city: a multi-level quantitativeapproach. Plan Plus 2004;1(2):79–95.
[28] Robert G. Sargent, verification and validation of simulation models. In:Proceedings of the 2007 Winter simulation conference, IEEE; 2007.
[29] Smith K. Environmental hazards: assessing risk and reducingdisaster. 3rd ed.London: Routledge; 2001.