Direct Observation of Iron-Induced Conformational Changes of Mitochondrial DNA by High-Resolution...
6
Proc. Natl. Acad. Sci. USA Vol. 93, pp. 5341-5346, May 1996 Cell Biology Direct observation of iron-induced conformational changes of mitochondrial DNA by high-resolution field-emission in-lens scanning electron microscopy (DNA unwinding/iron colloid formation/backscattered electron detection) MARCUS YAFFEE*t#, PATRICK WALTERt, CHRISTOPH RICHTERt, AND MARTIN MULLER* *Laboratory for Electron Microscopy I and tLaboratory for Biochemistry I, Swiss Federal Institute of Technology (ETH), CH-8092 Zurich, Switzerland Communicated by K Wuthrich, Eidgenossische Technische Hochschule, Zurich, Switzerland. January 24, 1996 (received for review June 21, 1995) ABSTRACT When respiring rat liver mitochondria are incubated in the presence of Fe(III) gluconate, their DNA (mtDNA) relaxes from the supercoiled to the open circular form dependent on the iron dose. Anaerobiosis or antioxi- dants fail to completely inhibit the unwinding. High- resolution field-emission in-lens scanning electron micros- copy imaging, in concert with backscattered electron detec- tion, pinpoints nanometer-range iron colloids bound to mtDNA isolated from iron-exposed mitochondria. High- resolution field-emission in-lens scanning electron micros- copy with backscattered electron detection imaging permits simultaneous detailed visual analysis of DNA topology, iron dose-dependent mtDNA unwinding, and assessment of iron colloid formation on mtDNA strands. Mitochondria accumulate iron in the form of Fe(III) (1-3) and then can reduce it to Fe(II) (4). Mitochondrial iron is necessary for incorporation into iron-sulfur proteins and heme (5) but is potentially dangerous because it participates in hydroxyl rad- ical (-OH) formation (6). Mitochondria are the major source of superoxide (7), which can dismutate to yield hydrogen peroxide. This, in turn, can interact with Fe(II) to produce -OH radicals. They can damage DNA in many ways, particularly by inducing single-strand breaks (SSB) (8), which leads to changes in mtDNA conformation (9-13). Mammalian mtDNA possesses three archetypal conforma- tions: form I, supercoiled; form II, open relaxed; and form III, linear. Form I is believed to predominate in vivo.§ mtDNA is a compact molecule coding for 2 rRNAs, 22 tRNAs, and 13 peptides [rat mtDNA has 16,298 bp (16)]. This leaves mtDNA with few noncoding regions; damage to the mtDNA could therefore be metabolically devastating. Indeed, modifications of mtDNA-e.g., point mutations, fragmentation, deletions, and duplications-have been etiologically linked to human diseases (17) and to aging (18). Since oxidative damage to mtDNA is 16-fold greater than that to nuclear DNA (19), oxidative stress could contribute significantly to disease- related mtDNA modifications (20). Here we establish a method for high-resolution field- emission in-lens scanning electron microscopy (HR-SEM) observation of the three-dimensional structure of native DNA topology. We thereby detect an iron-induced shift of mtDNA from the supercoiled to the open circular forms. HR-SEM analysis with backscattered electron (BSE) detection also allowed us to localize and identify colloidal iron species on mtDNA. Because the exact structure and composition of these aggregates are not yet known, we refer to them as colloids. Colloids are microheterogeneous structures with dimensions in the range from 1 to 1000 nm (21, 22). MATERIALS AND METHODS mtDNA Preparation. Female Wistar rat liver mitochondria were isolated by differential centrifugation (23) and incubated with up to 500 ,uM Fe(III) gluconate for 20 min, with stirring, in an oxygen-saturated buffer, consisting of 10 mM N-(2- hydroxyethyl)piperazine-N'-(2-ethanesulfonic acid) (Hepes), 5 mM MgCl2, 10 mM KCl, 225 mM sucrose, pH 7.4, with 2.5 mM succinate as substrate. Fe(III) gluconate complexes were synthesized by oxidative hydrolysis (2), which yields Fe(III) gluconate that is characterized as to structure (24, 25) and bioavailability (2, 3). Nitrogen (99.995%)-purged solutions of 20 mM potassium D-gluconate and 100 mM Hepes (pH 7.4) were made, to which an equal volume of 20 mM nitrogen- purged FeCl2 was added. This Fe(II) solution was completely oxidized by purging with 100% oxygen for 30 min. Chelation of the 1:1 Fe(III):gluconate complexes by succinate was ruled out by speciation calculations as follows: even though the acid dissociation constants of gluconate and succinate are similar (26), there is no Fe(III) succinate species at pH 7.4 when the Fe(III):gluconate molar ratio is 1:1, due to structural differ- ences between gluconate and succinate. At low pH the car- boxylates are the sole donors to Fe(III), but at pH 7.4 the hydroxyl groups of gluconate become deprotonated with as- sistance of the strong Lewis acid Fe(III). The gluconate becomes tetradentate in turn. Its capacity to chelate then exceeds that of succinate, which is only bidentate. The loga- rithm of the stability constant of the 3-fold deprotonated Fe(III) gluconate complex is calculated from Martell and Motekaitis (26) as 35.6. Analogously, the logarithm of the stability constant of the Fe(III) succinate complex is only 6.9. Because both species are of the same stochiometry, the data can be compared directly. Thus, at equimolar or excessive Fe(III):gluconate ratio, the Fe(III) gluconate complex is the only significant Fe(III) species. Fe(III) gluconate uptake (2, 3) by respiring mitochondria was confirmed by using 59Fe [Am- ersham; 0.143 mCi/mg of Fe(III); 1 Ci = 37 GBq] -labeled Fe(III) gluconate complexes in combination with Millipore filtration as described for 45Ca2+ transport (27). In anaerobic experiments the extent of oxygen depletion by nitrogen purging and glucose oxidase [EC 1.1.3.4, Km = 2.0 x 10⁻⁴ M (28); Fluka] addition was monitored by a Clark electrode (Yellow Springs Instruments). The oxygen concen- tration was below 0.5 ,uM, as determined by dithionite and glucose oxidase calibration of the oxygen electrode. Abbreviations: BSE, backscattered electron; DARS, double-axis rotary shadowing; HR-SEM, high-resolution field-emission in-lens scanning electron microscopy; SE, secondary electron; SSB, single-strand breaks. tTo whom reprint requests should be addressed at: Biochemistry I, CHN-N33, Swiss Federal Institute of Technology, CH-8092 Zurich Switzerland. §HR-SEM identification of form I mtDNA, combined with electro- phoresis data of isolated mtDNA, strongly suggest that a specific level of supercoiling is present in vivo. The existence of mitochondrial topoisomerases supports this hypothesis (14, 15). 5341 The publication costs of this article were defrayed in part by page charge payment. This article must therefore be hereby marked "advertisement" in accordance with 18 U.S.C. §1734 solely to indicate this fact.
Transcript of Direct Observation of Iron-Induced Conformational Changes of Mitochondrial DNA by High-Resolution...

Proc. Natl. Acad. Sci. USAVol. 93, pp. 5341-5346, May 1996Cell Biology
Direct observation of iron-induced conformational changes ofmitochondrial DNA by high-resolution field-emission in-lensscanning electron microscopy
(DNA unwinding/iron colloid formation/backscattered electron detection)
MARCUS YAFFEE*t#, PATRICK WALTERt, CHRISTOPH RICHTERt, AND MARTIN MULLER**Laboratory for Electron Microscopy I and tLaboratory for Biochemistry I, Swiss Federal Institute of Technology (ETH), CH-8092 Zurich, Switzerland
Communicated by K Wuthrich, Eidgenossische Technische Hochschule, Zurich, Switzerland. January 24, 1996 (received for review June 21, 1995)
ABSTRACT When respiring rat liver mitochondria areincubated in the presence of Fe(III) gluconate, their DNA(mtDNA) relaxes from the supercoiled to the open circularform dependent on the iron dose. Anaerobiosis or antioxi-dants fail to completely inhibit the unwinding. High-resolution field-emission in-lens scanning electron micros-copy imaging, in concert with backscattered electron detec-tion, pinpoints nanometer-range iron colloids bound tomtDNA isolated from iron-exposed mitochondria. High-resolution field-emission in-lens scanning electron micros-copy with backscattered electron detection imaging permitssimultaneous detailed visual analysis of DNA topology, irondose-dependent mtDNA unwinding, and assessment of ironcolloid formation on mtDNA strands.
Mitochondria accumulate iron in the form of Fe(III) (1-3) andthen can reduce it to Fe(II) (4). Mitochondrial iron is necessaryfor incorporation into iron-sulfur proteins and heme (5) but ispotentially dangerous because it participates in hydroxyl rad-ical (-OH) formation (6). Mitochondria are the major sourceof superoxide (7), which can dismutate to yield hydrogenperoxide. This, in turn, can interact with Fe(II) to produce -OHradicals. They can damage DNA in many ways, particularly byinducing single-strand breaks (SSB) (8), which leads to changesin mtDNA conformation (9-13).Mammalian mtDNA possesses three archetypal conforma-
tions: form I, supercoiled; form II, open relaxed; and form III,linear. Form I is believed to predominate in vivo.§ mtDNA isa compact molecule coding for 2 rRNAs, 22 tRNAs, and 13peptides [rat mtDNA has 16,298 bp (16)]. This leaves mtDNAwith few noncoding regions; damage to the mtDNA couldtherefore be metabolically devastating. Indeed, modificationsof mtDNA-e.g., point mutations, fragmentation, deletions,and duplications-have been etiologically linked to humandiseases (17) and to aging (18). Since oxidative damage tomtDNA is 16-fold greater than that to nuclear DNA (19),oxidative stress could contribute significantly to disease-related mtDNA modifications (20).Here we establish a method for high-resolution field-
emission in-lens scanning electron microscopy (HR-SEM)observation of the three-dimensional structure of native DNAtopology. We thereby detect an iron-induced shift of mtDNAfrom the supercoiled to the open circular forms. HR-SEManalysis with backscattered electron (BSE) detection alsoallowed us to localize and identify colloidal iron species onmtDNA. Because the exact structure and composition of theseaggregates are not yet known, we refer to them as colloids.Colloids are microheterogeneous structures with dimensionsin the range from 1 to 1000 nm (21, 22).
MATERIALS AND METHODS
mtDNA Preparation. Female Wistar rat liver mitochondriawere isolated by differential centrifugation (23) and incubatedwith up to 500 ,uM Fe(III) gluconate for 20 min, with stirring,in an oxygen-saturated buffer, consisting of 10 mM N-(2-hydroxyethyl)piperazine-N'-(2-ethanesulfonic acid) (Hepes),5 mM MgCl2, 10 mM KCl, 225 mM sucrose, pH 7.4, with 2.5mM succinate as substrate. Fe(III) gluconate complexes weresynthesized by oxidative hydrolysis (2), which yields Fe(III)gluconate that is characterized as to structure (24, 25) andbioavailability (2, 3). Nitrogen (99.995%)-purged solutions of20 mM potassium D-gluconate and 100 mM Hepes (pH 7.4)were made, to which an equal volume of 20 mM nitrogen-purged FeCl2 was added. This Fe(II) solution was completelyoxidized by purging with 100% oxygen for 30 min. Chelationof the 1:1 Fe(III):gluconate complexes by succinate was ruledout by speciation calculations as follows: even though the aciddissociation constants of gluconate and succinate are similar(26), there is no Fe(III) succinate species at pH 7.4 when theFe(III):gluconate molar ratio is 1:1, due to structural differ-ences between gluconate and succinate. At low pH the car-boxylates are the sole donors to Fe(III), but at pH 7.4 thehydroxyl groups of gluconate become deprotonated with as-sistance of the strong Lewis acid Fe(III). The gluconatebecomes tetradentate in turn. Its capacity to chelate thenexceeds that of succinate, which is only bidentate. The loga-rithm of the stability constant of the 3-fold deprotonatedFe(III) gluconate complex is calculated from Martell andMotekaitis (26) as 35.6. Analogously, the logarithm of thestability constant of the Fe(III) succinate complex is only 6.9.Because both species are of the same stochiometry, the datacan be compared directly. Thus, at equimolar or excessiveFe(III):gluconate ratio, the Fe(III) gluconate complex is theonly significant Fe(III) species. Fe(III) gluconate uptake (2, 3)by respiring mitochondria was confirmed by using 59Fe [Am-ersham; 0.143 mCi/mg of Fe(III); 1 Ci = 37 GBq] -labeledFe(III) gluconate complexes in combination with Milliporefiltration as described for 45Ca2+ transport (27).
In anaerobic experiments the extent of oxygen depletion bynitrogen purging and glucose oxidase [EC 1.1.3.4, Km = 2.0 x10⁻⁴ M (28); Fluka] addition was monitored by a Clarkelectrode (Yellow Springs Instruments). The oxygen concen-tration was below 0.5 ,uM, as determined by dithionite andglucose oxidase calibration of the oxygen electrode.
Abbreviations: BSE, backscattered electron; DARS, double-axis rotaryshadowing; HR-SEM, high-resolution field-emission in-lens scanningelectron microscopy; SE, secondary electron; SSB, single-strand breaks.tTo whom reprint requests should be addressed at: Biochemistry I,CHN-N33, Swiss Federal Institute of Technology, CH-8092 ZurichSwitzerland.§HR-SEM identification of form I mtDNA, combined with electro-phoresis data of isolated mtDNA, strongly suggest that a specific levelof supercoiling is present in vivo. The existence of mitochondrialtopoisomerases supports this hypothesis (14, 15).
5341
The publication costs of this article were defrayed in part by page chargepayment. This article must therefore be hereby marked "advertisement" inaccordance with 18 U.S.C. §1734 solely to indicate this fact.
Proc. Natl. Acad. Sci. USA 93 (1996)
mtDNA was isolated by neutral lysis of mitochondria in 1.5%SDS, precipitation of membranes and proteins by 5 M NaCl,followed by two phenol/chloroform (1:1) and chloroform extrac-tions, ethanol precipitation and centrifugation. The resultingmtDNA pellet was washed with 80% ethanol and resuspended,then further purified on a Sephacryl S-400 mini-spun column.Samples were electrophoresed at constant current, 67 mA (4V/cm) for 90 min on a 0.7% agarose gel with 0.5 ,.g/ml ethidiumbromide. The gel was photographed under UV illumination, andthe negative was scanned on a Molecular Dynamics laser densi-tometer. Error shown is standard error of the mean.Sample Preparation and HR-SEM Observation. pBR322,
pUC21, and mtDNA samples were dialyzed against 3 mMMgCl2 by centrifugation/filtration in Centricon-30 concentra-tors (3 x 30 min at 5000x g) (Amicon). DNA was adjusted to-300 ng/ml and placed in 20-gl droplets on parafilm (29).Carbon/collodion-coated 400-mesh copper grids, freshlyetched by a charged oxygen plasma [30 sec, 100 mV, 5 mbar of02 (1 mbar = 100 Pa) in a Balzers GEA-003-S glow-dischargeapparatus (Balzers), were placed on the droplets for 2 min,removed perpendicularly to the surface, immediately plunge-frozen in liquid nitrogen, and transferred under liquid nitrogento the stage of a precooled (- 160°C) Balzers BAF-300 freeze-etch machine. Samples were kept at 2 x 10⁻⁷ mbar and-100°C for 2 hr, and then double-axis rotary-shadowed (30)with chromium metal (-1 nm thick). They were then broughtto 20°C under vacuum and removed from the BAF-300.
Samples were next placed in a Hitachi S-900 field-emissionin-lens HR-SEM on a Gatan cryoholder, and brought to -85°Cto reduce contamination (30). This S-900 is equipped with ahighly sensitive yttrium/aluminum garnet single-crystal BSE de-tector (31). Primary magnifications ranged from x50,000 tox400,000. Astigmatism was corrected to x800,000 on chromiummetal grains. Fine focusing was done during the first lines of thephotoscan. Images of DNA surface topology were generated bythe secondary electron (SE) signal; the material-dependent BSEimages were used to localize the metal colloids. BSE and SEsignals were recorded in parallel on film; they were also digitallyacquired simultaneously using Gatan Digiscan equipment andDigital Micrograph software (Gatan, Pleasanton, CA). Negativeswere scanned and digitized (Leafscan Model 45 film scanner,Leaf Systems, Southborough, MA). DNA length was calculatedfrom digitized images (DIGITAL MICROGRAPH 2.1B, Gatan) andfrom micrographs processed with a Bit Pad Plus (model CR 1212,Summagraphics, Fairfield, CT). For quanitation of mtDNAforms in HR-SEM, all micrographs were pooled and the pro-portion of each form was calculated.HR-SEM of Colloids. Experiments to verify the presence of
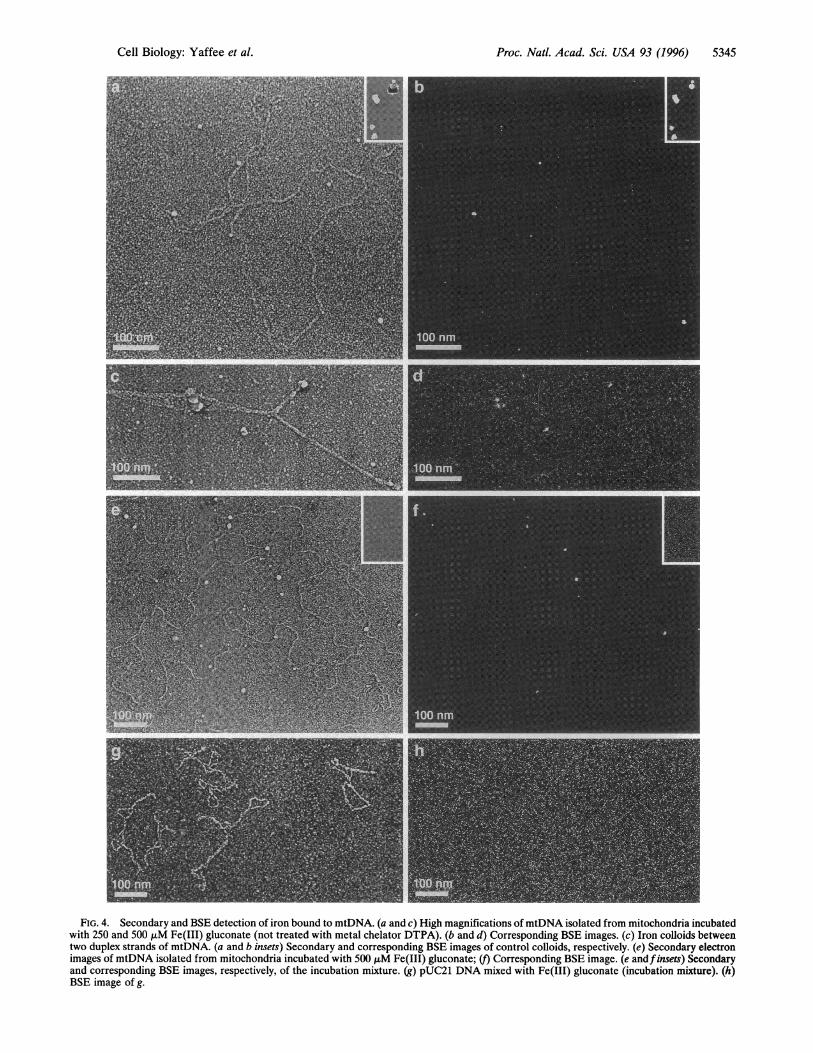
iron in the colloids were performed as follows: (i) Fe(III)gluconate solutions were plunge-frozen and analyzed withHR-SEM SE/BSE imaging for metal colloids. (ii) Incubationsolutions with or without (see Fig. 4 e andf) DTPA (20 mM)were treated analogously. (iii) mtDNA isolated from mito-chondria incubated with or without iron, and mtDNA treatedwith or without DTPA after isolation, was also analyzed bycryo-HR-SEM. (iv) Two iron colloids, 30 and 100 nm indiameter (a gift of Felix Funk, Institute of Terrestrial Ecology,Eidgenossische Technische Hochschule, Zurich), were imagedin BSE and SE modes for reference (see Fig. 4 a and b insets).(v) Isolated mtDNA was mixed with either Fe(III) gluconate,or Fe(III) gluconate plus incubation solution, or the ironreference colloids (described above), and analyzed with cryo-HR-SEM.
RESULTSConformational Analysis. DNA plasmids pBR322 and
pUC21 were chosen as HR-SEM specimen controls because oftheir known sequences (32, 33) and conformational similarityto mtDNA. HR-SEM micrographs of plasmids and mtDNA
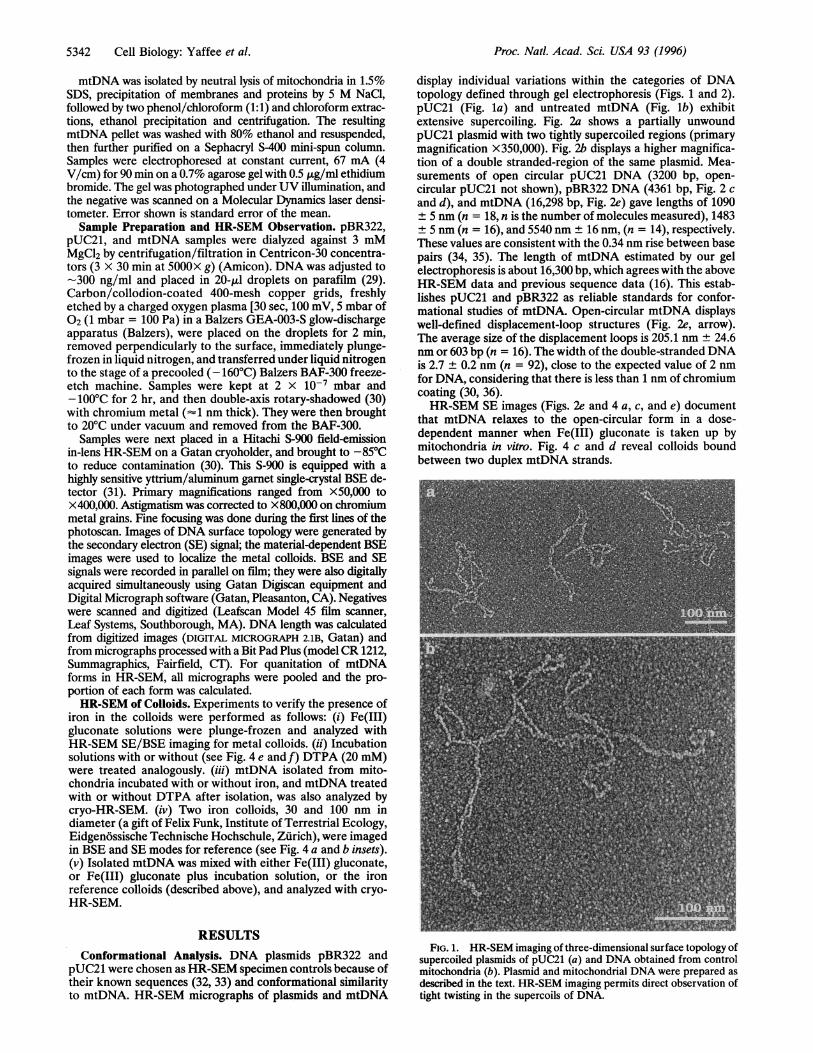
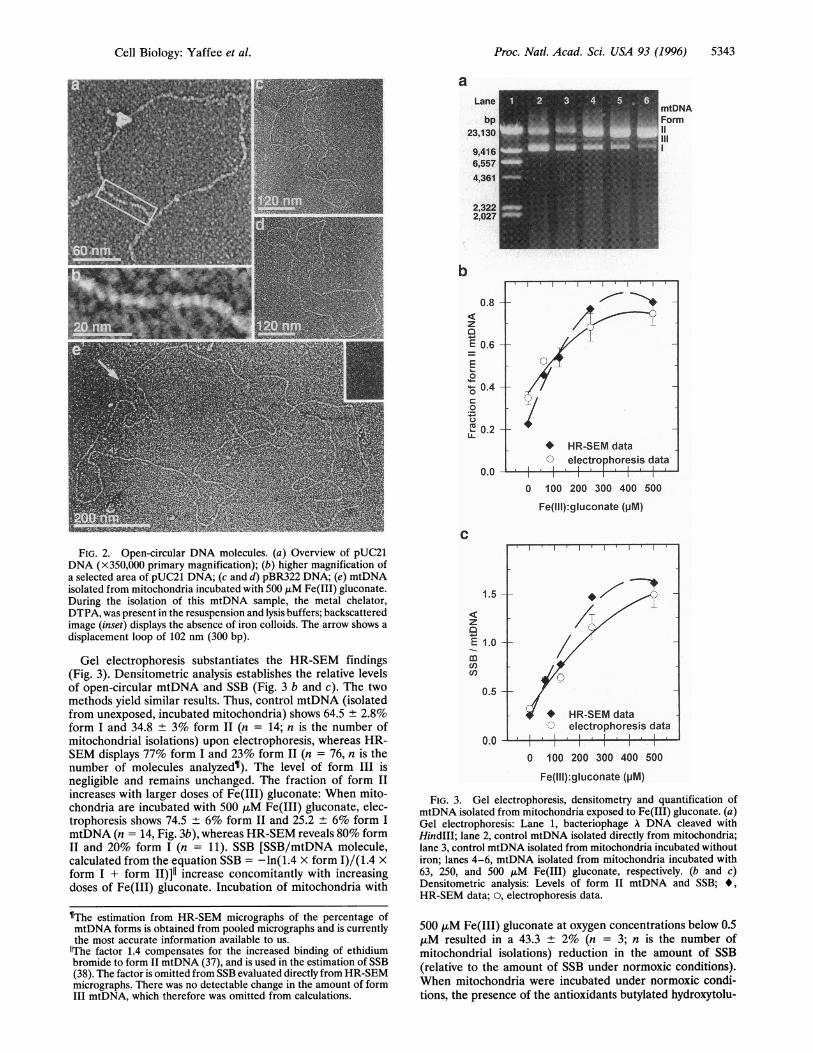
display individual variations within the categories of DNAtopology defined through gel electrophoresis (Figs. 1 and 2).pUC21 (Fig. la) and untreated mtDNA (Fig. lb) exhibitextensive supercoiling. Fig. 2a shows a partially unwoundpUC21 plasmid with two tightly supercoiled regions (primarymagnification X350,000). Fig. 2b displays a higher magnifica-tion of a double stranded-region of the same plasmid. Mea-surements of open circular pUC21 DNA (3200 bp, open-circular pUC21 not shown), pBR322 DNA (4361 bp, Fig. 2 cand d), and mtDNA (16,298 bp, Fig. 2e) gave lengths of 1090± 5 nm (n = 18, n is the number of molecules measured), 1483± 5 nm (n = 16), and 5540 nm ± 16 nm, (n = 14), respectively.These values are consistent with the 0.34 nm rise between basepairs (34, 35). The length of mtDNA estimated by our gelelectrophoresis is about 16,300 bp, which agrees with the aboveHR-SEM data and previous sequence data (16). This estab-lishes pUC21 and pBR322 as reliable standards for confor-mational studies of mtDNA. Open-circular mtDNA displayswell-defined displacement-loop structures (Fig. 2e, arrow).The average size of the displacement loops is 205.1 nm ± 24.6nm or 603 bp (n = 16). The width of the double-stranded DNAis 2.7 ± 0.2 nm (n = 92), close to the expected value of 2 nmfor DNA, considering that there is less than 1 nm of chromiumcoating (30, 36).HR-SEM SE images (Figs. 2e and 4 a, c, and e) document
that mtDNA relaxes to the open-circular form in a dose-dependent manner when Fe(III) gluconate is taken up bymitochondria in vitro. Fig. 4 c and d reveal colloids boundbetween two duplex mtDNA strands.
FIG. 1. HR-SEM imaging of three-dimensional surface topology ofsupercoiled plasmids of pUC21 (a) and DNA obtained from controlmitochondria (b). Plasmid and mitochondrial DNA were prepared asdescribed in the text. HR-SEM imaging permits direct observation oftight twisting in the supercoils of DNA.
5342 Cell Biology: Yaffee et al.
Proc. Natl. Acad. Sci. USA 93 (1996) 5343
FIG. 2. Open-circular DNA molecules. (a) Overview of pUC21DNA (X350,000 primary magnification); (b) higher magnification ofa selected area of pUC21 DNA; (c and d) pBR322 DNA; (e) mtDNAisolated from mitochondria incubated with 500 ,uM Fe(III) gluconate.During the isolation of this mtDNA sample, the metal chelator,DTPA, was present in the resuspension and lysis buffers; backscatteredimage (inset) displays the absence of iron colloids. The arrow shows adisplacement loop of 102 nm (300 bp).
Gel electrophoresis substantiates the HR-SEM findings(Fig. 3). Densitometric analysis establishes the relative levelsof open-circular mtDNA and SSB (Fig. 3 b and c). The twomethods yield similar results. Thus, control mtDNA (isolatedfrom unexposed, incubated mitochondria) shows 64.5 ± 2.8%form I and 34.8 ± 3% form II (n = 14; n is the number ofmitochondrial isolations) upon electrophoresis, whereas HR-SEM displays 77% form I and 23% form II (n = 76, n is thenumber of molecules analyzed¶l). The level of form III isnegligible and remains unchanged. The fraction of form IIincreases with larger doses of Fe(III) gluconate: When mito-chondria are incubated with 500 ,uM Fe(III) gluconate, elec-trophoresis shows 74.5 ± 6% form II and 25.2 ± 6% form ImtDNA (n = 14, Fig. 3b), whereas HR-SEM reveals 80% formII and 20% form I (n = 11). SSB [SSB/mtDNA molecule,calculated from the equation SSB = -ln(1.4 x form 1)/(1.4 xform I + form II)]II increase concomitantly with increasingdoses of Fe(III) gluconate. Incubation of mitochondria with
aLane
bp23,130
9,4166,5574,361
2,3222,027
b
0.8
z10E 0.6
E0
0.40
0
T 0.2
0.0
C
1.5
zaE 1.0
0.5
0.0
mtDNAForm11
* HR-SEM dataC) electrophoresis data
I I
0 100 200 300 400 500
Fe(III):gluconate (pM)
* HR-SEM dataelectrophoresis data
._ 1_I4III. _ <0I 200 5
0 100 200 300 400 500
Fe(111):gluconate (pM)
FIG. 3. Gel electrophoresis, densitometry and quantification ofmtDNA isolated from mitochondria exposed to Fe(III) gluconate. (a)Gel electrophoresis: Lane 1, bacteriophage A DNA cleaved withHindIII; lane 2, control mtDNA isolated directly from mitochondria;lane 3, control mtDNA isolated from mitochondria incubated withoutiron; lanes 4-6, mtDNA isolated from mitochondria incubated with63, 250, and 500 ,uM Fe(III) gluconate, respectively. (b and c)Densitometric analysis: Levels of form II mtDNA and SSB; *,HR-SEM data; 0, electrophoresis data.
IThe estimation from HR-SEM micrographs of the percentage ofmtDNA forms is obtained from pooled micrographs and is currentlythe most accurate information available to us.1The factor 1.4 compensates for the increased binding of ethidiumbromide to form II mtDNA (37), and is used in the estimation of SSB(38). The factor is omitted from SSB evaluated directly from HR-SEMmicrographs. There was no detectable change in the amount of formIII mtDNA, which therefore was omitted from calculations.
500 ,uM Fe(III) gluconate at oxygen concentrations below 0.5,uM resulted in a 43.3 ± 2% (n = 3; n is the number ofmitochondrial isolations) reduction in the amount of SSB(relative to the amount of SSB under normoxic conditions).When mitochondria were incubated under normoxic condi-tions, the presence of the antioxidants butylated hydroxytolu-
Cell Biology: Yaffee et al.
l

Proc. Natl. Acad. Sci. USA 93 (1996)
ene or probucol at 50 ,uM resulted in a 40.6 ± 0.4% or 42.7 +3.1% (n = 3) reduction in Fe(III) gluconate-caused SSB,respectively (relative to the amount of SSB without addedantioxidants). Higher concentrations of antioxidants were alsotried under normoxic conditions. When mitochondria wereincubated in the presence 200 ,uM Trolox-c (6-hydroxy-2,5,7,8-tetramethylchroman-2-carboxylic acid) or butylated hydroxy-toluene the Fe(III) gluconate-caused SSB were increased by21.7 ± 7% or 1.3 ± 0.1% (n = 2), respectively. However, theaddition of 200 ,uM of the iron chelator. Desferal resulted in47.1 ± 0.1% (n = 2) reduction in SSB.
Iron Detection in SE and BSE Images. SE and BSE imagesof mtDNA samples isolated from mitochondria incubated withFe(III) gluconate (Fig. 4 a-f) show metal colloids bound toDNA. Since nonmetallic, carbon-based biological sampleshave inherently low BSE coefficients compared with metals,the strong BSE signal appearing in areas of DNA unwindingand on strands of unwound mtDNA (Fig. 4 b, d, and f)unequivocally identifies the metal content of the colloid. SEand BSE images show a similar number (4 ± 2) of metalcolloids bound to mtDNA with increasing iron dose. Thecolloids have an average size of 6.5 ± 0.7 nm (range 1-52 nm,
n = 151, n is the number of colloids measured). DNA obtainedfrom untreated mitochondria, and mtDNA treated with themetal chelator DTPA, did not contain any metal colloids (Fig.2 e and inset). No metal colloids were found when mitochon-dria were omitted from the incubation mixture, or when themitochondria-free incubation solution was mixed with pUC21(Fig. 4 g and h) or pBR322 (not shown) at 300 ng/ml.Furthermore, mtDNA and pUC21 DNA mixed with referencecolloids and washed by centrifugation-filtration did not showbound colloids (not shown).
DISCUSSIONHR-SEM Analysis of DNA. Conventional scanning micros-
copy cannot resolve nanometer-range structures, and trans-mission electron microscopy is unable to depict three-dimensional topography without simulated or reconstructedmodels. In contrast, HR-SEM imaging directly displays three-dimensional information. HR-SEM combined with BSE de-tection can map nanometer-range metal colloids, uniquelycomplementing topographic information provided by the SE(39).DNA was prepared here in 3 mM MgCl2 (29) without
resorting to modifying conditions such as hypophasic spread-ing or the presence of ethidium bromide, cytochrome c, or
formamide. In addition, rapid freezing used here preventsDNA width variation due to increased salt concentration (40),and it immobilizes the hydrated molecule in a physiologicalsuspension. Hence HR-SEM micrographs show mtDNA indimensions expected for duplex DNA-i.e., the 2-nm widthand 0.34-nm rise between base pairs. mtDNA visualized byHR-SEM is in the B form since the A or Z form would havemeasured 3749 nm or 6193 nm in length, respectively, based onthe 0.34-nm rise between base pairs. Therefore, this techniquepermits the analysis ofmtDNA in a near-native state and whenit has undergone iron-induced conformational changes.
Iron Colloid Formation. Mitochondria exposed to 500 ,uMFe(III) gluconate take up about 33 nmol of Fe(III) per mg ofprotein (P.W., unpublished result). Can the iron upon uptakebind to DNA? Double-stranded helical DNA has potentialsites for metal-ion interaction at the major and minor grooves,
exposing both the ribose phosphate moieties and parts of thebases; these organized centers of charge and N donors can bindheavy metal ions (41). Early experiments showed evidence thatiron can bind to nucleic acids (42-46). NMR work by Eisingeret al. (46) suggests binding of Fe(III) and Fe(II) to the interiorand exterior, respectively, of the DNA double helix. Morerecent experiments provide further evidence of iron-DNA
adduct formation (47-49). Additionally, deposits within mi-tochondria of humans with sideroblastic anemia have beenidentified as iron phosphates (50, 51).Our HR-SEM study, combined with BSE detection, shows
that iron colloid formation takes place on mtDNA during invitro iron overload of mitochondria. We believe that all ironvisualized through BSE detection is associated with mtDNAsince 3-fold centrifugation/filtration washing (see Materialsand Methods) would remove all free iron and unbound colloids.Furthermore, we have ruled out nonspecific binding by findingthat mtDNA and pUC21 DNA mixed with reference colloidsand washed by centrifugation-filtration do not show colloids(not shown). The large size of the colloids compared with thepresumed size of the Fe(III) gluconate complex suggests someform of mitochondrial processing of the iron.
In relationship to DNA damage, two DNA binding modesfor iron have been suggested (52): either binding to phosphateresidues or coordination in a sequence (base-) specific manner.In the latter case, iron can bind either the base and thephosphate or the base alone. We show here directly thatcolloidal iron indeed binds to DNA. Our experiments differfrom the recently published work (52) in that we see colloidaliron bound to mtDNA, which again is probably due to mito-chondrial processing of the iron. Furthermore, mitochondrialproteins may play a role in DNA binding of the iron colloids,and even constitute part of the colloid. The number of ironcolloids bound to mtDNA molecules (4 ± 2) is independent ofthe Fe(III) dose. This suggests that the binding is base specific.mtDNA Relaxation. Iron-induced change in overall DNA
topology has previously been attributed to oxidative DNAdamage caused by -OH by the Fenton reaction (8). We find,however, that iron-induced relaxation is not completely pre-vented by nitrogen purging or antioxidants. We cannot excludeminute amounts of oxygen, perhaps bound to iron complexes,in mitochondria, but glucose oxidase and mitochondrial cyto-chrome oxidase bring the free oxygen well below 0.5 ,M.Additional factors other than reactive oxygen are then appar-ently involved in the iron-dependent unwinding of mtDNA.For example, iron colloid growth on mtDNA could physicallyseparate the mtDNA supercoils (see Fig. 4c). Colloids mayprevent site-specific binding of proteins-e.g., mtDNA repairenzymes and/or other mtDNA binding proteins-therebypreventing mtDNA from reforming supercoils. Possible mito-chondrial reduction of Fe(III) to Fe(II) (4) followed byreaction with H202 generates -OH or type I and II oxidants(52), which could nick the DNA strands. The resulting relaxedmtDNA molecule would be more receptive to further iron-DNA binding and iron colloid growth on DNA strands.
Conclusions. Images obtained from transmission electronmicroscopy techniques still provide highly useful structuralinformation. In-lens field-emission cryo-HR-SEM, in concertwith BSE detection, provides information about nanometer-level topography and heavy atom complex localization (30, 36).Molecules with highly corrugated surfaces, such as supercoiledmtDNA, are particularly suitable for this technique. HR-SEMstudies can also complement structural data, from particlescatter-based modeling systems (e.g., x-ray, electron diffrac-tion) or NMR studies, by providing the in situ elucidation ofmolecular architecture. HR-SEM could thereby bridge the gapbetween these different methods. Although HR-SEM does notyield atomic level data, as does NMR or diffraction-basedmethods, HR-SEM is not limited by the size, shape, orbiophysical characteristics (e.g. crystallizability, isotropic"tumbling") of the target molecule. Combined with the tech-nical ease of imaging complex macromolecules, this sets thestage for a wide range of future studies-e.g., the analysis ofrepair enzymes binding to oxidatively damaged mtDNA, metalcomplex and antitumor drug interactions with DNA, andimmunolabeling of DNA adducts.
5344 Cell Biology: Yaffee et al.
Proc. Natl. Acad. Sci. USA 93 (1996) 5345
FIG. 4. Secondary and BSE detection of iron bound to mtDNA. (a and c) High magnifications ofmtDNA isolated from mitochondria incubatedwith 250 and 500 ,M Fe(III) gluconate (not treated with metal chelator DTPA). (b and d) Corresponding BSE images. (c) Iron colloids betweentwo duplex strands of mtDNA. (a and b insets) Secondary and corresponding BSE images of control colloids, respectively. (e) Secondary electronimages of mtDNA isolated from mitochondria incubated with 500 ,uM Fe(III) gluconate; (') Corresponding BSE image. (e andfinsets) Secondaryand corresponding BSE images, respectively, of the incubation mixture. (g) pUC21 DNA mixed with Fe(III) gluconate (incubation mixture). (h)BSE image of g.
Cell Biology: Yaffee et al.

Proc. Natl. Acad. Sci. USA 93 (1996)
We are indebted to Willem H. Koppenol and Reinhard Kissner(Eidgenossische Technische Hochschule) for their professional inputand speciation calculations, Felix Funk for providing reference ironcolloids, and Alain Wasserfallen, Rene Hermann, and Jose M. Sogofor helpful suggestions and discussions. We are grateful to MarianneSuter for help with the mitochondrial experiments. We also acknowl-edge the pioneering work and suggestions of Margit Nass, and thankKaspar H. Winterhalter and Hans Moor for their interest and con-tinuing support. M.Y. and P.W. received research funds from the SwissFederal Institute of Technology.
1. Romslo, I. & Flatmark, T. (1973) Biochim. Biophys. Acta 305,29-40.
2. Funk, F., Lecrenier, C., Lesuisse, E., Crichton, R. R. & Schnei-der, W. (1986) Eur. J. Biochem. 157, 303-309.
3. Masini, A., Tommaso, T., Ceccarelli-Stanzani, D. & Ventura, E.(1985) Biochim. Biophys. Acta 810, 20-26.
4. Flatmark, T. & Romslo, I. (1975) J. Biol. Chem. 250, 6433-6438.5. Tyler, D. (1992) The Mitochondrion in Health and Disease (VCH,
Cambridge, U.K.), pp. 466-474.6. Ryan, T. P. & Aust, S. A. (1992) Crit. Rev. Toxicol. 22, 119-141.7. Loschen, G., Azzi, A., Richter, C. & Floh6, L. (1974) FEBS Lett.
42, 68-72.8. Dizdaroglu, M. (1993) in DNA and Free Radicals, eds. Halliwell,
B. & Aruoma, 0. (Ellis Horwood, Chichester, U.K.), pp. 19-39.9. Singh, G., Hauswirth, W., Ross, W. & Neims, A. H. (1985) Mol.
Pharmacol. 27, 167-170.10. Lim, L. 0. & Neims, A. H. (1987) Biochem. Pharmacol. 36,
2769-2774.11. Hruszkewycz, A. M. (1988) Biochem. Biophys. Res. Commun.
153, 191-197.12. Itoh, H., Shioda, T., Matsura, T., Koyama, S., Nakanishi, T.,
Kajiyama, G. & Kawasaki, T. (1994)Arch. Biochem. Biophys. 313,120-125.
13. Higuchi, Y. & Linn, S. (1995) J. Biol. Chem. 270, 7950-7956.14. Fairfield, F. R., Bauer, W. R. & Simpson, M. V. (1979) J. Biol.
Chem. 254, 9352-9354.15. Kosovsky, M. J. & Soslau, G. (1993) Biochim. Biophys. Acta 1164,
101-107.16. Gadaleta, M. N., Pepe, G., DeCandia, G., Quagliariello, C.,
Sbisa, E. & Saccone, C. (1989) J. Mol. Evol. 28, 497-516.17. Richter, C. (1995) in Molecular Aspects of Ageing, Dahlem
Konferenz 74, eds. Esser, K., & Martin, G. M. (Wiley, NewYork), pp. 99-108.
18. Shigenaga, M. K., Hagen, T. M. & Ames, B. N. (1994) Proc. Natl.Acad. Sci. USA 91, 10771-10775.
19. Richter, C., Park, J.-W. & Ames, B. N. (1988) Proc. Natl. Acad.Sci. USA 85, 6465-6467.
20. Wallace, D. C. (1992) Science 256, 628-632.21. Lewis, J. R. (1993) Hawley's Condensed Chemical Dictionary
(Van Nostrand Reinhold, New York), 12th Ed., pp. 300-301.22. Hibbert, D. B. & James, A. M. (1987) Macmillan Dictionary of
Chemistry (Macmillan, London), pp. 111-112.23. Klingenberg, M. & Slenczka, W. (1959) Biochem. Z. 331, 486-
517.24. Pecsok, R. L. & Sandera, J. (1955) J. Am. Chem. Soc. 77,
1489-1494.
25. Shepherd, R. E., Isaacson, Y., Chensny, L., Zhang, S., Kortes, R.& John, K. (1993) J. Inorg. Biochem. 49, 23-48.
26. Martell, A. E. & Motekaitis, R. (1993) Critical Stability Constants,Data Base Number 46 (National Institute of Standards, Gaith-ersburg, MD).
27. Frei, B., Winterhalter, K. H. & Richter, C. (1985) J. Biol. Chem.260, 7394-7401.
28. Gibson, Q. H., Swoboda, B. E. P. & Massey, V. (1964) J. Biol.Chem. 239, 3927-3931.
29. Sogo, J., Stasiak, A., De Bernardin, W., Losa, R. & Koller, T.(1987) in Electron Microscopy in Molecular Biology: A PracticalApproach, eds. Sommerville, J. & Scheer, U. (IRL, Oxford), pp.61-78.
30. Hermann, R., Pawley, J., Nagatani, T. & Muller, M. (1988)Scanning Microsc. 2, 1215-1230.
31. Autrata, R., Hermann, R. & Muller, M. (1992) Scanning 14,127-135.
32. Watson, N. (1988) Gene 70, 399-403.33. Vieira, J. & Messing, J. (1991) Gene 100, 189-194.34. Astbury, W. T. & Bell, F. 0. (1938) Nature (London) 141,
747-748.35. Adams, R. L. P., Knowle, J. T. & Leader, D. P. (1992) The
Biochemistry ofNucleicAcids (Chapman and Hall, London), 11thEd., pp. 14-19.
36. Hermann, R. & Muller, M. (1991) Scanning Microsc. 5, 653-664.37. Lloyd, R. S., Haidle, C. W. & Robberson, D. L. (1978) Biochenm-
istry 17, 1890-1896.38. Epe, B., Mutzel, P. & Adam, W. (1988) Chem.-Biol. Interact. 67,
149-165.39. Hermann, R., Schwarz, H. & Muller, M. (1991) J. Struct. Biol.
107, 38-47.40. Bednar, J., Furrer, P., Stasiak, A., Dubochet, J., Egelman, E. H.
& Bates, A. D. (1994) J. Mol. Biol. 235, 825-847.41. Frauisto Da Silva, J. J. R. & Williams, R. J. P. (1991) The
Biological Chemistry of the Elements: The Inorganic Chemistry ofLife (Clarendon, Oxford), pp. 188-219.
42. Wacker, W. E. C., Gordon, M. P. & Huff, J. W. (1963) Biochem-istry 2, 716-719.
43. Wacker, W. E. C. & Vallee, B. L. (1959) J. Biol. Chem. 234,3257-3262.
44. Haschemeyer, R., Singer, B. & Fraenkel-Conrat, H. (1959) Proc.Natl. Acad. Sci. USA 45, 313-319.
45. Loring, H. S. & Waritz, R. S. (1957) Science 125, 646-648.46. Eisinger, J., Shulman, R. G. & Blumberg, W. E. (1961) Nature
(London) 192, 963-964.47. Shires, T. K. (1982) Biochem. J. 205, 321-329.48. Richardson, C. L., Verna, J., Schulman, G. E., Shipp, K. & Grant,
A. D. (1981) Environ. Mutagen. 3, 545-553.49. Sakurai, K., Haga, K. & Ogiso, T. (1994) Biol. Pharm. Bull. 17,
227-231.50. Trump, B. F., Berezesky, I. K., Jiji, R. M., Mergner, W. J. &
Bulger, R. E. (1978) Lab. Invest. 39, 375-380.51. Grasso, J. A., Myers, T. J., Hines, J. D. & Sullivan, A. L (1980)
Br. J. Haematol. 46, 57-72.52. Luo, Y., Han, Z., Chin, S. M. & Linn, S. (1994) Proc. Natl. Acad.
Sci. USA 91, 12438-12442
5346 Cell Biology: Yaffee et al.