Direct n-octanol amination by ammonia on supported Ni and ...
27
Submitted to Catalysis Science & Technology 1 Direct n-octanol amination by ammonia on supported Ni and Pd catalysts: activity is enhanced by “spectator” ammonia adsorbates Alexandre S. Dumon, 1 Tao Wang, 1 Javier Ibañez, 2,3 Ajay Tomer, 2,3 Zhen Yan, 2 Raphael Wischert, 2 Philippe Sautet, 4 Marc Pera-Titus 2* and Carine Michel 1* 1 Univ Lyon, Ens de Lyon, CNRS UMR 5182, Université Claude Bernard Lyon 1, Laboratoire de Chimie, F69342, Lyon, France 2 Eco-Efficient Products and Processes Laboratory (E2P2L), UMI 3464 CNRS – Solvay, 3966 Jin Du Road, Xin Zhuang Ind. Zone, 201108 Shanghai, China 3 Univ. Lille, Univ. Artois, CNRS, Centrale Lille, ENSCL, UMR 8181 – UCCS – Unité de Catalyse et Chimie du Solide, Lille, F-59000, France 4 Department of Chemical and Biomolecular Engineering, University of California Los Angeles, Los Angeles, CA 90095, United States 5 Department of Chemistry and Biochemistry, University of California Los Angeles, Los Angeles, CA 90095, United States * Corresponding author: [email protected], [email protected] Abstract The direct amination of alcohols by ammonia is a promising sustainable route to primary amines. The development of novel heterogeneous catalysts calls for a better understanding of this reaction. Through a combination of well-designed catalytic tests and periodic DFT computations, we provide here a deeper understanding of the factors determining the activity of Ni and Pd catalysts. In particular, we demonstrate that a proper assessment of the relative activity requires the inclusion of a spectator species, namely ammonia, which modifies the rate limiting intermediate and transition state and thus affects the overall predicted activity. This better understanding paves the road to a rational improvement of metal-based catalysts. Keywords: alcohol amination, metallic supported catalysts, DFT, ammonia, co-adsorption
-
Upload
khangminh22 -
Category
Documents
-
view
1 -
download
0
Transcript of Direct n-octanol amination by ammonia on supported Ni and ...

Submitted to Catalysis Science & Technology
1
Direct n-octanol amination by ammonia on supported Ni and Pd catalysts: activity is enhanced by “spectator” ammonia adsorbates
Alexandre S. Dumon,1 Tao Wang,1 Javier Ibañez,2,3 Ajay Tomer,2,3 Zhen Yan,2 Raphael Wischert,2 Philippe Sautet,4 Marc Pera-Titus2* and Carine Michel1*
1 Univ Lyon, Ens de Lyon, CNRS UMR 5182, Université Claude Bernard Lyon 1, Laboratoire de Chimie, F69342, Lyon, France
2 Eco-Efficient Products and Processes Laboratory (E2P2L), UMI 3464 CNRS – Solvay, 3966 Jin Du Road, Xin Zhuang Ind. Zone, 201108 Shanghai, China
3 Univ. Lille, Univ. Artois, CNRS, Centrale Lille, ENSCL, UMR 8181 – UCCS – Unité de Catalyse et Chimie du Solide, Lille, F-59000, France
4 Department of Chemical and Biomolecular Engineering, University of California Los Angeles, Los Angeles, CA 90095, United States
5 Department of Chemistry and Biochemistry, University of California Los Angeles, Los Angeles, CA 90095, United States
*Corresponding author: [email protected], [email protected]
Abstract
The direct amination of alcohols by ammonia is a promising sustainable route to primary amines.
The development of novel heterogeneous catalysts calls for a better understanding of this reaction.
Through a combination of well-designed catalytic tests and periodic DFT computations, we
provide here a deeper understanding of the factors determining the activity of Ni and Pd catalysts.
In particular, we demonstrate that a proper assessment of the relative activity requires the
inclusion of a spectator species, namely ammonia, which modifies the rate limiting intermediate
and transition state and thus affects the overall predicted activity. This better understanding paves
the road to a rational improvement of metal-based catalysts.
Keywords: alcohol amination, metallic supported catalysts, DFT, ammonia, co-adsorption

Submitted to Catalysis Science & Technology
2
1. Introduction
Synthetic amines are extensively used in the chemical industry as solvents, agrochemicals,
pharmaceuticals, detergents, polymers and fabric softeners. 1 Historically, amines have been
produced from feedstocks such as nitriles, carboxylic acids, alkyl halides and carbonyl
compounds using processes often comprising hazardous reagents, generating salt residues or
consuming H2 stoichiometrically (i.e. reductive amination). As an alternative, the direct
amination of alcohols appears as an eco-efficient method for amine production as water is
generated as main byproduct.2 This process offers the added advantage of being potentially
compatible with biorefineries, which are expected to supply a large portfolio of alcohols.3
The most studied heterogeneous catalysts for the direct synthesis of amines from long-chain
alcohols rely on the Ni-Cu couple comprising Raney Ni,4 as well as Ni,5 Cu,6 NiCu,7 NiCuFeOx,8
NiCuZn,9 CuAl,10 CuAg11 and CuCr12 supported over alkaline or amphoteric oxides (e.g., g,q-
Al2O3). Alternative metal formulations have been explored for the synthesis of alkylamines, but
with poor success. For instance, Co either unsupported or supported over silica, has been
reported as a highly selective catalyst for the direct amination of short chain alcohols,
ethoxylated alcohols and diols, but with low activity for fatty alcohols.13 Noble metals such as
Ru and Pd usually suffer from lower activity for amination and lower selectivity to
monoalkylation, and require most often promoters and co-catalysts.5c,6a,14
The direct amination of alcohols over metals proceeds via the H-borrowing or H-
autotransfer mechanism. This tandem mechanism, which has been well established for
organometallic catalysts based on Ru and Ir, 15 but also for heterogeneous catalysts,5d, 16
comprises three consecutive steps (Scheme 1): (1) dehydrogenation of the alcohol to generate an
aldehyde/ketone, (2) formation of an imine intermediate by fast condensation of the carbonyl
with ammonia or an amine, and (3) hydrogenation of the imine to give the final amine. In this
mechanism, H2 is temporally borrowed by the action of the catalyst from the alcohol to the imine.

Submitted to Catalysis Science & Technology
3
Since steps (1) and (3) are catalyzed by the metal phase, it is necessary to find suitable metals
offering simultaneously good dehydrogenation and hydrogenation properties.
Scheme 1. H-borrowing mechanism for the amination of a primary aliphatic alcohol.
In this view, a better design of a supported metal catalyst for amination lies in a deeper
understanding of the reaction mechanism. Combining experimental kinetics together with
characterization and a thorough modeling study is a robust strategy to achieve such a goal. So
far, the direct amination of alcohols over heterogeneous catalysts using computational methods
has been explored only in a preliminary study considering the thermochemistry of the elementary
steps on Co and Ni.17 In addition, alcohol dehydrogenation is a key step that has been extensively
studied per se or as part of more global reactions involving alcohol transformations.18 The
reverse reaction, ketone hydrogenation, has also been the object of extensive studies. 19 In
particular, some of us have recently shown that the presence of a co-adsorbed water molecule,
which is hydrogen-bonded with the alcohol or the resulting ketone, can greatly affect the
catalytic activity of a metallic surface.20 According to these studies, Pt and Pd tend to facilitate
the initial C-H bond breaking of the alcohol, while the situation is less clear on more oxophilic
metals such as Ni, Co or Ru, where the alkoxy intermediate is particularly stabilized and may
poison the surface. The presence of co-adsorbed water improves the catalytic activity of
oxophilic metals towards alcohol dehydrogenation, combining lower activation energy for the
OH scission with a less stable alkoxy intermediate.

Submitted to Catalysis Science & Technology
4
The hydrogenation of imines has not been studied per se because primary alkyl imines are
unstable. However, this reaction has attracted attention as a major step of the nitrile
hydrogenation reaction network and as an intermediate in the decomposition of amines.21,22,23 In
this reaction, the hydrogenation of the nitrogen belonging to the imine appears to be more
difficult than the hydrogenation of the carbon over most metals. Furthermore, to the best of our
knowledge, the effect of co-adsorbed species on this reaction has never been addressed.
Herein, we aim at identifying the key parameters that control the activity of a metal for the
amination of aliphatic alcohols for producing alkyl amines. To this end, we will compare Ni, the
most active metal found so far with Pd, which was shown to be less active.5g,h
2. Results & discussion
Synthesis and characterization of the Ni/Al2O3 and Pd/Al2O3 catalysts
Ni and Pd catalysts over g-Al2O3 were prepared by the incipient wetness impregnation
method using nitrate precursors. Overall, three Ni/Al2O3 catalysts were prepared with Ni loading
in the range 5-15 wt% to assess the effect of the Ni loading on its speciation, whereas one
Pd/Al2O3 catalyst was prepared with a loading of 1.5 wt%, ensuring a high metal dispersion over
the support. The Ni catalysts were constituted by NiO and Ni aluminates before reduction, as
inferred from the XRD patterns (main reflections centered at 2-theta = 37o, 43.5o, 63o for NiO
and 2-theta = 31.5o, 37o, 59o for Ni aluminates) (Figure S1). Upon reduction, three different Ni
species were present in the catalysts (i.e. bulk or a-Ni, surface or b-Ni and Ni aluminates), which
were visible in the H2-TPR profiles with temperature intervals in the range 300-450 oC for bulk
Ni, 450-650 oC for surface Ni, and 650-800 oC for Ni aluminates (Figure S2, Table S3). In
particular, a catalyst with 6.5 wt% Ni/Al2O3 showed 90% of b-Ni species with complete
reducibility (Table 1, column 1). This sample was used in the remainder of this study for
assessing the catalytic properties for n-octanol amination. In the case of 1.5 wt% Pd/Al2O3, this

Submitted to Catalysis Science & Technology
5
sample ensured only surface species with almost complete metal reducibility (99%). In both
cases, the specific surface area of the catalysts was very similar to the value measured on the
parent alumina support (Table 1, column 2), reflecting the absence of pore blockage, and
confirming a good dispersion of the metal phases. Both samples are hereinafter termed as ‘Ni’
and ‘Pd’ catalysts for 6.5 wt% Ni/Al2O3 and 1.5 wt% Pd/Al2O3, respectively.
Table 1. Specific surface area, metal dispersion, mean particle size of the metallic phase and reducibility of the Ni and Pd catalysts prepared in this study.
Catalysta Metal reduction (%)
SBET
(m2/g)b Metal dispersion
(%)c dp
(nm)d Al2O3 - 154 - - 6.5 wt.% Ni/Al2O3
100
138
18
5.5 ± 0.7
(5.8 ± 0.5) 1.5 wt.% Pd/Al2O3
99
156
44
3.0 ± 0.3
(2.8 ± 0.2) a Metal loading confirmed by ICP-AES analysis b Measured by N2 adsorption at 77 K c Metal dispersion measured by CO-TPD and H2-TPD for Pd d Measured from dispersion values by assuming a spherical shape for the metal nanoparticles using Eq. 6 in the Experimental section; in parentheses, values measured by HRTEM (see SI)
The highest Ni dispersion was achieved over 6.5 wt% Ni/Al2O3 with a value about 18%,
whereas 1.5 wt% Pd/Al2O3 showed a Pd dispersion of 44% (Table 1 column 3, Figure S3, Table
S4). When transposing the metal dispersions into particle sizes by assuming a spherical shape for
the metal nanoparticles (Eq. 6 in Experimental section), a mean particle size of 5.5 nm and 3.0
nm could be estimated for Ni and Pd, respectively. These values are in fairly good agreement
with the average particle sizes measured by HRTEM, showing values of 5.8 nm and 2.8 nm for
6.5 wt%Ni/Al2O3 and 1.5 wt%Pd/Al2O3, respectively (Table 1 column 4, Figure S4).
Dehydrogenation of n-octanol
A first series of catalytic tests was carried out in a continuous fixed-bed reactor at 180 oC
and a weight-hourly space velocity (WHSV) of 155 h-1 at a constant metal weight of 8.5 mg to
assess the performance of Ni and Pd catalysts for n-octanol dehydrogenation, both in the

Submitted to Catalysis Science & Technology
6
presence and absence of hydrogen (Table 2). The reaction conditions were adjusted to assess the
catalytic activity far from chemical equilibrium (see SI for further details). For both catalysts, the
conversion of n-octanol decreased after introduction of hydrogen from 28% to 14% for Ni and
from 12% to 9% for the Pd catalyst (Table 2, column 3). In all cases, the reaction yielded mainly
low-boiling volatile products (e.g., light alkanes) that could not be recovered in the cold trap
after the reactor. It is noteworthy that the organic carbon balance improved when the
dehydrogenation reaction was conducted in the presence of hydrogen (from 79% to 90% for Ni
catalyst and from 90% to 93% for Pd catalyst) (Table 2, column 6). The main products recovered
were octanal and di-n-octylether, the latter being attributed to n-octanol condensation over the
Al2O3 support. In the absence of hydrogen, the yields of octanal and di-n-octylether were 7.0%
and <1%, respectively, for Ni, whereas the corresponding yields for Pd were in both cases about
1.0% (Table 2, columns 4 and 5). In the presence of hydrogen, the octanal yield decreased from
the initial value of 7.0% to 3.1% for Ni, while the yield of di-n-octylether remained almost
unchanged. In the case of Pd, both the octanal and di-n-octylether yields were almost not
affected by introducing hydrogen.
Table 2. Results for n-octanol dehydrogenation over Ni and Pd catalystsa
Catalyst Feed C8-OH : H2 : N2
Conversion (C8-OH)
(%)
Formation
(C7-CHO) (%)b
Formation
(C8-O-C8) (%)c
TOF (h-1) Carbon Balanced
Conversion (C8-OH)
Yield (C7-CHO)
6.5 wt% Ni/Al2O3
1.0 : 0.0 : 12.5 28 7.0 <1% 79% 107 ± 16 27 ± 3 1.0 : 2.5 : 10.0 14 3.1 1.2 90% 55 ± 14 12 ± 1
1.5 wt% Pd/Al2O3
1.0 : 0.0 : 12.5 12 1.0 1.0 90% 35 ± 10 3.0 ± 0.3 1.0 : 2.5 : 10.0 9 1.1 0.9 93% 26 ± 10 3.0 ± 0.3
a Reaction conditions: 180 oC, 1.6 mL/h n-octanol, 8.5 mg metal weight, 155 h-1 WHSV, ambient pressure; catalysts pre-reduced at 500 oC (Ni) and 250 oC (Pd) b GC yield determined by the ECN method with relative response to n-octanol24 c GC yield determined by the ECN method with relative response to di-n-octylamine24 d Organic carbon balance of the liquid products recovered in the cold trap (n-octanol, octanal and di-n-octylether)
The activity of the Ni and Pd catalysts was compared in terms of the rates of n-octanol
conversion and aldehyde formation. At the tested conditions, Ni exhibited a higher activity for n-

Submitted to Catalysis Science & Technology
7
octanol dehydrogenation with a rate of n-octanol conversion of 107 h-1 and a rate of aldehyde
formation of 27 h-1 in the absence of hydrogen (Table 2, columns 7 and 8). In contrast, under the
very same reaction conditions, the rates of n-octanol conversion and aldehyde formation over Pd
showed values of 35 h-1 and 3.0 h-1, respectively. The introduction of hydrogen exerted a more
significant effect over the Ni catalyst, enhancing the hydrogenation rate of the aldehyde and thus
reducing its production rate down to 12 h-1 from the initial value of 27 h-1. This effect was not so
evident over the Pd catalyst (the reaction rate of aldehyde formation was kept almost unchanged
at a value of 3.0 h-1), which could be explained by the lower conversion and aldehyde formation.
Indeed, at higher aldehyde partial pressures, the rate of the backwards reaction increases, thus
lowering its formation rate. Since Ni produces more aldehyde under the given conditions, it is
expected that the backward reaction would also be faster (we are closer to equilibrium).
Direct amination of n-octanol
The n-octanol amination reaction was carried out under atmospheric pressure using 3 or 9
equiv. of ammonia relative to n-octanol in the presence of 2.5 equiv. of hydrogen and balance
nitrogen as carrier gas (Table 3). In all cases, the organic carbon balance could be closed (96-
99%), which is consistent with the observation that no volatile compounds were formed (Table 3,
column 9). Unlike n-octanol dehydrogenation, the n-octanol conversion exhibited a remarkable
increase for Ni upon introduction of ammonia (from 14% to 34% and 35% with 3 and 9 equiv. of
ammonia, respectively), whereas only a slight decrease was observed for Pd (from 9% to 8%
with 3 and 9 equiv. of ammonia) (Table 2 column 3 and Table 3 column 3). Meanwhile, the
reaction rate of n-octanol conversion increased from 55 h-1 to 137 h-1 (3 equiv. of ammonia) and
130 h-1 (9 equiv. of ammonia) for Ni, while it remained almost constant at 22 h-1 for Pd (3 and 9
equiv. of ammonia, Table 2 column 7 and Table 3 column 10).
Compared to alcohol dehydrogenation, no trace of ether was found in presence of ammonia.
The etherification reaction is expected to be catalyzed by the acid sites of alumina and those sites

Submitted to Catalysis Science & Technology
8
are neutralized in presence of ammonia. An increase of the ammonia to alcohol ratio altered the
product distribution, resulting in higher yields to octanenitrile and N-octylamine at the expense
of N,N-dioctylamine and trioctylamine (Table 3, columns 4-7), in particular for the Ni catalyst.
The total yield to amines decreased from 32% to 27% for Ni when increasing the ammonia
concentration from 3 to 9 equiv, whereas the decrease was from 4.6% to 3.8% for Pd (Table 3,
column 8). Within the experimental error, no variation of the reaction rate of amine production
was observed for both catalysts when increasing the ammonia concentration from 3 to 9 equiv,
showing a value of about 100 h-1 for Ni and 12 h-1 for Pd (Table 3, column 11). This observed
zero-order in ammonia is in agreement with the literature.14b,16 Overall, these results confirm the
higher activity (TOF) of Ni for generating alkylamines compared to Pd.
Table 3. Results for n-octanol amination with ammonia over Ni and Pd catalystsa
Catalyst NH3 eq. Conversion
C8-OH (%)
Formation
C7-CN (%)
Formation
C8-NH2 (%)
Formation
(C8)2-NH (%)
Formation
(C8)3-N (%)
Formation Amines
(%)
Carbon Balance
(%)b
TOF (h-1)
Conversion (C8-OH)
Yield (Amines)
6.5 wt% Ni/Al2O3
3.0 35 2.4 14 15 2.6 32 99 137 ± 18 121 ± 12
9.0 34 3.5 19 6.2 1.3 27 96 130 ± 18 104 ± 10
1.5 wt% Pd/Al2O3
3.0 8 0.6 3.2 1.2 0.2 4.6 97 23 ± 10 14 ± 1.4
9.0 8 0.7 3.6 0.2 0.0 3.8 97 22 ± 10 12 ± 1.2 a Reaction conditions: 180 oC, 1.6 mL/h n-octanol, 8.5 mg metal, 155 h-1 WHSV, ambient pressure, feed composition: C8-OH : NH3 : H2 : N2 = 1.0 : 3.0-9.0 : 2.5 : 6.9; catalysts pre-reduced at 500 oC (Ni) and 250 oC (Pd) b Organic carbon balance of the liquid products recovered in the cold trap (n-octanol, octanenitrile, amines)
Understanding the relative activity
In order to obtain a better understanding of the surface reactivity, DFT calculations of the
different possible paths were performed on the amination of methanol (MeOH), used here as a
model for octanol, while the surfaces were modeled by a periodic slab of the most stable facet
exposed on the particles, Ni(111) and Pd(111). We considered that only the alcohol
dehydrogenation and the imine hydrogenation steps are catalyzed by the metallic surface, the
ammonia condensation on the aldehyde being a rapid equilibrium.25 The corresponding Gibbs

Submitted to Catalysis Science & Technology
9
free energy profiles at T=180°C are shown in Figure 1. More details can be found in the
computational details on the evaluation of the Gibbs free energy from the electronic energy.
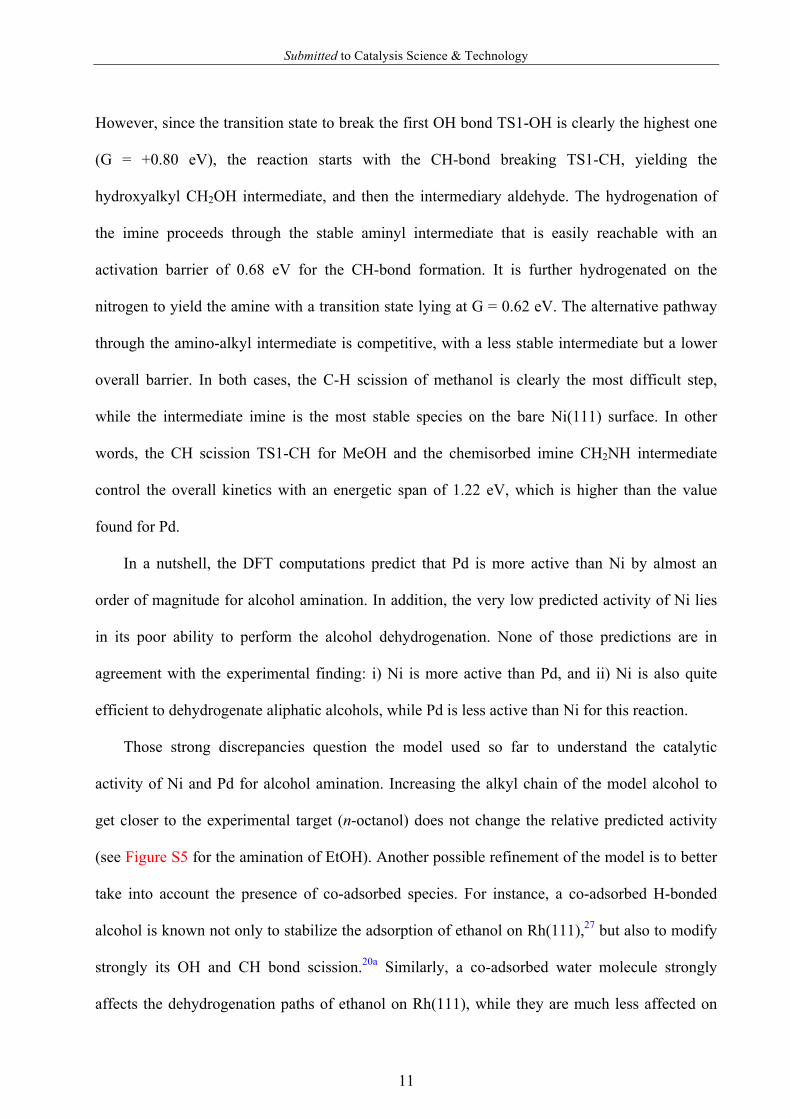
Figure 1. Computed Gibbs free energy profiles (in eV) at 180°C on Pd (top) and Ni (bottom) for
the amination of methanol with ammonia, following the H-borrowing mechanism: (i) alcohol
dehydrogenation (ii) C-N coupling in gas phase (iii) hydrogenation of the imine. The reference is
the bare metallic slab and the molecules in gas phase. The hydrogen atoms generated by the
dehydrogenation steps are kept adsorbed on a separated metallic slab. When adsorbed, the
molecular species are tagged with a “*”. The rate determining transition state and the rate
determining intermediate are shown in red. The corresponding energetic span is shown with a
vertical double arrow.
To start, MeOH adsorbs in a top position on both metals as it is commonly reported with an
adsorption energy of Eads ~ -0.55 eV.26 At the experimental temperature (180 °C), this energy
gain does not compensate the entropic loss, leading to a positive Gibbs free energy of adsorption
-0.59
0.09
-0.38
0.450.40
-0.14
-0.47
0.62
-0.13
MeNH2*CH2NH*-0.54
0.13
0.77
-0.43
0.80
0.15
Ni
0.35
0.62
-0.34 -0.16
0MeOH*
CH2O*
G (eV)
1.22
0.36
-0.63
0.38
0.21
-0.14
-0.49
0.76
-0.27
MeNH2*CH2NH*
-0.32
0.13
0.64
0.23
0.95
-0.13
Pd
0.630.43
-0.30 -0.30
0 MeOH*
CH2O*
G (eV)
-0.60
1.13
MeO
CH2OH MeNH
CH2NH2
NH3 H2OMeOH
CH2O CH2NH MeNH2
TS1-CH
TS1-OH
TS2-OH
TS2-CH
TS3-CHTS3-NH TS4-CH
TS4-NH
TS1-CH
TS1-OH
TS2-CH
TS2-OH
TS3-CH
TS3-NH
NH3 H2O
MeOH CH2O CH2NH
TS4-CHTS4-NH
MeNH2
CH2OH
MeOMeNH
CH2NH2

Submitted to Catalysis Science & Technology
10
(Gads = +0.13 eV). With its longer chain, the n-octanol used experimentally has higher adsorption
energy, compensating this loss in entropy.
Methanol dehydrogenation initially yields two possible surface species, either methoxy
(MeO) or hydroxymethylidene (CH2OH), and then formaldehyde (CH2O), through successive
CH and OH scissions. Hence, two paths are possible: (i) the alkyl path, starting with the CH-
bond breaking TS1-CH followed by the OH bond breaking TS2-OH (dashed line in the reaction
profiles), and (ii) the alkoxy path starting with the OH-bond breaking TS1-OH and followed by
the CH-bond breaking TS2-CH (solid line in the reaction profiles). The obtained aldehyde
undergoes a condensation with ammonia, producing the corresponding imine and a water
molecule. Then, imine hydrogenation can generate two intermediates: (1) the aminoalkyl
CH2NH2 obtained by the hydrogenation at the nitrogen through TS3-NH (dashed line in the
reaction profiles), and (2) the aminyl MeNH intermediate obtained by the hydrogenation at the
carbon (solid line in the reaction profiles). The barriers are in the range of 0.47 to 1.16 eV and
the transition states structures are in line with previous studies on the decomposition of methanol
and other alcohols,18 and on the hydrogenation of nitrile on Ni.22
On Pd, the methanol dehydrogenation clearly proceeds via the hydroxyalkyl intermediate
(CH2OH), while the hydrogenation of the imine goes through the aminoalkyl intermediate
(CH2NH2). Both intermediates are stabilized by the strong affinity of Pd for C. The TOF-limiting
TS corresponds to the first CH bond breaking, (G = +0.64 eV), while the most stable TOF-
limiting intermediate is the aminoalkyl (G = -0.63 eV). Together with a Gibbs free energy of
reaction predicted at -0.14eV, this leads to an energetic span of 1.13 eV for the amination
catalytic cycle.
On the more oxophilic Ni, the relative stabilities are strongly modified in comparison with
Pd. The methoxy and aminyl intermediates are more stable than the corresponding alkyl ones,
while the hydrogen atom is slightly less stabilized (-0.69 eV on Pd vs. -0.61 eV on Ni).
Submitted to Catalysis Science & Technology
11
However, since the transition state to break the first OH bond TS1-OH is clearly the highest one
(G = +0.80 eV), the reaction starts with the CH-bond breaking TS1-CH, yielding the
hydroxyalkyl CH2OH intermediate, and then the intermediary aldehyde. The hydrogenation of
the imine proceeds through the stable aminyl intermediate that is easily reachable with an
activation barrier of 0.68 eV for the CH-bond formation. It is further hydrogenated on the
nitrogen to yield the amine with a transition state lying at G = 0.62 eV. The alternative pathway
through the amino-alkyl intermediate is competitive, with a less stable intermediate but a lower
overall barrier. In both cases, the C-H scission of methanol is clearly the most difficult step,
while the intermediate imine is the most stable species on the bare Ni(111) surface. In other
words, the CH scission TS1-CH for MeOH and the chemisorbed imine CH2NH intermediate
control the overall kinetics with an energetic span of 1.22 eV, which is higher than the value
found for Pd.
In a nutshell, the DFT computations predict that Pd is more active than Ni by almost an
order of magnitude for alcohol amination. In addition, the very low predicted activity of Ni lies
in its poor ability to perform the alcohol dehydrogenation. None of those predictions are in
agreement with the experimental finding: i) Ni is more active than Pd, and ii) Ni is also quite
efficient to dehydrogenate aliphatic alcohols, while Pd is less active than Ni for this reaction.
Those strong discrepancies question the model used so far to understand the catalytic
activity of Ni and Pd for alcohol amination. Increasing the alkyl chain of the model alcohol to
get closer to the experimental target (n-octanol) does not change the relative predicted activity
(see Figure S5 for the amination of EtOH). Another possible refinement of the model is to better
take into account the presence of co-adsorbed species. For instance, a co-adsorbed H-bonded
alcohol is known not only to stabilize the adsorption of ethanol on Rh(111),27 but also to modify
strongly its OH and CH bond scission.20a Similarly, a co-adsorbed water molecule strongly
affects the dehydrogenation paths of ethanol on Rh(111), while they are much less affected on

Submitted to Catalysis Science & Technology
12
Pt(111).20c Finally, we have shown that the hydrogenation of a ketone is activated on oxophilic
metals such as Ni by the presence of a co-adsorbed H-bonded water.20d During the amination of
n-octanol, an excess of ammonia is introduced in the flow reactor. Since ammonia strongly
adsorbs on Ni and Pd (Eads ~ -0.9 eV), it should be present on the surface and this may affect the
predicted catalytic ability through H-bonding assistance. Based on an ab initio thermodynamic
analysis, the ammonia coverage is ~1/9 ML (Gads ~ -0.25 eV) under our working conditions
(PNH3 = 0.67 bar; T=180 °C, Figure S6). This coverage is the same for the two conditions we
tested experimentally (3 and 9 equiv with respect to n-octanol). Accordingly, we revisited the
reaction profiles starting from ammonia covered surfaces, considering now two situations: a)
NH3 and the reacting species are co-adsorbed, and b) chemisorption of the reactive species
induces a concomitant desorption of ammonia. The Gibbs free energy profiles at 180 °C that
correspond to the most stable situation for each step are shown in Figure 2. In this figure, the
steps were desorption of ammonia was required to reach a more stable transition state are
indicated in green.

Submitted to Catalysis Science & Technology
13
Figure 2. Computed Gibbs free energy profiles (in eV) at 180°C on NH3-Pd (top) and NH3-Ni
(bottom) for the amination of methanol by ammonia following the H-borrowing mechanism: (i)
alcohol dehydrogenation (ii) C-N coupling in gas phase (iii) hydrogenation of the imine. The
reference is the ammonia covered metallic slab (with a coverage of 1/9 ML) and the molecules in
gas phase. The hydrogen atoms generated by the dehydrogenation steps are kept adsorbed on a
separated ammonia covered metallic slab. When adsorbed, the molecular species are tagged with
a *. The possible desorption of ammonia upon co-adsorption of reactants or intermediates has
been considered and included when this leads to a more stable situation. The corresponding
states are shown in green. The rate determining transition state and the rate determining
intermediate are shown in red. The corresponding energetic span is shown with a vertical double
arrow.
Let us first focus on the dehydrogenation of the alcohol. The situation is rather similar on Ni
and Pd. Upon adsorption, the methanol molecule is physisorbed (not bound to the surface) and it
accepts an H-bond from the chemisorbed ammonia (Figure 3). Despite its large distance from the
metallic surface (the oxygen lies at least at 3 Å above the surface), its adsorption energy (~-0.7
eV) is slightly higher than in the absence of NH3 (~ -0.5 eV). This enthalpic gain
-0.36
0.32
-0.15
0.690.64
-0.14
-0.23
0.73
-0.14
MeNH2*
CH2NH*
-0.30
-0.07
0.75
-0.20
0.55
0.11
NH3-Ni
0.40
0.46
-0.35
-0.17
0
MeOH*
CH2O*
G (eV)
-0.32
0.05
-0.40
1.09
-0.36
0.63
-0.36
0.65
0.44
-0.14
-0.23
0.88
-0.26MeNH2*
CH2NH*
-0.05-0.13
0.71
0.10
0.74
-0.14
NH3-Pd
0.430.34
-0.46-0.29
0MeOH
CH2O
G (eV)
-0.04 -0.16
-0.63
1.28
-0.30MeOH*
MeO
CH2OH
MeNH
CH2NH2
MeOH
MeO
CH2OH
NH3 H2O
CH2O CH2NHMeNH2
TS1-OH
TS1-CH
TS2-CHTS2-OH
TS3-CH
TS3-NH TS4-CHTS4-NH
CH2NH2
MeNH
TS1-CHTS1-OH
TS2-OHTS2-CH
TS3-CH
TS3-NH
TS4-CH
TS4-NH
CH2O*
NH3H2O
MeNH2CH2NH

Submitted to Catalysis Science & Technology
14
counterbalances the entropy loss upon adsorption, even in the case of our small model MeOH.
Co-adsorption with NH3 stabilizes all intermediates and transition states during MeOH
dehydrogenation on both metals, but to a variable extent. The transition state for OH scission in
MeOH is the most stabilized intermediate (by ca. 0.5 eV), while the alkoxy intermediate, MeO,
is almost not affected on Ni. A closer inspection into the geometric modifications (Figure 3)
shows that this OH scission transition state appears earlier (structurally closer to the reactants) in
the presence of ammonia (the metal-O bond distance increases, the O-H distance decreases, all
by about 0.1 Å). This situation is analogous to the OH-scission pattern when assisted by H-
bonded neighbors.20 On the other hand, the MeO intermediate is strongly stabilized in a ternary
position in the absence of ammonia, whereas in the presence of ammonia the formation of a H-
bond is done at the expense of the loss of one or two metal-oxygen bonds. In the case of Pd, the
poor oxophilicity allows MeO to reach a top position and build a H-bond with co-adsorbed
ammonia (Figure 3). This is 0.26 eV more stable than a simple co-adsorption of MeO in fcc site
with ammonia on a top of a neighboring metallic site. In the case of Ni, the stronger oxophilicity
forbids MeO to leave the ternary site. The shift of MeO to reach a bridge position and then top
position leads to a loss of 0.05 eV and then of 0.13 eV in stability despite the gain of a strong H-
bond.

Submitted to Catalysis Science & Technology
15
Figure 3. MeOH adsorption, OH-breaking TS and MeO intermediate, in the absence and in the presence of NH3 on Pd (top) and Ni (bottom). The distances are in Å. Note, that the relative orientation of the metal slabs is not conserved in most cases. Instead, each metal slab has been oriented as to give the best graphical representation for every intermediate.
In a nutshell, the overall impact is minimal on Pd, but large on Ni, since the OH-scission in
MeOH becomes the most favorable first step. Alcohol dehydrogenation is facilitated by the
presence of chemisorbed ammonia, by the stabilization of the OH-scission TS1-OH combined
with an absence of over-stabilization of the corresponding methoxy intermediate on Ni. In
contrast, the stabilization of TS1-OH is not strong enough on Pd to compete with TS1-CH,
which is not affected by ammonia co-adsorption and thus, methanol dehydrogenation is not
strongly affected by ammonia co-adsorption on this metal. The impact of co-adsorbed ammonia
at coverage of 1/9ML is in line with the influence of co-adsorbed water on alcohol
dehydrogenation on Ni and Pd, but to a lesser extent.20
Turning now our attention to imine hydrogenation, the situation becomes more complex
since here the reactive species clearly competes with the chemisorbed ammonia. In most of the
elementary steps under consideration, ammonia desorption is more favorable than co-adsorption

Submitted to Catalysis Science & Technology
16
despite an associated cost of ΔGdesorption ~ 0.25eV. On Pd, the aminoalkyl intermediate (CH3NH)
is strongly destabilized by this competition with ammonia and is not any more the most stable
intermediate, but the hydrogenation of the imine still proceeds through the alkyl-amine pathway.
The rate determining intermediate becomes the adsorbed imine, which is remarkably strongly
stabilized by the co-adsorbed ammonia. On Ni, all surface intermediates involved in the
hydrogenation of the imine are destabilized up to 0.28 eV by ammonia chemisorption, favoring
ammonia desorption, and a similar behavior is observed for most of the transition states. The
only exception is the hydrogenation of the aminyl intermediate (MeNH). The spectator ammonia
assists N-H formation through H-bonding (NH3-N distance of 1.83Å), just like it facilitates O-H
scission in the first step. Even if the barrier is lowered by 0.12eV, the impact of this assistance on
the overall activity is limited since the hydrogenation of the imine still proceeds through the
alkyl-amine intermediate (CH2NH2).
In presence of co-adsorbed ammonia, the imine becomes the rate determining intermediate
on Ni and Pd. However, the presence of ammonia has a contrasted effect, with a great
stabilization of the imine on Pd (by 0.27eV) and a much weaker stabilization on Ni (by 0.04eV
only). A closer regard into the structures (Figure 4) together with an energy decomposition
analysis in terms of interaction energy (Eint) and deformation energy (Edef) allows us to
rationalize these differences (Table S4). On Pd, the imine is adsorbed in a di-sigma configuration
on the bare surface and it forms a H-bond with the neighboring NH3 molecule. The interaction of
the imine with the metal is strengthened by the presence of a H-bond (2.13 Å) yielding to a
stabilizing interaction with ammonia (Eint = -0.13 eV). It is reinforced by a stabilizing synergy
emerging from the three-body interaction (Eint = -0.14 eV), leading to a favorable co-adsorption
of NH3 and the imine on Pd. Turning now our attention to Ni, we observe that the imine adsorbs
on a hollow site, encompassing a much stronger metal/imine interaction than on Pd (Eint= -2.78
eV vs. -1.78eV) that is accompanied by a stronger deformation (Edef = 1.30 eV vs. 0.48 eV),

Submitted to Catalysis Science & Technology
17
forbidding any H-bond formation with the added ammonia. In absence of such a H-bond, the co-
adsorption is not synergistic anymore and is barely favored compared with desorption of
ammonia.
Figure 4. Imine adsorption in the absence and in the presence of NH3 on Pd and Ni. The
distances are in Å.
Finally, the inclusion of the ammonia pressure to assess the state of the catalytic surface
strongly influences the predicted relative activity and our understanding of the catalytic system.
The inclusion of the chemisorption of ammonia yields a decrease in the predicted activity of Pd,
with an energy span than shifts up from 1.13 eV to 1.28 eV. In absence of ammonia on the
surface, the catalytic cycle is controlled by the C-H scission in the alcohol and the stability of the
alkylamine intermediate. Upon the inclusion of the chemisorbed ammonia, some key
intermediates and transition states are destabilized. In some extreme cases, this destabilization
becomes so large that desorption of ammonia becomes more favorable. While the C-H scission
in the alcohol is only weakly affected, the amino-alkyl intermediate and the corresponding C-H
formation transition state are strongly pushed up. As a consequence, the TS4-CH becomes the
rate determining transition state and alkylamine is not the rate controlling intermediate anymore.
On the other hand, the imine is stabilized in presence of ammonia through a H-bond and thus
imine, co-adsorbed with ammonia, becomes the rate determining intermediate. In short, the
combination of the imine stabilization with the TS4-CH destabilization is detrimental to the
2.13
2.13
2.01 2.14 2.02 2.15
Pd
Ni
2.01
2.01
1.91 1.99
1.99 2.05
2.05 1.97

Submitted to Catalysis Science & Technology
18
activity of Pd. On the other hand, Ni is predicted being more active once the possible
chemisorption of ammonia is included. MeOH dehydrogenation is facilitated through H-bond
with NH3 and starts with the OH scission. As a consequence, the hydrogenation of the carbon of
the alkyl-amine intermediate (TS4-CH) takes over from the TS1-CH as the rate determining
transition state. None of the intermediates are over-stabilized by the ammonia co-adsorption;
actually, most are slightly destabilized. The imine, which is still the rate-determining
intermediate, is pushed up by DG = 0.19 eV. All in all, the energy span is lowered to 1.09 eV on
Ni once the chemisorption of ammonia is included.
In short, when using a pristine surface as a model, Pd was predicted being much more active
than Ni. With the inclusion of the potential chemisorption of ammonia, this trend is reversed in
reasonable agreement with the experimental results, where Ni (137 h-1) has been evidenced being
more active than Pd (23h-1). More importantly, this study demonstrates that the prediction of
relative activity calls for a careful inclusion of co-adsorbed species, even when they are not
considered as a partner in the surface reactions.
3. Conclusion
Through a combined experimental-computational approach, we provided insights into the
catalytic role of Ni and Pd for the amination of n-octanol by ammonia in the gas phase. The
catalytic results presented here confirm the higher activity of nickel with a TOF of 137 h-1, six
times faster than that of Pd (23 h-1). This multistep reaction starts with the alcohol
dehydrogenation. In absence of ammonia and hydrogen, n-octanol is converted into its
corresponding aldehyde but with a poor selectivity. However, the same trend in activity is
observed that in the case of the overall reaction: Ni is slightly more active than Pd (55 h-1 vs. 26
h-1).

Submitted to Catalysis Science & Technology
19
The role of ammonia on the surface reaction steps of (de)-hydrogenation was revealed
using periodic DFT computations. In absence of co-adsorbed species, the Gibbs energy profiles
yield a higher predicted activity for Pd than for Ni (calculated energetic span of 1.13 eV vs. 1.22
eV respectively), in contradiction with the experimentally observed relative activity. Under
reaction condition, ammonia is expected to reach a surface coverage of around 1/9 ML.
Ammonia is not directly participating in the (de)-hydrogenation steps. Nevertheless, accounting
for co-adsorption of ammonia significantly modifies the energy landscape: ammonia facilitates
OH-scission in the alcohol and hydrogenation of the aminyl intermediate. It also strongly
stabilizes the imine adsorption on Pd but not on Ni. This leads to a decrease of the overall energy
span on Ni (from 1.22 eV to 1.09 eV) and conversely to an increase of this energy span on Pd
(from 1.13 eV to 1.28 eV). The inclusion of NH3 co-adsorbates is hence crucial to understand the
dehydrogenation/hydrogenation activity of these metals in the amination reaction. The co-
adsorption of ammonia has a contrasted influence on the various reaction steps in the H-
borrowing mechanism. It stabilizes the first hydrogenation steps while it destabilizes the
intermediates of the hydrogenation steps. In addition, ammonia shows also a strong influence on
activation barriers, facilitating the OH scission and the NH formation by H-bonding. On Ni, the
easier OH scission and the easier hydrogenation of aminyl intermediate are key aspects to
understand the impact of the ‘spectator’ ammonia on the overall predicted activity. On Pd, the
main effect lies in the stabilization of the imine and the destabilization of the alkylamine and its
corresponding hydrogenation transition state.
This study demonstrates that the activity of metallic catalysts can be directly affected by
the spectator surface species present during the catalytic reaction, especially in the case of a
chemisorbed H-donor molecule that can strongly modify the OH and NH bond scission in
alcohol and amine.
Experimental and computational methods

Submitted to Catalysis Science & Technology
20
Materials
γ-Al2O3 (Sasol Puralox Sasol Scca-5/170, 154 m2/g) was used as support for catalyst
synthesis. Palladium (II) nitrate dihydrate Pd(NO3)2×2H2O (40% Pd) and nickel nitrate
hexahydrate Ni(NO3)2.6H2O (% Ni) were supplied by Sigma-Aldrich. N-octanol and ammonia,
both supplied by J&K (purity 99.5%), were used in the catalytic tests. N2 and H2 were both
supplied by Air Liquide (purity 99.99%). N-octylamine, N,N-dioctylamine, trioctylamine and
octanenitrile standards for GC calibration were all purchased from J&K (purity 99.5%). All
reactants were used without further purification.
Catalyst preparation
The different catalysts were prepared by incipient wetness impregnation (IWI) using an
aqueous solution of the metal precursor (Ni or Pd). In a typical preparation, a given amount of
the metal precursor (e.g., 0.787 g for 5wt.%Ni) was dissolved in 1.3 mL of distilled water. The
resulting solution was added dropwise into 2.94 g of Al2O3 at constant stirring rate (600 rpm).
The mixture was stirred for 2 h and dried in an oven at 120 °C overnight followed by calcination
under static air in a furnace at 400 oC for 2 h using a heating rate of 3 oC min-1. The catalysts
were pre-reduced at at 500 oC (Ni) and 250 oC (Pd) (the choice of tis temperature being based on
the H2-TPR profiles) under a 20% H2-Ar flow (100 mL(STP)/min) before the catalytic tests.
Catalyst characterization
The bulk metal (Ni or Pd) composition in the catalysts was analyzed by inductively
coupled plasma (ICP-AES) on a Perkin-Elmer Optical Emission Spectrometer (Optima 8000)
equipped with an autosampler. Before the analyses, the dried and ground sample (10 mg) was
dissolved in 1.5 mL of concentrated aqua regia and 250 µL of a HF solution (48%). The
solutions were heated to 50 oC and stirred for 24 h.

Submitted to Catalysis Science & Technology
21
The phases present in the different samples were analyzed by powsder X-ray diffraction
(PXRD), using a Rigaku D/Max-2200/PC diffractometer using Cu-Kα radiation (λ = 1.5418 Å)
and a beam voltage of 45 kV.
The morphology and structure of the catalysts was inspected by High-Resolution
Transmission Electron Microscopy (HR-TEM) on a JEOL JEM-2100F (200 kV) microscope
equipped with energy dispersive X-ray (EDX) analysis (semi-quantitative), using a Philips PV
9800 spectrometer operated using SuperQuant software. The particle size distributions were
measured by assuming that the metal particles were spherical in shape after correcting the
density between the oxide and metal phases. The average particle size (surface weighted, dp[3,2])
was estimated from the particle size distribution using the following expression
(1)
where dpi stands for the particle size and ni indicates the frequency.
The specific surface area was measured from N2 adsorption-desorption isotherms at 77 K
using a Micromeritics ASAP 2010 Surface Area Analyzer. The surface areas were calculated by
the Brunauer-Emmett-Teller (BET) method in the relative pressure range 0.05 < P/P0 < 0.25.
Prior to the measurements, the samples were degassed at 200 °C under vacuum (0.5 mbar)
during 15 h.
Temperature-programmed reduction (H2-TPR) and desorption (H2-TPD and CO-TPD)
measurements were conducted on a Micromeritics AutoChem II 2920 system equipped with a
thermal conductivity detector (TCD), a CryoCooler for sub-ambient (-50 °C) measurements, and
a cold trap before the detector. The H2-TPR profiles were measured using a heating rate of 10
oC/min under a 10% H2/Ar flow (40 mL (STP)/min). The H2-TPD profiles were measured by
reducing first the samples at a given temperature (200 °C for Pd) under 10%H2-Ar flow (40
mL(STP)/min) followed by evacuation in the temperature range from -50 oC to 40 oC under Ar
dp 3,2!" #$=Σ1ndp,i3 niΣ1ndp,i2 ni

Submitted to Catalysis Science & Technology
22
flow (20 mL(STP)/min) using a 10 oC/min heating ramp. The CO-TPD profiles were measured
on the pre-reduced catalysts (580 oC for Ni) by adsorbing first CO at 40 oC under a 3% CO-He
flow (40 mL(STP).min-1) for 20 min followed by evacuation in the temperature range 50-600 oC
under He (40 mL(STP)/min) using a 10 oC/min heating ramp.
Catalytic tests
The catalytic activity of the different metals was investigated in the gas-phase amination
reaction between n-octanol and ammonia. The catalytic tests were conducted in a continuous
fixed-bed reactor equipped with a mixer head, a distribution unit and a stainless steel tube (i.d. 4
mm) filled with quartz sand from the bottom up to the reaction zone, where the catalyst was
loaded in powder form. Above the catalyst, a SiC bed ensured good mixing of the feed reagents
and a high thermal conductivity. The flowrate of the inlet reagents (n-octanol, ammonia,
hydrogen, nitrogen) was adjusted using mass flow controllers (Seven Star), whereas the
temperature in the three zones of the system was regulated using PID controllers (Yashentech,
±1 oC). N-octanol and a gas mixture consisting of ammonia, hydrogen and carrier nitrogen were
fed separately in the preheater at 250 oC. The vaporized n-octanol and the gas feed were then
mixed at the head of the reactor and submitted to the catalytic zone. After stabilization during 1 h,
liquid samples were recovered every hour in a cold trap kept at 0 oC and analyzed using an
Agilent 7890 GC equipped with a HP-5 capillary column with 5 wt.% phenyl groups (0.32 mm;
length, 30 m; thickness, 0.25 µm) using biphenyl as internal standard. The column was
temperature-programmed with a 3 ºC.min-1 initial ramp from 80 ºC to 100 ºC, followed by a 50
ºC·min-1 ramp to 300 ºC and held at this temperature for 3 min. Mass balances were accurate to
within 5% in all the amination tests, whereas non-quantified volatile side products (mainly
octane, octane, heptane and heptene)and/or coke were also generated in the dehydrogenation
reactions. Blank tests confirmed the absence of reaction without catalyst.

Submitted to Catalysis Science & Technology
23
The amination reaction was carried out at 180 oC using a n-octanol flowrate of 1.6 mL/h,
corresponding to a weight-hourly-space velocity (WHSV) of 155 h-1 relative to the metal weight
(8.5 mg). The H2/octanol and NH3/octanol molar ratios were varied from 0 to 2.5 eq and from 0
to 9 eq with respect to n-octanol, respectively. Nitrogen was used as inert carrier to keep the total
volumetric flow constant. All the experiments were carried out at atmospheric pressure (101
kPa). For the sake of comparison, a series of n-octanol dehydrogenation tests were also carried
out at the very same reaction conditions both in the presence and absence of hydrogen, but
removing ammonia from the inlet gas stream.
The n-octanol conversion and yield to the N-containing products were defined as follows:
0O
O
ww1conversionoltanOc =
(2)
i
o0o
ii wwYield =
(3)
where µi refers to the respective stoichiometric factors, wo0 and wo refer to the inlet and steady
state molar flowrates of n-octanol, respectively, whereas wi refers to the molar flowrate of N-
containing products (i = N-octylamine, N,N-dioctylamine and octanenitrile).
The turnover frequency with respect to n-octanol conversion and of products (TOFX and TOFY,
respectively) was computed as follows
(4)
(5)
where i = N-octylamine, N,N-dioctylamine and octanenitrile, F is the total molar flowrate, rG is
the molar density of the gas stream, nM is the molar number of metal atoms and refers to the
metal dispersion.
Measurement of metal particle sizes
TOFX =1−wC8−OHnM DM
=FρG XC8−OHnM DM
TOFYi =1−wi
nM DM=FρG YinM DM
DM

Submitted to Catalysis Science & Technology
24
The mean size of the Ni and Pd nanoparticles ( ) was directly estimated from the metal
dispersion using the following expression by assuming a spherical shape
d p = 6 VM
nM NA DM σG
(6)
where sG is the cross section of the adsorbing gas, is the molar volume of the metal
nanoparticles and NA is the Avogadro number, nM is the molar number of metal atoms and
refers to the metal dispersion.
Computational Details
The Density Functional Theory (DFT)28 calculations were performed using the Vienna Ab Initio
Simulation Program (VASP).29 The exchange-correlation energies and potentials were calculated
within the generalized gradient approximation, using the Perdew Burke and Ernzerhof (PBE)
functional.30 The Projector Augmented Wave method (PAW) was used to describe electron-ion
interactions.31 The dDsC approach was used to describe the van der Waals interactions.32 The
plane-wave expansion was cut-off at 400 eV. For Ni, the calculations were spin-polarized. The
metallic (111) surfaces were modeled by p(3x3) supercells built on four-layers slabs, separated
by a vacuum of 10 Å. A Monkhorst-Pack mesh of 5x5x1 K-points was used for the 3D Brillouin
zone integration.33 The energy was corrected for the dipolar contribution in the z direction.
The adsorption and reaction processes were carried out on the upper layer of the slab. The top
two layers of the surfaces were also relaxed during the simulations while the bottom two layers
were kept fixed at bulk positions (interatomic distance of 2.779 Å for Pd, and 2.475 Å for Ni).
The geometries were considered as minima or transition states when the forces were smaller than
0.02 eV/Å. Transitions States (TS) were obtained using a combination of our local reaction path
generator, Opt’n Path,34 with the Nudge Elastic Band,35 and Dimer methods.36 The nature of the
TS was confirmed by the presence of a single imaginary frequency corresponding to the reaction
coordinate. The translational and rotational entropy were included and evaluated in the
dp
VM
DM

Submitted to Catalysis Science & Technology
25
approximation of perfect gas, whereas the vibrational entropy includes the contribution of the
organic part only. The Gibbs free energy was evaluated with the following ratios NH3 : H2 : N2 :
MeOH = 9 : 2.5 : 0.9 : 1 at a total pressure of 1 bar and a temperature of 180°C. To assess the
coverage in ammonia at this working pressure and temperature in ammonia, we compared the
Gibbs Free energy of adsorption of increasing coverage from 1/16 monolayer to 1/3 monolayer.
For this ab initio thermodynamics study, we used a denser K-Points mesh, in order to have an iso
kpoint-density for each coverage (21x21x1 for a p(2x2) cell). The energy span of a given
reaction was predicted using the theory proposed by Kozuch and co-workers for catalytic
reaction networks.37 The energetic span δG is given by δG = GRDTS –GRDI if the rate determining
transition state (RDTS) appears after the rate determining intermediate (RDI) in the reaction
profile ; δG = GRDTS –GRDI + ΔGr, if the rate determining transition state (RDTS) appears before
the rate determining intermediate (RDI) in the reaction profile; ΔGr is the Gibbs energy of
reaction of the catalyzed reaction.
Conflicts of interest
There are no conflicts of interest to declare
Acknowledgements
This work was granted access to the HPC resources of CINES and IDRIS under the allocation
2014-080609 made by GENCI. It also benefited from the computational resources of the PSMN.
Financial support was provided by the ANR grant SHAPes (13-CDII-0004-06) and by the CNRS
and Solvay through a BDI support.
References
1 H. A. Wittcoff, B. G. Reuben, J. S. Plotkin, Industrial Organic Chemicals, 2nd ed., Wiley, NY, 2004. 2 a) P. Roose, K. Eller, E. Henkes, R. Rossbacher, H. Höke, 2015. Amines, Aliphatic. Ullmann's
Encyclopedia of Industrial Chemistry. 1-55 b) S. A. Lawrence, Amines: Synthesis, Properties and

Submitted to Catalysis Science & Technology
26
Applications, Cambridge University Press, 2004; c) Z. Appoport, The Chemistry of Anilines, John Wiley & Sons Ltd, 2007.
3 M. Pera-Titus, F. Shi, ChemSusChem. 2014, 7, 1-4. 4 a) Fluzard, Bo, Huzard, Internal Rhodia Report No. 2174, 1954; b) G. Rice, E. J. Koh, J. Org. Chem.
1955, 77, 4052-4054; c) G. Bo, Ph. Perras, Internal Rhodia Report No. 2932, 1958; d) A. Mehta, A. Thaker, V. Londhe, S. R. Nandan, Appl. Catal. A: Gen. 2014, 478, 241-251.
5 a) G. A. Vedage, L. A. Emig, H-X. Li, J. N. Armor, US 5,917,092, 1998; b) G. A. Vedage, K. S. Hayes, M. Leeaphon, J. N. Armor, US 5,932,769, 1998; c) K-I. Shimizu, K. Kon, W. Onodera, H. Yamazaki, J. N. Kondo, ACS Catal. 2013, 3, 112-117; d) K-I. Shimizu, K. Kon, W. Onodera, H. Yamazaki, J. N. Kondo, ACS Catal. 2013, 3, 998-1005; e) K-I. Shimizu, S. Kanno, K. Kon, S. M. A. H. Siddiki, H. Tanaka, Y. Sakata, Catal. Today 2014, 232, 134-138; f) K-I. Shimizu, Catal. Sci. Technol. 2015, 5, 1412-1427.
6 a) A. Baiker, W. Richarz, Chem. Prod. Res. Dev. 1977, 16, 261-266; b) R. C. Lemon, S. Depot, R. C. Myerly, US 3,022,349, 1982; c) J. He, K. Yamaguchi, N. Mizuno, Chem. Lett. 2010, 39, 1182-1183; d) M. Dixit, M. Mishra, P. A. Joshi, D. Shah, Catal. Commun. 2013, 33, 80-83; e) F. Santoro, R. Psaro, N. Ravasio, F. Zaccheria, ChemCatChem. 2012, 4, 1249-1254; RSC Adv. 2014, 4, 2596-2600.
7 a) A. Baiker, J. Kijenski, Catal. Rev. Sci. Eng. 1985, 27, 653-697; b) H. Kimura, H. Taniguchi, Appl. Catal. A: Gen. 2005, 287, 191-196; c) Y. Li, Q. Li, L. Zhi, M. Zhang, Catal. Lett. 2011, 141, 1635-1642; d) J. Sun, X. Jin, F. W. Zhang, W. Hu, J. Liu, R. Li, Catal. Commun. 2012, 24, 30-33.
8 X. Cui, Y. Dai, Y. Q. Deng, F. Shi, Chem. Eur. J. 2013, 19, 3665-3675. 9 Q. Li, G. Zhang, S. Peng, J. Surf. Detergents 2002, 5, 229-233. 10 P. R. Likhar, R. Arundhathi, M. L. Kantam, P. S. Prathima, Eur. J. Org. Chem. 2009, 5383-5389. 11 K-I. Shimizu, K, Shimura, M. Nishimura, A. Satsuma, RSC Adv. 2011, 1, 1310-1317. 12 GB 1180972A, 1970. 13 a) G. Sewell, C. O’Connor, E. van Steen, Appl. Catal. A: Gen. 1995, 125, 99-112; b) A. Fischer, T.
Mallat, A. Baiker, J. Catal. 1999, 182, 289-291; c) G. Jenzer, T. Mallat, A. Baiker, Catal. Lett. 1999, 61, 111-114; c) P. Kubanek, B. W. Schwab, J-P. Melder, H. Evers, T. Gerlach, US 0,286,977, 2009; d); e) J. H. Cho, J. H. Park, T. S. Chang, G. Seo, C. H. Shin, Appl. Catal. A: Gen. 2012, 417-418, 313-319.
14 a) K. Yamaguchi, J. He, T. Oishi, N. Mizuno, Chem. Eur. J. 2010, 16, 7199-7207; b) D. Ruiz, A. Aho, T. Saloranta, K. Eränen, J. Wärnå, R. Leino, D.Y. Murzin, Chem. Eng. J. 2017, 307, 739-749.
15 a) G. Guillena, D. J. Ramón, M. Yus, Chem. Rev. 2009, 110, 1611-1641; b) T. D. Nixon, M. K. Whittlesey, J. M. J. Williams, Dalton Trans. 2009, 5, 753-762; c) G. E. Dobereiner, R. H. Crabtree, Chem. Rev. 2010, 110, 681-703; d) S. Bähn, S. Imm, L. Neubert, M. Zhang, H. Neumann, M. Beller, ChemCatChem. 2011, 3, 1853-1864; e) J. L. Klinkenberg, J. F. Hartwig, Angew. Chem. Int. Ed. 2011, 50, 86-95; f) C. Gunanathan, D. Milstein, Science 2013, 341, 1229712; g) Q. Yang, Q. Wang, Z. Yu, Chem. Soc. Rev. 2015, 44, 2305-2329.
16 V. A. Bassili, A. Baiker, Appl. Catal. 1991, 70, 325-338. 17 H. Cheng, J.W. Mitchell, K.S. Hayes, M. Neurock, C. Smead, Q. Ma, K. Klier, Nato Science Series II,
2002, 68, 385-403. 18 a) J. Greeley, M. Mavrikakis J. Am. Chem. Soc. 2002, 124, 7193-7201; b) D. Cao, G.-Q. Lu, A.
Wieckowski, S. A. Wasileski, M. Neurock J. Phys. Chem. B 2005, 109, 11622-11633; c) G.-C. Wang, Y.-H. Zhou, Y. Morikawa, J. Nakamura, Z.-S. Cai, X.-Z. Zhao, J. Phys. Chem. B, 2005, 109, 12431-12442; d) H.-F. Wang, Z.-P. Liu J. Am. Chem. Soc., 2008, 130, 10996-11004; e) J.-H. Wang, C. S. Lee, M. C. Lin, J. Phys. Chem. C, 2009, 113, 6681-6688; f) M. Li, W. Guo, R. Jiang, L. Zhao, H. Shan Langmuir, 2010, 26, 1879-1888; g) M. Li, W. Guo, R. Jiang, L. Zhao, X. Lu, H. Zhu, D. Fu, H. Shan J. Phys. Chem. C, 2010, 114, 21493-21503; h) B. Liu, J. Greeley J. Phys. Chem. C, 2011, 115, 19702-19709; i) F. Auneau, C. Michel, F. Delbecq, C. Pinel, P. Sautet, Chem. Eur. J., 2011, 17, 14288-14299; j) S. Lin, J. Y. Ma, L. S. Zhou, C. J. Huang, D. Q. Xie, H. Guo, J. Phys. Chem. C, 2013, 117, 451-459; k) Z. C. Kramer, X. Gu, D. D. Y. Zhou, W. Li, R. T. Skodje, J. Phys. Chem. C, 2014, 118,

Submitted to Catalysis Science & Technology
27
12364-12383; l) R. Garcia-Muelas, Q. Li, N. Lopez, ACS Catalysis, 2015, 5, 1027-1036; m) J. Zaffran, C. Michel, F. Delbecq, P. Sautet, J. Phys. Chem. C, 2015, 119, 12988-12998.
19 a) P. Maki-Arvela, J. Hajek, T. Salmi, D. Yu. Murzin, Appl. Catal. A: General, 2005, 1-49; b) C. D. Taylor and M. Neurock, Curr. Opin. Solid State Mater. Sci., 2005, 9, 49-65; c) B. S. Akpa, C. D’Agostino, L. F. Gladden, K. Hindle, H. Manyar, J. McGregor, R. Li, M. Neurock, N. Sinha, E. H. Stitt, D. Weber, J. A. Zeitler, D. W. Rooney, J. Catal., 2012, 289, 30-41.; d) N. K. Sinh, M. Neurock, J. Catal., 2012, 295, 31-44 ; e) Letchworth-Weaver, T. A. Arias, R. G. Hennig, J. Chem. Phys., 2014, 140, 084106.
20 a) C. Michel, F. Auneau, F. Delbecq, P. Sautet. ACS Catal., 2011, 1, 1430-1440; b) C. Michel, F. Göltl, P. Sautet, Phys. Chem. Chem. Phys., 2012,14, 15286-15290; c) D. Loffreda, C. Michel, F. Delbecq, P. Sautet, J. Catal., 2013, 308, 374-385; d) C. Michel, J. Zaffran, A. M. Ruppert, J. Matras-Michalska, M. Jędrzejczyk, J.Grams, P. Sautet, Chem. Commun., 2014, 50, 12450-12453; e) J. Zaffran, C. Michel, F. Delbecq, P. Sautet, Catal. Sci. Technol., 2016, 6, 6615-6624.
21 C. Lv, J. Li, K. Ling, Z. Shang, G. Wang, Surf. Sci., 2010, 604, 779-787. 22 C. Oliva, C.van den Berg, J.W. Nietmantsverdriet, D. Curulla-Ferré, J. Catal, 2007, 245, 436-445. 23 J. Liu, C. Lv, Y. Guo, G.Wang, Appl. Surf. Sci., 2013, 271, 291-308. 24 J. T. Scanlon, D. E. Willis, J. Chromatogr. Sci. 1985, 23, 333-340. 25 a) Y. Ogata, A. Kawasaki, Tetrahedron, 1964, 855-860; Tetrahedron, 1964, 1573-1578; b) M.
Tamura, K. Tomishige, Angew. Chem. Int. Ed, 2015, 54, 864-867; c) D. Ruiz, A. Aho, T. Saloranta, K. Eränen, J. Wärnå, R. Leino, D. Y. Murzin, Chem Eng J., 2017, 307, 739-749.
26 J. Greeley, M. Mavrikakis, J. Am. Chem. Soc., 2002, 124, 7193-7201. 27 a) M. Yang, X. Bao, W. Li, J. Phys. Chem. C, 2007, 111, 7403-7410. 28 a) P. Hohenberg, W. Kohn, Phys. Rev., 1964, 136, B864- B871; b) W. Kohn, L. J. Sham, Phys. Rev.,
1965, 140, A1133- A1138 29 G. Kresse, J. Furthmüller, Phys. Rev. B, 1996, 54, 11169-11186. 30 J. P. Perdew, Y. Wang, Phys. Rev. B, 1992, 45, 13244-13249. 31 a) P. E. Blöchl, Phys. Rev. B, 1994, 50, 17953-17979; b) G. Kresse, J. Joubert, Phys. Rev. B, 1999, 59,
1758-1775 32 a) S. N. Steinmann, C. Corminboeuf, J. Chem. Phys., 2011, 134; b) S. N. Steinmann, C. Corminboeuf,
J. Chem. Theory Comput., 2011, 7, 3567-3577. 33 D. J. Chadi, M. L. Cohen, Phys. Rev. B, 1973, 8, 5747 34 Available upon request at http://perso.ens-lyon.fr/paul.fleurat-lessard/ReactionPath.html 35 G. Henkelman, H. Jonsson, J. Chem. Phys., 2000, 113, 9901-9904 36 G. Henkelman, H. Jonsson J. Chem. Phys., 1999, 111, 7010-7022 37 S. Kozuch, J. M. L. Martin, ChemPhysChem., 2011, 12, 1413-1418.