Direct force measurements between carboxylate-modified latex microspheres and glass using atomic...
8
UNCORRECTED PROOF COLSUA 13741 1–8 Colloids and Surfaces A: Physicochem. Eng. Aspects xxx (2006) xxx–xxx Direct force measurements between carboxylate-modified latex microspheres and glass using atomic force microscopy 3 4 Shoeleh Assemi a,∗ , Jakub Nalaskowski b , William Paul Johnson a 5 a Department of Geology and Geophysics, USA 6 b Department of Metallurgical Engineering, University of Utah, Salt Lake City, Utah, USA 7 Received 14 May 2005; received in revised form 24 February 2006; accepted 7 March 2006 8 Abstract 9 Depths of colloid-surface interaction energy minima have been sometimes utilized for estimation of the force holding a colloid to the surface upon contact. Since this approach assumes that non-contact forces prevail following attachment, a comparison of this approach to direct measurement via atomic force microscopy is warranted. Interaction and adhesion forces between 1.0-m diameter carboxylate-modified polystyrene latex microspheres and a glass surface were measured directly with an atomic force microscope using the colloidal probe technique. Measurements were conducted as a function of ionic strength in NaCl with and without added MOPS (3-(N-morpholino)-propanesulfonic acid) buffer, at pH 6.8–6.9. Theoretical DLVO force curves were fit to the AFM approach curves by varying the surface potential of the microspheres. The depths of the primary minima of the theoretical DLVO curves fitted to AFM approach curves, were used to estimate adhesion forces according to previously published approaches, and were compared to the pull-off forces measured by AFM. Pull-off forces measured by AFM in both electrolytes were consistently a factor of about 20–30 lower than the pull-off forces estimated from theoretical adhesion forces obtained from DLVO curves. AFM- measured pull-off forces decreased with increasing the ionic strength in both electrolytes, whereas the adhesion forces calculated from DLVO showed either no change or a slight increase with increasing the ionic strength. Possible reasons for these discrepancies include roughness on one or both surfaces, which would presumably reduce the adhesion force via reduced contact area and presence of hydration forces that could reduce adhesion via strong short-range repulsion in the neighborhood of the contact points. These observations demonstrate that DLVO-based approach for determining adhesion force overestimates actual adhesion force, likely because a DLVO-based approach neglects interactions that manifest at very close separation distances and upon contact. 10 11 12 13 14 15 16 17 18 19 20 21 22 23 24 © 2006 Elsevier B.V. All rights reserved. 25 Keywords: Interaction energy; Adhesion; DLVO; Glass; Carboxylate-modified latex; Atomic force microscopy 26 27 1. Introduction 1 Researchers investigating colloidal transport in environmen- 2 tal contexts are typically concerned with colloid deposition 3 under electrostatically unfavorable conditions, where the inter- 4 action of like charges results in a repulsive energy barrier. Their 5 results are often interpreted based on estimated forces between 6 colloids and porous media surfaces developed using Derjaguin- 7 Landau-Verwey-Overbeek (DLVO) theory and measured sur- 8 face properties. However, under electrostatically unfavorable 9 conditions, DLVO theory can be a rather coarse tool from which 10 to interpret results. For example, attachment is often observed 11 ∗ Corresponding author. Tel.: +1 801 585 1553. E-mail address: [email protected] (S. Assemi). even when DLVO analysis yields a significant barrier (even up 12 to 1000s of kT) [1–3]. 13 DLVO theory predicts the total interaction energy or force as 14 a function of the separation distance between two charged sur- 15 faces. At close separation distances (within a few nm), van der 16 Waals attraction exceeds electric double layer repulsion, result- 17 ing in net attraction. The finite depth of the attractive well at very 18 close distances to the surface (primary minimum), is the result 19 of the addition of Born repulsion to the DLVO potential energy 20 curves [4]. Theoretical expressions to estimate adhesion forces 21 between ideal smooth systems are usually based on measured 22 interfacial properties (e.g. surface free energies) rather than pre- 23 dictions of non-contact interaction energies using DLVO theory 24 [5–8]. In colloid transport studies the depth of the primary energy 25 minimum or the van der Waals forces at very close separation 26 are often used to estimate the magnitude of the adhesion force. 27 1 0927-7757/$ – see front matter © 2006 Elsevier B.V. All rights reserved. 2 doi:10.1016/j.colsurfa.2006.03.024
Transcript of Direct force measurements between carboxylate-modified latex microspheres and glass using atomic...

RO
OF
Colloids and Surfaces A: Physicochem. Eng. Aspects xxx (2006) xxx–xxx
Direct force measurements between carboxylate-modified latexmicrospheres and glass using atomic force microscopy
3
4
Shoeleh Assemi a,∗, Jakub Nalaskowski b, William Paul Johnson a5
a Department of Geology and Geophysics, USA6b Department of Metallurgical Engineering, University of Utah, Salt Lake City, Utah, USA7
Received 14 May 2005; received in revised form 24 February 2006; accepted 7 March 2006
8
Abstract9
Depths of colloid-surface interaction energy minima have been sometimes utilized for estimation of the force holding a colloid to the surface uponcontact. Since this approach assumes that non-contact forces prevail following attachment, a comparison of this approach to direct measurementvia atomic force microscopy is warranted. Interaction and adhesion forces between 1.0-�m diameter carboxylate-modified polystyrene latexmicrospheres and a glass surface were measured directly with an atomic force microscope using the colloidal probe technique. Measurementsw6tpcmsoafv
10
11
12
13
14
15
16
17
18
19
20
21
22
23
24
©25
K26
27
11
2
t3
u4
a5
r6
c7
L8
f9
c10
t11
12
13
14
15
16
17
18
19
20
21
22
23
24
25
26
27
1 02 d
UN
CO
RR
EC
TED
P
COLSUA 13741 1–8
ere conducted as a function of ionic strength in NaCl with and without added MOPS (3-(N-morpholino)-propanesulfonic acid) buffer, at pH.8–6.9. Theoretical DLVO force curves were fit to the AFM approach curves by varying the surface potential of the microspheres. The depths ofhe primary minima of the theoretical DLVO curves fitted to AFM approach curves, were used to estimate adhesion forces according to previouslyublished approaches, and were compared to the pull-off forces measured by AFM. Pull-off forces measured by AFM in both electrolytes wereonsistently a factor of about 20–30 lower than the pull-off forces estimated from theoretical adhesion forces obtained from DLVO curves. AFM-easured pull-off forces decreased with increasing the ionic strength in both electrolytes, whereas the adhesion forces calculated from DLVO
howed either no change or a slight increase with increasing the ionic strength. Possible reasons for these discrepancies include roughness on oner both surfaces, which would presumably reduce the adhesion force via reduced contact area and presence of hydration forces that could reducedhesion via strong short-range repulsion in the neighborhood of the contact points. These observations demonstrate that DLVO-based approachor determining adhesion force overestimates actual adhesion force, likely because a DLVO-based approach neglects interactions that manifest atery close separation distances and upon contact.
2006 Elsevier B.V. All rights reserved.
eywords: Interaction energy; Adhesion; DLVO; Glass; Carboxylate-modified latex; Atomic force microscopy
. Introduction
Researchers investigating colloidal transport in environmen-al contexts are typically concerned with colloid depositionnder electrostatically unfavorable conditions, where the inter-ction of like charges results in a repulsive energy barrier. Theiresults are often interpreted based on estimated forces betweenolloids and porous media surfaces developed using Derjaguin-andau-Verwey-Overbeek (DLVO) theory and measured sur-
ace properties. However, under electrostatically unfavorableonditions, DLVO theory can be a rather coarse tool from whicho interpret results. For example, attachment is often observed
∗ Corresponding author. Tel.: +1 801 585 1553.E-mail address: [email protected] (S. Assemi).
even when DLVO analysis yields a significant barrier (even upto 1000s of kT) [1–3].
DLVO theory predicts the total interaction energy or force asa function of the separation distance between two charged sur-faces. At close separation distances (within a few nm), van derWaals attraction exceeds electric double layer repulsion, result-ing in net attraction. The finite depth of the attractive well at veryclose distances to the surface (primary minimum), is the resultof the addition of Born repulsion to the DLVO potential energycurves [4]. Theoretical expressions to estimate adhesion forcesbetween ideal smooth systems are usually based on measuredinterfacial properties (e.g. surface free energies) rather than pre-dictions of non-contact interaction energies using DLVO theory[5–8]. In colloid transport studies the depth of the primary energyminimum or the van der Waals forces at very close separationare often used to estimate the magnitude of the adhesion force.
927-7757/$ – see front matter © 2006 Elsevier B.V. All rights reserved.oi:10.1016/j.colsurfa.2006.03.024

ED
PR
OO
F
2 S. Assemi et al. / Colloids and Surfaces A: Physicochem. Eng. Aspects xxx (2006) xxx–xxx
For example, in their examination of colloid detachment driven28
by hydrodynamic drag, a balance of torques on attached colloids29
was performed by Bergendahl and Grasso [9]. The torque resist-30
ing detachment was estimated from the normal force holding the31
colloid to the surface and the effective lever arm resisting detach-32
ment, which was represented by the radius of contact between the33
colloid and the collector. The normal force required to mobilize34
an attached colloid of radius (R) was estimated using the Der-35
jaguin approximation, which relates the interaction force (F) of36
two spheres at close separation distance (l) to the interaction37
energy per unit area (W) [10]:38
F (�) = 2πRW (l � R) (1)39
where F(l) s the interaction force at close separation distance40
The interaction energy per unit area was calculated using the41
depth of the primary energy minimum (�Gmin):42
W = �Gmin
Aeff(2)43
where the Langbein approximation defines the effective interac-44
tion area between a sphere and a flat surface (Aeff) as the circular45
zone centered at a distance l from the surface [10]:46
Aeff = 2πR� (l � R) (3)47
Abu-Lail and Camesano [11] used the calculated van der Waals48
a49
a50
m51
m52
h53
t54
55
b56
t57
B58
v59
l60
n61
o62
w63
t64
e65
66
r67
t68
h69
m70
u71
s72
a73
t74
A75
r76
r77
f78
t79
ties between those of the liquid media and the substrate, showed 80
that surface roughness could reduce the depth of the primary 81
energy minimum by orders of magnitude. 82
These models require parameters such as height, radius and 83
number density of the asperities (e.g. via atomic force or electron 84
microscopy) and assignment of an idealized shape (cone, hemi- 85
sphere, fractal, pit). For natural samples with wide distributions 86
of asperity height and size (and almost always on both surfaces) it 87
is difficult to assign such parameters with one image. The extent 88
of the agreement of data with theory can also be affected by the 89
methods used for calculation of van der Waals and electrostatic 90
interactions and approximations used to apply these calculations 91
to the geometry of interacting surfaces, which makes choosing 92
the right model even more difficult. Parameters such as defor- 93
mation, charge heterogeneity and forces at very short distance 94
(e.g. hydration forces) have not been taken into account. There- 95
fore, implementation of these models to estimate the depth of 96
the primary energy minimum is not straightforward. A review 97
of different mathematical approaches to calculate the effect of 98
roughness on van der Waals and electrostatic interactions can be 99
found in Sun and Walz [17]. 100
Contact mechanics studies [20–23] show that surface rough- 101
ness can alter adhesion, based on the shape of the roughness 102
(point, pit, ridge) and whether the particle is positioned on mul- 103
tiple asperities or resting against an asperity that acts as a lever 104
arm, yielding an increased or decreased contact area [24]. 105
106
t 107
m 108
i 109
p 110
e 111
f 112
a 113
t 114
s 115
2 116
2 117
118
t 119
w 120
T 121
a 122
2 123
u 124
2 125
126
N 127
H 128
o 129
1 130
w 131
UN
CO
RR
EC
T
ttractive force at 0.3 nm separation distance to represent thedhesive force. Finally, approaches that relate colloid detach-ent kinetics to the combined height of the primary energyinimum and the energy barrier [2] implicitly assume that forces
olding colloids to the surface (adhesion forces) are equivalento the interaction forces represented by DLVO theory.
The depth of the energy minimum can be significantly alteredy uncertainties in constants used in calculations at close dis-ances such as the Hamaker constant or the collision diameter inorn repulsion. Furthermore, different models (constant chargeersus constant potential) used to calculate the electric doubleayer component of DLVO potential energy curves can yield sig-ificantly different energy minima [12]. As well, the presencef various less-well-constrained non-DLVO forces that operateithin the first few nanometers of the surface, such as hydra-
ion or steric forces [13,14], can affect the depth of the primarynergy minimum.
Surface roughness is also an important parameter that caneduce the van der Waals interaction between two surfaces andhus the depth of the primary energy minimum. Several modelsave been proposed to incorporate surface roughness into esti-ations for van der Waals and electric double layer interactions
sing parameters such as asperity size, shape, and density on theurface [15–17]. Suresh and Waltz [18] found that at large sep-rations, the depth of the secondary minimum was reduced byhe increased electrostatic repulsion produced by the roughness.t closer separations the height of the energy barrier could be
educed significantly by the increased van der Waals attraction,esulting in much larger attraction than predicted for smooth sur-aces by DLVO. Calculations by Dagastine et al. [19], assuminghe roughness as a diffuse layer with varying dielectric proper-
COLSUA 13741 1–8
The advent of atomic force microscopy provides the oppor-unity to directly measure forces between two surfaces in the
edium of choice [25]. In this paper, we report AFM-measurednteraction and adhesion forces between carboxylate-modifiedolystyrene latex microspheres and glass in water at variouslectrolyte concentrations. We compare measured non-contactorces to those expected from DLVO theory and the measureddhesion forces to those estimated using the calculated depth ofhe primary energy minimum and van der Waals forces at closeeparation distance.
. Materials and methods
.1. Latex microspheres
Carboxylate-modified polystyrene latex microspheres (func-ionalized during polymerization) with a diameter of 1.0 �mere purchased from Molecular Probes Inc, (Eugene, OR).he surface charge density of the microspheres was givens 14.8 �eq g−1, and the stock suspension concentration was.7 × 1010 mL−1, with 0.002 M NaN3. The microspheres weresed as received.
.2. Cleaning procedures
Borosilicate glass slides (Fisher scientific, Fairlawn,J) were cleaned by submerging in a 5:1:1 mixture of2O–NH4OH–H2O2 and heating at 75–80 ◦C for 10 min andverflow-quenching the solution under ultra pure water for aboutmin (RCA, SC-1method [26]). Other glassware and plasticare used in the measurements were cleaned by soaking in
D P
RO
OF
S. Assemi et al. / Colloids and Surfaces A: Physicochem. Eng. Aspects xxx (2006) xxx–xxx 3
2% Hellmanex II (Mullheim, Germany) 20 min while sonicat-132
ing, followed by rinsing with deionized water. Ultra pure water133
was obtained from a Millipore MilliQ Academic A10 water134
purification system (Billerica, MA) with resistivity no less than135
18 M� cm.136
2.3. Electrophoretic mobility (EPM) measurements137
Stock microsphere suspensions were diluted 100 times using138
desired concentrations of electrolytes. Suspensions were bath139
sonicated for about 2 min and their pH was measured (6.8–6.9)140
immediately before EPM measurements. Electrophoretic mobil-141
ities of the microspheres were measured using phase analysis142
light scattering (ZetaPALS, Brookhaven Instruments, Holtsville,143
NY). Three EPM measurements (with three cycles) were con-144
ducted for each ionic strength condition.145
To estimate the surface potential of the glass surface over146
the range of the solution conditions used in AFM measure-147
ments, a clean glass slide was crushed in an agate capsule to fine148
powder using a mechanical grinder (Wig-L-Bug, Crystal Labo-149
ratories, Garfield, NJ). The glass powder was hydrated for 72 h150
in deionized water and then centrifuged and equilibrated with151
the electrolyte of interest for 24 h. Three EPM measurements152
(five cycles each) were performed on a Zeta PALS instrument153
(Brookhaven Instruments, Holtsville, NY).154
Surface potentials of the carboxylate-modified polystyrene155
l156
e157
r158
t159
s160
2161
162
a163
i164
a165
F166
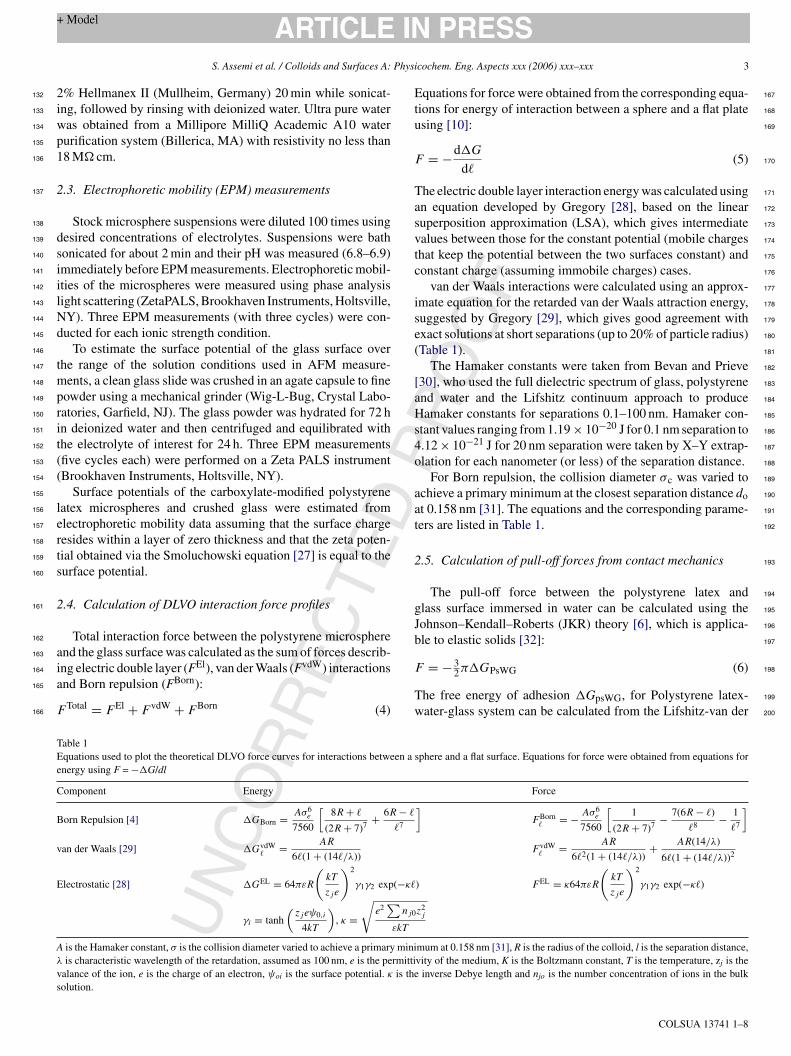
Equations for force were obtained from the corresponding equa- 167
tions for energy of interaction between a sphere and a flat plate 168
using [10]: 169
F = −d�G
d�(5) 170
The electric double layer interaction energy was calculated using 171
an equation developed by Gregory [28], based on the linear 172
superposition approximation (LSA), which gives intermediate 173
values between those for the constant potential (mobile charges 174
that keep the potential between the two surfaces constant) and 175
constant charge (assuming immobile charges) cases. 176
van der Waals interactions were calculated using an approx- 177
imate equation for the retarded van der Waals attraction energy, 178
suggested by Gregory [29], which gives good agreement with 179
exact solutions at short separations (up to 20% of particle radius) 180
(Table 1). 181
The Hamaker constants were taken from Bevan and Prieve 182
[30], who used the full dielectric spectrum of glass, polystyrene 183
and water and the Lifshitz continuum approach to produce 184
Hamaker constants for separations 0.1–100 nm. Hamaker con- 185
stant values ranging from 1.19 × 10⁻²⁰ J for 0.1 nm separation to 186
4.12 × 10⁻²¹ J for 20 nm separation were taken by X–Y extrap- 187
olation for each nanometer (or less) of the separation distance. 188
For Born repulsion, the collision diameter σc was varied to 189
a 190
a 191
t 192
2 193
194
g 195
J 196
b 197
F 198
T 199
w 200
TE en a se
C
B− �
�7
v
E (−κ�
nj0
εkT
A miniλ rmittiv is thes
UN
CO
RR
EC
TE
atex microspheres and crushed glass were estimated fromlectrophoretic mobility data assuming that the surface chargeesides within a layer of zero thickness and that the zeta poten-ial obtained via the Smoluchowski equation [27] is equal to theurface potential.
.4. Calculation of DLVO interaction force profiles
Total interaction force between the polystyrene microspherend the glass surface was calculated as the sum of forces describ-ng electric double layer (FEl), van der Waals (FvdW) interactionsnd Born repulsion (FBorn):
Total = FEl + FvdW + FBorn (4)
able 1quations used to plot the theoretical DLVO force curves for interactions betwenergy using F = −�G/dl
omponent Energy
orn Repulsion [4] �GBorn = Aσ6e
7560
[8R+ �
(2R+ 7)7+ 6R
an der Waals [29] �GvdW�
= AR
6�(1 + (14�/λ))
lectrostatic [28] �GEL = 64πεR
(kT
zje
)2
γ1γ2 exp
γi = tanh(zjeψ0,i
4kT
), κ =
√e2
∑
is the Hamaker constant, σ is the collision diameter varied to achieve a primaryis characteristic wavelength of the retardation, assumed as 100 nm, e is the pe
alance of the ion, e is the charge of an electron, ψoi is the surface potential. κolution.
COLSUA 13741 1–8
chieve a primary minimum at the closest separation distance dot 0.158 nm [31]. The equations and the corresponding parame-ers are listed in Table 1.
.5. Calculation of pull-off forces from contact mechanics
The pull-off force between the polystyrene latex andlass surface immersed in water can be calculated using theohnson–Kendall–Roberts (JKR) theory [6], which is applica-le to elastic solids [32]:
= − 32π�GPsWG (6)
he free energy of adhesion �GpsWG, for Polystyrene latex-ater-glass system can be calculated from the Lifshitz-van der
phere and a flat surface. Equations for force were obtained from equations for
Force]FBorn�
= − Aσ6e
7560
[1
(2R+ 7)7− 7(6R− �)
�8− 1
�7
]
FvdW�
= AR
6�2(1 + (14�/λ))+ AR(14/λ)
6�(1 + (14�/λ))2
) FEL = κ64πεR
(kT
zje
)2
γ1γ2 exp(−κ�)
z2j
mum at 0.158 nm [31], R is the radius of the colloid, l is the separation distance,vity of the medium, K is the Boltzmann constant, T is the temperature, zj is the
inverse Debye length and njo is the number concentration of ions in the bulk
CTE
D P
RO
OF
4 S. Assemi et al. / Colloids and Surfaces A: Physicochem. Eng. Aspects xxx (2006) xxx–xxx
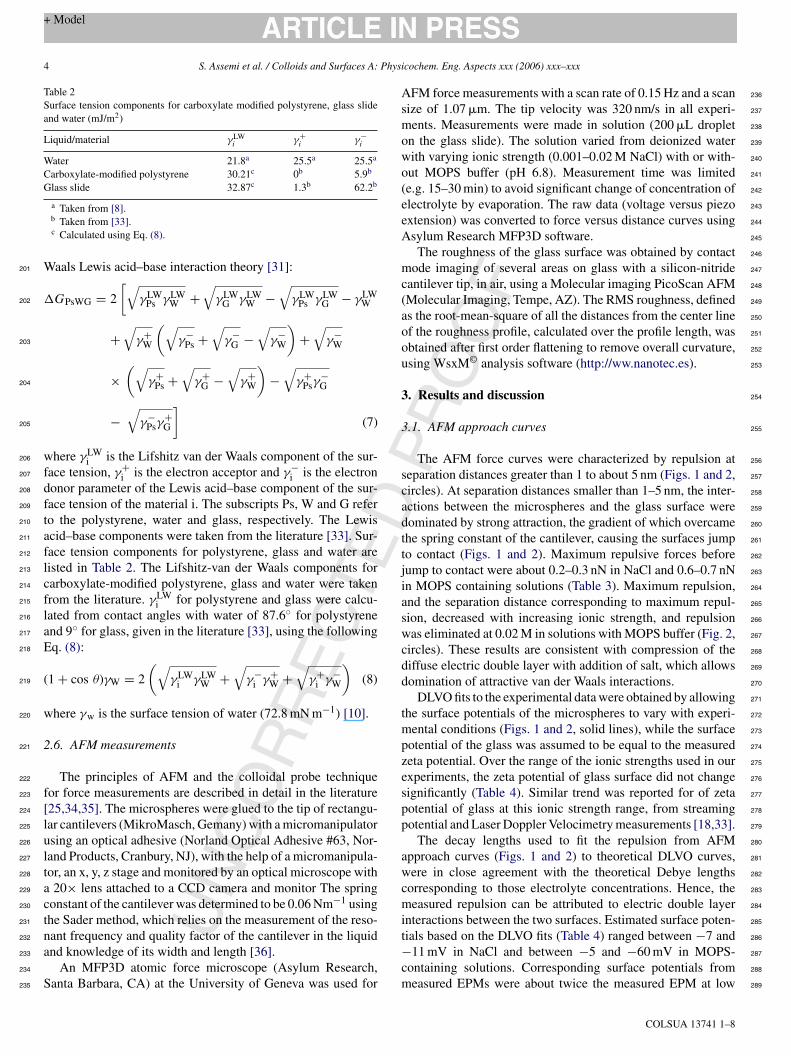
Table 2Surface tension components for carboxylate modified polystyrene, glass slideand water (mJ/m2)
Liquid/material γLWi γ+
i γ−i
Water 21.8a 25.5a 25.5a
Carboxylate-modified polystyrene 30.21c 0b 5.9b
Glass slide 32.87c 1.3b 62.2b
a Taken from [8].b Taken from [33].c Calculated using Eq. (8).
Waals Lewis acid–base interaction theory [31]:201
�GPsWG = 2
[√γLW
Ps γLWW +
√γLW
G γLWW −
√γLW
Ps γLWG − γLW
W202
+√γ+
W
(√γ−
Ps +√γ−
G −√γ−
W
)+
√γ−
W203
×(√
γ+Ps +
√γ+
G −√γ+
W
)−
√γ+
Psγ−G204
−√γ−
Psγ+G
](7)205
where γLWi is the Lifshitz van der Waals component of the sur-206
face tension, γ+i is the electron acceptor and γ−
i is the electron207
donor parameter of the Lewis acid–base component of the sur-208
face tension of the material i. The subscripts Ps, W and G refer209
to the polystyrene, water and glass, respectively. The Lewis210
acid–base components were taken from the literature [33]. Sur-211
face tension components for polystyrene, glass and water are212
listed in Table 2. The Lifshitz-van der Waals components for213
carboxylate-modified polystyrene, glass and water were taken214
from the literature. γLWi for polystyrene and glass were calcu-215
lated from contact angles with water of 87.6◦ for polystyrene216
and 9◦ for glass, given in the literature [33], using the following217
Eq. (8):218
(
(√ √ √ )219
w220
2221
222
f223
[224
l225
u226
l227
t228
a229
c230
t231
n232
a233
234
S235
AFM force measurements with a scan rate of 0.15 Hz and a scan 236
size of 1.07 �m. The tip velocity was 320 nm/s in all experi- 237
ments. Measurements were made in solution (200 �L droplet 238
on the glass slide). The solution varied from deionized water 239
with varying ionic strength (0.001–0.02 M NaCl) with or with- 240
out MOPS buffer (pH 6.8). Measurement time was limited 241
(e.g. 15–30 min) to avoid significant change of concentration of 242
electrolyte by evaporation. The raw data (voltage versus piezo 243
extension) was converted to force versus distance curves using 244
Asylum Research MFP3D software. 245
The roughness of the glass surface was obtained by contact 246
mode imaging of several areas on glass with a silicon-nitride 247
cantilever tip, in air, using a Molecular imaging PicoScan AFM 248
(Molecular Imaging, Tempe, AZ). The RMS roughness, defined 249
as the root-mean-square of all the distances from the center line 250
of the roughness profile, calculated over the profile length, was 251
obtained after first order flattening to remove overall curvature, 252
using WsxM© analysis software (http://ww.nanotec.es). 253
3. Results and discussion 254
3.1. AFM approach curves 255
The AFM force curves were characterized by repulsion at 256
separation distances greater than 1 to about 5 nm (Figs. 1 and 2, 257
circles). At separation distances smaller than 1–5 nm, the inter- 258
a 259
d 260
t 261
t 262
j 263
i 264
a 265
s 266
w 267
c 268
d 269
d 270
271
t 272
m 273
p 274
z 275
e 276
s 277
p 278
p 279
280
a 281
w 282
c 283
m 284
i 285
t 286
− 287
c 288
m 289
UN
CO
RR
E1 + cos θ)γW = 2 γLWi γLW
W + γ−i γ
+W + γ+
i γ−W (8)
here γw is the surface tension of water (72.8 mN m−1) [10].
.6. AFM measurements
The principles of AFM and the colloidal probe techniqueor force measurements are described in detail in the literature25,34,35]. The microspheres were glued to the tip of rectangu-ar cantilevers (MikroMasch, Gemany) with a micromanipulatorsing an optical adhesive (Norland Optical Adhesive #63, Nor-and Products, Cranbury, NJ), with the help of a micromanipula-or, an x, y, z stage and monitored by an optical microscope with20× lens attached to a CCD camera and monitor The spring
onstant of the cantilever was determined to be 0.06 Nm−1 usinghe Sader method, which relies on the measurement of the reso-ant frequency and quality factor of the cantilever in the liquidnd knowledge of its width and length [36].
An MFP3D atomic force microscope (Asylum Research,anta Barbara, CA) at the University of Geneva was used for
COLSUA 13741 1–8
ctions between the microspheres and the glass surface wereominated by strong attraction, the gradient of which overcamehe spring constant of the cantilever, causing the surfaces jumpo contact (Figs. 1 and 2). Maximum repulsive forces beforeump to contact were about 0.2–0.3 nN in NaCl and 0.6–0.7 nNn MOPS containing solutions (Table 3). Maximum repulsion,nd the separation distance corresponding to maximum repul-ion, decreased with increasing ionic strength, and repulsionas eliminated at 0.02 M in solutions with MOPS buffer (Fig. 2,
ircles). These results are consistent with compression of theiffuse electric double layer with addition of salt, which allowsomination of attractive van der Waals interactions.
DLVO fits to the experimental data were obtained by allowinghe surface potentials of the microspheres to vary with experi-
ental conditions (Figs. 1 and 2, solid lines), while the surfaceotential of the glass was assumed to be equal to the measuredeta potential. Over the range of the ionic strengths used in ourxperiments, the zeta potential of glass surface did not changeignificantly (Table 4). Similar trend was reported for of zetaotential of glass at this ionic strength range, from streamingotential and Laser Doppler Velocimetry measurements [18,33].
The decay lengths used to fit the repulsion from AFMpproach curves (Figs. 1 and 2) to theoretical DLVO curves,ere in close agreement with the theoretical Debye lengths
orresponding to those electrolyte concentrations. Hence, theeasured repulsion can be attributed to electric double layer
nteractions between the two surfaces. Estimated surface poten-ials based on the DLVO fits (Table 4) ranged between −7 and
11 mV in NaCl and between −5 and −60 mV in MOPS-ontaining solutions. Corresponding surface potentials fromeasured EPMs were about twice the measured EPM at low

EC
TED
PR
OO
F
S. Assemi et al. / Colloids and Surfaces A: Physicochem. Eng. Aspects xxx (2006) xxx–xxx 5
Table 3Maximum repulsive forces and the “jump to contact” distances measured by AFM for the interactions between a 1.0-�m carboxylate modified polystyrene latexmicrosphere and a glass surface in NaCl and MOPS containing solutions (n = 20–30)
Electrolyte concentration (M) Maximum repulsive force beforejump to contact (nN)
Distance of separation at jumpto contact (nm)
NaCl NaCL + MOPS NaCl NaCl + MOPS
0.001 a 0.70 ± 0.24 a 7.3 ± 2.40.006 0.29 ± 0.11 0.55 ± 0.36 2.4 ± 1.2 2.0 ± 1.20.01 0.28 ± 0.20 a 2.1 ± 1.5 a
0.02 0.24 ± 0.25 b 1.5 ± 1.6 b
a Not measured.b These parameters could not be measured at 0.02 M NaCl + MOPS.
ionic strength (0.001 M) and approximately one order of mag-290
nitude higher at higher ionic strengths (0.02 M) (Table 4).291
Zeta potentials obtained from EPM measurements using micro-292
electrophoresis represent average values for the microsphere293
population in a solution. However, the surface potentials294
obtained by AFM reflect local interactions within the contact295
area between the glass surface and one microsphere. There-296
fore, the surface potential estimated from AFM may be more297
F1cs1e
sensitive to the charge heterogeneity and roughness of the 298
surfaces. 299
The relatively low values for surface potentials estimated 300
from DLVO fits at high ionic strength are more consistent with 301
transport data for equivalent microspheres in glass beads, which 302
showed significant attachment at all ionic strengths, and sen- 303
sitivity of deposition rate to ionic strength [37]. For this rea- 304
son, the depths of the primary minima from the DLVO fits to 305
OR
R
UN
C
ig. 1. AFM approach curves (open circles) for the interactions between the-�m polystyrene latex microsphere and glass and pH 6.8 in NaCI. AFMurves represent 70–100 measurements at three different locations on the glassurface. DLVO fits (solid lines) were obtained using Hamaker constants of.19 × 10−20–4.12 × 10⁻²¹ for the polystyrene–water–glass system [30] andquations outlined in Table 1.
F1ilaop
COLSUA 13741 1–8
ig. 2. AFM approach curves (open circles) for the interactions between the-�m polystyrene latex microsphere and glass and pH 6.9 in MOPS contain-ng solutions. AFM curves represent 70–100 measurements at three differentocations on the glass surface. AFM curves represent 70–100 measurementst three different locations on the glass surface. DLVO fits (solid lines) werebtained using Hamaker constants of 1.19 × 10⁻²⁰ to 4.12 × 10⁻²¹ for theolystyrene–water–glass system [30] and equations outlined in Table 1.
EC
TED
PR
OO
F
6 S. Assemi et al. / Colloids and Surfaces A: Physicochem. Eng. Aspects xxx (2006) xxx–xxx
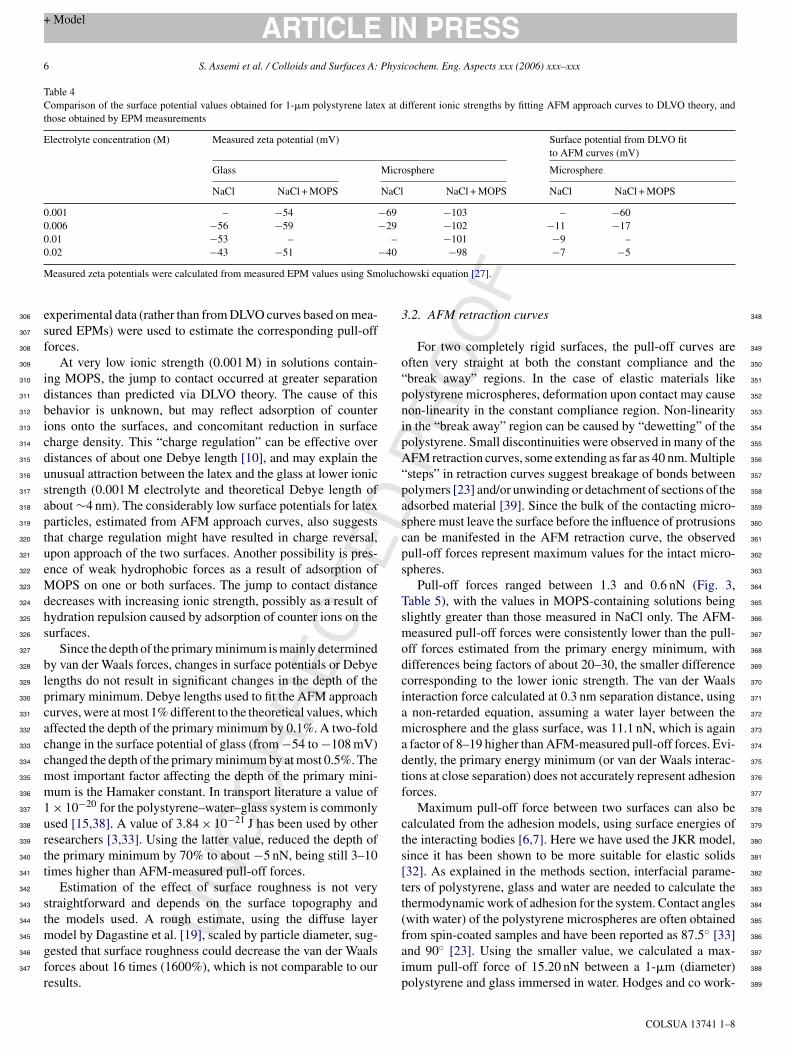
Table 4Comparison of the surface potential values obtained for 1-�m polystyrene latex at different ionic strengths by fitting AFM approach curves to DLVO theory, andthose obtained by EPM measurements
Electrolyte concentration (M) Measured zeta potential (mV) Surface potential from DLVO fitto AFM curves (mV)
Glass Microsphere Microsphere
NaCl NaCl + MOPS NaCl NaCl + MOPS NaCl NaCl + MOPS
0.001 – −54 −69 −103 – −600.006 −56 −59 −29 −102 −11 −170.01 −53 – – −101 −9 –0.02 −43 −51 −40 −98 −7 −5
Measured zeta potentials were calculated from measured EPM values using Smoluchowski equation [27].
experimental data (rather than from DLVO curves based on mea-306
sured EPMs) were used to estimate the corresponding pull-off307
forces.308
At very low ionic strength (0.001 M) in solutions contain-309
ing MOPS, the jump to contact occurred at greater separation310
distances than predicted via DLVO theory. The cause of this311
behavior is unknown, but may reflect adsorption of counter312
ions onto the surfaces, and concomitant reduction in surface313
charge density. This “charge regulation” can be effective over314
distances of about one Debye length [10], and may explain the315
unusual attraction between the latex and the glass at lower ionic316
strength (0.001 M electrolyte and theoretical Debye length of317
about ∼4 nm). The considerably low surface potentials for latex318
particles, estimated from AFM approach curves, also suggests319
that charge regulation might have resulted in charge reversal,320
upon approach of the two surfaces. Another possibility is pres-321
ence of weak hydrophobic forces as a result of adsorption of322
MOPS on one or both surfaces. The jump to contact distance323
decreases with increasing ionic strength, possibly as a result of324
hydration repulsion caused by adsorption of counter ions on the325
surfaces.326
Since the depth of the primary minimum is mainly determined327
by van der Waals forces, changes in surface potentials or Debye328
lengths do not result in significant changes in the depth of the329
primary minimum. Debye lengths used to fit the AFM approach330
curves, were at most 1% different to the theoretical values, which331
a332
c333
c334
m335
m336
1337
u338
r339
t340
t341
342
s343
t344
m345
g346
f347
r
3.2. AFM retraction curves 348
For two completely rigid surfaces, the pull-off curves are 349
often very straight at both the constant compliance and the 350
“break away” regions. In the case of elastic materials like 351
polystyrene microspheres, deformation upon contact may cause 352
non-linearity in the constant compliance region. Non-linearity 353
in the “break away” region can be caused by “dewetting” of the 354
polystyrene. Small discontinuities were observed in many of the 355
AFM retraction curves, some extending as far as 40 nm. Multiple 356
“steps” in retraction curves suggest breakage of bonds between 357
polymers [23] and/or unwinding or detachment of sections of the 358
adsorbed material [39]. Since the bulk of the contacting micro- 359
sphere must leave the surface before the influence of protrusions 360
can be manifested in the AFM retraction curve, the observed 361
pull-off forces represent maximum values for the intact micro- 362
spheres. 363
Pull-off forces ranged between 1.3 and 0.6 nN (Fig. 3, 364
Table 5), with the values in MOPS-containing solutions being 365
slightly greater than those measured in NaCl only. The AFM- 366
measured pull-off forces were consistently lower than the pull- 367
off forces estimated from the primary energy minimum, with 368
differences being factors of about 20–30, the smaller difference 369
corresponding to the lower ionic strength. The van der Waals 370
interaction force calculated at 0.3 nm separation distance, using 371
a non-retarded equation, assuming a water layer between the 372
m 373
a 374
d 375
t 376
f 377
378
c 379
t 380
s 381
[ 382
t 383
t 384
( 385
f 386
a 387
i 388
p 389
UN
CO
RRffected the depth of the primary minimum by 0.1%. A two-fold
hange in the surface potential of glass (from −54 to −108 mV)hanged the depth of the primary minimum by at most 0.5%. Theost important factor affecting the depth of the primary mini-um is the Hamaker constant. In transport literature a value of× 10−20 for the polystyrene–water–glass system is commonlysed [15,38]. A value of 3.84 × 10⁻²¹ J has been used by otheresearchers [3,33]. Using the latter value, reduced the depth ofhe primary minimum by 70% to about −5 nN, being still 3–10imes higher than AFM-measured pull-off forces.
Estimation of the effect of surface roughness is not verytraightforward and depends on the surface topography andhe models used. A rough estimate, using the diffuse layerodel by Dagastine et al. [19], scaled by particle diameter, sug-
ested that surface roughness could decrease the van der Waalsorces about 16 times (1600%), which is not comparable to ouresults.
COLSUA 13741 1–8
icrosphere and the glass surface, was 11.1 nN, which is againfactor of 8–19 higher than AFM-measured pull-off forces. Evi-ently, the primary energy minimum (or van der Waals interac-ions at close separation) does not accurately represent adhesionorces.
Maximum pull-off force between two surfaces can also bealculated from the adhesion models, using surface energies ofhe interacting bodies [6,7]. Here we have used the JKR model,ince it has been shown to be more suitable for elastic solids32]. As explained in the methods section, interfacial parame-ers of polystyrene, glass and water are needed to calculate thehermodynamic work of adhesion for the system. Contact angleswith water) of the polystyrene microspheres are often obtainedrom spin-coated samples and have been reported as 87.5◦ [33]nd 90◦ [23]. Using the smaller value, we calculated a max-mum pull-off force of 15.20 nN between a 1-�m (diameter)olystyrene and glass immersed in water. Hodges and co work-

RE
CTE
D P
RO
OF
S. Assemi et al. / Colloids and Surfaces A: Physicochem. Eng. Aspects xxx (2006) xxx–xxx 7
Table 5Comparison of pull-off forces obtained from AFM measurements with those calculated from DLVO curves
Electrolyte concentration (M) Pull-off force (nN)
AFM DLVO
NaCl NaCl + MOPS NaCl NaCl + MOPS
0.001 a 1.30 ± 0.29 a 17.260.006 1.19 ± 0.29 0.71 ± 0.36 17.80 17.520.01 0.86 ± 0.34 a 17.87 a
0.02 0.57 ± 0.23 0.57 ± 0.35 17.93 17.98
Theoretical forces are the values at the primary minima from the DLVO theoretical force curves after fitting to the AFM data. van der Waals interaction forcescalculated for a sphere-flat geometry at 0.3 nm separation distance were 11.1 nN using a Hamaker constant of 1.19 × 10⁻²⁰ J for the polystyrene–water–glass system[30]. Maximum pull-off forces from JKR theory were calculated as 15.20 nN using a contact angel of 87.5◦ and 1.35 nN using a contact angel of 69◦, as explainedin the manuscript.
a Not measured.
ers [23] performed adhesion measurements between polystyrene390
microspheres and reported that when corrections included sur-391
face energy as well as roughness, the values agreed better with392
the JKR theory and found that regardless of microsphere size, a393
contact angle of 69◦ was more appropriate than the 90◦ initially394
used. Using a contact angle of 69◦, we calculated a maximum395
pull-off force of 1.35 nN, which is in the range of our AFM-396
measured pull-off forces (Table 5).397
The glass surface used in our experiments had a RMS rough-398
ness of 0.43 nm over a 920 nm × 920 nm scan size (Fig. 4). The399
average asperity height of the surface over the scan range was400
1.46 nm, indicating that the glass surface was fairly smooth (con-401
FpNat
sidering that molecularly smooth muscovite mica usually has an 402
RMS roughness of <0.1–0.3 nm). Roughness measurements by 403
Tormoen and Drelich [40] of a 14 �m latex bead shows asperities 404
in the order of several to a few tenths of a nanometer. Considine 405
et al. [41] reported asperity heights of 20 nm on latex spheres 406
of 6.4 and 7 �m in diameter. Asperities as high as 40 nm were 407
reported on 6-�m latex particles [30]. Based on these measure- 408
ments roughness on one or both surfaces, may have reduced 409
the pull-off forces relative to theoretical values calculated in 410
this paper. It has been stated that in case of single-scale rough- 411
ness, a partial detachment can occur before full detachment, 412
which could result in a substantial reduction in the pull-off force 413
[21]. Dispersion of asperity heights can reduce the adhesion 414
by higher asperities pushing the adhering surfaces apart [20]. 415
Asperities may also cause reduction in the Hamaker function 416
and thus reduce van der Waals interaction [19]. 417
DLVO-based pull-off forces were either unaffected by ionic 418
strength (NaCl) or slightly increased with increasing ionic 419
strength (MOPS containing solutions) (Fig. 3, Table 5). In con- 420
trast, the AFM-measured pull-off forces decreased with increas- 421
ing ionic strength. This effect is possibly caused by the repulsive 422
hydration forces arising from binding of hydrated counter ions 423
to the surfaces. It has been demonstrated that hydration forces 424
between mineral surfaces (mica-mica, silica-mica) can extend 425
to about 5 nm [42] and can result in reduction of adhesion 426
NC
OR
ig. 3. AFM retraction curves (open circles) for interactions between the 1-�m
Uolystyrene latex polystyrene latex microsphere and glass at pH ∼6.5 in (a)aCI, (b) NaCI + MOPS. The curves represent 70–100 measurements obtainedt three different location on the glass substrate. The curve minimum representshe maximum pull-off force.
Fsw
COLSUA 13741 1–8
ig. 4. Contact mode AFM image in air of a glass slide used in this study. Thecan size is 920 nm × 920 nm. The surface has a RMS roughness of 0.43 nmith an average asperity height of 1.46 nm.
ED
PR
OO
F
8 S. Assemi et al. / Colloids and Surfaces A: Physicochem. Eng. Aspects xxx (2006) xxx–xxx
forces between mineral surfaces when the electrolyte concentra-427
tion is increased [43,44]. Similarly, the pull-off force between428
two polystyrene microspheres decreased by increasing the ionic429
strength from 0.1 to 500 mM [41], perhaps by hydration of the430
functional groups on the latex.431
Similar differences in magnitudes and trends in AFM-432
measured versus DLVO-derived adhesion forces were observed433
for 5.7 �m in diameter carboxylate-modified polystyrene latex434
microspheres (Bangs Laboratories, Fishers, IN) (data not435
shown), demonstrating generality of these results to other sizes436
of carboxyate-modified polystyrene latex microspheres on glass.437
These results indicate that a DLVO-based approach for esti-438
mating adhesion force can severely over-estimate measured439
adhesion forces. Non-DLVO forces, e.g. hydration, and effects440
from deformation and surface roughness can significantly alter441
interaction and adhesion forces between colloid and collector442
surfaces.443
Acknowledgements444
We are grateful to Asylum Research and Dr. Jason Bemis445
for providing the MFP3D software and for technical assistance446
with data processing. We thank Dr. Georg Papastavrou at the447
University of Geneva for assistance with AFM measurements448
and Mr. Xiqing Li for performing the EPM measurements of449
the latex microspheres. We appreciate Dr. Jaroslaw Drelich’s450
h451
a452
T453
S454
fi455
m456
t457
R458
459
460
461
462
463
464
465
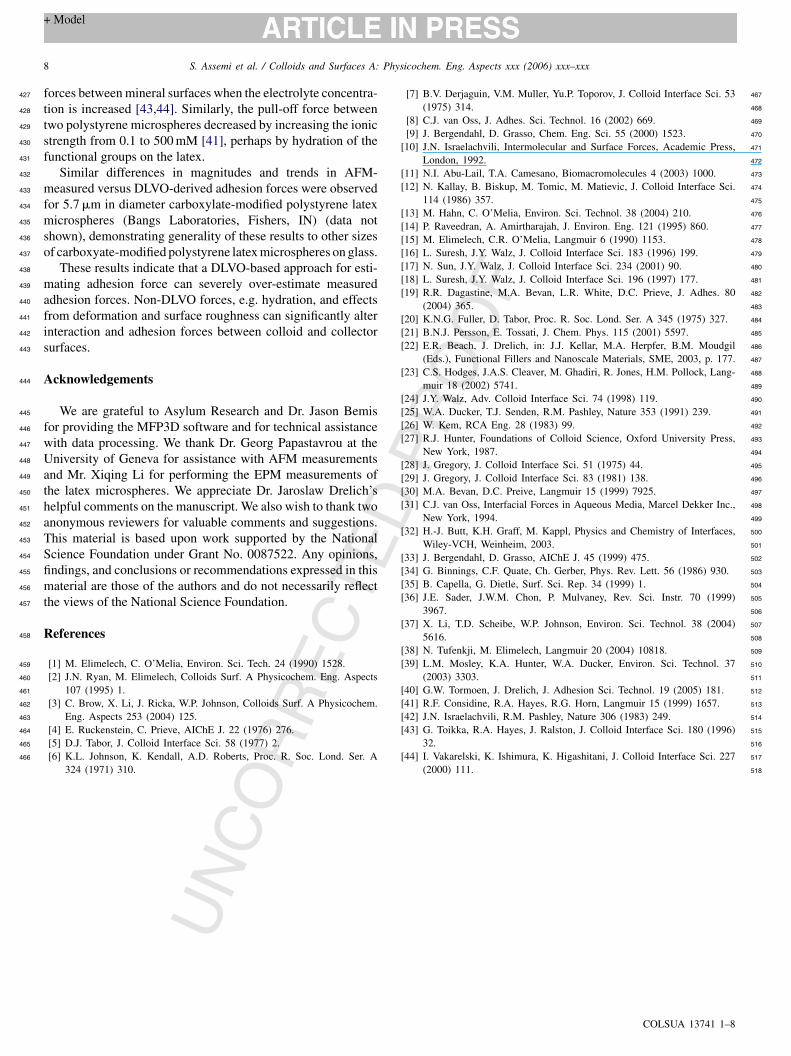
466
[7] B.V. Derjaguin, V.M. Muller, Yu.P. Toporov, J. Colloid Interface Sci. 53 467
(1975) 314. 468
[8] C.J. van Oss, J. Adhes. Sci. Technol. 16 (2002) 669. 469
[9] J. Bergendahl, D. Grasso, Chem. Eng. Sci. 55 (2000) 1523. 470
[10] J.N. Israelachvili, Intermolecular and Surface Forces, Academic Press, 471
London, 1992. 472
[11] N.I. Abu-Lail, T.A. Camesano, Biomacromolecules 4 (2003) 1000. 473
[12] N. Kallay, B. Biskup, M. Tomic, M. Matievic, J. Colloid Interface Sci. 474
114 (1986) 357. 475
[13] M. Hahn, C. O’Melia, Environ. Sci. Technol. 38 (2004) 210. 476
[14] P. Raveedran, A. Amirtharajah, J. Environ. Eng. 121 (1995) 860. 477
[15] M. Elimelech, C.R. O’Melia, Langmuir 6 (1990) 1153. 478
[16] L. Suresh, J.Y. Walz, J. Colloid Interface Sci. 183 (1996) 199. 479
[17] N. Sun, J.Y. Walz, J. Colloid Interface Sci. 234 (2001) 90. 480
[18] L. Suresh, J.Y. Walz, J. Colloid Interface Sci. 196 (1997) 177. 481
[19] R.R. Dagastine, M.A. Bevan, L.R. White, D.C. Prieve, J. Adhes. 80 482
(2004) 365. 483
[20] K.N.G. Fuller, D. Tabor, Proc. R. Soc. Lond. Ser. A 345 (1975) 327. 484
[21] B.N.J. Persson, E. Tossati, J. Chem. Phys. 115 (2001) 5597. 485
[22] E.R. Beach, J. Drelich, in: J.J. Kellar, M.A. Herpfer, B.M. Moudgil 486
(Eds.), Functional Fillers and Nanoscale Materials, SME, 2003, p. 177. 487
[23] C.S. Hodges, J.A.S. Cleaver, M. Ghadiri, R. Jones, H.M. Pollock, Lang- 488
muir 18 (2002) 5741. 489
[24] J.Y. Walz, Adv. Colloid Interface Sci. 74 (1998) 119. 490
[25] W.A. Ducker, T.J. Senden, R.M. Pashley, Nature 353 (1991) 239. 491
[26] W. Kem, RCA Eng. 28 (1983) 99. 492
[27] R.J. Hunter, Foundations of Colloid Science, Oxford University Press, 493
New York, 1987. 494
[28] J. Gregory, J. Colloid Interface Sci. 51 (1975) 44. 495
[29] J. Gregory, J. Colloid Interface Sci. 83 (1981) 138. 496
[30] M.A. Bevan, D.C. Preive, Langmuir 15 (1999) 7925. 497
[ 498
499
[ 500
501
[ 502
[ 503
[ 504
[ 505
506
[ 507
508
[ 509
[ 510
511
[ 512
[ 513
[ 514
[ 515
516
[ 517
518
UN
CO
RR
EC
T
elpful comments on the manuscript. We also wish to thank twononymous reviewers for valuable comments and suggestions.his material is based upon work supported by the Nationalcience Foundation under Grant No. 0087522. Any opinions,ndings, and conclusions or recommendations expressed in thisaterial are those of the authors and do not necessarily reflect
he views of the National Science Foundation.
eferences
[1] M. Elimelech, C. O’Melia, Environ. Sci. Tech. 24 (1990) 1528.[2] J.N. Ryan, M. Elimelech, Colloids Surf. A Physicochem. Eng. Aspects
107 (1995) 1.[3] C. Brow, X. Li, J. Ricka, W.P. Johnson, Colloids Surf. A Physicochem.
Eng. Aspects 253 (2004) 125.[4] E. Ruckenstein, C. Prieve, AIChE J. 22 (1976) 276.[5] D.J. Tabor, J. Colloid Interface Sci. 58 (1977) 2.[6] K.L. Johnson, K. Kendall, A.D. Roberts, Proc. R. Soc. Lond. Ser. A
324 (1971) 310.
COLSUA 13741 1–8
31] C.J. van Oss, Interfacial Forces in Aqueous Media, Marcel Dekker Inc.,New York, 1994.
32] H.-J. Butt, K.H. Graff, M. Kappl, Physics and Chemistry of Interfaces,Wiley-VCH, Weinheim, 2003.
33] J. Bergendahl, D. Grasso, AIChE J. 45 (1999) 475.34] G. Binnings, C.F. Quate, Ch. Gerber, Phys. Rev. Lett. 56 (1986) 930.35] B. Capella, G. Dietle, Surf. Sci. Rep. 34 (1999) 1.36] J.E. Sader, J.W.M. Chon, P. Mulvaney, Rev. Sci. Instr. 70 (1999)
3967.37] X. Li, T.D. Scheibe, W.P. Johnson, Environ. Sci. Technol. 38 (2004)
5616.38] N. Tufenkji, M. Elimelech, Langmuir 20 (2004) 10818.39] L.M. Mosley, K.A. Hunter, W.A. Ducker, Environ. Sci. Technol. 37
(2003) 3303.40] G.W. Tormoen, J. Drelich, J. Adhesion Sci. Technol. 19 (2005) 181.41] R.F. Considine, R.A. Hayes, R.G. Horn, Langmuir 15 (1999) 1657.42] J.N. Israelachvili, R.M. Pashley, Nature 306 (1983) 249.43] G. Toikka, R.A. Hayes, J. Ralston, J. Colloid Interface Sci. 180 (1996)
32.44] I. Vakarelski, K. Ishimura, K. Higashitani, J. Colloid Interface Sci. 227
(2000) 111.