
Direct and indirect energy requirements of households in India
13
Energy Policy 30 (2002) 511–523 Direct and indirect energy requirements of households in India Shonali Pachauri*, Daniel Spreng Centre for Energy Policy and Economics, Swiss Federal Institutes of Technology, ETH Zentrum WEC, CH-8092 Zuerich, Switzerland Abstract This study is based on the 115 sector classification input–output tables for India for the years 1983–84, 1989–90 and 1993–94. Calculated total primary energy intensities along with private final consumption expenditures are used as a basis for determining the indirect energy requirements of Indian households. Results reveal that total household energy consumption is about evenly divided between direct and indirect energy and together comprises 75% of the total energy consumption of India. Most of household energy consumed directly is still non-commercial and the consumption of food is responsible for about half the indirect energy consumption. Household energy requirements have increased significantly, both in total and per capita terms over this time period. The commercial component of direct household energy consumption and the indirect energy requirements have increased continuously. The main drivers of this increase have been (1) the growing expenditures per capita, (2) population and (3) increasing energy intensity in the food and agricultural sectors. r 2002 Elsevier Science Ltd. All rights reserved. Keywords: Household energy requirements; Household expenditures; Total primary energy intensities 1. Introduction Energy services make up a sizeable share of total household expenditures in developing countries. In India energy consumption patterns vary widely across different areas and groups of households. Average per capita energy consumption is low compared to devel- oped countries and even world average figures. How- ever, the demand for energy using services in the household sector has been growing at an increasing rate since the early 1980s and is likely to expand rapidly in coming years too. Given this scenario and the growing share of India in global energy use and CO 2 emissions, it is important to analyse the responsible factors. This paper aims to do so by quantitatively analysing total, i.e. direct and indirect energy requirements of households in India over the years 1983–84 to 1993–94. It is difficult to define a typical Indian household, however, the average, albeit not necessarily typical Indian household in 1993–94 comprised 4.5 members including 1.5 children. More than 70% of Indians resided in rural areas and engaged in agriculture, more than 80% owned their own dwelling, and about 66% relied on firewood as their main source of direct energy The per capita expenditure of the average Indian was about Rs. 6226 (US$ 198.5). Direct commercial plus non-commercial energy consumption of households in 1993–94 was on average half the value Goldemberg et al. (1988) postulated to be required for a decent standard of living in a warm climate. This latter value is about 10 GJ/capita or 0.3 kW/capita. Official statistics state that virtually all villages in India are now electrified; however, several studies show that still barely 40% of rural households have electricity connections. Erratic power supply and low incomes result in very low penetration rates for most electric fittings and electronic appliances. This scenario, however, is changing rapidly. One study shows that while the penetration of consumer durables increased at an average annual rate of 4% between 1989–90 and 1992–93, it was nearly double this between 1992–93 and 1995–96. Additionally, while the penetration rate of electrical goods in urban areas was 3573 per thousand households as compared to only 883 in rural areas in 1995–96, if all rural households were assumed to be electrified the figure for rural areas would jump to 2574 per thousand households (Natarajan, 1998). Changes in technology, income levels and lifestyles are bringing about important changes in both direct and *Corresponding author. Tel.: +41-1-632-4188; fax: +41-1-632- 1050. E-mail address: [email protected] (S. Pachauri). 0301-4215/02/$ - see front matter r 2002 Elsevier Science Ltd. All rights reserved. PII:S0301-4215(01)00119-7
Transcript of Direct and indirect energy requirements of households in India

Energy Policy 30 (2002) 511–523
Direct and indirect energy requirements of households in India
Shonali Pachauri*, Daniel Spreng
Centre for Energy Policy and Economics, Swiss Federal Institutes of Technology, ETH Zentrum WEC, CH-8092 Zuerich, Switzerland
Abstract
This study is based on the 115 sector classification input–output tables for India for the years 1983–84, 1989–90 and 1993–94.Calculated total primary energy intensities along with private final consumption expenditures are used as a basis for determining the
indirect energy requirements of Indian households. Results reveal that total household energy consumption is about evenly dividedbetween direct and indirect energy and together comprises 75% of the total energy consumption of India. Most of household energyconsumed directly is still non-commercial and the consumption of food is responsible for about half the indirect energyconsumption. Household energy requirements have increased significantly, both in total and per capita terms over this time period.
The commercial component of direct household energy consumption and the indirect energy requirements have increasedcontinuously. The main drivers of this increase have been (1) the growing expenditures per capita, (2) population and (3) increasingenergy intensity in the food and agricultural sectors. r 2002 Elsevier Science Ltd. All rights reserved.
Keywords: Household energy requirements; Household expenditures; Total primary energy intensities
1. Introduction
Energy services make up a sizeable share of totalhousehold expenditures in developing countries. InIndia energy consumption patterns vary widely acrossdifferent areas and groups of households. Average percapita energy consumption is low compared to devel-oped countries and even world average figures. How-ever, the demand for energy using services in thehousehold sector has been growing at an increasing ratesince the early 1980s and is likely to expand rapidly incoming years too. Given this scenario and the growingshare of India in global energy use and CO2 emissions, itis important to analyse the responsible factors. Thispaper aims to do so by quantitatively analysing total, i.e.direct and indirect energy requirements of households inIndia over the years 1983–84 to 1993–94.
It is difficult to define a typical Indian household,however, the average, albeit not necessarily typicalIndian household in 1993–94 comprised 4.5 membersincluding 1.5 children. More than 70% of Indiansresided in rural areas and engaged in agriculture, morethan 80% owned their own dwelling, and about 66%
relied on firewood as their main source of direct energyThe per capita expenditure of the average Indian wasabout Rs. 6226 (US$ 198.5). Direct commercial plusnon-commercial energy consumption of households in1993–94 was on average half the value Goldemberg et al.(1988) postulated to be required for a decent standard ofliving in a warm climate. This latter value is about10GJ/capita or 0.3 kW/capita. Official statistics statethat virtually all villages in India are now electrified;however, several studies show that still barely 40% ofrural households have electricity connections. Erraticpower supply and low incomes result in very lowpenetration rates for most electric fittings and electronicappliances.
This scenario, however, is changing rapidly. Onestudy shows that while the penetration of consumerdurables increased at an average annual rate of 4%between 1989–90 and 1992–93, it was nearly double thisbetween 1992–93 and 1995–96. Additionally, while thepenetration rate of electrical goods in urban areas was3573 per thousand households as compared to only 883in rural areas in 1995–96, if all rural households wereassumed to be electrified the figure for rural areas wouldjump to 2574 per thousand households (Natarajan,1998).
Changes in technology, income levels and lifestylesare bringing about important changes in both direct and
*Corresponding author. Tel.: +41-1-632-4188; fax: +41-1-632-
1050.
E-mail address: [email protected] (S. Pachauri).
0301-4215/02/$ - see front matter r 2002 Elsevier Science Ltd. All rights reserved.
PII: S 0 3 0 1 - 4 2 1 5 ( 0 1 ) 0 0 1 1 9 - 7
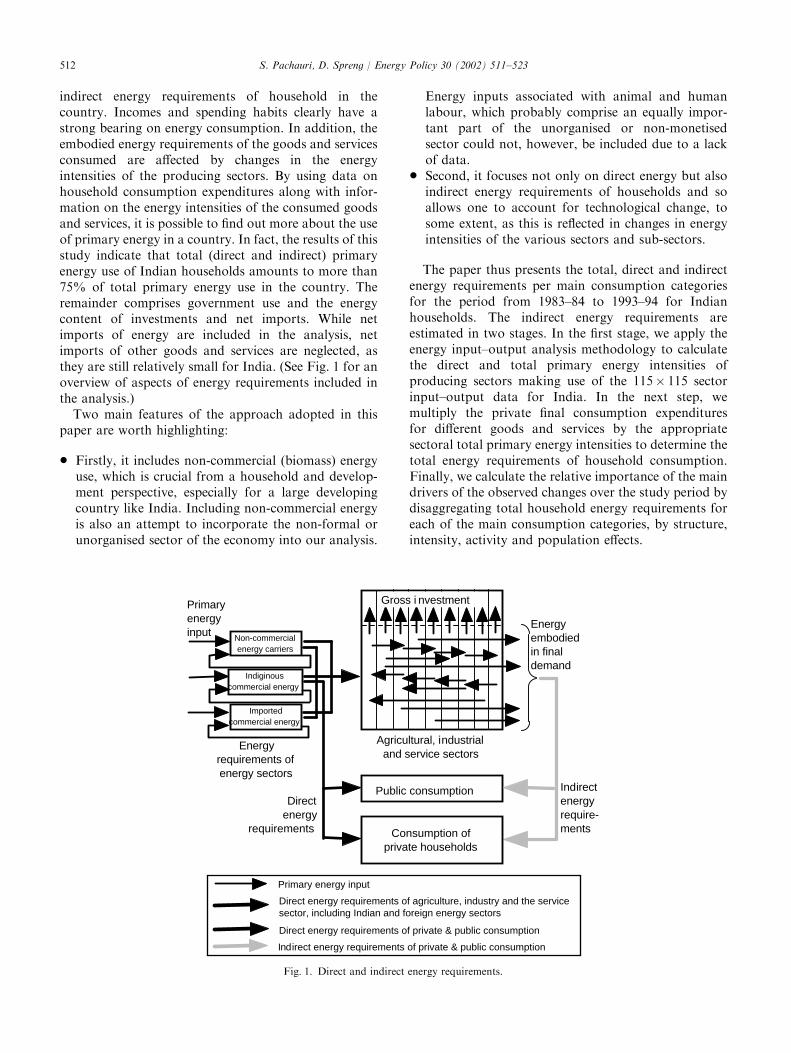
indirect energy requirements of household in thecountry. Incomes and spending habits clearly have astrong bearing on energy consumption. In addition, theembodied energy requirements of the goods and servicesconsumed are affected by changes in the energyintensities of the producing sectors. By using data onhousehold consumption expenditures along with infor-mation on the energy intensities of the consumed goodsand services, it is possible to find out more about the useof primary energy in a country. In fact, the results of thisstudy indicate that total (direct and indirect) primaryenergy use of Indian households amounts to more than75% of total primary energy use in the country. Theremainder comprises government use and the energycontent of investments and net imports. While netimports of energy are included in the analysis, netimports of other goods and services are neglected, asthey are still relatively small for India. (See Fig. 1 for anoverview of aspects of energy requirements included inthe analysis.)
Two main features of the approach adopted in thispaper are worth highlighting:
* Firstly, it includes non-commercial (biomass) energyuse, which is crucial from a household and develop-ment perspective, especially for a large developingcountry like India. Including non-commercial energyis also an attempt to incorporate the non-formal orunorganised sector of the economy into our analysis.
Energy inputs associated with animal and humanlabour, which probably comprise an equally impor-tant part of the unorganised or non-monetisedsector could not, however, be included due to a lackof data.
* Second, it focuses not only on direct energy but alsoindirect energy requirements of households and soallows one to account for technological change, tosome extent, as this is reflected in changes in energyintensities of the various sectors and sub-sectors.
The paper thus presents the total, direct and indirectenergy requirements per main consumption categoriesfor the period from 1983–84 to 1993–94 for Indianhouseholds. The indirect energy requirements areestimated in two stages. In the first stage, we apply theenergy input–output analysis methodology to calculatethe direct and total primary energy intensities ofproducing sectors making use of the 115� 115 sectorinput–output data for India. In the next step, wemultiply the private final consumption expendituresfor different goods and services by the appropriatesectoral total primary energy intensities to determine thetotal energy requirements of household consumption.Finally, we calculate the relative importance of the maindrivers of the observed changes over the study period bydisaggregating total household energy requirements foreach of the main consumption categories, by structure,intensity, activity and population effects.
Gross i nvestment
Energy embodied in finaldemand
Public consumption
Consumption ofprivate households
Directenergy
requirements
Indirectenergyrequire-ments
Non-commercialenergy carriers
Indiginouscommercial energy
Importedcommercial energy
Primary energyinput
Energyrequirements ofenergy sectors
Agricultural, industrial and service sectors
Primary energy input
Direct energy requirements of agriculture, industry and the service sector, including Indian and foreign energy sectors
Direct energy requirements of private & public consumption
Indirect energy requirements of private & public consumption
Fig. 1. Direct and indirect energy requirements.
S. Pachauri, D. Spreng / Energy Policy 30 (2002) 511–523512

2. Methodology for calculating total energy intensities
The use of the engineering oriented process analysis,the economic input–output analysis, or a hybrid of thetwo is well established in the energy analysis literature.While the seminal work in input–output analysis wasdone by Leontief as early as the 1930s and 1940s(Leontief, 1994), it was Bullard and Herendeen (1975)and their colleagues at the University of Illinois whopioneered techniques in energy input–output analysis inthe 1970s. The oil price shocks of the 1970s prompted aspurt in energy analysis research in an effort to find waysto increase the efficiency of energy use. (See Spreng(1988) for a discussion of much of this early work andalso an illustration of a process analysis approach tocalculating total household energy requirements.)
Early research focused on the determination of totalenergy intensities of goods and services or otherprocesses by input–output analysis, in OECD countries,and include those for Germany by Denton (1975), forthe USA by Bullard and Herendeen (1975) and Wright(1974), for Canada by Bush (1981), for the UK by Pickand Becker (1975), and for New Zealand by Peet (1993).For India, the first published literature related to thisfield is a study done in the early 1980s to calculate totalenergy intensities for 15 broad sector groupings basedon the 1978–79 input–output tables by Rao et al. (1981).A more recent study by Tiwari (2000) has calculateddirect and total energy intensities for 38 aggregatedsectors based on the 1983–84 and 1989–90 input–outputtables.
For the purposes of this paper, we calculated totaland direct primary energy intensities at the disaggre-gated 100 sector level for India, using the 115� 115sector input–output transactions tables, sectoral priceindices, and energy flow data, both commercial andnon-commercial, for the study years. Input–outputtransactions tables for India for 1983–84, 1989–90 and1993–94, prepared by the CSO (Central StatisticalOrganisation, 1990, 1997, 2000) were used for theanalysis.
Actual quantity data for each energy type was reliedon to obtain the physical flows of energy across sectors.As no single comprehensive published source for suchdata is available, various official sources were used suchas the official publicationsFCoal Statistics, Petroleumand Natural Gas Statistics, Power Statistics, variousissues on ‘‘Energy’’ by CMIE, various issues ofElectricity Statistics by CEA, and the TERI onlineEnergy Database (Central Electricity Authority, variousissues; CMIE, 1995; Department of Coal, various issues;Ministry of Petroleum and Natural Gas, various issues;Ministry of Power, various issues; Tata Energy ResearchInstitute, 1999). For non-commercial energy flows, dataestimates from the Regional Wood Energy Develop-ment Programme in Asia of the FAO (1997) were relied
upon primarily but crosschecked with other publishedestimates as well. Where the physical flows of energyrequired further sectoral desegregation than was avail-able in the published sources, monetary flow values inthe input–output tables along with energy price datawere used to make proportional allocations (seeAppendix A for a detailed description of the methodused for allocating energy flows).
Energy intensities by main energy carriers for differentsectors were calculated using the national input–outputtransactions tables by applying economic input–outputenergy analysis. Since the published input–output tablesincluded only the monetary value of transactions forcommercial energy sectors alone, two modifications tothe matrices were carried out for the purpose of thesecalculations as is mentioned in Steps 1 and 2 of thedescription of the analysis below. In the first stage of theanalysis, the 115 sector input–output tables wereaggregated to a 99� 99 table. The reason why such anaggregation was carried out was two-fold. On the onehand, energy data was available only at a very aggregatelevel and even though for reasons of accuracy it madesense to keep the analysis at as disaggregate a level aspossible, for certain industries, namely mining, iron andsteel, heavy engineering and machinery, and othertransport equipment, early calculations done at the115 sector level revealed implausible fluctuations inenergy intensities over the studied decade. This was dueto the fact that the procedure for allocating energy froma more aggregate sector (based on the classification ofsectors in the energy statistics) to sub-sectors of thesector (following the classification in the input–outputtables) only provides accurate results under the assump-tion that the sub-sectors that comprise the sector havesimilar energy intensities. However, for the sub-sectorsthat comprised the industries mentioned above directenergy use are widely varying as the processes involvedin these industries are quite disparate and therefore theassumptions used to allocate energy flows to thesesectors resulted in skewed results.
The second reason for aggregating the sectors of theseindustries was, that since none of the products producedby these industries were consumed as final demand by thehousehold sector, energy intensities of these sectors didnot have a direct bearing on the calculation of totalhousehold energy requirements and would not makemuch of a difference to the next stage of the analysis.Therefore, it was decided to aggregate the sectors thatcomprised the above-mentioned industries, thus effectivelytransforming the 115� 115 matrix to a 99� 99 matrix.
Briefly, the input–output analysis consisted of thefollowing steps.
Step 1: The 115 sector input–output tables wereaggregated to 99 sectors, by aggregating all the miningsub-sectors, the iron and steel sub-sectors and the heavyengineering sub-sectors into single sectors. A new row
S. Pachauri, D. Spreng / Energy Policy 30 (2002) 511–523 513

and column were added to each year’s table to representthe non-commercial energy sector, thus effectivelymaking the classification for each year 100� 100. Ofthese 100 sectors, five were energy sectorsFcoal andlignite, crude petroleum and natural gas, petroleumproducts, electricity, and non-commercial energy.
Step 2: Values in the energy rows were changed frommonetary to physical flows using the sources of datamentioned above. The ratio of monetary flows tophysical flows of energy were also determined and crosschecked with published data on energy prices fordifferent sectors, wherever available, and appropriatecorrections made. For a detailed description of howenergy flows were allocated refer to Appendix A.
Step 3: Direct energy intensities for each energycarrier for all sectors were calculated as the physicalenergy flows into the sector per Rupee output.
Step 4: Total energy intensities for each energy carrierwere calculated with the aid of the Leontief inversematrices whose elements represent total direct andindirect requirements per Rupee output for each sector.
Step 5: The energy intensities were deflated toconstant 1993–94 prices using sectoral wholesale priceindices in order to make the values for different yearscomparable. For the service sectors the overall con-sumer price index for urban non-manual employees wasused.
For details of the computational procedures used forcalculating the various energy intensities and require-ments please refer to Appendix 6–1, in Miller and Blair
(1985) on the mathematics of energy input–outputanalysis.
3. Results
3.1. Energy intensities of goods and services
The ten most energy intensive non-energy sectors inIndia (i.e. other than the energy sectors) in terms of theirtotal primary energy intensity, which we define as thesum of total coal and lignite intensity, total oil andnatural gas intensity, the ratio electricity from primarysources (i.e. hydro and nuclear) times total electricityintensity and total non-commercial energy intensity, arepresented in Table 1. The most energy intensive non-energy sectors in 1983–84 as can be seen from the tablewere Cement, Structural Clay Products, Fertilisers, CoalTar Products and Iron and Steel, whereas in 1993–94 themost energy intensive sectors were Fertilisers, Paper,Paper Products and Newsprint, Structural Clay Pro-ducts, Cement and Hydrogenated Oil. Looking at thetotal energy intensities by different energy carriers theranking of different sectors can be seen to be quitedifferent. Table 2 shows the top ten non-energy sectorsin terms of total coal and lignite intensity, total oil andnatural gas intensity, total petroleum products intensity,total electricity intensity and total non-commercialenergy intensity in 1993–94. Detailed data on energyintensities of different sectors for the different years are
Table 1
Total primary energy intensity of most intensive non-energy sectorsa
1983–84 1989–90 1993–94
Sector Total primary
energy intensity
(kgoe/Rs. 93–94)
Sector Total primary
energy intensity
(kgoe/Rs. 93–94)
Sector Total primary
energy intensity
(kgoe/Rs. 93–94)
Cement 0.23400 (0.9798) Structural clay
products
0.16142 (0.6759) Fertilisers 0.1860 (0.7788)
Structural clay products 0.22176 (0.9285) Fertilisers 0.14556 (0.6095) Paper, paper
products and
newsprint
0.1701 (0.7123)
Fertilisers 0.21386 (0.8954) Paper, paper products
and newsprint
0.13356 (0.5592) Structural clay
products
0.1666 (0.6975)
Coal tar products 0.20432 (0.8555) Cement 0.11798 (0.4940) Cement 0.1130 (0.4730)
Iron and steel 0.13574 (0.5684) Iron and steel 0.10846 (0.4541) Hydrogenated oil 0.0896 (0.3750)
Paper, paper products
and newsprint
0.13172 (0.5515) Inorganic heavy
chemicals
0.08728 (0.3654) Iron and steel 0.0894 (0.3744)
Other non-metallic
minerals
0.11972 (0.5013) Soaps, cosmetics and
glycerine
0.06779 (0.2838) Wheat 0.0704 (0.2947)
Organic heavy chemicals 0.09331 (0.3907) Other non-metallic
minerals
0.06700 (0.2805) Water supply 0.0672 (0.2814)
Hotels and restaurants 0.08304 (0.3477) Woolen textiles 0.06691 (0.2802) Printing, publishing
and allied activities
0.0653 (0.2733)
Railway transport service 0.08112 (0.3396) Coal tar products 0.06691 (0.2802) Woolen textiles 0.0598 (0.2503)
aNote: Figures in brackets are total primary energy intensities in MJ/100 Rs.
S. Pachauri, D. Spreng / Energy Policy 30 (2002) 511–523514

Table 2
Most intensive non-energy sectors by energy carrierF1993–94
Sector Total coal
and lignite
intensity
(kgoe/Rs. 93–94)
Sector Total oil
and n. gas
intensity
(kgoe/Rs. 93–94)
Sector Total petro.
products
intensity
(kgoe/Rs. 93–94)
Sector Total
electricity
intensity
(kgoe/Rs. 93–94)
Sector Total non-
commercial
energy intensity
(kgoe/Rs. 93–94)
Cement 0.0967 Fertilisers 0.1246 Fertilisers 0.0610 Water supply 0.0188 Paper, paper products
and newsprint
0.1247
Iron and steel 0.0744 Other transport
services
0.0310 Other transport
services
0.0335 Wheat 0.0140 Structural clay
products
0.1245
Fertilisers 0.0560 Wheat 0.0228 Other non-metallic
mineral
0.0151 Cement 0.0090 Printing publishing
and allied activities
0.0379
Water supply 0.0532 Pesticides 0.0162 Pesticides 0.0138 Hydrogenated oil 0.0088 Hydrogenated oil 0.0334
Inorganic heavy
chemical
0.0502 Paddy 0.0151 Jute, hemp,
mesta textiles
0.0129 Fertilisers 0.0085 Hotels and restaurant 0.0313
Wheat 0.0429 Hydrogenated oil 0.0146 Wheat 0.0126 Non-ferrous
basic metals
0.0072 Woolen textile 0.0235
Misc. metal
products
0.0396 Other non-metallic
minerals
0.0144 Iron and steel 0.0123 Pesticides 0.0068 Tea and coffee
processing
0.0199
Hydrogenated oil 0.0392 Jute, hemp,
mesta textiles
0.0130 Railway transport
service
0.0118 Soaps, cosmetics
and glycerine
0.0067 Rubber products 0.0191
Other non-metallic
minerals
0.0372 Iron and steel 0.0123 Hydrogenated oil 0.0117 Organic heavy
chemicals
0.0063 Jute, hemp, mesta
textiles
0.0191
Paper, paper
products and
newsprint
0.0366 Synthetic fibres
and resin
0.0122 Cement 0.0110 Paints, varnishes
and lacquers
0.0063 Other chemicals 0.0171
S.Pachauri,
D.Spren
g/Energ
yPolicy
30(2002)511–523
515

not included in here but can be obtained from theauthors.
The contribution of direct energy intensity to the totaldiffers widely across sectors. Except in the case ofpetroleum products, coal tar products, structural clayproducts, cement, and electricity sectors the contribu-tion of direct energy inputs to the total energy intensitywas o80% for each of the studied years. In fact, formost machine/ engineering industries and some manu-facturing sectors, the percentage of direct to total energyintensity was very low, mostly o8% for all years.Clearly, for these sectors the contribution of indirectenergy inputs to total energy intensity was relativelyhigh, often as large as ten times the direct inputs. Froman energy conservation perspective, this highlights theimportance of determining total energy intensities aslowering direct energy use alone may not be the mosteffective strategy for reducing total energy use. Reduc-tions in indirect energy use through the substitution ofproduction factors and reducing materials use isespecially important for sectors near the end ofproduction chains.
Table 1 also reflects some changes in energy intensitiesover the decade from 1983–84 to 1993–94. The changesin energy intensities over time reflect the changingtechnologies of production within the country as well aschanging patterns of demand for different forms ofenergy. In general, energy intensities increased for manysectors during the period 1983–84 to 1989–90 but thenexperienced a decrease during 1989–90 to 1993–94. Inall, of the 100 sectors for which intensities weredetermined, 56 sectors experienced a decline in energyintensity over the decade, 2 sectors showed no change,and the remaining 42 sectors had an increase in theirtotal primary energy intensities over this period. Thetotal primary energy intensity of total production, whichequals the average of the primary energy intensities overall production sectors weighted by the production ofeach sector, declined marginally from 0.029 kgoe/Rs.93�94 to 0.025 kgoe/Rs.93�94 between 1983–84 and1989–90 and then declined further to 0.022 kgoe/Rs.93�94 by 1993–94. For most of the food andagricultural sectors, however, the energy intensitiesincreased during the entire time period. This is explainedin part by the fast rate of growth of electricity use in theagricultural sector during this time period. In fact,annual average electricity growth rate in the agriculturalsector was 14% between 1976 and 1996, the highestamong all sectors in India. It is difficult to specifyexactly the degree of accuracy of the reported energydata used in our analysis; however, it is possible thatsome of the observed growth in electricity use in theagricultural and household (direct) sectors may be aresult of better reporting and accounting. It is a knownfact that transmission and distribution losses in elec-tricity supply are very large in India. The Planning
Commission estimates that these losses are as high as20% or more of total electricity available and asignificant proportion of these losses are attributed topilferage, especially by the household and agriculturalsectors where proper metering is often lacking (PlanningCommission, 1999). In addition, the rapidly risingelectricity use in the agricultural sector is also likely, inpart, to be a result of the very low, subsidised electricitytariffs to agricultural users.
In all, 15 sectors experienced an increase in energyintensity of more than 50% during this decade, largelythose in the food and agricultural sectors but also thePrinting, Publishing and Allied Activities sector, thePesticides sector, and the Wood Products sector. Therewere also seven sectors including Cement, the Miscella-neous Manufacturing sector and Rail Transport Ser-vices sector, which experienced a decrease of greaterthan 50% in their primary energy intensities. For manysectors, the general shift from coal and lignite and non-commercial energy use to greater oil and electricity useduring this period are responsible, in part, for theobserved decreases in primary energy intensities. Parti-cularly, the substitution of non-commercial with com-mercial energy may lead to significant decreases inenergy intensity.
3.1.1. Comparison with energy intensity values fromother countries
It is problematic to compare energy intensities ofgoods and services in one country with the equivalentenergy intensities in another country. Both differences inprices of goods and services and in the product mix ofthe sector-outputs limit the usefulness of the compar-ison. We therefore do not attempt to compare ourresults for the energy intensities of goods and services inIndia with results from other studies but cite acomparison of energy requirements for the productionof three commodities for the recent UNDP/WEC-study(Jochem et al., 2000). These specific energy requirementsare computed for well-defined products per weight(Table 3).
It is clear from the table that despite improvements inthe energy intensity of certain sectors in India during thestudied period, there is a significant potential for further
Table 3
Specific energy use in selected basic products industries and countries
Mid-1990a
Country Steel
(GJ/tonne)
Cement
(GJ/tonne)
Pulp and paper
(GJ/tonne)
India 39.7 8.4 46.6
USA 25.4 4.0 40.6
Japan 17.5 5.0 FSweden 21.0 5.9 31.6
aSource: UNDP/WEC 2000.
S. Pachauri, D. Spreng / Energy Policy 30 (2002) 511–523516

improvements in energy efficiency by adopting moreefficient technologies and production processes.
3.2. Direct energy consumption of households
Total direct final energy use in Indian householdsincreased by 14.3% during the decade between 1983–84and 1993–94. However, if one considers total directprimary energy use, which we define as direct finalenergy use multiplied by the energy intensity of theenergy sectors in kgoein=kgoeout or energy requirementsof energy, during the same period, then one observesa slightly greater increase of 18.7%. In fact, therewas an overall increase in direct energy requirementsfor all energy carriers other than coal and ligniteduring this period, with electricity use increasing thefastest.
Looking more closely at the trends in per capita directenergy requirements, we observe that while non-commercial energy use still dominates household directenergy requirements, its use, in per capita terms,declined continuously over the study period. In contrast,both electricity and petroleum products use increasedrapidly, while direct consumption of coal in privatehouseholds remained small and decreasing (see Fig. 2).Of all important energy carriers, the use of electricitygrew the fastest between 1983–84 and 1993–94 at thehousehold level. The large increase in electricity use isprimarily a result of greater accessibility for householdsto electricity grids, and the faster penetration ofelectrical and electronic equipment in households. Theseshifts in the energy carriers also had an impact on thetotal direct primary energy requirements as the energy
contents and efficiencies of different fuels vary by a largerange. Thus, while direct commercial energy useincreased at an average rate of 4.3% per annum duringthe studied decade this was offset by a decrease of about1% per annum in per capita non-commercial energyconsumption. These trends are in conformance with aprogression up the ‘‘energy ladder’’, a phenomenon welldocumented by other researchers (Reddy and Reddy,1994) wherein households move to more sophisticatedfuels and energy applications with increases in incomesand urbanisation.
3.3. Total (direct plus indirect) energy consumption ofhouseholds
Studies examining specifically the total (direct andindirect) energy requirements of households usinginput–output analysis have been done for the USA byHerendeen et al. (1981), New Zealand (Peet et al., 1985)and Switzerland (Ospelt et al., 1996). Studies extendingthe analysis to calculate total carbon emissions includethose for the UK by Gay and Proops (1995) and forAustralia (Common and Salma, 1992), (Lenzen, 1998).A series of publications by researchers at the Universityof Groningen and University of Utrecht look athousehold metabolic flows (Noorman et al., 1998),(Vringer and Blok, 1995a, b; Vringer and Blok, 2000). Arecent publication in this field that links consumption toenvironmental pollution reported results from theEuropean study for Germany, France and Netherlandson ‘‘Consumer Lifestyles and Pollutant Emissions’’Weber and Perrels (2000).
Studies on developing countries are more difficult tofind. Researchers at the Indira Gandhi Institute ofDevelopmental Research have used input–output ana-lysis to calculate the CO2 emissions from energyconsumption for different groups of households for theyear 1989–90 (Murthy et al., 1997; Parikh et al., 1997).However, to the best of the authors’ knowledge, thepresent study is the first attempt at examining changes intotal energy requirements, including non-commercialenergy, of different household consumption categoriesin a developing country using input–output analysis atthe disaggregated 100 sector level.
In Fig. 3, total household energy requirements,broken down by direct commercial, direct non-commer-cial and indirect energy requirements for each of thestudy years are presented. As in conventional energystatistics, one observes a very large but decliningproportion of direct non-commercial to direct commer-cial energy use. However, in addition, it is also clear thatthe ratio of indirect energy use to the total rose over thisperiod. This conforms to the pattern observed in mostindustrialized countries.
The average per capita total energy requirement ofprivate consumption increased from 266 kgoe (11.2GJ)Fig. 2. Direct household energy requirements per capita.
S. Pachauri, D. Spreng / Energy Policy 30 (2002) 511–523 517

in 1983–84 to 288 kgoe (12.1GJ) in 1993–94, exhibitingan annual average rate of increase of about 0.8%.During the same period, the level of direct energyrequirements per capita decreased marginally at anaverage rate of –0.3% per annum, but indirect per capitaenergy requirements grew at a rate of 2.2% per year.
Indirect energy requirements made up 41% of totalhousehold energy requirements in 1983–84 but thispercentage increased to 47% by 1993–94. The per capitaindirect energy requirements per main consumptioncategories for the study years show an increasing trendfor all the main consumption categories except clothingand footwear (see Fig. 4). The largest proportion ofindirect energy requirements was for the ‘‘food, bev-erages and tobacco’’ category (more than 40%), which isalso the one that experienced the largest absoluteincrease in total energy requirements. This can be
explained in part by the fast rate of growth of directenergy use in the agricultural sector during this period.Energy requirements of the ‘‘transport and communica-tions’’ group also showed a large increase during thisperiod. For details regarding which sectors are includedin each consumption category refer to Appendix B. Thefollowing section will discuss in greater detail thechanges in total and indirect energy requirements fordifferent consumption categories over the studieddecade.
3.3.1. Comparison with other studiesAs this is the first such study carried out for India,
and is also the first to include non-commercial energyuse, it is difficult to compare the results obtained fromour analysis with other studies. Total per capita house-hold energy requirements in most industrialized nationsfor comparable time periods are a factor 7–10 timeshigher than the value for India determined in this study.Differences in energy requirements arise from differencesin direct and indirect energy use, both of which arelarger in industrialized countries.
Rather than comparing actual numerical values ofenergy requirements for Indian households with those ofother countries, it is interesting to compare some of thetrends in household energy requirements betweencountries. Studies carried out for Netherlands showindirect energy requirements to comprise more than50% of total household energy requirements (Vringeret al., 1995a, b). In India, this share is still slightly lessthan half of the total but has increased rapidly over thestudied decade and will most likely exceed 50% inthe near future. Within the indirect energy category, theshare of basic commodities like food, clothing, andhousing, was lower in the Netherlands in 1990 (Vringeret al., 1995a) as compared to the share determined inthis study of these basic commodities. This seemsreasonable given the vast differences in living standardsbetween the two countries. The only anomalous trend isthe rising share of indirect primary energy requirementsfor food, beverages and tobacco in India. However, thetrends for other basic commodities show that the shareof these in total household energy requirements, bothfor India and the Netherlands, is declining. Similarly,the share of transport and communication is seen to berising for both countries.
3.4. Changes in household energy requirements
To understand the evolution in total and indirectenergy requirements of households during the period1983–84 to 1993–94, we related the changes that haveoccurred to four factors: (1) change in the compositionof the household shopping basket or structure ofconsumption; (2) change in the productive energyintensities of the goods and services consumed; (3)
0
30
60
90
12 0
150
180
21 0
240
270
300
1983 -84 1989-90 1993 -94
En
erg
y in
kg
oe
Indirect Direct Commercial Direct Non-Commercial Total
Fig. 3. Total household primary energy requirements per capita.
Fig. 4. Indirect primary energy requirements per capita for the main
consumption categories.
S. Pachauri, D. Spreng / Energy Policy 30 (2002) 511–523518

change in per capita levels of energy-using activities orthe per capita expenditures on each item; and (4)changes in total population size. For the total and foreach indirect consumption category, we measured thechanges in activity, structure, intensity and populationand calculated the change in energy use that would haveoccurred in response to each factor if the other three hadremained constant at the base year (1983–84) values. Inthis way, we disaggregated the contributions to energyuse made by changes in the shares of householdexpenditure (structure), the primary energy intensity ofeach item (intensity), per capita household expenditures(activity), and population in order to understand therelative importance of these different factors.
The relation used in order to disaggregate the effectsof changes in structure, intensity, activity and popula-tion on energy requirements was
THER ¼X
i
PFCEiPi PFCEi
�TPEIi�P
i PFCEi
POP�POP;
where THER refers to total household energy require-ments, PFCEi=
Pi PFCEi is the share of expenditure on
each item as proportion of the total, TPEIi is totalprimary energy intensity of each sector,
Pi PFCEi=POP
is per capita private final consumption expenditure,POP refers to total population, and PFCE refers toprivate final consumption expenditure.
At the first level, the above analysis was carried out todisaggregate changes in the overall total householdenergy requirements. Results indicate that during thestudied decade, structural changes were responsible for a25% increase in total household energy requirements(see Fig. 5). Changes in productive intensities on theother hand, decreased total household energy require-ments by 16%. However, changes in activity levels asmeasured by real per capita household expenditures,were responsible for a 55% increase in total householdenergy requirements of Indian households during thisperiod. Similarly, population changes led to a 29%increase in total energy use. It is clear from these figuresthat increases in activity levels in Indian householdswere the largest contributor to the increase in energyrequirements during the study period.
A similar disaggregation was also carried out onchanges in indirect energy requirements for each of themain consumption categories. The results of thatanalysis can be seen in Fig. 6. In general, for most ofthe categories, other than ‘‘clothing and footwear’’,structural changes were responsible for a decrease inindirect energy requirements. Changes in energy inten-sity also led to a decrease in energy use for all categoriesexcept ‘‘food, beverages and tobacco’’, where it led to a34% increase, and the ‘‘medical and hygiene’’ categorywhere it led to a smaller increase. Changes in activitylevels and population exerted an upward pull on energyuse for each category.
While it is also difficult to directly compare results ofthis study with those of other Indian studies, as mosttend to exclude non-commercial energy use, a recentpaper using decomposition analysis for total commercialprimary and final energy consumption and carbonemissions for India between 1970 and 1995 reached asimilar conclusion regarding the importance of changesin activity levels in driving the increase in energy use andcarbon emissions during this period (Nag & Parikh,2000). Nag and Parikh conclude that ‘‘India is likely tobecome more and more important as a global energyconsumer and therefore autonomous technical changewill not be enough to attain the desired level of efficiencyand emissions reduction’’. Mukhopadhyay and Chak-raborty (1999) have carried out a structural decomposi-tion analysis of energy consumption changes in Indiabetween 1973–74 and 1991–92. Their analysis alsoconcludes that shifts in final demand levels were themost important driver of increase in total commercialenergy consumption during the period between 1973–74and 1993–94.
4. Discussion and conclusions
The paper presents direct and indirect energy require-ments of Indian households during the decade from1983–84 to 1993–94 and disaggregates the changes intotal energy use during this period by structure,intensity, activity and population effects. Results in-dicate that rising real per capita expenditures, which werefer to as the activity effect, has been the largestcontributor to increasing energy requirements duringthis period. An overall 43% increase in real per capita
0
20
40
60
80
100
120
140
160
180
200
1983-84 1989-90 1993-94
Structural change Intensity change
Activity change Population change
Actual change
Fig. 5. Index values for the decomposition of changes in total
household energy requirements.
S. Pachauri, D. Spreng / Energy Policy 30 (2002) 511–523 519

household expenditures over the study period translatedinto an 8% increase in per capita total energyrequirements, implying an expenditure elasticity ofabout 0.19 over this period. Future increases inexpenditure levels will lead to further increases inhousehold energy requirements.
Our findings also indicate that the intensity effects ledto a slight decrease in total energy use during thisperiod but the structure, activity and population effectsled to a large increase in total energy requirements.Findings from the disaggregation of indirect energy usefor each of the consumption categories are similar tothose for total energy use, with the exception of thecategory ‘‘food, beverages and tobacco’’ and ‘‘clothingand footwear’’. The food category comprised almosthalf of the indirect energy requirements of Indianhouseholds and also experienced the largest increasedue to the fact that energy intensity for most of theagricultural and food sectors also increased during thisperiod. Thus, the combined effect of increasing expen-ditures on food and rising energy intensities in thissector led to a large increase in energy requirements forthis consumption category. In fact, the combination ofdirect energy needs for cooking and the indirect energyrequirements of the ‘‘food, beverages and tobacco’’consumption category make up about 60–65% of totalhousehold energy needs. While, food remains a basicnecessity whose consumption must increase givenincreasing populations levels in India and widespreadpoverty, the results of this study indicate that large
energy savings can be realised by increasing theefficiency of energy use both in the food producingand manufacturing sectors, as well as in food prepara-tion. This requires putting in place appropriate energypricing policies that encourage energy conservation,especially for agricultural users; adopting newer moreenergy efficient technologies in upstream sectors thatprovide inputs to the agricultural sectors (for e.g.fertilisers and pesticides); and encouraging the use ofmore sophisticated direct fuels and appliances forcooking.
‘‘Clothing and footwear’’ was the second categorythat exhibited changes contrary to the average duringthis decade. This was the only category for which percapita indirect energy requirements decreased. Moreinterestingly, this was the only category for which realper capita expenditure levels remained almost constantduring the studied decade. In order to better understandthis trend, we looked at some of the physical textileconsumption data for India during this decade. Datafrom the World Apparel Fibre Consumption Survey ofthe FAO (FAO, 1996) shows that for the studied decade,per capita availability of fibres increased only margin-ally. In addition, a structural change within this sectortook place during this decade, with larger increase in theconsumption of natural fibres during the late 1980s, buta decrease in the same during the early to mid 1990s anda larger increase in the consumption in man-made fibresduring this period. Greater durability of man-madefibres might, in part, be responsible for the almost
Fig. 6. Impacts of changes in structure, intensity, activity and population on different categories of indirect household energy requirements.
S. Pachauri, D. Spreng / Energy Policy 30 (2002) 511–523520

constant per capita expenditures for this category duringthe studied decade.
The results presented here are for the total of allhouseholds in India or for the average per capitahousehold energy requirement. However, given the highdegree of variation in living conditions and consumptionlevels across different groups of households and urban/rural areas in India, an important area for futureresearch will be to carry out a similar analysis separatelyfor urban and rural households and households belong-ing to different income classes or geographical regions.In addition, the analysis can be extended to calculate theenvironmental consequences (insult) resulting from totalenergy consumption of households. These environmen-tal emissions gain increasing significance at the house-hold scale (especially for the large majority of the ruralpopulation that still use non-commercial energy) be-cause of their serious health impacts. This paper makesa first step towards understanding the causes of changesin total household energy requirements. Future researchwill provide more insights into the drivers of totalenergy consumption across different groups of house-holds by looking at household consumption from amore micro perspective.
Acknowledgements
The authors would like to acknowledge the Alliancefor Global Sustainability, a university research partner-ship between the Massachusetts Institute of Technology(MIT), the Swiss Federal Institutes of Technology(ETH), and the University of Tokyo (UT), for partialfunding of the work reported in this paper. We wouldalso like to thank Eberhard Jochem for valuablecomments made on earlier drafts.
Appendix A. Technical note on input–output
exercise: conversion of sectoral energy transactions from
value units to physical units
This note describes the various steps taken tocalculate direct and total energy intensities for Indiausing input–output data by directly incorporating theenergy usage patterns for each activity/sector in physicalterms into the input–output tables of the economy. Theexercise was performed on the 115-sector input–outputtransactions matrix of the Indian economy, published bythe Central Statistical Organisation, Department ofStatistics, Ministry of Planning, Government of Indiafor the years 1983–84, 1989–90 and 1993–94. Theexercise used sectoral energy transactions (in valueterms) reported in the matrices as the starting point,and then converted these values into physical quantitiesof energy used. These physical quantities replaced the
original values of energy transactions in the 115-sectormatrix, and the modified transactions matrix was used tocompute a technology coefficient matrix, which was usedas the basis of the input–output energy analysis. The follo-wing describes in detail the transformation of sectoralenergy value transactions into physical quantities.
The original matrices provided information on fossil-fuel usage by each of the sectors in terms of the Rupeevalues (current prices) of coal and lignite (Sector 23),crude petroleum and natural gas (Sector 24), petroleumproducts (Sector 52), electricity (Sector 84) and gas(Sector 85) used by each sector during each of the threeaccounting years 1983–84, 1989–90 and 1993–94. Thecoal classification included all varieties of coal, includingcoking coal. The petroleum products classification is,again, an aggregated one, inclusive of all refineryproducts.
(1) Coal and lignite. Data on the sectoral consumptionof various types of coal and lignite was limited. The datafor some sectors was available in the CMIE and CSOpublications and TEDDY. Since data on sectoralconsumption of various different types of coal for allsectors was not available, to start with the physicalquantities of coal was allotted to those sectors for whichphysical data was available. These related to the largestconsumers of coal such as the electricity sector, iron andsteel, etc. In the next step, and average price of coal wasestimated for each of the years based on the availablephysical data and monetary values in the input–outputtables. Finally, monetary values were divided by thecalculated average price to arrive at the physical flows.
Lignite production data provided information on thetotal lignite produced and consumed within the country.In addition, the CEA General Reviews provided data onthe physical quantity of lignite consumed by theelectricity sector, which was approximately 65% of thetotal. The remaining quantity of lignite was assigned tothe manufacturing sector as a share of total coalconsumption of each sector. The fractions used were0.035 for 1983–84, 0.05 for 1989–90 and 0.075 for 1993–94.
(2) Crude petroleum and natural gas. Crude petroleumand natural gas flows were almost entirely shown as aninput into the petroleum products activity, as was to beexpected, with some small values feeding into severalother sectors. These flows were interpreted as theamount of natural gas being directly consumed by thesesectors. For some sectors (large consumers such asfertilisers and electricity sector) data on the physicalquantities of natural gas consumed for the differentyears was available. For the other sectors for whichphysical flows were not available physical quantities ofnatural gas use were allotted in proportion to themonetary or value flows from the relevant sectors.
(3) Petroleum products. The conversion exercise forpetroleum products involved an additional step. A
S. Pachauri, D. Spreng / Energy Policy 30 (2002) 511–523 521
distinction had to be made between categories ofdistillates (light, middle and heavy). The demand forfuels by the production activities (intermediate demand)in the system was taken to consist of furnace oil (FO),LSHS (both heavy distillates) and HSD and LDO(middle distillates) and LPG and Naphtha (lightdistillates). The final demand component for petroleumproducts was assumed to consist of LDO (middle),motor spirit and kerosene (light distillates).
For all production sectors the following procedurewas used. The document Indian Petroleum and NaturalGas Statistics (P&NGS) (1989–90 and 1993–94) pro-vided us some idea of the usage patterns of refineryproducts by some of the production sectors. In addition,the CMIE and CSO publications also provided somedata on the physical consumption of selected petroleumproducts by different sectors. The prices of variousdistillates were also obtained from the same sources. Thevalue of petroleum product usage provided by theinput–output matrix was decomposed into HSD and FOcomponents, using the value distributions obtained fromthe P&NG Statistics. Since this value decompositionwas not available for all sectors separately, somejudgements about usage patterns were necessary. Thefinal result was, therefore, a combination of P&NGSdistributions applied to as many sectors as possible andown judgements for the rest of the sectors. The rupeevalue for different petroleum products thus obtainedwere converted to physical units (tonnes) using the priceinformation described above.
For the final demand components of petroleumproducts, as well as for imports, the value sharesprovided in the P&NG statistics was used to convertthe matrix information on aggregate values intoproduct-wise values, and then to physical quantities,using price information from the same source.
(4) Electricity. Data on electricity consumption bydifferent end-use sectors was culled out from the CMIEand CSO publications, CEA publications and TEDDY.As data for electricity use for each of the 115 sectors wasnot available, price data was also made use of to convertthe value data to physical quantities. In general,quantity data was used wherever available, and forsectors where the disaggregate physical consumptiondata was not available, assumptions were made suchthat price of electricity for like industries/sectors (HT/LT) was taken to be the same. Wherever, possiblecrosschecks were also carried out between calculatedprices (monetary value/physical value) and publisheddata on prices for electricity for different sectors.
(5) Gas. GasFrefers only to Gobar Gas/Biogas(LPG is included in the Petroleum, Products sector andNatural Gas in the Crude Petroleum and Natural Gassector) and is very small in value, hence values inthis sector were not converted from monetary to physicalterms.
A.1. Note on creating a new non-commercial energy usesector and allocating non-commercial energy to thedifferent end-use sectors
For data on the non-commercial energy use by broadsector groupings (industry, services and households) fordifferent years we used the RWEDP database of theFAO. The data was crosschecked with other sources ofpublished data on NCE use in India. Further desegrega-tions to end sectors were done in proportion to totalRupee value of expense on coal and lignite of eachsector. In addition, assumptions regarding, whichsectors are the prime users of non-commercial energywere made based on data on the consumption pattern ofwood fuels in industries from the Wood Energy News(newsletter) of the RWEDP in Asia of the FAO.
Appendix B. Sectoral composition of consumption
categories
1. Food, beverages and tobacco: Paddy, Wheat, Jower,Bajra, Maize, Gram, Pulses, Sugarcane, Groundnut,Jute, Cotton, Tea, Coffee, Rubber, Coconut, Tobac-co, Other Crops, Milk And Milk Products, AnimalServices (Agriculture), Other Livestock Products,Forestry and Logging, Fishing, Sugar, Khandsariand Boora, Hydrogenated Oil, Edible Oil other thanVanaspati, Tea and Coffee Processing, MiscellaneousFood Products, Beverages, Tobacco Products
2. Clothing and footwear: Khadi, Cotton Textile inHandlooms, Cotton Textiles, Woolen Textiles, SilkTextiles, Art Silk, Synthetic Fibre Textiles, Jute,Hemp, Mesta Textiles, Carpet Weaving, Ready MadeGarments, Miscellaneous Textile Products, LeatherFootwear
3. Housing and household effects: Furniture andFixtures, Wood and Wood Products Except Furni-ture, Leather and Leather Products Except Footwear,Rubber Products, Plastic Products, Other Chemicals,Structural Clay Products, Other Non-Metallic Miner-al, Miscellaneous Metal Products, Office Computingand Accounting, Other-Non-Electrical Machinery,Batteries, Electrical Appliances, Other ElectricalMachinery, Watches and Clocks, MiscellaneousManufacturing, Ownership Of Dwellings
4. Medical care and hygiene: Soaps, Cosmetics andGlycerine, Water Supply, Medical and Health Ser-vices, Other Services
5. Transport and communication: CommunicationEquipment, Ships and Boats, Rail Equipment, MotorVehicles, Motor Cycle and Scooter, Bicycles, Cycle-Rikshaw, Other Transport Equipment, Railway Trans-port Service, Other Transport Service, Communication
6. Education and recreation: Paper, Paper Products andNewspapers, Printing Publishing and Allied Activ-
S. Pachauri, D. Spreng / Energy Policy 30 (2002) 511–523522

ities, Electronic Equipment Incl. Television, Hotelsand Restaurants, Education and Research
7. Other services: Trade, Banking, Insurance
References
Bullard, C.W., Herendeen, R., 1975. The energy costs of goods and
services. Energy Policy 3(4), 268–278.
Bush, M.J., 1981. The energy intensities of commodities produced in
Canada. Energy 6, 503–517.
Central Electricity Authority, various issues 1984–85, 1989–90, 1990–
91, 1993–94, 1994–95. Public electricity supply all India statistics.
Government of India, New Delhi.
Central Statistical Organisation, 1990. Input–output transaction table
for 83–84. Government of India, New Delhi.
Central Statistical Organisation, 1997. Input–output transaction table
for 1989–90. Government of India, New Delhi.
Central Statistical Organisation, 2000. Input–output transaction table
for 1993–94. Government of India, New Delhi.
CMIE (Centre for Monitoring the Indian Economy), 1995. (1996),
(1999) India’s energy sector. Mumbai, India.
Common, M.S., Salma, U., 1992. Accounting for changes in
Australian carbon dioxide emissions. Energy Economics 14(3),
217–225.
Denton, R.V., 1975. The energy costs of goods and services in the
Federal Republic of Germany. Energy Policy 3(4), 279–284.
Department of Coal, various issues 1990–91, 1993–94. Annual Report.
Government of India, New Delhi.
FAO, 1997. Regional wood energy development programme in Asia
(RWEDP). Wood Energy Database.
FAO 1996. World apparel fibre consumption survey. FAO, Rome,
Italy.
Gay, P.W., Proops, J.L.R., 1995. Carbon-dioxide production by the
UK economy: an input–output assessment. Applied Energy 44,
113–130.
Goldemberg, J., Johansson, T.B., Reddy, A.K.N., Williams, R.H.,
1988. Energy for a Sustainable World. Wiley Eastern Limited, New
Delhi.
Herendeen, R., Ford, C., Hannon, B., 1981. Energy cost of living,
1972–73. Energy 6 (12), 1433–1450.
Jochem, E., 2000. End-use efficiency. In: UNDP, UNDESA, WEC
(Ed.), World Energy Assessment: Energy and the Challenge of
Sustainability. New York (Chapter 6).
Lenzen, M., 1998. Primary energy and greenhouse gases embodied in
Australian final consumption: an input–output analysis. Energy
Policy 26 (6), 495–506.
Leontief, W.W., 1994. The Structure Of American Society 1919–1929.
Oxford University Press, New York.
Miller, R.E., Blair, P.D., 1985. Input–Output Analysis: Foundations
and Extensions. Englewood Cliffs, Prentice-Hall, NJ.
Ministry of Petroleum and Natural Gas, various issues 1989–90, 1993–
94. Annual Report. Government of India, New Delhi.
Ministry of Power, various issues 1990–91, 1993–94. Annual Report.
Government of India, New Delhi.
Mukhopadhyay, K., Chakraborty, D., 1999. India’s energy consump-
tion changes during 1973/74 to 1991/92. Economic Systems
Research 11 (4), 423–438.
Murthy, N.S, Panda, M.K., Parikh, J.K., 1997. Economic develop-
ment, poverty reduction and carbon emissions in India. Energy
Economics 19, 327–354.
Nag, B., Parikh, J.K., 2000. Indicators of carbon emissions intensity
from commercial energy use in India. Energy Economics 22, 441–
461.
Natarajan, I., 1998. India market demographics report (1998) NCAER
(National Council for Applied Economic Research), New Delhi.
Noorman, K.J., Uiterkamp, T.S. (Eds.) 1998. Green Households?
Domestic Consumers, Environment and Sustainability. Earthscan
Publications Ltd., UK.
Ospelt, C., Knoepfel, I., Spreng, D., 1996. Direkter und indirekter
Energieverbrauch der Haushalte Bulletin SEV/VSE, 7, June, 1996.
Parikh, J.K., Panda, M.K., Murthy, N.S., 1997. Consumption patterns
by income groups and carbon-dioxide implications for India: 1990–
2010. International Journal of Global Energy Issues 9 (4–6), 237–
255.
Peet, N.J., 1993. Input–output methods of energy analysis. Interna-
tional Journal of Global Energy Issues. Special Issue on Energy
Analysis 5 (1), 10–18.
Peet, N.J., Carter, A.J., Baines, J.T., 1985. Energy in the New Zealand
household, 1974–1980. Energy 10 (11), 1197–1208.
Pick, H.J., Becker, P.E., 1975. Direct and indirect use of energy and
materials in engineering and construction. Applied Energy 1 (1),
31–51.
Planning Commission, 1999. Annual report on the working of state
electricity boards and electricity department, Government of India,
New Delhi.
Rao, S.S., Raizada, S.I., Ramanathan, A., 1981. Determination of
energy costs and intensities of and goods and services in the Indian
economyFan input–output approach. In: Chatterji, M. (Ed.),
Energy and Environment in Developing Countries. Wiley, New
York.
Reddy, A., Reddy, B.S., 1994. Substitution of energy carriers for
cooking in Bangalore. Energy 19 (5), 561–571.
RWEDP (Regional Wood Energy Development Programme), 1996.
Wood Energy News 11(2), 16.
Spreng, D., 1988. Net Energy Analysis and the Energy Requirements
of Energy Systems. Praeger Publishers, New York.
Tata Energy Research Institute, 1999. TERI online energy database.
TERI, New Delhi.
Tiwari, P., 2000. An analysis of sectoral energy intensity in India.
Energy Policy 28, 771–778.
Vringer, K., Blok, K., 1995a. The direct and indirect energy
requirements of households in the Netherlands. Energy Policy 23
(10), 893–910.
Vringer, K., Blok, K., 1995b. Consumption and energy-requirement: a
time series for households in the Netherlands from 1948 to 1992.
NW & Sonderzoeksrapport no. 95016, University of Utrecht,
Utrecht.
Vringer, K., Blok, K., 2000. Long-term trends in direct and indirect
household energy intensities: a factor in dematerialisation? Energy
Policy 28, 713–727.
Weber, C., Perrels, A., 2000. Modelling lifestyle effects on energy
demand and related emissions. Energy Policy 28, 549–566.
Wright, D.J., 1974. Goods and services: an input–output analysis.
Energy Policy 2(4), 307–315.
S. Pachauri, D. Spreng / Energy Policy 30 (2002) 511–523 523