
dIM PrIVATE FUNdS INTErIM FINANCIAL STATEMENTS
59
AS AT JUNE 30, 2017 D I M P R I V A T E F U N D S I N T E R I M F I N A N C I A L S T A T E M E N T S
-
Upload
khangminh22 -
Category
Documents
-
view
3 -
download
0
Transcript of dIM PrIVATE FUNdS INTErIM FINANCIAL STATEMENTS

A S A T J U N E 3 0 , 2 0 1 7
d I M P r I V A T E F U N d S I N T E r I M F I N A N C I A L S T A T E M E N T S

The following Desjardins Funds’ Interim Financial Statements have not been subject to a review by the Funds’ external auditors.
I N T E r I M F I N A N C I A L S T A T E M E N T S ( U N A U d I T E d ) | N O T I C E
Discretionary portfolio management is offered by Desjardins Wealth Management, Private Wealth Management and is provided by Desjardins Investment Management Inc., a wholly-owned subsidiary of the Fédération des caisses Desjardins du Québec. Desjardins Investment Management Inc. is registered as a portfolio manager and investment fund manager with the Autorité des marchés financiers (AMF).

T A b L E O F C O N T E N T S
FINANCIAL STATEMENTS AND SCHEDULES OF INVESTMENT PORTFOLIO (UNAUDITED)FIXED INCOME FUNDSDIM Private Bond Fund . . . . . . . . . . . . . . . . . . . . . . . . . . . . . . . . . . . . . . . . . . . . . . . . . . . . . . . . . . . . . . . . . . . . . . . . . . . . . . . . . . . . . . . . . . . . . . . . . . . . . . . . . . . . . . . . . . . . . . . . . . . . . . . . . . 2DIM Private Government Bond Fund . . . . . . . . . . . . . . . . . . . . . . . . . . . . . . . . . . . . . . . . . . . . . . . . . . . . . . . . . . . . . . . . . . . . . . . . . . . . . . . . . . . . . . . . . . . . . . . . . . . . . . . . . . . . . . . . . . . . 5DIM Private Corporate Bond Fund . . . . . . . . . . . . . . . . . . . . . . . . . . . . . . . . . . . . . . . . . . . . . . . . . . . . . . . . . . . . . . . . . . . . . . . . . . . . . . . . . . . . . . . . . . . . . . . . . . . . . . . . . . . . . . . . . . . . . . . 9CANAdIAN EQUITY FUNdSDIM Private Canadian Large Cap Equity Fund . . . . . . . . . . . . . . . . . . . . . . . . . . . . . . . . . . . . . . . . . . . . . . . . . . . . . . . . . . . . . . . . . . . . . . . . . . . . . . . . . . . . . . . . . . . . . . . . . . . . . . . . . . 15DIM Private Canadian Equity Growth Fund . . . . . . . . . . . . . . . . . . . . . . . . . . . . . . . . . . . . . . . . . . . . . . . . . . . . . . . . . . . . . . . . . . . . . . . . . . . . . . . . . . . . . . . . . . . . . . . . . . . . . . . . . . . . . 19DIM Private Canadian Small Cap Equity Fund . . . . . . . . . . . . . . . . . . . . . . . . . . . . . . . . . . . . . . . . . . . . . . . . . . . . . . . . . . . . . . . . . . . . . . . . . . . . . . . . . . . . . . . . . . . . . . . . . . . . . . . . . . 22FOrEIGN EQUITY FUNdSDIM Private U.S. Equity Fund (for taxable accounts) . . . . . . . . . . . . . . . . . . . . . . . . . . . . . . . . . . . . . . . . . . . . . . . . . . . . . . . . . . . . . . . . . . . . . . . . . . . . . . . . . . . . . . . . . . . . . . . . . . . . 25DIM Private U.S. Equity Fund (for non taxable accounts). . . . . . . . . . . . . . . . . . . . . . . . . . . . . . . . . . . . . . . . . . . . . . . . . . . . . . . . . . . . . . . . . . . . . . . . . . . . . . . . . . . . . . . . . . . . . . . . 28DIM Private International Equity Fund . . . . . . . . . . . . . . . . . . . . . . . . . . . . . . . . . . . . . . . . . . . . . . . . . . . . . . . . . . . . . . . . . . . . . . . . . . . . . . . . . . . . . . . . . . . . . . . . . . . . . . . . . . . . . . . . . 31COMPLETION STrATEGY FUNdDIM Private Completion Strategy Fund . . . . . . . . . . . . . . . . . . . . . . . . . . . . . . . . . . . . . . . . . . . . . . . . . . . . . . . . . . . . . . . . . . . . . . . . . . . . . . . . . . . . . . . . . . . . . . . . . . . . . . . . . . . . . . . . . 36bALANCEd FUNdSDIM Private Balanced Fund . . . . . . . . . . . . . . . . . . . . . . . . . . . . . . . . . . . . . . . . . . . . . . . . . . . . . . . . . . . . . . . . . . . . . . . . . . . . . . . . . . . . . . . . . . . . . . . . . . . . . . . . . . . . . . . . . . . . . . . . . . . . . 40DIM Private Monthly Distribution Income Fund. . . . . . . . . . . . . . . . . . . . . . . . . . . . . . . . . . . . . . . . . . . . . . . . . . . . . . . . . . . . . . . . . . . . . . . . . . . . . . . . . . . . . . . . . . . . . . . . . . . . . . . . 43DIM Private Monthly Distribution Growth Fund . . . . . . . . . . . . . . . . . . . . . . . . . . . . . . . . . . . . . . . . . . . . . . . . . . . . . . . . . . . . . . . . . . . . . . . . . . . . . . . . . . . . . . . . . . . . . . . . . . . . . . . . 46
NOTES TO THE FINANCIAL STATEMENTS (UNAUDITED) . . . . . . . . . . . . . . . . . . . . . . . . . . . . . . . . . . . . . . . . . . . . . . . . . . . . . . . . . . . . . . . . . . . . . . . . . . . . . . . . . . . . . . . . . . . . . . . . . . . . . . . . . . . . . 49

The accompanying Notes are an integral part of these financial statements.
2
d I M P r I V A T E b O N d F U N d
STATEMENT OF FINANCIAL POSITION ( U N A U d I T E d )
AS AT JUNE 302017
$
dECEMbEr 312016
$ASSETSCurrent AssetsCash 5,897,706 3,720,573 Investments at fair value through profit or loss (FVTPL) 232,720,827 195,777,640 Interest, dividends and other receivables – 1,947
238,618,533 199,500,160
LIABILITIESCurrent LiabilitiesAccrued expenses 24,590 –
Net Assets Attributable to Holders of Redeemable Units 238,593,943 199,500,160 – per unit (Note 4) 10.55 10.52
Approved on behalf of the Board of Directors ofDesjardins Investment Management Inc.,Manager of the DIM Private FundsVincent P. Hogue, President of the Board of Directorsand Sylvain Thériault, Director
STATEMENT OF COMPrEHENSIVE INCOME ( U N A U d I T E d )
SIx-MONTH PErIOdS ENdEd JUNE 30 2017$
2016$
IncomeInterest for distribution purposes 9,809 5,219 Distributions from underlyning funds 2,229,782 2,108,192 Changes in fair value: Net realized gain (loss) on investments – 353,001 Net unrealized gain (loss) on investments 149,060 2,912,578
2,388,651 5,378,990
ExpensesAudit fees 3,536 3,302 Unitholders’ reporting costs 42 10 Filing fees 11,925 2,017 Administration fees 14,827 12,267
30,330 17,596
Increase (Decrease) in Net Assets Attributable to Holders of Redeemable Units 2,358,321 5,361,394 – per unit 0.12 0.29
Average Number of Redeemable Units 20,459,071 18,763,510
STATEMENT OF CHANGES IN FINANCIAL POSITION ( U N A U d I T E d )
SIx-MONTH PErIOdS ENdEd JUNE 30 2017 2016 $ $
Net Assets Attributable to Holders of Redeemable Units, Beginning of Period 199,500,160 202,133,137
Increase (Decrease) in Net Assets Attributable to Holders of Redeemable Units 2,358,321 5,361,394
Redeemable Unit Transactions Proceeds from sale of redeemable units 45,819,739 6,756,120 Reinvested distributions 2,212,643 2,102,417 Amounts paid for redeemable units redeemed (9,084,277) (10,394,246)
38,948,105 (1,535,709)Distributions to Holders of Redeemable UnitsNet investment income (2,212,643) (2,102,449)
Net Assets Attributable to Holders of Redeemable Units, End of Period 238,593,943 203,856,373
STATEMENT OF CASH FLOWS ( U N A U d I T E d )
SIx-MONTH PErIOdS ENdEd JUNE 30 2017 2016 $ $
Cash Flows from (used in) Operating ActivitiesIncrease (decrease) in net assets attributable to holders of redeemable units 2,358,321 5,361,394 Adjustments for: Net realized gain (loss) – (353,001) Net unrealized gain (loss) (149,060) (2,912,578) Non-cash distributions from investments (2,229,782) (2,108,192)Proceeds from sale/maturity of investments – 22,512,720 Investments purchased (34,564,345) (17,915,001)Interest, dividends and other receivables 1,947 2,641 Accrued expenses 24,590 11,834 Net Cash Flows from (used in) Operating Activities (34,558,329) 4,599,817
Cash Flows from (used in) Financing ActivitiesProceeds from sale of redeemable units 45,819,739 6,756,120 Amounts paid for redeemable units redeemed (9,084,277) (10,394,246)Distributions paid to holders of redeemable units net of reinvested distributions – (32)Net Cash Flows from (used in) Financing Activities 36,735,462 (3,638,158)
Increase (decrease) in cash/bank overdraft 2,177,133 961,659 Cash (bank overdraft), beginning of period 3,720,573 527,820 Cash (Bank Overdraft), End of Period 5,897,706 1,489,479
Supplemental Information on Cash Flows from (used in) Operating ActivitiesInterest received 6,172 1,543 Interest paid – 653
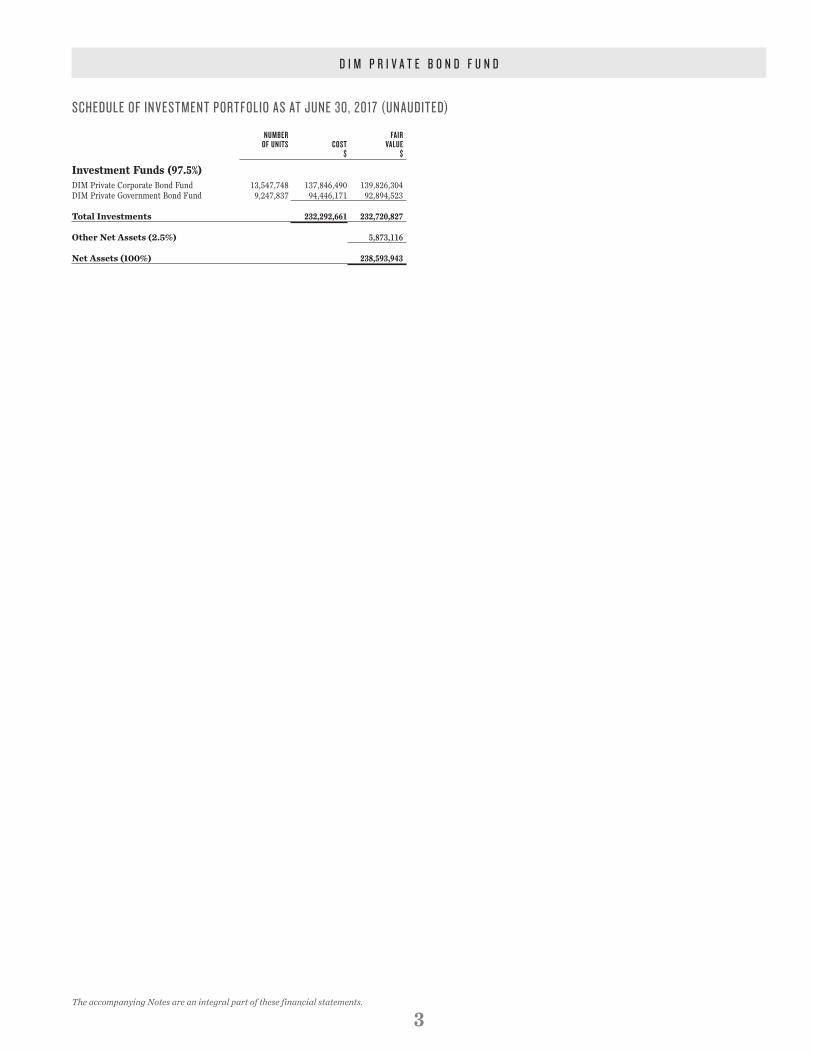
SCHEDULE OF INVESTMENT PORTFOLIO AS AT JUNE 30, 2017 (UNAUDITED)
The accompanying Notes are an integral part of these financial statements.
d I M P r I V A T E b O N d F U N d
3
NUMBER FAIR OF UNITS COST VALUE $ $
Investment Funds (97.5%)DIM Private Corporate Bond Fund 13,547,748 137,846,490 139,826,304DIM Private Government Bond Fund 9,247,837 94,446,171 92,894,523
Total Investments 232,292,661 232,720,827
Other Net Assets (2.5%) 5,873,116
Net Assets (100%) 238,593,943

NOTES TO THE FINANCIAL STATEMENTS – SPECIFIC INFORMATION (UNAUDITED)
d I M P r I V A T E b O N d F U N d
4
Strategy in Using Financial InstrumentsInvestment ObjectiveProvide both a regular income and long-term capital appreciation while emphasizing risk management.
In order to meet the investment objective, the Fund invests in Canadian fixed income funds.
Financial Instruments Measured at Fair Value (Note 8)Hierarchy of Financial Instruments Measured at Fair ValueThe following tables categorize the Fund’s financial assets fair value measurement according to a three-level hierarchy. The methodology used for valuing securities is not necessarily an indication of the risk associated with investing in those securities. Fair value measurement is described in the “Significant Accounting Policies” section of Note 2.
Investment Measured at Fair Value at the End of the Period, within the Following Levels:
JUNE 30, 2017 LEVEL 1 LEVEL 2 LEVEL 3 TOTAL$ $ $ $
FINANCIAL ASSETS AT FVTPLINVESTMENT FUNdS – 232,720,827 – 232,720,827 TOTAL – 232,720,827 – 232,720,827
DECEMBER 31, 2016 LEVEL 1 LEVEL 2 LEVEL 3 TOTAL$ $ $ $
FINANCIAL ASSETS AT FVTPLINVESTMENT FUNdS – 195,777,640 – 195,777,640TOTAL – 195,777,640 – 195,777,640
Transfers between Levels 1 and 2During the periods ended June 30, 2017 and December 31, 2016, there were no transfers of securities between Levels 1 and 2.
Investment Entities (Note 2)Total values of index-based investments, mortgage-backed securities, asset-backed securities, investment funds (including limited partnerships) and master asset vehicles (included in the bonds) in the table “Investment Measured at Fair Value within the Levels” also represent the fair value of investments in structured entities.
Financial Instruments Risks (Note 8)As the majority of the Fund’s Net Assets Attributable to Holders of Redeemable Units are invested in underlying funds, the Fund may be indirectly exposed to currency, interest, concentration or credit risk. Thus, only direct exposure to risks arising from the Fund’s financial instruments is presented. To obtain the detail of underlying funds’ risks, you can view the underlying funds’ financial statements presented in this report.
Underlying Funds Risk ManagementThe Fund’s portfolio advisor makes sure that the underlying funds’ portfolio manager manages financial risks. Each month, the Fund’s portfolio advisor receives the underlying funds’ investment portfolios to analyze the management style and compares performance against the Fund’s benchmarks. Every quarter, the Fund’s portfolio advisor receives detailed quarterly documents featuring an analysis of performance, sector allocations and the underlying funds’ top positions.
Currency RiskAs at June 30, 2017 and December 31, 2016, the majority of the Fund’s financial assets and liabilities are denominated in Canadian dollars. As a result, the Fund is not significantly exposed to currency risk.
Interest Rate RiskAs at June 30, 2017 and December 31, 2016, the majority of the Fund’s financial assets and liabilities are non-interest bearing. As a result, the Fund is not significantly exposed to interest rates risk.
Concentration RiskAs at June 30, 2017 and December 31, 2016, the majority of the Fund’s financial assets and liabilities are invested in underlying funds.
Price RiskThe Manager’s estimate of the impact on Net Assets Attributable to Holders of Redeemable Units as a result of a reasonably possible change in benchmarks, using a historical beta coefficient (a measure of the sensitivity of a security in comparison to the market) between the Fund’s return as compared to the return of the Fund’s benchmarks, with all other variables held constant, is included in the following table. A 36-month regression analysis has been utilized to estimate the historical beta coefficient. The regression analysis uses data based on the monthly returns of the Fund.
CHANGE IN PRICE
IMPACT ON NET ASSETS ATTRIBUTABLE TO HOLDERS OF REDEEMABLE UNITS
BENCHMARKS %JUNE 30, 2017
$DECEMBER 31, 2016
$
FTSE TMX Canada Short Term Government 1.00 560,696 467,261
FTSE TMX Canada Mid Term Government 1.00 560,696 467,261
FTSE TMX Canada Short Term Corporate 1.00 560,696 467,261
FTSE TMX Canada Mid Term Corporate 1.00 560,696 467,261
When there is more than one benchmark, the effect of each benchmark must be considered individually, as each benchmark might fluctuate independently from the others.
In practice, actual trading results may differ from these sensitivity analyses and the differences could be significant.
Credit RiskAs at June 30, 2017 and December 31, 2016, the Fund had no significant investments in either fixed-income securities, money market securities and derivative financial instruments. As a result, the Fund is not significantly exposed to credit risk.
Liquidity RiskFor further information on maturities of financial liabilities and liquidity risk management of the Fund, please refer to Note 8 “Financial Instruments Disclosures”.

The accompanying Notes are an integral part of these financial statements.
5
d I M P r I V A T E G O V E r N M E N T b O N d F U N d
STATEMENT OF FINANCIAL POSITION ( U N A U d I T E d )
AS AT JUNE 302017
$
dECEMbEr 312016
$ASSETSCurrent AssetsCash 1,822,187 3,855,757 Investments at fair value through profit or loss (FVTPL) 1,107,786,498 826,132,168 Receivable for investments sold 173,614,172 –Interest, dividends and other receivables 2,539,857 1,819,100
1,285,762,714 831,807,025
LIABILITIESCurrent LiabilitiesAccrued expenses 472,800 60,112 Payable for investments purchased 180,867,598 –
181,340,398 60,112
Net Assets Attributable to Holders of Redeemable Units 1,104,422,316 831,746,913 – per unit (Note 4) 10.05 10.05
Approved on behalf of the Board of Directors ofDesjardins Investment Management Inc.,Manager of the DIM Private FundsVincent P. Hogue, President of the Board of Directorsand Sylvain Thériault, Director
STATEMENT OF COMPrEHENSIVE INCOME ( U N A U d I T E d )
SIx-MONTH PErIOdS ENdEd JUNE 30 2017$
2016$
IncomeInterest for distribution purposes 8,750,175 10,778,376 Changes in fair value: Net realized gain (loss) on investments (35,016) 8,048,649 Net unrealized gain (loss) on investments (2,335,825) 6,420,472
6,379,334 25,247,497
ExpensesAudit fees 3,535 3,302 Custodian fees 60,271 58,806 Unitholders’ reporting costs 12,680 15,528 Filing fees 74,477 25,782 Administration fees 718,027 802,632
868,990 906,050 Expenses absorbed by the Manager (25,819) (25,368)
843,171 880,682
Increase (Decrease) in Net Assets Attributable to Holders of Redeemable Units 5,536,163 24,366,815 – per unit 0.06 0.25
Average Number of Redeemable Units 95,719,139 98,477,464
STATEMENT OF CHANGES IN FINANCIAL POSITION ( U N A U d I T E d )
SIx-MONTH PErIOdS ENdEd JUNE 30 2017 2016 $ $
Net Assets Attributable to Holders of Redeemable Units, Beginning of Period 831,746,913 1,083,584,499
Increase (Decrease) in Net Assets Attributable to Holders of Redeemable Units 5,536,163 24,366,815
Redeemable Unit Transactions Proceeds from sale of redeemable units 295,801,190 103,463,466 Reinvested distributions 8,273,491 10,275,046 Amounts paid for redeemable units redeemed (28,489,148) (224,032,854)
275,585,533 (110,294,342)
Distributions to Holders of Redeemable UnitsNet investment income (8,446,293) (10,453,967)
Net Assets Attributable to Holders of Redeemable Units, End of Period 1,104,422,316 987,203,005
STATEMENT OF CASH FLOWS ( U N A U d I T E d )
SIx-MONTH PErIOdS ENdEd JUNE 30 2017 2016 $ $
Cash Flows from (used in) Operating ActivitiesIncrease (decrease) in net assets attributable to holders of redeemable units 5,536,163 24,366,815 Adjustments for: Net realized gain (loss) 35,016 (8,048,649) Net unrealized gain (loss) 2,335,825 (6,420,472)Proceeds from sale/maturity of investments 7,230,843,692 4,838,099,808 Investments purchased (7,514,868,863) (4,726,761,924)Receivable for investments sold (173,614,172) –Interest, dividends and other receivables (720,757) 170,789 Accrued expenses 412,688 333,944 Payable for investments purchased 180,867,598 –Net Cash Flows from (used in) Operating Activities (269,172,810) 121,740,311
Cash Flows from (used in) Financing ActivitiesProceeds from sale of redeemable units 295,801,190 103,463,466 Amounts paid for redeemable units redeemed (28,489,148) (224,032,854)Distributions paid to holders of redeemable units net of reinvested distributions (172,802) (178,921)Net Cash Flows from (used in) Financing Activities 267,139,240 (120,748,309)
Increase (decrease) in cash/bank overdraft (2,033,570) 992,002 Cash (bank overdraft), beginning of period 3,855,757 3,025,209 Cash (Bank Overdraft), End of Period 1,822,187 4,017,211
Supplemental Information on Cash Flows from (used in) Operating ActivitiesInterest received 8,020,221 10,950,760 Interest paid 1,461 1,949

SCHEDULE OF INVESTMENT PORTFOLIO AS AT JUNE 30, 2017 (UNAUDITED)
The accompanying Notes are an integral part of these financial statements.
d I M P r I V A T E G O V E r N M E N T b O N d F U N d
6
PAR FAIR VALUE COST VALUE $ $
Mortgage-Backed Securities (12.5%)NHA Laurentian Bank of Canada 1.300%, 2021-10-01 CAD 47,490,982 47,253,393 46,658,087NHA Merrill Lynch 1.250%, 2020-12-01 CAD 21,520,024 21,364,179 21,276,288 1.400%, 2021-05-01 CAD 27,503,345 27,470,838 27,212,057 1.420%, 2022-06-01 CAD 44,000,000 43,881,021 43,231,716
Total Mortgage-Backed Securities 139,969,431 138,378,148
Money Market Securities (2.4%)Ontario Treasury Bills 2018-04-04 CAD 27,000,000 26,840,300 26,840,300
Total Investments (100.3%) 1,117,849,207 1,107,786,498
Other Net Assets (-0.3%) (3,364,182)
Net Assets (100%) 1,104,422,316
PAR FAIR VALUE COST VALUE $ $
Bonds (85.4%)Government of Canada (37.8%)Canada Housing Trust 2.000%, 2019-12-15 CAD 170,000,000 173,483,300 172,711,820Government of Canada 1.000%, 2027-06-01 CAD 252,500,000 237,759,012 235,331,053PSP Capital 1.730%, 2022-06-21 CAD 9,000,000 8,999,997 8,909,317 420,242,309 416,952,190Provincial Governments and Crown Corporations (47.5%)Financement-Québec 2.450%, 2019-12-01 CAD 20,000,000 20,646,770 20,493,878Hydro-Québec 1.000%, 2019-05-25 CAD 100,000,000 99,856,606 99,436,106 stripped, 2027-02-15 CAD 37,000,000 27,907,747 28,492,198Newfoundland and Labrador Hydro stripped, 2018-04-17 CAD 5,000,000 4,966,542 4,948,218OPB Finance Trust Series D, 1.880%, 2022-02-24 CAD 4,000,000 3,982,989 3,971,074 Series E, 2.950%, 2026-02-02 CAD 5,000,000 5,324,800 5,147,154Province of Alberta 1.250%, 2020-06-01 CAD 50,790,000 50,586,840 50,382,311 2.850%, 2024-01-19 CAD 25,300,000 26,711,238 26,269,749Province of British Columbia 2.300%, 2026-06-18 CAD 25,000,000 25,491,168 24,928,256Province of New-Brunswick 2.350%, 2027-08-14 CAD 23,260,000 23,253,487 22,764,690Province of Nova Scotia 2.150%, 2025-06-01 CAD 8,000,000 7,927,303 7,885,138Province of Ontario floating rate, 2021-10-27 CAD 20,000,000 20,055,211 20,079,200 1.350%, 2022-03-08 CAD 68,500,000 67,777,398 66,956,376 1.950%, 2023-01-27 CAD 75,000,000 76,035,500 74,808,002 2.850%, 2023-06-02 CAD 30,000,000 31,902,774 31,308,840 2.600%, 2027-06-02 CAD 15,000,000 15,461,782 15,186,127Province of Québec 2.750%, 2027-09-01 CAD 15,000,000 15,637,950 15,399,758Province of Saskatchewan 2.650%, 2027-06-02 CAD 6,000,000 6,199,016 6,082,725 529,725,121 524,539,800Municipalities and Semi-Public Institutions (0.1%)Régie d’Assainissement des Eaux du Bassin de La Prairie 1.600%, 2019-09-28 CAD 1,082,000 1,072,046 1,076,060
Total Bonds 951,039,476 942,568,050

NOTES TO THE FINANCIAL STATEMENTS – SPECIFIC INFORMATION (UNAUDITED)
d I M P r I V A T E G O V E r N M E N T b O N d F U N d
7
Strategy in Using Financial InstrumentsInvestment ObjectiveProvide regular income while emphasizing risk management.
Financial Instruments Measured at Fair Value (Note 8)Hierarchy of Financial Instruments Measured at Fair ValueThe following tables categorize the Fund’s financial assets fair value measurement according to a three-level hierarchy. The methodology used for valuing securities is not necessarily an indication of the risk associated with investing in those securities. Fair value measurement is described in the “Significant Accounting Policies” section of Note 2.
Investment Measured at Fair Value at the End of the Period, within the Following Levels:
JUNE 30, 2017 LEVEL 1 LEVEL 2 LEVEL 3 TOTAL$ $ $ $
FINANCIAL ASSETS AT FVTPLbONdS 941,491,990 1,076,060 – 942,568,050 MOrTGAGE-bACKEd
SECUrITIES 138,378,148 – – 138,378,148 MONEY MArKET SECUrITIES 26,840,300 – – 26,840,300 TOTAL 1,106,710,438 1,076,060 – 1,107,786,498
DECEMBER 31, 2016 LEVEL 1 LEVEL 2 LEVEL 3 TOTAL$ $ $ $
FINANCIAL ASSETS AT FVTPLbONdS 467,388,017 18,295,688 – 485,683,705MOrTGAGE-bACKEd
SECUrITIES 316,534,383 – – 316,534,383MONEY MArKET SECUrITIES 23,914,080 – – 23,914,080TOTAL 807,836,480 18,295,688 – 826,132,168
Transfers between Levels 1 and 2During the periods ended June 30, 2017 and December 31, 2016, there were no transfers of securities between Levels 1 and 2.
Investment Entities (Note 2)Total values of index-based investments, mortgage-backed securities, asset-backed securities, investment funds (including limited partnerships) and master asset vehicles (included in the bonds) in the table “Investment Measured at Fair Value within the Levels” also represent the fair value of investments in structured entities.
Financial Instruments Risks (Note 8)Currency RiskAs at June 30, 2017 and December 31, 2016, the majority of the Fund’s financial assets and liabilities are denominated in Canadian dollars. As a result, the Fund is not significantly exposed to currency risk.
Interest Rate RiskThe following table summarizes the Fund’s exposure to interest rate risk. It includes the Fund’s financial assets and liabilities at fair value, categorized by the earlier of contractual re-pricing or maturity dates. The table also illustrates the impact on the Net Assets Attributable to Holders of Redeemable Units, had prevailing interest rates changed by 0.25%, assuming a parallel shift in the yield curve, with all other variables held constant.
LESS THAN 1 YEAR 1 TO 5 YEARS 5 TO 10 YEARS GREATER THAN 10 YEARS TOTAL
IMPACT ON NET ASSETS ATTRIBUTABLE
TO HOLDERS OF REDEEMABLE UNITS
$ $ $ $ $ $
JUNE 30, 2017 53,689,905 562,315,090 455,439,242 38,164,448 1,109,608,685 14,218,894 dECEMbEr 31, 2016 27,769,837 387,222,069 405,313,000 9,683,019 829,987,925 9,770,661
In practice, actual trading results may differ from these sensitivity analyses and the differences could be significant.

NOTES TO THE FINANCIAL STATEMENTS – SPECIFIC INFORMATION (UNAUDITED) (CONTINUED)
d I M P r I V A T E G O V E r N M E N T b O N d F U N d
8
Concentration RiskThe following tables summarize the concentration risk, as a percentage of the Fund’s Net Assets Attributable to Holders of Redeemable Units:
JUNE 30, 2017MARKET SEGMENT %
DECEMBER 31, 2016MARKET SEGMENT %
Bonds Provincial Governments
and Crown Corporations 47.5 Government of Canada 37.8 Municipalities and
Semi-Public Institutions 0.1 Mortgage-Backed Securities 12.5 Money Market Securities 2.4 Other Net Assets (0.3)
Bonds Provincial Governments
and Crown Corporations 39.4 Government of Canada 16.8 Municipalities and
Semi-Public Institutions 2.2 Mortgage-Backed Securities 38.0 Money Market Securities 2.9 Other Net Assets 0.7
TOTAL 100 TOTAL 100
Price RiskThe Fund may trade in financial instruments and take positions in over-the-counter instruments.
The Manager’s estimate of the impact on Net Assets Attributable to Holders of Redeemable Units as a result of a reasonably possible change in benchmarks, using a historical beta coefficient (a measure of the sensitivity of a security in comparison to the market) between the Fund’s return as compared to the return of the Fund’s benchmarks, with all other variables held constant, is included in the following table. A 36-month regression analysis has been utilized to estimate the historical beta coefficient. The regression analysis uses data based on the monthly returns of the Fund.
CHANGE IN PRICE
IMPACT ON NET ASSETS ATTRIBUTABLE TO HOLDERS OF REDEEMABLE UNITS
BENCHMARKS %JUNE 30, 2017
$DECEMBER 31, 2016
$
FTSE TMX Canada Short Term Government 1.00 5,301,227 3,919,227
FTSE TMX Canada Mid Term Government 1.00 5,301,227 3,919,227
When there is more than one benchmark, the effect of each benchmark must be considered individually, as each benchmark might fluctuate independently from the others.
In practice, actual trading results may differ from these sensitivity analyses and the differences could be significant.
Credit RiskThe Fund’s credit risk is mainly concentrated in fixed-income securities. Their fair values include consideration of the issuers’ creditworthiness and accordingly, represent the Fund’s maximum exposure to credit risk.
Portfolio’s Fixed-Income Securities by Credit Rating Category
CREDIT RATING PERCENTAGE OF FIXED-INCOME SECURITIES
JUNE 30, 2017%
DECEMBER 31, 2016 %
AAA 54 62AA 24 25A 22 13TOTAL 100 100
Liquidity RiskFor further information on maturities of financial liabilities and liquidity risk management of the Fund, please refer to Note 8 “Financial Instruments Disclosures”.

The accompanying Notes are an integral part of these financial statements.
9
d I M P r I V A T E C O r P O r A T E b O N d F U N d
STATEMENT OF FINANCIAL POSITION ( U N A U d I T E d )
AS AT JUNE 302017
$
dECEMbEr 312016
$ASSETSCurrent AssetsCash 27,485,379 14,225,327 Investments at fair value through profit or loss (FVTPL) 2,386,572,769 1,760,522,625 Interest, dividends and other receivables 11,385,931 10,429,514
2,425,444,079 1,785,177,466
LIABILITIESCurrent LiabilitiesAccrued expenses 415,904 –Payable for investments purchased 6,335,263 –
6,751,167 –
Net Assets Attributable to Holders of Redeemable Units 2,418,692,912 1,785,177,466 – per unit (Note 4) 10.32 10.28
Approved on behalf of the Board of Directors ofDesjardins Investment Management Inc.,Manager of the DIM Private FundsVincent P. Hogue, President of the Board of Directorsand Sylvain Thériault, Director
STATEMENT OF COMPrEHENSIVE INCOME ( U N A U d I T E d )
SIx-MONTH PErIOdS ENdEd JUNE 30 2017$
2016$
IncomeInterest for distribution purposes 23,498,746 14,992,363 Distributions from underlyning funds 3,921,758 920,851 Changes in fair value: Net realized gain (loss) on investments 2,227,939 (389,090) Net unrealized gain (loss) on investments (394,257) 23,911,380
29,254,186 39,435,504
ExpensesAudit fees 3,535 3,302 Custodian fees 112,520 64,044 Unitholders’ reporting costs 27,640 18,956 Filing fees 179,538 96,234 Administration fees 1,444,401 974,631
1,767,634 1,157,167
Increase (Decrease) in Net Assets Attributable to Holders of Redeemable Units 27,486,552 38,278,337 – per unit 0.14 0.31
Average Number of Redeemable Units 203,508,353 121,547,476
STATEMENT OF CHANGES IN FINANCIAL POSITION ( U N A U d I T E d )
SIx-MONTH PErIOdS ENdEd JUNE 30 2017 2016 $ $
Net Assets Attributable to Holders of Redeemable Units, Beginning of Period 1,785,177,466 1,064,244,821
Increase (Decrease) in Net Assets Attributable to Holders of Redeemable Units 27,486,552 38,278,337
Redeemable Unit Transactions Proceeds from sale of redeemable units 715,882,646 387,582,244 Reinvested distributions 24,206,962 13,487,740 Amounts paid for redeemable units redeemed (109,562,005) (66,619,023)
630,527,603 334,450,961
Distributions to Holders of Redeemable UnitsNet investment income (24,498,709) (13,630,749)
Net Assets Attributable to Holders of Redeemable Units, End of Period 2,418,692,912 1,423,343,370
STATEMENT OF CASH FLOWS ( U N A U d I T E d )
SIx-MONTH PErIOdS ENdEd JUNE 30 2017 2016 $ $
Cash Flows from (used in) Operating ActivitiesIncrease (decrease) in net assets attributable to holders of redeemable units 27,486,552 38,278,337 Adjustments for: Net realized gain (loss) (2,227,939) 389,090 Net unrealized gain (loss) 394,257 (23,911,380) Non-cash distributions from investments (3,921,758) (920,851)Proceeds from sale/maturity of investments 970,553,283 322,657,959 Investments purchased (1,590,847,987) (653,079,055)Interest, dividends and other receivables (956,417) (664,817)Accrued expenses 415,904 (70,054)Payable for investments purchased 6,335,263 –Net Cash Flows from (used in) Operating Activities (592,768,842) (317,320,771)
Cash Flows from (used in) Financing ActivitiesProceeds from sale of redeemable units 715,882,646 387,582,244 Amounts paid for redeemable units redeemed (109,562,005) (66,619,023)Distributions paid to holders of redeemable units net of reinvested distributions (291,747) (143,009)Net Cash Flows from (used in) Financing Activities 606,028,894 320,820,212
Increase (decrease) in cash/bank overdraft 13,260,052 3,499,441 Cash (bank overdraft), beginning of period 14,225,327 9,299,074 Cash (Bank Overdraft), End of Period 27,485,379 12,798,515
Supplemental Information on Cash Flows from (used in) Operating ActivitiesInterest received 22,484,999 14,325,056 Interest paid 369 15

SCHEDULE OF INVESTMENT PORTFOLIO AS AT JUNE 30, 2017 (UNAUDITED)
The accompanying Notes are an integral part of these financial statements.
d I M P r I V A T E C O r P O r A T E b O N d F U N d
10
PAR FAIR VALUE COST VALUE $ $Corporations (continued)Canadian Tire Real Estate Investment Trust Series C, 2.159%, 2021-06-01 CAD 3,000,000 3,005,640 2,966,646 Series A, 2.852%, 2022-06-09 CAD 2,000,000 2,025,020 2,014,061 Series B, 3.527%, 2025-06-09 CAD 11,000,000 11,190,810 11,199,011Chartwell Retirement Series A, 3.786%, 2023-12-11 CAD 10,550,000 10,550,000 10,507,419Choice Properties Real Estate Investment Trust 3.498%, 2021-02-08 CAD 11,195,000 11,483,680 11,621,227 Series G, 3.196%, 2023-03-07 CAD 7,000,000 7,160,000 7,138,390 Series D, 4.293%, 2024-02-08 CAD 8,000,000 8,406,835 8,585,881CI Financial 2.775%, 2021-11-25 CAD 7,000,000 7,000,000 7,055,983CIBC Capital Trust 9.976%, (floating rate from 2019-06-30), 2108-06-30 CAD 6,000,000 7,148,920 6,864,358CT Real Estate Investment Trust Series E, 3.469%, 2027-06-16 CAD 2,750,000 2,750,000 2,732,245Daimler Canada Finance 1.420%, 2018-10-02 CAD 9,300,000 9,299,093 9,276,428 1.800%, 2019-12-16 CAD 4,000,000 3,999,760 3,992,254 1.910%, 2021-07-08 CAD 5,000,000 4,936,700 4,948,758Dollarama 3.095%, 2018-11-05 CAD 3,000,000 3,075,990 3,054,518 2.337%, 2021-07-22 CAD 2,250,000 2,250,000 2,256,548 2.203%, 2022-11-10 CAD 6,000,000 6,000,000 5,920,179Emera 2.900%, 2023-06-16 CAD 6,000,000 6,110,230 6,081,137Enbridge 4.530%, 2020-03-09 CAD 3,000,000 3,229,050 3,187,673 3.190%, 2022-12-05 CAD 8,000,000 8,137,870 8,209,361 3.940%, 2023-06-30 CAD 8,000,000 8,524,960 8,500,315 2.500%, 2026-08-05 CAD 2,500,000 2,464,200 2,476,645 3.200%, 2027-06-08 CAD 9,750,000 9,745,905 9,513,904Enbridge Income Fund 4.100%, 2019-02-22 CAD 5,352,000 5,737,180 5,543,725 3.940%, 2023-01-13 CAD 11,500,000 11,471,715 12,200,611 3.950%, 2024-11-19 CAD 2,800,000 2,882,384 2,963,208Enbridge Pipelines 4.490%, 2019-11-12 CAD 3,000,000 3,234,550 3,191,632 3.000%, 2026-08-10 CAD 9,900,000 9,954,319 9,946,891EnerCare Solutions 4.600%, 2020-02-03 CAD 4,250,000 4,483,975 4,455,054 Series 17-2, 3.990%, 2024-02-21 CAD 7,700,000 7,794,378 7,886,017Fairfax Financial Holdings 4.500%, 2023-03-22 CAD 10,000,000 10,434,912 10,455,396 4.700%, 2026-12-16 CAD 10,500,000 10,808,415 10,890,221First Capital Realty Series Q, 3.900%, 2023-10-30 CAD 8,000,000 8,387,536 8,383,982 Series R, 4.790%, 2024-08-30 CAD 5,000,000 5,472,500 5,494,209 Series T, 3.604%, 2026-05-06 CAD 11,000,000 11,039,270 11,069,094Ford Credit Canada 2.939%, 2019-02-19 CAD 7,000,000 7,249,050 7,107,414 3.140%, 2019-06-14 CAD 6,300,000 6,300,000 6,426,958 2.450%, 2020-05-07 CAD 9,400,000 9,399,268 9,427,337 2.580%, 2021-05-10 CAD 3,850,000 3,850,000 3,846,230Fortis 2.850%, 2023-12-12 CAD 7,670,000 7,668,543 7,779,494FortisAlberta 3.300%, 2024-09-30 CAD 4,000,000 4,060,138 4,230,889FortisBC 2.580%, 2026-04-08 CAD 2,000,000 2,060,260 2,007,412GE Capital Canada Funding Company 4.600%, 2022-01-26 CAD 6,000,000 6,561,093 6,647,838GM Financial 3.080%, 2020-05-22 CAD 1,250,000 1,249,488 1,272,047
PAR FAIR VALUE COST VALUE $ $
Bonds (70.5%)Government of Canada (0.3%)Government of Canada 1.000%, 2027-06-01 CAD 8,000,000 7,622,250 7,456,033
Provincial Governments and Crown Corporations (0.4%)OMERS Realty 2.858%, 2024-02-23 CAD 10,000,000 10,522,220 10,265,859
Corporations (69.8%)Algonquin Power & Utilities 4.820%, 2021-02-15 CAD 4,500,000 4,866,555 4,842,550 4.650%, 2022-02-15 CAD 2,300,000 2,316,236 2,489,814 4.090%, 2027-02-17 CAD 2,250,000 2,248,402 2,364,443Alimentation Couche-Tard 3.319%, 2019-11-01 CAD 7,930,000 8,318,763 8,180,921 3.899%, 2022-11-01 CAD 2,000,000 2,156,020 2,127,140 Series 5, 3.600%, 2025-06-02 CAD 14,000,000 14,056,581 14,482,603Alliance Pipeline 4.928%, 2019-12-16 CAD 4,686,000 5,015,921 4,911,396AltaGas 4.070%, 2020-06-01 CAD 2,000,000 2,121,460 2,104,273 3.720%, 2021-09-28 CAD 11,000,000 11,495,680 11,520,894 3.570%, 2023-06-12 CAD 5,000,000 5,247,650 5,186,048 3.840%, 2025-01-15 CAD 4,000,000 4,012,120 4,177,492AltaLink 2.747%, 2026-05-29 CAD 5,000,000 5,014,805 5,092,474Bank of Montreal 2.840%, 2020-06-04 CAD 22,750,000 24,014,350 23,436,675 2.100%, 2020-10-06 CAD 29,300,000 29,448,577 29,549,534 2.700%, 2026-12-09 CAD 10,000,000 9,991,725 10,059,686bcIMC Realty Series 13, 2.840%, 2025-06-03 CAD 4,000,000 4,230,016 4,077,136 3.000%, 2027-03-31 CAD 13,100,000 13,292,433 13,344,874Bell Canada 3.350%, 2019-06-18 CAD 2,000,000 2,079,300 2,058,718 2.000%, 2021-10-01 CAD 9,000,000 8,999,730 8,909,128 3.000%, 2022-10-03 CAD 10,000,000 10,338,000 10,292,707 3.350%, 2023-03-22 CAD 23,500,000 24,160,340 24,514,601 2.700%, 2024-02-27 CAD 12,000,000 12,073,124 12,002,963 3.550%, 2026-03-02 CAD 18,400,000 19,302,496 19,177,441 2.900%, 2026-08-12 CAD 7,000,000 7,058,140 6,932,332BMW Canada Series M, 2.270%, 2018-11-26 CAD 8,000,000 8,140,800 8,075,019 Series Q, 1.880%, 2020-12-11 CAD 1,800,000 1,800,000 1,795,159 Series O, 1.830%, 2021-06-15 CAD 6,000,000 5,990,623 5,941,662Brookfield Asset Management 4.540%, 2023-03-31 CAD 7,000,000 7,509,266 7,611,417 5.040%, 2024-03-08 CAD 5,500,000 5,762,470 6,134,007 4.820%, 2026-01-28 CAD 8,000,000 8,693,430 8,854,660 3.800%, 2027-03-16 CAD 7,000,000 7,129,060 7,192,384Brookfield Renewable Partners 4.790%, 2022-02-07 CAD 6,809,000 7,514,663 7,433,662 3.752%, 2025-06-02 CAD 12,000,000 12,076,196 12,422,831Bruce Power 2.844%, 2021-06-23 CAD 4,500,000 4,547,200 4,584,720 Series 17-1, 3.000%, 2024-06-21 CAD 4,200,000 4,252,465 4,235,263 3.969%, 2026-06-23 CAD 3,500,000 3,630,410 3,706,119Canadian Imperial Bank of Commerce 1.700%, 2018-10-09 CAD 17,500,000 17,640,592 17,552,040 2.350%, 2019-06-24 CAD 6,000,000 6,154,925 6,084,051 1.900%, 2021-04-26 CAD 14,000,000 14,118,279 13,974,480Canadian Natural Resources 2.890%, 2020-08-14 CAD 17,000,000 16,878,065 17,226,602 3.310%, 2022-02-11 CAD 7,000,000 7,114,775 7,139,638 3.550%, 2024-06-03 CAD 4,000,000 4,104,080 4,073,452 3.420%, 2026-12-01 CAD 7,700,000 7,700,000 7,510,840
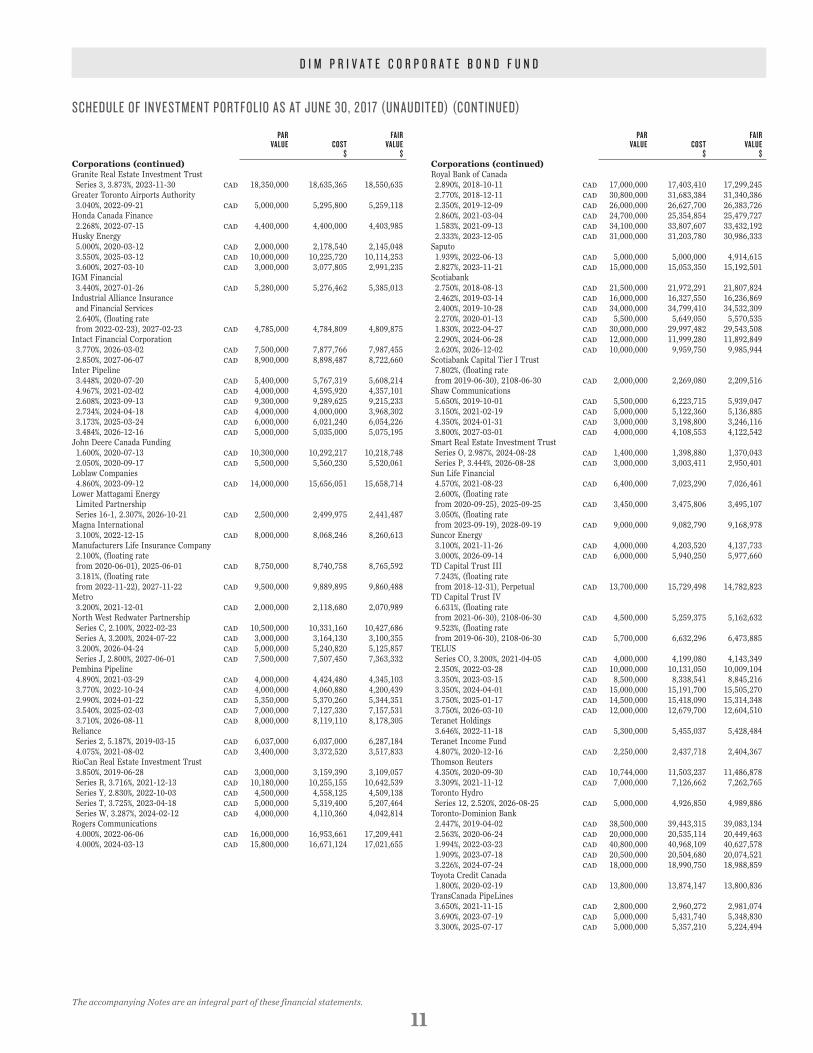
SCHEDULE OF INVESTMENT PORTFOLIO AS AT JUNE 30, 2017 (UNAUDITED) (CONTINUED)
The accompanying Notes are an integral part of these financial statements.
d I M P r I V A T E C O r P O r A T E b O N d F U N d
11
PAR FAIR VALUE COST VALUE $ $Corporations (continued)Royal Bank of Canada 2.890%, 2018-10-11 CAD 17,000,000 17,403,410 17,299,245 2.770%, 2018-12-11 CAD 30,800,000 31,683,384 31,340,386 2.350%, 2019-12-09 CAD 26,000,000 26,627,700 26,383,726 2.860%, 2021-03-04 CAD 24,700,000 25,354,854 25,479,727 1.583%, 2021-09-13 CAD 34,100,000 33,807,607 33,432,192 2.333%, 2023-12-05 CAD 31,000,000 31,203,780 30,986,333Saputo 1.939%, 2022-06-13 CAD 5,000,000 5,000,000 4,914,615 2.827%, 2023-11-21 CAD 15,000,000 15,053,350 15,192,501Scotiabank 2.750%, 2018-08-13 CAD 21,500,000 21,972,291 21,807,824 2.462%, 2019-03-14 CAD 16,000,000 16,327,550 16,236,869 2.400%, 2019-10-28 CAD 34,000,000 34,799,410 34,532,309 2.270%, 2020-01-13 CAD 5,500,000 5,649,050 5,570,535 1.830%, 2022-04-27 CAD 30,000,000 29,997,482 29,543,508 2.290%, 2024-06-28 CAD 12,000,000 11,999,280 11,892,849 2.620%, 2026-12-02 CAD 10,000,000 9,959,750 9,985,944Scotiabank Capital Tier I Trust 7.802%, (floating rate from 2019-06-30), 2108-06-30 CAD 2,000,000 2,269,080 2,209,516Shaw Communications 5.650%, 2019-10-01 CAD 5,500,000 6,223,715 5,939,047 3.150%, 2021-02-19 CAD 5,000,000 5,122,360 5,136,885 4.350%, 2024-01-31 CAD 3,000,000 3,198,800 3,246,116 3.800%, 2027-03-01 CAD 4,000,000 4,108,553 4,122,542Smart Real Estate Investment Trust Series O, 2.987%, 2024-08-28 CAD 1,400,000 1,398,880 1,370,043 Series P, 3.444%, 2026-08-28 CAD 3,000,000 3,003,411 2,950,401Sun Life Financial 4.570%, 2021-08-23 CAD 6,400,000 7,023,290 7,026,461 2.600%, (floating rate from 2020-09-25), 2025-09-25 CAD 3,450,000 3,475,806 3,495,107 3.050%, (floating rate from 2023-09-19), 2028-09-19 CAD 9,000,000 9,082,790 9,168,978Suncor Energy 3.100%, 2021-11-26 CAD 4,000,000 4,203,520 4,137,733 3.000%, 2026-09-14 CAD 6,000,000 5,940,250 5,977,660TD Capital Trust III 7.243%, (floating rate from 2018-12-31), Perpetual CAD 13,700,000 15,729,498 14,782,823TD Capital Trust IV 6.631%, (floating rate from 2021-06-30), 2108-06-30 CAD 4,500,000 5,259,375 5,162,632 9.523%, (floating rate from 2019-06-30), 2108-06-30 CAD 5,700,000 6,632,296 6,473,885TELUS Series CO, 3.200%, 2021-04-05 CAD 4,000,000 4,199,080 4,143,349 2.350%, 2022-03-28 CAD 10,000,000 10,131,050 10,009,104 3.350%, 2023-03-15 CAD 8,500,000 8,338,541 8,845,216 3.350%, 2024-04-01 CAD 15,000,000 15,191,700 15,505,270 3.750%, 2025-01-17 CAD 14,500,000 15,418,090 15,314,348 3.750%, 2026-03-10 CAD 12,000,000 12,679,700 12,604,510Teranet Holdings 3.646%, 2022-11-18 CAD 5,300,000 5,455,037 5,428,484Teranet Income Fund 4.807%, 2020-12-16 CAD 2,250,000 2,437,718 2,404,367Thomson Reuters 4.350%, 2020-09-30 CAD 10,744,000 11,503,237 11,486,878 3.309%, 2021-11-12 CAD 7,000,000 7,126,662 7,262,765Toronto Hydro Series 12, 2.520%, 2026-08-25 CAD 5,000,000 4,926,850 4,989,886Toronto-Dominion Bank 2.447%, 2019-04-02 CAD 38,500,000 39,443,315 39,083,134 2.563%, 2020-06-24 CAD 20,000,000 20,535,114 20,449,463 1.994%, 2022-03-23 CAD 40,800,000 40,968,109 40,627,578 1.909%, 2023-07-18 CAD 20,500,000 20,504,680 20,074,521 3.226%, 2024-07-24 CAD 18,000,000 18,990,750 18,988,859Toyota Credit Canada 1.800%, 2020-02-19 CAD 13,800,000 13,874,147 13,800,836TransCanada PipeLines 3.650%, 2021-11-15 CAD 2,800,000 2,960,272 2,981,074 3.690%, 2023-07-19 CAD 5,000,000 5,431,740 5,348,830 3.300%, 2025-07-17 CAD 5,000,000 5,357,210 5,224,494
PAR FAIR VALUE COST VALUE $ $Corporations (continued)Granite Real Estate Investment Trust Series 3, 3.873%, 2023-11-30 CAD 18,350,000 18,635,365 18,550,635Greater Toronto Airports Authority 3.040%, 2022-09-21 CAD 5,000,000 5,295,800 5,259,118Honda Canada Finance 2.268%, 2022-07-15 CAD 4,400,000 4,400,000 4,403,985Husky Energy 5.000%, 2020-03-12 CAD 2,000,000 2,178,540 2,145,048 3.550%, 2025-03-12 CAD 10,000,000 10,225,720 10,114,253 3.600%, 2027-03-10 CAD 3,000,000 3,077,805 2,991,235IGM Financial 3.440%, 2027-01-26 CAD 5,280,000 5,276,462 5,385,013Industrial Alliance Insurance and Financial Services 2.640%, (floating rate from 2022-02-23), 2027-02-23 CAD 4,785,000 4,784,809 4,809,875Intact Financial Corporation 3.770%, 2026-03-02 CAD 7,500,000 7,877,766 7,987,455 2.850%, 2027-06-07 CAD 8,900,000 8,898,487 8,722,660Inter Pipeline 3.448%, 2020-07-20 CAD 5,400,000 5,767,319 5,608,214 4.967%, 2021-02-02 CAD 4,000,000 4,595,920 4,357,101 2.608%, 2023-09-13 CAD 9,300,000 9,289,625 9,215,233 2.734%, 2024-04-18 CAD 4,000,000 4,000,000 3,968,302 3.173%, 2025-03-24 CAD 6,000,000 6,021,240 6,054,226 3.484%, 2026-12-16 CAD 5,000,000 5,035,000 5,075,195John Deere Canada Funding 1.600%, 2020-07-13 CAD 10,300,000 10,292,217 10,218,748 2.050%, 2020-09-17 CAD 5,500,000 5,560,230 5,520,061Loblaw Companies 4.860%, 2023-09-12 CAD 14,000,000 15,656,051 15,658,714Lower Mattagami Energy Limited Partnership Series 16-1, 2.307%, 2026-10-21 CAD 2,500,000 2,499,975 2,441,487Magna International 3.100%, 2022-12-15 CAD 8,000,000 8,068,246 8,260,613Manufacturers Life Insurance Company 2.100%, (floating rate from 2020-06-01), 2025-06-01 CAD 8,750,000 8,740,758 8,765,592 3.181%, (floating rate from 2022-11-22), 2027-11-22 CAD 9,500,000 9,889,895 9,860,488Metro 3.200%, 2021-12-01 CAD 2,000,000 2,118,680 2,070,989North West Redwater Partnership Series C, 2.100%, 2022-02-23 CAD 10,500,000 10,331,160 10,427,686 Series A, 3.200%, 2024-07-22 CAD 3,000,000 3,164,130 3,100,355 3.200%, 2026-04-24 CAD 5,000,000 5,240,820 5,125,857 Series J, 2.800%, 2027-06-01 CAD 7,500,000 7,507,450 7,363,332Pembina Pipeline 4.890%, 2021-03-29 CAD 4,000,000 4,424,480 4,345,103 3.770%, 2022-10-24 CAD 4,000,000 4,060,880 4,200,439 2.990%, 2024-01-22 CAD 5,350,000 5,370,260 5,344,351 3.540%, 2025-02-03 CAD 7,000,000 7,127,330 7,157,531 3.710%, 2026-08-11 CAD 8,000,000 8,119,110 8,178,305Reliance Series 2, 5.187%, 2019-03-15 CAD 6,037,000 6,037,000 6,287,184 4.075%, 2021-08-02 CAD 3,400,000 3,372,520 3,517,833RioCan Real Estate Investment Trust 3.850%, 2019-06-28 CAD 3,000,000 3,159,390 3,109,057 Series R, 3.716%, 2021-12-13 CAD 10,180,000 10,255,155 10,642,539 Series Y, 2.830%, 2022-10-03 CAD 4,500,000 4,558,125 4,509,138 Series T, 3.725%, 2023-04-18 CAD 5,000,000 5,319,400 5,207,464 Series W, 3.287%, 2024-02-12 CAD 4,000,000 4,110,360 4,042,814Rogers Communications 4.000%, 2022-06-06 CAD 16,000,000 16,953,661 17,209,441 4.000%, 2024-03-13 CAD 15,800,000 16,671,124 17,021,655

SCHEDULE OF INVESTMENT PORTFOLIO AS AT JUNE 30, 2017 (UNAUDITED) (CONTINUED)
The accompanying Notes are an integral part of these financial statements.
d I M P r I V A T E C O r P O r A T E b O N d F U N d
12
PAR FAIR VALUE COST VALUE $ $Corporations (continued)TransCanada Trust Series 17-A, 4.650%, (floating rate until 2027-05-18), 2077-05-18 CAD 14,500,000 14,902,981 14,581,749Union Gas 3.190%, 2025-09-17 CAD 3,825,000 3,885,815 4,009,256 2.810%, 2026-06-01 CAD 4,675,000 4,736,560 4,753,464Ventas Canada Finance Series D, 2.550%, 2023-03-15 CAD 4,700,000 4,697,838 4,643,317VW Credit Canada 2.500%, 2019-10-01 CAD 3,000,000 3,057,510 3,032,428Wells Fargo Financial Corporation Canada 2.944%, 2019-07-25 CAD 13,000,000 13,491,370 13,316,283 3.460%, 2023-01-24 CAD 10,000,000 10,693,400 10,580,435West Edmonton Mall Property Series B1, 4.309%, 2024-02-13 CAD 3,600,000 3,600,000 3,764,856Westcoast Energy 3.430%, 2024-09-12 CAD 5,000,000 5,153,340 5,198,859 3.770%, 2025-12-08 CAD 6,800,000 7,043,012 7,159,932 1,691,422,975 1,688,358,710
Total Bonds 1,709,567,445 1,706,080,602
NUMBER OF UNITS
Investment Funds (28.1%)AlphaFixe Floating Rate Bank Loan Fund, Series A 32,064,654 327,039,206 331,356,138Jarislowsky Fraser Fixed Income Core Plus Fund 33,698,794 344,566,537 347,138,020
Total Investment Funds 671,605,743 678,494,158
PAR VALUE
Money Market Securities (0.1%)Canada Treasury Bills 2017-09-07 CAD 2,000,000 1,998,009 1,998,009
Total Investments (98.7%) 2,383,171,197 2,386,572,769
Other Net Assets (1.3%) 32,120,143
Net Assets (100%) 2,418,692,912
NOTES TO THE FINANCIAL STATEMENTS – SPECIFIC INFORMATION (UNAUDITED)
d I M P r I V A T E C O r P O r A T E b O N d F U N d
13
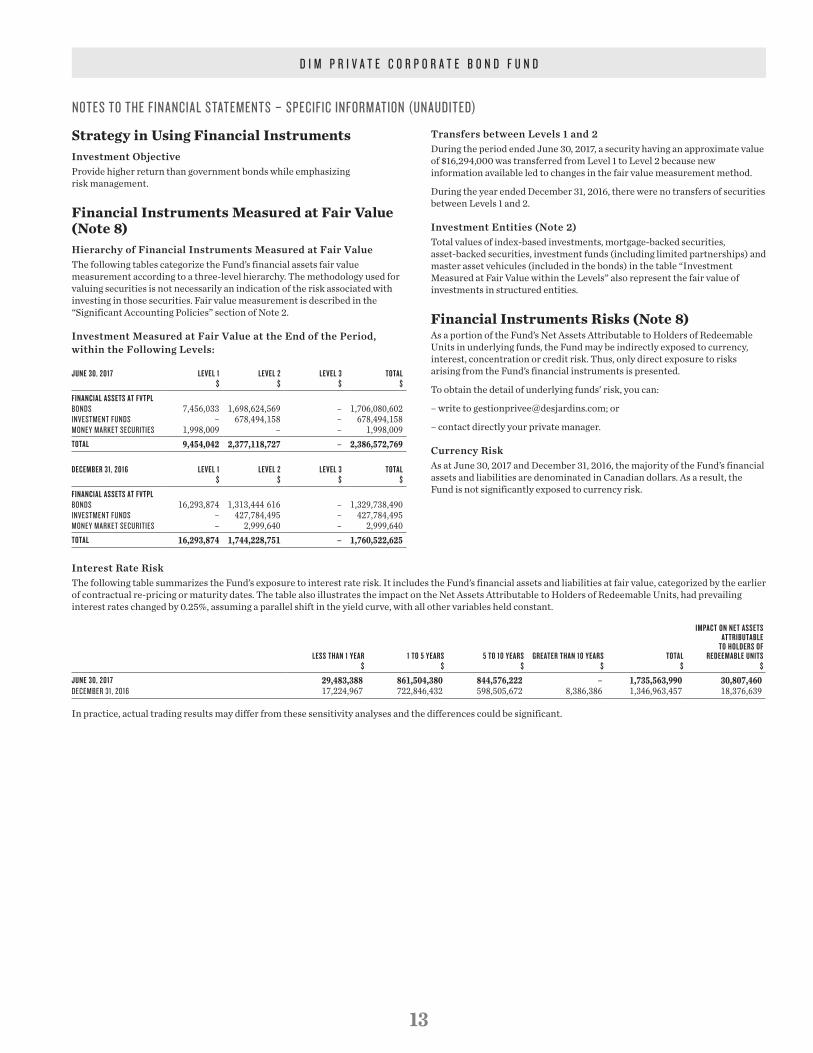
Strategy in Using Financial InstrumentsInvestment ObjectiveProvide higher return than government bonds while emphasizing risk management.
Financial Instruments Measured at Fair Value (Note 8)Hierarchy of Financial Instruments Measured at Fair ValueThe following tables categorize the Fund’s financial assets fair value measurement according to a three-level hierarchy. The methodology used for valuing securities is not necessarily an indication of the risk associated with investing in those securities. Fair value measurement is described in the “Significant Accounting Policies” section of Note 2.
Investment Measured at Fair Value at the End of the Period, within the Following Levels:
JUNE 30, 2017 LEVEL 1 LEVEL 2 LEVEL 3 TOTAL$ $ $ $
FINANCIAL ASSETS AT FVTPLbONdS 7,456,033 1,698,624,569 – 1,706,080,602 INVESTMENT FUNdS – 678,494,158 – 678,494,158 MONEY MArKET SECUrITIES 1,998,009 – – 1,998,009 TOTAL 9,454,042 2,377,118,727 – 2,386,572,769
DECEMBER 31, 2016 LEVEL 1 LEVEL 2 LEVEL 3 TOTAL$ $ $ $
FINANCIAL ASSETS AT FVTPLbONdS 16,293,874 1,313,444 616 – 1,329,738,490INVESTMENT FUNdS – 427,784,495 – 427,784,495MONEY MArKET SECUrITIES – 2,999,640 – 2,999,640TOTAL 16,293,874 1,744,228,751 – 1,760,522,625
Transfers between Levels 1 and 2During the period ended June 30, 2017, a security having an approximate value of $16,294,000 was transferred from Level 1 to Level 2 because new information available led to changes in the fair value measurement method.
During the year ended December 31, 2016, there were no transfers of securities between Levels 1 and 2.
Investment Entities (Note 2)Total values of index-based investments, mortgage-backed securities, asset-backed securities, investment funds (including limited partnerships) and master asset vehicules (included in the bonds) in the table “Investment Measured at Fair Value within the Levels” also represent the fair value of investments in structured entities.
Financial Instruments Risks (Note 8)As a portion of the Fund’s Net Assets Attributable to Holders of Redeemable Units in underlying funds, the Fund may be indirectly exposed to currency, interest, concentration or credit risk. Thus, only direct exposure to risks arising from the Fund’s financial instruments is presented.
To obtain the detail of underlying funds’ risk, you can:
– write to [email protected]; or
– contact directly your private manager.
Currency RiskAs at June 30, 2017 and December 31, 2016, the majority of the Fund’s financial assets and liabilities are denominated in Canadian dollars. As a result, the Fund is not significantly exposed to currency risk.
Interest Rate RiskThe following table summarizes the Fund’s exposure to interest rate risk. It includes the Fund’s financial assets and liabilities at fair value, categorized by the earlier of contractual re-pricing or maturity dates. The table also illustrates the impact on the Net Assets Attributable to Holders of Redeemable Units, had prevailing interest rates changed by 0.25%, assuming a parallel shift in the yield curve, with all other variables held constant.
LESS THAN 1 YEAR 1 TO 5 YEARS 5 TO 10 YEARS GREATER THAN 10 YEARS TOTAL
IMPACT ON NET ASSETS ATTRIBUTABLE
TO HOLDERS OF REDEEMABLE UNITS
$ $ $ $ $ $
JUNE 30, 2017 29,483,388 861,504,380 844,576,222 – 1,735,563,990 30,807,460 dECEMbEr 31, 2016 17,224,967 722,846,432 598,505,672 8,386,386 1,346,963,457 18,376,639
In practice, actual trading results may differ from these sensitivity analyses and the differences could be significant.

NOTES TO THE FINANCIAL STATEMENTS – SPECIFIC INFORMATION (UNAUDITED) (CONTINUED)
d I M P r I V A T E C O r P O r A T E b O N d F U N d
14
Concentration RiskThe following tables summarize the concentration risk, as a percentage of the Fund’s Net Assets Attributable to Holders of Redeemable Units:
JUNE 30, 2017MARKET SEGMENT %
DECEMBER 31, 2016MARKET SEGMENT %
Bonds Corporations 69.8 Provincial Governments
and Crown Corporations 0.4 Government of Canada 0.3
Fixed-Income Investment Funds 28.1 Money Market Securities 0.1 Other Net Assets 1.3
Bonds Corporations 73.6
Provincial Governments and Crown Corporations 0.9
Fixed-Income Investment Funds 23.9Money Market Securities 0.2Other Net Assets 1.4
TOTAL 100 TOTAL 100
Price RiskThe Fund may trade in financial instruments and take positions in over-the-counter instruments.
The Manager’s estimate of the impact on Net Assets Attributable to Holders of Redeemable Units as a result of a reasonably possible change in benchmarks, using a historical beta coefficient (a measure of the sensitivity of a security in comparison to the market) between the Fund’s return as compared to the return of the Fund’s benchmarks, with all other variables held constant, is included in the following table. A 36-month regression analysis has been utilized to estimate the historical beta coefficient. The regression analysis uses data based on the monthly returns of the Fund.
CHANGE IN PRICE
IMPACT ON NET ASSETS ATTRIBUTABLE TO HOLDERS OF REDEEMABLE UNITS
BENCHMARKS %JUNE 30, 2017
$DECEMBER 31, 2016
$
FTSE TMX Canada Short Term Corporate 1.00 11,488,791 8,818,496
FTSE TMX Canada Mid Term Corporate 1.00 11,488,791 8,818,496
When there is more than one benchmark, the effect of each benchmark must be considered individually, as each benchmark might fluctuate independently from the others.
In practice, actual trading results may differ from these sensitivity analyses and the differences could be significant.
Credit RiskThe Fund’s credit risk is mainly concentrated in fixed-income securities. Their fair values include consideration of the issuers’ creditworthiness and accordingly, represent the Fund’s maximum exposure to credit risk.
Portfolio’s Fixed-Income Securities by Credit Rating Category
CREDIT RATING PERCENTAGE OF FIXED-INCOME SECURITIES
JUNE 30, 2017%
DECEMBER 31, 2016 %
AA 22 31A 29 21bbb 49 48TOTAL 100 100
Liquidity RiskFor further information on maturities of financial liabilities and liquidity risk management of the Fund, please refer to Note 8 “Financial Instruments Disclosures”.

The accompanying Notes are an integral part of these financial statements.
15
d I M P r I V A T E C A N A d I A N L A r G E C A P E Q U I T Y F U N d
STATEMENT OF FINANCIAL POSITION ( U N A U d I T E d )
AS AT JUNE 302017
$
dECEMbEr 312016
$ASSETSCurrent AssetsCash 21,377,717 19,742,055 Investments at fair value through profit or loss (FVTPL) 558,792,827 640,648,972 Receivable for investments sold 14,722,669 –Interest, dividends and other receivables 1,595,297 1,656,657
596,488,510 662,047,684
LIABILITIESCurrent LiabilitiesAccrued expenses 299,656 47,585 Payable for investments purchased 13,824,634 –
14,124,290 47,585
Net Assets Attributable to Holders of Redeemable Units 582,364,220 662,000,099 – per unit (Note 4) 15.89 16.02
Approved on behalf of the Board of Directors ofDesjardins Investment Management Inc.,Manager of the DIM Private FundsVincent P. Hogue, President of the Board of Directorsand Sylvain Thériault, Director
STATEMENT OF COMPrEHENSIVE INCOME ( U N A U d I T E d )
SIx-MONTH PErIOdS ENdEd JUNE 30 2017$
2016$
IncomeInterest for distribution purposes 684,329 147,337 Dividends 8,949,550 10,311,208 Foreign exchange gain (loss) on cash 1,457 –Changes in fair value: Net realized gain (loss) on investments 70,741,255 (3,928,290) Net unrealized gain (loss) on investments (75,385,466) 48,375,698
4,991,125 54,905,953
ExpensesAudit fees 3,535 3,302 Custodian fees 45,932 32,311 Unitholders’ reporting costs 8,996 9,277 Filing fees 21,363 20,614 Administration fees 515,689 488,990
595,515 554,494 Expenses absorbed by the Manager – (28,356)
595,515 526,138 Commissions and other portfolio transaction costs 1,707,857 171,441
2,303,372 697,579
Increase (Decrease) in Net Assets Attributable to Holders of Redeemable Units 2,687,753 54,208,374 – per unit 0.06 1.25
Average Number of Redeemable Units 42,392,021 43,509,360
STATEMENT OF CHANGES IN FINANCIAL POSITION ( U N A U d I T E d )
SIx-MONTH PErIOdS ENdEd JUNE 30 2017 2016 $ $
Net Assets Attributable to Holders of Redeemable Units, Beginning of Period 662,000,099 561,967,926
Increase (Decrease) in Net Assets Attributable to Holders of Redeemable Units 2,687,753 54,208,374
Redeemable Unit Transactions Proceeds from sale of redeemable units 83,607,171 83,112,669 Reinvested distributions 8,934,533 9,530,120 Amounts paid for redeemable units redeemed (165,719,010) (28,744,383)
(73,177,306) 63,898,406
Distributions to Holders of Redeemable UnitsNet investment income (9,146,326) (9,679,331)
Net Assets Attributable to Holders of Redeemable Units, End of Period 582,364,220 670,395,375
STATEMENT OF CASH FLOWS ( U N A U d I T E d )
SIx-MONTH PErIOdS ENdEd JUNE 30 2017 2016 $ $
Cash Flows from (used in) Operating ActivitiesIncrease (decrease) in net assets attributable to holders of redeemable units 2,687,753 54,208,374 Adjustments for: Foreign exchange gain (loss) on cash (1,457) – Net realized gain (loss) (70,741,255) 3,928,290 Net unrealized gain (loss) 75,385,466 (48,375,698)Proceeds from sale/maturity of investments 1,225,979,116 61,178,240 Investments purchased (1,148,766,865) (124,749,832)Receivable for investments sold (14,722,669) –Interest, dividends and other receivables 61,360 (493,520)Accrued expenses 252,071 239,183 Payable for investments purchased 13,824,634 –Net Cash Flows from (used in) Operating Activities 83,958,154 (54,064,963)
Cash Flows from (used in) Financing ActivitiesProceeds from sale of redeemable units 83,607,171 83,112,669 Amounts paid for redeemable units redeemed (165,719,010) (28,744,383)Distributions paid to holders of redeemable units net of reinvested distributions (211,793) (149,211)Net Cash Flows from (used in) Financing Activities (82,323,632) 54,219,075
Effect of exchange rate changes on foreign cash 1,140 –
Increase (decrease) in cash/bank overdraft 1,635,662 154,112 Cash (bank overdraft), beginning of period 19,742,055 5,782,130 Cash (Bank Overdraft), End of Period 21,377,717 5,936,242
Supplemental Information on Cash Flows from (used in) Operating ActivitiesInterest received 78,897 57,788 Dividends received, net of withholding taxes 9,012,947 9,817,688
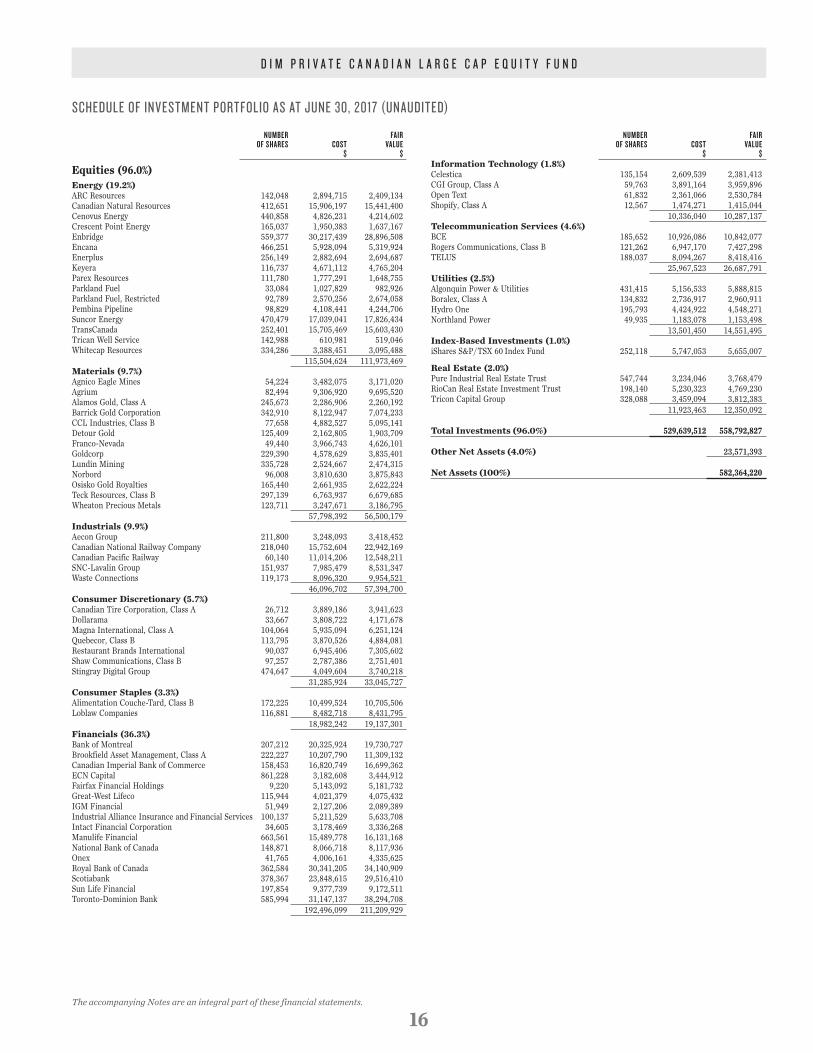
SCHEDULE OF INVESTMENT PORTFOLIO AS AT JUNE 30, 2017 (UNAUDITED)
The accompanying Notes are an integral part of these financial statements.
d I M P r I V A T E C A N A d I A N L A r G E C A P E Q U I T Y F U N d
16
NUMBER FAIR OF SHARES COST VALUE $ $Information Technology (1.8%)Celestica 135,154 2,609,539 2,381,413CGI Group, Class A 59,763 3,891,164 3,959,896Open Text 61,832 2,361,066 2,530,784Shopify, Class A 12,567 1,474,271 1,415,044 10,336,040 10,287,137Telecommunication Services (4.6%)BCE 185,652 10,926,086 10,842,077Rogers Communications, Class B 121,262 6,947,170 7,427,298TELUS 188,037 8,094,267 8,418,416 25,967,523 26,687,791Utilities (2.5%)Algonquin Power & Utilities 431,415 5,156,533 5,888,815Boralex, Class A 134,832 2,736,917 2,960,911Hydro One 195,793 4,424,922 4,548,271Northland Power 49,935 1,183,078 1,153,498 13,501,450 14,551,495Index-Based Investments (1.0%)iShares S&P/TSX 60 Index Fund 252,118 5,747,053 5,655,007
Real Estate (2.0%)Pure Industrial Real Estate Trust 547,744 3,234,046 3,768,479RioCan Real Estate Investment Trust 198,140 5,230,323 4,769,230Tricon Capital Group 328,088 3,459,094 3,812,383 11,923,463 12,350,092
Total Investments (96.0%) 529,639,512 558,792,827
Other Net Assets (4.0%) 23,571,393
Net Assets (100%) 582,364,220
NUMBER FAIR OF SHARES COST VALUE $ $
Equities (96.0%)Energy (19.2%)ARC Resources 142,048 2,894,715 2,409,134Canadian Natural Resources 412,651 15,906,197 15,441,400Cenovus Energy 440,858 4,826,231 4,214,602Crescent Point Energy 165,037 1,950,383 1,637,167Enbridge 559,377 30,217,439 28,896,508Encana 466,251 5,928,094 5,319,924Enerplus 256,149 2,882,694 2,694,687Keyera 116,737 4,671,112 4,765,204Parex Resources 111,780 1,777,291 1,648,755Parkland Fuel 33,084 1,027,829 982,926Parkland Fuel, Restricted 92,789 2,570,256 2,674,058Pembina Pipeline 98,829 4,108,441 4,244,706Suncor Energy 470,479 17,039,041 17,826,434TransCanada 252,401 15,705,469 15,603,430Trican Well Service 142,988 610,981 519,046Whitecap Resources 334,286 3,388,451 3,095,488 115,504,624 111,973,469Materials (9.7%)Agnico Eagle Mines 54,224 3,482,075 3,171,020Agrium 82,494 9,306,920 9,695,520Alamos Gold, Class A 245,673 2,286,906 2,260,192Barrick Gold Corporation 342,910 8,122,947 7,074,233CCL Industries, Class B 77,658 4,882,527 5,095,141Detour Gold 125,409 2,162,805 1,903,709Franco-Nevada 49,440 3,966,743 4,626,101Goldcorp 229,390 4,578,629 3,835,401Lundin Mining 335,728 2,524,667 2,474,315Norbord 96,008 3,810,630 3,875,843Osisko Gold Royalties 165,440 2,661,935 2,622,224Teck Resources, Class B 297,139 6,763,937 6,679,685Wheaton Precious Metals 123,711 3,247,671 3,186,795 57,798,392 56,500,179Industrials (9.9%)Aecon Group 211,800 3,248,093 3,418,452Canadian National Railway Company 218,040 15,752,604 22,942,169Canadian Pacific Railway 60,140 11,014,206 12,548,211SNC-Lavalin Group 151,937 7,985,479 8,531,347Waste Connections 119,173 8,096,320 9,954,521 46,096,702 57,394,700Consumer Discretionary (5.7%)Canadian Tire Corporation, Class A 26,712 3,889,186 3,941,623Dollarama 33,667 3,808,722 4,171,678Magna International, Class A 104,064 5,935,094 6,251,124Quebecor, Class B 113,795 3,870,526 4,884,081Restaurant Brands International 90,037 6,945,406 7,305,602Shaw Communications, Class B 97,257 2,787,386 2,751,401Stingray Digital Group 474,647 4,049,604 3,740,218 31,285,924 33,045,727Consumer Staples (3.3%)Alimentation Couche-Tard, Class B 172,225 10,499,524 10,705,506Loblaw Companies 116,881 8,482,718 8,431,795 18,982,242 19,137,301Financials (36.3%)Bank of Montreal 207,212 20,325,924 19,730,727Brookfield Asset Management, Class A 222,227 10,207,790 11,309,132Canadian Imperial Bank of Commerce 158,453 16,820,749 16,699,362ECN Capital 861,228 3,182,608 3,444,912Fairfax Financial Holdings 9,220 5,143,092 5,181,732Great-West Lifeco 115,944 4,021,379 4,075,432IGM Financial 51,949 2,127,206 2,089,389Industrial Alliance Insurance and Financial Services 100,137 5,211,529 5,633,708Intact Financial Corporation 34,605 3,178,469 3,336,268Manulife Financial 663,561 15,489,778 16,131,168National Bank of Canada 148,871 8,066,718 8,117,936Onex 41,765 4,006,161 4,335,625Royal Bank of Canada 362,584 30,341,205 34,140,909Scotiabank 378,367 23,848,615 29,516,410Sun Life Financial 197,854 9,377,739 9,172,511Toronto-Dominion Bank 585,994 31,147,137 38,294,708 192,496,099 211,209,929
NOTES TO THE FINANCIAL STATEMENTS – SPECIFIC INFORMATION (UNAUDITED)
d I M P r I V A T E C A N A d I A N L A r G E C A P E Q U I T Y F U N d
17
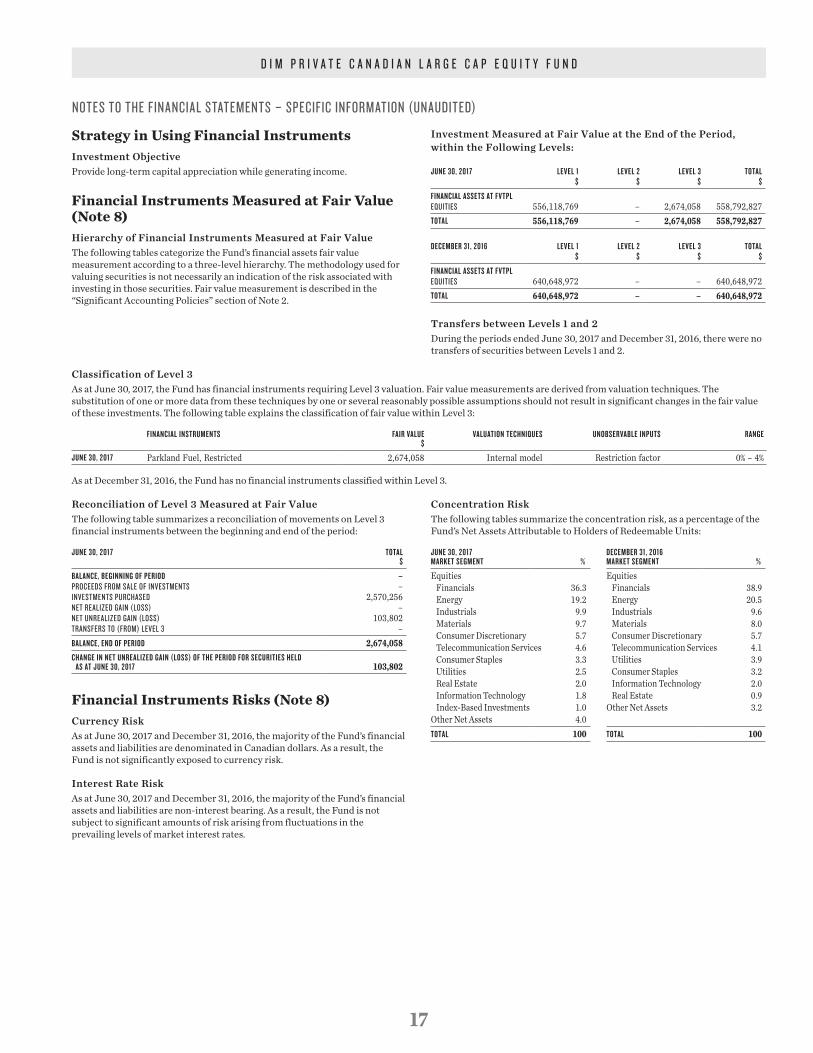
Strategy in Using Financial InstrumentsInvestment ObjectiveProvide long-term capital appreciation while generating income.
Financial Instruments Measured at Fair Value (Note 8)Hierarchy of Financial Instruments Measured at Fair ValueThe following tables categorize the Fund’s financial assets fair value measurement according to a three-level hierarchy. The methodology used for valuing securities is not necessarily an indication of the risk associated with investing in those securities. Fair value measurement is described in the “Significant Accounting Policies” section of Note 2.
Investment Measured at Fair Value at the End of the Period, within the Following Levels:
JUNE 30, 2017 LEVEL 1 LEVEL 2 LEVEL 3 TOTAL$ $ $ $
FINANCIAL ASSETS AT FVTPLEQUITIES 556,118,769 – 2,674,058 558,792,827 TOTAL 556,118,769 – 2,674,058 558,792,827
DECEMBER 31, 2016 LEVEL 1 LEVEL 2 LEVEL 3 TOTAL$ $ $ $
FINANCIAL ASSETS AT FVTPLEQUITIES 640,648,972 – – 640,648,972TOTAL 640,648,972 – – 640,648,972
Transfers between Levels 1 and 2During the periods ended June 30, 2017 and December 31, 2016, there were no transfers of securities between Levels 1 and 2.
Classification of Level 3As at June 30, 2017, the Fund has financial instruments requiring Level 3 valuation. Fair value measurements are derived from valuation techniques. The substitution of one or more data from these techniques by one or several reasonably possible assumptions should not result in significant changes in the fair value of these investments. The following table explains the classification of fair value within Level 3:
FINANCIAL INSTRUMENTS FAIR VALUE $
VALUATION TECHNIQUES UNOBSERVABLE INPUTS RANGE
JUNE 30, 2017 Parkland Fuel, Restricted 2,674,058 Internal model Restriction factor 0% – 4%
As at December 31, 2016, the Fund has no financial instruments classified within Level 3.
Reconciliation of Level 3 Measured at Fair ValueThe following table summarizes a reconciliation of movements on Level 3 financial instruments between the beginning and end of the period:
JUNE 30, 2017 TOTAL$
BALANCE, BEGINNING OF PERIOD –PrOCEEdS FrOM SALE OF INVESTMENTS –INVESTMENTS PUrCHASEd 2,570,256NET rEALIZEd GAIN (LOSS) –NET UNrEALIZEd GAIN (LOSS) 103,802TrANSFErS TO (FrOM) LEVEL 3 –BALANCE, END OF PERIOD 2,674,058CHANGE IN NET UNREALIZED GAIN (LOSS) OF THE PERIOD FOR SECURITIES HELD
AS AT JUNE 30, 2017 103,802
Financial Instruments Risks (Note 8)Currency RiskAs at June 30, 2017 and December 31, 2016, the majority of the Fund’s financial assets and liabilities are denominated in Canadian dollars. As a result, the Fund is not significantly exposed to currency risk.
Interest Rate RiskAs at June 30, 2017 and December 31, 2016, the majority of the Fund’s financial assets and liabilities are non-interest bearing. As a result, the Fund is not subject to significant amounts of risk arising from fluctuations in the prevailing levels of market interest rates.
Concentration RiskThe following tables summarize the concentration risk, as a percentage of the Fund’s Net Assets Attributable to Holders of Redeemable Units:
JUNE 30, 2017MARKET SEGMENT %
DECEMBER 31, 2016MARKET SEGMENT %
Equities Financials 36.3 Energy 19.2 Industrials 9.9 Materials 9.7 Consumer Discretionary 5.7 Telecommunication Services 4.6 Consumer Staples 3.3 Utilities 2.5 Real Estate 2.0 Information Technology 1.8 Index-Based Investments 1.0
Other Net Assets 4.0
Equities Financials 38.9Energy 20.5Industrials 9.6Materials 8.0Consumer Discretionary 5.7Telecommunication Services 4.1Utilities 3.9Consumer Staples 3.2Information Technology 2.0Real Estate 0.9
Other Net Assets 3.2
TOTAL 100 TOTAL 100

NOTES TO THE FINANCIAL STATEMENTS – SPECIFIC INFORMATION (UNAUDITED) (CONTINUED)
d I M P r I V A T E C A N A d I A N L A r G E C A P E Q U I T Y F U N d
18
Price RiskThe Fund may trade in financial instruments and take positions in traded and over-the-counter instruments.
The Manager’s estimate of the impact on Net Assets Attributable to Holders of Redeemable Units as a result of a reasonably possible change in benchmarks, using a historical beta coefficient (a measure of the sensitivity of a security in comparison to the market) between the Fund’s return as compared to the return of the Fund’s benchmarks, with all other variables held constant, is included in the following table. A 36-month regression analysis has been utilized to estimate the historical beta coefficient. The regression analysis uses data based on the monthly returns of the Fund.
CHANGE IN PRICE
IMPACT ON NET ASSETS ATTRIBUTABLE TO HOLDERS OF REDEEMABLE UNITS
BENCHMARKS %JUNE 30, 2017
$DECEMBER 31, 2016
$
S&P/TSX Dividend 3.00 17,820,345 20,394,568
When there is more than one benchmark, the effect of each benchmark must be considered individually, as each benchmark might fluctuate independently from the others.
In practice, actual trading results may differ from these sensitivity analyses and the differences could be significant.
Credit RiskAs at June 30, 2017 and December 31, 2016, the Fund had no significant investments in either fixed-income securities, money market securities and derivative financial instruments. As a result, the Fund is not significantly exposed to credit risk.
Liquidity RiskFor further information on maturities of financial liabilities and liquidity risk management of the Fund, please refer to Note 8 “Financial Instruments Disclosures”.

The accompanying Notes are an integral part of these financial statements.
19
d I M P r I V A T E C A N A d I A N E Q U I T Y G r O W T H F U N d
STATEMENT OF FINANCIAL POSITION ( U N A U d I T E d )
AS AT JUNE 302017
$
dECEMbEr 312016
$ASSETSCurrent AssetsCash 4,968,926 3,969,925 Investments at fair value through profit or loss (FVTPL) 145,556,621 144,228,763 Receivable for investments sold 1,219,246 –Interest, dividends and other receivables 353,451 290,739
152,098,244 148,489,427
LIABILITIESCurrent LiabilitiesAccrued expenses 76,413 10,343 Payable for investments purchased 1,583,613 973,400
1,660,026 983,743
Net Assets Attributable to Holders of Redeemable Units 150,438,218 147,505,684 – per unit (Note 4) 14.18 14.51
Approved on behalf of the Board of Directors ofDesjardins Investment Management Inc.,Manager of the DIM Private FundsVincent P. Hogue, President of the Board of Directorsand Sylvain Thériault, Director
STATEMENT OF CHANGES IN FINANCIAL POSITION ( U N A U d I T E d )
SIx-MONTH PErIOdS ENdEd JUNE 30 2017 2016 $ $
Net Assets Attributable to Holders of Redeemable Units, Beginning of Period 147,505,684 103,264,823
Increase (Decrease) in Net Assets Attributable to Holders of Redeemable Units (2,987,438) 10,290,142
Redeemable Unit Transactions Proceeds from sale of redeemable units 42,258,029 38,228,702 Reinvested distributions 1,589,012 964,243 Amounts paid for redeemable units redeemed (36,336,971) (7,274,828)
7,510,070 31,918,117
Distributions to Holders of Redeemable UnitsNet investment income (1,590,098) (964,841)
Net Assets Attributable to Holders of Redeemable Units, End of Period 150,438,218 144,508,241
STATEMENT OF CASH FLOWS ( U N A U d I T E d )
SIx-MONTH PErIOdS ENdEd JUNE 30 2017 2016 $ $
Cash Flows from (used in) Operating ActivitiesIncrease (decrease) in net assets attributable to holders of redeemable units (2,987,438) 10,290,142 Adjustments for: Foreign exchange gain (loss) on cash (112) – Net realized gain (loss) (116,087) (5,129,071) Net unrealized gain (loss) 4,497,986 (4,341,097)Proceeds from sale/maturity of investments 115,152,773 62,070,600 Investments purchased (120,862,442) (86,710,499)Receivable for investments sold (1,219,246) (3,309,989)Interest, dividends and other receivables (62,712) (141,725)Accrued expenses 66,070 50,093 Payable for investments purchased 610,213 62,340 Net Cash Flows from (used in) Operating Activities (4,920,995) (27,159,206)
Cash Flows from (used in) Financing ActivitiesProceeds from sale of redeemable units 42,258,029 38,228,702 Amounts paid for redeemable units redeemed (36,336,971) (7,274,828)Distributions paid to holders of redeemable units net of reinvested distributions (1,086) (598)Net Cash Flows from (used in) Financing Activities 5,919,972 30,953,276
Effect of exchange rate changes on foreign cash 24 –
Increase (decrease) in cash/bank overdraft 999,001 3,794,070 Cash (bank overdraft), beginning of period 3,969,925 2,392,282 Cash (Bank Overdraft), End of Period 4,968,926 6,186,352
Supplemental Information on Cash Flows from (used in) Operating ActivitiesInterest received 53,657 57,916 Dividends received, net of withholding taxes 1,530,295 913,281
STATEMENT OF COMPrEHENSIVE INCOME ( U N A U d I T E d )
SIx-MONTH PErIOdS ENdEd JUNE 30 2017$
2016$
IncomeInterest for distribution purposes 223,178 58,981 Dividends 1,602,688 1,054,290 Foreign exchange gain (loss) on cash 112 –Changes in fair value: Net realized gain (loss) on investments 116,087 5,129,071 Net unrealized gain (loss) on investments (4,497,986) 4,341,097
(2,555,921) 10,583,439 ExpensesAudit fees 3,533 3,302 Custodian fees 11,985 8,168 Unitholders’ reporting costs 2,177 1,831 Filing fees 10,984 9,425 Administration fees 142,335 115,371
171,014 138,097 Expenses absorbed by the Manager (26,278) (34,245)
144,736 103,852 Commissions and other portfolio transaction costs (Note 7) 286,781 189,445
431,517 293,297 Increase (Decrease) in Net Assets Attributable to Holders of Redeemable Units (2,987,438) 10,290,142 – per unit (0,26) 1,14
Average Number of Redeemable Units 11,429,188 9,010,000

SCHEDULE OF INVESTMENT PORTFOLIO AS AT JUNE 30, 2017 (UNAUDITED)
The accompanying Notes are an integral part of these financial statements.
d I M P r I V A T E C A N A d I A N E Q U I T Y G r O W T H F U N d
20
NUMBER FAIR OF SHARES COST VALUE $ $Telecommunication Services (1.9%)Rogers Communications, Class B 20,000 1,018,444 1,225,000TELUS 35,000 1,581,514 1,566,950 2,599,958 2,791,950Utilities (0.5%)Northland Power 31,000 651,450 716,100
Real Estate (4.2%)Canadian Real Estate Investment Trust 60,000 2,773,686 2,752,200FirstService 43,000 2,916,735 3,578,030 5,690,421 6,330,230
Total Equities 127,019,549 143,566,629
PAR VALUE
Money Market Securities (1.3%)Canada Treasury Bills 2018-05-03 CAD 2,000,000 1,989,992 1,989,992
Total Investments (96.8%) 129,009,541 145,556,621
Other Net Assets (3.2%) 4,881,597
Net Assets (100%) 150,438,218
NUMBER FAIR OF SHARES COST VALUE $ $
Equities (95.5%)Energy (13.8%)Advantage Oil & Gas 190,000 1,454,516 1,666,300Canadian Natural Resources 20,000 749,727 748,400Enerflex 85,000 1,586,981 1,599,700Enerplus Corporation 250,000 2,696,775 2,630,000Freehold Royalties 130,000 1,810,732 1,696,500Gibson Energy 90,000 1,759,883 1,508,400Kelt Exploration 249,823 1,848,315 1,568,888Parex Resources 130,000 1,328,815 1,917,500Parkland Fuel 48,749 1,248,827 1,448,333PrairieSky Royalty 32,000 998,320 944,960ShawCor, Class A 28,500 983,250 754,680TransCanada 50,000 2,810,658 3,091,000Trinidad Drilling 638,305 1,757,114 1,244,696 21,033,913 20,819,357Materials (11.6%)Canfor 140,000 2,664,664 2,742,600CCL Industries, Class B 36,605 707,841 2,401,654Dominion Diamond 50,000 892,734 816,000Hudbay Minerals 139,000 1,609,815 1,042,500Labrador Iron Ore Royalty 43,000 773,418 675,960Lundin Mining 530,000 3,955,190 3,906,100Methanex 27,000 1,675,600 1,545,750Norbord 42,000 1,481,020 1,695,540Teck Resources, Class B 38,000 373,175 854,240West Fraser Timber Co. 30,000 1,756,224 1,841,400 15,889,681 17,521,744Industrials (11.9%)Air Canada 110,000 1,505,738 1,911,800Bombardier, Class B 646,000 1,626,950 1,524,560Canadian National Railway Company 50,000 4,703,221 5,261,000Cargojet 15,000 747,281 712,650Finning International 118,000 2,790,018 2,999,560Russel Metals 100,000 2,532,496 2,596,000WSP Global 55,000 2,769,369 2,959,550 16,675,073 17,965,120Consumer Discretionary (3.7%)Dollarama 30,000 2,438,876 3,717,300Restaurant Brands International 22,000 1,828,854 1,785,080 4,267,730 5,502,380Consumer Staples (3.2%)Premium Brands Holdings 51,000 2,105,239 4,745,040
Health Care (0.4%)CRH Medical 75,000 893,183 553,500
Financials (33.8%)AGF Management, Class B 410,000 2,635,237 2,763,400Bank of Montreal 70,000 5,787,869 6,665,400Brookfield Asset Management, Class A 26,000 900,343 1,323,140Canadian Imperial Bank of Commerce 17,000 1,796,616 1,791,630Manulife Financial 61,000 1,479,915 1,482,910National Bank of Canada 50,000 2,711,830 2,726,500Onex 35,000 2,694,491 3,633,350Royal Bank of Canada 97,000 7,948,801 9,133,520Scotiabank 95,000 6,980,283 7,410,950TMX Group 54,000 3,224,151 3,810,240Toronto-Dominion Bank 155,000 8,712,447 10,129,250Trisura Group 152 2,180 3,298 44,874,163 50,873,588Information Technology (10.5%)Celestica 140,000 2,552,172 2,466,800Descartes Systems Group 60,000 1,591,662 1,893,000Kinaxis 38,000 1,276,429 3,068,120Open Text 90,000 3,656,425 3,683,700Shopify, Class A 25,000 1,472,824 2,815,000Sierra Wireless 50,000 1,789,226 1,821,000 12,338,738 15,747,620

NOTES TO THE FINANCIAL STATEMENTS – SPECIFIC INFORMATION (UNAUDITED)
d I M P r I V A T E C A N A d I A N E Q U I T Y G r O W T H F U N d
21
Strategy in Using Financial InstrumentsInvestment ObjectiveProvide long-term capital appreciation.
Financial Instruments Measured at Fair Value (Note 8)Hierarchy of Financial Instruments Measured at Fair ValueThe following tables categorize the Fund’s financial assets fair value measurement according to a three-level hierarchy. The methodology used for valuing securities is not necessarily an indication of the risk associated with investing in those securities. Fair value measurement is described in the “Significant Accounting Policies” section of Note 2.
Investment Measured at Fair Value at the End of the Period, within the Following Levels:
JUNE 30, 2017 LEVEL 1 LEVEL 2 LEVEL 3 TOTAL$ $ $ $
FINANCIAL ASSETS AT FVTPLEQUITIES 143,566,629 – – 143,566,629 MONEY MArKET SECUrITIES 1,989,992 – – 1,989,992 TOTAL 145,556,621 – – 145,556,621
DECEMBER 31, 2016 LEVEL 1 LEVEL 2 LEVEL 3 TOTAL$ $ $ $
FINANCIAL ASSETS AT FVTPLEQUITIES 130,244,493 – – 130,244,493MONEY MArKET SECUrITIES 13,984,270 – – 13,984,270TOTAL 144,228,763 – – 144,228,763
Transfers between Levels 1 and 2During the periods ended June 30, 2017 and December 31, 2016, there were no transfers of securities between Levels 1 and 2.
Financial Instruments Risks (Note 8)Currency RiskAs at June 30, 2017 and December 31, 2016, the majority of the Fund’s financial assets and liabilities are denominated in Canadian dollars. As a result, the Fund is not significantly exposed to currency risk.
Interest Rate RiskAs at June 30, 2017 and December 31, 2016, the majority of the Fund’s financial assets and liabilities are non-interest bearing. As a result, the Fund is not subject to significant amounts of risk arising from fluctuations in the prevailing levels of market interest rates.
Concentration RiskThe following tables summarize the concentration risk, as a percentage of the Fund’s Net Assets Attributable to Holders of Redeemable Units:
JUNE 30, 2017MARKET SEGMENT %
DECEMBER 31, 2016MARKET SEGMENT %
Equities Financials 33.8 Energy 13.8 Industrials 11.9 Materials 11.6 Information Technology 10.5 Real Estate 4.2 Consumer Discretionary 3.7 Consumer Staples 3.2 Telecommunication Services 1.9 Utilities 0.5 Health Care 0.4
Money Market Securities 1.3 Other Net Assets 3.2
Equities Financials 25.0Energy 20.4Materials 14.4Industrials 7.8Consumer Staples 6.1Information Technology 6.1Real Estate 3.4Utilities 2.4Telecommunication Services 1.8Consumer Discretionary 0.9
Money Market Securities 9.5Other Net Assets 2.2
TOTAL 100 TOTAL 100
Price RiskThe Fund may trade in financial instruments and take positions in traded and over-the-counter instruments.
The Manager’s estimate of the impact on Net Assets Attributable to Holders of Redeemable Units as a result of a reasonably possible change in benchmarks, using a historical beta coefficient (a measure of the sensitivity of a security in comparison to the market) between the Fund’s return as compared to the return of the Fund’s benchmarks, with all other variables held constant, is included in the following table. A 36-month regression analysis has been utilized to estimate the historical beta coefficient. The regression analysis uses data based on the monthly returns of the Fund.
CHANGE IN PRICE
IMPACT ON NET ASSETS ATTRIBUTABLE TO HOLDERS OF REDEEMABLE UNITS
BENCHMARKS %JUNE 30, 2017
$DECEMBER 31, 2016
$
S&P/TSX Composite 3.00 2,978,677 2,935,038
When there is more than one benchmark, the effect of each benchmark must be considered individually, as each benchmark might fluctuate independently from the others.
In practice, actual trading results may differ from these sensitivity analyses and the differences could be significant.
Credit RiskAs at June 30, 2017 and December 31, 2016, the Fund had no significant investments in either fixed-income securities, money market securities and derivative financial instruments. As a result, the Fund is not significantly exposed to credit risk.
Liquidity RiskFor further information on maturities of financial liabilities and liquidity risk management of the Fund, please refer to Note 8 “Financial Instruments Disclosures”.
The accompanying Notes are an integral part of these financial statements.
22
d I M P r I V A T E C A N A d I A N S M A L L C A P E Q U I T Y F U N d
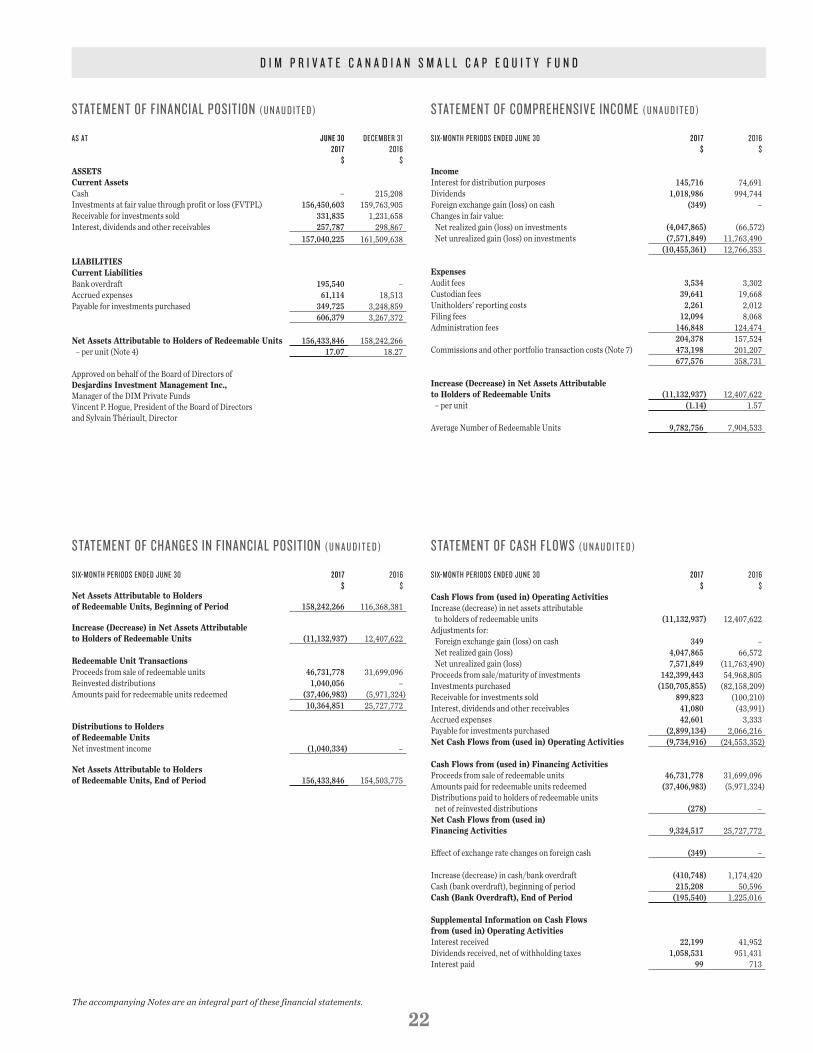
STATEMENT OF FINANCIAL POSITION ( U N A U d I T E d )
AS AT JUNE 302017
$
dECEMbEr 312016
$ASSETSCurrent AssetsCash – 215,208 Investments at fair value through profit or loss (FVTPL) 156,450,603 159,763,905 Receivable for investments sold 331,835 1,231,658 Interest, dividends and other receivables 257,787 298,867
157,040,225 161,509,638
LIABILITIESCurrent LiabilitiesBank overdraft 195,540 –Accrued expenses 61,114 18,513 Payable for investments purchased 349,725 3,248,859
606,379 3,267,372
Net Assets Attributable to Holders of Redeemable Units 156,433,846 158,242,266 – per unit (Note 4) 17.07 18.27
Approved on behalf of the Board of Directors ofDesjardins Investment Management Inc.,Manager of the DIM Private FundsVincent P. Hogue, President of the Board of Directorsand Sylvain Thériault, Director
STATEMENT OF COMPrEHENSIVE INCOME ( U N A U d I T E d )
SIx-MONTH PErIOdS ENdEd JUNE 30 2017$
2016$
IncomeInterest for distribution purposes 145,716 74,691 Dividends 1,018,986 994,744 Foreign exchange gain (loss) on cash (349) –Changes in fair value: Net realized gain (loss) on investments (4,047,865) (66,572) Net unrealized gain (loss) on investments (7,571,849) 11,763,490
(10,455,361) 12,766,353
ExpensesAudit fees 3,534 3,302 Custodian fees 39,641 19,668 Unitholders’ reporting costs 2,261 2,012 Filing fees 12,094 8,068 Administration fees 146,848 124,474
204,378 157,524 Commissions and other portfolio transaction costs (Note 7) 473,198 201,207
677,576 358,731
Increase (Decrease) in Net Assets Attributable to Holders of Redeemable Units (11,132,937) 12,407,622 – per unit (1.14) 1.57
Average Number of Redeemable Units 9,782,756 7,904,533
STATEMENT OF CHANGES IN FINANCIAL POSITION ( U N A U d I T E d )
SIx-MONTH PErIOdS ENdEd JUNE 30 2017 2016 $ $
Net Assets Attributable to Holders of Redeemable Units, Beginning of Period 158,242,266 116,368,381
Increase (Decrease) in Net Assets Attributable to Holders of Redeemable Units (11,132,937) 12,407,622
Redeemable Unit Transactions Proceeds from sale of redeemable units 46,731,778 31,699,096 Reinvested distributions 1,040,056 –Amounts paid for redeemable units redeemed (37,406,983) (5,971,324)
10,364,851 25,727,772
Distributions to Holders of Redeemable UnitsNet investment income (1,040,334) –
Net Assets Attributable to Holders of Redeemable Units, End of Period 156,433,846 154,503,775
STATEMENT OF CASH FLOWS ( U N A U d I T E d )
SIx-MONTH PErIOdS ENdEd JUNE 30 2017 2016 $ $
Cash Flows from (used in) Operating ActivitiesIncrease (decrease) in net assets attributable to holders of redeemable units (11,132,937) 12,407,622 Adjustments for: Foreign exchange gain (loss) on cash 349 – Net realized gain (loss) 4,047,865 66,572 Net unrealized gain (loss) 7,571,849 (11,763,490)Proceeds from sale/maturity of investments 142,399,443 54,968,805 Investments purchased (150,705,855) (82,158,209)Receivable for investments sold 899,823 (100,210)Interest, dividends and other receivables 41,080 (43,991)Accrued expenses 42,601 3,333 Payable for investments purchased (2,899,134) 2,066,216 Net Cash Flows from (used in) Operating Activities (9,734,916) (24,553,352)
Cash Flows from (used in) Financing ActivitiesProceeds from sale of redeemable units 46,731,778 31,699,096 Amounts paid for redeemable units redeemed (37,406,983) (5,971,324)Distributions paid to holders of redeemable units net of reinvested distributions (278) –Net Cash Flows from (used in) Financing Activities 9,324,517 25,727,772
Effect of exchange rate changes on foreign cash (349) –
Increase (decrease) in cash/bank overdraft (410,748) 1,174,420 Cash (bank overdraft), beginning of period 215,208 50,596 Cash (Bank Overdraft), End of Period (195,540) 1,225,016
Supplemental Information on Cash Flows from (used in) Operating ActivitiesInterest received 22,199 41,952 Dividends received, net of withholding taxes 1,058,531 951,431 Interest paid 99 713

SCHEDULE OF INVESTMENT PORTFOLIO AS AT JUNE 30, 2017 (UNAUDITED)
The accompanying Notes are an integral part of these financial statements.
d I M P r I V A T E C A N A d I A N S M A L L C A P E Q U I T Y F U N d
23
NUMBER FAIR OF SHARES COST VALUE $ $Utilities (3.3%)Boralex, Class A 170,249 2,877,262 3,738,668Crius Energy Trust, Units 143,046 1,137,156 1,483,387 4,014,418 5,222,055Real Estate (12.3%)Altus Group 89,604 2,020,892 2,511,600Colliers International Group 39,664 1,868,230 2,907,371FirstService 14,703 579,863 1,223,437InterRent Real Estate Investment Trust 467,221 3,122,861 3,779,818Killam Apartment Real Estate Investment Trust 96,788 976,711 1,233,079Pure Multi-family REIT 215,042 1,962,716 1,868,715Tricon Capital Group 493,305 4,411,217 5,732,207 14,942,490 19,256,227
Total Canadian Equities 138,307,122 151,604,477
U.S. Equities (0.6%)EnergyGran Tierra Energy 313,810 1,097,113 903,773
Foreign Equities (1.9%)Cayman IslandsEndeavour Mining 129,952 3,160,614 2,908,326
Total Equities 142,564,849 155,416,576
PAR VALUE
Money Market Securities (0.7%)Canada Treasury Bills 2017-08-10 CAD 190,000 189,877 189,877 2017-08-24 CAD 595,000 594,411 594,411 2017-09-07 CAD 250,000 249,739 249,739
Total Money Market Securities 1,034,027 1,034,027
Total Investments (100.0%) 143,598,876 156,450,603
Other Net Assets (-0.0%) (16,757)
Net Assets (100%) 156,433,846
NUMBER FAIR OF SHARES COST VALUE $ $
Equities (99.3%)
Canadian Equities (96.8%)Energy (12.1%)CES Energy Solutions 539,487 4,093,165 3,118,235Enerflex 176,988 3,053,272 3,330,914Kelt Exploration 301,948 2,113,454 1,896,233Nuvista Energy 327,654 2,174,004 2,146,134Parex Resources 324,225 4,705,109 4,782,319Spartan Energy 51,631 428,498 317,531Tidewater Midstream & Infrastructure 1,753,159 2,545,221 2,296,638ZCL Composites 84,039 1,080,442 1,094,188 20,193,165 18,982,192Materials (13.1%)Asanko Gold 635,369 2,669,573 1,264,384Hudbay Minerals 316,573 2,906,236 2,374,298Interfor 195,787 3,035,061 3,637,722Intertape Polymer Group 208,843 4,945,256 5,156,334Major Drilling Group International 180,774 1,386,347 1,534,771Osisko Mining 319,005 1,028,859 1,307,920Stella-Jones 54,143 1,861,339 2,396,369Wesdome Gold Mines 138,400 457,952 422,120Winpak 41,734 2,339,994 2,429,753 20,630,617 20,523,671Industrials (20.2%)Ag Growth International 54,614 2,531,086 3,152,320Badger Daylighting 182,462 4,829,643 4,857,138Black Diamond Group 117,737 515,014 324,954Boyd Group Income Fund 48,589 2,553,650 4,671,832Cargojet 86,840 3,191,816 4,125,768DIRTT Environmental Solutions 353,251 1,866,658 2,419,769New Flyer Industries 89,808 3,434,234 4,871,186Richelieu Hardware 97,126 2,138,021 2,918,636Russel Metals 93,313 2,511,650 2,422,405Savaria 109,330 882,887 1,742,720 24,454,659 31,506,728Consumer Discretionary (12.8%)Aritzia 164,514 2,736,865 2,471,000AutoCanada 35,172 890,199 671,082Freshii, Class A 61,964 813,928 762,157Park Lawn 116,973 2,155,985 2,201,432Sleep Country Canada Holdings 117,355 3,780,296 4,829,158Spin Master 80,330 2,302,416 3,108,771Stingray Digital Group 231,845 1,772,501 1,826,939Uni-Select 134,980 4,583,955 4,227,574 19,036,145 20,098,113Consumer Staples (3.0%)AGT Food & Ingredients 42,763 1,328,269 995,523Clearwater Seafoods 64,348 740,054 734,854Premium Brands Holdings 32,059 2,642,408 2,982,769 4,710,731 4,713,146Health Care (2.6%)CRH Medical 208,812 1,646,351 1,541,033Knight Therapeutics 247,050 1,866,914 2,542,144 3,513,265 4,083,177Financials (6.8%)Acasta Enterprises Warrants, 2023-07-30 85,709 38,630 74,567 Class B 299,653 2,965,349 2,301,335Canadian Western Bank 58,695 1,639,462 1,607,069Equitable Group 70,789 4,174,661 4,210,530StorageVault Canada 925,567 1,739,246 2,443,497 10,557,348 10,636,998Information Technology (10.6%)DealNet Capital 2,017,703 1,060,036 615,399Descartes Systems Group 134,915 4,238,055 4,256,568Enghouse Systems 88,567 4,613,512 4,654,196Kinaxis 52,117 3,784,382 4,207,927Solium Capital 144,308 1,060,047 1,415,661Sylogist 158,981 1,498,252 1,432,419 16,254,284 16,582,170

NOTES TO THE FINANCIAL STATEMENTS – SPECIFIC INFORMATION (UNAUDITED)
d I M P r I V A T E C A N A d I A N S M A L L C A P E Q U I T Y F U N d
24
Strategy in Using Financial InstrumentsInvestment ObjectiveProvide mid-term return superior to that of the Canadian stock market as a whole.
Financial Instruments Measured at Fair Value (Note 8)Hierarchy of Financial Instruments Measured at Fair ValueThe following tables categorize the Fund’s financial assets fair value measurement according to a three-level hierarchy. The methodology used for valuing securities is not necessarily an indication of the risk associated with investing in those securities. Fair value measurement is described in the “Significant Accounting Policies” section of Note 2.
Investment Measured at Fair Value at the End of the Period, within the Following Levels:
JUNE 30, 2017 LEVEL 1 LEVEL 2 LEVEL 3 TOTAL$ $ $ $
FINANCIAL ASSETS AT FVTPLEQUITIES 155,416,576 – – 155,416,576 MONEY MArKET SECUrITIES 1,034,027 – – 1,034,027 TOTAL 156,450,603 – – 156,450,603
DECEMBER 31, 2016 LEVEL 1 LEVEL 2 LEVEL 3 TOTAL$ $ $ $
FINANCIAL ASSETS AT FVTPLEQUITIES 156,337,231 – – 156,337,231MONEY MArKET SECUrITIES 3,426,674 – – 3,426,674TOTAL 159,763,905 – – 159,763,905
Transfers between Levels 1 and 2During the periods ended June 30, 2017 and December 31, 2016, there were no transfers of securities between Levels 1 and 2.
Classification of Level 3As at June 30, 2017 and December 31, 2016, the Fund has no financial instruments classified within Level 3.
Reconciliation of Level 3 Measured at Fair ValueThe following table summarizes a reconciliation of movements on Level 3 financial instruments between the beginning and end of the period:
DECEMBER 31, 2016 TOTAL$
BALANCE, BEGINNING OF YEAR –PrOCEEdS FrOM SALE OF INVESTMENTS –INVESTMENTS PUrCHASEd 321,750 NET rEALIZEd GAIN (LOSS) –NET UNrEALIZEd GAIN (LOSS) –TrANSFErS TO (FrOM) LEVEL 3 (321,750)BALANCE, END OF YEAR –
Financial Instruments Risks (Note 8)Currency RiskAs at June 30, 2017 and December 31, 2016, the majority of the Fund’s financial assets and liabilities are denominated in Canadian dollars. As a result, the Fund is not significantly exposed to currency risk.
Interest Rate RiskAs at June 30, 2017 and December 31, 2016, the majority of the Fund’s financial assets and liabilities are non-interest bearing. As a result, the Fund is not subject to significant amounts of risk arising from fluctuations in the prevailing levels of market interest rates.
Concentration RiskThe following tables summarize the concentration risk, as a percentage of the Fund’s Net Assets Attributable to Holders of Redeemable Units:
JUNE 30, 2017MARKET SEGMENT %
DECEMBER 31, 2016MARKET SEGMENT %
Canadian Equities Industrials 20.2 Materials 13.1 Consumer Discretionary 12.8 Real Estate 12.3 Energy 12.1 Information Technology 10.6 Financials 6.8 Utilities 3.3 Consumer Staples 3.0 Health Care 2.6
U.S. Equities 0.6 Foreign Equities 1.9 Money Market Securities 0.7
Equities Energy 25.7Industrials 19.7Materials 12.9Real Estate 11.4Financials 8.5Consumer Discretionary 7.6Consumer Staples 4.4Information Technology 4.0Utilities 2.4Health Care 2.2
Money Market Securities 2.2Other Net Assets (1.0)
TOTAL 100 TOTAL 100
Price RiskThe Fund may trade in financial instruments and take positions in traded and over-the-counter instruments.
The Manager’s estimate of the impact on Net Assets Attributable to Holders of Redeemable Units as a result of a reasonably possible change in benchmarks, using a historical beta coefficient (a measure of the sensitivity of a security in comparison to the market) between the Fund’s return as compared to the return of the Fund’s benchmarks, with all other variables held constant, is included in the following table. A 36-month regression analysis has been utilized to estimate the historical beta coefficient. The regression analysis uses data based on the monthly returns of the Fund.
CHANGE IN PRICE
IMPACT ON NET ASSETS ATTRIBUTABLE TO HOLDERS OF REDEEMABLE UNITS
BENCHMARKS %JUNE 30, 2017
$DECEMBER 31, 2016
$
S&P/TSX Small Cap 3.00 2,393,438 2,640,918
When there is more than one benchmark, the effect of each benchmark must be considered individually, as each benchmark might fluctuate independently from the others.
In practice, actual trading results may differ from these sensitivity analyses and the differences could be significant.
Credit RiskAs at June 30, 2017 and December 31, 2016, the Fund had no significant investments in either fixed-income securities, money market securities and derivative financial instruments. As a result, the Fund is not significantly exposed to credit risk.
Liquidity RiskFor further information on maturities of financial liabilities and liquidity risk management of the Fund, please refer to Note 8 “Financial Instruments Disclosures”.

The accompanying Notes are an integral part of these financial statements.
25
d I M P r I V A T E U . S . E Q U I T Y F U N d ( F O r T A x A b L E A C C O U N T S )
STATEMENT OF FINANCIAL POSITION ( U N A U d I T E d )
AS AT JUNE 302017
$
dECEMbEr 312016
$ASSETSCurrent AssetsCash 36,299,501 10,493,963 Investments at fair value through profit or loss (FVTPL) 598,345,447 547,785,240 Receivable for investments sold 3,170,006 –Interest, dividends and other receivables 637,699 247,478
638,452,653 558,526,681
LIABILITIESCurrent LiabilitiesAccrued expenses 147,860 34,914 Payable for investments purchased 2,559,085 –
2,706,945 34,914
Net Assets Attributable to Holders of Redeemable Units 635,745,708 558,491,767 – per unit (Note 4) 10.48 10.07
Approved on behalf of the Board of Directors ofDesjardins Investment Management Inc.,Manager of the DIM Private FundsVincent P. Hogue, President of the Board of Directorsand Sylvain Thériault, Director
STATEMENT OF COMPrEHENSIVE INCOME ( U N A U d I T E d )
SIx-MONTH PErIOdS ENdEd JUNE 30 2017$
2016$
IncomeInterest for distribution purposes 1,044,033 879,320 Dividends 5,514,564 4,066,668 Foreign exchange gain (loss) on cash (494,554) 208,848 Changes in fair value: Net realized gain (loss) on investments 43,311,484 7,070,693 Net realized gain (loss) on derivatives – 27,500,182 Net unrealized gain (loss) on investments (18,707,878) (29,633,528)
30,667,649 10,092,183
ExpensesAudit fees 3,534 3,302 Custodian fees 54,415 47,839 Unitholders’ reporting costs 8,202 7,498 Filing fees 33,508 24,668 Administration fees 483,638 411,500
583,297 494,807 Withholding taxes 692,188 576,883 Commissions and other portfolio transaction costs (Note 7) 194,421 177,532
1,469,906 1,249,222
Increase (Decrease) in Net Assets Attributable to Holders of Redeemable Units 29,197,743 8,842,961 – per unit 0.49 0.17
Average Number of Redeemable Units 59,083,221 52,445,157
STATEMENT OF CHANGES IN FINANCIAL POSITION ( U N A U d I T E d )
SIx-MONTH PErIOdS ENdEd JUNE 30 2017 2016 $ $
Net Assets Attributable to Holders of Redeemable Units, Beginning of Period 558,491,767 471,775,562
Increase (Decrease) in Net Assets Attributable to Holders of Redeemable Units 29,197,743 8,842,961
Redeemable Unit Transactions Proceeds from sale of redeemable units 132,078,761 100,603,908 Reinvested distributions 5,008,629 2,712,026 Amounts paid for redeemable units redeemed (83,965,553) (52,453,539)
53,121,837 50,862,395
Distributions to Holders of Redeemable UnitsNet investment income (5,065,639) (2,737,131)
Net Assets Attributable to Holders of Redeemable Units, End of Period 635,745,708 528,743,787
STATEMENT OF CASH FLOWS ( U N A U d I T E d )
SIx-MONTH PErIOdS ENdEd JUNE 30 2017 2016 $ $
Cash Flows from (used in) Operating ActivitiesIncrease (decrease) in net assets attributable to holders of redeemable units 29,197,743 8,842,961 Adjustments for: Foreign exchange gain (loss) on cash 494,554 (208,848) Net realized gain (loss) (43,311,484) (34,570,875) Net unrealized gain (loss) 18,707,878 29,633,528 Proceeds from sale/maturity of investments 255,228,071 190,381,536 Investments purchased (280,497,100) (233,426,011)Receivable for investments sold (3,170,006) (1,681,488)Interest, dividends and other receivables (390,221) (110,933)Accrued expenses 112,946 (26,587)Payable for investments purchased 2,559,085 7,065,132 Net Cash Flows from (used in) Operating Activities (21,068,534) (34,101,585)
Cash Flows from (used in) Financing ActivitiesProceeds from sale of redeemable units 132,078,761 100,603,908 Amounts paid for redeemable units redeemed (83,965,553) (52,453,539)Distributions paid to holders of redeemable units net of reinvested distributions (57,010) (25,105)Net Cash Flows from (used in) Financing Activities 48,056,198 48,125,264
Effect of exchange rate changes on foreign cash (1,182,126) (877,660)
Increase (decrease) in cash/bank overdraft 25,805,538 13,146,019 Cash (bank overdraft), beginning of period 10,493,963 34,226,097 Cash (Bank Overdraft), End of Period 36,299,501 47,372,116
Supplemental Information on Cash Flows from (used in) Operating ActivitiesInterest received 12,457 11,760 Dividends received, net of withholding taxes 4,360,860 3,378,852 Interest paid 5,242 151

SCHEDULE OF INVESTMENT PORTFOLIO AS AT JUNE 30, 2017 (UNAUDITED)
The accompanying Notes are an integral part of these financial statements.
d I M P r I V A T E U . S . E Q U I T Y F U N d ( F O r T A x A b L E A C C O U N T S )
26
NUMBER FAIR OF SHARES COST VALUE $ $
Equities (94.1%)
U.S. Equities (83.1%)Energy (5.4%)Cimarex Energy 31,285 5,044,002 3,814,022ConocoPhillips 102,750 6,773,822 5,857,503EOG Resources 61,685 7,034,895 7,240,976Exxon Mobil 117,905 13,032,413 12,343,553Pioneer Natural Resources 25,480 5,109,983 5,272,916 36,995,115 34,528,970Industrials (11.4%)Deere & Company 26,545 2,995,432 4,254,407General Electric Company 195,195 7,422,145 6,837,011Honeywell International 76,485 9,029,426 13,220,468Raytheon Company 49,140 8,759,611 10,290,273Rockwell Automation 24,160 3,475,791 5,074,318Union Pacific 30,790 3,698,525 4,348,610United Parcel Service, Class B 78,685 11,200,426 11,284,461United Technologies 109,845 14,713,516 17,394,203 61,294,872 72,703,751Consumer Discretionary (5.7%)AutoZone 15,121 12,734,028 11,186,100Comcast, Class A 243,842 10,625,179 12,307,061Lowe’s Companies 77,785 7,753,513 7,820,574lululemon athletica 64,500 4,642,395 4,991,014 35,755,115 36,304,749Consumer Staples (11.0%)Coca-Cola Company 474,290 26,698,104 27,585,408Kellogg Company 92,390 8,622,745 8,322,097Molson Coors Brewing Company, Class B 109,835 13,658,658 12,297,754Procter & Gamble 110,427 11,582,668 12,480,031Walgreens Boots Alliance 89,145 9,344,133 9,052,889 69,906,308 69,738,179Health Care (12.0%)Celgene 70,785 10,263,604 11,921,285Eli Lilly and Company 55,580 5,438,002 5,931,867Humana 21,720 6,164,567 6,777,422Johnson & Johnson 102,745 14,335,495 17,626,282Pfizer 427,090 17,046,800 18,603,832Thermo Fisher Scientific 30,065 5,088,257 6,802,287Zoetis 105,585 5,335,992 8,541,234 63,672,717 76,204,209Financials (9.5%)Citigroup 319,700 25,807,388 27,727,576Commerce Bancshares 114,760 8,463,598 8,457,484Intercontinental Exchange Group 176,810 9,998,728 15,114,613Morgan Stanley 160,310 9,447,058 9,263,579 53,716,772 60,563,252Information Technology (25.4%)Alphabet, Class A 26,050 22,278,889 31,406,115Apple 160,172 20,227,798 29,914,545Applied Materials 54,140 1,532,609 2,900,324Cisco Systems 329,945 11,519,445 13,392,415DXC Technology Company 63,515 6,449,109 6,319,139eBay 282,540 10,273,127 12,794,614Facebook, Class A 44,960 6,875,327 8,802,757Fidelity National Information Services 60,065 5,498,933 6,652,002Microsoft 251,830 15,949,278 22,510,687Motorola Solutions 114,100 12,538,587 12,834,474Palo Alto Networks 21,870 3,405,480 3,794,988Visa, Class A 78,409 6,318,371 9,535,625 122,866,953 160,857,685Telecommunication Services (2.7%)AT&T 356,340 18,341,583 17,435,098
Total U.S. Equities 462,549,435 528,335,893
NUMBER FAIR OF SHARES COST VALUE $ $
Foreign Equities (11.0%)Ireland (6.5%)Allergan 38,560 12,197,863 12,155,620Eaton 71,305 6,996,943 7,196,810Johnson Controls International 188,552 10,064,316 10,602,137Medtronic 97,785 10,241,857 11,254,173 39,500,979 41,208,740Netherlands Antilles (2.5%)Schlumberger 188,680 19,011,002 16,109,746
United Kingdom (2.0%)Aon 73,610 9,645,570 12,691,068
Total Foreign Equities 68,157,551 70,009,554
Total Investments (94.1%) 530,706,986 598,345,447
Other Net Assets (5.9%) 37,400,261
Net Assets (100%) 635,745,708

NOTES TO THE FINANCIAL STATEMENTS – SPECIFIC INFORMATION (UNAUDITED)
d I M P r I V A T E U . S . E Q U I T Y F U N d ( F O r T A x A b L E A C C O U N T S )
27
Strategy in Using Financial InstrumentsInvestment ObjectiveProvide long-term capital growth.
Financial Instruments Measured at Fair Value (Note 8)Hierarchy of Financial Instruments Measured at Fair ValueThe following tables categorize the Fund’s financial assets fair value measurement according to a three-level hierarchy. The methodology used for valuing securities is not necessarily an indication of the risk associated with investing in those securities. Fair value measurement is described in the “Significant Accounting Policies” section of Note 2.
Investment Measured at Fair Value at the End of the Period, within the Following Levels:
JUNE 30, 2017 LEVEL 1 LEVEL 2 LEVEL 3 TOTAL$ $ $ $
FINANCIAL ASSETS AT FVTPLEQUITIES 598,345,447 – – 598,345,447 TOTAL 598,345,447 – – 598,345,447
DECEMBER 31, 2016 LEVEL 1 LEVEL 2 LEVEL 3 TOTAL$ $ $ $
FINANCIAL ASSETS AT FVTPLEQUITIES 547,785,240 – – 547,785,240TOTAL 547,785,240 – – 547,785,240
Transfers between Levels 1 and 2During the periods ended June 30, 2017 and December 31, 2016, there were no transfers of securities between Levels 1 and 2.
Financial Instruments Risks (Note 8)Currency RiskThe following tables indicate the foreign currencies to which the Fund had significant exposure, in Canadian dollar terms, and the notional amounts of foreign exchange forward contracts. The tables also illustrate the potential impact on the Net Assets Attributable to Holders of Redeemable Units if the Canadian dollar had strengthened or weakened by 3% in relation to each of the other currencies, with all other variables held constant.
JUNE 30, 2017
FINANCIAL ASSETSFINANCIAL
LIABILITIESNET
EXPOSURE
IMPACT ON NET ASSETS
ATTRIBUTABLE TO HOLDERS OF
REDEEMABLE UNITS$ $ $ $
U.S. Dollar 623,786,081 – 623,786,081 18,713,582 * COMPOSEd OF:MONETArY ITEMS 25,440,634 NON-MONETArY ITEMS 598,345,447
DECEMBER 31, 2016
FINANCIAL ASSETSFINANCIAL
LIABILITIESNET
EXPOSURE
IMPACT ON NET ASSETS
ATTRIBUTABLE TO HOLDERS OF
REDEEMABLE UNITS$ $ $ $
U.S. Dollar 554,047,220 – 554,047,220 16,621,417* COMPOSEd OF:MONETArY ITEMS 6,261,980NON-MONETArY ITEMS 547,785,240
In practice, actual trading results may differ from these sensitivity analyses and the differences could be significant.
Interest Rate RiskAs at June 30, 2017 and December 31, 2016, the majority of the Fund’s financial assets and liabilities are non-interest bearing. As a result, the Fund is not subject to significant amounts of risk arising from fluctuations in the prevailing levels of market interest rates.
Concentration RiskThe following tables summarize the concentration risk, as a percentage of the Fund’s Net Assets Attributable to Holders of Redeemable Units:
JUNE 30, 2017MARKET SEGMENT %
DECEMBER 31, 2016MARKET SEGMENT %
U.S. Equities Information Technology 25.4 Health Care 12.0 Industrials 11.4 Consumer Staples 11.0 Financials 9.5 Consumer Discretionary 5.7 Energy 5.4 Telecommunication Services 2.7
Foreign Equities 11.0 Other Net Assets 5.9
U.S. Equities Information Technology 27.7Health Care 14.0Industrials 11.6Consumer Staples 11.1Financials 8.8Consumer Discretionary 8.3Telecommunication Services 3.3Energy 1.7Real Estate 1.0
Foreign Equities 10.6Other Net Assets 1.9
TOTAL 100 TOTAL 100
Price RiskThe Fund may trade in financial instruments and take positions in traded and over-the-counter instruments.
The Manager’s estimate of the impact on Net Assets Attributable to Holders of Redeemable Units as a result of a reasonably possible change in benchmarks, using a historical beta coefficient (a measure of the sensitivity of a security in comparison to the market) between the Fund’s return as compared to the return of the Fund’s benchmarks, with all other variables held constant, is included in the following table. A 36-month regression analysis has been utilized to estimate the historical beta coefficient. The regression analysis uses data based on the monthly returns of the Fund.
CHANGE IN PRICE
IMPACT ON NET ASSETS ATTRIBUTABLE TO HOLDERS OF REDEEMABLE UNITS
BENCHMARKS %JUNE 30, 2017
$DECEMBER 31, 2016
$
S&P 500 3.00 17,546,582 15,375,695
When there is more than one benchmark, the effect of each benchmark must be considered individually, as each benchmark might fluctuate independently from the others.
In practice, actual trading results may differ from these sensitivity analyses and the differences could be significant.
Credit RiskAs at June 30, 2017 and December 31, 2016, the Fund had no significant investments in either fixed-income securities, money market securities and derivative financial instruments. As a result, the Fund is not significantly exposed to credit risk.
Liquidity RiskFor further information on maturities of financial liabilities and liquidity risk management of the Fund, please refer to Note 8 “Financial Instruments Disclosures”.
*
*

The accompanying Notes are an integral part of these financial statements.
28
d I M P r I V A T E U . S . E Q U I T Y F U N d ( F O r N O N T A x A b L E A C C O U N T S )
STATEMENT OF FINANCIAL POSITION ( U N A U d I T E d )
AS AT JUNE 302017
$
dECEMbEr 312016
$ASSETSCurrent AssetsCash 5,118,204 7,145,958 Investments at fair value through profit or loss (FVTPL) 183,626,383 167,173,459 Receivable for investments sold 964,747 –Interest, dividends and other receivables 206,765 79,873
189,916,099 174,399,290
LIABILITIESCurrent LiabilitiesAccrued expenses 78,419 14,711 Payable for investments purchased 733,639 –
812,058 14,711
Net Assets Attributable to Holders of Redeemable Units 189,104,041 174,384,579 – per unit (Note 4) 11.62 11.06
Approved on behalf of the Board of Directors ofDesjardins Investment Management Inc.,Manager of the DIM Private FundsVincent P. Hogue, President of the Board of Directorsand Sylvain Thériault, Director
STATEMENT OF COMPrEHENSIVE INCOME ( U N A U d I T E d )
SIx-MONTH PErIOdS ENdEd JUNE 30 2017$
2016$
IncomeInterest for distribution purposes 220,499 330,749 Dividends 1,666,310 1,315,790 Foreign exchange gain (loss) on cash (312,628) 179,722 Changes in fair value: Net realized gain (loss) on investments 13,465,329 2,700,507 Net realized gain (loss) on derivatives – 8,986,888 Net unrealized gain (loss) on investments (5,964,491) (10,533,311)
9,075,019 2,980,345
ExpensesAudit fees 3,535 3,302 Custodian fees 32,810 23,884 Unitholders’ reporting costs 2,460 2,407 Filing fees 6,061 3,622 Administration fees 165,052 156,060
209,918 189,275 Commissions and other portfolio transaction costs (Note 7) 58,041 56,117
267,959 245,392
Increase (Decrease) in Net Assets Attributable to Holders of Redeemable Units 8,807,060 2,734,953 – per unit 0.55 0.18
Average Number of Redeemable Units 16,094,368 14,945,468
STATEMENT OF CHANGES IN FINANCIAL POSITION ( U N A U d I T E d )
SIx-MONTH PErIOdS ENdEd JUNE 30 2017 2016 $ $
Net Assets Attributable to Holders of Redeemable Units, Beginning of Period 174,384,579 158,096,932
Increase (Decrease) in Net Assets Attributable to Holders of Redeemable Units 8,807,060 2,734,953
Redeemable Unit Transactions Proceeds from sale of redeemable units 22,763,616 13,403,629 Amounts paid for redeemable units redeemed (16,851,214) (10,255,981)
5,912,402 3,147,648
Net Assets Attributable to Holders of Redeemable Units, End of Period 189,104,041 163,979,533
STATEMENT OF CASH FLOWS ( U N A U d I T E d )
SIx-MONTH PErIOdS ENdEd JUNE 30 2017 2016 $ $
Cash Flows from (used in) Operating ActivitiesIncrease (decrease) in net assets attributable to holders of redeemable units 8,807,060 2,734,953 Adjustments for: Foreign exchange gain (loss) on cash 312,628 (179,722) Net realized gain (loss) (13,465,329) (11,687,395) Net unrealized gain (loss) 5,964,491 10,533,311 Proceeds from sale/maturity of investments 75,598,509 63,368,324 Investments purchased (84,461,443) (66,974,139)Receivable for investments sold (964,747) (562,456)Interest, dividends and other receivables (126,892) (35,496)Accrued expenses 63,708 30,620 Payable for investments purchased 733,639 2,178,008 Net Cash Flows from (used in) Operating Activities (7,538,376) (593,992)
Cash Flows from (used in) Financing ActivitiesProceeds from sale of redeemable units 22,763,616 13,403,629 Amounts paid for redeemable units redeemed (16,851,214) (10,255,981)Net Cash Flows from (used in) Financing Activities 5,912,402 3,147,648
Effect of exchange rate changes on foreign cash (401,780) (143,344)
Increase (decrease) in cash/bank overdraft (2,027,754) 2,410,312 Cash (bank overdraft), beginning of period 7,145,958 10,427,599 Cash (Bank Overdraft), End of Period 5,118,204 12,837,911
Supplemental Information on Cash Flows from (used in) Operating ActivitiesInterest received 2,893 3,054 Dividends received, net of withholding taxes 1,533,542 1,280,294 Interest paid 735 –

SCHEDULE OF INVESTMENT PORTFOLIO AS AT JUNE 30, 2017 (UNAUDITED)
The accompanying Notes are an integral part of these financial statements.
d I M P r I V A T E U . S . E Q U I T Y F U N d ( F O r N O N T A x A b L E A C C O U N T S )
29
NUMBER FAIR OF SHARES COST VALUE $ $
Equities (97.1%)
U.S. Equities (85.9%)Energy (5.7%)Cimarex Energy 10,280 1,617,544 1,253,257ConocoPhillips 29,945 1,977,506 1,707,084EOG Resources 20,480 2,336,246 2,404,072Exxon Mobil 37,700 4,160,918 3,946,838Pioneer Natural Resources 7,385 1,463,256 1,528,277 11,555,470 10,839,528Industrials (11.6%)Deere & Company 8,710 1,022,898 1,395,965General Electric Company 57,135 2,174,634 2,001,243Honeywell International 22,175 2,476,079 3,832,959Raytheon Company 14,290 2,531,572 2,992,430Rockwell Automation 7,810 1,157,446 1,640,332Union Pacific 8,900 1,063,363 1,256,987United Parcel Service, Class B 25,755 3,671,906 3,693,605United Technologies 31,875 4,235,112 5,047,478 18,333,010 21,860,999Consumer Discretionary (6.2%)AutoZone 4,867 4,008,437 3,600,473Comcast, Class A 79,561 3,522,961 4,015,560Lowe’s Companies 25,335 2,537,319 2,547,204lululemon athletica 21,180 1,523,745 1,638,910 11,592,462 11,802,147Consumer Staples (11.2%)Coca-Cola Company 137,875 7,756,618 8,019,014Kellogg Company 26,780 2,489,715 2,412,228Molson Coors Brewing Company, Class B 36,110 4,447,130 4,043,082Procter & Gamble 35,949 3,776,988 4,062,817Walgreens Boots Alliance 26,030 2,725,136 2,643,409 21,195,587 21,180,550Health Care (12.7%)Celgene 20,610 2,957,058 3,471,042Eli Lilly and Company 16,175 1,567,153 1,726,303Humana 6,410 1,819,755 2,000,151Johnson & Johnson 33,530 4,771,603 5,752,195Pfizer 139,230 5,559,664 6,064,791Thermo Fisher Scientific 8,700 1,429,141 1,968,398Zoetis 38,395 2,123,056 3,105,940 20,227,430 24,088,820Financials (10.2%)Citigroup 104,755 8,489,426 9,085,400Commerce Bancshares 37,525 2,767,359 2,765,485Intercontinental Exchange Group 51,430 2,768,902 4,396,496Morgan Stanley 52,685 3,104,999 3,044,424 17,130,686 19,291,805Information Technology (25.6%)Alphabet, Class A 7,554 6,138,815 9,107,171Apple 46,536 5,593,033 8,691,302Applied Materials 17,620 534,542 943,918Cisco Systems 108,450 3,804,244 4,401,968DXC Technology Company 18,555 1,884,586 1,846,046eBay 82,575 2,957,458 3,739,347Facebook, Class A 14,605 2,284,623 2,859,526Fidelity National Information Services 17,425 1,578,819 1,929,762Microsoft 73,230 4,462,241 6,545,914Motorola Solutions 37,495 4,141,335 4,217,604Palo Alto Networks 6,395 993,063 1,109,691Visa, Class A 25,524 2,059,078 3,104,073 36,431,837 48,496,322Telecommunication Services (2.7%)AT&T 103,575 5,315,147 5,067,745
Total U.S. Equities 141,781,629 162,627,916
NUMBER FAIR OF SHARES COST VALUE $ $
Foreign Equities (11.2%)Ireland (6.7%)Allergan 12,535 3,975,868 3,951,522Eaton 23,235 2,284,490 2,345,107Johnson Controls International 54,882 2,921,841 3,085,974Medtronic 28,460 2,967,947 3,275,490 12,150,146 12,658,093Netherlands Antilles (2.5%)Schlumberger 54,360 5,463,633 4,641,328
United Kingdom (2.0%)Aon 21,455 2,760,631 3,699,046
Total Foreign Equities 20,374,410 20,998,467
Total Investments (97.1%) 162,156,039 183,626,383
Other Net Assets (2.9%) 5,477,658
Net Assets (100%) 189,104,041

NOTES TO THE FINANCIAL STATEMENTS – SPECIFIC INFORMATION (UNAUDITED)
d I M P r I V A T E U . S . E Q U I T Y F U N d ( F O r N O N T A x A b L E A C C O U N T S )
30
Strategy in Using Financial InstrumentsInvestment ObjectiveProvide long-term capital growth for tax-deferred accounts.
Financial Instruments Measured at Fair Value (Note 8)Hierarchy of Financial Instruments Measured at Fair ValueThe following tables categorize the Fund’s financial assets fair value measurement according to a three-level hierarchy. The methodology used for valuing securities is not necessarily an indication of the risk associated with investing in those securities. Fair value measurement is described in the “Significant Accounting Policies” section of Note 2.
Investment Measured at Fair Value at the End of the Period, within the Following Levels:
JUNE 30, 2017 LEVEL 1 LEVEL 2 LEVEL 3 TOTAL$ $ $ $
FINANCIAL ASSETS AT FVTPLEQUITIES 183,626,383 – – 183,626,383 TOTAL 183,626,383 – – 183,626,383
DECEMBER 31, 2016 LEVEL 1 LEVEL 2 LEVEL 3 TOTAL$ $ $ $
FINANCIAL ASSETS AT FVTPLEQUITIES 167,173,459 – – 167,173,459TOTAL 167,173,459 – – 167,173,459
Transfers between Levels 1 and 2During the periods ended June 30, 2017 and December 31, 2016, there were no transfers of securities between Levels 1 and 2.
Financial Instruments Risks (Note 8)Currency RiskThe following tables indicate the foreign currencies to which the Fund had significant exposure, in Canadian dollar terms, and the notional amounts of foreign exchange forward contracts. The tables also illustrate the potential impact on the Net Assets Attributable to Holders of Redeemable Units if the Canadian dollar had strengthened or weakened by 3% in relation to each of the other currencies, with all other variables held constant.
JUNE 30, 2017
FINANCIAL ASSETSFINANCIAL
LIABILITIESNET
EXPOSURE
IMPACT ON NET ASSETS
ATTRIBUTABLE TO HOLDERS OF
REDEEMABLE UNITS$ $ $ $
U.S. Dollar 186,280,666 – 186,280,666 5,588,420 * COMPOSEd OF:MONETArY ITEMS 2,654,283 NON-MONETArY ITEMS 183,626,383
DECEMBER 31, 2016
FINANCIAL ASSETSFINANCIAL
LIABILITIESNET
EXPOSURE
IMPACT ON NET ASSETS
ATTRIBUTABLE TO HOLDERS OF
REDEEMABLE UNITS$ $ $ $
U.S. Dollar 173,561,611 – 173,561,611 5,206,848* COMPOSEd OF:MONETArY ITEMS 6,388,152NON-MONETArY ITEMS 167,173,459
In practice, actual trading results may differ from these sensitivity analyses and the differences could be significant.
Interest Rate RiskAs at June 30, 2017 and December 31, 2016, the majority of the Fund’s financial assets and liabilities are non-interest bearing. As a result, the Fund is not subject to significant amounts of risk arising from fluctuations in the prevailing levels of market interest rates.
Concentration RiskThe following tables summarize the concentration risk, as a percentage of the Fund’s Net Assets Attributable to Holders of Redeemable Units:
JUNE 30, 2017MARKET SEGMENT %
DECEMBER 31, 2016MARKET SEGMENT %
U.S. Equities Information Technology 25.6 Health Care 12.7 Industrials 11.6 Consumer Staples 11.2 Financials 10.2 Consumer Discretionary 6.2 Energy 5.7 Telecommunication Services 2.7
Foreign Equities 11.2 Other Net Assets 2.9
U.S. Equities Information Technology 27.2Health Care 13.6Industrials 11.2Consumer Staples 10.9Financials 8.6Consumer Discretionary 8.1Telecommunication Services 3.2Energy 1.7Real Estate 1.0
Foreign Equities 10.4Other Net Assets 4.1
TOTAL 100 TOTAL 100
Price RiskThe Fund may trade in financial instruments and take positions in traded and over-the-counter instruments.
The Manager’s estimate of the impact on Net Assets Attributable to Holders of Redeemable Units as a result of a reasonably possible change in benchmarks, using a historical beta coefficient (a measure of the sensitivity of a security in comparison to the market) between the Fund’s return as compared to the return of the Fund’s benchmarks, with all other variables held constant, is included in the following table. A 36-month regression analysis has been utilized to estimate the historical beta coefficient. The regression analysis uses data based on the monthly returns of the Fund.
CHANGE IN PRICE
IMPACT ON NET ASSETS ATTRIBUTABLE TO HOLDERS OF REDEEMABLE UNITS
BENCHMARKS %JUNE 30, 2017
$DECEMBER 31, 2016
$
S&P 500 3.00 5,219,272 4,825,462
When there is more than one benchmark, the effect of each benchmark must be considered individually, as each benchmark might fluctuate independently from the others.
In practice, actual trading results may differ from these sensitivity analyses and the differences could be significant.
Credit RiskAs at June 30, 2017 and December 31, 2016, the Fund had no significant investments in either fixed-income securities, money market securities and derivative financial instruments. As a result, the Fund is not significantly exposed to credit risk.
Liquidity RiskFor further information on maturities of financial liabilities and liquidity risk management of the Fund, please refer to Note 8 “Financial Instruments Disclosures”.
*
*

The accompanying Notes are an integral part of these financial statements.
31
d I M P r I V A T E I N T E r N A T I O N A L E Q U I T Y F U N d
STATEMENT OF FINANCIAL POSITION ( U N A U d I T E d )
AS AT JUNE 302017
$
dECEMbEr 312016
$ASSETSCurrent AssetsCash 32,041,628 22,932,869 Investments at fair value through profit or loss (FVTPL) 669,264,591 653,840,193 Investments at fair value through provided as collateral 100,027,053 21,425,845 Interest, dividends and other receivables 1,510,755 826,187
802,844,027 699,025,094
LIABILITIESCurrent LiabilitiesAccrued expenses – 152,901
Net Assets Attributable to Holders of Redeemable Units 802,844,027 698,872,193 – per unit (Note 4) 15.20 12.70
Approved on behalf of the Board of Directors ofDesjardins Investment Management Inc.,Manager of the DIM Private FundsVincent P. Hogue, President of the Board of Directorsand Sylvain Thériault, Director
STATEMENT OF COMPrEHENSIVE INCOME ( U N A U d I T E d )
SIx-MONTH PErIOdS ENdEd JUNE 30 2017$
2016$
IncomeInterest for distribution purposes 940,971 882,778 Dividends 6,657,093 8,255,074 Revenue from securities lending and repurchase transactions 167,607 92,677 Foreign exchange gain (loss) on cash (171,269) (540,493)Changes in fair value: Net realized gain (loss) on investments 27,772,418 (4,255,317) Net unrealized gain (loss) on investments 116,724,407 (63,349,447)
152,091,227 (58,914,728)
ExpensesAudit fees 3,535 3,302 Custodian fees 278,543 258,345 Unitholders’ reporting costs 10,610 9,969 Filing fees 38,071 35,818 Administration fees 537,147 523,702
867,906 831,136 Withholding taxes 354,885 837,522 Commissions and other portfolio transaction costs (Note 7) 253,287 266,938
1,476,078 1,935,596
Increase (Decrease) in Net Assets Attributable to Holders of Redeemable Units 150,615,149 (60,850,324) – per unit 2.68 (1.13)
Average Number of Redeemable Units 56,294,559 53,985,821
STATEMENT OF CHANGES IN FINANCIAL POSITION ( U N A U d I T E d )
SIx-MONTH PErIOdS ENdEd JUNE 30 2017 2016 $ $
Net Assets Attributable to Holders of Redeemable Units, Beginning of Period 698,872,193 662,595,722
Increase (Decrease) in Net Assets Attributable to Holders of Redeemable Units 150,615,149 (60,850,324)
Redeemable Unit Transactions Proceeds from sale of redeemable units 150,999,725 145,517,395 Reinvested distributions 5,773,516 16,875,248 Amounts paid for redeemable units redeemed (197,595,272) (25,789,906)
(40,822,031) 136,602,737
Distributions to Holders of Redeemable UnitsNet investment income (5,821,284) (16,967,394)
Net Assets Attributable to Holders of Redeemable Units, End of Period 802,844,027 721,380,741
STATEMENT OF CASH FLOWS ( U N A U d I T E d )
SIx-MONTH PErIOdS ENdEd JUNE 30 2017 2016 $ $
Cash Flows from (used in) Operating ActivitiesIncrease (decrease) in net assets attributable to holders of redeemable units 150,615,149 (60,850,324)Adjustments for: Foreign exchange gain (loss) on cash 171,269 540,493 Net realized gain (loss) (27,772,418) 4,255,317 Net unrealized gain (loss) (116,724,407) 63,349,447 Proceeds from sale/maturity of investments 160,910,946 64,756,890 Investments purchased (109,987,190) (177,102,602)Interest, dividends and other receivables (684,568) (296,541)Accrued expenses (152,901) (157,054)Net Cash Flows from (used in) Operating Activities 56,375,880 (105,504,374)
Cash Flows from (used in) Financing ActivitiesProceeds from sale of redeemable units 150,999,725 145,517,395 Amounts paid for redeemable units redeemed (197,595,272) (25,789,906)Distributions paid to holders of redeemable units net of reinvested distributions (47,768) (92,146)Net Cash Flows from (used in) Financing Activities (46,643,315) 119,635,343
Effect of exchange rate changes on foreign cash (623,806) (852,550)
Increase (decrease) in cash/bank overdraft 9,108,759 13,278,419 Cash (bank overdraft), beginning of period 22,932,869 17,401,273 Cash (Bank Overdraft), End of Period 32,041,628 30,679,692
Supplemental Information on Cash Flows from (used in) Operating ActivitiesInterest received 27,057 42,105 Dividends received, net of withholding taxes 5,734,828 7,121,011 Interest paid 1,123 –
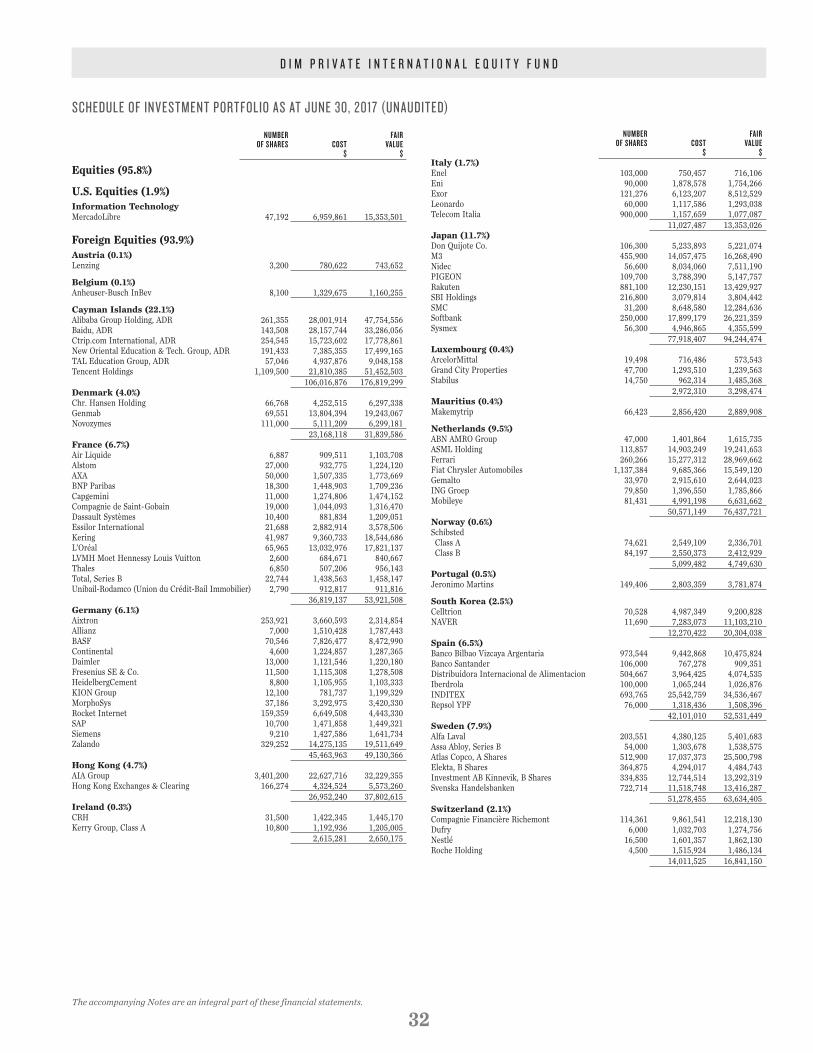
SCHEDULE OF INVESTMENT PORTFOLIO AS AT JUNE 30, 2017 (UNAUDITED)
The accompanying Notes are an integral part of these financial statements.
d I M P r I V A T E I N T E r N A T I O N A L E Q U I T Y F U N d
32
NUMBER FAIR OF SHARES COST VALUE $ $
Equities (95.8%)
U.S. Equities (1.9%)Information TechnologyMercadoLibre 47,192 6,959,861 15,353,501
Foreign Equities (93.9%)Austria (0.1%)Lenzing 3,200 780,622 743,652
Belgium (0.1%)Anheuser-Busch InBev 8,100 1,329,675 1,160,255
Cayman Islands (22.1%)Alibaba Group Holding, ADR 261,355 28,001,914 47,754,556Baidu, ADR 143,508 28,157,744 33,286,056Ctrip.com International, ADR 254,545 15,723,602 17,778,861New Oriental Education & Tech. Group, ADR 191,433 7,385,355 17,499,165TAL Education Group, ADR 57,046 4,937,876 9,048,158Tencent Holdings 1,109,500 21,810,385 51,452,503 106,016,876 176,819,299Denmark (4.0%)Chr. Hansen Holding 66,768 4,252,515 6,297,338Genmab 69,551 13,804,394 19,243,067Novozymes 111,000 5,111,209 6,299,181 23,168,118 31,839,586France (6.7%)Air Liquide 6,887 909,511 1,103,708Alstom 27,000 932,775 1,224,120AXA 50,000 1,507,335 1,773,669BNP Paribas 18,300 1,448,903 1,709,236Capgemini 11,000 1,274,806 1,474,152Compagnie de Saint-Gobain 19,000 1,044,093 1,316,470Dassault Systèmes 10,400 881,834 1,209,051Essilor International 21,688 2,882,914 3,578,506Kering 41,987 9,360,733 18,544,686L’Oréal 65,965 13,032,976 17,821,137LVMH Moet Hennessy Louis Vuitton 2,600 684,671 840,667Thales 6,850 507,206 956,143Total, Series B 22,744 1,438,563 1,458,147Unibail-Rodamco (Union du Crédit-Bail Immobilier) 2,790 912,817 911,816 36,819,137 53,921,508Germany (6.1%)Aixtron 253,921 3,660,593 2,314,854Allianz 7,000 1,510,428 1,787,443BASF 70,546 7,826,477 8,472,990Continental 4,600 1,224,857 1,287,365Daimler 13,000 1,121,546 1,220,180Fresenius SE & Co. 11,500 1,115,308 1,278,508HeidelbergCement 8,800 1,105,955 1,103,333KION Group 12,100 781,737 1,199,329MorphoSys 37,186 3,292,975 3,420,330Rocket Internet 159,359 6,649,508 4,443,330SAP 10,700 1,471,858 1,449,321Siemens 9,210 1,427,586 1,641,734Zalando 329,252 14,275,135 19,511,649 45,463,963 49,130,366Hong Kong (4.7%)AIA Group 3,401,200 22,627,716 32,229,355Hong Kong Exchanges & Clearing 166,274 4,324,524 5,573,260 26,952,240 37,802,615Ireland (0.3%)CRH 31,500 1,422,345 1,445,170Kerry Group, Class A 10,800 1,192,936 1,205,005 2,615,281 2,650,175
NUMBER FAIR OF SHARES COST VALUE $ $Italy (1.7%)Enel 103,000 750,457 716,106Eni 90,000 1,878,578 1,754,266Exor 121,276 6,123,207 8,512,529Leonardo 60,000 1,117,586 1,293,038Telecom Italia 900,000 1,157,659 1,077,087 11,027,487 13,353,026Japan (11.7%)Don Quijote Co. 106,300 5,233,893 5,221,074M3 455,900 14,057,475 16,268,490Nidec 56,600 8,034,060 7,511,190PIGEON 109,700 3,788,390 5,147,757Rakuten 881,100 12,230,151 13,429,927SBI Holdings 216,800 3,079,814 3,804,442SMC 31,200 8,648,580 12,284,636Softbank 250,000 17,899,179 26,221,359Sysmex 56,300 4,946,865 4,355,599 77,918,407 94,244,474Luxembourg (0.4%)ArcelorMittal 19,498 716,486 573,543Grand City Properties 47,700 1,293,510 1,239,563Stabilus 14,750 962,314 1,485,368 2,972,310 3,298,474Mauritius (0.4%)Makemytrip 66,423 2,856,420 2,889,908
Netherlands (9.5%)ABN AMRO Group 47,000 1,401,864 1,615,735ASML Holding 113,857 14,903,249 19,241,653Ferrari 260,266 15,277,312 28,969,662Fiat Chrysler Automobiles 1,137,384 9,685,366 15,549,120Gemalto 33,970 2,915,610 2,644,023ING Groep 79,850 1,396,550 1,785,866Mobileye 81,431 4,991,198 6,631,662 50,571,149 76,437,721Norway (0.6%)Schibsted Class A 74,621 2,549,109 2,336,701 Class B 84,197 2,550,373 2,412,929 5,099,482 4,749,630Portugal (0.5%)Jeronimo Martins 149,406 2,803,359 3,781,874
South Korea (2.5%)Celltrion 70,528 4,987,349 9,200,828NAVER 11,690 7,283,073 11,103,210 12,270,422 20,304,038Spain (6.5%)Banco Bilbao Vizcaya Argentaria 973,544 9,442,868 10,475,824Banco Santander 106,000 767,278 909,351Distribuidora Internacional de Alimentacion 504,667 3,964,425 4,074,535Iberdrola 100,000 1,065,244 1,026,876INDITEX 693,765 25,542,759 34,536,467Repsol YPF 76,000 1,318,436 1,508,396 42,101,010 52,531,449Sweden (7.9%)Alfa Laval 203,551 4,380,125 5,401,683Assa Abloy, Series B 54,000 1,303,678 1,538,575Atlas Copco, A Shares 512,900 17,037,373 25,500,798Elekta, B Shares 364,875 4,294,017 4,484,743Investment AB Kinnevik, B Shares 334,835 12,744,514 13,292,319Svenska Handelsbanken 722,714 11,518,748 13,416,287 51,278,455 63,634,405Switzerland (2.1%)Compagnie Financière Richemont 114,361 9,861,541 12,218,130Dufry 6,000 1,032,703 1,274,756Nestlé 16,500 1,601,357 1,862,130Roche Holding 4,500 1,515,924 1,486,134 14,011,525 16,841,150

SCHEDULE OF INVESTMENT PORTFOLIO AS AT JUNE 30, 2017 (UNAUDITED) (CONTINUED)
The accompanying Notes are an integral part of these financial statements.
d I M P r I V A T E I N T E r N A T I O N A L E Q U I T Y F U N d
33
NUMBER FAIR OF SHARES COST VALUE $ $United Kingdom (6.0%)Aggreko 283,744 6,895,747 4,411,504Ashtead Group 32,400 658,573 869,571British American Tobacco 12,500 1,156,820 1,105,045Burberry Group 34,500 781,329 967,888Diageo 40,500 1,402,283 1,551,780Dialog Semiconductor 66,482 3,028,581 3,680,784Ocado Group 554,929 3,408,946 2,712,515Rio Tinto 24,800 1,287,530 1,358,004Rolls-Royce Holdings 1,346,426 18,665,998 20,262,657Shire 15,300 1,190,597 1,095,188Sophos Group 162,000 655,663 1,213,241Standard Chartered 602,106 8,837,268 7,903,909Weir Group 23,000 719,901 672,452 48,689,236 47,804,538
Total Foreign Equities 564,745,174 753,938,143
Total Investments (95.8%) 571,705,035 769,291,644
Other Net Assets (4.2%) 33,552,383
Net Assets (100%) 802,844,027
TABLE 1
Securities Lending (Note 2)
FAIR VALUE VALUE OF COLLATERAL RECEIVED
$ $
Loaned Securities 100,027,053 106,416,126

NOTES TO THE FINANCIAL STATEMENTS – SPECIFIC INFORMATION (UNAUDITED)
d I M P r I V A T E I N T E r N A T I O N A L E Q U I T Y F U N d
34
Strategy in Using Financial InstrumentsInvestment ObjectiveProvide long-term capital growth.
Financial Instruments Measured at Fair Value (Note 8)Hierarchy of Financial Instruments Measured at Fair ValueThe following tables categorize the Fund’s financial assets fair value measurement according to a three-level hierarchy. The methodology used for valuing securities is not necessarily an indication of the risk associated with investing in those securities. Fair value measurement is described in the “Significant Accounting Policies” section of Note 2.
Investment Measured at Fair Value at the End of the Period, within the Following Levels:
JUNE 30, 2017 LEVEL 1 LEVEL 2 LEVEL 3 TOTAL$ $ $ $
FINANCIAL ASSETS AT FVTPLEQUITIES 769,291,644 – – 769,291,644 TOTAL 769,291,644 – – 769,291,644
DECEMBER 31, 2016 LEVEL 1 LEVEL 2 LEVEL 3 TOTAL$ $ $ $
FINANCIAL ASSETS AT FVTPLEQUITIES 675,266,038 – – 675,266,038TOTAL 675,266,038 – – 675,266,038
Transfers between Levels 1 and 2During the periods ended June 30, 2017 and December 31, 2016, there were no transfers of securities between Levels 1 and 2.
Financial Instruments Risks (Note 8)Currency RiskThe following tables indicate the foreign currencies to which the Fund had significant exposure, in Canadian dollar terms, and the notional amounts of foreign exchange forward contracts. The tables also illustrate the potential impact on the Net Assets Attributable to Holders of Redeemable Units if the Canadian dollar had strengthened or weakened by 3% in relation to each of the other currencies, with all other variables held constant.
JUNE 30, 2017
FINANCIAL ASSETS
FINANCIAL LIABILITIES
NETEXPOSURE
IMPACT ON NET ASSETS
ATTRIBUTABLE TO HOLDERS OF
REDEEMABLE UNITS$ $ $ $
Euro 254,525,293 – 254,525,293 7,635,759 U.S. Dollar 164,346,177 – 164,346,177 4,930,385 Japanese Yen 94,347,140 – 94,347,140 2,830,414 Hong Kong Dollar 89,255,118 – 89,255,118 2,677,654 Swedish Krona 63,861,567 – 63,861,567 1,915,847 Pound Sterling 44,302,270 – 44,302,270 1,329,068 Danish Krone 31,950,207 – 31,950,207 958,506 South Korean Won 20,304,038 – 20,304,038 609,121 Swiss Franc 17,233,141 – 17,233,141 516,994 Norwegian Krone 4,753,240 – 4,753,240 142,597 * COMPOSEd OF:MONETArY ITEMS 15,586,547 NON-MONETArY ITEMS 769,291,644
DECEMBER 31, 2016
FINANCIAL ASSETS
FINANCIAL LIABILITIES
NETEXPOSURE
IMPACT ON NET ASSETS
ATTRIBUTABLE TO HOLDERS OF
REDEEMABLE UNITS$ $ $ $
Euro 231,638,196 – 231,638,196 6,949,146 U.S. Dollar 125,059,541 – 125,059,541 3,751,786 Japanese Yen 84,033,669 – 84,033,669 2,521,010 Hong Kong Dollar 83,054,351 – 83,054,351 2,491,631 Swedish Krona 57,784,000 – 57,784,000 1,733,520 Danish Krone 34,019,088 – 34,019,088 1,020,573 Pound Sterling 32,724,495 – 32,724,495 981,735 South Korean Won 19,564,781 – 19,564,781 586,943 Swiss Franc 16,220,296 – 16,220,296 486,609 Norwegian Krone 4,994,653 – 4,994,653 149,840 * COMPOSEd OF:MONETArY ITEMS 13,827,032NON-MONETArY ITEMS 675,266,038
In practice, actual trading results may differ from these sensitivity analyses and the differences could be significant.
Interest Rate RiskAs at June 30, 2017 and December 31, 2016, the majority of the Fund’s financial assets and liabilities are non-interest bearing. As a result, the Fund is not subject to significant amounts of risk arising from fluctuations in the prevailing levels of market interest rates.
Concentration RiskThe following tables summarize the concentration risk, as a percentage of the Fund’s Net Assets Attributable to Holders of Redeemable Units:
JUNE 30, 2017MARKET SEGMENT %
DECEMBER 31, 2016MARKET SEGMENT %
Foreign Equities Cayman Islands 22.1 Japan 11.7 Netherlands 9.5 Sweden 7.9 France 6.7 Spain 6.5 Germany 6.1 United Kingdom 6.0 Other Countries* 19.3
Other Net Assets 4.2
Foreign Equities Cayman Islands 20.3Japan 12.0Netherlands 10.1Sweden 8.3France 7.1Spain 6.9Germany 6.2Hong Kong 5.3United Kingdom 5.2Other Countries* 15.2
Other Net Assets 3.4TOTAL 100 TOTAL 100
* This category includes all countries representing less than 5% of the Fund’s net asset value.
*
*

NOTES TO THE FINANCIAL STATEMENTS – SPECIFIC INFORMATION (UNAUDITED) (CONTINUED)
d I M P r I V A T E I N T E r N A T I O N A L E Q U I T Y F U N d
35
Price RiskThe Fund may trade in financial instruments and take positions in traded and over-the-counter instruments.
The Manager’s estimate of the impact on Net Assets Attributable to Holders of Redeemable Units as a result of a reasonably possible change in benchmarks, using a historical beta coefficient (a measure of the sensitivity of a security in comparison to the market) between the Fund’s return as compared to the return of the Fund’s benchmarks, with all other variables held constant, is included in the following table. A 36-month regression analysis has been utilized to estimate the historical beta coefficient. The regression analysis uses data based on the monthly returns of the Fund.
CHANGE IN PRICE
IMPACT ON NET ASSETS ATTRIBUTABLE TO HOLDERS OF REDEEMABLE UNITS
BENCHMARKS %JUNE 30, 2017
$DECEMBER 31, 2016
$
MSCI EAFE 3.00 23,567,486 20,141,813MSCI Europe 3.00 1,240,394 1,060,095
When there is more than one benchmark, the effect of each benchmark must be considered individually, as each benchmark might fluctuate independently from the others.
In practice, actual trading results may differ from these sensitivity analyses and the differences could be significant.
Credit RiskAs at June 30, 2017 and December 31, 2016, the Fund had no significant investments in either fixed-income securities, money market securities and derivative financial instruments. As a result, the Fund is not significantly exposed to credit risk.
Liquidity RiskFor further information on maturities of financial liabilities and liquidity risk management of the Fund, please refer to Note 8 “Financial Instruments Disclosures”.
Reconciliation of Income from Securities Lending and Repurchase Transactions (Note 2)The following table shows a reconciliation of the total income generated from securities lending transactions of the Fund and the revenue from securities lending and repurchase transactions disclosed in the Fund’s Statement of Comprehensive Income.
JUNE 30, 2017 JUNE 30, 2016
$ % $ %
TOTAL INCOME 279,512 100 154,462 100NET INCOME rECEIVEd bY THE FUNd 167,707 60 92,677 60NET INCOME rECEIVEd bY dESJArdINS TrUST 111,805 40 61,785 40

The accompanying Notes are an integral part of these financial statements.
36
d I M P r I V A T E C O M P L E T I O N S T r A T E G Y F U N d
STATEMENT OF FINANCIAL POSITION ( U N A U d I T E d )
AS AT JUNE 302017
$
dECEMbEr 312016
$ASSETSCurrent AssetsCash 9,064,988 7,332,848 Investments at fair value through profit or loss (FVTPL) 162,897,502 130,078,874 Interest, dividends and other receivables 2,926 53,945
171,965,416 137,465,667
LIABILITIESCurrent LiabilitiesAccrued expenses 56,240 9,933 Payable for investments purchased 2,391,256 –
2,447,496 9,933
Net Assets Attributable to Holders of Redeemable Units 169,517,920 137,455,734 – per unit (Note 4) 11.40 11.34
Approved on behalf of the Board of Directors ofDesjardins Investment Management Inc.,Manager of the DIM Private FundsVincent P. Hogue, President of the Board of Directorsand Sylvain Thériault, Director
STATEMENT OF COMPrEHENSIVE INCOME ( U N A U d I T E d )
SIx-MONTH PErIOdS ENdEd JUNE 30 2017$
2016$
IncomeInterest for distribution purposes 223,888 7,871 Dividends 939,165 927,717 Foreign exchange gain (loss) on cash (10,812) –Changes in fair value: Net realized gain (loss) on investments (89,772) 539,865 Net unrealized gain (loss) on investments (433,579) 4,103,603
628,890 5,579,056
ExpensesAudit fees 3,533 3,302 Custodian fees 7,967 5,728 Unitholders’ reporting costs 2,043 1,824 Filing fees 9,667 3,986 Administration fees 141,611 126,791
164,821 141,631 Withholding taxes 164,779 139,158 Commissions and other portfolio transaction costs 8,212 3,639
337,812 284,428
Increase (Decrease) in Net Assets Attributable to Holders of Redeemable Units 291,078 5,294,628 – per unit 0.02 0.49
Average Number of Redeemable Units 13,470,099 10,793,491
STATEMENT OF CHANGES IN FINANCIAL POSITION ( U N A U d I T E d )
SIx-MONTH PErIOdS ENdEd JUNE 30 2017 2016 $ $
Net Assets Attributable to Holders of Redeemable Units, Beginning of Period 137,455,734 116,310,438
Increase (Decrease) in Net Assets Attributable to Holders of Redeemable Units 291,078 5,294,628
Redeemable Unit Transactions Proceeds from sale of redeemable units 37,234,634 14,882,256 Amounts paid for redeemable units redeemed (5,463,526) (8,892,617)
31,771,108 5,989,639
Net Assets Attributable to Holders of Redeemable Units, End of Period 169,517,920 127,594,705
STATEMENT OF CASH FLOWS ( U N A U d I T E d )
SIx-MONTH PErIOdS ENdEd JUNE 30 2017 2016 $ $
Cash Flows from (used in) Operating ActivitiesIncrease (decrease) in net assets attributable to holders of redeemable units 291,078 5,294,628 Adjustments for: Foreign exchange gain (loss) on cash 10,812 – Net realized gain (loss) 89,772 (539,865) Net unrealized gain (loss) 433,579 (4,103,603)Proceeds from sale/maturity of investments 463 6,111,617 Investments purchased (33,342,396) (12,144,786)Interest, dividends and other receivables 51,019 106,922 Accrued expenses 46,307 3,660 Payable for investments purchased 2,391,256 –Net Cash Flows from (used in) Operating Activities (30,028,110) (5,271,427)
Cash Flows from (used in) Financing ActivitiesProceeds from sale of redeemable units 37,234,634 14,882,256 Amounts paid for redeemable units redeemed (5,463,526) (8,892,617)Net Cash Flows from (used in) Financing Activities 31,771,108 5,989,639
Effect of exchange rate changes on foreign cash (10,858) (17)
Increase (decrease) in cash/bank overdraft 1,732,140 718,195 Cash (bank overdraft), beginning of period 7,332,848 1,471,355 Cash (Bank Overdraft), End of Period 9,064,988 2,189,550
Supplemental Information on Cash Flows from (used in) Operating ActivitiesInterest received 178,297 7,841 Dividends received, net of withholding taxes 828,324 895,481
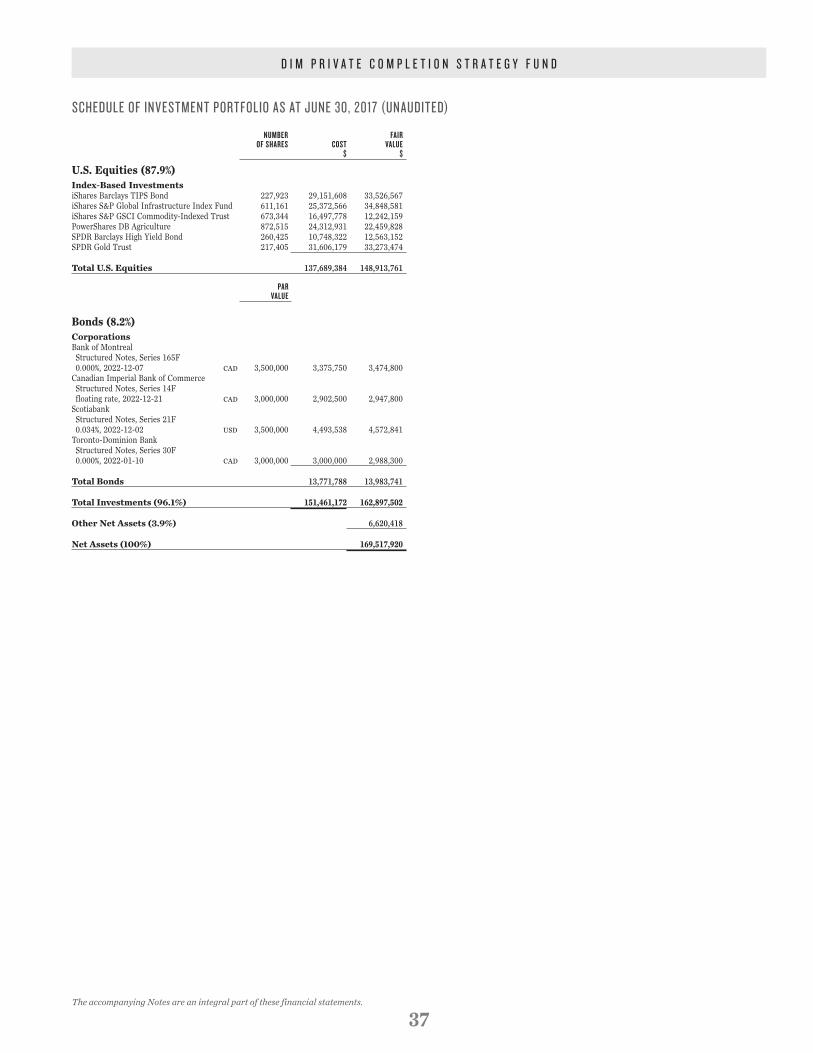
SCHEDULE OF INVESTMENT PORTFOLIO AS AT JUNE 30, 2017 (UNAUDITED)
The accompanying Notes are an integral part of these financial statements.
d I M P r I V A T E C O M P L E T I O N S T r A T E G Y F U N d
37
NUMBER FAIR OF SHARES COST VALUE $ $
U.S. Equities (87.9%)Index-Based InvestmentsiShares Barclays TIPS Bond 227,923 29,151,608 33,526,567iShares S&P Global Infrastructure Index Fund 611,161 25,372,566 34,848,581iShares S&P GSCI Commodity-Indexed Trust 673,344 16,497,778 12,242,159PowerShares DB Agriculture 872,515 24,312,931 22,459,828SPDR Barclays High Yield Bond 260,425 10,748,322 12,563,152SPDR Gold Trust 217,405 31,606,179 33,273,474
Total U.S. Equities 137,689,384 148,913,761
PAR VALUE
Bonds (8.2%)CorporationsBank of Montreal Structured Notes, Series 165F 0.000%, 2022-12-07 CAD 3,500,000 3,375,750 3,474,800Canadian Imperial Bank of Commerce Structured Notes, Series 14F floating rate, 2022-12-21 CAD 3,000,000 2,902,500 2,947,800Scotiabank Structured Notes, Series 21F 0.034%, 2022-12-02 USD 3,500,000 4,493,538 4,572,841Toronto-Dominion Bank Structured Notes, Series 30F 0.000%, 2022-01-10 CAD 3,000,000 3,000,000 2,988,300
Total Bonds 13,771,788 13,983,741
Total Investments (96.1%) 151,461,172 162,897,502
Other Net Assets (3.9%) 6,620,418
Net Assets (100%) 169,517,920

NOTES TO THE FINANCIAL STATEMENTS – SPECIFIC INFORMATION (UNAUDITED)
d I M P r I V A T E C O M P L E T I O N S T r A T E G Y F U N d
38
Strategy in Using Financial InstrumentsInvestment ObjectiveProvide income and long-term capital growth.
In order to meet the investment objective, the Fund invests in a diversified basket of exchange traded funds (ETF).
Financial Instruments Measured at Fair Value (Note 8)Hierarchy of Financial Instruments Measured at Fair ValueThe following tables categorize the Fund’s financial assets fair value measurement according to a three-level hierarchy. The methodology used for valuing securities is not necessarily an indication of the risk associated with investing in those securities. Fair value measurement is described in the “Significant Accounting Policies” section of Note 2.
Investment Measured at Fair Value at the End of the Period, within the Following Levels:
JUNE 30, 2017 LEVEL 1 LEVEL 2 LEVEL 3 TOTAL$ $ $ $
FINANCIAL ASSETS AT FVTPLINdEx-bASEd INVESTMENTS 148,913,761 – – 148,913,761 bONdS – 9,410,900 4,572,841 13,983,741 TOTAL 148,913,761 9,410,900 4,572,841 162,897,502
DECEMBER 31, 2016 LEVEL 1 LEVEL 2 LEVEL 3 TOTAL$ $ $ $
FINANCIAL ASSETS AT FVTPLINdEx-bASEd INVESTMENTS 118,748,105 – – 118,748,105bONdS – 97,032 11,233,737 11,330,769TOTAL 118,748,105 97,032 11,233,737 130,078,874
Transfers between Levels 1 and 2During the periods ended June 30, 2017 and December 31, 2016, there were no transfers of securities between Levels 1 and 2.
Classification of Level 3As at June 30, 2017 and December 31, 2016, the Fund has financial instruments requiring Level 3 valuation. Fair value measurements are derived from valuation techniques. The substitution of one or more data from these techniques by one or several reasonably possible assumptions should not result in significant changes in the fair value of these investments. The following table explains the classification of fair value within Level 3:
FINANCIAL INSTRUMENTS FAIR VALUE $
VALUATION TECHNIQUES UNOBSERVABLE INPUTS RANGE
JUNE 30, 2017 Scotiabank Structured Notes, Series 21F 0.034%, 2022-12-02 4,572,841 Manager valuation Price paid –
dECEMbEr 31, 2016 Bank of Montreal Structured NotesSeries 165F, 0.000%, 2022-12-07 3,534,300
Net asset value provided by the investment manager
Net asset value provided by the investment manager –
Scotiabank Structured NotesSeries 21F, 0.000%, 2022-12-02 4,699,437 Manager valuation Price paid –Canadian Imperial Bank ofCommerce Structured NotesSeries 14F, floating rate, 2022-12-21 3,000,000 Manager valuation Price paid –
Reconciliation of Level 3 Measured at Fair ValueThe following tables summarize a reconciliation of movements on Level 3 financial instruments between the beginning and end of the period:
JUNE 30, 2017 TOTAL$
BALANCE, BEGINNING OF PERIOD 11,233,737 PrOCEEdS FrOM SALE OF INVESTMENTS – INVESTMENTS PUrCHASEd 3,000,000 NET rEALIZEd GAIN (LOSS) – NET UNrEALIZEd GAIN (LOSS) (160,896)TrANSFErS TO (FrOM) LEVEL 3 (9,500,000)BALANCE, END OF PERIOD 4,572,841 CHANGE IN NET UNREALIZED GAIN (LOSS) OF THE PERIOD FOR SECURITIES HELD
AS AT JUNE 30, 2017 (126,596)
During the period ended June 30, 2017, securities valued at approximately $9,500,000 were transferred from Level 3 to Level 2 following the modification of the method for evaluating fair value. These securities are now valued at the quoted prices on the active markets.
DECEMBER 31, 2016 TOTAL$
BALANCE, BEGINNING OF YEAR –PrOCEEdS FrOM SALE OF INVESTMENTS –INVESTMENTS PUrCHASEd 13,652,900NET rEALIZEd GAIN (LOSS) –NET UNrEALIZEd GAIN (LOSS) 80,837TrANSFErS TO (FrOM) LEVEL 3 (2,500,000)BALANCE, END OF YEAR 11,233,737CHANGE IN NET UNREALIZED GAIN (LOSS) OF THE YEAR FOR SECURITIES HELD
AS AT DECEMBER 31, 2016 80,837
During the year ended December 31, 2016, a security valued at approximately $2,500,000 was transferred from Level 3 to Level 2 following the modification of the method for evaluating fair value. This security is now valued at the quoted prices on the active markets.
Investment Entities (Note 2)Total values of index-based investments, mortgage-backed securities, asset-backed securities, investment funds (including limited partnerships) and master asset vehicles (included in the bonds) in the table “Investment Measured at Fair Value within the Levels” also represent the fair value of investments in structured entities.
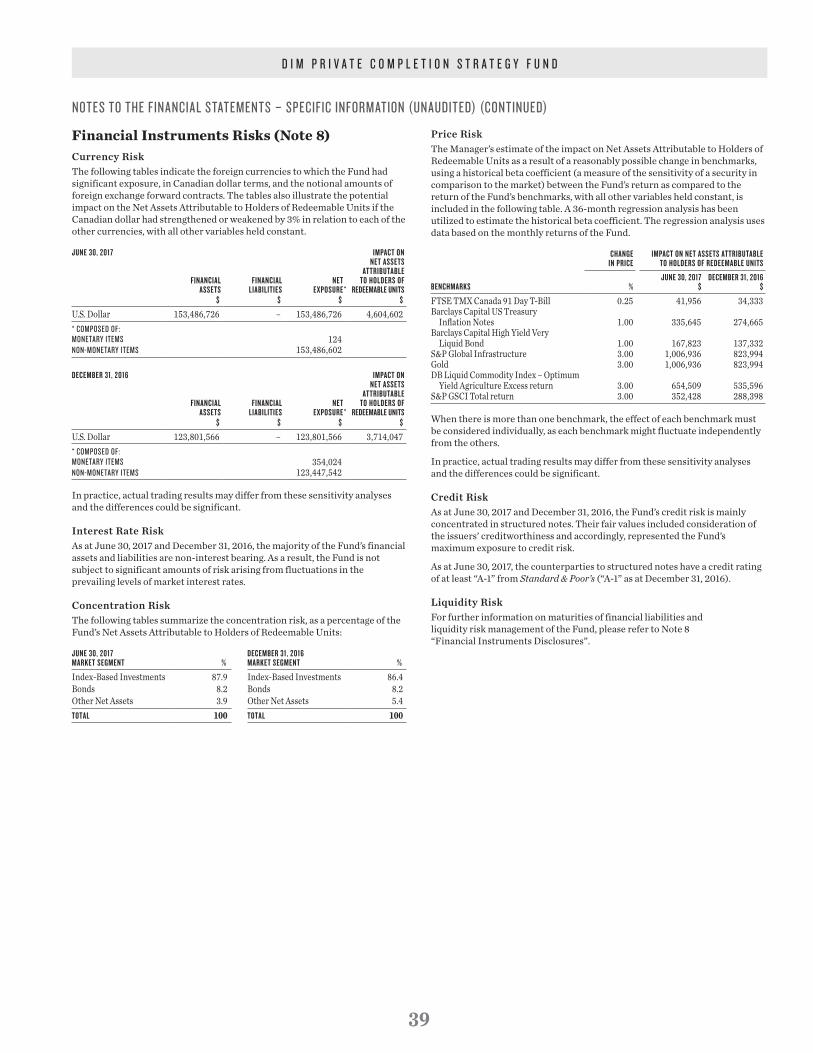
NOTES TO THE FINANCIAL STATEMENTS – SPECIFIC INFORMATION (UNAUDITED) (CONTINUED)
d I M P r I V A T E C O M P L E T I O N S T r A T E G Y F U N d
39
Financial Instruments Risks (Note 8)Currency RiskThe following tables indicate the foreign currencies to which the Fund had significant exposure, in Canadian dollar terms, and the notional amounts of foreign exchange forward contracts. The tables also illustrate the potential impact on the Net Assets Attributable to Holders of Redeemable Units if the Canadian dollar had strengthened or weakened by 3% in relation to each of the other currencies, with all other variables held constant.
JUNE 30, 2017
FINANCIAL ASSETS
FINANCIAL LIABILITIES
NETEXPOSURE
IMPACT ON NET ASSETS
ATTRIBUTABLE TO HOLDERS OF
REDEEMABLE UNITS$ $ $ $
U.S. Dollar 153,486,726 – 153,486,726 4,604,602 * COMPOSEd OF:MONETArY ITEMS 124NON-MONETArY ITEMS 153,486,602
DECEMBER 31, 2016
FINANCIAL ASSETS
FINANCIAL LIABILITIES
NETEXPOSURE
IMPACT ON NET ASSETS
ATTRIBUTABLE TO HOLDERS OF
REDEEMABLE UNITS$ $ $ $
U.S. Dollar 123,801,566 – 123,801,566 3,714,047* COMPOSEd OF:MONETArY ITEMS 354,024NON-MONETArY ITEMS 123,447,542
In practice, actual trading results may differ from these sensitivity analyses and the differences could be significant.
Interest Rate RiskAs at June 30, 2017 and December 31, 2016, the majority of the Fund’s financial assets and liabilities are non-interest bearing. As a result, the Fund is not subject to significant amounts of risk arising from fluctuations in the prevailing levels of market interest rates.
Concentration RiskThe following tables summarize the concentration risk, as a percentage of the Fund’s Net Assets Attributable to Holders of Redeemable Units:
JUNE 30, 2017MARKET SEGMENT %
DECEMBER 31, 2016MARKET SEGMENT %
Index-Based Investments 87.9 Bonds 8.2 Other Net Assets 3.9
Index-Based Investments 86.4Bonds 8.2Other Net Assets 5.4
TOTAL 100 TOTAL 100
Price RiskThe Manager’s estimate of the impact on Net Assets Attributable to Holders of Redeemable Units as a result of a reasonably possible change in benchmarks, using a historical beta coefficient (a measure of the sensitivity of a security in comparison to the market) between the Fund’s return as compared to the return of the Fund’s benchmarks, with all other variables held constant, is included in the following table. A 36-month regression analysis has been utilized to estimate the historical beta coefficient. The regression analysis uses data based on the monthly returns of the Fund.
CHANGE IN PRICE
IMPACT ON NET ASSETS ATTRIBUTABLE TO HOLDERS OF REDEEMABLE UNITS
BENCHMARKS %JUNE 30, 2017
$DECEMBER 31, 2016
$
FTSE TMX Canada 91 Day T-Bill 0.25 41,956 34,333Barclays Capital US Treasury
Inflation Notes 1.00 335,645 274,665Barclays Capital High Yield Very
Liquid Bond 1.00 167,823 137,332S&P Global Infrastructure 3.00 1,006,936 823,994Gold 3.00 1,006,936 823,994DB Liquid Commodity Index – Optimum
Yield Agriculture Excess return 3.00 654,509 535,596S&P GSCI Total return 3.00 352,428 288,398
When there is more than one benchmark, the effect of each benchmark must be considered individually, as each benchmark might fluctuate independently from the others.
In practice, actual trading results may differ from these sensitivity analyses and the differences could be significant.
Credit RiskAs at June 30, 2017 and December 31, 2016, the Fund’s credit risk is mainly concentrated in structured notes. Their fair values included consideration of the issuers’ creditworthiness and accordingly, represented the Fund’s maximum exposure to credit risk.
As at June 30, 2017, the counterparties to structured notes have a credit rating of at least “A-1” from Standard & Poor’s (“A-1” as at December 31, 2016).
Liquidity RiskFor further information on maturities of financial liabilities and liquidity risk management of the Fund, please refer to Note 8 “Financial Instruments Disclosures”.
*
*

The accompanying Notes are an integral part of these financial statements.
40
d I M P r I V A T E b A L A N C E d F U N d
STATEMENT OF FINANCIAL POSITION ( U N A U d I T E d )
AS AT JUNE 302017
$
dECEMbEr 312016
$ASSETSCurrent AssetsCash 15,466,113 17,711,286 Investments at fair value through profit or loss (FVTPL) 152,254,499 125,854,030 Interest, dividends and other receivables 14,974 10,223
167,735,586 143,575,539
LIABILITIESCurrent Liabilities – –
Net Assets Attributable to Holders of Redeemable Units 167,735,586 143,575,539 – per unit (Note 4) 12.89 12.65
Approved on behalf of the Board of Directors ofDesjardins Investment Management Inc.,Manager of the DIM Private FundsVincent P. Hogue, President of the Board of Directorsand Sylvain Thériault, Director
STATEMENT OF COMPrEHENSIVE INCOME ( U N A U d I T E d )
SIx-MONTH PErIOdS ENdEd JUNE 30 2017$
2016$
IncomeInterest for distribution purposes 71,980 41,965 Distributions from underlyning funds 1,331,738 1,238,406 Changes in fair value: Net realized gain (loss) on investments 927,182 6,392 Net unrealized gain (loss) on investments 1,731,969 1,855,676
4,062,869 3,142,439
ExpensesAudit fees 3,535 3,302 Unitholders’ reporting costs 176 114 Filing fees 7,713 6,371 Administration fees 16,817 17,500
28,241 27,287
Increase (Decrease) in Net Assets Attributable to Holders of Redeemable Units 4,034,628 3,115,152 – per unit 0.33 0.32
Average Number of Redeemable Units 12,235,943 9,759,169
STATEMENT OF CHANGES IN FINANCIAL POSITION ( U N A U d I T E d )
SIx-MONTH PErIOdS ENdEd JUNE 30 2017 2016 $ $
Net Assets Attributable to Holders of Redeemable Units, Beginning of Period 143,575,539 110,830,523
Increase (Decrease) in Net Assets Attributable to Holders of Redeemable Units 4,034,628 3,115,152
Redeemable Unit Transactions Proceeds from sale of redeemable units 28,841,212 23,980,052 Reinvested distributions 1,360,373 1,232,726 Amounts paid for redeemable units redeemed (8,715,350) (6,548,938)
21,486,235 18,663,840
Distributions to Holders of Redeemable UnitsNet investment income (1,360,816) (1,232,937)
Net Assets Attributable to Holders of Redeemable Units, End of Period 167,735,586 131,376,578
STATEMENT OF CASH FLOWS ( U N A U d I T E d )
SIx-MONTH PErIOdS ENdEd JUNE 30 2017 2016 $ $
Cash Flows from (used in) Operating ActivitiesIncrease (decrease) in net assets attributable to holders of redeemable units 4,034,628 3,115,152 Adjustments for: Net realized gain (loss) (927,182) (6,392) Net unrealized gain (loss) (1,731,969) (1,855,676) Non-cash distributions from investments (1,331,738) (1,238,406)Proceeds from sale/maturity of investments 6,648,087 3,500,000 Investments purchased (29,057,667) (19,708,718)Interest, dividends and other receivables (4,751) 3,818 Net Cash Flows from (used in) Operating Activities (22,370,592) (16,190,222)
Cash Flows from (used in) Financing ActivitiesProceeds from sale of redeemable units 28,841,212 23,980,052 Amounts paid for redeemable units redeemed (8,715,350) (6,548,938)Distributions paid to holders of redeemable units net of reinvested distributions (443) (211)Net Cash Flows from (used in) Financing Activities 20,125,419 17,430,903
Increase (decrease) in cash/bank overdraft (2,245,173) 1,240,681 Cash (bank overdraft), beginning of period 17,711,286 6,334,991 Cash (Bank Overdraft), End of Period 15,466,113 7,575,672
Supplemental Information on Cash Flows from (used in) Operating ActivitiesInterest received 41,964 26,623
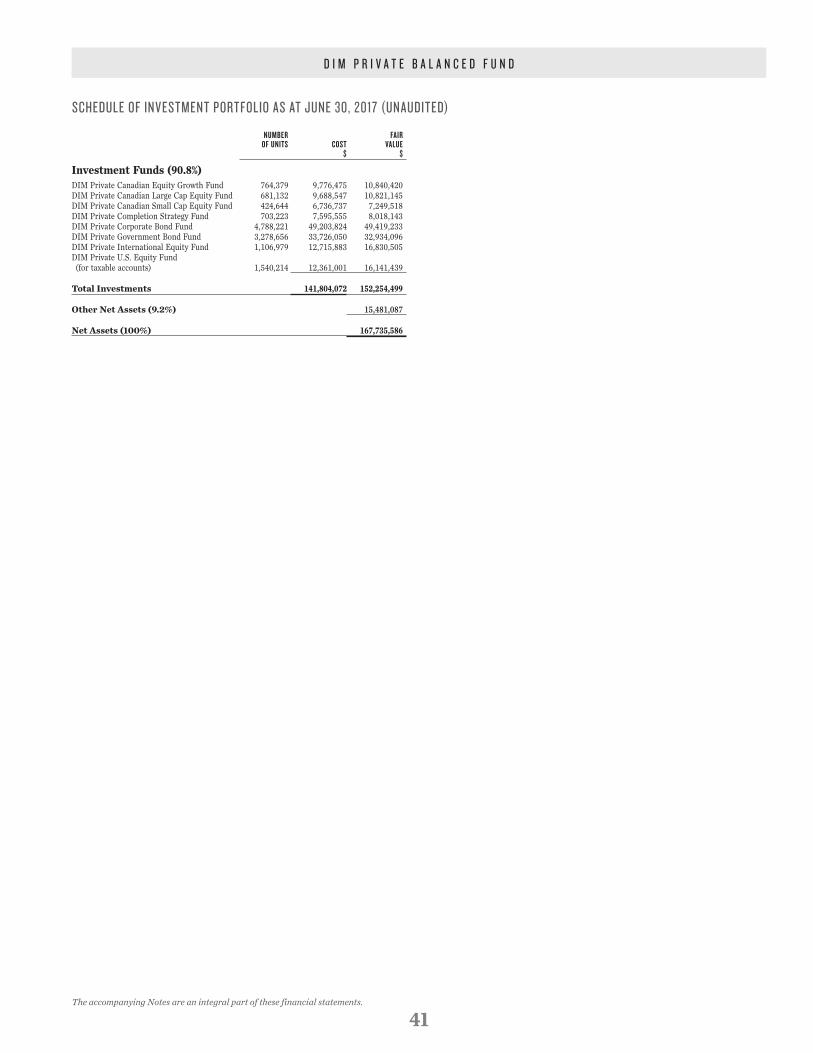
SCHEDULE OF INVESTMENT PORTFOLIO AS AT JUNE 30, 2017 (UNAUDITED)
The accompanying Notes are an integral part of these financial statements.
d I M P r I V A T E b A L A N C E d F U N d
41
NUMBER FAIR OF UNITS COST VALUE $ $
Investment Funds (90.8%)DIM Private Canadian Equity Growth Fund 764,379 9,776,475 10,840,420DIM Private Canadian Large Cap Equity Fund 681,132 9,688,547 10,821,145DIM Private Canadian Small Cap Equity Fund 424,644 6,736,737 7,249,518DIM Private Completion Strategy Fund 703,223 7,595,555 8,018,143DIM Private Corporate Bond Fund 4,788,221 49,203,824 49,419,233DIM Private Government Bond Fund 3,278,656 33,726,050 32,934,096DIM Private International Equity Fund 1,106,979 12,715,883 16,830,505DIM Private U.S. Equity Fund (for taxable accounts) 1,540,214 12,361,001 16,141,439
Total Investments 141,804,072 152,254,499
Other Net Assets (9.2%) 15,481,087
Net Assets (100%) 167,735,586

NOTES TO THE FINANCIAL STATEMENTS – SPECIFIC INFORMATION (UNAUDITED)
d I M P r I V A T E b A L A N C E d F U N d
42
Strategy in Using Financial InstrumentsInvestment ObjectiveProvide long-term capital growth while generating income.
In order to meet the investment objective, the Fund invests in a diversified basket of funds.
Financial Instruments Measured at Fair Value (Note 8)Hierarchy of Financial Instruments Measured at Fair ValueThe following tables categorize the Fund’s financial assets fair value measurement according to a three-level hierarchy. The methodology used for valuing securities is not necessarily an indication of the risk associated with investing in those securities. Fair value measurement is described in the “Significant Accounting Policies” section of Note 2.
Investment Measured at Fair Value at the End of the Period, within the Following Levels:
JUNE 30, 2017 LEVEL 1 LEVEL 2 LEVEL 3 TOTAL$ $ $ $
FINANCIAL ASSETS AT FVTPLINVESTMENT FUNdS – 152,254,499 – 152,254,499 TOTAL – 152,254,499 – 152,254,499
DECEMBER 31, 2016 LEVEL 1 LEVEL 2 LEVEL 3 TOTAL$ $ $ $
FINANCIAL ASSETS AT FVTPLINVESTMENT FUNdS – 125,854,030 – 125,854,030TOTAL – 125,854,030 – 125,854,030
Transfers between Levels 1 and 2During the periods ended June 30, 2017 and December 31, 2016, there were no transfers of securities between Levels 1 and 2.
Investment Entities (Note 2)Total values of index-based investments, mortgage-backed securities, asset-backed securities, investment funds (including limited partnerships) and master asset vehicles (included in the bonds) in the table “Investment Measured at Fair Value within the Levels” also represent the fair value of investments in structured entities.
Financial Instruments Risks (Note 8)As the majority of the Fund’s Net Assets Attributable to Holders of Redeemable Units are invested in underlying funds, the Fund may be indirectly exposed to currency, interest, concentration or credit risk. Thus, only direct exposure to risks arising from the Fund’s financial instruments is presented. To obtain the detail of underlying funds’ risks, you can view the underlying funds’ financial statements presented in this report.
Underlying Funds Risk ManagementThe Fund’s portfolio advisor makes sure that the underlying funds’ portfolio manager manages financial risks. Each month, the Fund’s portfolio advisor receives the underlying funds’ investment portfolios to analyze the management style and compares performance against the Fund’s benchmarks. Every quarter, the Fund’s portfolio advisor receives detailed quarterly documents featuring an analysis of performance, sector allocations and the underlying funds’ top positions.
Currency RiskAs at June 30, 2017 and December 31, 2016, the majority of the Fund’s financial assets and liabilities are denominated in Canadian dollars. As a result, the Fund is not significantly exposed to currency risk.
Interest Rate RiskAs at June 30, 2017 and December 31, 2016, the majority of the Fund’s financial assets and liabilities are non-interest bearing. As a result, the Fund is not significantly exposed to interest rates risk.
Concentration RiskAs at June 30, 2017 and December 31, 2016, the majority of the Fund’s financial assets and liabilities are invested in underlying funds.
Price RiskThe Manager’s estimate of the impact on Net Assets Attributable to Holders of Redeemable Units as a result of a reasonably possible change in benchmarks, using a historical beta coefficient (a measure of the sensitivity of a security in comparison to the market) between the Fund’s return as compared to the return of the Fund’s benchmarks, with all other variables held constant, is included in the following table. A 36-month regression analysis has been utilized to estimate the historical beta coefficient. The regression analysis uses data based on the monthly returns of the Fund.
CHANGE IN PRICE
IMPACT ON NET ASSETS ATTRIBUTABLE TO HOLDERS OF REDEEMABLE UNITS
BENCHMARKS %JUNE 30, 2017
$DECEMBER 31, 2016
$
FTSE TMX Canada 30 Day T-Bill 0.25 21,596 18,666FTSE TMX Canada 91 Day T-Bill 0.25 2,160 1,867FTSE TMX Canada Short Term
Government 1.00 215,960 186,657FTSE TMX Canada Mid Term
Government 1.00 215,960 186,657FTSE TMX Canada Short Term
Corporate 1.00 215,960 186,657FTSE TMX Canada Mid Term Corporate 1.00 215,960 186,657Bloomberg Barclays Capital US Treasury
Inflation Notes 1.00 17,277 14,933Bloomberg Barclays Capital High Yield
Very Liquid Bond 1.00 8,638 7,466S&P/TSX Dividend 3.00 388,727 335,983S&P/TSX Composite 3.00 388,727 335,983S&P/TSX Small Cap 3.00 259,151 223,988S&P 500 3.00 518,303 447,977MSCI EAFE 3.00 492,388 425,578MSCI Europe 3.00 25,915 22,399S&P Global Infrastructure 3.00 51,830 44,798Gold 3.00 51,830 44,798DB Liquid Commodity Index – Optimum
Yield Agriculture Excess return 3.00 33,690 29,118S&P GSCI Total return 3.00 18,141 15,679
When there is more than one benchmark, the effect of each benchmark must be considered individually, as each benchmark might fluctuate independently from the others.
In practice, actual trading results may differ from these sensitivity analyses and the differences could be significant.
Credit RiskAs at June 30, 2017 and December 31, 2016, the Fund had no significant investments in either fixed-income securities, money market securities and derivative financial instruments. As a result, the Fund is not significantly exposed to credit risk.
Liquidity RiskFor further information on maturities of financial liabilities and liquidity risk management of the Fund, please refer to Note 8 “Financial Instruments Disclosures”.

The accompanying Notes are an integral part of these financial statements.
43
d I M P r I V A T E M O N T H L Y d I S T r I b U T I O N I N C O M E F U N d
STATEMENT OF FINANCIAL POSITION ( U N A U d I T E d )
AS AT JUNE 302017
$
dECEMbEr 312016
$ASSETSCurrent AssetsCash 781,699 955,556 Investments at fair value through profit or loss (FVTPL) 26,818,407 26,769,998
27,600,106 27,725,554
LIABILITIESCurrent LiabilitiesAccrued expenses 3,579 1,545
Net Assets Attributable to Holders of Redeemable Units 27,596,527 27,724,009 – per unit (Note 4) 11.00 10.91
Approved on behalf of the Board of Directors ofDesjardins Investment Management Inc.,Manager of the DIM Private FundsVincent P. Hogue, President of the Board of Directorsand Sylvain Thériault, Director
STATEMENT OF COMPrEHENSIVE INCOME ( U N A U d I T E d )
SIx-MONTH PErIOdS ENdEd JUNE 30 2017$
2016$
IncomeInterest for distribution purposes 2,415 4,301 Distributions from underlyning funds 272,942 297,141 Changes in fair value: Net realized gain (loss) on investments 161,959 136,146 Net unrealized gain (loss) on investments 329,508 149,385
766,824 586,973
ExpensesAudit fees 3,537 3,302 Unitholders’ reporting costs 9 18 Filing fees 492 1,212 Administration fees 11,511 12,663
15,549 17,195
Increase (Decrease) in Net Assets Attributable to Holders of Redeemable Units 751,275 569,778 – per unit 0.30 0.23
Average Number of Redeemable Units 2,515,188 2,476,220
STATEMENT OF CHANGES IN FINANCIAL POSITION ( U N A U d I T E d )
SIx-MONTH PErIOdS ENdEd JUNE 30 2017 2016 $ $
Net Assets Attributable to Holders of Redeemable Units, Beginning of Period 27,724,009 24,906,416
Increase (Decrease) in Net Assets Attributable to Holders of Redeemable Units 751,275 569,778
Redeemable Unit Transactions Proceeds from sale of redeemable units 467,949 3,346,647 Amounts paid for redeemable units redeemed (819,357) (2,109,287)
(351,408) 1,237,360
Distributions to Holders of Redeemable UnitsNet investment income (59,403) (179,782)Net realized gain on sale of investments and derivatives (467,946) (342,575)
(527,349) (522,357)Net Assets Attributable to Holders of Redeemable Units, End of Period 27,596,527 26,191,197
STATEMENT OF CASH FLOWS ( U N A U d I T E d )
SIx-MONTH PErIOdS ENdEd JUNE 30 2017 2016 $ $
Cash Flows from (used in) Operating ActivitiesIncrease (decrease) in net assets attributable to holders of redeemable units 751,275 569,778 Adjustments for: Net realized gain (loss) (161,959) (136,146) Net unrealized gain (loss) (329,508) (149,385) Non-cash distributions from investments (272,942) (297,141)Proceeds from sale/maturity of investments 716,000 3,564,825 Investments purchased – (4,021,186)Interest, dividends and other receivables – 5,201 Accrued expenses 2,034 5,882 Net Cash Flows from (used in) Operating Activities 704,900 (458,172)
Cash Flows from (used in) Financing ActivitiesProceeds from sale of redeemable units 467,949 3,346,647 Amounts paid for redeemable units redeemed (819,357) (2,109,287)Distributions paid to holders of redeemable units net of reinvested distributions (527,349) (522,357)Net Cash Flows from (used in) Financing Activities (878,757) 715,003
Increase (decrease) in cash/bank overdraft (173,857) 256,831 Cash (bank overdraft), beginning of period 955,556 964,373 Cash (Bank Overdraft), End of Period 781,699 1,221,204
Supplemental Information on Cash Flows from (used in) Operating ActivitiesInterest received 1,914 4,301 Interest paid 19 –

SCHEDULE OF INVESTMENT PORTFOLIO AS AT JUNE 30, 2017 (UNAUDITED)
The accompanying Notes are an integral part of these financial statements.
d I M P r I V A T E M O N T H L Y d I S T r I b U T I O N I N C O M E F U N d
44
NUMBER FAIR OF UNITS COST VALUE $ $
Investment Funds (97.2%)DIM Private Canadian Large Cap Equity Fund 121,428 1,587,756 1,929,130DIM Private Corporate Bond Fund 1,221,641 12,410,313 12,608,551DIM Private Government Bond Fund 827,979 8,569,528 8,317,054DIM Private International Equity Fund 133,154 1,260,194 2,024,474DIM Private U.S. Equity Fund (for taxable accounts) 185,038 1,208,537 1,939,198
Total Investments 25,036,328 26,818,407
Other Net Assets (2.8%) 778,120
Net Assets (100%) 27,596,527

NOTES TO THE FINANCIAL STATEMENTS – SPECIFIC INFORMATION (UNAUDITED)
d I M P r I V A T E M O N T H L Y d I S T r I b U T I O N I N C O M E F U N d
45
Strategy in Using Financial InstrumentsInvestment ObjectiveProvide a regular income and, to a lesser extent, long-term capital appreciation.
In order to meet the investment objective, the Fund invests in a diversified basket of funds.
Financial Instruments Measured at Fair Value (Note 8)Hierarchy of Financial Instruments Measured at Fair ValueThe following tables categorize the Fund’s financial assets fair value measurement according to a three-level hierarchy. The methodology used for valuing securities is not necessarily an indication of the risk associated with investing in those securities. Fair value measurement is described in the “Significant Accounting Policies” section of Note 2.
Investment Measured at Fair Value at the End of the Period, within the Following Levels:
JUNE 30, 2017 LEVEL 1 LEVEL 2 LEVEL 3 TOTAL$ $ $ $
FINANCIAL ASSETS AT FVTPLINVESTMENT FUNdS – 26,818,407 – 26,818,407 TOTAL – 26,818,407 – 26,818,407
DECEMBER 31, 2016 LEVEL 1 LEVEL 2 LEVEL 3 TOTAL$ $ $ $
FINANCIAL ASSETS AT FVTPLINVESTMENT FUNdS – 26,769,998 – 26,769,998TOTAL – 26,769,998 – 26,769,998
Transfers between Levels 1 and 2During the periods ended June 30, 2017 and December 31, 2016, there were no transfers of securities between Levels 1 and 2.
Investment Entities (Note 2)Total values of index-based investments, mortgage-backed securities, asset-backed securities, investment funds (including limited partnerships) and master asset vehicles (included in the bonds) in the table “Investment Measured at Fair Value within the Levels” also represent the fair value of investments in structured entities.
Financial Instruments Risks (Note 8)As the majority of the Fund’s Net Assets Attributable to Holders of Redeemable Units are invested in underlying funds, the Fund may be indirectly exposed to currency, interest, concentration or credit risk. Thus, only direct exposure to risks arising from the Fund’s financial instruments is presented. To obtain the detail of underlying funds’ risks, you can view the underlying funds’ financial statements presented in this report.
Underlying Funds Risk ManagementThe Fund’s portfolio advisor makes sure that the underlying funds’ portfolio manager manages financial risks. Each month, the Fund’s portfolio advisor receives the underlying funds’ investment portfolios to analyze the management style and compares performance against the Fund’s benchmarks. Every quarter, the Fund’s portfolio advisor receives detailed quarterly documents featuring an analysis of performance, sector allocations and the underlying funds’ top positions.
Currency RiskAs at June 30, 2017 and December 31, 2016, the majority of the Fund’s financial assets and liabilities are denominated in Canadian dollars. As a result, the Fund is not significantly exposed to currency risk.
Interest Rate RiskAs at June 30, 2017 and December 31, 2016, the majority of the Fund’s financial assets and liabilities are non-interest bearing. As a result, the Fund is not significantly exposed to interest rates risk.
Concentration RiskAs at June 30, 2017 and December 31, 2016, the majority of the Fund’s financial assets and liabilities are invested in underlying funds.
Price RiskThe Manager’s estimate of the impact on Net Assets Attributable to Holders of Redeemable Units as a result of a reasonably possible change in benchmarks, using a historical beta coefficient (a measure of the sensitivity of a security in comparison to the market) between the Fund’s return as compared to the return of the Fund’s benchmarks, with all other variables held constant, is included in the following table. A 36-month regression analysis has been utilized to estimate the historical beta coefficient. The regression analysis uses data based on the monthly returns of the Fund.
CHANGE IN PRICE
IMPACT ON NET ASSETS ATTRIBUTABLE TO HOLDERS OF REDEEMABLE UNITS
BENCHMARKS %JUNE 30, 2017
$DECEMBER 31, 2016
$
FTSE TMX Canada 30 Day T-Bill 0.25 3,484 3,460FTSE TMX Canada Short Term
Government 1.00 52,261 51,900FTSE TMX Canada Mid Term
Government 1.00 52,261 51,900FTSE TMX Canada Short Term
Corporate 1.00 52,261 51,900FTSE TMX Canada Mid Term Corporate 1.00 52,261 51,900S&P/TSX Dividend 3.00 55,745 55,360S&P 500 3.00 55,745 55,360MSCI EAFE 3.00 52,958 52,592MSCI Europe 3.00 2,787 2,768
When there is more than one benchmark, the effect of each benchmark must be considered individually, as each benchmark might fluctuate independently from the others.
In practice, actual trading results may differ from these sensitivity analyses and the differences could be significant.
Credit RiskAs at June 30, 2017 and December 31, 2016, the Fund had no significant investments in either fixed-income securities, money market securities and derivative financial instruments. As a result, the Fund is not significantly exposed to credit risk.
Liquidity RiskFor further information on maturities of financial liabilities and liquidity risk management of the Fund, please refer to Note 8 “Financial Instruments Disclosures”.
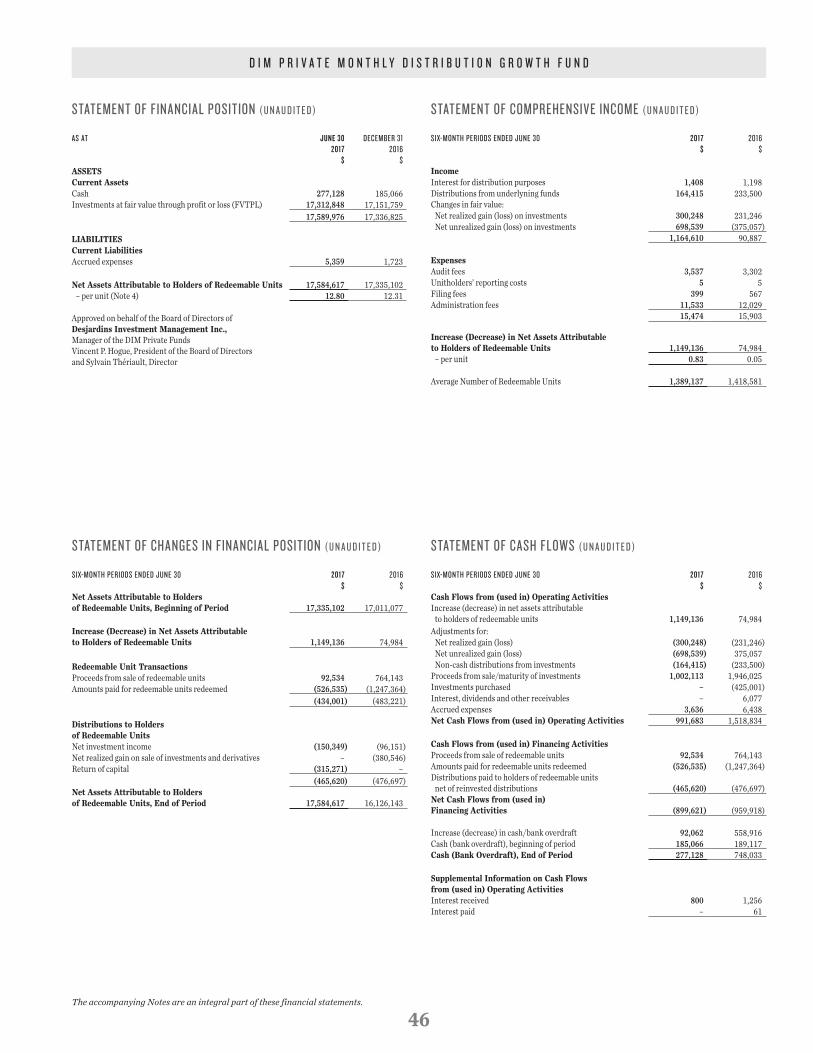
The accompanying Notes are an integral part of these financial statements.
46
d I M P r I V A T E M O N T H L Y d I S T r I b U T I O N G r O W T H F U N d
STATEMENT OF FINANCIAL POSITION ( U N A U d I T E d )
AS AT JUNE 302017
$
dECEMbEr 312016
$ASSETSCurrent AssetsCash 277,128 185,066 Investments at fair value through profit or loss (FVTPL) 17,312,848 17,151,759
17,589,976 17,336,825
LIABILITIESCurrent LiabilitiesAccrued expenses 5,359 1,723
Net Assets Attributable to Holders of Redeemable Units 17,584,617 17,335,102 – per unit (Note 4) 12.80 12.31
Approved on behalf of the Board of Directors ofDesjardins Investment Management Inc.,Manager of the DIM Private FundsVincent P. Hogue, President of the Board of Directorsand Sylvain Thériault, Director
STATEMENT OF COMPrEHENSIVE INCOME ( U N A U d I T E d )
SIx-MONTH PErIOdS ENdEd JUNE 30 2017$
2016$
IncomeInterest for distribution purposes 1,408 1,198 Distributions from underlyning funds 164,415 233,500 Changes in fair value: Net realized gain (loss) on investments 300,248 231,246 Net unrealized gain (loss) on investments 698,539 (375,057)
1,164,610 90,887
ExpensesAudit fees 3,537 3,302 Unitholders’ reporting costs 5 5 Filing fees 399 567 Administration fees 11,533 12,029
15,474 15,903
Increase (Decrease) in Net Assets Attributable to Holders of Redeemable Units 1,149,136 74,984 – per unit 0.83 0.05
Average Number of Redeemable Units 1,389,137 1,418,581
STATEMENT OF CHANGES IN FINANCIAL POSITION ( U N A U d I T E d )
SIx-MONTH PErIOdS ENdEd JUNE 30 2017 2016 $ $
Net Assets Attributable to Holders of Redeemable Units, Beginning of Period 17,335,102 17,011,077
Increase (Decrease) in Net Assets Attributable to Holders of Redeemable Units 1,149,136 74,984
Redeemable Unit Transactions Proceeds from sale of redeemable units 92,534 764,143 Amounts paid for redeemable units redeemed (526,535) (1,247,364)
(434,001) (483,221)
Distributions to Holders of Redeemable UnitsNet investment income (150,349) (96,151)Net realized gain on sale of investments and derivatives – (380,546)Return of capital (315,271) –
(465,620) (476,697)Net Assets Attributable to Holders of Redeemable Units, End of Period 17,584,617 16,126,143
STATEMENT OF CASH FLOWS ( U N A U d I T E d )
SIx-MONTH PErIOdS ENdEd JUNE 30 2017 2016 $ $
Cash Flows from (used in) Operating ActivitiesIncrease (decrease) in net assets attributable to holders of redeemable units 1,149,136 74,984 Adjustments for: Net realized gain (loss) (300,248) (231,246) Net unrealized gain (loss) (698,539) 375,057 Non-cash distributions from investments (164,415) (233,500)Proceeds from sale/maturity of investments 1,002,113 1,946,025 Investments purchased – (425,001)Interest, dividends and other receivables – 6,077 Accrued expenses 3,636 6,438 Net Cash Flows from (used in) Operating Activities 991,683 1,518,834
Cash Flows from (used in) Financing ActivitiesProceeds from sale of redeemable units 92,534 764,143 Amounts paid for redeemable units redeemed (526,535) (1,247,364)Distributions paid to holders of redeemable units net of reinvested distributions (465,620) (476,697)Net Cash Flows from (used in) Financing Activities (899,621) (959,918)
Increase (decrease) in cash/bank overdraft 92,062 558,916 Cash (bank overdraft), beginning of period 185,066 189,117 Cash (Bank Overdraft), End of Period 277,128 748,033
Supplemental Information on Cash Flows from (used in) Operating ActivitiesInterest received 800 1,256 Interest paid – 61

SCHEDULE OF INVESTMENT PORTFOLIO AS AT JUNE 30, 2017 (UNAUDITED)
The accompanying Notes are an integral part of these financial statements.
d I M P r I V A T E M O N T H L Y d I S T r I b U T I O N G r O W T H F U N d
47
NUMBER FAIR OF UNITS COST VALUE $ $
Investment Funds (98.5%)DIM Private Canadian Large Cap Equity Fund 275,175 3,672,153 4,371,705DIM Private Corporate Bond Fund 206,540 2,098,523 2,131,704DIM Private Government Bond Fund 138,947 1,435,138 1,395,719DIM Private International Equity Fund 328,978 3,112,853 5,001,787DIM Private U.S. Equity Fund (for taxable accounts) 420,986 2,728,802 4,411,933
Total Investments 13,047,469 17,312,848
Other Net Assets (1.5%) 271,769
Net Assets (100%) 17,584,617
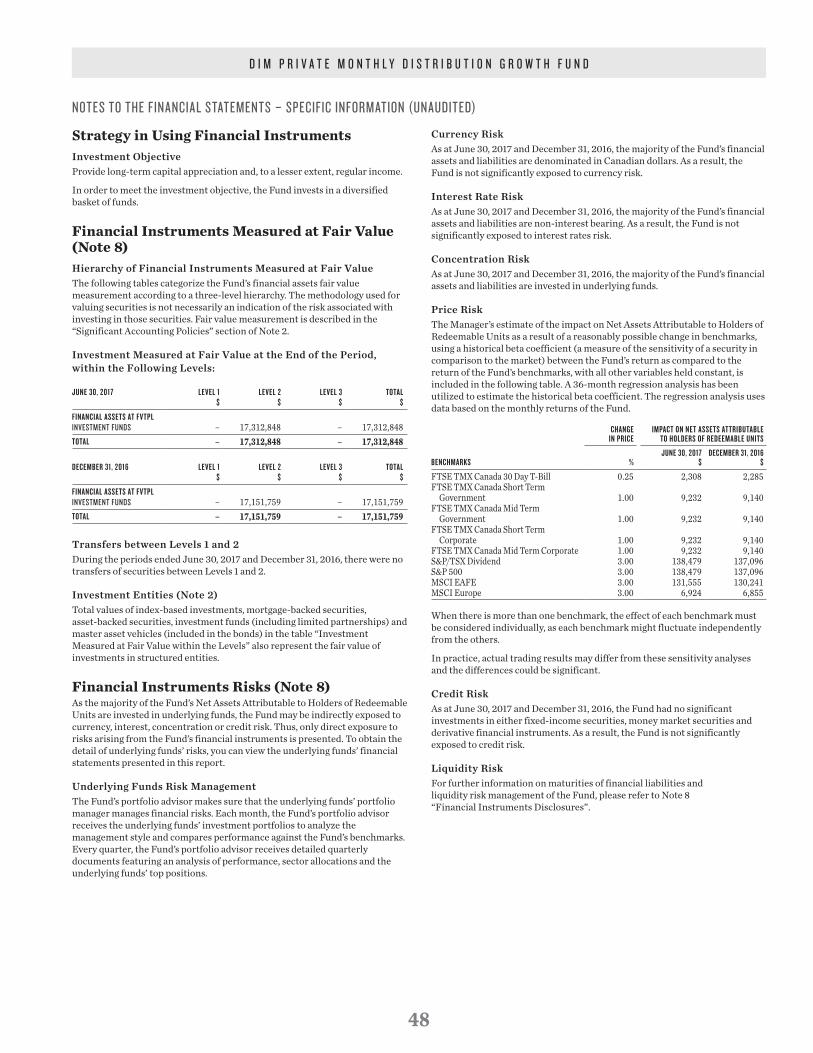
NOTES TO THE FINANCIAL STATEMENTS – SPECIFIC INFORMATION (UNAUDITED)
d I M P r I V A T E M O N T H L Y d I S T r I b U T I O N G r O W T H F U N d
48
Strategy in Using Financial InstrumentsInvestment ObjectiveProvide long-term capital appreciation and, to a lesser extent, regular income.
In order to meet the investment objective, the Fund invests in a diversified basket of funds.
Financial Instruments Measured at Fair Value (Note 8)Hierarchy of Financial Instruments Measured at Fair ValueThe following tables categorize the Fund’s financial assets fair value measurement according to a three-level hierarchy. The methodology used for valuing securities is not necessarily an indication of the risk associated with investing in those securities. Fair value measurement is described in the “Significant Accounting Policies” section of Note 2.
Investment Measured at Fair Value at the End of the Period, within the Following Levels:
JUNE 30, 2017 LEVEL 1 LEVEL 2 LEVEL 3 TOTAL$ $ $ $
FINANCIAL ASSETS AT FVTPLINVESTMENT FUNdS – 17,312,848 – 17,312,848 TOTAL – 17,312,848 – 17,312,848
DECEMBER 31, 2016 LEVEL 1 LEVEL 2 LEVEL 3 TOTAL$ $ $ $
FINANCIAL ASSETS AT FVTPLINVESTMENT FUNdS – 17,151,759 – 17,151,759TOTAL – 17,151,759 – 17,151,759
Transfers between Levels 1 and 2During the periods ended June 30, 2017 and December 31, 2016, there were no transfers of securities between Levels 1 and 2.
Investment Entities (Note 2)Total values of index-based investments, mortgage-backed securities, asset-backed securities, investment funds (including limited partnerships) and master asset vehicles (included in the bonds) in the table “Investment Measured at Fair Value within the Levels” also represent the fair value of investments in structured entities.
Financial Instruments Risks (Note 8)As the majority of the Fund’s Net Assets Attributable to Holders of Redeemable Units are invested in underlying funds, the Fund may be indirectly exposed to currency, interest, concentration or credit risk. Thus, only direct exposure to risks arising from the Fund’s financial instruments is presented. To obtain the detail of underlying funds’ risks, you can view the underlying funds’ financial statements presented in this report.
Underlying Funds Risk ManagementThe Fund’s portfolio advisor makes sure that the underlying funds’ portfolio manager manages financial risks. Each month, the Fund’s portfolio advisor receives the underlying funds’ investment portfolios to analyze the management style and compares performance against the Fund’s benchmarks. Every quarter, the Fund’s portfolio advisor receives detailed quarterly documents featuring an analysis of performance, sector allocations and the underlying funds’ top positions.
Currency RiskAs at June 30, 2017 and December 31, 2016, the majority of the Fund’s financial assets and liabilities are denominated in Canadian dollars. As a result, the Fund is not significantly exposed to currency risk.
Interest Rate RiskAs at June 30, 2017 and December 31, 2016, the majority of the Fund’s financial assets and liabilities are non-interest bearing. As a result, the Fund is not significantly exposed to interest rates risk.
Concentration RiskAs at June 30, 2017 and December 31, 2016, the majority of the Fund’s financial assets and liabilities are invested in underlying funds.
Price RiskThe Manager’s estimate of the impact on Net Assets Attributable to Holders of Redeemable Units as a result of a reasonably possible change in benchmarks, using a historical beta coefficient (a measure of the sensitivity of a security in comparison to the market) between the Fund’s return as compared to the return of the Fund’s benchmarks, with all other variables held constant, is included in the following table. A 36-month regression analysis has been utilized to estimate the historical beta coefficient. The regression analysis uses data based on the monthly returns of the Fund.
CHANGE IN PRICE
IMPACT ON NET ASSETS ATTRIBUTABLE TO HOLDERS OF REDEEMABLE UNITS
BENCHMARKS %JUNE 30, 2017
$DECEMBER 31, 2016
$
FTSE TMX Canada 30 Day T-Bill 0.25 2,308 2,285FTSE TMX Canada Short Term
Government 1.00 9,232 9,140FTSE TMX Canada Mid Term
Government 1.00 9,232 9,140FTSE TMX Canada Short Term
Corporate 1.00 9,232 9,140FTSE TMX Canada Mid Term Corporate 1.00 9,232 9,140S&P/TSX Dividend 3.00 138,479 137,096S&P 500 3.00 138,479 137,096MSCI EAFE 3.00 131,555 130,241MSCI Europe 3.00 6,924 6,855
When there is more than one benchmark, the effect of each benchmark must be considered individually, as each benchmark might fluctuate independently from the others.
In practice, actual trading results may differ from these sensitivity analyses and the differences could be significant.
Credit RiskAs at June 30, 2017 and December 31, 2016, the Fund had no significant investments in either fixed-income securities, money market securities and derivative financial instruments. As a result, the Fund is not significantly exposed to credit risk.
Liquidity RiskFor further information on maturities of financial liabilities and liquidity risk management of the Fund, please refer to Note 8 “Financial Instruments Disclosures”.

N O T E S T O T H E F I N A N C I A L S T A T E M E N T S ( U N A U d I T E d ) | Six-month Periods Ended June 30, 2017 and 2016
49
1. Establishment of the DIM Private FundsDIM Private Funds are comprised of eleven mutual fund trusts and two unit trusts, collectively called the “Funds.” Desjardins Investment Management Inc. (the Manager) is the Portfolio Advisor and Manager of the Funds in accordance with the terms of the declaration of trust agreement. Its head office is located at 1 Complexe Desjardins, East Tower, 27th Floor, Montréal, Québec, Canada H5B 1E4.
The Funds listed below are unincorporated mutual fund trusts, established under the laws of Québec and governed by a trust agreement amended November 4, 2013:
DIM PRIVATE FUNDS START OF OPERATIONS
Bond February 9, 2001Government Bond December 3, 2004Corporate Bond December 3, 2004Canadian Large Cap Equity February 9, 2001Canadian Equity Growth June 19, 2009Canadian Small Cap Equity December 3, 2004U.S. Equity (for taxable accounts) February 9, 2001U.S. Equity (for non taxable accounts) March 9, 2001International Equity June 22, 2001Completion Strategy July 22, 2005Balanced November 1, 2004
The Funds listed below are unincorporated unit trusts, established under the laws of Québec and governed by a trust agreement dated November 4, 2013:
DIM PRIVATE FUNDS START OF OPERATIONS
Monthly Distribution Income June 12, 2009Monthly Distribution Growth June 12, 2009
The interim financial statements (financial statements) of the Funds are presented in Canadian dollars, the Funds’ functional and presentation currency. The main activities of the Funds are disclosed in the section “Notes to the Financial Statements – Specific Information” pertaining to each Fund.
2. Basis of PresentationInternational Financial Reporting Standards (IFRS)These financial statements have been prepared in compliance with International Financial Reporting Standards (IFRS) applicable to the preparation of financial statements.
Statement of ComplianceThe policies applied in these financial statements are based on IFRS in effect as of August 15, 2017, the date on which the financial statements have been authorized for issue by the Board of Directors of the Manager.
Significant Accounting PoliciesThe significant measurement and presentation policies applied to prepare these financial statements are described below.
Financial Assets and LiabilitiesThe Funds’ financial assets consist primarily of investments in non-derivative financial instruments and derivative financial instruments presented in the schedule of investment portfolio. Financial liabilities consist primarily of derivative financial instruments.
Financial assets and liabilities are recognized on the date the Funds become a party to the contractual provisions of the instrument, namely the trade date of the financial instrument.
Information on the classification of Financial InstrumentsThe Funds classify their financial assets and liabilities in the following categories:
Financial assets at fair value through profit or loss (FVTPL):
• Held for trading: derivative financial instruments;
• Designated at FVTPL: all other investments including equity and fixed-income securities.
Financial assets at amortized cost:
• Loans and receivables: cash and all other receivables.
Financial liabilities at FVTPL:
• Held for trading: derivative financial instruments and short positions.
Financial liabilities at amortized cost:
• Bank overdraft and all other payables.
A financial instrument is designated at FVTPL if it eliminates or significantly reduces a measurement or a recognition inconsistency that would otherwise arise from measuring assets or liabilities or recognizing gains or losses on them on different bases.
The Funds’ obligation concerning net assets attributable to holders of redeemable units is recorded at the redemption amount which approximates fair value. The accounting policies used to measure the fair value of investments and derivative financial instruments are identical to those used in measuring the net asset value for transactions with holders of redeemable units, except where the closing price for financial assets and liabilities is not within the bid-ask spread.
As at June 30, 2017 and December 31, 2016, there are no differences between the Funds’ net asset value per unit for transactions and their net assets attributable to holders of redeemable units in accordance with IFRS.
Determination of the Fair Value of Financial InstrumentsFair value is the price that would be received from selling an asset or paid to transfer a liability in an orderly transaction between market participants at the valuation date. The fair value of financial assets and liabilities traded in active markets are based on quoted market prices at the close of trading on the valuation date and there is little subjectivity in its determination. The Funds use the closing price for both financial assets and financial liabilities where this price falls within the bid-ask spread. In circumstances when the closing price is not within the bid-ask spread, the Manager determines the point within the bid-ask spread that is most representative of fair value based on the specific facts and circumstances.
The fair value of financial assets and liabilities that are not traded in an active market, including over-the-counter derivative financial instruments, is determined using valuation techniques. The Funds use a variety of methods and make assumptions that are based on market conditions existing at each valuation date.
Valuation techniques include the use of comparable recent arm’s length transactions, the fair value of other instruments that are substantially the same, discounted cash flow analysis, option pricing models and others commonly used by market participants and which make the maximum use of observable inputs. Refer to Note 8 “Financial Instruments Disclosures” for further information about the Funds’ fair value measurements.
LiquidityCash (bank overdraft) is measured at cost which closely approximates fair value.
Money Market SecuritiesMoney market securities are recorded at cost, together with accrued interest, which closely approximates fair value.
Equities and Index-Based InvestmentsEquity securities and index-based investments are recorded at the closing price of the accredited stock exchange on which the corresponding security is principally traded. Unlisted warrants are valued with a recognized valuation model, including Black & Scholes.

N O T E S T O T H E F I N A N C I A L S T A T E M E N T S ( U N A U d I T E d ) | Six-month Periods Ended June 30, 2017 and 2016
50
Bonds, Mortgage-Backed Securities and Asset-Backed SecuritiesBonds, mortgage-backed securities and asset-backed securities are valued based on prices obtained from recognized securities dealers.
Investment FundsThe underlying funds’ units are generally valued based on the net asset value per unit provided by the underlying fund’s manager at the end of each valuation day.
Derivative Financial InstrumentsCertain Funds use an array of derivative financial instruments such as foreign currency forward contracts, forward contracts and futures contracts for hedging purposes or purposes other than hedging, or both. The fair value of derivative financial instruments takes into account the impact of legally binding master netting agreements, if applicable. Refer to the section “Offsetting Financial Assets and Financial Liabilities” for further information about the Funds’ offsetting.
Foreign Currency Forward Contracts and Forward ContractsThe fair value of these instruments corresponds to the gains or losses that would result from the contract close-out on the valuation date; this value is recorded in “Unrealized appreciation (depreciation) on derivatives” in the Statement of Financial Position.
Futures ContractsFutures contracts are valued at fair value and are settled daily through brokers acting as intermediaries. Any amounts receivable (payable) from the settlement of futures contracts are recorded in “Receivable (Payable) on futures contracts” in the Statement of Financial Position.
Valuation of Unlisted Securities and Other InvestmentsWhen the valuation principles of the aforementioned investments are not appropriate, fair value is determined according to the Manager’s best estimates, based on established valuation procedures and on prevailing market conditions on each valuation date. These procedures cover, among others, securities no longer traded, securities issued by private corporations and illiquid securities. For further information, refer to Note 3 “Critical Accounting Judgments, Estimates and Assumptions”.
Investment TransactionsInvestment transactions are accounted for on the trade date. Cost is determined on an average cost basis except for money market securities, for which the cost is determined using the First-In, First-Out method. The average cost does not include amortization of premiums or discounts on fixed-income securities with the exception of stripped bonds. Transaction costs, such as brokerage commissions, incurred in the purchase and sale of securities by the Funds are recognized in the Statement of Comprehensive Income. The difference between the unrealized appreciation (depreciation) of investments at the beginning and at the end of the period is included in “Net unrealized gain (loss) on investments” in the Statement of Comprehensive Income. On disposal of an investment, the difference between the fair value and the cost of the investment is included in “Net realized gain (loss) on investments” in the Statement of Comprehensive Income.
Securities Lending and Repurchase TransactionsThe DIM Private International Equity Fund (the Fund) may enter into securities lending and repurchase transactions through the securities lending program of the Fund’s custodian, Desjardins Trust Inc. (the Trust).
The securities loaned and repurchase transactions are not derecognized in the Statement of Financial Position as substantially all the risks and rewards of ownership of these securities are kept.
To limit the risk that the counterparty fails to fulfill its obligations, the Fund obtains collateral, representing at least 102% of the contract amount, determined daily based on the fair value of the previous business day’s securities loaned or repurchase transactions. Securities received as collateral in securities lending transactions are not recognized in the Statement of Financial Position as substantially all the risks and rewards of ownership of these securities have not been transferred to the Fund. Cash guarantees received for securities lending and repurchase transactions are recognized as financial assets in the Statement of Financial Position, in “Cash guarantee received for securities lending” and/or “Cash guarantee received for
repurchase transactions”, as appropriate. A liability representing the obligation to return the securities is recognized in “Commitments related to securities lending” and/or “Commitments related to repurchase transactions” as appropriate.
Trust, as the fund’s custodian, may use those amounts to buy investments. Revenue generated through the Trust’s securities lending program is shared by the Fund and the Trust at the rate presented in the section “Notes to the Financial Statements – Specific Information” pertaining to each Fund. This revenue is included in “Revenue from securities lending and repurchase transactions” in the Statement of Comprehensive Income.
Offsetting Financial Assets and Financial LiabilitiesFinancial assets and liabilities are offset in the Statement of Financial Position for the Funds if and only if a Fund has:
• a legally enforceable and unconditional right to offset the recognized amounts and
• an intention to settle on a net basis, or to realize the asset and settle the liability simultaneously.
The Funds have a legally enforceable and unconditional right to offset a financial asset and liability when they meet the following criteria:
• the right is enforceable in the normal course of business and
• the right is enforceable in the event of default, insolvency or bankruptcy.
Over-the-counter derivative financial instruments, securities lending and repurchase agreements, receivable for investments sold and payable for investments purchased are subject to master netting or similar agreements that do not meet the criteria for offsetting in the Statement of Financial Position as they give a right to an offset that is enforceable only in the event of default, insolvency or bankruptcy.
The table presenting financial assets and liabilities that are offset or not offset in the Statement of Financial Position and subject to a master netting agreement or similar agreement is presented in the section “Notes to the Financial Statements – Specific Information” pertaining to each Fund, if applicable.
Other Assets and LiabilitiesMargin deposited on derivatives, receivable on futures contracts, subscriptions receivable, receivable for investments sold as well as interest, dividends and other receivables are classified as loans and receivables and are recorded at cost.
Similarly, accrued expenses, payable on futures contracts, redemptions payable, payable for investments purchased, interest, dividends and other payables, as well as distributions payable, are classified as financial liabilities and recorded at cost.
Given their short-term nature, their carrying amount closely approximates their fair value.
IncomeInterest income for distribution purposes from investments in debt securities presented in the Statement of Comprehensive Income is recognized as it is earned. The Funds do not amortize premiums paid or discounts received on the purchase of debt securities except for stripped bonds. Dividends are recognized as income on the ex-dividend date. Foreign interest and dividend income are accounted for on a gross basis and is included in the income section of the Statement of Comprehensive Income.
Distributions received from underlying funds are recorded at the date of distribution. Distributions are included in “Distributions from underlying funds” and are presented as a separate line item in the Statement of Comprehensive Income. Previously, those amounts were split between the different types of revenues. For the purposes of presentation, the comparative information has been reclassified accordingly.
Distributions received in the form of units from underlying funds are presented as a separate line item called “Non-cash distribution from investments” on the Statement of Cash Flows and its equivalent has been removed from the “Investments purchased” line item. For the purposes of presentation, the comparative information has been revised accordingly.

N O T E S T O T H E F I N A N C I A L S T A T E M E N T S ( U N A U d I T E d ) | Six-month Periods Ended June 30, 2017 and 2016
51
On derivative financial instruments contract close-out, the gains and losses from derivative financial instruments held for hedging purposes are included in “Net realized gain (loss) on derivatives” in the Statement of Comprehensive Income. Gains and losses from derivative financial instruments held for purposes other than hedging are included in the “Net income (loss) from derivatives” in the Statement of Comprehensive Income.
Foreign Currency TranslationThe Funds’ subscriptions and redemptions are denominated in Canadian dollars. Foreign currency assets and liabilities denominated in a foreign currency are translated into the functional currency at the exchange rate on each valuation date. Purchases and sales of securities, as well as income and expenses denominated in foreign currencies are translated into the functional currency at the exchange rates prevailing on the transaction dates.
Foreign exchange gains and losses relating to cash are presented as “Foreign exchange gain (loss) on cash on investments” and those relating to other financial assets and liabilities are presented within “Net realized gain (loss) on investments” and “Net unrealized gain (loss) on investments” in the Statement of Comprehensive Income.
Increase (Decrease) in Net Assets Attributable to Holders of Redeemable Units per UnitThe increase (decrease) in net assets attributable to holders of redeemable units per unit, presented in the Statement of Comprehensive Income, is calculated by dividing the increase (decrease) in net assets attributable to holders of redeemable units by the average number of units outstanding during the period.
Income TaxesUnder the Income Tax Act (Canada), the DIM Private Monthly Distribution Income Fund and the DIM Private Monthly Distribution Growth Fund are defined as unit trusts and their fiscal year-end is December 31. All the other DIM Private Funds are defined as mutual fund trusts and their fiscal year-end is December 15.
The Funds are taxable on net income and net capital gains not distributed to holders of redeemable units. All the Funds’ investment income and sufficient net capital gains realized in any period are required to be distributed to holders of redeemable units to ensure no income tax is payable by the Funds. As a result, the Funds do not record income taxes. Since the Funds do not record income taxes, the tax benefit of capital and non-capital losses has not been reflected in the Statement of Financial Position as a deferred income tax asset.
The Funds currently incur withholding taxes imposed by certain countries on investment income and capital gains. Such income and gains are recorded on a gross basis, and the related withholding taxes are shown as a separate expense in the Statement of Comprehensive Income.
Capital losses can be carried forward indefinitely to reduce future capital gains. Non-capital losses may be carried forward 20 years to reduce future investment income and capital gains.
Investment EntitiesThe Funds meet the definition in IFRS 10, Consolidated Financial Statements, for investment entities and account for their investments in underlying funds at FVTPL.
According to IFRS 12, Disclosure of Interests in Other Entities, the Funds must disclose specific information on their investments in other entities, such as subsidiaries, associates and structured entities.
SubsidiariesAn entity is considered as a subsidiary when it is controlled by another entity. The Fund controls an entity when it has the right to variable returns from its involvement with the entity and through its power over the entity.
AssociatesAssociates are investments in entities over which the Fund exercises significant influence without, however, exercising control.
Structured EntitiesStructured entities are conceived in a way that the right to vote and other similar rights are not determining factors in exercising control. The Manager has determined that its investments in underlying funds (including limited partnerships), index-based investments, mortgage-backed securities, asset-backed securities and master asset vehicles (included in the bonds) are structured entities, unless the specified relationship is different.
Refer to the section “Notes to the financial statements – Specific Information” pertaining to each Fund for more information on Investment Entities.
Accounting Standards Issued but not yet AppliedIn July 2014, the International Accounting Standards Board (IASB) issued the complete and final version of IFRS 9, Financial Instruments (IFRS 9), which will replace IAS 39, Financial Instruments: Recognition and Measurement (IAS 39). IFRS 9 includes, among others, the requirements for the classification and measurement of financial assets and liabilities.
IFRS 9 sets out a new classification and measurement model for financial assets to determine whether a financial asset should be classified at amortized cost, at FVTPL or at fair value through other comprehensive income. This model is based on the contractual cash flow characteristics of the financial asset and the business model under which the financial asset is held. The valuation basis of financial assets, namely amortized cost or fair value, may need to be changed, as well as the recognition of unrealized gains and losses arising from changes in fair value. For the classification and measurement of financial liabilities, the new standard essentially carries forward the current requirements under IAS 39.
The Funds will have to adopt IFRS 9 retrospectively for annual periods beginning on or after January 1, 2018. However, the restatement of comparative periods is not mandatory as an exemption from applying the standard allows comparative periods to be presented in accordance with the previous GAAP under certain conditions. A team has been assigned to the project to highlight the following: the changes in disclosure and financial reporting as well as in systems and processes, disclosures and training. The project is progressing according to the proposed implementation schedule. The assessment of the impacts for the Funds is finalized. There is only a change of wording versus the classification in IAS 39. There is no impact on recognition and measurement for the Funds.
3. Critical Accounting Judgments, Estimates and Assumptions
The preparation of financial statements requires management to use judgment in applying its accounting policies and to make estimates and assumptions about the future. Actual results may differ from these estimates. The following paragraphs discuss the most significant accounting judgments and estimates that the Funds have made in preparing the financial statements.
Fair Value Measurement of Derivative Financial Instruments and Securities not Quoted in an Active MarketThe Funds may hold financial instruments that are not quoted in active markets, including derivative financial instruments. Fair value is determined based on models that make maximum use of observable inputs and rely as little as possible on unobservable inputs. The Funds consider the data observable if that market data is readily available, distributed or updated on a regular basis, reliable and verifiable, not proprietary and provided by independent sources that are actively involved in the relevant market. The models used to determine fair values are validated and periodically reviewed by experienced personnel of the Manager.
When no quoted prices are available, the fair value is estimated using present value or other valuation methods, which are influenced by the assumptions used concerning the amount and timing of estimated future cash flows and discount rates, which reflect varying degrees of risk, including liquidity risk, credit risk, risks related to interest rates, exchange rates, and price and rate volatility.
The calculation of the fair values may differ given the role that judgment plays in applying the acceptable estimation and valuation techniques and the acceptable estimation. Estimated fair value reflects market conditions at a given date and for this reason, it may not be representative of future fair values. Refer to Note 8 “Financial Instruments Disclosures” for further information on fair value measurement of financial instruments.

N O T E S T O T H E F I N A N C I A L S T A T E M E N T S ( U N A U d I T E d ) | Six-month Periods Ended June 30, 2017 and 2016
52
Classification and Measurement of Investments and Application of the Fair Value OptionIn classifying and measuring financial instruments held by the Funds, the Manager is required to make significant judgments about whether or not the business of the Funds is to invest on a total return basis for the purpose of applying the fair value option for financial assets under IAS 39. The most significant judgment lies in determining if certain investments are held-for-trading and if the fair value option can be applied to those which are not. For further information on financial instruments, refer to Note 2 “Basis of Presentation”.
4. Net Assets Attributable to Holders of Redeemable Units
Structure of Redeemable UnitsEach Fund is authorized to issue an unlimited number of redeemable units (the units). Each unit entitles the holder to participate equally in the distributions of the Fund. Fractions of units may be issued.
The units of a Fund confer the same rights and privileges. As a result, each unit entitles the holder to one vote and to participate equally in distributions made by the Fund and, on liquidation, in the net assets attributable to holders of redeemable units after satisfaction of outstanding liabilities. A fraction of a unit will entitle the holder to proportionate participation and to vote.
The Funds only issue fully paid units and fractions. Unitholders may redeem their units in the manner described in the Declaration of Trust.
The Manager manages the capital of the Funds in accordance with their investment objectives (refer to Note 8). Also, in accordance with securities regulations, the Funds seek to invest subscriptions received in appropriate investments while maintaining sufficient liquidity to meet redemptions.
Classification of Units Issued by the FundsThe Funds’ outstanding units qualify as “puttable instruments’’ as required by the IAS 32; Financial Instruments: Presentation (IAS 32). IAS 32 states that units that include a contractual obligation for the issuer to repurchase or redeem them for cash or another financial asset should be classified as financial liabilities.
In addition, the Funds have a contractual obligation to distribute any taxable income annually that allows the unitholder to request cash payment for any distributions or dividends declared. These features violate criteria that are required in order for the units to be presented as equity under IAS 32. Consequently, the Fund’s outstanding units are classified as financial liabilities in these financial statements.
Outstanding UnitsChanges in the number of outstanding units are presented below:
DIM PRIVATE FUNDSOUTSTANDING UNITS
AS AT JANUARY 1 UNITS ISSUED UNITS REINVESTED UNITS REDEEMEDOUTSTANDING UNITS
AS AT JUNE 30
Bond 2017 18,957,982 4,302,219 208,603 857,849 22,610,9552016 18,966,765 629,835 196,677 970,133 18,823,144
Government Bond 2017 82,775,654 29,163,543 818,412 2,814,928 109,942,6812016 104,958,964 9,966,594 992,909 21,613,231 94,305,236
Corporate Bond 2017 173,686,850 68,824,226 2,333,544 10,501,956 234,342,6642016 104,372,722 37,851,286 1,317,849 6,484,124 137,057,733
Canadian Large Cap Equity 2017 41,310,569 5,141,874 557,764 10,353,763 36,656,4442016 41,022,071 5,986,445 659,445 2,036,106 45,631,855
Canadian Equity Growth 2017 10,165,470 2,886,323 111,061 2,555,128 10,607,7262016 7,692,673 2,886,956 70,612 539,967 10,110,274
Canadian Small Cap Equity 2017 8,659,885 2,619,656 61,695 2,177,977 9,163,2592016 6,950,727 1,933,860 – 349,827 8,534,760
U.S. Equity (for taxable accounts) 2017 55,474,593 12,548,004 475,974 7,838,572 60,659,9992016 49,384,881 10,696,714 285,571 5,558,011 54,809,155
U.S. Equity (for non taxable accounts) 2017 15,760,911 1,939,679 – 1,429,375 16,271,2152016 14,716,208 1,272,215 – 971,132 15,017,291
International Equity 2017 55,050,006 10,491,918 383,397 13,122,005 52,803,3162016 48,847,372 12,063,018 1,395,003 2,147,112 60,158,281
Completion Strategy 2017 12,124,158 3,212,254 – 469,478 14,866,9342016 10,544,491 1,334,045 – 797,082 11,081,454
Balanced 2017 11,351,266 2,228,522 105,460 671,892 13,013,3562016 8,885,050 1,947,069 99,192 530,390 10,400,921
Monthly Distribution Income 2017 2,541,455 41,818 – 73,839 2,509,4342016 2,281,625 309,864 – 194,032 2,397,457
Monthly Distribution Growth 2017 1,407,981 7,042 – 40,822 1,374,2012016 1,393,216 65,735 – 105,524 1,353,427

N O T E S T O T H E F I N A N C I A L S T A T E M E N T S ( U N A U d I T E d ) | Six-month Periods Ended June 30, 2017 and 2016
53
Valuation of UnitsOn each business day, the Manager calculates the net asset value per unit by dividing the net assets attributable to holders of redeemable units by the number of units outstanding.
Distributions to UnitholdersThe Funds’ net investment income is distributed in cash or reinvested in additional units, as follows:
DIM PRIVATE FUNDS INCOME DISTRIBUTIONS
Bond MonthlyGovernment Bond MonthlyCorporate Bond MonthlyCanadian Large Cap Equity QuarterlyCanadian Equity Growth QuarterlyCanadian Small Cap Equity YearlyU.S. Equity (for taxable accounts) QuarterlyU.S. Equity (for non taxable accounts) YearlyInternational Equity QuarterlyCompletion Strategy YearlyBalanced QuarterlyMonthly Distribution Income MonthlyMonthly Distribution Growth Monthly
Any net capital gains realized are distributed annually in December for each Fund, if applicable.
5. Management Fees and Other ExpensesDesjardins Trust Inc. (the Trust) is the Funds’ trustee. Each unitholder negotiates management fees directly with the Funds’ Manager.
Each Fund assumes its own operating expenses, which include, among other things, brokerage, custody, legal, audit, filing and administration costs, up to an annual cap.
The Manager has the power to charge operating expenses to the Funds, up to an annual cap set by the Funds and the Manager. When the total expenses exceed the imposed cap, the Manager must absorb its share of expenses, presented as “Expenses absorbed by the Manager”, in the Statement of Comprehensive Income.
As at June 30, 2017 and 2016, the annual cap before taxes of each Fund is as follows:
DIM PRIVATE FUNDS ANNUAL CAP (%)
Bond 0.35Government Bond 0.15Corporate Bond 0.25Canadian Large Cap Equity 0.15Canadian Equity Growth 0.15Canadian Small Cap Equity 0.30U.S. Equity (for taxable accounts) 0.25U.S. Equity (for non taxable accounts) 0.25International Equity 0.40Completion Strategy 0.70Balanced 0.35Monthly Distribution Income 0.35Monthly Distribution Growth 0.45
In order to avoid duplicate fees, the DIM Private Funds that invest in other DIM Private Funds do not pay fees for this portion of the investment.
The DIM Private Completion Strategy Fund must pay fees for the portion of investments in exchange-traded funds. The Funds’ annual caps include all these fees.
6. Related Party TransactionsThe Manager ensures the daily administration of the Funds, and provides or ensures the Funds are provided with all services (accounting, custody, portfolio management, record maintenance, transfer agent) required to function properly. The administrative fees presented in the Statement of Comprehensive Income were incurred with the Fédération des caisses Desjardins du Québec (the Federation), the Manager’s parent company.
The Trust is the Funds’ trustee and custodian of their assets. The Trust is a wholly-owned subsidiary of the Federation. The Trust’s trustee fees are assumed by the Manager. The Trust’s custodian fees are paid by the Funds and established based on market conditions. The custodian fees presented in the Statement of Comprehensive Income were incurred with the Trust.
Revenue from securities lending and repurchase transactions are received from Desjardins Trust Inc., an entity belonging to the same group as the Manager.
Desjardins Global Asset Management Inc. (the Portfolio Advisor) acts as Portfolio Advisor to certain Funds. The Portfolio Advisor is a wholly-owned subsidiary of the Federation. The Portfolio Advisor’s fees are paid by the Manager.
Fiera Capital Corporation (Fiera) acts as a portfolio subadvisor to certain Funds. The Manager’s parent company holds 8.8% of Fiera’s voting rights. Fiera’s fees are paid by the Manager.
Desjardins Securities Inc. (DSI), a wholly-owned subsidiary of the Federation, is a broker firm that buys and sells securities for the Funds’ portfolios. The commissions paid to DSI on the Funds’ investment portfolio transactions during the periods ended at the following dates, are as follows:
DIM PRIVATE FUNDS JUNE 30 AMOUNT PAID TO DSI $
Canadian Large Cap Equity 2017 94,4642016 171,599
Canadian Equity Growth 2017 3,4712016 2,719
Canadian Small Cap Equity 2017 1,7482016 618
Completion Strategy 2017 5,9732016 3,639
During the periods ended June 30, 2017 and 2016, the commissions paid by the Funds to Desjardins Trust Inc. are:
DIM PRIVATE FUNDS JUNE 30 AMOUNT PAID TO THE DESJARDINS TRUST $
U.S. Equity (for taxable accounts)
2017 3102016 –
U.S. Equity (for non taxable accounts)
2017 682016 –
Based on their investment objectives, the DIM Private Funds invest part of their assets in other DIM Private Funds. All transactions in these underlying funds are based on net asset value per unit determined according to the policies of the respective underlying funds prevailing on the transaction date. The Funds pay no commissions or other fees related to these transactions.

N O T E S T O T H E F I N A N C I A L S T A T E M E N T S ( U N A U d I T E d ) | Six-month Periods Ended June 30, 2017 and 2016
54
During the periods ended June 30, 2017 and 2016, the Funds received the following income from funds managed by related parties:
DIM PRIVATE FUNDS JUNE 30 DISTRIBUTIONS FROM UNDERLYING FUNDS $
Bond 2017 2,229,7822016 2,108,192
Corporate Bond 2017 3,921,7582016 920,851
Balanced 2017 1,331,7382016 1,238,406
Monthly Distribution Income 2017 272,9422016 297,141
Monthly Distribution Growth 2017 164,4152016 233,500
For the periods ended June 30, 2017 and December 31, 2016, some Funds recorded an amount receivable from the Manager:
DIM PRIVATE FUNDS AMOUNT RECEIVABLE $
Bond June 30, 2017 –December 31, 2016 1,947
Corporate Bond June 30, 2017 –December 31, 2016 5,094
Balanced June 30, 2017 14,974December 31, 2016 10,223
International Equity June 30, 2017 12,588December 31, 2016 –
For the periods ended June 30, 2017 and December 31, 2016, no other Fund recorded an amount receivable from the Manager. The accrued expenses recorded in the Statement of Financial Position were incurred with the Manager.
7. Other Payments Paid to BrokersThe amount of soft dollars, which represents the amount paid or payable for goods and services other than order execution, are as follows:
DIM PRIVATE FUNDS JUNE 30, 2017 $
JUNE 30, 2016 $
Canadian Equity Growth 21,497 39,628Canadian Small Cap Equity 63,252 29,703U.S. Equity (for taxable accounts) 54,959 48,053U.S. Equity (for non taxable accounts) 16,387 15,541International Equity 37,255 42,245
No additional commissions were paid to brokers.
8. Financial Instruments DisclosuresHierarchy of Financial Instruments Measured at Fair ValueThe fair value measurement of financial instruments is determined using the following three levels of the fair value hierarchy:
Level 1 – Measurement based on quoted prices (unadjusted) in active markets for identical assets or liabilities;
Level 2 – Valuation techniques based primarily on observable market data;
Level 3 – Valuation techniques not based primarily on observable market data.
If inputs of different levels are used to measure the fair value of an asset or liability, the classification within the hierarchy is based on the lowest level input that is significant to the measurement of fair value.
Measurement MonitoringThe Manager is responsible for establishing the fair value measurements included in the Funds’ financial statements, including Level 3 measurements. The Manager obtains prices from a pricing agency and monitors and analyzes these prices on a daily basis. A Measurement Monitoring Committee ensures that appropriate operating procedures and a proper monitoring structure are in place and followed. Monthly monitoring reports are prepared and sent to each member for approval. The Measurement Monitoring Committee verifies the measurements on a monthly basis. On a quarterly basis, this Committee examines and approves the Level 3 measurements after obtaining confirmation of the measurements from each portfolio manager, as needed. The Committee signs off on any adjustments made to prices or estimates provided by the pricing agency.
Classification within the Fair Value HierarchyA change in the fair value measurement method could result in a transfer between levels. The Funds’ policy is to record the implications of the transfers between levels on the date of the event or change in circumstances behind the transfer.
The following types of investments may be classified as Level 3 if their prices are no longer based on observable inputs.
a) Money Market SecuritiesMoney market securities primarily include public sector and corporate securities. The inputs that are significant to valuation are generally observable. Public sector money market securities guaranteed by the federal or provincial government have been classified as Level 1. Other money market securities have been classified as Level 2.
b) EquitiesEquities are classified as Level 1 when the security is actively traded and a reliable price is observable. Certain equities do not trade frequently and therefore observable prices may not be available. In such cases, fair value is determined using observable market data and the fair value is classified as Level 2, unless the determination of fair value requires significant unobservable data, in which case the measurement is classified as Level 3. Unlisted warrants are generally classified as Level 2.
c) Index-Based InvestmentsIndex-based investments are classified as Level 1 when the security is actively traded and a reliable price is observable.
d) BondsPublic sector bonds guaranteed by the federal or provincial government are classified as Level 1. Corporate bonds, which are valued using models with inputs including interest rate curves, credit spreads and volatilities, are usually classified as Level 2.
e) Mortgage-Backed Securities and Asset-Backed Securities Mortgage-backed securities and asset-backed securities consist primarily of corporate securities, which are valued using models with inputs including interest rate curves, credit spreads and volatilities. Since the inputs that are significant to valuation are generally observable, mortgage-backed securities and asset-backed securities are usually classified as Level 2.
f) Investment FundsPublic investment funds are classified as Level 1 when their prospectus is unrestricted and their price is reliable and observable. Since some investment funds are not public, their price is determined using observable market data and fair value is classified as Level 2, unless the measurement of fair value requires the use of significant unobservable inputs, in which case it is classified as Level 3.
g) Derivative Financial InstrumentsDerivative financial instruments consist of foreign currency forward contracts for which counterparty credit spreads are observable and reliable or for which the credit-related inputs are determined to be significant to fair value, are classified as Level 2.

N O T E S T O T H E F I N A N C I A L S T A T E M E N T S ( U N A U d I T E d ) | Six-month Periods Ended June 30, 2017 and 2016
55
Detailed information concerning the fair value hierarchy of each Fund is available in their respective notes to the financial statements. For securities classified as Level 3, the valuation techniques and assumptions are also presented in their respective notes.
Management of Risks Arising from Financial InstrumentsDuring the course of their activities, the Funds are exposed to a variety of risks associated with financial instruments such as market risk (including currency risk, interest rate risk and price risk), concentration risk, credit risk and liquidity risk. The overall strategy of the Funds’ risk management focuses on the unpredictability of financial markets and optimizes the Funds’ financial performance. Most investments involve a risk of loss.
The Manager is responsible for the Funds’ risk management and for selecting and monitoring portfolio sub-advisors.
The Manager compares the performance of the Funds with benchmark indexes on a monthly basis. This analysis is reviewed quarterly by the Monitoring Committees Discretionary Management. The Manager also ensures that the Funds’ investment policies are followed and writes a compliance report, which is also reviewed on a quarterly basis by this Committee.
Every quarter, the Manager discusses the results of the performance analyses with the portfolio sub-advisors and organizes yearly meetings with them in order to keep abreast of any changes in their investment practices.
Market RiskMarket risk is the risk that the fair value or future cash flows associated with a financial instrument will fluctuate because of a change in the relevant risk variables, such as interest rates, exchange rates and equity prices. The Funds’ market risk is managed through diversification of the investment portfolio’s exposure ratios.
Currency RiskCurrency risk is the risk that the fair value or future cash flows of a financial instrument will fluctuate as a result of changes in foreign exchange rates.
Currency risk is composed of monetary items (usually including cash, receivable amounts in foreign currencies, investments in fixed-income and money market securities) and non-monetary items (usually including investments in equities and investment funds). The non-monetary assets are classified according to the currency in which the security was purchased.
The Funds are exposed to currency risk by holding assets and liabilities denominated in currencies other than the Canadian dollar, the Funds’ functional currency, as the value of the securities denominated in other currencies will fluctuate according to the prevailing exchange rates.
The Funds’ exposure to currency risk is shown based on the carrying value of financial assets and financial liabilities (including the notional amount of foreign currency forward contracts and foreign currency futures, if any).
When the Canadian dollar decreases in relation to foreign currencies, the value of foreign investments increases. Conversely, when the value of the Canadian dollar increases, the value of foreign investments decreases.
Interest Rate RiskInterest rate risk is the risk that the fair value or future cash flows of a financial instrument will fluctuate as a result of changes in market interest rates.
Interest rate risk occurs when an investment fund invests in interest-bearing financial instruments. Generally, the value of these securities increases if interest rates decrease, and decreases if interest rates increase. The interest rate risk is managed by calculating and monitoring the portfolio duration and the exposures on different points along the interest rate yield curve. The Funds also hold a limited amount of cash subject to variable interest rates, which expose them to cash flow interest rate risk.
Price RiskPrice risk is the risk that the fair value or future cash flows of a financial instrument will fluctuate as a result of changes in market price, other than those arising from currency risk or interest rate risk.
The portfolio advisor plans to manage this risk by carefully selecting securities and other financial instruments, in accordance with defined limits. The maximum risk resulting from financial instruments is determined by the fair value or contract value of the financial instruments. The Funds’ financial instruments are exposed to price risk arising from uncertainties about the future prices of instruments.
Concentration RiskConcentration risk arises as a result of the concentration of exposures within the same category, whether it is geographical location or industry sector. For Funds with an international investment strategy, the concentration by geographic location is presented according to, among other things, the country of incorporation or region. For Funds with a domestic investment strategy, the concentration by industry sector is presented according to, among other things, their investments in finance, health care or energy sectors, etc. The concentration risk is managed through portfolio diversification within the framework of the Funds’ objective and strategy.
Credit RiskCredit risk is the risk that the financial instrument counterparty will be unable to pay the full amount at maturity. The Funds’ credit risk is managed through an independent credit analysis from the Manager/sub-advisor, in addition to credit rating agencies analysis.
Financial Instrument TransactionsThe Funds are exposed to credit risk. The Funds’ and counterparty’s respective credit risks are taken into account when determining the fair value of financial assets and liabilities. Transactions are settled or paid on delivery using approved brokers. The risk of default is considered limited as delivery of the securities sold is made once the broker has received payment.
Payment is made on a purchase once the securities have been received by the broker. The trade will fail if either party fails to meet its obligations.
However, there are risks involved in dealing with custodians or prime brokers who settle trades and, in rare circumstances, the securities and other assets deposited with the custodian or broker may be exposed to credit risk with regard to such parties. In addition, there may be practical problems or time delays associated with enforcing the Funds’ rights to their assets in the case of an insolvency of any such party.
The investment grade for fixed-income securities and money market securities is rated by credit rating agencies, such as the Dominion Bond Rating Service (DBRS), Standard & Poor’s and Moody’s. In cases where the credit rating agencies do not agree on a credit rating for fixed-income securities and money market securities, they will be classified following these rules:
• If two credit ratings are available, but the ratings are different, the lowest rating is used;
• If three credit ratings are available, the most common credit rating is used;
• If all three credit rating agencies have different ratings, the middle credit rating is used.
The credit rating is then converted to DBRS format. Generally, the greater the credit rating of a security, the lower the probability of it defaulting on its obligations.
Derivative financial instruments are financial contracts whose value depends on underlying assets, including interest rates and foreign exchange rates. The vast majority of derivative financial instruments is negotiated by mutual agreement between the Funds and their counterparties, and includes foreign currency forward contracts. Other transactions are carried out as part of trades and mainly consist of futures contracts.
Liquidity RiskLiquidity risk is the risk that the Fund will encounter difficulty in meeting obligations associated with financial liabilities.
The Funds are exposed to daily cash redemptions of units. Most of their assets are therefore invested in liquid investments (i.e. investments that trade in an active market and that can be readily disposed of ).
Some Funds may invest in derivative financial instruments, debt securities and unlisted equity investments that are not traded in an active market. As a result, some Funds may not be able to quickly liquidate their investments at amounts approximating their fair values, or be able to respond to specific effects such as deterioration in the creditworthiness of any particular issuer.
Units are redeemable on demand at the holder’s option. However, the Manager does not expect that the contractual maturity disclosed will be representative of the actual cash outflows, as holders of the instruments typically retain them for a longer period.

N O T E S T O T H E F I N A N C I A L S T A T E M E N T S ( U N A U d I T E d ) | Six-month Periods Ended June 30, 2017 and 2016
56
The majority of the remaining liabilities are due within the next three months. Balances due within 12 months equal their carrying balances as the impact of discounting is not significant.
Management of Risks Associated with UnitsUnits issued and outstanding are considered as the Funds’ capital. The Funds are not subject to specific capital requirements concerning subscription and redemption of units, other than certain minimum subscription requirements. Unitholders are entitled to require payment of the net asset value per unit for all or any of the units they hold by giving written notice to the Manager. The written notice must be received within the prescribed time period. Moreover, the notice must be irrevocable and the signature thereon must be guaranteed by a Canadian chartered bank, a trust company or an investment dealer acceptable to the Manager. Units are redeemable for cash equal to a pro rata share of the Funds’ net asset value.
Additional InformationFor further information on the risks associated with financial instruments to which each Fund is exposed, refer to the section “Notes to the Financial Statements – Specific Information” pertaining to each Fund.
9. Income Taxes – Loss Carry ForwardThe Funds’ capital losses and non-capital losses determined for tax purposes as at December 15, 2016 are as follows:
DIM PRIVATE FUNDS CAPITAL LOSSES NON-CAPITAL LOSSES
AMOUNT $
AMOUNT $
EXPIRATION
Canadian Equity Growth 3,991,543 – –Completion Strategy 5,992,784 – –
10. Filing ExemptionEach DIM Private Fund avails itself of the exemption from filing its financial statements to the concerned securities commissions, in accordance with section 2.11 of Regulation 81-106 Respecting Investment Fund Continuous Disclosure.

M O N T R É A L 514 286-3180 1 877 286-3180
Q U É B E C 418 653-7922 1 800 653-7922
O T T A W A / G A T I N E A U 613 567-2885 1 866 567-2885
d E S J A r d I N S P r I V A T E M A N A G E M E N T . C O M