Teachers' and pupils' scientific dialogue in learning about ...
Upload
universityfordevelopmentstudiesCategory
view
2download
0
Research ArticleDilemma of Basic School Pupils in Northern Ghana with respectto Their Learning Context
Hakim Abdallah,1 Moses Naiim Fuseini,2 Amadu Musah Abudu,3 and Yusif Nuhu4
1 Ghana Education Service, Savelugu, Ghana2 Faculty of Integrated Development Studies, University for Development Studies, Wa, Ghana3 Faculty of Education, University for Development Studies, P.O. Box TL 1350, Tamale, Ghana4Tamale Polytechnic, Tamale, Ghana
Correspondence should be addressed to Amadu Musah Abudu; [email protected]
Received 26 March 2014; Revised 12 August 2014; Accepted 17 August 2014; Published 1 September 2014
Academic Editor: Stephen P. Heyneman
Copyright © 2014 Hakim Abdallah et al. This is an open access article distributed under the Creative Commons AttributionLicense, which permits unrestricted use, distribution, and reproduction in any medium, provided the original work is properlycited.
Lately, basic school pupils have performed poorly in the Basic Education Certificate Examination (BECE) as well as in their endof term examinations and this necessitated an enquiry into the phenomenon. The study used the cross-sectional study design. Thesample size was 195. The study collected data using a questionnaire. Data analysis involved using descriptive statistics. The studyfound that largely pupils from academically performing and nonacademically performing schools have similar perceptions aboutcauses of poor academic performance. Again, the combined effect of home and school environmental factors emerged as the majorcontributor to poor academic performance. The study recommends that providing a conducive home environment for the pupils,tackling pupil and teacher related factors, would help to ensure that poor academic performance is a thing of the past.
1. Introduction
For students to achieve high academic laurels, they need tobelieve that they can learn and that what they are learningis useful, relevant, and meaningful for them and for thesociety at large [1]. The learning environment must thereforebe conducive for students to be able to achieve this goal.The learning environment is twofold, home and school.The parents or guardians of these pupils are responsible forproviding the right home environment that will facilitateeffective learning for their wards [2], so are the schoolauthorities.This, however, might not continue as most pupilsare unable to pass their exams with distinction. This isattributable to certain hindrances they meet as they learn.
In this regard, in Nigeria, both parents and governmentare in total agreement that their huge investment in educationis not yielding the desired results as the Senior SecondaryCertificate Examination results have continuously shown thatstudents are performing poorly [3]. For example, the passrate between 2004 and 2007 has not gone beyond 47%for both Mathematics and English [3]. Similarly, the pupils’
performance at the Basic Education Certificate Examination(BECE) in the Northern Region of Ghana is erratic and hasnot exceeded 50%pass rate since 2007 to date. For instance, in2007, the pass rate was 47.6%which declined to 40.1% in 2008and further to 39.8% in 2009 [4].Thepass rate for the BECE in2010, however, experienced a slight increase to 46.4%, but thefigure consistently dropped to 41.1% in 2012 [4]. The criticalissue is what is causing this phenomenon in spite of theefforts put in by the government and nongovernmental orga-nizations (NGOs) to boost performance at the BECE in theNorthern Region. Some of the NGOs working in this regardinclude the Federation of African Women in Education, theCampaign for Female Education, and Regional Advisoryand Information Network [5]. Similarly, the poor academicperformance in BECE at the regional level is replicated at thestudy locations. In the central Gonja district, in 2008, the passrate for the BECE was 36.5% which dipped to 34.2% in 2010and further to 29.8% in 2013 [4] and the same is reflectedin pupils’ end of term examinations. Similarly, in the Karagadistrict, in 2010, the pass rate for the BECE was 46.3% whichdropped to 39.3% in 2012 and further to 29.4% in 2013 [4].
Hindawi Publishing CorporationEducation Research InternationalVolume 2014, Article ID 140737, 13 pageshttp://dx.doi.org/10.1155/2014/140737
2 Education Research International
The issue is what could be accounting for this decline inacademic performance.
This phenomenon of poor academic performance ofpupils has sparked off series of research to find out thelearning environmental factors that might trigger this sit-uation in order to develop strategies to arrest the canker.Many of those studies have considered the learning factorsfrom the perspective either of the home environment or ofthe school environment. The variables in the home learningenvironment usually investigated include family structure,parental involvement, socioeconomic status of parents, andlevel of education of parents [6–10]. Studies on schoolenvironmental factors usually centred on teacher qualifica-tion, teacher availability, class size, availability of teachingand learning materials, monitoring, contact hours, schoolownership (i.e., private or public),motivation of teachers, andteachers absenteeism/commitment to duty [11–15] neglectingthe home based factors. Nonetheless, these variables are notindependent of one another as they all complement oneanother to influence effective learning, which triggers thephenomenon of poor academic performance. This createsa knowledge gap which this study seeks to fill. Equallyimportant is that the pupils are in a dilemma because theyare at a loss as both fronts that they can rely on to achieveacademic excellence are rather those that do not supporteffective learning, thereby causing their academic downfall.
Also, most of the studies on the learning environmentalfactors influencing academic success have focused on theuniversities and secondary schools [3, 11, 16–19] neglectingthe basic schools. Only few studies [10, 20, 21] have centredon basic schools pupils’ academic performance. For example,a study looked at academic performance at the basic school,but in that study only factors from the home environmentwere a matter of concern [10]. Similarly, a study was con-ducted on junior high school pupils’ residential needs andtheir academic performance [20]. This study also focusedbasically on the homebased factors of academic performance.This necessitates examining pupils’ learning from the jointperspective of the home and school environments at the basicschool level.
2. Literature Review
This section provides a discourse on learning, home learningenvironment, school learning environment, combined effectof home and school environmental factors on learning ofpupils and conceptual framework.
2.1. Learning. The environment in which learning occursmust be conducive. Such learning environments include thehome and school.
2.2. Home Learning Environment. Home learning environ-ment refers to conditions that prevail in the home orcommunity of a pupil that may hinder or promote learning.The discourse on home environmental factors that influencelearning primarily focuses on family structure, parentalinvolvement in pupils’ academic work, income level of family,
and parental level of education. The empirical lines ofevidence of the above areas are below.
Family structure is an important variable that influencesthe learning of pupils at home [6, 10, 18] but some studiesfound contrary evidence in that regard [22]. With respectto family as a factor, in a study in the Wa Municipality ofGhana, it was discovered that pupils who come from two-parent homes performed academically better than those thatare from single-parent homes [10]. This was because thetwo-parent families provided better learning environmentfor their children. Likewise, other researchers examined theeffects of family structure and parenthood on the academicperformance of Nigerian university students [6]. The resultsshowed that significant differences existed between the aca-demic performance of students from single-parent family andthose from two-parent family structures. Furthermore, theimpact of family structure on the academic performance ofuniversity students was studied and significant differencesin academic performance of male and female students com-pared on the two types of family structures were found [18].On the contrary, a discovery was made that there is nosignificant difference between the academic performance ofstudents from single-parent families and those from two-parent families [22]. This literature suggest that findings onthe family as one of the causes of poor academic performanceis not yet conclusive.
Research has indicated that high level of parental involve-ment in children’s education positively affects their learningpotentials [7–10, 23]. For example, it was discovered thatparents that are very much involved in the educational activ-ities (i.e., engagement in homework and attending parent-teacher association meetings) of their children enable themto have good academic performance [10]. In this regard, it ispointed out that the poor academic performance of childrenemanates from parents lack of proper supervision of theirwards’ homework [7]. Nonetheless, in a study in Nigeria, itwas found that parents were not involved in any meaningfulway in the literacy development of beginning readers [24].This situation at home spells doom for the child since parentalinvolvement is critical to academic performance.
Another home environmental factor that influences edu-cational performance is income level of the family [25–28].For instance, it was discovered that students’ academic per-formance correlates with locality of residence and householdincome [25]. Similar studies found that parents’ educationand household income are moderate to strong predictors ofacademic achievement [26]. Again, a positive relationshipbetween family income and academic achievement of highschool students was found [27]. Likewise, parental economicstatus was yet discovered as a significant factor that influencesa child’s academic performance [28]. This implies that pupilswhose parents were poor had poor academic performanceas they are unable to create a good learning environmentfor their wards. However, it is not always the case thatlower parental income is associated with negative learningenvironment for pupils as some pupils rise above the oddsto succeed.
Also, parental education is considered a major deter-minant of a child’s academic performance as it influences

Education Research International 3
the pupils’ learning attitude [2, 28]. In the case of somestudies, they found that parents’ education can affect theachievement drive of their children in their academic endeav-ours [2]. More so, in a study of primary five pupils in Nigeria,it came to light that parental level of education influencedacademic performance [28].Thismeans that parents with lessor no education are likely to have their wards performingpoorly academically. Nonetheless, some people with illiterateparents have excelled academically which challenges theseempirical findings.
2.3. School Learning Environment. School learning environ-ment encompasses the factors within the school that may ormay not provide suitable conditions for the promotion ofeffective teaching and learning. Researchers on this themehave had different focuses as illustrated in the empirical linesof evidence presented below.
First and foremost, teacher qualification has been consis-tently found to impact the academic performance of pupils[13]. A teacher who lacks the professional skill will beunable to deliver in class, which will induce poor student’sperformance. A teacher who does not have both the academicand the professional qualifications would undoubtedly havea negative influence on the teaching and learning of a givensubject [13]. It is further argued that a teacher who isacademically and professionally qualified, but works underunfavourable conditions of service, would be less dedicatedto his work and thus be less productive than a teacher who isunqualified but works under favourable conditions of service.In a particular study, it was discovered that teachers andstudents blame each other for poor academic performance[3]. In that study, while the teachers noted their qualificationdid not account for poor academic performance of students,the students, however, noted that it accounted for the pooracademic performance.
Furthermore, available literature on school environmen-tal factors that cause poor academic performance has foundteachers’ drive as a significant variable [15, 29]. In a particularstudy, it was argued that drive is a critical factor that influ-ences a teacher’s work attitude and that a highly motivatedperson puts in the greatest effort into his or her job [15].The effect of such efforts is that the students will benefitfrom effective teaching which has the likelihood of mak-ing them improve their academic performance. Similarly,another study revealed that lack of drive and professionalcommitment produces poor attendance and unprofessionalattitudes towards students, which, in turn, affects pupils’performance academically [30]. This kind of unprofessionalattitudes may lead to loss of many instructional hours whichcannot be regained.
Teaching methods adopted by teachers during instruc-tions in classes have been found to greatly influence thelearning of students [3, 27]. In a study in Nigeria, it wasfound that teachers indicated that method of teaching maycause poor academic performance while the students helda contrary opinion [3]. However, the studies in Benue,Nasarawa, and Plateau states in Nigeria provided definiteresults [24]. The study revealed that teachers did not have
essential literacy skills and so do not use research-provenand result-oriented strategies in executing the work. Thissituation implies that the understanding of pupils in thelesson is hampered. The end effect is that it will lead to poorperformance in literacy.
Moreover, teaching and learning materials availabilityinfluences the level of academic performance. Where thesematerials (i.e., textbooks, laboratory equipment, carpentrytools, etc.) are not available, it can cause low academicperformance as teaching and learning becomes ineffective. Itis noted that the availability and use of teaching and learningmaterials affect the effectiveness of a teacher’s lessons [15].This is because the use of teaching and learningmaterials willinfluence pupils’ comprehension of lessons. The creative useof a variety of media was found to increase the chance thatthe students would learn more, keep better what they learn,and improve their performance on the skills that they areto develop [31]. Furthermore, it is reported that children arecapable of understanding abstract ideas if they are providedwith enough materials and concrete experience with thephenomenon they are to understand [32]. Nonetheless, acontrary discovery was made in a particular study [3]. Inthat study, the writer found that learning materials did notinfluence poor academic performance. This challenges thegenerally held view that teaching and learning materials arefundamental causes of poor academic performance.
Numerous studies have indicated that large classes areusually associated with challenges such as crowding of class,poor sitting arrangements, and students feeling isolated andless motivated [33–35]. Other studies examined the effectsof class size and found that students in the smaller classesperformed better academically than those from larger classsizes [15, 36–40]. For instance, it was discovered that studentsin the smaller classes achieved test scores that were 0.45 and0.56 standard deviations higher than their peers in the largerclasses, on the mathematics and reading tests, respectively[40]. Similarly, in a study in Nigeria, the results showedthat large class size negatively affects students’ academicperformance [41]. In the case of [15], the author foundthat class size is an important determinant of academicperformance and that studies have indicated that schoolswith smaller class sizes do better academically than schoolswith larger class sizes. Likewise, in a study in Ghana, it wasconcluded that a class size above 40 has negative effects onstudents’ achievement [42]. In support of the effect of classsize on academic performance, another researcher addedthat, since children have differences in drive, interests, andabilities and that they also differ in health, personal and socialadjustment, and creativity, generally good teaching is bestdone in classes with smaller numbers that allow for personalattention [31]. The school’s physical structure has been foundto influence pupils’ academic performance. In this regard, theentire unattractive physical structure of the school buildingcould demotivate learners to achieve less academically. Thisis what is referred to as learner’s environment mismatch[43]. According to the author, this promotes poor academicperformance.
Another important variable that influences learning iseffective monitoring and supervision of teachers’ activities
4 Education Research International
Home environmental factors
School environmental factors
Poor academic performance
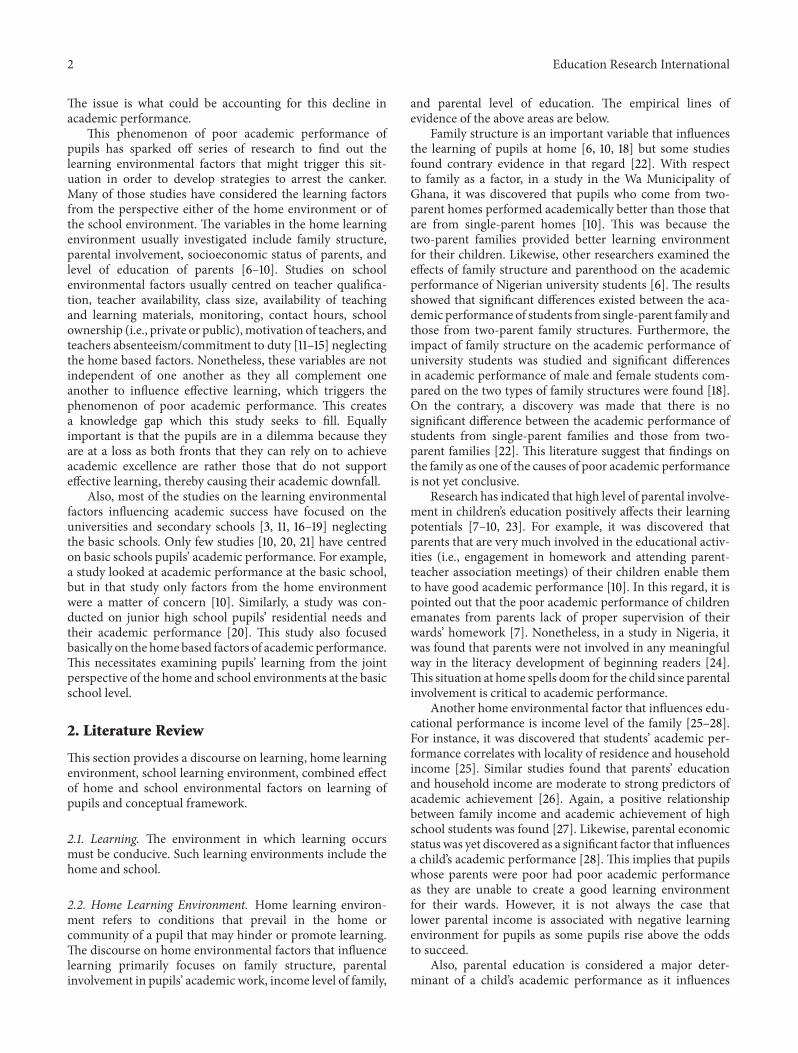
Figure 1: Conceptual framework on causes of poor academicperformance. Source: authors’ construct (2014).
[12, 14]. Accordingly, it is argued that effective supervision ofinstruction can improve teaching and learning quality in theclassroom [12].This denotes that if teaching is not supervisedeffectively, teachers may not do their duties diligently andthis might lead to pupils performing poorly academically.In addition, it is concluded in another study that academicperformance was better in private schools than in publicschools because of more effective supervision of work [14].This illustrates that inadequate supervision triggers pooracademic performance of pupils since teachers may relax inthe performance of their responsibilities.
2.4. Combined Effect of Home and School EnvironmentalFactors on Learning of Pupils. Most of the studies on factorsinfluencing learning have focused either only on home learn-ing environment [7, 8, 10] or on school learning environment[11, 40], but not both. Nonetheless, these factors combinein some form to stimulate effective learning of pupils. Thepupils actually find themselves in a state of dilemma as theyare between dicey situations. That is, at home, their learningenvironment is not right for them to conduct their learningeffectively and neither is the school learning environment. Inexamining pupils’ academic performance which shows thatthey are in a state of dilemma, it is critical at this junctureto make sure that the right measures are in place to arrestthe poor academic performance of pupils. In relation to theabove, it is intimated that home-school partnership is criticalin helping children to become fluent readers [44, 45]. Thisclearly illustrates that pupils are in a dilemma as they will failto perform academically if their learning environments bothat home and at school are not right for academic work.
2.5. Conceptual Framework. The conceptual framework ofthis study is in Figure 1. From the figure, the key compo-nents are home environmental factors, school environmentalfactors, and poor academic performance. On the issue ofhome environmental factors (See Section 2.2 for details) ascauses of poor academic performance, two arrows radiatefrom it ending up at poor academic performance. The firstarrow leads directly to poor academic performance. Thisarrow depicts that only home environmental factors cantrigger poor academic performance of pupils (i.e., the one-dimensional cause of the phenomenon-the earlier perspec-tive). That is, when certain conditions in the house do notenhance a child’s ability to learn at home, this can lead to
the child not performing academically. In terms of the schoolenvironmental factors (See Section 2.3 for details), the arrowsare also twofold.These two arrows both lead to poor academicperformance but from different perspectives. One of thearrows leads directly to poor academic performance. Thisillustrates that only school environmental factors account forpoor academic performance which is the old perspective ofcauses of poor academic performance. The second arrow forboth home and school environmental factors demonstratethat none of the factors act alone in accounting for pooracademic performance. The arrows radiate from both homeand school environmental factors converging at a point andthen leading to poor academic performance. This showsthat the combined effect of both the conditions at homeand those at school is what engineers the phenomenon ofpoor academic performance of pupils at the basic schoollevel. This is the new perspective that this paper propagates.This situation creates a dilemma for the pupils as they facedaunting challenges towards their academic path.
3. Methodology
3.1. Study Design. This study used the cross-sectional studydesign. A cross-sectional study design is the kind of studydesign that is best suited to finding out the prevalence ofa phenomenon or problem by taking a cross-section of thepopulation [46]. This research design was right for this studybecause it involved collecting data from pupils and teachersat only one time.
3.2. Sampling Design. Purposive sampling method aided inselecting the central Gonja and Karaga districts from the26 districts in the Northern Region of Ghana as the samplesites. The basis for the use of purposive sampling was toselect districts with some schools consistently recording lowperformance in the BECE and, at the same time, whileothers are having good performance in the same exam (seeTable 1 for details). The schools in the central Gonja andKaraga districts were stratified into academically performingjunior high schools (JHS) and nonacademically performingschools. In all, there were 13 academically performing and 19nonacademically performing schools constituting a samplingframe of 32 schools which were obtained from the centralGonja and Karaga districts education offices. Then simplerandom samplingwas applied in the selection of eight schoolsfrom each of the stratum on proportional basis to constitutethe sample schools. Three of the sampled JHS were fromacademically performing schools and the remaining fivefrom nonacademically performing schools. Simple randomsampling was used in selecting JHS two pupils (i.e., grade8 pupils) who are performing poorly from both schoolcategories to form part of the sample. This was possiblethrough the data obtained from pupils’ report cards from theselected schools after permission was granted by the headteachers. The teachers in each of the study schools were alsoselected using simple random sampling. The sample size forthe study was 195 respondents (see Table 2 for details of thesample), which was determined based on the judgement ofthe researchers.

Education Research International 5
Table 1: Performance of Basic Schools in 2012 BECE in some Selected Districts in Northern Region of Ghana.
NumberCentral Gonja district Karaga district Bunkpurugu/Yunyoo district
Name of school 2012 BECE 2012 BECE Name of school 2012 BECE% Pass % Pass % Pass
1 Chama D/A JHS 100.0 Karaga L/A 84.6 Nasuan J.H.S 100.02 Yapei Presby JHS 100.0 Ishadia 60.5 Kpanlori J.H.S 100.03 Miracle Days Inst. JHS 80.0 Pishigu 50.0 Temmaa J.H.S 100.04 Kusawgu D/A JHS 89.5 Sung 3.7 Konchian-Gberuk J.H.S 100.05 Buipe Academy JHS 73.2 Tamaligu 13.2 Nabopelik 100.06 Yapei D/A JHS 72.6 Bagurugu 62.2 Salimbouku “A” J.H.S 98.87 Fufulso Presby JHS 84.4 Tonzg 29.7 Nakpanduri A/G J.H.S 97.58 Sankpalat. JHS 61.9 Yemokaraga 26.7 Nakpanduri Presby J.H.S 95.69 SHARI D/A JHS 34.1 Shellilanyili 46.2 Kambagu J.H.S 95.010 Mpaha D/A JHS 29.1 Nuri-Islam 21.7 Boaterigu J.H.S 92.011 Buipe S.D.A. JHS 29.1 Binduli 10.0 Bunkpurugu D/A J.H.S 89.112 Buipe D/A JHS 7.0 Gunayili 0.0 Bimbagu J.H.S 88.113 Kpabuso D/A JHS 16.7 Nyong 61.0 Gbingbanmon J.H.S 80.014 Kabilpe JHS 0.0 Namburugu 0.0 Nakpanduri D/A J.H.S 77.415 Kpasera D/A JHS 0.0 Nakundugu 16.7 Salimbouku “B” J.H.S 71.816 Buipe Bridge JHS 22.7 Jimbale J.H.S 67.717 Mpaha T.I. JHS 18.3 Guangbiang J.H.S 62.518 Kinkangu J.H.S 60.519 Pagnatik J.H.S 51.920 Bunkpurugu Zongo J.H.S 50.021 Gbankurugu J.H.S 45.822 Jilig J.H.S 44.423 Binde J.H.S 43.224 Najong number 1 “A” 39.425 Najong number 2 26.826 Yunyoo J.H.S 24.127 Gbankoni J.H.S 15.628 Kambatiak J.H.S 10.529 Najong number 1 “B” 4.530 Bagamsa J.H.S 0.031 Academically performing schools totals 8 532 Nonacademically performing schools totals 9 10Source: Central Gonja and Karaga district education directorates (2014).∗A school with less than 50% pass rate is considered a nonacademically performing school.∗A school with 50% or more pass rate is considered an academically performing school.
Table 2: Sample size distribution.
Respondentcategory
School categoryAcademicallyperforming schools
Nonacademicallyperforming schools
Male Female Male FemaleTeachers 20 10 20 15Pupils 40 20 30 40Total 195
3.3. Tools for Data Collection. The study obtained primarydata from the respondents using a questionnaire. The ques-tionnaire was in two categories; one was for the teachers
and the other for the pupils. The questionnaire for theteachers was divided into two sections. The first sectionwas made up of the background data. The second sectioncomprised school factors based on causes of poor academicperformance, which were rated on a five-point Likert scaleranging from strongly disagree (1) to strongly agree (5).In the case of the questionnaire for the pupils, it also hastwo parts. The first part concentrates on the backgrounddata of the pupils. The second, but last section, make upitems on causes of poor academic performance from boththe home and school environments which were rated ona five-point Likert scale ranging from strongly disagree (1)to strongly agree (5). Permission was sought from GhanaEducation Service directorate of the centralGonja andKaraga
6 Education Research International
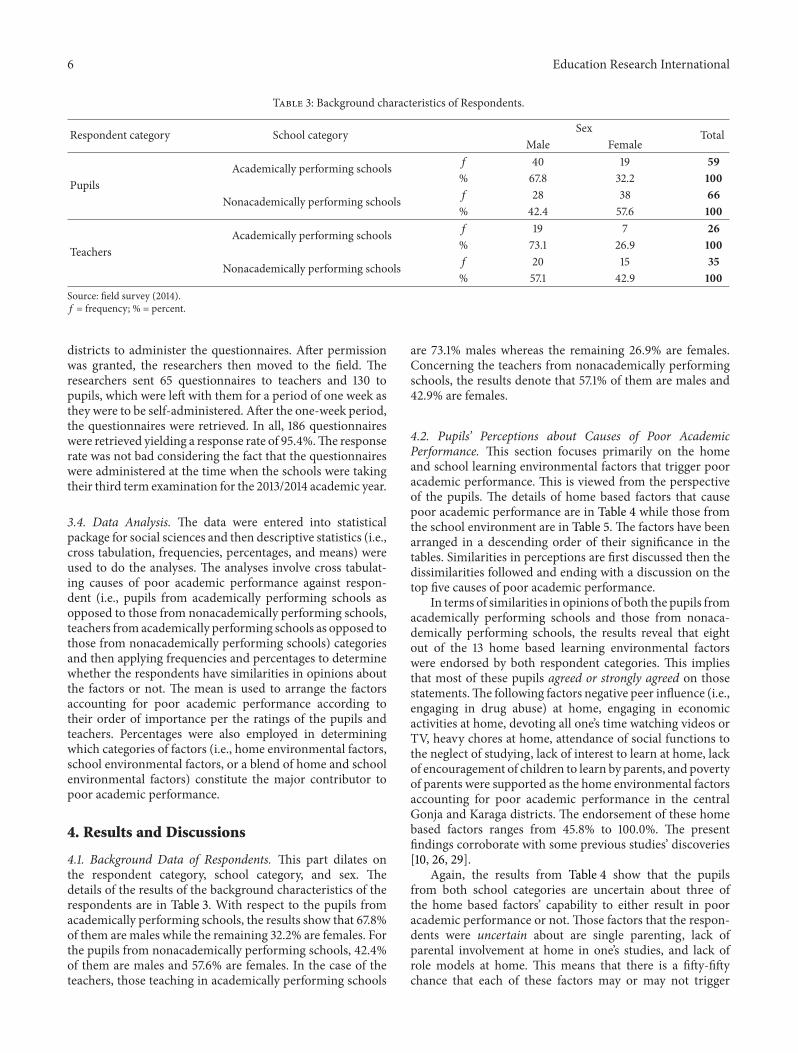
Table 3: Background characteristics of Respondents.
Respondent category School category Sex TotalMale Female
PupilsAcademically performing schools 𝑓 40 19 59
% 67.8 32.2 100
Nonacademically performing schools 𝑓 28 38 66% 42.4 57.6 100
TeachersAcademically performing schools 𝑓 19 7 26
% 73.1 26.9 100
Nonacademically performing schools 𝑓 20 15 35% 57.1 42.9 100
Source: field survey (2014).𝑓 = frequency; % = percent.
districts to administer the questionnaires. After permissionwas granted, the researchers then moved to the field. Theresearchers sent 65 questionnaires to teachers and 130 topupils, which were left with them for a period of one week asthey were to be self-administered. After the one-week period,the questionnaires were retrieved. In all, 186 questionnaireswere retrieved yielding a response rate of 95.4%.The responserate was not bad considering the fact that the questionnaireswere administered at the time when the schools were takingtheir third term examination for the 2013/2014 academic year.
3.4. Data Analysis. The data were entered into statisticalpackage for social sciences and then descriptive statistics (i.e.,cross tabulation, frequencies, percentages, and means) wereused to do the analyses. The analyses involve cross tabulat-ing causes of poor academic performance against respon-dent (i.e., pupils from academically performing schools asopposed to those from nonacademically performing schools,teachers from academically performing schools as opposed tothose from nonacademically performing schools) categoriesand then applying frequencies and percentages to determinewhether the respondents have similarities in opinions aboutthe factors or not. The mean is used to arrange the factorsaccounting for poor academic performance according totheir order of importance per the ratings of the pupils andteachers. Percentages were also employed in determiningwhich categories of factors (i.e., home environmental factors,school environmental factors, or a blend of home and schoolenvironmental factors) constitute the major contributor topoor academic performance.
4. Results and Discussions
4.1. Background Data of Respondents. This part dilates onthe respondent category, school category, and sex. Thedetails of the results of the background characteristics of therespondents are in Table 3. With respect to the pupils fromacademically performing schools, the results show that 67.8%of them are males while the remaining 32.2% are females. Forthe pupils from nonacademically performing schools, 42.4%of them are males and 57.6% are females. In the case of theteachers, those teaching in academically performing schools
are 73.1% males whereas the remaining 26.9% are females.Concerning the teachers from nonacademically performingschools, the results denote that 57.1% of them are males and42.9% are females.
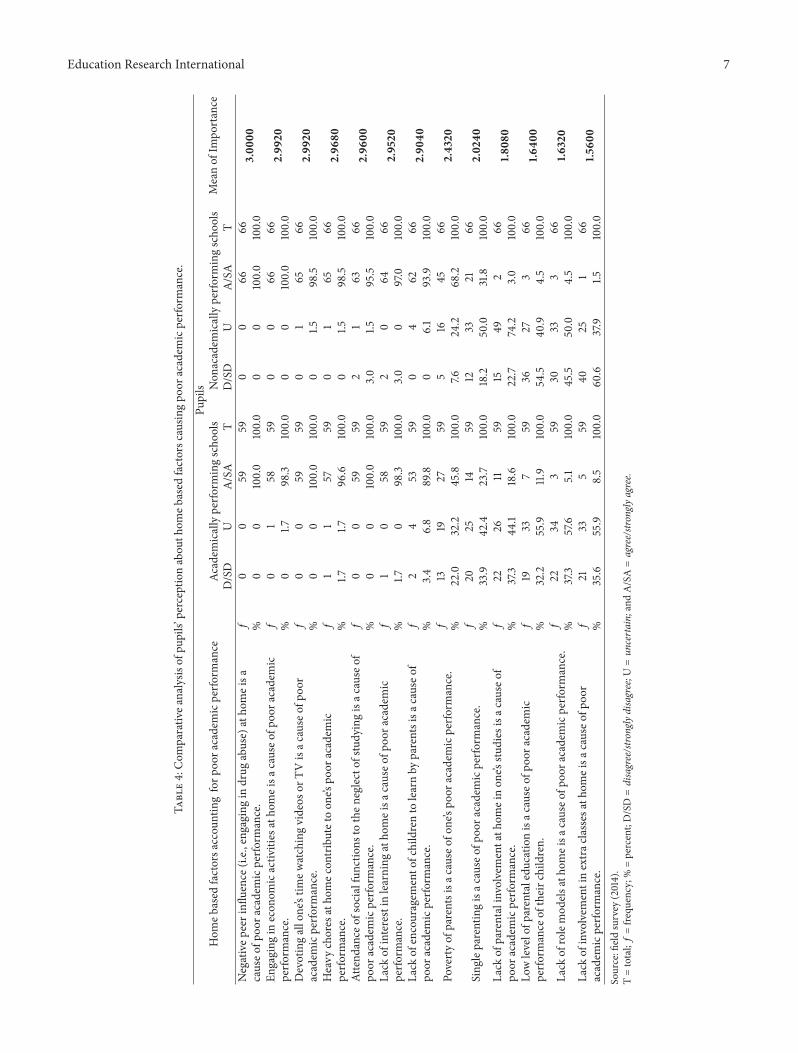
4.2. Pupils’ Perceptions about Causes of Poor AcademicPerformance. This section focuses primarily on the homeand school learning environmental factors that trigger pooracademic performance. This is viewed from the perspectiveof the pupils. The details of home based factors that causepoor academic performance are in Table 4 while those fromthe school environment are in Table 5. The factors have beenarranged in a descending order of their significance in thetables. Similarities in perceptions are first discussed then thedissimilarities followed and ending with a discussion on thetop five causes of poor academic performance.
In terms of similarities in opinions of both the pupils fromacademically performing schools and those from nonaca-demically performing schools, the results reveal that eightout of the 13 home based learning environmental factorswere endorsed by both respondent categories. This impliesthat most of these pupils agreed or strongly agreed on thosestatements.The following factors negative peer influence (i.e.,engaging in drug abuse) at home, engaging in economicactivities at home, devoting all one’s time watching videos orTV, heavy chores at home, attendance of social functions tothe neglect of studying, lack of interest to learn at home, lackof encouragement of children to learn by parents, and povertyof parents were supported as the home environmental factorsaccounting for poor academic performance in the centralGonja and Karaga districts. The endorsement of these homebased factors ranges from 45.8% to 100.0%. The presentfindings corroborate with some previous studies’ discoveries[10, 26, 29].
Again, the results from Table 4 show that the pupilsfrom both school categories are uncertain about three ofthe home based factors’ capability to either result in pooracademic performance or not. Those factors that the respon-dents were uncertain about are single parenting, lack ofparental involvement at home in one’s studies, and lack ofrole models at home. This means that there is a fifty-fiftychance that each of these factors may or may not trigger
Education Research International 7
Table4:Com
parativ
eanalysis
ofpu
pils’
perceptio
nabou
thom
ebased
factorsc
ausin
gpo
oracadem
icperfo
rmance.
Pupils
Meanof
Impo
rtance
Hom
ebased
factorsa
ccou
ntingforp
oora
cademicperfo
rmance
Academ
icallyperfo
rmingscho
ols
Non
academ
icallyperfo
rmingscho
ols
D/SD
UA/SA
TD/SD
UA/SA
TNegativep
eerinfl
uence(i.e.,engaging
indrug
abuse)atho
meisa
causeo
fpoo
racademicperfo
rmance.
𝑓0
059
590
066
663.00
00%
00
100.0
100.0
00
100.0
100.0
Engaging
inecon
omicactiv
ities
atho
meisa
causeo
fpoo
racademic
perfo
rmance.
𝑓0
158
590
066
662.99
20%
01.7
98.3
100.0
00
100.0
100.0
Devotingallone’stim
ewatchingvideos
orTV
isac
ause
ofpo
oracadem
icperfo
rmance.
𝑓0
059
590
165
662.99
20%
00
100.0
100.0
01.5
98.5
100.0
Heavy
chores
atho
mec
ontributetoon
e’spo
oracadem
icperfo
rmance.
𝑓1
157
590
165
662.96
80%
1.71.7
96.6
100.0
01.5
98.5
100.0
Attend
ance
ofsocialfunctio
nsto
then
eglectof
studyingisac
ause
ofpo
oracadem
icperfo
rmance.
𝑓0
059
592
163
662.96
00%
00
100.0
100.0
3.0
1.595.5
100.0
Lack
ofinterestin
learning
atho
meisa
causeo
fpoo
racademic
perfo
rmance.
𝑓1
058
592
064
662.9520
%1.7
098.3
100.0
3.0
097.0
100.0
Lack
ofencouragem
ento
fchildrento
learnby
parentsisa
causeo
fpo
oracadem
icperfo
rmance.
𝑓2
453
590
462
662.90
40%
3.4
6.8
89.8
100.0
06.1
93.9
100.0
Povertyof
parentsisa
causeo
fone’spo
oracadem
icperfo
rmance.
𝑓13
1927
595
1645
662.4320
%22.0
32.2
45.8
100.0
7.624.2
68.2
100.0
Sing
leparentingisac
ause
ofpo
oracadem
icperfo
rmance.
𝑓20
2514
5912
3321
662.0240
%33.9
42.4
23.7
100.0
18.2
50.0
31.8
100.0
Lack
ofparentalinvolvem
entath
omeinon
e’sstu
dies
isac
ause
ofpo
oracadem
icperfo
rmance.
𝑓22
2611
5915
492
661.8
080
%37.3
44.1
18.6
100.0
22.7
74.2
3.0
100.0
Lowlevelofp
arentaledu
catio
nisac
ause
ofpo
oracadem
icperfo
rmance
oftheirc
hildren.
𝑓19
337
5936
273
661.6
400
%32.2
55.9
11.9
100.0
54.5
40.9
4.5
100.0
Lack
ofrolemod
elsatho
meisa
causeo
fpoo
racademicperfo
rmance.𝑓
2234
359
3033
366
1.6320
%37.3
57.6
5.1
100.0
45.5
50.0
4.5
100.0
Lack
ofinvolvem
entinextrac
lasses
atho
meisa
causeo
fpoo
racadem
icperfo
rmance.
𝑓21
335
5940
251
661.5
600
%35.6
55.9
8.5
100.0
60.6
37.9
1.5100.0
Source:fieldsurvey
(2014).
T=total;𝑓=fre
quency;%
=percent;D/SD=disagree/stronglydisagree;U
=un
certain;andA/SA=agree/strongly
agree.
8 Education Research International
Table5:comparativ
eanalysis
ofpu
pils’
perceptio
nabou
tschoo
lbased
factorsc
ausin
gpo
oracadem
icperfo
rmance.
Teachers
Meanof
Impo
rtance
Scho
olbasedfactorsa
ccou
ntingforp
oora
cademicperfo
rmance
Academ
icallyperfo
rmingscho
ols
Non
academ
icallyperfo
rmingscho
ols
D/SD
UA/SA
TD/SD
UA/SA
TAteacherrushing
tocompletetop
icsisa
causeo
fpoo
racademic
perfo
rmance.
𝑓0
059
590
066
663.00
00%
00
100.0
100
00
100.0
100
Lack
ofadequatepreparationof
teachersbefore
comingto
teachisa
causeo
fpoo
racademicperfo
rmance.
𝑓0
059
590
066
663.00
00%
00
100.0
100
00
100.0
100
Lack
ofcommitm
ento
fteacherstotheirw
orkisac
ause
ofpo
oracadem
icperfo
rmance.
𝑓0
059
590
066
663.00
00%
00
100.0
100
00
100.0
100
Teachera
bsenteeism
contrib
utes
topo
oracadem
icperfo
rmance.
𝑓1
157
590
066
662.9760
%1.7
1.796.6
100
00
100.0
100
Lack
ofcompetent
teachersisac
ause
ofpo
oracadem
icperfo
rmance.𝑓
10
5859
01
6566
2.9760
%1.7
098.3
100
01.5
98.5
100
Stud
ents’
absenteeism
isac
ause
ofpo
oracadem
icperfo
rmance.
𝑓2
057
590
066
662.9680
%3.4
096.6
100
00
100.0
100
Lack
ofteaching
andlearning
materialsisac
ause
ofpo
oracadem
icperfo
rmance.
𝑓1
256
590
264
662.9520
%1.7
3.4
94.9
100
03.0
97.0
100
Lack
ofserio
usnessof
thep
upilin
classisac
ause
ofpo
oracadem
icperfo
rmance.
𝑓1
355
590
165
662.9520
%1.7
5.1
93.2
100
01.5
98.5
100
Poor
motivationof
teachersisac
ause
ofpo
oracadem
icperfo
rmance.𝑓
12
5659
20
6466
2.93
60%
1.73.4
94.9
100
3.0
097.0
100
Inadequatesupervision
ofteachersisac
ause
ofpo
oracadem
icperfo
rmance.
𝑓4
253
591
065
662.90
40%
6.8
3.4
89.8
100
1.50
98.5
100
Overeng
agem
entinextracurric
ular
activ
ities
neglectin
gacadem
icwo
rkisac
ause
ofpo
oracadem
icperfo
rmance.
𝑓6
350
592
064
662.84
80%
10.2
5.1
84.7
100
3.0
097.0
100
Scho
olsc
losin
gearlier
than
thea
ppropriateclo
singtim
eare
acause
ofpo
oracadem
icperfo
rmance.
𝑓1
454
592
1153
662.8320
%1.7
6.8
91.5
100
3.0
16.7
80.3
100
Largec
lasssiz
eisa
causeo
fpoo
racademicperfo
rmance.
𝑓6
944
595
2437
662.56
00%
10.2
15.3
74.6
100
7.636.4
56.1
100
Teachershaving
manyperio
dsto
teacharea
causeo
fpoo
racademic
perfo
rmance
ofpu
pils.
𝑓13
2224
599
3225
662.2160
%22.0
37.3
40.7
100
13.6
48.5
37.9
100
Inadequateteachersarea
causeo
fpoo
racademicperfo
rmance.
𝑓24
1421
593
4221
662.1200
%40.7
23.7
35.6
100
4.5
63.6
31.8
100
Regu
larc
hang
ingof
scho
olsb
ypu
pilsisac
ause
ofpo
oracadem
icperfo
rmance.
𝑓16
358
5918
453
661.8
160
%27.1
59.3
13.6
100
27.3
68.2
4.5
100
Regu
lartransfersof
teachersou
tofa
scho
olandreplacingthem
cause
poor
academ
icperfo
rmance.
𝑓34
178
5940
188
661.5
360
%57.6
28.8
13.6
100
60.6
27.3
12.1
100
Lack
ofextrac
lasses
inscho
olisac
ause
ofpo
oracadem
icperfo
rmance.
𝑓29
219
5945
174
661.5
120
%49.2
35.6
15.3
100
68.2
25.8
6.1
100
Source:fieldsurvey
(2014).
T=total;𝑓=fre
quency;%
=percent;D/SD=disagree/stronglydisagree;U
=un
certain;andA/SA=agree/strongly
agree.
Education Research International 9
poor academic performance. It signifies that these factorscomplement other factors to cause the phenomenon. Thisdiscovery seems to support the findings that single parentingwas not a significant determinant of a person’s academicperformance [23]. Nonetheless, some studies have found thatthese factors account for poor academic performance in somejurisdictions [10, 22].These differences in opinion could haveresulted from the study population and the location of thestudy.
In the case of differences in perceptions of the pupilson the home learning environmental factors, the resultsillustrate that two of the factors fall within this category.Those factors are, namely, low level of parental educationand lack of involvement in extra classes at home. Withrespect to both of these factors, pupils from academicallyperforming schools are mostly uncertain about their effecton academic performance. On the contrary, for those pupilsfrom nonacademically performing schools, they did notconsider them as causes of poor academic performance. Thisis because most of them disagreed or strongly disagreed onthese issues. These differences in pupils’ perceptions couldhave resulted from other home based factors.
Despite the differences and similarities, the top fivehome learning environmental factors that account for pooracademic performance have been identified. From the resultsshown in Table 4, it is found that negative peer influence(i.e., engaging in drug abuse) at home, engaging in economicactivities at home, devoting all one’s time watching videos orTV, heavy chores at home, and attendance of social functionsto the neglect of studying surfaced as the major homeenvironmental factors causing poor academic performanceof pupils in the central Gonja and Karaga Districts. Themean of importance of the factors enumerated ranges from2.9600 to 3.0000. This signifies that, in any school in thedistricts where there is poor academic performance, all or acombination of these factors may be the underlying cause ofthe phenomenon.
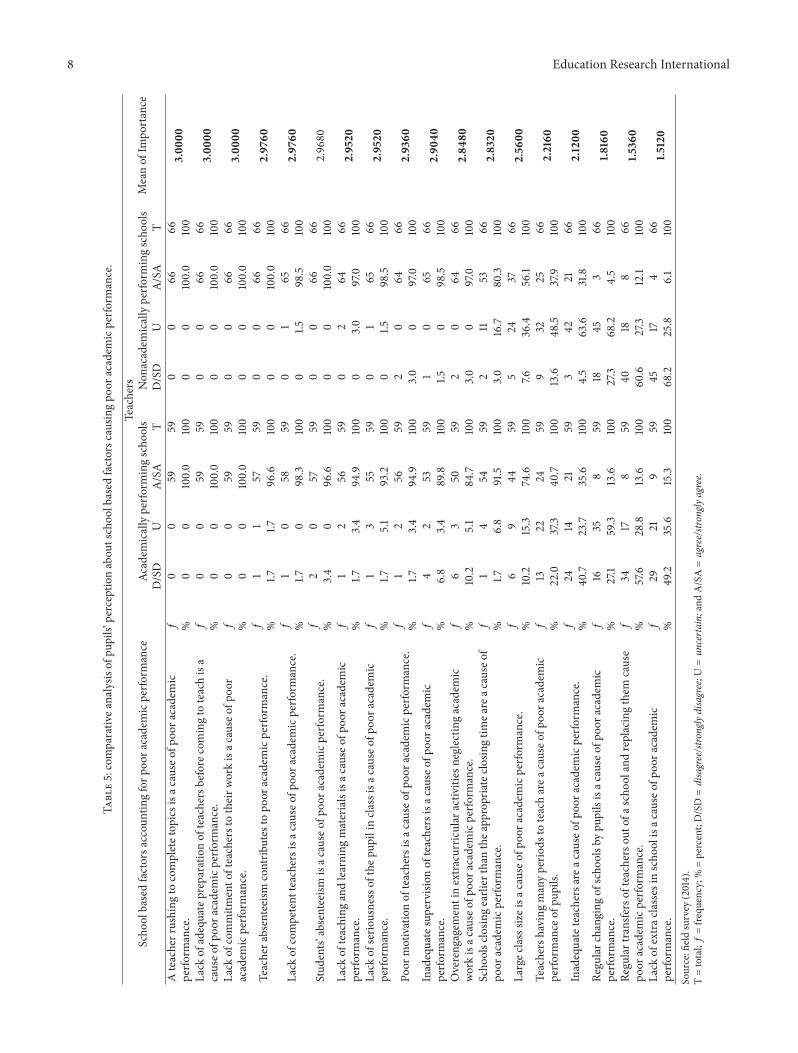
With regard to similarities in pupils’ perceptions aboutschool based factors accounting for poor academic per-formance, the results from Table 5 show that, out of 18school based factors, 13 were endorsed by both respondentcategories. This signifies that most of these pupils agreed orstrongly agreed on those statements. The following factors,a teacher rushing to complete topics, lack of adequatepreparation of teachers before coming to teach, lack ofcommitment of teachers to their work, teacher absenteeism,lack of competent teachers, students’ absenteeism, lack ofteaching and learning materials, lack of seriousness of thepupil in class, poor motivation of teachers, inadequatesupervision of teachers, overengagement in extracurricularactivities neglecting academic work, schools closing earlierthan the appropriate closing time, and large class size, werebacked as the school environmental factors accounting forpoor academic performance in the central Gonja and Karagadistricts. The endorsement of these school based factorsranges from 40.7% to 100.0%. Similar discoveries were madeby earlier studies [14, 15, 30, 40].
Also, the results from Table 5 show that the pupils fromboth school categories are uncertain about one school based
factor’s capability to either result in poor academic perfor-mance or not. The said factor is regular changing of schoolsby pupils being a cause of poor academic performance.With respect to this item, 59.3% of the pupils from aca-demically performing schools said they were uncertain aboutthe factor’s impact. In the case of those from academicallynonperforming schools, 63.6% of them indicated that theywere uncertain about the effect of the current item.The aboveevidence suggest that, the respondents who were uncertainin both category were higher than those who either agreedor strongly agreed. A similar trend was observed in respectto those who disagreed or strongly disagreed. This clearlyconfirms the issue of uncertainty in respect of which factor(s)impacts more on academic performance of pupils in schools.Thismeans that there is a fifty-fifty chance that this factormayor may not account for poor academic performance.
The results further showed that differences exist in pupils’perception on the school based factors accounting for pooracademic performance. The pupils had different views onteachers having many periods to teach and inadequateteachers as causes of poor academic performance. In thecase of the pupils from academically performing schools,most of them agreed or strongly agreed that teachers havingto teach for many periods are a cause of poor academicperformance while those from nonacademically performingschools are uncertain on the issue. Concerning inadequateteachers as a cause of poor academic performance, the resultsshow that most pupils from academically performing schoolsdisagreed or strongly disagreed on it whereas pupils fromnonacademically performing schools are uncertain about theability of this factor to cause poor academic performance.
In terms of the top five school learning environmentalfactors that account for poor academic performance, theresults show that teachers rushing to complete topics, lackof adequate preparation of teachers before coming to teach,lack of commitment of teachers to their work, teacherabsenteeism, and lack of competent teachers fall withinthat category. The mean of importance of these factorsenumerated ranges from 2.9760 to 3.0000. It is important tonote that all of thesemajor school based factors that the pupilsconsider as causing poor academic performance are linked tothe teacher related factors.This suggests that the pupils blamethe teachers for their poor academic performance.
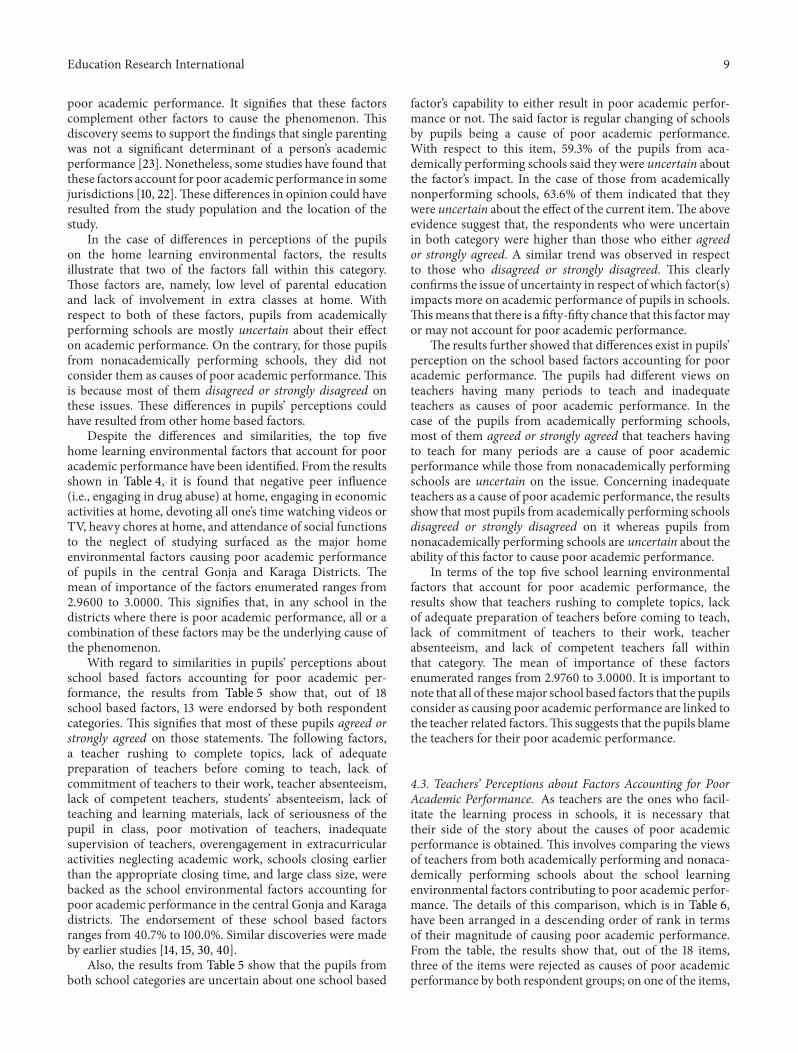
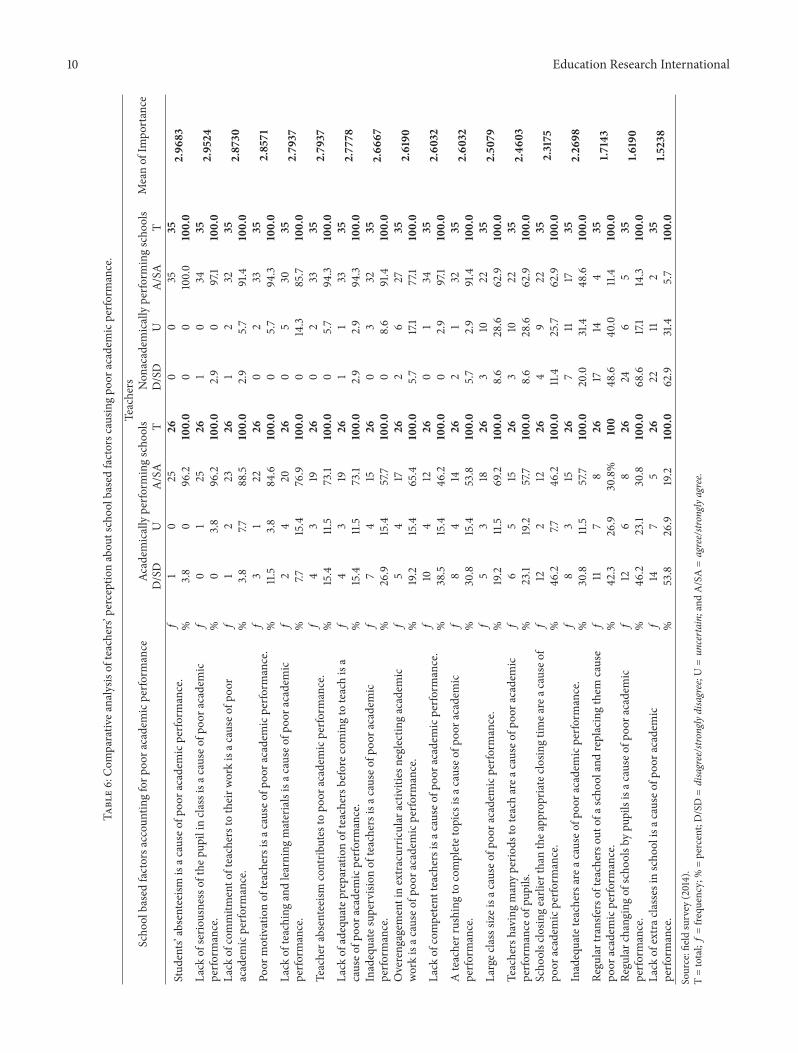
4.3. Teachers’ Perceptions about Factors Accounting for PoorAcademic Performance. As teachers are the ones who facil-itate the learning process in schools, it is necessary thattheir side of the story about the causes of poor academicperformance is obtained. This involves comparing the viewsof teachers from both academically performing and nonaca-demically performing schools about the school learningenvironmental factors contributing to poor academic perfor-mance. The details of this comparison, which is in Table 6,have been arranged in a descending order of rank in termsof their magnitude of causing poor academic performance.From the table, the results show that, out of the 18 items,three of the items were rejected as causes of poor academicperformance by both respondent groups; on one of the items,
10 Education Research International
Table6:Com
parativ
eanalysis
ofteachers’perceptionabou
tschoo
lbased
factorsc
ausin
gpo
oracadem
icperfo
rmance.
Teachers
Meanof
Impo
rtance
Scho
olbasedfactorsa
ccou
ntingforp
oora
cademicperfo
rmance
Academ
icallyperfo
rmingscho
ols
Non
academ
icallyperfo
rmingscho
ols
D/SD
UA/SA
TD/SD
UA/SA
T
Stud
ents’
absenteeism
isac
ause
ofpo
oracadem
icperfo
rmance.
𝑓1
025
260
035
352.96
83%
3.8
096.2
100.0
00
100.0
100.0
Lack
ofserio
usnessof
thep
upilin
classisac
ause
ofpo
oracadem
icperfo
rmance.
𝑓0
125
261
034
352.9524
%0
3.8
96.2
100.0
2.9
097.1
100.0
Lack
ofcommitm
ento
fteacherstotheirw
orkisac
ause
ofpo
oracadem
icperfo
rmance.
𝑓1
223
261
232
352.8730
%3.8
7.788.5
100.0
2.9
5.7
91.4
100.0
Poor
motivationof
teachersisac
ause
ofpo
oracadem
icperfo
rmance.𝑓
31
2226
02
3335
2.8571
%11.5
3.8
84.6
100.0
05.7
94.3
100.0
Lack
ofteaching
andlearning
materialsisac
ause
ofpo
oracadem
icperfo
rmance.
𝑓2
420
260
530
352.7937
%7.7
15.4
76.9
100.0
014.3
85.7
100.0
Teachera
bsenteeism
contrib
utes
topo
oracadem
icperfo
rmance.
𝑓4
319
260
233
352.7937
%15.4
11.5
73.1
100.0
05.7
94.3
100.0
Lack
ofadequatepreparationof
teachersbefore
comingto
teachisa
causeo
fpoo
racademicperfo
rmance.
𝑓4
319
261
133
352.77
78%
15.4
11.5
73.1
100.0
2.9
2.9
94.3
100.0
Inadequatesupervision
ofteachersisac
ause
ofpo
oracadem
icperfo
rmance.
𝑓7
415
260
332
352.66
67%
26.9
15.4
57.7
100.0
08.6
91.4
100.0
Overeng
agem
entinextracurric
ular
activ
ities
neglectin
gacadem
icwo
rkisac
ause
ofpo
oracadem
icperfo
rmance.
𝑓5
417
262
627
352.6190
%19.2
15.4
65.4
100.0
5.7
17.1
77.1
100.0
Lack
ofcompetent
teachersisac
ause
ofpo
oracadem
icperfo
rmance.𝑓
104
1226
01
3435
2.60
32%
38.5
15.4
46.2
100.0
02.9
97.1
100.0
Ateacherrushing
tocompletetop
icsisa
causeo
fpoo
racademic
perfo
rmance.
𝑓8
414
262
132
352.60
32%
30.8
15.4
53.8
100.0
5.7
2.9
91.4
100.0
Largec
lasssiz
eisa
causeo
fpoo
racademicperfo
rmance.
𝑓5
318
263
1022
352.50
79%
19.2
11.5
69.2
100.0
8.6
28.6
62.9
100.0
Teachershaving
manyperio
dsto
teacharea
causeo
fpoo
racademic
perfo
rmance
ofpu
pils.
𝑓6
515
263
1022
352.46
03%
23.1
19.2
57.7
100.0
8.6
28.6
62.9
100.0
Scho
olsc
losin
gearlier
than
thea
ppropriateclo
singtim
eare
acause
ofpo
oracadem
icperfo
rmance.
𝑓12
212
264
922
352.3175
%46
.27.7
46.2
100.0
11.4
25.7
62.9
100.0
Inadequateteachersarea
causeo
fpoo
racademicperfo
rmance.
𝑓8
315
267
1117
352.26
98%
30.8
11.5
57.7
100.0
20.0
31.4
48.6
100.0
Regu
lartransfersof
teachersou
tofa
scho
olandreplacingthem
cause
poor
academ
icperfo
rmance.
𝑓11
78
2617
144
351.7
143
%42.3
26.9
30.8%
100
48.6
40.0
11.4
100.0
Regu
larc
hang
ingof
scho
olsb
ypu
pilsisac
ause
ofpo
oracadem
icperfo
rmance.
𝑓12
68
2624
65
351.6
190
%46
.223.1
30.8
100.0
68.6
17.1
14.3
100.0
Lack
ofextrac
lasses
inscho
olisac
ause
ofpo
oracadem
icperfo
rmance.
𝑓14
75
2622
112
351.5
238
%53.8
26.9
19.2
100.0
62.9
31.4
5.7
100.0
Source:fieldsurvey
(2014).
T=total;𝑓=fre
quency;%
=percent;D/SD=disagree/stronglydisagree;U
=un
certain;andA/SA=agree/strongly
agree.
Education Research International 11
the respondents had different opinions and 14 were endorsedby teachers from both school categories.
With regard to the 14 items that were endorsed, it meantthat most of teachers from both academically performingand nonacademically performing schools agreed or stronglyagreed on those school based factors. In all, inadequateteachers, lack of competent teachers, lack of commitment ofteachers to their work, teacher absenteeism, poor motivationof teachers, lack of adequate preparation of teachers beforecoming to teach, teachers rushing to complete topics, lack ofteaching and learning materials, large class size, inadequatesupervision of teachers, overengagement in extracurricularactivities neglecting academic work, lack of seriousness ofthe pupil in class, students’ absenteeism, and teachers havingmany periods to teach were perceived as causes of pooracademic performance. The endorsement of these factorsranges from 46.2% to 100.0% with that of the teachersfrom nonacademically performing schools being higher withrespect to each of the items. This shows that the teachersfrom both academically performing and nonacademicallyperforming schools have similar views about the causes ofpoor academic performance. The current discoveries are inline with some previous findings [3, 13–15, 40].
Concerning schools closing earlier than the appropriateclosing time as a cause of poor academic performance, theresults show that the teachers have different opinions onthis factor. In terms of the perception of teachers fromacademically performing schools, 46.2% of them agreedor strongly agreed on the item while the same percentagedisagreed or strongly disagreed. This shows that there is a splitin the teachers’ opinion.With respect to the teachers from thenonacademically performing schools, the results show thatabout 62.9% of them agreed or strongly agreed that schoolsclosing earlier than the appropriate closing time cause pooracademic performance. These results show that most of theteachers in the nonperforming schools endorsed the currentfactor as a cause of poor academic performance, whichis in line with half of the teachers from the academicallyperforming schools, but contrary to the other half ’s opinion.
In terms of the top five school learning environmentalfactors that contribute to poor academic performance, theresults show that students’ absenteeism, lack of seriousnessof the pupil in class, lack of commitment of teachers totheir work, poor motivation of teachers, and lack of teachingand learning materials emerged as the most significantcauses of poor academic performance of pupils. The meanof importance of the factors named ranges from 2.7937 to2.9683. It is interesting to note that most of the top schoolbased factors causing poor academic performance of pupilshave been tied by the teachers to both student related factorsand teacher related factors with the student related factorscarrying more weight.This shows that the teachers blame thepupils for their poor academic performance.
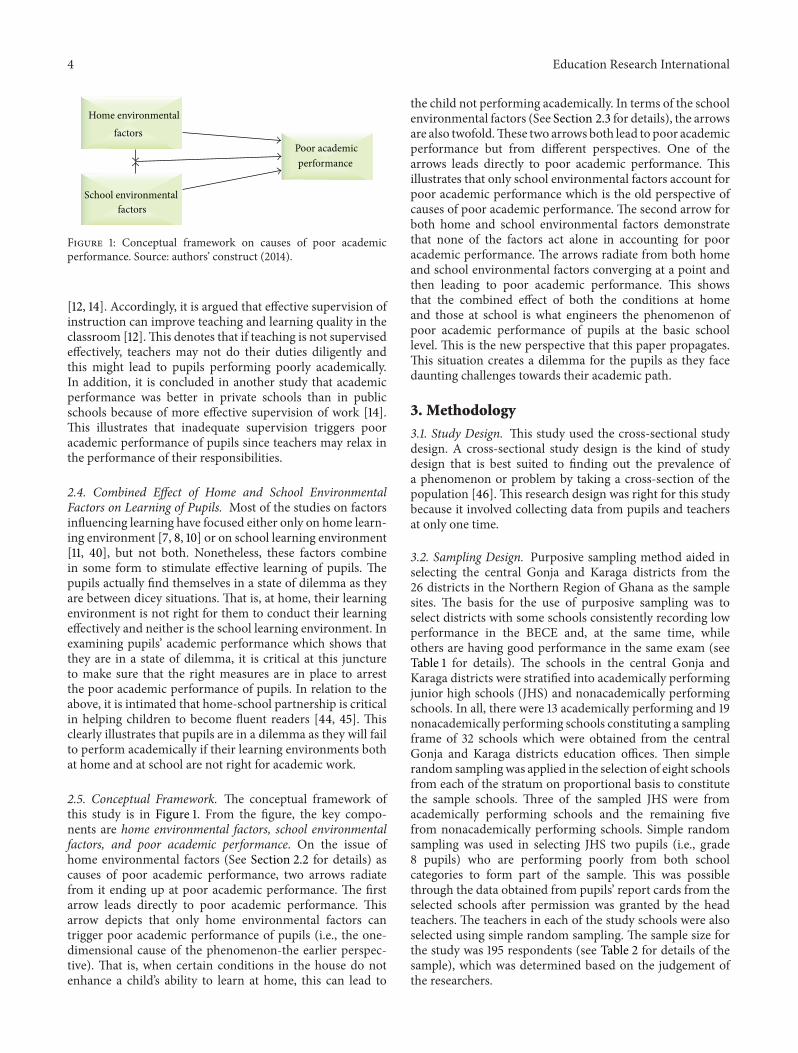
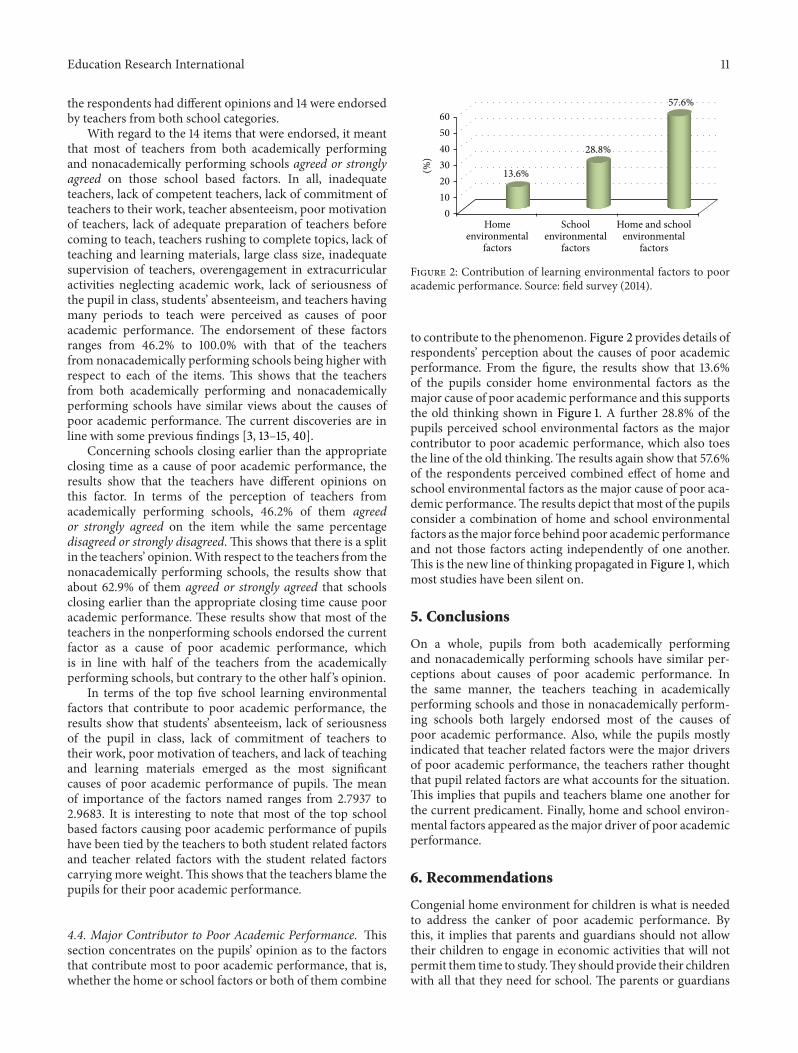
4.4. Major Contributor to Poor Academic Performance. Thissection concentrates on the pupils’ opinion as to the factorsthat contribute most to poor academic performance, that is,whether the home or school factors or both of them combine
0102030405060
13.6%
28.8%
57.6%
(%)
Homeenvironmental
factors
Schoolenvironmental
factors
Home and schoolenvironmental
factors
Figure 2: Contribution of learning environmental factors to pooracademic performance. Source: field survey (2014).
to contribute to the phenomenon. Figure 2 provides details ofrespondents’ perception about the causes of poor academicperformance. From the figure, the results show that 13.6%of the pupils consider home environmental factors as themajor cause of poor academic performance and this supportsthe old thinking shown in Figure 1. A further 28.8% of thepupils perceived school environmental factors as the majorcontributor to poor academic performance, which also toesthe line of the old thinking.The results again show that 57.6%of the respondents perceived combined effect of home andschool environmental factors as the major cause of poor aca-demic performance.The results depict that most of the pupilsconsider a combination of home and school environmentalfactors as themajor force behind poor academic performanceand not those factors acting independently of one another.This is the new line of thinking propagated in Figure 1, whichmost studies have been silent on.
5. Conclusions
On a whole, pupils from both academically performingand nonacademically performing schools have similar per-ceptions about causes of poor academic performance. Inthe same manner, the teachers teaching in academicallyperforming schools and those in nonacademically perform-ing schools both largely endorsed most of the causes ofpoor academic performance. Also, while the pupils mostlyindicated that teacher related factors were the major driversof poor academic performance, the teachers rather thoughtthat pupil related factors are what accounts for the situation.This implies that pupils and teachers blame one another forthe current predicament. Finally, home and school environ-mental factors appeared as themajor driver of poor academicperformance.
6. Recommendations
Congenial home environment for children is what is neededto address the canker of poor academic performance. Bythis, it implies that parents and guardians should not allowtheir children to engage in economic activities that will notpermit them time to study.They should provide their childrenwith all that they need for school. The parents or guardians
12 Education Research International
should also ensure that children are not overburdened withhousehold chores. The parents can help by doing some of thehousehold chores themselves or hire maids to do the choresto create room for the children to learn. Also, parents shouldencourage their children to make friends with people whowant to learn. Finally, the parents should ensure that theylimit their children’s engagement in entertainment whichsways them away from studying. If all these are in place, thechildren would have the opportunity at home to learn.
Addressing teacher related factors is the key to preventingand eliminating poor academic performance. This signifiesthat, for a person to be qualified to teach, he/she should bewell trained. As the person has the appropriate training, heor she will invariably prepare adequately before coming toteach.With good professional ethics, the person will not rushto finish topics but would rather take time to go through themone after the other. The purpose is to ensure that whateveris taught is understood. Also, if the teachers are motivatedthrough higher salaries and other gift packages, they wouldtend to be committed to their work. As they are committedto their work they would usually not absent themselves fromwork which will inure to the benefit of the pupils.
Tackling student related factors will help to prevent pooracademic performance.This could be carried out by ensuringthat lessons aremade interesting by teachers always to capturethe attention of the pupils from beginning to end. This canbe done through making learning pupil-centred. When thishappens, the pupils would be serious in class. As they enjoythe lessons, they would not like to miss classes for anything.The end results would be that they would be able to retainwhat they learn and apply it during examinations.
Conflict of Interests
The authors declare that there is no conflict of interestsregarding the publication of this paper.
References
[1] G. H. Gregory and C. Chapman, Differentiated InstructionalStrategies: One Size Doesn’t Fit All, Corwin, Thousand Oaks,Calif, USA, 2007.
[2] M. I. Ogbemudia and M. V. Aiasa, “Influence of home environ-ment on the academic performance of primary five pupils’ inEnglish language inOrhionmwon local government area of EdoState,”Merit Research Journal of Education andReview, vol. 1, no.5, pp. 120–125, 2013.
[3] O. A. Asikhia, “Students and teachers’ perception of the causesof poor academic performance in ogun state secondary schools[Nigeria]: implications for couselling for national develop-ment,”European Journal of Social Sciences, vol. 13, no. 2, pp. 229–242, 2010.
[4] Northern Regional Education Data Base, Ghana EducationalService Northern Region, Northern Region, Ghana, 2013.
[5] Gushiegu, Educational Sector, 2006, http://www.ghanadistricts.com/districts/?news&r=6& =84.
[6] S. Pong, J. Dronkers, and G. Hampden-Thompson, “Familypolicies and children’s school achievement in single- versus two-parent families,” Journal of Marriage and Family, vol. 65, no. 3,pp. 681–699, 2003.
[7] A. K. Donkor, “Parental involvement in education inGhana: thecase of a private elementary school,” International Journal aboutParents in Education, vol. 4, no. 1, pp. 23–38, 2010.
[8] K. Nyarko, “Parental school involvement: the case of Ghana,”Journal of Emerging Trends in Educational Research and PolicyStudies, vol. 2, no. 5, pp. 378–381, 2011.
[9] G.Chowa,D.Ansong, and I.Osei-Akoto, “Parental involvementand academic performance in Ghana,” Youthsave ResearchBrief 12-42, 2012.
[10] A. M. Abudu and M. N. Fuseini, “Influence of single parentingon pupils’ academic performance in basic schools in the WaMunicipality,” International Journal of Education Learning andDevelopment, vol. 1, no. 2, pp. 85–94, 2013.
[11] R. Win and P. W. Miller, “The effects of individual and schoolfactors on university students’ academic performance,” CLMRDiscussion Paper Series 04/4, The Centre for Labour MarketResearch, The University of Western Australia, 2004.
[12] R. I. Neagley and N. D. Evans, Handbook for Effective Supervi-sion of Instruction, Prentice-Hall, New York, NY, USA, 1970.
[13] D. K. Agyemang, Sociology of Education for African Students,Black Mask, Accra, Ghana, 1993.
[14] Y. K. A. Etsey, F. K. Amedahe, and K. Edjah, Do PrivatePrimary Schools Perform Better than Public Schools in Ghana?Department of Educational Foundations, University of CapeCoast, Cape Coast, Ghana, 2005.
[15] Y. Etsey, “Causes of low academic performance of primaryschool pupils in the shama sub-metro of Shama Ahanta EastMetropolitan Assembly (SAEMA) in Ghana,” in Proceedings ofthe Regional Conference on Education in West Africa, Dakar,Senegal, 2005.
[16] S. F. Krein and A. H. Beller, “Educational attainment of childrenfrom single-parent families: differences by exposure, gender,and race,” Demography, vol. 25, no. 2, pp. 221–234, 1988.
[17] S. O. Salami and E. A. Alawode, Influence of Single-Parentingon the Academic Achievement of Adolescents in SecondarySchools: Implications for Counseling, Department of Guidanceand Counseling University of Ibadan, Ibadan, Nigeria, 2000.
[18] G. D. Eweniyi, “ The impact of family structure on universitystudents’ academic performance,” Olabisi Onabamijo Uni-versity, Ago-lwoye, 2005, http://www.unilorin.edu.ng/journals/education/ije/dec2002/THE%20IMPACT%20OF%20FAMILY%20STRUCTURE%20ON%20UNIVERSITY%20STUDENTS%20ACADEMIC%20PERFORMANCE.pdf.
[19] M. S. Farooq, A. H. Chaudhry, M. Shafiq, and G. Berhanu,“Factors affecting students’ quality of academic performance:a case of secondary school level,” Journal of Quality andTechnology Management, vol. 7, no. 2, pp. 1–14, 2011.
[20] C. Mahama and B. Campion, “Housing tenure, residentialmoves and children’s educational performance in Accra,” Jour-nal of Science and Technology, vol. 31, no. 1, pp. 65–75, 2011.
[21] M. P. K. Okyerefo, D. Y. Fiaveh, and S. N. L. Lamptey, “Factorsprompting pupils’ academic performance in privately ownedJunior High Schools in Accra, Ghana,” International Journal ofSociology and Anthropology, vol. 3, no. 8, pp. 280–289, 2011.
[22] V. O. Uwaifo, “The effects of family structure and parenthoodon the academic performance of Nigerian University students,”Studies on Home and Community Science, vol. 2, no. 2, pp. 121–124, 2008.
[23] M. A. Ushie, J. O. Emeka, G. I. Ononga, and E. O. Owolabi,“Influence of family structure on Students academic perfor-mance in Agege Local Government Area, Lagos State, Nigeria,”
Education Research International 13
European Journal of Educational Studies, vol. 4, no. 2, pp. 177–187, 2012.
[24] D. R. Topor, S. P. Keane, T. L. Shelton, and S. D. Calkins, “Parentinvolvement and student academic performance: a multiplemediational analysis,” Journal of Prevention and Intervention inthe Community, vol. 38, no. 3, pp. 183–197, 2010.
[25] C. A. Muodumogu, “Evaluation of school and home strategiesfor literacy development of beginning readers in the northcentral zone of Nigeria,” European Journal of EducationalSciences, vol. 2, no. 1, pp. 41–58, 2014.
[26] T. Tuttle, “Family Background, Locality, and the Influence onSAT Scores for Indiana Class of Hoosier Briefs,” Hoosier Briefs,no. 2, 2004.
[27] P. E. Davis-Kean, “The influence of parent education and familyincome on child achievement: the indirect role of parentalexpectations and the home environment,” Journal of FamilyPsychology, vol. 19, no. 2, pp. 294–304, 2005.
[28] F. Yousefi, “The effects of family income on test-anxiety andacademic achievement among Iranian high school students,”Asian Social Science, vol. 6, no. 6, pp. 89–93, 2010.
[29] N. Acharya and S. Joshi, “Influence of parents’ education onachievement motivation of adolescents,” Indian Journal SocialScience Researches, vol. 6, no. 1, pp. 72–79, 2009.
[30] M. Lockheed and A. M. Verspoor, “Improving education,”Education Review, vol. 16, no. 3, pp. 303–311, 1991.
[31] L. Broom, Sociology: A Text with Adopted Reading, Harper &Row, New York, NY, USA, 4th edition, 1973.
[32] D. P. Ausubel, The Psychology of Meaningful Verbal Learning,Harvard University Press, New York, NY, USA, 1973.
[33] J. Cooper and P. Robinson, “The argument for making largeclasses seem small,” in Strategies for Energizing Large Classes:From Small Groups to Learning Communities, J. MacGregor,J. Cooper, K. Smith, and P. Robinson, Eds., vol. 81 of NewDirections for Teaching and Learning, pp. 5–16, Jossey-Bass, SanFrancisco, Calif, USA, 2000.
[34] M. Svinicki and W. McKeachie, McKeachie’s Teaching Tips:Strategies, Research and Theory for College and UniversityTeachers, Cengage Learning, Belmont, Calif, USA, 13th edition,2010.
[35] A. Kerr, Teaching and Learning in Large Classes at OntarioUniversities: An Exploratory Study, Higher Education QualityCouncil of Ontario, Toronto, Canada, 2011.
[36] K. Asiedu-Akrofi, School Organisation inModern Africa, GhanaPublishing Corporation, Tema, Ghana, 1978.
[37] E. Word, J. Johnston, H. Pate-Bain et al.,The State of Tennessee’sStudent/Teacher Achievement Ratio Project Final SummaryReport 1985–1990, Tennessee State Department of Education,1990.
[38] B. Nye, L. V. Hedges, and S. Konstantopoulos, “The effects ofsmall classes on academic achievement: the results of the Ten-nessee class size experiment,” American Educational ResearchJournal, vol. 37, no. 1, pp. 123–151, 2000.
[39] J. Westerlund, “Class size and student evaluations in Sweden,”Education Economics, vol. 16, no. 1, pp. 19–28, 2008.
[40] O. Adunola, An Analysis of the Relationship between Class Sizeand Academic Performance of Students, Ego Booster Books,Ogun State, Nigeria, 2013.
[41] C. M. Achilles, P. Harman, and P. Egelson, “Using researchresults on class size to improve pupil achievement outcomes,”Research in Schools, vol. 2, no. 2, pp. 23–30, 1995.
[42] R. J. Kraft, Teaching and Learning in Ghana, Mitchell Group,Boulder, Colo, USA, 1994.
[43] A. J. Isangedigh, “Under achievement: an index of learner-environmentmismatch,”Nigeria Journal of Educational Psychol-ogy, vol. 3, no. 1, pp. 220–226, 1988.
[44] B. H. Wasik, Handbook of Family Literacy, Lawrence ErlbaumAssociates, Mahwah, NJ, USA, 2004.
[45] D. R. Reutzel and R. B. Cooter, Strategies for Reading Assessmentand Instruction: Helping Every Child Succeed, Pearson Educa-tion, Upper Saddle River, NJ, USA, 2007.
[46] R. Kumar, Research Methodology: A Step-by-Step Guide forBeginners, SAGE Publications, New Delhi, India, 1999.

Submit your manuscripts athttp://www.hindawi.com
Child Development Research
Hindawi Publishing Corporationhttp://www.hindawi.com Volume 2014
Education Research International
Hindawi Publishing Corporationhttp://www.hindawi.com Volume 2014
Biomedical EducationJournal of
Hindawi Publishing Corporationhttp://www.hindawi.com Volume 2014
Hindawi Publishing Corporationhttp://www.hindawi.com Volume 2014
Psychiatry Journal
ArchaeologyJournal of
Hindawi Publishing Corporationhttp://www.hindawi.com Volume 2014
Hindawi Publishing Corporationhttp://www.hindawi.com Volume 2014
AnthropologyJournal of
Hindawi Publishing Corporationhttp://www.hindawi.com Volume 2014
Research and TreatmentSchizophrenia
Hindawi Publishing Corporationhttp://www.hindawi.com Volume 2014
Urban Studies Research
Population ResearchInternational Journal of
Hindawi Publishing Corporationhttp://www.hindawi.com Volume 2014
CriminologyJournal of
Hindawi Publishing Corporationhttp://www.hindawi.com Volume 2014
Aging ResearchJournal of
Hindawi Publishing Corporationhttp://www.hindawi.com Volume 2014
Hindawi Publishing Corporationhttp://www.hindawi.com Volume 2014
NursingResearch and Practice
Current Gerontology& Geriatrics Research
Hindawi Publishing Corporationhttp://www.hindawi.com
Volume 2014
Sleep DisordersHindawi Publishing Corporationhttp://www.hindawi.com Volume 2014
AddictionJournal of
Hindawi Publishing Corporationhttp://www.hindawi.com Volume 2014
Depression Research and TreatmentHindawi Publishing Corporationhttp://www.hindawi.com Volume 2014
Hindawi Publishing Corporationhttp://www.hindawi.com Volume 2014
Geography Journal
Hindawi Publishing Corporationhttp://www.hindawi.com Volume 2014
Research and TreatmentAutism
Hindawi Publishing Corporationhttp://www.hindawi.com Volume 2014
Economics Research International
Copyright © 2022 FDOKUMEN