"Digitize Me": Generating E-Learning Profiles for Media and Communication Students in a Jamaican...
29
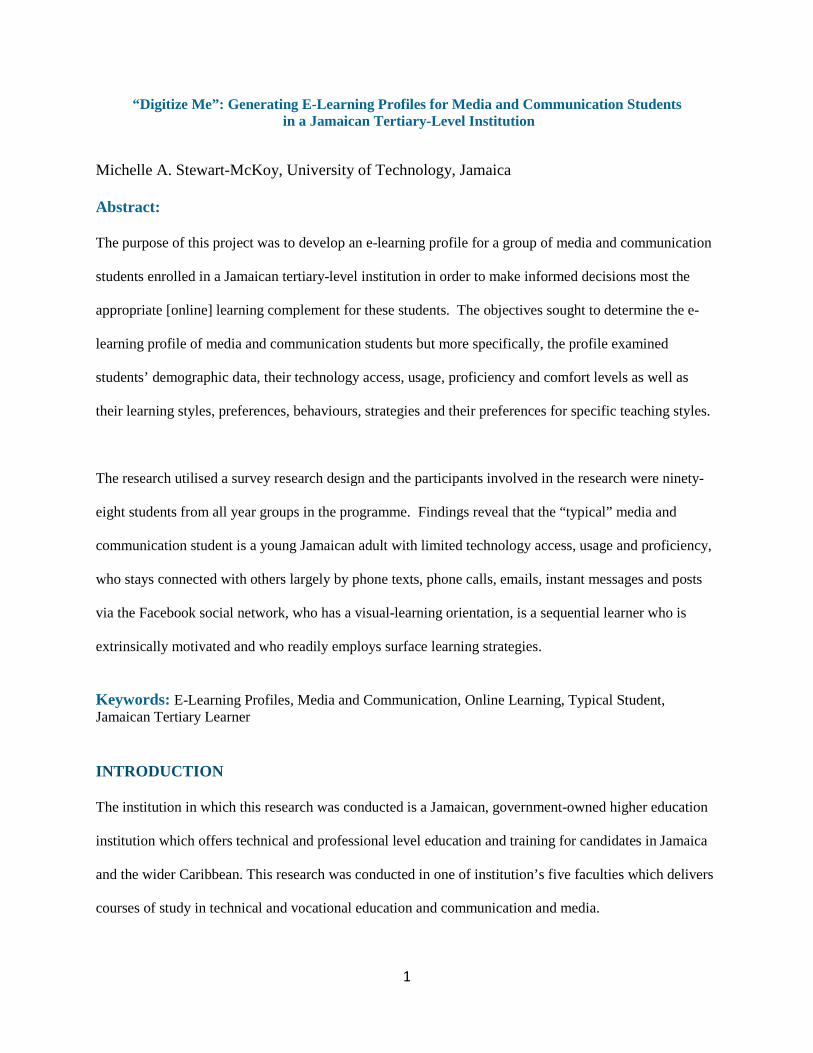
1 “Digitize Me”: Generating E-Learning Profiles for Media and Communication Students in a Jamaican Tertiary-Level Institution Michelle A. Stewart-McKoy, University of Technology, Jamaica Abstract: The purpose of this project was to develop an e-learning profile for a group of media and communication students enrolled in a Jamaican tertiary-level institution in order to make informed decisions most the appropriate [online] learning complement for these students. The objectives sought to determine the e- learning profile of media and communication students but more specifically, the profile examined students’ demographic data, their technology access, usage, proficiency and comfort levels as well as their learning styles, preferences, behaviours, strategies and their preferences for specific teaching styles. The research utilised a survey research design and the participants involved in the research were ninety- eight students from all year groups in the programme. Findings reveal that the “typical” media and communication student is a young Jamaican adult with limited technology access, usage and proficiency, who stays connected with others largely by phone texts, phone calls, emails, instant messages and posts via the Facebook social network, who has a visual-learning orientation, is a sequential learner who is extrinsically motivated and who readily employs surface learning strategies. Keywords: E-Learning Profiles, Media and Communication, Online Learning, Typical Student, Jamaican Tertiary Learner INTRODUCTION The institution in which this research was conducted is a Jamaican, government-owned higher education institution which offers technical and professional level education and training for candidates in Jamaica and the wider Caribbean. This research was conducted in one of institution’s five faculties which delivers courses of study in technical and vocational education and communication and media.
Transcript of "Digitize Me": Generating E-Learning Profiles for Media and Communication Students in a Jamaican...
1
“Digitize Me”: Generating E-Learning Profiles for Media and Communication Students in a Jamaican Tertiary-Level Institution
Michelle A. Stewart-McKoy, University of Technology, Jamaica Abstract: The purpose of this project was to develop an e-learning profile for a group of media and communication
students enrolled in a Jamaican tertiary-level institution in order to make informed decisions most the
appropriate [online] learning complement for these students. The objectives sought to determine the e-
learning profile of media and communication students but more specifically, the profile examined
students’ demographic data, their technology access, usage, proficiency and comfort levels as well as
their learning styles, preferences, behaviours, strategies and their preferences for specific teaching styles.
The research utilised a survey research design and the participants involved in the research were ninety-
eight students from all year groups in the programme. Findings reveal that the “typical” media and
communication student is a young Jamaican adult with limited technology access, usage and proficiency,
who stays connected with others largely by phone texts, phone calls, emails, instant messages and posts
via the Facebook social network, who has a visual-learning orientation, is a sequential learner who is
extrinsically motivated and who readily employs surface learning strategies.
Keywords: E-Learning Profiles, Media and Communication, Online Learning, Typical Student, Jamaican Tertiary Learner INTRODUCTION The institution in which this research was conducted is a Jamaican, government-owned higher education
institution which offers technical and professional level education and training for candidates in Jamaica
and the wider Caribbean. This research was conducted in one of institution’s five faculties which delivers
courses of study in technical and vocational education and communication and media.
2
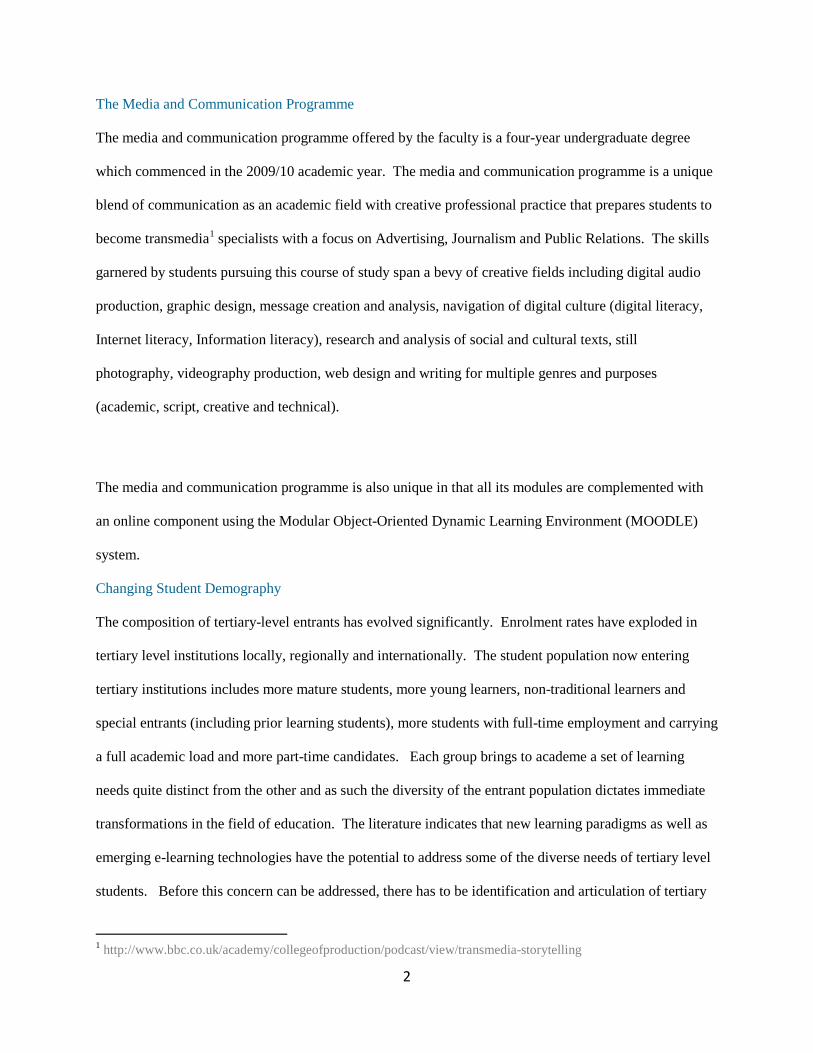
The Media and Communication Programme The media and communication programme offered by the faculty is a four-year undergraduate degree
which commenced in the 2009/10 academic year. The media and communication programme is a unique
blend of communication as an academic field with creative professional practice that prepares students to
become transmedia1
The media and communication programme is also unique in that all its modules are complemented with
an online component using the Modular Object-Oriented Dynamic Learning Environment (MOODLE)
system.
specialists with a focus on Advertising, Journalism and Public Relations. The skills
garnered by students pursuing this course of study span a bevy of creative fields including digital audio
production, graphic design, message creation and analysis, navigation of digital culture (digital literacy,
Internet literacy, Information literacy), research and analysis of social and cultural texts, still
photography, videography production, web design and writing for multiple genres and purposes
(academic, script, creative and technical).
Changing Student Demography
The composition of tertiary-level entrants has evolved significantly. Enrolment rates have exploded in
tertiary level institutions locally, regionally and internationally. The student population now entering
tertiary institutions includes more mature students, more young learners, non-traditional learners and
special entrants (including prior learning students), more students with full-time employment and carrying
a full academic load and more part-time candidates. Each group brings to academe a set of learning
needs quite distinct from the other and as such the diversity of the entrant population dictates immediate
transformations in the field of education. The literature indicates that new learning paradigms as well as
emerging e-learning technologies have the potential to address some of the diverse needs of tertiary level
students. Before this concern can be addressed, there has to be identification and articulation of tertiary
1 http://www.bbc.co.uk/academy/collegeofproduction/podcast/view/transmedia-storytelling
3
level learners diverse needs. (Jeffrey, Atkins, Laurs and Mann, 2006; Cercone, 2008; Palloff and Pratt,
2003).
E-Learning Profiles
A learner profile is narrative description or an academic compilation of key learning assumptions of the
learner. This profile comprises the learner’s characteristics, needs, preferences, attitudes and capabilities
(Gardner and Miller, 2005; Rothwell and Kazanas, 2008). Currently we operate in a digital age in
which ICT-enhanced education (e-learning) abounds. An e-learning profile is therefore a compendium
relating to the student’s characteristics, needs, styles and preferences, attitudes and capabilities as well as
his/her knowledge of, access to, use of and comfort levels with e-learning technologies.
Most of the research literature examined by the researcher regarding tertiary level learning profiles
concentrated on a circumscribed selection of learner attributes (Amir, Jelas and Rahman, 2011; Bullen,
Morgan, Belfer, and Qayyum, 2009; Hunte, 2010; Jeffrey, Atkins, Laurs and Mann, 2006; Cercone,
2008; Howe and Strauss, 2000; Oblinger and Oblinger, 2005; Tapscott, 2009; Tucker, 2003; Sadler-Smith
and Riding, 1999) which may not be sufficient in generating a comprehensive e-learning profile. This
paper examines a more inclusive e-learning profile which embraces students’ learning styles, preferences
and processing strategies, their preferences for teaching modes and their information gathering sources.
This profile also captures learners’ motivational orientation, academic impetus, as well as their
technology knowledge, access and usage.
The work conducted with the media and communication students at this research setting is an extension of
the researcher’s doctoral study at the University of the West Indies, Mona campus which examines the
design, development and implementation of e-learning enhanced environments based on students’ e-
learning profiles.
4
Purpose of the Research
The specific purpose of the research was to generate a generic profile of media and communication
students based on research-driven empirical data which could inform decisions made regarding online
complements for conventional face-to-face instruction.
Research Question
In order to determine the best complementary, online learning experience for Jamaican communication
and media students, it was critical to examine their learning styles and preferences, sources of information
gathering, technology access, usage and comfort levels. The overarching question of the research was
what is the e-learning profile of the typical student enrolled in a media and communication programme in
a Jamaican tertiary level institution?
Considering that the investigation aimed at generating a comprehensive e-learning profile of these
communication and media students, the research question further examined the following sub-questions:
1. What is the demographic profile of the communication and media students under investigation?
2. What is the digital/technology profile of the communication and media students under study?
3. What are the learning styles and preferences of the select research participants?
METHODS Research Design
This research sought to generate a comprehensive e-learning profile among media and communication
students in a Jamaican tertiary-level institution. The research was conducted in the 2011/12 academic
year; the third year of this new programme’s 4-year cycle. The study utilised a cross-sectional survey
research design in which data was collected at one point in time (Creswell, 2012; Babbie, 2007).
Participants and Sampling Strategy
This research utilised purposive sampling which is a non-probability sampling technique (Babbie, 2007;
Cresswell, 2012, Laerd dissertation, 2012). The total population sampling strategy was used because
5
total population strategy targets all or as close to 100% of the study population. Given that the
communication and media student population in the 2011/12 academic year comprised three (3) cohorts
totalling one hundred and eight (108) students and also taking into consideration that the media and
communication students’ modules all had an online supplement, total population sampling was deemed
the most appropriate to use. The sample variance was therefore zero (0) since all participants were
targeted in the research.
Data Collection Instrument
Data collected using a questionnaire. The questionnaire was selected because they are objective in nature
guaranteeing standardized data collection and they were more likely to guarantee anonymity. Data can
also be gathered from large groups quickly.
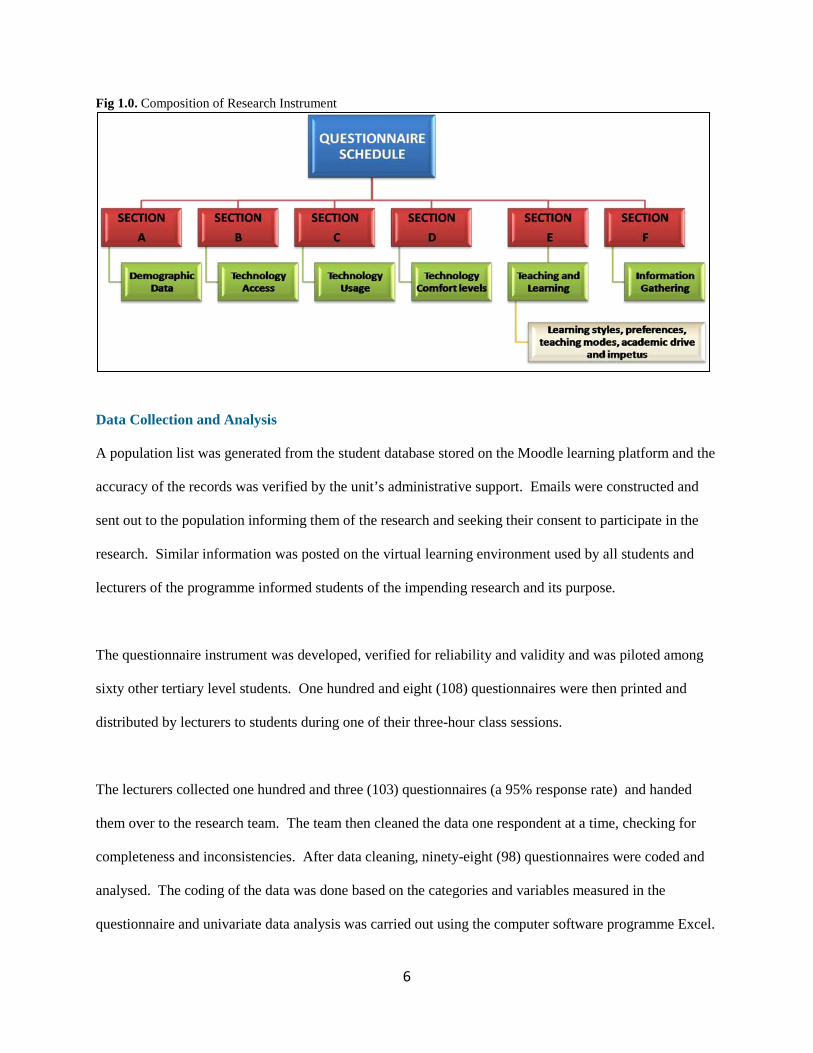
The questionnaire had six (6) sections and twenty-five principal items. Section one addressed
demographic data and comprised ten (10) open-ended and closed items. Section two of the questionnaire
addressed technology ownership and access and encompassed five main items. This items in this section
also included contingency (subsequent questions in a series) as well as matrix question formats (using
Likert-type responses). Section three, had four main items with matrix question formats and focussed on
participants’ technology usage in a variety of contexts. Technology comfort levels based on a range of
contexts and using matrix question formats were examined in section four. Teaching and learning
concerns were addressed in section five and this section included participants’ learning styles and
preferences, strategies, behaviours, teaching modes and preferences. Figure 1.0 is an illustration of the
composition of the questionnaire.
6
Fig 1.0. Composition of Research Instrument
Data Collection and Analysis
A population list was generated from the student database stored on the Moodle learning platform and the
accuracy of the records was verified by the unit’s administrative support. Emails were constructed and
sent out to the population informing them of the research and seeking their consent to participate in the
research. Similar information was posted on the virtual learning environment used by all students and
lecturers of the programme informed students of the impending research and its purpose.
The questionnaire instrument was developed, verified for reliability and validity and was piloted among
sixty other tertiary level students. One hundred and eight (108) questionnaires were then printed and
distributed by lecturers to students during one of their three-hour class sessions.
The lecturers collected one hundred and three (103) questionnaires (a 95% response rate) and handed
them over to the research team. The team then cleaned the data one respondent at a time, checking for
completeness and inconsistencies. After data cleaning, ninety-eight (98) questionnaires were coded and
analysed. The coding of the data was done based on the categories and variables measured in the
questionnaire and univariate data analysis was carried out using the computer software programme Excel.
7
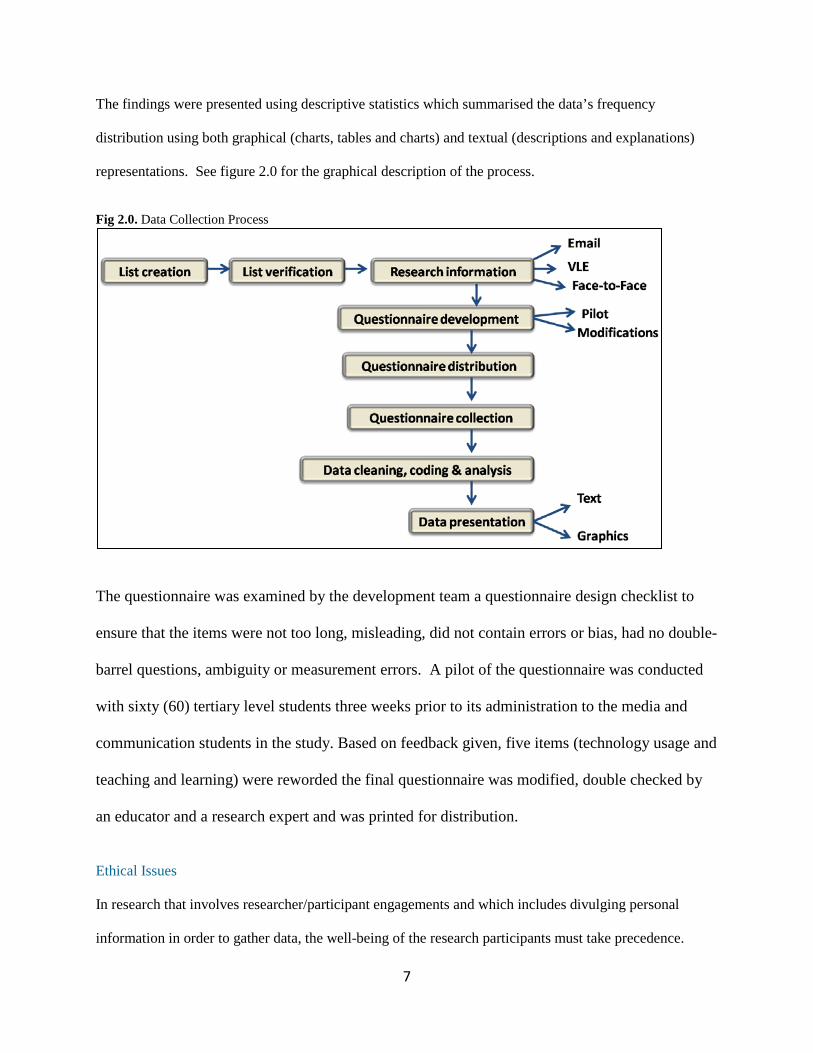
The findings were presented using descriptive statistics which summarised the data’s frequency
distribution using both graphical (charts, tables and charts) and textual (descriptions and explanations)
representations. See figure 2.0 for the graphical description of the process.
Fig 2.0. Data Collection Process
The questionnaire was examined by the development team a questionnaire design checklist to
ensure that the items were not too long, misleading, did not contain errors or bias, had no double-
barrel questions, ambiguity or measurement errors. A pilot of the questionnaire was conducted
with sixty (60) tertiary level students three weeks prior to its administration to the media and
communication students in the study. Based on feedback given, five items (technology usage and
teaching and learning) were reworded the final questionnaire was modified, double checked by
an educator and a research expert and was printed for distribution.
Ethical Issues
In research that involves researcher/participant engagements and which includes divulging personal
information in order to gather data, the well-being of the research participants must take precedence.
8
Silverman and Marvasti (2008), Babbie (2007), Creswell (2012), Descombe (2007) among others remind
researchers that while carrying out their investigations, the research ethics (permissions obtained, research
purpose communicated, consent sought, confidentiality maintained and identities preserved) must be
observed.
Departmental permission was sought and granted regarding the conducting of the survey. The students in
the communication and media programme were informed electronically (via email and the virtual
learning platform) and personally (in class face-to-face interaction) about the research and its purpose.
They were also informed that by completing and returning the questionnaire, they were agreeing to
participate in the research and were assenting to the publication of the findings. Additionally, they were
advised that their participation was voluntary, that anonymity would be guaranteed and that they could
withdraw from the process at any time.
Results This research was conducted among three cohorts of students studying a media and communication
programme in Jamaica. The study aimed at developing a “typical” profile of these students in order to
determine the best online complementary instruction for them. The results of the findings are discussed
in this section.
What is the e-learning profile of the typical student enrolled in a media and communication programme in a Jamaican tertiary institution?
In order to generate an e-learning profile of the typical communication and media student, an analysis was
done based on the results gleaned and using the patterns, a generic description was extracted.
1. What is the demographic profile of the communication and media students under investigation?
Demographic information sought included, gender, age range, nationality, number of years since last
place of study, academic workload, academic year level and employment status. Each area is discussed in
the following sections:
Gender
9
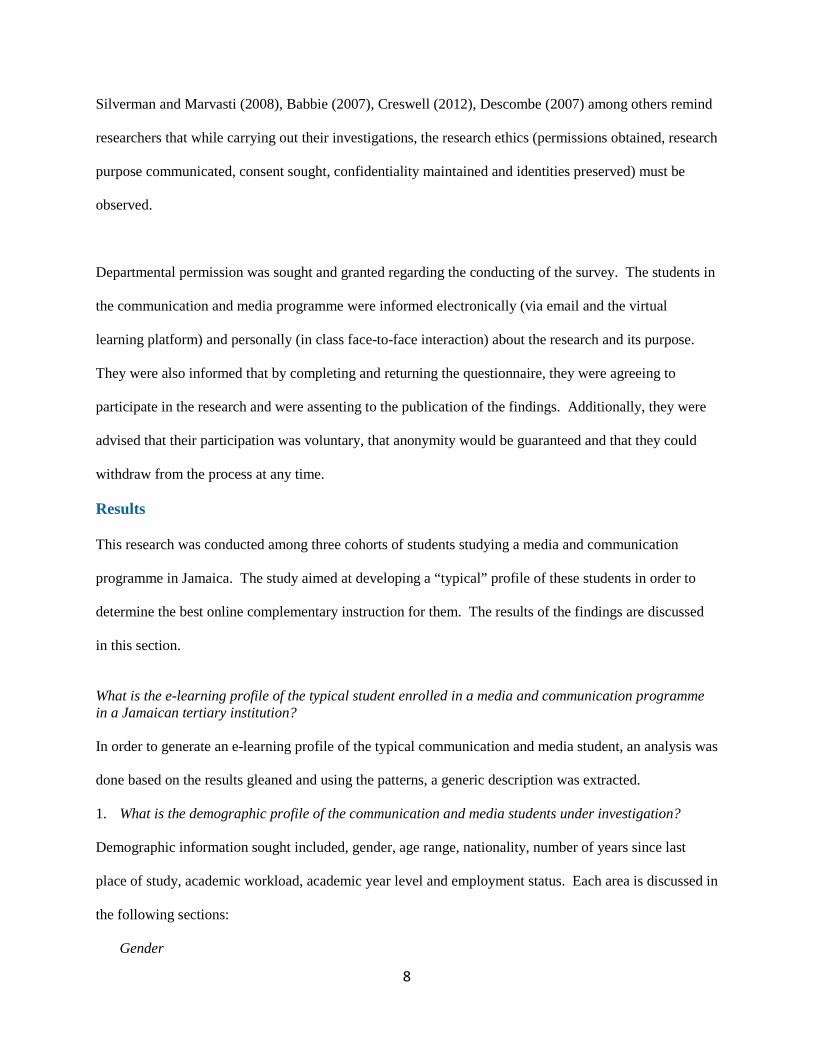
Females accounted for the bulk of the media and communication participants with seventy-six per cent
(76%). The males accounted for twenty-four per cent (24%) of the ninety-eight (98) participants. Figure
3.0 provides a graphical representation of this data.
Fig 3.0. Distribution of Male and Female Participants
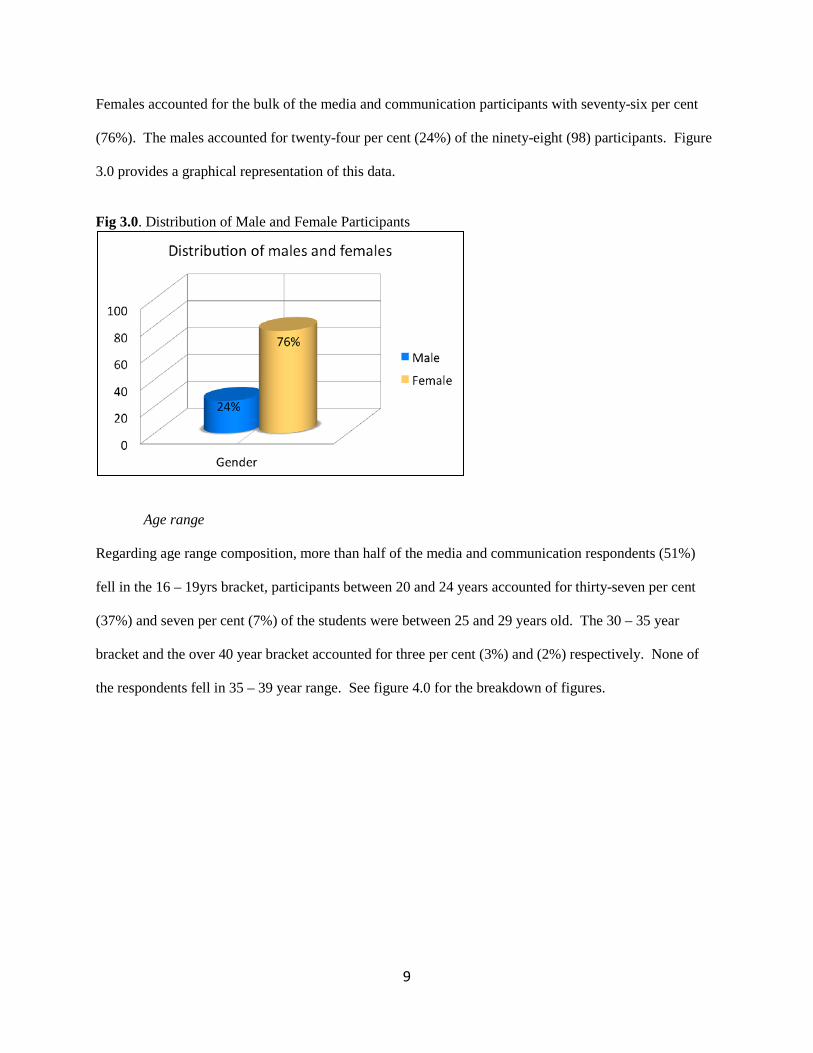
Age range
Regarding age range composition, more than half of the media and communication respondents (51%)
fell in the 16 – 19yrs bracket, participants between 20 and 24 years accounted for thirty-seven per cent
(37%) and seven per cent (7%) of the students were between 25 and 29 years old. The 30 – 35 year
bracket and the over 40 year bracket accounted for three per cent (3%) and (2%) respectively. None of
the respondents fell in 35 – 39 year range. See figure 4.0 for the breakdown of figures.
10
Fig 4.0. Distribution of Participants by Age Range
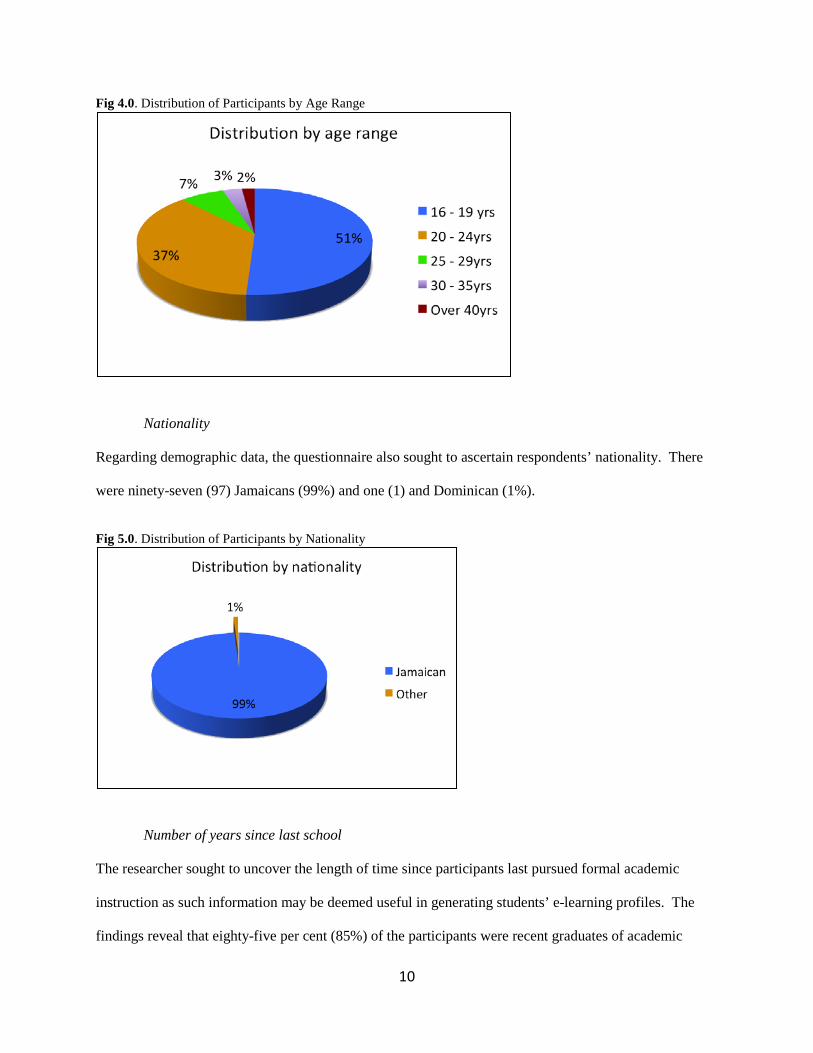
Nationality
Regarding demographic data, the questionnaire also sought to ascertain respondents’ nationality. There
were ninety-seven (97) Jamaicans (99%) and one (1) and Dominican (1%).
Fig 5.0. Distribution of Participants by Nationality
Number of years since last school
The researcher sought to uncover the length of time since participants last pursued formal academic
instruction as such information may be deemed useful in generating students’ e-learning profiles. The
findings reveal that eighty-five per cent (85%) of the participants were recent graduates of academic
11
institutions with the other fifteen per cent (15%) leaving schools four years and beyond. See figure 1.6
for the graphical representation.
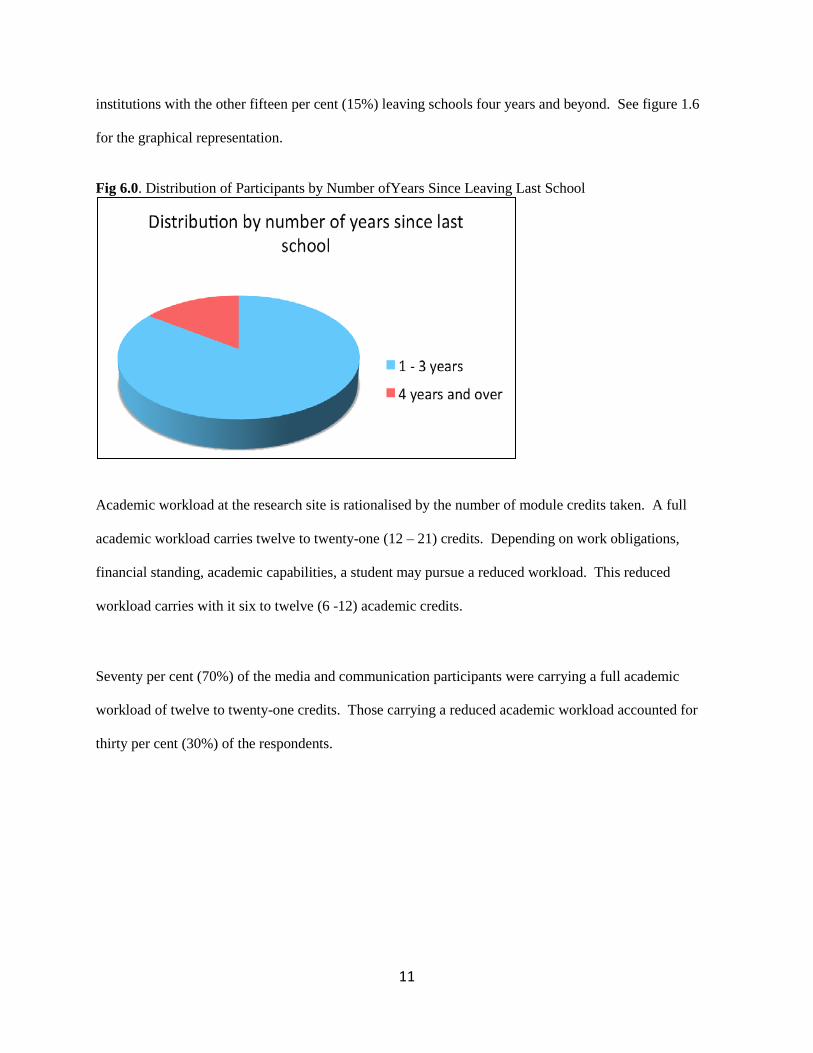
Fig 6.0. Distribution of Participants by Number ofYears Since Leaving Last School
Academic workload at the research site is rationalised by the number of module credits taken. A full
academic workload carries twelve to twenty-one (12 – 21) credits. Depending on work obligations,
financial standing, academic capabilities, a student may pursue a reduced workload. This reduced
workload carries with it six to twelve (6 -12) academic credits.
Seventy per cent (70%) of the media and communication participants were carrying a full academic
workload of twelve to twenty-one credits. Those carrying a reduced academic workload accounted for
thirty per cent (30%) of the respondents.
12
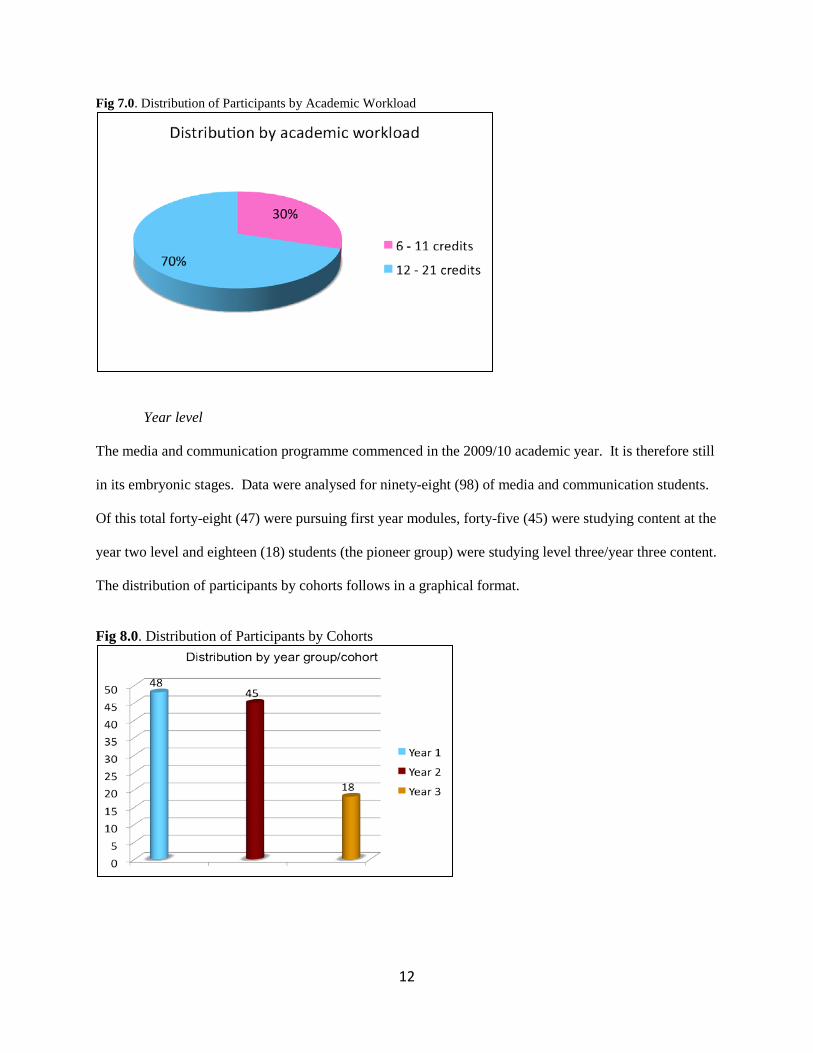
Fig 7.0. Distribution of Participants by Academic Workload
Year level
The media and communication programme commenced in the 2009/10 academic year. It is therefore still
in its embryonic stages. Data were analysed for ninety-eight (98) of media and communication students.
Of this total forty-eight (47) were pursuing first year modules, forty-five (45) were studying content at the
year two level and eighteen (18) students (the pioneer group) were studying level three/year three content.
The distribution of participants by cohorts follows in a graphical format.
Fig 8.0. Distribution of Participants by Cohorts
13
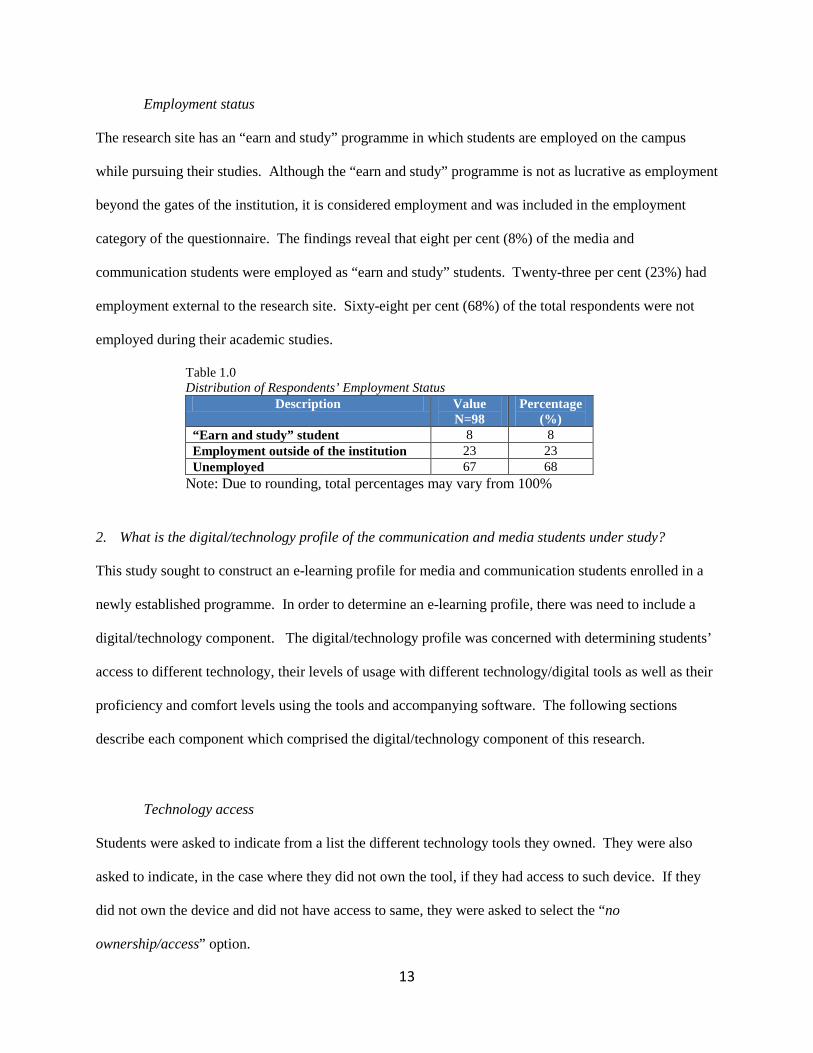
Employment status The research site has an “earn and study” programme in which students are employed on the campus
while pursuing their studies. Although the “earn and study” programme is not as lucrative as employment
beyond the gates of the institution, it is considered employment and was included in the employment
category of the questionnaire. The findings reveal that eight per cent (8%) of the media and
communication students were employed as “earn and study” students. Twenty-three per cent (23%) had
employment external to the research site. Sixty-eight per cent (68%) of the total respondents were not
employed during their academic studies.
Table 1.0 Distribution of Respondents’ Employment Status
Description Value N=98
Percentage (%)
“Earn and study” student 8 8 Employment outside of the institution 23 23 Unemployed 67 68
Note: Due to rounding, total percentages may vary from 100%
2. What is the digital/technology profile of the communication and media students under study?
This study sought to construct an e-learning profile for media and communication students enrolled in a
newly established programme. In order to determine an e-learning profile, there was need to include a
digital/technology component. The digital/technology profile was concerned with determining students’
access to different technology, their levels of usage with different technology/digital tools as well as their
proficiency and comfort levels using the tools and accompanying software. The following sections
describe each component which comprised the digital/technology component of this research.
Technology access
Students were asked to indicate from a list the different technology tools they owned. They were also
asked to indicate, in the case where they did not own the tool, if they had access to such device. If they
did not own the device and did not have access to same, they were asked to select the “no
ownership/access” option.
14
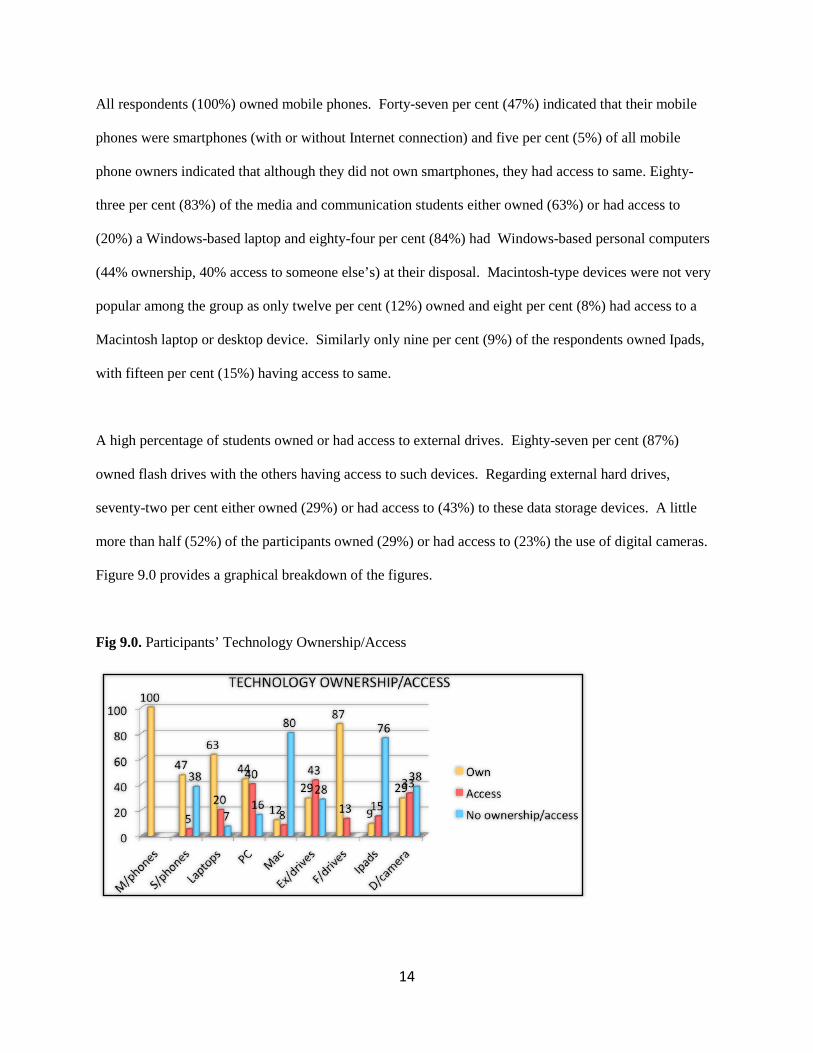
All respondents (100%) owned mobile phones. Forty-seven per cent (47%) indicated that their mobile
phones were smartphones (with or without Internet connection) and five per cent (5%) of all mobile
phone owners indicated that although they did not own smartphones, they had access to same. Eighty-
three per cent (83%) of the media and communication students either owned (63%) or had access to
(20%) a Windows-based laptop and eighty-four per cent (84%) had Windows-based personal computers
(44% ownership, 40% access to someone else’s) at their disposal. Macintosh-type devices were not very
popular among the group as only twelve per cent (12%) owned and eight per cent (8%) had access to a
Macintosh laptop or desktop device. Similarly only nine per cent (9%) of the respondents owned Ipads,
with fifteen per cent (15%) having access to same.
A high percentage of students owned or had access to external drives. Eighty-seven per cent (87%)
owned flash drives with the others having access to such devices. Regarding external hard drives,
seventy-two per cent either owned (29%) or had access to (43%) to these data storage devices. A little
more than half (52%) of the participants owned (29%) or had access to (23%) the use of digital cameras.
Figure 9.0 provides a graphical breakdown of the figures.
Fig 9.0. Participants’ Technology Ownership/Access
15
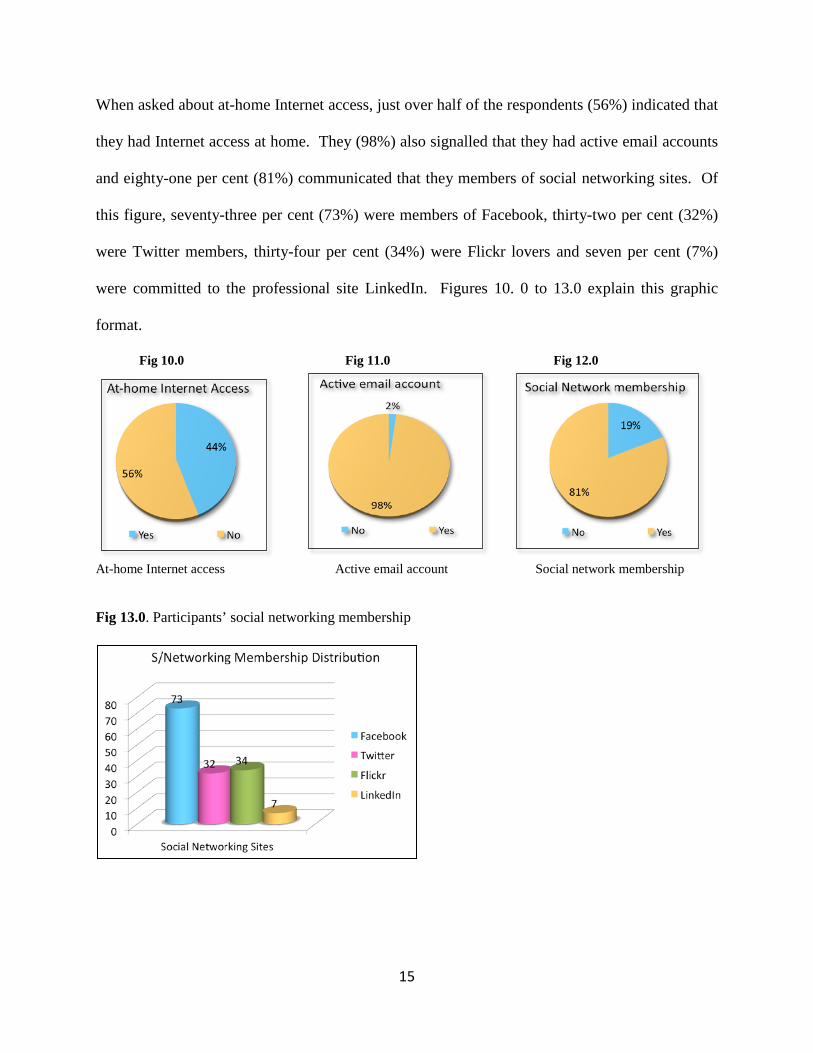
When asked about at-home Internet access, just over half of the respondents (56%) indicated that
they had Internet access at home. They (98%) also signalled that they had active email accounts
and eighty-one per cent (81%) communicated that they members of social networking sites. Of
this figure, seventy-three per cent (73%) were members of Facebook, thirty-two per cent (32%)
were Twitter members, thirty-four per cent (34%) were Flickr lovers and seven per cent (7%)
were committed to the professional site LinkedIn. Figures 10. 0 to 13.0 explain this graphic
format.
Fig 10.0 Fig 11.0 Fig 12.0
At-home Internet access Active email account Social network membership Fig 13.0. Participants’ social networking membership
16
Technology usage
Students’ utilisation of technology tools was divided into four sub-sets; each addressing participants’
usage of media and games, mobile devices, traditional web/Internet and web 2.0 tools. Students were
requested to indicate how frequently they used a selection of activities/tools. Frequency was
operationally defined into three bands; regularly (several times per day, once per day, several times per
week), occasionally which was explained as once per week or once per month and seldom which
accounted for usage every few months or once per year. If their usage patterns did not fall into any of
these categories, participants were advised to select the option “never”.
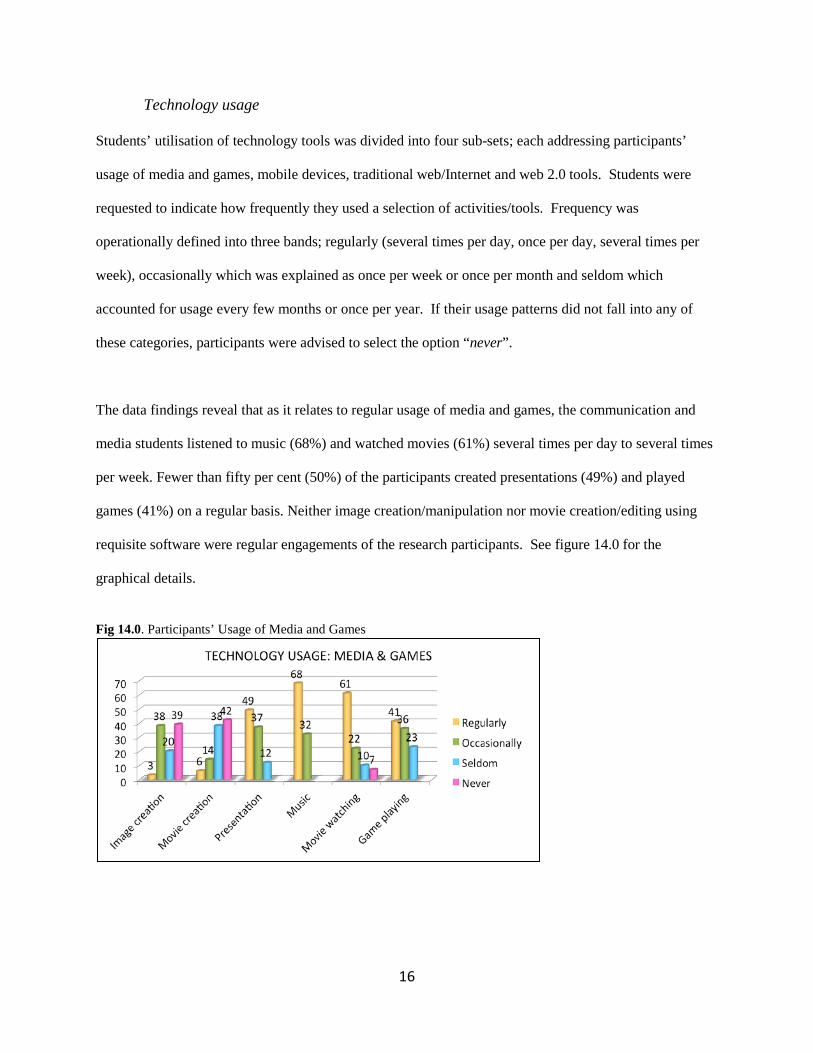
The data findings reveal that as it relates to regular usage of media and games, the communication and
media students listened to music (68%) and watched movies (61%) several times per day to several times
per week. Fewer than fifty per cent (50%) of the participants created presentations (49%) and played
games (41%) on a regular basis. Neither image creation/manipulation nor movie creation/editing using
requisite software were regular engagements of the research participants. See figure 14.0 for the
graphical details.
Fig 14.0. Participants’ Usage of Media and Games
17
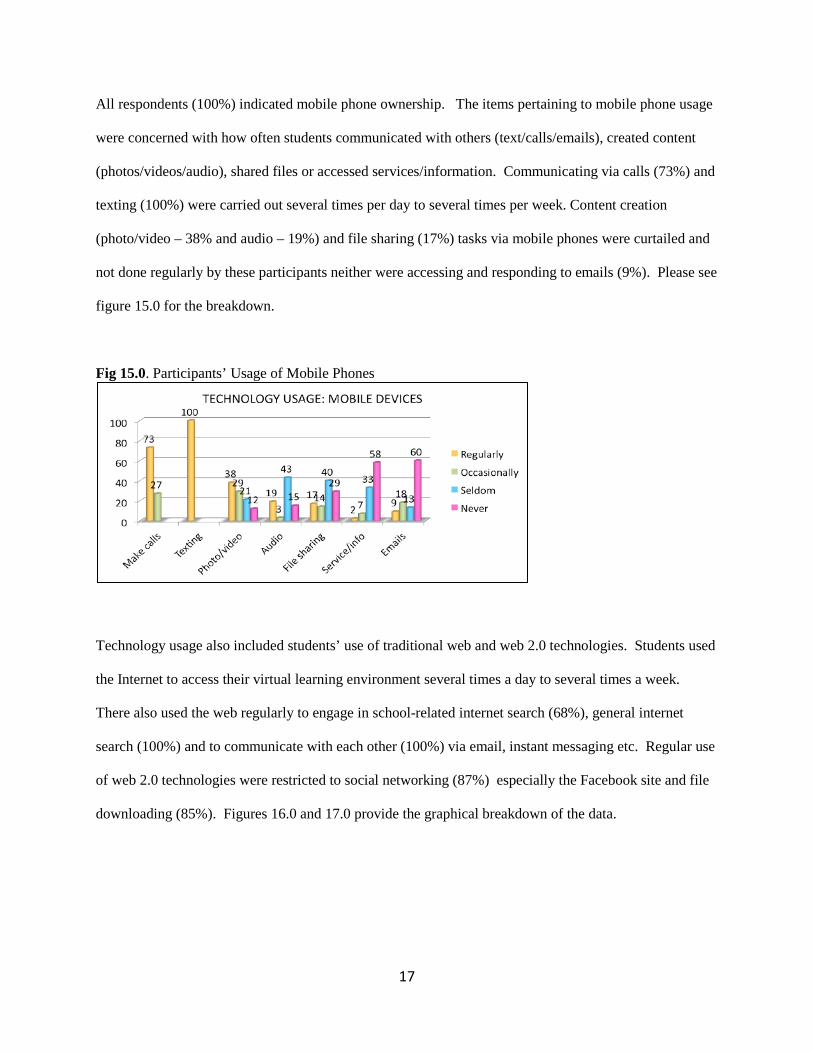
All respondents (100%) indicated mobile phone ownership. The items pertaining to mobile phone usage
were concerned with how often students communicated with others (text/calls/emails), created content
(photos/videos/audio), shared files or accessed services/information. Communicating via calls (73%) and
texting (100%) were carried out several times per day to several times per week. Content creation
(photo/video – 38% and audio – 19%) and file sharing (17%) tasks via mobile phones were curtailed and
not done regularly by these participants neither were accessing and responding to emails (9%). Please see
figure 15.0 for the breakdown.
Fig 15.0. Participants’ Usage of Mobile Phones
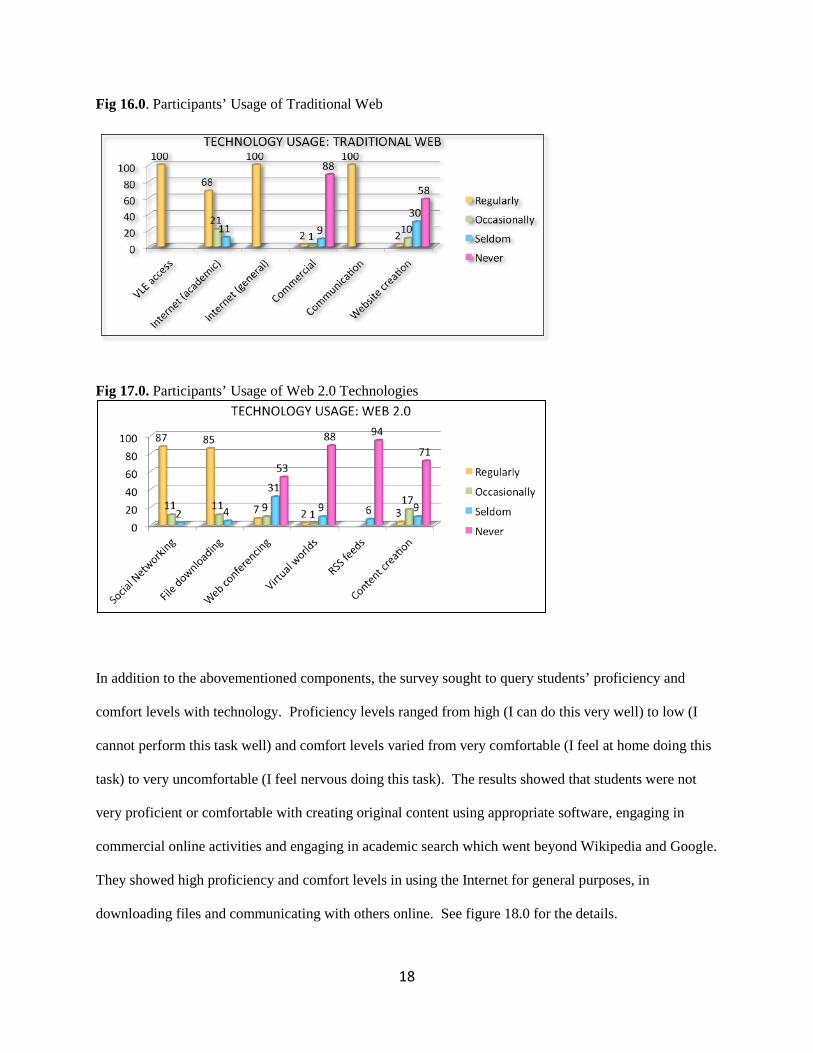
Technology usage also included students’ use of traditional web and web 2.0 technologies. Students used
the Internet to access their virtual learning environment several times a day to several times a week.
There also used the web regularly to engage in school-related internet search (68%), general internet
search (100%) and to communicate with each other (100%) via email, instant messaging etc. Regular use
of web 2.0 technologies were restricted to social networking (87%) especially the Facebook site and file
downloading (85%). Figures 16.0 and 17.0 provide the graphical breakdown of the data.
18
Fig 16.0. Participants’ Usage of Traditional Web
Fig 17.0. Participants’ Usage of Web 2.0 Technologies
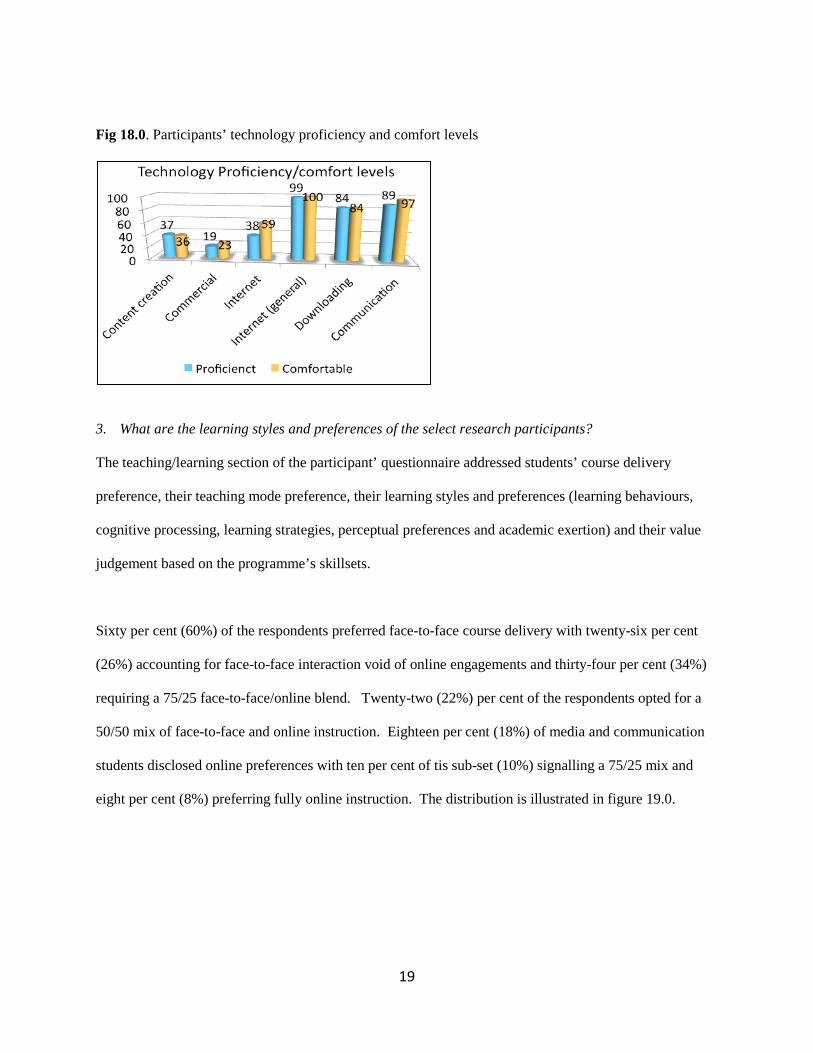
In addition to the abovementioned components, the survey sought to query students’ proficiency and
comfort levels with technology. Proficiency levels ranged from high (I can do this very well) to low (I
cannot perform this task well) and comfort levels varied from very comfortable (I feel at home doing this
task) to very uncomfortable (I feel nervous doing this task). The results showed that students were not
very proficient or comfortable with creating original content using appropriate software, engaging in
commercial online activities and engaging in academic search which went beyond Wikipedia and Google.
They showed high proficiency and comfort levels in using the Internet for general purposes, in
downloading files and communicating with others online. See figure 18.0 for the details.
19
Fig 18.0. Participants’ technology proficiency and comfort levels
3. What are the learning styles and preferences of the select research participants?
The teaching/learning section of the participant’ questionnaire addressed students’ course delivery
preference, their teaching mode preference, their learning styles and preferences (learning behaviours,
cognitive processing, learning strategies, perceptual preferences and academic exertion) and their value
judgement based on the programme’s skillsets.
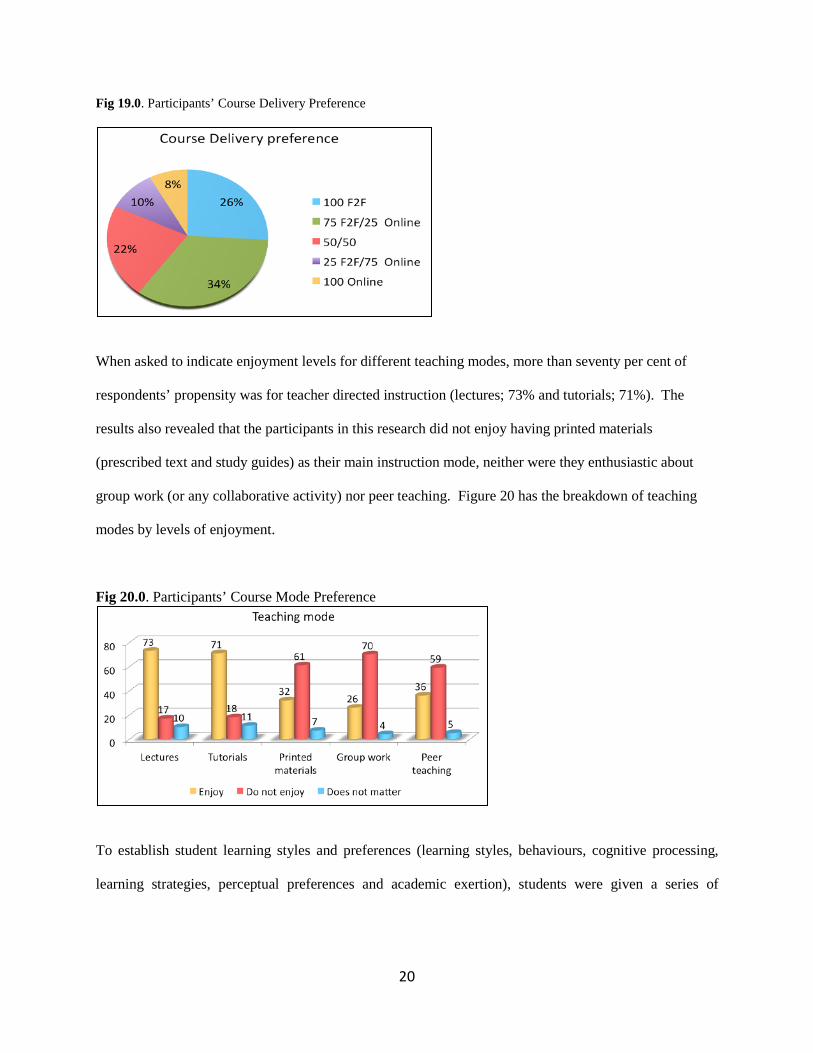
Sixty per cent (60%) of the respondents preferred face-to-face course delivery with twenty-six per cent
(26%) accounting for face-to-face interaction void of online engagements and thirty-four per cent (34%)
requiring a 75/25 face-to-face/online blend. Twenty-two (22%) per cent of the respondents opted for a
50/50 mix of face-to-face and online instruction. Eighteen per cent (18%) of media and communication
students disclosed online preferences with ten per cent of tis sub-set (10%) signalling a 75/25 mix and
eight per cent (8%) preferring fully online instruction. The distribution is illustrated in figure 19.0.
20
Fig 19.0. Participants’ Course Delivery Preference
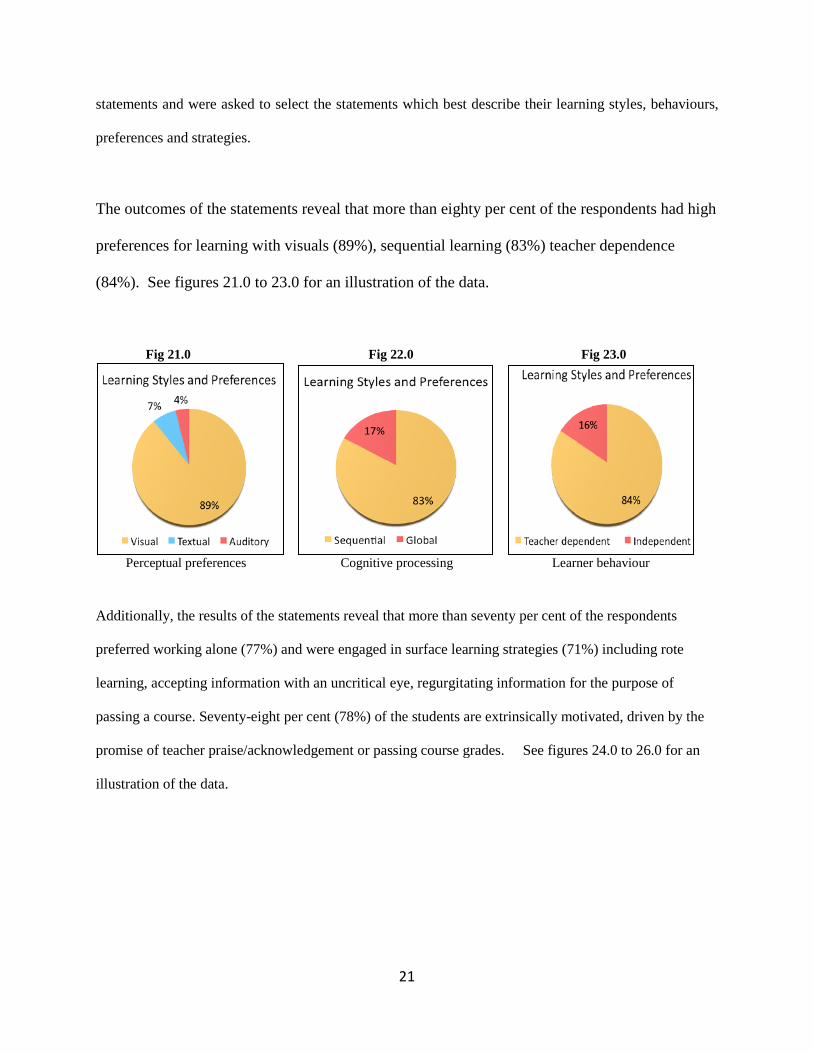
When asked to indicate enjoyment levels for different teaching modes, more than seventy per cent of
respondents’ propensity was for teacher directed instruction (lectures; 73% and tutorials; 71%). The
results also revealed that the participants in this research did not enjoy having printed materials
(prescribed text and study guides) as their main instruction mode, neither were they enthusiastic about
group work (or any collaborative activity) nor peer teaching. Figure 20 has the breakdown of teaching
modes by levels of enjoyment.
Fig 20.0. Participants’ Course Mode Preference
To establish student learning styles and preferences (learning styles, behaviours, cognitive processing,
learning strategies, perceptual preferences and academic exertion), students were given a series of
21
statements and were asked to select the statements which best describe their learning styles, behaviours,
preferences and strategies.
The outcomes of the statements reveal that more than eighty per cent of the respondents had high
preferences for learning with visuals (89%), sequential learning (83%) teacher dependence
(84%). See figures 21.0 to 23.0 for an illustration of the data.
Fig 21.0 Fig 22.0 Fig 23.0
Perceptual preferences Cognitive processing Learner behaviour
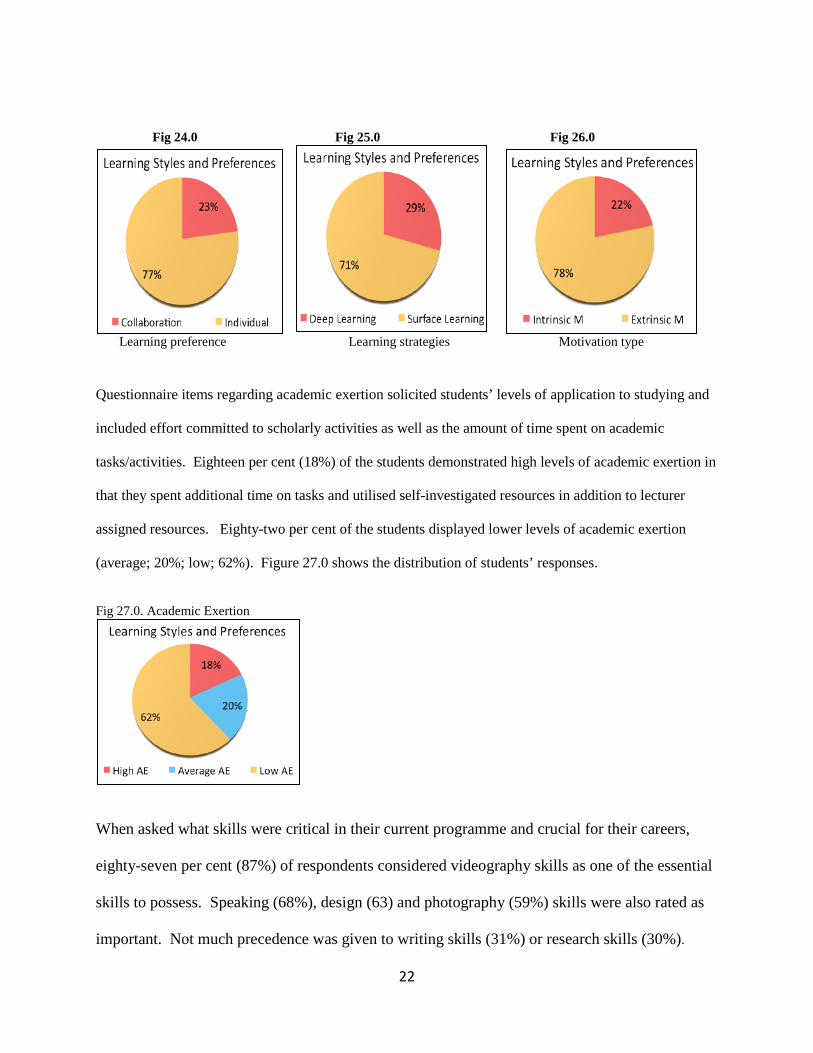
Additionally, the results of the statements reveal that more than seventy per cent of the respondents
preferred working alone (77%) and were engaged in surface learning strategies (71%) including rote
learning, accepting information with an uncritical eye, regurgitating information for the purpose of
passing a course. Seventy-eight per cent (78%) of the students are extrinsically motivated, driven by the
promise of teacher praise/acknowledgement or passing course grades. See figures 24.0 to 26.0 for an
illustration of the data.
22
Fig 24.0 Fig 25.0 Fig 26.0
Learning preference Learning strategies Motivation type
Questionnaire items regarding academic exertion solicited students’ levels of application to studying and
included effort committed to scholarly activities as well as the amount of time spent on academic
tasks/activities. Eighteen per cent (18%) of the students demonstrated high levels of academic exertion in
that they spent additional time on tasks and utilised self-investigated resources in addition to lecturer
assigned resources. Eighty-two per cent of the students displayed lower levels of academic exertion
(average; 20%; low; 62%). Figure 27.0 shows the distribution of students’ responses.
Fig 27.0. Academic Exertion
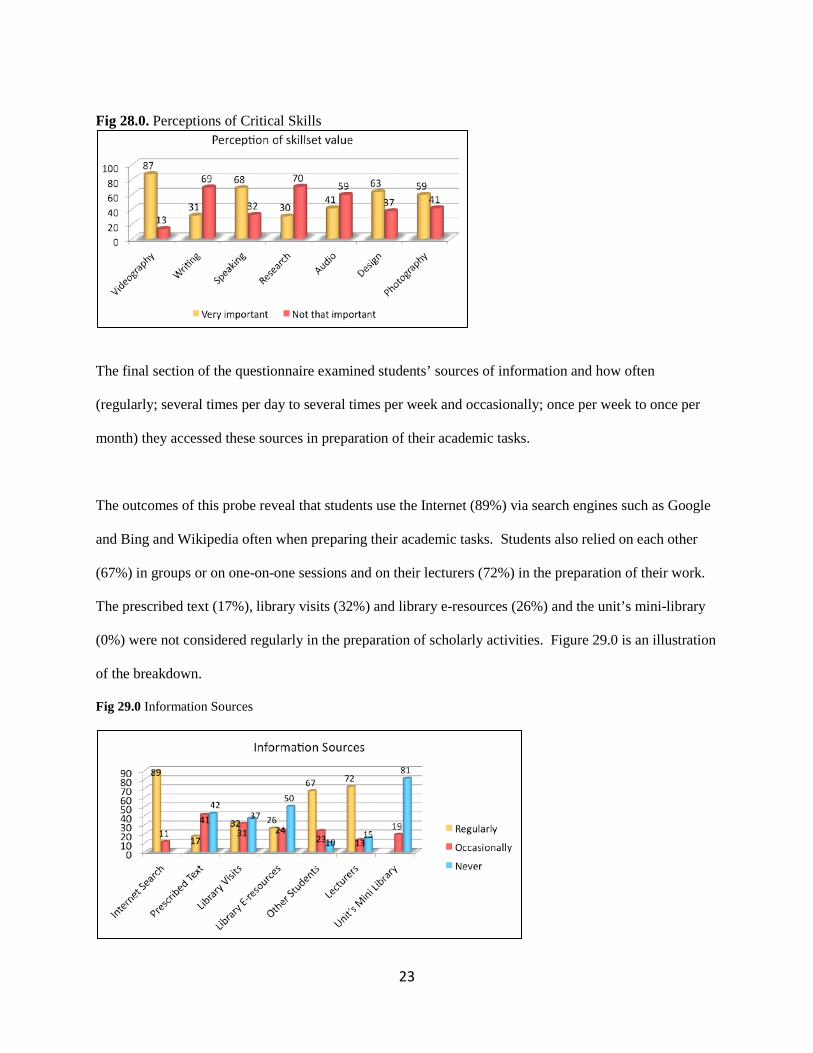
When asked what skills were critical in their current programme and crucial for their careers,
eighty-seven per cent (87%) of respondents considered videography skills as one of the essential
skills to possess. Speaking (68%), design (63) and photography (59%) skills were also rated as
important. Not much precedence was given to writing skills (31%) or research skills (30%).
23
Fig 28.0. Perceptions of Critical Skills
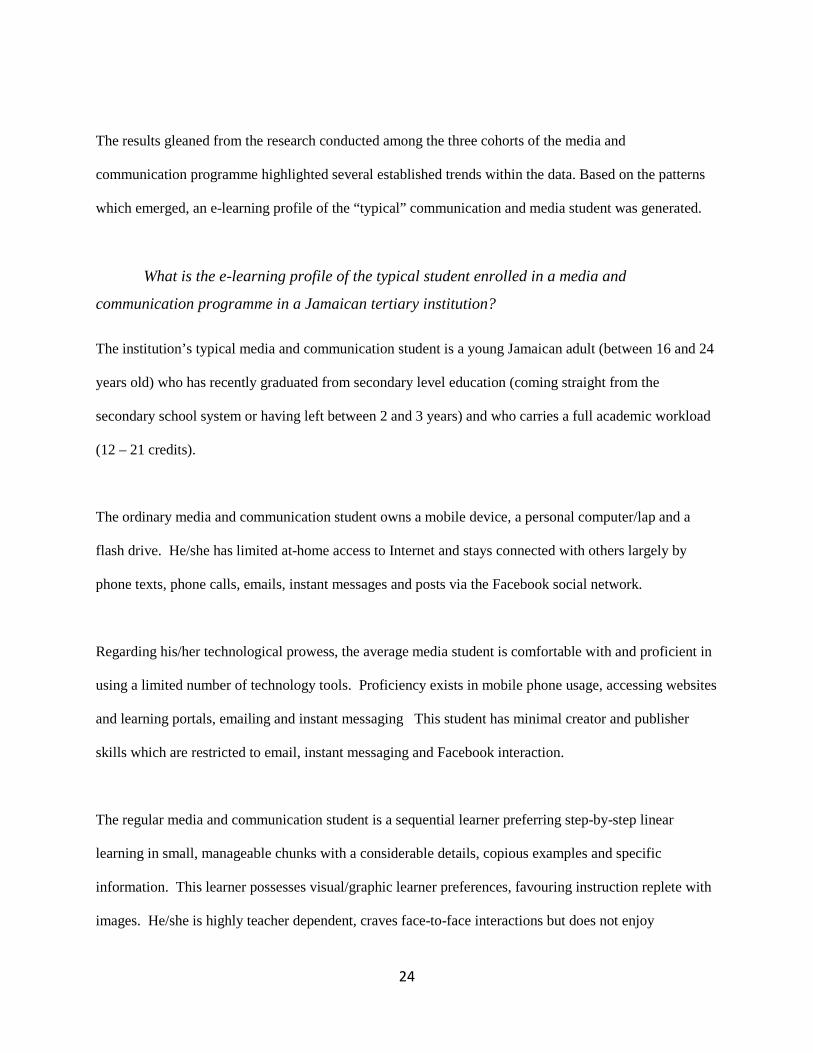
The final section of the questionnaire examined students’ sources of information and how often
(regularly; several times per day to several times per week and occasionally; once per week to once per
month) they accessed these sources in preparation of their academic tasks.
The outcomes of this probe reveal that students use the Internet (89%) via search engines such as Google
and Bing and Wikipedia often when preparing their academic tasks. Students also relied on each other
(67%) in groups or on one-on-one sessions and on their lecturers (72%) in the preparation of their work.
The prescribed text (17%), library visits (32%) and library e-resources (26%) and the unit’s mini-library
(0%) were not considered regularly in the preparation of scholarly activities. Figure 29.0 is an illustration
of the breakdown.
Fig 29.0 Information Sources
24
The results gleaned from the research conducted among the three cohorts of the media and
communication programme highlighted several established trends within the data. Based on the patterns
which emerged, an e-learning profile of the “typical” communication and media student was generated.
What is the e-learning profile of the typical student enrolled in a media and
communication programme in a Jamaican tertiary institution?
The institution’s typical media and communication student is a young Jamaican adult (between 16 and 24
years old) who has recently graduated from secondary level education (coming straight from the
secondary school system or having left between 2 and 3 years) and who carries a full academic workload
(12 – 21 credits).
The ordinary media and communication student owns a mobile device, a personal computer/lap and a
flash drive. He/she has limited at-home access to Internet and stays connected with others largely by
phone texts, phone calls, emails, instant messages and posts via the Facebook social network.
Regarding his/her technological prowess, the average media student is comfortable with and proficient in
using a limited number of technology tools. Proficiency exists in mobile phone usage, accessing websites
and learning portals, emailing and instant messaging This student has minimal creator and publisher
skills which are restricted to email, instant messaging and Facebook interaction.
The regular media and communication student is a sequential learner preferring step-by-step linear
learning in small, manageable chunks with a considerable details, copious examples and specific
information. This learner possesses visual/graphic learner preferences, favouring instruction replete with
images. He/she is highly teacher dependent, craves face-to-face interactions but does not enjoy
25
collaborative learning and tasks. He/she is extrinsically motivated, exerts minimum academic effort with
learning tasks and activities using general internet search (primarily Wikipedia), pulling on other students
and lecturers when preparing for assignments or quizzes.
IMPLICATIONS AND RECOMMENDATIONS Considering the typical students’ profile, what therefore are the implications and recommendations for an
online complement to the traditional face-to-face instruction in a communication and media programme
bearing a significant online seal? Education today dictates that faculty must prepare students to operate in
a 21st century context. This of course demands the establishment and development of 21st century skill
sets in learners.
The average communication and media student in this study hails directly from the secondary level where
instruction is largely traditional, favours and encourages teacher dependency (Akerlind and Trevitt, 1999;
Saddler-Smith & Riding,1999). At the tertiary level in Jamaica, students “read for their degree” and
student-directed learning is championed. Self-directed learning for these students is a new and frightening
concept which has to be carefully inculcated. Students have to be gradually weaned from the concept that
the teacher is all-knowing, ever-correct and ever-present.
The research results reveal that these communication and media students have a strong preference for
face-to-face instruction. This may be so because it is much easier to read non-verbal cues (Shade, 1989)
or it may stem from a high level of teacher dependence (Akerlind and Trevitt, 1999; Saddler-Smith &
Riding, 1999) which originates at the secondary level and is expected to be perpetuated at the tertiary
level. More compelling justifications seem to suggest that this preference may evolve from an absence of
at-home internet access (56% of the respondents state that they did not have at home internet access) or
more so from students’ high levels of discomfort with using online technologies for learning.
26
Participating in online learning engagements demands a certain degree of comfort with digital and online
technologies (Lee & Witta, 2001). In order to fully participate in online instructional activities, students
need to be able to use a variety of modern hardware and software applications. If the requisite skills are
deficient, students are likely to shun the online environment.
Facilitators will have to skilfully and gradually integrate online tools into the traditional curriculum,
allowing students to become more comfortable with the digital tools. Indeed, extended and on-going
scaffolding of communication and media content, relevant digital skillsets and appropriate attitudes
(moving students from the known to the unknown) will play a critical role in these students’ education.
Students share similar poor experiences of working in groups. The world for which the media and
communication student is being prepared however; is one which is replete with collaborative
engagements. The key to satisfactory group work lies in how the tasks are administered, how often they
are assigned and on providing a clear accountability structure for individuals in the group.
The majority students in this research are not adept or very comfortable with a range of technology
gadgets and software neither are they proficient in content creation. This programme dictates such
knowledge and skills. Comfort levels and proficiency can be developed gradually with scaffolding
(McLeod, 2010). This can be done with graphic-heavy instruction, a wide range of models, samples and
tips, segmentation of work with constant reference to the “bigger picture”. Implicit in this, is the
“unlearning and relearning of learned practices” among lecturers for successful classroom applications.
E-learning environments (learning environments on a whole) must be learner-centred. Learner-centricity
dictates knowing the learner and knowing him/her well. The development and utilisation of an e-
learning profile is instrumental for learner-centred instruction as it directs customization of based on
learner characteristics and behaviours, learning styles, preferences, strategies, knowledge and skills

27
competencies. The learning experiences and interaction of the average media and communication students
must reflect 21st century practices. The key priorities for Jamaican tertiary institutions in general and this
research site in particular, are to successfully engage learners and provide sufficient interaction and
scaffolding without overextending lecturers.
28
References Akerlind, G. & Trevitt, C. (1999). Enhancing self-directed learning through educational technology:
When students resist the change. Innovations in Education and Training International, 36(2), 96-105.
Amir, R., Jelas, M. & Rahman, S. (2011). Learning styles of university students: Implications for
teaching and learning. World Applied Sciences Journal, 14, 22-26. Babbie, E. (2007). The practice of social research. California: Cengage Learning. Bullen, M., Morgan, T., Belfer, K., & Qayyum, A. (2009). The net generation in higher education:
Rhetoric and reality. International Journal of Excellence in E-Learning, 2(1). Cercone, K. (2008). Characteristics of adult learners with implications for online learning design. AACE
Journal, 16(2), 137-159. Creswell, J. (2012). Educational research: Planning, conducting and evaluating quantitative and
qualitative research. Boston: Pearson Education. Denscombe, M. (2007). The good research guide for small-scale social research projects. Buckingham:
Open University Press. Gardner, D. & Miller, L. (2005). Establishing self-access: From theory to practice. Cambridge:
Cambridge University Press. Jeffrey, L., Atkins, C., Laurs, A. & Mann, S. (2006). ELearning profiles: Diversity in learning.
Retrieved from http://www.educationcounts.govt.nz/publications/ict/57985 Howe, N. & Strauss, W. (2000). Millennials rising: The next great generation. New York: Vintage
Books. Lee, C. & Witta, L. (2001). Online students’ perceived self-efficacy: Does it change? Retrieved from
http://articles.com/academic-articles/self-efficacy-and-online-learning/02341/php Laerd Dissertation. (2012). Total population sampling: An overview. Retrieved from
http://dissertation.laerd.com/articles/total-population-sampling-an-overview.php McLeod, S. (2010). Zone of proximal development - scaffolding - simply psychology. Retrieved from
http://www.simplypsychology.org/Zone-of-Proximal-Development.html Oblinger, D. & Oblinger, J. (2005). Educating the next generation. Retrieved from
http://net.educause.edu/ir/library/pdf/pub7101.pdf Palloff, N. & Pratt, K. (2003). The virtual student: A profile and guide for working with online learners.
29
San Francisco: John Wiley and Sons. Rothwell, W. & Kazanas, H. (2008). Mastering the instructional design process: A systematic approach.
San Francisco: Pfeiffer Sadler-Smith, E. & Riding, R. (1999). Cognitive style and instructional preferences. Instructional
Science, 27, 355-371. Shade, B. 1989. Culture, style, and the educative process. Springfield: Thomas. Silverman, D. & Marvasti, A. (2008). Doing qualitative research: A comprehensive guide. Thousand
Oaks: Sage Publication. Tapscott, D. (2009). Grown up digital: How the net generation is changing your world. New York:
McGraw-Hill. Tucker, S. (2003). A portrait of distance learners in higher education. Turkish Online Journal of
Distance Education, 4 (3).