Differential responses of phytoplankton and heterotrophic bacteria to organic and inorganic nutrient...
17
MARINE ECOLOGY PROGRESS SERIES Mar Ecol Prog Ser Vol. 416: 17–33, 2010 doi: 10.3354/meps08776 Published October 14 INTRODUCTION Anthropogenic alterations of global biogeochemical cycles are changing the magnitude and nature of mat- ter inputs into the ocean (Falkowski et al. 1998, Gal- loway & Cowling 2002, Matthews 2006, Duce et al. 2008). This phenomenon is particularly relevant in coastal regions, where a large fraction of the human population is concentrated (Vitousek et al. 1997, Paerl et al. 2002). A broad range of studies in coastal waters have shown that nitrogen (N) controls the rate of primary production (PP ) in many estuarine and coastal waters (Nixon & Pilson 1983, Oviatt et al. 1995). It is estimated that N inputs into the ocean have increased 2- to 3-fold in the past century (up to 15-fold in some coastal loca- © Inter-Research 2010 · www.int-res.com *Email: [email protected] Differential responses of phytoplankton and heterotrophic bacteria to organic and inorganic nutrient additions in coastal waters off the NW Iberian Peninsula Sandra Martínez-García 1, *, Emilio Fernández 1 , Xosé-Antón Álvarez-Salgado 2 , Jose González 1 , Christian Lønborg 2, 3 , Emilio Marañón 1 , Xosé-Anxelu G. Morán 4 , Eva Teira 1 1 Departamento Ecoloxía e Bioloxía Animal, Universidade de Vigo, Campus Lagoas-Marcosende, 36310 Vigo, Spain 2 CSIC, Insituto de Investigacións Mariñas, Eduardo Cabello 6, 36208 Vigo, Spain 3 Scottish Association for Marine Science, Oban, Argyll PA37 1QA, UK 4 Instituto Español de Oceanografía, Centro Oceanográfico de Xixón, Camín de L’Arbeyal s/n, 33212 Xixón, Spain ABSTRACT: The short-term effects of inorganic N and P (nitrate, ammonium, phosphate) and organic C and N (glucose, amino acids) input, added separately as well as jointly, on microplankton commu- nity structure and metabolism were studied in 6 microcosm experiments conducted from February to July 2008 in a eutrophic coastal embayment in NW Spain under contrasting hydrographic conditions. The responses of planktonic communities were highly variable. Strong positive effects of combined inorganic and organic nutrient enrichments for phytoplankton and heterotrophic bacteria were found. In most experiments enhanced phytoplankton biomass and productivity (primary production increased up to 5.5-fold) was measured after mixed (inorganic plus organic) additions but phyto- plankton responded only in one of the experiments after inorganic additions. Heterotrophic bacteria responded faster than phytoplankton to the additions but were never affected by inorganic nutrient additions, suggesting a C limitation of bacterial activity in this coastal environment. Heterotrophic bacteria biomass, productivity, and respiration responded to mixed additions (containing C, N, and P) in all the experiments (bacterial production increased from 14- to 34-fold) whereas its response to organic (containing C and N) additions greatly differed among experiments (bacterial production increased from 0.6- to 21-fold), which could be partially related to P availability. A general increase in bacterial growth efficiency occurred only after mixed additions (up to 2-fold). The tendency towards heterotrophy of the microbial plankton community was weaker after the mixed (Production/Respira- tion (P/R) ratio changes from 0.34- to 1.6-fold) than after the organic additions (P/R changes from 0.16- to 0.8-fold). Our results suggest that phytoplankton requirememnts for organic nutrients for growth and P deficiency of bacterial populations intermittently occur in this coastal area. KEY WORDS: Nutrient additions · Organic nitrogen · Phytoplankton · Bacteria Resale or republication not permitted without written consent of the publisher
-
Upload
independent -
Category
Documents
-
view
0 -
download
0
Transcript of Differential responses of phytoplankton and heterotrophic bacteria to organic and inorganic nutrient...

MARINE ECOLOGY PROGRESS SERIESMar Ecol Prog Ser
Vol. 416: 17–33, 2010doi: 10.3354/meps08776
Published October 14
INTRODUCTION
Anthropogenic alterations of global biogeochemicalcycles are changing the magnitude and nature of mat-ter inputs into the ocean (Falkowski et al. 1998, Gal-loway & Cowling 2002, Matthews 2006, Duce et al.2008). This phenomenon is particularly relevant incoastal regions, where a large fraction of the human
population is concentrated (Vitousek et al. 1997, Paerlet al. 2002).
A broad range of studies in coastal waters haveshown that nitrogen (N) controls the rate of primaryproduction (PP) in many estuarine and coastal waters(Nixon & Pilson 1983, Oviatt et al. 1995). It is estimatedthat N inputs into the ocean have increased 2- to 3-foldin the past century (up to 15-fold in some coastal loca-
© Inter-Research 2010 · www.int-res.com*Email: [email protected]
Differential responses of phytoplankton andheterotrophic bacteria to organic and inorganic
nutrient additions in coastal waters off the NW Iberian Peninsula
Sandra Martínez-García1,*, Emilio Fernández1, Xosé-Antón Álvarez-Salgado2, Jose González1, Christian Lønborg2, 3, Emilio Marañón1, Xosé-Anxelu G. Morán4,
Eva Teira1
1Departamento Ecoloxía e Bioloxía Animal, Universidade de Vigo, Campus Lagoas-Marcosende, 36310 Vigo, Spain2CSIC, Insituto de Investigacións Mariñas, Eduardo Cabello 6, 36208 Vigo, Spain
3Scottish Association for Marine Science, Oban, Argyll PA37 1QA, UK4Instituto Español de Oceanografía, Centro Oceanográfico de Xixón, Camín de L’Arbeyal s/n, 33212 Xixón, Spain
ABSTRACT: The short-term effects of inorganic N and P (nitrate, ammonium, phosphate) and organicC and N (glucose, amino acids) input, added separately as well as jointly, on microplankton commu-nity structure and metabolism were studied in 6 microcosm experiments conducted from February toJuly 2008 in a eutrophic coastal embayment in NW Spain under contrasting hydrographic conditions.The responses of planktonic communities were highly variable. Strong positive effects of combinedinorganic and organic nutrient enrichments for phytoplankton and heterotrophic bacteria werefound. In most experiments enhanced phytoplankton biomass and productivity (primary productionincreased up to 5.5-fold) was measured after mixed (inorganic plus organic) additions but phyto-plankton responded only in one of the experiments after inorganic additions. Heterotrophic bacteriaresponded faster than phytoplankton to the additions but were never affected by inorganic nutrientadditions, suggesting a C limitation of bacterial activity in this coastal environment. Heterotrophicbacteria biomass, productivity, and respiration responded to mixed additions (containing C, N, and P)in all the experiments (bacterial production increased from 14- to 34-fold) whereas its response toorganic (containing C and N) additions greatly differed among experiments (bacterial productionincreased from 0.6- to 21-fold), which could be partially related to P availability. A general increase inbacterial growth efficiency occurred only after mixed additions (up to 2-fold). The tendency towardsheterotrophy of the microbial plankton community was weaker after the mixed (Production/Respira-tion (P/R) ratio changes from 0.34- to 1.6-fold) than after the organic additions (P/R changes from 0.16-to 0.8-fold). Our results suggest that phytoplankton requirememnts for organic nutrients for growthand P deficiency of bacterial populations intermittently occur in this coastal area.
KEY WORDS: Nutrient additions · Organic nitrogen · Phytoplankton · Bacteria
Resale or republication not permitted without written consent of the publisher
Mar Ecol Prog Ser 416: 17–33, 2010
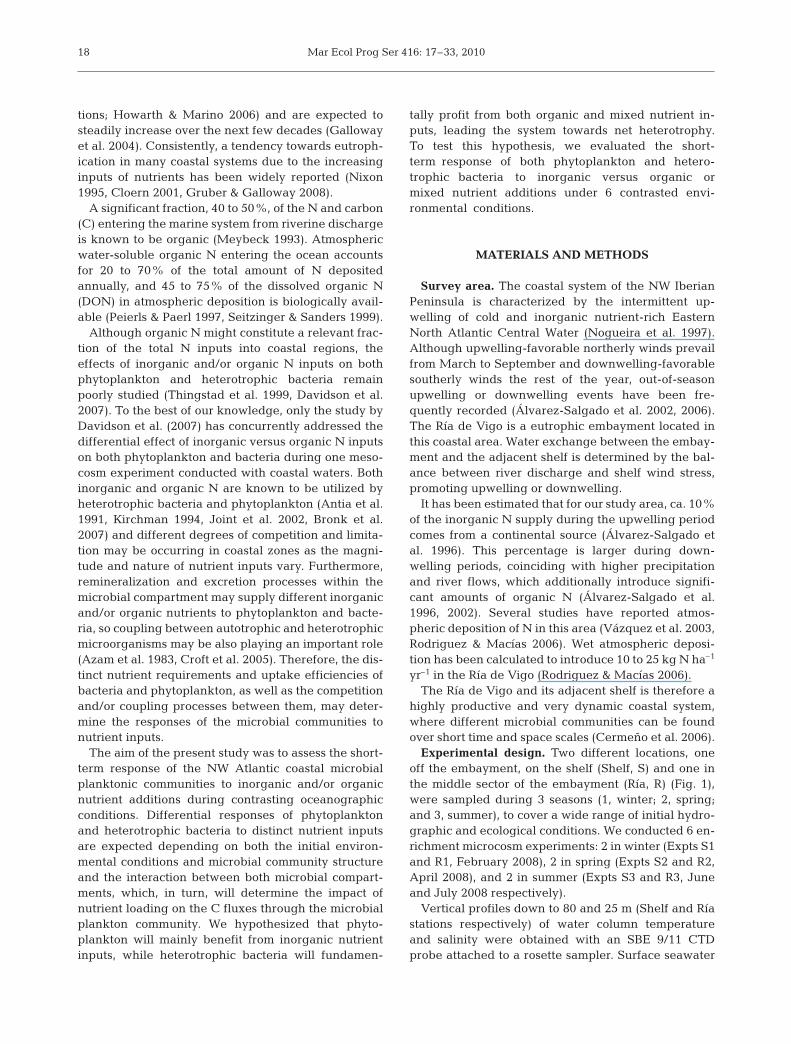
tions; Howarth & Marino 2006) and are expected tosteadily increase over the next few decades (Gallowayet al. 2004). Consistently, a tendency towards eutroph-ication in many coastal systems due to the increasinginputs of nutrients has been widely reported (Nixon1995, Cloern 2001, Gruber & Galloway 2008).
A significant fraction, 40 to 50%, of the N and carbon(C) entering the marine system from riverine dischargeis known to be organic (Meybeck 1993). Atmosphericwater-soluble organic N entering the ocean accountsfor 20 to 70% of the total amount of N depositedannually, and 45 to 75% of the dissolved organic N(DON) in atmospheric deposition is biologically avail-able (Peierls & Paerl 1997, Seitzinger & Sanders 1999).
Although organic N might constitute a relevant frac-tion of the total N inputs into coastal regions, theeffects of inorganic and/or organic N inputs on bothphytoplankton and heterotrophic bacteria remainpoorly studied (Thingstad et al. 1999, Davidson et al.2007). To the best of our knowledge, only the study byDavidson et al. (2007) has concurrently addressed thedifferential effect of inorganic versus organic N inputson both phytoplankton and bacteria during one meso-cosm experiment conducted with coastal waters. Bothinorganic and organic N are known to be utilized byheterotrophic bacteria and phytoplankton (Antia et al.1991, Kirchman 1994, Joint et al. 2002, Bronk et al.2007) and different degrees of competition and limita-tion may be occurring in coastal zones as the magni-tude and nature of nutrient inputs vary. Furthermore,remineralization and excretion processes within themicrobial compartment may supply different inorganicand/or organic nutrients to phytoplankton and bacte-ria, so coupling between autotrophic and heterotrophicmicroorganisms may be also playing an important role(Azam et al. 1983, Croft et al. 2005). Therefore, the dis-tinct nutrient requirements and uptake efficiencies ofbacteria and phytoplankton, as well as the competitionand/or coupling processes between them, may deter-mine the responses of the microbial communities tonutrient inputs.
The aim of the present study was to assess the short-term response of the NW Atlantic coastal microbialplanktonic communities to inorganic and/or organicnutrient additions during contrasting oceanographicconditions. Differential responses of phytoplanktonand heterotrophic bacteria to distinct nutrient inputsare expected depending on both the initial environ-mental conditions and microbial community structureand the interaction between both microbial compart-ments, which, in turn, will determine the impact ofnutrient loading on the C fluxes through the microbialplankton community. We hypothesized that phyto-plankton will mainly benefit from inorganic nutrientinputs, while heterotrophic bacteria will fundamen-
tally profit from both organic and mixed nutrient in-puts, leading the system towards net heterotrophy.To test this hypothesis, we evaluated the short-term response of both phytoplankton and hetero-trophic bacteria to inorganic versus organic ormixed nutrient additions under 6 contrasted envi-ronmental conditions.
MATERIALS AND METHODS
Survey area. The coastal system of the NW IberianPeninsula is characterized by the intermittent up-welling of cold and inorganic nutrient-rich EasternNorth Atlantic Central Water (Nogueira et al. 1997).Although upwelling-favorable northerly winds prevailfrom March to September and downwelling-favorablesoutherly winds the rest of the year, out-of-seasonupwelling or downwelling events have been fre-quently recorded (Álvarez-Salgado et al. 2002, 2006).The Ría de Vigo is a eutrophic embayment located inthis coastal area. Water exchange between the embay-ment and the adjacent shelf is determined by the bal-ance between river discharge and shelf wind stress,promoting upwelling or downwelling.
It has been estimated that for our study area, ca. 10%of the inorganic N supply during the upwelling periodcomes from a continental source (Álvarez-Salgado etal. 1996). This percentage is larger during down-welling periods, coinciding with higher precipitationand river flows, which additionally introduce signifi-cant amounts of organic N (Álvarez-Salgado et al.1996, 2002). Several studies have reported atmos-pheric deposition of N in this area (Vázquez et al. 2003,Rodriguez & Macías 2006). Wet atmospheric deposi-tion has been calculated to introduce 10 to 25 kg N ha–1
yr–1 in the Ría de Vigo (Rodriguez & Macías 2006).The Ría de Vigo and its adjacent shelf is therefore a
highly productive and very dynamic coastal system,where different microbial communities can be foundover short time and space scales (Cermeño et al. 2006).
Experimental design. Two different locations, oneoff the embayment, on the shelf (Shelf, S) and one inthe middle sector of the embayment (Ría, R) (Fig. 1),were sampled during 3 seasons (1, winter; 2, spring;and 3, summer), to cover a wide range of initial hydro-graphic and ecological conditions. We conducted 6 en-richment microcosm experiments: 2 in winter (Expts S1and R1, February 2008), 2 in spring (Expts S2 and R2,April 2008), and 2 in summer (Expts S3 and R3, Juneand July 2008 respectively).
Vertical profiles down to 80 and 25 m (Shelf and Ríastations respectively) of water column temperatureand salinity were obtained with an SBE 9/11 CTDprobe attached to a rosette sampler. Surface seawater
18

Martínez-García et al.: Coastal microbial plankton response to nutrients
samples (5 to 10 m) were collected in 12 l acid-cleanedNiskin bottles and filtered through a 200 µm pore sizemesh to remove larger zooplankton in order to ensuregood replication, given the difficulty to homoge-neously sample these organisms in 12 l bottles. Subse-quently, 12 l acid-washed polycarbonate bottles weregently filled under dim light conditions.
The experimental design included duplicate bottlesfor a series of 4 treatment levels: (1) control treatment:no additions made; (2) inorganic addition treatment:5 µmol l–1 nitrate (NO3
–), 5 µmol l–1 ammonium (NH4+),
1 µmol l–1 phosphate (HPO42–); (3) organic addition
treatment: 5 µmol l–1 glucose and 5 µmol l–1 of anequimolar mixture of 18 amino acids (all protein aminoacids, except cysteine and tyrosine); (4) mixed additiontreatment: combination of inorganic and organic addi-tions. The nitrogen:phosphorus (N:P) ratio of theseadditions was 10:1 to 15:1 depending on the additionmade (inorganic or mixed addition treatment), thusavoiding P-limited additions in the inorganic andmixed treatment. The C:N ratio of these additions wasca. 3.3:1 to 10:1 depending on the addition made(mixed or organic addition). Organic additions wereperformed to simulate the increases of bioavailableorganic N in atmospheric and/or continental discharge(Meybeck 1993, Peierls & Paerl 1997, Seitzinger &Sanders 1999). Furthermore, atmospheric depositionand river discharge have been demonstrated to con-tain not only organic N but also labile dissolvedorganic C (DOC) (Meybeck 1993, Jacobson et al. 2000,
Cauwet 2002, Jurado et al. 2008). We therefore addedglucose and amino acids, as they are among the mostabundant organic labile substances identified in sea-water (Benner 2002, Bronk 2002). Despite its poten-tially important role, dissolved organic P (DOP) wasnot included in the organic addition as the fluxes ofDOP are less well documented than those of C and N(Meybeck 1993, Cauwet 2002, Karl & Björkman 2002).
The experimental bottles were maintained in atemperature-controlled room at in situ temperature(±0.1°C). Bottles were illuminated with cool white lightfrom fluorescent tubes. The photoperiod ranged from12 h light: 12 h dark to 14 h light :10 h dark dependingon the season of sampling, and the average photosyn-thetically active radiation (PAR) was 240 µE m–2 s–1. Toprevent cell sedimentation, bottles were placed onrollers which rotated them at ca. 6 rpm. After pre-screening, samples were incubated overnight on therollers, and single nutrient additions were performedbefore the light was turned on. Initial conditions weremeasured just after the nutrient additions. Experi-ments lasted 3 d and samples were taken every 24 h tomonitor changes in microbial community structure andmetabolism.
Inorganic and organic nutrients. Aliquots for in-organic nutrient determinations (ammonium, nitrite, ni-trate, phosphate, and silicate) were collected in 50 mlpolyethylene bottles and frozen at –20°C until analysisby standard colorimetric methods with an Alpkemsegmented flow analyzer (Hansen & Grasshoff 1983).
19
8.9° W 8.8° 8.7° 8.6°
Longitude
42.15°
42.20°
42.25°
42.30°
42.35° N
Latitu
de
Ría de Vigo
Iberian
Peninsula
75
m
40 m
20 m20 m
Ría
Shelf
Fig. 1. The NW Iberian margin (inset) and locations of the stations that were sampled in the Ría de Vigo and on the shelf
Mar Ecol Prog Ser 416: 17–33, 2010
Water for the analysis of DOC was filtered through0.2 µm filters (Pall, Supor membrane Disc Filter) in anall-glass filtration system under positive pressure of N2,collected into pre-combusted (450°C, 12 h) 10 ml glassampoules, and acidified with H3PO4 to pH < 2 beforeheat sealing. Samples were measured in a ShimadzuTOC-CVS analyzer (Pt-catalyst) following Álvarez-Sal-gado & Miller (1998). Fluorescence measurementswere performed at a constant room temperature of25°C in a 1 cm quartz fluorescence cell in a PerkinElmer LS 55 luminescence spectrometer. Fluorescenceintensity was measured at a fixed excitation/emissionwavelength of 280 nm/350 nm, which is characteristicof protein-like materials (Coble 1996). Following Nieto-Cid et al. (2006), the spectrofluorometer was calibrateddaily with tryptophan (Trp) in 0.1 N sulfuric acid. Fluo-rescence of dissolved organic matter (FDOM) was ex-pressed in µg l–1 equivalents of Trp (hereinafter: ppbTrp). Equivalent concentrations were determined bysubtracting the average peak height from the MQblank height, and dividing by the slope of the standardcurve.
Size-fractionated chlorophyll a (chl a). Size-fraction-ated chl a concentrations were measured in 150 mlwater samples that were filtered sequentially through20, 5, 2, and 0.2 µm polycarbonate filters. After extractionwith 90% acetone at 4°C overnight in the dark, chl a flu-orescence was determined using the non-acidificationtechnique (Welschmeyer 1994), with a TD-700 TurnerDesigns fluorometer calibrated with pure chl a.
Photosynthetic efficiency (Fv/Fm). Fast repetition rate(FRR) fluorescence measurements were made using aChelsea Instruments Fasttracka FRR fluorometer (Estévez2007). Samples were adapted to dark conditions for30 min in order to ensure relaxation of non-photochem-ical quenching. A single turnover protocol was used: aflash sequence consisting of a series of 100 saturationflashlets (1.34 µs flash duration and 2.8 µs flash period)and a series of 20 relaxation flashlets (1.34 µs flash du-ration and 51.6 µs flash period). Measurements of three50 ml replicates were performed in dark conditions inthe FRR fluorometer dark chamber (30 acquisitions of8 averaged flash sequences). Autogaining mode wasused in order to ensure that the optimal gain was beingapplied and to avoid saturation problems. Blanks (wa-ter samples filtered through Millipore glass-fiber filters)were measured at fixed gains for every addition treat-ment every sampling day. Data were processed usingthe Fasttracka postprocessing software Frs (provided byChelsea Instruments). The ratio Fv/Fm was calculatedfor each replicate, and then a mean of the 3 values wasobtained for each microcosm bottle.
Primary production (PP). Four 75 ml acid-cleanedpolystyrene bottles (3 light and 1 dark) were filled withseawater and spiked with 185 kBq (5 µCi) NaH14CO3.
Samples were incubated for 3 to 4 h in the same incu-bation chamber as the experimental bottles. After theincubation period, samples were sequentially filteredthrough 20, 5, 2, and 0.2 µm polycarbonate filters atvery low vacuum (<50 mm Hg). Filters were processedto assess 14C incorporation as described in Marañón etal. (2001). Hourly PP rates presented in the presentstudy correspond to PP rates in the particulate fraction.Given that the incubations lasted 3 to 4 h, they can beconsidered to be close to gross rates. Daily gross PPrates estimated using a correction factor for phyto-plankton respiration of 20% and a percentage of extra-cellular release (PER) of 20% (Marañón et al. 2004)were used for the calculation of the PP to communityrespiration (CR) ratio (PP/CR).
Bacterial heterotrophic production (BP). The[3H]leucine incorporation method (Kirchman et al.1985), modified as described by Smith & Azam (1992),was used to determine leucine (Leu) incorporationrates (LIR). Samples were incubated for 1 h in the sameincubation chamber as the experimental bottles. Eightdilution experiments, 4 in the Ría (Expt R3) and 4 onthe Shelf (Expt S3), were performed in order to deter-mine empirical Leu to C conversion factors for the con-trol, inorganic, organic, and mixed nutrient treatment,following methods detailed elsewhere (Calvo-Díaz &Morán 2009). No significant differences in conversionfactors were found between both sampling locations(t-test, p > 0.05). The mean conversion factors derivedwere: 2.6 ± 1.1 kg C mol Leu–1 for the control, 1.6 ±0.6 kg C mol Leu–1 for the inorganic treatment, 3.3 ±0.9 kg C mol Leu–1 for the organic treatment, and 4.4 ±1.3 kg C mol Leu–1 for the mixed treatment. Bacterialgrowth efficiency (BGE) was calculated as: BP/(BP +BR), where BR is bacterial respiration.
In vivo electron transport system (ETS). ETS activityrate was used as an estimator of CR. Size-fractionatedin vivo ETS activity rates were measured usingthe in vivo INT (2-para (iodo-phenyl)-3(nitrophenyl)-5(phenyl)-tetrazolium chloride) method (Martínez-García et al. 2009). Four 100 ml dark bottles were filledfrom each microcosm bottle. One bottle was immedi-ately fixed by adding formaldehyde (2% w/v final con-centration) and used as killed-control. Samples wereincubated at the same temperature as the microcosmbottles in dark conditions during 1 h. After incubation,samples were filtered sequentially through 0.8 and0.2 µm pore size polycarbonate filters. BR was opera-tionally defined as ETS activity < 0.8 µm (Robinson2008). In order to transform ETS activity into C respira-tion, a CR/ETS ratio of 12.8 (Martínez-García et al.2009) and a respiratory quotient (RQ) of 0.8 (Williams &del Giorgio 2005) were used.
Autotrophic and heterotrophic picoplankton. Theabundance of picoautotrophs (Synechococcus, Pro-
20

Martínez-García et al.: Coastal microbial plankton response to nutrients
chlorococcus, and picoeukaryotes) and heterotrophicbacteria was determined with a Becton DickinsonFACSCalibur flow cytometer equipped with a laseremitting at 488 nm (Calvo-Díaz & Morán 2006). Pico-plankton samples (1.8 ml) were preserved with 1%paraformaldehyde plus 0.05% glutaraldehyde, andfrozen at –80°C until analysis. Aliquots of the samesample were used for the analysis of picophytoplank-ton (0.6 ml) and heterotrophic bacteria (0.4 ml). Prior toanalysis, heterotrophic bacteria were stained with2.5 mM SybrGreen DNA fluorochrome.
Picoplankton groups were identified on the basis oftheir fluorescence and light side scatter (SSC) signa-tures. Synechococcus and Prochlorococcus cyanobac-teria and 3 groups of eukaryotic cells (small and largepicoeukaryotes plus cryptophytes) were identified inplots of SSC versus red fluorescence (FL3, >650 nm),and orange fluorescence (FL2, 585 nm) versus FL3.Small cryptophytes showed higher SSC and FL2 sig-nals than Synechococcus. More details are given inCalvo-Díaz & Morán (2006). Two groups of hetero-trophic bacteria were distinguished based on theirgreen fluorescence (FL1, 530 nm) as a proxy for nucleicacid content: low (LNA) and high nucleic acid (HNA)content bacteria.
The empirical calibrations between SSC and meancell diameter described in Calvo-Díaz & Morán (2006)were used to estimate biovolume (BV) of picoauto-trophs and heterotrophic bacteria. BV was finallyconverted into biomass by using the volume-to-C con-version factors from Worden et al. (2004) for picophyto-plankton and the allometric relationship of Norland(1993): fg C cell–1 = 120 × BV0.72 for heterotrophicbacteria.
Nano- and microphytoplankton identification. Forthe analysis of larger cells under the microscope,100 ml samples were preserved with Lugol’s solution.After sedimentation of a subsample (5 to 100 ml), cellswere identified, counted, and measured following themethod of Utermöhl (Lund et al. 1958) at 100 × and200 × magnification on an Olympus IX50 invertedmicroscope connected to an NIS-Elements BR 3.0image analysis program. Cell biovolume for each spe-cies was estimated from direct measurements of fixedcells under the microscope and by approximating thecells’ shape to the closest geometric shape followingOlenina et al. (2006) (whenever it was not possible toobtain the third dimension it was taken from Oleninaet al. 2006). Finally, C-to-volume relationships wereextracted from Menden-Deuer & Lessard (2000).
Statistical analysis. Repeated-measures ANOVA(RMANOVA) was conducted to assess time (incuba-tion time, within-subject factor), treatment (control,inorganic, organic, and mixed treatments, between-subject factor), and experiment (the 6 different experi-
ments performed, between-subject factor) effects. Foreach variable, data from the 4 treatments, the 6 exper-iments, and all sampling times were pulled together forthe RMANOVA test. All data fitted a normal distribu-tion (Kolmogorov-Smirnov test); however, even afterlog or arcsine data transformation, the homogeneity ofcovariance matrices failed for some data sets or vari-ables. For the latter case we applied the Huynh-Feldtadjustment to correct p-values (Scheiner & Gurevitch1993). A Bonferroni post hoc test was conducted toassess the direction (stimulation or inhibition) of theeffect of the addition treatments on the microbial vari-ables. In order to estimate and compare the magnitudeof the effect of different nutrient additions on the bio-masses and rates, we calculated response ratios (RR) asAT/C, where AT and C are the time-integrated valueof the variable over the 72 h incubation in the additiontreatment and the control, respectively. In the case ofbiomasses, time-averaged values were used. It isworth mentioning that no differences were foundeither in the time, experiment, and treatment effects(RMANOVA) or in the direction of the nutrient addi-tion effect over all the variables (Bonferroni post hoctest) using data from 0 to 24, 48, or 72 h.
RESULTS
Initial conditions
Initial conditions for each experiment are presentedin Table 1 and Fig. 2. Different hydrographic condi-tions were found during each survey. In winter (ExptsS1 and R1), low surface temperature and high nutri-ent concentration indicate intense vertical mixing.Spring surveys (Expts S2 and R2) were performedafter an upwelling event. In Expt R2, surface salinitywas 33.7, indicating important continental inputs atthis location at the time of sampling. Summer sam-plings (Expts S3 and R3) coincided with an upwellingevent.
Nitrate and nitrite concentrations varied 1 order ofmagnitude between stations and seasons (from 0.48 to10 µmol l–1 and from 0.03 to 0.8 µmol l–1 respectively).Phosphate initial concentrations ranged from 0.04 to1.19 µmol l–1 and were always higher in the Ría than inshelf waters. Silicate initial concentrations ranged from0.5 to 5.4 µmol l–1. DOC concentration ranged from73 to 86 µmol l–1. Chl a concentrations varied over 1order of magnitude and ranged from 0.18 to 2.10 µg l–1.
Nanophytoplankton (2 to 20 µm), mainly composedof dinoflagellates, dominated the phytoplankton com-munity in terms of chl a concentration in Expts S1 andS3, whereas >20 µm phytoplankton, mainly formedby diatoms, dominated in Expts R1, R2, R3, and S2
21

Mar Ecol Prog Ser 416: 17–33, 201022
Table 1. Summary of initial conditions for each experiment. Sampling depth was 5 to 10 m. DOC: dissolved organic carbon; FDOM: fluorescence of dissolved organic matter. Trp: tryptophan
Expt Surface Surface Chl a Surface nutrientstemperature salinity (µg l–1) NO3
– NO2– NH4
+ HPO4–2 SiO2 FDOM DOC
(°C) (µmol l–1) (µmol l–1) (µmol l–1) (µmol l–1) (µmol l–1) (ppb Trp) (µmol l–1)
S1 14.0 35.2 1.8 2.3 0.09 0.23 0.08 4.1 7.6 85S2 14.6 35.4 0.3 0.48 0.03 1.4 0.04 0.5 6.9 74S3 16.3 35.7 0.2 0.93 0.81 1.6 0.19 2.1 5.5 82R1 13.5 35.0 0.7 9.6 0.32 5.5 1.19 5.4 8.9 86R2 14.3 33.7 1.3 2.4 0.11 0.9 0.14 3.5 9.3 80R3 15.2 35.6 2.1 3.6 0.25 1.5 0.52 4.4 7.9 73
Ch
loro
phyll
a(µ
g l
–1)
0.0
0.5
1.0
1.5
2.0
2.5
0
5
10
15
20
25
0.2
0.3
0.4
0.5
0.60
1
2
3
4
5
Bacte
rial b
iom
ass
(µg
C l
–1)
0
10
20
30
40
LNA
HNA
A
D
E
F
G
H
<2 µm2–5 µm
5–20 µm
>20 µm
0
20
40
60< 0.8 µm
> 0.8 µm
Nan
o-
an
dM
icro
phyto
pla
nkto
n(µ
g C
l–1
)
0
20
40
60
80Diatoms
Flagellates
Dinoflagellates
B
Pic
op
hyto
pla
nkto
n(µ
g C
l–1
)
0
10
20
30
40
50Proch
Syne
Small P
Big P
Crypto
C
Bacte
rial p
rod
uctio
n(µ
g C
l–1
h–1
)F v
:Fm
Pri
mary
pro
du
ctio
n(µ
g C
l–1
h–1
) C
om
mu
nit
y r
esp
iratio
n(µ
g C
l–1
h–1
)
Experiment
S1 S2 S3 R1 R2 R3
Experiment
S1 S2 S3 R1 R2 R3
Fig. 2. Initial biological conditions at the sampling stations. (A) Size-fractionated chl a. (B) Nano- and microphytoplankton bio-mass. (C) Picophytoplankton biomass. Proch: Prochlorococcus; Syne: Synechococcus; Small P: small picoeukaryotes; Big P: big pi-coeukaryotes; Crypto: Cryptophyceae. (D) Heterotrophic bacterial biomass. LNA: low nucleic acid content; HNA: high nucleicacid content. (E) Size-fractionated primary production. (F) Photosynthetic efficiency (Fv/Fm). (G) Bacterial production. (H) Size-
fractionated community respiration estimated from in vivo electron transport system (ETS) activity

Martínez-García et al.: Coastal microbial plankton response to nutrients
(Fig. 2A,B). Large picoeukaryotes dominated the pico-phytoplankton size class in all experiments (Fig. 2C).
The variability in hourly gross PP was similar to thatof chl a concentration data. PP rates ranged from 0.27to 3.82 µg C l–1 h–1. The relative contribution of the dif-ferent size fractions to total PP paralleled that found inchl a concentration. Photosynthetic efficiency mea-sured as Fv/Fm was ca. 0.4 to 0.5 in all the experimentsexcept for Expt S3, where a very low value wasrecorded (0.25). Bacterial biomass (BB) ranged from12.6 to 32 µg C l–1 and BP rates ranged from 4.8 to15.9 µg C l–1 d–1. BB was highest in summer. HNA bac-teria dominated bacterial community biomass in allexperiments except for Expt S1. CR, estimated from invivo ETS activity, ranged from 19.8 to 50.1 µg C l–1 d–1.The contribution of BR (<0.8 µm fraction) to CR rangedfrom 21 to 52%.
Three different ratios, the initial phytoplankton bio-mass (PhytoB) relative to BB (PhytoB/BB_i), the initialdaily gross PP to daily CR ratio (PP/CR_i), and the ini-tial daily gross PP to daily BP ratio (PP/BP_i), were cal-culated to synthetically describe the initial microbialcommunity structure and metabolism. The PhytoB/BB_i ratio changed between experiments, and rangedfrom 0.4 to 6.5. The metabolic balance at initial condi-tions (PP/CR_i) (from 0.3 to 3) and the PP/BP_i ratio(from 0.3 to 14.6) were also highly variable amongexperiments (Fig. 3).
Statistically significant linear relationships werefound between PhytoB/BB_i and PP/BP_i (n = 6, r2 =0.84, p = 0.01) (Fig. 3A) and between PhytoB/BB_i andPP/CR_i (n = 6, r2 = 0.82, p = 0.012) (Fig. 3B).
Nutrient concentration
Nitrate and ammonium were exhausted in the mixedtreatment by the end of the incubation time in ExptsR1, R2, R3, and S1 (Fig. 4A,B). In all the experiments,phosphate was quickly consumed during the first incu-bation day in the mixed treatment although it was notexhausted in any of the experiments. Phosphatedecreased to a lesser extent in the inorganic treatment(Fig. 4C). Overall, silicate concentration remainedrather constant or slightly decreased throughout theincubation except for Expt R1, in which a sharp de-creased of silicate was observed in all the treatments(data not shown). The time course of FDOM shows thatthe added DON was consumed completely in themixed treatment in all experiments. In the organictreatment it was consumed completely in Expts R1, R2,and R3 and to a lesser extent in Expts S1, S2, and S3(Fig. 4D). DOC concentrations sharply decreased dur-ing the first incubation day in the mixed treatment.Decreases in DOC concentration in the organic treat-
ment paralleled those in the mixed treatment inExpts S3, R1, R2, and R3 and were less important inExpts S1 and S2 (Fig. 4E).
Autotrophic responses to nutrient additions
Different phytoplankton responses were recorded inthe 6 experiments (Fig. 5). Three different patterns ofresponse were found, although the largest responseswere always observed after the mixed additions (Bon-ferroni post hoc test, p < 0.05; Table 2).
Similar responses were registered in Expts S1, R1,R2, and R3 (Fig. 5). In these experiments, chl a and PPconsiderably increased relative to the control aftermixed additions (significantly increased in Expts R1and R3; Bonferroni post hoc test, p < 0.001) and smallerresponses were registered after inorganic and/ororganic additions. The magnitude of the responses(response ratios, RR) in the mixed treatment variedbetween experiments for chl a (chl aRR from 2.2- to3.4-fold) and for PP (PPRR from 1.9- to 5.5-fold). In ExptS2, chl a and PP similarly increased after inorganic
23
PhytoB/BB_i
0 2 4 6 8
PP
/CR
_i
0
1
2
3 S1
S2
S3
R1
R2
R3
B
PP
/BP
_i
0
4
8
12
16
S1
S2
S3
R1
R2
R3
A
Fig. 3. Initial phytoplankton biomass to bacterial biomass ratio(PhytoB/BB_i) versus: (A) initial primary production to bacter-ial production ratio (PP/BP_i) and (B) initial primary produc-tion to community respiration ratio (PP/CR_i), for the 6 expe-
riments (R1 to R3 and S1 to S3)

Mar Ecol Prog Ser 416: 17–33, 201024
PO4–3
(µmol l–1)
0.0
0.3
0.6
0.9
1.2
0369
12
05
10
15
20
0369
02468
NO3–
(µmol l–1)
0369
12
AA
AA
AA
S1
S2
S3
R1
R2
R3
NH4+
(µmol l–1)
0369
0369
12
15
0369
02468
0369
0.0
0.3
0.6
0.9
1.2
0.0
0.3
0.6
0.9
1.2
1.5
0.0
0.5
1.0
1.5
2.0
2.5
0.0
0.3
0.6
0.9
1.2
CC
CC
CC
BB
BB
BB
02
44
87
2
Co
ntr
ol
Ino
rgan
ic
Org
an
ic
Mix
ed
02
44
87
26
0
90
12
0
15
0
02
44
87
26
0
90
12
0
15
0
02
44
87
26
0
90
12
0
15
0
02
44
87
26
0
90
12
0
15
0
Sam
plin
g t
ime (h
)
02
44
87
2
DOC(µmol l–1)
60
90
12
0
15
0E
EE
EE
E
0
10
0
20
0
30
0
0
10
0
20
0
30
0
0
10
0
20
0
30
0
Protein-like FDOM(ppb Trp)
0
10
0
20
0
30
0
0
10
0
20
0
30
0D
DD
DD
D
0369
12
15 0369
0.0
0.5
1.0
1.5
2.0 60
90
12
0
15
00
10
0
20
0
30
0
Fig
. 4. T
ime
cou
rse
of m
ean
(A
) n
itra
te; (
B)
amm
oniu
m; (
C)
ph
osp
hat
e; (
D)
pro
tein
-lik
e fl
uor
esce
nce
of
dis
solv
ed o
rgan
ic m
atte
r (F
DO
M);
an
d (
E)
dis
solv
ed o
rgan
ic c
arb
on(D
OC
), fo
r th
e 6
exp
erim
ents
(S1
to S
3 an
d R
1 to
R3)
. Con
trol
: no
add
itio
n; I
nor
gan
ic: i
nor
gan
ic a
dd
itio
n; O
rgan
ic: o
rgan
ic a
dd
itio
n; M
ixed
: mix
ed a
dd
itio
n. N
ote
that
dif
fer-
ent
scal
es w
ere
use
d. E
rror
bar
s re
pre
sen
t th
e st
and
ard
err
or f
rom
du
pli
cate
s; w
her
e er
ror
bar
s ar
e n
ot v
isib
le, t
hey
are
sm
alle
r th
an t
he
size
of
the
sym
bol

Martínez-García et al.: Coastal microbial plankton response to nutrients 25
0
25
50
75
100
0
25
50
75
100
0
25
50
75
100
0
25
50
75
100
0
25
50
75
100
% Chl a > 5 µm
0
25
50
75
100
0369
12
15
180369
12
Co
ntr
ol
Ino
rganic
Org
anic
Mix
ed
0.2
0.3
0.4
0.5
0.6
Fv/Fm
0.2
0.3
0.4
0.5
0.6
Primary production(µg C l–1 h–1)
06
12
18
24
30
Total Chl a (µg l–1)
0369
0.0
0.2
0.4
0.6
0.8
1.0
0.0
0.1
0.2
0.3
0.4
0.2
0.3
0.4
0.5
0.6
0
50
100
150
200
2500
10
20
30
40
0.2
0.3
0.4
0.5
0.6
0
10
20
30
40
50
600369
12
15
0.2
0.3
0.4
0.5
0.6
0
10
20
30
40
5005
10
15
20
25
0.2
0.3
0.4
0.5
0.6
AA
AA
AA
CC
CC
CC
DD
DD
DD
R 1
R 2
R 3
S 3
S 2
S 1
BB
B
B
BB 0
24
48
72
0
25
50
75
100
024
48
72
0
25
50
75
100
024
48
72
0
25
50
75
100
024
48
72
0
25
50
75
100
024
48
72
0
25
50
75
100
Sam
plin
g t
ime (h
)
024
48
72
%PP > 5 µm
0
25
50
75
100
E
E
E
EE
E
Fig
. 5. T
ime
cou
rse
of m
ean
(A) c
hlo
rop
hyl
l (ch
l) a
; (B
) per
cen
tag
e of
> 5
µm
frac
tion
ch
l a; (
C) p
hot
osyn
thet
ic e
ffic
ien
cy (F
v/F
m);
(D) t
otal
pri
mar
y p
rod
uct
ion
(PP
); a
nd
(E) p
er-
cen
tag
e of
> 5
µm
frac
tion
PP,
for
the
6 ex
per
imen
ts (S
1 to
S3
and
R1
to R
3). C
ontr
ol: n
o ad
dit
ion
; In
org
anic
: in
org
anic
ad
dit
ion
; Org
anic
: org
anic
ad
dit
ion
; Mix
ed: m
ixed
ad
di-
tion
. N
ote
that
dif
fere
nt
scal
es w
ere
use
d.
Err
or b
ars
rep
rese
nt
the
stan
dar
d e
rror
fro
m d
up
lica
tes;
wh
ere
erro
r b
ars
are
not
vis
ible
, th
ey a
re s
mal
ler
than
th
e sy
mb
ol s
ize

Mar Ecol Prog Ser 416: 17–33, 2010
(4.4- and 2.5-fold respectively) and mixed additions(5.4- and 3.6-fold respectively) (Fig. 5A,D). No res-ponse was found in Expt S3 (Fig. 5) (Bonferroni posthoc test, p > 0.05).
No major changes were found in phytoplankton bio-mass size structure as a response to nutrient additionsin any of the experiments (Fig. 5B,E). Microphyto-plankton (>20 µm) dominated in Expts R1, R2, R3, andS2 and nanophytoplankton (2 to 20 µm) dominated inExpts S1 and S3 before (Fig. 2) and after the additions(data not shown). For simplicity we have representedonly the contribution of >5 µm phytoplankton to bothchl a and PP. No significant changes were found in thecontribution of >5 µm phytoplankton to both chl a andPP after the additions (Bonferroni post hoc test, p >0.05; Table 2). Similarly, phytoplankton communitycomposition did not greatly change as a result of thenutrient additions. Diatoms dominated the phyto-plankton community at the end of the experiment in allthe treatments in Expts R1, R2, R3 (except in the inor-ganic treatment), and S2, whereas in Expts S1 and S3the final phytoplankton community was dominated bydinoflagellates, flagellates, and picophytoplankton inall treatments (data not shown).
Photosynthetic efficiency (Fv/Fm) followed a similarpattern as chl a and PP (Fig. 5C). Fv/Fm decreased rel-ative to control in the organic treatment in Expts S1and S2. A decrease in Fv/Fm in all the addition treat-ments relative to control was also measured in Expt S3.
We lack Fv/Fm data from some bottles for the last incu-bation day (t = 72 h) due to saturation of the FRR fluo-rescence measurements.
The statistical analysis showed that the incubationtime (within-subject factor) as well as the experiment(i.e. initial conditions) and the addition treatment(between-subjects factors) had a significant effect onchl a and PP (RMANOVA, p < 0.001). Mixed additionsresulted in a significant increase in total chl a and PP(Bonferroni post hoc test, p < 0.05; Table 2).
Heterotrophic responses to nutrient additions
The response of heterotrophic bacteria to nutrientadditions differed among experiments (RMANOVA,p < 0.001) (Fig. 6). Three different patterns of responsewere found, although the largest responses werealways registered after the mixed additions (Bonfer-roni post hoc test, p < 0.001).
The first pattern was observed in Expts S1 and S2where enhanced BB and BP relative to the control wasonly observed after mixed additions (BBRR and BPRR upto 4.6- and 33.6-fold respectively) (Bonferroni post hoctest, p < 0.001). In contrast, organic and mixed treat-ments resulted in similar increases (Bonferroni posthoc test, p > 0.05) in BB and BP (up to 3.5- and 23.3-foldrespectively) in Expts R1 and R3. Finally, in Expts S3and R2, BB and BP significantly increased (Bonferronipost hoc test, p < 0.001) after mixed addition (up to 4.6-and 25-fold respectively) and to a lesser extent afterorganic addition (3.3- and 14.5-fold respectively)(Fig. 6A,C) (Bonferroni post hoc test, p < 0.01). The bio-mass contribution of high-DNA bacteria (HNA/BBratio) significantly increased after organic and mixedadditions (Bonferroni post hoc test, p < 0.05; Table 2),reaching values of up to 0.99 (Fig. 6B).
BR responses to the additions followed the same pat-tern as BB (Fig. 6). BR significantly increased aftermixed additions (Bonferroni post hoc test, p < 0.001;Table 2) in all the experiments (up to 11.8-fold inExpt S3), whereas BR increases were registered afterorganic additions in Expts R1 and R3 (6.6- and 3.8-foldrespectively) (Fig. 6D) (significant in Expt R1: Bonfer-roni post hoc test, p < 0.01).
BGE did not significantly increase (Expts S2, S3, andR2) relative to control when inorganic nutrients wereadded in any of the experiments (Bonferroni post hoctest, p > 0.05) (Fig. 6E). The organic addition causedincrease (up to 1.7-fold) (Expts S3, R1, R2, and R3),decrease (Expt S2), or no change (Expt S1) in BGE rel-ative to control (Fig. 6E). After the mixed treatment,BGE significantly increased (Bonferroni post hoc test,p < 0.05; Table 2) relative to control (from 1.2- to 2-fold)in all the experiments (Fig. 6E).
26
Table 2. Summary of the global effect of the different addi-tions on biological variables (repeated-measures ANOVA[RMANOVA] and Bonferroni post hoc tests). 0: no significanteffect; +++: significant effect at p < 0.001. Chl a: chlorophyll aconcentration; %Chl a > 5 µm: contribution of chl a in the frac-tion > 5 µm to total chl a; PP: primary production; %PP > 5 µm:contribution of PP in the fraction > 5 µm to total PP; Fv/Fm:photosynthetic efficiency; BB: heterotrophic bacterial biomass;HNA: high nucleic acid content bacteria; BP: bacterial produc-tion; BR: bacterial respiration (estimated from in vivo electrontransport system [ETS] activity due to the fraction < 0.8 µm);BGE: bacterial growth efficiency; CR: community respiration
(estimated from total in vivo ETS activity)
Variable Inorganic Organic Mixed addition addition addition
Chl a 0 0 +++%Chl a > 5µm 0 0 0PP 0 0 +++%PP > 5 µm 0 0 0Fv/Fm 0 0 0BB 0 +++ +++HNA/BB 0 +++ +++BP 0 +++ +++BR (<0.8 µm ETS) 0 0 +++BGE 0 0 +++CR (total ETS) 0 +++ +++

Martínez-García et al.: Coastal microbial plankton response to nutrients 27S
1S
2S
3R
1R
2R
3
0
30
60
90
120
150
180
A
0
70
140
210
28
0A
0
30
60
90
120
150
180
A
0
50
100
150
20
0
25
0A
0
50
100
150
20
0
25
0A
0.8
0
0.8
5
0.9
0
0.9
5
1.0
0B
0.8
0
0.8
5
0.9
0
0.9
5
1.0
0B
0.0
0.20.4
0.6
0.81.0
B
0.8
0
0.8
5
0.9
0
0.9
5
1.0
0B
0.8
0
0.8
5
0.9
0
0.9
5
1.0
0B
0
20
0
40
0
60
0C
0
20
0
40
0
60
0
80
0C
0
20
0
40
0
60
0
80
0C
0
20
0
40
0
60
0C
0
25
0
50
0
75
0
100
0C
BP(µg C l–1 d–1)
0
25
0
50
0
75
0
100
0C
0
50
100
150
D
0
50
100
150
20
0D
0
100
20
0
30
0
40
0
50
0D
0
100
20
0
30
0
40
0D
0
30
60
90
120
D
BR(µg C l–1 d–1)
0
50
0
100
0
150
0C
on
tro
l
Ino
rga
nic
Org
an
ic
Mix
ed
D
HNA/BB
0.0
0.20.4
0.6
0.81.0
B
BB(µg C l–1)
0
30
60
90
120
150
180
A
BGE
0.0
0.20.4
0.6
0.81.0
E
024
48
72
0
50
0
100
0
150
0
20
00
25
00
F
Sam
plin
g t
ime (h)
024
48
72
CR(µg C l–1 d–1)
0
100
0
20
00
30
00
40
00
F
024
48
72
0
100
0
20
00
30
00
40
00
50
00
F
024
48
72
0
50
0
100
0
150
0
20
00
25
00
F
024
48
72
0
100
0
20
00
30
00
F
024
48
72
0
100
0
20
00
30
00
40
00
F
0.0
0.20.4
0.6
0.81.0
E0
.0
0.20.4
0.6
0.81.0
E0
.0
0.20.4
0.6
0.81.0
E0
.0
0.20.4
0.6
0.81.0
E0
.0
0.20.4
0.6
0.81.0
E
Fig
. 6.
Tim
e co
urs
e of
mea
n (
A)
bac
teri
al b
iom
ass
(BB
); (
B)
rati
o of
hig
h n
ucl
eic
acid
con
ten
t b
acte
ria
(HN
A)
to B
B;
(C)
bac
teri
al p
rod
uct
ion
(B
P);
(D
) b
acte
rial
res
pir
atio
n(B
R)
esti
mat
ed f
rom
ele
ctro
n t
ran
spor
t sy
stem
(E
TS
) ac
tivi
ty i
n t
he
<0.
8 µ
m f
ract
ion
; (E
) b
acte
rial
gro
wth
eff
icie
ncy
(B
GE
); a
nd
(F
) co
mm
un
ity
resp
irat
ion
(C
R)
esti
mat
edfr
om t
otal
ET
S a
ctiv
ity,
for
th
e 6
exp
erim
ents
(S
1 to
S3
and
R1
to R
3). C
ontr
ol: n
o ad
dit
ion
; In
org
anic
: in
org
anic
ad
dit
ion
; Org
anic
: org
anic
ad
dit
ion
; Mix
ed: m
ixed
ad
dit
ion
.N
ote
that
dif
fere
nt
scal
es w
ere
use
d.
Err
or b
ars
rep
rese
nt
the
stan
dar
d e
rror
fro
m d
up
lica
tes;
wh
ere
erro
r b
ars
are
not
vis
ible
, th
ey a
re s
mal
ler
than
th
e sy
mb
ol s
ize

Mar Ecol Prog Ser 416: 17–33, 2010
CR always increased after mixed additions (up to51.5-fold) (Bonferroni post hoc test, p < 0.001; Table 2)and to a lesser extent after organic additions (up to23.9-fold) in all the experiments except for Expt S1(Bonferroni post hoc test, p < 0.05) (Fig. 6F).
The effects of the addition treatment, time, andexperiment on BB, HNA/BB ratio, BP, BR, BGE, and CRwere all significant (RMANOVA, p < 0.001). A signifi-cant interaction between the factors treatment andexperiment was found for all variables (RMANOVA,p < 0.001); that is, the effect of the addition treatmentdiffered among experiments. Significant stimulationsof BB, HNA/BB ratio, BP, and CR were observed afterorganic and mixed additions, whereas BGE and BRsignificantly increased only after mixed additions(Bonferroni post hoc test, p < 0.05; Table 2).
DISCUSSION
Seasonality of nutrient inputs and irradiance levelsin the study area (Nogueira et al. 1997), associatedwith hydrological and meteorological variability,allowed us to sample a wide range of microbial plank-ton communities in terms of both structure and func-tioning (Figs. 2 & 3).
Major differences in the response of phytoplanktonand heterotrophic bacteria biomass and metabolismsto nutrient additions were found among experiments,suggesting that the processes that control autotrophicand heterotrophic microbial standing stocks and activ-ity change both over seasonal and short spatial scales.
Responses of phytoplankton
Phytoplankton did not respond to any of the nutrientadditions in Expt S3 (Fig. 5), where chl a, PP, and Fv/Fm
exhibited very low values throughout the experiments.The lack of response observed in this experiment sug-gests that phytoplankton populations were likely in asenescent growth phase at the time of sampling. Thisis in agreement with the net heterotrophic microbialplankton metabolism and the very low PhytoB/BB ratioestimated (Fig. 3).
Previous studies in coastal zones have frequentlyshown increases in phytoplankton biomass and produc-tion rates after inorganic nutrient additions (Caron et al.2000, Joint et al. 2002, Lignell et al. 2003). However, wefound this response only in Expt S2, while in the rest ofthe experiments (Expts S1, R1, R2, and R3), phytoplank-ton growth increased only when inorganic and organicnutrients were jointly added (Fig. 5). The explanation forthe general lack of response of phytoplankton to the in-
organic nutrient treatment is not straightforward, andseveral mechanisms including both bottom-up and top-down control processes can be proposed.
Firstly, we can hypothesize that co-limitation by inor-ganic and organic nutrients could be related to thespecific requirements for organic compounds of thephytoplankton species present. In this regard, mixo-trophy and auxotrophy of coastal phytoplankton com-munities have been widely reported (Antia et al. 1991,Bronk et al. 2007, Burkholder et al. 2008). Release anduptake of amino acids tend to be closely linked so thatambient concentrations of dissolved free amino acids(DFAA) are usually very low and represent a smallfraction of the measured DON (Berman & Bronk 2003).However, Bronk et al. (2007) reported that the contri-bution of urea and DFAA to total measured N uptakeby coastal phytoplankton might be as high as 80%.The organic compounds potentially required for phyto-plankton growth may have been supplied in the mixedtreatment bottles by 2 non-exclusive pathways: by theorganic addition itself or through the release of sec-ondary metabolites derived from bacterial metabolism.The latter explanation would imply a trophic couplingbetween heterotrophic bacteria metabolism and PP.Bacterial activity has been previously proposed as afactor that can stimulate phytoplankton growth (Kura-ta 1986, Croft et al. 2005).
Secondly, the lack of response of phytoplankton inthe inorganic treatment could be related to a time lagin the response of primary producers to nutrient addi-tions or to top-down processes. Prefiltration (200 µmpore size mesh) of the samples could partially releaseciliates and heterotrophic flagellates from predators,thus enhancing grazing pressure by microbial protistson phytoplankton. In these scenarios, only the extranutrient input associated with remineralization byheterotrophic bacteria in the mixed treatment bottleswould allow phytoplankton to sustain sufficiently highgrowth rates and give way to a bloom.
A previous microcosm experiment conducted withmicroplankton populations collected in the WesternEnglish Channel also failed to find a response by phyto-plankton communities incubated for 7 d in inorganicnutrient-rich water and under constant environmentalconditions (stability in the ambient light, temperature,and mixing conditions) (Fernández et al. 1992). There-fore, the lack of phytoplankton response to inorganicnutrient addition found in some of our experimentscannot be necessarily attributed to the relatively shortincubation periods. On the other hand, large phyto-plankton, which mostly dominated the phytoplanktoncommunity in our experiments, would not presumablybe severely grazed in this 200 µm prefiltered water.
In any case, the concentration of inorganic nutrientsis already high in the inorganic treatment, making it
28

Martínez-García et al.: Coastal microbial plankton response to nutrients
therefore unlikely that remineralization had providedsuch an extra input as to make a difference. In addi-tion, it has been shown that heterotrophic bacteria onlysignificantly mineralize N from amino acids under con-ditions of extreme C limitation (Goldman & Dennet1991).
Few studies have attempted to determine theresponse of microbial plankton communities to inor-ganic and organic inputs and most of them assessedthe effect of organic C (Caron et al. 2000, Jacquet et al.2002, Joint et al. 2002). These investigations did notfind a positive response of phytoplankton to labileDOC and even reported that phytoplankton biomassand production decreased in the presence of excesslabile DOC as a result of enhanced heterotrophic bac-terial activity that reduced the amount of inorganicnutrients (P and N) available for phytoplankton (Jointet al. 2002). Davidson et al. (2007) found positiveresponses by phytoplankton populations after theaddition of organic N alone or in conjunction with inor-ganic nutrients, which they attributed to the extra inor-ganic nutrient input as a result of remineralization pro-cesses by heterotrophic bacteria. This is in agreementwith the results observed in the present study in 4 outof 5 experiments in which phytoplankton responded tothe mixed but not to the inorganic additions. We con-clude that phytoplankton growth requirements fororganic additions may be relevant in this coastal area,and likely change over spatial and temporal scales.
Responses of heterotrophic bacteria
Parallel sharp decreases in ammonium, phosphate,and DOC concentrations during the first incubationday in the mixed treatment (Fig. 4) coincided withincreases in BP rates (Fig. 6), indicating a high rate ofnutrient consumption by heterotrophic bacteria. It hasbeen shown that, over time scales of days, bacteriapreferentially use inorganic sources of N and P to sup-port growth (Zweifel et al. 1993). Furthermore, en-hanced nutrient uptake by C-limited heterotrophicbacteria was observed when supplied with glucose(Thingstad et al. 2008). Also, bacteria have beenshown to be more efficient than phytoplankton in theuptake of ammonium and phosphate (Joint et al. 2002).
Heterotrophic bacteria did not respond to inorganicnutrient additions alone in the study area (Bonferronipost hoc test, p > 0.05; Table 2), suggesting a broadlimitation by organic C. On the other hand, bacteriacould be co-limited by inorganic and organic nutrientsin the shelf (Expts S1 and S2), since they onlyresponded to the mixed treatments (Bonferroni posthoc test, p < 0.001) and to a lesser extent in Expts S3and R2, where although both BB and BP increased
after organic nutrient additions, further increases wereregistered after mixed additions (Bonferroni post hoctest, p < 0.001). This kind of response (secondary inor-ganic nutrient limitation) suggests that the additionalinorganic nutrients supplied in the mixed treatmentallowed bacteria to utilize more organic matter thanwhen adding organic nutrients alone. Our results pointto a large degree of temporal variability in the magni-tude of inorganic nutrient availability in the studiedarea.
Considering that our organic addition includes N butnot P, co-limitation by organic and inorganic nutrientssuggested in Expts S1 and S2 could be likely explainedby P deficiency at the shelf station as inferred from theinitial low phosphate concentrations (Table 1).
Limitation of heterotrophic bacteria biomass andactivity in coastal areas by organic C (Jacquet et al.2002, Joint et al. 2002, Davidson et al. 2007) and inor-ganic nutrients (Caron et al. 2000, Lignell et al. 2003)has been previously reported. Inorganic nutrient limi-tation has been suggested to prevent bacteria from uti-lizing organic C, thus resulting in DOC accumulationin the upper water column (Rivkin & Anderson 1997,Thingstad et al. 1997, Tanaka et al. 2009). This is inagreement with our experiments, where P deficiencycould have prevented the bacterial utilization of thelabile DOC and DON added in Expts S1 and S2.
Limitation of bacterial activity by organic C can besomewhat unexpected for a productive coastal areawhere both continental inputs (Aminot et al. 1990,Zweifel et al. 1995, Álvarez-Salgado et al. 2006) andhigh production rates associated with phytoplanktonblooms contribute to DOM production and accumula-tion. However, it is well known that photosyntheticallyderived organic matter may not always be directlyavailable to heterotrophic bacteria (Joint et al. 2002),and that most terrestrial materials, such as humic sub-stances, are essentially refractory (Cauwet 2002). Onthe other hand, long-term (approximately 2 mo) DOMbacterial degradation experiments in the Ría de Vigoshowed that 17% of DOC was labile or semilabile(Lønborg et al. 2010). A possible explanation for theapparent general organic C limitation of bacteria inour experiments could be enhanced predation pres-sure by microbial protists on bacteria due to the pre-filtration procedure (Caron et al. 2000). A strong graz-ing pressure on bacteria could have masked theresponse of bacteria in the inorganic treatment. Onlythe extra organic C input in the organic treatment bot-tles allowed heterotrophic bacteria to sustain highenough growth rates to overcome predation losses.
A general organic C limitation of BGE may explainthe increases in BGE registered after organic andmixed additions but not when adding inorganic (N andP) nutrients alone (Fig. 6E). This is in agreement with
29

Mar Ecol Prog Ser 416: 17–33, 2010
previous manipulation experiments that showed littleor no effect of inorganic nutrient additions on BGE incoastal areas (Jørgensen et al. 1993, Zweifel et al.1993, Daneri et al. 1994). A recent field study by Apple& del Giorgio (2007) also suggested that BGE is mainlycontrolled by the DOC pool. The lack of BGE responsein the organic treatment observed in Expts S1 and S2(Fig. 6E) could be related to the aforementioned co-limitation by inorganic P and organic nutrients. Thisco-limitation of BGE by inorganic and organic nutri-ents has been widely documented (del Giorgio & Cole2000 and references therein) and several studies havereported evidence that P may control BGE in marinesystems (Zweifel et al. 1993, Pomeroy et al. 1995).
Metabolic balance of microbial plankton communities
When organic C is available, heterotrophic bacteriamay utilize inorganic nutrients to satisfy their de-mands, thus possibly outcompeting phytoplankton.This implies a decrease in the photosynthesis-to-respi-ration ratio when organic nutrients enter the pelagicecosystem. In contrast, when inorganic nutrients areadded, phytoplankton may utilize inorganic nutrients,and an increase in the photosynthesis-to-respirationratio after inorganic inputs could be expected.
Changes in the PP/CR ratio as a consequence ofthe nutrient additions (expressed as the PP/CR ratios inthe addition treatments compared to those in thecontrol: PP/CRRR_Inorganic, PP/CRRR_Organic, andPP/CRRR_Mixed) have been plotted against the initialPP/CR ratio (PP/CR_i) (Fig. 7). These PP/CRRR can beinterpreted as relative short-term tendencies towardsautotrophy (PP/CRRR > 1) or towards heterotrophy(PP/CRRR < 1) of the addition treatments compared tothe control. The dashed line is the regression linePP/CRRR = 1/(PP/CR_i), and represents, for any givenPP/CR_i, the PP/CRRR that would result in a net meta-bolic balance equal to 1. Therefore, points above theline would be net autotrophic and points below the linenet heterotrophic.
The magnitude of response of the PP/CR ratio in theorganic and mixed addition treatments compared tothe control (PP/CRRR_Organic and PP/CRRR_Mixed)significantly increased as the initial relative impor-tance of autrotrophs in the microbial community washigher (Fig. 7B,C). Thus, after organic and mixed addi-tions, changes in the metabolic balance of the planktoncommunity were predictable: the lower the PP/CR_i,the stronger the tendency to heterotrophy after theadditions (PP/CRRR < 1) (Fig. 7B,C). In contrast, afterinorganic additions, PP/CRRR was not correlated withPP/CR_i, and microbial communities became netautotrophic in all cases (except for Expt S3, in which no
phytoplankton response was registered). Therefore,although changes in the microbial metabolic balanceafter organic additions (mainly driven by changes inCR) depend on the initial microbial community meta-bolism, the changes after inorganic additions (mainlydriven by unpredictable changes in PP) do not dependon the initial community metabolism.
It is noteworthy that, when organic and inorganicnutrients were jointly added, not only did heterotro-
30
PP
/CR
RR_In
org
anic
0
1
2
S1
S2
S3
R1
R2
R3
A
PP
/CR
RR_O
rganic
0
1
2
S1
S2S3
R1R2
R3
B
PP/CR_i
0.0 0.5 1.0 1.5 2.0 2.5 3.0
PP
/CR
RR_M
ixed
0
1
2
S1
S2S3
R1R2
R3
C
Fig. 7. Initial primary production to community respirationratio (PP/CR_i) versus primary production to community res-piration response ratio (PP/CRRR) for (A) inorganic additions;(B) organic additions (y = 0.216x + 0.075, r2 = 0.74, p < 0.05);and (C) mixed additions (y = 0.417x +0.059, r2 = 0.70, p = 0.05)for the 6 experiments (S1 to S3 and R1 to R3). The regressionline y = 1/x (dashed line) corresponds to PP/CR = 1. Pointsabove the line are net autotrophic and points below the line
are net heterotrophic

Martínez-García et al.: Coastal microbial plankton response to nutrients
phic bacteria benefit but phytoplankton biomass andactivity also increased. Therefore, the expected imbal-ance between autotrophic and heterotrophic processesin response to mixed additions may be reduced.
To what extent the tendency to heterotrophy can beattenuated seemed to be dependent on the initialstructure of the microbial community. The tendency toheterotrophy of the microbial plankton communitieswas stronger in the organic than in the mixed treat-ment bottles (PP/CRRR_Organic < PP/CRRR_Mixed) inall the experiments, and in one of them (Expt R2) thenet metabolism of the microbial community evenchanged from net heterotrophic after the organic treat-ment (Expt R2 below the dashed line representing PP/CR = 1) to net autotrophic after the mixed treatment(Expt R2 above the dashed line) (Fig. 7B,C).Therefore,the fact that phytoplankton also benefit from mixedadditions may partially compensate the tendencytowards heterotrophy in marine planktonic systemsreceiving increasing amounts of organic matter. This isof interest in the context of predicting possible shifts inthe metabolic balance of microbial communities incoastal areas that are subjected to increasingly higheranthropogenic inputs. Future studies should considerthe effects of both inorganic and organic nutrients, tak-ing into account that variations in the initial composi-tion of the communities and complex trophic interac-tions make it difficult to observe universal responses ofmicrobial communities to coastal eutrophication.
Acknowledgements. We thank all the people involved in theproject AddEx who helped with the preparation and sam-pling of the experiments. We also thank C. Carreira, L. Díaz-Pérez, A. Fernández, E. García, M. Huete, M. Pérez, A.Franco, C. Sobrino, and V. Vieitez for their help during theexperimental work. We thank Estación de Ciencias Mariñasde Toralla (ECIMAT) for the technical support during theexperiments as well as the crew of the RV ‘Mytilus’ for theirhelp during the work at sea. Access to vessel time was pro-vided by the RAFTING project (CTM2007-61983/MAR). Thisresearch was supported by the Xunta de Galicia throughprojects AddEx (grant PGIDIT06PXIB312222PR) and IMAN(grant 07MMA002402PR). S.M.-G. was funded by an FPUMEC fellowship. E.T. was funded by a Juan de la Cierva anda Ramón y Cajal-MEC contract. C.L. was funded by a fellow-ship from the Early Stage Training site ECOSUMMER(MEST-CT-2004-0205019) and the Carlsberg Foundation.
LITERATURE CITED
Álvarez-Salgado XA, Miller AEJ (1998) Simultaneous deter-mination of dissolved organic carbon and total dissolvednitrogen in seawater by high temperature catalytic oxida-tion: conditions for precise shipboard measurements. MarChem 62:325–333
Álvarez-Salgado XA, Rosón G, Perez FF, Figueiras FG, PazosY (1996) Nitrogen cycling in an estuarine upwelling sys-tem, the Ria de Arousa (NW Spain). I. Short-time-scalepatterns of hydrodynamic and biogeochemical circulation.Mar Ecol Prog Ser 135:259–273
Álvarez-Salgado XA, Beloso S, Joint I, Nogueira E and others(2002) New production of the NW Iberian shelf during theupwelling season over the period 1982-1999. Deep-SeaRes I 49:1725–1739
Álvarez-Salgado XA, Nieto-Cid M, Gago J, Brea S, CastroCG, Doval MD, Pérez FF (2006) Stoichiometry of thedegradation of dissolved and particulate biogenic organicmatter in the NW Iberian upwelling. J Geophys Res 111:C07017 doi:10.1029/2004JC002473
Aminot A, El-Sayed MA, Kerouel R (1990) Fate of natural andanthropogenic dissolved organic carbon in the macrotidalElorn estuary (France). Mar Chem 29:255–275
Antia NJ, Harrison PJ, Oliveira L (1991) The role of dissolvedorganic nitrogen in phytoplankton nutrition, cell biologyand ecology. Phycologia 30:1–89
Apple JK, del Giorgio PA (2007) Organic substrate quality asthe link between bacterioplankton carbon demand andgrowth efficiency in a temperate salt-marsh estuary. ISMEJ 1:729–742
Azam F, Fenchel T, Field JG, Gray JS, Meyer-Rail LA,Thingstad F (1983) The ecological role of water-columnmicrobes in the sea. Mar Ecol Prog Ser 10:257–263
Benner R (2002) Chemical composition and reactivity. In:Hansell DA, Carlson CA (eds) Biogeochemistry of dis-solved organic matter. Academic Press, San Diego, CA,p 153–231
Berman T, Bronk DA (2003) Dissolved organic nitrogen: adynamic participant in aquatic ecosystems. Aquat MicrobEcol 31:279–305
Bronk DA (2002) Dynamics of DON. In: Hansell DA, CarlsonCA (eds) Biogeochemistry of dissolved organic matter.Academic Press, San Diego, CA, p 153–231
Bronk DA, See JH, Bradley P, Killberg L (2007) DON as asource of bioavailable nitrogen for phytoplankton. Biogeo-sciences 4:283–296
Burkholder JM, Glibert PM, Skelton HM (2008) Mixotrophy, amajor mode of nutrition for harmful algal species ineutrophic waters. Harmful Algae 8:77–93
Calvo-Díaz A, Morán XAG (2006) Seasonal dynamics ofpicoplankton in shelf waters of the southern Bay of Biscay.Aquat Microb Ecol 42:159–174
Calvo-Díaz A, Morán XAG (2009) Empirical leucine-to-carbon conversion factors for estimating heterotrophicbacterial production: seasonality and predictability in atemperate coastal ecosystem. Appl Environ Microbiol 75:3216–3221
Caron DA, Lim EL, Sanders RW, Dennett MR, Berninger UG(2000) Responses of bacterioplankton and phytoplanktonto organic carbon and inorganic nutrient additions incontrasting oceanic ecosystems. Aquat Microb Ecol 22:175–184
Cauwet G (2002) DOM in the coastal zone. In: Hansell DA,Carlson CA (ed) Biogeochemistry of marine dissolvedorganic matter. Academic Press, San Diego, CA,p 579–609
Cermeño P, Marañón E, Pérez V, Serret P, Fernández E, Cas-tro CG (2006) Phytoplankton size structure and primaryproduction in a highly dynamic coastal ecosystem (Ría deVigo, NW Spain): seasonal and short-time scale variabil-ity. Estuar Coast Shelf Sci 67:251–266
Cloern JE (2001) Our evolving conceptual model of thecoastal eutrophication problem. Mar Ecol Prog Ser 210:223–253
Coble PG (1996) Characterization of marine and terrestrialDOM in seawater using excitation-emission matrix spec-troscopy. Mar Chem 51:325–346
Croft MT, Lawrence AD, Raux-Deery E, Warren MJ, Smith
31

Mar Ecol Prog Ser 416: 17–33, 2010
AG (2005) Algae acquire vitamin B12 through a symbioticrelationship with bacteria. Nature 438:90–93
Daneri G, Riemann B, Williams PJleB (1994) In situ bacterialproduction and growth yield measured by thymidine,leucine and fractionated dark oxygen uptake. J PlanktonRes 16:105–113
Davidson K, Gilpin LC, Hart MC, Foilland E and others (2007)The influence of the balance of inorganic and organicnitrogen on the trophic dynamics of microbial food webs.Limnol Oceanogr 52:2147–2163
del Giorgio PA, Cole JJ (2000) Bacterial energetics and growthefficiency. In: Kirchman DL (ed) Microbial ecology of theoceans, 1st edn. Wiley-Liss, New York, NY, p 289–326
Duce RA, LaRoche J, Altieri K, Arrigo KR and others (2008)Impacts of atmospheric anthropogenic nitrogen on theopen ocean. Science 320:893–897
Estévez P (2007) Determinación de la producción primariaplanctónica mediante fluorometría de alta tasa de repeti-ción (fast repetition rate fluorometry). Validación de mod-elos empíricos predictivos. PhD dissertation, Universidadde Vigo
Falkowski PG, Barber TR, Smetacek V (1998) Biogeochemicalcontrols and feedbacks on ocean primary production.Science 281:200–206
Fernández E, Serret P, de Madariaga I, Harbour DS, Davies A(1992) Photosynthetic carbon metabolism and biochemicalcomposition of spring phytoplankton assemblages enclo-sed in microcosms: the diatom — Phaeocystis sp. succes-sion. Mar Ecol Prog Ser 90:89–102
Galloway JN, Cowling EB (2002) Reactive nitrogen and theworld: 200 years of change. Ambio 3:64–71
Galloway JN, Dentener FJ, Capone DG, Boyer EW and others(2004) Nitrogen cycles: past, present, and future. Biogeo-chemistry 70:153–226
Goldman JC, Dennet MR (1991) Ammonium regenerationand carbon utilization by marine bacteria grown on mixedsubstrates. Mar Biol 109:369–379
Gruber N, Galloway JN (2008) An Earth-system perspectiveof the global nitrogen cycle. Nature 451:293–296
Hansen HP, Grasshoff K (1983) Automated chemical analysis.In: Grasshoff K, Ehrhardt M, Kermling K (eds) Methods ofseawater analysis, 2nd edn. Verlag Chemie, Weinheim,p 347–395
Howarth R, Marino R (2006) Nitrogen as the limiting nutri-ent for eutrophication in coastal marine ecosystems:Evolving views over three decades. Limnol Oceanogr51:364–376
Jacobson MC, Hansson HC, Noone KJ, Charlson RJ (2000)Organic atmospheric aerosols: review and state of the sci-ence. Rev Geophys 38:267–294
Jacquet S, Havskum H, Thingstad TF, Vaulot D (2002) Effectsof inorganic and organic nutrient addition on a coastalmicrobial community (Isefjord, Denmark). Mar Ecol ProgSer 228:3–14
Joint I, Henriksen P, Fonnes GA, Bourne D, Thingstad TF,Riemann B (2002) Competition for inorganic nutrientsbetween phytoplankton and bacterioplankton in nutrientmanipulated mesocosms. Aquat Microb Ecol 29:145–159
Jørgensen NOG, Kroer N, Coffin RB, Hoch MP (1993) Dis-solved free amino acids, combined amino acids, and DNAsources of carbon and nitrogen to marine bacteria. MarEcol Prog Ser 98:135–148
Jurado E, Dachs J, Duarte CM, Simó R (2008) Atmosphericdeposition of organic and black carbon to the globaloceans. Atmos Environ 42:7931–7939
Karl DM, Björkman KM (2002) Dynamics of DOP. In: HansellDA, Carlson CA (eds) Biogeochemistry of dissolved or-
ganic matter. Academic Press, San Diego, CA, p 250–348Kirchman DL (1994) The uptake of inorganic nutrients by het-
erotrophic bacteria. Microb Ecol 28:255–271Kirchman D, Knees E, Hodson R (1985) Leucine incorporation
and its potential as a measure of protein synthesis by bac-teria in natural aquatic systems. Appl Environ Microbiol49:599–607
Kurata A (1986) Blooms of Uroglena americana in relation toconcentrations of B group vitamins. In: Kristiansen J,Andersen RA (eds) Chrysophytes: aspects and problems.Cambridge University Press, Cambridge, p 185–196
Lignell R, Seppälä J, Kuuppo P, Tamminen T, Andersen T,Gismervik I (2003) Beyond bulk properties: responses ofcoastal summer plankton communities to nutrient enrich-ment in the northern Baltic Sea. Limnol Oceanogr 48:189–209
Lønborg C, Álvarez-Salgado XA, Martínez-García S, MillerA, Teira E (2010) Stoichiometry of dissolved organic mat-ter and the kinetics of its microbial degradation in acoastal upwelling system. Aquat Microb Ecol 58:117–126
Lund JWG, Kipling C, Le Cren ED (1958) The inverted micro-scope method of estimating algal numbers and the statisti-cal basis of estimations by counting. Hydrobiologia 11:143–170
Marañón E, Holligan PM, Barciela R, González N, Mouriño B,Pazó MJ, Varela M (2001) Patterns of phytoplankton sizestructure and productivity in contrasting open-ocean envi-ronments. Mar Ecol Prog Ser 216:43–56
Marañón E, Cermeño P, Fernández E, Rodríguez J, Zabala L(2004) Significance and mechanisms of photosyntheticproduction of dissolved organic carbon in a coastaleutrophic ecosystem. Limnol Oceanogr 49:1652–1666
Martínez-García S, Fernández E, Aranguren-Gassis M, TeiraE (2009) In vivo electron transport system activity: amethod to estimate respiration in marine microbial plank-tonic communities. Limnol Oceanogr Methods 7:459–469
Matthews D (2006) The water cycle freshens up. Nature 439:793–794
Menden-Deuer S, Lessard EJ (2000) Carbon to volume rela-tionships for dinoflagellates, diatoms, and other protistplankton. Limnol Oceanogr 45:569–579
Meybeck M (1993) C, N, P and S in rivers: from sources toglobal inputs. In: Wollast R, Mackenzie FT, Chou L (eds)Interactions of C, N, P and S. Biogeochemical cycles andglobal change. Springer-Verlag, Berlin, p 163–194
Nieto-Cid M, Álvarez-Salgado XA, Pérez FF (2006) Microbialand photochemical reactivity of fluorescent dissolvedorganic matter in a coastal upwelling system. LimnolOceanogr 51:1391–1400
Nixon SW (1995) Coastal marine eutrophication: a definition,social causes and future concerns. Ophelia 41:199–219
Nixon SW, Pilson MEQ (1983) Nitrogen in estuarine andcoastal marine ecosystems. In: Carpenter EJ, Capone DG(eds) Nitrogen in the marine environment. AcademicPress, New York, NY, p 565–648
Nogueira E, Pérez FF, Ríos AF (1997) Seasonal patterns andlong-term trends in an estuarine ecosystem (Ría de Vigo,NW Spain). Estuar Coast Shelf Sci 44:285–300
Norland S (1993) The relationship between biomass and vol-ume of bacteria. In: Kemp PF, Sherr BF, Sherr EB, Cole JJ(eds) Handboook of methods in aquatic microbial ecology.Lewis Publishers, Boca Raton, FL, p 303–307
Olenina I, Hajdu S, Edler L, Andersson A and others (2006)Biovolumes and size-classes of phytoplankton in the BalticSea. HELCOM Baltic Sea Environment Proceedings 106.Helsinki Commission, Baltic Marine Environment Protec-tion, Helsinki
32

Martínez-García et al.: Coastal microbial plankton response to nutrients
Oviatt C, Doering P, Nowicki B, Reed L, Cole J, Frithsen J(1995) An ecosystem level experiment on nutrient limita-tion in temperate coastal marine environments. Mar EcolProg Ser 116:171–179
Paerl HW, Dennis LR, Whitall DL (2002) Atmospheric deposi-tion of nitrogen: implications for nutrient over-enrichmentof coastal waters. Estuaries 25(4b):677–693
Peierls BL, Paerl HW (1997) Bioavailability of atmosphericorganic nitrogen deposition to coastal phytoplankton.Limnol Oceanogr 42:1819–1823
Pomeroy LR, Sheldon JE, Sheldon WM, Peters F (1995) Limitsto growth and respiration of bacterioplankton in the Gulfof Mexico. Mar Ecol Prog Ser 117:259–268
Rivkin RB, Anderson MR (1997) Inorganic nutrient limitationof oceanic bacterioplankton. Limnol Oceanogr 42:730–740
Robinson C (2008) Heterotrophic bacterial respiration. In:Kirchman DL (ed) Microbial ecology of the oceans, 2ndedn. Wiley-Liss, New York, NY, p 299–336
Rodriguez L, Macías F (2006) Eutrophication trends in forestsoils in Galicia (NW Spain) caused by the atmosphericdeposition of nitrogen compounds. Chemosphere 63:1598–1609
Scheiner SM, Gurevitch J (1993) Design and analysis of eco-logical experiments. Chapman & Hall, London
Seitzinger SP, Sanders RW (1999) Atmospheric inputs of dis-solved organic nitrogen stimulate estuarine bacteria andphytoplankton. Limnol Oceanogr 44:721–730
Smith DC, Azam F (1992) A simple, economical method formeasuring bacterial protein synthesis rates in seawaterusing 3H-leucine. Mar Microb Food Webs 6:107–114
Tanaka T, Thingstad TF, Gasol JM, Cardelús C and others(2009) Determining the availability of phosphate and glu-cose for bacteria in P-limited mesocosms of NW Mediter-ranean surface waters. Aquat Microb Ecol 56:81–91
Thingstad TF, Hagström A, Rassoulzadegan F (1997) Accu-
mulation of degradable DOC in surface waters: Is itcaused by a malfunctioning microbial loop? LimnolOceanogr 42:398–404
Thingstad TF, Havskum H, Kaas H, Nielsen TG, Riemann B,Le Févre D, Williams PJleB (1999) Bacteria-protist inter-actions and organic matter degradation under P-limitedconditions: analysis of an enclosure experiment using asimple model. Limnol Oceanogr 44:62–79
Thingstad TF, Bellerby RGJ, Bratbak G, Børsheim KY andothers (2008) Counterintuitive carbon-to-nutrient cou-pling in an Arctic pelagic ecosystem. Nature 455:387–391
Vázquez A, Costoya M, Peña RM, García S, Herrero C (2003)A rainwater quality monitoring network: a preliminarystudy of the composition of rainwater in Galicia (NWSpain). Chemosphere 51:375–386
Vitousek PM, Mooney HA, Lubchenco J, Melillo JM (1997)Human domination of Earth’s ecosystems. Science 277:494–499
Welschmeyer NA (1994) Fluorometric analysis of chloro-phyll a in the presence of chlorophyll b and pheopig-ments. Limnol Oceanogr 39:1985–1992
Williams PJleB, del Giorgio PA (2005) Respiration in aquaticecosystems: history and background. In: del Giorgio PA,Williams PJleB (eds) Respiration in aquatic ecosystems.Oxford University Press, London, p 1–18
Worden AZ, Nolan JK, Palenik B (2004) Assessing the dynam-ics and ecology of marine picophytoplankton: the impor-tance of the eukaryotic component. Limnol Oceanogr 49:168–179
Zweifel UL, Norrman B, Hagström A (1993) Consumption ofdissolved organic carbon by marine bacteria and demandfor inorganic nutrients. Mar Ecol Prog Ser 101:23–32
Zweifel UL, Norrman B, Hagström A (1995) Dynamics of dis-solved organic carbon in a coastal ecosystem. LimnolOceanogr 40:299–305
33
Editorial responsibility: Graham Savidge, Portaferry, UK
Submitted: May 6, 2010; Accepted: August 20, 2010Proofs received from author(s): September 28, 2010