Differential DNA methylation analysis of breast cancer reveals the impact of immune signaling in...
11
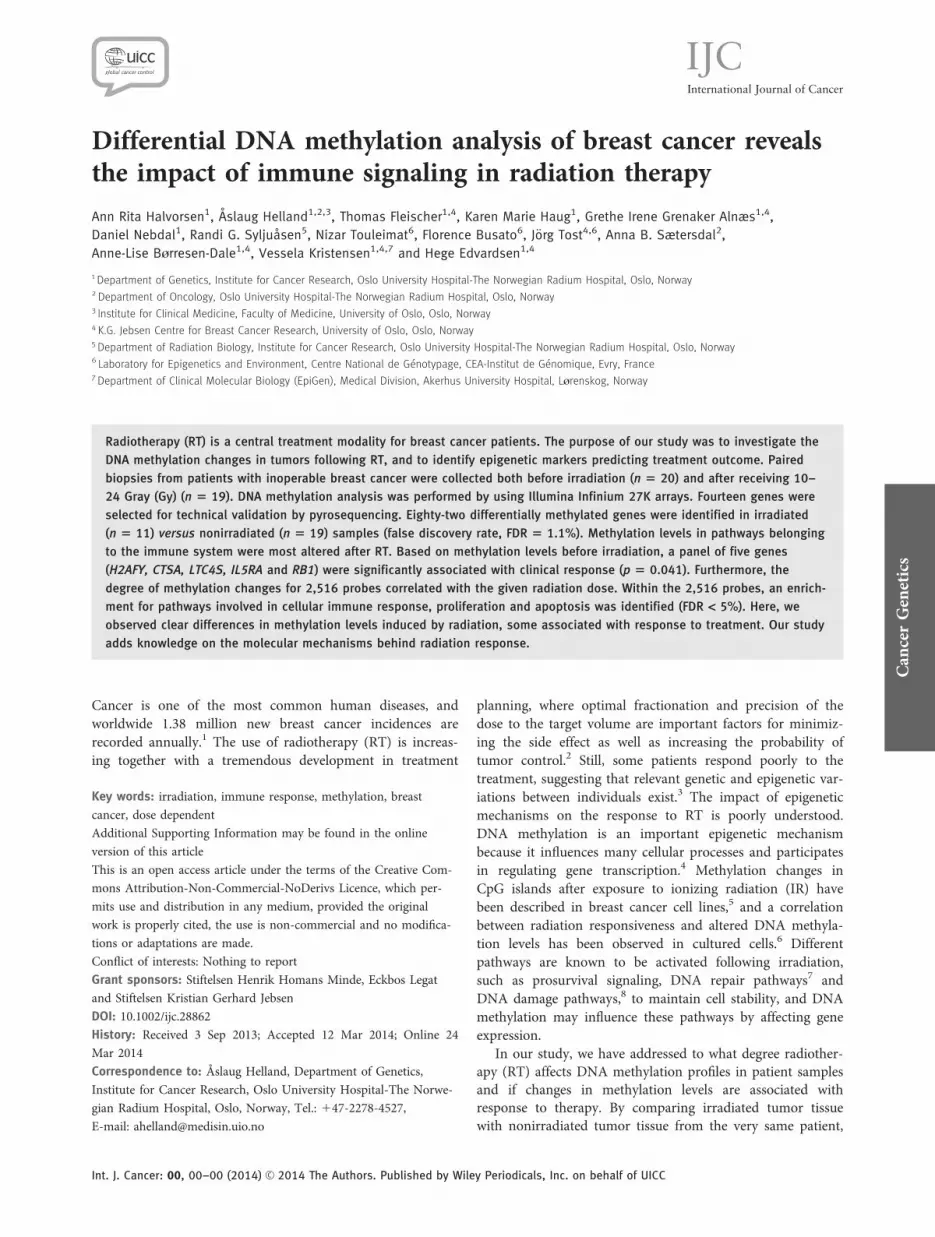
Differential DNA methylation analysis of breast cancer reveals the impact of immune signaling in radiation therapy Ann Rita Halvorsen 1 ,A ˚ slaug Helland 1,2,3 , Thomas Fleischer 1,4 , Karen Marie Haug 1 , Grethe Irene Grenaker Alnæs 1,4 , Daniel Nebdal 1 , Randi G. Syljua ˚ sen 5 , Nizar Touleimat 6 , Florence Busato 6 ,J€ org Tost 4,6 , Anna B. Sætersdal 2 , Anne-Lise Bïrresen-Dale 1,4 , Vessela Kristensen 1,4,7 and Hege Edvardsen 1,4 1 Department of Genetics, Institute for Cancer Research, Oslo University Hospital-The Norwegian Radium Hospital, Oslo, Norway 2 Department of Oncology, Oslo University Hospital-The Norwegian Radium Hospital, Oslo, Norway 3 Institute for Clinical Medicine, Faculty of Medicine, University of Oslo, Oslo, Norway 4 K.G. Jebsen Centre for Breast Cancer Research, University of Oslo, Oslo, Norway 5 Department of Radiation Biology, Institute for Cancer Research, Oslo University Hospital-The Norwegian Radium Hospital, Oslo, Norway 6 Laboratory for Epigenetics and Environment, Centre National de G enotypage, CEA-Institut de G enomique, Evry, France 7 Department of Clinical Molecular Biology (EpiGen), Medical Division, Akerhus University Hospital, Lïrenskog, Norway Radiotherapy (RT) is a central treatment modality for breast cancer patients. The purpose of our study was to investigate the DNA methylation changes in tumors following RT, and to identify epigenetic markers predicting treatment outcome. Paired biopsies from patients with inoperable breast cancer were collected both before irradiation (n 5 20) and after receiving 10– 24 Gray (Gy) (n 5 19). DNA methylation analysis was performed by using Illumina Infinium 27K arrays. Fourteen genes were selected for technical validation by pyrosequencing. Eighty-two differentially methylated genes were identified in irradiated (n 5 11) versus nonirradiated (n 5 19) samples (false discovery rate, FDR 5 1.1%). Methylation levels in pathways belonging to the immune system were most altered after RT. Based on methylation levels before irradiation, a panel of five genes (H2AFY, CTSA, LTC4S, IL5RA and RB1) were significantly associated with clinical response (p 5 0.041). Furthermore, the degree of methylation changes for 2,516 probes correlated with the given radiation dose. Within the 2,516 probes, an enrich- ment for pathways involved in cellular immune response, proliferation and apoptosis was identified (FDR < 5%). Here, we observed clear differences in methylation levels induced by radiation, some associated with response to treatment. Our study adds knowledge on the molecular mechanisms behind radiation response. Cancer is one of the most common human diseases, and worldwide 1.38 million new breast cancer incidences are recorded annually. 1 The use of radiotherapy (RT) is increas- ing together with a tremendous development in treatment planning, where optimal fractionation and precision of the dose to the target volume are important factors for minimiz- ing the side effect as well as increasing the probability of tumor control. 2 Still, some patients respond poorly to the treatment, suggesting that relevant genetic and epigenetic var- iations between individuals exist. 3 The impact of epigenetic mechanisms on the response to RT is poorly understood. DNA methylation is an important epigenetic mechanism because it influences many cellular processes and participates in regulating gene transcription. 4 Methylation changes in CpG islands after exposure to ionizing radiation (IR) have been described in breast cancer cell lines, 5 and a correlation between radiation responsiveness and altered DNA methyla- tion levels has been observed in cultured cells. 6 Different pathways are known to be activated following irradiation, such as prosurvival signaling, DNA repair pathways 7 and DNA damage pathways, 8 to maintain cell stability, and DNA methylation may influence these pathways by affecting gene expression. In our study, we have addressed to what degree radiother- apy (RT) affects DNA methylation profiles in patient samples and if changes in methylation levels are associated with response to therapy. By comparing irradiated tumor tissue with nonirradiated tumor tissue from the very same patient, Key words: irradiation, immune response, methylation, breast cancer, dose dependent Additional Supporting Information may be found in the online version of this article This is an open access article under the terms of the Creative Com- mons Attribution-Non-Commercial-NoDerivs Licence, which per- mits use and distribution in any medium, provided the original work is properly cited, the use is non-commercial and no modifica- tions or adaptations are made. Conflict of interests: Nothing to report Grant sponsors: Stiftelsen Henrik Homans Minde, Eckbos Legat and Stiftelsen Kristian Gerhard Jebsen DOI: 10.1002/ijc.28862 History: Received 3 Sep 2013; Accepted 12 Mar 2014; Online 24 Mar 2014 Correspondence to: Åslaug Helland, Department of Genetics, Institute for Cancer Research, Oslo University Hospital-The Norwe- gian Radium Hospital, Oslo, Norway, Tel.: 147-2278-4527, E-mail: [email protected] Cancer Genetics Int. J. Cancer: 00, 00–00 (2014) V C 2014 The Authors. Published by Wiley Periodicals, Inc. on behalf of UICC International Journal of Cancer IJC
-
Upload
independent -
Category
Documents
-
view
1 -
download
0
Transcript of Differential DNA methylation analysis of breast cancer reveals the impact of immune signaling in...
Differential DNA methylation analysis of breast cancer revealsthe impact of immune signaling in radiation therapy
Ann Rita Halvorsen1, Aslaug Helland1,2,3, Thomas Fleischer1,4, Karen Marie Haug1, Grethe Irene Grenaker Alnæs1,4,
Daniel Nebdal1, Randi G. Syljuasen5, Nizar Touleimat6, Florence Busato6, J€org Tost4,6, Anna B. Sætersdal2,
Anne-Lise B�rresen-Dale1,4, Vessela Kristensen1,4,7 and Hege Edvardsen1,4
1 Department of Genetics, Institute for Cancer Research, Oslo University Hospital-The Norwegian Radium Hospital, Oslo, Norway2 Department of Oncology, Oslo University Hospital-The Norwegian Radium Hospital, Oslo, Norway3 Institute for Clinical Medicine, Faculty of Medicine, University of Oslo, Oslo, Norway4 K.G. Jebsen Centre for Breast Cancer Research, University of Oslo, Oslo, Norway5 Department of Radiation Biology, Institute for Cancer Research, Oslo University Hospital-The Norwegian Radium Hospital, Oslo, Norway6 Laboratory for Epigenetics and Environment, Centre National de G�enotypage, CEA-Institut de G�enomique, Evry, France7 Department of Clinical Molecular Biology (EpiGen), Medical Division, Akerhus University Hospital, L�renskog, Norway
Radiotherapy (RT) is a central treatment modality for breast cancer patients. The purpose of our study was to investigate the
DNA methylation changes in tumors following RT, and to identify epigenetic markers predicting treatment outcome. Paired
biopsies from patients with inoperable breast cancer were collected both before irradiation (n 5 20) and after receiving 10–
24 Gray (Gy) (n 5 19). DNA methylation analysis was performed by using Illumina Infinium 27K arrays. Fourteen genes were
selected for technical validation by pyrosequencing. Eighty-two differentially methylated genes were identified in irradiated
(n 5 11) versus nonirradiated (n 5 19) samples (false discovery rate, FDR 5 1.1%). Methylation levels in pathways belonging
to the immune system were most altered after RT. Based on methylation levels before irradiation, a panel of five genes
(H2AFY, CTSA, LTC4S, IL5RA and RB1) were significantly associated with clinical response (p 5 0.041). Furthermore, the
degree of methylation changes for 2,516 probes correlated with the given radiation dose. Within the 2,516 probes, an enrich-
ment for pathways involved in cellular immune response, proliferation and apoptosis was identified (FDR < 5%). Here, we
observed clear differences in methylation levels induced by radiation, some associated with response to treatment. Our study
adds knowledge on the molecular mechanisms behind radiation response.
Cancer is one of the most common human diseases, andworldwide 1.38 million new breast cancer incidences arerecorded annually.1 The use of radiotherapy (RT) is increas-ing together with a tremendous development in treatment
planning, where optimal fractionation and precision of thedose to the target volume are important factors for minimiz-ing the side effect as well as increasing the probability oftumor control.2 Still, some patients respond poorly to thetreatment, suggesting that relevant genetic and epigenetic var-iations between individuals exist.3 The impact of epigeneticmechanisms on the response to RT is poorly understood.DNA methylation is an important epigenetic mechanismbecause it influences many cellular processes and participatesin regulating gene transcription.4 Methylation changes inCpG islands after exposure to ionizing radiation (IR) havebeen described in breast cancer cell lines,5 and a correlationbetween radiation responsiveness and altered DNA methyla-tion levels has been observed in cultured cells.6 Differentpathways are known to be activated following irradiation,such as prosurvival signaling, DNA repair pathways7 andDNA damage pathways,8 to maintain cell stability, and DNAmethylation may influence these pathways by affecting geneexpression.
In our study, we have addressed to what degree radiother-apy (RT) affects DNA methylation profiles in patient samplesand if changes in methylation levels are associated withresponse to therapy. By comparing irradiated tumor tissuewith nonirradiated tumor tissue from the very same patient,
Key words: irradiation, immune response, methylation, breast
cancer, dose dependent
Additional Supporting Information may be found in the online
version of this article
This is an open access article under the terms of the Creative Com-
mons Attribution-Non-Commercial-NoDerivs Licence, which per-
mits use and distribution in any medium, provided the original
work is properly cited, the use is non-commercial and no modifica-
tions or adaptations are made.
Conflict of interests: Nothing to report
Grant sponsors: Stiftelsen Henrik Homans Minde, Eckbos Legat
and Stiftelsen Kristian Gerhard Jebsen
DOI: 10.1002/ijc.28862
History: Received 3 Sep 2013; Accepted 12 Mar 2014; Online 24
Mar 2014
Correspondence to: Åslaug Helland, Department of Genetics,
Institute for Cancer Research, Oslo University Hospital-The Norwe-
gian Radium Hospital, Oslo, Norway, Tel.: 147-2278-4527,
E-mail: [email protected]
Can
cerGenetics
Int. J. Cancer: 00, 00–00 (2014) VC 2014 The Authors. Published by Wiley Periodicals, Inc. on behalf of UICC
International Journal of Cancer
IJC
we attempted to discover differential methylation patternsand obtain important information about pathway regulationsassociated with radiation. Genome-wide methylation effectswere investigated in tissue biopsies both before exposure toIR and after receiving 10–24 Gray (Gy).
Material and MethodsEthical considerations
All patients provided informed consent, and the project wasapproved by our institutional review board and by theRegional Ethical Committee (REC).
Samples and datasets
Twenty breast cancer patients treated with radiation during2002–2005 were included in our study. All patients had inop-erable breast cancer stage 3–4 or local relapse, with no stand-ard treatment established. Some patients had receivedsystemic treatment before the RT. The volume targeted wasthe mammary gland and affected lymph nodes when pre-sent. Total dose prescribed was 25 3 2 Gy with photons or23 3 2 Gy with photons and 2 3 2 Gy with electrons. Biop-sies were collected both before radiation (n 5 20) and afterreceiving 10–24 Gy (n 5 19) of photon irradiation, depend-ing on practicalities in biopsy sampling and scheduling. Theresponse to radiation was evaluated after treatment comple-tion, based on alterations in the clinically evaluated tumorsize and categorized as good response, partial response, noresponse or progression. Side effects were evaluated accordingto RTOG/EORTC Late Radiation Morbidity Scoring Scheme.9
All clinical information is presented in Supporting Informa-tion Table S1, which is an updated description of the clinicalmaterial that Helland et al. used when studying gene expres-sion.10 Breast tissue from nine healthy women who under-went breast tissue reduction was used as reference material(denoted as normal controls). The methylation array dataare available in the Gene Expression Omnibus (GEO)(http://www.ncbi.nlm.nih.gov/geo) with accession numberGSE50220.
Cell lines
Breast cancer cell lines MCF-7 (obtained from Interlab CellLine Collection, Genova, Italy) and SK-BR-3 (obtained from
American type Culture Collection, USA) were cultured andirradiated three times with 2 Gy doses and 24 hr betweeneach fractionation dose. The recipe for the growth mediumused for the cell lines is given in Supporting InformationTable S2. Irradiation was performed by using a FaxitronCP160 X-ray machine (Initios Medical AB, Sweden) (160 kV,6.3 mA, dose rate 0.5 Gy/min).
DNA isolation
DNA was extracted from breast tumor biopsies and cell linesby using MaxwellVR 16 DNA Purification Kits TechnicalManual, Literature # TM284 (http://www.promega.com) anda MaxwellVR 16 instrument.
DNA methylation
The EpiTectVR Bisulphite Kit 48 (Qiagen, California, USA)(Source: EpiTectVR Bisulphite Handbook, QIAGEN 09/2009)was used to treat DNA with bisulfite, and the amount of con-verted DNA was measured by real-time polymerase chainreaction (PCR), as previously described.11 The methylationanalysis was performed by using Illumina Infinium Human-Methylation27 BeadChip Kits, Genome Build 36 (27K).12
Because of low DNA concentration, the total elution volumeof the bisulfite-treated DNA (30–40 lL) was used instead ofthe recommended 4 lL. To ensure complete denaturation, 30lL 0.1 M NaOH was used instead of 4 lL as outlined in themethylation 40 protocol guide. The rest of the procedure wasperformed according to the protocol (Illumina, San Diego,USA Part#11322371 Rev. A). Methylation scores for eachCpG site are referred to as “beta” values (using the BeadStu-dio software from Illumina) ranging from 0 (unmethylated,U) to 1 (fully methylated, M) on a continuous scale, and arecalculated from the intensity of the M and U alleles as theratio of fluorescent signals, b 5 Max(M,0)/(Max(M,0) 1
Max(U,0 1 100)).Pyrosequencing was used as the technical validation for
the array data. Pyrosequencing is a “sequencing by syn-thesis” method that quantitatively analyzes high-quality,bisulfite-converted DNA sequences. Pyrosequencing primerswere designed according to Tost and Gut13 and producedby Eurofins MWG Operon. PCRs were performed in aPTC-200 Peltier Thermal Cycler (BioRad) using either thePyroMark PCR Kit (Qiagen) or a Hotstar TaqVR DNA
What’s new?
Radiotherapy is a central treatment modality for breast cancer patients. This study set to investigate DNA methylation changes
in tumors following radiotherapy and identify epigenetic markers predicting treatment outcome. Genome-wide methylation
effects were studied by comparing breast cancer biopsies before and after irradiation. 82 differentially methylated genes
enriched for immune regulation pathways were identified. Based on methylation levels before irradiation, a combination of 5
genes was significantly associated with response to radiotherapy. A dose dependency was seen for 2516 probes, mainly
involved in immune response and apoptosis. This study sheds light on the genes and pathways involved in radiation
response.
Can
cerGenetics
2 Methylation impact on radiation response
Int. J. Cancer: 00, 00–00 (2014) VC 2014 The Authors. Published by Wiley Periodicals, Inc. on behalf of UICC
Polymerase Kit (Qiagen). The enzyme mix and substratemix were PyroMark Gold Q96 reagents (Qiagen), while thepyrosequencing reaction was performed in a PyroMark Q96MD machine. PCR primers, temperature profiles and pri-mers for pyrosequencing are shown in Supporting Informa-tion Table S3.
Statistical analysis
The array dataset was quality controlled and normalized.Bead studio software was used for the initial processing ofthe methylation data. Probes for which a score was missingfor any array were discarded (n 5 10). Raw data were nor-malized according to a three-step process: color bias correc-tion, background level correction and quantile normalization.Only those beta values associated with significant p-valueswere selected for comparing locus methylation status of thedata. Individual loci were scored as differentially methylatedif the difference between median beta values was greater thanor equal to 20% of methylation.
A paired analysis of the samples was utilized with a signif-icance analysis of microarrays (SAM) in J-express (http://www.molmine.com/) (log2-transformation, 2000 permuta-tions). Next, a group comparison based on the beta-valuesfrom the array was performed. The dataset was divided intotwo groups consisting of (i) nonirradiated samples and (ii)irradiated samples, and a Prediction Analysis of Microarrays(PAM) was performed in R (ver. 2.12.2 http://cran.r-project.org/). The “nearest shrunken method” was used to identifythose genes best characterizing each class.14 By defining athreshold, a misclassification table for the samples and num-ber of genes with false discovery rate (FDR) were obtained.The threshold giving the lowest overall error (OER) and theminimum misclassified samples was chosen. To test therobustness of the gene list, a “leave one out test” (LOO) wasperformed in R. Extracted lists based on the PAM analysiswere further analyzed by supervised hierarchical clustering inJ-express (http://www.molmine.com/) (average linkage andSpearman rank correlation) and ingenuity pathway analysis(IPA; IngenuityVR Systems, http://www.ingenuity.com). ASpearman’s rho correlation analysis between given doses andchanges in the degree of methylation was performed by usingR (ver. 2.15.1). The Mann–Whitney U-test, Fisher’s exact testand Spearman’s correlation analysis (IBM SPSS Statistics 18)were used when appropriate. Criteria for significance for allanalyses were p < 0.05. Furthermore, to investigate the dif-ference between good and poor responses for “before IR” and“after IR” groups, the following statistical procedure wasapplied: (i) A methylation index (z-score) of the data wasobtained by calculating for each sample the deviation fromthe mean methylation level divided by the standard deviationfor each gene. (ii) The relative value of each z-score wastaken to measure the size of the effect for the methylationlevel. (iii) All relative values for one sample were summar-ized. (iv) The rank-sum test was applied to two groups, goodand poor for each group.
ResultsDNA methylation associated with RT
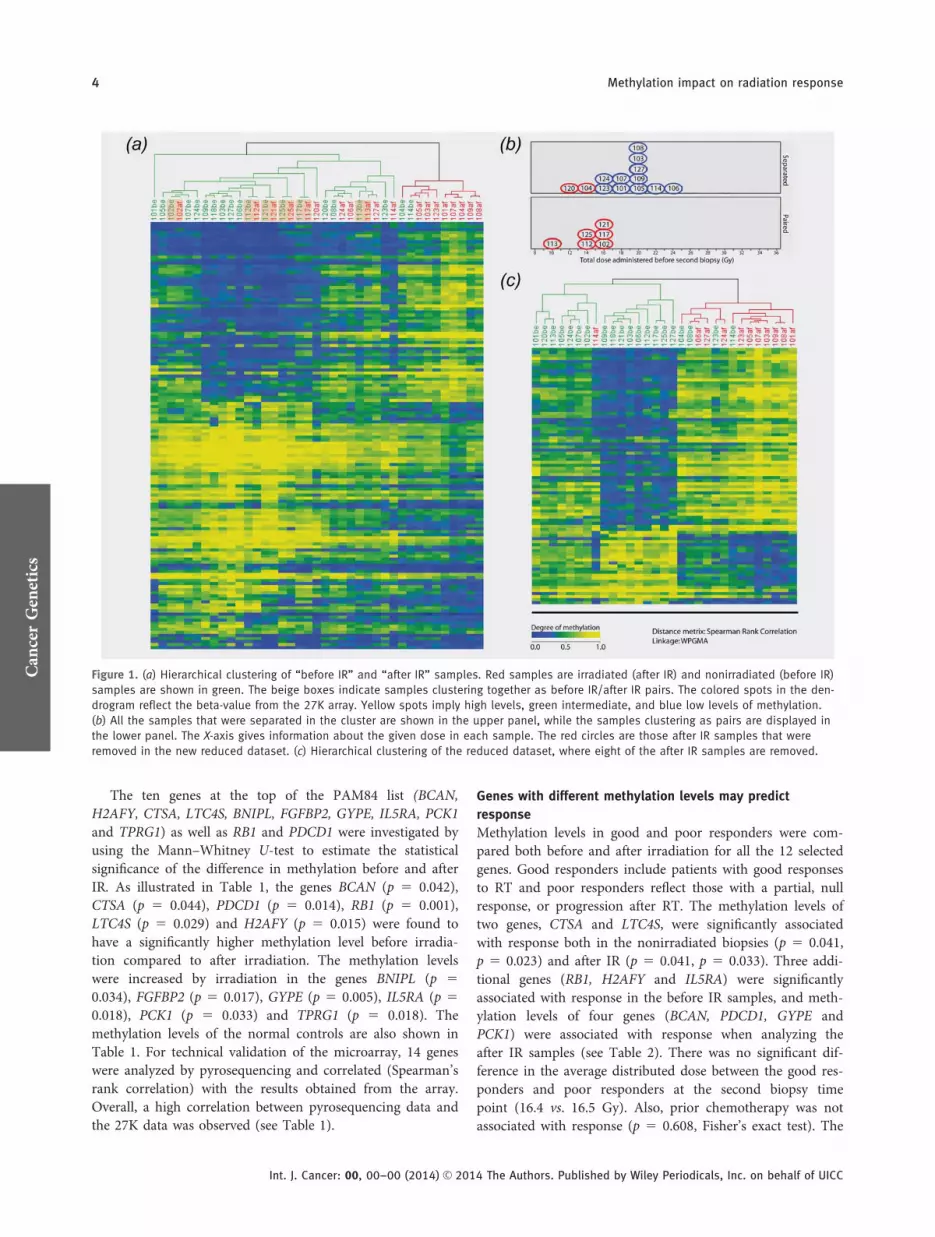
Genome-wide DNA methylation data from breast tumorsamples (n 5 39) and normal controls (n 5 9) were obtainedwith the use of the Illumina Infinium 27K array. By usingPAM, 140 probes representing 138 genes (referred to asPAM140 list; see Supporting Information Table S4) wereidentified as differentially methylated in the nonirradiatedsamples versus the irradiated samples (FDR 5 8.7). ForPAM140, OER was 27.8%, indicating that as many as six of19 after IR samples and five of 20 before IR samples weremisclassified. Supervised hierarchical clustering was per-formed by using the PAM140 list (see Fig. 1a). Six of thepaired samples clustered together (102, 112, 113, 117, 121and 125 marked with a beige box in the cluster), indicatingthat these after IR samples shared more similarities with itsrespective sample partner than with the irradiated group.Interestingly, these biopsies were collected after receiving acomparatively lower cumulative dose (10–16 Gy) comparedto the other after IR samples (12–24 Gy) (see Fig. 1b). Sam-ples receiving higher cumulative doses generally showed abetter separation in the hierarchical clustering, except sam-ples 120 and 104, which were separated in the cluster despiteonly receiving 12 and 14 Gy, respectively. We hypothesizedthat the change in methylation level was more prominentafter receiving a higher dose. To test this, samples receivingless than 16 Gy were removed (104, 112, 113, 120 and 125)(see Fig. 1b) and the analysis redone. Based on 20 before IRsamples and 14 after IR samples, we did a new PAM analysis.With an OER on 20.3%, a gene list containing 211 probes(PAM211) was generated (FDR 5 29%). When clustering,three after IR samples still clustered together with the beforeIR sample (121, 117 and 102). In an attempt to identify thelist of genes with a highest radiation-induced difference inmethylation, we also excluded these three from the PAManalysis. The reduced sample set was analyzed by usingPAM, giving a probe list (84 probes; FDR 5 1.1%) corre-sponding to 82 genes (PAM84 list; see Supporting Informa-tion Table S5). The OER was reduced to 12.8%, where one of11 after IR samples and three of 20 before IR samples weremisclassified. There were 40 genes overlapping betweenPAM84 and PAM140, while PAM211 and PAM84 had 69overlapping genes. All the top ten genes in PAM84 were alsopresent in the two other lists. To test the robustness of thePAM84 list, a LOO test was performed on all the after IRsamples, generating 11 gene lists. By using Spearman’s rhocorrelation, a significant correlation between the lists wasobtained (rho 5 0.73; p 5 2.2E216), indicating a robustPAM84 gene list. Supervised hierarchical clustering was uti-lized for the PAM84 list (see Fig. 1c).
Next, a paired SAM analysis was performed on all 27,568probes to see if the degree of methylation had changed afterirradiation in the paired samples (n 5 19 pairs). Two genes,RB1 and PDCD1, were found to be significantly demethylated(q-val < 0.0001, FDR < 0.0001) after IR.
Can
cerGenetics
Halvorsen et al. 3
Int. J. Cancer: 00, 00–00 (2014) VC 2014 The Authors. Published by Wiley Periodicals, Inc. on behalf of UICC
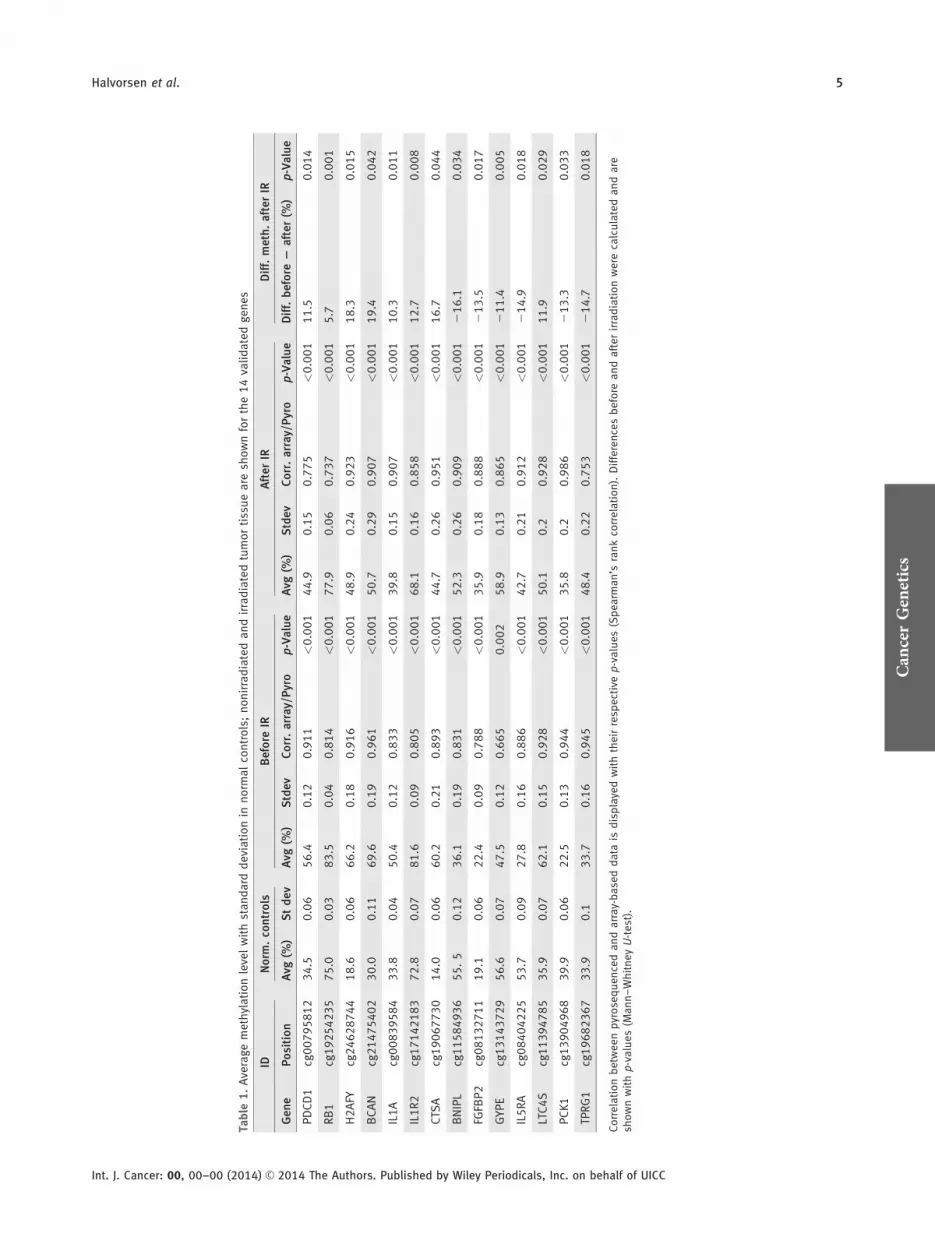
The ten genes at the top of the PAM84 list (BCAN,H2AFY, CTSA, LTC4S, BNIPL, FGFBP2, GYPE, IL5RA, PCK1and TPRG1) as well as RB1 and PDCD1 were investigated byusing the Mann–Whitney U-test to estimate the statisticalsignificance of the difference in methylation before and afterIR. As illustrated in Table 1, the genes BCAN (p 5 0.042),CTSA (p 5 0.044), PDCD1 (p 5 0.014), RB1 (p 5 0.001),LTC4S (p 5 0.029) and H2AFY (p 5 0.015) were found tohave a significantly higher methylation level before irradia-tion compared to after irradiation. The methylation levelswere increased by irradiation in the genes BNIPL (p 5
0.034), FGFBP2 (p 5 0.017), GYPE (p 5 0.005), IL5RA (p 5
0.018), PCK1 (p 5 0.033) and TPRG1 (p 5 0.018). Themethylation levels of the normal controls are also shown inTable 1. For technical validation of the microarray, 14 geneswere analyzed by pyrosequencing and correlated (Spearman’srank correlation) with the results obtained from the array.Overall, a high correlation between pyrosequencing data andthe 27K data was observed (see Table 1).
Genes with different methylation levels may predict
response
Methylation levels in good and poor responders were com-pared both before and after irradiation for all the 12 selectedgenes. Good responders include patients with good responsesto RT and poor responders reflect those with a partial, nullresponse, or progression after RT. The methylation levels oftwo genes, CTSA and LTC4S, were significantly associatedwith response both in the nonirradiated biopsies (p 5 0.041,p 5 0.023) and after IR (p 5 0.041, p 5 0.033). Three addi-tional genes (RB1, H2AFY and IL5RA) were significantlyassociated with response in the before IR samples, and meth-ylation levels of four genes (BCAN, PDCD1, GYPE andPCK1) were associated with response when analyzing theafter IR samples (see Table 2). There was no significant dif-ference in the average distributed dose between the good res-ponders and poor responders at the second biopsy timepoint (16.4 vs. 16.5 Gy). Also, prior chemotherapy was notassociated with response (p 5 0.608, Fisher’s exact test). The
Figure 1. (a) Hierarchical clustering of “before IR” and “after IR” samples. Red samples are irradiated (after IR) and nonirradiated (before IR)
samples are shown in green. The beige boxes indicate samples clustering together as before IR/after IR pairs. The colored spots in the den-
drogram reflect the beta-value from the 27K array. Yellow spots imply high levels, green intermediate, and blue low levels of methylation.
(b) All the samples that were separated in the cluster are shown in the upper panel, while the samples clustering as pairs are displayed in
the lower panel. The X-axis gives information about the given dose in each sample. The red circles are those after IR samples that were
removed in the new reduced dataset. (c) Hierarchical clustering of the reduced dataset, where eight of the after IR samples are removed.
Can
cerGenetics
4 Methylation impact on radiation response
Int. J. Cancer: 00, 00–00 (2014) VC 2014 The Authors. Published by Wiley Periodicals, Inc. on behalf of UICC
Tab
le1
.A
vera
ge
me
thyl
ati
on
leve
lw
ith
sta
nd
ard
de
via
tio
nin
no
rma
lco
ntr
ols
;n
on
irra
dia
ted
an
dir
rad
iate
dtu
mo
rti
ssu
ea
resh
ow
nfo
rth
e1
4va
lid
ate
dg
en
es
IDN
orm
.co
ntr
ols
Be
fore
IRA
fte
rIR
Dif
f.m
eth
.a
fte
rIR
Ge
ne
Po
siti
on
Avg
(%)
St
de
vA
vg(%
)S
tde
vC
orr
.a
rra
y/P
yro
p-V
alu
eA
vg(%
)S
tde
vC
orr
.a
rra
y/P
yro
p-V
alu
eD
iff.
be
fore
2a
fte
r(%
)p
-Va
lue
PD
CD
1cg
00
79
58
12
34
.50
.06
56
.40
.12
0.9
11
<0
.00
14
4.9
0.1
50
.77
5<
0.0
01
11
.50
.01
4
RB
1cg
19
25
42
35
75
.00
.03
83
.50
.04
0.8
14
<0
.00
17
7.9
0.0
60
.73
7<
0.0
01
5.7
0.0
01
H2
AFY
cg2
46
28
74
41
8.6
0.0
66
6.2
0.1
80
.91
6<
0.0
01
48
.90
.24
0.9
23
<0
.00
11
8.3
0.0
15
BC
AN
cg2
14
75
40
23
0.0
0.1
16
9.6
0.1
90
.96
1<
0.0
01
50
.70
.29
0.9
07
<0
.00
11
9.4
0.0
42
IL1
Acg
00
83
95
84
33
.80
.04
50
.40
.12
0.8
33
<0
.00
13
9.8
0.1
50
.90
7<
0.0
01
10
.30
.01
1
IL1
R2
cg1
71
42
18
37
2.8
0.0
78
1.6
0.0
90
.80
5<
0.0
01
68
.10
.16
0.8
58
<0
.00
11
2.7
0.0
08
CTS
Acg
19
06
77
30
14
.00
.06
60
.20
.21
0.8
93
<0
.00
14
4.7
0.2
60
.95
1<
0.0
01
16
.70
.04
4
BN
IPL
cg1
15
84
93
65
5.
50
.12
36
.10
.19
0.8
31
<0
.00
15
2.3
0.2
60
.90
9<
0.0
01
21
6.1
0.0
34
FGFB
P2
cg0
81
32
71
11
9.1
0.0
62
2.4
0.0
90
.78
8<
0.0
01
35
.90
.18
0.8
88
<0
.00
12
13
.50
.01
7
GY
PE
cg1
31
43
72
95
6.6
0.0
74
7.5
0.1
20
.66
50
.00
25
8.9
0.1
30
.86
5<
0.0
01
21
1.4
0.0
05
IL5
RA
cg0
84
04
22
55
3.7
0.0
92
7.8
0.1
60
.88
6<
0.0
01
42
.70
.21
0.9
12
<0
.00
12
14
.90
.01
8
LTC
4S
cg1
13
94
78
53
5.9
0.0
76
2.1
0.1
50
.92
8<
0.0
01
50
.10
.20
.92
8<
0.0
01
11
.90
.02
9
PC
K1
cg1
39
04
96
83
9.9
0.0
62
2.5
0.1
30
.94
4<
0.0
01
35
.80
.20
.98
6<
0.0
01
21
3.3
0.0
33
TPR
G1
cg1
96
82
36
73
3.9
0.1
33
.70
.16
0.9
45
<0
.00
14
8.4
0.2
20
.75
3<
0.0
01
21
4.7
0.0
18
Co
rre
lati
on
be
twe
en
pyr
ose
qu
en
ced
an
da
rra
y-b
ase
dd
ata
isd
isp
laye
dw
ith
the
irre
spe
ctiv
ep
-va
lue
s(S
pe
arm
an
’sra
nk
corr
ela
tio
n).
Dif
fere
nce
sb
efo
rea
nd
aft
er
irra
dia
tio
nw
ere
calc
ula
ted
an
da
resh
ow
nw
ith
p-v
alu
es
(Ma
nn
–W
hit
ne
yU
-te
st).
Can
cerGenetics
Halvorsen et al. 5
Int. J. Cancer: 00, 00–00 (2014) VC 2014 The Authors. Published by Wiley Periodicals, Inc. on behalf of UICC
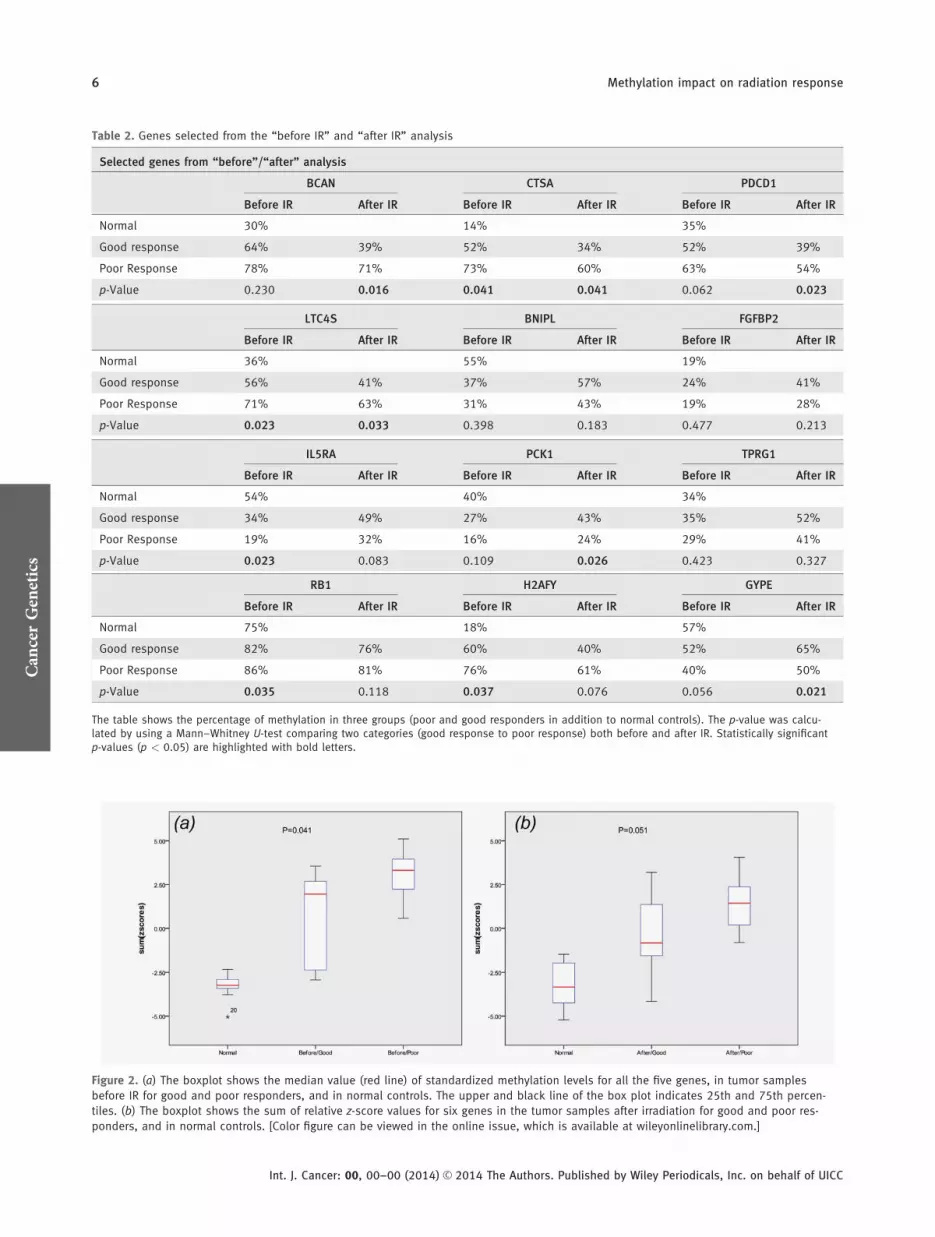
Figure 2. (a) The boxplot shows the median value (red line) of standardized methylation levels for all the five genes, in tumor samples
before IR for good and poor responders, and in normal controls. The upper and black line of the box plot indicates 25th and 75th percen-
tiles. (b) The boxplot shows the sum of relative z-score values for six genes in the tumor samples after irradiation for good and poor res-
ponders, and in normal controls. [Color figure can be viewed in the online issue, which is available at wileyonlinelibrary.com.]
Table 2. Genes selected from the “before IR” and “after IR” analysis
Selected genes from “before”/“after” analysis
BCAN CTSA PDCD1
Before IR After IR Before IR After IR Before IR After IR
Normal 30% 14% 35%
Good response 64% 39% 52% 34% 52% 39%
Poor Response 78% 71% 73% 60% 63% 54%
p-Value 0.230 0.016 0.041 0.041 0.062 0.023
LTC4S BNIPL FGFBP2
Before IR After IR Before IR After IR Before IR After IR
Normal 36% 55% 19%
Good response 56% 41% 37% 57% 24% 41%
Poor Response 71% 63% 31% 43% 19% 28%
p-Value 0.023 0.033 0.398 0.183 0.477 0.213
IL5RA PCK1 TPRG1
Before IR After IR Before IR After IR Before IR After IR
Normal 54% 40% 34%
Good response 34% 49% 27% 43% 35% 52%
Poor Response 19% 32% 16% 24% 29% 41%
p-Value 0.023 0.083 0.109 0.026 0.423 0.327
RB1 H2AFY GYPE
Before IR After IR Before IR After IR Before IR After IR
Normal 75% 18% 57%
Good response 82% 76% 60% 40% 52% 65%
Poor Response 86% 81% 76% 61% 40% 50%
p-Value 0.035 0.118 0.037 0.076 0.056 0.021
The table shows the percentage of methylation in three groups (poor and good responders in addition to normal controls). The p-value was calcu-lated by using a Mann–Whitney U-test comparing two categories (good response to poor response) both before and after IR. Statistically significantp-values (p < 0.05) are highlighted with bold letters.
Can
cerGenetics
6 Methylation impact on radiation response
Int. J. Cancer: 00, 00–00 (2014) VC 2014 The Authors. Published by Wiley Periodicals, Inc. on behalf of UICC
z-score methylation index revealed that a panel of five non-irradiated genes combined (RB1, H2AFY, CTSA, LTC4S andIL5RA) could predict response (p 5 0.041). As illustrated inFigure 2, the panel of six genes (BCAN, PDCD1, CTSA,LTC4S, GYPE and PCK1) evaluated by the methylation indexafter IR was of borderline significance (p 5 0.051).
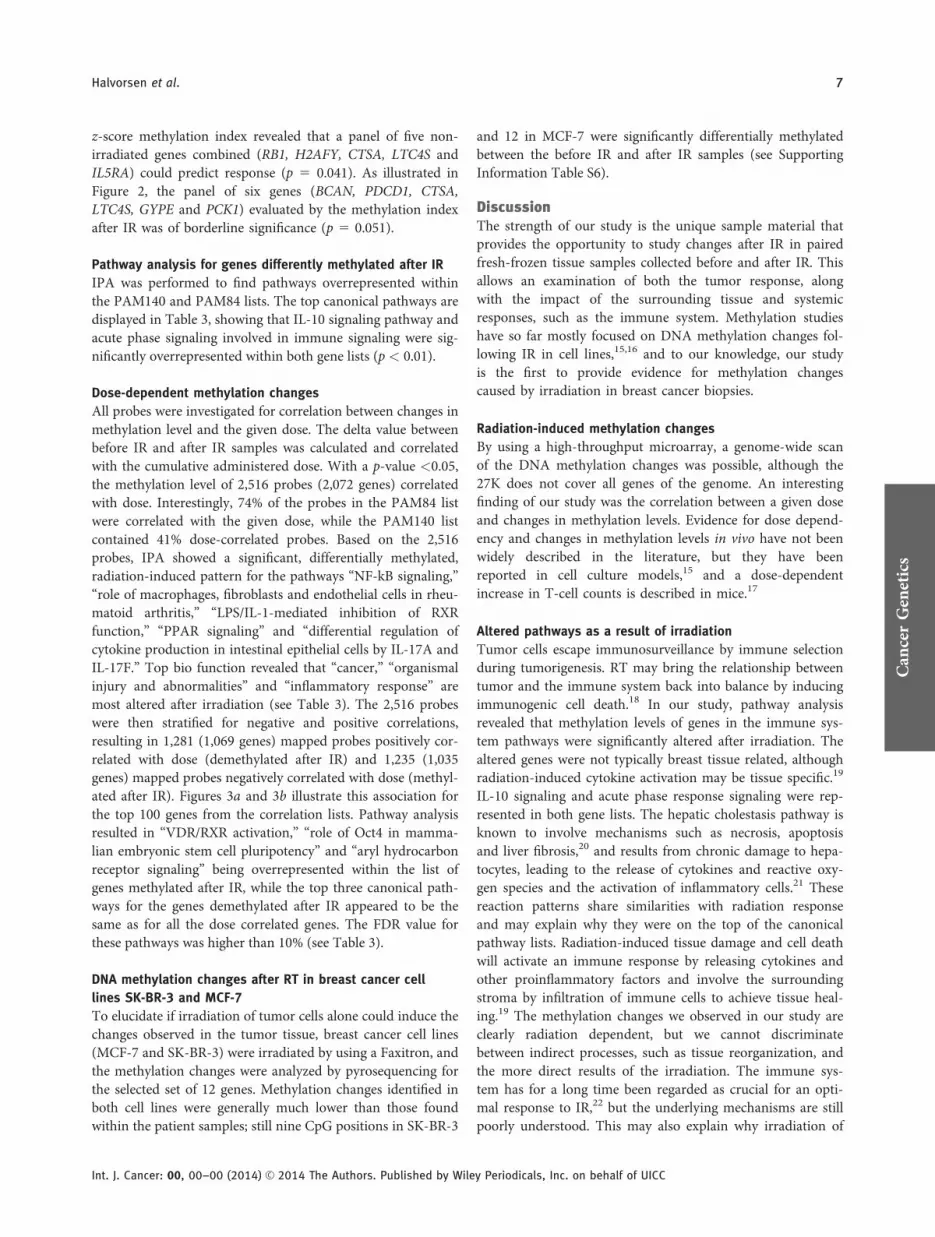
Pathway analysis for genes differently methylated after IR
IPA was performed to find pathways overrepresented withinthe PAM140 and PAM84 lists. The top canonical pathways aredisplayed in Table 3, showing that IL-10 signaling pathway andacute phase signaling involved in immune signaling were sig-nificantly overrepresented within both gene lists (p < 0.01).
Dose-dependent methylation changes
All probes were investigated for correlation between changes inmethylation level and the given dose. The delta value betweenbefore IR and after IR samples was calculated and correlatedwith the cumulative administered dose. With a p-value <0.05,the methylation level of 2,516 probes (2,072 genes) correlatedwith dose. Interestingly, 74% of the probes in the PAM84 listwere correlated with the given dose, while the PAM140 listcontained 41% dose-correlated probes. Based on the 2,516probes, IPA showed a significant, differentially methylated,radiation-induced pattern for the pathways “NF-kB signaling,”“role of macrophages, fibroblasts and endothelial cells in rheu-matoid arthritis,” “LPS/IL-1-mediated inhibition of RXRfunction,” “PPAR signaling” and “differential regulation ofcytokine production in intestinal epithelial cells by IL-17A andIL-17F.” Top bio function revealed that “cancer,” “organismalinjury and abnormalities” and “inflammatory response” aremost altered after irradiation (see Table 3). The 2,516 probeswere then stratified for negative and positive correlations,resulting in 1,281 (1,069 genes) mapped probes positively cor-related with dose (demethylated after IR) and 1,235 (1,035genes) mapped probes negatively correlated with dose (methyl-ated after IR). Figures 3a and 3b illustrate this association forthe top 100 genes from the correlation lists. Pathway analysisresulted in “VDR/RXR activation,” “role of Oct4 in mamma-lian embryonic stem cell pluripotency” and “aryl hydrocarbonreceptor signaling” being overrepresented within the list ofgenes methylated after IR, while the top three canonical path-ways for the genes demethylated after IR appeared to be thesame as for all the dose correlated genes. The FDR value forthese pathways was higher than 10% (see Table 3).
DNA methylation changes after RT in breast cancer cell
lines SK-BR-3 and MCF-7
To elucidate if irradiation of tumor cells alone could induce thechanges observed in the tumor tissue, breast cancer cell lines(MCF-7 and SK-BR-3) were irradiated by using a Faxitron, andthe methylation changes were analyzed by pyrosequencing forthe selected set of 12 genes. Methylation changes identified inboth cell lines were generally much lower than those foundwithin the patient samples; still nine CpG positions in SK-BR-3
and 12 in MCF-7 were significantly differentially methylatedbetween the before IR and after IR samples (see SupportingInformation Table S6).
DiscussionThe strength of our study is the unique sample material thatprovides the opportunity to study changes after IR in pairedfresh-frozen tissue samples collected before and after IR. Thisallows an examination of both the tumor response, alongwith the impact of the surrounding tissue and systemicresponses, such as the immune system. Methylation studieshave so far mostly focused on DNA methylation changes fol-lowing IR in cell lines,15,16 and to our knowledge, our studyis the first to provide evidence for methylation changescaused by irradiation in breast cancer biopsies.
Radiation-induced methylation changes
By using a high-throughput microarray, a genome-wide scanof the DNA methylation changes was possible, although the27K does not cover all genes of the genome. An interestingfinding of our study was the correlation between a given doseand changes in methylation levels. Evidence for dose depend-ency and changes in methylation levels in vivo have not beenwidely described in the literature, but they have beenreported in cell culture models,15 and a dose-dependentincrease in T-cell counts is described in mice.17
Altered pathways as a result of irradiation
Tumor cells escape immunosurveillance by immune selectionduring tumorigenesis. RT may bring the relationship betweentumor and the immune system back into balance by inducingimmunogenic cell death.18 In our study, pathway analysisrevealed that methylation levels of genes in the immune sys-tem pathways were significantly altered after irradiation. Thealtered genes were not typically breast tissue related, althoughradiation-induced cytokine activation may be tissue specific.19
IL-10 signaling and acute phase response signaling were rep-resented in both gene lists. The hepatic cholestasis pathway isknown to involve mechanisms such as necrosis, apoptosisand liver fibrosis,20 and results from chronic damage to hepa-tocytes, leading to the release of cytokines and reactive oxy-gen species and the activation of inflammatory cells.21 Thesereaction patterns share similarities with radiation responseand may explain why they were on the top of the canonicalpathway lists. Radiation-induced tissue damage and cell deathwill activate an immune response by releasing cytokines andother proinflammatory factors and involve the surroundingstroma by infiltration of immune cells to achieve tissue heal-ing.19 The methylation changes we observed in our study areclearly radiation dependent, but we cannot discriminatebetween indirect processes, such as tissue reorganization, andthe more direct results of the irradiation. The immune sys-tem has for a long time been regarded as crucial for an opti-mal response to IR,22 but the underlying mechanisms are stillpoorly understood. This may also explain why irradiation of
Can
cerGenetics
Halvorsen et al. 7
Int. J. Cancer: 00, 00–00 (2014) VC 2014 The Authors. Published by Wiley Periodicals, Inc. on behalf of UICC
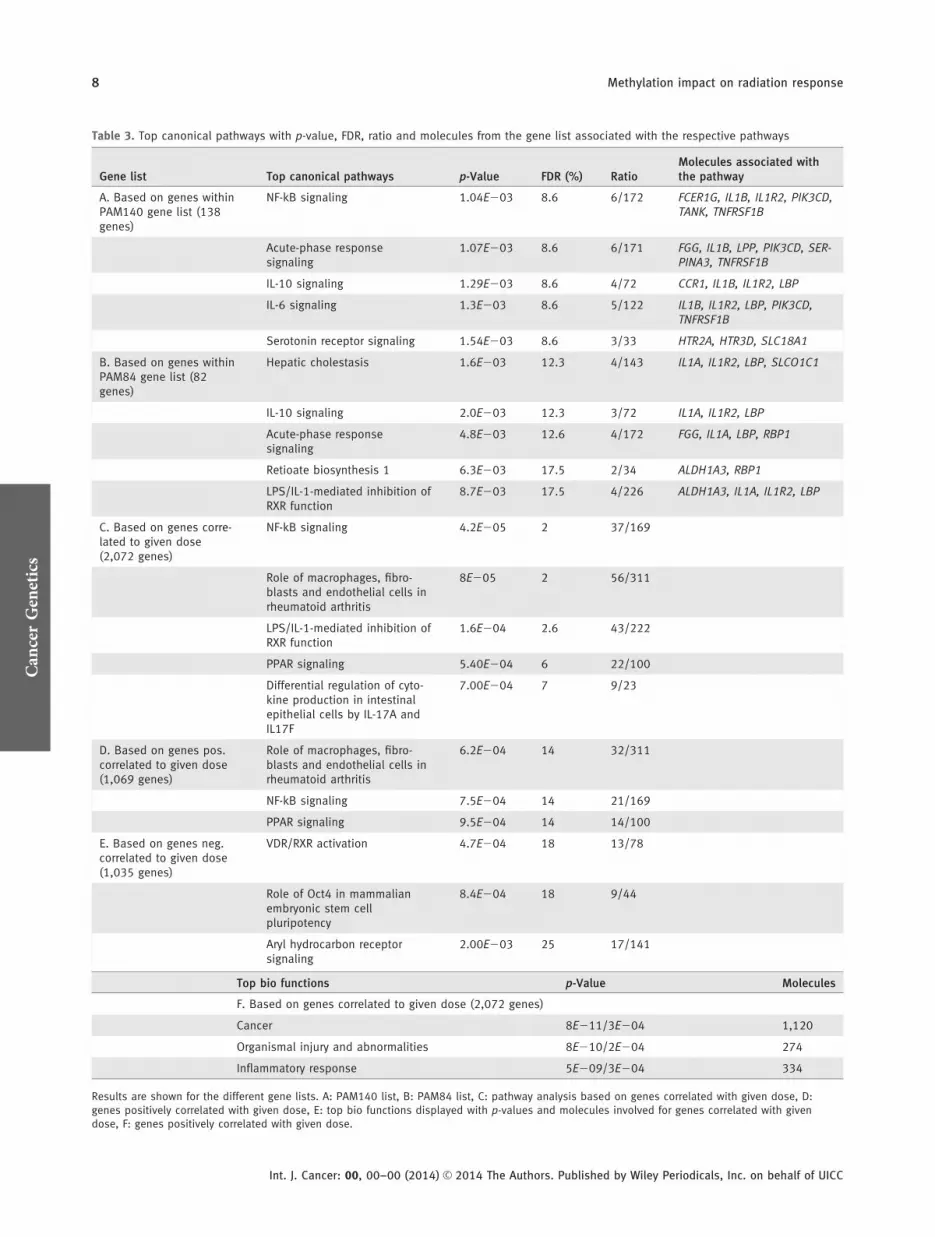
Table 3. Top canonical pathways with p-value, FDR, ratio and molecules from the gene list associated with the respective pathways
Gene list Top canonical pathways p-Value FDR (%) RatioMolecules associated withthe pathway
A. Based on genes withinPAM140 gene list (138genes)
NF-kB signaling 1.04E203 8.6 6/172 FCER1G, IL1B, IL1R2, PIK3CD,TANK, TNFRSF1B
Acute-phase responsesignaling
1.07E203 8.6 6/171 FGG, IL1B, LPP, PIK3CD, SER-PINA3, TNFRSF1B
IL-10 signaling 1.29E203 8.6 4/72 CCR1, IL1B, IL1R2, LBP
IL-6 signaling 1.3E203 8.6 5/122 IL1B, IL1R2, LBP, PIK3CD,TNFRSF1B
Serotonin receptor signaling 1.54E203 8.6 3/33 HTR2A, HTR3D, SLC18A1
B. Based on genes withinPAM84 gene list (82genes)
Hepatic cholestasis 1.6E203 12.3 4/143 IL1A, IL1R2, LBP, SLCO1C1
IL-10 signaling 2.0E203 12.3 3/72 IL1A, IL1R2, LBP
Acute-phase responsesignaling
4.8E203 12.6 4/172 FGG, IL1A, LBP, RBP1
Retioate biosynthesis 1 6.3E203 17.5 2/34 ALDH1A3, RBP1
LPS/IL-1-mediated inhibition ofRXR function
8.7E203 17.5 4/226 ALDH1A3, IL1A, IL1R2, LBP
C. Based on genes corre-lated to given dose(2,072 genes)
NF-kB signaling 4.2E205 2 37/169
Role of macrophages, fibro-blasts and endothelial cells inrheumatoid arthritis
8E205 2 56/311
LPS/IL-1-mediated inhibition ofRXR function
1.6E204 2.6 43/222
PPAR signaling 5.40E204 6 22/100
Differential regulation of cyto-kine production in intestinalepithelial cells by IL-17A andIL17F
7.00E204 7 9/23
D. Based on genes pos.correlated to given dose(1,069 genes)
Role of macrophages, fibro-blasts and endothelial cells inrheumatoid arthritis
6.2E204 14 32/311
NF-kB signaling 7.5E204 14 21/169
PPAR signaling 9.5E204 14 14/100
E. Based on genes neg.correlated to given dose(1,035 genes)
VDR/RXR activation 4.7E204 18 13/78
Role of Oct4 in mammalianembryonic stem cellpluripotency
8.4E204 18 9/44
Aryl hydrocarbon receptorsignaling
2.00E203 25 17/141
Top bio functions p-Value Molecules
F. Based on genes correlated to given dose (2,072 genes)
Cancer 8E211/3E204 1,120
Organismal injury and abnormalities 8E210/2E204 274
Inflammatory response 5E209/3E204 334
Results are shown for the different gene lists. A: PAM140 list, B: PAM84 list, C: pathway analysis based on genes correlated with given dose, D:genes positively correlated with given dose, E: top bio functions displayed with p-values and molecules involved for genes correlated with givendose, F: genes positively correlated with given dose.
Can
cerGenetics
8 Methylation impact on radiation response
Int. J. Cancer: 00, 00–00 (2014) VC 2014 The Authors. Published by Wiley Periodicals, Inc. on behalf of UICC
the cell lines resulted in less prominent changes in methyla-tion level compared to the breast cancer samples collectedafter irradiation. The surrounding tissue is central for proc-esses such as the inflammatory response, found enriched inour dataset.
Within the dose-dependent gene list, a significant changein methylation pattern for pathways associated with cellularimmune response, cell cycle regulation and apoptosis wasfound, representing mechanisms known to be important inradiation response. This is consistent with the results fromZheng et al., who, when studying irradiated mice, found acti-vated pathways mediating repair, apoptosis, coagulation andcell cycle control.23 Interestingly, when looking at negativeand positive dose-correlated probes separately, the positivelycorrelated pathways (demethylated) had a lower FDR, sug-gesting that demethylation of genes is more prominent afterirradiation. We found that irradiation resulted in demethyla-tion of pathways either involved in the immune systemresponse or in cell proliferation and survival. The nuclear fac-tor kappa B (NF-kB) transcription factors can be activated byDNA-damaging agents and can regulate gene expression.Radiation has been shown to activate NF-kB and regulateapoptosis in p53-mutated cell lines. Interestingly, this processwas only activated by higher doses (10 Gy).24 Other studieson irradiated mice and rats have demonstrated that NF-kBsignaling is activated in a dose-dependent manner.25,26 Theperoxisome proliferator-activated receptor a (PPARa) canrepress NF-kB activation, and radiation-induced apoptosiscan be inhibited by knocking out PPARa.27 In our study,many molecules in these two pathways indicated dosedependency. It is interesting to note that cellular immune
response was also present within the top canonical pathways.As 74% of the genes in the PAM84 list also contributed tothe dose-dependent list, these findings strengthen immuneresponse as one of the top findings altered after irradiation.This is also consistent with results for the top bio functions,where cancer, organismal injury abnormalities and inflamma-tory response are ranked highest. On the basis of our results,we propose that methylation changes induced by irradiationinfluence activities essential for treatment response, and thatchanges in methylation levels for some of the molecules takeplace only after higher accumulated doses.
Methylation status may be essential for response to RT
By using the Mann–Whitney U-test, 12 selected genes weretested for the hypothesis that a change in methylation afterIR could also be predictive for responses to RT. Interestingly,in PDCD1, BCAN, PCK1 and GYPE the change in methyla-tion after IR was more prominent in good responders thanin poor responders (p < 0.05). The genes LTC4S and CTSAalso revealed a significantly different methylation level in thetwo response groups, both before and after IR. We suggestthat a change in methylation level in essential genes isrequired to achieve an optimal radiation response. Further-more, the methylation status before RT for the entire panelof five genes was significantly associated with response totherapy (p 5 0.041). From a clinical point of view, predictionof treatment response is essential information when treat-ment regimes are chosen for the patients. One of these genes,H2AFY, encoding for the protein macroH2A1, is known as achromatin regulator involved in X-chromosome inactivation.Xu et al. demonstrated that loss of macroH2A1 resulted in
Figure 3. (a) Difference in the percentage of methylation (before/after IR) positively correlated to the effective administered dose. This is
performed on the top 100 positively correlated probes, and a mean value is calculated based on delta methylation level for these 100
probes. (b) Delta methylation level is based on the mean value for top 100 negatively correlated probes. The red line indicates a trend line
for the values. [Color figure can be viewed in the online issue, which is available at wileyonlinelibrary.com.]
Can
cerGenetics
Halvorsen et al. 9
Int. J. Cancer: 00, 00–00 (2014) VC 2014 The Authors. Published by Wiley Periodicals, Inc. on behalf of UICC
an increased radiosensitivity, suggesting a role in controllingnonhomologous end joining.28 The isoform of this proteinmH2AFY1.2 interacts with HER-2 in cancer cells overex-pressing HER-2, and has been linked to driving HER-2 over-expression.29 Interestingly, downregulation of HER-2 withtrastuzumab has shown enhanced radiation-induced apopto-sis and radiosensitivity.30 The gene BCAN has previouslybeen reported to be hypermethylated in breast cancer tissueversus normal tissue.31 This is consistent with our findings,where the mean methylation level was 40% higher in tumorsamples than in normal controls. After IR, a 20% decrease inmethylation was observed. Cathepsin A, encoded by CTSA,contributes to the normal development of elastic fibers,32 buthas not previously been investigated in the context of radia-tion. Our results indicate significant changes in methylationlevels after IR.
There is a growing body of evidence that the inflamma-tory signaling pathways are strongly involved in the responseto radiation and may be promising targets for enhancingradiosensitivity of tumors.7 The interleukin receptor IL5RArevealed a significant change in methylation level after IRand may also be important in the response to IR. Further-more, PDCD1, encoding the protein PD-1 (programmed celldeath 1) and previously described to be involved in responseto IR,33 in our study was on average 11% less methylatedafter IR. PD-1 is responsible for limiting T-cell activation,34
and by targeting PD-1 and Cd137 in combination with IR,an enhanced radiation response in mice models has beenreported.35 Clinical studies exploiting this synergy areongoing.36 Leukotriene C4 synthase (LTC4S) has a biologicalactivity in inflammation and allergy37 but has not previouslybeen associated with response to IR. Another important geneis RB1, which is known to contribute to cell cycle regulation,double-strand break repair and apoptosis.38,39 RB1 regulatesthe radiation-induced G1 checkpoint through interactionwith E2F1,40 a complex that may induce apoptosis.38 In ourstudy, this gene was less methylated after IR, which is con-sistent with an activation following IR. RB1 was less methyl-ated in good responders compared to poor responders, whichis in line with its crucial role of apoptosis in response toradiation.41
During the last decade, the field of RT has gone through amajor transformation. To further optimize the RT, a deeperunderstanding of the radiation response is indispensable. Byidentifying genes and pathways involved in radiationresponse, new attractive approaches to improve RT canemerge.
AcknowledgementThe authors gratefully acknowledge the contributions fromthe women participating in this study.
References
1. WHO. International Agency for Research onCancer. WHO June 5 2012. Available at:globocan.iarc.fr.
2. International Commission on Radiation Unitsand Measurements. ICRU report 83: prescribing,recording and reporting photon beam intensitymodulated radiation therapy. Karolinska InstituteOxford University Press, 2010.
3. Bourguignon MH, Gisone PA, Perez MR, et al.Genetic and epigenetic features in radiation sensi-tivity. I. Cell signalling in radiation response. EurJ Nucl Med Mol Imaging 2005;32:229–46.
4. Tost J. DNA methylation: an introduction to thebiology and the disease-associated changes of apromising biomarker. Mol Biotechnol 2010;44:71–81.
5. Kuhmann C, Weichenhan D, Rehli M, et al.DNA methylation changes in cells regrowingafter fractioned ionizing radiation. RadiotherOncol 2011;101:116–21.
6. Luzhna L, Kovalchuk O. Modulation of DNAmethylation levels sensitizes doxorubicin-resistantbreast adenocarcinoma cells to radiation-inducedapoptosis. Biochem Biophys Res Commun 2010;392:113–17.
7. Deorukhkar A, Krishnan S. Targeting inflamma-tory pathways for tumor radiosensitization. Bio-chem Pharmacol 2010;80:1904–14.
8. Ma S, Liu X, Jiao B, et al. Low-dose radiation-induced responses: focusing on epigenetic regula-tion. Int J Radiat Biol 2010;86:517–28.
9. Radiation Therapy Oncology Group. RTOG/EORTC Late Radiation Morbidity ScoringSchema. RTOG May 5 2013. Available at: http://www.rtog.org.
10. Helland A, Johnsen H, Froyland C, et al. Radia-tion-induced effects on gene expression: an invivo study on breast cancer. Radiother Oncol2006;80:230–5.
11. Campan M, Weisenberger DJ, Trinh B, et al.MethyLight. Methods Mol Biol 2009;507:325–37.
12. Illumina I. Infinium methylation assay. IlluminaNov 21 2011. Available at: http://www.illumina.com/technology/infinium_methylation_assay.ilmn.
13. Tost J, Gut IG. DNA methylation analysis bypyrosequencing. Nat Protoc 2007;2:2265–75.
14. Tibshirani R, Hastie T, Narasimhan B, et al.Diagnosis of multiple cancer types by shrunkencentroids of gene expression. Proc Natl Acad SciUSA 2002;99:6567–72.
15. Aypar U, Morgan WF, Baulch JE. Radiation-induced epigenetic alterations after low and highLET irradiations. Mutat Res 2010;707:24–33.
16. Chaudhry MA, Omaruddin RA. DifferentialDNA methylation alterations in radiation-sensitive and -resistant cells. DNA Cell Biol 2011;31:908–16.
17. Johnston CJ, Manning C, Hernady E, et al. Effectof total body irradiation on late lung effects: hid-den dangers. Int J Radiat Biol 2011;87:902–13.
18. Zitvogel L, Apetoh L, Ghiringhelli F, et al. Theanticancer immune response: indispensable fortherapeutic success? J Clin Invest 2008;118:1991–2001.
19. Stone HB, Coleman CN, Anscher MS, et al.Effects of radiation on normal tissue: consequen-ces and mechanisms. Lancet Oncol 2003;4:529–36.
20. Gujral JS, Farhood A, Bajt ML, et al. Neutrophilsaggravate acute liver injury during obstructive
cholestasis in bile duct-ligated mice. Hepatology2003;38:355–63.
21. Bataller R, Gabele E, Parsons CJ, et al. Systemicinfusion of angiotensin II exacerbates liver fibro-sis in bile duct-ligated rats. Hepatology 2005;41:1046–55.
22. Anderson RE, Warner NL. Ionizing radiation andthe immune response. Adv Immunol 1976;24:215–335.
23. Zheng J, Garg S, Wang J, et al. Laser capturemicrodissected mucosa versus whole tissue speci-mens for assessment of radiation-induceddynamic molecular and pathway changes in thesmall intestine. PLoS One 2013;8:e53711.
24. Lu TP, Lai LC, Lin BI, et al. Distinct signaling path-ways after higher or lower doses of radiation in threeclosely related human lymphoblast cell lines. Int JRadiat Oncol Biol Phys 2010;76:212–19.
25. Wang Y, Meng A, Lang H, et al. Activation ofnuclear factor kappaB In vivo selectively protectsthe murine small intestine against ionizingradiation-induced damage. Cancer Res 2004;64:6240–6.
26. Raju U, Gumin GJ, Tofilon PJ. Radiation-inducedtranscription factor activation in the rat cerebralcortex. Int J Radiat Biol 2000;76:1045–53.
27. Zhao W, Iskandar S, Kooshki M, et al. Knockingout peroxisome proliferator-activated receptor(PPAR) alpha inhibits radiation-induced apopto-sis in the mouse kidney through activation ofNF-kappaB and increased expression of IAPs.Radiat Res 2007;167:581–91.
28. Xu C, Xu Y, Gursoy-Yuzugullu O, et al. The his-tone variant macroH2A1.1 is recruited to DSBs
Can
cerGenetics
10 Methylation impact on radiation response
Int. J. Cancer: 00, 00–00 (2014) VC 2014 The Authors. Published by Wiley Periodicals, Inc. on behalf of UICC
through a mechanism involving PARP1. FEBSLett 2012;586:3920–5.
29. Li X, Kuang J, Shen Y, et al. The atypical histonemacroH2A1.2 interacts with HER-2 protein incancer cells. J Biol Chem 2012;287:23171–83.
30. Liang K, Lu Y, Jin W, et al. Sensitization of breastcancer cells to radiation by trastuzumab. MolCancer Ther 2003;2:1113–20.
31. Faryna M, Konermann C, Aulmann S, et al.Genome-wide methylation screen in low-gradebreast cancer identifies novel epigeneticallyaltered genes as potential biomarkers for tumordiagnosis. FASEB J 2012;26:4937–50.
32. Seyrantepe V, Hinek A, Peng J, et al. Enzymatic activ-ity of lysosomal carboxypeptidase (cathepsin) A isrequired for proper elastic fiber formation and inacti-vation of endothelin-1.Circulation 2008;117:1973–81.
33. Demaria S, Formenti SC. Role of T lymphocytesin tumor response to radiotherapy. Front Oncol2012;2:95.
34. Pardoll DM. The blockade of immune check-points in cancer immunotherapy. Nat Rev Cancer2012;12:252–64.
35. Verbrugge I, Hagekyriakou J, Sharp LL, et al.Radiotherapy increases the permissiveness ofestablished mammary tumors to rejection byimmunomodulatory antibodies. Cancer Res 2012;72:3163–74.
36. Clinicaltrials. Results database 2012 Nov 20.Available at: http://www.clinicaltrials.gov.
37. Duroudier NP, Tulah AS, Sayers I.Leukotriene pathway genetics andpharmacogenetics in allergy. Allergy2009;64:823–39.
38. Carnevale J, Palander O, Seifried LA, et al. DNAdamage signals through differentially modifiedE2F1 molecules to induce apoptosis. Mol Cell Biol2012;32:900–12.
39. Udayakumar T, Shareef MM, Diaz DA, et al. TheE2F1/Rb and p53/MDM2 pathways in DNA repairand apoptosis: understanding the crosstalk todevelop novel strategies for prostate cancer radio-therapy. Semin Radiat Oncol 2010;20:258–66.
40. Slebos RJ, Lee MH, Plunkett BS, et al. p53-dependent G1 arrest involves pRB-related pro-teins and is disrupted by the human papillomavi-rus 16 E7 oncoprotein. Proc Natl Acad Sci USA1994;91:5320–4.
41. Eriksson D, Stigbrand T. Radiation-induced celldeath mechanisms. Tumour Biol 2010;31:363–72.
Can
cerGenetics
Halvorsen et al. 11
Int. J. Cancer: 00, 00–00 (2014) VC 2014 The Authors. Published by Wiley Periodicals, Inc. on behalf of UICC