Electrically Elicited Force Response Characteristics of ... - MDPI
Upload
independentCategory
view
2download
0
Neuroscience Vol. 49, No. 2, pp. 451466, 1992 Printed in Great Britain
0306-4522/92 $5.00 + 0.00 Pergamon Press Ltd
© 1992 IBRO
DIFFERENTIAL CEREBROVASCULAR A N D METABOLIC RESPONSES IN SPECIFIC
NEURAL SYSTEMS ELICITED FROM THE CENTROMEDIAN-PARAFASCICULAR COMPLEX
S. MRAOVITCH,* t Y. CALANDO,* E. PINARD,* W. J. PEARCE~ and J. SEYLAZ*
*Laboratoire de Recherche Crrrbrovasculaire, C.N.R.S.U.A. 641, Universit6 Paris VII, 10, avenue de Verdun, 75010 Paris, France
:~Division of Perinatal Biology, Loma Linda University School of Medicine, Loma Linda, California, CA 92350, U.S.A.
Abstract--The effect of electrical stimulation of the centromedian-parafascicular complex on local cerebral blood flow and local cerebral glucose utilization was investigated in anesthetized, paralysed and ventilated rats. Local cerebral blood flow and local cerebral glucose utilization were measured in separate groups of animals using the autoradiographic (I4C)iodoantipyrine and (14C)2-deoxyglucose methods, respectively. Because of the well-established centromedian-parafascicular complex neuroanatomical connections, three functional neuronal systems were analysed and compared: the extrapyramidal motor system the limbic system and the reticular formation, also known as the ascending activating system. Cortical regions not included in the limbic system were considered separately. The validity of comparisons between changes in local cerebral blood flow and local cerebral glucose utilization across the brain was verified by assessing the reactivity and stability of the cortical blood flow during long-term centromedian parafascicular complex stimulation.
Centromedian-parafascicular complex stimulation elicited a marked but heterogeneous increase in local cerebral blood flow in 50 of the 52 cerebral structures measured. The most pronounced increases were seen in the lateral habenular nucleus (331 ___ 30% of control), the zona incerta (400 + 55%), the mesencephalic reticular formation (415 __+ 122%) and the parietal cortex (211 +__ 35%).
In contrast, local cerebral glucose utilization remained statistically unchanged (P > 0.05) in 28 of these 50 individual brain regions during centromedian-parafascicular complex stimulation. The most pro- nounced increases in local cerebral glucose utilization were seen in the zona incerta (123 + 28%) and the mesencephalic reticular formation (193 ± 26%). Local cerebral blood flow and local cerebral glucose utilization were linearly related in unstimulated controls, considering either all brain regions taken as a whole or the three systems separately. The significant increase in the slopes of the regression line between local cerebral blood flow and local cerebral glucose utilization for the reticular formation and the limbic system during centromedian-parafascicular complex stimulation indicates, however, that the coupling mechanisms for these systems, but not for the extrapyramidal motor system, were reset. The local cerebral blood flow to local cerebral glucose utilization ratio was heterogeneous in controls and differentially increased during centromedian-parafascicular complex stimulation, being markedly pronounced in the parietal cortex and in the reticular formation.
We conclude that these results, for the first time, provide evidence that, the functionally well-defined neural networks may have different mechanisms whereby changes in vascular and metabolic demands are regulated.
A number of recent studies have suggested that specific neural systems in the brain participate in the regulation of the cerebral blood flow (CBF) by different mechanisms (for recent reviews see Refs 25, 29). An overall cerebral vasodilation secondary to an increase in cerebral glucose utilization can
tTo whom correspondence should be addressed. Abbreviations: AP, systemic arterial pressure; CBF, cerebral
blood flow; CM-Pf, centromedian-parafascicular com- plex; CSD, cortical spreading depression; EEG, electro- encephalogram; EMS, extrapyramidal motor system; IAP, 4-[N-methyl-C 14] iodoantipyrine; LCBF, local cer- ebral blood flow; LCGU, local cerebral glucose utiliz- ation; LS, limbic system; MABP, mean arterial blood pressure; RF, ascending activating system or reticular formation; 2-DG, 2-[14]-deoxy-D-glucoSe.
be elicited by electrical stimulation of the dorsal medullary reticular formation, 6 while stimulation of the medial parabrachial nucleus of the pons elicits widespread cerebral vasoconstriction and a reduction in glucose metabolism. 2° In contrast, electrical stimulation of two neural systems results in altered CBF which is independent of metabolism: cortical CBF is increased by stimulating the cerebellar fastigial nucleus, 27 and decreased by stimulating the lateral parabrachial nucleus, 19 without significant changes in cerebral glucose utilization.
We have recently obtained evidence that electri- cal stimulation of the centromedian-parafascicular complex ( C M - P f ) in rats elicits a marked increase in regional cortical and subcortical C B F ) l The increase in CBF was modulated by the sympathetic nervous
451

452 S, MRAOVITCH el al.
system and circulating adrenal hormones , and was not concomi tan t with e lec t roencephalogram (EEG) activation. We also observed tha t the cerebral vaso- di la t ion elicited by the C M - P f s t imulat ion may be independent of changes in glucose metabol ism. 23
In the present study we sought fur ther evidence to indicate whether the changes in local cerebral b lood flow (LCBF) and local cerebral glucose utiliz- a t ion ( L C G U ) elicited by electrical s t imulat ion of the C M - P f are widespread or specific to neural networks having well-established ana tomica l relat ion with the C M - P f . We compared three systems: the extra- pyramidal m o t o r system (EMS), the l imbic system (LS), and the ascending act ivat ing system or reticular fo rmat ion (RF). The validity of compar ing changes in L C B F and L C G U was evaluated by verifying the stability of the CM-Pf-e l ic i ted cerebrovascular responses using the mass spectrometry me thod 35 dur ing con t inuous long- term C M - P f st imulat ion.
We shall demons t ra te tha t dur ing pro longed elec- trical s t imulat ion of the CM=Pf, elevations in LCBF were mainta ined, tha t the increases in LCBF in individual regions were heterogeneous t h r o u g h o u t the bra in and were largely dissociated f rom glucose metabol ism, and finally tha t the l inear regression analysis and /o r LCBF to L C G U ratio comparison, suggest tha t the mechanisms cont r ibut ing to the vascular and metabol ic changes in individual bra in regions and specific neural systems are different. Some of the da ta f rom this study have been included in prel iminary reports. 24
EXPERIMENTAL PROCEDURES
Animal preparation Wistar rats (IFFA CREDO, Lyon, France) weighing
300-370 g were anesthetized with ~-chloralose (40 mg/kg, s.c.) after induction with halothane (0.5-2% in 25% O: and 75% N2). Thin-wall vinyl catheters were inserted into both right and left femoral arteries and veins for arterial blood sampling, systemic pressure monitoring, intravenous infusion of tracer, and KC1 injection at the end of the experiment.
The trachea of anesthetized rats was cannulated, and animals were placed in a stereotaxic frame (bite bar position: - 5 . 0 ram). Halothane was discontinued and the rats were paralysed with d-tubocurarine (initial dose of 0.5 mg/kg i.v. supplemented with 0.2 mg/kg every hour), and artificially ventilated (Rodent Respirator, Harvard Apparatus Co.) with 25% 02 and 75% N 2. One of the arterial catheters was connected to a Statham P 23 Db transducer for continuous monitoring of systemic arterial pressure (AP) and heart-rate using a polygraph recorder (Gould). Body temperature was maintained at 37 _+ 0.5°C throughout the experiment. The parietal bone of the animal was perforated unilaterally with a dental drill at a point 4.0 mm posterior to the bregma and 1 mm lateral to the midline. The drill-hole was then enlarged laterally to approximately 2.5ram from the midline and 5.5 mm posterior to the bregrna. Small samples (0.2 ml) of arterial blood were periodically taken for measurement of 02 and CO 2 partial pressures (POz and pCO2) and pH (ABL 2, blood gas analyser Radiometer),
Measurement of local cerebral blood flow LCBF was measured using 14C-iodoantipyrine (IAP) as
diffusible inert indicator. 31 Tissue concentrations of IAP
were assessed by autoradiography) t The effect of long- term CM-Pf stimulation on LCBF in the parietal cortex (chosen for its high cerebrovascular reactivity to CM-Pf stimulation) was assessed using the method of mass spec- trometry. 35
Determination of the arterial concentration-time curve of 4-[N-methyl-CJ4]iodoantipyrine. IAP in ethanol (Amersham International; specific activity: 40-60 mCi/mmol) was dried under a stream of N 2 and dissolved in 1.2 ml normal saline. The IAP was infused (10 pCi/100 g of body weight) at a constant rate over approximately 30-35 s with an infusion pump. During the infusion, about 50 #1 of blood was sampled every 3-4 s through a femoral arterial catheter to determine the arterial concentration-time curve of IAP. The blood samples (40 #1) were placed in scintillation vials containing 0.6 ml tissue solubilizer (Solulyte, Baker), incu- bated for 20rain and decolorized with 30% hydrogen peroxide. Ten milliliters of Dynagel was added and the sample radioactivity was determined in a liquid scintillation spectrometer.
Measurement of local brain concentration of 4-[N-methyl- Ct4]iodoantipyrine. Rats were killed approximately 30-35 s after the start of lAP infusion by an i.v, bolus injection of saturated KC1. The brain was rapidly removed from the skull, frozen in isopentane ( -45°C to -50°C), coated with an embedding medium (Lipshaw), and sectioned (20-/~m thick) in a cryostat (Bright). Four consecutive sections of the brain were removed from the knife every 140 #m using cover- slips. The sections were dried immediately on a.hot plate, and placed sequentially in an X-ray cassette, together with a set of autoradiographic 14C-microscale standards (Amersham). Sections together with calibrated standards were exposed to X-ray film (Kodak SB-5) for six days. The films were developed according to the manufacturer's instructions. Alternate sections were stained with Cresyl Violet.
Autoradiograms were analysed using a computerized image analysis system (Histopericolor, MS2I Matra Sep, France). The mean optical density of each brain region was determined bilaterally over four consecutive auto- radiograms. The calibrated standards (nCi/g) were used to quantify the concentration of the tracer within specific brain regions.
Calculation of local cerebral blood flow. LCBF (ml/100 g per min) was calculated from the concentration-time curve of IAP and the local brain concentration of the tracer using a computerized approximation of the equation developed by Kety. N The blood-brain partition coefficient for IAP was set at 0.8. 31
Measurement of local blood flow within the parietal cortex by mass spectrometry. In the seven experiments in which LCBF was measured by mass spectrometry, 35 the animal preparation was as previously described. 2a Briefly, the surgical procedures were performed in two phases. Animals were first anesthetized with sodium pentobarbital (35 mg/kg i.p.) and a gas sampling cannula (o.d. = 0.7 mm) for measuring blood flow was stereotaxically and chroni- cally implanted in the parietal cortex of the right hemi- sphere (A, 8.0 + 0.5 mm) rostrally from the interaural line, laterally (L, -5 .5 ram) from the midline, and horizontally (H, - 5 . 0 m m ) from the surface of the cortex. The gas sampling cannula was fixed to the skull with dental cement and protected by a fiberglass cover.
Fifteen days later, after any possible inflammation or edema had resorbed, the animals were reanesthetized with ct-chloralose (40mg/kg s.c.) after induction with halothane (0.5-2% in 25% 02-75% N2). The general pro- cedures for surgical preparation and electrical stimulation are summarized above. The LCBF was determined repeat- edly by helium clearance according to the Fick principle: CBF = lambda in 2/T½, where lambda is the tissue-blood partition coefficient for helium. CM-Pf stimulation was initiated after the blood gases reached a steady state. Stimulus intensity was adjusted during the initial first
CM-Pf stimulation and LCBF/LCGU regulation in specific neural systems
minute of C M - P f stimulation, so that arterial pressure remained stable. The LCBF was measured during the period of stable arterial pressure.
Determination of local cerebral glucose utilization
LCGU was measured using the 2-deoxyglucose (2-DG) method and quantitative autoradiography. 36
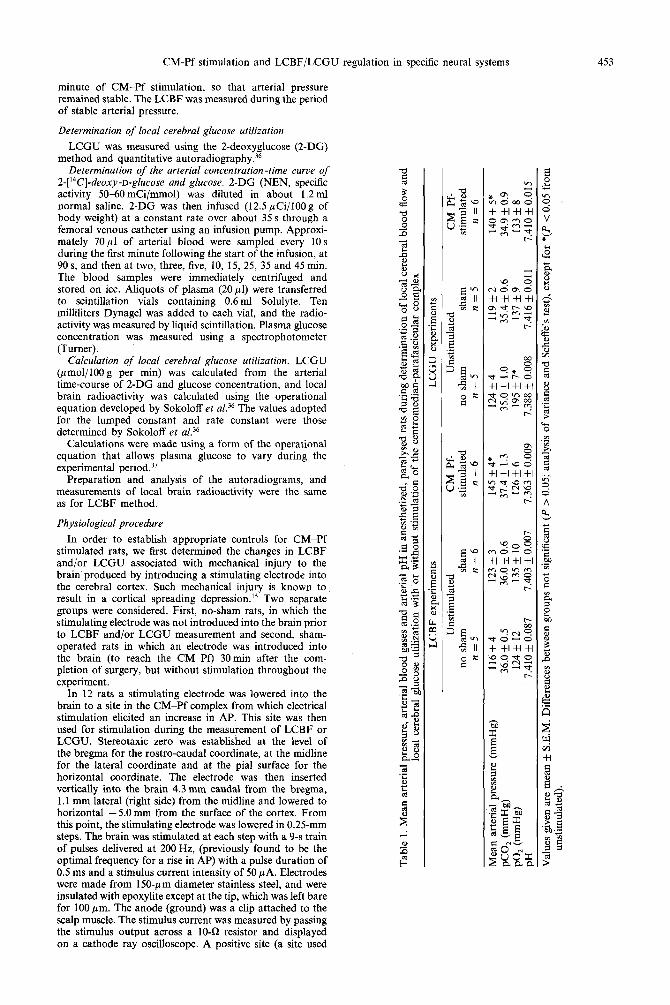
Determination of the arterial concentration-time curve of 2-[14C]-deoxy-D-glucoseand glucose. 2-DG (NEN, specific activity 50-60mCi/mmol) was diluted in about 1.2ml normal saline. 2-DG was then infused (12.5/~Ci/100g of body weight) at a constant rate over about 35 s through a femoral venous catheter using an infusion pump. Approxi- mately 70/~1 of arterial blood were sampled every 10s during the first minute following the start of the infusion, at 90 s, and then at two, three, five, 10, 15, 25, 35 and 45 min. The blood samples were immediately centrifuged and stored on ice. Aliquots of plasma (20 #1) were transferred to scintillation vials containing 0.6ml Solulyte. Ten milliliters Dynagel was added to each vial, and the radio- activity was measured by liquid scintillation. Plasma glucose concentration was measured using a spectrophotometer (Turner).
Calculation of local cerebral glucose utilization. LCGU ~mol /100g per min) was calculated from the arterial time-course of 2-DG and glucose concentration, and local brain radioactivity was calculated using the operational equation developed by Sokoloff et al. 36 The values adopted for the lumped constant and rate constant were those determined by Sokoloff et al. 36
Calculations were made using a form of the operational equation that allows plasma glucose to vary during the experimental period. 37
Preparation and analysis of the autoradiograms, and measurements of local brain radioactivity were the same as for LCBF method.
Physiological procedure
In order to establish appropriate controls for C M - P f stimulated rats, we first determined the changes in LCBF and/or LCGU associated with mechanical injury to the brain produced by introducing a stimulating electrode into the cerebral cortex. Such mechanical injury is known t o result in a cortical spreading depression. ]5 Two separate groups were considered. First, no-sham rats, in which the stimulating electrode was not introduced into the brain prior to LCBF and/or LCGU measurement and second, sham- operated rats in which an electrode was introduced into the brain (to reach the CM-Pf) 30 min after the com- pletion of surgery, but without stimulation throughout the experiment.
In 12 rats a stimulating electrode was lowered into the brain to a site in the C M - P f complex from which electrical stimulation elicited an increase in AP. This site was then used for stimulation during the measurement of LCBF or LCGU. Stereotaxic zero was established at the level of the bregma for the rostro-caudal coordinate, at the midline for the lateral coordinate and at the pial surface for the horizontal coordinate. The electrode was then inserted vertically into the brain 4.3 mm caudal from the bregma, 1,1 mm lateral (right side) from the midline and lowered to horizontal - 5 . 0 mm from the surface of the cortex. From this point, the stimulating electrode was lowered in 0.25-ram steps~ The brain was stimulated at each step with a 9-s train of pulses delivered at 200 Hz, (previously found to be the optimal frequency for a rise in AP) with a pulse duration of 0.5 ms and a stimulus current intensity of 50 #A. Electrodes were made from 150-#m diameter stainless steel, and were insulated with epoxylite except at the tip, which was left bare for 100 #m. The anode (ground) was a clip attached to the scalp muscle. The stimulus current was measured by passing the stimulus output across a 10-f~ resistor and displayed on a Cathode ray oscilloscope. A positive site (a site used
0
0
Lo "~ 0
~'~
i- ~2
e~
[....
I
r,.) . ~ ~
+1 +1 +1 +1
+ 1 + 1 + 1 + 1
+1 +1 +1 +P
+1 +1 +1 +1
t ~
+1 +1 +1 +li t",l " ¢ ¢ ~
+ 1 + 1 + 1 + 1
=
O
v
A
'2 ca)
2 ~0 e~
o
cA +1 e~
453
454 S. MRAOVITCH et al.
for stimulation during LCBF or LCGU measurement) was defined as a site along an electrode track from which a just-detectable increase in mean arterial blood . . . . ~ure (MABP; < 10mmHg) was elicited with the lowest (threshold) stimulus current. Care was taken during CM Pf exploration for positive sites and during LCBF or LCGU measurement that the MABP during the electrical stimu- lation never exceeded 150 mmHg, a value considered to be w~ll within the autoregulatory range of AP for the rat. 4 The electrode was left in place at the positive site until the end of the experiment.
Blood gases were carefully adjusted. The arterial pCO 2 was maintained within the normocapnic range (34-38 mmHg) by adjusting the respirator stroke volume.
Ninety minutes after introduction of the stimulating electrode, the blood gases had reached a steady state, C M - P f stimulation for LCBF measurement was initiated. This time, however, the C M - P f was stimulated with an intermittent stimulus train (1 s on/1 s off, 200 Hz). The intensity of the stimulus was gradually increased to reach three-times threshold current (threshold current = 20-30#A). After an initial period of stimulus intensity adjustment (2-3 min), C M - P f stimulation was continued ( l ~ 1 5 m i n for LCBF measurement and approximately 50-55rain for LCGU measurement), during which the MABP remained stable.
The general procedures used in the experiments in which LCBF was measured continuously by mass spec- trometry during electrical stimulation of the brain have been described. 2z
Histological location of electrode sites The stimulation site was marked by passing 50/~A d.c. for
40 s through the stimulating electrode at the end of each experiment. The location of the stimulated site was then precisely reconstructed from Cresyl Violet-stained serial sections using a Baush and Lumb vertical projector.
Statistical analysis Two groups were compared and statistically evaluated
with the Mann Whitney U-test; side-to-side comparisons
were analysed by paired t-test and multiple comparisons were evaluated by analysis of variance and Scheffe's test. To evaluate the correlation between LCBF and LCGU, a simple linear regression analysis was performed. The signifi- cance of the difference between the slopes was analysed using a t-test. The significance of the difference between the ratios was evaluated using analysis of variance and Scheffe's test.
RESULTS
Cons ide r ing the ana tomica l c o n n e c t i o n s be t ween the C M - P f a n d b ra in areas impl ica ted in m o t o r cont ro l , behav io ra l and e m o t i o n a l express ion a n d arousal , the values for L C B F and L C G U in 48 s t ruc tures were g r o u p e d in to th ree func t iona l sys- tems: E M S (nine s t ructures) , LS (22 s t ructures) a n d R F (17 s t ructures) . The cor t ica l regions ( f ronta l , par ie tal , occipi tal) and co rpus ca l losum were ana lysed separa te ly . The da t a are s u m m a r i z e d in Tables 3, 4, 5 a n d 6.
Physiological variables during the experiments
The phys io logica l var iables are s u m m a r i z e d in Table 1. A l t h o u g h M A B P was e levated dur ing m e a s u r e m e n t o f L C B F and L C G U in the C M - P f - s t imula ted rats , it r ema i ned well wi th in the au to - regu la tory range. 4 T h e values o f ar ter ia l pCO2, POE and p H for the uns t imu la t ed con t ro l s and s t imu- la ted an imal s were n o t significantly different. The p l a sma glucose c o n c e n t r a t i o n o f uns t imu la t ed ra ts var ied f r o m 180-218 rag/100 ml. Electr ical s t imu- la t ion o f the C M - P f elicited a s ignif icant (P < 0.05) increase in the p l a s m a glucose concen t r a t i on (up to 276 ± 23 m g / 1 0 0 m l dur ing first 5min) , wh ich
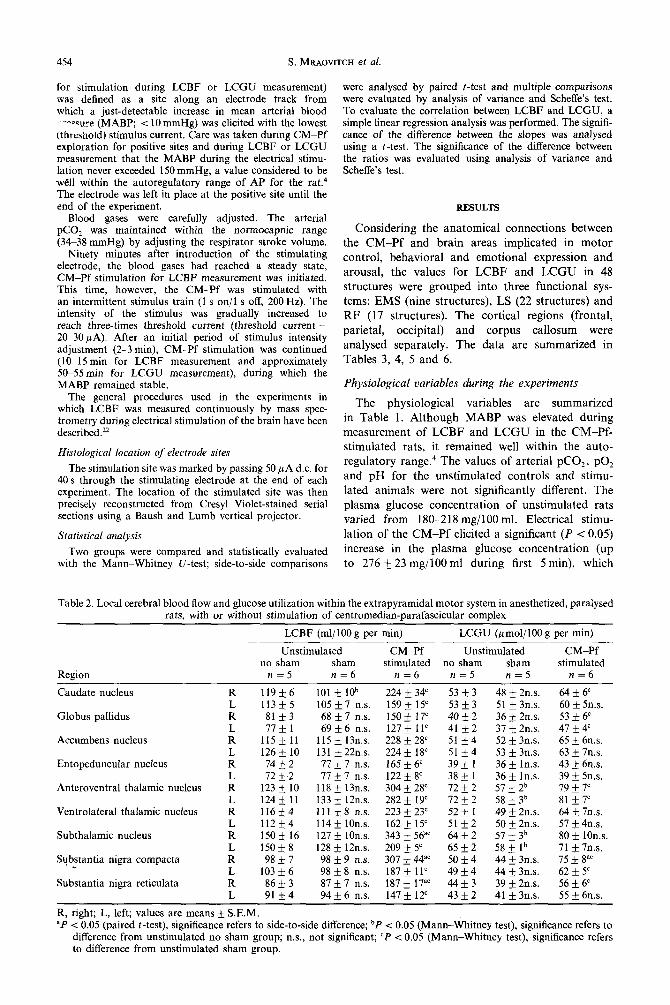
Table 2. Local cerebral blood flow and glucose utilization within the extrapyramidal motor system in anesthetized, paralysed rats, with or without stimulation of centromedian-parafascicular complex
Region
LCBF (ml/100 g per min) LCGU (/~mol/100 g per min)
Unstimulated C M - P f Unstimulated C M - P f no sham sham stimulated no sham sham stimulated
n = 5 n = 6 n = 6 n = 5 n = 5 n = 6
Caudate nucleus R 119 + 6 101 -I- l 0 b 224 __+ 34 ¢ 53 + 3 48 _ 2n.s. 64 _ 6 c L 113_+5 105+7 n.s. 159+15 c 5 3 + 3 51 _+ 3n.s. 60 -+ 5n.s.
Globus pallidus R 81 -+ 3 68 ___ 7 n.s. 150 +__ 17 c 40 __+ 2 36 -+ 2n.s. 53 __+ 6 ¢ L 77_+1 69_+6 n.s. 127±11 ¢ 41_+2 37 _ 2n.s. 4 7 + 4 c
Accumbens nucleus R 115 + 11 115 _+ 13n.s. 228 _+ 28 ¢ 51 _+ 4 52 +__ 3n.s. 65 __+ 6n.s. L 126_+ 10 131 _+ 22n.s. 224+ 18 c 51 ___4 53 _+ 3n.s. 63 + 7n.s.
Entopeduncular nucleus R 74 -+ 2 77 __+ 7 n.s. 165 _ 6 c 39 __+ 1 36 _+ ln.s. 43 __+ 6n.s. L 72 -+2 77 + 7 n.s. 122 _+ 8 c 38 _+ 1 36 _+ ln.s. 39 + 5n.s.
Anteroventral thalamic nucleus R 123 -+ 10 118 + 13n.s. 304 -+ 28 ¢ 72 _+ 2 57 + 2 b 79 _+ 7 ° L 124__.11 133 + 12n.s. 282_+_19 c 72-+2 58__+3 b 8 1 + 7 ¢
Ventrolateral thalamic nucleus R 116 +_. 4 111 + 8 n.s. 223 __+ 23 ¢ 52 + 1 49 __+ 2n.s. 64 + 7n.s. L 112-+4 114_+ 10n.s. 162-+15 ¢ 51___2 5 0 _ 2n.s. 57 -+ 4n.s.
Subthalamic nucleus R 150 + 16 127 _ 10n.s. 343 __+ 56 "c 64 _+ 2 57 _ 3 b 80 _ 10n.s. L 150 _+ 8 128 + 12n.s. 209 + 5 ¢ 65 _ 2 58 -+ 1 b 71 _+ 7n.s.
Substantia nigra compacta R 98 + 7 98 + 9 n.s. 307 + 44 a¢ 50 + 4 44 + 3n.s. 75 + 8 "c L 103_+6 98_+8 n.s. 187_+ l P 49_+4 44 -+ 3n.s. 62_+5 c
Substantia nigra reticulata R 86 _+ 3 87 + 7 n.s. 187 -+_ 17 ac 44 _ 3 39 + 2n.s. 56 -+ 6 ¢ L 91 -+ 4 94 _+ 6 n.s. 147 +__ 12 ¢ 43 +_ 2 41 _+ 3n.s. 55 _+ 6n.s.
R, right; L, left; values are means + S.E.M. ap < 0.05 (paired t-test), significance refers to side-to-side difference; bp < 0.05 (Mann-Whitney test), significance refers to
difference from unstimulated no sham group; n.s., not significant; cP < 0.05 (Mann-Whitney test), significance refers to difference from unstimulated sham group.

CM-Pf stimulation and LCBF/LCGU regulation in specific neural systems 455
Table 3. Local cerebral blood flow and glucose utilization within the limbic system in anesthetized, paralysed rats, with or without stimulation of centromedian-parafascicular complex
LCBF (ml/100 g per min) LCGU (,umol/100 g per min)
Unstimulated C M P f - Unstimulated CM-Pf- no sham sham stimulated no sham sham stimulated
Region n = 5 n = 6 n = 6 n = 5 n = 5 n = 6
Cingular cortex R 123 ___ 11 113 ___ 14an.s. 335 + 64 ~ 59 __+ 4 58 + 3n.s. 70 __+ 4n.s. (area 24) L 124+ 11 122+ 14n.s. 244 + 21 c 5 9 + 4 6 0 _ 3n.s. 69 +4n.s.
Cingular cortex R 123 ___ 9 121 + 13an.s. 355 __+ 49 ~ 69 + 3 56 ___ 3n.s. 70 _+ 7~n.s. (area 29) L 119 + 8 125 + 14n.s. 247 + 25 c 70 _ 3 58 + 3 b 67 __+ 6n.s.
Cingular cortex R 108 _+ 6 87 _ 8an.s. 201 + 33 c 57 ___ 4 60 + 3n.s. 71 ___ 5n.s. (area 32) L 111 + 6 9 8 + 10n.s. 184_+20 ¢ 5 7 + 4 58__+ 3n.s. 70_+ 5n.s.
Entorhinal cortex R 125 ___ 16 61 + 20 ab 103 __+ 11 ac 47 __+ 3 42 + 3n.s. 52 ___ 6n.s. (area 28) L 107+ 11 9 3 + 10n.s. 142+ 15 ~ 45_+3 4 6 _ 3n.s. 54 + 6n.s.
Piriform cortex R 132+ 12 77+ 11 ab 114+ 11 ~ 62+ 1 53 4 n . s . 52__+6n.s. (area 51) L 120 + 9 96 ___ 9n.s. 141 -+ 8 ~ 61 ___ 1 57 -+ 3n.s. 59 _+ 8n.s.
Hippocampus anterior dorsal Field CA1 R 90 __+ 10 50 __+ 6 ~b 71 ___ 8 ~ 46 -+ 2 49 +__ 2n.s. 43 -+ 5n.s.
L 86 _ 7 68 + 7n.s. 87 ___ 4n.s. 45 ___ 1 47 -+ 2 42 __+ 4n.s. Field CA3 R 103 + 10 66 _ 7 ab 86 _+ 9~n.s. 54 + 2 61 + 2an.s. 57 _+ 5~n.s.
L 99_+6 9 6 + 1 ln.s. 108 __+ 5n.s. 52_+2 52 + 2n.s. 50 + 5n.s. Field CA4 R 91 _+ 5 63 _+ 6 ab 84 + 8an.s. 52 __+ 2 68 + 4 "b 60 ___ 5"n.s.
L 9 2 + 7 87 + 9n.s. 111 -+ 6n.s. 51__+2 55 + 3n.s. 55 __+ 5n.s. Posterior ventral
Field CA1 R 143 + 18 73 + 7 "b 158 __+ 24 ¢ 46 + 3 50 __+ 3n.s. 61 + 6n.s. L 126___12 115 + 16n.s. 178 + 22 c 4 5 + 2 49 + 3n.s. 58 _ 7n.s.
Field CA3: R 143 ___ 16 80 __+ 8 ab 112 + !2an.s. 52 + 3 57 + 4an.s. 69 ___ 5n.s. L 125+8 111 ± lln.s. 146 ___ 10 c 5 1 + 4 50 + 2n.s. 62 __+ 6n.s.
Dentate gyrus R 126 __+ 16 79 + 6 b 149 + 12 c 41 ___ 2 39 + 2n.s. 52 ___ 5 c L 116 __+ 12 96 + 10n.s. 138 + 14 c 40 ___ 2 38 + ln.s. 54 -+ 5 ~
Subiculum R 152 + 25 103 __+ 10an.s. 205 __+ 27 c 53 + 4 51 __+ 2n.s. 65 + 6n.s. L 150 ___ 25 132 + 17n.s. 205 _+ 29 c 51 ___ 3 50 _+ 2n.s. 63 +__ 6n.s.
Lateral septal nucleus R 99 ___ 5 87 ___ 9~n.s. 165 _+ 5 c 40 + 2 41 + ln.s. 45 + 3n.s. L 95 ___ 4 92 + 10n.s. 136 ___ 6 ~ 40 + 2 40 + ln.s. 45 ___ 3n.s.
Medial septal nucleus 122 __+ 10 113 + 14n.s. 226 + 18 c 47 __+ 3 47 + ln.s. 55 +__ 2 ° Accumbens nucleus R 115 -+ 11 115 + 13n.s. 228 + 28 ~ 51 + 4 52 + 3n.s. 65 + 6n.s.
L 126 _+ 10 131 ___ 22n.s. 224 ___ 18 c 51 + 4 53 ___ 3n.s. 63 + 7n.s. Lateral habenular nucleus R 166 __+ 9 148 + 15n.s. 639 ___ 44 a~ 75 + 4 68 ___ 3n.s. 115 ___ 7 ~
L 168+11 164 + 22n.s. 165+15 c 7 7 + 4 70 + 3n.s. 84__5 c Medial habenular nucleus R 139 + 6 136 + 39n.s. 306 ___ 39 ¢ 59 + 1 55 ___ 1 b 67 + 5n.s.
L 133__+6 128 + lln.s. 276 ___ 21 ~ 59___1 5 4 + 1 b 61 _ 5n.s. Interpeduncular nucleus 241 __+ 10 196 + 17n.s. 415 + 61 ~ 100 +__ 2 90 + 5n.s. 116 +__ 8 c Mammillary complex 144 __+ 14 186 ___ 29n.s. 300 + 29 ~ 55 __+ 3 56 + 4n.s. 82 + 6 ~ Lateral hypothalamus R 97 + 4 92 + 10n.s. 240 __+ 31 a~ 42 + 1 38 + 1 b 51 + 5"n.s.
L 9 3 + 3 98 + lln.s. 165+15 ~ 4 2 + 1 3 7 + 1 b 45 +__ 5n.s. Anteroventral thalamic R 123 + 10 118 ___ 13n.s. 304 +__ 28 ~ 72 + 2 57 __+ 2 b 79 d- 7 ac
nucleus L 124 ___ 11 133 + 12n.s. 282 +__ 19 c 72 + 2 58 __+ 3 b 81 __+ 7 ~ Central amygdaloid nucleus R 116 ___ 11 73 + 5 ab 168 + 21 c 42 ___ 1 40 _+ 3n.s. 50 __+ 5an.s.
L 112+ 11 8 7 _ 9n.s. 149_+9 c 4 2 + 1 40 + 2n.s. 45 __+ 4n.s.
For designations see Table 2.
thereaf ter s lowly declined to 254 + 9 mg/100 ml,
r emain ing stable t h r o u g h o u t the s t imula t ing per iod.
These values were well wi th in the limits o f the
ope ra t iona l equa t ion for calculat ing L C G U . 36
Local cerebral blood flow and glucose utilization in unstimulated rats
In n o - s h a m rats (n = 5), L C B F (see Tables 2, 3, 4
and 5) r anged f r o m 54 ___ 5 ml/100 g per min in the
co rpus ca l losum (Table 5) to 241 + 10 ml/100 g per
min in the in t e rpeduncu la r nucleus (Table 3).
In s h a m - o p e r a t e d rats (n = 6), LCBF, m e a s u r e d
90 min after pos i t ion ing the electrode, was reduced
in several b ra in areas, par t icu lar ly in the l imbic
system. There were significant bilateral decreases
in L C B F (P < 0 . 0 5 ) in the en torh ina l and piri-
f o r m cortices, h i p p o c a m p a l complex and amygda lo id
nucleus. There were also significant differences
(P < 0.05, pa i red t- test) be tween r ight a n d left sides
in the cingular , the en to rh ina l and the p i r i fo rm
cortices, the h i p p o c a m p a l complex, the lateral septal
nucleus a n d the central amygda lo id nucleus (Table 3).
L C B F did no t differ be tween sides (P > 0.05, pa i red
t- test) wi th in the R F and the E M S (except in the
cauda te nucleus, Table 2).
The L C G U me asu r ed in a n o - s h a m g r o u p o f
ra ts (n = 5) r anged f r o m 25 + 1 p m o l / 1 0 0 g per min
in the c o r p u s ca l losum to 100 + 2 / ~ m o l / 1 0 0 g per
m i n in the in t e rpeduncu la r nucleus. L C G U ranged
f r o m 2 7 _ 2 # m o l / 1 0 0 g per min in the co r pus

456 S. MRAOVITCH et al.
Table 4. Local cerebral blood flow and glucose utilization within the reticular formation in anesthetized, paralysed rats, with or without stimulation of centromedian-parafascicular complex
Region
LCBF (ml/100 g per min) LCGU ~mol/100 g per min)
Unstimulated CM-Pf- Unstimulated CM-Pf- no sham sham stimulated no sham sham stimulated
n = 5 n-=6 n = 6 n = 5 n = 5 n = 6
Zona incerta
Reticular thalamic nucleus
Ventral tegmental area
Anterior pretectal area
Mesencephalic reticular formation
Reticular tegmental nucleus
Ventral tegmental nucleus
Dorsal tegrnental nucleus
Median raphe Dorsal raphe Raphe pontis Raphe magnus Pontine reticular nucleus oral
Pontine reticular nucleus caudal
Dorsal gigantocellular reticular nucleus
Ventral gigantocellular reticular nucleus
Nucleus reticular ventral
R 140+10 130 + 8n.s. 650+72 ac 5 3 + 3 51 _ ln.s. 114_14 a¢ L 140__+11 128 _+ 10n.s. 201+16 ¢ 5 2 + 3 50 + ln.s. 64 + 6n.s. R 103+5 97 __+ 5n.s. 165+9 c 5 1 + 2 47 -+_ 2n.s. 48 -+_ ln.s. L I00 + 4 105 ___ 5n.s. 147 + 9 ¢ 50 + 2 46 ___ 2n.s. 41 + ln.s. R 113+6 130 _ 7n.s. 3594-56 ac 4 3 + 3 4 4 _ 2n.s. 59__+5 ¢ L 115___9 134 + 9n.s. 226+25 ¢ 4 3 + 2 43 + 2n.s. 5 5 + 4 ¢ R 156-t-14 132± lln.s. 4454-123 c 5 4 + 2 48 _+_ ln.s. 106+6 "~ L 155_+15 131 _+ lln.s. 2244-21 ~ 54_+2 48 _+ 2n.s. 6 4 + 4 c R 117_+10 110 + 10n.s. 564+134 ac 51_+3 44 + 2n.s. 130+11 ac L 118_+13 113 + 10n.s. 202 + 34 c 5 1 + 3 43 -+ 2n.s. 6 1 + 4 c R 141_+13 132 -+ 9n.s. 416___ 114 ac 52_+2 50 _ 3n.s. 7 3 + 3 ac L 137_+12 133 + 8n.s. 287+51 c 52_+I 52-+ 2n.s. 59 -+ 6n.s. R 144+9 130 -+ lln.s. 477+__57 ~ 5 9 + 2 53 + 2n.s. 80_+7 ac L 142 4- 8 127 _ 9n.s. 302 4- 25 c 59 4- 2 53 + 2n.s. 68 + 4 ~ R 164 4- 17 138 + 15n.s. 329 _ 42 ac 64 ___ 2 61 + 3n.s. 72 -+ 4an.s. L 161+17 137 + 14n.s. 274+31 ¢ 6 6 + 1 60 + 2n.s. 67 -+ 4n.s.
151 -+ 13 137 _ 14n.s. 437 4- 78 c 63 -+ 1 59 ___ 3n.s. 74 4- 8n.s. 111+6 123 -+ 10n.s. 370+67 c 6 1 + 1 5 4 + 2 b 6 5 _ 5n.s. 93 + 1 107 4- 9n.s. 269 4- 52 c 43 + 1 42 -+ 2n.s. 61 -+ 6 ~ 98 4- 2 100 + 7n.s. 254 + 37 ~ 41 + 1 42 -+ 2n.s. 54 + 5n.s.
R 110+6 112+9 n.s. 562+111 a¢ 51-+2 424-1 b 9 8 + 9 ac L 108_+6 112 -+ 10n.s. 240+32 c 49_+2 4 3 _ 1 b 6 1 + 4 c R 93 -+ 3 124 -+ 6n.s. 319 + 64 ~¢ 43 _+ 1 42 + 2n.s. 68 _+ 6 ~c L 94 _+ 3 120 ___ 7n.s. 210 + 30 ~ 43 4- 1 42 + 2n.s. 60 + 6 ¢ R 104 _ 3 106 + 6n.s. .210 + 29 ¢ 46 ___ 2 41 + 2n.s. 56 + 6an.s. L 102_+3 105 -+ 6n.s. 183_ 22 c 46_+1 4 0 + 2 b 54-+ 5n.s. R 117 _+ 4 118 -+ 8n.s. 308 _+ 62 ¢ 46 -+ 1 42 _ ln.s. 66 _+ 7 ac L 116 -+ 4 121 -+ 10n.s. 214 _+ 33 ¢ 46 -+ 1 42 _+ 1 b 54 _+ 6n.s. R 111_+5 115_+ 5n.s. 2304-42 c 48_+I 434-1 b 564-5 c L 110-t-5 114-+ 6n.s. 202 + 28 c 48_+1 4 2 + 1 b 5 3 ± 4 ~
Designations as in Table 2.
ca l losum to 90 _ 5 /~mol /100 g per min in the inter-
p e d u n c u l a r nucleus in s h a m - o p e r a t e d rats (n = 5).
There were significant (P < 0.05) decreases in L C G U
in the an te roven t ra l tha!amic nucleus and the sub tha -
lamic nucleus (Table 2), the c ingular cortex, the
medial h a b e n u l a r nucleus and the lateral hypo tha la -
m u s (Table 3), the dorsa l r aphe and the pon t ine
ret icular nuclei (Table 4) o f these rats. L C G U was
significantly increased in the CA3 and CA4 fields o f
the h i p p o c a m p u s .
All b ra in regions d e m o n s t r a t i n g significant changes
in L C B F a n d / o r L C G U due to spreading depress ion
were excluded f rom fur ther analysis,
Effect of long term centromedian-parafascieular complex stimulation on local cerebral blood flow
Table 6 shows that , after an initial rise (up to
86_+ 15%, me asu r ed 5 m i n fol lowing the onse t o f
s t imulat ion) , L C B F remained stable and significantly
elevated (P < 0 . 0 5 ) dur ing 5 0 m i n o f c o n t i n u o u s
Table 5. Local cerebral blood flow and glucose utilization within the cortex and the corpus callosurn in anesthetized, paralysed rats, with or without stimulation of centromedian-parafascicular complex
Region
LCBF (ml/100 g per min) LCGU (#mol/100 g per min)
Unstimulated CM-Pf- Unstimulated CM-Pf- no sham sham stimulated no sham sham stimulated
n = 5 n = 6 n = 6 n = 5 n = 5 n = 6
Frontal cortex (area 10) R 119 + I1 L 117_+11
Parietal cortex (area 2; 40) R 135 ___ 14 L 130 4- 16
Occipital cortex (area 17; 18) R 112 + 6 L 102 ___ 2
Corpus callosum R 54 + 5 L 5 4 + 4
115 _+ 17n.s. 280 + 24 b 5 3 + 3 50 _+ 2n.s. 604-3 b 115 _ 17n.s. 187_ 31 b 53-t-3 5 4 _ 3n,s. 57 + 4n.s. 136 + 20n.s. 425 + 48 ab 56 -+_ 4 54 _+ 2n.s. 61 + 4n.s. 130 _+ 15n.s. 216 -+_ 24 b 56 +_ 3 58 _+ 3n.s. 59 _+ 3n.s. 86 4- 12n.s. 168 _ 24 b 57 -t- 4 53 ± 3n.s. 58 4- 5n.s. 92_+ 8n.s. 135+9 b 5 7 + 4 56 _+ 4n.s. 60 ± 6n.s. 43 4- 7n.s. 85 4- 6 b 25 4- 1 27 _+ 2n.s. 29 ___ 2n.s. 43 _ 7n.s. 74 ± 4 b 25 _+ 1 28 4- ln.s. 28 _ 2n.s.
Designations as in Table 2.

CM-Pf stimulation and LCBF/LCGU regulation in specific neural systems 457
N
0
e~
O
, 7-
+1
rx l
+1
c-I
+1
t*
+1
e¢5
+1
¢xl
+1 c-I
+l!
¢ q
+1 70
t '-I
+1
+1
+1 =
-~ +,.~
;>~.
~ r - ' v
stimulation. LCBF returned to its pre-stimulus level when stimulation was stopped.
Effect of centromedian-parafascicular complex stimu- lation on local cerebral blood flow and glucose utilization
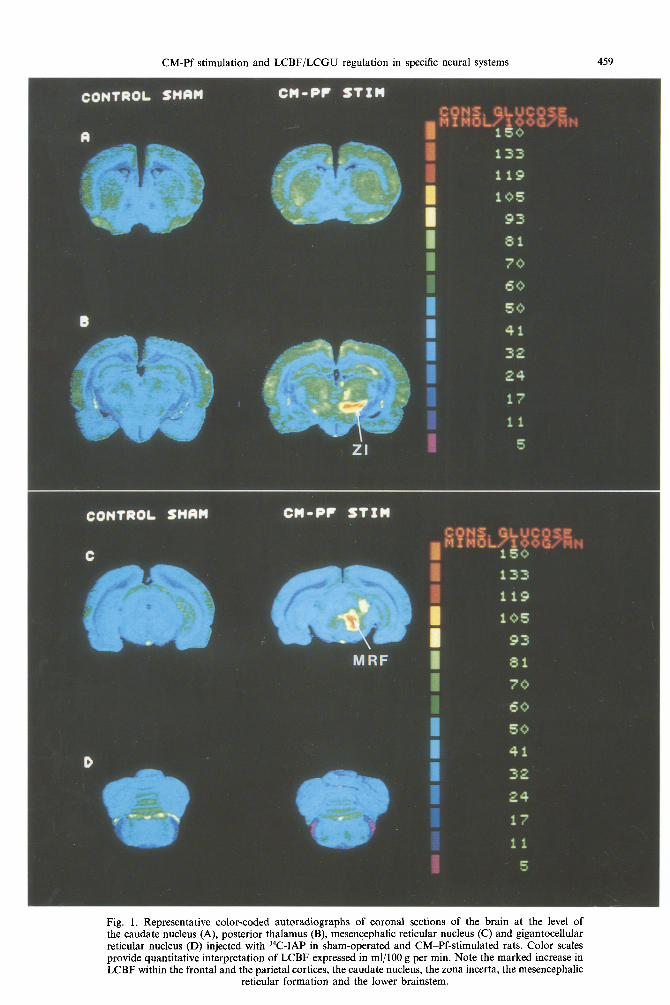
Electrical stimulation of the CM-Pf resulted in an overall but differentiated increase in LCBF and LCGU (Figs 1, 2, 3).
LCBF in the extrapyramidal motor system (n = 6) increased significantly (P < 0.05) and bilaterally in all structures, including the substantia nigra pars compacta (212___44%), the substantia nigra pars reticulata (115_20%), and the globus pallidus (118 +24%), as shown in Fig. 3. LCBF increased in the LS, particularly in the lateral habenular nucleus (331 + 30%) and the cingular cortex area 24 (194+56%). The most pronounced increase in LCBF occurred in the brain regions comprising the mesencephalic RF (415-+ 122%), the zona incerta including Forel 's field (400 ± 55%) and the ventral tegmental nucleus (267 _+ 43%).
In addition to its effect on subcortical regions, electrical stimulation of the CM-Pf significantly increased (P < 0.05) cortical LCBF (Fig. 4, Table 5). The most pronounced increase was seen in the pari- etal cortex on the stimulated side (211 _ 35%).
In contrast to the marked increase in LCBF, electrical stimulation of the CM-Pf had a rather small effect on subcortical LCGU (Fig. 3). LCGU increased significantly (P < 0.05) in two of the six regions comprising the EMS: the globus pallidus (45 ___ 15%) and the substantia nigra pars compacta (72 -+ 19%). LCGU increased in only four of the nine limbic structures analysed. The greatest increases were seen in the lateral habenular nucleus (68 +__ 10%) and the mammillary body (45-+ 11%). In regions comprising the RF the most marked increases in LCGU during the CM-Pf stimulation were in the mesencephalic RF (193-+ 26%), the zona incerta (123 + 2 8 % ) and the anterior pretectal area (121 _+ 13%).
Stimulation of the CM-Pf elicited a significant increase in LCGU in the frontal cortex, but not in the parietal and occipital cortices (Fig. 4, Table 5).
Relationship between local cerebral blood flow and glucose utilization in unstimulated sham-operated ra ts
The relationship between LCBF and LCGU in unstimulated sham-operated rats was examined by linear regression analysis across the brain as a whole and for each system separately. There were significant positive correlations, similar to those reported previously in anesthetized rats, 6'19'25 as well as correlations computed for the three systems separately. The overall regression line (Fig. 4) was expressed by the equation LCBF = 2.0 LCGU + 20 (r = 0.75, P < 0.05). The regression equations for the three systems are indicated in Fig. 5. The correlation

458 S. MRAOVITCH et al.
coefficients for the three systems were: r = 0.99, P < 0.05 (EMS); r = 0.63, P < 0.05 (LS); r = 0.72, P < 0.05 (RF).
The LCBF to LCGU ratio ranged from 1.45 ml/ /lmol in the cingular cortex (area 32) to 3.32 ml/#mol in the mammillary body. The mean LCBF to LCGU ratios (Table 7) for the three systems (EMS: 2.18 + 0.05 ml//lmol; LS: 2.22 _+ 0.11 ml/#mol; and RF: 2.56 _+ 0.06 ml//~mol) were significantly different (RF being higher than LS and EMS), indicating heterogeneity between the systems in unstimulated rats.
Effect o f centromedian-parafascicular complex stimu- lation on the relationship between local cerebral blood flow and glucose utilization
Electrical stimulation of the C M - P f preserved and improved the correlation of the overall relationship (r = 0.85, P < 0.05) between LCGU and LCBF (Fig. 5) and those for the three systems analysed separately (EMS: r = 0.89, P < 0.05; LS: r =0.82, P <0.05; RF: r =0.88, P <0.05). The overall difference in the slopes of the regression line representing the relationship between LCGU and LCBF during control and C M - P f stimulation, was statistically significant (P < 0.05). The slopes of the regression line between LCBF and LCGU were also significantly (P < 0.05) different when comparing LS and RF.
The LCBF to LCGU ratio was markedly increased during CM-Pf stimulation within the parietal cortex (7.0ml//zml) and the frontal cortex (4.7ml/#ml). The mean LCBF to LCGU ratio for the three systems (Table 7) was also significantly increased: (P < 0.05): (EMS: 3.24 + 0.13 ml//lmol, LS: 3.52 _+ 0.22 ml/#mol and RF: 4.49 + 0.20 ml//~mol). Analy- sis of variance and Scheffe's test also showed a significant difference (P <0.05) in the ratios between the systems. The mean ratio for the reti- cular system was higher than the ratios for the limbic and extrapyramidal motor systems, indi- cating that the vascular beds within the regions comprising the RF was more responsive to CM-Pf stimulation.
DISCUSSION
We have previously demonstrated that electrical stimulation restricted to the CM-Pf of the intra- laminar thalamus elicits a marked increase in CBF in the rat. 22 The cerebrodilatory response was modu- lated by the sympathetic nervous system and adrenal hormones, but was not related to the EEG activity. More recently, we analysed a limited number of brain regions by quantitative autoradiography, and showed that the increase in LCBF during CM-Pf stimulation might be dissociated from changes in LCGUY
The present study has confirmed and extended the data on the effect of CM-Pf stimulation on LCBF and glucose metabolism in anesthetized, paralysed rats. It is important to consider several points before discussing the anatomical and functional significance of the present findings. First, the increase in LCBF during CM-Pf stimulation could not be attributed to changes in blood gases (Table 1) since they were not different in control and CM-Pf-stimulated rats, except for elevated pO2 in the unstimulated no-sham control rats, which does not significantly influence CBF. Second, a moderate but significant increase in mean arterial pressure during CM-Pf stimulation could not account for an increase in LCBF, since AP, although slightly increased, was well within the range of cerebral autoregulation in the rat. 4 Third, the mechanical lesion of the cortex produced by introducing the stimulating electrode elicited a corti- cal spreading depression (CSD), and hence cerebro- vascular and metabolic changes similar to those described previously. 15 All structures showing signifi- cant alteration in LCBF and/or LCGU due to CSD were excluded from further analysis. The complexity of the CSD-induced alteration in LCBF and LCGU deserves separate consideration (in preparation). Fourth, although the arterial plasma glucose concen- tration was elevated (probably due to increased circu- lating catecholamines during CM-Pf stimulation), it remained stable and well below critical values requiring redetermination of the lumped constant. LCGU was calculated, however, using a modified operational equation 37 which accounts for changes in arterial plasma glucose concentration. Fifth, the
ACB APT CN CXC24 CXC32 CXF CXP DTg EP GP IP LHb LS MB MnR
Abbreviations used in the figures accumbens nucleus anterior pretectal area caudate nucleus cingular cortex (area 24) cingular cortex (area 32) frontal cortex parietal cortex dorsal tegmental nucleus entopeduncular nucleus globus pallidus interpeduncular nucleus lateral habenular nucleus lateral septal nucleus mammillary complex median raphe
MRF MS PnC RMg RPn RTh RtTg S SNc SNr VL VTA VTg ZI
mesencephalic reticular formation medial septal nucleus pontine reticular nucleus caudal raphe magnus raphe pontis reticular thalamic nucleus reticular tegmental nucleus subiculum substantia nigra compacta substantia nigra reticulata ventrolateral thalamic nucleus ventral tegmental area ventral tegmental nucleus zona incerta
CONTROL SHAH C M - P F S T Z H
A
, ~ , ~, i~ ~,,, ,i~ ~ ~ , i ~, ~ ' , ~ • ~:
" ~ ~~~ ~~i ,~~ i~,~i~i~i,, ~ii~' ~ i I!~~
B
, ....... ~ !i~!~iil ~
CONTROL SHRIq
C
• •~i • i / • ~•!~ ~ ,
C x F
Nil
Zi
C x P
C M - P F STZM
M R F
| I
...... !

COHTROi - S H A H
A
B
CH - P F S T Z l q
Zl
?! 5
2 a
C O N T R O L
C
D
SHAM C H - P F S T Z H
M R F i
,2

CM-Pf stimulation and LCBF/LCGU regulation in specific neural systems 461
- 0 <" 1 0 0
I i
i;~==--.
k=m- .
@i=-.
L E F T R I G H T ( S T I M U L A T E D S I D E )
200 300 - 0 ÷ 100 200 300
EXTRAPYRAMIDAL M O T O R SYSTEM
GP I - "
ACB ~ l l m ~ +
EP ~ , ,
VL m~llI~I--*
SNc - - ] ' - - "
SNr "--~+'
LCGU ~ LCBF * p<@O5
4 0 0
LIMBIC SYSTEM
~IIIIIIIllI-- • CXC24
~ i ~ l l ~ - - + CXC32
~ m m - - . s
I] i i l- , LS
~IIIIIl-, ACB
~ I ~ , LHb
"-]-" , IP
~ i l ~ . - ,, MB
I-"
--1-"
.=
RETICULAR F O R M A T I O N
~ m - ° zi
, RTh
, APT
~ , , MRF
~- , RtTg
--]-. . VTg
~ 1 ~ - - + ' DTg
, MnR
• l - ] ' , RPn
- 7 - ' , RMg
l ~ I I I ~ , , PnC
1 - - . - ~
m .
--I-"
r"
7 -
I-"
7 -
I-"
=
I
I--"
4(
4(
i ~ 4 0 0
k
415
Fig. 3. Effect of C M P f stimulation of LCBF and LCGU (percentage of unstimulated sham control) on brain regions comprising the EMs, the LS and the RF not affected by a cortical spreading depression in anesthetized and paralysed rats. In the EMS note that the bilateral increase in LCBF (except in globus pallidus and substantia nigra) was not associated with a significant rise in metabolism. In the LS, significant increases in LCGU occurred in four (medial septum, lateral habenular nucleus, interpeduncular nucleus and mammillary body) out of nine structures. In the RF, bilateral increases in LCBF (except in the reticular thalamic nucleus, dorsal tegmental nucleus, median raphe and raphe magnus nucleus) were
associated with significant rises in metabolism.

462 S. MRAOVITCtt el al.
700
- • contro( y= 5.4 X- 97 % J 600 -- o stimulated r=0.85 /
E 500 " P= <0 °.05 / o
oO ~400 o o
0 0 o°O
3o0 o o
h - o o
o 8o0 2 0 0 -
. o
I00 . ~ ": p <0.05
i i i ~ I i , t , I ~ J , I 0 20 40 60 80 I O0 120 140
LCGU (/zmo(/lO0 g per rain)
Fig. 4. Comparison of the relationship between LCGU and LCBF in controls (0) and during C M P f stimulation (©) in 48 regions comprising the EMS, LS and RF. The regression lines are y = 2.0x +20 (r = 0.75, P < 0.05) for the controls and y = 5.4x -97 (r = 0.85, P < 0.05) for the stimulated rats. Note that the slope and the intercept of the stimulated animals are significantly different from the control rats.
temporal resolution between measurement of CBF (30-s and 10-15-min stimulation) and cerebral glucose utilization (45- and 60-min stimulation) is known to be a major problem in correlating and interpreting CBF and cerebral glucose utilization changes. This problem was circumvented by making the timing between the two experimental procedures such that 2-DG was injected 20-30 min earlier in the exper- iments in which LCGU was measured than was iodoantipyrine in those in which LCBF was measured. Using the mass spectrometry method, we have also demonstrated, in a separate group of animals, that LCBF in the parietal cortex (chosen for its high cerebrovascular reactivity to C M @ f stimulation) remains elevated and stable throughout the 50 min of continuous stimulation. Sixth, general anesthetics, including alpha-chloralose, are known to depress 2-DG uptake. 3 Despite this limitation, the experimental conditions of the anesthetized and paralysed preparations provide considerable advan- tages for analysing and interpreting altered cerebro- vascular and metabolic responses. Such preparations limit, for example, activation of receptors conveying information on position and movement to the thala- mus and the cortex and, hence, those reflex activations that may be unrelated to the experimental goal. In a conscious animal, the local values for blood flow and/or glucose metabolism and their spatial distri- bution during a stimulation, would be greatly "con- taminated" by non-specific activation of reflex pathways, rendering the interpretation of results difficult. Moreover, acute preparations such as those used in this study can establish conditions for further investigations of the electrophysiological and neuro- chemical mechanisms via which the altered changes
in LCBF and LCGU were elicited. Seventh, we are aware that no selective electrical stimulation may be a source of potential errors in interpreting our results. Indeed, the stimulation used in the present study will depolarize cell bodies within the CM-Pf and elicit the propagation of action potentials along its monosynaptic thalamo-striatal projections to activate intrinsic extrapyramidal neuronal circuit, and via the CM-Pf amygdaloid projection to the limbic system. We do not exclude the possibility that the electrical stimulation will also excite dendritic arborization, neural local circuits, multisynaptic pathways, glia, as well as fibers of passage reaching other regions of the brain. Thus, cerebrovascular and metabolic responses elicited within the reticular nuclei by the stimulation might be due to the antidromic activation of fibers of passage and/or the action of circulating catechol- amines released via multisynaptic pathways from the adrenal medulla. We have demonstrated that the origin of cerebrovascular and metabolic changes are cell bodies activating C M - P f efferent projections in a parallel study 26 using microinjection of carbachol as a stimulating agent.
It is generally believed that individual cerebral structures are perfused in proportion to their meta- bolic demand and that LCBF is adjusted to local energy requirement. Many studies using quantitative autoradiography for measuring both LCBF and LCGU have shown parallel changes in blood flow and glucose utilization across the brain (see, for example, Refs 6, 16, 20, 38). But it has recently been demon- strated that an increase in CBF need not be associated with proportional changes in glucose use under several experimental conditions. A discrepancy between increased CBF and glucose utilization has been

CM-Pf stimulation and LCBF/ISCGU regulation in specific neural systems 463
700
6 0 0
c
E 5 0 0
I:~ 4 0 0 0 0
~" 3 0 0
E
Lt_ 200 t]3
I o o
Ext rapy ramlda l motor system
• control * st imulated
• / d j ~ / r - % ~ f p <0.05
, , , I ~ , , J I , I 20 40 60 80 I oo 120 140
LCGU ( /zmol / lO0 g permin)
Table 7. Mean ratio ( __+ S.E.) between local cerebral blood flow and glucose utilization in sham and during centrome- dian-parafasicular complex stimulation in anesthetized,
paralysed rats
EMS LS RF n = 12 n = 15 n = 21
Sham 2.18 ___ 0.05n.s. 2.22 4- 0.1 ln.s. 2.56 4- 0.06 b Stim 3.24 4- 0.13an.s. 3.52 4- 0.22"n.s. 4.49 4- 0.20 ab
Values are measured in ml/#mol. aSignificance refers to difference from unstimulated sham
control (Student t-test, P < 0.05). bSignificance refers to difference between the systems
(analysis of variance and Scheffe's test, P < 0.05). n.s., not significant (refers to difference between the
systems).
700
600
c
F: 500
400 o o
3o0
200
I00
Limbic system
• control e * st imulated /
y : 5 0 X - 1 0 3 / r :0 .82 /
. ~ ' ~ , r : 0 7 2
, , - - ~ ~ , , ; "i , , , p ~ o . o ~ ,
20 4 0 60 80 I00 120 140
LCGU { jumoL/ lO0 g per min)
700 Ret i cu la r fo rmot ion / • contro l * /
600 * st imulated
-~ / o
'~ 500 y : 5 . 4 X - 6 I r =0.88 * / .
~ 3o0
Ix_ 2 0 0
,oo ~ . y / - ~ - ' t ~ , - " r=0.63_ ~ ' - / p <0.05
I I I I I I I I I I I I ' ' J 0 20 40 60 80 I00 120 140
L C G U ( / Z m o l / I O 0 g per min)
Fig. 5. Comparison of the relationship between local cer- ebral glucose utilization and local cerebral blood flow in controls (O) and during CM-Pf stimulation (©) in the EMS (n = 12), the LS (n = 15), and the RF (n = 21). Note that only in the EMS, the slope in the CM-Pf-stimulated
rats is not significantly different from its control.
shown during bicuculline-induced seizures, 9 infusion of catecholamines, 39 metabolic depressants adminis- tration such as gamma-hydroxybutyrate, 13 action of a calcium antagonist, 18 potassium-depletion 34 and electrical stimulation of the brain. 19'26
The present results demonstrate that electrical stimulation of C M - P f elicits differential changes in
L C B F and L C G U , when measured bilaterally in 52 individual brain structures. Some regions showed only moderate increases in L C B F (the reticular thalamic nucleus, the mammillary body), while the flow rate was increased two- to three-fold in others (the substantia nigra pars compacta, the cingular and parietal cortices, the lateral habenular nucleus, the zona incerta and the mesencephalic reticular for- mation). The heterogeneous LCBF response during C M - P f stimulation cannot be explained by differ- ences in vasocapacity between the regions measured, since hypercarbia elicits rather uniform cerebrovascu- lar responses under similar experimental conditions. 7 It cannot be explained by a proport ional alteration in L C G U either. Although the increase in L C B F was associated with a marked focal alteration in L C G U in some brain regions (the zona incerta, the mesen- cephalic RF and the anterior pretectal area); the magnitude of the overall L C G U increase (across the brain) was rather small. For example, L C B F in- creased up to 200% within the cingular, frontal and parietal cortices, while the increase in L C G U , up to about 20%, was not significant.
Al though the changes in LCBF and L C G U across the brain were previously grouped according to neuro-anatomical and/or functional (extrapyramidal or visual system, for example) criteria. 9'13'16'18'27'34'39 the
quantitative analysis considered all measured regions as a whole. A high correlation was invariably found between the rate of flow and the rate of glucose metabolism, which was interpreted as a tight coupling between the two responses. We are aware that linear regression analysis, even in its more elaborate form ~6 cannot adequately represent the complex relationship between L C B F and LCGU. We used these statistics, however, in order to compare our data with those of others. 13'16'18'34'39
In the present study we have attempted to extend global analysis of data across the brain to anatomi- cally and functionally well-defined neural systems. Under control conditions, in agreement with others, we found a good correlation between local blood flow and glucose utilization computed globally. The L C B F and L C G U were also well correlated when the three systems were analysed separately. The ratio,

464 S. MRAOVITCH et al.
indicating a degree of association between LCBF and LCGU, considering either individual brain re- gions or specific neural circuits, was differentiated. Thus, the mean ratio of blood flow to glucose use for the RF is significantly higher than the mean ratios for the limbic and extrapyramidal motor sys- tems. This indicates that, even in the resting state, the degree of a vascular and metabolic coupling is not uniform within a specific neural network. Elec- trical stimulation of the C M - P f resulted in a signifi- cant increase in the slope of the regression line between local blood flow and glucose utilization, analysed globally and within the RF and the EMS. This indicates that the coupling mechanisms for the RF and the EMS were not disturbed during stimu- lation, but merely reset. Although the coupling of LCBF and LCGU was preserved in the limbic sys- tem, CM-Pf stimulation did not significantly change their relationship from that of the unstimulated sham controls. The magnitudes of the increases in the LCBF/LCGU mean ratios for the three systems were also significantly different (RF being higher than the other two). It appears, thus, that CM-Pf stimulation can elicit a differential pattern of cer- ebrovascular and glucose metabolic response within the well-defined neural networks. This finding pro- vides, for the first time, evidence suggesting that anatomically and functionally defined neural net- works have specific vascular and metabolic regulat- ory mechanisms.
The differential responses of LCBF and glucose metabolism during CM-Pf stimulation raise the question of the pathways by which these responses are mediated. The relationship between CM-Pf efferents and cerebral blood vessels has not yet been investigated. In the absence of a morphological link between the neural elements within the CM-Pf and the cerebral blood vessel wall, it is conceivable that CM-Pf stimulation could activate other neural systems known to participate in CBF regulation. Several anatomical 1'3°'3z and pharmacological ~2 stud- ies have shown that C M P f provides a major input to the striatum and regulates the release of dopa- mine from nigrostriatal synaptic terminals in the caudate- putamen. The dopaminergic influences on CBF and/or cerebral glucose utilization have been extensively studied (for review, see Ref. 17). It was shown that both LCBF and LCGU changes elicited by dopaminergic agonist such as apomorphine are particularly pronounced within the extrapyramidal brain regions. 16 It is therefore conceivable that the activated CM-Pf could alter CBF and glucose metabolism within the EMS by activating, monosy- naptically, neural circuits implicated in dopamin- ergic transmission. CM-Pf stimulation would also activate, multisynaptically, the limbic regions via CM-Pf-amygdaloid 28 and CM-Pf-cortical projec- tions, s,3°'32 It is unlikely that the potent vasodilation elicited in the brain regions comprising the RF was due to activation of C M P f efferent projections to
the brainstem, since no such connections have, to date, been described (except with the zona incerta). Nor could it be due to an antidromically 2'1° elicited increase in LCGU, since it is believed that the most pronounced alteration in LCGU occurs at axon terminals and their postsynaptic elements. 33 It has recently been shown 8'2x that circulating catechol- amines can modulate CBF during brain stimulation 8 including CM-Pf stimulation. 2~ Using quantitative autoradiography, we have observed (unpublished data) that bilateral adrenalectomy markedly reduces the C M P f elicited vasodilatory response through- out the brainstem RF, the parietal cortex, but not the thalamus. This observation, coupled with our previous 2a and present findings, are in agreement with recently published data and the hypothesis 14 that regional increases in CBF may be elicited di- rectly via neural pathways and indirectly via circu- lating adreno-medullary catecholamines. One of the targets of adrenal catecholamines, perhaps acting through the circumventricular organs, might be the RF nuclei.
Additional autoradiographic data are needed, however, in order to evaluate, both locally and in neural networks, the extent and locations where changes in LCBF and/or LCGU are modulated by adrenal catecholamines. Similar data are required for the sympathetic nervous system, which also alters CM-Pf-elicited vasodilation. 21 The functional specificity of the individual brain regions as well as the well-defined neural systems require specific LCBF and LCGU regulation implicating at least three major factors: neurogenic (intrinsic and/or ex- trinsic), metabolic and hormonal.
CONCLUSION
We propose that the heterogeneous increases in LCBF and/or LCGU during C M P f stimulation involve differential contributions of metabolic, hormonal and neurogenic mechanisms. Each of these mechanisms contributes to the appropriate adjustment of the immediate and/or anticipated local energy and blood flow requirements within a given brain region or neural network, necessary for expression of a specific neurogenic function. The mechanisms underlying this heterogeneous cerebro- vascular and/or metabolic regulation are presently unknown. The nature of the transmitters involved and the critical pathways controling the LCBF and/or LCGU alteration during CM-Pf stimulation remain to be elucidated.
Acknowledgements--We thank Mrs Josiane Borredon for providing computing expertise and data processing, Mr Robert Charbonne for technical assistance and Mrs Jeanne Leizerovici for secretarial help. This research was supported by grants from the Centre National de la Recherche Scien- tifique (U.A. 641) and the Institut National de la Sant6 et de la Recherche M6dicale (U. 182), and the Direction des Recherches, Etudes et Techniques (contract no. 88048).

CM-Pf stimulation and LCBF/LCGU regulation in specific neural systems 465
REFERENCES
1. Beckstead R. M. (1984) The thalamostriatal projection in the cat. J. comp. Neurol. 223, 313 346. 2. Cornwall J. and Philipson O. Y. T. (1988) Afferent projections to the parafascicular thalamic nucleus of the rat, as
shown by the retrograde transport of wheat germ agglutinin. Brain Res. Bull. 20, 139-150. 3. Dudley R. E., Nelson S. R. and Samson F. (1982) Influence of chloralose on brain regional glucose utilization. Brain
Res. 233, 173 180. 4. Gross P. M., Harper A. M. and Graham D. I. (1981) Cerebral blood flow in rats during physiological and humoral
stimuli. Stroke 12, 345-352. 5. Herkenham M. (1980) Laminar organization of thalamic projections to the rat neocortex. Science 207, 532-535. 6. Iadecola C., Nakai M., Mraovitch S., Ruggiero D. A., Tucker L. W. and Reis D. J. (1983) Global increase in cerebral
metabolism and blood flow produced by focal electrical stimulation of dorsal medullary reticular formation in rat. Brain Res. 272, I01 114.
7. Iadecola C., Arneric S. P., Baker H. D., Tucker L. W. and Reis D. J. (1987) Role of local neurons in cerebrocortical vasodilation elicited from cerebellum. Am. J. Physiol. 252, R1082-R1091.
8. Iadecola C., Lacombe P. M., Underwood M. D., Ishitsuka T. and Reis D. J. (1987) Role of adrenal catecholamines in cerebrovasodilation evoked from brain stem. Am. J. Physiol. 252, H1183-Hl191.
9. Ingvar M. and Siesjo B. K. (1983) Local blood flow and glucose consumption in the rat brain during sustained bicuculline-induced seizures. Acta neurol, scand. 68, 129-144.
10. Jones B. E. and Yang T. Z. (1985) The efferent projections from the reticular formation and the locus coeruleus studied by anterograde and retrograde axonal transport in the rat. J. comp. Neurol. 242, 56-92.
I1. Kety S. S. (1981) The theory and applications of the exchange of inert gas at the lungs and tissues. Pharmac. Rev. 3, 1-41.
12. Kilpatrick I. C. and Philipson O. T. (1986) Thalamic control of dopaminergic functions in the caudate-putamen of the rat. I. The influence of electrical stimulation of the parafascicular nucleus on dopamine utilization. Neuroscience 19, 965478.
13. Kuschinsky W., Suda S. and Sokoloff L. (1985) Influence of 7-hydroxybutyrate on the relationship between local cerebral glucose utilization and local cerebral blood flow in the rat brain. J. cerebr. Blood Flow Metab. 5, 58~64.
14. Lacombe P. M., !adecola C., Underwood M. D., Sved A. F. and Reis D. J. (1990) Plasma epinephrine modulates the cerebrovasodilation evoked by electrical stimulation of dorsal medulla. Brain Res. 506, 93 100.
15. Lauritzen M. and Diemer N. H. (1986) Uncoupling of cerebral blood flow and metabolism after single episode of cortical spreading depression in the rat brain. Brain Res. 370, 405-408.
16. McCulloch J., Kelly P. A. T. and Ford I. (1982) Effect of apomorphine on the relationship between local cerebral glucose utilization and local cerebral blood flow (with an appendix on its statistical analysis). J. cerebr. Blood Flow Metab. 2, 487-499.
17. McCulloch J. (1984) Role of dopamine in interaction among cerebral function, metabolism and blood flow. In Neurotransmitters and the Cerebral Circulation (eds Bes A., MacKenzie E. T. and Seylaz J.), pp. 137-155.
18. Mohamed K. A., Mendelow A. D., Teasdale G. M., Harper A. M. and McCulloch J. (1985) Effect of the calcium antagonist nimodipine on local cerebral blood flow and metabolism coupling. J. cerebr. Blood Flow Metab. 5, 26-33.
19. Mraovitch S., Iadecola C. and Reis D. J. (1983) Vasoconstriction unassociated with metabolism in cerebral cortex elicited by electrical stimulation of the parabrachial nucleus in rat. J. cerebr. Blood Flow Metab. 3(suppl. 1), S 196-S 197.
20. Mraovitch S., Iadecola C., Ruggiero D. A. and Reis D. J. (1985) Widespread reduction in cerebral blood flow and metabolism elicited by electrical stimulation of the parabrachial nucleus in rat. Brain Res. 341, 283-296.
21. Mraovitch S., Lasbennes F., Calando Y. and Seylaz J. (1986) Cerebrovascular changes elicited by electrical stimulation of the centromedian parafascicular complex in rat. Brain Res. 380, 42-53.
22. Mraovitch S., Pinard E. and Seylaz J. (1986) Two neural mechanisms in rat fastigial nucleus regulating systemic and cerebral circulation. Am. J. Physiol. 251, H153-H163.
23. Mraovitch S. and Seylaz J. (1987) Metabolism-independent cerebral vasodilation elicited by electrical stimulation of the centromedian-parafascicular complex in rat. Neurosci. Lett. 83, 269-274.
24. Mraovitch S., Calando Y. and Seylaz J. (1987) Cerebral blood flow and metabolism in the limbic and extrapyramidal motor system of the rat: Effect of centromedian-parafascicular complex situation. J. cerebr. Blood Flow Metab. 7(suppl. 1), $249.
25. Mraovitch S. (1989) Functional organization of central cerebrovascular pathways with special reference to the thalamus. In Neurotransmission and Cerebrovascular Function H (eds Seylaz J. and Sercombe R.), pp. 343 368. Elsevier Science Publishers, Amsterdam.
26. Mraovitch S., Feger J., Calando Y. and Seylaz J. (1989) Cardiovascular and cerebrovascular alterations elicited by cholinergic stimulation of the centromedian-parafascicular complex in the rat. In Neurotransmission and Cerebrovascular Function I (eds Seylaz J. and MacKenzie E. T.), pp. 397-400. Elsevier Science Publishers, Amsterdam.
27. Nakai M., Iadecola C., Ruggiero D. A., Tucker L. and Reis D. J. (1983) Electrical stimulation of the cerebellar fastigial nucleus increases cerebral cortical blood flow without changes in focal metabolism: evidence for an intrinsic system in brain for primary vasodilation. Brain Res. 260, 35-49.
28. Otterson O. P. and Ben-Ari Y. (1979) Afferent connection of the amygdaloid complex of the rat and cat. J. comp. Neurol. 187, 401-424.
29. Reis D. J. and Iadecola C. (1989) Central neurogenic regulation of cerebral blood flow. In Neurotransmission and Cerebrovascular Function H (eds Seylaz J. and Sercombe R.), pp. 369090. Elsevier Science Publishers, Amsterdam.
30. Royce G. J. and Mourey R. J. (1985) Efferent connections of the centromedian and parafascicular thalamic nuclei: an autoradiographic investigation in the cat. J. comp. Neurol. 235, 277-300.
31. Sakurada O., Kennedy C., Jehle J., Brown J. D., Carbin G. L. and Sokoloff L. (1978) Measurement of local cerebral blood flow with iodo-~4Crantipyrine. Am. J. Physiol. 3, H59-H66.
32. Saper C. B. and Loewy A. D. (1980) Efferent connections of the parabrachial nucleus in the rat. Brain Res. 197, 291-312.
33. Schwartz W. J., Smith C. B., Davidson L., Savaki H., Sokoloff L., Mata M., Fink D. J. and Gainer H. (1979) Metabolic mapping of functional activity in the hypothalamo-neurohypophysal system of the rat. Science 205, 723-725.

466 S. MRAOV1TCH et al.
34. Schrock H. and Kuschinsky W. (1988) Cerebral blood flow, glucose use and CSF ionic regulation in potassium-depleted rats. Am. J. Physiol. 254, H350-H357.
35. Seylaz 3., Pinard E., Meric P. and Correze J. L. (1983) Local cerebral PO 2, PCO 2 and blood flow measurements by mass spectrometry. Am. J. Physiol. 245, H513-H518,
36. Sokoloff L., Reivich M., Kennedy C., DesRosiers M. H., Patlak, C. S., Pettigrew K. D., Sakurada O. and Shinohara M. (1977) The 14C-deoxyglucose method for the measurement of local cerebral glucose utilization: theory procedure and normal values in the conscious and anesthetized albino rat. J. Neurochem. 28, 897416.
37. Sokoloff L. (1979) The 14C-2-deoxyglucose method: four years later. In Cerebral Blood Flow and Metabolism (eds Gotoh F., Nagai H. and Taraki Y.), pp. 640~49. Munksgaard, Copenhagen.
38. Sokoloff L. (1981) Localization of functional activity in the central nervous system by measurement of glucose utilization with radioactive deoxyglucose. J. cerebr. Blood Flow Metab. 1, 7-36.
39. Tuor U. I., Edvinsson L. and McCulloch J. (1986) Catecholamines and the relationship between cerebral blood flow and glucose use. Am. J. Physiol. 251, H824-H833.
(Accepted 7 February 1992)
Copyright © 2022 FDOKUMEN