Cognitive aging: a common decline of episodic recollection and spatial memory in rats

HUMAN–COMPUTER INTERACTION, 2013, Volume 28, pp. 479–517
Copyright © 2013 Taylor & Francis Group, LLC
ISSN: 0737-0024 print / 1532-7051 online
DOI: 10.1080/07370024.2012.755421
Machines Outperform Laypersons inRecognizing Emotions Elicited by
Autobiographical Recollection
Joris H. Janssen,1,2 Paul Tacken,2 J.J.G. (Gert-Jan) de Vries,2
Egon L. van den Broek,3,4,5 Joyce H.D.M. Westerink,2
Pim Haselager,6 and Wijnand A. IJsselsteijn 1
1Eindhoven University of Technology, The Netherlands2Philips Research, The Netherlands
3TNO Technical Sciences, The Netherlands4University of Twente, The Netherlands
5Radboud University Medical Center Nijmegen, The Netherlands6Radboud University Nijmegen, The Netherlands
Over the last decade, an increasing number of studies have focused
on automated recognition of human emotions by machines. However,
performances of machine emotion recognition studies are difficult to
interpret because benchmarks have not been established. To provide such
a benchmark, we compared machine with human emotion recognition.
We gathered facial expressions, speech, and physiological signals from
17 individuals expressing 5 different emotional states. Support vector
machines achieved an 82% recognition accuracy based on physiological
and facial features. In experiments with 75 humans on the same data,
a maximum recognition accuracy of 62.8% was obtained. As machines
outperformed humans, automated emotion recognition might be ready to
be tested in more practical applications.
Joris H. Janssen is a socio-cognitive engineer with a broad interest in topics combining psychology
and artificial intelligence, such as affective computing, social signal processing, persuasive technology,
personalized healthcare, and transformed social interaction; he recently joined Philips Research as a
research scientist.Paul Tacken is a software engineer with an interest in application-driventechnologies;
he is a design engineer Metrology at ASML Netherlands B.V. J.J.G. (Gert-Jan) de Vries is a computing
scientist with interest in data analysis, machine learning, and intelligent algorithm development, applied
to topics ranging from healthcare information and clinical decision support to physiological signals
and emotions measurement; he is a Research Scientist in the Department of Healthcare Information
Management of Philips Research. Egon L. van den Broek is a cognitive engineer with interest
in multimodal ambient perception and interaction in (a) health and well-being; (b) personalized,
empathic, context-aware, adaptive, and autonomous systems; and (c) profiling, security, and forensics;
he is consultant at Technical Sciences TNO, Assistant Professor at the Human Media Interaction
479
Dow
nloa
ded
by [
Uni
vers
iteit
Tw
ente
] at
04:
13 0
3 A
ugus
t 201
3

480 Janssen et al.
1. INTRODUCTION
Affective computing (Picard, 1997) has the potential to improve and enrich
the ways in which we interact with technology. Examples of affective comput-
ing involve, for instance, detecting and adapting to user frustration (Scheirer, Fer-
nandez, Klein, & Picard, 2002), driver’s emotional state assessment (Healey & Pi-
card, 2005; Katsis, Katertsidis, Ganiatsas, & Fotiadis, 2008), affective music play-
ers (Janssen, Van den Broek, & Westerink, 2012), or affective communication tech-
nology (Janssen, Bailenson, IJsselsteijn, & Westerink, 2010). For all the proposed ap-
plications, some form of machine emotion recognition is necessary. This requirement
has not gone unnoticed during the last decade, with machine emotion recognition
often being treated as the holy grail of affective computing (Cowie, 2009; Picard,
2003; Picard & Klein, 2002). A large number of studies have tried to recognize human
emotions from facial expressions, posture, speech, and physiological indices (see the
Background section for a review). Despite all these studies and several extensive
surveys (Cowie et al., 2001; Van den Broek, Lisý et al., 2010; Zeng, Pantic, Roisman,
& Huang, 2009), researchers seem to agree that automated emotion recognition is not
yet mature enough to be put into practice (Calvo & D’Mello, 2010; Kappas, 2010).
We challenge the claim that the current state of the art of machine emotion
recognition is not good enough for practical application. Instead, we suggest that we
do not know if machine emotion is currently sufficiently developed to be put into
practice. Therefore, we propose to use human performance as a starting point for
benchmarking machine emotion recognition. First, humans can recognize emotions
and report what they recognized in an understandable way. Second, other applications
of artificial intelligence (including machine learning) are also benchmarked against
human performance, for instance, playing chess (Hsu, 2002) and recognizing charac-
ters (Chellapilla, Larson, Simard, & Czerwinski, 2005). Third, humans are generally
recognized as the most superior natural systems performing mental tasks (Roth &
Dicke, 2005). Moreover, artificially intelligent applications are traditionally seen as
successful if they are able to beat human performance (Turing, 1950).
group, University Twente, senior scientist at Radboud University Medical Center Nijmegen, all in the
Netherlands. Joyce H.D.M. Westerink studied physics and did her Ph.D. on the human-oriented
topic of perceived image quality, after which she joined Philips Research and specializes on human
perception, emotion, and cognition related to consumer products. Pim Haselager is a philosopher of
cognitive science with an interest in topics combining artificial intelligence and cognitive neuroscience,
such as embodied embedded cognition, representation, intention, and behavioral control; he is Associate
Professor, head of the educational program of AI, and Principal Investigator of the Donders Institute
for Brain, Cognition and Behaviour, at the Radboud University, Nijmegen. Wijnand A. IJsselsteijn is
a cognitive neuropsychologist with an interest in conceptualizing and measuring human experiences in
relation to advanced media environments (virtual environments, serious games, affective computing)
in the service of human learning, health, and well-being; he is a Full Professor of Cognition and Affect in
Human-Technology Interaction at the Human-Technology Interaction Group of Eindhoven University
of Technology.
Dow
nloa
ded
by [
Uni
vers
iteit
Tw
ente
] at
04:
13 0
3 A
ugus
t 201
3

Machines Outperform Laypersons in Recognizing Emotions 481
CONTENTS
1. INTRODUCTION2. BACKGROUND
2.1. Vision-Based Emotion Recognition2.2. Audio-Based Emotion Recognition2.3. Physiology-Based Emotion Recognition2.4. Multimodal Emotion Recognition2.5. Conclusion
3. DATA GATHERING3.1. Experimental Setup
Participants and DesignMaterialsProcedure
3.2. ResultsDurationSelf-Report Ratings
3.3. Conclusion4. HUMAN BENCHMARK
4.1. Non-Dutch ExperimentParticipants and DesignMaterialsProcedureResults
4.2. Dutch ExperimentParticipants and DesignResults
4.3. Discussion5. MACHINE EMOTION RECOGNITION
5.1. MethodFeature ExtractionPreprocessing and NormalizationFeature SelectionClassification
5.2. Results and Discussion6. GENERAL DISCUSSION
6.1. Machines Outperform Humans6.2. Physiology is a Promising Modality6.3. Conclusion
In the current work, we set out to investigate how well machine emotion
recognition performs by comparing it to human emotion recognition. We use the
autobiographical recollection technique for inducing natural, ecologically valid, emo-
tional expressions. Three modalities are measured to form a corpus that is used for
emotion recognition by man and machine. Furthermore, we investigate the relative
performances of emotion recognition based on (combinations of) different sources of
Dow
nloa
ded
by [
Uni
vers
iteit
Tw
ente
] at
04:
13 0
3 A
ugus
t 201
3

482 Janssen et al.
emotional information (i.e., modalities). In this way, we hope to quantify where current
state of the art of machine emotion recognition stands and what fruitful directions
for future research and technologies might be. The rest of the article provides, first,
a review of the current state of the art in machine emotion recognition and then
describes data generation we used for testing emotion recognition. Subsequently,
human emotion recognition is described, followed by machine emotion recognition,
followed by discussion and conclusions.
2. BACKGROUND
Emotions are strongly coupled to facial expressions (Ekman, 1992, 1999), pos-
ture (de Gelder, 2009; de Gelder et al., 2010; Kleinsmith, Bianchi-Berthouze, & Steed,
2011; van den Hoogen, IJsselsteijn, & de Kort, 2008), speech prosody (Bachorowski
& Owren, 2008; Banse & Scherer, 1996; K. R. Scherer, 1986), and physiological
responses (Cacioppo, Tassinary, & Berntson, 2000; Ekman, Levenson, & Friesen,
1983). Although there is not one universally agreed-upon definition of emotion,
emotion is usually defined as a short-term affective reaction to an object, agent,
or event (Ortony, Clore, & Collins, 1988). Throughout this article, we adopt this
definition of emotion, with expressions that arise and leave within a time frame
of several seconds (Cowie et al., 2001). We use the term ‘‘mood’’ for longer term
emotional states.
Measurements of such signals can be used to automatically recognize emotions,
which is essentially a pattern recognition problem. The goal of pattern recognition is
to develop an artificial system that is able to recognize (complex) patterns, in our case
emotions, through statistical learning techniques. Machine learning can be employed
for each data source (i.e., modality) separately or, when the features from all data
sources are extracted, they can be merged into one set. Both approaches are applied
frequently. Figures 1 to 5 illustrate both differences and similarities in research on
affective computing that utilized distinct modalities.
Inspecting Figures 2 to 5 shows that the number of features extracted is very dif-
ferent for the different studies. Not only do the number of features differ considerably
between studies, but also the number of participants ranges from 1 (Picard, Vyzas, &
Healey, 2001) to 100 or even more (K. H. Kim, Bang, & Kim, 2004; Lien, Kanade,
Cohn, & Li, 2000; Littlewort, Bartlett, Fasel, Susskind, & Movellan, 2006; Xiao, Zhao,
Zhang, & Shi, 2011). The number of participants is an important parameter, as it gives
information as to how reliable the findings are when applied to a larger population.
Studies including more than 30 participants are relatively rare, which makes the results
obtained so far difficult to generalize to other populations.
For affective computing, a plethora of classifiers has been used (e.g., SVM,
ANN, Bayesian Network), as illustrated by Figures 2 to 5. Classification in affective
computing is hard, as the emotion classes used are typically ill defined. This lack of
definitions makes it difficult to compare studies. Moreover, the number of emotion
Dow
nloa
ded
by [
Uni
vers
iteit
Tw
ente
] at
04:
13 0
3 A
ugus
t 201
3

Machines Outperform Laypersons in Recognizing Emotions 483
FIGURE 1. Table with abbreviations.
Abbreviation Explanation
AdaBoost Adaptive BoostingANFIS Adaptive-Network-based Fuzzy Inference SystemsANOVA Analysis of VarianceBN Bayesian NetworkC Cardiovascular activity (e.g., ECG and BVP)CTKF Continuous Time Kalman FilterDT Decision TtreeE Electrodermal activityEMDC A tailored ensemble of binary classifiersFACS Facial Action Coding SystemFeats Number of featuresGA Genetic AlgorithmGMM Gaussian Mixture ModelsGP Gaussian Process classificationGWF Gabor Wavelet FiltersHMM Hidden Markov ModelsK* Instance-based classifier, with a distance measure based on entropyLDA Fisher’s Linear Discriminant AnalysisLRM Linear Regression ModelLPP Locality Preserving ProjectionkNN k-Nearest NeighborsMo MovementM ElectromyogramNB Naïve-BayesPCA Principal Component AnalysisPr PressureR RespirationRT Regression TreePerf PerformanceSBS Sequential Backward SelectionSFS Sequential Forward SelectionSp SpeechSs SubjectsSUD Subjective Unit of DistressSVM Support Vector MachinesT Skin temperatureVi VisionVFI Voted Features Interval
categories to be discriminated in the different studies ranges considerably: from two
to four in most studies up to around 12 in others (Banse & Scherer, 1996; Gunes &
Piccardi, 2009). To further review previous work on affective computing, we discuss
three modalities that have frequently been employed for machine emotion recognition:
vision/image, audio/speech, and physiological signals. These three modalities can be
used to analyze facial expressions, speech utterances, and physiological processes. In
the following we first discuss each of these three modalities separately. Subsequently,
we discuss work on the combination of these three modalities.
Dow
nloa
ded
by [
Uni
vers
iteit
Tw
ente
] at
04:
13 0
3 A
ugus
t 201
3

484 Janssen et al.
2.1. Vision-Based Emotion Recognition
Vision-based emotion recognition is mostly done based on facial expression
analysis. Facial expression analysis is complex, at least in part because physiognomies
of faces vary considerably among individuals due to age, ethnicity, gender, facial
hair, cosmetic products, and occluding objects (e.g., glasses and hair). Furthermore,
a face can appear differently due to pose or lighting changes, or other forms of
environmental noise (Fasel & Luettin, 2003; Tian, Kanade, & Cohn, 2005).
Despite its complexity, emotion recognition based on facial expression remains
popular within the scientific community. This popularity is likely because it is among
the dominant modalities for human emotion recognition, and it can be applied to
stimuli of different types (e.g., still images and video). Furthermore, Ekman and
Friesen’s FACS (Ekman & Friesen, 1978) provides an excellent set of markers that
can be employed for vision-based emotion recognition. FACS provides a rather solid
theoretical foundation and, consequently, FACS is often used as a basic starting point
for facial expression analysis. Third, vision-based facial analysis is very well possible
in controlled conditions. Par excellence, this is illustrated by the inclusion of face
recognition in the biometrics portfolio (Van den Broek, 2010).
Xiao et al. (2011) showed that thousands of features can be derived from human
faces. These features can be characterized along several dimensions (Fasel & Luettin,
2003). First, local features versus the face as a whole can be distinguished. In both
cases segmentation of the image is required, often augmented by a priori knowledge
of human observers. Second, deformation analysis versus motion extraction can be
distinguished. With deformation analysis, a neutral image or a face model is compared
with the image of interest. Motion extraction directly compares image sequences with
each other.
As is shown in Figure 2, in practice, the number of features extracted varies
considerably: from 16 (Yacoob & Davis, 2006) to 4,320 (Xiao et al., 2011). In all studies
except two, feature selection/reduction was applied, which means that uninformative
features are removed from the data set prior to training a classifier. The number of
subjects who participated in the studies also varies considerably, from four to 210.
In contrast, the number of emotion classes that are to be discriminated is relatively
similar among the studies (range D 5–8) with only one study that discriminates among
12 emotional states (Gunes & Piccardi, 2009). The reported recognition rates range
from 72 to 98%. The early work of Cottrell and Metcalfe (1991) is an exception
to this, with their 20% correct classification among eight emotions (chance level D
12.5%). Taken together, classification performance varies strongly among different
studies.
2.2. Audio-Based Emotion Recognition
Audio-based emotion recognition mainly focuses on speech-based emotion
recognition. In addition to speech-based emotion recognition, studies have focused
on nonlinguistic utterances such as coughing, crying, laughing, and specific utterances
Dow
nloa
ded
by [
Uni
vers
iteit
Tw
ente
] at
04:
13 0
3 A
ugus
t 201
3

Machines Outperform Laypersons in Recognizing Emotions 485
FIGURE 2. Review of 10 machine learning studies employing computer vision torecognize emotions.
References Input Ss Features Functions Targets Perf
Cottrell & Metcalfe(1991)
Face 20 4,096 NN 8 emotions 20%
Essa & Pentland(1995, 1997)
FACS 8 5 emotions 98%
Yacoob & Davis(1996)
Mouth 32 16 7 emotions 65%
Lien et al.(2000)
FACS 100 38 LDA,HMM
9 action units 80%
Cohen et al.(2003)
Motion Units 53 12 BN 7 emotions 83%
Pantic & Patras(2006)
FACS 19 24 30 action units 87%
Littlewort et al.(2006)
Face 100 900 LDA,SVM
7 emotions 93%
Gunes & Piccardi(2009)
Head, hands, body 10 172 DT, BN,SVM,ANN,AdaBoost
12 emotions 85%
Sanchez et al.(2010)
Face 52 84 SVM 6 emotions 95%
Xiao et al.(2011)
Face 210 4,320 ANN,SVM
6 emotions 97%
Note. Abbreviations are explained in Figure 1.
such as ‘‘uuuuh’’ (Petridis & Pantic, 2011). However, not all of these studies employed
machine learning techniques. Moreover, the specific techniques employed for classi-
fying these nonlinguistic utterances have not been adopted in speech-based emotion
recognition in general.
Similar to vision-based approaches, audio-based emotion recognition suffers
from environmental noise (e.g., from a radio or conversations in the background).
Although ubiquitous recording of sound could also cancel out some of the noise, such
an approach is challenging. Therefore, similar to vision-based emotion recognition,
audio-based emotion recognition is difficult when conducted outside a controlled
setting, as the measured signals contain more noise.
For decades audio-based emotion recognition has been conducted with a limited
set of features (� 64), without the use of any feature selection or reduction; see
Figure 3. For representative reviews, we refer to K. R. Scherer (2003), Ververidis and
Kotropoulos (2006), and Koolagudi and Rao (2012). During the last 3 years, more
often a brute force strategy was employed (Schuller, Batliner, Steidl, & Seppi, 2011),
using hundreds or even thousands of features (Tawari & Trivedi, 2010; Wu, Falk, &
Chan, 2011; see also Figure 3). In parallel with the increase of the number of features
used, feature selection/reduction strategies started to be applied in order to overcome
overfitting and help selecting the most useful features.
Dow
nloa
ded
by [
Uni
vers
iteit
Tw
ente
] at
04:
13 0
3 A
ugus
t 201
3

486 Janssen et al.
FIGURE 3. Review of 9 machine learning studies employing speech to recognize emotions.
Reference Ss Features Functions Targets Perf
Banse & Scherer(1996)
12 12 humans 14 emotions 48%
18 LRM, LDA 14 emotions 25%Oudeyer
(2003)6 8 humans 5 emotions 77%
4 emotions 89%200 kNN, DT,
ANN, K*,LRM, SVM,VFI, DT, NB
4 emotions 96%
Morrison et al.(2007)
11 38 SVM, kNN,ANN, NB,K*, DT
6 emotions 73%
Scherer et al.(2009)
10 200 kNN 7 emotions 70%
20 humans 85%Luengo et al.
(2010)10 383 SVM, GMM 7 emotions 78%
Tawari & Trivedi(2010)
10 1,054 SVM 7 emotions 83%
4 1,054 SVM 3 emotions 88%Sobol-Shikler &
Robinson (2010)10 173 DT, SVM 8 emotions 75%
Van den Broek et al.(2011b)
25 65 LRM SUD scale 83%
Wu et al.(2011)
10 442 SVM 7 emotions 92%
Note. Abbreviations are explained in Figure 1.
It is noteworthy that in several studies professional actors participated who
perhaps expressed emotions in a rather stereotypical, not necessarily natural, manner
(Wilting, Krahmer, & Swerts, 2006). Moreover, it should also be noted that in speech-
based emotion recognition, next to artificial classifiers, humans sometimes labeled
the data. Speech-based human emotion recognition rates range from 48 to 89% (see
also Figure 3). Machine recognition rates vary considerably from Banse and Scherer
(1996), who reported up to 40% correct classification on 14 emotions, to Wu et al.
(2011), who reported 92% correct classification for seven emotions. In between lay the
results reported by Schuller et al. (2011) on the InterSpeech 2009 emotion challenge:
71% (two classes) and 44% (five classes).
2.3. Physiology-Based Emotion Recognition
A broad range of physiological signals have been used for emotion recogni-
tion, for example, cardiovascular activity (i.e., electrocardiogram [ECG] and blood
volume pulse), respiration, electrodermal activity (EDA), and facial muscle activity
Dow
nloa
ded
by [
Uni
vers
iteit
Tw
ente
] at
04:
13 0
3 A
ugus
t 201
3

Machines Outperform Laypersons in Recognizing Emotions 487
(i.e., fEMG); see also Figure 4. The choice of the physiological signal(s) to be used
depends on both the area of application (e.g., depending on which sensors can
be unobtrusively incorporated in a device) and the information that needs to be
extracted from them. In addition, a delay between the actual emotional change and
the resulting change in the recorded physiological signal has to be taken into account
(Van den Broek, Janssen, Westerink, & Healey, 2009). Moreover, physiological signals
differ significantly between individuals, which is why personalized approaches have
been shown to provide the best performance (J. Kim & André, 2008). Furthermore,
measurements with physiological sensors can be unreliable due to movement artifacts
and differences in bodily position. More problematic, people’s physiology is influenced
by a variety of factors unrelated to emotions (Cacioppo & Tassinary, 1990), some with
an internal (e.g., cognitive effort) and some with an external origin (e.g., temperature
changes). Nevertheless, physiological recordings are gaining in popularity as the
sensors become more and more sophisticated and their integration in other products
can now easily be realized (M. Chen, Gonzalez, Vasilakos, Cao, & Leung, 2011).
FIGURE 4. Review of 10 machine learning studies employing different physiological signalsto recognize emotions.
Reference Signals Ss Features Function Targets Perf
Sinha & Parsons(1996)
M 27 18 LDA 2 emotions 86%
Picard et al.(2001)
C, E, R, M 1 40 LDA 8 emotions 81%
Kim et al.(2004)
C, E, S 175 SVM 3 emotions 73%
Lisetti & Nasoz(2004)
C, E, S 29 kNN,LDA,ANN
6 emotions 86%
Healey & Picard(2005)
C, E, R, M 9 22 LDA 3 stress levels 97%
Rani et al.(2006)
C, E, S, M, P 15 46 kNN,SVM,RT,BN
3 emotions 86%
Kim & André(2008)
C, E, M, R 3 110 LDA,EMDC
4 emotions 79%
Chanel et al.(2009)
C, E, R 11 18 3 emotions 66%
EEG 18,720 3 emotions 73%C, E, R, EEG 18,738 3 emotions 70%
Hosseini et al.(2010)
C, E, R 15 38 SVM 2 arousal levels 77%
EEG 15 21 LDA,SVM
2 arousal levels 85%
Van den Broeket al. (2010)
E, M 21 10 kNN,SVM,ANN
4 emotions 61%
Note. Abbreviations are explained in Figure 1.
Dow
nloa
ded
by [
Uni
vers
iteit
Tw
ente
] at
04:
13 0
3 A
ugus
t 201
3

488 Janssen et al.
Figure 4 presents a review of key articles in this area of affective computing
published throughout the last decade. In 2001, Picard et al. published their pioneering
study with 81% correct classification on eight emotions, using linear discriminant
analysis. Their study included multiple physiological signals but only one subject to
whom the complete classification processing pipeline was tailored. In the decade that
followed this study, the robustness of classification across participants was addressed.
J. Kim and André (2008) reported 70% correct classification on four emotions using
a generic classifier and 95% correct classification when employing a personalized
classifier. Most recent studies address generic classifiers that are applied using multiple
participants; see Figure 4. Most studies discriminate between two and four (categories
of) emotions and achieve a correct classification in the range of 60 to more than 90%.
2.4. Multimodal Emotion Recognition
As is illustrated in Figure 5, to our knowledge the three modalities have not
been combined for emotion recognition purposes. Vision and audio-based emotion
FIGURE 5. Review of 9 machine learning studies employing multiple modalities to recognizeemotions.
Reference Signals Ss Features Functions Targets Perf
Tartter(1980)
Vi, Sp 6 12 humans 2 emo 71%
Silva et al.(1997)
Vi 2 18 humans 2 emo 75%
Sp 60%Vi, Sp 6 emo 21%
L. S. Chenet al. (1998)
Vi 2 15 kNN,GMM
6 emo 69%
Sp 16 75%Vi, Sp 31 97%
Kim & André(2006)
C, E, R, M, S 3 77 LDA 4 emo 51%
Sp 61 54%C, E, R, M, S, Sp 138 55%
Kapoor et al.(2007)
Mo, Vi, Pre, E 24 14 kNN,SVM,GP
2 emo 79%
Wang & Guan(2008)
Vi, Sp 8 153 GMM,kNN,ANN,LDA
6 emo 82%
C.-Y. Changet al. (2009)
C, E, T, Vi 15 ANN 4 emo 95%
Petridis & Pantic(2011)
Vi, Sp 15 61 ANN 2 emo 98%
Van den Broek(2011)
C, Sp 32 4 ANOVA 6 emo 90%
Note. Abbreviations are explained in Figure 1.
Dow
nloa
ded
by [
Uni
vers
iteit
Tw
ente
] at
04:
13 0
3 A
ugus
t 201
3

Machines Outperform Laypersons in Recognizing Emotions 489
recognition have been combined several times, and several review papers exist that
integrated both modalities (Cowie et al., 2001; Lisetti & Nasoz, 2004; Pantic et al.,
2011; Pantic & Rothkrantz, 2003; Zeng et al., 2009). Nonetheless, physiological signals
are hardly combined with other modalities. Only two groups have published on the
combination of audio; in both cases it concerned speech, and physiological signals
(J. Kim, André, Rehm, Vogt, & Wagner, 2005; Van den Broek, 2013; see Figure 5).
As far as we know, only two publications exist on the combination of vision and
physiological signals (Bailenson et al., 2008; Kapoor, Burleson, & Picard, 2007).
The publications that do report on multimodal affective computing incorporated
few subjects. Exceptions are the works of Kapoor et al. (2007) and Van den Broek
(2013), which included, respectively, 24 and 32 subjects, which is more in line
with the studies on unimodal affect recognition (cf. Figures 2–4). The number of
features extracted from the multiple signals differs significantly, ranging from 4
(Van den Broek, 2013) to more than 1,000 (J. Kim et al., 2005). Moreover, it should
be noted that the number of emotions discriminated is small, ranging from two to
six; see Figure 5. This all suggests that work on multimodal affective computing is
still in a beginning stage.
The classification results on multimodal affective computing are ranging between
21 and 98%. Most studies report recognition accuraries between 50 and 70% correct
classification, which is slightly lower than the unimodal studies (cf. Figure 5 with
Figures 2–4). Most studies that do report higher classification rates have some
limitations. For example, Petridis and Pantic (2011) reported high classification rates,
but they discriminated only between regular speech and laughter. An exception to
this is L. S. Chen, Tao, Huang, Miyasato, and Nakatsu (1998), who reported a study
on two subjects with 97% correct classification among six emotion classes, using a
combination of speech- and vision-based emotion recognition.
2.5. Conclusion
Despite the large body of work on machine emotion recognition (see Figures 2–
5), the main conclusion of this review on affective computing has to be that it is
very difficult to compare results of the different studies. This difficulty stems from
the fact that the studies differ in many aspects, including the number of partici-
pants and features used, the type and number of target emotions they try to recognize,
and modalities they use. Therefore, studies with the highest recognition rates do not
necessarily employ the best generic machine emotion recognition approaches. Easier
comparison between studies could be realized by creating a benchmark. A benchmark
could help by identifying approaches to machine emotion recognition that work and
approaches that do not work well. In turn, this would provide the means to improve
performance over time.
Perhaps due to the complexity of unimodal emotion recognition, multimodal
expression of emotions has been hardly touched upon. Few studies employed mul-
timodal emotion recognition, and some of the studies that did employ multimodal
emotion recognition did not focus on a machine learning component (Van den Broek,
Dow
nloa
ded
by [
Uni
vers
iteit
Tw
ente
] at
04:
13 0
3 A
ugus
t 201
3

490 Janssen et al.
2013; Van den Broek, Schut, Westerink, & Tuinenbreijer, 2009). To keep the field of
affective computing moving forward, we stress the importance of benchmarking the
techniques employed and combining multiple modalities. Against this background,
this section presents a series of studies that create a fundamental benchmark, a direct
comparison between man and machine using and combining the three modalities of
speech, vision, and physiological signals. For this we need to gather a data set
of emotions including all three modalities, which is described next.
3. DATA GATHERING
Stimuli are necessary to test how well humans and machines are able to recognize
emotions. Therefore, the first step of this research was a trial in which we collected
self-reports of experienced emotions, physiological recordings, speech, and facial
expressions from several people in various emotional states. As discussed before,
it is key to generate ecologically valid emotional responses so that our results can
be generalized to situations outside the lab. For this, we employed autobiographical
recollection because (a) it is a very strong emotion inducer (Levenson, Carstensen,
Friesen, & Ekman, 1991; Van den Broek, van der Sluis, & Dijkstra, 2011b; Zaki,
Weber, Bolger, & Ochsner, 2009); (b) it is likely to generate more ecologically
valid emotional responses compared to acted emotions that are sometimes used
for emotion recognition research (e.g., Picard et al., 2001); and (c) it involves speech
whereas many passive induction techniques do not involve the participants having
to speak (e.g., emotion induction through the presentation of emotionally charged
pictures).
3.1. Experimental Setup
Participants and Design
Participants were eight women and nine men aged 18 to 26 (M D 21.1), who
received €25 for their participation. All participants were undergraduates at a Dutch
university and were native Dutch speakers. None of the participants reported any
cardiovascular problems. The order of the within-participant factor Emotion type
(happy, sad, angry, relaxed, and neutral) was counterbalanced as well as possible over
the participants. Two participants were later dropped, one because of overly short
collected data and one for not granting us permission to use the collected data for
our intended purposes.
Materials
Physiological recordings were done with a Mobi-8 from TMS International. EDA
was measured with two Velcro strips with dry electrodes strapped around the distal
phalanx of the index and ring finger of the nondominant hand. The EDA signal was
Dow
nloa
ded
by [
Uni
vers
iteit
Tw
ente
] at
04:
13 0
3 A
ugus
t 201
3

Machines Outperform Laypersons in Recognizing Emotions 491
sampled at 128 Hz. Skin temperature (ST) was measured with a thermistor strapped
with medical adhesive tape to the distal phalanx of the little finger of the nondominant
hand. The ST signal was sampled at 128 Hz. Respiration was measured with a gauge
band positioned over the clothes around the chest at a sampling frequency of 128 Hz.
An electrocardiogram was taken at 1024 Hz using Ag/AgCl electrodes in the standard
Lead-II placement.
Facial expressions were recorded using a Logitec Quickcam webcam at 25 fps
with a resolution of 640 � 480 pixels. The webcam was positioned at the top of
the computer screen that the participants were facing. Audio was recorded using
a Sennheiser MZT 100 microphone positioned on the desk the participants were
sitting at.
The entire experiment was done on a computer with the participants sitting
behind a desk that held the computer screen, keyboard and mouse, microphone, and
webcam. The experimenter was in a control room next to the room the participants
were in.
Procedure
After arriving in the lab, participants signed an informed consent form. In this
informed consent, we explicitly told them that their data would not be shown to
other people to make sure this would not limit their emotional expressions. Only at
the end of the experiment did we debrief them about the true intentions we had for
using data and we asked them permission to show the recordings we made to other
people. One participant did not consent to this, and his data were therefore excluded
from the human emotion recognition experiments described later.
In the first phase of the experiment, participants were asked to recall (from their
personal experience) two events each that made them feel extremely happy, relaxed,
sad, and angry (i.e., eight events in total). They were also asked to recall getting up
this morning and going home last evening to provide two possibly neutral events.
Subsequently, they were asked to write one paragraph about each of the 10 events,
shortly describing the event and their feelings during the event. Participants provided
a title and rated each event on their own emotional intensity (very weak to very intense),
valence (very unpleasant to very pleasant), and arousal (very relaxed to very aroused) during
the event on 9-point Likert-type scales. The experimenter selected one of two events
based on the best matching valence and arousal ratings the participants gave to their
feelings during the event (e.g., for relaxation the experimenter selected the events
that were highest in valence and lowest in arousal). When the valence and arousal
ratings were the same for both events, the one with the highest emotional intensity
was selected (except for the neutral state, where the one with the lowest neutral
intensity was selected). This first phase took 30 to 45 min.
In the second phase, the experimenter attached the physiological sensors and
checked the signals visually. Subsequently, two individual difference measures were
administered. (These questionnaires on emotional expressiveness are not relevant for
the current article and therefore not further discussed.)
Dow
nloa
ded
by [
Uni
vers
iteit
Tw
ente
] at
04:
13 0
3 A
ugus
t 201
3

492 Janssen et al.
In the third phase, we used autobiographical recollection to induce the five
emotions in the participants. For each of the five emotions, the participants first
watched a 5-min aquatic movie to make sure they started each condition in the same
neutral state (Piferi, Kline, Younger, & Lawler, 2000). After this baseline video, the
participant turned over a piece of paper with the title of one of the selected events
they described earlier. They were instructed to take a minute to recall the event and try
to relive their feelings during the event. When they felt they were ready, they pressed a
continue button and described (in Dutch) the event and their feelings during the event
in 2 to 3 min. After each description they were told to rate their feelings during the
event disclosure on emotional intensity (very weak to very intense), valence (very unpleasant
to very pleasant), and arousal (very relaxed to very aroused) on 9-point Likert-type scales.
Instructions explicitly stated that they had to rate their feelings during the disclosure
of the event and not during the event itself. This process was repeated for all five
emotions.
In the final phase, after all five events were described, participants were presented
with both audio and video of each of the recordings we made of their disclosure.
While watching the recording, participants had to continuously rate how they felt
during the recording on a 9-point Likert-type scale using the left and right arrow key.
This is a validated method of emotional state assessment (Levenson & Ruef, 1992).
Half of the participants first rated their arousal on all five movies and then their
valence, whereas this was done vice versa for the other half of the participants.
3.2. Results
Duration
Duration of the disclosures of one of the participants was discarded because it
lasted only 39 s. The mean duration of the remaining disclosures was 141 s (SE D
18 s). A repeated measures analysis of variance (ANOVA; Huyn Feldt corrected
to compensate for violation of the sphericity assumption) showed differences in
duration between the five emotion types, F(4, 32) D 4.664, p < .02, �2 D .250. Post
hoc comparisons showed that relaxed (M D 100 s) and neutral (M D 85 s) emotion
disclosures were shorter than angry (M D 180 s) and sad (M D 159 s) disclosures (p <
.05). The duration of happy disclosures (M D 102 s) did not significantly differ from
the other durations (all p > .05). Furthermore, the duration of relaxed and neutral
and the duration of angry and sad disclosures did not significantly differ (p > .10).
Self-Report Ratings
To check if the emotion induction was successful we analyzed the self-report
ratings taken directly after each disclosure. Figure 6 presents the aggregated self-
report ratings of arousal and valence for each of the elicited emotions. A repeated
measures ANOVA (Huyn Feldt) confirmed effects of Emotion type on valence, F(3,
46) D 24.847, p < .001, �2D .62, arousal, F(4, 54) D 14.935, p < .001, �2
D .50,
Dow
nloa
ded
by [
Uni
vers
iteit
Tw
ente
] at
04:
13 0
3 A
ugus
t 201
3

Machines Outperform Laypersons in Recognizing Emotions 493
FIGURE 6. Mean arousal and valence ratings by the disclosers for each of the five emotion
types.
Note. Error bars depict ˙ SE.
and emotional intensity, F(4, 60) D 7.975, p < .001, �2D .35. Pairwise comparisons
showed that emotional intensity was lower in the neutral condition than in all the
other conditions (all p < .05), whereas all the other conditions did not significantly
differ in emotional intensity (all p > .10). Valence was higher in the happy and relaxed
conditions than in all the other conditions (p < .05) and valence was lower in the
sad and angry conditions than in the other conditions (p < .05). Happy and relaxed,
and sad and angry, respectively, did not significantly differ on self-reported valence
(p > .05). Arousal was higher in the angry condition compared to happy, relaxed, and
neutral (all p < .05) and there was a trend with sad (p < .07). Happy and sad were
both higher in arousal than neutral and relaxed (all p < .05) but did not differ from
each other (p > .10). Neutral and Relaxed did not differ in arousal (p > .10).
As an extra manipulation check, we also analyzed the means of the continuous
ratings while participants reviewed the recordings of their own disclosures. These
showed the same patterns as the overall ratings. A repeated measures ANOVA (Huyn
Feldt) confirmed effects of Emotion type on valence, F(3, 45) D 30.383, p < .001,
�2D .69, and arousal, F(4, 56) D 8.972, p < .001, �2
D .40. Pairwise comparisons
show that valence was higher in the happy (M D 5.8) and relaxed (M D 5.7) compared
to all other conditions (p < .05). Valence was higher in the neutral (M D 4.0) condition
than in the angry and sad conditions (p < .05). The angry (M D 2.9) and sad (M D 2.2)
conditions did not differ in valence (p > .10). Arousal was lower in the relaxed (M D
Dow
nloa
ded
by [
Uni
vers
iteit
Tw
ente
] at
04:
13 0
3 A
ugus
t 201
3

494 Janssen et al.
2.6) and neutral (M D 3.3) conditions compared to all other conditions (p < .05).
There was a trend between angry (M D 5.1) and happy (M D 4.3) showing that arousal
in the happy condition might be lower than arousal in the angry condition. Arousal in
the sad (M D 4.6) condition did not differ from the angry and happy conditions.
3.3. Conclusion
The employed emotion elicitation for our data set was successful. Participants
disclosed around 2 min per emotion type, which we aimed for. Furthermore, the self-
reported valence and arousal were congruent with the disclosed emotion, except for
sadness. We expected sadness to be lower in arousal. The durations of the angry
and sad disclosures were slightly larger than those of the other emotion types.
Nonetheless, self-reported emotional intensity showed only a lower intensity for
neutral. In sum, all four emotions seem to be successfully elicited (with sadness
being more arousing than was expected), resulting in a data set of 85 physiological,
video, and audio recordings, covering five different emotions.
4. HUMAN BENCHMARK
To test how well humans are able to detect others’ emotions, we ran two
experiments in which humans watched the recordings of the disclosers and rated
how they thought the disclosers felt. In both experiments, we compared all three
combinations of the audio and video modalities (i.e., audio only, video only, and
audio plus video) in the recordings to see how the communication modality influences
emotion recognition performance. To get to a comparison on relatively equal terms
between human emotion recognition and machine emotion recognition, we wanted
to take out the semantic information in the recordings, as our computer algorithms
do not use semantic information contained in the speech. To that end, in the first
experiment, we used participants who could not understand Dutch but who spoke
a language similar to Dutch so that the emotional prosody in the language was
comparable. Therefore, we used American participants, as English is related to Dutch
and therefore unlikely to contain strong differences in vocal affect expressions (K. R.
Scherer, Banse, & Wallbott, 2001). Furthermore, we ran a second experiment in
which we used Dutch participants, to also test how well they perform on the emotion
recognition task with the semantic information available in addition to the nonverbal
and para-linguistic features.
4.1. Non-Dutch Experiment
Participants and Design
Participants were 22 female and 20 male undergraduates (N D 42) aged between
19 and 23 (M D 20.4) from an American West Coast university. None of the
Dow
nloa
ded
by [
Uni
vers
iteit
Tw
ente
] at
04:
13 0
3 A
ugus
t 201
3

Machines Outperform Laypersons in Recognizing Emotions 495
participants knew any of the disclosers in the data-gathering session, and none of
them spoke Dutch. Participants received course credit for their participation.
Modality (audio/video/audio and video) was administered as a between-par-
ticipant condition. Each participant received two blocks of five recordings. In one
block they rated valence and in the other block arousal of the discloser. The order of
the blocks was counterbalanced over the participants. Within each block there was a
recording of each of the five emotion types (happy/relaxed/angry/sad/neutral). The
order of the emotion types within each block was digram balanced (Wagenaar, 1969).
For every participant, each of the 10 recordings came from a different discloser.
Materials
Out of the 85 recordings made during the data-gathering experiment, we se-
lected a set of 40 recordings that had a variety of disclosers, had relatively similar
durations, contained each emotion type equally often, and had self-reported ratings
of the discloser that were congruent with the emotion type. These constraints left
50 recordings from which we randomly selected a subset of 40. A subset was selected
so that we would have the opportunity to collect multiple datapoints for one video
while maintaining the emotional variety in the data that we gathered. In other words,
each video would be presented to a number of different participants. We tried to select
recordings with similar durations to limit a possible confound of different durations
between the five emotion types.
Procedure
After consent for the experiment was obtained, depending on the condition,
participants were instructed that they would see and/or hear 10 recordings of persons
talking about an event from their own lives in Dutch. During the playback, it was
the participants’ task to pay careful attention to the recording. They also had to
continuously rate either the valence or the arousal of the person in the recording using
keyboard arrow keys. For the sake of clarity and brevity, however, these data are not
further reported in this article. Directly after each movie we asked the participants
to select the emotion that they thought was expressed in the recording. They could
choose from five categories corresponding to the five categories used for the data
gathering: happy, relaxed, sad, angry, and neutral. To make sure the participants did
not understand the disclosers and did not use any semantic information for their
judgments, we also asked them to describe what they thought the discloser was
talking about. One participant sometimes understood what the discloser was talking
about and was therefore removed from the sample. The entire experiment took about
30 min.
Results
To assess the emotion recognition performance, we compared the emotions
selected by the participants with the disclosed emotions. An ANOVA was run on
Dow
nloa
ded
by [
Uni
vers
iteit
Tw
ente
] at
04:
13 0
3 A
ugus
t 201
3

496 Janssen et al.
FIGURE 7. Confusion matrices for human emotion recognition by theAmerican participants for audio-only stimuli.
Predicted Emotion
Disclosed Emotion Happy Relaxed Sad Angry Neutral
Happy 25.9% 47.4% 10.4% 15.6% 0.0%Relaxed 14.1% 25.1% 28.6% 17.6% 14.1%Sad 24.4% 12.0% 24.4% 9.0% 30.3%Angry 50.0% 0.0% 0.0% 0.0% 50.0%Neutral 16.4% 12.8% 20.0% 29.0% 21.8%
Note. Average correct recognition rate is 22.7%.
FIGURE 8. Confusion matrices for human emotion recognition by theAmerican participants for video-only stimuli.
Predicted Emotion
Disclosed Emotion Happy Relaxed Sad Angry Neutral
Happy 32.0% 28.2% 0.0% 32.0% 7.7%Relaxed 28.0% 25.0% 18.5% 12.5% 15.5%Sad 13.2% 13.2% 34.7% 17.4% 21.6%Angry 0.0% 16.1% 25.3% 16.1% 41.4%Neutral 17.4% 17.4% 21.6% 21.6% 21.6%
Note. Average correct recognition rate is 26.1%.
FIGURE 9. Confusion matrices for human emotion recognition by theAmerican participants for video and audio stimuli.
Predicted Emotion
Disclosed Emotion Happy Relaxed Sad Angry Neutral
Happy 28.0% 34.4% 9.2% 12.4% 15.6%Relaxed 28.2% 32.3% 24.1% 8.2% 8.2%Sad 19.2% 7.9% 31.0% 15.3% 27.1%Angry 20.5% 10.3% 39.7% 20.5% 10.3%Neutral 5.9% 11.4% 14.3% 37.4% 31.5%
Note. Average correct recognition rate is 31.0%.
the average percentage of correct recognition per participant with modality (video
only/audio only/video and audio) as between-participant factor. Results did not show
a significant effect of modality, F(2, 39) D 1.18, p D .32, partial �2D 0.06. Correct
selection accuracy was 31.0% (SE D 4.7%) in the video and audio condition, 22.7%
(SE D 4.3%) in the audio-only condition, and 26.1% (SE D 4.5%) in the video-only
condition.
Confusion matrices can be found in Figures 7, 8, and 9. From those confusion
matrices, it can be seen that, in all conditions, angry had the lowest correct recognition
Dow
nloa
ded
by [
Uni
vers
iteit
Tw
ente
] at
04:
13 0
3 A
ugus
t 201
3

Machines Outperform Laypersons in Recognizing Emotions 497
rates. In the audio-only condition, angry was confused with happy and neutral. In the
other two conditions, angry was confused mostly with neutral and sad. In addition,
happy was mostly confused with relaxed. Relaxed was mostly confused with happy
and sad. Moreover, sad emotions were mostly confused with neutral, and neutral was
mostly confused with angry.
We also compared the result of each condition against the 20% a priori prob-
ability of randomly guessing the correct emotion class using one-sample one-tailed
t tests. Recognition in the video and audio condition is significantly higher than
chance, t(12) D 1.97, p < .05. Recognition in the video-only condition is marginally
higher than chance, t(12) D 1.53, p D .075. Recognition in the audio-only condition
was not significantly higher than chance (p > .20).
4.2. Dutch Experiment
Participants and Design
Participants were 12 female and 15 male undergraduates (N D 27) aged between
19 and 25 (M D 22.3) from a Dutch university. None of the participants knew any
of the disclosers in the data-gathering session, and all of them were native Dutch
speakers. Participants received €5 for participation. The materials and procedure were
the same as in the non-Dutch experiment. Participants were equally divided over the
three modality conditions: video only, audio only, video and audio.
Results
To assess the emotion recognition performance, we compared the emotions
selected by the participants with the disclosed emotions. An ANOVA was run on
the average correct percentage per participant with modality as between-participant
factor. Results showed a significant main effect of modality, F(2, 25) D 8.29, p <
.002, partial �2 D 0.43. Correct selection was highest in the audio-only condition,
with an accuracy of 58.2% (SE D 4.9%). The correct selection in the video and
audio condition was 47.9% (SE D 4.4%). Correct selection was lowest in the video-
only condition, with an accuracy of 35.7% (SE D 5.2%). Pairwise comparisons show
a significant effect when comparing the audio-only with the video-only condition
(p < .006). Marginally significant effects for the comparison of the video and audio
condition with the video-only condition (p D .09) and with the audio only condition
(p D .06) were found.
Confusion matrices can be found in Figures 10, 11, and 12. Across all three
conditions neutral and angry had the lowest recognition rates. Neutral was least often
confused with happy but was confused with all other emotion classes. Angry was
mostly confused with sadness. Happy was mostly confused with relaxed, and relaxed
was mostly confused with neutral.
We also compared the result of each condition against the 20% a priori prob-
ability of randomly guessing the correct emotion class using one-sample one-tailed
Dow
nloa
ded
by [
Uni
vers
iteit
Tw
ente
] at
04:
13 0
3 A
ugus
t 201
3

498 Janssen et al.
FIGURE 10. Confusion matrices for human emotion recognition of theDutch participants for video and audio stimuli.
Predicted Emotion
Disclosed Emotion Happy Relaxed Sad Angry Neutral
Happy 46.7% 33.3% 13.3% 0.0% 6.7%Relaxed 14.3% 64.3% 0.0% 7.1% 14.3%Sad 10.0% 0.0% 90.0% 0.0% 0.0%Angry 16.7% 0.0% 33.3% 25.0% 25.0%Neutral 7.7% 38.5% 23.1% 7.7% 23.1%
Note. Average correct recognition rate is 47.9%.
FIGURE 11. Confusion matrices for human emotion recognition of theDutch participants for video only.
Predicted Emotion
Disclosed Emotion Happy Relaxed Sad Angry Neutral
Happy 39.1% 21.7% 8.7% 4.3% 26.1%Relaxed 8.7% 34.8% 21.7% 0.0% 34.8%Sad 0.0% 6.3% 50.0% 12.5% 31.3%Angry 10.0% 10.0% 40.0% 30.0% 10.0%Neutral 21.1% 10.5% 15.8% 26.3% 26.3%
Note. Average correct recognition rate is 35.7%.
FIGURE 12. Confusion matrices for human emotion recognition of theDutch participants for audio only.
Predicted Emotion
Disclosed Emotion Happy Relaxed Sad Angry Neutral
Happy 68.4% 15.8% 5.3% 5.3% 5.3%Relaxed 16.7% 61.1% 5.6% 0.0% 26.7%Sad 0.0% 0.0% 91.7% 7.1% 0%Angry 5.9% 0.0% 29.4% 55.6% 5.9%Neutral 6.7% 6.7% 26.7% 29.4% 33.3%
Note. Average correct recognition rate is 62.8%.
t tests. Video and audio condition, t(7) D 12.78, p < .001; video-only condition,
t(9) D 2.60, p < .02; and audio-only condition, t(7) D 11.61, p < .001, all result
in significant differences with 20% a priori probability. Finally, we also compared
the video-only condition of the Dutch participants with the video-only condition
of the non-Dutch participants, as these were expected to lead to similar results. As
expected, no significant difference was found on a one-sample t test with a reference
value of 26.1%, t(9) D 1.61, p > .10.
Dow
nloa
ded
by [
Uni
vers
iteit
Tw
ente
] at
04:
13 0
3 A
ugus
t 201
3

Machines Outperform Laypersons in Recognizing Emotions 499
4.3. Discussion
For the non-Dutch sample, the video and audio condition results in the best
human emotion recognition performance, followed by the video-only condition, with
the worst performance for the audio-only conditions. This makes sense, considering
that the combination of audio and video contains the most information and is a more
common way of emotion communication than communication through either visual
or audio modalities only. Nonetheless, the recognition performances are only slightly
higher than random guessing, suggesting that recognition of affective state from verbal
reporting is a difficult task when no semantic or context information is present.
In the Dutch sample, the audio is much more valuable because for these
participants it also contains semantic information about the emotions described by
the disclosers. Hence, it makes sense that the audio-only condition leads to a much
higher performance than the video-only condition. The audio and video condition
results in a lower performance than the audio-only condition. This suggests that more
information does not necessarily lead to a better performance. Instead, it might be
the case that participants were less focused on the speech or were thrown off by a
perceived mismatch between the video and audio channels.
The relatively low emotion recognition performance we found differs from
results with acted data (e.g., K. R. Scherer et al., 2001). This is likely due to the
nature of the autobiographical recollection leading to less intense expressions but
more ecologically valid natural data (Zaki, Bolger, & Ochsner, 2009). Hence, the fact
that acted data often lead to better recognition rates leads us to believe that with
acted data, human emotion recognition performance may be overstated compared
to more naturalistic settings. We do believe that emotions were successfully induced
in our experiments, because self-reports at the disclosers suggested emotions were
relatively intense and clearly separable in the valence-arousal space and, for instance,
Zaki, Weber, et al. (2009) also got relatively strong emotional expressions using
autobiographical recollection in a nonsocial context.
There are some limitations to our approach. First of all, differences between the
two samples might also be due to cultural effects. In line with the classic FACS theory
of Ekman and Friesen (Ekman, 1992, 1999; Ekman & Friesen, 1978; Ekman et al.,
1983), this explanation should be regarded as unlikely. However, as was already stated
in the Background section, there is evidence for differences in facial expressions be-
tween cultures. Recently, a metareview has provided support for this position (Reisen-
zein, Studtmann, & Horstmann, 2013). So, indeed culture could be a source of variance
in the data acquired in this research. Moreover, this stresses that caution should be
taken in this discussion, and follow-up research on this issue needs to be encouraged.
Moreover, there also have been researchers who suggest that affective speech in
related languages like Dutch and English is very similar (K. R. Scherer et al., 2001).
This is also one of the reasons why we added the Dutch sample as an extra comparison
group with machine emotion recognition. Second, the emotional expressiveness of the
participants in the data-gathering session might have been limited because they were
not in a regular social context (Fischer, Manstead, & Zaalberg, 2003; Fridlund, 1991).
Dow
nloa
ded
by [
Uni
vers
iteit
Tw
ente
] at
04:
13 0
3 A
ugus
t 201
3

500 Janssen et al.
We did this to create a comparison on equal terms with machine emotion recognition
(often done in a nonsocial context as well). Third, video has limitations (e.g., in
terms of resolution and depth perception), compared to face-to-face interaction,
that might have decreased emotion recognition performance. However, again we
intentionally did this to create a video comparison on equal terms with machine
emotion recognition (with only video recordings to recognize emotions from).
Semantic information in the speech was absent for American participants, al-
lowing for a more equal comparison between human and machine recognition. Fur-
thermore, investigating emotional speech independent of the semantic information
might, in practice, be more realistic, as people can have emotions while talking not
about those emotions but about something else (e.g., in case they want to hide their
emotion). Taking the results of the Dutch and American samples together, it is seen
that in our data the value of the audio channel lies mainly in providing semantic
information. When audio is purely used for transmitting emotional prosody, facial
expressions are more informative emotion recognition channels for humans than
speech. Future research should be done to assess whether these effects are replicable
and generalizable.
5. MACHINE EMOTION RECOGNITION
In this section, we describe the results of training a machine on the data that we
gathered and see how well the trained machine performs on the emotion recognition
task. We extracted features from the video, audio, and physiological modalities as
input for the training from the same data set as was used to test human emotion
recognition. Subsequently, we let the machine predict the class of emotions from
which the features were extracted using two different statistical machine learning
techniques. We first describe the method in detail and then present the classification
results.
5.1. Method
The machine emotion recognition was investigated using video, audio, and
physiological data from the disclosers in the data-gathering experiment to investigate
whether the machine could classify these data into the five classes of emotions
induced. First, features were extracted for each modality separately. Second, for the
physiology features baseline correction was applied, as their baselines can change over
time. Third, modalities were fused using feature-level fusion (i.e., by concatenating
feature vectors of the different modalities). Fourth, feature selection was applied to
find the most useful features for separating the emotion classes. Finally, classification
was done for each modality separately and for every combination of the three different
modalities, using a support vector machine (SVM) and a multilayer perceptron (MLP).
This process is schematically depicted in Figure 13.
Dow
nloa
ded
by [
Uni
vers
iteit
Tw
ente
] at
04:
13 0
3 A
ugus
t 201
3

Machines Outperform Laypersons in Recognizing Emotions 501
FIGURE 13. Schematic overview of the preprocessing applied.
Feature Extraction
For feature extraction, a running window of 10 s was used, over which features
were extracted. Each step, the window was shifted 10 s, preventing subsequent time
windows from overlapping. A 10-s window was chosen as this relates to the speed
with which emotional expressions can change (Cowie et al., 2001). The features were
chosen partly based on the review presented before and partly based on what the
software we used extracted for us.
Facial expressions were analyzed using the OKAO Vision software package from
OMRON Corporation (Ahn, Bailenson, Fox, & Jabon, 2010). This software tracks
37 points on the face, primarily around the mouth and eyes and general features of
the head like mouth and eye openness, and the yaw, pitch, and roll of the head. From
the extracted points and features, motion features were generated by computing the
difference between two sequential feature values (Fasel & Luettin, 2003). These values
were extracted at 15 frames per second and then averaged for every 10 s of data. This
gave, in total, 42 facial feature values for each 10 s of data.
Audio was obtained from the recorded videos. For extracting audio features,
the software PRAAT (Boersma & Weenink, 2012) was used. The features we ex-
tracted were based on features that have often been used in the literature. First, we
extracted pitch, which is often referred to as fundamental frequency F0 and represents
vocal-cord vibration as a function of time (Boersma & Weenink, 2012). Pitch can,
for example, be used to distinguish happiness or sadness from a neutral state (Cowie
& Cornelius, 2003). We also extracted intensity, which represents the speech signal
intensity in dB (Boersma & Weenink, 2012). Third, we extracted formants which
describe vocal resonances at specific frequencies in the frequency spectrum. Each
formant has its own frequency range. The use of formants has also been found useful
for emotion classification (Ververidis & Kotropoulos, 2006). Nygaard and Lunders
(2002) linked sadness to increased jitter and shimmer values, which we extracted as
well: jitter is a term for the frequency variability of the pitch signal, and shimmer
describes the amplitude variability of the pitch signal (Boersma & Weenink, 2012).
The fraction of unvoiced 0.01-s frames in the pitch signal was also used as a feature
value (Busso et al., 2004). Finally, we used the degree of voice breaks, which is the
relative duration of breaks between the voiced frames (Boersma & Weenink, 2012).
This resulted in 12 audio features, namely, mean and standard deviation of pitch, mean
and standard deviation of intensity, formants F1 to F4, jitter, shimmer, the fraction
unvoiced frames, and the degree of voice breaks. These are features that are commonly
used in machine emotion recognition studies (Schuller, Batliner, Steidl, & Seppi, 2011).
The physiological signals from which features were extracted were EDA, ST,
respiration, and ECG. EDA and ST were preprocessed with a 0.5 Hz low pass filter
Dow
nloa
ded
by [
Uni
vers
iteit
Tw
ente
] at
04:
13 0
3 A
ugus
t 201
3

502 Janssen et al.
and downsampled to 2 Hz. Subsequently, mean, standard deviation, and slope were
calculated over each 10-s window. For the EDA signal, we also extracted the number
of skin conductance responses using the SCRGauge algorithm (Boucsein, 1992). The
respiration signal was filtered with a low pass filter (cutoff frequency: 0.5 Hz) before
individual breaths were extracted using a local min/max filter based on the method
of Lemire (2006), from which the respiration rate was derived for each 10-s window.
From the ECG signal, first the interbeat intervals (IBIs) were detected using pattern
matching. Subsequently, mean, standard deviation, and root mean squared successive
differences were calculated as time domain heart rate (variability) measures (Berntson
et al., 1997). The IBIs were also transformed to the frequency domain from which
the power in the low-frequency range (0.05 Hz–0.15 Hz), in the high-frequency range
(0.15 Hz–0.40 Hz), and the ratio between low-frequency and high-frequency power
were calculated (Berntson et al., 1997). For these frequency-domain calculations we
used 30-s windows instead of 10-s windows as the lower frequency components have
cycle times larger than 10 s. Thirty s is thought to be the minimum duration to get
reliable heart rate variability estimates (Porges et al., 1997). The 10-s and 30-s time
windows were aligned such that they shared the same start time. In total we derived
14 physiological features.
This resulted in 715 feature vectors. Each feature vector was labeled with the
emotion that was induced in the recordings from which the corresponding time
window was taken. Of all the feature vectors, 135 (19%) stemmed from recordings to
be classified as happy, 110 (15%) from recordings to be classified as relaxed, 179 (25%)
from recordings to be classified as sad, 195 (27%) from recordings to be classified as
angry, and 96 (13%) from recordings to be classified as neutral. The differences in the
number of feature vectors per class originate from different lengths of the recordings,
hence the number of time windows derived.
Preprocessing and Normalization
Baseline correction was applied to physiological signals as physiological baseline
values may change over time (e.g., between the different disclosures we obtained).
During the data gathering, each emotion recording was preceded by a 5-min baseline.
We extracted the mean and standard deviation from the last 90 s of this baseline period,
to make sure effects of the previous emotion disclosure were not included in the
baseline values. The features from the subsequent emotion recording were baseline
corrected using a standard z transformation, by subtracting the baseline mean from
each data point and dividing each point by the baseline standard deviation (Boucsein,
1992). Audio and video signals did not receive specific preprocessing before features
were extracted.
Finally, all the features from audio, video, and physiological data were scaled in
[�1, 1], by subtracting the minimum value and dividing by the difference between
the maximum and minimum value of each feature. This was done to prevent features
with large numeric values from dominating those with smaller numeric values (C.-C.
Chang & Lin, 2011).
Dow
nloa
ded
by [
Uni
vers
iteit
Tw
ente
] at
04:
13 0
3 A
ugus
t 201
3

Machines Outperform Laypersons in Recognizing Emotions 503
Feature Selection
Not all features contribute equally to dividing the different emotion classes.
To find the features that best separate the five emotion classes, we applied feature
selection. Two feature selection methods were used. The first method was to select
(combinations of) the different modalities (by hand). In this case, all features from
a single modality were either included or excluded in the classification process. This
way, we compared all different modalities and all combinations of modalities with
each other, leading to seven different combinations.
The second feature selection method was an automated method using a wrapper
approach for finding the best feature subset out of the features of all modalities
combined. A wrapper is constructed from a search algorithm for finding the optimal
subset and a classification algorithm for evaluating the quality of each subset (Kohavi
& John, 1997). The type of classification algorithms were the same algorithms as used
in the final evaluation. Moreover, as in the final evaluation, the classification algorithms
employed fivefold cross-validation. The search algorithms that were selected were best
first search and genetic search (Russell, 2003). In short, best first search adapts the
feature set by adding or removing a feature of the feature set that performed best up
to that moment and evaluates the new set. Genetic search makes random adjustments
(mutations) to the feature set, evaluates those adjustments against the nonadjusted
set, and continuous with the best performing set of features.
Classification
Two classifiers were used: a SVM with the radial basis function kernel, and a
MLP. These two techniques were selected based on their successful application in
a wide variety of applications (Bishop, 2006). Furthermore, as shown in Figures 2
to 5, they constitute two of the most popular techniques used for classification of
emotions. For the SVM, the LIBSVM implementation (C.-C. Chang & Lin, 2011) was
used, with cost and gamma values set to 100 and 0.1, respectively, as recommended
by C.-C. Chang and Lin (2011). For the MLP, the WEKA implementation with its
default settings was used (Witten & Frank, 2005). The number of hidden layers was
one. The number of neurons in the hidden layer was determined by rounding down
the result of (Nf C Nc)/2 where Nf depicts the number of features and Nc depicts the
number of classes. In addition, a sigmoid activation function was used. Learning rate
was set to 0.3, momentum was set to 0.2, and 500 epochs were used for training.
Cross-validation was done using five folds. Hence, the data were randomly split
into five equally sized parts. Five runs were done, and in each run a different part was
selected for testing and the classifier was trained on the data in the other four parts.
Finally, the results of testing recognition accuracies were averaged.
5.2. Results and Discussion
We trained the classifiers over the data of all participants, using SVM and MLP
classifiers with fivefold cross-validation. Different feature subsets were selected in two
Dow
nloa
ded
by [
Uni
vers
iteit
Tw
ente
] at
04:
13 0
3 A
ugus
t 201
3

504 Janssen et al.
ways: (a) based on different sets of the modalities (i.e., video, audio, and physiology)
that we used and (b) based on wrapper selection techniques using genetic search, and
best first search. The overall results of the recognition accuracies of all these different
methods are presented in Figure 14.
Comparing the different modalities shows that audio alone performs worst with
39% (SVM) and 37% (MLP) recognition accuracies. Video performs better with 59%
(SVM) and 54% (MLP) recognition accuracies. Combining audio and video features
results in 65% (SVM) and 54% (MLP) recognition accuracies. Based on the SVM, the
physiological features outperform the audio and video features with 76% (SVM) and
53% (MLP). Combining physiological and audio features results in 72% (SVM)
and 56% (MLP). For the SVM, this is lower than using the physiological features alone,
suggesting that the audio features actually introduce noise, making it more difficult
to train the classifier. Combining physiological features with video features shows an
increase in recognition performance to 79% (SVM) and 74% (MLP). This indicates
that physiological information is a useful source for machine emotion recognition.
We further investigated the contribution of different physiological modalities by
classifying emotions using SVMs and selecting specific sets of features of the four
physiological signals. The results of this are depicted in Figure 15. Classification with
all features gave a classification performance of 76%, whereas classification with the
respiration features left out gave a performance of 78%. This suggests that respiration
features might be the least useful, as including them actually decreased classification
performance. This might be because they are confounded by the speaking of the
FIGURE 14. Recognition accuracy for the different methods of machine learning techniques.
Note. The x-axis depicts the different combinations of features and modalities. The y-axis
depicts the recognition accuracy as obtained by using fivefold cross-validation. Bars for the
support vector machine results are black, and bars for the multilayer perceptronresults are white.
Dow
nloa
ded
by [
Uni
vers
iteit
Tw
ente
] at
04:
13 0
3 A
ugus
t 201
3
Machines Outperform Laypersons in Recognizing Emotions 505
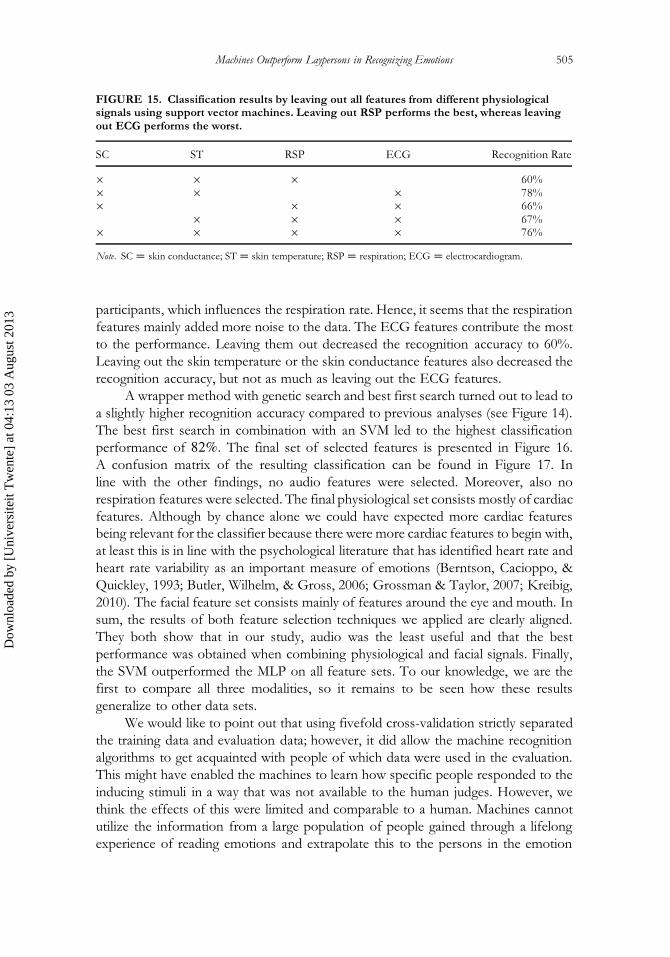
FIGURE 15. Classification results by leaving out all features from different physiologicalsignals using support vector machines. Leaving out RSP performs the best, whereas leavingout ECG performs the worst.
SC ST RSP ECG Recognition Rate
� � � 60%� � � 78%� � � 66%
� � � 67%� � � � 76%
Note. SC D skin conductance; ST D skin temperature; RSP D respiration; ECG D electrocardiogram.
participants, which influences the respiration rate. Hence, it seems that the respiration
features mainly added more noise to the data. The ECG features contribute the most
to the performance. Leaving them out decreased the recognition accuracy to 60%.
Leaving out the skin temperature or the skin conductance features also decreased the
recognition accuracy, but not as much as leaving out the ECG features.
A wrapper method with genetic search and best first search turned out to lead to
a slightly higher recognition accuracy compared to previous analyses (see Figure 14).
The best first search in combination with an SVM led to the highest classification
performance of 82%. The final set of selected features is presented in Figure 16.
A confusion matrix of the resulting classification can be found in Figure 17. In
line with the other findings, no audio features were selected. Moreover, also no
respiration features were selected. The final physiological set consists mostly of cardiac
features. Although by chance alone we could have expected more cardiac features
being relevant for the classifier because there were more cardiac features to begin with,
at least this is in line with the psychological literature that has identified heart rate and
heart rate variability as an important measure of emotions (Berntson, Cacioppo, &
Quickley, 1993; Butler, Wilhelm, & Gross, 2006; Grossman & Taylor, 2007; Kreibig,
2010). The facial feature set consists mainly of features around the eye and mouth. In
sum, the results of both feature selection techniques we applied are clearly aligned.
They both show that in our study, audio was the least useful and that the best
performance was obtained when combining physiological and facial signals. Finally,
the SVM outperformed the MLP on all feature sets. To our knowledge, we are the
first to compare all three modalities, so it remains to be seen how these results
generalize to other data sets.
We would like to point out that using fivefold cross-validation strictly separated
the training data and evaluation data; however, it did allow the machine recognition
algorithms to get acquainted with people of which data were used in the evaluation.
This might have enabled the machines to learn how specific people responded to the
inducing stimuli in a way that was not available to the human judges. However, we
think the effects of this were limited and comparable to a human. Machines cannot
utilize the information from a large population of people gained through a lifelong
experience of reading emotions and extrapolate this to the persons in the emotion
Dow
nloa
ded
by [
Uni
vers
iteit
Tw
ente
] at
04:
13 0
3 A
ugus
t 201
3

506 Janssen et al.
FIGURE 16. The features selected for the best (SVM) classificationperformance. The features were selected using best first search. Audio featureswere included in the search space but not selected in the best performing set.
Physiological Features Video Features
M SC ConfidenceNo. of SC responses Standard deviation of faceM ST Right eye ratioSD of ST Mouth ratioSlope ST YawM HR Right pupil y-valueLF power HRV Left pupil y-valueHF power HRV Lower lip center y-valueRMSSD HRV Right mouth corner x-valueSDNN HRV Right mouth corner y-value
Left mouth corner x-valueLeft mouth corner y-valueLeft outer eye corner y-valueRight outer eye corner x-valueLeft lower lip y-valueGaze tiltGaze panLeft eye opennessMouth openness
Note. SC D skin conductance; ST D skin temperature; HR D heart rate; HRV D heart rate
variability; LF D low-frequency (0.05 Hz–0.15 Hz); HF D high-frequency (0.15 Hz–0.40 Hz);
RMSSD D root mean squared successive differences; SDNN D standard deviation IBI intervals.
recognition task at hand, like humans can. To compensate for this human advantage,
this type of cross-validation allows some acquaintance to the emotional responses of
the people in the task at hand while still remaining a strict separation of training and
evaluation data.
These results illustrate the advantages of combining different modalities for
machine emotion recognition. As expected, machine emotion recognition was better
when combinations of modalities were used. Where we used a controlled laboratory
FIGURE 17. Confusion matrix for the classification results of the support vector machinewith the best first search, which was the best classification method with 82% recognitionaccuracy. Rows depict the emotion predicted by the computer, and columns depict the actualdisclosed emotion.
Disclosed Emotion
Disclosed Emotion Happy Relaxed Sad Angry Neutral
Happy 79% 7% 7% 6% 2%Relaxed 7% 79% 5% 7% 1%Sad 2% 2% 89% 4% 8%Angry 4% 2% 4% 87% 3%Neutral 9% 2% 8% 10% 70%
Dow
nloa
ded
by [
Uni
vers
iteit
Tw
ente
] at
04:
13 0
3 A
ugus
t 201
3

Machines Outperform Laypersons in Recognizing Emotions 507
environment, the benefits of modality fusing might be even more pronounced in real-
world settings. In such contexts, measurements are less reliable and audio or video
signals could be degraded due to sensor or bandwidth limitations making multimodal
verification more important (Van den Broek, Janssen, et al., 2009). Therefore, we
think it may be worthwhile to further investigate multimodal emotion recognition by,
for instance, comparing different fusion (feature, classifier, or model-level fushion)
and synchronization techniques.
Another point that could further improve the machine emotion recognition
is to include temporal dynamics in the model (Van den Broek, Janssen, Healey, &
Van der Zwaag, 2010). In our analyses, we have dealt with this by taking short
time windows that are related to the temporal resolution of emotions (Cowie et al.,
2001). However, subsequent time windows are unlikely to be completely independent
from each other. For instance, the law of initial values (Wilder, 1967) suggests that
physiological changes are based on the current physiological level (e.g., heart rate
is more likely to decrease than increase when it is very high). Moreover, emotions
influence longer term moods. In turn, moods influence emotions. This way, specific
emotions can also have longer term affective influences, and subsequent emotions
might be related. Possible models to account for such temporal relationships are
dynamic Bayesian networks (Bishop, 2006) or time series analyses like autoregressive
or moving average models (Van den Broek, Sluis, & Dijkstra, 2011a, 2011b).
6. GENERAL DISCUSSION
It was our goal to compare human and machine emotion recognition using
facial expressions, speech, and physiological signals. For this, using autobiographical
recollection, we elicited five emotional states in participants while we recorded their
speech, facial expressions, and physiological signals. These recordings were shown to
others who had to estimate which of five emotions had been induced in the participant
in the recording. Subsequently, we used the same data to conduct machine emotion
recognition experiments with different statistical learning methods.
6.1. Machines Outperform Humans
When comparing the results of human and machine emotion recognition studies,
we can see that the machines performed better than humans did (e.g., 65% vs.
31% correct when using video and audio). Although we have seen many studies
attempting to train machines to recognize emotions, the recognition performances of
these studies have been difficult to interpret and compare. We show that machines
may perform much better than humans in situations where they are given access to
the same signals (i.e., video and audio). There are several potential reasons for the
fact that the machines outperform human emotion recognition. First, machines have
more time to process the input, whereas humans might have evolved to optimize
Dow
nloa
ded
by [
Uni
vers
iteit
Tw
ente
] at
04:
13 0
3 A
ugus
t 201
3

508 Janssen et al.
the speed with which they can detect emotions, as emotions are often used as
a warning system (Damasio, 1994). Furthermore, the machines might outperform
humans because humans are geared to detecting emotions expressed in a social context
(Fridlund, 1991). However, many affective computing applications are done outside
a social context, which led us to use data that were not gathered in a social context.
The machines might be better at handling such data, as they are trained specifically
to do so. The method of cross-validation used might have brought an advantage to
the machines. However, as previously discussed, this was chosen to compensate
for the human advantage of being able to extrapolate from a large population of people
gained through a lifelong experience of emotion recognition. Hence, the effects are
expected to be limited and the outcome comparable to humans. Finally, a lack of
motivation for accurately recognizing the emotions might have led the humans to
perform less accurately (Ickes, Gesn, & Graham, 2000). In contrast, for machines a
lack of motivation is not an important issue. In sum, machines have several benefits
over humans for recognizing emotions that can explain their performance differences.
More research is needed to see whether these results generalize to emotion recognition
of other and larger populations.
A few other studies have also made comparisons between human and machine
classification. For instance, Lien et al. (2000) showed that vision-based classification is
comparable to the interrater agreement of two human facial action coding specialists.
However, they focused on comparisons between computer and human experts and
not on emotion recognition by laypeople as we did. In addition, Nwe, Foo, and Silva
(2003) reported that machine classification algorithms outperform human classifiers
using speech-based emotion recognition. However, they relied on an acted emotion
corpus and used only three humans for recognition. Although those studies were
different from ours and focused on comparisons of only one modality, their findings
are in line with our results.
There were some differences between the human and machine emotion recog-
nition, which are outlined next. The humans in our experiment have emotion recog-
nition skills that generalize to a larger population than those of the machines, which
were specifically tailored to the set of disclosers used in our experiment. Furthermore,
the humans have had much more time and data to train their skills compared to the
machines. Hence, to be able to generalize our findings, future research could see
what results other contexts or corpora yield with human and machine comparisons.
Nonetheless, we tried to create ecologically valid conditions to have a valid comparison
between human and machine emotion recognition.
To create a comparison on equal terms, some people who expressed the emo-
tions spoke a different language from the ones who did the emotion recognition.
We established this condition on purpose, as machines cannot easily benefit from
understanding the semantics and context of spoken language. Moreover, we want to
be able to generalize our emotion recognition to the many situations in which semantic
information from speech is absent. Therefore, as an extra experimental control, we
also included a second sample that did speak Dutch. We used Dutch disclosers and
English recognizers as Dutch and English are related languages and emotional prosody
Dow
nloa
ded
by [
Uni
vers
iteit
Tw
ente
] at
04:
13 0
3 A
ugus
t 201
3

Machines Outperform Laypersons in Recognizing Emotions 509
is similar in those languages (K. R. Scherer et al., 2001). Hence, a cultural difference
in the interpretation of prosody would have been unlikely, and cultural differences
would only be observable in terms of differences in semantic interpretation. This effect
can be observed as the Dutch participants performed much better when they had
access to the semantic information of speech; however, they did still worse than the
machine emotion recognition. Furthermore, in absence of semantic interpretation
(i.e., comparing non-Dutch participants and machine learning), we observe similar
relative performances for the three conditions (audio, video, and audio plus video), as
best performance is obtained using both audio and video and worst performance is
obtained in the audio-only condition. This finding suggests that the audio and video
modalities had similar relative value for the humans as for the machines.
We have explored person-independent classification of emotions instead of
person-specific classification. We choose this approach because it relates to the wide
range of applications in which emotion recognition has to be used without calibration
to a specific user. Moreover, it was in line with the human emotion recognition as
the human recognizers also did not know the disclosers. Nonetheless, we know from
psychological studies that humans become better at recognizing others’ emotions
when they become more familiar with them (Ickes, 1997). Moreover, machine emotion
recognition studies have confirmed these findings by showing that person-specific
models improve recognition accuracy (Bailenson et al., 2008; J. Kim & André, 2008).
Hence, it might be worthwhile to further investigate the combinations of different
modalities and compare human and machine recognition in settings where both are
allowed to become familiar with the discloser.
The fact that machine emotion recognition outperformed human emotion recog-
nition leads to a few points for future research. Now that we have empirical data
suggesting that machine emotion recognition is at a high level compared to human
performance, we think that it is important to start transferring the successful emotion
recognition models into applications and see how well they perform in practice. This
also includes testing how well the machine learning algorithms perform outside the
lab, as the real-world contexts contain more noise than laboratory environments
and actual real-world performance is therefore likely to be lower in practice for the
machine emotion recognition. In contrast, humans might perform better in real-world
contexts because in those cases they can directly interact with the persons they are
trying to recognize the emotions from.
Humans seem to get a lot of information from context and semantics of speech.
This suggests that recent attempts to include semantics and context in emotion
recognition models are promising (Pantic et al., 2011). This could, for instance, be
done by employing speech recognition to analyze the semantic context of the speech.
Considering the importance of context, a useful approach might be to derive emotion
from stimuli that a person encounters (e.g., movies) to better predict how someone
reacts to that stimulus. Similarly, using information about the main purpose of the
interaction with the other person could substantially facilitate emotion recognition.
The reason why one is interacting may help to focus on a subset of emotions and
their intensities, give clues as to what people might try to show or hide, and to know
Dow
nloa
ded
by [
Uni
vers
iteit
Tw
ente
] at
04:
13 0
3 A
ugus
t 201
3

510 Janssen et al.
what kind of cues would be (in)appropriate for the situation. Incorporating these
approaches could further improve machine emotion recognition.
6.2. Physiology is a Promising Modality
Our results suggest that physiological signals are the most useful for recognizing
emotions. Within the physiological modalities, the ECG seems to be the most valuable
signal and respiration the least valuable signal. The finding that physiological signals
are useful for inferring emotions is not surprising, as there have been many theories
on emotion that have emphasized the role of physiological processes for emotions
(James, 1894; Prinz, 2004). The low recognition performances for speech and facial
expressions might be explained by the fact that our results come from data gathered in
a nonsocial context. In a social context people might be more expressive and speech
and facial expressions might be more valuable (Bucy & Bradley, 2004; Fischer et al.,
2003; Fridlund, 1991). Moreover, when machines would be able to extract semantic
information from speech, the speech signal might also become more valuable, as
can be derived from the results of our Dutch participants who could understand
the Dutch of the disclosers. Nevertheless, there are many applications of affective
computing in nonsocial contexts, and it seems that physiological signals are most
valuable at least there. Finally, we want to stress that these suggestions are based on
only the current studies and that before any strong conclusions should be drawn our
findings need to be replicated (especially because it opposes some of the findings
with, e.g., acted data).
Because physiological signals are valuable for machine emotion recognition,
these signals might also be useful for humans trying to recognize emotions. In the
light of the poor human emotion recognition performance we found in our studies,
it may be worthwhile to look at technologies that could assist humans in recognizing
others’ emotions (Picard, 2009). Based on the role of physiological signals for machine
performance, it seems that presenting physiological signals as emotional information
about others might benefit humans as well (Janssen et al., 2010). Further research is
necessary to test this idea and answer questions about what information is most useful,
how such information should be presented to the user, and what the influence is of
human learning of information extracted from physiological signals. Moreover, a more
nuanced distinction between various emotions might be necessary in communication
applications. For instance, distinctions between happy and sad might not be as relevant
as distinctions between frustration, anger, or insecurity (Scheirer et al., 2002).
6.3. Conclusion
Comparing machine emotion recognition with human emotion recognition sug-
gests that machine emotion recognition is likely to be mature enough to be incorpo-
rated in applications, as it generally outperforms humans. Improving the recognition
further could potentially be done by incorporating semantic and context information,
Dow
nloa
ded
by [
Uni
vers
iteit
Tw
ente
] at
04:
13 0
3 A
ugus
t 201
3

Machines Outperform Laypersons in Recognizing Emotions 511
as humans also benefit from such information. A potential next step will be to develop
applications that employ these emotion recognition techniques and validate them in
the real world. In the end, we foresee a future in which machines can be emotionally in
touch with us, improving existing user experiences and opening up opportunities for
a myriad of new technologies and tools that can dramatically improve our happiness,
health, and well-being.
NOTES
Background. This article is partly based on the Ph.D. thesis of Joris H. Janssen (Eind-
hoven University of Technology) and the M.Sc. thesis of Paul Tacken (Radboud University
Nijmegen).
Acknowledgments. We thank internal reviewers and three anonymous reviewers for
their valuable remarks, detailed comments, and constructive feedback.
Support. This publication was supported by the Dutch national program COMMIT
(projects P4 Virtual worlds for well-being and P7 SWELL).
Authors’ Present Addresses. Joris H. Janssen, High Tech Campus 34, 5656AE Eind-
hoven, The Netherlands. E-mail: [email protected]. Paul Tacken, De Run 6501,
5504 DR Veldhoven, The Netherlands. E-mail: [email protected]. J.J.G. (Gert-Jan)
de Vries, High Tech Campus 34, 5656AE Eindhoven, The Netherlands. E-mail: gj.de.vries@
philips.com. Egon L. van den Broek, Moeflonstraat 76, 6531JR Nijmegen, The Netherlands.
Joyce H.D.M. Westerink, High Tech Campus 34, 5656AE Eindhoven, The Netherlands. E-
mail: [email protected]. Pim Haselager, Montessorilaan 3 room B.02.40, 6525HR
Nijmegen, The Netherlands. E-mail: [email protected]. Wijnand A. IJsselsteijn, Den
Dolech 2, 5600MB Eindhoven, The Netherlands. E-mail: [email protected].
HCI Editorial Record. First manuscript received September 6, 2011. Revision received
August 16, 2012. Final manuscript received October 16, 2012. Accepted by Andrew Monk. —
Editor
REFERENCES
Ahn, S. J., Bailenson, J. N., Fox, J. A., & Jabon, M. E. (2010). Using automated facial expression
analysis for emotion and behavior prediction, In K. Doeveling, C. von Scheve, and E. A.Konijn, Handbook of emotions and mass media (pp. 349–369). New York, NY: Routledge.
Bachorowski, J., & Owren, M. J. (2008). Vocal expressions of emotion. In M. Lewis, J. M.Haviland-Jones, & L. F. Barrett (Eds.), Handbook of emotions (pp. 196–210). New York,NY: Guilford.
Bailenson, J. N., Pontikakis, E. D., Mauss, I. B., Gross, J. J., Jabon, M. E., & Hutcherson,C. A. : : : John, O. (2008). Real-time classification of evoked emotions using facial feature
tracking and physiological responses. International Journal of Human–Computer Studies, 66,303–317.
Banse, R., & Scherer, K. R. (1996). Acoustic profiles in vocal emotion expression. Journal of
Personality and Social Psychology, 70, 614–636.
Dow
nloa
ded
by [
Uni
vers
iteit
Tw
ente
] at
04:
13 0
3 A
ugus
t 201
3

512 Janssen et al.
Berntson, G. G., Bigger, J. T., Eckberg, D. L., Grossman, P., Kaufmann, P. G., Malik, M. : : :
der Molen, M. W. (1997). Heart rate variability: Origins, methods, and interpretive caveats.Psychophysiology, 34, 623–648.
Berntson, G. G., Cacioppo, J. T. & Quickley, K. S. (1993). Cardiac psychophysiology and auto-
nomic space in humans: Empirical perspectives and conceptual implications. Psychological
Bulletin, 114, 296–322.
Bishop, C. M. (2006). Pattern recognition and machine learning. New York, NY: Springer.Boersma, P., & Weenink, D. (2012). Praat: Doing phonetics by computer. Retrieved from http://
www.praat.org/
Boucsein, W. (1992). Electrodermal activity. New York, NY: Plenum.Bucy, E. P., & Bradley, S. D. (2004). Presidential expressions and viewer emotion: Coun-
terempathic responses to televised leader displays. Social Science Information, 43, 59–94.Busso, C., Deng, Z., Yildirim, S., Bulut, M., Lee, C. M., Kazemzadeh, A. : : : Narayanan, S.
(2004). Analysis of emotion recognition using facial expressions, speech and multimodal
information. In R. Sharma, T. Darrell, M. Harper, G. Lazzari, & M. Turk (Eds.), ICMI’04
Proceedings of the 6th International Conference on Multimodal Interfaces (pp. 205–211). New York,
NY: ACM.Butler, E. A., Wilhelm, F. H. & Gross, J. J. (2006). Respiratory sinus arrhythmia, emotion,
and emotion regulation during social interaction. Psychophysiology, 43, 612–622.
Cacioppo, J. T., & Tassinary, L. (1990). Inferring psychological significance from physiologicalsignals. American Psychologist, 45, 16–28.
Cacioppo, J. T., Tassinary, L. & Berntson, G. G. (2000). Handbook of psychophysiology. Cambridge,MA: Cambridge University Press.
Calvo, R. A., & D’Mello, S. (2010). Affect detection: An interdisciplinary review of models,
methods, and their applications. IEEE Transactions on Affective Computing, 1, 18–37.Chanel, G., Kierkels, J. J. M., Soleymani, M. & Pun, T. (2009). Short-term emotion assessment
in a recall paradigm. International Journal of Human-Computer Studies, 67, 607–627.Chang, C.-C., & Lin, C.-J. (2011). LIBSVM: A library for support vector machines. ACM
Transactions on Intelligent Systems and Technology, 2, 27.
Chang, C.-Y., Tsai, J.-S., Wang, C.-J., & Chung, P.-C. (2009). Emotion recognition withconsideration of facial expressions and physiological signals. In K. C. Wiese (Ed.),
CIBCB’09 IEEE Symposium on Computational Intelligence in Bioinformatics and Computational
Biology (pp. 278–283). Nashville, TN: IEEE.Chellapilla, K., Larson, K., Simard, P., & Czerwinski, M. (2005). Computers beat humans
at single character recognition in reading based human interaction proofs (HIPs). InJ. Goodman, J. Alspector, T. Fawcett, & A. McCallum (Eds.), 2nd Conference on Email and
Anti-Spam (pp. 21–29). Stanford, CA: IEEE.Chen, L. S., Tao, H., Huang, T. S., Miyasato, T., & Nakatsu, R. (1998). Emotion recognition
from audiovisual information. In P. W. Wong, A. Alwan, A. Ortega, C.-C. J. Kuo, &
C. L. M. Nikias (Eds.), 1998 IEEE Second Workshop on Multimedia Signal Processing (pp. 83–88). Piscataway, NJ: IEEE Signal Processing Society.
Chen, M., Gonzalez, S., Vasilakos, A., Cao, H., & Leung, V. C. M. (2011). Body area networks:A survey. Mobile Networks and Applications, 16, 171–193.
Cohen, I., Sebe, N., Garg, A., Chen, L. S., & Huang, T. S. (2003). Facial expression recog-
nition from video sequences: Temporal and static modeling. Computer Vision and Image
Understanding, 91, 160–187.
Cottrell, G. W., & Metcalfe, J. (1991). EMPATH: Face, emotion, and gender recognition usingholons. In R. P. Lippmann, J. E. Moody, & D. S. Touretzky (Eds.), Advances in neural
information processing systems (pp. 564–571). San Mateo, CA: Morgan Kaufmann.
Dow
nloa
ded
by [
Uni
vers
iteit
Tw
ente
] at
04:
13 0
3 A
ugus
t 201
3

Machines Outperform Laypersons in Recognizing Emotions 513
Cowie, R. (2009). Perceiving emotion: Towards a realistic understanding of the task. Philosoph-
ical Transactions of the Royal Society B: Biological Sciences, 364, 3515–3525.Cowie, R., & Cornelius, R. (2003). Describing the emotional states that are expressed in speech.
Speech Communication, 40, 5–32.
Cowie, R., Douglas-Cowie, E., Tsapatsoulis, N., Votsis, G., Kollias, S., Fellenz, W., & Taylor,J. G. (2001). Emotion recognition in human–computer interaction. IEEE Signal Processing
Magazine, 18, 32–80.Damasio, A. R. (1994). Descartes’ error: Emotion, reason, and the human brain. New York, NY: G.P.
Putnam.
de Gelder, B. (2009). Why bodies? Twelve reasons for including bodily expressions in affectiveneuroscience. Philosophical Transactions of the Royal Society B: Biological Sciences, 364, 3475–
3484.de Gelder, B., Van den Stock, J., Meeren, H. K. M., Sinke, C. B. A., Kret, M. E., & Tamietto, M.
(2010). Standing up for the body. Recent progress in uncovering the networks involved
in processing bodies and bodily expressions. Neuroscience and Biobehavioral Reviews, 34, 513–527.
Ekman, P. (1992). Facial expressions of emotion: New findings, new questions. Psychological
Science, 3, 34–38.Ekman, P. (1999). Basic emotions. In T. Dalgleish & M. Power (Eds.), Handbook of cognition
and emotion (pp. 45–60). Sussex, UK: HarperCollins.Ekman, P., & Friesen, W. V. (1978). Facial Action Coding System: A technique for the measurement
of facial movement. Palo Alto, CA: Consulting Psychologists Press.Ekman, P., Levenson, R. W., & Friesen, W. V. (1983). Autonomic nervous system activity
distinguishes between emotions. Science, 221, 1208–1210.
Essa, I. A., & Pentland, A. P. (1995). Facial expression recognition using a dynamic model andmotion energy. In N. Sebe, M. S. Lew, & T. S. Huang (Eds.), ICCV’95 Fifth International
Conference on Computer Vision (pp. 360–367). Cambridge, MA: IEEE Computer SocietyPress.
Essa, I. A., & Pentland, A. P. (1997). Coding, analysis, interpretation, and recognition of facial
expressions. IEEE Transactions on Pattern Analysis and Machine Intelligence, 19, 757–763.Fasel, B., & Luettin, J. (2003). Automatic facial expression analysis: A survey. Pattern Recognition,
36, 259–275.Fischer, A. H., Manstead, A. S. R., & Zaalberg, R. (2003). Social influences on the emotion
process. European Review of Social Psychology, 14, 171–201.
Fridlund, A. J. (1991). Sociality of solitary smiling: Potentiation by an implicit audience. Journal
of Personality and Social Psychology, 60, 229–240.
Grossman, P., & Taylor, E. W. (2007). Toward understanding respiratory sinus arrythmia:Relations to cardiac vagal tone, evolution and biobehavioral functions. Biological Psychology,
74, 263–285.
Gunes, H., & Piccardi, M. (2009). Automatic temporal segment detection and affect recogni-tion from face and body display. IEEE Transactions on Systems, Man, and Cybernetics–Part B:
Cybernetics, 39, 64–84.Healey, J. A., & Picard, R. W. (2005). Detecting stress during real-world driving tasks using
physiological sensors. IEEE Transactions on Intelligent Transportation Systems, 6, 156–166.
Hosseini, S. A., Khalilzadeh, M. A., & Changiz, S. (2010). Emotional stress recognition systemfor affective computing based on bio-signals. Journal of Biological Systems, 18, 101–114.
Hsu, F.-H. (2002). Behind deep blue: Building the computer that defeated the world chess champion.Princeton, NJ: Princeton University Press.
Ickes, W. J. (1997). Empathic accuracy. New York, NY: Guilford.
Dow
nloa
ded
by [
Uni
vers
iteit
Tw
ente
] at
04:
13 0
3 A
ugus
t 201
3

514 Janssen et al.
Ickes, W. J., Gesn, P. R., & Graham, T. (2000). Gender differences in empathic accuracy:
Differential ability or differential motivation? Personal Relationships, 7, 95–109.
James, W. (1894). The physical basis of emotion. Psychological Review, 1, 516–529.
Janssen, J. H., Bailenson, J. N., IJsselsteijn, W. A., & Westerink, J. H. D. M. (2010). Intimate
heartbeats: Opportunities for affective communication technology. IEEE Transactions on
Affective Computing, 1, 72–80.
Janssen, J. H., Van den Broek, E. L., & Westerink, J. H. D. M. (2012). Tune in to your
emotions: A robust personalized affective music player. User Modeling and User-Adaptive
Interaction, 22, 255–279.
Kapoor, A., Burleson, W., & Picard, R. W. (2007). Automatic prediction of frustration.
International Journal of Human–Computer Studies, 65, 724–736.
Kappas, A. (2010). Smile when you read this, whether you like it or not: Conceptual challanges
to affect detection. IEEE Transactions on Affective Computing, 1, 38–41.
Katsis, C. D., Katertsidis, N., Ganiatsas, G., & Fotiadis, D. I. (2008). Toward emotion
recognition in car-racing drivers: A biosignal processing approach. IEEE Transactions
on Systems, Man, and Cybernetics–Part A: Systems and Humans, 38, 502–512.
Kim, J., & André, E. (2006). Emotion recognition using physiological and speech signal in
short-term observation. Lecture Notes in Computer Science (Perception and Interactive Technologies),
4021, 53–64.
Kim, J., & André, E. (2008). Emotion recognition based on physiological changes in music
listening. IEEE Transactions on Pattern Analysis and Machine Intelligence, 30, 2067–2083.
Kim, J., André, E., Rehm, M., Vogt, T., & Wagner, J. (2005). Integrating information
from speech and physiological signals to achieve emotional sensitivity. In I. Trancoso
& L. Oliveira (Eds.), Proceedings of the 9th European Conference on Speech Communication
and Technology (pp. 809–812). Lisboa, Portugal: L2F–Spoken Language Systems Labor-
atory.
Kim, K. H., Bang, S. W., & Kim, S. R. (2004). Emotion recognition system using short-term
monitoring of physiological signals. Medical & Biological Engineering & Computing, 42, 419–
427.
Kleinsmith, A., Bianchi-Berthouze, N., & Steed, A. (2011). Automatic recognition of non-acted
affective postures. IEEE Transactions on Systems, Man and Cybernetics–Part B: Cybernetics, 41,
1027–1038.
Kohavi, R., & John, G. (1997). Wrappers for feature subset selection. Artificial intelligence, 97,
273–324.
Koolagudi, S., & Rao, K. (2012). Emotion recognition from speech: A review. International
Journal of Speech Technology, 15, 99–117.
Kreibig, S. D. (2010). Autonomic nervous system activity in emotion: A review. Biological
Psychology, 84, 394–421.
Lemire, D. (2006). Streaming maximum-minimum filter using no more than three comparisons
per element. Nordic Journal of Computing, 13, 328–339.
Levenson, R. W., Carstensen, L. L., Friesen, W. V., & Ekman, P. (1991). Emotion, physiology,
and expression in old age. Psychology and Aging, 6, 28–35.
Levenson, R. W., & Ruef, A. M. (1992). Empathy: A physiological substrate. Journal of Personality
and Social Psychology, 63, 234–246.
Lien, J. J.-J., Kanade, T., Cohn, J. F., & Li, C.-C. (2000). Detection, tracking, and classification
of action units in facial expression. Robotics and Autonomous Systems, 31, 131–146.
Lisetti, C. L., & Nasoz, F. (2004). Using noninvasive wearable computers to recogniza human
emotions from physiological signals. Journal of Applied Signal Processing, 11, 1672–1687.
Dow
nloa
ded
by [
Uni
vers
iteit
Tw
ente
] at
04:
13 0
3 A
ugus
t 201
3

Machines Outperform Laypersons in Recognizing Emotions 515
Littlewort, G., Bartlett, M. S., Fasel, I., Susskind, J., & Movellan, J. (2006). Dynamics of
facial expression extracted automatically from video. Image and Vision Computing, 24, 615–
625.
Luengo, I., Navas, E., & Hernáez, I. (2010). Feature analysis and evaluation for automatic
emotion identification in speech. IEEE Transactions on Multimedia, 12, 490–501.
Morrison, D., Wang, R., & Silva, L. C. D. (2007). Ensemble methods for spoken emotion
recognition in call-centres. Speech Communication, 49, 98–112.
Nwe, T. L., Foo, S. W., & Silva, L. C. D. (2003). Speech emotion recognition using hidden
Markov models. Speech Communication, 41, 603–623.
Nygaard, L., & Lunders, E. (2002). Resolution of lexical ambiguity by emotional tone of voice.
Memory & Cognition, 30, 583–593.
Ortony, A., Clore, G. L., & Collins, A. (1988). The cognitive structure of emotions. Cambridge, UK:
Cambridge University Press.
Oudeyer, P.-Y. (2003). The production and recognition of emotions in speech: Features and
algorithms. International Journal in Human–Computer Studies, 59, 157–183.
Pantic, M., Caridakis, G., André, E., Kim, J., Karpouzis, K., & Kollias, S. (2011). Multimodal
emotion recognition from low-level cues. In P. Petta, C. Pelachaud & R. Cowie (Eds.),
Emotion-oriented systems: The humaine handbook (pp. 115–132). Berlin/Heidelberg, Germany:
Springer-Verlag.
Pantic, M., & Patras, I. (2006). Dynamics of facial expression: Recognition of facial actions
and their temporal segments from face profile image sequences. IEEE Transactions on
Systems, Man, and Cybernetics, Part B: Cybernetics, 36, 433–449.
Pantic, M., & Rothkrantz, L. J. M. (2003). Toward an affect-sensitive multimodal human-
computer interaction. Proceedings of the IEEE, 91, 1370–1390.
Petridis, S., & Pantic, M. (2011). Audiovisual discrimination between speech and laughter:
Why and when visual information might help. IEEE Transactions on Multimedia, 13, 216–
234.
Picard, R. W. (1997). Affective computing. Cambridge, MA: MIT Press.
Picard, R. W. (2003). Affective computing: Challenges. International Journal of Human–Computer
Studies, 59, 55–64.
Picard, R. W. (2009). Future affective technology for autism and emotion communication.
Philosophical Transactions of the Royal Society B: Biological Sciences, 364, 3575–3584.
Picard, R. W., & Klein, J. (2002). Computers that recognise and respond to user emotion:
Theoretical and practical implications. Interacting with Computers, 14, 141–169.
Picard, R. W., Vyzas, E., & Healey, J. (2001). Toward machine emotional intelligence: Analysis
of affective physiological state. IEEE Transactions on Pattern Analysis and Machine Intelligence,
23, 1175–1191.
Piferi, R. L., Kline, K. A., Younger, J., & Lawler, K. A. (2000). An alternative approach
for achieving cardiovascular baseline: Viewing an aquatic video. International Journal of
Psychophysiology, 37, 207–217.
Porges, S. W., Saul, J. P., Stone, P. H., Van der Molen, M. W., Berntson, G. G., Bigger, J. T. J. : : :
Nagaraja, H. N. (1997). Heart rate variability: Origins, methods, and interpretive caveats.
Psychophysiology, 34, 623–647.
Prinz, J. J. (2004). Gut reactions: A perceptual theory of emotion. New York, NY: Oxford University
Press.
Rani, P., Liu, C., Sarkar, N., & Vanman, E. (2006). An empirical study of machine learning
techniques for affect recognition in human-robot interaction. Pattern Analysis & Applica-
tions, 9, 58–69.
Dow
nloa
ded
by [
Uni
vers
iteit
Tw
ente
] at
04:
13 0
3 A
ugus
t 201
3

516 Janssen et al.
Reisenzein, R., Studtmann, M., & Horstmann, G. (2013). Coherence between emotion and
facial expression: Evidence from laboratory experiments. Emotion Review, 5, 16–23.Roth, G., & Dicke, U. (2005). Evolution of the brain and intelligence. Trends in Cognitive Sciences,
9, 250–257.
Russell, J. A. (2003). Core Affect and the Psychological Construction of Emotion. Psychological
Review, 110, 145–172.
Sanchez, A., Ruiz, J. V., Moreno, A. B., Montemayor, A. S., Hernandez, J., & Pantrigo,J. J. (2010). Differential optical flow applied to automatic facial expression recognition.Neurocomputing, 74, 1272–1282.
Scheirer, J., Fernandez, R., Klein, J., & Picard, R. W. (2002). Frustrating the user on purpose:A step toward building an affective computer. Interacting with Computers, 14, 93–118.
Scherer, K. R. (1986). Vocal affect expression: A review and a model for future research.Psychological Bulletin, 99, 143–165.
Scherer, K. R. (2003). Vocal communication of emotion: A review of research paradigms.
Speech communication, 40, 227–256.Scherer, K. R., Banse, R., & Wallbott, H. G. (2001). Emotion inferences from vocal expression
correlate across languages and cultures. Journal of Cross-Cultural Psychology, 32, 76–92.Scherer, S., Schwenker, F., & Palm, G. (2009). Classifier fusion for emotion recognition from
speech. In W. Minker, M. Weber, H. Hagras, V. Callagan, & A. D. Kameas (Eds.), Advanced
intelligent environments (pp. 95–117). New York, NY: Springer Science+Business Media.Schuller, B., Batliner, A., Steidl, S., & Seppi, D. (2011). Recognizing realistic emotions and affect
in speech: State of the art and lessons learnt from the first challenge. Speech Communication,
53, 1062–1087.Silva, L. C. D., Miyasato, T., & Nakatsu, R. (1997, September 9–12). Facial emotion recognition
using multi-modal information. In IEEE proceedings of the international conference on information,
communications and signal processing (ICICS) (Vol. 1, pp. 397–401). Singapore: Piscataway, NJ:
IEEE Singapore Section/IEEE Signal Processing Society.Sinha, R., & Parsons, O. A. (1996). Multivariate response patterning of fear. Cognition and
Emotion, 10, 173–198.
Sobol-Shikler, T., & Robinson, P. (2010). Classification of complex information: Inferenceof co-occurring affective states from their expressions in speech. IEEE Transactions on
Pattern Analysis and Machine Intelligence, 32, 1284–1297.Tartter, V. C. (1980). Happy talk: Perceptual and acoustic effects of smiling on speech. Perception
& Psychophysics, 27, 24–27.
Tawari, A., & Trivedi, M. M. (2010). Speech emotion analysis: Exploring the role of context.IEEE Transactions on Multimedia, 12, 502–509.
Tian, Y.-L., Kanade, T., & Cohn, J. F. (2005). Facial expression analysis. In S. Z. Li &A. K. Jain (Eds.), Handbook of face recognition (pp. 247–275). New York, NY: SpringerScience+Business Media Inc.
Turing, A. M. (1950). Computing machinery and intelligence. Mind, LIX, 433–460.Van den Broek, E. L. (2010). Beyond biometrics. Procedia Computer Science, 1, 2505–2513.
Van den Broek, E. L. (2013). Ubiquitous emotion-aware computing. Personal and Ubiquitous
Computing, 17, 53–67.Van den Broek, E. L., Janssen, J. H., Healey, J. A., & Van der Zwaag, M. D. (2010). Prerequisites
for Affective Signal Processing–Part II. In A. Fred, J. Filipe, & H. Gamboa (Eds.),Proceedings of the 3rd International Conference on Bio-Inspired Systems and Signal Processing, Biosignals
2010 (pp. 188–193). Valence, Spain: INSTICC Press.Van den Broek, E. L., Janssen, J. H., Westerink, J. H. D. M., & Healey, J. A. (2009). Prerequisists
for affective signal processing (ASP). In P. Encarnaca & A. Veloso (Eds.), Biosignals 2009:
Dow
nloa
ded
by [
Uni
vers
iteit
Tw
ente
] at
04:
13 0
3 A
ugus
t 201
3

Machines Outperform Laypersons in Recognizing Emotions 517
Proceedings of the international conference on bio-inspired systems and signal processing (pp. 426–433).
Porto, Portugal.Van den Broek, E. L., Lisý, V., Janssen, J. H., Westerink, J. H. D. M., Schut, M. H., &
Tuinenbreijer, K. (2010). Affective Man-Machine Interface: Unveiling human emotions
through biosignals. In A. Fred, J. Filipe, & H. Gamboa (Eds.), Biomedical Engineering Systems
and Technologies: BIOSTEC2009 selected revised papers (Vol. 52, pp. 21–47). Berlin/Heidelberg,
Germany: Springer.Van den Broek, E. L., Schut, M. H., Westerink, J. H. D. M., & Tuinenbreijer, K. (2009). Un-
obtrusive Sensing of Emotions (USE). Journal of Ambient Intelligence and Smart Environments,
1, 287–299.Van den Broek, E. L., van der Sluis, F., & Dijkstra, T. (2011a). Cross-validation of bi-
modal health-related stress assessment. Personal and Ubiquitous Computing. Advance onlinepublication., http://dx.doi.org/10.1007/s00779-011-0468-z
Van den Broek, E. L., van der Sluis, F., & Dijkstra, T. (2011b). Telling the story and re-
living the past: How speech analysis can reveal emotions in post-traumatic stress disorder(PTSD) patients. In J. H. D. M. Westerink, M. Krans, & M. Ouwerkerk (Eds.), Sensing
emotions: The impact of context on experience measurements (Vol. 12, pp. 153–180). Dordrecht,The Netherlands: Springer Science C Business Media B.V.
van den Hoogen, W. M., IJsselsteijn, W. A., & de Kort, Y. A. W. (2008). Exploring Behavioral
Expressions of Player Experience in Digital Games. In A. Nijholt & R. Poppe (Eds.),ECAG’08 Proceedings of the Workshop on Facial and Bodily Expression for Control and Adaptation
of Games (pp. 11–19). Amsterdam, The Netherlands.Ververidis, D., & Kotropoulos, C. (2006). Emotional speech recognition: Resources, features,
and methods. Speech Communication, 48, 1162–1181.
Wagenaar, W. A. (1969). Note on the construction of digram-balanced Latin squares. Psycho-
logical Bulletin, 72, 384–386.
Wang, Y., & Guan, L. (2008). Recognizing human emotional state from audiovisual signals.IEEE Transactions on Multimedia, 10, 936–946.
Wilder, J. F. (1967). Stimulus and response: The law of initial value. Bristol, UK: John Wright.
Wilting, J., Krahmer, E., & Swerts, M. (2006, September 17–21). Real vs. acted emotionalspeech. In Proceedings of the Ninth International Conference on Spoken Language Processing INTER-
SPEECH 2006–ICSLP (pp. 805–808). Pittsburgh, PA, USA: Baixas, France: InternationalSpeech Communication Association.
Witten, I. H., & Frank, E. (2005). Data mining: Practical machine learning tools and techniques.
Amsterdam, The Netherlands: Elsevier.Wu, S., Falk, T. H., & Chan, W.-Y. (2011). Automatic speech emotion recognition using
modulation spectral features. Speech Communication, 53, 768–785.Xiao, R., Zhao, Q., Zhang, D., & Shi, P. (2011). Facial expression recognition on multiple
manifolds. Pattern Recognition, 44, 107–116.
Yacoob, Y., & Davis, L. S. (2006). Recognizing human facial expressions from long imagesequences using optical flow. IEEE Transactions on Pattern Analysis and Machine Intelligence,
18, 636–642.Zaki, J., Bolger, N., & Ochsner, K. (2009). Unpacking the informational bases of empathic
accuracy. Emotion, 9, 478–487.
Zaki, J., Weber, J., Bolger, N., & Ochsner, K. (2009). The neural bases of empathic accuracy.Proceedings of the National Academy of Sciences, 106, 11382–11387.
Zeng, Z., Pantic, M., Roisman, G. I., & Huang, T. S. (2009). A survey of affect recognitionmethods: Audio, visual, and spontaneous expressions. IEEE Transactions on Pattern Analysis
and Machine Intelligence, 31, 39–58.
Dow
nloa
ded
by [
Uni
vers
iteit
Tw
ente
] at
04:
13 0
3 A
ugus
t 201
3
Copyright © 2022 FDOKUMEN