
Reaching the Working Poor and Poor Elderly: Cognitive Test ...
Upload
independentCategory
view
1download
0
Article
Different Functional Neura
l Substrates for Good andPoor Language Outcome in AutismHighlights
d Different language trajectories emerge in ASD subgroups in
the first 4 years of life
d ASD with later poor language outcome shows temporal
cortex hypoactivation to speech
d Large-scale brain-language relationships are atypically
reversed and specific to ASD
d ASD subgroup prognosis is best predicted by combining
early behavioral and fMRI data
Lombardo et al., 2015, Neuron 86, 1–11April 22, 2015 ª2015 Elsevier Inc.http://dx.doi.org/10.1016/j.neuron.2015.03.023
Authors
Michael V. Lombardo, Karen Pierce, ...,
Kathleen Campbell, Eric Courchesne
[email protected] (M.V.L.),[email protected] (E.C.)
In Brief
Autism is heterogeneous in early
developmental course and later clinical
outcome. Lombardo et al. discover very
early neural substrates that precede and
help explain why some individuals go on
to show good versus poor later language
development and outcome.
Neuron
Article
Different Functional Neural Substratesfor Good and Poor Language Outcome in AutismMichael V. Lombardo,1,2,3,* Karen Pierce,4 Lisa T. Eyler,4,5,6 Cindy Carter Barnes,4 Clelia Ahrens-Barbeau,4
Stephanie Solso,4 Kathleen Campbell,4 and Eric Courchesne4,*1Department of Psychology, University of Cyprus, 1 Panepistimiou Avenue, Aglantzia, Nicosia 1678, Cyprus2Center for Applied Neuroscience, University of Cyprus, 1 Panepistimiou Avenue, Aglantzia, Nicosia 1678, Cyprus3Autism Research Centre, Department of Psychiatry, University of Cambridge, Douglas House, 18B Trumpington Road,
Cambridge CB2 8AH, UK4Autism Center of Excellence, Department of Neuroscience, University of California, San Diego, 8110 La Jolla Shores Drive, Suite 201,
La Jolla, CA 92093, USA5Department of Psychiatry, University of California, San Diego, 9500 Gilman Drive, La Jolla, CA 92161, USA6VISN 22 Mental Illness Research, Education, and Clinical Center, VA San Diego Healthcare System, 3350 La Jolla Village Drive, San Diego,
CA 92161, USA
*Correspondence: [email protected] (M.V.L.), [email protected] (E.C.)http://dx.doi.org/10.1016/j.neuron.2015.03.023
SUMMARY
Autism (ASD) is vastly heterogeneous, particularly inearly language development. While ASD languagetrajectories in the first years of life are highly unstable,by early childhood these trajectories stabilize andare predictive of longer-term outcome. Early neuralsubstrates that predict/precede such outcomes arelargely unknown, but could have considerable trans-lational and clinical impact. Pre-diagnosis fMRI res-ponse to speech in ASD toddlers with relativelygood language outcome was highly similar to non-ASD comparison groups and robustly recruited lan-guage-sensitive superior temporal cortices. In con-trast, language-sensitive superior temporal corticeswere hypoactive in ASD toddlers with poor languageoutcome. Brain-behavioral relationships were atypi-cally reversed in ASD, and a multimodal combinationof pre-diagnostic clinical behavioral measures andspeech-related fMRI response showed the mostpromise as an ASD prognosis classifier. Thus, beforeASD diagnoses and outcome become clinically clear,distinct functional neuroimaging phenotypes arealready present that can shed insight on an ASD tod-dler’s later outcome.
INTRODUCTION
There is an absence of neurobiological explanations for why in-
fants and toddlers with autism spectrum disorders (ASD) can
have strikingly different clinical outcomes. One primary reason
for this absence is the large degree of heterogeneity manifested
in both the early clinical phenotype and in the likely underlying
causes for different subtypes of autism (Geschwind and Levitt,
2007). Underscoring phenotypic behavioral heterogeneity in
early development, there is no better example than variability
in early language development (Anderson et al., 2007; Kjelgaard
and Tager-Flusberg, 2001; Pickles et al., 2014). Some individuals
with ASD are minimally verbal throughout life and display high
levels of symptom severity and poor clinical outcome (Tager-
Flusberg and Kasari, 2013). In contrast, others display delayed
or typical early language development and may have relatively
more positive clinical outcome (Fein et al., 2013). The neurode-
velopmental bases for this variability in clinical outcomes are un-
known. Differences in treatment quantity have not accounted for
such variability. For example, in one of the first studies of applied
behavioral analysis (ABA) intervention where treatment quantity
and type were largely standardized across participants, 50%
of individuals achieved typical school placement and IQ scores
within the normal range following treatment, while the remainder
did not (Lovaas, 1987). Overall, variable response to treatment
has been reported for all evidence-based approaches available
for ASD children (Bacon et al., 2014). While pre-treatment lan-
guage (Perry et al., 2011) and other nonverbal cognitive abilities
(McEachin et al., 1993) are often predictors of treatment suc-
cess, this relationship is not always straightforward (Eapen
et al., 2013). Lord and colleagues (Lord et al., 2012) recently
concluded that ‘‘intrinsic’’ biological factors (i.e., different biolog-
ical factors underlying ASD subgroups with different clinical
course) might better explain variable clinical change, although
such biological explanations have yet to be identified.
Given both the widespread heterogeneity in early language
development (Anderson et al., 2007; Kjelgaard and Tager-Flus-
berg, 2001; Pickles et al., 2014) and its importance in relation to
core trajectories of symptom severity (Gotham et al., 2012),
alongside the predictive power of early language levels on later
outcomes (Bennett et al., 2008; Billstedt et al., 2005; Gillberg
and Steffenburg, 1987; Gotham et al., 2012; Howlin, 2003;
Howlin et al., 2000, 2014; Szatmari et al., 2000, 2003, 2009;
Venter et al., 1992), it is important for the field to develop
ways in which the ASD population could be stratified into plau-
sible and clinically relevant neurodevelopmental subtypes. Tak-
ing this stratification approach would help to accelerate the
Neuron 86, 1–11, April 22, 2015 ª2015 Elsevier Inc. 1
Please cite this article in press as: Lombardo et al., Different Functional Neural Substrates for Good and Poor Language Outcome in Autism, Neuron(2015), http://dx.doi.org/10.1016/j.neuron.2015.03.023
translational process from discovery of novel biological markers
to ways in which better treatments could be developed and
individualized to specific phenotypes (Kapur et al., 2012).
No developmental studies of biomarkers for early language
heterogeneity in ASD have been designed to address this major
issue. Existing natural sleep fMRI studies have found that 2- to 3-
year-old ASD toddlers as a whole differ on average from TD
toddlers in atypical speech-related lateralization of superior
temporal cortex (Eyler et al., 2012; Redcay and Courchesne,
2008) and reduced inter-hemispheric synchrony (Dinstein
et al., 2011). While these early studies established the potential
power of natural sleep fMRI to pinpoint early speech-related pro-
cessing differences in superior temporal cortical regions, they
fall short in addressing critical questions about heterogeneity
within ASD with regard to early language development and
outcome. That is, past studies have not employed analyses
and designs capable of detecting different neural subtypes
within ASD that underlie and help explain differing develop-
mental language trajectories and outcomes. Past studies have
also not studied predictive power at the individual level with
respect to prognosis and have not systematically studied how
such individual level variation in large-scale speech-related neu-
ral systems response varies with an individual’s level of change
in early developing language ability. Finally, existing work has
not yet tested whether any such neurofunctional abnormalities
within ASD are specific to an ASD subtype or whether they are
shared by a non-ASD clinical comparison group with significant
early language or general developmental delays.
In the present study, we have gone further to address each of
these critical questions.We combined (1) prospective fMRImea-
surement of neural systems response to speech during our nat-
ural sleep fMRI language paradigm (Eyler et al., 2012; Redcay
and Courchesne, 2008) at the earliest ages at which risk for
ASD can be clinically detected in the general pediatric popula-
tion with (2) contemporaneous and comprehensive longitudinal
diagnostic and clinical assessments to evaluate diagnostic
outcome and characterize language level by 3–4 years of age. In-
fants and toddlers were recruited using a combination of the
one-year well-baby check-up approach (Pierce et al., 2011) as
well as community referral. The natural sleep fMRI language
paradigm employed in this study was identical to that used in
our previously published studies (Eyler et al., 2012; Redcay
and Courchesne, 2008) and used three types of stimuli to reduce
habituation (i.e., complex forward speech, simple forward
speech, and backward speech) and rest blocks (more informa-
tion on the procedure for sleep-fMRI scanning as well as data
acquisition and analysis details can be found in the Supple-
mental Information). Cohorts of age- and sex-matched infants
and toddlers (aged 12–48 months) with ASD (n = 60), non-ASD
language/developmentally delayed individuals (LD/DD; n = 19),
and typically developing individuals (TD; n = 24) participated.
Early language development was characterized longitudinally
approximately every 6 months from clinical intake, and outcome
was determined from a follow-up assessment in early childhood,
on average 1 year after the original fMRI scanning session.Within
the ASD group, we identified individuals with poor language
outcome in early childhood (‘‘ASD Poor’’; n = 24) who had
outcome receptive (RL) and expressive (EL) language T-scores
on the Mullen Scales of Early Learning that were below 1 SD of
the norm (i.e., T < 40). A second subgroup was identified that
had relatively better language outcome in early childhood
(‘‘ASD Good’’; n = 36) with EL or RL scores at outcomes greater
than 1 SD below the norm (i.e., T R 40). See Table S1 and
Supplemental Information for more on characterization of the
sample.
RESULTS
Behavioral Characterization of DevelopmentLongitudinal assessments of language, non-verbal, and autism
symptomdevelopmentweremadeapproximately every6months
from initial clinical intake to an individual’s last outcome assess-
ment. Developmental trajectorieswere characterizedat the group
level after taking into account individual-level effects using linear
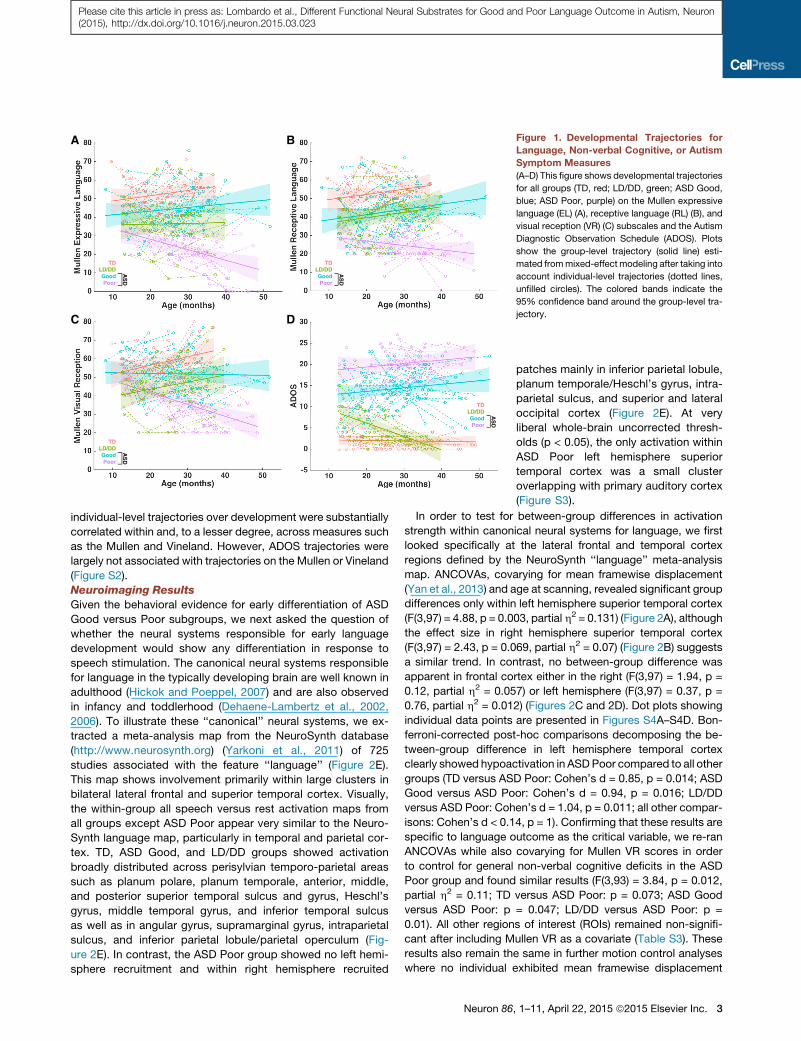
mixed-effect models. Across T-scores for Mullen EL and RL
subscales, we observed null or trend-level main effects for Age
(EL: F = 0.0803, p = 0.77; RL: F = 3.38, p = 0.06), but found
highly significant main effects of Group (EL: F = 39.01, p <
0.0001; RL: F = 26.72, p < 0.0001) and significant or trend-level
Group 3 Age interactions (EL: F = 8.43, p = 0.0042; RL: F =
3.71, p = 0.055). Bonferroni-corrected post-hoc comparisons
showed that the main effects of Group were driven by differentia-
tion on every pairwise comparison, where a gradient across
groups was observed of TD with the best language scores, fol-
lowed by ASD Good, LD/DD, and ASD Poor. An exception to
this was similar RL levels for LD/DD and ASD Good. For both EL
and RL, the Group3 Age interactions were solely driven by ASD
Poor’s declining trajectory differing from all other groups, though
the statistical significance for RL was at a nominally significant
level (e.g., p < 0.02) (Table S2, Figures 1A and 1B). Because we
are using Mullen T-scores, declining trajectories in ASD Poor
should be interpreted as individuals falling further and further
behind age-appropriate norms, rather than as loss of skills over
development.
In terms of trajectories of autism symptom severity measured
by the Autism Diagnostic Observation Schedule (ADOS), we
found a main effect of Group (F = 11.35, p = 0.0011) but no
main effect of Age (F = 0.536, p = 0.46) or Group 3 Age interac-
tion (F = 1.75, p = 0.18). Bonferroni-corrected post-hoc compar-
isons showed that all groupswere differentiated from each other,
with a gradient of ASD Poor with the most elevated ADOS
scores, followed by ASD Good, LD/DD, and TD. Furthermore,
the LD/DD group showed a decreasing trajectory over time,
and this decreasing slope was significantly different from all
other groups, where the trajectories were relatively stable or
slightly increasing over time (Table S2, Figure 1D).
Similar types of results were also observed on the non-verbal
subscales of theMullen (i.e., visual reception, finemotor) and the
Vineland Adaptive Behavior Scales, a parental clinical interview
measure of abilities in everyday settings (Figure 1C, Table S2,
Figure S1). This is expected, given past research documenting
correlations between early developmental clinical assessment
measures for autism such as theMullen, Vineland, and ADOS (El-
lis Weismer et al., 2010). In this study we replicated this correla-
tional structure at intake and outcome time points (Figure S2).
Furthermore, with longitudinal data, we additionally found that
2 Neuron 86, 1–11, April 22, 2015 ª2015 Elsevier Inc.
Please cite this article in press as: Lombardo et al., Different Functional Neural Substrates for Good and Poor Language Outcome in Autism, Neuron(2015), http://dx.doi.org/10.1016/j.neuron.2015.03.023
individual-level trajectories over development were substantially
correlated within and, to a lesser degree, across measures such
as the Mullen and Vineland. However, ADOS trajectories were
largely not associated with trajectories on the Mullen or Vineland
(Figure S2).
Neuroimaging Results
Given the behavioral evidence for early differentiation of ASD
Good versus Poor subgroups, we next asked the question of
whether the neural systems responsible for early language
development would show any differentiation in response to
speech stimulation. The canonical neural systems responsible
for language in the typically developing brain are well known in
adulthood (Hickok and Poeppel, 2007) and are also observed
in infancy and toddlerhood (Dehaene-Lambertz et al., 2002,
2006). To illustrate these ‘‘canonical’’ neural systems, we ex-
tracted a meta-analysis map from the NeuroSynth database
(http://www.neurosynth.org) (Yarkoni et al., 2011) of 725
studies associated with the feature ‘‘language’’ (Figure 2E).
This map shows involvement primarily within large clusters in
bilateral lateral frontal and superior temporal cortex. Visually,
the within-group all speech versus rest activation maps from
all groups except ASD Poor appear very similar to the Neuro-
Synth language map, particularly in temporal and parietal cor-
tex. TD, ASD Good, and LD/DD groups showed activation
broadly distributed across perisylvian temporo-parietal areas
such as planum polare, planum temporale, anterior, middle,
and posterior superior temporal sulcus and gyrus, Heschl’s
gyrus, middle temporal gyrus, and inferior temporal sulcus
as well as in angular gyrus, supramarginal gyrus, intraparietal
sulcus, and inferior parietal lobule/parietal operculum (Fig-
ure 2E). In contrast, the ASD Poor group showed no left hemi-
sphere recruitment and within right hemisphere recruited
A B
C D
Figure 1. Developmental Trajectories for
Language, Non-verbal Cognitive, or Autism
Symptom Measures
(A–D) This figure shows developmental trajectories
for all groups (TD, red; LD/DD, green; ASD Good,
blue; ASD Poor, purple) on the Mullen expressive
language (EL) (A), receptive language (RL) (B), and
visual reception (VR) (C) subscales and the Autism
Diagnostic Observation Schedule (ADOS). Plots
show the group-level trajectory (solid line) esti-
mated frommixed-effect modeling after taking into
account individual-level trajectories (dotted lines,
unfilled circles). The colored bands indicate the
95% confidence band around the group-level tra-
jectory.
patches mainly in inferior parietal lobule,
planum temporale/Heschl’s gyrus, intra-
parietal sulcus, and superior and lateral
occipital cortex (Figure 2E). At very
liberal whole-brain uncorrected thresh-
olds (p < 0.05), the only activation within
ASD Poor left hemisphere superior
temporal cortex was a small cluster
overlapping with primary auditory cortex
(Figure S3).
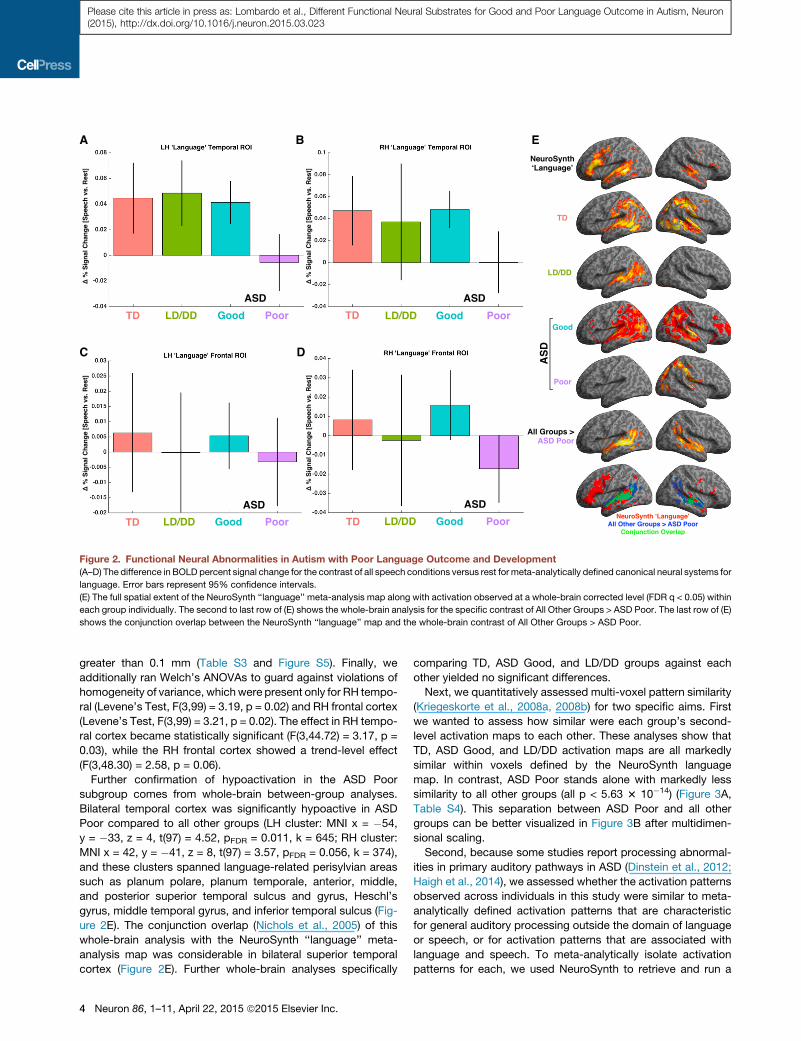
In order to test for between-group differences in activation
strength within canonical neural systems for language, we first
looked specifically at the lateral frontal and temporal cortex
regions defined by the NeuroSynth ‘‘language’’ meta-analysis
map. ANCOVAs, covarying for mean framewise displacement
(Yan et al., 2013) and age at scanning, revealed significant group
differences only within left hemisphere superior temporal cortex
(F(3,97) = 4.88, p = 0.003, partial h2 = 0.131) (Figure 2A), although
the effect size in right hemisphere superior temporal cortex
(F(3,97) = 2.43, p = 0.069, partial h2 = 0.07) (Figure 2B) suggests
a similar trend. In contrast, no between-group difference was
apparent in frontal cortex either in the right (F(3,97) = 1.94, p =
0.12, partial h2 = 0.057) or left hemisphere (F(3,97) = 0.37, p =
0.76, partial h2 = 0.012) (Figures 2C and 2D). Dot plots showing
individual data points are presented in Figures S4A–S4D. Bon-
ferroni-corrected post-hoc comparisons decomposing the be-
tween-group difference in left hemisphere temporal cortex
clearly showed hypoactivation in ASDPoor compared to all other
groups (TD versus ASD Poor: Cohen’s d = 0.85, p = 0.014; ASD
Good versus ASD Poor: Cohen’s d = 0.94, p = 0.016; LD/DD
versus ASD Poor: Cohen’s d = 1.04, p = 0.011; all other compar-
isons: Cohen’s d < 0.14, p = 1). Confirming that these results are
specific to language outcome as the critical variable, we re-ran
ANCOVAs while also covarying for Mullen VR scores in order
to control for general non-verbal cognitive deficits in the ASD
Poor group and found similar results (F(3,93) = 3.84, p = 0.012,
partial h2 = 0.11; TD versus ASD Poor: p = 0.073; ASD Good
versus ASD Poor: p = 0.047; LD/DD versus ASD Poor: p =
0.01). All other regions of interest (ROIs) remained non-signifi-
cant after including Mullen VR as a covariate (Table S3). These
results also remain the same in further motion control analyses
where no individual exhibited mean framewise displacement
Neuron 86, 1–11, April 22, 2015 ª2015 Elsevier Inc. 3
Please cite this article in press as: Lombardo et al., Different Functional Neural Substrates for Good and Poor Language Outcome in Autism, Neuron(2015), http://dx.doi.org/10.1016/j.neuron.2015.03.023
greater than 0.1 mm (Table S3 and Figure S5). Finally, we
additionally ran Welch’s ANOVAs to guard against violations of
homogeneity of variance, whichwere present only for RH tempo-
ral (Levene’s Test, F(3,99) = 3.19, p = 0.02) and RH frontal cortex
(Levene’s Test, F(3,99) = 3.21, p = 0.02). The effect in RH tempo-
ral cortex became statistically significant (F(3,44.72) = 3.17, p =
0.03), while the RH frontal cortex showed a trend-level effect
(F(3,48.30) = 2.58, p = 0.06).
Further confirmation of hypoactivation in the ASD Poor
subgroup comes from whole-brain between-group analyses.
Bilateral temporal cortex was significantly hypoactive in ASD
Poor compared to all other groups (LH cluster: MNI x = �54,
y = �33, z = 4, t(97) = 4.52, pFDR = 0.011, k = 645; RH cluster:
MNI x = 42, y = �41, z = 8, t(97) = 3.57, pFDR = 0.056, k = 374),
and these clusters spanned language-related perisylvian areas
such as planum polare, planum temporale, anterior, middle,
and posterior superior temporal sulcus and gyrus, Heschl’s
gyrus, middle temporal gyrus, and inferior temporal sulcus (Fig-
ure 2E). The conjunction overlap (Nichols et al., 2005) of this
whole-brain analysis with the NeuroSynth ‘‘language’’ meta-
analysis map was considerable in bilateral superior temporal
cortex (Figure 2E). Further whole-brain analyses specifically
comparing TD, ASD Good, and LD/DD groups against each
other yielded no significant differences.
Next, we quantitatively assessed multi-voxel pattern similarity
(Kriegeskorte et al., 2008a, 2008b) for two specific aims. First
we wanted to assess how similar were each group’s second-
level activation maps to each other. These analyses show that
TD, ASD Good, and LD/DD activation maps are all markedly
similar within voxels defined by the NeuroSynth language
map. In contrast, ASD Poor stands alone with markedly less
similarity to all other groups (all p < 5.63 3 10�14) (Figure 3A,
Table S4). This separation between ASD Poor and all other
groups can be better visualized in Figure 3B after multidimen-
sional scaling.
Second, because some studies report processing abnormal-
ities in primary auditory pathways in ASD (Dinstein et al., 2012;
Haigh et al., 2014), we assessed whether the activation patterns
observed across individuals in this study were similar to meta-
analytically defined activation patterns that are characteristic
for general auditory processing outside the domain of language
or speech, or for activation patterns that are associated with
language and speech. To meta-analytically isolate activation
patterns for each, we used NeuroSynth to retrieve and run a
A B E
C D
Figure 2. Functional Neural Abnormalities in Autism with Poor Language Outcome and Development
(A–D) The difference in BOLD percent signal change for the contrast of all speech conditions versus rest formeta-analytically defined canonical neural systems for
language. Error bars represent 95% confidence intervals.
(E) The full spatial extent of the NeuroSynth ‘‘language’’ meta-analysis map along with activation observed at a whole-brain corrected level (FDR q < 0.05) within
each group individually. The second to last row of (E) shows the whole-brain analysis for the specific contrast of All Other Groups > ASD Poor. The last row of (E)
shows the conjunction overlap between the NeuroSynth ‘‘language’’ map and the whole-brain contrast of All Other Groups > ASD Poor.
4 Neuron 86, 1–11, April 22, 2015 ª2015 Elsevier Inc.
Please cite this article in press as: Lombardo et al., Different Functional Neural Substrates for Good and Poor Language Outcome in Autism, Neuron(2015), http://dx.doi.org/10.1016/j.neuron.2015.03.023
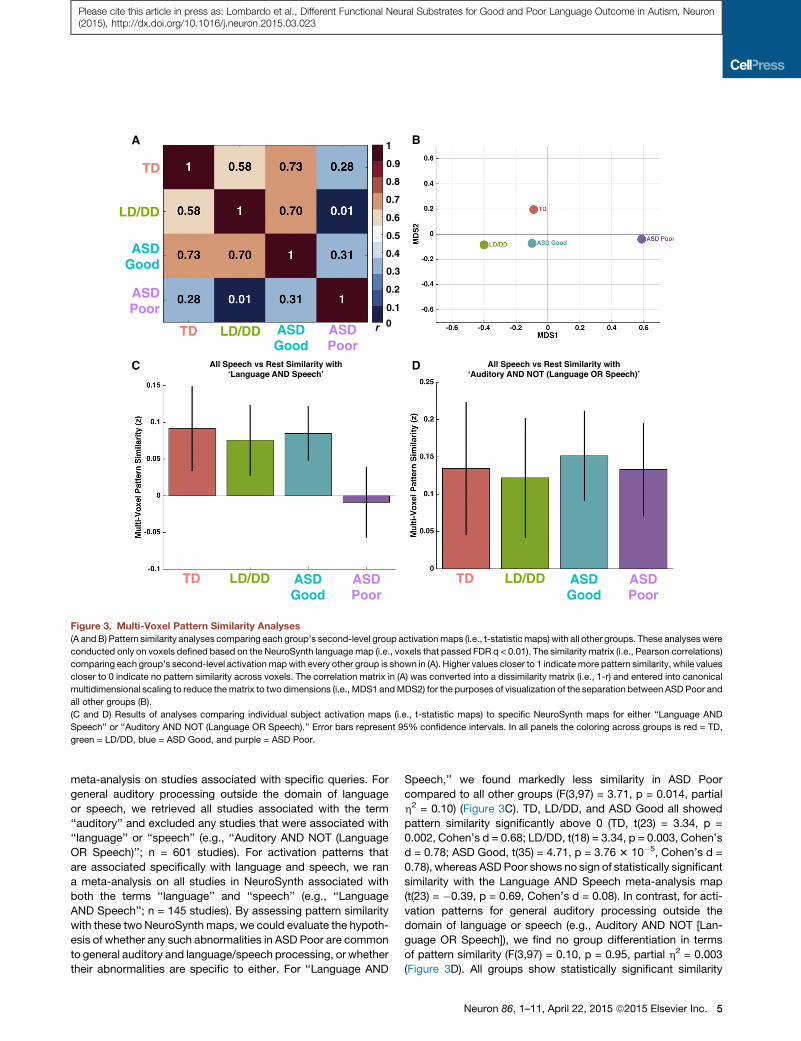
meta-analysis on studies associated with specific queries. For
general auditory processing outside the domain of language
or speech, we retrieved all studies associated with the term
‘‘auditory’’ and excluded any studies that were associated with
‘‘language’’ or ‘‘speech’’ (e.g., ‘‘Auditory AND NOT (Language
OR Speech)’’; n = 601 studies). For activation patterns that
are associated specifically with language and speech, we ran
a meta-analysis on all studies in NeuroSynth associated with
both the terms ‘‘language’’ and ‘‘speech’’ (e.g., ‘‘Language
AND Speech’’; n = 145 studies). By assessing pattern similarity
with these two NeuroSynth maps, we could evaluate the hypoth-
esis of whether any such abnormalities in ASD Poor are common
to general auditory and language/speech processing, or whether
their abnormalities are specific to either. For ‘‘Language AND
Speech,’’ we found markedly less similarity in ASD Poor
compared to all other groups (F(3,97) = 3.71, p = 0.014, partial
h2 = 0.10) (Figure 3C). TD, LD/DD, and ASD Good all showed
pattern similarity significantly above 0 (TD, t(23) = 3.34, p =
0.002, Cohen’s d = 0.68; LD/DD, t(18) = 3.34, p = 0.003, Cohen’s
d = 0.78; ASD Good, t(35) = 4.71, p = 3.76 3 10�5, Cohen’s d =
0.78), whereas ASDPoor shows no sign of statistically significant
similarity with the Language AND Speech meta-analysis map
(t(23) = �0.39, p = 0.69, Cohen’s d = 0.08). In contrast, for acti-
vation patterns for general auditory processing outside the
domain of language or speech (e.g., Auditory AND NOT [Lan-
guage OR Speech]), we find no group differentiation in terms
of pattern similarity (F(3,97) = 0.10, p = 0.95, partial h2 = 0.003
(Figure 3D). All groups show statistically significant similarity
TD LD/DD ASDGood
ASDPoor
1
0
0.8
0.6
0.4
0.2
r
0.1
0.3
0.5
0.7
0.9TD
LD/DD
ASDGood
ASDPoor
TD LD/DD ASDGood
ASDPoor
All Speech vs Rest Similarity with
A B
C D All Speech vs Rest Similarity with
TD LD/DD ASDGood
ASDPoor
Figure 3. Multi-Voxel Pattern Similarity Analyses
(A andB) Pattern similarity analyses comparing each group’s second-level group activationmaps (i.e., t-statisticmaps) with all other groups. These analyseswere
conducted only on voxels defined based on the NeuroSynth languagemap (i.e., voxels that passed FDR q < 0.01). The similarity matrix (i.e., Pearson correlations)
comparing each group’s second-level activationmapwith every other group is shown in (A). Higher values closer to 1 indicatemore pattern similarity, while values
closer to 0 indicate no pattern similarity across voxels. The correlation matrix in (A) was converted into a dissimilarity matrix (i.e., 1-r) and entered into canonical
multidimensional scaling to reduce thematrix to two dimensions (i.e., MDS1 andMDS2) for the purposes of visualization of the separation between ASDPoor and
all other groups (B).
(C and D) Results of analyses comparing individual subject activation maps (i.e., t-statistic maps) to specific NeuroSynth maps for either ‘‘Language AND
Speech’’ or ‘‘Auditory AND NOT (Language OR Speech).’’ Error bars represent 95% confidence intervals. In all panels the coloring across groups is red = TD,
green = LD/DD, blue = ASD Good, and purple = ASD Poor.
Neuron 86, 1–11, April 22, 2015 ª2015 Elsevier Inc. 5
Please cite this article in press as: Lombardo et al., Different Functional Neural Substrates for Good and Poor Language Outcome in Autism, Neuron(2015), http://dx.doi.org/10.1016/j.neuron.2015.03.023

with these meta-analytically defined activation patterns for gen-
eral auditory processing, with ASD Poor possessing the biggest
effect size (TD, t(23) = 3.15, p = 0.004, Cohen’s d = 0.64; LD/DD,
t(18) = 3.22, p = 0.004, Cohen’s d = 0.73; ASDGood, t(35) = 5.13,
p = 1.05 3 10�5, Cohen’s d = 0.85; ASD Poor, t(23) = 4.43, p =
0.0001, Cohen’s d = 0.90). Dot plots showing individual data
points are shown in Figures S4E and S4F. These results show
that activation patterns linked back to general auditory process-
ing are intact across all groups including ASD Poor. In contrast,
for activation patterns characteristic of language and speech,
there is little multi-voxel pattern similarity on average at the group
level in ASD Poor, and their pattern similarity was markedly
reduced compared to all other groups.
Further analysis on the topic of general auditory processing
was done by specifically examining activation response within
a primary auditory cortex ROI. Here we did not find any signifi-
cant differences between groups in an ANCOVA (F(3,97) =
0.89, p = 0.44, partial h2 = 0.027). TD, LD/DD, and ASD Good
all showed sizeable effect sizes for non-zero activation in this re-
gion (e.g., Cohen’s d > 0.54, one-tailed p < 0.006). For ASD Poor,
a one-sample t test shows that there is weak group-level activa-
tion at trend-level significance for being different from 0 (t(23) =
1.67, one-tailed p = 0.054, Cohen’s d = 0.33) (Figure S3; Table
S4). Montages of single-subject analyses in ASD Poor, thresh-
olded at liberal uncorrected levels in order to show any subtle
extent of activation, demonstrate, however, that this effect is
not particularly robust at the level of individuals (Figure S3).
In contrast to analyses comparing all speech conditions to
rest, we also compared forward versus backwards speech as
a further higher-level contrast specific to intelligible speech pro-
cessing. All analyses on this forward versus backward contrast
yielded no significant differences in canonical neural systems
for language processing (i.e., NeuroSynth temporal and frontal
ROIs), either at thewithin-group or between-group level. Further-
more, whole-brain analyses additionally showed no evidence for
differentiation of forward from backward speech in temporal or
frontal areas. Rather, whole-brain analyses showed that only
the TD group recruited areas in thalamus, retrosplenial, and oc-
cipital cortex significantly more for forward compared to back-
ward speech. The sole recruitment of these areas in the TD group
was also manifested in a significant between-group whole-brain
analysis showing increased activation in TD compared all other
groups (Table S3, Figure S6).
Multivariate Brain-Behavior Relationships at Intake and
Outcome
Next, we looked at brain-behavior relationships between lan-
guage-related behavioral measures (e.g., Mullen EL and RL
subscales and the Vineland Communication subscale) at both
intake and outcome time points and neural contrast measured
from all speech versus rest contrast. To achieve these aims,
we used partial least-squares correlation (PLSC) analyses
(Krishnan et al., 2011; McIntosh and Lobaugh, 2004). PLSC anal-
ysis is most appropriate for this particular aim, as the two data-
sets (i.e., brain and language-related behavioral measures) are
both multivariate and show high degrees of correlation. For
such situations, PLSC finds latent variable (LV) brain-behavioral
pairings that maximally covary and which are uncorrelated
with other brain-behavior LV pairs. PLSC also assesses the
null hypothesis of whether the observed strength of brain-
behavior relationships, noted by the singular value (‘‘d’’) for
each LV pair, would emerge frequently under chance conditions
(i.e., permutation test, 10,000 iterations) and can descriptively
unveil how such multivariate brain-behavior relationships mani-
fest as covariation patterns of distributed neural response and
multivariate behavioral patterns (see Krishnan et al., 2011 for
primer on PLSC applied to neuroimaging).
PLSC highlighted one significant brain-behavior LV pair (LV1:
d = 73.90, p = 0.031) that accounted for 29.60% of the covari-
ance in the data. Brain regions that make the strongest contribu-
tions toward LV1 (Figures 4C and 4D) are split into two types. The
first are regions shown in hot colors in Figures 4C and 4D and are
generally located within ‘‘language’’-related superior and inferior
temporal cortices, anterior lateral and medial prefrontal cortex,
subcortical regions in amygdala, hippocampus, and ventral
striatum, as well as anterior cingulate and insular cortices. These
brain regions all show a directionality of brain-behavioral corre-
lations shown in Figure 4A; that is, gradient descent in correlation
strength across groups, from robust positive correlations in TD
to less-strong positive correlations in LD/DD, followed by weak
negative correlations in ASD Good and robust negative correla-
tions in ASD Poor. The second set of regions shown in cool
colors in Figures 4C and 4D are generally located within frontal
and temporally connected segments of the thalamus (Behrens
et al., 2003), somatomotor-connected segments of cerebellar re-
gions Crus IV and V (Buckner et al., 2011), supplementary and
pre-supplementary motor areas (SMA, pre-SMA), motor and
premotor cortices, and primary visual cortex. These brain re-
gions all show a directionality of brain-behavioral correlations
shown in Figure 4B, which are the direct opposite of that shown
in Figure 4A; that is, gradient ascent from robust negative corre-
lations in TD to weak negative correlations in LD/DD, followed by
weak positive correlations in ASD Good and robust positive cor-
relations in ASD Poor. It is clear from these plots that there is a
reversal in the directionality of brain-behavioral correlations in
ASD subgroups compared to TD, with the strongest and most
pervasive reversal apparent in the ASD Poor group. In ASD
Good, however, this atypical reversal was less severe when as-
sessing the brain-outcome behavioral relationship, and this may
be indicative of a different developmental process emerging in
ASD Good that allows such brain-behavioral relationships to
approach those seen in LD/DD.
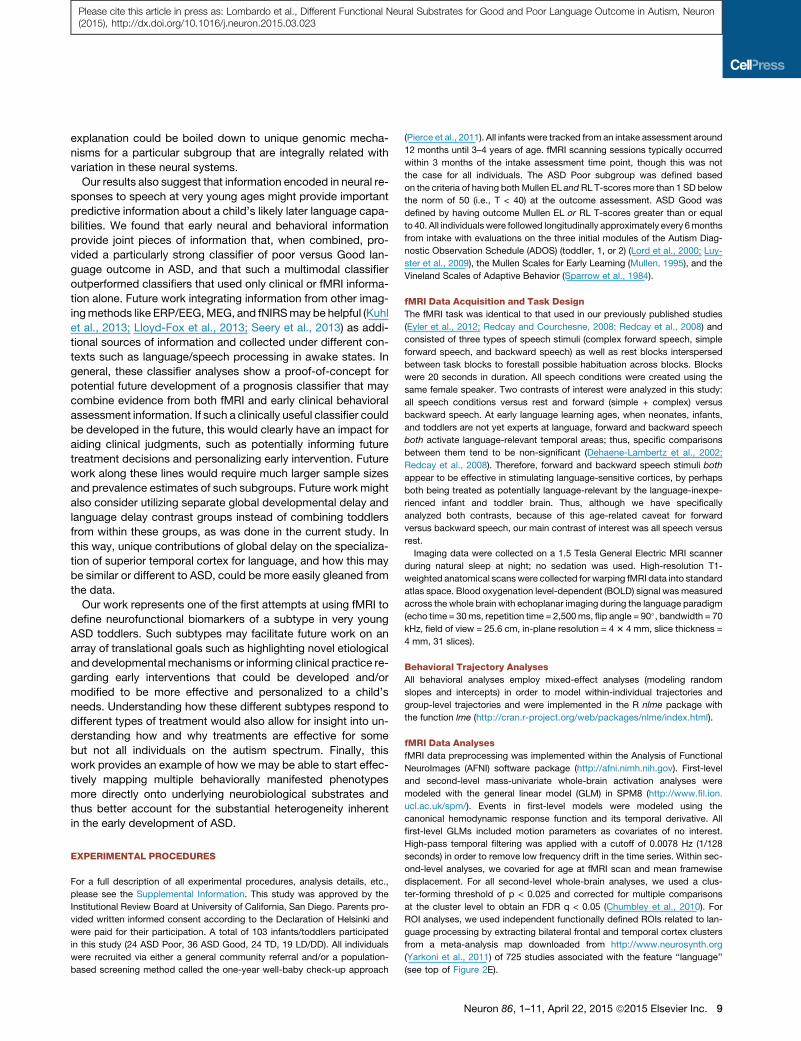
Predicting Poor versus Good Language Prognosis
within ASD
Finally, we asked the important clinical question of how informa-
tion from behavioral and functional neuroimaging measures at
pre-diagnostic ages (i.e., the earliest clinical intake time point)
could be used in the context of predicting poor versus good
language prognosis within ASD. Our primary aim in this analysis
was to assess the predictive power that fMRI data have at an
individual level for classifying ASD Poor versus ASD Good
compared to other early clinical behavioral measures, or to
determine whether a multimodal combination of early clinical
behavioral and fMRI data could provide a potentially more prom-
ising prognostic classifier. Here we used a partial least-squares
linear discriminant classifier with 5-fold cross-validation to
obtain estimates of performance when using various types of
6 Neuron 86, 1–11, April 22, 2015 ª2015 Elsevier Inc.
Please cite this article in press as: Lombardo et al., Different Functional Neural Substrates for Good and Poor Language Outcome in Autism, Neuron(2015), http://dx.doi.org/10.1016/j.neuron.2015.03.023

features, such as the ADOS at intake alone, clinical measures
at intake alone (Mullen + Vineland + ADOS), fMRI alone (e.g.,
speech-related activation from the left hemisphere superior tem-
poral cortex ROI derived from NeuroSynth), or a multimodal
combination of clinical intake measures and fMRI. Comparing
these different classifiers based on area under the curve (AUC)
values, we find that the multimodal combination of clinical intake
measures plus left hemisphere superior temporal cortex activa-
tion outperformed all other classifiers (AUC = 81). Classifiers that
used either ADOS alone, clinical intake measures alone, or fMRI
alone performed similarly in terms of near-identical AUC values
(AUC ranging from 67 to 70) (see Figure 5).
DISCUSSION
In this study we discovered functional neuroimaging biomarkers
underlying one of the theoretically and clinically most important
areas of developmental heterogeneity in autism: early language
TDLD/DDGoodPoor
AS
D
Intake Outcome Intake Outcome Intake OutcomeMullen Expressive
Language (EL)Mullen Receptive
Language (RL)Vineland
Communication
*
*
* *
*
*
** *
* **
**
*
BSR
-2
-4
-6
2
4
6
8
A
B
C
D
Intake Outcome Intake Outcome Intake OutcomeMullen Expressive
Language (EL)Mullen Receptive
Language (RL)Vineland
Communication
*
*
**
* **
**
*
**
**
*
TDLD/DDGoodPoor
AS
D
Figure 4. Multivariate Brain-Behavioral Relationship Analyses
(A–D) This figure shows large-scale neural systems where all speech versus rest fMRI response covaries with multivariate behavioral patterns of variation in
language ability measured at intake and outcome time points. PLSC analysis highlighted one significant brain-behavioral latent variable pair (LV1; d = 73.90, p =
0.031; 29.60% covariance explained), and the strength of brain-behavioral relationships for LV1 are shown in (A) and (B), while the voxels that most robustly
express such relationships are shown in (C) and (D). (A) depicts the directionality of brain-behavioral relationships for hot-colored brain regions in (C) and (D), while
(B) depicts the directionality of brain-behavioral correlations for cool-colored brain regions in (C) and (D). Within the bar plots in (A) and (B), bars are stratified by
language measure (Mullen expressive [EL] or receptive [RL] language or Vineland Communication) and by the developmental time point at which they were
measured (e.g., intake or outcome assessment). Error bars indicate the 95%confidence intervals estimated from bootstrapping (10,000 resamples). The coloring
of the bars indicate different groups (red = TD, green = LD/DD, blue = ASD Good, purple = ASD Poor). Stars above specific bars indicate where the brain-
behavioral relationship is non-zero (i.e., 95% CIs do not encompass 0), and these are specific relationships that reliably contribute to the overall PLS relationship
for LV1. The coloring in (C) and (D) reflects the bootstrap ratio (BSR), which is analogous to a pseudo z-statistic and can be interpreted accordingly. Only voxels in
(C) and (D) with BSR values greater than 1.96 or less than�1.96 are shown, as these are the primary voxels showing the biggest contributions to the overall pattern
being expressed by LV1. BSR, bootstrap ratio; EL, Mullen expressive language; RL, Mullen receptive language; ASD, autism spectrum disorder; TD, typical
development; LD/DD, language/developmental delay.
Neuron 86, 1–11, April 22, 2015 ª2015 Elsevier Inc. 7
Please cite this article in press as: Lombardo et al., Different Functional Neural Substrates for Good and Poor Language Outcome in Autism, Neuron(2015), http://dx.doi.org/10.1016/j.neuron.2015.03.023
development. Prior to this work, neurobiological explanations
were lacking for why clinical courses in toddlers and young
children with ASD are so heterogeneous, with some worsening
and others improving with development. Here we have shown
that subgrouping the ASD population based on early childhood
language outcome represents a developmentally and neuro-
biologically meaningful way to parse this phenotypic heteroge-
neity and identify meaningful biological subtypes. Moreover,
leveraging a rare and large sample size of toddlers from the
general population, our study, for the first time, finds a strong
relationship between levels of aberrance in speech-activation
in language-critical superior temporal cortex and actual real-
world language ability in ASD toddlers.
Developmentally, ASD subgroups defined in this study
showed differential behavioral developmental trajectories of lan-
guage growth over the first 4 years of life. ASD Poor individuals
arrive at their poor outcome levels at 3–4 years through develop-
mental trajectories from 12 months of age that are indicative of
falling further and further behind what is considered age-appro-
priate developmental progress. In contrast, ASD Good shows
steady age-appropriate progress and slight improvement in lan-
guage ability over time. These results are well aligned with other
clinical studies looking at a much larger age range that show
that > 50% of ASD individuals have poor long-term language
outcomes, while the remaining individuals have better long-
term language outcomes (Anderson et al., 2007; Gotham et al.,
2012; Pickles et al., 2014).
Neurally, ASD individuals with good language development
and clinical outcome alongside typically developing and non-
ASD language/developmentally delayed individuals all showed
intact speech-related response of language-relevant superior
temporal cortical areas and in terms of multi-voxel activation
patterning were also very similar. In striking contrast, ASD indi-
viduals with poor language development and outcome showed
a lack functional differentiation in superior temporal cortex to
speech stimuli and showed markedly less similarity in activation
patterning compared to all other groups. Furthermore, in terms
of activation patterning, ASD Poor showed relatively intact acti-
vation patterning related to general auditory processing, but
showed much less activation pattern similarity that was specif-
ically related to language and speech. This result points towards
the interpretation that neural systems for general auditory pro-
cessing are relatively intact in ASD Poor and that the abnormal-
ities observed here are specific to language and speech-related
neural systems dysfunction. Thus, the neural functional sub-
strates of early language presentation and development in ASD
are different for those with good versus poor outcome, and this
very early effect points to distinctly different neural develop-
mental subtypes of ASD. These neural functional findings will
accelerate translational progress on important questions and
topics related to the mechanisms (e.g., molecular, cellular, neu-
ral systems, cognitive, social/environmental) that lead to such
differentiation in the early phenotype of ASD. At the molecular
and cellular levels, prior work has shown that prenatal periods
of brain development are important in ASD (Baron-Cohen
et al., 2015; Courchesne et al., 2011; Parikshak et al., 2013;
Stoner et al., 2014; Willsey et al., 2013), and so genomic and
stem cell methodologies could be used to investigate whether
these ASD Good and Poor neural subtypes reflect different
timing and/or manifestation of etiological mechanisms.
Further underscoring the importance of these different neural
substrates to early language progress and outcome, we also
found in ASD highly atypical relationships between language
development and neural response to speech. Two major sys-
tems were highlighted in these analyses. First, canonical lan-
guage areas, the default mode network, and subcortical regions
involved in reward, emotion, and memory (e.g., hot-colored re-
gions in Figures 4C and 4D) appear to be normatively (i.e., in
the typically developing group) recruited more in individuals
with better language, while other large-scale systems (e.g.,
cool-colored regions in Figures 4C and 4D) were recruited less
by individuals with the best language ability (i.e., somatomotor
cerebellar areas, thalamus, motor, premotor, and primary visual
areas). This trade-off between these two large-scale sets of neu-
ral systems is insightful on its own about typical language devel-
opment and the neural systems that are modulated as a function
of an individual’s early language ability. However, the additional
and perhaps more striking insight for autism is that these brain-
behavioral relationships reverse in directionality, with ASD Poor
being most prominent in showing these atypical reversals that
persist across early intake and outcome time points. In contrast
to ASD Poor, ASD Good toddlers (who had improving language
development) started with intake brain-behavioral relationships
that were atypically reversed, but showed brain-behavior rela-
tionships at clinical outcome that began to approach the TD
and LD/DD groups. The mechanism(s) involved in this atypical
directionality reversal of how brain function is relevant to lan-
guage-related behavioral variation in the early development of
ASD is unknown. One possibility is that because social interac-
tions are critically important for early language development,
early social deficits common to all ASD toddlers may delay early
language learning in ASD Good toddlers despite their good
neural activation to speech. Another non-mutually exclusive
Acc Sens Spec AUC100
90
80
70
60
50
40
30
20
fMRI + [Mullen, Vineland, ADOS]
ADOS
[Mullen, Vineland, ADOS]
fMRI
Features %
Figure 5. Prognostic Classifier Performance within ASD for Models
Using Clinical Behavioral Data, fMRI Data, or Both at Pre-diagnostic
Ages
This figure shows the performance of four classifier models (i.e., partial least-
squares linear discriminant analyses) using different features for the purpose of
distinguishing the ASD Poor from the ASD Good subgroup. All models using
behavioral data (e.g., ADOS,Mullen, Vineland) utilize such information from the
earliest clinical intake time point. Information input into the fMRI classifier are
percent signal change estimates from all speech versus rest from all voxels
within the NeuroSynth left hemisphere superior temporal cortex ROI. Acc,
Accuracy; Sens, Sensitivity; Spec, Specificity; AUC, area under the curve;
ADOS, Autism Diagnostic Observation Schedule.
8 Neuron 86, 1–11, April 22, 2015 ª2015 Elsevier Inc.
Please cite this article in press as: Lombardo et al., Different Functional Neural Substrates for Good and Poor Language Outcome in Autism, Neuron(2015), http://dx.doi.org/10.1016/j.neuron.2015.03.023
explanation could be boiled down to unique genomic mecha-
nisms for a particular subgroup that are integrally related with
variation in these neural systems.
Our results also suggest that information encoded in neural re-
sponses to speech at very young ages might provide important
predictive information about a child’s likely later language capa-
bilities. We found that early neural and behavioral information
provide joint pieces of information that, when combined, pro-
vided a particularly strong classifier of poor versus Good lan-
guage outcome in ASD, and that such a multimodal classifier
outperformed classifiers that used only clinical or fMRI informa-
tion alone. Future work integrating information from other imag-
ingmethods like ERP/EEG,MEG, and fNIRSmay be helpful (Kuhl
et al., 2013; Lloyd-Fox et al., 2013; Seery et al., 2013) as addi-
tional sources of information and collected under different con-
texts such as language/speech processing in awake states. In
general, these classifier analyses show a proof-of-concept for
potential future development of a prognosis classifier that may
combine evidence from both fMRI and early clinical behavioral
assessment information. If such a clinically useful classifier could
be developed in the future, this would clearly have an impact for
aiding clinical judgments, such as potentially informing future
treatment decisions and personalizing early intervention. Future
work along these lines would require much larger sample sizes
and prevalence estimates of such subgroups. Future work might
also consider utilizing separate global developmental delay and
language delay contrast groups instead of combining toddlers
from within these groups, as was done in the current study. In
this way, unique contributions of global delay on the specializa-
tion of superior temporal cortex for language, and how this may
be similar or different to ASD, could be more easily gleaned from
the data.
Our work represents one of the first attempts at using fMRI to
define neurofunctional biomarkers of a subtype in very young
ASD toddlers. Such subtypes may facilitate future work on an
array of translational goals such as highlighting novel etiological
and developmental mechanisms or informing clinical practice re-
garding early interventions that could be developed and/or
modified to be more effective and personalized to a child’s
needs. Understanding how these different subtypes respond to
different types of treatment would also allow for insight into un-
derstanding how and why treatments are effective for some
but not all individuals on the autism spectrum. Finally, this
work provides an example of how we may be able to start effec-
tively mapping multiple behaviorally manifested phenotypes
more directly onto underlying neurobiological substrates and
thus better account for the substantial heterogeneity inherent
in the early development of ASD.
EXPERIMENTAL PROCEDURES
For a full description of all experimental procedures, analysis details, etc.,
please see the Supplemental Information. This study was approved by the
Institutional Review Board at University of California, San Diego. Parents pro-
vided written informed consent according to the Declaration of Helsinki and
were paid for their participation. A total of 103 infants/toddlers participated
in this study (24 ASD Poor, 36 ASD Good, 24 TD, 19 LD/DD). All individuals
were recruited via either a general community referral and/or a population-
based screening method called the one-year well-baby check-up approach
(Pierce et al., 2011). All infants were tracked from an intake assessment around
12 months until 3–4 years of age. fMRI scanning sessions typically occurred
within 3 months of the intake assessment time point, though this was not
the case for all individuals. The ASD Poor subgroup was defined based
on the criteria of having both Mullen EL andRL T-scores more than 1 SD below
the norm of 50 (i.e., T < 40) at the outcome assessment. ASD Good was
defined by having outcome Mullen EL or RL T-scores greater than or equal
to 40. All individuals were followed longitudinally approximately every 6months
from intake with evaluations on the three initial modules of the Autism Diag-
nostic Observation Schedule (ADOS) (toddler, 1, or 2) (Lord et al., 2000; Luy-
ster et al., 2009), the Mullen Scales for Early Learning (Mullen, 1995), and the
Vineland Scales of Adaptive Behavior (Sparrow et al., 1984).
fMRI Data Acquisition and Task Design
The fMRI task was identical to that used in our previously published studies
(Eyler et al., 2012; Redcay and Courchesne, 2008; Redcay et al., 2008) and
consisted of three types of speech stimuli (complex forward speech, simple
forward speech, and backward speech) as well as rest blocks interspersed
between task blocks to forestall possible habituation across blocks. Blocks
were 20 seconds in duration. All speech conditions were created using the
same female speaker. Two contrasts of interest were analyzed in this study:
all speech conditions versus rest and forward (simple + complex) versus
backward speech. At early language learning ages, when neonates, infants,
and toddlers are not yet experts at language, forward and backward speech
both activate language-relevant temporal areas; thus, specific comparisons
between them tend to be non-significant (Dehaene-Lambertz et al., 2002;
Redcay et al., 2008). Therefore, forward and backward speech stimuli both
appear to be effective in stimulating language-sensitive cortices, by perhaps
both being treated as potentially language-relevant by the language-inexpe-
rienced infant and toddler brain. Thus, although we have specifically
analyzed both contrasts, because of this age-related caveat for forward
versus backward speech, our main contrast of interest was all speech versus
rest.
Imaging data were collected on a 1.5 Tesla General Electric MRI scanner
during natural sleep at night; no sedation was used. High-resolution T1-
weighted anatomical scans were collected for warping fMRI data into standard
atlas space. Blood oxygenation level-dependent (BOLD) signal was measured
across the whole brain with echoplanar imaging during the language paradigm
(echo time = 30ms, repetition time = 2,500ms, flip angle = 90�, bandwidth = 70
kHz, field of view = 25.6 cm, in-plane resolution = 43 4 mm, slice thickness =
4 mm, 31 slices).
Behavioral Trajectory Analyses
All behavioral analyses employ mixed-effect analyses (modeling random
slopes and intercepts) in order to model within-individual trajectories and
group-level trajectories and were implemented in the R nlme package with
the function lme (http://cran.r-project.org/web/packages/nlme/index.html).
fMRI Data Analyses
fMRI data preprocessing was implemented within the Analysis of Functional
NeuroImages (AFNI) software package (http://afni.nimh.nih.gov). First-level
and second-level mass-univariate whole-brain activation analyses were
modeled with the general linear model (GLM) in SPM8 (http://www.fil.ion.
ucl.ac.uk/spm/). Events in first-level models were modeled using the
canonical hemodynamic response function and its temporal derivative. All
first-level GLMs included motion parameters as covariates of no interest.
High-pass temporal filtering was applied with a cutoff of 0.0078 Hz (1/128
seconds) in order to remove low frequency drift in the time series. Within sec-
ond-level analyses, we covaried for age at fMRI scan and mean framewise
displacement. For all second-level whole-brain analyses, we used a clus-
ter-forming threshold of p < 0.025 and corrected for multiple comparisons
at the cluster level to obtain an FDR q < 0.05 (Chumbley et al., 2010). For
ROI analyses, we used independent functionally defined ROIs related to lan-
guage processing by extracting bilateral frontal and temporal cortex clusters
from a meta-analysis map downloaded from http://www.neurosynth.org
(Yarkoni et al., 2011) of 725 studies associated with the feature ‘‘language’’
(see top of Figure 2E).
Neuron 86, 1–11, April 22, 2015 ª2015 Elsevier Inc. 9
Please cite this article in press as: Lombardo et al., Different Functional Neural Substrates for Good and Poor Language Outcome in Autism, Neuron(2015), http://dx.doi.org/10.1016/j.neuron.2015.03.023
Multi-Voxel Pattern Similarity Analyses
Two separate multi-voxel pattern similarity analyses were conducted. The
first assessed similarity between each group’s second-level activation map
(i.e., t-statistic map), masked for only voxels within the NeuroSynth language
map. The resulting correlation matrix was converted into a dissimilarity matrix
(i.e., 1-r) and entered into canonical multidimensional scaling to reduce dimen-
sionality down to a two dimensions for visualization of the separation between
ASD Poor and all other groups. The second analysis compared individual
subjects’ activation maps (i.e., first-level t-statistic maps) with specific Neuro-
Synth featuremaps constructed specifically for the purposes of testing similar-
ity with meta-analytic knowledge about neural systems for general auditory
processing outside the domain of language and speech or for meta-analytic
knowledge about neural systems that are specific to language and speech
(see Supplemental Information for more details).
Brain-Behavior Relationship Analysis
Brain-behavior relationships were assessed with the multivariate technique of
PLSC analysis (Krishnan et al., 2011; McIntosh and Lobaugh, 2004). All PLSC
analyses were implemented with the plsgui Matlab toolbox (http://www.
rotman-baycrest.on.ca/pls/). The number of permutations and bootstrap re-
samples were each set to 10,000 (see Supplemental Information for more
details).
Classifier Analyses
Classifier analyses used partial least-squares linear discriminant analyses
with 5-fold cross-validation implemented with the Matlab toolbox libPLS
(http://www.libpls.net). Features for the classifiers consisted of behavioral
measures taken from the earliest clinical intake time point or using fMRI
speech-related activation (i.e., percent signal change for all speech versus
rest) from all voxels extracted from the NeuroSynth-defined left hemisphere
superior temporal cortex ROI. The distinction being made in each classifier
was the distinction between ASD Poor versus ASD Good. Receiver operating
characteristic (ROC) curves and AUC values were computed for each classi-
fier in order to determine which of the four classifiers performed best, and
accuracy, sensitivity, and specificity were also computed as measures of
classifier performance.
SUPPLEMENTAL INFORMATION
Supplemental Information includes Supplemental Experimental Procedures,
six figures, and four tables and can be found with this article online at http://
dx.doi.org/10.1016/j.neuron.2015.03.023.
ACKNOWLEDGMENTS
This work was supported by NIMH Autism Center of Excellence grant P50-
MH081755 (E.C.), NIMH R01-MH080134 (K.P.), NFAR grant (K.P.), NIMH
R01-MH036840 (E.C.), and fellowships from Jesus College, Cambridge and
the British Academy (M.V.L.). We thank Richard Znamirowski, Maisi Mayo,
and Julia Young for help with data collection and Stuart Spendlove and Mela-
nie Weinfeld for assistance with clinical characterization of subjects.
Received: October 14, 2014
Revised: January 18, 2015
Accepted: March 5, 2015
Published: April 9, 2015
REFERENCES
Anderson, D.K., Lord, C., Risi, S., DiLavore, P.S., Shulman, C., Thurm, A.,
Welch, K., and Pickles, A. (2007). Patterns of growth in verbal abilities among
children with autism spectrum disorder. J. Consult. Clin. Psychol. 75, 594–604.
Bacon, E.C., Dufek, S., Schreibman, L., Stahmer, A.C., Pierce, K., and
Courchesne, E. (2014). Measuring outcome in an early intervention program
for toddlers with autism spectrum disorder: use of a curriculum-based assess-
ment. Autism Res. Treat. 2014, 964704.
Baron-Cohen, S., Auyeung, B., Nørgaard-Pedersen, B., Hougaard, D.,
Abdallah, M., Melgaard, L., Cohen, A.S., Chakrabarti, B., Ruta, L., and
Lombardo, M.V. (2015). Elevated fetal steroidogenic activity in autism. Mol.
Psychiatry 20, 369–376.
Behrens, T.E., Johansen-Berg, H., Woolrich, M.W., Smith, S.M., Wheeler-
Kingshott, C.A., Boulby, P.A., Barker, G.J., Sillery, E.L., Sheehan, K.,
Ciccarelli, O., et al. (2003). Non-invasive mapping of connections between hu-
man thalamus and cortex using diffusion imaging. Nat. Neurosci. 6, 750–757.
Bennett, T., Szatmari, P., Bryson, S., Volden, J., Zwaigenbaum, L., Vaccarella,
L., Duku, E., and Boyle, M. (2008). Differentiating autism and Asperger syn-
drome on the basis of language delay or impairment. J. Autism Dev. Disord.
38, 616–625.
Billstedt, E., Gillberg, I.C., and Gillberg, C. (2005). Autism after adolescence:
population-based 13- to 22-year follow-up study of 120 individuals with autism
diagnosed in childhood. J. Autism Dev. Disord. 35, 351–360.
Buckner, R.L., Krienen, F.M., Castellanos, A., Diaz, J.C., and Yeo, B.T. (2011).
The organization of the human cerebellum estimated by intrinsic functional
connectivity. J. Neurophysiol. 106, 2322–2345.
Chumbley, J., Worsley, K., Flandin, G., and Friston, K. (2010). Topological FDR
for neuroimaging. Neuroimage 49, 3057–3064.
Courchesne, E., Mouton, P.R., Calhoun, M.E., Semendeferi, K., Ahrens-
Barbeau, C., Hallet, M.J., Barnes, C.C., and Pierce, K. (2011). Neuron number
and size in prefrontal cortex of children with autism. JAMA 306, 2001–2010.
Dehaene-Lambertz, G., Dehaene, S., and Hertz-Pannier, L. (2002). Functional
neuroimaging of speech perception in infants. Science 298, 2013–2015.
Dehaene-Lambertz, G., Hertz-Pannier, L., Dubois, J., Meriaux, S., Roche, A.,
Sigman, M., and Dehaene, S. (2006). Functional organization of perisylvian
activation during presentation of sentences in preverbal infants. Proc. Natl.
Acad. Sci. USA 103, 14240–14245.
Dinstein, I., Pierce, K., Eyler, L., Solso, S., Malach, R., Behrmann, M., and
Courchesne, E. (2011). Disrupted neural synchronization in toddlers with
autism. Neuron 70, 1218–1225.
Dinstein, I., Heeger, D.J., Lorenzi, L., Minshew, N.J., Malach, R., and
Behrmann, M. (2012). Unreliable evoked responses in autism. Neuron 75,
981–991.
Eapen, V., Crn�cec, R., and Walter, A. (2013). Exploring Links between
Genotypes, Phenotypes, and Clinical Predictors of Response to Early
Intensive Behavioral Intervention in Autism Spectrum Disorder. Front. Hum.
Neurosci. 7, 567.
Ellis Weismer, S., Lord, C., and Esler, A. (2010). Early language patterns of tod-
dlers on the autism spectrum compared to toddlers with developmental delay.
J. Autism Dev. Disord. 40, 1259–1273.
Eyler, L.T., Pierce, K., and Courchesne, E. (2012). A failure of left temporal cor-
tex to specialize for language is an early emerging and fundamental property of
autism. Brain 135, 949–960.
Fein, D., Barton, M., Eigsti, I.M., Kelley, E., Naigles, L., Schultz, R.T., Stevens,
M., Helt, M., Orinstein, A., Rosenthal, M., et al. (2013). Optimal outcome in in-
dividuals with a history of autism. J. Child Psychol. Psychiatry 54, 195–205.
Geschwind, D.H., and Levitt, P. (2007). Autism spectrum disorders: develop-
mental disconnection syndromes. Curr. Opin. Neurobiol. 17, 103–111.
Gillberg, C., and Steffenburg, S. (1987). Outcome and prognostic factors in in-
fantile autism and similar conditions: a population-based study of 46 cases fol-
lowed through puberty. J. Autism Dev. Disord. 17, 273–287.
Gotham, K., Pickles, A., and Lord, C. (2012). Trajectories of autism severity in
children using standardized ADOS scores. Pediatrics 130, e1278–e1284.
Haigh, S.M., Heeger, D.J., Dinstein, I., Minshew, N., and Behrmann, M. (2014).
Cortical Variability in the Sensory-Evoked Response in Autism. J. Autism Dev.
Disord. Published online October 19, 2014. http://dx.doi.org/10.1007/s10803-
014-2276-6.
Hickok, G., and Poeppel, D. (2007). The cortical organization of speech pro-
cessing. Nat. Rev. Neurosci. 8, 393–402.
10 Neuron 86, 1–11, April 22, 2015 ª2015 Elsevier Inc.
Please cite this article in press as: Lombardo et al., Different Functional Neural Substrates for Good and Poor Language Outcome in Autism, Neuron(2015), http://dx.doi.org/10.1016/j.neuron.2015.03.023
Howlin, P. (2003). Outcome in high-functioning adults with autism with and
without early language delays: implications for the differentiation between
autism and Asperger syndrome. J. Autism Dev. Disord. 33, 3–13.
Howlin, P., Mawhood, L., and Rutter, M. (2000). Autism and developmental
receptive language disorder—a follow-up comparison in early adult life. II:
Social, behavioural, and psychiatric outcomes. J. Child Psychol. Psychiatry
41, 561–578.
Howlin, P., Savage, S., Moss, P., Tempier, A., and Rutter, M. (2014). Cognitive
and language skills in adults with autism: a 40-year follow-up. J. Child Psychol.
Psychiatry 55, 49–58.
Kapur, S., Phillips, A.G., and Insel, T.R. (2012). Why has it taken so long for bio-
logical psychiatry to develop clinical tests and what to do about it? Mol.
Psychiatry 17, 1174–1179.
Kjelgaard, M.M., and Tager-Flusberg, H. (2001). An Investigation of Language
Impairment in Autism: Implications for Genetic Subgroups. Lang. Cogn.
Process. 16, 287–308.
Kriegeskorte, N., Mur, M., and Bandettini, P. (2008a). Representational similar-
ity analysis - connecting the branches of systems neuroscience. Front. Syst.
Neurosci. 2, 4.
Kriegeskorte, N., Mur,M., Ruff, D.A., Kiani, R., Bodurka, J., Esteky, H., Tanaka,
K., and Bandettini, P.A. (2008b). Matching categorical object representations
in inferior temporal cortex of man and monkey. Neuron 60, 1126–1141.
Krishnan, A., Williams, L.J., McIntosh, A.R., and Abdi, H. (2011). Partial Least
Squares (PLS) methods for neuroimaging: a tutorial and review. Neuroimage
56, 455–475.
Kuhl, P.K., Coffey-Corina, S., Padden, D., Munson, J., Estes, A., and Dawson,
G. (2013). Brain responses to words in 2-year-olds with autism predict devel-
opmental outcomes at age 6. PLoS ONE 8, e64967.
Lloyd-Fox, S., Blasi, A., Elwell, C.E., Charman, T., Murphy, D., and Johnson,
M.H. (2013). Reduced neural sensitivity to social stimuli in infants at risk for
autism. Proc. Biol. Sci. 280, 20123026.
Lord, C., Risi, S., Lambrecht, L., Cook, E.H., Jr., Leventhal, B.L., DiLavore,
P.C., Pickles, A., and Rutter, M. (2000). The autism diagnostic observation
schedule-generic: a standard measure of social and communication deficits
associated with the spectrum of autism. J. Autism Dev. Disord. 30, 205–223.
Lord, C., Luyster, R., Guthrie, W., and Pickles, A. (2012). Patterns of develop-
mental trajectories in toddlers with autism spectrum disorder. J. Consult. Clin.
Psychol. 80, 477–489.
Lovaas, O.I. (1987). Behavioral treatment and normal educational and intellec-
tual functioning in young autistic children. J. Consult. Clin. Psychol. 55, 3–9.
Luyster, R., Gotham, K., Guthrie, W., Coffing, M., Petrak, R., Pierce, K.,
Bishop, S., Esler, A., Hus, V., Oti, R., et al. (2009). The Autism Diagnostic
Observation Schedule-toddler module: a new module of a standardized diag-
nostic measure for autism spectrum disorders. J. Autism Dev. Disord. 39,
1305–1320.
McEachin, J.J., Smith, T., and Lovaas, O.I. (1993). Long-term outcome for chil-
dren with autism who received early intensive behavioral treatment. Am. J.
Ment. Retard. 97, 359–372, discussion 373–391.
McIntosh, A.R., and Lobaugh, N.J. (2004). Partial least squares analysis of
neuroimaging data: applications and advances. Neuroimage 23 (1), S250–
S263.
Mullen, E.M. (1995). Mullen scales of early learning. (Circle Pine, MN: American
Guidance Service, Inc).
Nichols, T., Brett, M., Andersson, J., Wager, T., and Poline, J.B. (2005). Valid
conjunction inference with the minimum statistic. Neuroimage 25, 653–660.
Parikshak, N.N., Luo, R., Zhang, A., Won, H., Lowe, J.K., Chandran, V.,
Horvath, S., and Geschwind, D.H. (2013). Integrative functional genomic ana-
lyses implicate specific molecular pathways and circuits in autism. Cell 155,
1008–1021.
Perry, A., Cummings, A., Geier, J.D., Freeman, N.L., Hughes, S., Managhan,
T., Reitzel, J., and Williams, J. (2011). Predictors of outcome for children
receiving intensive behavioral intervention in a large, community-based pro-
gram. Res. Autism Spectr. Disord. 5, 592–603.
Pickles, A., Anderson, D.K., and Lord, C. (2014). Heterogeneity and plasticity in
the development of language: a 17-year follow-up of children referred early for
possible autism. J. Child Psychol. Psychiatry 55, 1354–1362.
Pierce, K., Carter, C., Weinfeld, M., Desmond, J., Hazin, R., Bjork, R., and
Gallagher, N. (2011). Detecting, studying, and treating autism early: the one-
year well-baby check-up approach. J. Pediatr. 159, 458, e1–e6.
Redcay, E., and Courchesne, E. (2008). Deviant functional magnetic reso-
nance imaging patterns of brain activity to speech in 2-3-year-old children
with autism spectrum disorder. Biol. Psychiatry 64, 589–598.
Redcay, E., Haist, F., and Courchesne, E. (2008). Functional neuroimaging of
speech perception during a pivotal period in language acquisition. Dev. Sci.
11, 237–252.
Seery, A.M., Vogel-Farley, V., Tager-Flusberg, H., and Nelson, C.A. (2013).
Atypical lateralization of ERP response to native and non-native speech in in-
fants at risk for autism spectrum disorder. Dev Cogn Neurosci 5, 10–24.
Sparrow, S., Balla, D., and Cicchetti, D. (1984). Vineland Scales of Adaptive
Behavior: Interview edition, survey form manual. (Circle Pines, MN:
American Guidance Service).
Stoner, R., Chow, M.L., Boyle, M.P., Sunkin, S.M., Mouton, P.R., Roy, S.,
Wynshaw-Boris, A., Colamarino, S.A., Lein, E.S., and Courchesne, E. (2014).
Patches of disorganization in the neocortex of children with autism. N. Engl.
J. Med. 370, 1209–1219.
Szatmari, P., Bryson, S.E., Streiner, D.L., Wilson, F., Archer, L., and Ryerse, C.
(2000). Two-year outcome of preschool children with autism or Asperger’s
syndrome. Am. J. Psychiatry 157, 1980–1987.
Szatmari, P., Bryson, S.E., Boyle, M.H., Streiner, D.L., and Duku, E. (2003).
Predictors of outcome among high functioning children with autism and
Asperger syndrome. J. Child Psychol. Psychiatry 44, 520–528.
Szatmari, P., Bryson, S., Duku, E., Vaccarella, L., Zwaigenbaum, L., Bennett,
T., and Boyle, M.H. (2009). Similar developmental trajectories in autism and
Asperger syndrome: from early childhood to adolescence. J. Child Psychol.
Psychiatry 50, 1459–1467.
Tager-Flusberg, H., and Kasari, C. (2013). Minimally verbal school-aged chil-
dren with autism spectrum disorder: the neglected end of the spectrum.
Autism Res. 6, 468–478.
Venter, A., Lord, C., and Schopler, E. (1992). A follow-up study of high-func-
tioning autistic children. J. Child Psychol. Psychiatry 33, 489–507.
Willsey, A.J., Sanders, S.J., Li, M., Dong, S., Tebbenkamp, A.T., Muhle, R.A.,
Reilly, S.K., Lin, L., Fertuzinhos, S., Miller, J.A., et al. (2013). Coexpression net-
works implicate human midfetal deep cortical projection neurons in the path-
ogenesis of autism. Cell 155, 997–1007.
Yan, C.G., Cheung, B., Kelly, C., Colcombe, S., Craddock, R.C., Di Martino, A.,
Li, Q., Zuo, X.N., Castellanos, F.X., and Milham, M.P. (2013). A comprehensive
assessment of regional variation in the impact of head micromovements on
functional connectomics. Neuroimage 76, 183–201.
Yarkoni, T., Poldrack, R.A., Nichols, T.E., Van Essen, D.C., and Wager, T.D.
(2011). Large-scale automated synthesis of human functional neuroimaging
data. Nat. Methods 8, 665–670.
Neuron 86, 1–11, April 22, 2015 ª2015 Elsevier Inc. 11
Please cite this article in press as: Lombardo et al., Different Functional Neural Substrates for Good and Poor Language Outcome in Autism, Neuron(2015), http://dx.doi.org/10.1016/j.neuron.2015.03.023
Copyright © 2022 FDOKUMEN