Differences in mtDNA haplogroup distribution among 3 Jewish populations alter susceptibility to T2DM...
11
BioMed Central Page 1 of 11 (page number not for citation purposes) BMC Genomics Open Access Research article Differences in mtDNA haplogroup distribution among 3 Jewish populations alter susceptibility to T2DM complications Jeanette Feder 1 , Ilana Blech 2 , Ofer Ovadia 1 , Shirly Amar 3 , Julio Wainstein 4,5 , Itamar Raz 4,6 , Sarah Dadon 1 , Dan E Arking 7 , Benjamin Glaser 2,4 and Dan Mishmar* 1 Address: 1 Department of Life Sciences and National Institute of Biotechnology in the Negev (NIBN), Ben-Gurion University of the Negev, Beer- Sheva, Israel, 2 Endocrinology and Metabolism Service, Internal Medicine Department, Hadassah-Hebrew University Medical Center, Jerusalem, Israel, 3 Stanley Research Center, Ben-Gurion University of the Negev and Mental Health Center, Beer-Sheva, Israel, 4 Israel Diabetes Research Group (IDRG), Israel, 5 Wolfson Hospital, Holon, Israel, 6 Diabetes Unit, Internal Medicine Department, Hadassah-Hebrew University Medical Center, Jerusalem, Israel and 7 McKusick-Nathans Institute of Genetic Medicine, Johns Hopkins University School of Medicine, Baltimore, Maryland 21205, USA Email: Jeanette Feder - [email protected]; Ilana Blech - [email protected]; Ofer Ovadia - [email protected]; Shirly Amar - [email protected]; Julio Wainstein - [email protected]; Itamar Raz - [email protected]; Sarah Dadon - [email protected]; Dan E Arking - [email protected]; Benjamin Glaser - [email protected]; Dan Mishmar* - [email protected] * Corresponding author Abstract Background: Recent genome-wide association studies searching for candidate susceptibility loci for common complex diseases such as type 2 diabetes mellitus (T2DM) and its common complications have uncovered novel disease-associated genes. Nevertheless these large-scale population screens often overlook the tremendous variation in the mitochondrial genome (mtDNA) and its involvement in complex disorders. Results: We have analyzed the mitochondrial DNA (mtDNA) genetic variability in Ashkenazi (Ash), Sephardic (Seph) and North African (NAF) Jewish populations (total n = 1179). Our analysis showed significant differences (p < 0.001) in the distribution of mtDNA genetic backgrounds (haplogroups) among the studied populations. To test whether these differences alter the pattern of disease susceptibility, we have screened our three Jewish populations for an association of mtDNA genetic haplogroups with T2DM complications. Our results identified population-specific susceptibility factors of which the best example is the Ashkenazi Jewish specific haplogroup N1b1, having an apparent protective effect against T2DM complications in Ash (p = 0.006), being absent in the NAF population and under-represented in the Seph population. We have generated and analyzed whole mtDNA sequences from the disease associated haplogroups revealing mutations in highly conserved positions that are good candidates to explain the phenotypic effect of these genetic backgrounds. Conclusion: Our findings support the possibility that recent bottleneck events leading to over- representation of minor mtDNA alleles in specific genetic isolates, could result in population- specific susceptibility loci to complex disorders. Published: 29 April 2008 BMC Genomics 2008, 9:198 doi:10.1186/1471-2164-9-198 Received: 24 September 2007 Accepted: 29 April 2008 This article is available from: http://www.biomedcentral.com/1471-2164/9/198 © 2008 Feder et al; licensee BioMed Central Ltd. This is an Open Access article distributed under the terms of the Creative Commons Attribution License (http://creativecommons.org/licenses/by/2.0 ), which permits unrestricted use, distribution, and reproduction in any medium, provided the original work is properly cited.
Transcript of Differences in mtDNA haplogroup distribution among 3 Jewish populations alter susceptibility to T2DM...

BioMed CentralBMC Genomics
ss
Open AcceResearch articleDifferences in mtDNA haplogroup distribution among 3 Jewish populations alter susceptibility to T2DM complicationsJeanette Feder1, Ilana Blech2, Ofer Ovadia1, Shirly Amar3, Julio Wainstein4,5, Itamar Raz4,6, Sarah Dadon1, Dan E Arking7, Benjamin Glaser2,4 and Dan Mishmar*1Address: 1Department of Life Sciences and National Institute of Biotechnology in the Negev (NIBN), Ben-Gurion University of the Negev, Beer-Sheva, Israel, 2Endocrinology and Metabolism Service, Internal Medicine Department, Hadassah-Hebrew University Medical Center, Jerusalem, Israel, 3Stanley Research Center, Ben-Gurion University of the Negev and Mental Health Center, Beer-Sheva, Israel, 4Israel Diabetes Research Group (IDRG), Israel, 5Wolfson Hospital, Holon, Israel, 6Diabetes Unit, Internal Medicine Department, Hadassah-Hebrew University Medical Center, Jerusalem, Israel and 7McKusick-Nathans Institute of Genetic Medicine, Johns Hopkins University School of Medicine, Baltimore, Maryland 21205, USA
Email: Jeanette Feder - [email protected]; Ilana Blech - [email protected]; Ofer Ovadia - [email protected]; Shirly Amar - [email protected]; Julio Wainstein - [email protected]; Itamar Raz - [email protected]; Sarah Dadon - [email protected]; Dan E Arking - [email protected]; Benjamin Glaser - [email protected]; Dan Mishmar* - [email protected]
* Corresponding author
AbstractBackground: Recent genome-wide association studies searching for candidate susceptibility locifor common complex diseases such as type 2 diabetes mellitus (T2DM) and its commoncomplications have uncovered novel disease-associated genes. Nevertheless these large-scalepopulation screens often overlook the tremendous variation in the mitochondrial genome(mtDNA) and its involvement in complex disorders.
Results: We have analyzed the mitochondrial DNA (mtDNA) genetic variability in Ashkenazi(Ash), Sephardic (Seph) and North African (NAF) Jewish populations (total n = 1179). Our analysisshowed significant differences (p < 0.001) in the distribution of mtDNA genetic backgrounds(haplogroups) among the studied populations. To test whether these differences alter the patternof disease susceptibility, we have screened our three Jewish populations for an association ofmtDNA genetic haplogroups with T2DM complications. Our results identified population-specificsusceptibility factors of which the best example is the Ashkenazi Jewish specific haplogroup N1b1,having an apparent protective effect against T2DM complications in Ash (p = 0.006), being absentin the NAF population and under-represented in the Seph population. We have generated andanalyzed whole mtDNA sequences from the disease associated haplogroups revealing mutations inhighly conserved positions that are good candidates to explain the phenotypic effect of thesegenetic backgrounds.
Conclusion: Our findings support the possibility that recent bottleneck events leading to over-representation of minor mtDNA alleles in specific genetic isolates, could result in population-specific susceptibility loci to complex disorders.
Published: 29 April 2008
BMC Genomics 2008, 9:198 doi:10.1186/1471-2164-9-198
Received: 24 September 2007Accepted: 29 April 2008
This article is available from: http://www.biomedcentral.com/1471-2164/9/198
© 2008 Feder et al; licensee BioMed Central Ltd. This is an Open Access article distributed under the terms of the Creative Commons Attribution License (http://creativecommons.org/licenses/by/2.0), which permits unrestricted use, distribution, and reproduction in any medium, provided the original work is properly cited.
Page 1 of 11(page number not for citation purposes)

BMC Genomics 2008, 9:198 http://www.biomedcentral.com/1471-2164/9/198
BackgroundThe quest for susceptibility genes of common complexdisorders such as type 2 diabetes mellitus (T2DM) has ledto recent successful discoveries of novel disease-relatedgenes through the use of large scale genome-wide associa-tion studies including thousands of patients belonging tomajor ethnic groups [1]. Disease-associated loci often failto replicate in different populations, because of patternsof population-specific susceptibility [2]. This may occurdue to genetic drift and founder effects, turning minoralleles in a certain populations to prevalent ones inanother population. One may hypothesize that some ofthese alleles carry functional effects underlying differencesin disease susceptibility between populations. Revealingsuch an effect requires mining special populations, suchas the Jews, that due to bottleneck events have increasedincidence of alleles that are less abundant in the generalpopulation.
The Jewish people underwent several recent bottleneckevents after the 2600 year old Babylonian and 2000 yearold Roman deportation from Israel [3,4]. These resultedin geographically separated Jewish communities that kepttheir customs and religion over centuries, mostly marry-ing within the communities with little or no intermarriagewith local non-Jews, suggesting several founder events.Thus, Jews represent an excellent model to study possibleassociation of population-specific alleles with commondisorders, including T2DM [5].
T2DM is the most common metabolic disease today, withincreasing incidence in the Western world (1). Growingevidence for dysfunction of the mitochondrial energy pro-duction machinery (OXPHOS) in many T2DM patients[6] highlights the role of altered OXPHOS activity in themolecular basis leading to the common forms of T2DM:(a) approximately 1% of diabetic patients have largemitochondrial DNA (mtDNA) deletions or the A3243Gpoint mutation [7,8]; (b) expression of OXPHOS-relatedgenes is decreased in muscle tissues of diabetic individuals[9,10]; (c) mitochondrial ATP production is decreasedand intra-myocellular fat content is increased in offspringof T2DM patients [11]; (d) in pancreatic beta-cells ofmice, cellular depletion of mtDNA and knock-out ofmitochondrial transcription factor A (TFAM) interferewith insulin secretion [12,13].
Given that T2DM is a common complex disorder withconsiderable heritability, it is probably influenced by acombination of predisposing common genetic variants,potentially including mtDNA variants. Although mtDNAgenetic variants have previously been associated withcomplex disorders in some populations [14], its extensivegenetic variability [15] and uniparental inheritance mayresult in diverse association among specific populations
[16]. Indeed, mtDNA genetic association with T2DMexemplifies the differences among populations: signifi-cant association of certain mtDNA genetic backgrounds(haplogroups) was found in Asians [17] but not in Cauca-sians as documented in a recent large scale analysis [18].Additionally, association of mtDNA variants with T2DMwas limited to specific populations [19-21]. The onlyexample of a mtDNA variant (T16189C) associated withT2DM in both Caucasian and Chinese populations[22,23] was recently questioned [24].
Similar to T2DM, diabetic complications are complexphenotypes determined by multiple pathways with a largegenetic component. Diabetic complications increasemarkedly in incidence after 5–10 years of active T2DM,but with extreme variability in onset and progression, i.e.some individuals developing severe complications rela-tively early in the disease course, while others fail todevelop any significant complications despite many yearsof severe disease. Being responsible for most T2DM-asso-ciated mortality, diabetic complications involve pathol-ogy in small and large vessels (micro- and macrovasculardisease), encompassing malfunction of the mitochondrialOXPHOS [25]. Thus, mtDNA variants could be logicalcandidates to alter the genetic risk to the major diabeticcomplications- nephropathy, retinopathy and cardiovas-cular disease [26].
To search for possible population-specific associationbetween mtDNA common genetic variants and the com-mon complications of T2DM we examined mtDNAgenetic variability in three Jewish populations: Ashkenazi,Sephardic and North African Jews.
ResultsA total of 1,179 T2DM patients comprised of three popu-lations (762 Ashkenazi Jews [Ash], 191 non-AshkenaziEuropean Jews [Seph], and 226 North African Jews[NAF]), were genotyped and assigned to different mtDNAhaplogroups. Almost 90% of the subjects belonged to oneof the 12 most prevalent mtDNA haplogroups inAshkenazi Jews, i.e., K1, K2, U (non-K), H, V, J1, J2, T,N1b, I, X, W (Figure 1). R × C test of independence [27]indicated that haplogroup distribution varied signifi-cantly among the three Jewish patients populations (G =180.1, df = 30, p < 0.001), implying that each of thesepatients populations should be analyzed separately. Spe-cifically, there was an over-representation of haplogroupT in Seph patients, HV* in NAF patients, haplogroups K1,K2 and N1b in the Ashkenazi patients. Although theobserved differences are among populations of patientsand do not necessarily apply to the general population,our data is in line with previous reports of differences inmtDNA haplotypes distribution among Jewish popula-tions, thus supporting the hypothesis that separate
Page 2 of 11(page number not for citation purposes)

BMC Genomics 2008, 9:198 http://www.biomedcentral.com/1471-2164/9/198
founder events led to the establishment these differentJewish populations (Figure 1) [3,28]. Furthermore,sequencing of the mtDNA hyper variable region 1 (HVR1)of haplogroup N1b patients in our populations revealedthat the Ashkenazi population harbored only the 16145-16176A-16223 motif termed "N1b1" which is extremelyrare in other populations, whereas of the seven Seph N1bpatients, five harbored the N1b1 motif and two harboreda 16145-16176G-16223 motif termed "N1b2" which isfound at low prevalence in Caucasians. Haplogroup N1bwas totally absent from the NAF population, thus furthersupporting separate bottleneck events in the Ash, Sephand NAF populations.
This significant genetic divergence of mtDNA genetic var-iation could result in population-specific signals ofmtDNA association with complex disorders. In order toevaluate this we have assessed possible association ofmtDNA haplogroups with the major complications ofT2DM separately within each of the three populations.This approach enabled minimizing the possible effects ofpopulation stratification. First, each population wasdivided into patients that had developed cardiovasculardisease, retinopathy or nephropathy (Tables 1, 2, 3) and a
group of patients who did not develop any of these com-plications after at least 10 years of known diabetes ("no-complications" group). These complications were chosenbecause of their high prevalence in T2DM and since theorgans involved (heart, retina and kidney, respectively)are highly affected in mitochondrial disorders [29].
In an attempt to identify candidate haplogroups for asso-ciation with T2DM complications a permutation analysiswas performed (see Additional file 1 and Additional file 1– Table 1). In the Ash population haplogroup J1 wasdetected as a plausible candidate for association withretinopathy and nephropathy (p = 0.035 and p = 0.022,respectively) and haplogroup N1b1 for association withnephropathy (p = 0.003) (Table 1). In the Seph popula-tion haplogroup aggregate HV* and haplogroup T weredetected as borderline candidates for association withretinopathy (p = 0.054) and nephropathy (p = 0.059),respectively (Table 2). In the NAF population haplogroupaggregate HV* was detected as a candidate for associationwith nephropathy and cardiovascular disease (p = 0.024and p = 0.014, respectively) (Table 3).
Haplogroup distribution in the three studied populations: Letters under the X-axis – haplogroup names; Y-axis – percentage of each haplogroup of the corresponding populations (Ash – lines, Seph – black, NAF – white)Figure 1Haplogroup distribution in the three studied populations: Letters under the X-axis – haplogroup names; Y-axis – percentage of each haplogroup of the corresponding populations (Ash – lines, Seph – black, NAF – white). Ash (n = 762), Seph (n = 191), NAF (n = 226). HV* – samples belonging to the HV lineage, excluding haplogroups H and V. O – others; JT – samples belonging to the JT lineage excluding haplogroups J and T.
0
5
10
15
20
25
30
35
H V HV* J1 J2 T JT K1 K2 U N1b I W X O
Haplogroup
%
Ash (%) SEPH (%) NAF (%)
Page 3 of 11(page number not for citation purposes)

BMC Genomics 2008, 9:198 http://www.biomedcentral.com/1471-2164/9/198
These results suggest that the differences in haplogroupdistribution may result in different disease-associatedmtDNA factors in each population. To rigorously investi-gate the involvement of mtDNA haplogroups in the ten-dency to develop T2DM complications we focused onlyon the significant candidate haplogroups (J1 and N1b inthe Ash population, and HV* in the NAF population).
mtDNA Haplogroups J1 and N1b associate with T2DM Complications in Ashkenazi JewsUsing a logistic regression model and appropriate Bonfer-onni correction we compared the candidate haplogroupswith each of the other haplogroups while controlling forthe possible effects of patient characteristics (disease dura-tion, sex and age). A possible association of a populationspecific mtDNA haplogroup with T2DM complicationscould be best tested in our Ashkenazi population (Ash),since N1b1 is an apparently Ashkenazi-specific haplo-
group. Our analyses revealed that haplogroup N1b wassignificantly under-represented in the nephropathy groupand in the cardiovascular group as compared with the no-complication group relative to all other haplogroups (p =0.006, odds ratio (OR) = 0.34 (0.15–0.74), and p = 0.017,OR = 0.39 (0.18–0.84), respectively; also see Additionalfile 1 – Table 2). In the retinopathy group however, no sig-nificant association with N1b was found. These resultsimply that Ashkenazi T2DM patients pertaining to haplo-group N1b exhibit reduced susceptibility to the testedT2DM complications.
In contrast to haplogroup N1b, haplogroup J1 was over-represented in the Ash population only in the microvascu-lar complications (retinopathy and nephropathy). A sig-nificant and specific effect of haplogroup J1 could bemasked by including patients who exhibit more than onecomplication in each of the tested groups. This premise is
Table 1: Haplogroup distribution of Ashkenazi (Ash) T2DM patients who developed complications and those who did not develop any complications for at least 10 years after diagnosis ("No complications"). Patients included in this table may have more than one complication. N – number of patients in each group; (%) – percentage of patients belonging to a certain haplogroup in a specific group.
Haplogroup All Ash N (%) No complications N (%) Cardiovascular N (%) Retino-pathy N (%) Nephro-pathy N (%)
U (nonK) 51 (6.7) 19 (7.1) 12 (4.6) 9 (7.6) 22 (7.1)K1 178 (23.4) 56 (21) 65 (24.9) 25 (21.2) 77 (25)K2 44 (5.8) 17 (6.4) 14 (5.4) 6 (5.1) 19 (6.2)1HV* 74 (9.7) 26 (9.7) 27 (10.3) 14 (11.9) 25 (8.1)H 175 (23) 60 (22.5) 66 (25.3) 31 (26.3) 73 (23.7)J1 59 (7.8) 14 (5.2) 18 (6.9) 14 (11.9) 33 (10.7)T 33 (4.3) 13 (4.9) 9 (3.4) 3 (2.5) 12 (3.9)N1b 44 (5.8) 23 (8.6) 13 (5) 6 (5.1) 9 (2.9)IWX 31 (4.1) 12 (4.5) 8 (3.1) 2 (1.7) 16 (5.2)2Others 71 (9.3) 27 (10.1) 29 (11.1) 8 (6.8) 22 (7.1)Total 760** 267** 261 118 308
1HV* – samples belonging to the HV lineage, excluding haplogroup H but including haplogroup V. 2Others – include haplogroups JT* and L in addition to unclassified, probably non-European haplogroups. **After removing the two J2 patients (see Materials and Methods), we were left only with J1 patients; thus, the sample size of the "no-complications" group was reduced from 269 to 267, and that of the total population from 762 to 760.
Table 2: Haplogroup distribution of European non-Ashkenazi Jewish (Seph) T2DM patients who developed complications and the "No complications" group as in table 1. Patients included in this table may have more than one complication.
Haplogroup All Seph n (%) No complication n (%) Cardiovascular n (%) Retino-pathy n (%) Nephro-pathy n (%)
U (nonK) 12 (6.5) 5 (7.7) 3 (5.4) 1 (2.7) 5 (7.7)K 21 (11.3) 6 (9.2) 7 (12.5) 7 (18.9) 9 (13.8)1HV* 17 (9.1) 4 (6.2) 5 (8.9) 7 (18.9) 10 (15.4)H 49 (26.3) 17 (26.2) 16 (28.6) 6 (16.2) 14 (21.5)J1** 16 (8.6) 5 (7.7) 3 (5.4) 4 (10.8) 8 (12.3)T 26 (14) 12 (18.5) 7 (12.5) 4 (10.8) 4 (6.2)N1b 7 (3.8) 2 (3.1) 2 (3.6) 2 (5.4) 3 (4.6)WXI 12 (6.5) 4 (6.2) 3 (5.4) 3 (8.1) 3 (4.6)2Others 26 (14) 10 (15.4) 10 (17.6) 3 (8.1) 9 (13.8)Total 186 65 56 37 65
1HV* – see table 1. 2Others – see table 1. **After removing the J2 patients (see Materials and Methods), we were left only with J1 patients; thus, the sample size was reduced from 191 to 186 for the total population and the complications groups were adjusted accordingly.
Page 4 of 11(page number not for citation purposes)
BMC Genomics 2008, 9:198 http://www.biomedcentral.com/1471-2164/9/198
supported by the view that the risks of developing each ofthe different complications are not entirely independent.Retinopathy and nephropathy may have some commonpathophysiological features, and nephropathy per se mayincrease the risk of cardiovascular disease. Hence recipro-cal interactions among the complications could mask theeffect of certain genetic backgrounds. To test for the possi-bility that patients pertaining to mitochondrial haplo-group J1 exhibit preferentially altered susceptibility toeither microvascular or macrovascular complications, weperformed the analysis on groups of T2DM patients hav-ing nephropathy or retinopathy but no evidence of cardi-ovascular disease and on T2DM patients withcardiovascular disease who did not develop either neph-ropathy or retinopathy (for detailed information of hap-logroup J1 compared to each of the other haplogroups,see Additional file 1 – Table 3). This demonstrated a sig-nificant over-representation of haplogroup J1 in the "iso-lated" nephropathy group [p = 0.018, OR = 2.3 (1.15–4.7)] and in the "isolated" retinopathy group [p = 0.017,OR = 3.1 (1.2–7.8)]. However, no such trends could bedetected in the "isolated" cardiovascular group. Theseresults suggest that mutations defining mtDNA haplo-group J1 increase the propensity of Ashkenazi T2DMpatients to develop nephropathy or retinopathy but notcardiovascular complications.
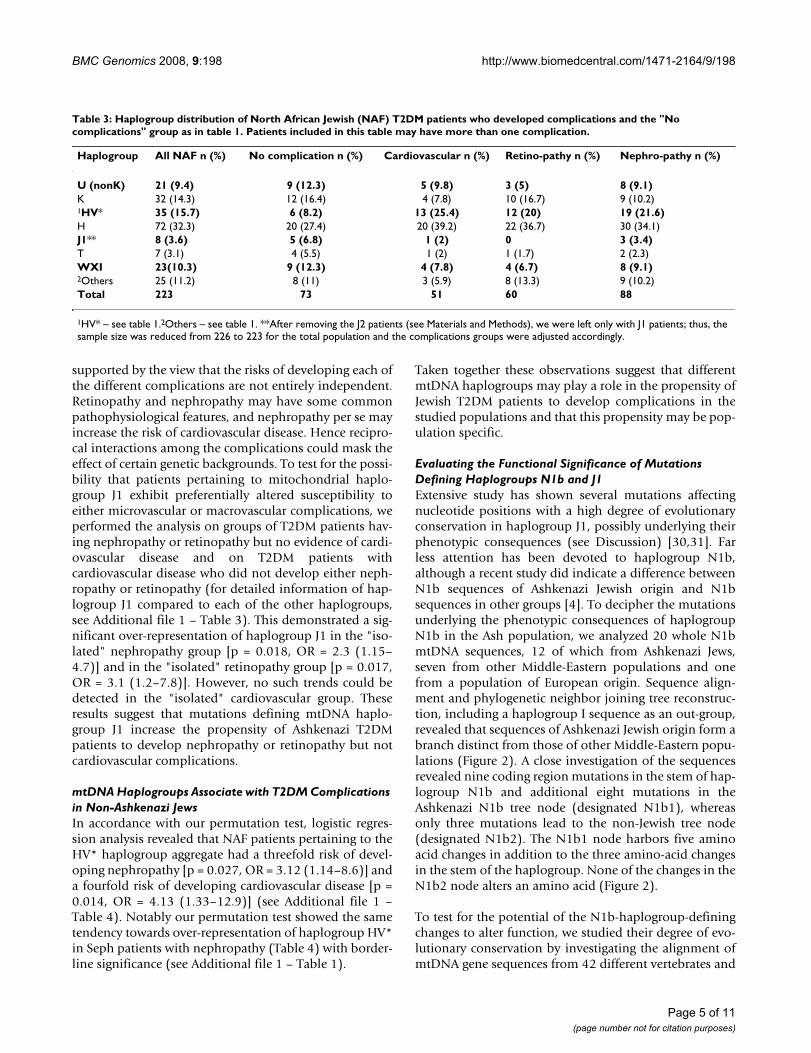
mtDNA Haplogroups Associate with T2DM Complications in Non-Ashkenazi JewsIn accordance with our permutation test, logistic regres-sion analysis revealed that NAF patients pertaining to theHV* haplogroup aggregate had a threefold risk of devel-oping nephropathy [p = 0.027, OR = 3.12 (1.14–8.6)] anda fourfold risk of developing cardiovascular disease [p =0.014, OR = 4.13 (1.33–12.9)] (see Additional file 1 –Table 4). Notably our permutation test showed the sametendency towards over-representation of haplogroup HV*in Seph patients with nephropathy (Table 4) with border-line significance (see Additional file 1 – Table 1).
Taken together these observations suggest that differentmtDNA haplogroups may play a role in the propensity ofJewish T2DM patients to develop complications in thestudied populations and that this propensity may be pop-ulation specific.
Evaluating the Functional Significance of Mutations Defining Haplogroups N1b and J1Extensive study has shown several mutations affectingnucleotide positions with a high degree of evolutionaryconservation in haplogroup J1, possibly underlying theirphenotypic consequences (see Discussion) [30,31]. Farless attention has been devoted to haplogroup N1b,although a recent study did indicate a difference betweenN1b sequences of Ashkenazi Jewish origin and N1bsequences in other groups [4]. To decipher the mutationsunderlying the phenotypic consequences of haplogroupN1b in the Ash population, we analyzed 20 whole N1bmtDNA sequences, 12 of which from Ashkenazi Jews,seven from other Middle-Eastern populations and onefrom a population of European origin. Sequence align-ment and phylogenetic neighbor joining tree reconstruc-tion, including a haplogroup I sequence as an out-group,revealed that sequences of Ashkenazi Jewish origin form abranch distinct from those of other Middle-Eastern popu-lations (Figure 2). A close investigation of the sequencesrevealed nine coding region mutations in the stem of hap-logroup N1b and additional eight mutations in theAshkenazi N1b tree node (designated N1b1), whereasonly three mutations lead to the non-Jewish tree node(designated N1b2). The N1b1 node harbors five aminoacid changes in addition to the three amino-acid changesin the stem of the haplogroup. None of the changes in theN1b2 node alters an amino acid (Figure 2).
To test for the potential of the N1b-haplogroup-definingchanges to alter function, we studied their degree of evo-lutionary conservation by investigating the alignment ofmtDNA gene sequences from 42 different vertebrates and
Table 3: Haplogroup distribution of North African Jewish (NAF) T2DM patients who developed complications and the "No complications" group as in table 1. Patients included in this table may have more than one complication.
Haplogroup All NAF n (%) No complication n (%) Cardiovascular n (%) Retino-pathy n (%) Nephro-pathy n (%)
U (nonK) 21 (9.4) 9 (12.3) 5 (9.8) 3 (5) 8 (9.1)K 32 (14.3) 12 (16.4) 4 (7.8) 10 (16.7) 9 (10.2)1HV* 35 (15.7) 6 (8.2) 13 (25.4) 12 (20) 19 (21.6)H 72 (32.3) 20 (27.4) 20 (39.2) 22 (36.7) 30 (34.1)J1** 8 (3.6) 5 (6.8) 1 (2) 0 3 (3.4)T 7 (3.1) 4 (5.5) 1 (2) 1 (1.7) 2 (2.3)WXI 23(10.3) 9 (12.3) 4 (7.8) 4 (6.7) 8 (9.1)2Others 25 (11.2) 8 (11) 3 (5.9) 8 (13.3) 9 (10.2)Total 223 73 51 60 88
1HV* – see table 1.2Others – see table 1. **After removing the J2 patients (see Materials and Methods), we were left only with J1 patients; thus, the sample size was reduced from 226 to 223 for the total population and the complications groups were adjusted accordingly.
Page 5 of 11(page number not for citation purposes)

BMC Genomics 2008, 9:198 http://www.biomedcentral.com/1471-2164/9/198
invertebrates (see Methods and Additional file 1 – Tables5 and 6). The degree of conservation was ranked high onlyif it fell within one standard deviation range from themean conservation degree of mtDNA disease-causingmutations [31] (Figure 2, Additional file 1 – Table 5).Strikingly, only the N1b1 node (Ashkenazi Jewish) holdshighly conserved changes in addition to three highly con-served changes in the N1b stem thus supporting theirpotential involvement in the protective effect of haplo-group N1b1.
DiscussionMtDNA genes, in contrast to nuclear DNA (nDNA)-encoded genes, are in full linkage disequilibrium. Themutation rate of the mtDNA is ~10 times faster than thatof the nDNA and thus it is the most variable coding regionin the human genome. Since mtDNA is maternally inher-ited, it is prone to genetic drift, resulting in large differ-ences in patterns of genetic variability among and withinpopulations [32]. Such genetic drift often leads to difficul-ties in replicating results of mtDNA association studiesamong populations. Hence, we hypothesized that, due toits high genetic divergence among populations, a subset ofmtDNA alleles with functional consequences will differ-entiate among distinct populations. Here we have shownthat recent bottleneck events within the three studied Jew-
ish populations (Ash, Seph and NAF), underlie markeddifferences in mtDNA diversity in three ethnically-relatedJewish populations, resulting in increased frequency ofgenotypes in some populations, some of which may act assusceptibility factors to T2DM complications. Such wasthe case in the haplogroup N1b1 that was significantlyunder-represented in certain complications of theAshkenazi population and not present in the NAF popu-lation.
In contrast to haplogroup N1b1, the haplogroups identi-fied as factors with risk trends to some T2DM complica-tions (haplogroup J1 and haplogroup aggregate HV*,with marginal significant values considering a Bonferonnicorrected α<0.017) were present in all three studied pop-ulations. Nevertheless haplogroup J1, showing associa-tion with increased risk for T2DM nephropathy orretinopathy in the Ashkenazi population does not haveenough power to replicate in the Seph and NAF popula-tions, i.e. ~250 subjects in each of the complicationsgroups to replicate the significant results of the Ash popu-lation (power of 80%, α<0.05 (two tailed)) (Figure 1).The significant over-representation of haplogroup aggre-gate HV* in certain complications of the NAF populationis harder to interpret, since although there was enoughpower to detect its effect in the Ashkenazi population, i.e.
Table 4: General clinical data for the patient populations.
Parameter Population Total populations No complications Nephro-pathy Retino-pathy Cardiovascular
Number of patients (% of total population)
Ash 762 269 (35.3) 308 (40.4) 118 (15.5) 261 (34.3)
Seph 191 65 (34) 69 (36.1) 37 (19.4) 60 (31.4)NAF 226 74 (32.7) 88 (38.9) 61 (27) 52 (23)
M/F (%) Ash 50/50 38/62 54/46 57/43 62/38Seph 51/49 48/52 55/45 54/46 62/38NAF 48/52 42/58 53/47 48/52 63.5/36.5
Age (mean ± SD) Ash 65.7 ± 9.9 64.3 ± 10 65.9 ± 9.7 64.6 ± 9.2 68.0 ± 9.2Seph 65 ± 9 64.3 ± 8.4 65.1 ± 8.8 64.6 ± 8.2 66.8 ± 8.6NAF 61.9 ± 9.4 60.7 ± 10.0 62.4 ± 8.9 61.6 ± 10.3 63.1 ± 8.8
Years of diabetes (mean ± SD)
Ash 18.9 ± 8.3 16.8 ± 7.3 19.2 ± 8.4 22.9 ± 8.5 20.9 ± 9.0
Seph 19.4 ± 8.4 21.4 ± 8.8 20.5 ± 9.2 24 ± 9.1 21.2 ± 8.2NAF 19 ± 7.3 16.8 ± 6.4 19.4 ± 7.3 22.4 ± 7.9 19.7 ± 7.9
BMI1 (kg/m2, mean ± SD) Ash 29.9 ± 5.2 28.8 ± 4.6 30.6 ± 5.5 30.8 ± 6.0 29.7 ± 5.0Seph 30.3 ± 4.9 30.7 ± 5.4 30.4 ± 5.3 30.5 ± 5.7 30.5 ± 5NAF 29.6 ± 5.1 28.8 ± 4.8 30.6 ± 5.1 30.3 ± 5.3 30.9 ± 4.5
HbA1c (mean ± SD) Ash 7.9 ± 1.5 7.8 ± 1.4 8.0 ± 1.5 8.2 ± 1.6 7.9 ± 1.4Seph 8.2 ± 1.6 8.2 ± 1.7 8.2 ± 1.4 8.2 ± 1.6 8.3 ± 1.6NAF 8.7 ± 1.9 8.7 ± 2.0 8.8 ± 2.0 8.6 ± 1.6 8.7 ± 1.9
HTN2 (%) Ash 72.9 61.3 81.8 79.7 77.4Seph 70.2 73.8 81.2 86.5 81.7NAF 61.5 54.1 69.3 72.1 65.4
LDL-c (mg/dl, mean ± SD) Ash 104.0 ± 31.0 108.7 ± 31.1 102.3 ± 29.7 103.3 ± 27.9 98.2 ± 30.5Seph 109.3 ± 36.7 106 ± 36 107.1 ± 39 110.9 ± 38 96.1 ± 29.4NAF 104.7 ± 29.8 104.9 ± 28.3 106.3 ± 27.8 105.6 ± 36.6 102.5 ± 31
1 BMI = Body mass index 2 HTN – Hypertension
Page 6 of 11(page number not for citation purposes)

BMC Genomics 2008, 9:198 http://www.biomedcentral.com/1471-2164/9/198
Page 7 of 11(page number not for citation purposes)
Neighbor joining phylogenetic reconstruction of whole mtDNA sequences of the N1b haplogroupFigure 2Neighbor joining phylogenetic reconstruction of whole mtDNA sequences of the N1b haplogroup. Haplogroup I sequence was used as an out-group, since it is the phylogeneticaly closest haplogroup to N1b. Sequences were aligned and bootstrapped 1000 times, and the tree was built with MEGA3 software. Sequence names ending with either "Ash" or "Pal" were generated by us indicating non-diabetic Ashkenazi Jews and Israeli Arabs, respectively; otherwise a Genbank Identification number (GI) was mentioned. It is worth noting that gi|82792542 and gi|82792304 N1b1 sequences originate from Ashkenazi Jews whereas the N1b2 sequence gi|17985627 is of non Jewish Jordanian origin. Sequence designated Herrnstadt2002-336 was downloaded from [45], as it was not available from Genbank. Numbers near the branches are the bootstrap values; numbers in boxes are changes in nucleotide positions of the mtDNA in the relevant node. Bold – amino acid change; underlined – change in a highly conserved position. For detailed information on each mutation and its degree of conservation, see Additional file 1 – Tables 5 and 6.
89_Ash
123_Ash
62_Ash
2130_Ash
2164_Ash
2149_Ash
gi|82792542|
147_Ash
gi|82792304|
2166_Ash
2153_Ash
79_Ash
Herrnstadt_mt336
4002_Pal
505002_Pal
33002_Pal
gi|17985627|
34002_Pal
37002_Pal
8002_Pal
gi|17985739|
83
53
46
62
30
26 62
99
68
84
63
0.0002
(I Haplogroup)
N1b1
N1b2
4735, 4917, 11928, 12092, 13129, 13710, 14581, 16176A
9335, 11362, 16176G
1598, 1703, 2639, 3921, 4960, 5471, 8472, 8836, 12822

BMC Genomics 2008, 9:198 http://www.biomedcentral.com/1471-2164/9/198
~70 subjects in each of the complication groups in orderto detect significance with a power of 80% and α<0.05(two tailed), it did not show the same tendency as in theNAF population. Nevertheless one should take intoaccount that HV* is a haplogroup aggregate; hence the dif-ferent bottleneck events leading to the establishment ofthe Ashkenazi and North African Jewish populationscould result in different compositions of lineages com-prising the HV* haplogroup aggregate in the two popula-tions. Testing for this possibility needs further genotypingof HV*, requiring increased sample sizes of the studiedpopulations.
Our findings support association of mtDNA commongenetic variants with sub-phenotypes of T2DM. Interest-ingly, the inconsistency of mtDNA genetic associationwith complications of T2DM as found here was describedfor other phenotypes as well: While haplogroup J has beenassociated with successful longevity in northern Italiansand the Finnish [33], it was not associated with successfullongevity in southern Italians [34] and subhaplogroup J1,but not J2, was associated with successful longevity in theNorthern Irish [35]. Therefore, both differences inmtDNA sub-groups and their differences in response toenvironment appear to affect the relationship betweenmtDNA genotypes and phenotypes. Since all of the func-tional SNPs in particular mtDNA lineages would have acollective effect on mitochondrial function, many mtDNAhaplogroups and sub-haplogroups might interact withenvironmental variation differently. Furthermore, this dif-ference can be further complicated by the interaction ofmtDNA encoded subunits, harboring functional SNPs,with nuclear DNA encoded subunits, harboring their owngenetic variation. This interpretation applies to our obser-vation that N1b1 reduces the risk to T2DM complicationsonly in Ashkenazi Jews. In addition, the tendency todevelop complications is an interplay of environment andgenetics, hence it is not solely dependent on a particularhaplogroup, and thus the absence of the N1b1 haplo-group in the NAF cohort is not expected to change signif-icantly the overall risk do develop complications.
Since our study observed disease-association with a popu-lation specific haplogroup, the Ashkenazi specific N1b1, itwas of importance to assess the functional potential ofthis haplogroup defining mutations. During our sequenceanalysis of haplogroup N1b we noticed that the Ash-spe-cific sub-haplogroup N1b1 harbors an amino acid substi-tution in mtDNA position 4917 (Figure 2), which alsodefines haplogroup T that was previously associated withreduced sperm motility [31]. Interestingly, our permuta-tion test suggests with borderline significance that haplo-group T might be in association (p = 0.059) with someT2DM complications in the Seph population. Previously[30,36] we showed that this mutation alters a highly con-
served amino acid in the ND2 gene, hence suggesting afunctional potential. Since haplogroups N1b1 and T stemfrom very different branches in the human mtDNA phyl-ogeny it can be concluded that the 4917 mutation wasestablished at least twice during human evolution. Allthese evidence imply that the change at position 4917contributes to the protective effect against certain T2DMcomplications.
Along with haplogroup J1 association with other multi-factorial phenotypes [30,37], and its effect on the pene-trance of mutations causing the eye disorder LHON [38]our results support the premise that mutations definingthis haplogroup affect OXPHOS. Similar to haplogroupN1b1, some mutations defining haplogroup J1 alteramino-acids with high conservation degree: (1) a transi-tion in position 10398 which is a Thr114Ala replacementin the ND3 subunit of complex I, shown to alter mito-chondrial matrix pH in cell-culture experiments [31]; and(2) a transition in position 13708, causing a Ala458Thrreplacement in the ND5 complex I subunit. In addition,haplogroup J1 harbors the G3010A substitution locatedwithin the 12SrRNA gene. Although this mutation hasbeen found in several haplogroups [39], it is possible thatthe combination of this mutation with the mutations thatgenerally define haplogroup J underlies the phenotypiceffect of J1 in the Ash population.
Interestingly, the non-synonymous changes in haplo-groups J1 and N1b1 altered highly conserved amino-acidpositions in OXPHOS complex I, implying that they pos-sibly affect the activity of this complex [40]. Accordingly,anti-diabetic agents (metformin and thiazolidinediones)act specifically through the inhibition of complex I activ-ity [41], which suggests a role for complex I functionalalteration in the etiology of T2DM.
ConclusionIn summary, our results revealed notable differences inmtDNA genetic diversity within Jews. Our associationstudy of mtDNA genetic variants with T2DM complica-tions showed, that the differences in haplogroup distribu-tion in the three studied populations were associated withdifferences in disease susceptibility factors. These findingssupported our working hypothesis that minor alleles over-looked in large scale association studies may reveal theirfunctional potential in genetic isolates.
MethodsPatient populationThe Israeli Diabetes Research Group (IDRG) collectedJewish unrelated T2DM patients of Ashkenazi (Ash) ori-gin (n = 762), of European non-Ashkenazi (Seph) origin(n = 191) and North African Jews (NAF) from seven med-ical centers in Israel. The Ashkenazi Jews belong to a rela-
Page 8 of 11(page number not for citation purposes)

BMC Genomics 2008, 9:198 http://www.biomedcentral.com/1471-2164/9/198
tively young population that has gone through a recentbottleneck and thus has less genetic heterogeneity thanthe general Caucasian population [41]. The Seph and NAFJewish populations are as young as the Ashkenazi popula-tion, yet may have gone through different bottleneckevents thus the three populations were analyzed sepa-rately. The countries of origin of the patients included inthis study can be viewed in Additional file 1-methods. Toavoid population stratification effects on the genetic vari-ability, samples in the compared groups were matched forthe maternal country of origin.
The basic clinical characteristics of the patients are shownin Table 4. Patients with at least 10 years of known diabe-tes were selected to assure a sufficiently high prevalence ofdiabetic complications to provide adequate statisticalpower in populations of this size. Using information fromthe patients' medical records and from structured inter-views; we initially classified the patients into two groups,those who did not develop any complications after at least10 years of clinical disease, and those who developed atleast one complication. The latter group was furtherdivided into three groups according to the complicationdiagnosed: retinopathy – patients with proliferating dia-betic retinopathy, macular edema and/or blindness; cardi-ovascular disease – patients with a history of percutaneoustransluminal coronary angioplasty, coronary artery bypassgraft, myocardial infarction, and congestive heart failure;and nephropathy – patients with microalbuminuria (>30but < 300 mg protein per gram of creatinine) or proteinu-ria (>300 mg protein per gram of creatinine), with orwithout decreased renal function.
DNA was extracted from peripheral lymphocytes bystandard techniques (Puregene, Gentra Systems, Minne-apolis, MN). Written informed consent was obtainedfrom all individuals who participated in this study, whichwas approved by the Hadassah Medical Organization'sInstitutional Review Board for Human Studies.
Classification of haplogroupsGenotyping was conducted by a hierarchical approach,starting from the most prevalent haplogroups in this pop-ulation [42]. For detailed information see Additional file1 – methods and Additional file 1 – Tables 7,8.
Statistical analysisTo avoid small sample sizes, some of the haplogroupswere grouped following phylogenetic considerations (fordetails, see Additional file 1- methods). Statistical analy-ses were performed using Systat 11.0 (Systat Software,Inc., CA, USA). We first used R × C (rows × columns) testof independence to compare haplogroup distributionamong the three different Jewish populations. Next weused a permutation test to detect candidate haplogroups
with altered representation in the complication groups ineach of the three Jewish populations. Permutation testswere performed using a MATLAB (v.6.5) script: Complica-tions (a binary indicator variable, 0 – no complicationand 1 – complication present) were randomly assignedwithout replacement to patients with different mtDNAgenetic backgrounds (i.e., haplogroups). The proportionof patients in each haplogroup who developed a specificcomplication was calculated. Next the absolute difference(two-tailed test) between each of these values and generaltendency to develop such a complication in the entirepopulation (i.e., the proportion of patients in the popula-tion who developed such a complication irrespective oftheir genetic background) was recorded. This procedurewas repeated 10,000 times. P values were estimated as theproportion cases in which the absolute differenceobtained during the simulations was equal to or greaterthan that of the original data set. Finally, to test whetherthe susceptibility to develop T2DM complications (repre-sented by a binary indicator variable taking on values 0and 1) differed among haplogroups, logistic regressionwas performed to adjust for patient characteristics, i.e.,disease duration, sex and age. It is notable that by convert-ing the categorical variable "haplogroup" into a dummyvariable, we could compare the candidate haplogroupswith each of the other haplogroups using a single test, i.e.,to avoid multiple testing. Specifically, since this variablecomposed of 8–10 classes (depending on the populationanalyzed), its inclusion in a logistic regression modelrequires generating 7–9 indicator variables, respectively.The coefficients of these indicator variables indicatewhether the propensity to develop complications in eachof the respective haplogroups differs from that of the ref-erence (candidate) haplogroup (haplogroup J1 or N1b inthe Ash and the HV* lineage in the NAF populations). Forsimplicity, we have presented in the text results from anal-yses in which we treated all the haplogroups in the aggre-gate excluding the reference haplogroup. The completeanalyses, in which these candidate haplogroups werecompared with each of the other haplogroups, are pre-sented in Additional file 1 – Tables 2-4. To obtain an esti-mate for the relative risk of carriers of a particularhaplogroup to develop T2DM complications, odds ratios(ORs) were calculated. Power analysis was conducted toget an estimate of the sample size required to replicate ourresults (see discussion). Although it was argued in the pastthat corrections are not necessary in our case [43], we haveconsidered the three different complications examined aspotential multiple testing and the statistical significancewas Bonferonni corrected to α<0.017.
Whole mtDNA sequencingThe mtDNA genome of normal non-T2DM individualswas amplified in 3 overlapping DNA fragments, and wassequenced using the mitochondrial DNA re-sequencing
Page 9 of 11(page number not for citation purposes)

BMC Genomics 2008, 9:198 http://www.biomedcentral.com/1471-2164/9/198
chip, as previously described [44] ; sequence ambiguitieswere resolved using specific primers with a conventionalABI 3100 sequencer. For details see Additional file 1 –methods. Changes within the sequences as comparedwith the Cambridge reference sequence were documented(see Additional file 1 – Table 5).
Phylogenetic reconstructionSequence alignment, phylogenetic reconstruction andbootstrap analysis were performed with MEGA3 software[31].
Estimating degrees of conservation of variants in the mtDNAAlignment of each of the mtDNA encoded proteins andrRNA genes in 40 vertebrates (including man) and twoinvertebrates (Drosophila and octopus) was performed(see Additional file 1 – Table 5,6). This alignment wasused to assess the degree of conservation (CD), i.e., thenumber of species that shared the same exact amino acidor nucleotide positions in protein-coding or rRNA-codingmtDNA genes, respectively (see Additional file 1 – Table6). The CD of the naturally occurring variants in the wholemtDNA sequences was compared with the mean CD of 20mtDNA disease-causing mutations (36 ± 9) as previouslydescribed. A position was considered highly conserved ifits CD was within one standard deviation from the meanCD of the disease-causing mutations.
Authors' contributionsJF performed the research and analyzed the data; IB, SAand SD analyzed the data. OO analyzed the data andassisted in the design of the statistical analyses. JW and IRcollected the data. DEA performed sequence analysis. BGassisted in the design of research and collected the data.DM designed the research and wrote the paper.
Additional material
AcknowledgementsWe would like to thank all of the members of the Israel Diabetes Research Group (IDRG – Josef Cohen, Ilana Harman-Boehm, Oscar Minuchin, Yair Yerushalmi, Andreas Buchs, Anat Tsur and Clara Norymberg) and their supporting staff for collecting the samples; We also would like to thank Prof Dina Raveh, BGU, for critical reading of this manuscript and Inon Scharf for writing the MATLAB script for the permutation test. This study was funded by grants from the Israel Science Foundation (D.M.), from the chief scientist
of the Israel Ministry of Health (B.G. and D.M.), from the Russell Berrie Foundation and D-Cure, Diabetes Care in Israel (B.G.) and from an unre-stricted research grant from Novo-Nordisk, Denmark (I.R.). The authors thank Dr. Procaccio, MAMMAG, UCI for providing positive controls for the A3243G mutation screen.
References1. Sladek R, Rocheleau G, Rung J, Dina C, Shen L, Serre D, Boutin P, Vin-
cent D, Belisle A, Hadjadj S, Balkau B, Heude B, Charpentier G, Hud-son TJ, Montpetit A, Pshezhetsky AV, Prentki M, Posner BI, BaldingDJ, Meyre D, Polychronakos C, Froguel P: A genome-wide associ-ation study identifies novel risk loci for type 2 diabetes.Nature 2007, 445(7130):881-885.
2. Shriner D, Vaughan LK, Padilla MA, Tiwari HK: Problems withgenome-wide association studies. Science 2007,316(5833):1840-1842.
3. Thomas MG, Weale ME, Jones AL, Richards M, Smith A, Redhead N,Torroni A, Scozzari R, Gratrix F, Tarekegn A, Wilson JF, Capelli C,Bradman N, Goldstein DB: Founding mothers of Jewish commu-nities: geographically separated Jewish groups were inde-pendently founded by very few female ancestors. Am J HumGenet 2002, 70(6):1411-1420.
4. Behar DM, Metspalu E, Kivisild T, Achilli A, Hadid Y, Tzur S, PereiraL, Amorim A, Quintana-Murci L, Majamaa K, Herrnstadt C, Howell N,Balanovsky O, Kutuev I, Pshenichnov A, Gurwitz D, Bonne-Tamir B,Torroni A, Villems R, Skorecki K: The matrilineal ancestry ofAshkenazi Jewry: portrait of a recent founder event. Am JHum Genet 2006, 78(3):487-497.
5. Stern E, Blau J, Rusecki Y, Rafaelovsky M, Cohen MP: Prevalence ofdiabetes in Israel. Epidemiologic survey. Diabetes 1988,37(3):297-302.
6. Maechler P, Wollheim CB: Mitochondrial function in normaland diabetic beta-cells. Nature 2001, 414(6865):807-812.
7. Ballinger SW, Shoffner JM, Hedaya EV, Trounce I, Polak MA, KoontzDA, Wallace DC: Maternally transmitted diabetes and deaf-ness associated with a 10.4 kb mitochondrial DNA deletion.Nature Genetics 1992, 1:11-15.
8. van den Ouweland JM, Bruining GJ, Lindhout D, Wit JM, VeldhuyzenBF, Maassen JA: Mutations in mitochondrial tRNA genes: non-linkage with syndromes of Wolfram and chronic progressiveexternal ophthalmoplegia. Nucleic Acids Research 1992,20(4):679-682.
9. Mootha VK, Lindgren CM, Eriksson KF, Subramanian A, Sihag S, LeharJ, Puigserver P, Carlsson E, Ridderstrale M, Laurila E, Houstis N, DalyMJ, Patterson N, Mesirov JP, Golub TR, Tamayo P, Spiegelman B,Lander ES, Hirschhorn JN, Altshuler D, Groop LC: PGC-1alpha-responsive genes involved in oxidative phosphorylation arecoordinately downregulated in human diabetes. Nat Genet2003, 34(3):267-273.
10. Sreekumar R, Halvatsiotis P, Schimke JC, Nair KS: Gene expressionprofile in skeletal muscle of type 2 diabetes and the effect ofinsulin treatment. Diabetes 2002, 51(6):1913-1920.
11. Petersen KF, Dufour S, Befroy D, Garcia R, Shulman GI: Impairedmitochondrial activity in the insulin-resistant offspring ofpatients with type 2 diabetes. N Engl J Med 2004,350(7):664-671.
12. Silva JP, Kohler M, Graff C, Oldfors A, Magnuson MA, Berggren PO,Larsson NG: Impaired insulin secretion and beta-cell loss intissue-specific knockout mice with mitochondrial diabetes.Nature Genetics 2000, 26(3):336-340.
13. Soejima A, Inoue K, Takai D, Kaneko M, Ishihara H, Oka Y, HayashiJI: Mitochondrial DNA is required for regulation of glucose-stimulated insulin secretion in a mouse pancreatic beta cellline, MIN6. J Biol Chem 1996, 271(42):26194-26199.
14. Wallace DC: A Mitochondrial Paradigm of Metabolic andDegenerative Diseases, Aging, and Cancer: A Dawn for Evo-lutionary Medicine. Annu Rev Genet 2005, 39:359-407.
15. Ingman M, Kaessmann H, Paabo S, Gyllensten U: Mitochondrialgenome variation and the origin of modern humans. Nature2000, 408(6813):708-713.
16. Ghezzi D, Marelli C, Achilli A, Goldwurm S, Pezzoli G, Barone P, Pel-lecchia MT, Stanzione P, Brusa L, Bentivoglio AR, Bonuccelli U, Petro-zzi L, Abbruzzese G, Marchese R, Cortelli P, Grimaldi D, Martinelli P,Ferrarese C, Garavaglia B, Sangiorgi S, Carelli V, Torroni A, AlbaneseA, Zeviani M: Mitochondrial DNA haplogroup K is associated
Additional File 1The file includes additional methods and additional tables that are referred to in the text.Click here for file[http://www.biomedcentral.com/content/supplementary/1471-2164-9-198-S1.doc]
Page 10 of 11(page number not for citation purposes)
http://www.ncbi.nlm.nih.gov/entrez/query.fcgi?cmd=Retrieve&db=PubMed&dopt=Abstract&list_uids=2453386
http://www.ncbi.nlm.nih.gov/entrez/query.fcgi?cmd=Retrieve&db=PubMed&dopt=Abstract&list_uids=2453386
http://www.ncbi.nlm.nih.gov/entrez/query.fcgi?cmd=Retrieve&db=PubMed&dopt=Abstract&list_uids=1301992
http://www.ncbi.nlm.nih.gov/entrez/query.fcgi?cmd=Retrieve&db=PubMed&dopt=Abstract&list_uids=1301992
http://www.ncbi.nlm.nih.gov/entrez/query.fcgi?cmd=Retrieve&db=PubMed&dopt=Abstract&list_uids=1542564
http://www.ncbi.nlm.nih.gov/entrez/query.fcgi?cmd=Retrieve&db=PubMed&dopt=Abstract&list_uids=1542564
http://www.ncbi.nlm.nih.gov/entrez/query.fcgi?cmd=Retrieve&db=PubMed&dopt=Abstract&list_uids=1542564
http://www.ncbi.nlm.nih.gov/entrez/query.fcgi?cmd=Retrieve&db=PubMed&dopt=Abstract&list_uids=8824267
http://www.ncbi.nlm.nih.gov/entrez/query.fcgi?cmd=Retrieve&db=PubMed&dopt=Abstract&list_uids=8824267

BMC Genomics 2008, 9:198 http://www.biomedcentral.com/1471-2164/9/198
Publish with BioMed Central and every scientist can read your work free of charge
"BioMed Central will be the most significant development for disseminating the results of biomedical research in our lifetime."
Sir Paul Nurse, Cancer Research UK
Your research papers will be:
available free of charge to the entire biomedical community
peer reviewed and published immediately upon acceptance
cited in PubMed and archived on PubMed Central
yours — you keep the copyright
Submit your manuscript here:http://www.biomedcentral.com/info/publishing_adv.asp
BioMedcentral
with a lower risk of Parkinson's disease in Italians. Eur J HumGenet 2005, 13(6):748-752.
17. Fuku N, Park KS, Yamada Y, Cho YM, Matsuo H, Segawa T, WatanabeS, Kato K, Yokoi K, Nozawa Y, Lee HK, Tanaka M: MitochondrialHaplogroup N9a Confers Resistance against Type 2 Diabetesin Asians. American Journal of Human Genetics 2007, 80(3):407-415.
18. Saxena R, de Bakker PI, Singer K, Mootha V, Burtt N, Hirschhorn JN,Gaudet D, Isomaa B, Daly MJ, Groop L, Ardlie KG, Altshuler D:Comprehensive association testing of common mitochon-drial DNA variation in metabolic disease. Am J Hum Genet2006, 79(1):54-61.
19. Wang D, Taniyama M, Suzuki Y, Katagiri T, Ban Y: Association ofthe mitochondrial DNA 5178A/C polymorphism withmaternal inheritance and onset of type 2 diabetes in Japa-nese patients. Exp Clin Endocrinol Diabetes 2001, 109(7):361-364.
20. Hegele RA, Zinman B, Hanley AJ, Harris S, Connelly PW: A com-mon mtDNA polymorphism associated with variation inplasma triglyceride concentration [letter]. American Journal ofHuman Genetics 1997, 60(6):1552-1555.
21. Rai E, Sharma S, Koul A, Bhat AK, Bhanwer AJ, Bamezai RN: Inter-action between the UCP2-866G/A, mtDNA 10398G/A andPGC1alpha p.Thr394Thr and p.Gly482Ser polymorphisms intype 2 diabetes susceptibility in North Indian population.Hum Genet 2007.
22. Poulton J, Luan J, Macaulay V, Hennings S, Mitchell J, Wareham NJ:Type 2 diabetes is associated with a common mitochondrialvariant: evidence from a population-based case-controlstudy. Hum Mol Genet 2002, 11(13):1581-1583.
23. Bhat A, Koul A, Sharma S, Rai E, Bukhari SI, Dhar MK, Bamezai RN:The possible role of 10398A and 16189C mtDNA variants inproviding susceptibility to T2DM in two North Indian popu-lations: a replicative study. Hum Genet 2007, 120(6):821-826.
24. Chinnery PF, Elliott HR, Patel S, Lambert C, Keers SM, Durham SE,McCarthy MI, Hitman GA, Hattersley AT, Walker M: Role of themitochondrial DNA 16184-16193 poly-C tract in type 2 dia-betes. Lancet 2005, 366(9497):1650-1651.
25. Brownlee M: Biochemistry and molecular cell biology of dia-betic complications. Nature 2001, 414(6865):813-820.
26. Mukae S, Aoki S, Itoh S, Sato R, Nishio K, Iwata T, Katagiri T: Mito-chondrial 5178A/C Genotype is Associated With Acute Myo-cardial Infarction. Circ J 2003, 67(1):16-20.
27. Sokal RR, Rohlf FJ: Biometry: the principles and practice of sta-tistics in biological research. 3rd edition. W.H. Freeman andCompany, New York; 1995.
28. Picornell A, Gimenez P, Castro JA, Ramon MM: MitochondrialDNA sequence variation in Jewish populations. Int J Legal Med2006, 120(5):271-281.
29. Zeviani M, Di Donato S: Mitochondrial disorders. Brain 2004,127(Pt 10):2153-2172.
30. Carelli V, Achilli A, Valentino ML, Rengo C, Semino O, Pala M, OlivieriA, Mattiazzi M, Pallotti F, Carrara F, Zeviani M, Leuzzi V, Carducci C,Valle G, Simionati B, Mendieta L, Salomao S, Belfort R Jr., Sadun AA,Torroni A: Haplogroup effects and recombination of mito-chondrial DNA: novel clues from the analysis of Leber hered-itary optic neuropathy pedigrees. Am J Hum Genet 2006,78(4):564-574.
31. Ruiz-Pesini E, Mishmar D, Brandon M, Procaccio V, Wallace DC:Effects of Purifying and Adaptive Selection on Regional Var-iation in Human mtDNA. Science 2004, 303(5655):223-226.
32. Feder J, Ovadia O, Glaser B, Mishmar D: Ashkenazi JewishmtDNA haplogroup distribution varies among distinct sub-populations: lessons of population substructure in a closedgroup. Eur J Hum Genet 2007, 15(4):498-500.
33. Dato S, Passarino G, Rose G, Altomare K, Bellizzi D, Mari V, FeracoE, Franceschi C, De Benedictis G: Association of the mitochon-drial DNA haplogroup J with longevity is population specific.European Journal of Human Genetics 2004, 12(12):1080-1082.
34. Ross OA, McCormack R, Curran MD, Duguid RA, Barnett YA, ReaIM, Middleton D: Mitochondrial DNA polymorphism: its role inlongevity of the Irish population. Experimental Gerontology 2001,36(7):1161-1178.
35. Ruiz-Pesini E, Lapena AC, Diez-Sanchez C, Perez-Martos A, MontoyaJ, Alvarez E, Diaz M, Urries A, Montoro L, Lopez-Perez MJ, EnriquezJA: Human mtDNA Haplogroups associated with high orreduced spermatozoa motility. American Journal of Human Genet-ics 2000, 67(3):682-696.
36. Niemi AK, Majamaa K: Mitochondrial DNA and ACTN3 geno-types in Finnish elite endurance and sprint athletes. Eur J HumGenet 2005, 13(8):965-969.
37. Hudson G, Keers S, Yu Wai Man P, Griffiths P, Huoponen K, Savon-taus ML, Nikoskelainen E, Zeviani M, Carrara F, Horvath R, KarcagiV, Spruijt L, de Coo IF, Smeets HJ, Chinnery PF: Identification of anX-chromosomal locus and haplotype modulating the pheno-type of a mitochondrial DNA disorder. Am J Hum Genet 2005,77(6):1086-1091.
38. Kazuno AA, Munakata K, Nagai T, Shimozono S, Tanaka M, YonedaM, Kato N, Miyawaki A, Kato T: Identification of MitochondrialDNA Polymorphisms That Alter Mitochondrial Matrix pHand Intracellular Calcium Dynamics. PLoS Genet 2006,2(8):e128.
39. www.mitomap.org: . .40. Brunmair B, Staniek K, Gras F, Scharf N, Althaym A, Clara R, Roden
M, Gnaiger E, Nohl H, Waldhausl W, Furnsinn C: Thiazolidinedi-ones, like metformin, inhibit respiratory complex I: a com-mon mechanism contributing to their antidiabetic actions?Diabetes 2004, 53(4):1052-1059.
41. Behar DM, Hammer MF, Garrigan D, Villems R, Bonne-Tamir B, Rich-ards M, Gurwitz D, Rosengarten D, Kaplan M, Della Pergola S, Quin-tana-Murci L, Skorecki K: MtDNA evidence for a geneticbottleneck in the early history of the Ashkenazi Jewish pop-ulation. Eur J Hum Genet 2004, 12(5):355-364.
42. Maitra A, Cohen Y, Gillespie SE, Mambo E, Fukushima N, Hoque MO,Shah N, Goggins M, Califano J, Sidransky D, Chakravarti A: TheHuman MitoChip: a high-throughput sequencing microarrayfor mitochondrial mutation detection. Genome Res 2004,14(5):812-819.
43. Rothman KJ: No adjustments are needed for multiple compar-isons. Epidemiology 1990, 1(1):43-46.
44. Kumar S, Tamura K, Nei M: MEGA3: Integrated software forMolecular Evolutionary Genetics Analysis and sequencealignment. Brief Bioinform 2004, 5(2):150-163.
45. [http://www.genpat.uu.se/mtDB/].
Page 11 of 11(page number not for citation purposes)
http://www.ncbi.nlm.nih.gov/entrez/query.fcgi?cmd=Retrieve&db=PubMed&dopt=Abstract&list_uids=9199581
http://www.ncbi.nlm.nih.gov/entrez/query.fcgi?cmd=Retrieve&db=PubMed&dopt=Abstract&list_uids=9199581
http://www.ncbi.nlm.nih.gov/entrez/query.fcgi?cmd=Retrieve&db=PubMed&dopt=Abstract&list_uids=9199581
http://www.ncbi.nlm.nih.gov/entrez/query.fcgi?cmd=Retrieve&db=PubMed&dopt=Abstract&list_uids=2081237