Dhanuka Agritech Ltd - MarketsMojo
25
Initiating Report 21 st Oct, 2020 Dhanuka Agritech Ltd Agrochemical Buy Target Price 880 DOMESTIC PLAY A BRIGHT SPOT We are initiating coverage on Dhanuka Agritech Limited (DAGRI) with a BUY recommendation and a Target Price of Rs 880 which implies 27% upside from the current levels. DAGRI’s strong growth prospects in domestic formulation and well established pan India network places it in a strong position. The company has ramped up its domestic formulations operations over the years through building strong collaboration with leading innovator companies in the global CPC business. The company has delivered healthy growth with a CAGR of ~10%/10%/12% in Revenue/EBITDA/PAT respectively, over FY11-20. We expect the company to deliver healthy growth over FY20-23E with a CAGR of ~16%/21%/20% in Revenue/EBITDA/PAT respectively on account of 1) Strong product portfolio with 4-5 new product launchesand one or two 9(3) molecules annualy in the domestic formulation business, 2) Stable revenue given collaboration with global MNCs, 3) PAN India distribution network of 7000+ dealers and strong marketing teamto penetrate further into newer markets, 4) Healthy (net debt free) balance sheet with no liquidity constraint, 5) Asset light business model to render high ROE & ROCE. At CMP, the stock trades at 14xFY23E earnings, which we believe is attractive given the strong revenue growth over FY20- FY23E. OUR INVESTMENT THESIS IS BASED ON THE FOLLOWING PREMISES Strong product portfolio backed by collaboration with global MNCs Dhanuka has a strong collaboration with global MNCs to market their products in India. The strategic partnership revenue stood at ~45% in FY20 vs 47% in FY14 due to slowdown in product launches, however we expect this growth to revive as the company targets to launch 10 new products across all segment in next 2-3 years with focus on margin accretive products in 9(3) category. Dhanuka has already launched 4 new products so far in FY21E of which 2 are in the 9(3) category and expects to maintain similar pace going forward. We believe, the company could post revenue CAGR of ~16% from FY20-23E given its 1) strong existing product portfolio with 4-5 new product launches each year and 2) Positive macro agriculture dynamics. Pan India distribution network Dhanuka derives ~33% of its revenues from its top ten brands which are in-licensed to the company, or are co-marketed agrochemical products under company’s brands. The company has built several strong brands over the years and some of the key brands, include TARGA SUPER, EM-1, COVER, CALDAN 4G, LARGO, DHANZYME GOLD and WEEDMAR SUPER. The company has a strong presence in southern and western regions which contributes ~65% toits revenues. DAGRI has established an extensive, pan-India distribution network comprising of over 7000+ distributors and over ~80,000 retailers with a network of more than 1,500 field agents that connect with over 10mn farmers and retailers across the country thus replicating a typical rural FMCG distribution model. This in our view is a key competitive advantage the company enjoys and can be leveraged with MNCs to drive further growth. DAGRI we believe is well placed to grow its domestic revenue over FY20-23E. Strong Balance Sheet and Return Ratios DAGRI’s asset light model has helped it to render high ROE and ROCE in comparison to the industry. The company has maintained healthy operating cashflows, asset turns (~8x) and EBITDA margins over the years making it a capital efficient business.The company has not undertaken any major CAPEX over the past few years and that which it did was largely funded through internal accruals. It has sustained an average ROE and ROCE at 25%+/28% respectively which are expected to be maintained (or improved given buy back) going forward given no major capex. Balance sheet remains strong with Net Debt/EBITDA and Net Debt/Equity at -0.11x and -0.03x respectively in FY20. Robust long-term growth outlook – Initiate with BUY Initiate coverage with BUY rating on the stock anda target price of Rs 880 (17xFY23E EPS). We believe Dhanuka is well placedin the domestic agrochem industry given its strong product portfolio aided by new launches every year in collaboration with global MNCs and solid distribution network aiding DAGRI to penetrate in newer markets. At CMP, stock trades at 14x FY23E EPS and is fairly valued in our view. We assign a target multiple of 17x FY23E EPS in line with 3 year average PE arrive at our TP. Key Financials (Consolidated) (Rs. Cr) FY20 FY21E FY22E FY23E Net Sales 1,120 1,402 1,581 1,744 EBITDA 174 233 275 309 Net Profit 142 181 216 243 EPS (Rs) 29.8 38.4 45.9 51.8 PER (x) 12.9 8.8 15.5 13.7 EV/EBITDA (x) 10.1 6.7 12.0 10.4 RoE (%) 21.0 24.1 25.1 24.0 Debt/Equity (x) 0 (0) (0) (0) Source: Company, Axis Research (CMP as of Oct 20, 2020) CMP (Rs) 695 Upside /Downside (%) 27% High/Low (Rs) 936/261 Market cap (Cr) 3,330 Avg. daily vol. (6m) Shrs. 136,378 No. of shares (Cr) 4.76 Shareholding (%) Jan-20 Jun-20 Sep-20 Promoter 75.0 75.0 75.0 FIIs 0.0 0.0 0.0 MFs / UTI 12.4 12.8 11.7 Banks /FIs 0.0 0.0 0.0 Others 12.6 12.2 13.3 Financial & Valuations Y/E Mar (Rs. Cr) FY21E FY22E FY23E Net Sales 1,402 1,581 1,744 EBITDA 233 275 309 Net Profit 181 216 243 EPS (Rs.) 38.4 45.9 51.8 PER (x) 8.8 16.0 14.2 EV/EBITDA (x) 6.7 12.0 10.4 P/BV (x) 2.0 3.7 3.1 ROE (%) 24.1 25.1 24.0 Key Drivers (%) Y/E Dec FY21E FY22E FY23E Revenue Growth 25.2 12.8 10.3 EBITDA Margin 16.6 17.4 17.7 PAT Growth 27.2 19.5 12.9 Axis vs Consensus EPS Estimates 2021E 2022E 2023E Axis 38.4 45.9 51.8 Consensus 39.4 44.7 49.6 Mean Consensus TP (12M) 918 Relative performance Source: Capitaline, Axis Securities 0 100 200 300 400 Oct-19 Apr-20 Oct-20 Dhanuka Agritech Ltd Sensex Index Gaurav Uttrani Research Analyst Email: [email protected] Ph: +91 9532866097 Suvarna Joshi Sr. Research Analyst Email: [email protected] Ph: +91 9987067592
-
Upload
khangminh22 -
Category
Documents
-
view
2 -
download
0
Transcript of Dhanuka Agritech Ltd - MarketsMojo

Initiating Report 21st Oct, 2020
Dhanuka Agritech Ltd Agrochemical
Buy Target Price
880
DOMESTIC PLAY A BRIGHT SPOT
We are initiating coverage on Dhanuka Agritech Limited (DAGRI) with a BUY recommendation and a Target Price of Rs 880 which implies 27% upside from the current levels. DAGRI’s strong growth prospects in domestic formulation and well established pan India network places it in a strong position. The company has ramped up its domestic formulations operations over the years through building strong collaboration with leading innovator companies in the global CPC business. The company has delivered healthy growth with a CAGR of ~10%/10%/12% in Revenue/EBITDA/PAT respectively, over FY11-20. We expect the company to deliver healthy growth over FY20-23E with a CAGR of ~16%/21%/20% in Revenue/EBITDA/PAT respectively on account of 1) Strong product portfolio with 4-5 new product launchesand one or two 9(3) molecules annualy in the domestic formulation business, 2) Stable revenue given collaboration with global MNCs, 3) PAN India distribution network of 7000+ dealers and strong marketing teamto penetrate further into newer markets, 4) Healthy (net debt free) balance sheet with no liquidity constraint, 5) Asset light business model to render high ROE & ROCE. At CMP, the stock trades at 14xFY23E earnings, which we believe is attractive given the strong revenue growth over FY20-FY23E.
OUR INVESTMENT THESIS IS BASED ON THE FOLLOWING PREMISES
Strong product portfolio backed by collaboration with global MNCs
Dhanuka has a strong collaboration with global MNCs to market their products in India. The strategic partnership revenue stood at ~45% in FY20 vs 47% in FY14 due to slowdown in product launches, however we expect this growth to revive as the company targets to launch 10 new products across all segment in next 2-3 years with focus on margin accretive products in 9(3) category. Dhanuka has already launched 4 new products so far in FY21E of which 2 are in the 9(3) category and expects to maintain similar pace going forward. We believe, the company could post revenue CAGR of ~16% from FY20-23E given its 1) strong existing product portfolio with 4-5 new product launches each year and 2) Positive macro agriculture dynamics.
Pan India distribution network
Dhanuka derives ~33% of its revenues from its top ten brands which are in-licensed to the company, or are co-marketed agrochemical products under company’s brands. The company has built several strong brands over the years and some of the key brands, include TARGA SUPER, EM-1, COVER, CALDAN 4G, LARGO, DHANZYME GOLD and WEEDMAR SUPER. The company has a strong presence in southern and western regions which contributes ~65% toits revenues. DAGRI has established an extensive, pan-India distribution network comprising of over 7000+ distributors and over ~80,000 retailers with a network of more than 1,500 field agents that connect with over 10mn farmers and retailers across the country thus replicating a typical rural FMCG distribution model. This in our view is a key competitive advantage the company enjoys and can be leveraged with MNCs to drive further growth. DAGRI we believe is well placed to grow its domestic revenue over FY20-23E.
Strong Balance Sheet and Return Ratios
DAGRI’s asset light model has helped it to render high ROE and ROCE in comparison to the industry. The company has maintained healthy operating cashflows, asset turns (~8x) and EBITDA margins over the years making it a capital efficient business.The company has not undertaken any major CAPEX over the past few years and that which it did was largely funded through internal accruals. It has sustained an average ROE and ROCE at 25%+/28% respectively which are expected to be maintained (or improved given buy back) going forward given no major capex. Balance sheet remains strong with Net Debt/EBITDA and Net Debt/Equity at -0.11x and -0.03x respectively in FY20.
Robust long-term growth outlook – Initiate with BUY
Initiate coverage with BUY rating on the stock anda target price of Rs 880 (17xFY23E EPS). We believe Dhanuka is well placedin the domestic agrochem industry given its strong product portfolio aided by new launches every year in collaboration with global MNCs and solid distribution network aiding DAGRI to penetrate in newer markets. At CMP, stock trades at 14x FY23E EPS and is fairly valued in our view. We assign a target multiple of 17x FY23E EPS in line with 3 year average PE arrive at our TP.
Key Financials (Consolidated)
(Rs. Cr) FY20 FY21E FY22E FY23E
Net Sales 1,120 1,402 1,581 1,744
EBITDA 174 233 275 309
Net Profit 142 181 216 243
EPS (Rs) 29.8 38.4 45.9 51.8
PER (x) 12.9 8.8 15.5 13.7
EV/EBITDA (x) 10.1 6.7 12.0 10.4
RoE (%) 21.0 24.1 25.1 24.0
Debt/Equity (x) 0 (0) (0) (0)
Source: Company, Axis Research
(CMP as of Oct 20, 2020)
CMP (Rs) 695
Upside /Downside (%) 27%
High/Low (Rs) 936/261
Market cap (Cr) 3,330
Avg. daily vol. (6m) Shrs. 136,378
No. of shares (Cr) 4.76
Shareholding (%)
Jan-20 Jun-20 Sep-20
Promoter 75.0 75.0 75.0
FIIs 0.0 0.0 0.0
MFs / UTI 12.4 12.8 11.7
Banks /FIs 0.0 0.0 0.0
Others 12.6 12.2 13.3
Financial & Valuations
Y/E Mar (Rs. Cr) FY21E FY22E FY23E
Net Sales 1,402 1,581 1,744
EBITDA 233 275 309
Net Profit 181 216 243
EPS (Rs.) 38.4 45.9 51.8
PER (x) 8.8 16.0 14.2
EV/EBITDA (x) 6.7 12.0 10.4
P/BV (x) 2.0 3.7 3.1
ROE (%) 24.1 25.1 24.0
Key Drivers (%)
Y/E Dec FY21E FY22E FY23E
Revenue Growth 25.2 12.8 10.3
EBITDA Margin 16.6 17.4 17.7
PAT Growth 27.2 19.5 12.9
Axis vs Consensus
EPS Estimates 2021E 2022E 2023E
Axis 38.4 45.9 51.8
Consensus 39.4 44.7 49.6
Mean Consensus TP (12M) 918
Relative performance
Source: Capitaline, Axis Securities
0
100
200
300
400
Oct-19 Apr-20 Oct-20
Dhanuka Agritech Ltd Sensex Index
Gaurav Uttrani Research Analyst
Email: [email protected]
Ph: +91 9532866097
Suvarna Joshi Sr. Research Analyst
Email: [email protected]
Ph: +91 9987067592

2
Story in charts
Exhibit 1: Revenue expected to register CAGR of ~16% Exhibit 2: Insecticide & Herbicide forming ~75% of the revenue
Source: Company, Axis Securities
Exhibit 3: West and South contribute ~65% to total revenue Exhibit4: EBITDAto post CAGR of ~21% over FY20-23E
Source: Company, Axis Securities
Exhibit 5: PAT to post CAGR of ~20% over FY20-23E Exhibit 6: Rising R&D exp as a % of sale
Source: Company, Axis Securities
-5
0
5
10
15
20
25
0
500
1000
1500
2000
(%)
(Rs c
r)
Revenue from Operation % Growth (YoY)
0
500
1000
1500
2000
(Rs c
r)
Insecticides Herbicide Fungicide Others
0
500
1000
1500
2000
(Rs C
r)
East North South West
0
5
10
15
20
25
0
100
200
300
400
(%
)
(Rs C
r)
EBITDA EBITDA Margin
0
4
8
12
16
0
100
200
300
(%)
(Rs c
r)
PAT PAT Margin
0
0,1
0,2
0,3
0,4
0,0
1,0
2,0
3,0
4,0
FY15 FY16 FY17 FY18 FY19 FY20
(% )
(Rs c
r)
Research and Development % of sales

3
Exhibit 7: Healthy operating cash flows to sustain capex Exhibit 8: Steady Asset turnover in range of ~8.0x
Source: Company, Axis Securities
Exhibit 9: Healthy Return Ratios to sustain over FY20-23E Exhibit 10: Stable Net Debt/Equity ratio
Source: Company, Axis Securities
Exhibit 11: 12MFWD PE CHART (x) Exhibit 12: 12MFWD PE BAND CHART
Source: Company, Axis Securities
0
5
10
15
20
25
(x)
CFO/CAPEX
0
2
4
6
8
10
0
5
10
15
20
25
30
35
(x)
(Rs c
r)
CAPEX Asset/Turnover
0%
10%
20%
30%
40%
(%)
ROE ROCE
(0,2)
(0,1)
(0,1)
0,0
0,1
0,1
(x)
Net Debt /Equity
0
500
1000
1500
2000
Ma
r-12
Se
p-1
2
Ma
r-13
Se
p-1
3
Ma
r-14
Se
p-1
4
Ma
r-15
Se
p-1
5
Ma
r-16
Se
p-1
6
Ma
r-17
Se
p-1
7
Ma
r-18
Se
p-1
8
Ma
r-19
Se
p-1
9
Ma
r-20
Se
p-2
0
Dhanuka Agri 12M Fwd PE Band
Price 10x 15x 20x 25x
0
10
20
30
40
Ma
r-12
Au
g-1
2
Jan
-13
Jun
-13
Nov-1
3
Ap
r-14
Se
p-1
4
Fe
b-1
5
Jul-1
5
Dec-1
5
Ma
y-16
Oct
-16
Ma
r-17
Au
g-1
7
Jan
-18
Jun
-18
Nov-1
8
Ap
r-19
Se
p-1
9
Fe
b-2
0
Jul-2
0
Dhanuka Agri1Y Fwd PE Chart
PE Mean Mean+1Stdev Mean-1Stdev

4
Agrochemical Industry overview
India’s crop protection chemical (CPC) market is estimated to be approximately US$4billion with export from India contributing ~50% of total
domestic production (by value) in 2019 with an equal amount of CPC meeting the domestic demand. In terms of exports, India’s crop protection
chemicals have grown at a CAGR of ~9% during 2015-2019. Exports share is projected to grow to ~55% in 2024 (by value) to reach US$ 3.1 billion
of the total domestic production, which would be valued at US$ 5.7 billion. India is world’s 3rd largest pesticide exporter by volume in 2018 with a
share of ~8% behind China (27%) and Germany (8.3%). Indian agriculture market is dominated by Insecticides which consists of 60% of the overall
demand followed by Fungicides at 18% and Herbicides at 16% and other categories comprise the remaining 6%. In the recent years, traction
towards Herbicides has grown, given changing (warmer) weather conditions, rising labour costs and increasing cultivation of rice, soybean and
wheat crops. Fungicides have grown relatively slower with increasing cropping areas of rice, fruits and vegetables. Bio Pesticides have not seen
significant growth yet, but its usage is likely to accelerate over the longer run as environmental awareness grows and farmers cut down on usage of
chemical based Pesticides.
Exhibit 13: India’s CPM*to register CAGR of ~6.3% fromFY19-24E Exhibit14: India’s CPM* dominated byInsecticides
Source: Company, Axis Securities, * CPM – Crop Protection Market
Key drivers of growth for Indian CPC market
Increasing food demand with decreasing per capita arable land: India’s population in 2019 was estimated at 1.35 billion, which is
approximately 18% of the world population. This population is growing at the rate of ~1.3% annually, and per capita arable land is
decreasing. Therefore in order to accommodate rising needs for the growing population, usage of crop protection chemicals is expected
to increase over the next 5 years. Currently, India has one of the lowest consumption of crop protection chemicals per hectare at 0.6
kg/ha as against 5-7 kg/ha in the UK and 13 kg/ha in China.
Exhibit 15: India is highly under penetrated for CPC Exhibit 16: Decreasing Per/Capita arable land
Source: Company, Axis SecuritiesSource: World Bank, Axis Securities
2,1 2,6
2,1
3,1
0
2
4
6
2019 2024E
US
D $
(b
n)
Domestic Export
56 53 49
23 24 21
18 19 14
3 4 16
0
20
40
60
80
100
120
2014 2019 2024E
Insecticides Herbicides Fungicides Others
0,6 2
3 4
5
7 7
12 13
0
2
4
6
8
10
12
14
kg/h
a)
Pesticide consumption
0,0
0,2
0,3
0,5
0
40
80
120
160
(x)
(mn)
Population Hectares Per Capita

5
Generic players to benefit in coming years: 70% of the agrochemical industry across the globe is dominated by innovators while the
main market consists of generics. Within the off-patent market, share of patent products is 20% while generic companies hold the rest
80% share. Out of the generic crop-protection market, about 25% is controlled by innovators. Therefore high cost of manufacturing
elsewhere creates a room for generic players to garner market share from innovators given their advantageous position in terms of
lower cost of production and wide distribution networks. Indian farmers are more price sensitive than those in other countries. Therefore,
lower price products offered by generic companies having a wide distribution network, innovative process technology for post patent
molecules, capability to develop better product mix could push volumes with competitive prices as compared to innovator companies.
Exhibit17: Products worth US$ 4.2 billion expected to go off patent between 2020-23
Source: Company, Axis Securities
Indian Government’s thurst on agriculture is in sync with goal to double farmers’ income: Government of India is proactively
taking measures to significantly improve farmers’ income in the coming decade. The budgetary provisions in the recent budget 2020-
2021, for the farmers’ welfare, Rs.1.4 trillion were allocated to the Ministry of Agriculture and Farmers’ Welfare. This allocation is 30%
higher than the revised estimate for 2019-2020. Crop protection chemicals market could thus be positively impacted by this huge
government spending as it could support the farmer from protecting his crop from loss and decreased yield. Besides, fiscal support,
Government has increased minimum support prices on key Rabi crops from 50% to 109% that will be marketed in the 2020-21 Rabi
harvest season.
Increase in horticulture and floriculture production: Fruits and vegetables contribute approximately 90% of the total horticulture
crops produced in India. This is an important source of income for farmers and thus the Government has been promoting export of
horticulture products. In order to avoid horticulture crop losses, crop protection chemicals are necessary and hence the market is
expected to increase over the next five years. Horticulture is a higher margin business and given the indespensibility of CPC to ensure
higher yield for the horticulral produce there is expected to be steadily improving growth incrop protection chemicals market. Floriculture
is another segment, which goes hand in hand with horticulture in terms of providing growth avenues, resulting in increased demand
forcrop protection chemicals in India.
Favorable regulatory environment and agricultural dynamics to benefit the sector
Pesticide Management Bill, 2020: Pesticides are currently regulated by the Insecticides Act, 1968. The main objective of the Pesticide
Management Bill, 2020 is to secure the interest of the farmers and propagate safe and effective usage of pesticides in India. This bill has
received cabinet approval in February 2020, and has been passed by the parliament. After passage of this bill, even advertisements for
the promotion of pesticides will be regulated by the Government, and hefty penalties are proposed in the bill for violating entities. This bill
would weed out the unorganised players from the market who fail to meet the stringent regulatory requirements. Thus providing
opportunity to the organised players to further expand their network into deep hinterlands.
Farm Bill, 2020: The Government of India on 14th September 2020 introduced ‘The Farmers Produce Trade and Commerce (Promotion
and Facilitation) Bill’, ‘The Farmers (Empowerment and Protection) Agreement on Price Assurance and Farm Services Bill’ and ‘The
Essential Commodities (Amendment) Bill’ to replace the ordinances promulgated earlier. These structural reforms are likely to benefit the
farmers in the long run as it will help improve their incomes as farmers will have a choice to sell their produce to anyone without APMC
getting in the way, the bills also will promote inter-state trade and provide farmers multiple options to sell their agricultural produce at
remunerative prices. We think, effective execution of these bills will go a long way in bettering the income levels of farmers thereby
indirectly being beneficial for agro-chem companies.
0,4
0,8
1,4
1,6
0,0
0,5
1,0
1,5
2,0
2020 2021 2022 2023
US
D $
(b
n)

6
Domestic Agriculture Dynamics
Outbreak of the COVID-19 pandemic which led to implementation of strict lockdown took a severe toll on the overall economic growth in
Q1FY21 as India’s GDP contracted by ~24%. However, a silver line in the blue sky was seen in terms of agriculture sector growth which
was in the positive and recorded a 3.4% YoY growth owing to Government’s timely intervention. Thus industries which are linked to
agriculture sector witnessed relatively lesser impact of the pandemic on its overall business operations. In addition to the pandemic, a
healthy monsoon this year (7% above normal as of September 2020) and improving ground water levels point towards encouraging
growth prospects for the sector. We note, surplus rains in the current monsoon season has led to a 5.7% YoY rise in sowing of kharif
crops to about 111 million hectares as against 105 million hecatres of sowing in the previous monsoon season. This healthy outlook for
the upcoming Rabi season supported by a raise in MSPs augur well for the overall agro-chemical sector in India.
Exhibit 18: Water storage levels higher than 10-year average as on (08.10.2020) to benefit Rabi sowing
Source: Central Water Commission, Axis Securities
73 81
93 91 87 90 87 93 89 87 85
79 74 78
69
0
20
40
60
80
100
Northern Region Eastern Region Western Region Central Region Southern Region
Current Year Last Year Ten Year Average

7
Key Investment Arguments
Strong Product Portfolio: New product introduction a key growth driver
Dhanuka Agritech with 150+product registrations across categories in Herbicides, Insecticides, Fungicides and Plant Growth Regulators /Bio-
Stimulants and with 350+ active SKUs has an extensive market penetration in domestic agrochemical industry. The Company provides solutions
for all major crops grown which includes cotton, paddy, wheat, sugarcane, pulses, fruits & vegetables, plantation crops and others. The company
has launched 50+ products from FY11-20 with an average 4-5 products launched each year and registering revenue CAGR of ~10% in the same
period. Top 10 brands contributed ~33% to total revenues, in FY20. The focus on 9(3) molecules and continued product launches are key for a
persistent growth in domestic industry. In Q1FY21, the company launched 2 herbicide molecules Dabooch herbicide (in-licensed from
CortevaAgriscience)for soyabean and groundnut while Dozo Maxx herbicide for broad and narrow leaf in Cotton with the help of Godrej Agrovet.
Similarly, in Q2FY21 the company launched 2 value accretive 9(3) molecules of grapes fungicides Kirari for the control of Downey Mildew
(parasite) in grapes (researched product from M/s Nissan Chemical Corporation, Japan) and Nissodium for effective control of Powdery Mildew
(fungus) of grapes (researched product from M/s Nissa Chemical, Europe). It had launched 5 molecules in FY20 (Chempa, Apply, Largo, Zapak
and Mycor) and management expects estimated sales from these 7 products to be around ~400-500 cr in the next 3-4 years.Largoan insecticideis
launched incollaboration with Cortevato control insects like Thrips & Lepidopteran in crops like Cotton, Soyabean and Chilli.Chempais apre and
early post emergence rice herbicide launched in collaboration with Nissanfor control of weeds; while Apply is an insecticides to control Brown Plant
Hopper (pest) inpaddy. The company has witnessed strong traction in the herbicide segment in Q1FY21 for paddydue to absence of labor, thereby
making weeding a tedious and cumbersome process.
We expect, the company to continue its pace of launches at 4-5 products anually, with 3-4 launches in 9(4) category and 1-2 novel molecules in
9(3) category. Dhanuka plans to launch ~10 new molecules over the next 2 years with growingfocus on 9(3) moleculesin tie ups with global MNCs.
Therefore, we believe DAGRI’sproduct pipeline will remain relatively strong and drive growth going forward.
Exhibit 19 (i): Top Ten product Contributing ~35% of the revenue
Product Name Technical Name Category Crops
Caldan4G Cartap Hydrochloride 4% G Insecticides Paddy
Caldan 50 S. P Cartap Hydrochloride 50% SP Insecticides Paddy
Cover GR Chlorantraniliprole/Rynaxypyr 0.4% GR Insecticides Paddy &Sugarcane
Cover Liq Chlorantraniliprole 18.5% W/W S Insecticides Paddy & Vegetables
Largo Spinetoram 11.7% SC Insecticide Cotton, Soybean, Chili
EM-1 Emamectin Benzoate 5% Sg Insecticides Cotton & vegetables
Targa Super Quizalofop Ethyl 5% EC Herbicides Soybean, Cotton, Groundnut
Weedmar Super 2,4-D Amine Salt 58% SL Herbicides Sorghum, Maize, Wheat
Dhanzyme Gold Granules Organic Manure Plant Growth Regulators Paddy, wheat, sugarcane
Dhanzyme Gold Liquid Organic Manure Plant Growth Regulators Paddy, wheat, sugarcane
Source: Company, Axis Securities

8
Exhibit 19 (ii): Consistent product launches with focus on margin accretive products in 9(3) category
Product Name Technical Name Category Crops Year
Mortar NA Insecticide Paddy 2014
Media Super Imidacloprid 30.5% Sc Insecticide Cotton & Paddy 2014
Danfuron SPIROMESIFEN 22.9% SC) Insecticide Brinjal, Chili, Okra 2014
Protocol Propineb 70% WP Fungicide Chili, Rice, Grapes 2014
Pager Diafenthiuron 50% WP) Insecticide Cotton, Cabbage, Chili etc. 2015
Sakura Aryloxy phenoxy-propionates Herbicides Soybeans 2015
Jackal Lambda Cyhalothrin 4.9% CS Insecticide Cotton, Paddy & Vegetables 2015
Sempra sulfonylurea Herbicides Sugarcane & Maize 2015
Dhanvarsha nitrogeneous organic Bio-nutrien Organic Bio- Complex Several Crops 2016
DOZO Pyrithibac Sodium 10% Ec Herbicides Cotton Crop 2016
Cover Chlorantraniliprole/Rynaxypyr 0.4% GR Insecticide Rice 2016
CONIKA NA Fungicide Grapes & Paddy 2017
MAXX-SOY Quizalofop-ethyl 10% EC and Chlorimuron ethyl 25% WP
Herbicide Soybeans 2017
FUJITA Isoprothiolane 40% EC Fungicide Paddy 2017
BULLON Pyriproxyfen 10% Ec Insect Growth Regulator
(IGR) Cotton &Chili 2017
Fenox - 1000 Pinoxaden 5.1% Ec Herbicide Wheat 2018
Godiwa Azoxystrobin 23% Sc) Fungicide Vegetables & Fruit 2018
Godiwa Super Azoxystrobin 18.2% W/W & Difenoconazole 11.4% W/W SC.
Fungicide Vegetables 2018
Markar Super Bifenthrin 8% SC Insecticides Tea & Apple 2018
D-One sulfoximines Insecticides Paddy & Cotton 2018
Suelo NA Soil Health Enhancer Vegetables 2018
Domar Dinofefuran 20% Sg Insecticide Rice & Cotton 2018
Mycore Arbuscular Mycorrhizal Fungi Plant Growth Regulators Paddy & Wheat 2020
Zapac NA Insecticide Flower 2020
Largo Spinetoram 11.7% SC Insecticide Cotton, Soybean, Chili 2020
Chempa Pyrazosulfuron-Ethyl 70% WDG Herbicides Paddy 2020
Apply Pymetrozine 50% WG Insecticide Paddy 2020
Kirari AMISULBROM 20% SC) Fungicide Grapes 2021
Nissodium CYFLUFENAMID 5% EW Fungicide Grapes 2021
Dabooch Diclosulam 84% WDG Herbicides Soybean &Groundnut 2021
Dozo Maxx Pyrithibac Sodium 10% Ec Herbicides Cotton 2021
Source: Company, Axis Securities

9
Innovation Turnover Index
Dhanuka Agritech has maintained strong innovation turnover index over the years with highest percentage of new molecules contribution to
revenues. Its new molecules contribution to revenue stood at 20% in FY16 and FY18. In FY19, the company witnessed a muted year in terms
of product launches, which led to a decline in revenue contribution from new molecules to only 17% which further reduced to 12% in FY20. To
again gather pace the company launched 5 new molecules in FY20, followed by 4 new molecules untill Q2FY21 of which 2 are of 9(3) category
(grapes fungicides Kirari & Nissodium). In Q1FY21, innovation turnover index was at 7% and the company expects this index to improve by
~200 bps in FY21E to 14% given positive response from the market for its new products launches.
Exhibit 20: Innovation turnover Index to improve going ahead with focus on 9(3) product launches
Source: Company, Axis Securities
Strong tie-ups with global MNC’s
In FY20, Dhanuka enjoyed technical collaborations with 11 (vs 8 in FY18) leading global innovating companies from US, Japan and Europe for
marketing and distributing their products in India and this has been a steady revenue generator for the company. The company’s expansive reach
with one of the largest distribution networks in the country with 7000+ distributors is a major strength. For MNCs planning to reach out to Indian
farmers, this offers an attractive proposition. Dhanuka has thus been able to leverage this competitive advantage while forging tie-ups with MNCs
and global innovators. Strategic collaborations with MNCs results in technology transfer and adoption of scientically advanced, high-efficacy plant-
protection chemicals. The company plans to launch 1-2 molecules every year in tie up with MNCs, giving Dhanuka exclusive marketing rights for
the first 3-5 years, which could be extended depending on performance. Products with limited competition provide higher margins with stable
revenue for the company. Partnership driven revenues in FY20 were ~45% lower than 47% in FY14 due to 1) termination of exclusitivity in certain
products and 2) generics entering thespace. To address this decline the company in Q2FY21, launched 2 value accretive 9(3) molecules Kirari, a
grape fungicide (researched product from M/s Nissan Chemical Corp, Japan) and Nissodium (researched product from M/s Nissan Chemical,
Europe). We think from a medium term perspective Dhanuka has an eye on forging new tie ups with other MNC agrochemical companies and new
product laucnhes from existing tie-ups which could lead to an improvement in partnership revenues and also enhance margins as these are value
accretive products.
Exhibit 21: Stable revenue backed by strong collaboration with 11 global MNCs
Source: Company, Axis Securities
11% 13%
20%
17%
20%
17%
12% 14%
0%
5%
10%
15%
20%
25%
FY14 FY15 FY16 FY17 FY18 FY19 FY20 FY21E
(%)
New Molecules as a % of Total Revenue

10
Widespread presence across regions
Dhanuka’s revenue profile is de-risked as, it derives revenues from across regions in India and thus is relatively insulated from demand contraction
in any one region as the other regions compensate for the decline thereby lowering exposure to any particular region. Major crops for the company
are paddy, cotton, soyabean and horticulture crops etc. which are predominantly grown in Southern and Western India. We note South and West
regions account for ~65% of the company’s revenue and North and East contributes 25% and 10% respectively. Top states in revenue contribution
are Maharashtra, Andhra Pradesh, Telangana and Madhya Pradeshfor the company as most crops to which DAGRI provides CPC are grown in
these states.
Exhibit 22: Pan India presence, with west and south contributing ~65% of the revenue
Source: Company, Axis Securities
Leveraging strong distribution network
DAGRI, has the 2nd largest pan India distribution network and has presence through marketing offices in all major states across India with over
~7,000 direct dealers catering to ~80,000 retailers, covering over 600 districts with ~10 million farmers’ touch point across the country.
Dhanuka’s distribution network grew from ~4,000 distributors in FY08 to ~7,000+ in FY20. A robust distribution network helps the company to
attract MNCs for new product launches. In 2016, so as to streamline its distribution network and weed out inefficiencies, the company launched
Kohinoor scheme with an aim to focus on high revenue generating dealers/distributors. Under this scheme it would nominate and provide
better services to about ~25% of its distributors who generate ~75% of the total revenues. In the scheme sales representative visit dealers with
suggetions on products to be bought and distributors whose supplies matches the system are provided with benefits of taking back products
remained unsold and efficient inventory and receivables management. While over the last couple years DAGRI consolidated and optimized its
primary channel (dealer distributors now at 7,000+ from 8,500 in FY17), it now focuses on expanding its secondary channel which includes
retailers. This we believe is a step in the right direction especially in the context of passage of Farm Bills 2020. Agriculture reforms initiatied by
these bills are expected to benefit farmers over the long term as it gives them an opportunity to improve their incomes and also bring in more
stability to their revenues because the farmer now has an opportunity to sell his produce in any state as free inter-state movement is now
permitted by law. Focus on retail channel will therefore ensure DAGRI is able to improve on its last mile connectivity and make their products
available at every access point even in deeper rural belts.
Exhibit 23: Second largest distribution network in the country with network of 7000+ dealers
Source: Company, Axis Securities
0
500
1000
1500
2000
(Rs C
r)
East North South West
East; 11%
North; 25%
South; 31%
West; 33%
7.000
10.000
3.800
5.000
4.000
0
4000
8000
12000
Dhanuka Agritech PI Industries Rallis India Insecticides Bayer
(No o
f D
eale
rs)
11
Go to market strategy for maximum market penetration
Farmers are end consumers of the products manufacturerd by Dhanuka and thus it needs to frequently organise various seminars to create
awareness about innovative farming techniques, products enhancing crop yield and service assistance to the farmers. Thus it becomes important
that the company works consistently on growing its farmer reach and penetrates further by expanding its retail touch points. Dhanuka interacts with
farmers through online modes and aggressively advertises new products launches on TV media. Through its go to market strategy, Dhanuka
engages with consumer as well as with channel partners to identify on ground requirements and launches new products as per market opportunity.
In FY20, the company introduced rice herbicide/Chempafor (DSR) Direct Seeded Rice or water stressed rice which witnessed an increased trend
YoYin FY20 due to deficient rainfall and high labour cost. Likewise, in FY21 due to non availability of migrant labor it became difficult for the
farmers in Punjab, Haryana and other places to carry out manual weeding. In absence of manual weeding process farmers depended on pre-
emergent herbicide manufactured by Dhanuka thereby aiding volume growth for its newly launched products.
Dhanuka Doctors
Dhanuka has strengthened the deployment of ‘Dhanuka Doctors’ from 850 in FY10 to 1500+ at present, demonstrating product efficacy, output
quality and superior price-value. Each Dhanuka doctor who is a field assistant, covers 12-18 villages every week and interacts directly with the
farmers and provide solution to farmers regarding their crops, it helps the company to assess new markets and create better awareness of the
company’s new and existing products that can be used by farmers at various stages of the crop cycle. Each of these Doctors possess an in-depth
understanding of crop allocations, harvest patterns, farm risks, projected farmer incomes etc which enables DAGRI to strategically introduce new
products in the market in turn enhancing its product offerings.
Exhibit 24: Strengthening the deployment over the years Exhibit 25: Average field assistant 1.6% of sale
Source: Company, Axis Securities
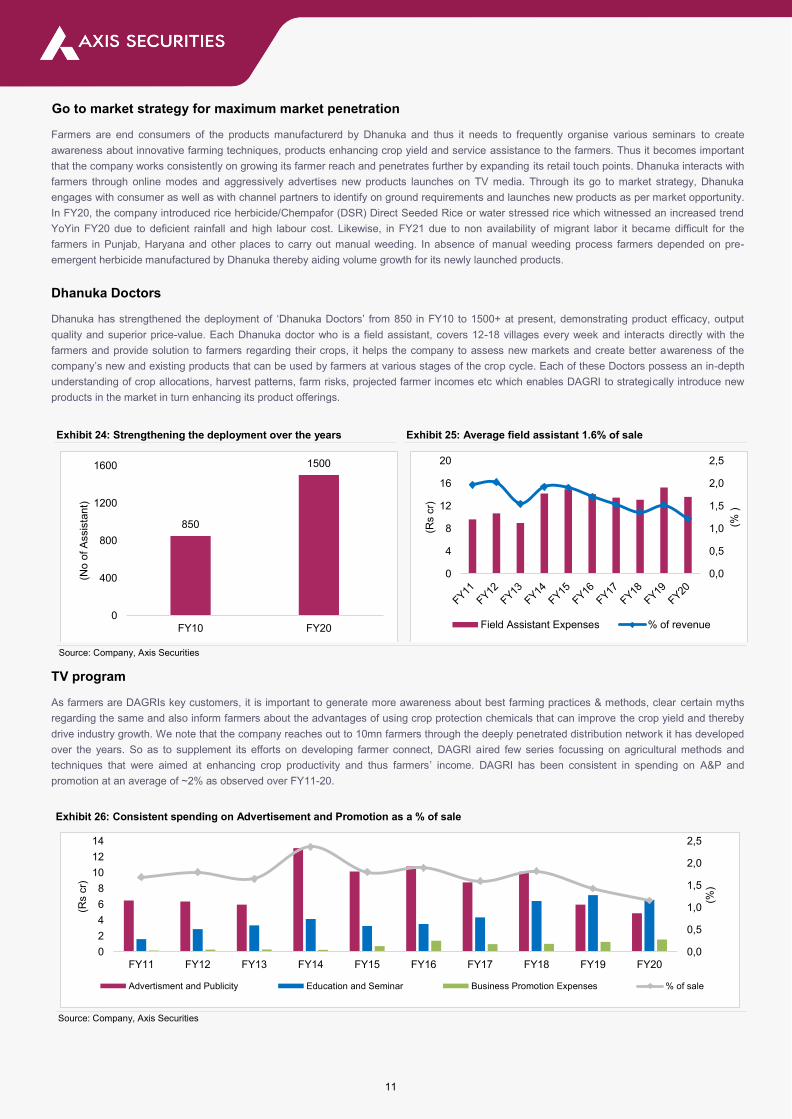
TV program
As farmers are DAGRIs key customers, it is important to generate more awareness about best farming practices & methods, clear certain myths
regarding the same and also inform farmers about the advantages of using crop protection chemicals that can improve the crop yield and thereby
drive industry growth. We note that the company reaches out to 10mn farmers through the deeply penetrated distribution network it has developed
over the years. So as to supplement its efforts on developing farmer connect, DAGRI aired few series focussing on agricultural methods and
techniques that were aimed at enhancing crop productivity and thus farmers’ income. DAGRI has been consistent in spending on A&P and
promotion at an average of ~2% as observed over FY11-20.
Exhibit 26: Consistent spending on Advertisement and Promotion as a % of sale
Source: Company, Axis Securities
850
1500
0
400
800
1200
1600
FY10 FY20
(No o
f A
ssis
tant)
0,0
0,5
1,0
1,5
2,0
2,5
0
4
8
12
16
20
(% )
(Rs c
r)
Field Assistant Expenses % of revenue
0,0
0,5
1,0
1,5
2,0
2,5
0
2
4
6
8
10
12
14
FY11 FY12 FY13 FY14 FY15 FY16 FY17 FY18 FY19 FY20
(%)
(Rs c
r)
Advertisment and Publicity Education and Seminar Business Promotion Expenses % of sale

12
Increasing spends on Research & Development
Dhanuka Agritech is focused on undertaking R&D and prepare appropriate proposals as per guidelines of the Government Of India (GOI) and
submit for approval to theCentral Insecticide Board & Registration Committee (CIB & RC).The R&D division of DAGRI is actively engaged in(i)
evaluating new and current products in different agro-climatic regions of the country, (ii) product promotion and create awareness about newly
introduced products amongst different stakeholders, (iii) channelize information to consumers for safeand judicious use, (iv) develops interface
with State Agriculture Units, Indian Council of Agricultural Research and its Institutes and other such academic organizations, and (v) impart
training to development and marketing staff, agri-input dealers and farmers, etc.The company has been gradually increasing its R&D expenses as
a % of revenue and it stood at Rs 3.5 cr in FY20, increasing ~58% YoY.
Exhibit 27: Rising expenditure on R&D
Source: Company, Axis Securities
Lower raw material prices and cost rationalization to aid margin
Operating margins came under pressure in FY19 and FY20 owing to lower technical product prices, rising raw material costs and DAGRIs inability
to pass on RM price increases due to weaker market demand and price sensitivity of Indian farmers. While, in FY19/FY20 the company did witness
pressure on RM front given ~25% of its RM requirements are imported (direct imports from China are ~15%) the same witnessed easing since
H1FY20. Besides softening RM prices, higher supply in China and stabilization of technical product prices could support Gross Margin (GM)
performance going forward. In Q1FY21 DAGRIs GM stood at 34.3% vs 34.1% in FY20. Further, the company has also been thrifty about costs and
has worked on rationalizing some of them like – 1) fixed C&F commission rate of 1% from FY20-23 from 2.5% in FY19, 2) optimizing manpower
requirement thus leading to savings on employee costs. While, on the cost front the company has undertaken measures to contain them, we do
believe, change in product mix in favour of higher margin products and value accretive product innovations could drive ~220bps EBITDA margin
improvement over FY20-23E.
Exhibit 28: Improvement in margins given lower RM prices and cost rationalization
Source: Company, Axis Securities
0,0
0,1
0,2
0,3
0,4
0,0
1,0
2,0
3,0
4,0
FY15 FY16 FY17 FY18 FY19 FY20
(%)
(Rs c
r)
Research and Development % of sales
33,6 35,3 34,6
36,8 37,3 39,0
43,5 41,6
38,7 36,5 37,5 38,5 38,7
15,5 14,9 14,5 16,3 16,8 16,9
19,2 17,2
14,5 15,5 16,6 17,4 17,7
0
5
10
15
20
25
30
35
40
45
50
FY11 FY12 FY13 FY14 FY15 FY16 FY17 FY18 FY19 FY20 FY21E FY22E FY23E
(%)
Gross Margin EBITDA Margin

13
Resilient business model to help sail through current scenario
COVID-19 struck the country early in the year leading to a complete lockdown across country from end of March this led to disruption at Dhanuka’s
formulation plants and sales depots across the country. This resulted in partial deferment of company's sales of ~10% for the month of March’ 20 to
Q1FY21 and impacted EBITDA marginally and no other major impact on financials. The Company resumed its operation at various sites from the
beginning of April in a gradual manner and quickly bounced back to almost pre-COVID levels of capacity utilization given it caters to agri
(essentials) sector. With the lockdown supplies of raw material was a key challenge as Dhanuka imports nearly ~25% of its total raw material
requirements. However, its direct dependence on China is ~12%, rest balance ~13% is imported from Japan and about ~75% of its requirements
are procured locally. This has placed the company in a better situation in terms of raw material procurement and thus a much lower impact due to
COVID led supply-chain disruption from China.
Exhibit 29: Majority of raw material imported from Japan with lower dependence on China
Source: Company, Axis Securities
Appendix
Common Terminology
9(4) Me-too Registration: This is for product and source, which are already registered in India. 9(4) is the easiest method of
registration and if all the documents submitted with CIB are in proper order, then registration is issued within 6 months of making the
application.
9(3) New Registration: This registration is for products or sources, which are not registered in India yet. Any first-time registration of a
molecule or of a source will be under this category. New registrations can be of:
9(3) – TI New Molecule: Technical import registration for a new Molecule, which is never registered in India for Import.
9(3) – TI New Source: Technical import registration for technical already registered in India for Import, but a new overseas
manufacturer also wants to register itself as an authorized source for exporting the molecule to India.
9(3) – FI New molecule: Formulations, which are to be directly imported to India, in finished form.
75%
25%
0%
20%
40%
60%
80%
100%
FY11 FY12 FY13 FY14 FY15 FY16 FY17 FY18 FY19 FY20
Indigenous Imports

14
Financial Commentary
Strong revenues growth, expected to post CAGR of ~16% over FY20-23E
Dhanuka with its formulation business model, is well placed to report healthy revnue growth over the next 3 years. We expect the company to
register a RevenueCAGR of ~16% over FY20-23E on the back of 1) 4-5 new product launches with 1-2 novel molecules, 2) strong collaboration with
global MNCs in turn resulting into higher share of revenue from in-licenced products and ramp-up of recently launched products in domestic
agrochemical business, 3) robust pan India distributon network of 7000+ dealers.
Exhibit 30:Strong revenue growth visibility, expected CAGR ~16% over FY20-23E
Source: Company, Axis Securities
Margin profiles to improve with EBITDA expected to register CAGR of ~21% over FY20-23E
Higher input costs led to gross margin contraction of ~220bps thereby affecting the overall operating performance in FY/20. However, going forward
as COVID-19 led lockdown restriction get eased with supply chain normalization we expect an improvement. Over FY20-23E we believe, Gross
Margin to see ~225bps improvement aided by superior prouduct mix and decline in raw material prices. This in addition to strong operating leverage
and improved mix in favour of higher margin products would result in a ~220bps EBITDA margins expansion.We expect DAGRI to report Gross&
EBITDA Margin of ~37.5%/16.6% in FY21E while in FY22E and FY23E, EBITDA margin would improve to 17.4%&17.7% with an EBITDA CAGR of
~21% over FY20-23E. The expectation of a strong EBITDA growth is on the back of 1) strong revenue growth driven by new product launches, 2)
higher share of revenue from in-licenced products and 3) operating leverage efficiencies.
Exhibit 31: EBITDA growth to continue, expected CAGR ~21% over FY20-23E
Source: Company, Axis Securities
0
400
800
1200
1600
2000
FY11 FY12 FY13 FY14 FY15 FY16 FY17 FY18 FY19 FY20 FY21E FY22E FY23E
(Rs c
r)
0
5
10
15
20
25
0
50
100
150
200
250
300
350
FY11 FY12 FY13 FY14 FY15 FY16 FY17 FY18 FY19 FY20 FY21E FY22E FY23E
(%
)
(Rs C
r)
EBITDA EBITDA Margin

15
PAT to post CAGR of ~20% over FY20-23E
Dhanuka’s strong hold in domestic formulation business backed by collaborations with global MNCs has benefited the company and resulted into
robust growth in earnings over the years. Dhanuka registered PAT CAGR of ~12% over FY11-20 with the growth momentum continuing. We expect
it to deliver PAT CAGR of ~20% over FY20-23E, given its (a) strong hold in domestic formulation business, (b) presence across regions through its
robust distribution networkand (c) ability to launch 4-5 products with 1-2 novel molecules.
Exhibit 32: PAT to post CAGR of ~20% over FY 20-23E
Source: Company, Axis Securities
Asset light business model provides unrivaled RoE, RoCE
Dhanuka Agritech operates with an asset light model thus enabling it to focus on marketing and distribution operations. It is engaged purely in
manufacturing formulations with no presence in manufacturing of technicals that require heavy capital investments. This has helped company to
introduce right products based on market requirement and build scale to emerge as one of the major players in the domestic agro-chem industry.
Owing to its focus only on domestic formulations, DAGRI enjoys industry leading fixed asset turnover of ~8x compared to industry average of 3x
ensuring superior ROE/ROCE. It has also maintained its debt-free status with low capex requirements.
Exhibit 33: Steadily improving Return Ratios over 20-23E Exhibit 34: Industry leading asset turnover
Source: Company, Axis Securities
0
2
4
6
8
10
12
14
16
0
50
100
150
200
250
300
FY11 FY12 FY13 FY14 FY15 FY16 FY17 FY18 FY19 FY20 FY21E FY22E FY23E
(%)
(Rs c
r)
PAT PAT Margin
0%
10%
20%
30%
40%
(%)
ROE ROCE
1,8
4,5
5,8 6,3
8,0
0
2
4
6
8
10
PIIND INST Bayer Sumitomo Dhanuka
(x)
Asset/Turnover

16
Healthy cash flows to fund Capex
Dhanuka’s capex requirements have been minimal owing to its asset light business model. To put things in perspective we see that, over FY14-16 it
incurred a capex of Rs. 50cr for commissioning of new automated manufacturing plant in Rajasthan. Its healthy balance sheet has ensured that
DAGRIs growth capex has been funded through internal accruals and also supported working capital inventments as average working capital cycle in
the agro-chem industry has been over 120 days across key players. However, we note over the last 2 years working cpaital requirements increased
due to high inventory cost that resulted in its Operating Cash Flow (OCF) to decline to Rs. 13cr in FY19. Barring FY19, Dhanuka’s OCF remained
healthy and over FY20-23E we expect it to generate Rs ~500cr OCF.
Exhibit35: Robust Cash Flow generation over the years
Source: Company, Axis Securities
Strong Balance Sheet
Dhanuka’s strong balance sheet (debt free since FY16) with sufficient cash balance offers an opportunity for higher dividendor buyback for the
company (a trend reported in the past). In FY17, the company bought back shares worth Rs 80cr followed by Rs 82.5 cr in FY19 and Rs 100 cr in
FY21. Going ahead, we believe, the company would continue to reward its shareholders periodically given a cash rich balance sheet and limited
capex plans. Balance sheet remains strong with net cash of Rs 18cr and Net Debt/Equity at -0.03x in FY20. We expect the company to maintain
similar levels of return ratios and Net debt/Equity, going forward.
Exhibit 36: Cash rich balance sheet offers an opportunity for higher dividend or buyback
Source: Company, Axis Securities
(200)
(100)
0
100
200
300
FY11 FY12 FY13 FY14 FY15 FY16 FY17 FY18 FY19 FY20 FY21E FY22E FY23E
(Rs c
r)
CFO CFI CFF
12 13 16
23 27
39
-
15 21
70
- - - - - -
80
-
83
-
100
0
20
40
60
80
100
120
FY11 FY12 FY13 FY14 FY15 FY16 FY17 FY18 FY19 FY20 FY21E
(Rs c
r)
Dividend Buyback

17
Working Capital to remain stable
Owing to COVID-19 impact and ensuing disruption caused to supply chains, DAGRI built up on raw material inventory to ensure uninterrupted
manufacturing at its plants. As a result, in FY20, DAGRI’s inventory days increased to 128 days (122 days in FY19). However, on the
Receivables front, Dhanuka has been aggressive and shown improvement on the collection front as receivable days reduced to 79 days in FY20
against an average of ~85 days in previous few years. Going forward over FY20-23E, we expect DAGRIs working capital cycle to be maintained
with some improvement in inventory days.
Exhibit 37: Working Capital Days to sustain at similar levels
Source: Company, Axis Securities
0
50
100
150
200
250
FY12 FY13 FY14 FY15 FY16 FY17 FY18 FY19 FY20 FY21E FY22E FY23E
(No o
f D
aya
)
Debtors Days Inventory Days Payable Days Core Working Capital Days

18
VALUATIONS AND OUTLOOK
We initiate coverage on Dhanuka Agritech with BUY and Target Price of Rs.880 share implying upside of 27% as we assign a target
multiple of 17x P/E its FY23E EPS in line with 3 year average PE arrive at our TP. Dhanuka is well placed in the steadily growing domestic
agrochemical industry. We believe, with 4-5 new products launches annually and incrementally focusing on value accrective 9(3) products, lower
dependence on China for raw material,robust kharif season backed by normal monsoon and increased water levels inreservoirs and ground water to
benefit Rabi sowing thereby enabling Dhanuka to continue its growth momentum. OverFY20–23E, we expect the company to record
Revenue/EBITDA/PAT CAGR of ~16/21/20% respectively. At the CMP, the stock is trading at a P/E of ~14x FY23E EPS and we believe, the
company is trading at an attractive valuation and leaves room for further upsides given 1) strong OCF of Rs ~500cr over FY20-23E, 2) Healthy return
ratios (ROCE/ROE expected at ~27%/24% in FY23E).
Exhibit 38: 12 M FWD PE CHART (x) Exhibit 39: 12 M FWD PE BAND CHART
Source: Company, Axis Securities
0
500
1000
1500
2000
Mar-
12
Se
p-1
2
Ma
r-13
Se
p-1
3
Ma
r-14
Se
p-1
4
Ma
r-15
Se
p-1
5
Ma
r-16
Se
p-1
6
Ma
r-17
Se
p-1
7
Ma
r-18
Se
p-1
8
Ma
r-19
Se
p-1
9
Ma
r-20
Se
p-2
0
Dhanuka Agri 12M Fwd PE Band
Price 10x 15x 20x 25x
0
10
20
30
40
Ma
r-12
Au
g-1
2
Jan
-13
Jun
-13
Nov-1
3
Ap
r-14
Se
p-1
4
Fe
b-1
5
Jul-1
5
Dec-1
5
Ma
y-16
Oct
-16
Ma
r-17
Au
g-1
7
Jan
-18
Jun
-18
Nov-1
8
Ap
r-19
Se
p-1
9
Fe
b-2
0
Jul-2
0
Dhanuka Agri1Y Fwd PE Chart
PE Mean Mean+1Stdev Mean-1Stdev

19
ABOUT THE COMPANY
Dhanuka Agritech Limited is aleading Agrochemical Company in India with Pan-India presence through its marketing offices in all major states
across India. The 3 manufacturing facilities in Rajasthan, Gujarat and J&K with 40 warehouses and network of over 14 branch offices across the
Indian geography. This caters to 7000+ distributors &~80,000 retailers which reach out to ~10 million Indian farmers Dhanuka has International
collaboration with the world’s seven leading agrochemical Companies from US, Japan and Europe which helps it to introduce the latest technology in
Indian farmlands. It has more than 150 registrations including Herbicides, Insecticides, Fungicides and Plant Growth Regulators /Bio- Stimulants and
with 350+ active SKUs has one of the most extensive products portfolio that drives strong market penetration, a key competitive feature in the Indian
Agrochemical Industry. The company has solutions for all major crops grown in the country including cotton, paddy, wheat, sugarcane, pulses, fruits
& vegetables, plantation crops and others.
Segmental Operations
Formulation: Domestic crop protection segment currently contributes ~99% to the overall revenue. The company offers crop protection
products and speciality plant nutrient products & solutions through its strong PAN India distribution network consisting of 7000+ distributors
& ~80,000 retailers which reach out to ~10 million Indian farmers.
Other operating revenue constitutesthe rest 1% of the total revenuegenerated from windmill, govt grants, sale of scrap etc.
Key Risks
Competition: Intensecompetition and cheaper imports from China pose a threat to the domestic Agrochemical Companies including
Dhanuka. MNCs arealso building their presence in India and selling their products to end customers.
Regulatory Issues: Changes in regulations for the Agrochemical Industry, slow innovation inthe domestic Pesticide Industry, threat from
biotech seeds, and subsistence farming could slowdown the growth.
Climate and Weather Conditions: The business is sensitive to weather conditions, including extremes such as drought and natural
disasters. Results of operations are significantly affected by weather conditions in the agricultural regions where agro chemical products
are used.
Availability of Raw Materials: Cost of materials consumed constitutes the largest component of cost structure and formed 63.5%, 61.3%
and 58.4% of thetotal income for FY20, FY19, FY18 respectively. Any inability to procure sufficient quantities of raw material and on
commercially acceptable terms, could lead to a change in manufacturing and sales volumes.
Subsidiary Companies
The Company has only one Wholly owned Subsidiary namely, M/s. Dhanuka Agri Solutions Private Limited, incorporated in Bangladesh.
Shareholder’s Name % of holding
Promoter & Promoter Group 75.0
HDFC Trustee Company Ltd.- A/c HDFC Mid-cap opportunities fund along with HDFC small & Midcap Fund 2.24
DSP Blackrock Trustee Company Pvt. Ltd 5.24
IDFC MULTI CAP FUND 1.35
Other Institutions 0.31
Others 15.86
*As on Sep 2020

20
Board of Directors
Name Experience
Mr. R.G. Agarwal
Chairman
Founder Chairman of Dhanuka Agritech Ltd. Mr. Agarwal holds a Bachelor of Commerce (Hons) degree from Sri
Ram College of Commerce, Delhi University. He is associated as Chairman, Sub-Committee (Crop Protection
Chemicals) of Federation of Indian Chambers of Commerce and Industry (FICCI), Chairman Advisory Committee
Crop Life India & Member of Argo Chemical Federation of India.
Mr. M.K. Dhanuka
Managing Director
Mr. Dhanukais the Managing Director of the company with a vast and rich experience in the Agrochemicals
Industry. He holds a Degree in Bachelor of Commerce (Hons) from Sri Ram college of Commerce, Delhi
University.
Mr. A.K. Dhanuka
Whole Time Director
He has distinguished corporate career and has been associated with the organization since its inception. He
holds a Degree in Bachelor of Commerce (Hons) from Delhi University. He was responsible for overall operations
of Gurgaon factory. After shifting of manufacturing operations of Gurgaon factory w.e.f. 9th January, 2018, he is
taking care of Sanad factory operations as well.
Mr. Rahul Dhanuka
Whole Time Director
He holds Bachelor in Chemistry and a Master’s in Business Administration from S.P. Jain Institute of
Management & Research, Mumbai. He has brought about changes in the manufacturing and production facilities
at Dhanuka’s plants and then took over the reins of the Marketing function.
Mr. Mridul Dhanuka
Whole Time Director
He is a Chemical Engineer from Pune University with a Master’s in Business Administration from NITIE, Mumbai.
Mr. Mridul has been associated with Dhanuka since 2005. His technical expertise has supported to expand the
product base of Dhanuka. He helped the Company in streamlining the production, procurement and logistic
functions and established quality control.
Mr. V.K. Bansal
Chief Financial Officer
He is a Chartered Accountant with over 30 years post qualification experience in Business Finance, Internal
Auditing, Treasury Operations, Organizational Restructuring (Mergers & Acquisitions), Right Issues and
Corporate Governance. He has a proven track record of improved operations, maintaining continuous profitability,
Business Growth through achievements in financial management, cost controls, internal control and
productivity/efficiency improvements.
.

21
Financials (consolidated)
Profit & Loss (Rs Cr)
Y/E March FY20 FY21E FY22E FY23E
Total Net Sales 1,120 1,402 1,581 1,744
% Change 11.4 25.2 12.8 10.3
Total Raw material Consumption 712 876 973 1,069
Staff costs 105 126 150 166
Other Expenditure 129 167 183 201
Total Expenditure 234 293 334 366
EBITDA 174 233 275 309
% Change 19.1 33.8 18.2 12.2
EBITDA Margin % 15.5 16.6 17.4 17.7
Depreciation 16 19 20 21
EBIT 158 213 255 288
% Change 17.9 35.4 19.7 12.6
EBIT Margin % 14.1 15.2 16.2 16.5
Interest 2 2 2 2
Other Income 25 30 35 40
PBT 181 241 288 326
Tax 39 61 73 82
Tax Rate % 21.6 25.2 25.2 25.2
APAT 142 181 216 243
% Change 26.1 27.2 19.5 12.9
Source: Company, Axis Securities
Balance Sheet (Rs Cr)
Y/E March FY20 FY21E FY22E FY23E
Share Capital 10 10 10 10
Reserves & Surplus 701 778 920 1,090
Net Worth 710 787 929 1,099
Total Borrowings 8 10 10 12
Deferred Tax Liability 5 5 5 5
Long Term Provisions 6 6 6 6
Other Long-Term Liability 16 20 25 30
Capital Employed 745 828 975 1,152
Gross Block 167 179 190 204
Less: Depreciation 51 70 89 110
Net Block 115 109 101 94
Other Non-Current Assets 151 164 178 195
Investments 60 50 90 120
Sundry Debtors 242 307 342 378
Cash & Bank Bal 26 13 68 147
Loans & Advances 33 31 50 60
Inventory 250 319 351 379
Other Current Assets 57 59 73 95
Total Current Assets 668 779 975 1,179
Current Liability & Provison 189 224 278 315
Net Current Assets 479 555 696 863
Total Assets 745 828 975 1,152
Source: Company, Axis Securities

22
Cash Flow (Rs Cr)
Y/E March FY20 FY21E FY22E FY23E
PBT 181 241 288 326
Depreciation & Amortization 16 19 20 21
Net Finance Interest and other expenses 2 2 2 2
Other Changes (16) (30) (35) (40)
Chg in Working cap 16 (39) (22) (37)
Direct tax paid 36 61 73 82
Cash flow from operations 163 133 181 190
0 0 0 0
Chg in Gross Block -10 -12 -11 -13
Chg in Investments (36) (68) (83) (72)
Others 2 30 35 40
Cash flow from investing (44) (50) (59) (45)
0 0 0 0
Proceeds / (Repayment) of ST Borrowings (Net) (19) 6 5 7
Proceeds from QIP - - - -
Finance Cost paid -2 -2 -2 -2
Dividends paid (72) - (70) (70)
Buyback - (100) - -
Cash flow from financing (93) (96) (67) (65)
Chg in cash 25 (13) 55 79
Cash at start 1 26 13 68
Cash at end 26 13 68 147
Source: Company, Axis Securities

23
Ratio Analysis (%)
Y/E March FY20 FY21E FY22E FY23E
Growth (%)
Net Sales 11.4 25.2 12.8 10.3
EBITDA 19.1 33.8 18.2 12.2
APAT 26.1 27.2 19.5 12.9
Per Share Data (Rs.)
Adj. EPS 29.8 38.4 45.9 51.8
BVPS 149 168 198 234
Profitability (%)
EBITDA Margin 15.5 16.6 17.4 17.7
Adj. PAT Margin 12.7 12.9 13.6 14.0
ROCE 22.3 27.4 28.6 27.3
ROE 21.0 24.1 25.1 24.0
Valuations (X)
PER 12.9 8.8 16.0 14.2
P/BV 2.6 2.0 3.7 3.1
EV / EBITDA 10.1 6.7 12.0 10.4
EV / Net Sales 1.6 1.1 2.1 1.8
Turnover Days
Asset Turnover 7.3 8.8 9.2 9.5
Inventory days 128 133 132 129
Debtors days 79 80 79 79
Creditors days 58 55 58 57
Working Capital Days 149 158 153 151
Gearing Ratio
Debt: Equity (x)
Net Debt to Equity 0 (0) (0) (0)
Source: Company, Axis Securities

24
About the analyst
Analyst: Gaurav Uttrani
Contact Details: [email protected]
Sector:Agrochemical & Consumer sector
Analyst Bio: Gaurav Uttrani is Chartered Accountant (ICAI) with about 2 years of experience in Equity market
and research
About the analyst
Analyst: Suvarna Joshi
Contact Details: [email protected]
Sector:FMCG, Consumption sector, Mid-Caps, Agrochemical
Analyst Bio: Suvarna Joshi is MBA (Finance) from Mumbai University with about 10years of experience in Equity
market and research
Disclosures:
The following Disclosures are being made in compliance with the SEBI Research Analyst Regulations 2014 (herein after referred to as the Regulations).
1. Axis Securities Ltd. (ASL) is a SEBI Registered Research Analyst having registration no. INH000000297. ASL, the Research Entity (RE) as defined in the
Regulations, is engaged in the business of providing Stock broking services, Depository participant services & distribution of various financial products. ASL is a
subsidiary company of Axis Bank Ltd. Axis Bank Ltd. is a listed public company and one of India’s largest private sector bank and has its various subsidiaries
engaged in businesses of Asset management, NBFC, Merchant Banking, Trusteeship, Venture Capital, Stock Broking, the details in respect of which are
available on www.axisbank.com.
2. ASL is registered with the Securities & Exchange Board of India (SEBI) for its stock broking & Depository participant business activities and with the Association
of Mutual Funds of India (AMFI) for distribution of financial products and also registered with IRDA as a corporate agent for insurance business activity.
3. ASL has no material adverse disciplinary history as on the date of publication of this report.
4. I/We, Gaurav Uttrani, Chartered Accountant & Suvarna Joshi PGDBM-Finance author/s and the name/s subscribed to this report, hereby certify that all of the
views expressed in this research report accurately reflect my/our views about the subject issuer(s) or securities. I/We (Research Analyst) also certify that no part
of my/our compensation was, is, or will be directly or indirectly related to the specific recommendation(s) or view(s) in this report. I/we or my/our relative or ASL
does not have any financial interest in the subject company. Also I/we or my/our relative or ASL or its Associates may have beneficial ownership of 1% or more
in the subject company at the end of the month immediately preceding the date of publication of the Research Report. Since associates of ASL are engaged in
various financial service businesses, they might have financial interests or beneficial ownership in various companies including the subject company/companies
mentioned in this report. I/we or my/our relative or ASL or its associate does not have any material conflict of interest. I/we have not served as director / officer,
etc. in the subject company in the last 12-month period.Any holding in stock – No
5. 5. ASL has not received any compensation from the subject company in the past twelve months. ASL has not been engaged in market making activity for the
subject company.
6. In the last 12-month period ending on the last day of the month immediately preceding the date of publication of this research report, ASL or any of its
associates may have:
Received compensation for investment banking, merchant banking or stock broking services or for any other services from the subject company of this research report
and / or;
Managed or co-managed public offering of the securities from the subject company of this research report and / or;
Received compensation for products or services other than investment banking, merchant banking or stock broking services from the subject company of this
research report;
ASL or any of its associates have not received compensation or other benefits from the subject company of this research report or any other third-party in connection
with this report.
Term& Conditions:
This report has been prepared by ASL and is meant for sole use by the recipient and not for circulation. The report and information contained herein is strictly
confidential and may not be altered in any way, transmitted to, copied or distributed, in part or in whole, to any other person or to the media or reproduced in any form,
without prior written consent of ASL. The report is based on the facts, figures and information that are considered true, correct, reliable and accurate. The intent of this
report is not recommendatory in nature. The information is obtained from publicly available media or other sources believed to be reliable. Such information has not
been independently verified and no guaranty, representation of warranty, express or implied, is made as to its accuracy, completeness or correctness. All such
information and opinions are subject to change without notice. The report is prepared solely for informational purpose and does not constitute an offer document or
solicitation of offer to buy or sell or subscribe for securities or other financial instruments for the clients. Though disseminated to all the customers simultaneously, not
all customers may receive this report at the same time. ASL will not treat recipients as customers by virtue of their receiving this report.

25
Disclaimer:
Nothing in this report constitutes investment, legal, accounting and tax advice or a representation that any investment or strategy is suitable or appropriate to the
recipient’s specific circumstances. The securities and strategies discussed and opinions expressed, if any, in this report may not be suitable for all investors, who
must make their own investment decisions, based on their own investment objectives, financial positions and needs of specific recipient.
This report may not be taken in substitution for the exercise of independent judgment by any recipient. Each recipient of this report should make such investigations
as it deems necessary to arrive at an independent evaluation of an investment in the securities of companies referred to in this report (including the merits and risks
involved), and should consult its own advisors to determine the merits and risks of such an investment. Certain transactions, including those involving futures,
options and other derivatives as well as non-investment grade securities involve substantial risk and are not suitable for all investors. ASL, its directors, analysts or
employees do not take any responsibility, financial or otherwise, of the losses or the damages sustained due to the investments made or any action taken on basis of
this report, including but not restricted to, fluctuation in the prices of shares and bonds, changes in the currency rates, diminution in the NAVs, reduction in the
dividend or income, etc. Past performance is not necessarily a guide to future performance. Investors are advice necessarily a guide to future performance. Investors
are advised to see Risk Disclosure Document to understand the risks associated before investing in the securities markets. Actual results may differ materially from
those set forth in projections. Forward-looking statements are not predictions and may be subject to change without notice.
ASL and its affiliated companies, their directors and employees may; (a) from time to time, have long or short position(s) in, and buy or sell the securities of the
company(ies) mentioned herein or (b) be engaged in any other transaction involving such securities or earn brokerage or other compensation or act as a market
maker in the financial instruments of the company(ies) discussed herein or act as an advisor or investment banker, lender/borrower to such company(ies) or may
have any other potential conflict of interests with respect to any recommendation and other related information and opinions. Each of these entities functions as a
separate, distinct and independent of each other. The recipient should take this into account before interpreting this document.
ASL and / or its affiliates do and seek to do business including investment banking with companies covered in its research reports. As a result, the recipients of this
report should be aware that ASL may have a potential conflict of interest that may affect the objectivity of this report. Compensation of Research Analysts is not
based on any specific merchant banking, investment banking or brokerage service transactions. ASL may have issued other reports that are inconsistent with and
reach different conclusion from the information presented in this report. The Research reports are also available & published on AxisDirect website.
Neither this report nor any copy of it may be taken or transmitted into the United State (to U.S. Persons), Canada, or Japan or distributed, directly or indirectly, in the
United States or Canada or distributed or redistributed in Japan or to any resident thereof. If this report is inadvertently sent or has reached any individual in such
country, especially, USA, the same may be ignored and brought to the attention of the sender. This report is not directed or intended for distribution to, or use by, any
person or entity who is a citizen or resident of or located in any locality, state, country or other jurisdiction, where such distribution, publication, availability or use
would be contrary to law, regulation or which would subject ASL to any registration or licensing requirement within such jurisdiction. The securities described herein
may or may not be eligible for sale in all jurisdictions or to certain category of investors.
The Disclosures of Interest Statement incorporated in this document is provided solely to enhance the transparency and should not be treated as endorsement of the
views expressed in the report. The Company reserves the right to make modifications and alternations to this document as may be required from time to time without
any prior notice. The views expressed are those of the analyst(s) and the Company may or may not subscribe to all the views expressed therein.
Copyright in this document vests with Axis Securities Limited.
Axis Securities Limited, Corporate office: Unit No. 2, Phoenix Market City, 15, LBS Road, Near Kamani Junction, Kurla (west), Mumbai-400070, Tel No. – 022-
40508080/ 022-61480808, Regd. off.- Axis House, 8th Floor, Wadia International Centre, PandurangBudhkar Marg, Worli, Mumbai – 400 025. Compliance Officer:
AnandShaha, Email: [email protected], Tel No: 022-42671582.SEBI-Portfolio Manager Reg. No. INP000000654
DEFINITION OF RATINGS
Ratings Expected absolute returns over 12-18 months
BUY More than 10%
HOLD Between 10% and -10%
SELL Less than -10%
NOT RATED We have forward looking estimates for the stock but we refrain from assigning valuation and recommendation
UNDER REVIEW We will revisit our recommendation, valuation and estimates on the stock following recent events
NO STANCE We do not have any forward looking estimates, valuation or recommendation for the stock