
BASIC ANIMAL HUSBANDRY STATISTICS - TNAU Agritech ...
198
AHS SERIES – 10 BASIC ANIMAL HUSBANDRY STATISTICS 2006 GOVERNMENT OF INDIA MINISTRY OF AGRICULTURE DEPARTMENT OF ANIMAL HUSBANDRY, DAIRYING & FISHERIES KRISHI BHAVAN NEW DELHI
-
Upload
khangminh22 -
Category
Documents
-
view
0 -
download
0
Transcript of BASIC ANIMAL HUSBANDRY STATISTICS - TNAU Agritech ...
AHS SERIES – 10
BASIC
ANIMAL HUSBANDRY STATISTICS
2006
GOVERNMENT OF INDIA MINISTRY OF AGRICULTURE
DEPARTMENT OF ANIMAL HUSBANDRY, DAIRYING & FISHERIES
KRISHI BHAVAN NEW DELHI

For any queries, please contact Shri O.P.Misra Adviser ( Statistics ), DAHDF
TELEFAX: 011+2436 5601 e-mail: [email protected]
Dr. Vishnu Kant Srivastava Director ( Statistics ), DAHDF TELEFAX: 011+2436 5637 e-mail: v.kant@ nic.in
Address: Animal Husbandry Statistics Division
Department of Animal Husbandry, Dairying and Fisheries Ministry of Agriculture,
Gate No. 32, First Floor, JLN Stadium, Lodhi Road, New Delhi –110 003.
Web –site: http://dahd.nic.in
All rights reserved. No data available in this CD/ File/ Book can be reproduced for sale in any form or by any means, electronic or mechanical including photo copying, recording or by any information storage and retrieval system, without prior permission in writing from the Secretary, Department of Animal Husbandry, Dairying & Fisheries, Ministry of Agriculture, Govt. of India, Krishi Bhavan, New Delhi-110 001, India.
CONTENTS Page PROLOGUE (ii)
FOREWORD (iii-iv) PREFACE (v) LIST OF TABLES, TOPICS & GRAPHS (vi) – (ix) A Technical Note on Basic Animal Husbandry Statistics 1-3 PART I Milk Production 4-28 PART II Egg Production 29-52 PART III Wool & Meat Production 53-73 PART IV Livestock Census –2003 74-97 PART V Growth Rates & Plan Expenditure 98-101 PART VI Gross Domestic Product of Livestock 102-110 Sector PART VII Animal Husbandry Statistics 111-132 PART VIII Dairying Statistics 133-135 PART IX Miscellaneous 136-151 PART X World Statistics 152-162 APPENDIX Methodology of Estimation of Milk, Egg 1-14 Meat and Wool (Integrated Sample Survey)
ii
PROLOGUE
The publication “ Basic Animal Husbandry Statistics” is an important publication of the Department of Animal Husbandry & Dairying. It is a biennial publication, the present being tenth in the series. The last publication was brought out in 2004. Efforts have been made to update the information as far as possible. The publication contains vital statistics relating to livestock products, livestock population and other livestock related matters.
The estimates of production of livestock products are based on the sample surveys conducted under the Central Sector Scheme “Integrated Sample Survey for the Estimation of major livestock products” which is implemented in all the States/U.T.s of the country, under the guidance of the Department of Animal Husbandry, Dairying & Fisheries. The surveys are conducted throughout the year and the estimates are prepared on seasonal basis, i.e., summer, rainy and winter seasons.
The livestock population of different species is enumerated through the livestock census conducted quinquennially in all States/U.T.s. The Livestock Censuses up to 16th Census, were conducted under the guidance and supervision of the Directorate of Economics & Statistics, under the Department of Agriculture and Co-operation. The 17th Livestock census has been conducted under the aegis of Department of Animal Husbandry, Dairying & Fisheries.
The present publication has been significantly modified and improved by adding latest data on livestock products up to 2005-06, whereas previous report contained data up to 2003-04 for milk, egg & wool and up to 2002-03 for meat from the registered sector. The report also contains extracts of information about livestock population based on the 17th Census held in the year 2003 and its comparison with the results of 16th Livestock Census of 1997.
It is hoped that the publication will be useful for administrators, planners,
veterinarians, scientists and various research organizations/institutions involved in the development of livestock and poultry sectors as well as the State Departments of Animal Husbandry & Veterinary Services.
I thank the Directors, Department of Animal Husbandry of the States and Union territories for the regular collection and compilation of data pertaining to the Integrated Sample Survey and successful completion of 17th Livestock Census. I also convey my appreciation for the efforts of Shri O.P. Misra, Adviser (Statistics), Dr. Vishnu Kant Srivastava, Director and their staff of Animal Husbandry Statistics Division in bringing out the improved publication in time. I also like to thank various other organizations and other Governmental Departments, who have provided their data for the preparation of the report.
Charusheela Sohoni New Delhi Secretary December 28, 2006 Department of Animal Husbandry, Dairying & Fisheries
Ministry of Agriculture
iii
FOREWORD
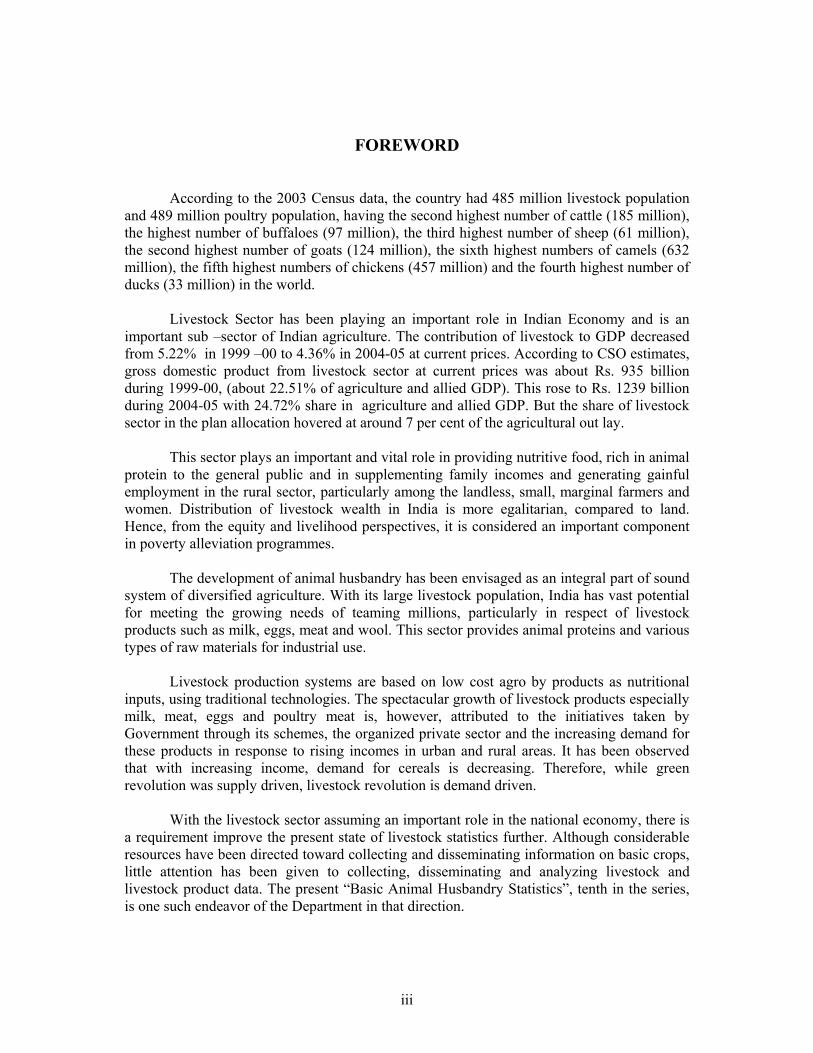
According to the 2003 Census data, the country had 485 million livestock population and 489 million poultry population, having the second highest number of cattle (185 million), the highest number of buffaloes (97 million), the third highest number of sheep (61 million), the second highest number of goats (124 million), the sixth highest numbers of camels (632 million), the fifth highest numbers of chickens (457 million) and the fourth highest number of ducks (33 million) in the world.
Livestock Sector has been playing an important role in Indian Economy and is an
important sub –sector of Indian agriculture. The contribution of livestock to GDP decreased from 5.22% in 1999 –00 to 4.36% in 2004-05 at current prices. According to CSO estimates, gross domestic product from livestock sector at current prices was about Rs. 935 billion during 1999-00, (about 22.51% of agriculture and allied GDP). This rose to Rs. 1239 billion during 2004-05 with 24.72% share in agriculture and allied GDP. But the share of livestock sector in the plan allocation hovered at around 7 per cent of the agricultural out lay.
This sector plays an important and vital role in providing nutritive food, rich in animal
protein to the general public and in supplementing family incomes and generating gainful employment in the rural sector, particularly among the landless, small, marginal farmers and women. Distribution of livestock wealth in India is more egalitarian, compared to land. Hence, from the equity and livelihood perspectives, it is considered an important component in poverty alleviation programmes.
The development of animal husbandry has been envisaged as an integral part of sound
system of diversified agriculture. With its large livestock population, India has vast potential for meeting the growing needs of teaming millions, particularly in respect of livestock products such as milk, eggs, meat and wool. This sector provides animal proteins and various types of raw materials for industrial use.
Livestock production systems are based on low cost agro by products as nutritional
inputs, using traditional technologies. The spectacular growth of livestock products especially milk, meat, eggs and poultry meat is, however, attributed to the initiatives taken by Government through its schemes, the organized private sector and the increasing demand for these products in response to rising incomes in urban and rural areas. It has been observed that with increasing income, demand for cereals is decreasing. Therefore, while green revolution was supply driven, livestock revolution is demand driven.
With the livestock sector assuming an important role in the national economy, there is
a requirement improve the present state of livestock statistics further. Although considerable resources have been directed toward collecting and disseminating information on basic crops, little attention has been given to collecting, disseminating and analyzing livestock and livestock product data. The present “Basic Animal Husbandry Statistics”, tenth in the series, is one such endeavor of the Department in that direction.
iv
I sincerely thank Directors of Animal Husbandry of various States and Union
Territory for carrying out schemes of the Integrated Sample Survey and Livestock Census of Animal Husbandry Statistics Division and the other members of the Technical Committee of Direction for Improvement of Animal Husbandry Statistics for finalizing the estimates within time frame. I also thank Shri O.P.Misra, Adviser (Statistics), Dr. Vishnu Kant Srivastava, Director and their staff for bringing out the publication with improvements and on time.
Dr.S.K.Bandyopadhyay New Delhi Animal Husbandry Commissioner December 28, 2006 Department of Animal Husbandry, Dairying & Fisheries
Ministry of Agriculture

v
PREFACE The present edition of Basic Animal Husbandry & Dairying Statistics contains latest
available data on various parameters and also related aspects of Livestock and Livestock products. The data on estimates of livestock production are based on Sample Surveys carried out by all State/U.T.s on regular basis under the Central Sector Scheme “Integrated Sample Survey for Estimation of major livestock products”, which is implemented by the Department of Animal Husbandry, Dairying & Fisheries (DAHDF), Ministry of Agriculture. The data on Livestock numbers are based on Livestock Census conducted quinquinelly by all States/U.T.s. The latest Livestock Census which was 17th in the series was conducted by the Department of Animal Husbandry, Dairying & Fisheries in the year 2003. The production estimates up to 2005-06 of milk, eggs and wool and those of meat from recognized sector have been provided. The anticipated achievements for the year 2006-07 for the major livestock products are also included.
I am extremely grateful to Ms. Charusheela Sohoni, Secretary, DAHDF, and Dr. S.K.Bandyopadhyay, Animal Husbandry Commissioner for their guidance and support.
This report has been prepared with the hard and painstaking efforts of Dr.Vishnu Kant
Srivastava, Director, Dr. Chandramani Sharma, Deputy Director and other staff of Animal Husbandry Statistics Division of the Department. I would like to acknowledge the services of all officials of the Department who have assisted in preparation and publication of this report by providing data of their respective fields.
I am confident that this edition of Basic Animal Husbandry Statistics will serve as a
rich reference to a wide spectrum of data users and planners.
Though extreme care has been taken in preparation of report, yet possibility of some errors cannot be ruled out. I would be glad to have the comments and suggestions of all users.
O.P.Misra New Delhi Adviser(Statistics) December 28, 2006 Department of Animal Husbandry, Dairying & Fisheries
Ministry of Agriculture
vi
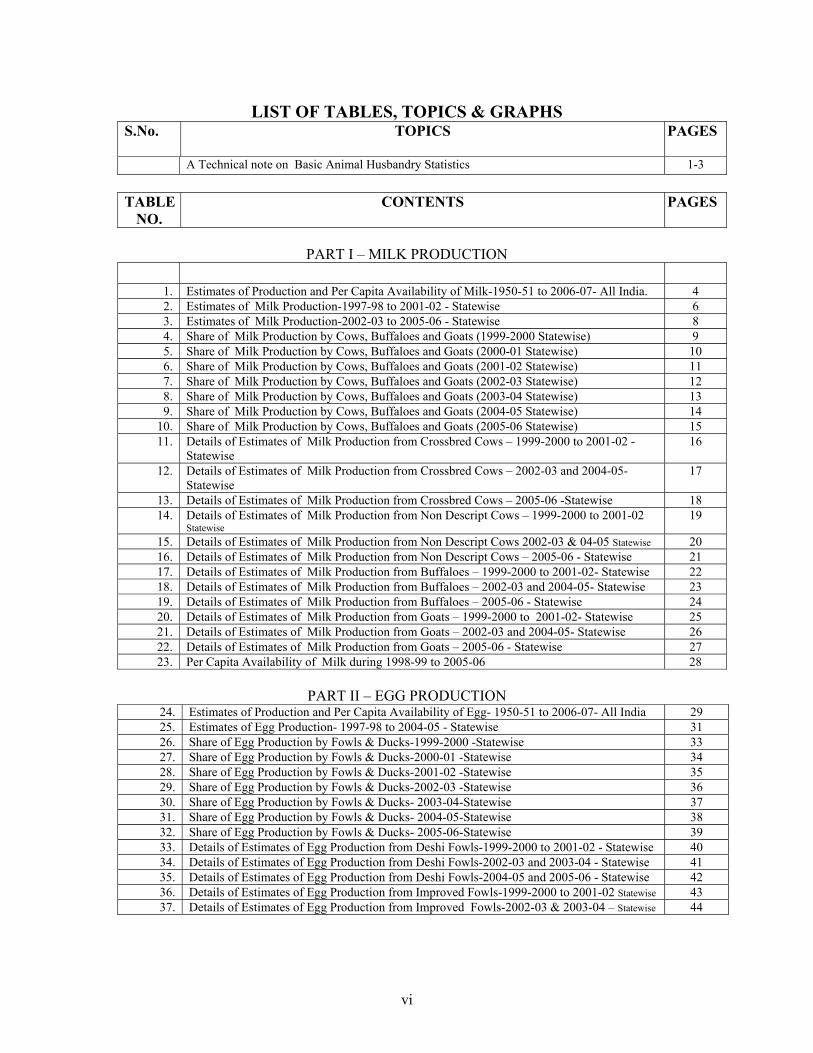
LIST OF TABLES, TOPICS & GRAPHS S.No.
TOPICS PAGES
A Technical note on Basic Animal Husbandry Statistics 1-3 TABLE
NO. CONTENTS PAGES
PART I – MILK PRODUCTION
1. Estimates of Production and Per Capita Availability of Milk-1950-51 to 2006-07- All India. 4 2. Estimates of Milk Production-1997-98 to 2001-02 - Statewise 6 3. Estimates of Milk Production-2002-03 to 2005-06 - Statewise 8 4. Share of Milk Production by Cows, Buffaloes and Goats (1999-2000 Statewise) 9 5. Share of Milk Production by Cows, Buffaloes and Goats (2000-01 Statewise) 10 6. Share of Milk Production by Cows, Buffaloes and Goats (2001-02 Statewise) 11 7. Share of Milk Production by Cows, Buffaloes and Goats (2002-03 Statewise) 12 8. Share of Milk Production by Cows, Buffaloes and Goats (2003-04 Statewise) 13 9. Share of Milk Production by Cows, Buffaloes and Goats (2004-05 Statewise) 14
10. Share of Milk Production by Cows, Buffaloes and Goats (2005-06 Statewise) 15 11. Details of Estimates of Milk Production from Crossbred Cows – 1999-2000 to 2001-02 -
Statewise 16
12. Details of Estimates of Milk Production from Crossbred Cows – 2002-03 and 2004-05- Statewise
17
13. Details of Estimates of Milk Production from Crossbred Cows – 2005-06 -Statewise 18 14. Details of Estimates of Milk Production from Non Descript Cows – 1999-2000 to 2001-02
Statewise 19
15. Details of Estimates of Milk Production from Non Descript Cows 2002-03 & 04-05 Statewise 20 16. Details of Estimates of Milk Production from Non Descript Cows – 2005-06 - Statewise 21 17. Details of Estimates of Milk Production from Buffaloes – 1999-2000 to 2001-02- Statewise 22 18. Details of Estimates of Milk Production from Buffaloes – 2002-03 and 2004-05- Statewise 23 19. Details of Estimates of Milk Production from Buffaloes – 2005-06 - Statewise 24 20. Details of Estimates of Milk Production from Goats – 1999-2000 to 2001-02- Statewise 25 21. Details of Estimates of Milk Production from Goats – 2002-03 and 2004-05- Statewise 26 22. Details of Estimates of Milk Production from Goats – 2005-06 - Statewise 27 23. Per Capita Availability of Milk during 1998-99 to 2005-06 28
PART II – EGG PRODUCTION
24. Estimates of Production and Per Capita Availability of Egg- 1950-51 to 2006-07- All India 29 25. Estimates of Egg Production- 1997-98 to 2004-05 - Statewise 31 26. Share of Egg Production by Fowls & Ducks-1999-2000 -Statewise 33 27. Share of Egg Production by Fowls & Ducks-2000-01 -Statewise 34 28. Share of Egg Production by Fowls & Ducks-2001-02 -Statewise 35 29. Share of Egg Production by Fowls & Ducks-2002-03 -Statewise 36 30. Share of Egg Production by Fowls & Ducks- 2003-04-Statewise 37 31. Share of Egg Production by Fowls & Ducks- 2004-05-Statewise 38 32. Share of Egg Production by Fowls & Ducks- 2005-06-Statewise 39 33. Details of Estimates of Egg Production from Deshi Fowls-1999-2000 to 2001-02 - Statewise 40 34. Details of Estimates of Egg Production from Deshi Fowls-2002-03 and 2003-04 - Statewise 41 35. Details of Estimates of Egg Production from Deshi Fowls-2004-05 and 2005-06 - Statewise 42 36. Details of Estimates of Egg Production from Improved Fowls-1999-2000 to 2001-02 Statewise 43 37. Details of Estimates of Egg Production from Improved Fowls-2002-03 & 2003-04 – Statewise 44
vii
TABLE NO.
CONTENTS PAGES
38. Details of Estimates of Egg Production from Improved Fowls-2004-05 and 2005-06 –
Statewise 45
39. Details of Estimates of Egg Production from Desi Ducks-1999-2000 to 2001-02 - Statewise 46 40. Details of Estimates of Egg Production from Desi Ducks -2002-03 and 2003-04 - Statewise 47 41. Details of Estimates of Egg Production from Desi Ducks -2004-05 and 2005-06 - Statewise 48 42. Details of Estimates of Egg Production from Improved Ducks-1999-2000 to 2001-02 –
Statewise 49
43. Details of Estimates of Egg Production from Improved Ducks -2002-03 and 2003-04 – Statewise
50
44. Details of Estimates of Egg Production from Improved Ducks -2004-05 and 2005-06 – Statewise
51
45. Per Capita Availability of Eggs during 1997-98 to 2005-06 52
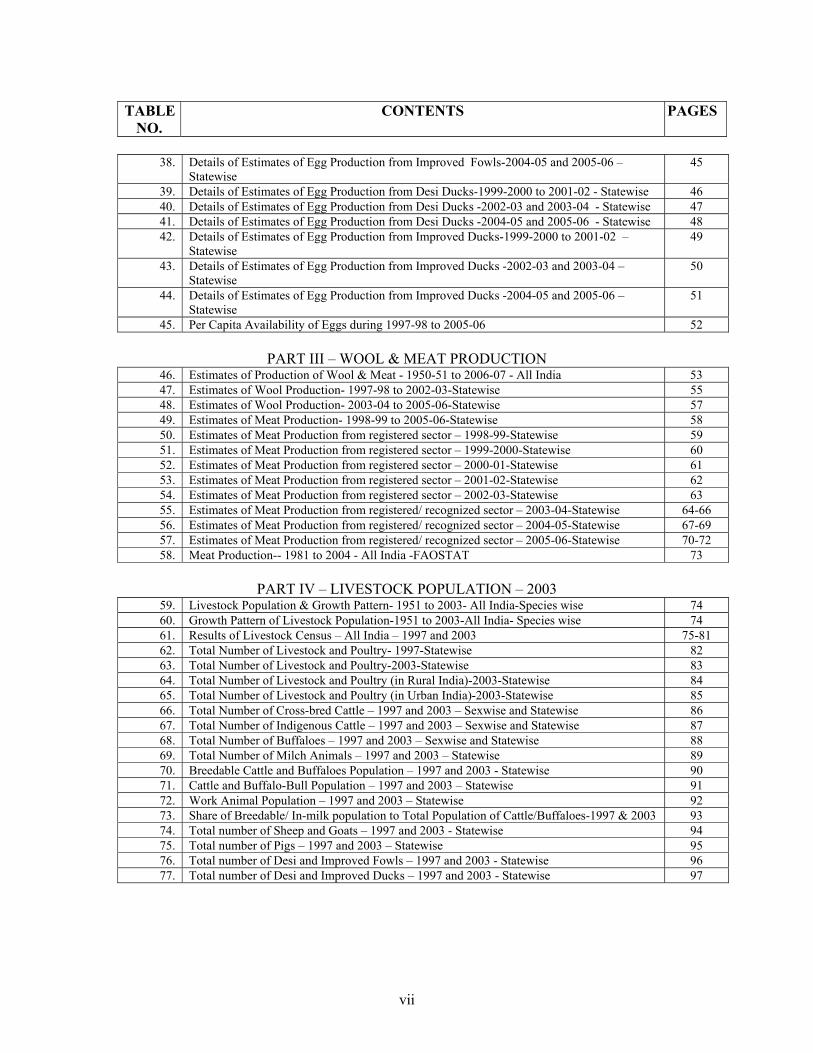
PART III – WOOL & MEAT PRODUCTION 46. Estimates of Production of Wool & Meat - 1950-51 to 2006-07 - All India 53 47. Estimates of Wool Production- 1997-98 to 2002-03-Statewise 55 48. Estimates of Wool Production- 2003-04 to 2005-06-Statewise 57 49. Estimates of Meat Production- 1998-99 to 2005-06-Statewise 58 50. Estimates of Meat Production from registered sector – 1998-99-Statewise 59 51. Estimates of Meat Production from registered sector – 1999-2000-Statewise 60 52. Estimates of Meat Production from registered sector – 2000-01-Statewise 61 53. Estimates of Meat Production from registered sector – 2001-02-Statewise 62 54. Estimates of Meat Production from registered sector – 2002-03-Statewise 63 55. Estimates of Meat Production from registered/ recognized sector – 2003-04-Statewise 64-66 56. Estimates of Meat Production from registered/ recognized sector – 2004-05-Statewise 67-69 57. Estimates of Meat Production from registered/ recognized sector – 2005-06-Statewise 70-72 58. Meat Production-- 1981 to 2004 - All India -FAOSTAT 73
PART IV – LIVESTOCK POPULATION – 2003
59. Livestock Population & Growth Pattern- 1951 to 2003- All India-Species wise 74 60. Growth Pattern of Livestock Population-1951 to 2003-All India- Species wise 74 61. Results of Livestock Census – All India – 1997 and 2003 75-81 62. Total Number of Livestock and Poultry- 1997-Statewise 82 63. Total Number of Livestock and Poultry-2003-Statewise 83 64. Total Number of Livestock and Poultry (in Rural India)-2003-Statewise 84 65. Total Number of Livestock and Poultry (in Urban India)-2003-Statewise 85 66. Total Number of Cross-bred Cattle – 1997 and 2003 – Sexwise and Statewise 86 67. Total Number of Indigenous Cattle – 1997 and 2003 – Sexwise and Statewise 87 68. Total Number of Buffaloes – 1997 and 2003 – Sexwise and Statewise 88 69. Total Number of Milch Animals – 1997 and 2003 – Statewise 89 70. Breedable Cattle and Buffaloes Population – 1997 and 2003 - Statewise 90 71. Cattle and Buffalo-Bull Population – 1997 and 2003 – Statewise 91 72. Work Animal Population – 1997 and 2003 – Statewise 92 73. Share of Breedable/ In-milk population to Total Population of Cattle/Buffaloes-1997 & 2003 93 74. Total number of Sheep and Goats – 1997 and 2003 - Statewise 94 75. Total number of Pigs – 1997 and 2003 – Statewise 95 76. Total number of Desi and Improved Fowls – 1997 and 2003 - Statewise 96 77. Total number of Desi and Improved Ducks – 1997 and 2003 - Statewise 97
viii
TABLE NO.
CONTENTS PAGES
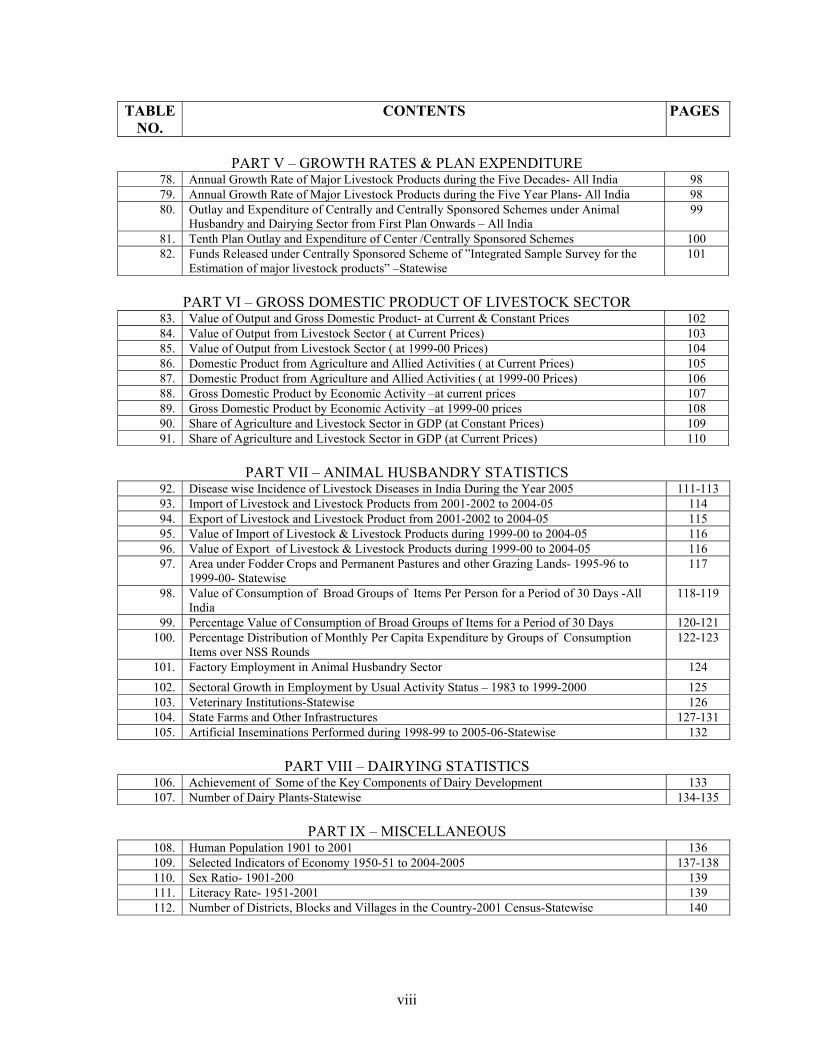
PART V – GROWTH RATES & PLAN EXPENDITURE
78. Annual Growth Rate of Major Livestock Products during the Five Decades- All India 98 79. Annual Growth Rate of Major Livestock Products during the Five Year Plans- All India 98 80. Outlay and Expenditure of Centrally and Centrally Sponsored Schemes under Animal
Husbandry and Dairying Sector from First Plan Onwards – All India 99
81. Tenth Plan Outlay and Expenditure of Center /Centrally Sponsored Schemes 100 82. Funds Released under Centrally Sponsored Scheme of ”Integrated Sample Survey for the
Estimation of major livestock products” –Statewise 101
PART VI – GROSS DOMESTIC PRODUCT OF LIVESTOCK SECTOR
83. Value of Output and Gross Domestic Product- at Current & Constant Prices 102 84. Value of Output from Livestock Sector ( at Current Prices) 103 85. Value of Output from Livestock Sector ( at 1999-00 Prices) 104 86. Domestic Product from Agriculture and Allied Activities ( at Current Prices) 105 87. Domestic Product from Agriculture and Allied Activities ( at 1999-00 Prices) 106 88. Gross Domestic Product by Economic Activity –at current prices 107 89. Gross Domestic Product by Economic Activity –at 1999-00 prices 108 90. Share of Agriculture and Livestock Sector in GDP (at Constant Prices) 109 91. Share of Agriculture and Livestock Sector in GDP (at Current Prices) 110
PART VII – ANIMAL HUSBANDRY STATISTICS
92. Disease wise Incidence of Livestock Diseases in India During the Year 2005 111-113 93. Import of Livestock and Livestock Products from 2001-2002 to 2004-05 114 94. Export of Livestock and Livestock Product from 2001-2002 to 2004-05 115 95. Value of Import of Livestock & Livestock Products during 1999-00 to 2004-05 116 96. Value of Export of Livestock & Livestock Products during 1999-00 to 2004-05 116 97. Area under Fodder Crops and Permanent Pastures and other Grazing Lands- 1995-96 to
1999-00- Statewise 117
98. Value of Consumption of Broad Groups of Items Per Person for a Period of 30 Days -All India
118-119
99. Percentage Value of Consumption of Broad Groups of Items for a Period of 30 Days 120-121 100. Percentage Distribution of Monthly Per Capita Expenditure by Groups of Consumption
Items over NSS Rounds 122-123
101. Factory Employment in Animal Husbandry Sector 124 102. Sectoral Growth in Employment by Usual Activity Status – 1983 to 1999-2000 125 103. Veterinary Institutions-Statewise 126 104. State Farms and Other Infrastructures 127-131 105. Artificial Inseminations Performed during 1998-99 to 2005-06-Statewise 132
PART VIII – DAIRYING STATISTICS
106. Achievement of Some of the Key Components of Dairy Development 133 107. Number of Dairy Plants-Statewise 134-135
PART IX – MISCELLANEOUS
108. Human Population 1901 to 2001 136 109. Selected Indicators of Economy 1950-51 to 2004-2005 137-138 110. Sex Ratio- 1901-200 139 111. Literacy Rate- 1951-2001 139 112. Number of Districts, Blocks and Villages in the Country-2001 Census-Statewise 140

ix
TABLE NO.
CONTENTS PAGES
113. Revised Estimates of Percentage of Population below Poverty Line in Urban and Rural
Areas— 1999-2000—Statewise 141
114. Distribution of Operational Holding (1991-92) - All India 142 115. Distribution of Livestock According to Size of the Holding during 1991-92 (All India) 143 116. Number and Area of the Operational Holdings in India from 1970-71 to 1995-96 144 117. Distribution of Number of Operational Holdings and Area Operated in India by Major Size
Classes of Holdings in 1990-91 and 1995-96 144
118. Average Size of Holding by Major Size Classes in India-All Census Years 145 119. Percentage Distribution of Area under Fodder and Green Manures by Major Size Classes in
India -1985-86 and 1990 –91 145
120. Index Number of Wholesale Prices of All Commodities, Food Articles and Livestock Product
146
121. All India Consumer Price Index Numbers 147-148 122. Selected Centres for Collection of Wholesale and Retail Prices of Livestock/Fodder/Feed/
Livestock Products 149
123. Cattle Insurance Statistics 150 124. Livestock (Other Than Cattle) Insurance Statistics 150 125. Livestock (Including Cattle) Insurance Statistics 151
PART X – WORLD STATISTICS
126. World Livestock Population-1990-2004 152 127. World Estimates of Milk Production-1990 to 2004 153 128. Production of Cow Milk by Major Countries of the World-1999-2004 154 129. Production of Buffalo Milk by Countries of the World-1999-2004 155 130. Production of Goat Milk by Major Countries of the World-1999-2004 156 131. Production of Eggs by Major Countries of the World-1999-2004 157 132. FAO Statistics pertaining to Milk Production and Per Capita Availability of Milk-2004 158-161 133. Livestock numbers by Major Top Countries of the World -2005 162
APPENDIX –METHODOLOGY OF INTEGRATED SAMPLE SURVEY
S.No. TOPICS PAGES1. Introduction 1 2. Sampling Design 1 3. Estimation Procedure –Estimation of Milk Production 2-5 4. Estimation of Egg Production 5-8 5. Estimation of Wool Production 8-11 6. Estimation of Meat Production 11-14
LIST OF GRAPHS
GRAPH NO.
CONTENTS PAGES
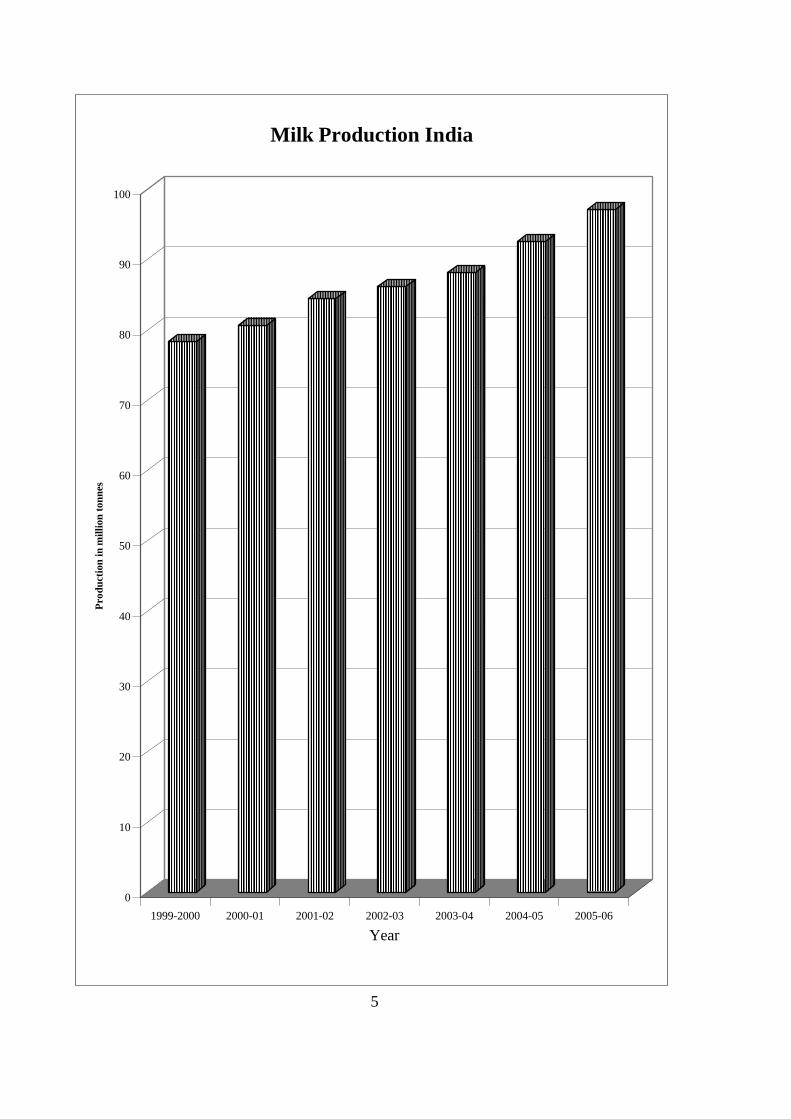
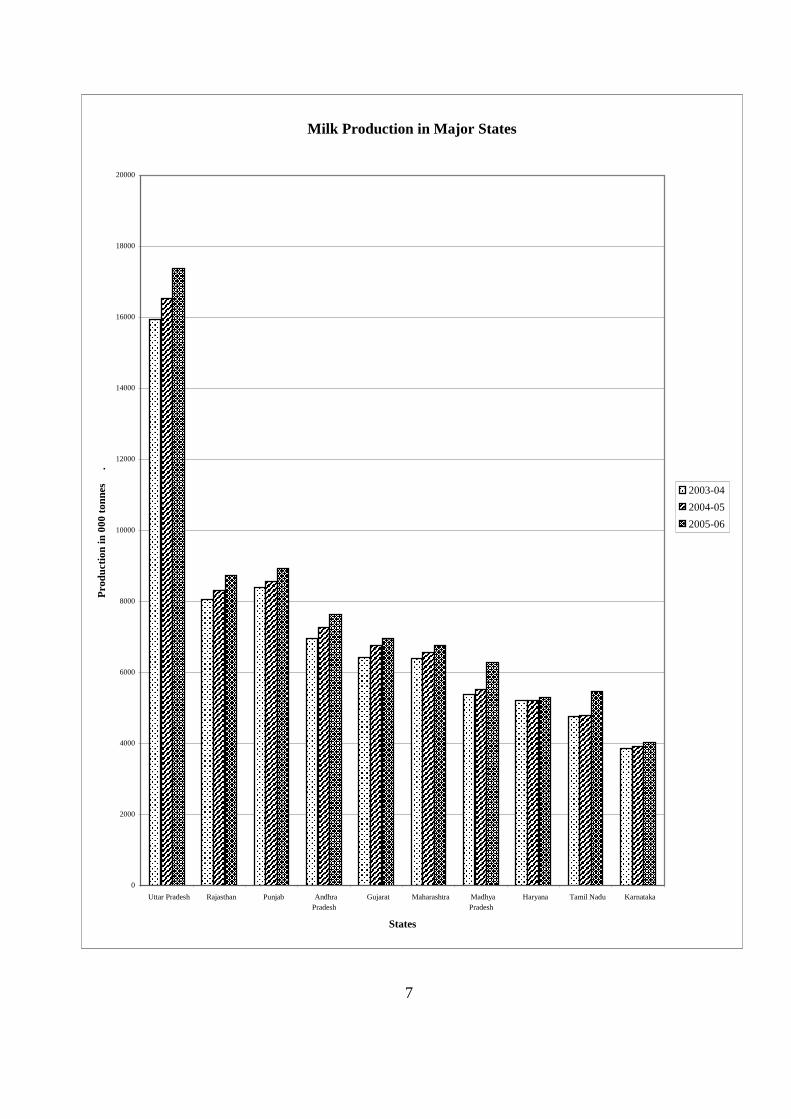
1. Growth of Milk Production in India 5 2. Milk Production by Major States 7 3. Growth of Egg Production in India 30 4. Egg Production by Major States 32 5. Growth of Wool Production in India 54 6. Wool Production by Major States 56
1
A Technical Note on Basic Animal Husbandry Statistics.
The Department of Animal Husbandry & Dairying (DAH&D) is regularlybringing out “Basic Animal Husbandry Statistics” as a biennial publication. Thepublication contained mainly the production estimates of major livestock products likemilk, eggs, meat and wool. All States/U.T.’s produce the estimates through a regularsample survey under the central sector scheme “Integrated Sample Survey for estimationof major livestock products”. The surveys are done round the year and data are collectedby field staff in many cases by camping in the villages.
The current report is tenth in the series and contains ten parts and one appendix.The estimates are approved by “Technical Committee of Direction for improvement inAnimal Husbandry & Dairying Statistics” (TCD), which meets regularly. The samplesurvey is a stratified sampling design with generally districts as strata. The surveys areconducted in three seasons- Summer, Rainy and Winter. The complete methodology ofestimation for production estimates of milk, egg, meat and wool is described in theAppendix. The part I contains estimates of production of milk up to 2005-06. Theproduction of milk has reached 97.1 million tonnes in 2005-06, which is 4.97 % morethan that in 2004-05. The per capita availability of milk has increased to 241 g. per day.The earlier estimates of 2004-05 were 90.7 million tonens, which was due to estimates ofmilk of Bihar done on 1982 livestock census results, later Bihar switched to the 2003livestock census base resulting the All India estimates of milk for the year 2004-05 as92.5 million tonnes. Thus per capita availability in 2004-05 was 233 g. / day.
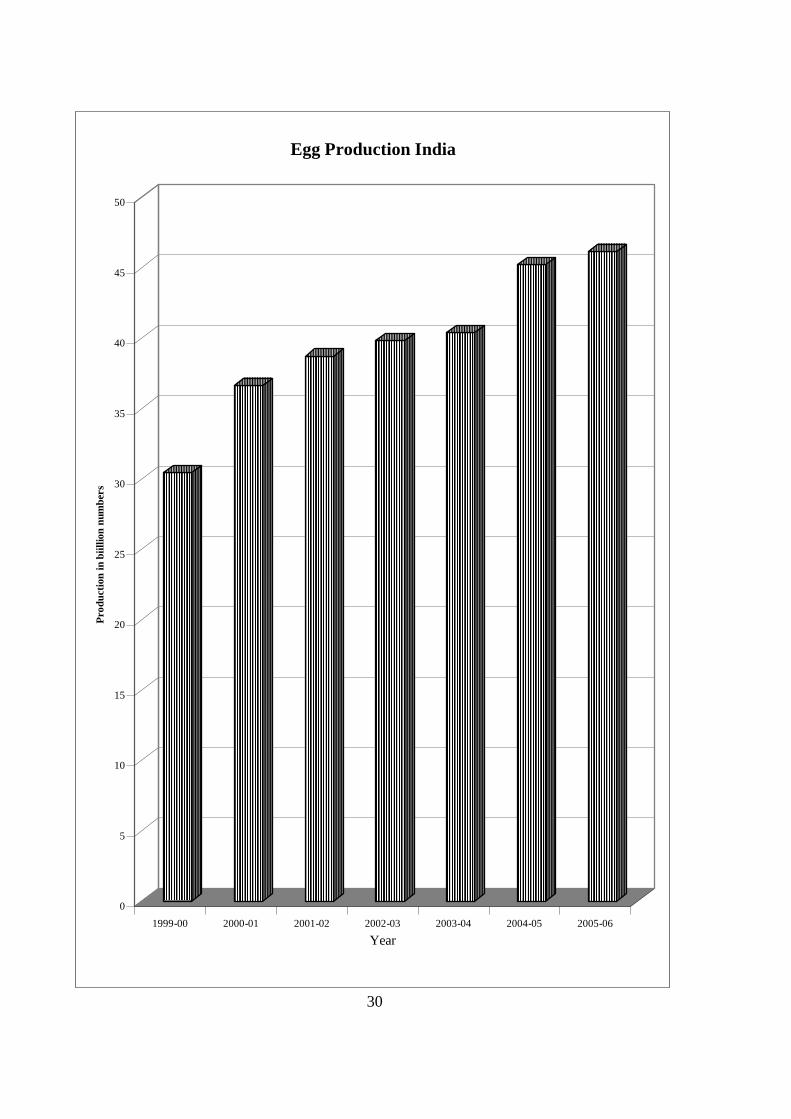
The part II contains data on egg production. The production of eggs have reached46 billion numbers in 2005-06, which is 2.13% more than the production estimates of2004-05. The per capita availability of eggs has increased to 42 eggs per annum in 2004-05 and 2005-06, thus showing that production is keeping perfect pace with populationincrease over these years. Some of the States like, Andhra Pradesh, Tamil Nadu and WestBengal are including the production of eggs from commercial firms, while Bihar,Chhattisgarh, Madhya Pradesh and Uttar Pradesh are also providing them separately intheir estimates.
The part III contains data on wool and meat production. The wool production hasslightly decreased during 2003-04 in comparison to 2002-03 and then further decreasedin 2004-05. However, it has registered stability having production 45 million Kg in 2005-06 at national level when compared to last years’ estimates. During 2004-05 and 2005-06, in some of the states, wool production decreased very rapidly. They are Bihar,Madhya Pradesh, Uttar Pradesh, Sikkim and Arunachal Pradesh. At the same time, somestates have shown increasing trend. Important ones are Andhra Pradesh, Gujarat andJammu & Kashmir. Punjab, in 2005-06, has also included wool production estimatesfrom slaughterhouses that resulted in the higher increase, adjusting the same gives itstrend going towards stabilization. The decline of wool production in Uttar Pradesh is dueto decline of its sheep population. There is direct competition between agriculture andsheep husbandry for land. The pastures meant for sheep husbandry is increasingly goingtowards production of cereals. UP being diverse in its geo-climatic setup ranging fromhigh rain fed & water logging areas to dry plateau of Bundelkhand, Sheep rearing isgenerally shifting to other States like Uttaranchal. It is currently mainly producing coarse
2
type of wool fabrics whose market value is less. However, UP has now started improvingits sheep breed for a better quality of wool through the interventions of State AnimalHusbandry programme and is targeting for a better production in coming years.
The production estimates of meat have been included after compiling the datareceived from all States/UTs in the third part of the report. The data published areprimarily from registered slaughtered houses of the States/UTs. However, endeavor tohave better estimates for meat production, from 2003-04, in some States the data fromrecognized butcher houses could also got included. Some of the north eastern States areproviding combined estimates of meat production from sheep and goat. The data onvarious types of animals slaughtered, their average weight and production upto 2005-06from recognized sector have been included in this part of the report. To have acomparative understanding for the meat production estimates, the estimates for India asobtained from FAOSTAT website in the year 2006 are also included in Table 58 byupdating the estimates from 1993 onwards; earlier estimates are as were available onFAOSTAT during 2004.
The part IV of the report is devoted to the results of 17th Livestock census,conducted in 2003. Data on livestock population of 1997 and 2003 have been providedwith comparisons. Population of cattle in the country was increasing till 15th census in1992. However, population of cattle decreased from 204.58 million in 1992 to 198.88million in 1997 & again to 187.38 million in 2003. From the results of 16th LivestockCensus conducted in 1997 and 17th Livestock Census conducted in 2003, it has beenobserved that there is clear shift of preference towards high yielding animals. As perlivestock censuses of 1997 and 2003, crossbred cattle population has increased by 22.82% and indigenous cattle population has decreased by 10.23 %. The buffalo populationhas increased from 89918 thousands to 97922 thousands thus registering an increase ofabout 9 %. There is a decline in indigenous male cattle population, which may be due tomechanization of agricultural activities. The data of 1997 and 2003 shows that there is 14% decrease during the period. Similarly, female indigenous cattle population decreasedby 6.34% during the same period. Further, the increase in female crossbred cattle andfemale buffalo population was 34 % and 12.26 % respectively. The decrease inindigenous cattle population and increase in crossbred cattle population with overallincrease in milk production indicates preferences for crossbred cattle population.
Apart from the basic production data of milk, eggs, wool and meat, the report alsocontains various data related to Animal Husbandry sector. While the growth rates ofproduction and plan expenditures on various schemes of the Animal Husbandry andDairy sectors are provided in part V of the report, the Gross Domestic Product ofLivestock Sector is provided in part VI. The contribution of livestock sector in theNational Economy at current prices is increasing upto 2000-01. In 2001-02, thecontribution of this sector in National GDP was 5.19%, which in 2002-03 is 4.79%. Thevalue of output in 2004-05 from livestock sector was Rs. 1,73,350 crores at currentprices, out of which Milk and Milk products was Rs. 1, 15,970 crores, of meat it was Rs.30,401 crores. The tables 88 & 89 of Gross Domestic Product by economic activity areadded to enhance the readability in the present report.
Part VII of the report contains various data like- incidence of disease, import andexport, value of consumption of various products, employment, veterinary institutes and
3
state infrastructures etc. The data of “Artificial Insemination done” is updated from the proceedings of TCD meeting held during October 2006, where some of the States/ UTs like Rajasthan etc, have revised their earlier reporting. Data for recent last two years from many States are still not available. While part VIII contains Dairying Statistics, in part IX of the report, miscellaneous data like human population, selected indicators of national economy are provided.
The part X of the report contains World statistics based on Food and Agricultural Organisation (FAO) Statistical Database. The coverage of tables has been increased. India ranks first in the milk production. A new table on Livestock numbers by major top countries based on 2005 data obtained from FAOSTAT Website during 2006 is also included.
I acknowledge my sincere thanks to Ms. Charusheela Sohoni, Secretary, DAHDF, Dr. S.K. Bandyopadhyay Animal Husbandry Commissioner and Shri O.P.Misra Adviser (Statistics) for providing guidance, continuous support and taking immense interest in TCD meetings, which gives constructive impetus towards finalisation of estimates across all the States/ UTs. I am also grateful to Dr. Chandramani Sharma Deputy Director, Shri Gurbax Singh Statistical Investigator, Shri Dhyan Chand DEO and other officers of the Department, who helped me in preparation of this report. I am extremely thankful to the Animal Husbandry Departments of all the States/UTs, members of TCD and various other departments of Government, without whose inputs and cooperation, this report would not have been updated successfully.
(Dr. Vishnu Kant Srivastava)
New Delhi Director December 28, 2006 Department of Animal Husbandry, Dairying & Fisheries
Ministry of Agriculture
PART I
Milk Production
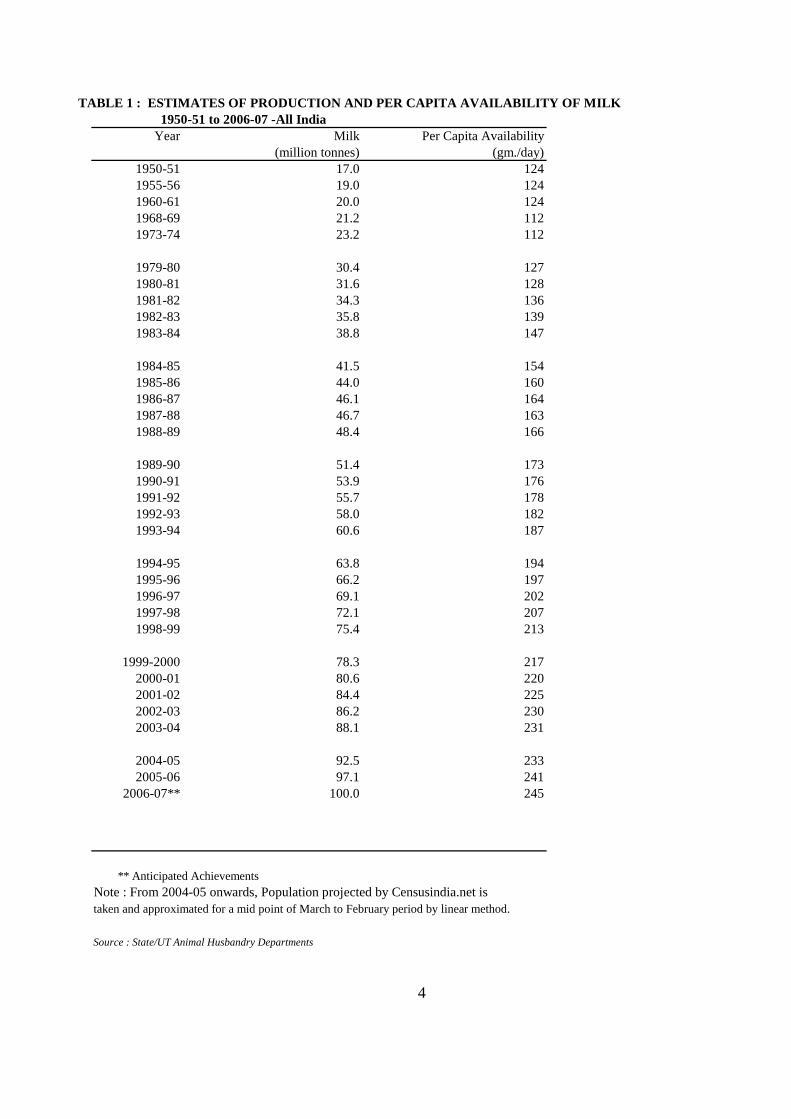
TABLE 1 : ESTIMATES OF PRODUCTION AND PER CAPITA AVAILABILITY OF MILK 1950-51 to 2006-07 -All India
Year Milk Per Capita Availability (million tonnes) (gm./day)
1950-51 17.0 1241955-56 19.0 1241960-61 20.0 1241968-69 21.2 1121973-74 23.2 112
1979-80 30.4 1271980-81 31.6 1281981-82 34.3 1361982-83 35.8 1391983-84 38.8 147
1984-85 41.5 1541985-86 44.0 1601986-87 46.1 1641987-88 46.7 1631988-89 48.4 166
1989-90 51.4 1731990-91 53.9 1761991-92 55.7 1781992-93 58.0 1821993-94 60.6 187
1994-95 63.8 1941995-96 66.2 1971996-97 69.1 2021997-98 72.1 2071998-99 75.4 213
1999-2000 78.3 2172000-01 80.6 2202001-02 84.4 2252002-03 86.2 2302003-04 88.1 231
2004-05 92.5 2332005-06 97.1 241
2006-07** 100.0 245
** Anticipated AchievementsNote : From 2004-05 onwards, Population projected by Censusindia.net istaken and approximated for a mid point of March to February period by linear method.
Source : State/UT Animal Husbandry Departments
4
5
0
10
20
30
40
50
60
70
80
90
100
Prod
uctio
n in
mill
ion
tonn
es
1999-2000 2000-01 2001-02 2002-03 2003-04 2004-05 2005-06
Year
Milk Production India

TABLE 2: ESTIMATES OF MILK PRODUCTION -1997-98 TO 2001-02- Statewise
(000 tonnes) S.No. States/UTs 1997-98 1998-99 1999-2000 2000-01 2001-02
1 Andhra Pradesh 4473 4842 5121 5521 58142 Arunachal Pradesh 43 45 46 42 423 Assam 719 725 667 683 6824 Bihar 3420 3440 3454 2489 26645 Chhattisgarh - - - 777 7956 Goa 38 41 44 45 457 Gujarat 4913 5059 5269 5312 58628 Haryana 4373 4527 4679 4850 49789 Himachal Pradesh 714 724 742 761 756
10 Jammu & Kashmir 1167 1232 1286 1321 136011 Jharkhand - - - 910 94012 Karnataka 3970 4231 4471 4599 479713 Kerala 2343 2420 2532 2605 271814 Madhya Pradesh 5377 5442 5519 4761 528315 Maharashtra 5193 5609 5707 5849 609416 Manipur 62 65 68 66 6817 Meghalaya 59 61 62 64 6618 Mizoram 17 20 18 14 1419 Nagaland 46 48 48 51 5720 Orissa 672 733 850 876 92921 Punjab 7165 7394 7706 7777 793222 Rajasthan 6487 6923 7280 7455 775823 Sikkim 35 35 35 35 3724 Tamil Nadu 4061 4273 4586 4910 498825 Tripura 57 76 77 77 9026 Uttar Pradesh 12934 13618 14152 13857 1464827 Uttaranchal - - - 1025 106628 West Bengal 3415 3441 3465 3471 351529 A&N Islands 22 22 23 22 2330 Chandigarh 43 43 42 43 4331 D.& N. Haveli 4 8 8 8 832 Daman & Diu 1 1 1 1 133 Delhi 267 290 290 291 29434 Lakshadweep 1 2 1 2 235 Pondicherry 36 36 37 37 37
All India 72128 75424 78286 80607 84406Source : State/UT Animal Husbandry Departments
6
7
Milk Production in Major States
0
2000
4000
6000
8000
10000
12000
14000
16000
18000
20000
Uttar Pradesh Rajasthan Punjab AndhraPradesh
Gujarat Maharashtra MadhyaPradesh
Haryana Tamil Nadu Karnataka
States
Pr
oduc
tion
in 0
00 to
nnes
.
2003-042004-052005-06

Table 3: ESTIMATES OF MILK PRODUCTION-2002-03 TO 2005-06
(000 tonnes) S.No. States/UTs 2002-03 2003-04 2004-05 2005-06
1 Andhra Pradesh 6584 6959 7257 76242 Arunachal Pradesh 46 46 48 483 Assam 705 727 739 7474 Bihar** 2869 3180 4743 50605 Chhattisgarh 804 812 831 8396 Goa 46 48 57 567 Gujarat 6089 6421 6745 69608 Haryana 5124 5221 5222 52999 Himachal Pradesh 773 786 870 869
10 Jammu & Kashmir 1389 1414 1422 140011 Jharkhand 952 954 1330 133512 Karnataka 4539 3857 3917 402213 Kerala 2419 2111 2025 206314 Madhya Pradesh 5343 5388 5506 628315 Maharashtra 6238 6379 6567 676916 Manipur 69 71 75 7717 Meghalaya 68 69 71 7318 Mizoram 15 15 16 1519 Nagaland 58 63 69 7420 Orissa 941 997 1283 134221 Punjab 8173 8391 8554 890922 Rajasthan 7789 8054 8310 871323 Sikkim 45 48 46 4824 Tamil Nadu 4622 4752 4784 547425 Tripura 79 84 86 8726 Uttar Pradesh 15288 15943 16512 1735627 Uttaranchal 1079 1188 1195 120628 West Bengal 3600 3686 3790 389129 A&N Islands 26 25 24 2030 Chandigarh 43 44 43 4631 D.& N. Haveli 8 8 4 532 Daman & Diu 1 1 1 133 Delhi 296 299 303 31034 Lakshadweep 2 1 1 235 Pondicherry 37 40 41 43
All India 86159 88082 92484 97066
** Bihar estimates swiched to 2003 livestock census base from 2004-05, earlier estimates are on 1982 livestock census base
Source : State/UT Animal Husbandry Departments
8

TABLE 4 : SHARE OF MILK PRODUCTION BY COWS, BUFFALOES & GOATS-1999-2000-Statewise
(000 tonnes) S.No. States/UTs Buffalo Goat Total
CB ND Total1 Andhra Pradesh 389 899 1288 3833 - 51212 Arunachal Pradesh 35 11 46 - - 463 Assam 130 425 555 87 25 6674 Bihar 213 1134 1347 1689 418 34545 Chattisgarh - - - - - -6 Goa 12 10 22 22 - 447 Gujarat 301 1400 1701 3339 229 52698 Haryana 443 436 879 3700 100 46799 Himachal Pradesh 119 216 335 370 37 742
10 Jammu & Kashmir 634 287 921 293 72 128611 Jharkhand* - - - - - -12 Karnataka 1168 1585 2753 1688 30 447113 Kerala 2105 229 2334 70 128 253214 Madhya Pradesh 214 2121 2335 2806 378 551915 Maharashtra 1670 1084 2754 2681 272 570716 Manipur 33 23 56 12 - 6817 Meghalaya 35 25 60 2 - 6218 Mizoram 13 4 17 1 - 1819 Nagaland 36 12 48 0.2 0.1 4820 Orissa 370 313 683 165 2 85021 Punjab 1907 205 2112 5552 42 770622 Rajasthan 72 2279 2351 4200 729 728023 Sikkim* - - - - - 3524 Tamil Nadu 1616 1220 2836 1750 - 458625 Tripura @ 16 57 73 2 2 7726 Uttar Pradesh 1001 2875 3876 9417 859 1415227 Uttaranchal - - - - - -28 West Bengal 980 2153 3133 321 11 346529 A&N Islands 2 13 15 5 3 2330 Chandigarh 10 0 10 32 - 4231 D.& N. Haveli* - - - - - 832 Daman & Diu* - - - - - 133 Delhi 62 - 62 228 - 29034 Lakshadweep - - - - - 135 Pondicherry 32 2 34 3 - 37
Total 13618 19018 32636 42268 3337 78286* Breakup not available; '-' denotes no production data reported.@ CB includes NDCB- Crossbred, ND- Non-descriptSource : State/UT Animal Husbandry Departments
Cow
9
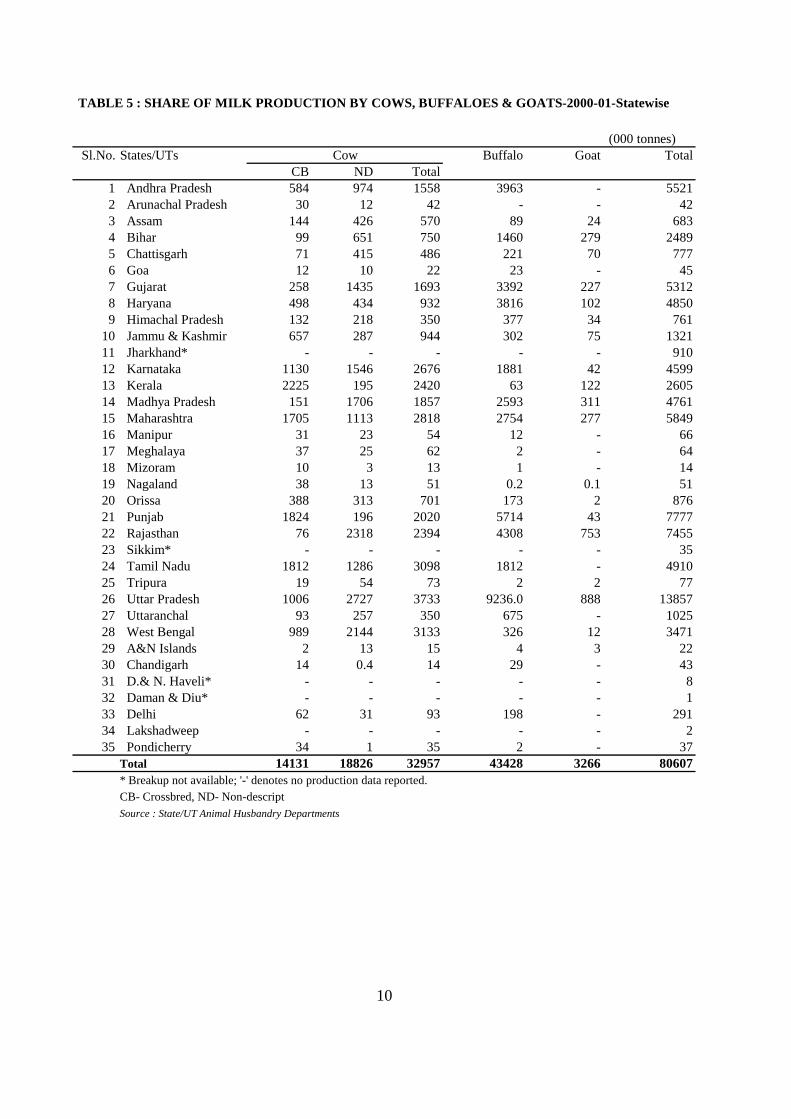
TABLE 5 : SHARE OF MILK PRODUCTION BY COWS, BUFFALOES & GOATS-2000-01-Statewise
(000 tonnes) Sl.No. States/UTs Buffalo Goat Total
CB ND Total1 Andhra Pradesh 584 974 1558 3963 - 55212 Arunachal Pradesh 30 12 42 - - 423 Assam 144 426 570 89 24 6834 Bihar 99 651 750 1460 279 24895 Chattisgarh 71 415 486 221 70 7776 Goa 12 10 22 23 - 457 Gujarat 258 1435 1693 3392 227 53128 Haryana 498 434 932 3816 102 48509 Himachal Pradesh 132 218 350 377 34 761
10 Jammu & Kashmir 657 287 944 302 75 132111 Jharkhand* - - - - - 91012 Karnataka 1130 1546 2676 1881 42 459913 Kerala 2225 195 2420 63 122 260514 Madhya Pradesh 151 1706 1857 2593 311 476115 Maharashtra 1705 1113 2818 2754 277 584916 Manipur 31 23 54 12 - 6617 Meghalaya 37 25 62 2 - 6418 Mizoram 10 3 13 1 - 1419 Nagaland 38 13 51 0.2 0.1 5120 Orissa 388 313 701 173 2 87621 Punjab 1824 196 2020 5714 43 777722 Rajasthan 76 2318 2394 4308 753 745523 Sikkim* - - - - - 3524 Tamil Nadu 1812 1286 3098 1812 - 491025 Tripura 19 54 73 2 2 7726 Uttar Pradesh 1006 2727 3733 9236.0 888 1385727 Uttaranchal 93 257 350 675 - 102528 West Bengal 989 2144 3133 326 12 347129 A&N Islands 2 13 15 4 3 2230 Chandigarh 14 0.4 14 29 - 4331 D.& N. Haveli* - - - - - 832 Daman & Diu* - - - - - 133 Delhi 62 31 93 198 - 29134 Lakshadweep - - - - - 235 Pondicherry 34 1 35 2 - 37
Total 14131 18826 32957 43428 3266 80607* Breakup not available; '-' denotes no production data reported.CB- Crossbred, ND- Non-descriptSource : State/UT Animal Husbandry Departments
Cow
10
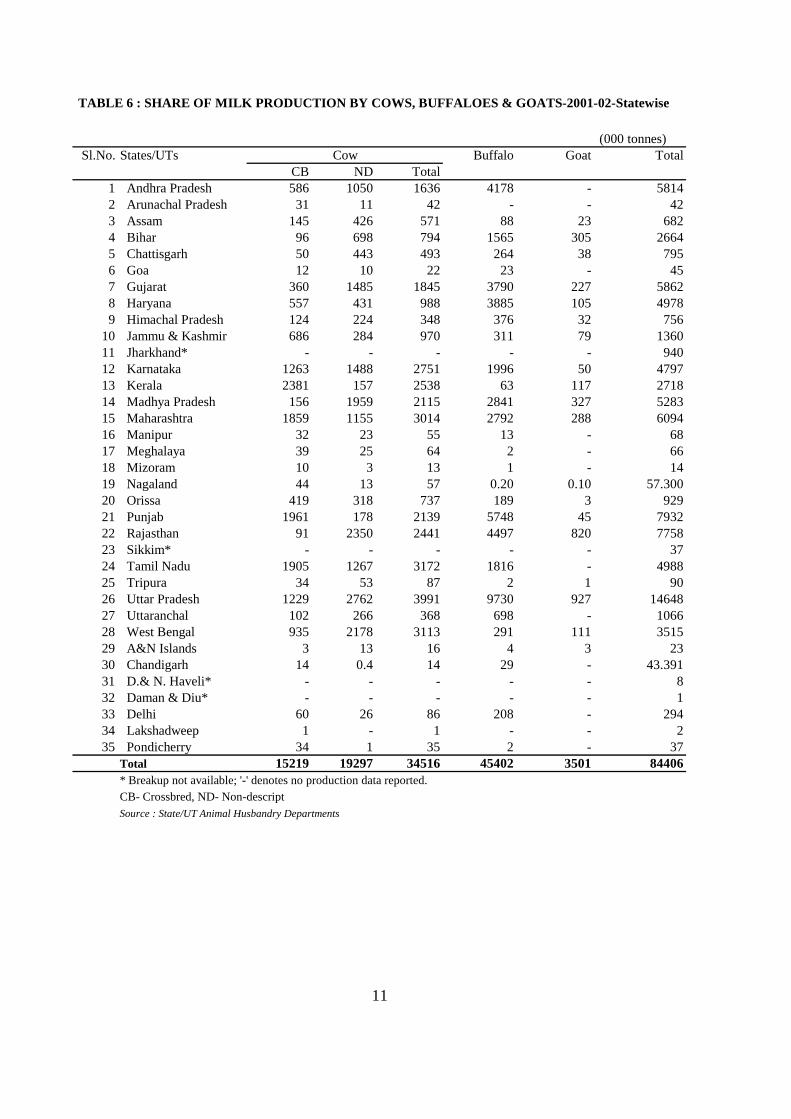
TABLE 6 : SHARE OF MILK PRODUCTION BY COWS, BUFFALOES & GOATS-2001-02-Statewise
(000 tonnes) Sl.No. States/UTs Buffalo Goat Total
CB ND Total1 Andhra Pradesh 586 1050 1636 4178 - 58142 Arunachal Pradesh 31 11 42 - - 423 Assam 145 426 571 88 23 6824 Bihar 96 698 794 1565 305 26645 Chattisgarh 50 443 493 264 38 7956 Goa 12 10 22 23 - 457 Gujarat 360 1485 1845 3790 227 58628 Haryana 557 431 988 3885 105 49789 Himachal Pradesh 124 224 348 376 32 756
10 Jammu & Kashmir 686 284 970 311 79 136011 Jharkhand* - - - - - 94012 Karnataka 1263 1488 2751 1996 50 479713 Kerala 2381 157 2538 63 117 271814 Madhya Pradesh 156 1959 2115 2841 327 528315 Maharashtra 1859 1155 3014 2792 288 609416 Manipur 32 23 55 13 - 6817 Meghalaya 39 25 64 2 - 6618 Mizoram 10 3 13 1 - 1419 Nagaland 44 13 57 0.20 0.10 57.30020 Orissa 419 318 737 189 3 92921 Punjab 1961 178 2139 5748 45 793222 Rajasthan 91 2350 2441 4497 820 775823 Sikkim* - - - - - 3724 Tamil Nadu 1905 1267 3172 1816 - 498825 Tripura 34 53 87 2 1 9026 Uttar Pradesh 1229 2762 3991 9730 927 1464827 Uttaranchal 102 266 368 698 - 106628 West Bengal 935 2178 3113 291 111 351529 A&N Islands 3 13 16 4 3 2330 Chandigarh 14 0.4 14 29 - 43.39131 D.& N. Haveli* - - - - - 832 Daman & Diu* - - - - - 133 Delhi 60 26 86 208 - 29434 Lakshadweep 1 - 1 - - 235 Pondicherry 34 1 35 2 - 37
Total 15219 19297 34516 45402 3501 84406* Breakup not available; '-' denotes no production data reported.CB- Crossbred, ND- Non-descriptSource : State/UT Animal Husbandry Departments
Cow
11
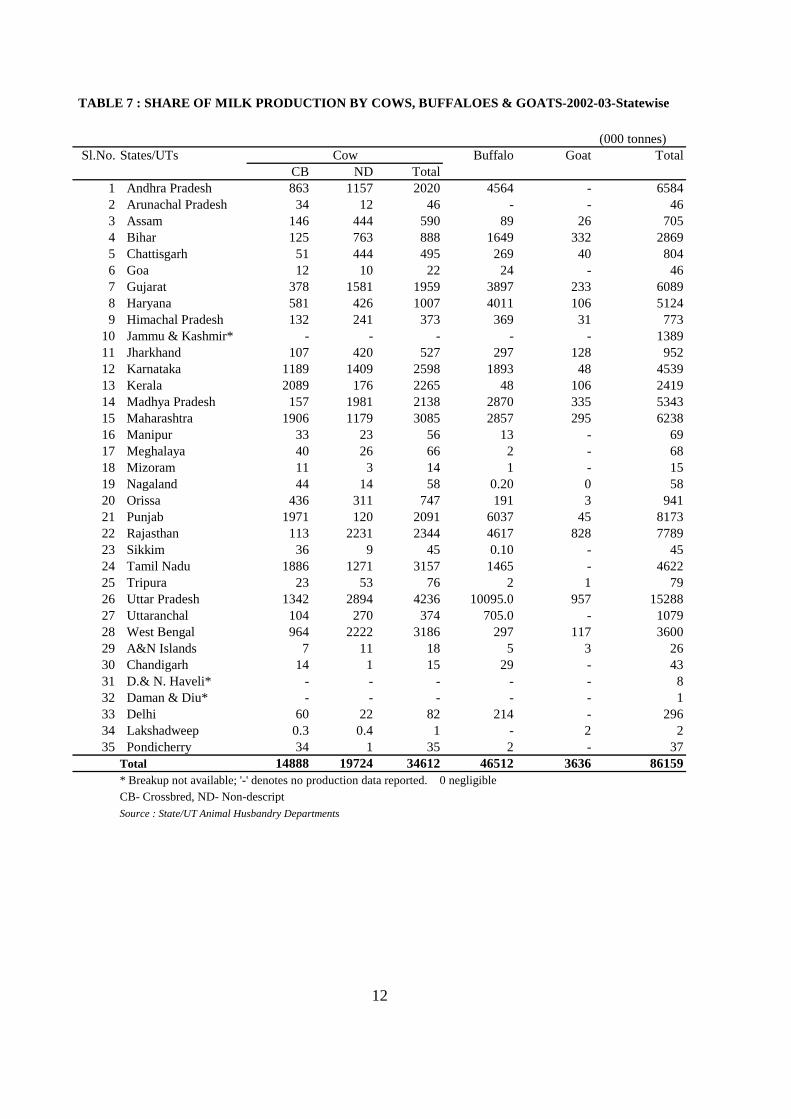
TABLE 7 : SHARE OF MILK PRODUCTION BY COWS, BUFFALOES & GOATS-2002-03-Statewise
(000 tonnes) Sl.No. States/UTs Buffalo Goat Total
CB ND Total1 Andhra Pradesh 863 1157 2020 4564 - 65842 Arunachal Pradesh 34 12 46 - - 463 Assam 146 444 590 89 26 7054 Bihar 125 763 888 1649 332 28695 Chattisgarh 51 444 495 269 40 8046 Goa 12 10 22 24 - 467 Gujarat 378 1581 1959 3897 233 60898 Haryana 581 426 1007 4011 106 51249 Himachal Pradesh 132 241 373 369 31 773
10 Jammu & Kashmir* - - - - - 138911 Jharkhand 107 420 527 297 128 95212 Karnataka 1189 1409 2598 1893 48 453913 Kerala 2089 176 2265 48 106 241914 Madhya Pradesh 157 1981 2138 2870 335 534315 Maharashtra 1906 1179 3085 2857 295 623816 Manipur 33 23 56 13 - 6917 Meghalaya 40 26 66 2 - 6818 Mizoram 11 3 14 1 - 1519 Nagaland 44 14 58 0.20 0 5820 Orissa 436 311 747 191 3 94121 Punjab 1971 120 2091 6037 45 817322 Rajasthan 113 2231 2344 4617 828 778923 Sikkim 36 9 45 0.10 - 4524 Tamil Nadu 1886 1271 3157 1465 - 462225 Tripura 23 53 76 2 1 7926 Uttar Pradesh 1342 2894 4236 10095.0 957 1528827 Uttaranchal 104 270 374 705.0 - 107928 West Bengal 964 2222 3186 297 117 360029 A&N Islands 7 11 18 5 3 2630 Chandigarh 14 1 15 29 - 4331 D.& N. Haveli* - - - - - 832 Daman & Diu* - - - - - 133 Delhi 60 22 82 214 - 29634 Lakshadweep 0.3 0.4 1 - 2 235 Pondicherry 34 1 35 2 - 37
Total 14888 19724 34612 46512 3636 86159* Breakup not available; '-' denotes no production data reported. 0 negligibleCB- Crossbred, ND- Non-descriptSource : State/UT Animal Husbandry Departments
Cow
12
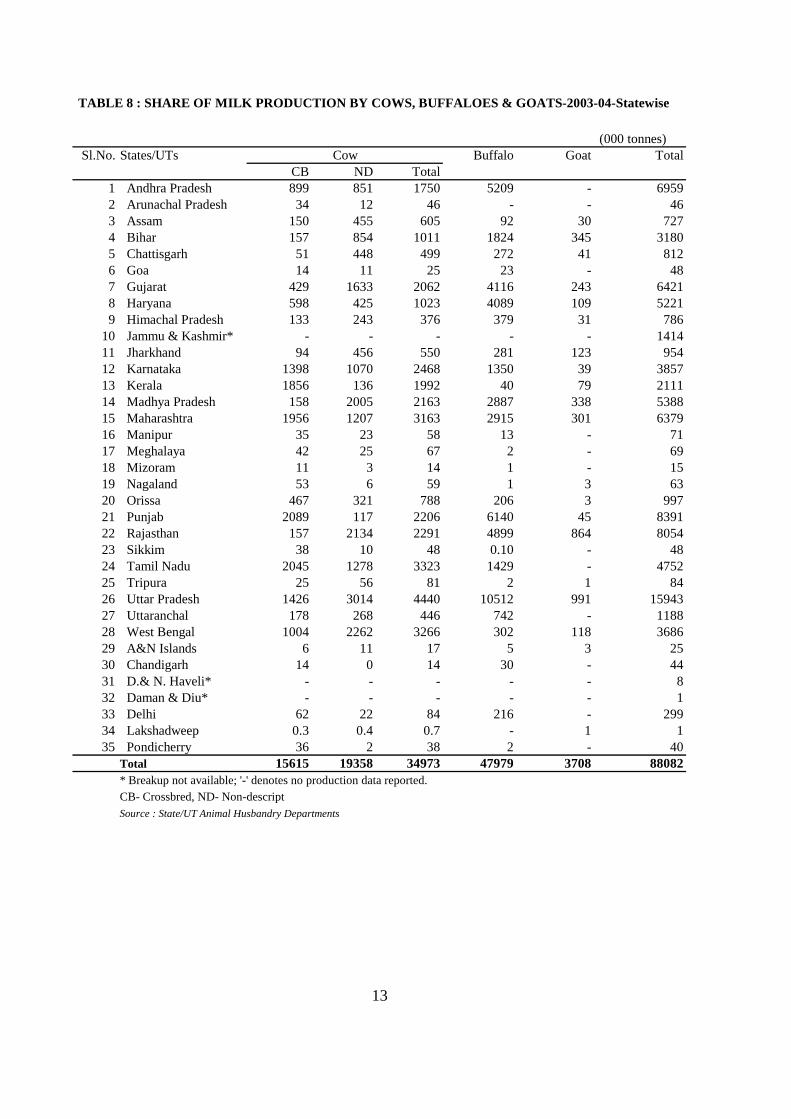
TABLE 8 : SHARE OF MILK PRODUCTION BY COWS, BUFFALOES & GOATS-2003-04-Statewise
(000 tonnes) Sl.No. States/UTs Buffalo Goat Total
CB ND Total1 Andhra Pradesh 899 851 1750 5209 - 69592 Arunachal Pradesh 34 12 46 - - 463 Assam 150 455 605 92 30 7274 Bihar 157 854 1011 1824 345 31805 Chattisgarh 51 448 499 272 41 8126 Goa 14 11 25 23 - 487 Gujarat 429 1633 2062 4116 243 64218 Haryana 598 425 1023 4089 109 52219 Himachal Pradesh 133 243 376 379 31 786
10 Jammu & Kashmir* - - - - - 141411 Jharkhand 94 456 550 281 123 95412 Karnataka 1398 1070 2468 1350 39 385713 Kerala 1856 136 1992 40 79 211114 Madhya Pradesh 158 2005 2163 2887 338 538815 Maharashtra 1956 1207 3163 2915 301 637916 Manipur 35 23 58 13 - 7117 Meghalaya 42 25 67 2 - 6918 Mizoram 11 3 14 1 - 1519 Nagaland 53 6 59 1 3 6320 Orissa 467 321 788 206 3 99721 Punjab 2089 117 2206 6140 45 839122 Rajasthan 157 2134 2291 4899 864 805423 Sikkim 38 10 48 0.10 - 4824 Tamil Nadu 2045 1278 3323 1429 - 475225 Tripura 25 56 81 2 1 8426 Uttar Pradesh 1426 3014 4440 10512 991 1594327 Uttaranchal 178 268 446 742 - 118828 West Bengal 1004 2262 3266 302 118 368629 A&N Islands 6 11 17 5 3 2530 Chandigarh 14 0 14 30 - 4431 D.& N. Haveli* - - - - - 832 Daman & Diu* - - - - - 133 Delhi 62 22 84 216 - 29934 Lakshadweep 0.3 0.4 0.7 - 1 135 Pondicherry 36 2 38 2 - 40
Total 15615 19358 34973 47979 3708 88082* Breakup not available; '-' denotes no production data reported.CB- Crossbred, ND- Non-descriptSource : State/UT Animal Husbandry Departments
Cow
13
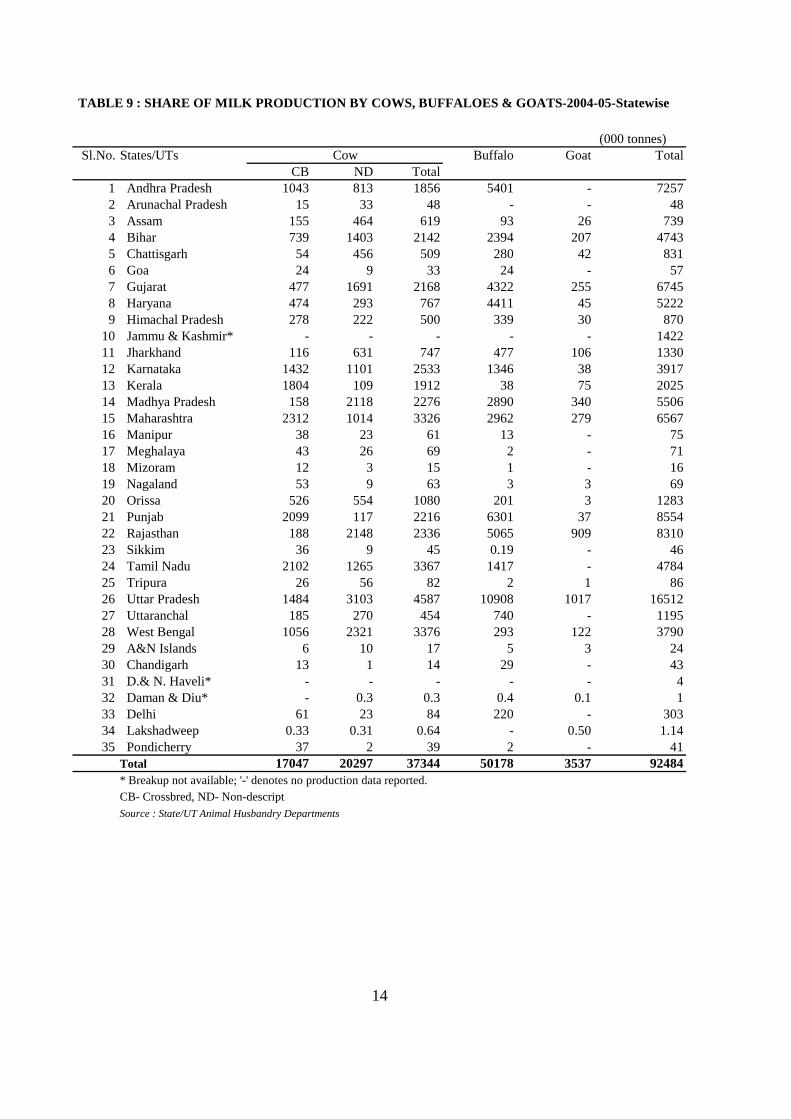
TABLE 9 : SHARE OF MILK PRODUCTION BY COWS, BUFFALOES & GOATS-2004-05-Statewise
(000 tonnes) Sl.No. States/UTs Buffalo Goat Total
CB ND Total1 Andhra Pradesh 1043 813 1856 5401 - 72572 Arunachal Pradesh 15 33 48 - - 483 Assam 155 464 619 93 26 7394 Bihar 739 1403 2142 2394 207 47435 Chattisgarh 54 456 509 280 42 8316 Goa 24 9 33 24 - 577 Gujarat 477 1691 2168 4322 255 67458 Haryana 474 293 767 4411 45 52229 Himachal Pradesh 278 222 500 339 30 870
10 Jammu & Kashmir* - - - - - 142211 Jharkhand 116 631 747 477 106 133012 Karnataka 1432 1101 2533 1346 38 391713 Kerala 1804 109 1912 38 75 202514 Madhya Pradesh 158 2118 2276 2890 340 550615 Maharashtra 2312 1014 3326 2962 279 656716 Manipur 38 23 61 13 - 7517 Meghalaya 43 26 69 2 - 7118 Mizoram 12 3 15 1 - 1619 Nagaland 53 9 63 3 3 6920 Orissa 526 554 1080 201 3 128321 Punjab 2099 117 2216 6301 37 855422 Rajasthan 188 2148 2336 5065 909 831023 Sikkim 36 9 45 0.19 - 4624 Tamil Nadu 2102 1265 3367 1417 - 478425 Tripura 26 56 82 2 1 8626 Uttar Pradesh 1484 3103 4587 10908 1017 1651227 Uttaranchal 185 270 454 740 - 119528 West Bengal 1056 2321 3376 293 122 379029 A&N Islands 6 10 17 5 3 2430 Chandigarh 13 1 14 29 - 4331 D.& N. Haveli* - - - - - 432 Daman & Diu* - 0.3 0.3 0.4 0.1 133 Delhi 61 23 84 220 - 30334 Lakshadweep 0.33 0.31 0.64 - 0.50 1.1435 Pondicherry 37 2 39 2 - 41
Total 17047 20297 37344 50178 3537 92484* Breakup not available; '-' denotes no production data reported.CB- Crossbred, ND- Non-descriptSource : State/UT Animal Husbandry Departments
Cow
14
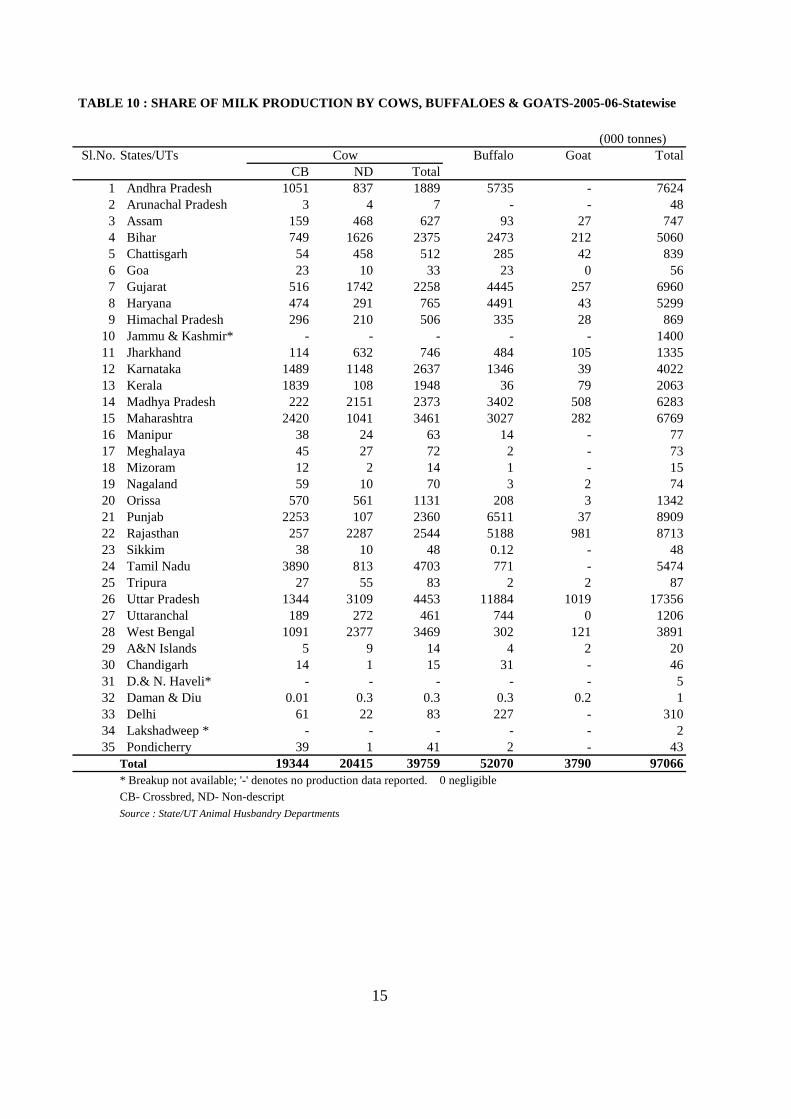
TABLE 10 : SHARE OF MILK PRODUCTION BY COWS, BUFFALOES & GOATS-2005-06-Statewise
(000 tonnes) Sl.No. States/UTs Buffalo Goat Total
CB ND Total1 Andhra Pradesh 1051 837 1889 5735 - 76242 Arunachal Pradesh 3 4 7 - - 483 Assam 159 468 627 93 27 7474 Bihar 749 1626 2375 2473 212 50605 Chattisgarh 54 458 512 285 42 8396 Goa 23 10 33 23 0 567 Gujarat 516 1742 2258 4445 257 69608 Haryana 474 291 765 4491 43 52999 Himachal Pradesh 296 210 506 335 28 869
10 Jammu & Kashmir* - - - - - 140011 Jharkhand 114 632 746 484 105 133512 Karnataka 1489 1148 2637 1346 39 402213 Kerala 1839 108 1948 36 79 206314 Madhya Pradesh 222 2151 2373 3402 508 628315 Maharashtra 2420 1041 3461 3027 282 676916 Manipur 38 24 63 14 - 7717 Meghalaya 45 27 72 2 - 7318 Mizoram 12 2 14 1 - 1519 Nagaland 59 10 70 3 2 7420 Orissa 570 561 1131 208 3 134221 Punjab 2253 107 2360 6511 37 890922 Rajasthan 257 2287 2544 5188 981 871323 Sikkim 38 10 48 0.12 - 4824 Tamil Nadu 3890 813 4703 771 - 547425 Tripura 27 55 83 2 2 8726 Uttar Pradesh 1344 3109 4453 11884 1019 1735627 Uttaranchal 189 272 461 744 0 120628 West Bengal 1091 2377 3469 302 121 389129 A&N Islands 5 9 14 4 2 2030 Chandigarh 14 1 15 31 - 4631 D.& N. Haveli* - - - - - 532 Daman & Diu 0.01 0.3 0.3 0.3 0.2 133 Delhi 61 22 83 227 - 31034 Lakshadweep * - - - - - 235 Pondicherry 39 1 41 2 - 43
Total 19344 20415 39759 52070 3790 97066* Breakup not available; '-' denotes no production data reported. 0 negligibleCB- Crossbred, ND- Non-descriptSource : State/UT Animal Husbandry Departments
Cow
15

TABLE 11 : DETAILS OF ESTIMATES OF MILK PRODUCTION FROM CROSSBRED COWS - 1999-2000, 2000-01and 2001-02- Statewise
S.No.States/UTs
1999-2000 2000-01 2001-02 1999-2000 2000-01 2001-02 1999-2000 2000-01 2001-021 Andhra Pradesh 169.4 252.0 260.4 6.272 6.344 6.169 389 584 5862 Arunachal Pradesh 16.0 11.7 11.9 6.000 7.071 7.071 35 30 313 Assam 100.0 112.0 113.0 3.540 3.514 3.514 130 144 1454 Bihar 118.6 55.2 52.3 4.915 4.915 5.038 213 99 965 Chattisgarh - 34.3 35.2 - 5.675 3.852 - 71 506 Goa 5.4 5.4 4.9 5.923 6.213 6.683 12 12 127 Gujarat 105.3 96.0 124.4 7.815 7.351 7.932 301 258 3608 Haryana 180.8 203.5 227.5 6.693 6.708 6.707 443 498 5579 Himachal Pradesh 96.7 95.6 97.5 3.373 3.780 3.493 119 132 124
10 Jammu & Kashmir 337.0 347.9 361.6 5.139 5.174 5.195 634 657 68611 Jharkhand* - - - - - - - - -12 Karnataka 494.7 478.3 557.3 6.452 6.471 6.209 1168 1130 126313 Kerala 894.2 929.7 968.8 6.433 6.556 6.733 2105 2225 238114 Madhya Pradesh 103.0 72.3 73.1 5.666 5.724 5.854 214 151 15615 Maharashtra 644.0 658.0 743.0 7.086 7.098 6.855 1670 1705 185916 Manipur 12.6 12.7 13.1 7.140 6.660 6.701 33 31 3217 Meghalaya 10.7 11.2 11.9 8.891 8.938 8.900 35 37 3918 Mizoram 4.3 3.2 3.3 8.040 8.110 8.093 13 10 1019 Nagaland 13.0 14.1 15.9 7.575 7.320 7.560 36 38 4420 Orissa 217.7 221.0 218.2 4.640 4.806 5.255 370 388 41921 Punjab 608.3 582.3 625.9 8.567 8.580 8.583 1907 1824 196122 Rajasthan 37.0 39.0 46.0 5.350 5.333 5.430 72 76 9123 Sikkim* - - - - - - - - -24 Tamil Nadu 735.9 826.9 835.7 6.000 6.002 6.244 1616 1812 190525 Tripura 15.0 17.0 30.2 3.000 3.100 3.100 16 19 3426 Uttar Pradesh 438.0 435.4 517.2 6.247 6.333 6.511 1001 1006 122927 Uttaranchal - 37.9 40.0 - 6.700 7.005 - 93 10228 West Bengal 389.9 406.1 438.5 6.869 6.674 5.844 980 989 93529 A&N Islands 1.0 1.0 2.0 4.250 4.300 4.680 2 2 330 Chandigarh 3.5 4.1 4.2 7.500 9.290 9.006 10 14 1431 D.& N. Haveli* - - - - - - - - -32 Daman & Diu* - - - - - - - - -33 Delhi 28.4 28.3 27.2 6.010 5.970 6.070 62 62 6034 Lakshadweep - - 0.4 - - 6.500 - - 135 Pondicherry 18.2 18.6 17.3 4.766 4.997 5.340 32 34 34
Total@ 5798 6011 6478 6.434 6.441 6.437 13618 14131 15219 * Details not available; '-' denotes no production data reported.@ Total of only those States/UTs for which data are availableSource : State/UT Animal Husbandry Departments
Estimates of MilkProduction
No. of Animalsin Milk
Average Yield perAnimal in Milk
16
(000 nos.) (kg/day) (000 tonnes)
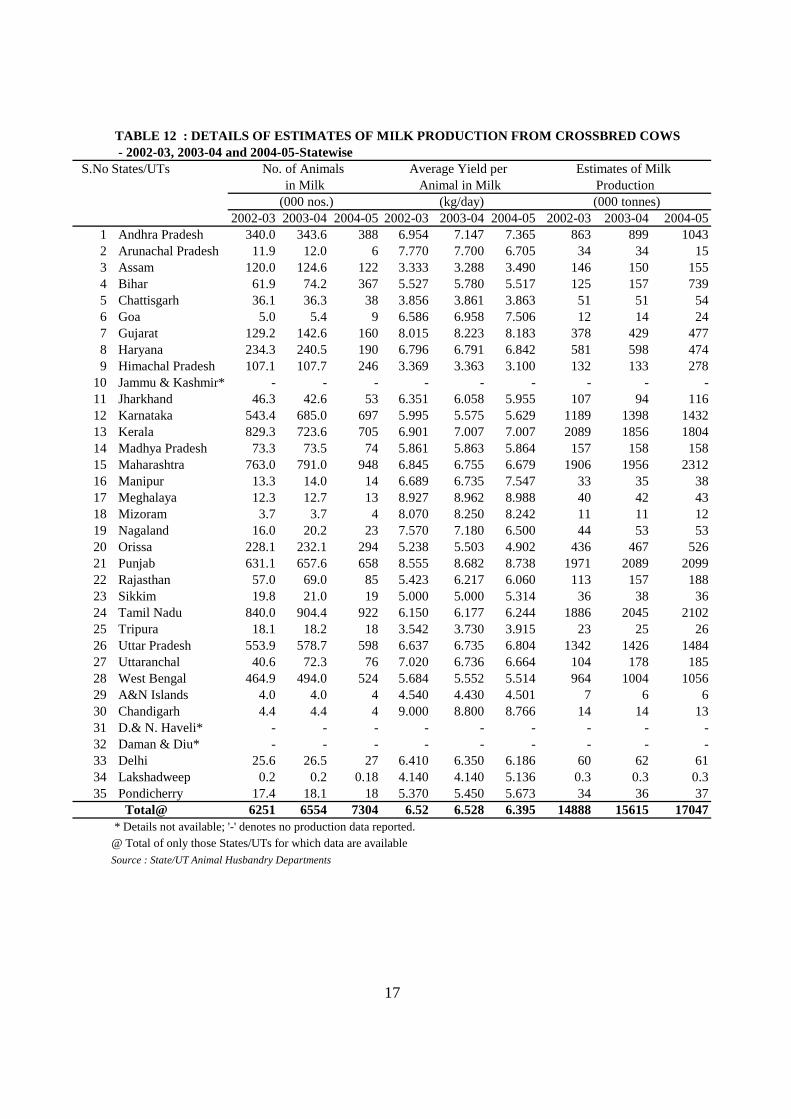
TABLE 12 : DETAILS OF ESTIMATES OF MILK PRODUCTION FROM CROSSBRED COWS - 2002-03, 2003-04 and 2004-05-Statewise
S.No.States/UTs
2002-03 2003-04 2004-05 2002-03 2003-04 2004-05 2002-03 2003-04 2004-051 Andhra Pradesh 340.0 343.6 388 6.954 7.147 7.365 863 899 10432 Arunachal Pradesh 11.9 12.0 6 7.770 7.700 6.705 34 34 153 Assam 120.0 124.6 122 3.333 3.288 3.490 146 150 1554 Bihar 61.9 74.2 367 5.527 5.780 5.517 125 157 7395 Chattisgarh 36.1 36.3 38 3.856 3.861 3.863 51 51 546 Goa 5.0 5.4 9 6.586 6.958 7.506 12 14 247 Gujarat 129.2 142.6 160 8.015 8.223 8.183 378 429 4778 Haryana 234.3 240.5 190 6.796 6.791 6.842 581 598 4749 Himachal Pradesh 107.1 107.7 246 3.369 3.363 3.100 132 133 278
10 Jammu & Kashmir* - - - - - - - - -11 Jharkhand 46.3 42.6 53 6.351 6.058 5.955 107 94 11612 Karnataka 543.4 685.0 697 5.995 5.575 5.629 1189 1398 143213 Kerala 829.3 723.6 705 6.901 7.007 7.007 2089 1856 180414 Madhya Pradesh 73.3 73.5 74 5.861 5.863 5.864 157 158 15815 Maharashtra 763.0 791.0 948 6.845 6.755 6.679 1906 1956 231216 Manipur 13.3 14.0 14 6.689 6.735 7.547 33 35 3817 Meghalaya 12.3 12.7 13 8.927 8.962 8.988 40 42 4318 Mizoram 3.7 3.7 4 8.070 8.250 8.242 11 11 1219 Nagaland 16.0 20.2 23 7.570 7.180 6.500 44 53 5320 Orissa 228.1 232.1 294 5.238 5.503 4.902 436 467 52621 Punjab 631.1 657.6 658 8.555 8.682 8.738 1971 2089 209922 Rajasthan 57.0 69.0 85 5.423 6.217 6.060 113 157 18823 Sikkim 19.8 21.0 19 5.000 5.000 5.314 36 38 3624 Tamil Nadu 840.0 904.4 922 6.150 6.177 6.244 1886 2045 210225 Tripura 18.1 18.2 18 3.542 3.730 3.915 23 25 2626 Uttar Pradesh 553.9 578.7 598 6.637 6.735 6.804 1342 1426 148427 Uttaranchal 40.6 72.3 76 7.020 6.736 6.664 104 178 18528 West Bengal 464.9 494.0 524 5.684 5.552 5.514 964 1004 105629 A&N Islands 4.0 4.0 4 4.540 4.430 4.501 7 6 630 Chandigarh 4.4 4.4 4 9.000 8.800 8.766 14 14 1331 D.& N. Haveli* - - - - - - - - -32 Daman & Diu* - - - - - - - - -33 Delhi 25.6 26.5 27 6.410 6.350 6.186 60 62 6134 Lakshadweep 0.2 0.2 0.18 4.140 4.140 5.136 0.3 0.3 0.335 Pondicherry 17.4 18.1 18 5.370 5.450 5.673 34 36 37
Total@ 6251 6554 7304 6.52 6.528 6.395 14888 15615 17047 * Details not available; '-' denotes no production data reported.@ Total of only those States/UTs for which data are availableSource : State/UT Animal Husbandry Departments
No. of Animals Average Yield per Estimates of Milkin Milk Animal in Milk Production
17
(kg/day) (000 nos.) (000 tonnes)
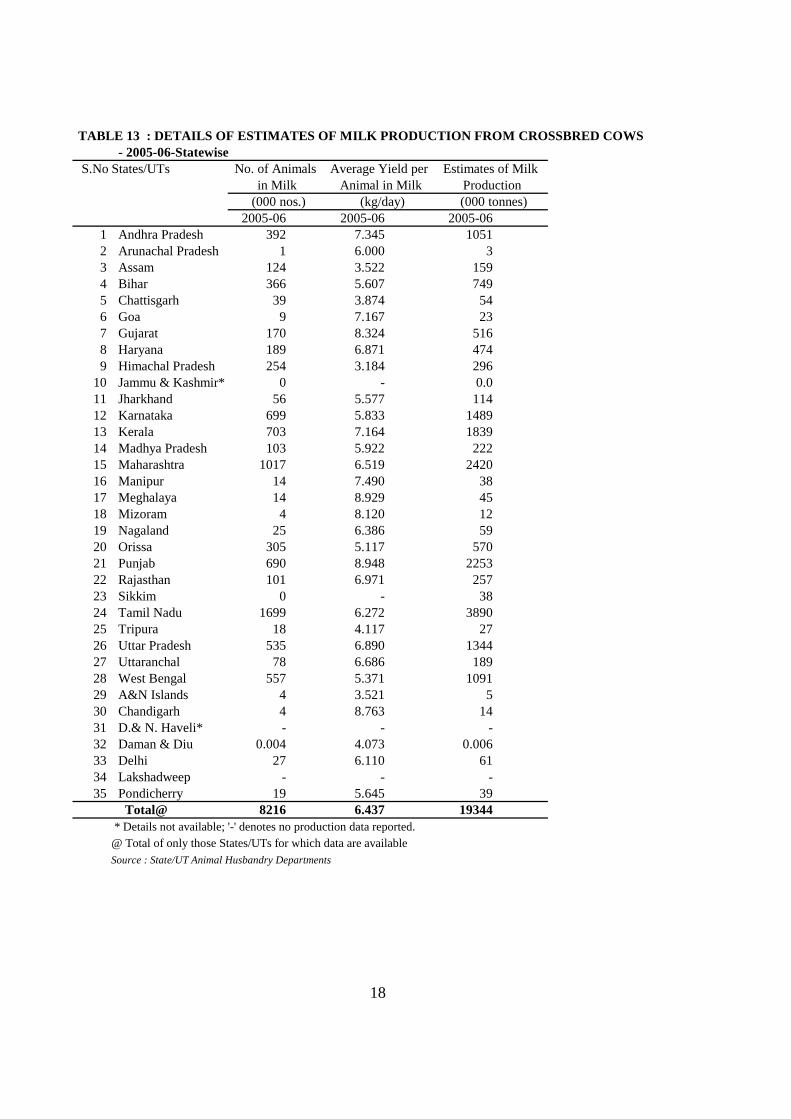
TABLE 13 : DETAILS OF ESTIMATES OF MILK PRODUCTION FROM CROSSBRED COWS - 2005-06-Statewise
S.No.States/UTs
2005-06 2005-06 2005-061 Andhra Pradesh 392 7.345 10512 Arunachal Pradesh 1 6.000 33 Assam 124 3.522 1594 Bihar 366 5.607 7495 Chattisgarh 39 3.874 546 Goa 9 7.167 237 Gujarat 170 8.324 5168 Haryana 189 6.871 4749 Himachal Pradesh 254 3.184 296
10 Jammu & Kashmir* 0 - 0.011 Jharkhand 56 5.577 11412 Karnataka 699 5.833 148913 Kerala 703 7.164 183914 Madhya Pradesh 103 5.922 22215 Maharashtra 1017 6.519 242016 Manipur 14 7.490 3817 Meghalaya 14 8.929 4518 Mizoram 4 8.120 1219 Nagaland 25 6.386 5920 Orissa 305 5.117 57021 Punjab 690 8.948 225322 Rajasthan 101 6.971 25723 Sikkim 0 - 3824 Tamil Nadu 1699 6.272 389025 Tripura 18 4.117 2726 Uttar Pradesh 535 6.890 134427 Uttaranchal 78 6.686 18928 West Bengal 557 5.371 109129 A&N Islands 4 3.521 530 Chandigarh 4 8.763 1431 D.& N. Haveli* - - -32 Daman & Diu 0.004 4.073 0.00633 Delhi 27 6.110 6134 Lakshadweep - - -35 Pondicherry 19 5.645 39
Total@ 8216 6.437 19344 * Details not available; '-' denotes no production data reported.@ Total of only those States/UTs for which data are availableSource : State/UT Animal Husbandry Departments
18
(000 tonnes)
Estimates of Milkin Milk Animal in Milk Production
(000 nos.) (kg/day)
No. of Animals Average Yield per
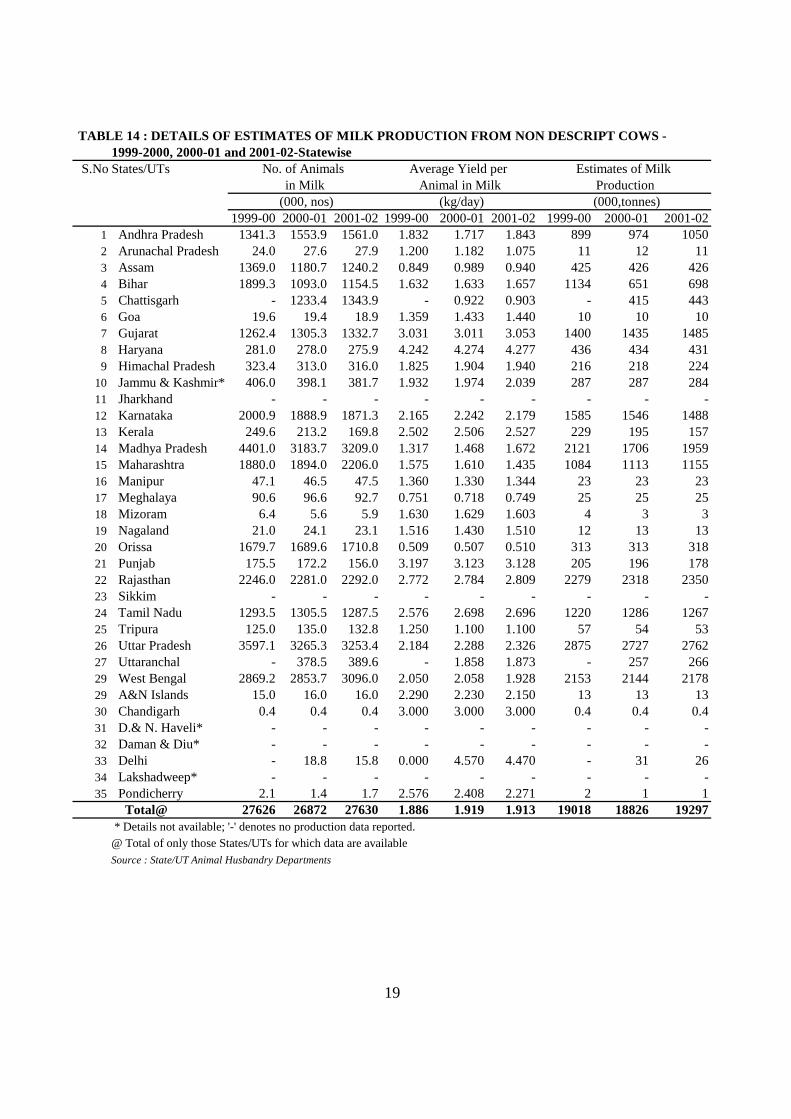
TABLE 14 : DETAILS OF ESTIMATES OF MILK PRODUCTION FROM NON DESCRIPT COWS -1999-2000, 2000-01 and 2001-02-Statewise
S.No.States/UTs
1999-00 2000-01 2001-02 1999-00 2000-01 2001-02 1999-00 2000-01 2001-021 Andhra Pradesh 1341.3 1553.9 1561.0 1.832 1.717 1.843 899 974 10502 Arunachal Pradesh 24.0 27.6 27.9 1.200 1.182 1.075 11 12 113 Assam 1369.0 1180.7 1240.2 0.849 0.989 0.940 425 426 4264 Bihar 1899.3 1093.0 1154.5 1.632 1.633 1.657 1134 651 6985 Chattisgarh - 1233.4 1343.9 - 0.922 0.903 - 415 4436 Goa 19.6 19.4 18.9 1.359 1.433 1.440 10 10 107 Gujarat 1262.4 1305.3 1332.7 3.031 3.011 3.053 1400 1435 14858 Haryana 281.0 278.0 275.9 4.242 4.274 4.277 436 434 4319 Himachal Pradesh 323.4 313.0 316.0 1.825 1.904 1.940 216 218 224
10 Jammu & Kashmir* 406.0 398.1 381.7 1.932 1.974 2.039 287 287 28411 Jharkhand - - - - - - - - -12 Karnataka 2000.9 1888.9 1871.3 2.165 2.242 2.179 1585 1546 148813 Kerala 249.6 213.2 169.8 2.502 2.506 2.527 229 195 15714 Madhya Pradesh 4401.0 3183.7 3209.0 1.317 1.468 1.672 2121 1706 195915 Maharashtra 1880.0 1894.0 2206.0 1.575 1.610 1.435 1084 1113 115516 Manipur 47.1 46.5 47.5 1.360 1.330 1.344 23 23 2317 Meghalaya 90.6 96.6 92.7 0.751 0.718 0.749 25 25 2518 Mizoram 6.4 5.6 5.9 1.630 1.629 1.603 4 3 319 Nagaland 21.0 24.1 23.1 1.516 1.430 1.510 12 13 1320 Orissa 1679.7 1689.6 1710.8 0.509 0.507 0.510 313 313 31821 Punjab 175.5 172.2 156.0 3.197 3.123 3.128 205 196 17822 Rajasthan 2246.0 2281.0 2292.0 2.772 2.784 2.809 2279 2318 235023 Sikkim - - - - - - - - -24 Tamil Nadu 1293.5 1305.5 1287.5 2.576 2.698 2.696 1220 1286 126725 Tripura 125.0 135.0 132.8 1.250 1.100 1.100 57 54 5326 Uttar Pradesh 3597.1 3265.3 3253.4 2.184 2.288 2.326 2875 2727 276227 Uttaranchal - 378.5 389.6 - 1.858 1.873 - 257 26629 West Bengal 2869.2 2853.7 3096.0 2.050 2.058 1.928 2153 2144 217829 A&N Islands 15.0 16.0 16.0 2.290 2.230 2.150 13 13 1330 Chandigarh 0.4 0.4 0.4 3.000 3.000 3.000 0.4 0.4 0.431 D.& N. Haveli* - - - - - - - - -32 Daman & Diu* - - - - - - - - -33 Delhi - 18.8 15.8 0.000 4.570 4.470 - 31 2634 Lakshadweep* - - - - - - - - -35 Pondicherry 2.1 1.4 1.7 2.576 2.408 2.271 2 1 1
Total@ 27626 26872 27630 1.886 1.919 1.913 19018 18826 19297 * Details not available; '-' denotes no production data reported.@ Total of only those States/UTs for which data are availableSource : State/UT Animal Husbandry Departments
19
(000,tonnes)
Estimates of MilkProduction
(000, nos)
No. of Animalsin Milk
Average Yield perAnimal in Milk
(kg/day)
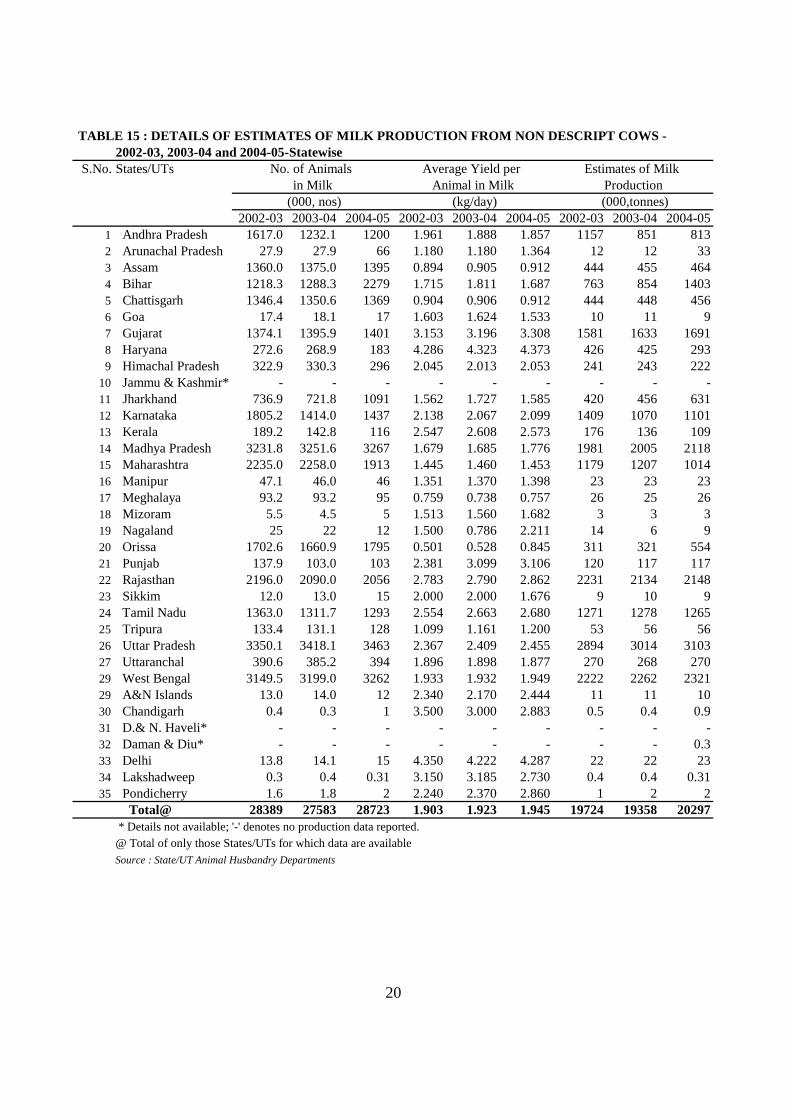
TABLE 15 : DETAILS OF ESTIMATES OF MILK PRODUCTION FROM NON DESCRIPT COWS -2002-03, 2003-04 and 2004-05-Statewise
S.No. States/UTs
2002-03 2003-04 2004-05 2002-03 2003-04 2004-05 2002-03 2003-04 2004-051 Andhra Pradesh 1617.0 1232.1 1200 1.961 1.888 1.857 1157 851 8132 Arunachal Pradesh 27.9 27.9 66 1.180 1.180 1.364 12 12 333 Assam 1360.0 1375.0 1395 0.894 0.905 0.912 444 455 4644 Bihar 1218.3 1288.3 2279 1.715 1.811 1.687 763 854 14035 Chattisgarh 1346.4 1350.6 1369 0.904 0.906 0.912 444 448 4566 Goa 17.4 18.1 17 1.603 1.624 1.533 10 11 97 Gujarat 1374.1 1395.9 1401 3.153 3.196 3.308 1581 1633 16918 Haryana 272.6 268.9 183 4.286 4.323 4.373 426 425 2939 Himachal Pradesh 322.9 330.3 296 2.045 2.013 2.053 241 243 222
10 Jammu & Kashmir* - - - - - - - - -11 Jharkhand 736.9 721.8 1091 1.562 1.727 1.585 420 456 63112 Karnataka 1805.2 1414.0 1437 2.138 2.067 2.099 1409 1070 110113 Kerala 189.2 142.8 116 2.547 2.608 2.573 176 136 10914 Madhya Pradesh 3231.8 3251.6 3267 1.679 1.685 1.776 1981 2005 211815 Maharashtra 2235.0 2258.0 1913 1.445 1.460 1.453 1179 1207 101416 Manipur 47.1 46.0 46 1.351 1.370 1.398 23 23 2317 Meghalaya 93.2 93.2 95 0.759 0.738 0.757 26 25 2618 Mizoram 5.5 4.5 5 1.513 1.560 1.682 3 3 319 Nagaland 25 22 12 1.500 0.786 2.211 14 6 920 Orissa 1702.6 1660.9 1795 0.501 0.528 0.845 311 321 55421 Punjab 137.9 103.0 103 2.381 3.099 3.106 120 117 11722 Rajasthan 2196.0 2090.0 2056 2.783 2.790 2.862 2231 2134 214823 Sikkim 12.0 13.0 15 2.000 2.000 1.676 9 10 924 Tamil Nadu 1363.0 1311.7 1293 2.554 2.663 2.680 1271 1278 126525 Tripura 133.4 131.1 128 1.099 1.161 1.200 53 56 5626 Uttar Pradesh 3350.1 3418.1 3463 2.367 2.409 2.455 2894 3014 310327 Uttaranchal 390.6 385.2 394 1.896 1.898 1.877 270 268 27029 West Bengal 3149.5 3199.0 3262 1.933 1.932 1.949 2222 2262 232129 A&N Islands 13.0 14.0 12 2.340 2.170 2.444 11 11 1030 Chandigarh 0.4 0.3 1 3.500 3.000 2.883 0.5 0.4 0.931 D.& N. Haveli* - - - - - - - - -32 Daman & Diu* - - - - - - - - 0.333 Delhi 13.8 14.1 15 4.350 4.222 4.287 22 22 2334 Lakshadweep 0.3 0.4 0.31 3.150 3.185 2.730 0.4 0.4 0.3135 Pondicherry 1.6 1.8 2 2.240 2.370 2.860 1 2 2
Total@ 28389 27583 28723 1.903 1.923 1.945 19724 19358 20297 * Details not available; '-' denotes no production data reported.@ Total of only those States/UTs for which data are availableSource : State/UT Animal Husbandry Departments
Estimates of Milkin Milk Animal in Milk
No. of Animals Average Yield per
20
(kg/day) (000,tonnes)Production
(000, nos)
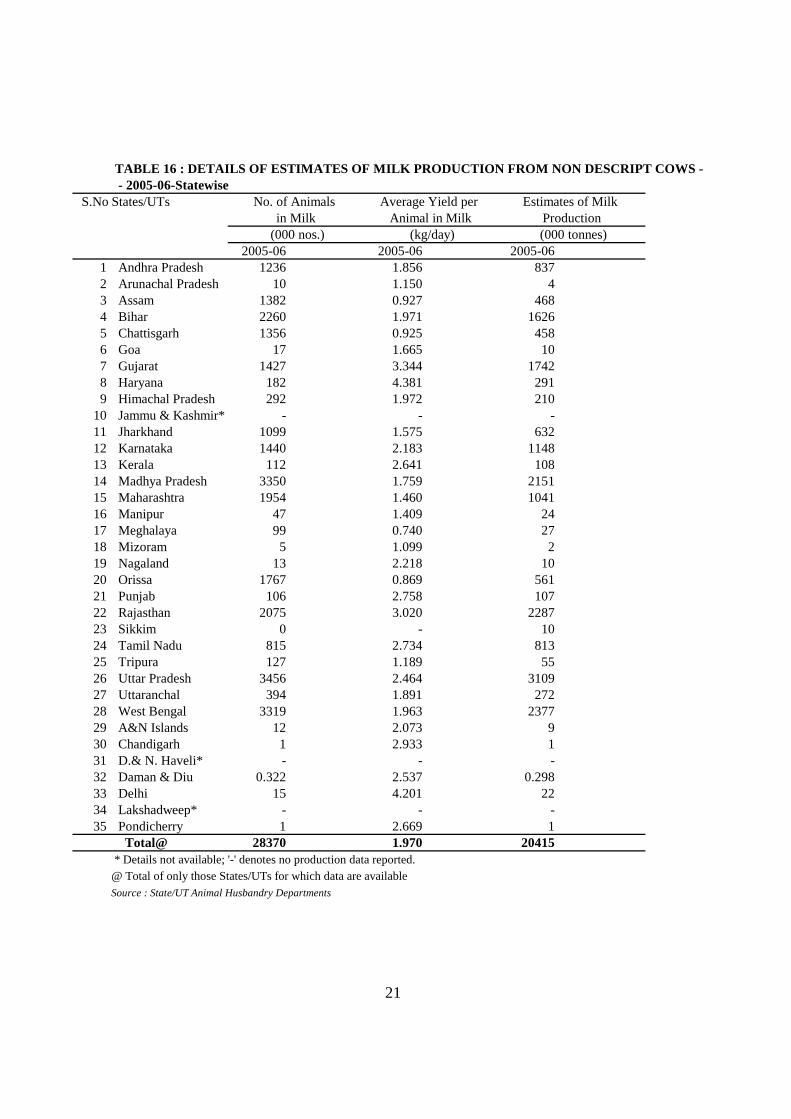
TABLE 16 : DETAILS OF ESTIMATES OF MILK PRODUCTION FROM NON DESCRIPT COWS - - 2005-06-Statewise
S.No.States/UTs
2005-06 2005-06 2005-061 Andhra Pradesh 1236 1.856 8372 Arunachal Pradesh 10 1.150 43 Assam 1382 0.927 4684 Bihar 2260 1.971 16265 Chattisgarh 1356 0.925 4586 Goa 17 1.665 107 Gujarat 1427 3.344 17428 Haryana 182 4.381 2919 Himachal Pradesh 292 1.972 210
10 Jammu & Kashmir* - - -11 Jharkhand 1099 1.575 63212 Karnataka 1440 2.183 114813 Kerala 112 2.641 10814 Madhya Pradesh 3350 1.759 215115 Maharashtra 1954 1.460 104116 Manipur 47 1.409 2417 Meghalaya 99 0.740 2718 Mizoram 5 1.099 219 Nagaland 13 2.218 1020 Orissa 1767 0.869 56121 Punjab 106 2.758 10722 Rajasthan 2075 3.020 228723 Sikkim 0 - 1024 Tamil Nadu 815 2.734 81325 Tripura 127 1.189 5526 Uttar Pradesh 3456 2.464 310927 Uttaranchal 394 1.891 27228 West Bengal 3319 1.963 237729 A&N Islands 12 2.073 930 Chandigarh 1 2.933 131 D.& N. Haveli* - - -32 Daman & Diu 0.322 2.537 0.29833 Delhi 15 4.201 2234 Lakshadweep* - - -35 Pondicherry 1 2.669 1
Total@ 28370 1.970 20415 * Details not available; '-' denotes no production data reported.@ Total of only those States/UTs for which data are availableSource : State/UT Animal Husbandry Departments
No. of Animals Average Yield per Estimates of Milkin Milk Animal in Milk Production
(000 nos.) (kg/day) (000 tonnes)
21
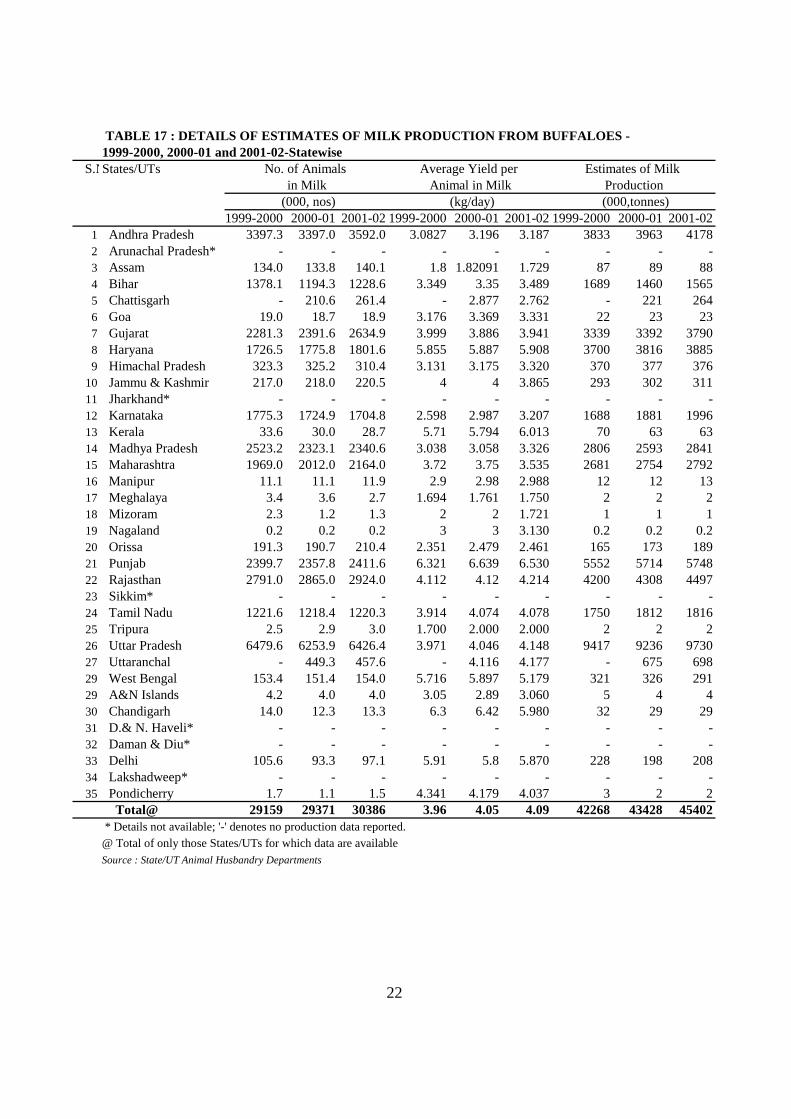
TABLE 17 : DETAILS OF ESTIMATES OF MILK PRODUCTION FROM BUFFALOES -1999-2000, 2000-01 and 2001-02-Statewise
S.No.States/UTs
1999-2000 2000-01 2001-02 1999-2000 2000-01 2001-02 1999-2000 2000-01 2001-021 Andhra Pradesh 3397.3 3397.0 3592.0 3.0827 3.196 3.187 3833 3963 41782 Arunachal Pradesh* - - - - - - - - -3 Assam 134.0 133.8 140.1 1.8 1.82091 1.729 87 89 884 Bihar 1378.1 1194.3 1228.6 3.349 3.35 3.489 1689 1460 15655 Chattisgarh - 210.6 261.4 - 2.877 2.762 - 221 2646 Goa 19.0 18.7 18.9 3.176 3.369 3.331 22 23 237 Gujarat 2281.3 2391.6 2634.9 3.999 3.886 3.941 3339 3392 37908 Haryana 1726.5 1775.8 1801.6 5.855 5.887 5.908 3700 3816 38859 Himachal Pradesh 323.3 325.2 310.4 3.131 3.175 3.320 370 377 376
10 Jammu & Kashmir 217.0 218.0 220.5 4 4 3.865 293 302 31111 Jharkhand* - - - - - - - - -12 Karnataka 1775.3 1724.9 1704.8 2.598 2.987 3.207 1688 1881 199613 Kerala 33.6 30.0 28.7 5.71 5.794 6.013 70 63 6314 Madhya Pradesh 2523.2 2323.1 2340.6 3.038 3.058 3.326 2806 2593 284115 Maharashtra 1969.0 2012.0 2164.0 3.72 3.75 3.535 2681 2754 279216 Manipur 11.1 11.1 11.9 2.9 2.98 2.988 12 12 1317 Meghalaya 3.4 3.6 2.7 1.694 1.761 1.750 2 2 218 Mizoram 2.3 1.2 1.3 2 2 1.721 1 1 119 Nagaland 0.2 0.2 0.2 3 3 3.130 0.2 0.2 0.220 Orissa 191.3 190.7 210.4 2.351 2.479 2.461 165 173 18921 Punjab 2399.7 2357.8 2411.6 6.321 6.639 6.530 5552 5714 574822 Rajasthan 2791.0 2865.0 2924.0 4.112 4.12 4.214 4200 4308 449723 Sikkim* - - - - - - - - -24 Tamil Nadu 1221.6 1218.4 1220.3 3.914 4.074 4.078 1750 1812 181625 Tripura 2.5 2.9 3.0 1.700 2.000 2.000 2 2 226 Uttar Pradesh 6479.6 6253.9 6426.4 3.971 4.046 4.148 9417 9236 973027 Uttaranchal - 449.3 457.6 - 4.116 4.177 - 675 69829 West Bengal 153.4 151.4 154.0 5.716 5.897 5.179 321 326 29129 A&N Islands 4.2 4.0 4.0 3.05 2.89 3.060 5 4 430 Chandigarh 14.0 12.3 13.3 6.3 6.42 5.980 32 29 2931 D.& N. Haveli* - - - - - - - - -32 Daman & Diu* - - - - - - - - -33 Delhi 105.6 93.3 97.1 5.91 5.8 5.870 228 198 20834 Lakshadweep* - - - - - - - - -35 Pondicherry 1.7 1.1 1.5 4.341 4.179 4.037 3 2 2
Total@ 29159 29371 30386 3.96 4.05 4.09 42268 43428 45402 * Details not available; '-' denotes no production data reported.@ Total of only those States/UTs for which data are availableSource : State/UT Animal Husbandry Departments
22
Estimates of Milkin Milk
(000,tonnes)Production
(000, nos)
No. of Animals Average Yield perAnimal in Milk
(kg/day)

TABLE 18 : DETAILS OF ESTIMATES OF MILK PRODUCTION FROM BUFFALOES -2002-03, 2003-04 & 2004-05- Statewise
S.No.States/UTs
2002-03 2003-04 2004-05 2002-03 2003-04 2004-05 2002-03 2003-04 2004-051 Andhra Pradesh 3912.0 3733 3774 3.196 3.813 3.920 4564 5209 54012 Arunachal Pradesh* - - - - - - - - -3 Assam 146.0 141 145 1.671 1.789 1.765 89 92 934 Bihar 1298.4 1365 1923 3.479 3.651 3.411 1649 1824 23945 Chattisgarh 264.5 266 271 2.782 2.801 2.825 269 272 2806 Goa 18.5 20 21 3.541 3.160 3.096 24 23 247 Gujarat 2690.9 2756 2824 3.968 4.081 4.193 3897 4116 43228 Haryana 1844.8 1874 1968 5.957 5.960 6.140 4011 4089 44119 Himachal Pradesh 319.6 320 345 3.165 3.243 2.694 369 379 339
10 Jammu & Kashmir* - - - - - - - - -11 Jharkhand 137.0 125 234 5.934 6.116 5.593 297 281 47712 Karnataka 1650.9 1453 1475 3.141 2.538 2.500 1893 1350 134613 Kerala 21.4 18 17 6.158 6.212 6.222 48 40 3814 Madhya Pradesh 2360.3 2363 2372 3.332 3.338 3.338 2870 2887 289015 Maharashtra 2200.0 2237 2267 3.558 3.560 3.579 2857 2915 296216 Manipur 11.9 12 13 2.980 3.045 2.893 13 13 1317 Meghalaya 2.7 3 3 1.755 1.765 1.783 2 2 218 Mizoram 1.3 1 1 1.736 1.750 1.767 1 1 119 Nagaland 0.2 2 3 3.090 2.245 2.957 0.20 1 320 Orissa 218.5 214 221 2.401 2.632 2.491 191 206 20121 Punjab 2479.9 2522 2539 6.670 6.651 6.798 6037 6140 630122 Rajasthan 3014.0 3118 3145 4.197 4.293 4.412 4617 4899 506523 Sikkim 0.2 0.2 0.3 2.000 2.000 1.541 0.1 0.1 0.224 Tamil Nadu 976.0 947 924 4.112 4.125 4.202 1465 1429 141725 Tripura 2.5 2 2 2.437 2.501 2.466 2 2 226 Uttar Pradesh 6585.0 6748 6927 4.200 4.256 4.314 10095 10512 1090827 Uttaranchal 458.9 485 493 4.210 4.181 4.111 705 742 74029 West Bengal 154.5 155 154 5.272 5.325 5.216 297 302 29329 A&N Islands 5.0 5 4 2.800 2.980 3.419 5 5 530 Chandigarh 13.3 14 13 6.000 6.000 6.130 29 30 2931 D.& N. Haveli* - - - - - - - - -32 Daman & Diu* - - - - - - - - 0.433 Delhi 96.7 98 100 6.060 6.021 6.038 214 216 22034 Lakshadweep* - - - - - - - - -35 Pondicherry 1.4 1 1 4.570 4.800 5.367 2 2 2
Total@ 30886 30998 32179 4.126 4.241 4.287 46512 47979 50178 * Details not available; '-' denotes no production data reported.@ Total of only those States/UTs for which data are availableSource : State/UT Animal Husbandry Departments
23
Estimates of MilkProduction
(000 tonnes) (000, nos)Animal in Milk
(kg/day)
No. of Animalsin Milk
Average Yield per
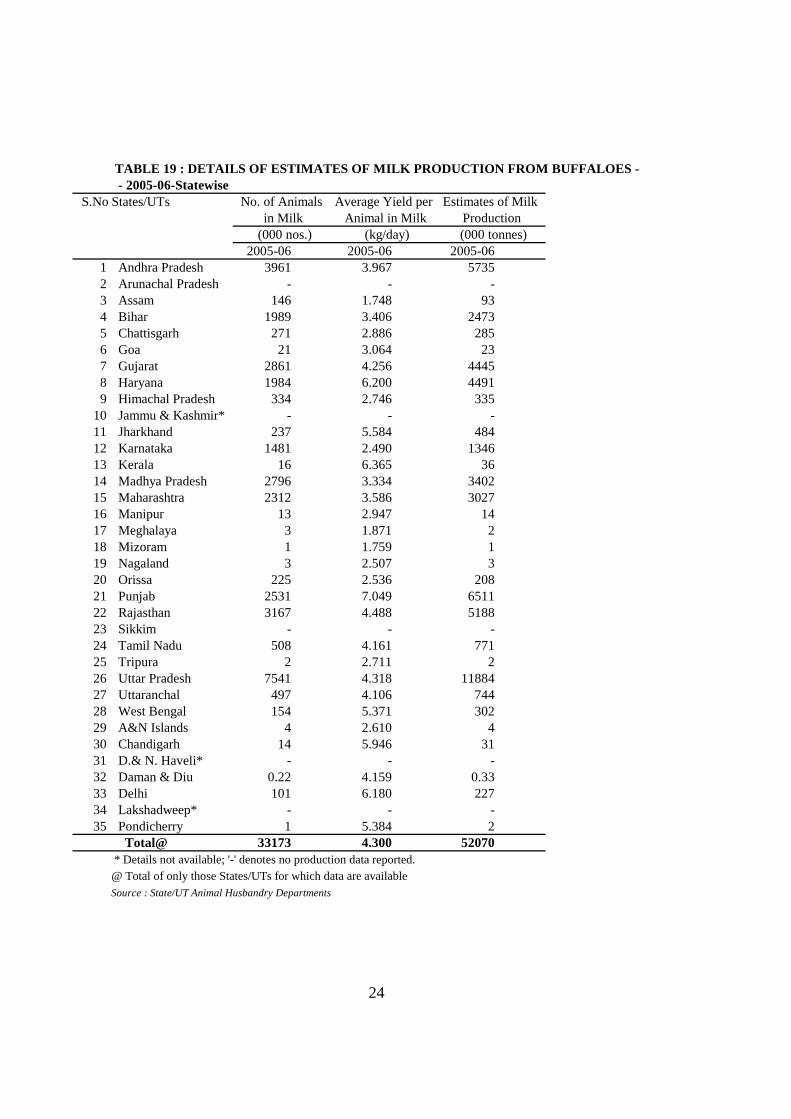
TABLE 19 : DETAILS OF ESTIMATES OF MILK PRODUCTION FROM BUFFALOES - - 2005-06-Statewise
S.No.States/UTs
2005-06 2005-06 2005-061 Andhra Pradesh 3961 3.967 57352 Arunachal Pradesh - - -3 Assam 146 1.748 934 Bihar 1989 3.406 24735 Chattisgarh 271 2.886 2856 Goa 21 3.064 237 Gujarat 2861 4.256 44458 Haryana 1984 6.200 44919 Himachal Pradesh 334 2.746 335
10 Jammu & Kashmir* - - -11 Jharkhand 237 5.584 48412 Karnataka 1481 2.490 134613 Kerala 16 6.365 3614 Madhya Pradesh 2796 3.334 340215 Maharashtra 2312 3.586 302716 Manipur 13 2.947 1417 Meghalaya 3 1.871 218 Mizoram 1 1.759 119 Nagaland 3 2.507 320 Orissa 225 2.536 20821 Punjab 2531 7.049 651122 Rajasthan 3167 4.488 518823 Sikkim - - -24 Tamil Nadu 508 4.161 77125 Tripura 2 2.711 226 Uttar Pradesh 7541 4.318 1188427 Uttaranchal 497 4.106 74428 West Bengal 154 5.371 30229 A&N Islands 4 2.610 430 Chandigarh 14 5.946 3131 D.& N. Haveli* - - -32 Daman & Diu 0.22 4.159 0.3333 Delhi 101 6.180 22734 Lakshadweep* - - -35 Pondicherry 1 5.384 2
Total@ 33173 4.300 52070 * Details not available; '-' denotes no production data reported.@ Total of only those States/UTs for which data are availableSource : State/UT Animal Husbandry Departments
No. of Animals Average Yield per Estimates of Milkin Milk Animal in Milk Production
24
(000 nos.) (kg/day) (000 tonnes)

TABLE 20 : DETAILS OF ESTIMATES OF MILK PRODUCTION FROM GOAT -1999-2000, 2000-01 and 2001-02-Statewise
S.No. States/UTs
1999-2000 2000-01 2001-021999-2000 2000-01 2001-021999-2000 2000-01 2001-021 Andhra Pradesh* - - - - - - - - -2 Arunachal Pradesh* - - - - - - - - -3 Assam 365.0 343.0 324.0 0.189 0.190 0.193 25 24 234 Bihar 9074.2 6016.4 6380.0 0.126 0.127 0.131 418 279 3055 Chattisgarh - 505.9 512.9 0.000 0.377 0.203 - 70 386 Goa* - - - - - - - - -7 Gujarat 1755.1 1753.1 1713.1 0.357 0.355 0.363 229 227 2278 Haryana 353.7 359.7 366.9 0.769 0.778 0.781 100 102 1059 Himachal Pradesh 236.7 221.0 203.5 0.432 0.418 0.429 37 34 32
10 Jammu & Kashmir 379.1 384.6 397.1 0.522 0.536 0.546 72 75 7911 Jharkhand* - - - - - - - - -12 Karnataka 645.0 656.0 1896.1 0.127 0.175 0.072 30 42 5013 Kerala 556.3 560.4 573.5 0.629 0.597 0.560 128 122 11714 Madhya Pradesh 2505.2 2009.3 2062.8 0.412 0.424 0.434 378 311 32715 Maharashtra 3676.0 3708.0 3845.0 0.202 0.205 0.205 272 277 28816 Manipur* - - - - - - - - -17 Meghalaya* - - - - - - - - -18 Mizoram* - - - - - - - - -19 Nagaland 0.7 0.7 0.6 0.500 0.420 0.430 0.1 0.1 0.120 Orissa 76.2 68.1 72.0 0.088 0.092 0.098 2 2 321 Punjab 120.0 120.0 124.0 0.960 0.980 0.990 42 43 4522 Rajasthan 3602.0 3666.0 3886.0 0.553 0.563 0.578 729 753 82023 Sikkim* - - - - - - - - -24 Tamil Nadu* - - - - - - - - -25 Tripura 50.0 100.0 143.4 0.100 0.058 0.018 2 2 126 Uttar Pradesh 3533.6 3589.8 3690.3 0.664 0.678 0.688 859 888 92727 Uttaranchal* - - - - - - - - -29 West Bengal 2665.9 2653.6 2719.9 0.011 0.012 0.111 11 12 11129 A&N Islands 20.7 21.0 22.0 0.430 0.390 0.430 3 3 330 Chandigarh* - - - - - - - - -31 D.& N. Haveli* - - - - - - - - -32 Daman & Diu* - - - - - - - - -33 Delhi* - - - - - - - - -34 Lakshadweep* - - - - - - - - -35 Pondicherry* - - - - - - - - -
Total@ 29615 26737 28933 0.31 0.33 0.33 3337 3266 3501 * Details not available; '-' denotes no production data reported.@ Total of only those States/UTs for which data are availableSource : State/UT Animal Husbandry Departments
25
(000 tonnes) (kg/day)
No. of Animals in Milk
(000 nos)
Estimates of MilkAverage Yield perAnimal in Milk Production
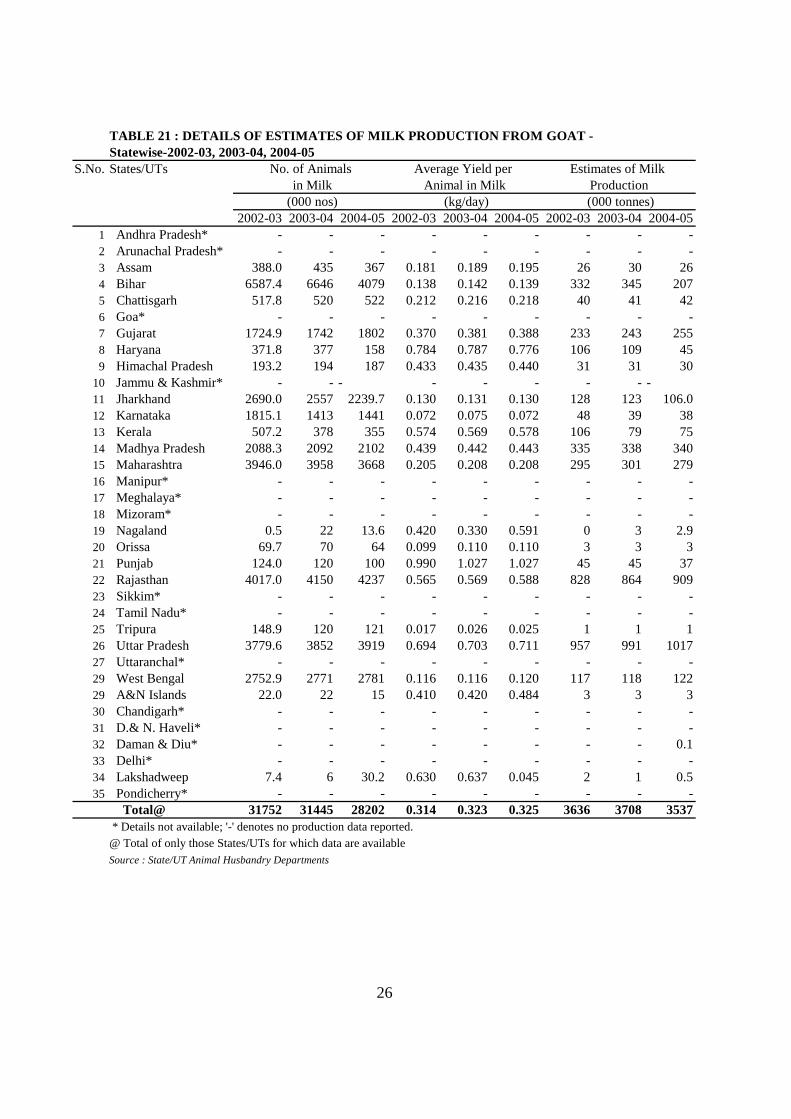
TABLE 21 : DETAILS OF ESTIMATES OF MILK PRODUCTION FROM GOAT -Statewise-2002-03, 2003-04, 2004-05
S.No. States/UTs
2002-03 2003-04 2004-05 2002-03 2003-04 2004-05 2002-03 2003-04 2004-051 Andhra Pradesh* - - - - - - - - -2 Arunachal Pradesh* - - - - - - - - -3 Assam 388.0 435 367 0.181 0.189 0.195 26 30 264 Bihar 6587.4 6646 4079 0.138 0.142 0.139 332 345 2075 Chattisgarh 517.8 520 522 0.212 0.216 0.218 40 41 426 Goa* - - - - - - - - -7 Gujarat 1724.9 1742 1802 0.370 0.381 0.388 233 243 2558 Haryana 371.8 377 158 0.784 0.787 0.776 106 109 459 Himachal Pradesh 193.2 194 187 0.433 0.435 0.440 31 31 30
10 Jammu & Kashmir* - - - - - - - - -11 Jharkhand 2690.0 2557 2239.7 0.130 0.131 0.130 128 123 106.012 Karnataka 1815.1 1413 1441 0.072 0.075 0.072 48 39 3813 Kerala 507.2 378 355 0.574 0.569 0.578 106 79 7514 Madhya Pradesh 2088.3 2092 2102 0.439 0.442 0.443 335 338 34015 Maharashtra 3946.0 3958 3668 0.205 0.208 0.208 295 301 27916 Manipur* - - - - - - - - -17 Meghalaya* - - - - - - - - -18 Mizoram* - - - - - - - - -19 Nagaland 0.5 22 13.6 0.420 0.330 0.591 0 3 2.920 Orissa 69.7 70 64 0.099 0.110 0.110 3 3 321 Punjab 124.0 120 100 0.990 1.027 1.027 45 45 3722 Rajasthan 4017.0 4150 4237 0.565 0.569 0.588 828 864 90923 Sikkim* - - - - - - - - -24 Tamil Nadu* - - - - - - - - -25 Tripura 148.9 120 121 0.017 0.026 0.025 1 1 126 Uttar Pradesh 3779.6 3852 3919 0.694 0.703 0.711 957 991 101727 Uttaranchal* - - - - - - - - -29 West Bengal 2752.9 2771 2781 0.116 0.116 0.120 117 118 12229 A&N Islands 22.0 22 15 0.410 0.420 0.484 3 3 330 Chandigarh* - - - - - - - - -31 D.& N. Haveli* - - - - - - - - -32 Daman & Diu* - - - - - - - - 0.133 Delhi* - - - - - - - - -34 Lakshadweep 7.4 6 30.2 0.630 0.637 0.045 2 1 0.535 Pondicherry* - - - - - - - - -
Total@ 31752 31445 28202 0.314 0.323 0.325 3636 3708 3537 * Details not available; '-' denotes no production data reported.@ Total of only those States/UTs for which data are availableSource : State/UT Animal Husbandry Departments
No. of Animals Average Yield perAnimal in Milk
Estimates of Milk in Milk Production
26
(000 nos) (kg/day) (000 tonnes)
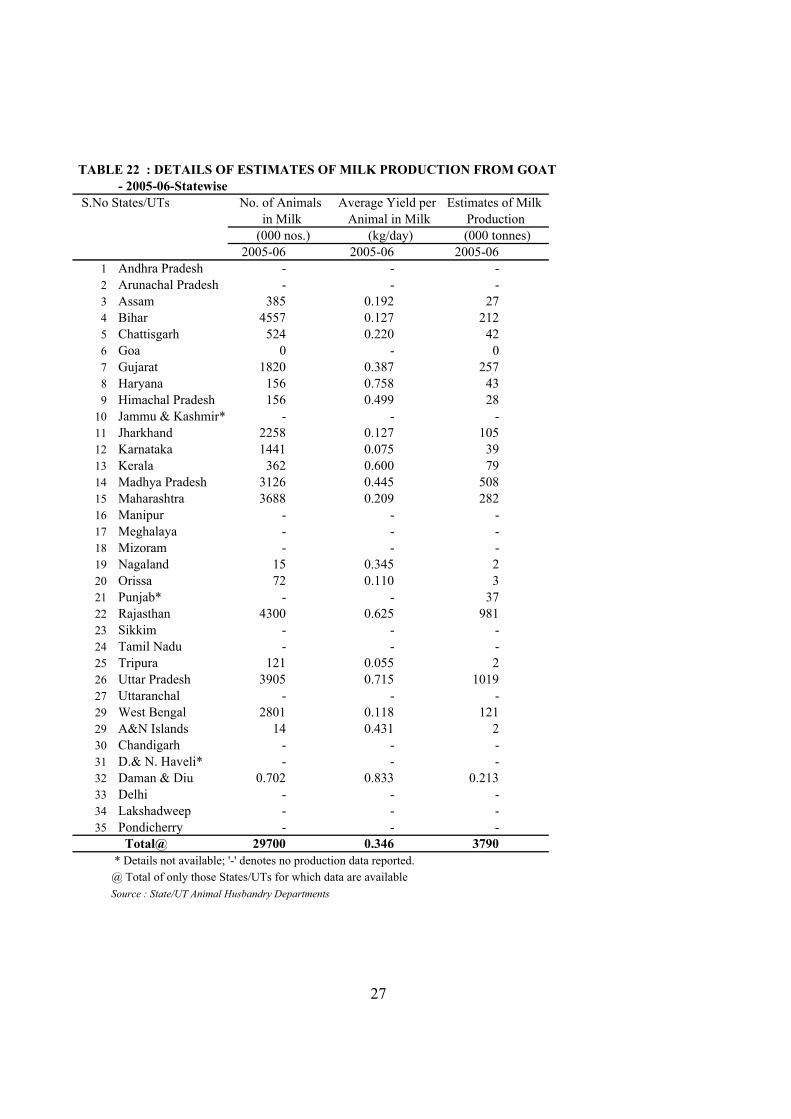
TABLE 22 : DETAILS OF ESTIMATES OF MILK PRODUCTION FROM GOAT - 2005-06-Statewise
S.No States/UTs
2005-06 2005-06 2005-061 Andhra Pradesh - - -2 Arunachal Pradesh - - -3 Assam 385 0.192 274 Bihar 4557 0.127 2125 Chattisgarh 524 0.220 426 Goa 0 - 07 Gujarat 1820 0.387 2578 Haryana 156 0.758 439 Himachal Pradesh 156 0.499 28
10 Jammu & Kashmir* - - -11 Jharkhand 2258 0.127 10512 Karnataka 1441 0.075 3913 Kerala 362 0.600 7914 Madhya Pradesh 3126 0.445 50815 Maharashtra 3688 0.209 28216 Manipur - - -17 Meghalaya - - -18 Mizoram - - -19 Nagaland 15 0.345 220 Orissa 72 0.110 321 Punjab* - - 3722 Rajasthan 4300 0.625 98123 Sikkim - - -24 Tamil Nadu - - -25 Tripura 121 0.055 226 Uttar Pradesh 3905 0.715 101927 Uttaranchal - - -29 West Bengal 2801 0.118 12129 A&N Islands 14 0.431 230 Chandigarh - - -31 D.& N. Haveli* - - -32 Daman & Diu 0.702 0.833 0.21333 Delhi - - -34 Lakshadweep - - -35 Pondicherry - - -
Total@ 29700 0.346 3790 * Details not available; '-' denotes no production data reported.@ Total of only those States/UTs for which data are availableSource : State/UT Animal Husbandry Departments
27
(000 nos.) (kg/day) (000 tonnes)
No. of Animals Average Yield per Estimates of Milk in Milk Animal in Milk Production
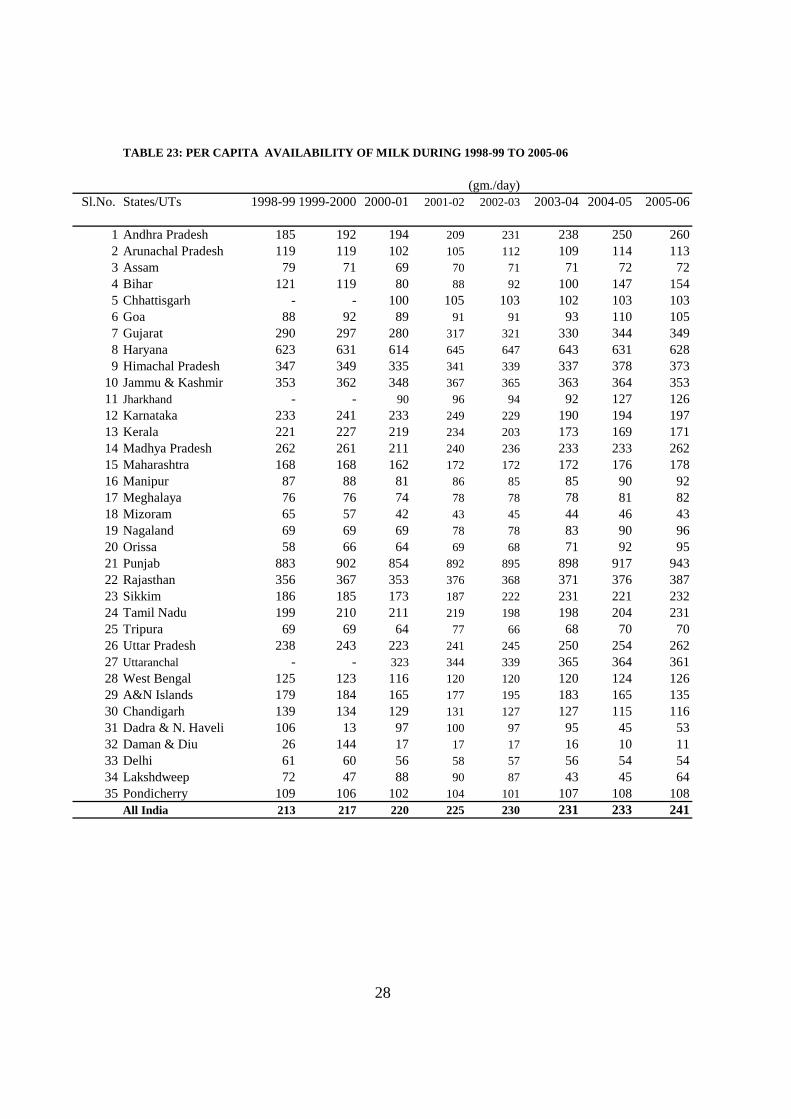
TABLE 23: PER CAPITA AVAILABILITY OF MILK DURING 1998-99 TO 2005-06
(gm./day) Sl.No. States/UTs 1998-99 1999-2000 2000-01 2001-02 2002-03 2003-04 2004-05 2005-06
1 Andhra Pradesh 185 192 194 209 231 238 250 2602 Arunachal Pradesh 119 119 102 105 112 109 114 1133 Assam 79 71 69 70 71 71 72 724 Bihar 121 119 80 88 92 100 147 1545 Chhattisgarh - - 100 105 103 102 103 1036 Goa 88 92 89 91 91 93 110 1057 Gujarat 290 297 280 317 321 330 344 3498 Haryana 623 631 614 645 647 643 631 6289 Himachal Pradesh 347 349 335 341 339 337 378 373
10 Jammu & Kashmir 353 362 348 367 365 363 364 35311 Jharkhand - - 90 96 94 92 127 12612 Karnataka 233 241 233 249 229 190 194 19713 Kerala 221 227 219 234 203 173 169 17114 Madhya Pradesh 262 261 211 240 236 233 233 26215 Maharashtra 168 168 162 172 172 172 176 17816 Manipur 87 88 81 86 85 85 90 9217 Meghalaya 76 76 74 78 78 78 81 8218 Mizoram 65 57 42 43 45 44 46 4319 Nagaland 69 69 69 78 78 83 90 9620 Orissa 58 66 64 69 68 71 92 9521 Punjab 883 902 854 892 895 898 917 94322 Rajasthan 356 367 353 376 368 371 376 38723 Sikkim 186 185 173 187 222 231 221 23224 Tamil Nadu 199 210 211 219 198 198 204 23125 Tripura 69 69 64 77 66 68 70 7026 Uttar Pradesh 238 243 223 241 245 250 254 26227 Uttaranchal - - 323 344 339 365 364 36128 West Bengal 125 123 116 120 120 120 124 12629 A&N Islands 179 184 165 177 195 183 165 13530 Chandigarh 139 134 129 131 127 127 115 11631 Dadra & N. Haveli 106 13 97 100 97 95 45 5332 Daman & Diu 26 144 17 17 17 16 10 1133 Delhi 61 60 56 58 57 56 54 5434 Lakshdweep 72 47 88 90 87 43 45 6435 Pondicherry 109 106 102 104 101 107 108 108
All India 213 217 220 225 230 231 233 241
28

PART II
Egg Production
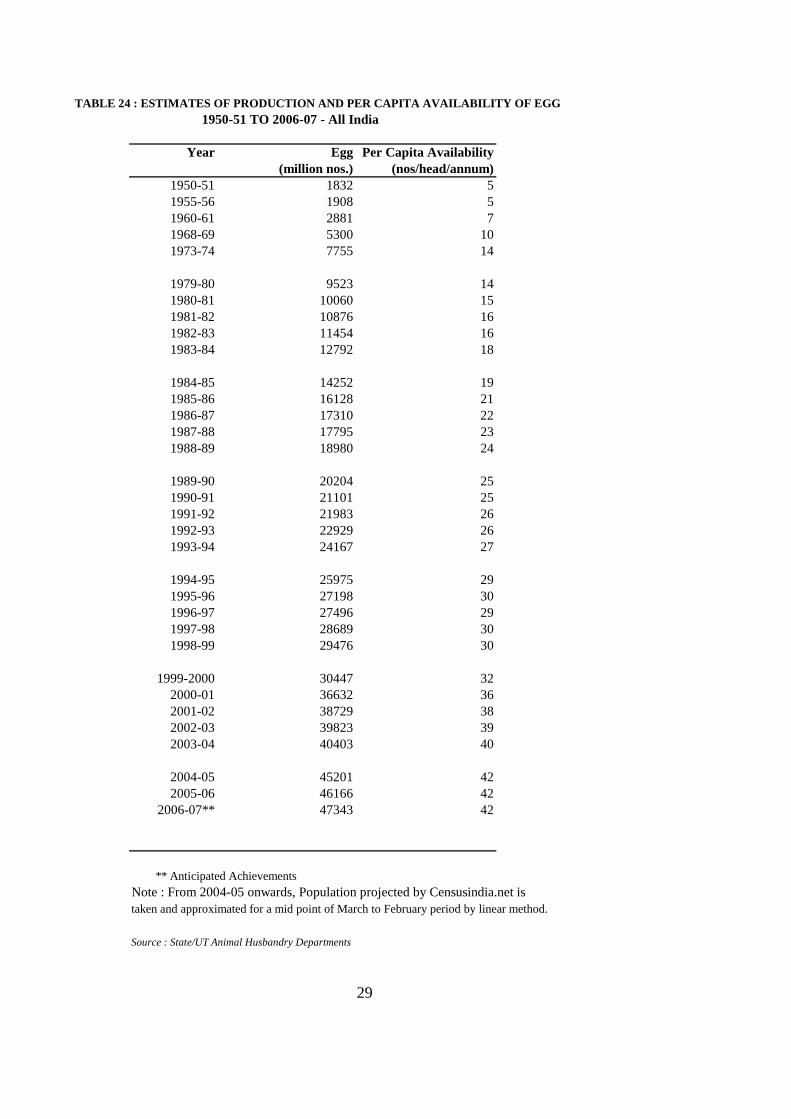
TABLE 24 : ESTIMATES OF PRODUCTION AND PER CAPITA AVAILABILITY OF EGG 1950-51 TO 2006-07 - All India
Year Egg Per Capita Availability (million nos.) (nos/head/annum)
1950-51 1832 51955-56 1908 51960-61 2881 71968-69 5300 101973-74 7755 14
1979-80 9523 141980-81 10060 151981-82 10876 161982-83 11454 161983-84 12792 18
1984-85 14252 191985-86 16128 211986-87 17310 221987-88 17795 231988-89 18980 24
1989-90 20204 251990-91 21101 251991-92 21983 261992-93 22929 261993-94 24167 27
1994-95 25975 291995-96 27198 301996-97 27496 291997-98 28689 301998-99 29476 30
1999-2000 30447 322000-01 36632 362001-02 38729 382002-03 39823 392003-04 40403 40
2004-05 45201 422005-06 46166 42
2006-07** 47343 42
** Anticipated AchievementsNote : From 2004-05 onwards, Population projected by Censusindia.net istaken and approximated for a mid point of March to February period by linear method.
Source : State/UT Animal Husbandry Departments
29
30
0
5
10
15
20
25
30
35
40
45
50
Prod
uctio
n in
biil
lion
num
bers
1999-00 2000-01 2001-02 2002-03 2003-04 2004-05 2005-06
Year
Egg Production India

(lakh nos.) S.No.States/UTs 1997-98 1998-99 1999-00 2000-01 2001-02 2002-03 2003-04 2004-05 2005-06
1 Andhra Pradesh 57516 59248 63450 118000 133151 148622 149928 158040 1645342 Arunachal Pradesh 279 326 84 85 86 86 88 90 733 Assam 4828 4864 4892 5061 5067 5095 5138 5216 53594 Bihar 14200 14304 14393 7177 7416 7370 7402 7894 100125 Chhattisgarh - - - 7326 7704 7790 8091 8795 88756 Goa 1049 1066 1117 1273 1145 1151 1145 146 1467 Gujarat 4884 4671 4785 3460 3701 3848 4443 5031 57758 Haryana 6615 6827 7563 10855 10855 12509 12802 14816 151259 Himachal Pradesh 750 775 801 816 823 828 840 811 753
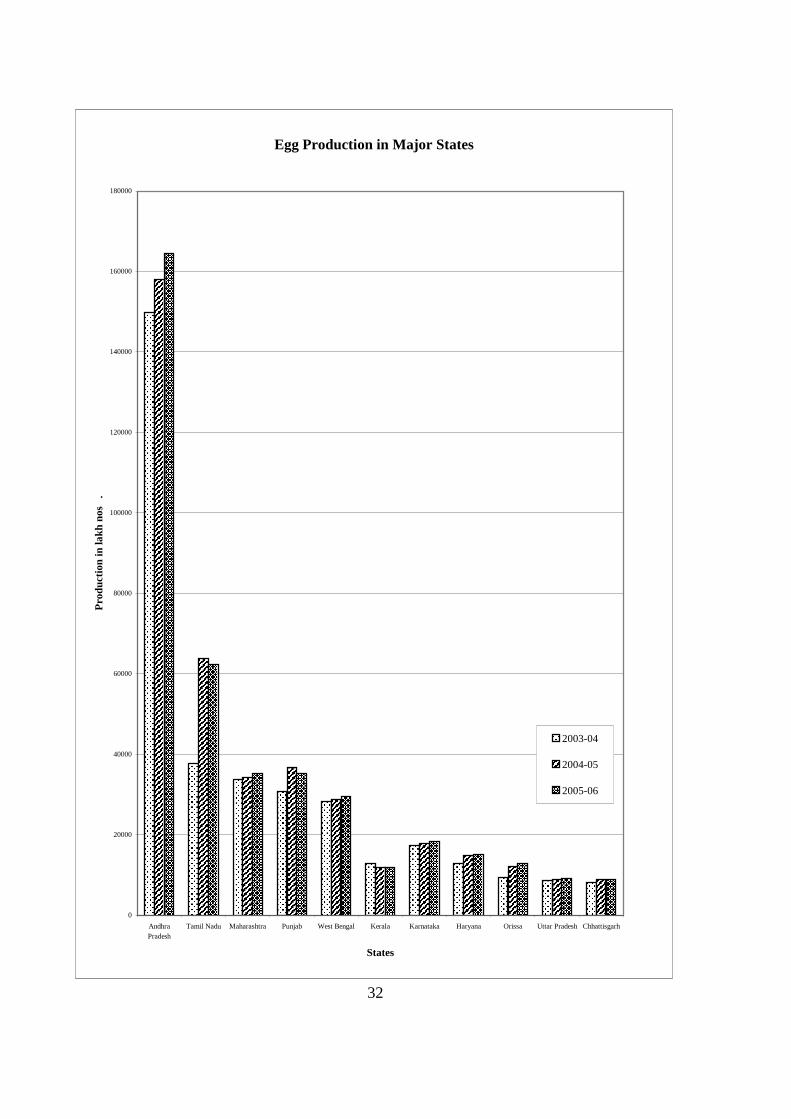
10 Jammu & Kashmir 5182 5200 5593 5689 6065 6220 6370 6105 632011 Jharkhand - - - 5500 6150 6619 6445 6980 697012 Karnataka 18124 19380 19918 19917 20274 19927 17277 17719 1834813 Kerala 20333 20440 20544 20344 20016 13468 12778 11974 1195614 Madhya Pradesh 13472 14001 12538 7022 6107 7844 8962 9023 941415 Maharashtra 27663 29377 30619 30985 31942 32950 33755 34362 3522716 Manipur 616 645 683 695 717 736 794 822 83517 Meghalaya 814 825 847 874 902 943 936 946 97318 Mizoram 281 334 433 279 289 304 307 317 32619 Nagaland 460 480 522 553 540 681 682 755 86820 Orissa 7300 7628 6447 7297 8372 9096 9311 12160 1278721 Punjab 29103 26300 27819 29640 29613 31306 30681 36800 3520022 Rajasthan 5034 5344 5539 5715 6022 6359 6722 6932 702923 Sikkim 170 160 90 95 97 103 129 140 14624 Tamil Nadu 32168 35886 38454 39294 42242 36222 37836 63948 6222525 Tripura 980 1080 1050 1053 607 995 1005 1071 110026 Uttar Pradesh 7224 7665 8016 8116 8056 7476 8740 9018 922827 Uttaranchal - - - 893 894 909 1842 1866 187328 West Bengal 26341 26532 26713 26920 27101 27490 28204 28877 2963729 A&N Islands 414 527 549 566 562 568 600 530 47730 Chandigarh 204 173 204 173 171 218 249 280 28031 D.& N. Haveli 30 45 27 30 18 16 15 50 4832 Daman & Diu 30 40 35 32 34 38 40 9 1133 Delhi 686 463 551 415 372 263 264 264 19634 Lakshadweep 63 60 65 79 82 85 110 120 12435 Pondicherry 86 90 93 94 95 93 100 102 105
Total 286897 294756 304473 366323 387288 398228 404031 452009 462307
'-' NA.Source : State/UT Animal Husbandry Departments
TABLE 25: ESTIMATES OF EGG PRODUCTION - 1997-98 TO 2005-06-Statewise
31
32
Egg Production in Major States
0
20000
40000
60000
80000
100000
120000
140000
160000
180000
AndhraPradesh
Tamil Nadu Maharashtra Punjab West Bengal Kerala Karnataka Haryana Orissa Uttar Pradesh Chhattisgarh
States
Prod
uctio
n in
lakh
nos
.
2003-04
2004-05
2005-06
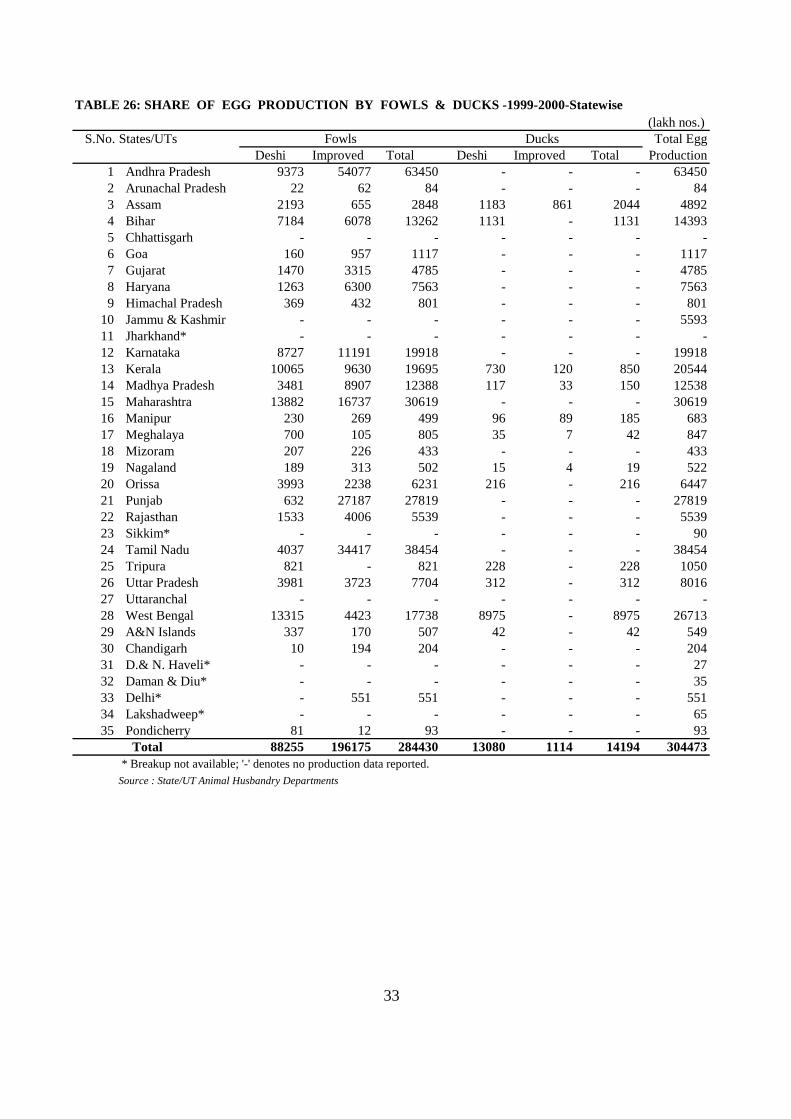
TABLE 26: SHARE OF EGG PRODUCTION BY FOWLS & DUCKS -1999-2000-Statewise (lakh nos.)
S.No. States/UTs Total Egg Deshi Improved Total Deshi Improved Total Production
1 Andhra Pradesh 9373 54077 63450 - - - 634502 Arunachal Pradesh 22 62 84 - - - 843 Assam 2193 655 2848 1183 861 2044 48924 Bihar 7184 6078 13262 1131 - 1131 143935 Chhattisgarh - - - - - - -6 Goa 160 957 1117 - - - 11177 Gujarat 1470 3315 4785 - - - 47858 Haryana 1263 6300 7563 - - - 75639 Himachal Pradesh 369 432 801 - - - 801
10 Jammu & Kashmir - - - - - - 559311 Jharkhand* - - - - - - -12 Karnataka 8727 11191 19918 - - - 1991813 Kerala 10065 9630 19695 730 120 850 2054414 Madhya Pradesh 3481 8907 12388 117 33 150 1253815 Maharashtra 13882 16737 30619 - - - 3061916 Manipur 230 269 499 96 89 185 68317 Meghalaya 700 105 805 35 7 42 84718 Mizoram 207 226 433 - - - 43319 Nagaland 189 313 502 15 4 19 52220 Orissa 3993 2238 6231 216 - 216 644721 Punjab 632 27187 27819 - - - 2781922 Rajasthan 1533 4006 5539 - - - 553923 Sikkim* - - - - - - 9024 Tamil Nadu 4037 34417 38454 - - - 3845425 Tripura 821 - 821 228 - 228 105026 Uttar Pradesh 3981 3723 7704 312 - 312 801627 Uttaranchal - - - - - - -28 West Bengal 13315 4423 17738 8975 - 8975 2671329 A&N Islands 337 170 507 42 - 42 54930 Chandigarh 10 194 204 - - - 20431 D.& N. Haveli* - - - - - - 2732 Daman & Diu* - - - - - - 3533 Delhi* - 551 551 - - - 55134 Lakshadweep* - - - - - - 6535 Pondicherry 81 12 93 - - - 93
Total 88255 196175 284430 13080 1114 14194 304473 * Breakup not available; '-' denotes no production data reported.Source : State/UT Animal Husbandry Departments
Fowls Ducks
33
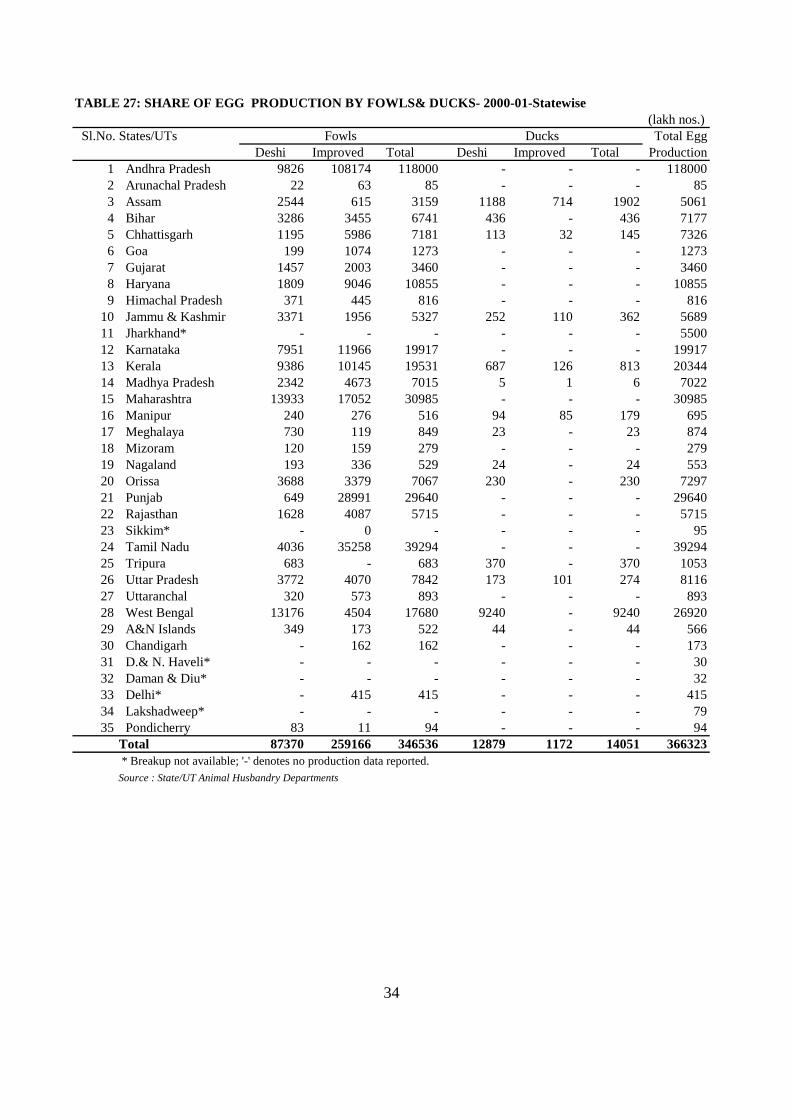
TABLE 27: SHARE OF EGG PRODUCTION BY FOWLS& DUCKS- 2000-01-Statewise (lakh nos.)
Sl.No. States/UTs Total Egg Deshi Improved Total Deshi Improved Total Production
1 Andhra Pradesh 9826 108174 118000 - - - 1180002 Arunachal Pradesh 22 63 85 - - - 853 Assam 2544 615 3159 1188 714 1902 50614 Bihar 3286 3455 6741 436 - 436 71775 Chhattisgarh 1195 5986 7181 113 32 145 73266 Goa 199 1074 1273 - - - 12737 Gujarat 1457 2003 3460 - - - 34608 Haryana 1809 9046 10855 - - - 108559 Himachal Pradesh 371 445 816 - - - 816
10 Jammu & Kashmir 3371 1956 5327 252 110 362 568911 Jharkhand* - - - - - - 550012 Karnataka 7951 11966 19917 - - - 1991713 Kerala 9386 10145 19531 687 126 813 2034414 Madhya Pradesh 2342 4673 7015 5 1 6 702215 Maharashtra 13933 17052 30985 - - - 3098516 Manipur 240 276 516 94 85 179 69517 Meghalaya 730 119 849 23 - 23 87418 Mizoram 120 159 279 - - - 27919 Nagaland 193 336 529 24 - 24 55320 Orissa 3688 3379 7067 230 - 230 729721 Punjab 649 28991 29640 - - - 2964022 Rajasthan 1628 4087 5715 - - - 571523 Sikkim* - 0 - - - - 9524 Tamil Nadu 4036 35258 39294 - - - 3929425 Tripura 683 - 683 370 - 370 105326 Uttar Pradesh 3772 4070 7842 173 101 274 811627 Uttaranchal 320 573 893 - - - 89328 West Bengal 13176 4504 17680 9240 - 9240 2692029 A&N Islands 349 173 522 44 - 44 56630 Chandigarh - 162 162 - - - 17331 D.& N. Haveli* - - - - - - 3032 Daman & Diu* - - - - - - 3233 Delhi* - 415 415 - - - 41534 Lakshadweep* - - - - - - 7935 Pondicherry 83 11 94 - - - 94
Total 87370 259166 346536 12879 1172 14051 366323 * Breakup not available; '-' denotes no production data reported.Source : State/UT Animal Husbandry Departments
DucksFowls
34

TABLE 28: SHARE OF EGG PRODUCTION BY FOWLS& DUCKS- 2001-02-Statewise (lakh nos.)
Sl.No. States/UTs Total Egg Deshi Improved Total Deshi Improved Total Production
1 Andhra Pradesh 9556 123595 133151 - - - 1331512 Arunachal Pradesh 22 64 86 - - - 863 Assam 2419 650 3069 1257 741 1998 50674 Bihar 3249 3716 6965 451 - 451 74165 Chhattisgarh 1299 6257 7556 114 34 148 77046 Goa 165 980 1145 - - - 11457 Gujarat 1277 2424 3701 - - - 37018 Haryana 1809 9046 10855 - - - 108559 Himachal Pradesh 408 415 823 - - - 823
10 Jammu & Kashmir 3623 2102 5725 223 117 340 606511 Jharkhand* - - - - - - 615012 Karnataka 8181 12093 20274 - - - 2027413 Kerala 9801 9442 19243 660 113 773 2001614 Madhya Pradesh 2432 3669 6101 5 1 6 610715 Maharashtra 14318 17624 31942 - - - 3194216 Manipur 253 280 533 97 87 184 71717 Meghalaya 771 131 902 - - - 90218 Mizoram 125 164 289 - - - 28919 Nagaland 156 302 458 9 73 82 54020 Orissa 3774 4598 8372 - - - 837221 Punjab 543 29070 29613 - - - 2961322 Rajasthan 1737 4285 6022 - - - 602223 Sikkim* - - - - - - 9724 Tamil Nadu 4035 38207 42242 - - - 4224225 Tripura 607 - 607 243 - 243 60726 Uttar Pradesh 3945 3834 7779 173 104 277 805627 Uttaranchal 341 553 894 - - - 89428 West Bengal 13561 4320 17881 9220 - 9220 2710129 A&N Islands 350 175 525 37 - 37 56230 Chandigarh 11 160 171 - - - 17131 D.& N. Haveli* - - - - - - 1832 Daman & Diu* - - - - - - 3433 Delhi* - 372 372 - - - 37234 Lakshadweep* - - - - - - 8235 Pondicherry 84 11 95 - - - 95
Total 88852 278539 367391 12489 1270 13759 387288 * Breakup not available; '-' denotes no production data reported.The increase in egg production is due to data reporting from commercial poultry farms.
Source : State/UT Animal Husbandry Departments
DucksFowls
35
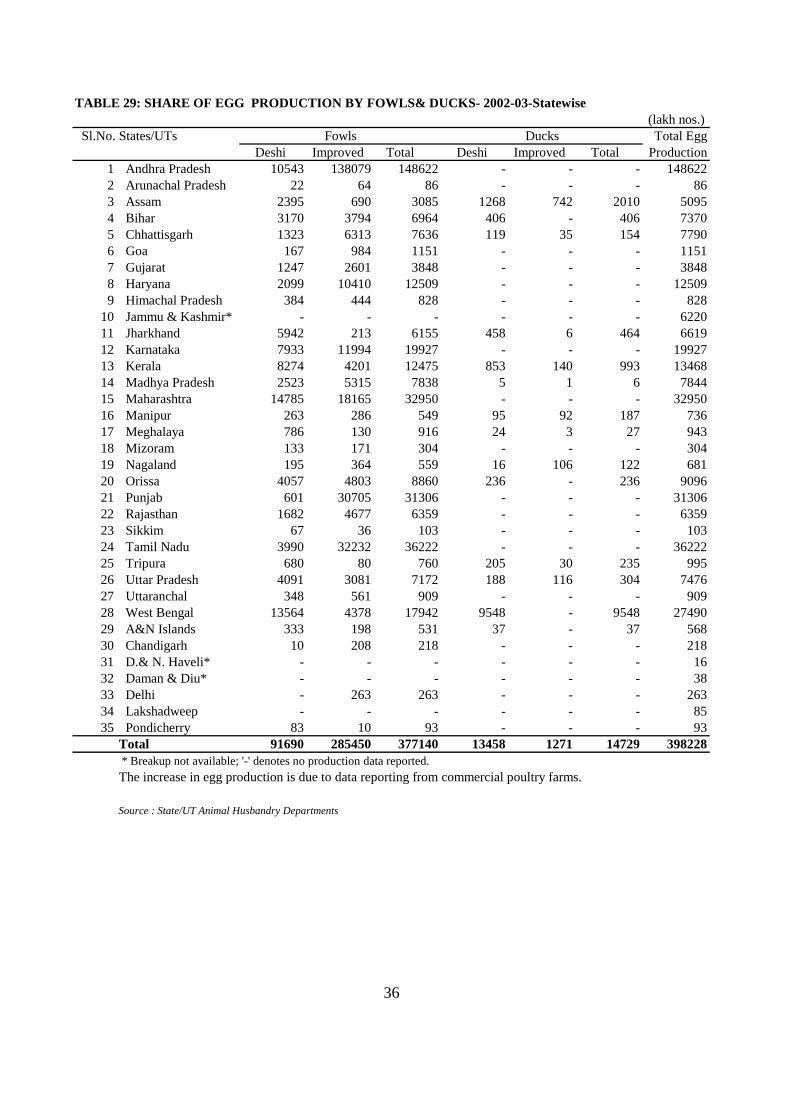
TABLE 29: SHARE OF EGG PRODUCTION BY FOWLS& DUCKS- 2002-03-Statewise (lakh nos.)
Sl.No. States/UTs Total Egg Deshi Improved Total Deshi Improved Total Production
1 Andhra Pradesh 10543 138079 148622 - - - 1486222 Arunachal Pradesh 22 64 86 - - - 863 Assam 2395 690 3085 1268 742 2010 50954 Bihar 3170 3794 6964 406 - 406 73705 Chhattisgarh 1323 6313 7636 119 35 154 77906 Goa 167 984 1151 - - - 11517 Gujarat 1247 2601 3848 - - - 38488 Haryana 2099 10410 12509 - - - 125099 Himachal Pradesh 384 444 828 - - - 828
10 Jammu & Kashmir* - - - - - - 622011 Jharkhand 5942 213 6155 458 6 464 661912 Karnataka 7933 11994 19927 - - - 1992713 Kerala 8274 4201 12475 853 140 993 1346814 Madhya Pradesh 2523 5315 7838 5 1 6 784415 Maharashtra 14785 18165 32950 - - - 3295016 Manipur 263 286 549 95 92 187 73617 Meghalaya 786 130 916 24 3 27 94318 Mizoram 133 171 304 - - - 30419 Nagaland 195 364 559 16 106 122 68120 Orissa 4057 4803 8860 236 - 236 909621 Punjab 601 30705 31306 - - - 3130622 Rajasthan 1682 4677 6359 - - - 635923 Sikkim 67 36 103 - - - 10324 Tamil Nadu 3990 32232 36222 - - - 3622225 Tripura 680 80 760 205 30 235 99526 Uttar Pradesh 4091 3081 7172 188 116 304 747627 Uttaranchal 348 561 909 - - - 90928 West Bengal 13564 4378 17942 9548 - 9548 2749029 A&N Islands 333 198 531 37 - 37 56830 Chandigarh 10 208 218 - - - 21831 D.& N. Haveli* - - - - - - 1632 Daman & Diu* - - - - - - 3833 Delhi - 263 263 - - - 26334 Lakshadweep - - - - - - 8535 Pondicherry 83 10 93 - - - 93
Total 91690 285450 377140 13458 1271 14729 398228 * Breakup not available; '-' denotes no production data reported.The increase in egg production is due to data reporting from commercial poultry farms.
Source : State/UT Animal Husbandry Departments
Fowls Ducks
36
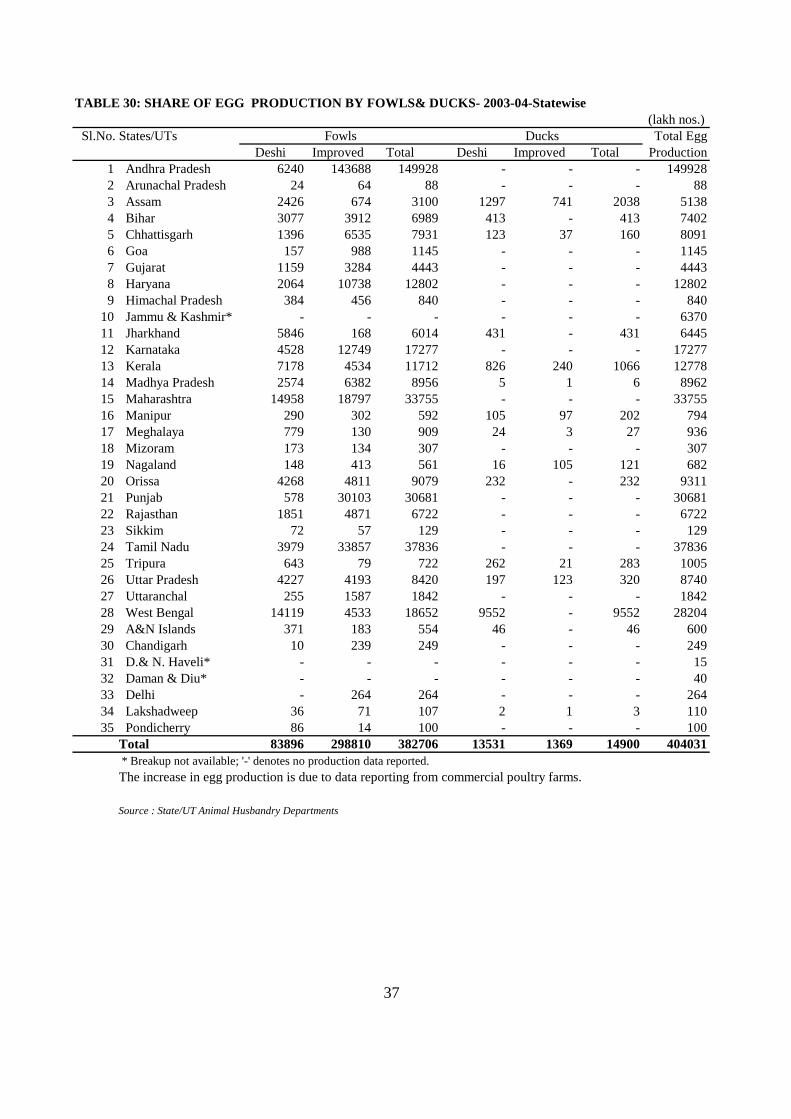
TABLE 30: SHARE OF EGG PRODUCTION BY FOWLS& DUCKS- 2003-04-Statewise (lakh nos.)
Sl.No. States/UTs Total Egg Deshi Improved Total Deshi Improved Total Production
1 Andhra Pradesh 6240 143688 149928 - - - 1499282 Arunachal Pradesh 24 64 88 - - - 883 Assam 2426 674 3100 1297 741 2038 51384 Bihar 3077 3912 6989 413 - 413 74025 Chhattisgarh 1396 6535 7931 123 37 160 80916 Goa 157 988 1145 - - - 11457 Gujarat 1159 3284 4443 - - - 44438 Haryana 2064 10738 12802 - - - 128029 Himachal Pradesh 384 456 840 - - - 840
10 Jammu & Kashmir* - - - - - - 637011 Jharkhand 5846 168 6014 431 - 431 644512 Karnataka 4528 12749 17277 - - - 1727713 Kerala 7178 4534 11712 826 240 1066 1277814 Madhya Pradesh 2574 6382 8956 5 1 6 896215 Maharashtra 14958 18797 33755 - - - 3375516 Manipur 290 302 592 105 97 202 79417 Meghalaya 779 130 909 24 3 27 93618 Mizoram 173 134 307 - - - 30719 Nagaland 148 413 561 16 105 121 68220 Orissa 4268 4811 9079 232 - 232 931121 Punjab 578 30103 30681 - - - 3068122 Rajasthan 1851 4871 6722 - - - 672223 Sikkim 72 57 129 - - - 12924 Tamil Nadu 3979 33857 37836 - - - 3783625 Tripura 643 79 722 262 21 283 100526 Uttar Pradesh 4227 4193 8420 197 123 320 874027 Uttaranchal 255 1587 1842 - - - 184228 West Bengal 14119 4533 18652 9552 - 9552 2820429 A&N Islands 371 183 554 46 - 46 60030 Chandigarh 10 239 249 - - - 24931 D.& N. Haveli* - - - - - - 1532 Daman & Diu* - - - - - - 4033 Delhi - 264 264 - - - 26434 Lakshadweep 36 71 107 2 1 3 11035 Pondicherry 86 14 100 - - - 100
Total 83896 298810 382706 13531 1369 14900 404031 * Breakup not available; '-' denotes no production data reported.The increase in egg production is due to data reporting from commercial poultry farms.
Source : State/UT Animal Husbandry Departments
Fowls Ducks
37
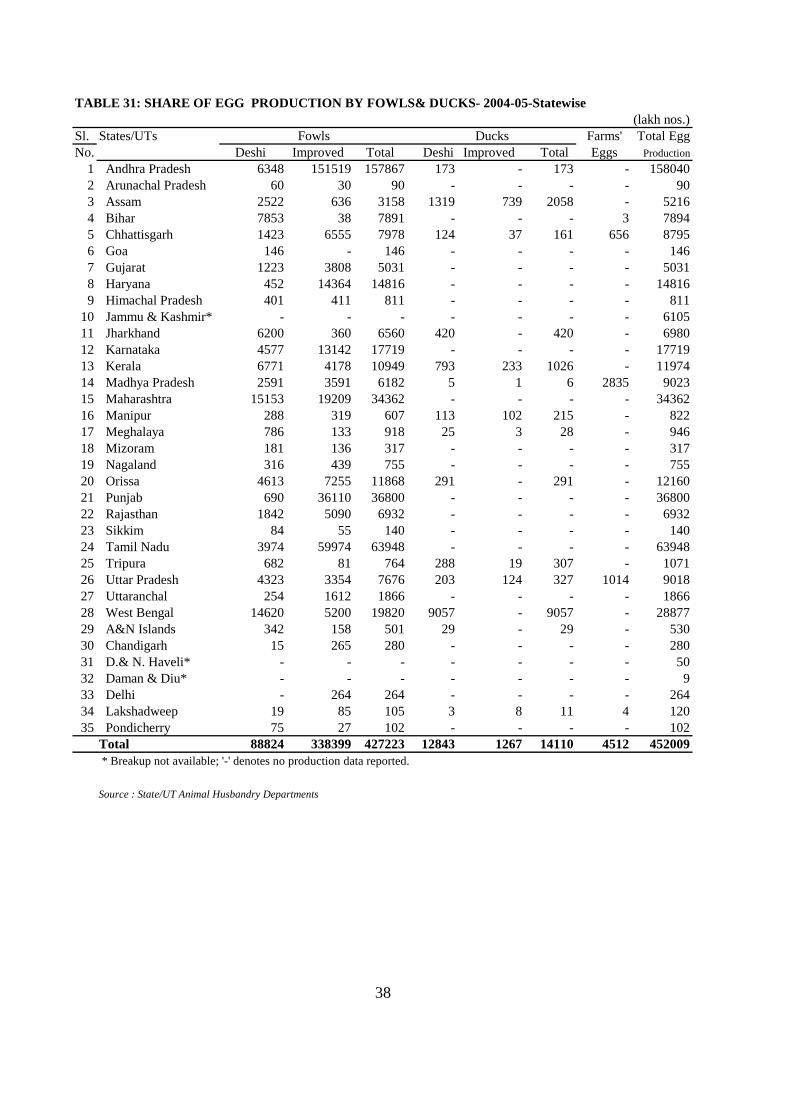
TABLE 31: SHARE OF EGG PRODUCTION BY FOWLS& DUCKS- 2004-05-Statewise (lakh nos.)
Sl. States/UTs Farms' Total EggNo. Deshi Improved Total Deshi Improved Total Eggs Production
1 Andhra Pradesh 6348 151519 157867 173 - 173 - 1580402 Arunachal Pradesh 60 30 90 - - - - 903 Assam 2522 636 3158 1319 739 2058 - 52164 Bihar 7853 38 7891 - - - 3 78945 Chhattisgarh 1423 6555 7978 124 37 161 656 87956 Goa 146 - 146 - - - - 1467 Gujarat 1223 3808 5031 - - - - 50318 Haryana 452 14364 14816 - - - - 148169 Himachal Pradesh 401 411 811 - - - - 811
10 Jammu & Kashmir* - - - - - - - 610511 Jharkhand 6200 360 6560 420 - 420 - 698012 Karnataka 4577 13142 17719 - - - - 1771913 Kerala 6771 4178 10949 793 233 1026 - 1197414 Madhya Pradesh 2591 3591 6182 5 1 6 2835 902315 Maharashtra 15153 19209 34362 - - - - 3436216 Manipur 288 319 607 113 102 215 - 82217 Meghalaya 786 133 918 25 3 28 - 94618 Mizoram 181 136 317 - - - - 31719 Nagaland 316 439 755 - - - - 75520 Orissa 4613 7255 11868 291 - 291 - 1216021 Punjab 690 36110 36800 - - - - 3680022 Rajasthan 1842 5090 6932 - - - - 693223 Sikkim 84 55 140 - - - - 14024 Tamil Nadu 3974 59974 63948 - - - - 6394825 Tripura 682 81 764 288 19 307 - 107126 Uttar Pradesh 4323 3354 7676 203 124 327 1014 901827 Uttaranchal 254 1612 1866 - - - - 186628 West Bengal 14620 5200 19820 9057 - 9057 - 2887729 A&N Islands 342 158 501 29 - 29 - 53030 Chandigarh 15 265 280 - - - - 28031 D.& N. Haveli* - - - - - - - 5032 Daman & Diu* - - - - - - - 933 Delhi - 264 264 - - - - 26434 Lakshadweep 19 85 105 3 8 11 4 12035 Pondicherry 75 27 102 - - - - 102
Total 88824 338399 427223 12843 1267 14110 4512 452009 * Breakup not available; '-' denotes no production data reported.
Source : State/UT Animal Husbandry Departments
38
Fowls Ducks

TABLE 32: SHARE OF EGG PRODUCTION BY FOWLS& DUCKS- 2005-06-Statewise (lakh nos.)
Sl.No. States/UTs Farms' Total Egg Deshi Improved Total Deshi Improved Total Eggs Production
1 Andhra Pradesh 6651 157883 164534 - - - - 1645342 Arunachal Pradesh* - - - - - - - 733 Assam 2764 645 3408 1281 670 1951 - 53594 Bihar 7926 2083 10009 - - - 3 100125 Chhattisgarh 1444 6614 8057 125 37 162 656 88756 Goa 146 0 146 - - - - 1467 Gujarat 1296 4479 5775 - - - - 57758 Haryana 444 14682 15125 - - - - 151259 Himachal Pradesh 326 427 753 - - - - 753
10 Jammu & Kashmir* 0 0 - - - - - 632011 Jharkhand 6180 370 6550 420 - 420 - 697012 Karnataka 4750 13598 18348 - - - - 1834813 Kerala 6749 4173 10922 802 232 1034 - 1195614 Madhya Pradesh 2741 3546 6287 16 6 22 3105 941415 Maharashtra 15387 19840 35227 - - - - 3522716 Manipur 261 356 617 107 111 218 - 83517 Meghalaya 810 134 944 25 3 29 - 97318 Mizoram 186 140 326 - - - - 32619 Nagaland 363 505 868 - - - - 86820 Orissa 5316 7273 12589 199 - 199 - 1278721 Punjab 660 34540 35200 - - - - 3520022 Rajasthan 1776 5253 7029 - - - - 702923 Sikkim 83 62 146 - - - - 14624 Tamil Nadu 3795 58431 62225 - - - - 6222525 Tripura 714 79 793 285 22 307 - 110026 Uttar Pradesh 4129 3760 7890 207 99 306 1032 922827 Uttaranchal 251 1622 1873 - - - - 187328 West Bengal 15292 4505 19797 9840 - 9840 - 2963729 A&N Islands 304 148 452 25 - 25 - 47730 Chandigarh 15 265 280 - - - - 28031 D.& N. Haveli* - - - - - - - 4832 Daman & Diu* 10 - 10 0.01 - 0.01 - 1133 Delhi - 196 196 - - - - 19634 Lakshadweep* - - - - - - - 12435 Pondicherry 66 39 105 - - - - 105
Total 90835 345647 436482 13333 1180 14512 4796 462307 * Breakup not available; '-' denotes no production data reported.The increase in egg production is due to data reporting from commercial poultry farms.
Source : State/UT Animal Husbandry Departments
Fowls Ducks
39
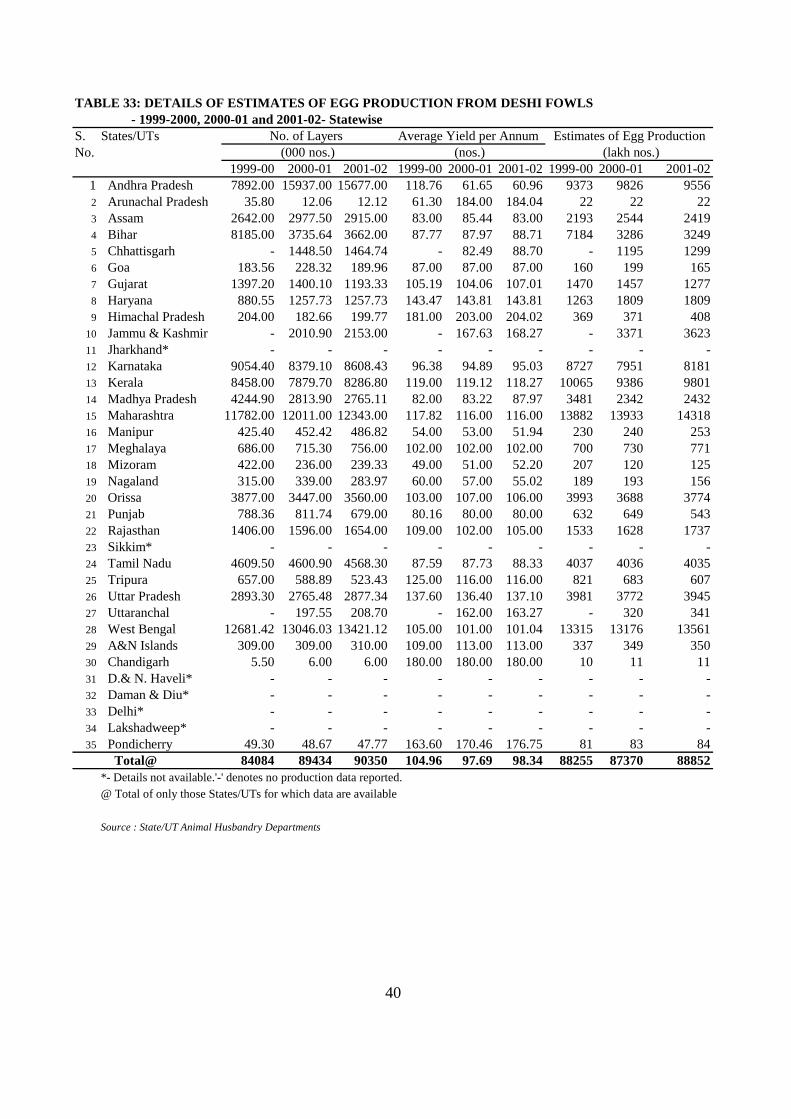
TABLE 33: DETAILS OF ESTIMATES OF EGG PRODUCTION FROM DESHI FOWLS - 1999-2000, 2000-01 and 2001-02- Statewise
S. States/UTsNo.
1999-00 2000-01 2001-02 1999-00 2000-01 2001-02 1999-00 2000-01 2001-021 Andhra Pradesh 7892.00 15937.00 15677.00 118.76 61.65 60.96 9373 9826 95562 Arunachal Pradesh 35.80 12.06 12.12 61.30 184.00 184.04 22 22 223 Assam 2642.00 2977.50 2915.00 83.00 85.44 83.00 2193 2544 24194 Bihar 8185.00 3735.64 3662.00 87.77 87.97 88.71 7184 3286 32495 Chhattisgarh - 1448.50 1464.74 - 82.49 88.70 - 1195 12996 Goa 183.56 228.32 189.96 87.00 87.00 87.00 160 199 1657 Gujarat 1397.20 1400.10 1193.33 105.19 104.06 107.01 1470 1457 12778 Haryana 880.55 1257.73 1257.73 143.47 143.81 143.81 1263 1809 18099 Himachal Pradesh 204.00 182.66 199.77 181.00 203.00 204.02 369 371 408
10 Jammu & Kashmir - 2010.90 2153.00 - 167.63 168.27 - 3371 362311 Jharkhand* - - - - - - - - -12 Karnataka 9054.40 8379.10 8608.43 96.38 94.89 95.03 8727 7951 818113 Kerala 8458.00 7879.70 8286.80 119.00 119.12 118.27 10065 9386 980114 Madhya Pradesh 4244.90 2813.90 2765.11 82.00 83.22 87.97 3481 2342 243215 Maharashtra 11782.00 12011.00 12343.00 117.82 116.00 116.00 13882 13933 1431816 Manipur 425.40 452.42 486.82 54.00 53.00 51.94 230 240 25317 Meghalaya 686.00 715.30 756.00 102.00 102.00 102.00 700 730 77118 Mizoram 422.00 236.00 239.33 49.00 51.00 52.20 207 120 12519 Nagaland 315.00 339.00 283.97 60.00 57.00 55.02 189 193 15620 Orissa 3877.00 3447.00 3560.00 103.00 107.00 106.00 3993 3688 377421 Punjab 788.36 811.74 679.00 80.16 80.00 80.00 632 649 54322 Rajasthan 1406.00 1596.00 1654.00 109.00 102.00 105.00 1533 1628 173723 Sikkim* - - - - - - - - -24 Tamil Nadu 4609.50 4600.90 4568.30 87.59 87.73 88.33 4037 4036 403525 Tripura 657.00 588.89 523.43 125.00 116.00 116.00 821 683 60726 Uttar Pradesh 2893.30 2765.48 2877.34 137.60 136.40 137.10 3981 3772 394527 Uttaranchal - 197.55 208.70 - 162.00 163.27 - 320 34128 West Bengal 12681.42 13046.03 13421.12 105.00 101.00 101.04 13315 13176 1356129 A&N Islands 309.00 309.00 310.00 109.00 113.00 113.00 337 349 35030 Chandigarh 5.50 6.00 6.00 180.00 180.00 180.00 10 11 1131 D.& N. Haveli* - - - - - - - - -32 Daman & Diu* - - - - - - - - -33 Delhi* - - - - - - - - -34 Lakshadweep* - - - - - - - - -35 Pondicherry 49.30 48.67 47.77 163.60 170.46 176.75 81 83 84
Total@ 84084 89434 90350 104.96 97.69 98.34 88255 87370 88852*- Details not available.'-' denotes no production data reported.@ Total of only those States/UTs for which data are available
Source : State/UT Animal Husbandry Departments
40
No. of Layers Average Yield per Annum Estimates of Egg Production (lakh nos.) (nos.) (000 nos.)
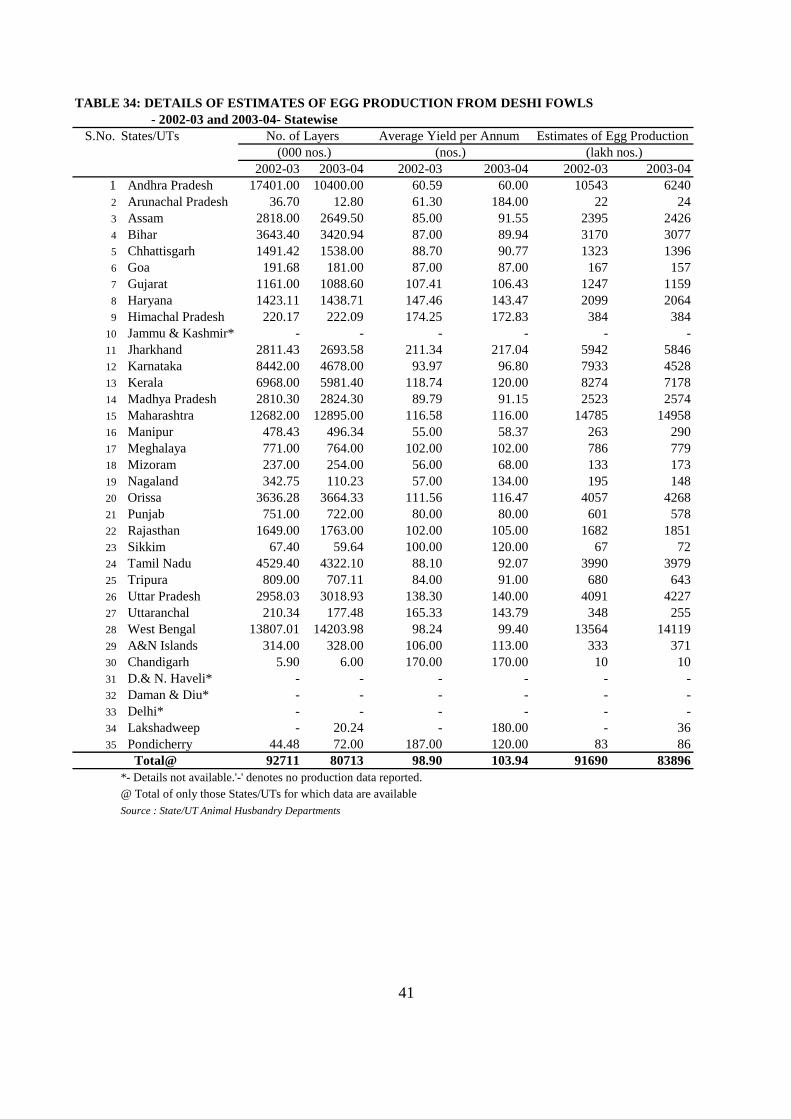
TABLE 34: DETAILS OF ESTIMATES OF EGG PRODUCTION FROM DESHI FOWLS - 2002-03 and 2003-04- Statewise
S.No. States/UTs
2002-03 2003-04 2002-03 2003-04 2002-03 2003-041 Andhra Pradesh 17401.00 10400.00 60.59 60.00 10543 62402 Arunachal Pradesh 36.70 12.80 61.30 184.00 22 243 Assam 2818.00 2649.50 85.00 91.55 2395 24264 Bihar 3643.40 3420.94 87.00 89.94 3170 30775 Chhattisgarh 1491.42 1538.00 88.70 90.77 1323 13966 Goa 191.68 181.00 87.00 87.00 167 1577 Gujarat 1161.00 1088.60 107.41 106.43 1247 11598 Haryana 1423.11 1438.71 147.46 143.47 2099 20649 Himachal Pradesh 220.17 222.09 174.25 172.83 384 384
10 Jammu & Kashmir* - - - - - -11 Jharkhand 2811.43 2693.58 211.34 217.04 5942 584612 Karnataka 8442.00 4678.00 93.97 96.80 7933 452813 Kerala 6968.00 5981.40 118.74 120.00 8274 717814 Madhya Pradesh 2810.30 2824.30 89.79 91.15 2523 257415 Maharashtra 12682.00 12895.00 116.58 116.00 14785 1495816 Manipur 478.43 496.34 55.00 58.37 263 29017 Meghalaya 771.00 764.00 102.00 102.00 786 77918 Mizoram 237.00 254.00 56.00 68.00 133 17319 Nagaland 342.75 110.23 57.00 134.00 195 14820 Orissa 3636.28 3664.33 111.56 116.47 4057 426821 Punjab 751.00 722.00 80.00 80.00 601 57822 Rajasthan 1649.00 1763.00 102.00 105.00 1682 185123 Sikkim 67.40 59.64 100.00 120.00 67 7224 Tamil Nadu 4529.40 4322.10 88.10 92.07 3990 397925 Tripura 809.00 707.11 84.00 91.00 680 64326 Uttar Pradesh 2958.03 3018.93 138.30 140.00 4091 422727 Uttaranchal 210.34 177.48 165.33 143.79 348 25528 West Bengal 13807.01 14203.98 98.24 99.40 13564 1411929 A&N Islands 314.00 328.00 106.00 113.00 333 37130 Chandigarh 5.90 6.00 170.00 170.00 10 1031 D.& N. Haveli* - - - - - -32 Daman & Diu* - - - - - -33 Delhi* - - - - - -34 Lakshadweep - 20.24 - 180.00 - 3635 Pondicherry 44.48 72.00 187.00 120.00 83 86
Total@ 92711 80713 98.90 103.94 91690 83896*- Details not available.'-' denotes no production data reported.@ Total of only those States/UTs for which data are availableSource : State/UT Animal Husbandry Departments
41
No. of Layers Average Yield per Annum Estimates of Egg Production (000 nos.) (nos.) (lakh nos.)
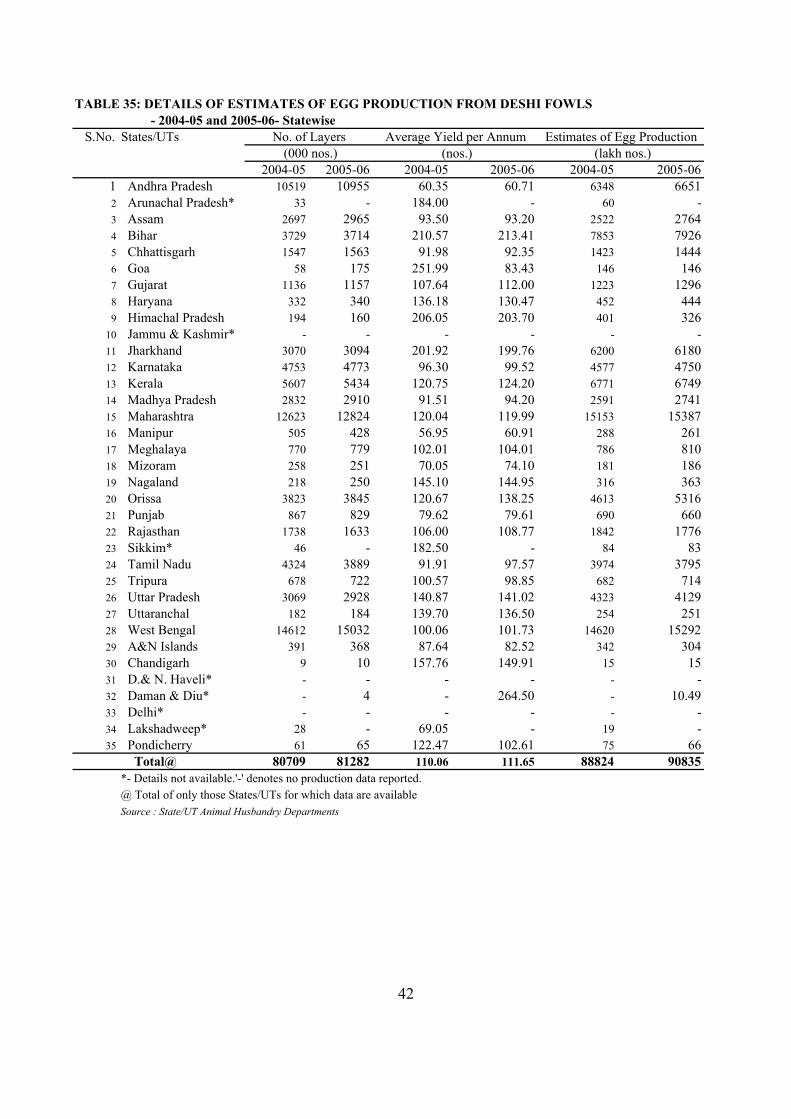
- 2004-05 and 2005-06- Statewise S.No. States/UTs
2004-05 2005-06 2004-05 2005-06 2004-05 2005-06
1 Andhra Pradesh 10519 10955 60.35 60.71 6348 66512 Arunachal Pradesh* 33 - 184.00 - 60 -3 Assam 2697 2965 93.50 93.20 2522 27644 Bihar 3729 3714 210.57 213.41 7853 79265 Chhattisgarh 1547 1563 91.98 92.35 1423 14446 Goa 58 175 251.99 83.43 146 1467 Gujarat 1136 1157 107.64 112.00 1223 12968 Haryana 332 340 136.18 130.47 452 4449 Himachal Pradesh 194 160 206.05 203.70 401 326
10 Jammu & Kashmir* - - - - - -11 Jharkhand 3070 3094 201.92 199.76 6200 618012 Karnataka 4753 4773 96.30 99.52 4577 475013 Kerala 5607 5434 120.75 124.20 6771 674914 Madhya Pradesh 2832 2910 91.51 94.20 2591 274115 Maharashtra 12623 12824 120.04 119.99 15153 1538716 Manipur 505 428 56.95 60.91 288 26117 Meghalaya 770 779 102.01 104.01 786 81018 Mizoram 258 251 70.05 74.10 181 18619 Nagaland 218 250 145.10 144.95 316 36320 Orissa 3823 3845 120.67 138.25 4613 531621 Punjab 867 829 79.62 79.61 690 66022 Rajasthan 1738 1633 106.00 108.77 1842 177623 Sikkim* 46 - 182.50 - 84 8324 Tamil Nadu 4324 3889 91.91 97.57 3974 379525 Tripura 678 722 100.57 98.85 682 71426 Uttar Pradesh 3069 2928 140.87 141.02 4323 412927 Uttaranchal 182 184 139.70 136.50 254 25128 West Bengal 14612 15032 100.06 101.73 14620 1529229 A&N Islands 391 368 87.64 82.52 342 30430 Chandigarh 9 10 157.76 149.91 15 1531 D.& N. Haveli* - - - - - -32 Daman & Diu* - 4 - 264.50 - 10.4933 Delhi* - - - - - -34 Lakshadweep* 28 - 69.05 - 19 -35 Pondicherry 61 65 122.47 102.61 75 66
Total@ 80709 81282 110.06 111.65 88824 90835*- Details not available.'-' denotes no production data reported.@ Total of only those States/UTs for which data are availableSource : State/UT Animal Husbandry Departments
TABLE 35: DETAILS OF ESTIMATES OF EGG PRODUCTION FROM DESHI FOWLS
No. of Layers Average Yield per Annum Estimates of Egg Production
42
(000 nos.) (nos.) (lakh nos.)
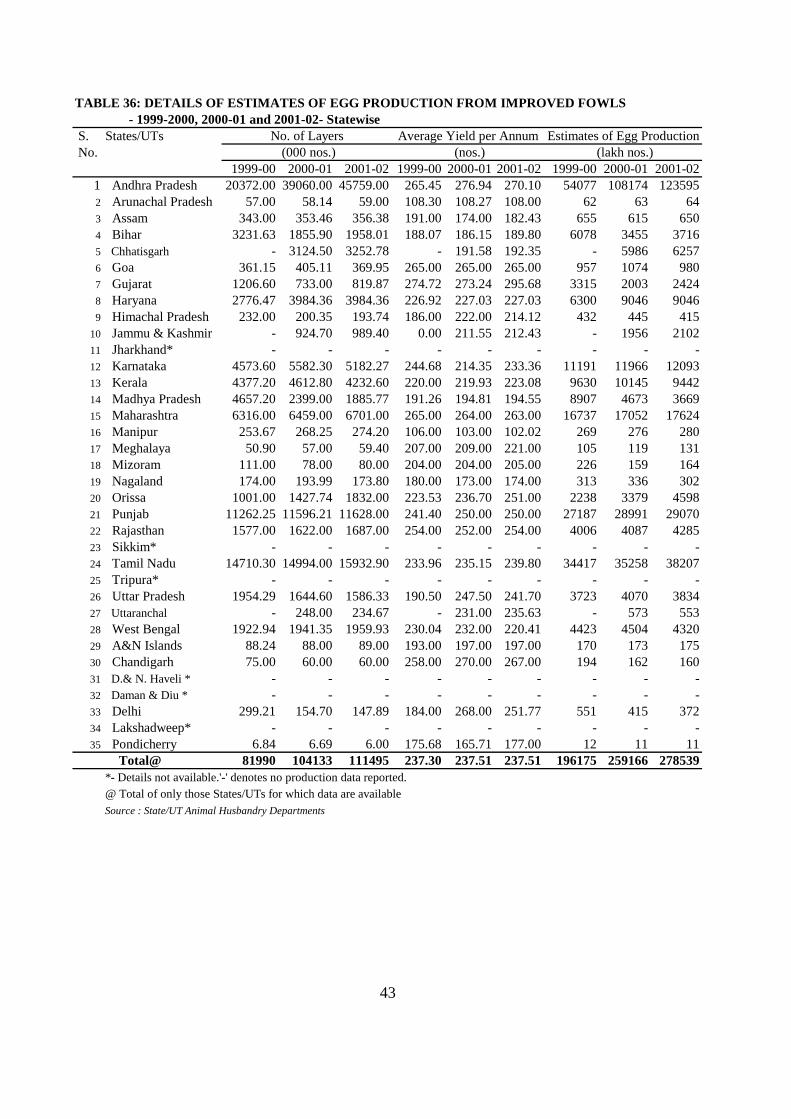
TABLE 36: DETAILS OF ESTIMATES OF EGG PRODUCTION FROM IMPROVED FOWLS - 1999-2000, 2000-01 and 2001-02- Statewise
S. States/UTs No.
1999-00 2000-01 2001-02 1999-00 2000-01 2001-02 1999-00 2000-01 2001-021 Andhra Pradesh 20372.00 39060.00 45759.00 265.45 276.94 270.10 54077 108174 1235952 Arunachal Pradesh 57.00 58.14 59.00 108.30 108.27 108.00 62 63 643 Assam 343.00 353.46 356.38 191.00 174.00 182.43 655 615 6504 Bihar 3231.63 1855.90 1958.01 188.07 186.15 189.80 6078 3455 37165 Chhatisgarh - 3124.50 3252.78 - 191.58 192.35 - 5986 62576 Goa 361.15 405.11 369.95 265.00 265.00 265.00 957 1074 9807 Gujarat 1206.60 733.00 819.87 274.72 273.24 295.68 3315 2003 24248 Haryana 2776.47 3984.36 3984.36 226.92 227.03 227.03 6300 9046 90469 Himachal Pradesh 232.00 200.35 193.74 186.00 222.00 214.12 432 445 415
10 Jammu & Kashmir - 924.70 989.40 0.00 211.55 212.43 - 1956 210211 Jharkhand* - - - - - - - - -12 Karnataka 4573.60 5582.30 5182.27 244.68 214.35 233.36 11191 11966 1209313 Kerala 4377.20 4612.80 4232.60 220.00 219.93 223.08 9630 10145 944214 Madhya Pradesh 4657.20 2399.00 1885.77 191.26 194.81 194.55 8907 4673 366915 Maharashtra 6316.00 6459.00 6701.00 265.00 264.00 263.00 16737 17052 1762416 Manipur 253.67 268.25 274.20 106.00 103.00 102.02 269 276 28017 Meghalaya 50.90 57.00 59.40 207.00 209.00 221.00 105 119 13118 Mizoram 111.00 78.00 80.00 204.00 204.00 205.00 226 159 16419 Nagaland 174.00 193.99 173.80 180.00 173.00 174.00 313 336 30220 Orissa 1001.00 1427.74 1832.00 223.53 236.70 251.00 2238 3379 459821 Punjab 11262.25 11596.21 11628.00 241.40 250.00 250.00 27187 28991 2907022 Rajasthan 1577.00 1622.00 1687.00 254.00 252.00 254.00 4006 4087 428523 Sikkim* - - - - - - - - -24 Tamil Nadu 14710.30 14994.00 15932.90 233.96 235.15 239.80 34417 35258 3820725 Tripura* - - - - - - - - -26 Uttar Pradesh 1954.29 1644.60 1586.33 190.50 247.50 241.70 3723 4070 383427 Uttaranchal - 248.00 234.67 - 231.00 235.63 - 573 55328 West Bengal 1922.94 1941.35 1959.93 230.04 232.00 220.41 4423 4504 432029 A&N Islands 88.24 88.00 89.00 193.00 197.00 197.00 170 173 17530 Chandigarh 75.00 60.00 60.00 258.00 270.00 267.00 194 162 16031 D.& N. Haveli * - - - - - - - - -32 Daman & Diu * - - - - - - - - -33 Delhi 299.21 154.70 147.89 184.00 268.00 251.77 551 415 37234 Lakshadweep* - - - - - - - - -35 Pondicherry 6.84 6.69 6.00 175.68 165.71 177.00 12 11 11
Total@ 81990 104133 111495 237.30 237.51 237.51 196175 259166 278539*- Details not available.'-' denotes no production data reported.@ Total of only those States/UTs for which data are availableSource : State/UT Animal Husbandry Departments
43
(lakh nos.) (000 nos.)Average Yield per Annum
(nos.)No. of Layers Estimates of Egg Production
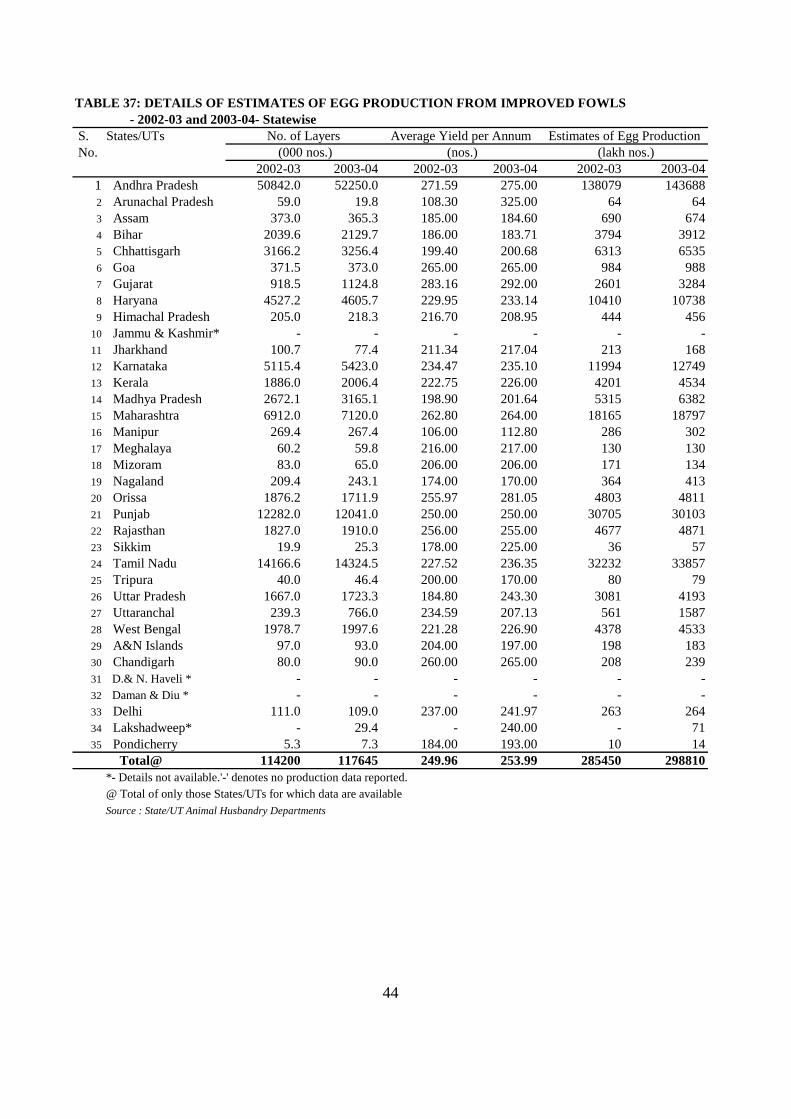
TABLE 37: DETAILS OF ESTIMATES OF EGG PRODUCTION FROM IMPROVED FOWLS - 2002-03 and 2003-04- Statewise
S. States/UTs No.
2002-03 2003-04 2002-03 2003-04 2002-03 2003-041 Andhra Pradesh 50842.0 52250.0 271.59 275.00 138079 1436882 Arunachal Pradesh 59.0 19.8 108.30 325.00 64 643 Assam 373.0 365.3 185.00 184.60 690 6744 Bihar 2039.6 2129.7 186.00 183.71 3794 39125 Chhattisgarh 3166.2 3256.4 199.40 200.68 6313 65356 Goa 371.5 373.0 265.00 265.00 984 9887 Gujarat 918.5 1124.8 283.16 292.00 2601 32848 Haryana 4527.2 4605.7 229.95 233.14 10410 107389 Himachal Pradesh 205.0 218.3 216.70 208.95 444 456
10 Jammu & Kashmir* - - - - - -11 Jharkhand 100.7 77.4 211.34 217.04 213 16812 Karnataka 5115.4 5423.0 234.47 235.10 11994 1274913 Kerala 1886.0 2006.4 222.75 226.00 4201 453414 Madhya Pradesh 2672.1 3165.1 198.90 201.64 5315 638215 Maharashtra 6912.0 7120.0 262.80 264.00 18165 1879716 Manipur 269.4 267.4 106.00 112.80 286 30217 Meghalaya 60.2 59.8 216.00 217.00 130 13018 Mizoram 83.0 65.0 206.00 206.00 171 13419 Nagaland 209.4 243.1 174.00 170.00 364 41320 Orissa 1876.2 1711.9 255.97 281.05 4803 481121 Punjab 12282.0 12041.0 250.00 250.00 30705 3010322 Rajasthan 1827.0 1910.0 256.00 255.00 4677 487123 Sikkim 19.9 25.3 178.00 225.00 36 5724 Tamil Nadu 14166.6 14324.5 227.52 236.35 32232 3385725 Tripura 40.0 46.4 200.00 170.00 80 7926 Uttar Pradesh 1667.0 1723.3 184.80 243.30 3081 419327 Uttaranchal 239.3 766.0 234.59 207.13 561 158728 West Bengal 1978.7 1997.6 221.28 226.90 4378 453329 A&N Islands 97.0 93.0 204.00 197.00 198 18330 Chandigarh 80.0 90.0 260.00 265.00 208 23931 D.& N. Haveli * - - - - - -32 Daman & Diu * - - - - - -33 Delhi 111.0 109.0 237.00 241.97 263 26434 Lakshadweep* - 29.4 - 240.00 - 7135 Pondicherry 5.3 7.3 184.00 193.00 10 14
Total@ 114200 117645 249.96 253.99 285450 298810*- Details not available.'-' denotes no production data reported.@ Total of only those States/UTs for which data are availableSource : State/UT Animal Husbandry Departments
44
No. of Layers Average Yield per Annum Estimates of Egg Production (000 nos.) (nos.) (lakh nos.)
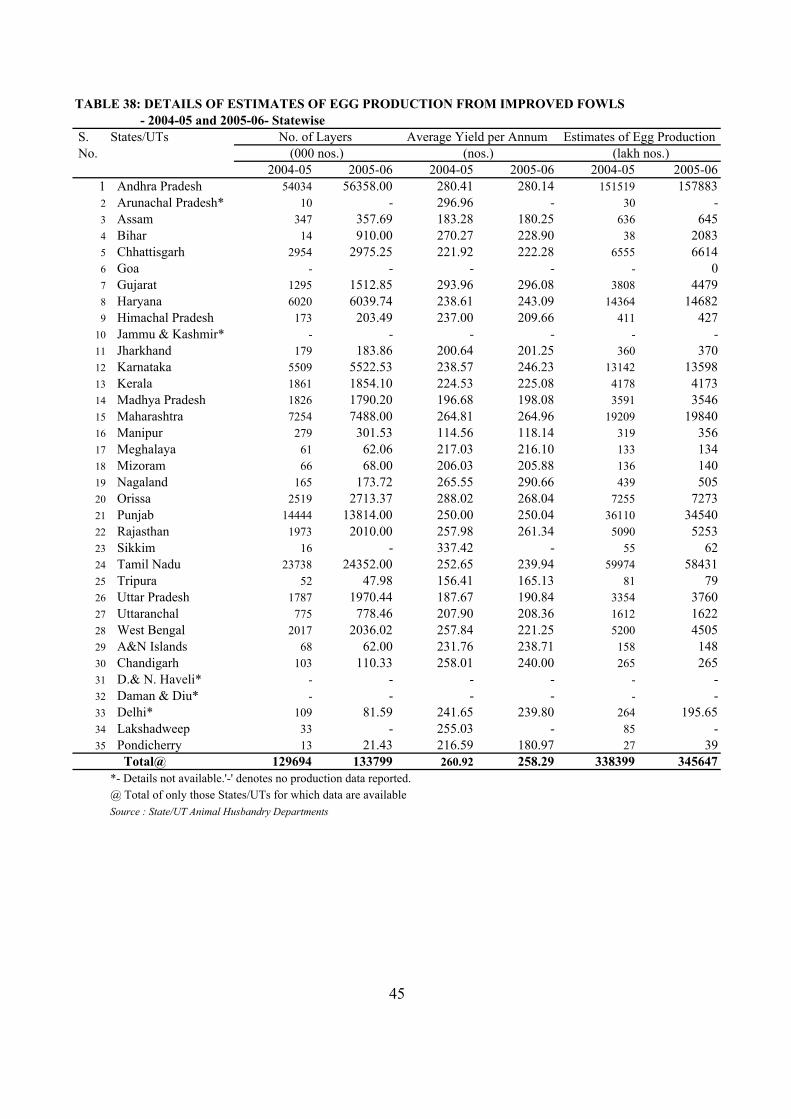
TABLE 38: DETAILS OF ESTIMATES OF EGG PRODUCTION FROM IMPROVED FOWLS - 2004-05 and 2005-06- Statewise
S. States/UTs No.
2004-05 2005-06 2004-05 2005-06 2004-05 2005-061 Andhra Pradesh 54034 56358.00 280.41 280.14 151519 1578832 Arunachal Pradesh* 10 - 296.96 - 30 -3 Assam 347 357.69 183.28 180.25 636 6454 Bihar 14 910.00 270.27 228.90 38 20835 Chhattisgarh 2954 2975.25 221.92 222.28 6555 66146 Goa - - - - - 07 Gujarat 1295 1512.85 293.96 296.08 3808 44798 Haryana 6020 6039.74 238.61 243.09 14364 146829 Himachal Pradesh 173 203.49 237.00 209.66 411 427
10 Jammu & Kashmir* - - - - - -11 Jharkhand 179 183.86 200.64 201.25 360 37012 Karnataka 5509 5522.53 238.57 246.23 13142 1359813 Kerala 1861 1854.10 224.53 225.08 4178 417314 Madhya Pradesh 1826 1790.20 196.68 198.08 3591 354615 Maharashtra 7254 7488.00 264.81 264.96 19209 1984016 Manipur 279 301.53 114.56 118.14 319 35617 Meghalaya 61 62.06 217.03 216.10 133 13418 Mizoram 66 68.00 206.03 205.88 136 14019 Nagaland 165 173.72 265.55 290.66 439 50520 Orissa 2519 2713.37 288.02 268.04 7255 727321 Punjab 14444 13814.00 250.00 250.04 36110 3454022 Rajasthan 1973 2010.00 257.98 261.34 5090 525323 Sikkim 16 - 337.42 - 55 6224 Tamil Nadu 23738 24352.00 252.65 239.94 59974 5843125 Tripura 52 47.98 156.41 165.13 81 7926 Uttar Pradesh 1787 1970.44 187.67 190.84 3354 376027 Uttaranchal 775 778.46 207.90 208.36 1612 162228 West Bengal 2017 2036.02 257.84 221.25 5200 450529 A&N Islands 68 62.00 231.76 238.71 158 14830 Chandigarh 103 110.33 258.01 240.00 265 26531 D.& N. Haveli* - - - - - -32 Daman & Diu* - - - - - -33 Delhi* 109 81.59 241.65 239.80 264 195.6534 Lakshadweep 33 - 255.03 - 85 -35 Pondicherry 13 21.43 216.59 180.97 27 39
Total@ 129694 133799 260.92 258.29 338399 345647
Source : State/UT Animal Husbandry Departments
45
(lakh nos.)No. of Layers Average Yield per Annum Estimates of Egg Production
*- Details not available.'-' denotes no production data reported.@ Total of only those States/UTs for which data are available
(000 nos.) (nos.)
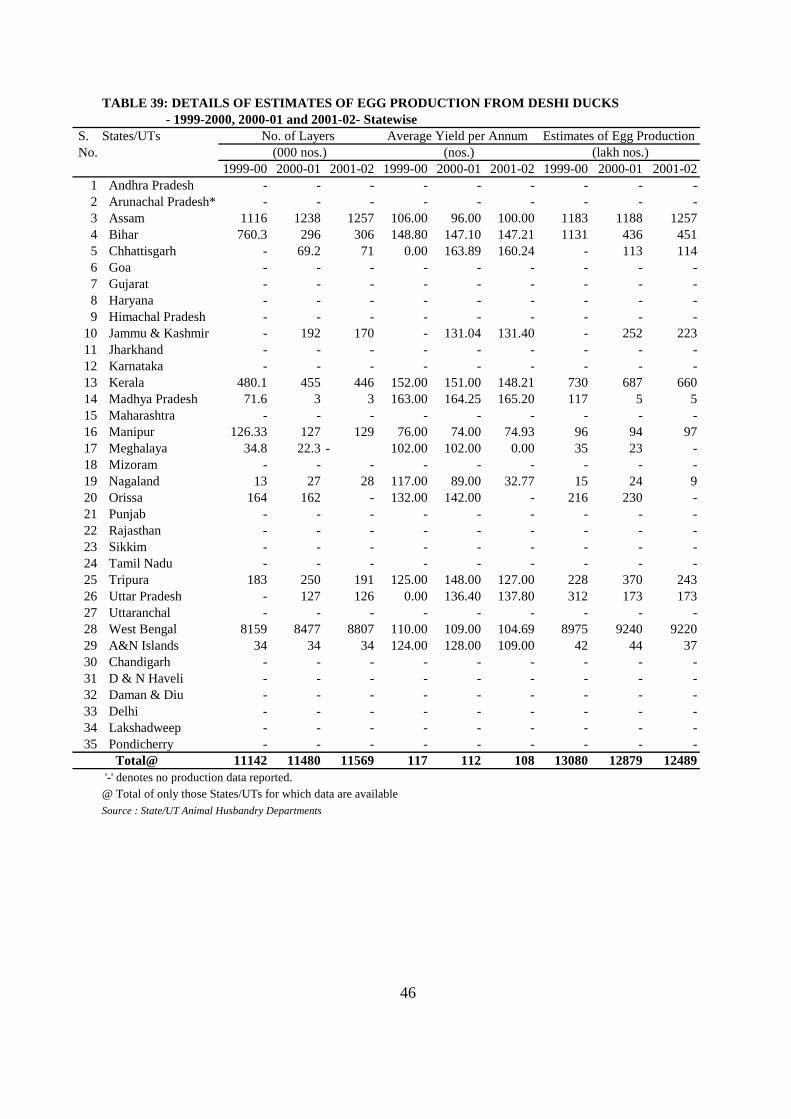
TABLE 39: DETAILS OF ESTIMATES OF EGG PRODUCTION FROM DESHI DUCKS - 1999-2000, 2000-01 and 2001-02- Statewise
S. States/UTs No.
1999-00 2000-01 2001-02 1999-00 2000-01 2001-02 1999-00 2000-01 2001-021 Andhra Pradesh - - - - - - - - -2 Arunachal Pradesh* - - - - - - - - -3 Assam 1116 1238 1257 106.00 96.00 100.00 1183 1188 12574 Bihar 760.3 296 306 148.80 147.10 147.21 1131 436 4515 Chhattisgarh - 69.2 71 0.00 163.89 160.24 - 113 1146 Goa - - - - - - - - -7 Gujarat - - - - - - - - -8 Haryana - - - - - - - - -9 Himachal Pradesh - - - - - - - - -
10 Jammu & Kashmir - 192 170 - 131.04 131.40 - 252 22311 Jharkhand - - - - - - - - -12 Karnataka - - - - - - - - -13 Kerala 480.1 455 446 152.00 151.00 148.21 730 687 66014 Madhya Pradesh 71.6 3 3 163.00 164.25 165.20 117 5 515 Maharashtra - - - - - - - - -16 Manipur 126.33 127 129 76.00 74.00 74.93 96 94 9717 Meghalaya 34.8 22.3 - 102.00 102.00 0.00 35 23 -18 Mizoram - - - - - - - - -19 Nagaland 13 27 28 117.00 89.00 32.77 15 24 920 Orissa 164 162 - 132.00 142.00 - 216 230 -21 Punjab - - - - - - - - -22 Rajasthan - - - - - - - - -23 Sikkim - - - - - - - - -24 Tamil Nadu - - - - - - - - -25 Tripura 183 250 191 125.00 148.00 127.00 228 370 24326 Uttar Pradesh - 127 126 0.00 136.40 137.80 312 173 17327 Uttaranchal - - - - - - - - -28 West Bengal 8159 8477 8807 110.00 109.00 104.69 8975 9240 922029 A&N Islands 34 34 34 124.00 128.00 109.00 42 44 3730 Chandigarh - - - - - - - - -31 D & N Haveli - - - - - - - - -32 Daman & Diu - - - - - - - - -33 Delhi - - - - - - - - -34 Lakshadweep - - - - - - - - -35 Pondicherry - - - - - - - - -
Total@ 11142 11480 11569 117 112 108 13080 12879 12489 '-' denotes no production data reported.@ Total of only those States/UTs for which data are availableSource : State/UT Animal Husbandry Departments
46
(nos.) (lakh nos.)No. of Layers Average Yield per Annum Estimates of Egg Production
(000 nos.)
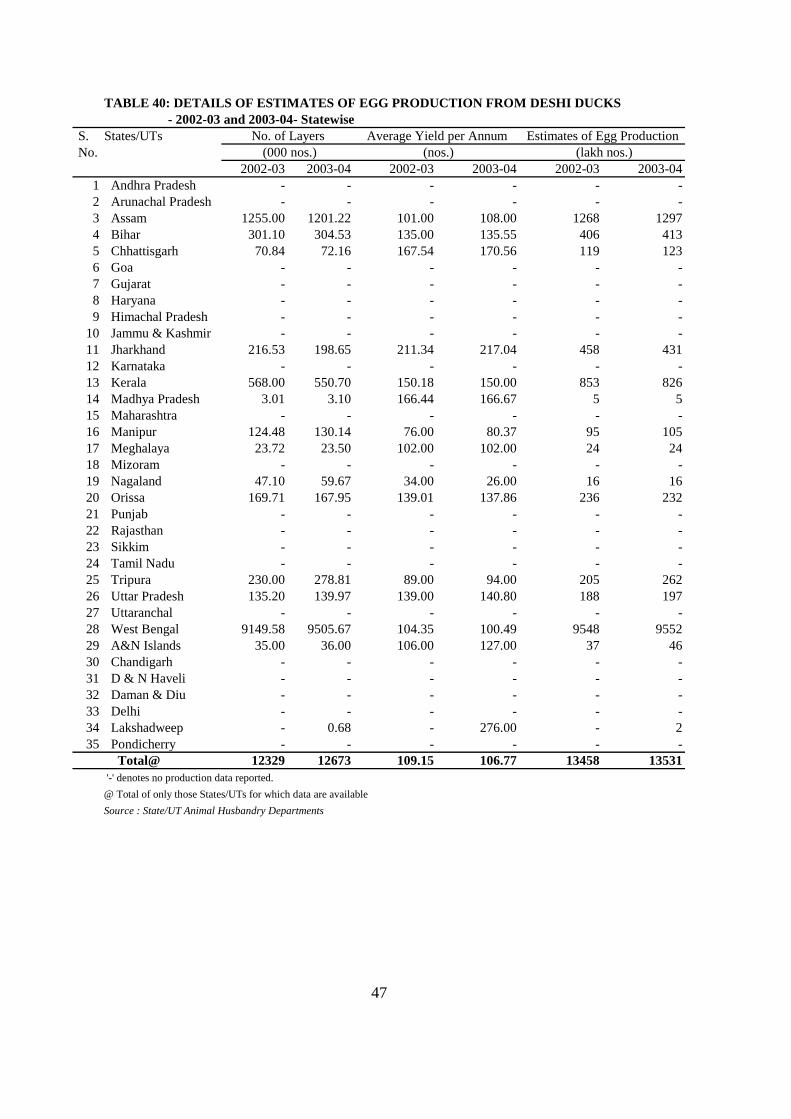
TABLE 40: DETAILS OF ESTIMATES OF EGG PRODUCTION FROM DESHI DUCKS - 2002-03 and 2003-04- Statewise
S. States/UTs No.
2002-03 2003-04 2002-03 2003-04 2002-03 2003-041 Andhra Pradesh - - - - - -2 Arunachal Pradesh - - - - - -3 Assam 1255.00 1201.22 101.00 108.00 1268 12974 Bihar 301.10 304.53 135.00 135.55 406 4135 Chhattisgarh 70.84 72.16 167.54 170.56 119 1236 Goa - - - - - -7 Gujarat - - - - - -8 Haryana - - - - - -9 Himachal Pradesh - - - - - -
10 Jammu & Kashmir - - - - - -11 Jharkhand 216.53 198.65 211.34 217.04 458 43112 Karnataka - - - - - -13 Kerala 568.00 550.70 150.18 150.00 853 82614 Madhya Pradesh 3.01 3.10 166.44 166.67 5 515 Maharashtra - - - - - -16 Manipur 124.48 130.14 76.00 80.37 95 10517 Meghalaya 23.72 23.50 102.00 102.00 24 2418 Mizoram - - - - - -19 Nagaland 47.10 59.67 34.00 26.00 16 1620 Orissa 169.71 167.95 139.01 137.86 236 23221 Punjab - - - - - -22 Rajasthan - - - - - -23 Sikkim - - - - - -24 Tamil Nadu - - - - - -25 Tripura 230.00 278.81 89.00 94.00 205 26226 Uttar Pradesh 135.20 139.97 139.00 140.80 188 19727 Uttaranchal - - - - - -28 West Bengal 9149.58 9505.67 104.35 100.49 9548 955229 A&N Islands 35.00 36.00 106.00 127.00 37 4630 Chandigarh - - - - - -31 D & N Haveli - - - - - -32 Daman & Diu - - - - - -33 Delhi - - - - - -34 Lakshadweep - 0.68 - 276.00 - 235 Pondicherry - - - - - -
Total@ 12329 12673 109.15 106.77 13458 13531 '-' denotes no production data reported.@ Total of only those States/UTs for which data are availableSource : State/UT Animal Husbandry Departments
47
Estimates of Egg Production (000 nos.) (nos.) (lakh nos.)
No. of Layers Average Yield per Annum
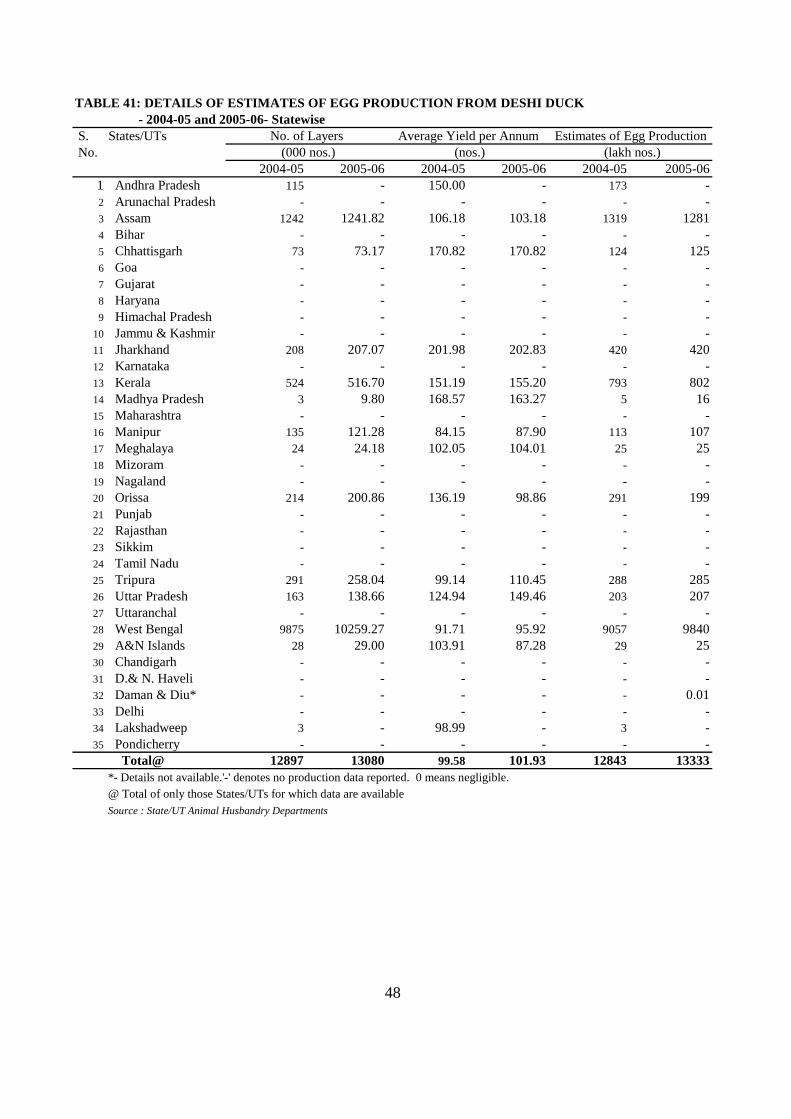
TABLE 41: DETAILS OF ESTIMATES OF EGG PRODUCTION FROM DESHI DUCK - 2004-05 and 2005-06- Statewise
S. States/UTs No.
2004-05 2005-06 2004-05 2005-06 2004-05 2005-061 Andhra Pradesh 115 - 150.00 - 173 -2 Arunachal Pradesh - - - - - -3 Assam 1242 1241.82 106.18 103.18 1319 12814 Bihar - - - - - -5 Chhattisgarh 73 73.17 170.82 170.82 124 1256 Goa - - - - - -7 Gujarat - - - - - -8 Haryana - - - - - -9 Himachal Pradesh - - - - - -
10 Jammu & Kashmir - - - - - -11 Jharkhand 208 207.07 201.98 202.83 420 42012 Karnataka - - - - - -13 Kerala 524 516.70 151.19 155.20 793 80214 Madhya Pradesh 3 9.80 168.57 163.27 5 1615 Maharashtra - - - - - -16 Manipur 135 121.28 84.15 87.90 113 10717 Meghalaya 24 24.18 102.05 104.01 25 2518 Mizoram - - - - - -19 Nagaland - - - - - -20 Orissa 214 200.86 136.19 98.86 291 19921 Punjab - - - - - -22 Rajasthan - - - - - -23 Sikkim - - - - - -24 Tamil Nadu - - - - - -25 Tripura 291 258.04 99.14 110.45 288 28526 Uttar Pradesh 163 138.66 124.94 149.46 203 20727 Uttaranchal - - - - - -28 West Bengal 9875 10259.27 91.71 95.92 9057 984029 A&N Islands 28 29.00 103.91 87.28 29 2530 Chandigarh - - - - - -31 D.& N. Haveli - - - - - -32 Daman & Diu* - - - - - 0.0133 Delhi - - - - - -34 Lakshadweep 3 - 98.99 - 3 -35 Pondicherry - - - - - -
Total@ 12897 13080 99.58 101.93 12843 13333*- Details not available.'-' denotes no production data reported. 0 means negligible.@ Total of only those States/UTs for which data are availableSource : State/UT Animal Husbandry Departments
48
No. of Layers Average Yield per Annum Estimates of Egg Production (000 nos.) (nos.) (lakh nos.)
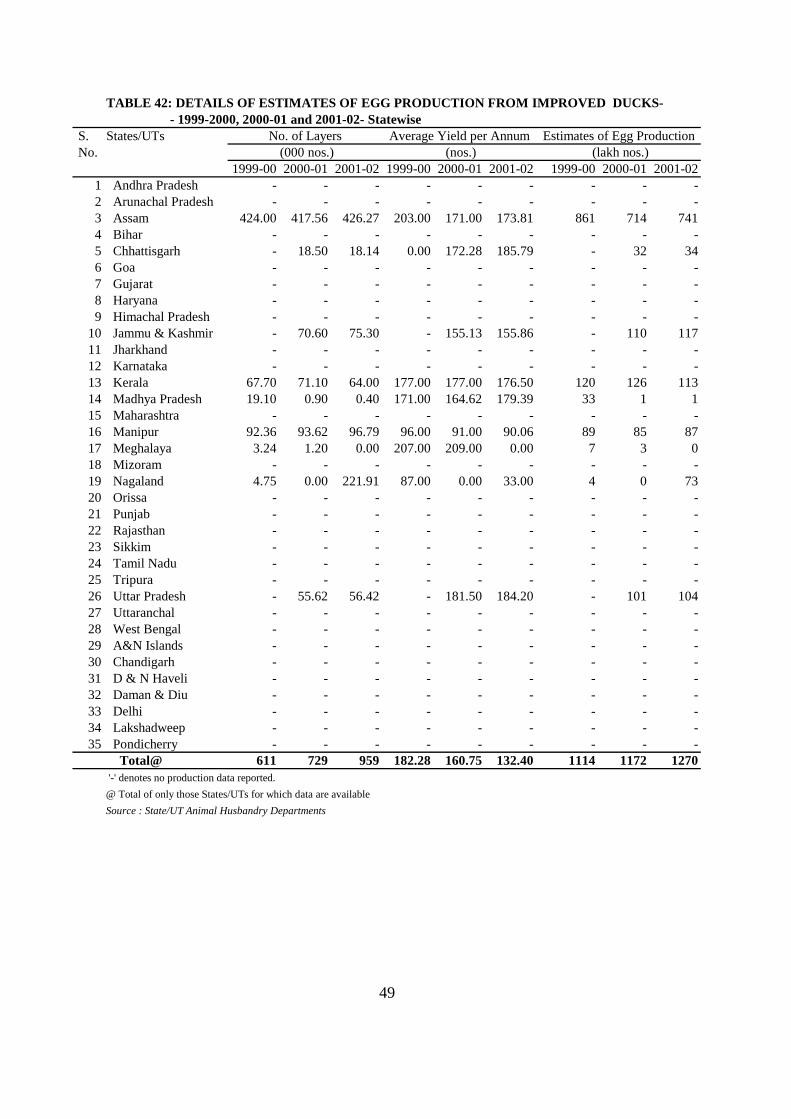
- 1999-2000, 2000-01 and 2001-02- Statewise S. States/UTs No.
1999-00 2000-01 2001-02 1999-00 2000-01 2001-02 1999-00 2000-01 2001-021 Andhra Pradesh - - - - - - - - -2 Arunachal Pradesh - - - - - - - - -3 Assam 424.00 417.56 426.27 203.00 171.00 173.81 861 714 7414 Bihar - - - - - - - - -5 Chhattisgarh - 18.50 18.14 0.00 172.28 185.79 - 32 346 Goa - - - - - - - - -7 Gujarat - - - - - - - - -8 Haryana - - - - - - - - -9 Himachal Pradesh - - - - - - - - -
10 Jammu & Kashmir - 70.60 75.30 - 155.13 155.86 - 110 11711 Jharkhand - - - - - - - - -12 Karnataka - - - - - - - - -13 Kerala 67.70 71.10 64.00 177.00 177.00 176.50 120 126 11314 Madhya Pradesh 19.10 0.90 0.40 171.00 164.62 179.39 33 1 115 Maharashtra - - - - - - - - -16 Manipur 92.36 93.62 96.79 96.00 91.00 90.06 89 85 8717 Meghalaya 3.24 1.20 0.00 207.00 209.00 0.00 7 3 018 Mizoram - - - - - - - - -19 Nagaland 4.75 0.00 221.91 87.00 0.00 33.00 4 0 7320 Orissa - - - - - - - - -21 Punjab - - - - - - - - -22 Rajasthan - - - - - - - - -23 Sikkim - - - - - - - - -24 Tamil Nadu - - - - - - - - -25 Tripura - - - - - - - - -26 Uttar Pradesh - 55.62 56.42 - 181.50 184.20 - 101 10427 Uttaranchal - - - - - - - - -28 West Bengal - - - - - - - - -29 A&N Islands - - - - - - - - -30 Chandigarh - - - - - - - - -31 D & N Haveli - - - - - - - - -32 Daman & Diu - - - - - - - - -33 Delhi - - - - - - - - -34 Lakshadweep - - - - - - - - -35 Pondicherry - - - - - - - - -
Total@ 611 729 959 182.28 160.75 132.40 1114 1172 1270 '-' denotes no production data reported.@ Total of only those States/UTs for which data are availableSource : State/UT Animal Husbandry Departments
49
TABLE 42: DETAILS OF ESTIMATES OF EGG PRODUCTION FROM IMPROVED DUCKS-
(000 nos.) (nos.) (lakh nos.)No. of Layers Average Yield per Annum Estimates of Egg Production
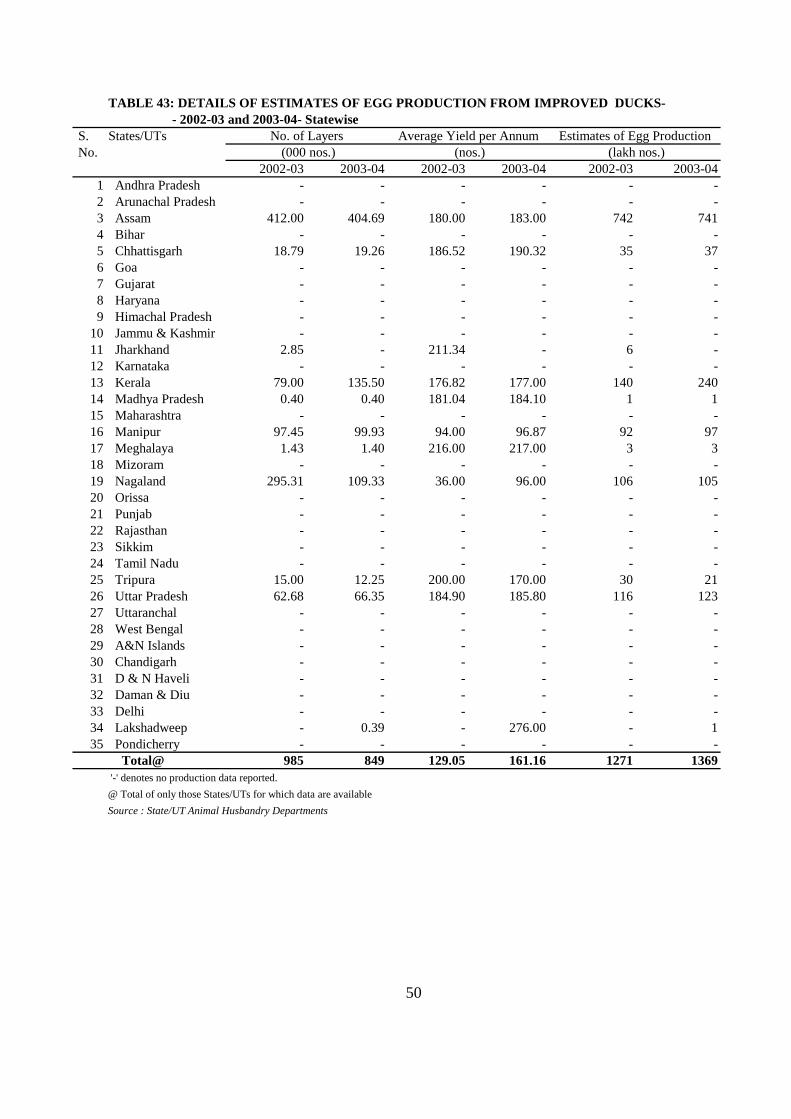
TABLE 43: DETAILS OF ESTIMATES OF EGG PRODUCTION FROM IMPROVED DUCKS- - 2002-03 and 2003-04- Statewise
S. States/UTs No.
2002-03 2003-04 2002-03 2003-04 2002-03 2003-041 Andhra Pradesh - - - - - -2 Arunachal Pradesh - - - - - -3 Assam 412.00 404.69 180.00 183.00 742 7414 Bihar - - - - - -5 Chhattisgarh 18.79 19.26 186.52 190.32 35 376 Goa - - - - - -7 Gujarat - - - - - -8 Haryana - - - - - -9 Himachal Pradesh - - - - - -
10 Jammu & Kashmir - - - - - -11 Jharkhand 2.85 - 211.34 - 6 -12 Karnataka - - - - - -13 Kerala 79.00 135.50 176.82 177.00 140 24014 Madhya Pradesh 0.40 0.40 181.04 184.10 1 115 Maharashtra - - - - - -16 Manipur 97.45 99.93 94.00 96.87 92 9717 Meghalaya 1.43 1.40 216.00 217.00 3 318 Mizoram - - - - - -19 Nagaland 295.31 109.33 36.00 96.00 106 10520 Orissa - - - - - -21 Punjab - - - - - -22 Rajasthan - - - - - -23 Sikkim - - - - - -24 Tamil Nadu - - - - - -25 Tripura 15.00 12.25 200.00 170.00 30 2126 Uttar Pradesh 62.68 66.35 184.90 185.80 116 12327 Uttaranchal - - - - - -28 West Bengal - - - - - -29 A&N Islands - - - - - -30 Chandigarh - - - - - -31 D & N Haveli - - - - - -32 Daman & Diu - - - - - -33 Delhi - - - - - -34 Lakshadweep - 0.39 - 276.00 - 135 Pondicherry - - - - - -
Total@ 985 849 129.05 161.16 1271 1369 '-' denotes no production data reported.@ Total of only those States/UTs for which data are availableSource : State/UT Animal Husbandry Departments
50
(000 nos.)No. of Layers
(lakh nos.)Estimates of Egg ProductionAverage Yield per Annum
(nos.)

TABLE 44: DETAILS OF ESTIMATES OF EGG PRODUCTION FROM IMPROVED DUCK - 2004-05 and 2005-06- Statewise
S. States/UTs No.
2004-05 2005-06 2004-05 2005-06 2004-05 2005-061 Andhra Pradesh - - - - - -2 Arunachal Pradesh - - - - - -3 Assam 402 360.35 183.97 185.84 739 6704 Bihar - - - - - -5 Chhattisgarh 19 19.41 190.89 190.53 37 376 Goa - - - - - -7 Gujarat - - - - - -8 Haryana - - - - - -9 Himachal Pradesh - - - - - -
10 Jammu & Kashmir* - - - - - -11 Jharkhand - - - - - -12 Karnataka - - - - - -13 Kerala 132 128.90 176.12 179.92 233 23214 Madhya Pradesh 0.44 3.00 184.09 200.00 1 615 Maharashtra - - - - - -16 Manipur 102 106.74 100.18 103.97 102 11117 Meghalaya 2 1.58 215.37 213.29 3 318 Mizoram - - - - - -19 Nagaland - - - - - -20 Orissa - - - - - -21 Punjab - - - - - -22 Rajasthan - - - - - -23 Sikkim - - - - - -24 Tamil Nadu - - - - - -25 Tripura 14 12.75 137.60 169.84 19 2226 Uttar Pradesh 70 53.61 177.14 184.55 124 9927 Uttaranchal - - - - - -28 West Bengal - - - - - -29 A&N Islands - - - - - -30 Chandigarh - - - - - -31 D.& N. Haveli* - - - - - -32 Daman & Diu* - - - - - -33 Delhi* - - - - - -34 Lakshadweep* - - - - 8 -35 Pondicherry - - - - - -
Total@ 741 686 169.79 171.86 1267 1180*- Details not available.'-' denotes no production data reported.@ Total of only those States/UTs for which data are availableSource : State/UT Animal Husbandry Departments
51
No. of Layers Average Yield per Annum Estimates of Egg Production (000 nos.) (nos.) (lakh nos.)

( nos./annum) S.No.States/UTs 1997-98 1998-99 1999-00 2000-01 2001-02 2002-03 2003-04 2004-05 2005-06
1 Andhra Pradesh 82 83 87 151 175 190 192 199 1932 Arunachal Pradesh 28 32 8 8 8 8 8 8 333 Assam 20 19 19 19 19 19 19 19 264 Bihar 19 18 18 8 9 9 9 9 105 Chhattisgarh - - - 34 37 37 38 40 396 Goa 84 84 86 92 85 83 83 10 107 Gujarat 10 10 10 7 7 7 9 9 98 Haryana 34 34 37 50 51 58 59 65 699 Himachal Pradesh 13 14 14 13 14 13 13 13 15
10 J& Kashmir 55 54 57 55 60 60 61 57 5811 Jharkhand - - - 20 23 24 23 24 2512 Karnataka 37 39 39 37 38 37 32 32 3213 Kerala 69 68 67 62 63 41 39 36 3814 Madhya Pradesh 24 25 22 11 10 13 15 14 1415 Maharashtra 31 32 33 31 33 33 34 34 3416 Manipur 31 32 33 31 33 33 36 36 4017 Meghalaya 38 38 38 37 39 40 39 39 3918 Mizoram 34 40 51 31 33 33 34 34 3519 Nagaland 25 26 27 27 27 33 33 36 4120 Orissa 21 22 18 19 23 24 25 32 4121 Punjab 129 115 119 119 122 126 123 144 14122 Rajasthan 10 10 10 10 11 11 12 11 1123 Sikkim 34 31 17 17 18 19 23 25 2424 Tamil Nadu 56 61 64 61 68 57 59 99 10025 Tripura 33 36 34 32 19 30 31 32 3226 Uttar Pradesh 5 5 5 5 5 4 5 5 527 Uttaranchl - - - 10 11 10 21 21 2028 West Bengal 36 35 35 33 34 33 34 34 3529 A&N Islands 126 157 172 155 158 156 165 133 12530 Chandigarh 25 20 24 19 19 24 27 27 2031 Dadra & N. Haveli 15 19 17 14 15 17 18 20 1232 Daman & Diu 21 30 24 19 11 10 9 5 433 Delhi 5 4 4 3 3 2 2 2 234 Lakshdweep 113 105 117 126 134 136 176 172 18335 Pondicherry 10 10 10 9 10 9 10 10 9
All India 30 30 32 36 38 39 40 42 42*- Details not available.'-' denotes no production data reported.Note: Based on estimates of production and projected population of RGI censusindia.net
Source : State/UT Animal Husbandry Departments
52
TABLE 45: PER CAPITA AVAILABILITY OF EGGS DURING 1997-98 TO 2005-06
PART III
Wool & Meat Production
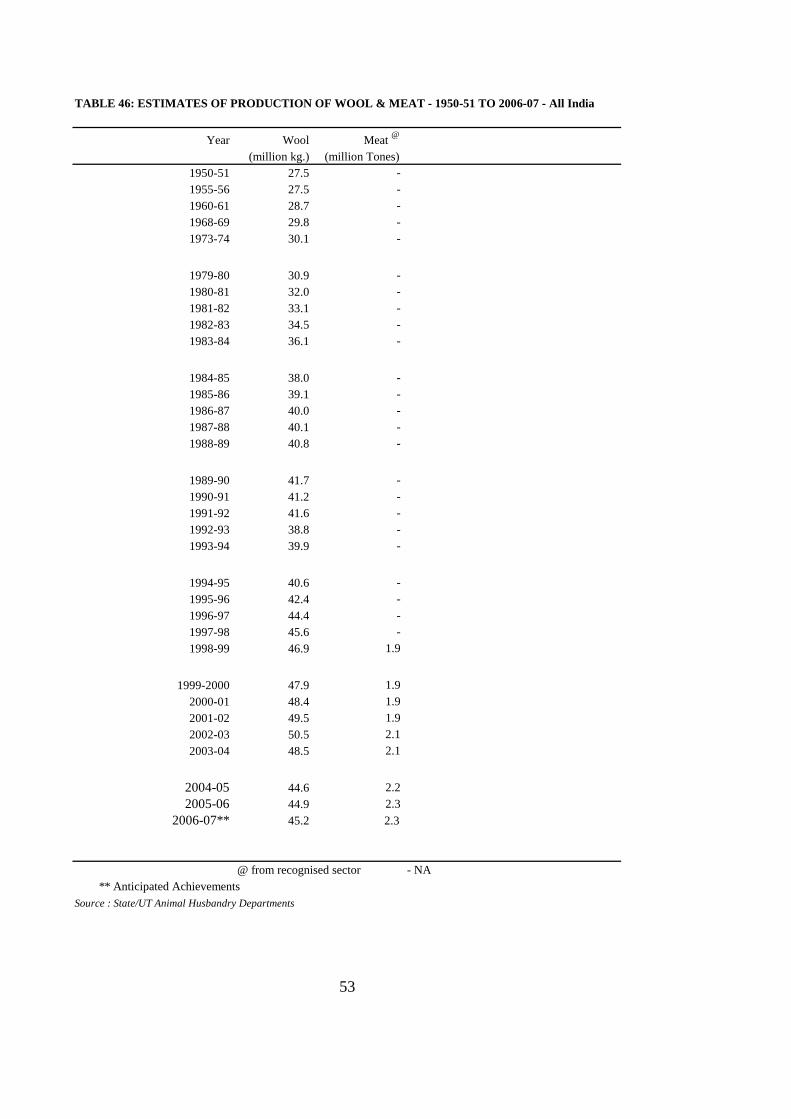
TABLE 46: ESTIMATES OF PRODUCTION OF WOOL & MEAT - 1950-51 TO 2006-07 - All India
Year Wool Meat @
(million kg.) (million Tones)1950-51 27.5 -1955-56 27.5 -1960-61 28.7 -1968-69 29.8 -1973-74 30.1 -
1979-80 30.9 -1980-81 32.0 -1981-82 33.1 -1982-83 34.5 -1983-84 36.1 -
1984-85 38.0 -1985-86 39.1 -1986-87 40.0 -1987-88 40.1 -1988-89 40.8 -
1989-90 41.7 -1990-91 41.2 -1991-92 41.6 -1992-93 38.8 -1993-94 39.9 -
1994-95 40.6 -1995-96 42.4 -1996-97 44.4 -1997-98 45.6 -1998-99 46.9 1.9
1999-2000 47.9 1.92000-01 48.4 1.92001-02 49.5 1.92002-03 50.5 2.12003-04 48.5 2.1
2004-05 44.6 2.22005-06 44.9 2.3
2006-07** 45.2 2.3
@ from recognised sector - NA ** Anticipated AchievementsSource : State/UT Animal Husbandry Departments
53

54
41
42
43
44
45
46
47
48
49
50
51
Prod
uctio
n in
mill
ion
Kgs
.
1999-2000 2000-01 2001-02 2002-03 2003-04 2004-05 2005-06
Year
Wool Production India
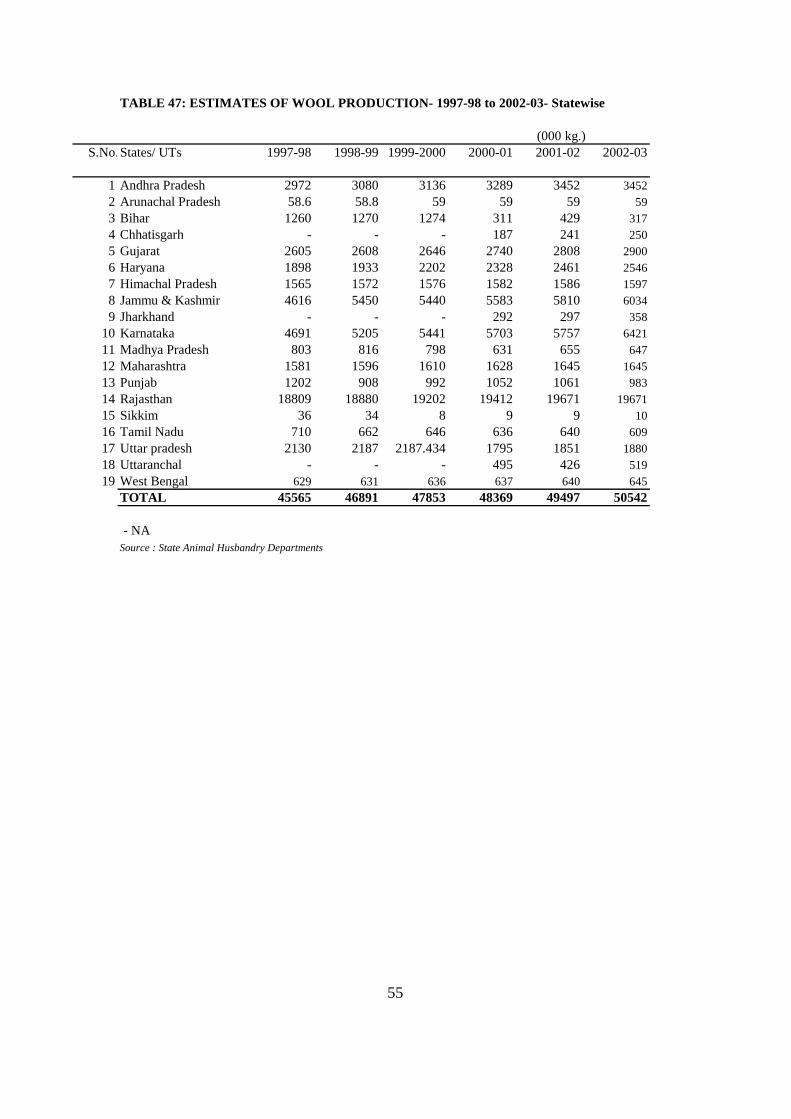
TABLE 47: ESTIMATES OF WOOL PRODUCTION- 1997-98 to 2002-03- Statewise
(000 kg.) S.No.States/ UTs 1997-98 1998-99 1999-2000 2000-01 2001-02 2002-03
1 Andhra Pradesh 2972 3080 3136 3289 3452 34522 Arunachal Pradesh 58.6 58.8 59 59 59 593 Bihar 1260 1270 1274 311 429 3174 Chhatisgarh - - - 187 241 2505 Gujarat 2605 2608 2646 2740 2808 29006 Haryana 1898 1933 2202 2328 2461 25467 Himachal Pradesh 1565 1572 1576 1582 1586 15978 Jammu & Kashmir 4616 5450 5440 5583 5810 60349 Jharkhand - - - 292 297 358
10 Karnataka 4691 5205 5441 5703 5757 642111 Madhya Pradesh 803 816 798 631 655 64712 Maharashtra 1581 1596 1610 1628 1645 164513 Punjab 1202 908 992 1052 1061 98314 Rajasthan 18809 18880 19202 19412 19671 1967115 Sikkim 36 34 8 9 9 1016 Tamil Nadu 710 662 646 636 640 60917 Uttar pradesh 2130 2187 2187.434 1795 1851 188018 Uttaranchal - - - 495 426 51919 West Bengal 629 631 636 637 640 645
TOTAL 45565 46891 47853 48369 49497 50542
- NASource : State Animal Husbandry Departments
55

56
Wool Production in Major States
0
2000
4000
6000
8000
10000
12000
14000
16000
18000
20000
Rajasthan Jammu &Kashmir
Karnataka Andhra Pradesh Gujarat Haryana Uttar pradesh Maharashtra HimachalPradesh
MadhyaPradesh
States
Prod
uctio
n in
000
Kgs
.
2003-042004-052005-06
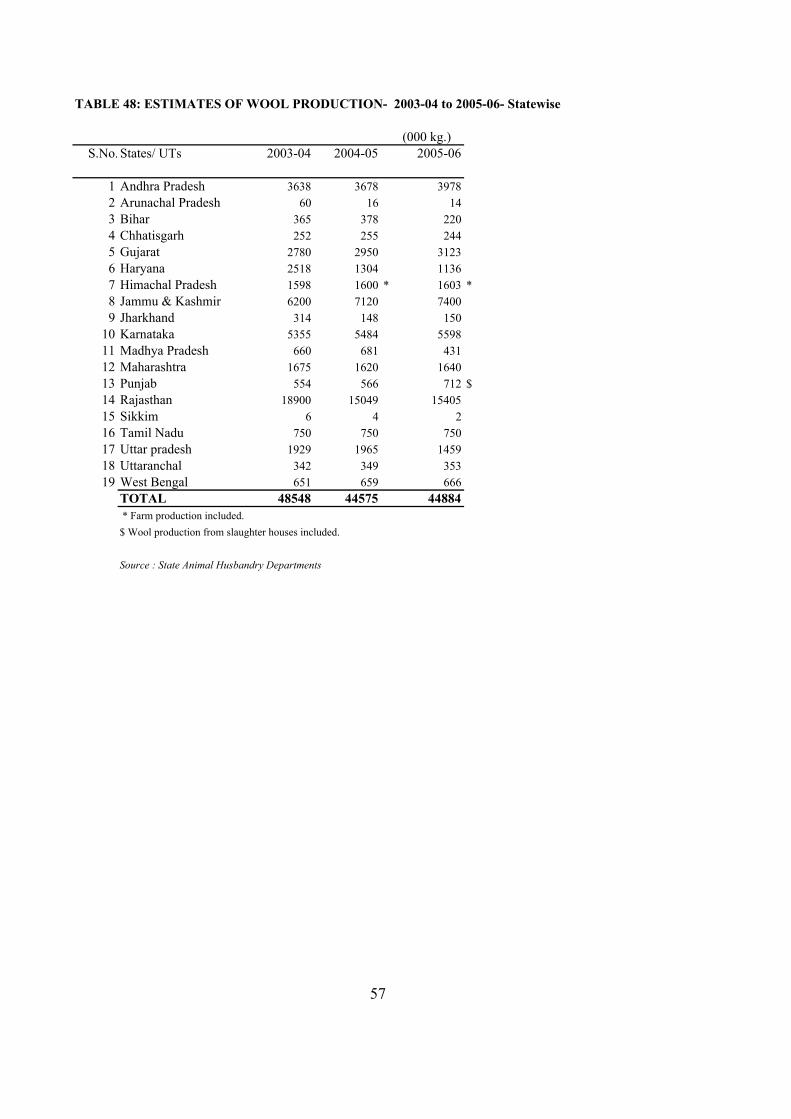
TABLE 48: ESTIMATES OF WOOL PRODUCTION- 2003-04 to 2005-06- Statewise
(000 kg.) S.No. States/ UTs 2003-04 2004-05 2005-06
1 Andhra Pradesh 3638 3678 39782 Arunachal Pradesh 60 16 143 Bihar 365 378 2204 Chhatisgarh 252 255 2445 Gujarat 2780 2950 31236 Haryana 2518 1304 11367 Himachal Pradesh 1598 1600 * 1603 *8 Jammu & Kashmir 6200 7120 74009 Jharkhand 314 148 150
10 Karnataka 5355 5484 559811 Madhya Pradesh 660 681 43112 Maharashtra 1675 1620 164013 Punjab 554 566 712 $14 Rajasthan 18900 15049 1540515 Sikkim 6 4 216 Tamil Nadu 750 750 75017 Uttar pradesh 1929 1965 145918 Uttaranchal 342 349 35319 West Bengal 651 659 666
TOTAL 48548 44575 44884 * Farm production included.$ Wool production from slaughter houses included.
Source : State Animal Husbandry Departments
57
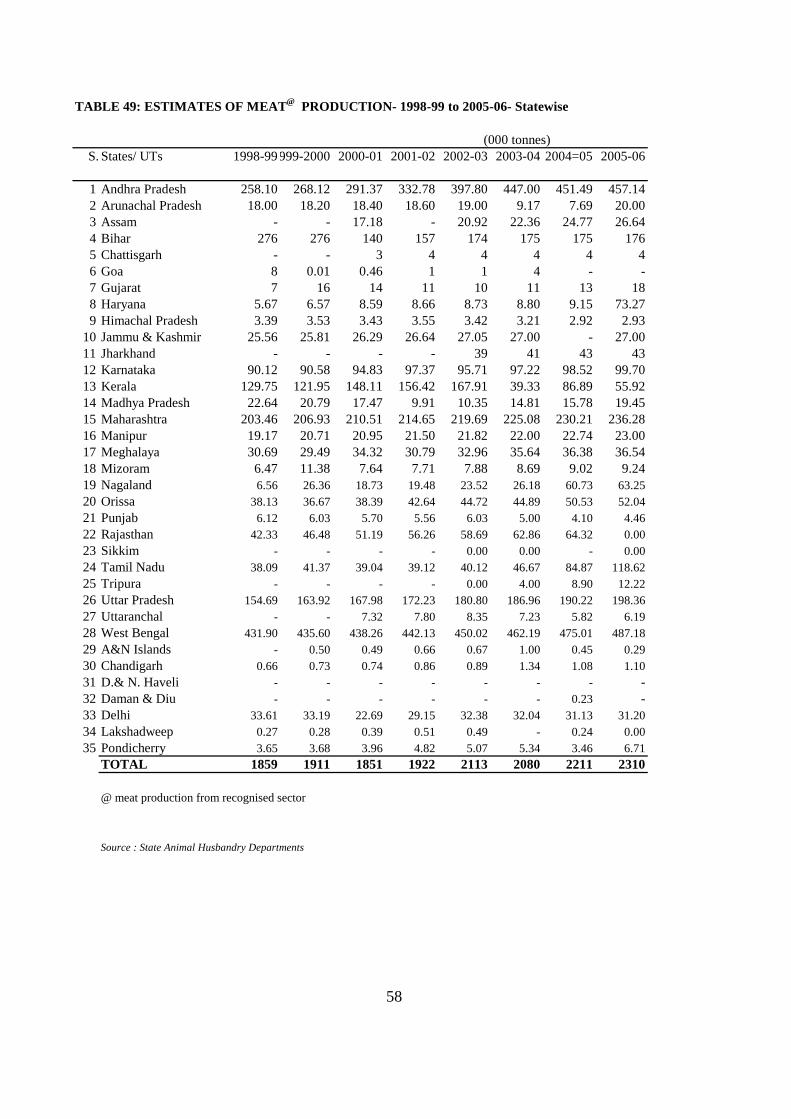
TABLE 49: ESTIMATES OF MEAT@ PRODUCTION- 1998-99 to 2005-06- Statewise
(000 tonnes) S.No.States/ UTs 1998-991999-2000 2000-01 2001-02 2002-03 2003-04 2004=05 2005-06
1 Andhra Pradesh 258.10 268.12 291.37 332.78 397.80 447.00 451.49 457.142 Arunachal Pradesh 18.00 18.20 18.40 18.60 19.00 9.17 7.69 20.003 Assam - - 17.18 - 20.92 22.36 24.77 26.644 Bihar 276 276 140 157 174 175 175 1765 Chattisgarh - - 3 4 4 4 4 46 Goa 8 0.01 0.46 1 1 4 - -7 Gujarat 7 16 14 11 10 11 13 188 Haryana 5.67 6.57 8.59 8.66 8.73 8.80 9.15 73.279 Himachal Pradesh 3.39 3.53 3.43 3.55 3.42 3.21 2.92 2.93
10 Jammu & Kashmir 25.56 25.81 26.29 26.64 27.05 27.00 - 27.0011 Jharkhand - - - - 39 41 43 4312 Karnataka 90.12 90.58 94.83 97.37 95.71 97.22 98.52 99.7013 Kerala 129.75 121.95 148.11 156.42 167.91 39.33 86.89 55.9214 Madhya Pradesh 22.64 20.79 17.47 9.91 10.35 14.81 15.78 19.4515 Maharashtra 203.46 206.93 210.51 214.65 219.69 225.08 230.21 236.2816 Manipur 19.17 20.71 20.95 21.50 21.82 22.00 22.74 23.0017 Meghalaya 30.69 29.49 34.32 30.79 32.96 35.64 36.38 36.5418 Mizoram 6.47 11.38 7.64 7.71 7.88 8.69 9.02 9.2419 Nagaland 6.56 26.36 18.73 19.48 23.52 26.18 60.73 63.2520 Orissa 38.13 36.67 38.39 42.64 44.72 44.89 50.53 52.0421 Punjab 6.12 6.03 5.70 5.56 6.03 5.00 4.10 4.4622 Rajasthan 42.33 46.48 51.19 56.26 58.69 62.86 64.32 0.0023 Sikkim - - - - 0.00 0.00 - 0.0024 Tamil Nadu 38.09 41.37 39.04 39.12 40.12 46.67 84.87 118.6225 Tripura - - - - 0.00 4.00 8.90 12.2226 Uttar Pradesh 154.69 163.92 167.98 172.23 180.80 186.96 190.22 198.3627 Uttaranchal - - 7.32 7.80 8.35 7.23 5.82 6.1928 West Bengal 431.90 435.60 438.26 442.13 450.02 462.19 475.01 487.1829 A&N Islands - 0.50 0.49 0.66 0.67 1.00 0.45 0.2930 Chandigarh 0.66 0.73 0.74 0.86 0.89 1.34 1.08 1.1031 D.& N. Haveli - - - - - - - -32 Daman & Diu - - - - - - 0.23 -33 Delhi 33.61 33.19 22.69 29.15 32.38 32.04 31.13 31.2034 Lakshadweep 0.27 0.28 0.39 0.51 0.49 - 0.24 0.0035 Pondicherry 3.65 3.68 3.96 4.82 5.07 5.34 3.46 6.71
TOTAL 1859 1911 1851 1922 2113 2080 2211 2310
@ meat production from recognised sector
Source : State Animal Husbandry Departments
58
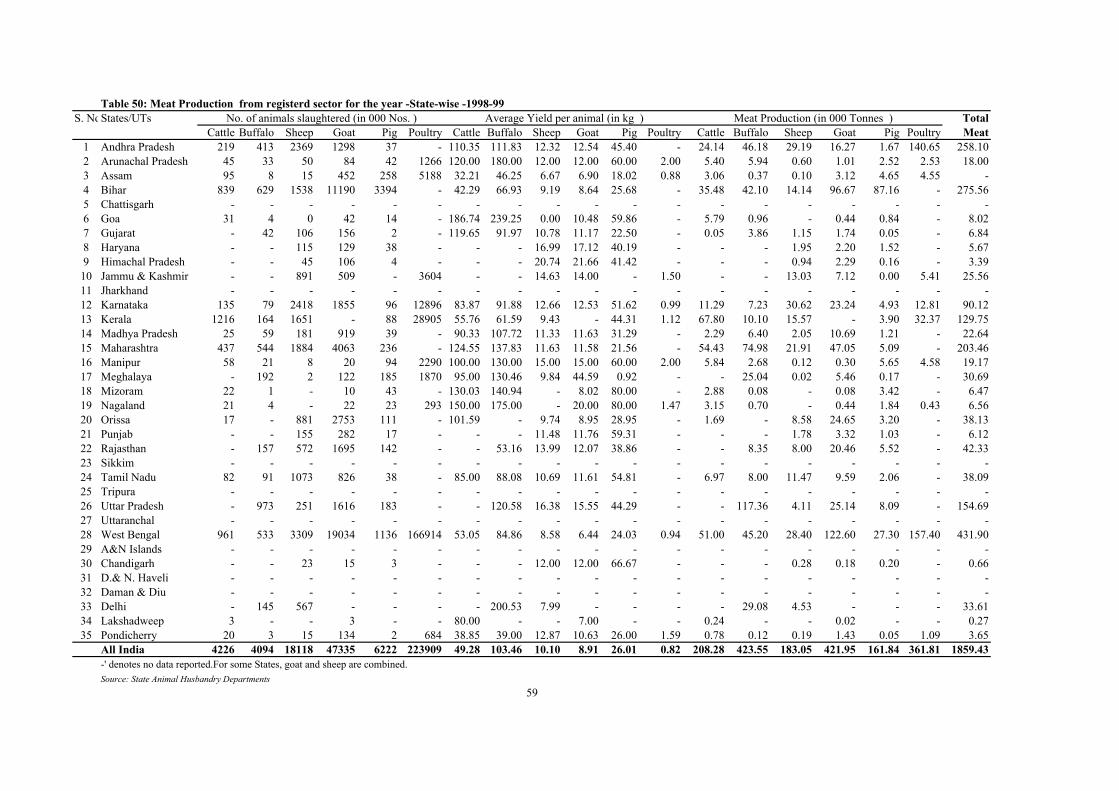
S. NoStates/UTs TotalCattle Buffalo Sheep Goat Pig Poultry Cattle Buffalo Sheep Goat Pig Poultry Cattle Buffalo Sheep Goat Pig Poultry Meat
1 Andhra Pradesh 219 413 2369 1298 37 - 110.35 111.83 12.32 12.54 45.40 - 24.14 46.18 29.19 16.27 1.67 140.65 258.102 Arunachal Pradesh 45 33 50 84 42 1266 120.00 180.00 12.00 12.00 60.00 2.00 5.40 5.94 0.60 1.01 2.52 2.53 18.003 Assam 95 8 15 452 258 5188 32.21 46.25 6.67 6.90 18.02 0.88 3.06 0.37 0.10 3.12 4.65 4.55 -4 Bihar 839 629 1538 11190 3394 - 42.29 66.93 9.19 8.64 25.68 - 35.48 42.10 14.14 96.67 87.16 - 275.565 Chattisgarh - - - - - - - - - - - - - - - - - - -6 Goa 31 4 0 42 14 - 186.74 239.25 0.00 10.48 59.86 - 5.79 0.96 - 0.44 0.84 - 8.027 Gujarat - 42 106 156 2 - 119.65 91.97 10.78 11.17 22.50 - 0.05 3.86 1.15 1.74 0.05 - 6.848 Haryana - - 115 129 38 - - - 16.99 17.12 40.19 - - - 1.95 2.20 1.52 - 5.679 Himachal Pradesh - - 45 106 4 - - - 20.74 21.66 41.42 - - - 0.94 2.29 0.16 - 3.3910 Jammu & Kashmir - - 891 509 - 3604 - - 14.63 14.00 - 1.50 - - 13.03 7.12 0.00 5.41 25.5611 Jharkhand - - - - - - - - - - - - - - - - - - -12 Karnataka 135 79 2418 1855 96 12896 83.87 91.88 12.66 12.53 51.62 0.99 11.29 7.23 30.62 23.24 4.93 12.81 90.1213 Kerala 1216 164 1651 - 88 28905 55.76 61.59 9.43 - 44.31 1.12 67.80 10.10 15.57 - 3.90 32.37 129.7514 Madhya Pradesh 25 59 181 919 39 - 90.33 107.72 11.33 11.63 31.29 - 2.29 6.40 2.05 10.69 1.21 - 22.6415 Maharashtra 437 544 1884 4063 236 - 124.55 137.83 11.63 11.58 21.56 - 54.43 74.98 21.91 47.05 5.09 - 203.4616 Manipur 58 21 8 20 94 2290 100.00 130.00 15.00 15.00 60.00 2.00 5.84 2.68 0.12 0.30 5.65 4.58 19.1717 Meghalaya - 192 2 122 185 1870 95.00 130.46 9.84 44.59 0.92 - - 25.04 0.02 5.46 0.17 - 30.6918 Mizoram 22 1 - 10 43 - 130.03 140.94 - 8.02 80.00 - 2.88 0.08 - 0.08 3.42 - 6.4719 Nagaland 21 4 - 22 23 293 150.00 175.00 - 20.00 80.00 1.47 3.15 0.70 - 0.44 1.84 0.43 6.5620 Orissa 17 - 881 2753 111 - 101.59 - 9.74 8.95 28.95 - 1.69 - 8.58 24.65 3.20 - 38.1321 Punjab - - 155 282 17 - - - 11.48 11.76 59.31 - - - 1.78 3.32 1.03 - 6.1222 Rajasthan - 157 572 1695 142 - - 53.16 13.99 12.07 38.86 - - 8.35 8.00 20.46 5.52 - 42.3323 Sikkim - - - - - - - - - - - - - - - - - - -24 Tamil Nadu 82 91 1073 826 38 - 85.00 88.08 10.69 11.61 54.81 - 6.97 8.00 11.47 9.59 2.06 - 38.0925 Tripura - - - - - - - - - - - - - - - - - - -26 Uttar Pradesh - 973 251 1616 183 - - 120.58 16.38 15.55 44.29 - - 117.36 4.11 25.14 8.09 - 154.6927 Uttaranchal - - - - - - - - - - - - - - - - - - -28 West Bengal 961 533 3309 19034 1136 166914 53.05 84.86 8.58 6.44 24.03 0.94 51.00 45.20 28.40 122.60 27.30 157.40 431.9029 A&N Islands - - - - - - - - - - - - - - - - - - -30 Chandigarh - - 23 15 3 - - - 12.00 12.00 66.67 - - - 0.28 0.18 0.20 - 0.6631 D.& N. Haveli - - - - - - - - - - - - - - - - - - -32 Daman & Diu - - - - - - - - - - - - - - - - - - -33 Delhi - 145 567 - - - - 200.53 7.99 - - - - 29.08 4.53 - - - 33.6134 Lakshadweep 3 - - 3 - - 80.00 - - 7.00 - - 0.24 - - 0.02 - - 0.2735 Pondicherry 20 3 15 134 2 684 38.85 39.00 12.87 10.63 26.00 1.59 0.78 0.12 0.19 1.43 0.05 1.09 3.65
All India 4226 4094 18118 47335 6222 223909 49.28 103.46 10.10 8.91 26.01 0.82 208.28 423.55 183.05 421.95 161.84 361.81 1859.43-' denotes no data reported.For some States, goat and sheep are combined.Source: State Animal Husbandry Departments
59
Table 50: Meat Production from registerd sector for the year -State-wise -1998-99No. of animals slaughtered (in 000 Nos. ) Average Yield per animal (in kg ) Meat Production (in 000 Tonnes )

S. No.States/UTs TotalCattle Buffalo Sheep Goat Pig Poultry Cattle Buffalo Sheep Goat Pig Poultry Cattle Buffalo Sheep Goat Pig Poultry Meat
1 Andhra Pradesh 212 410 2511 1287 40 - 110.02 111.84 12.41 12.48 45.41 - 23.34 45.85 31.16 16.07 1.81 149.90 268.122 Arunachal Pradesh 46 34 51 85 43 1174 120.00 180.00 12.00 12.00 60.00 2.00 5.52 6.12 0.61 1.02 2.58 2.35 18.203 Assam 89 8 16 457 321 6088 35.06 47.50 6.88 6.76 12.52 0.75 3.12 0.38 0.11 3.09 4.02 4.56 -4 Bihar 803 668 1463 11175 3748 - 41.36 65.95 8.41 8.41 24.54 - 33.21 44.06 12.31 94.03 91.99 - 275.595 Chattisgarh - - - - - - - - - - - - - - - - - - -6 Goa - - - - - - 90.00 - - - - - 0.01 - - - - - 0.017 Gujarat 1 43 102 156 1 8761 119.65 91.97 10.78 11.17 22.50 1.06 0.18 3.99 1.10 1.74 0.03 9.27 16.308 Haryana - - 138 143 43 - - - 17.08 17.36 40.31 - - - 2.35 2.48 1.74 - 6.579 Himachal Pradesh - - 60 108 3 - - - 17.22 21.82 43.03 - - - 1.03 2.35 0.14 - 3.53
10 Jammu & Kashmir - - 897 511 - 3624 - - 14.73 14.00 - 1.50 - - 13.22 7.15 0.00 5.44 25.8111 Jharkhand - - - - - - - - - - - - - - - - - - -12 Karnataka 138 88 2441 1685 99 13192 84.10 93.25 12.78 12.65 52.32 1.00 11.57 8.19 31.19 21.31 5.16 13.17 90.5813 Kerala 1441 164 18 - 102 29622 51.70 58.54 9.46 - 44.22 1.12 74.50 9.60 0.17 - 4.51 33.18 121.9514 Madhya Pradesh 26 60 170 771 31 - 89.96 107.24 11.36 11.75 32.68 - 2.34 6.46 1.93 9.06 1.01 - 20.7915 Maharashtra 406 572 2203 4359 209 - 123.97 134.47 11.50 11.40 22.29 - 50.33 76.92 25.33 49.69 4.66 - 206.9316 Manipur 61 25 5 15 103 2431 100.00 130.00 15.02 15.00 60.01 2.00 6.13 3.26 0.07 0.22 6.17 4.86 20.7117 Meghalaya - 197 1 114 192 3102 94.35 122.00 9.17 46.07 1.00 - - 24.02 - 5.27 0.19 - 29.4918 Mizoram 35 1 - 20 81 - 109.69 150.00 - 10.69 87.78 - 3.87 0.20 - 0.22 7.09 - 11.3819 Nagaland 63 74 - 13 46 - 150 175 - 20 80 - 9.47 12.95 - 0.26 3.68 - 26.3620 Orissa 24 - 800 2693 107 - 105.49 - 9.60 8.67 28.65 - 2.57 - 7.68 23.35 3.07 - 36.6721 Punjab - - 165 285 19 - - - 10.80 11.60 50.21 - - - 1.78 3.31 0.93 - 6.0322 Rajasthan - 138 670 1884 191 - - 49.53 13.87 12.10 39.56 - - 6.84 9.29 22.80 7.56 - 46.4823 Sikkim* - - - - - - - - - - - - - - - - - - -24 Tamil Nadu 75 155 870 701 105 - 85.33 88.92 9.30 10.34 55.98 - 6.37 13.77 8.09 7.25 5.88 - 41.3725 Tripura - - - - - - - - - - - - - - - - - - -26 Uttar Pradesh - 1029 273 1698 194 - - 120.75 16.37 15.66 44.29 - - 124.23 4.48 26.59 8.61 - 163.9227 Uttaranchal - - - - - - - - - - - - - - - - - - -28 West Bengal 982 529 3331 19101 1168 166952 53.05 85.07 8.68 6.44 24.06 0.95 52.10 45.00 28.90 123.10 28.10 158.40 435.6029 A&N Islands - - - - - - - - - - - - 0.05 0.03 0.00 0.13 0.29 0.00 0.5030 Chandigarh@ - - 27 17 3 - - - 11.85 11.76 70.00 - - - 0.32 0.20 0.21 - 0.7331 D.& N. Haveli - - - - - - - - - - - - - - - - - - -32 Daman & Diu - - - - - - - - - - - - - - - - - - -33 Delhi - 150 587 - - - - 190.00 7.99 - - - - 28.50 4.69 - - - 33.1934 Lakshadweep 3 - - 5 - - 80.00 - - 7.00 - - 0.25 - - 0.03 - - 0.2835 Pondicherry 18 3 16 129 2 737 39.11 36.00 11.50 11.32 21.00 1.60 0.70 0.11 0.18 1.46 0.04 1.18 3.6836 All India 4424 4348 16814 47411 6851 235684 64.56 105.90 11.06 8.90 27.66 0.99 285.63 460.48 185.99 422.17 189.48 382.30 1910.77
-' denotes no data reported.For some States, goat and sheep are combined.Source: State Animal Husbandry Departments
60
Table 51: Meat Production from registerd sector for the year -State-wise -1999-2000No. of animals slaughtered (in 000 Nos. ) Average Yield per animal (in kg ) Meat Production (in 000 Tonnes )
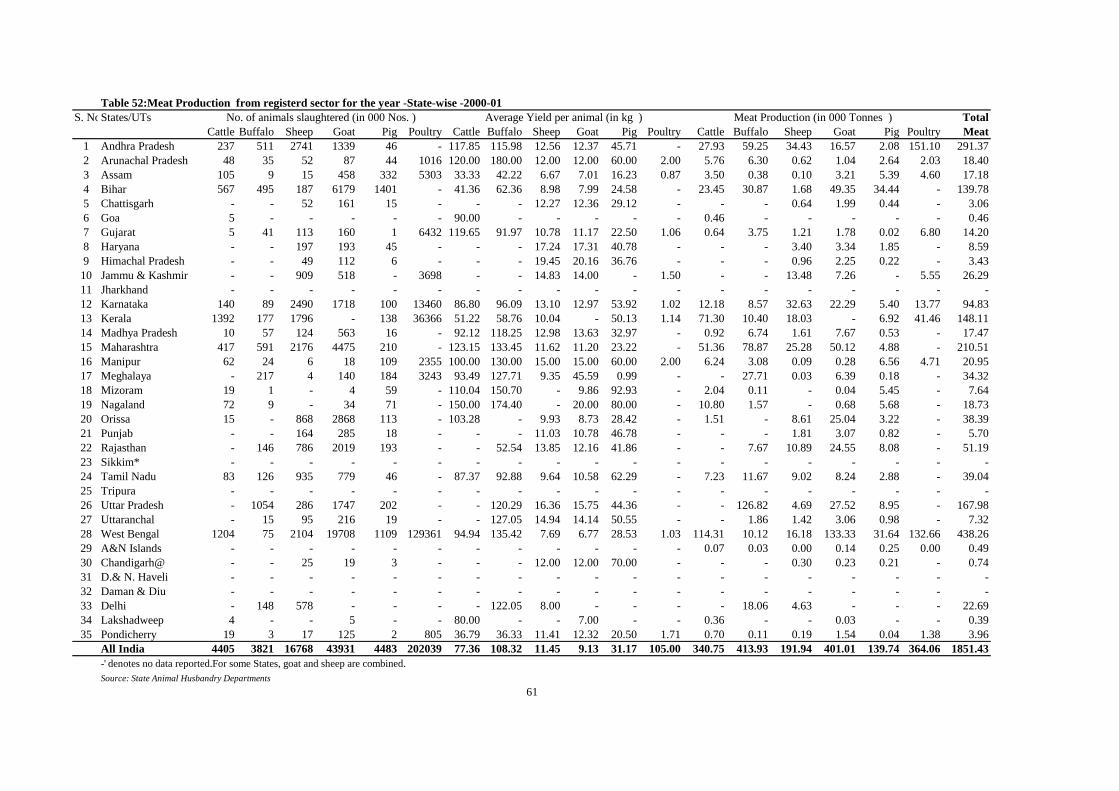
S. No.States/UTs TotalCattle Buffalo Sheep Goat Pig Poultry Cattle Buffalo Sheep Goat Pig Poultry Cattle Buffalo Sheep Goat Pig Poultry Meat
1 Andhra Pradesh 237 511 2741 1339 46 - 117.85 115.98 12.56 12.37 45.71 - 27.93 59.25 34.43 16.57 2.08 151.10 291.372 Arunachal Pradesh 48 35 52 87 44 1016 120.00 180.00 12.00 12.00 60.00 2.00 5.76 6.30 0.62 1.04 2.64 2.03 18.403 Assam 105 9 15 458 332 5303 33.33 42.22 6.67 7.01 16.23 0.87 3.50 0.38 0.10 3.21 5.39 4.60 17.184 Bihar 567 495 187 6179 1401 - 41.36 62.36 8.98 7.99 24.58 - 23.45 30.87 1.68 49.35 34.44 - 139.785 Chattisgarh - - 52 161 15 - - - 12.27 12.36 29.12 - - - 0.64 1.99 0.44 - 3.066 Goa 5 - - - - - 90.00 - - - - - 0.46 - - - - - 0.467 Gujarat 5 41 113 160 1 6432 119.65 91.97 10.78 11.17 22.50 1.06 0.64 3.75 1.21 1.78 0.02 6.80 14.208 Haryana - - 197 193 45 - - - 17.24 17.31 40.78 - - - 3.40 3.34 1.85 - 8.599 Himachal Pradesh - - 49 112 6 - - - 19.45 20.16 36.76 - - - 0.96 2.25 0.22 - 3.43
10 Jammu & Kashmir - - 909 518 - 3698 - - 14.83 14.00 - 1.50 - - 13.48 7.26 - 5.55 26.2911 Jharkhand - - - - - - - - - - - - - - - - - - -12 Karnataka 140 89 2490 1718 100 13460 86.80 96.09 13.10 12.97 53.92 1.02 12.18 8.57 32.63 22.29 5.40 13.77 94.8313 Kerala 1392 177 1796 - 138 36366 51.22 58.76 10.04 - 50.13 1.14 71.30 10.40 18.03 - 6.92 41.46 148.1114 Madhya Pradesh 10 57 124 563 16 - 92.12 118.25 12.98 13.63 32.97 - 0.92 6.74 1.61 7.67 0.53 - 17.4715 Maharashtra 417 591 2176 4475 210 - 123.15 133.45 11.62 11.20 23.22 - 51.36 78.87 25.28 50.12 4.88 - 210.5116 Manipur 62 24 6 18 109 2355 100.00 130.00 15.00 15.00 60.00 2.00 6.24 3.08 0.09 0.28 6.56 4.71 20.9517 Meghalaya - 217 4 140 184 3243 93.49 127.71 9.35 45.59 0.99 - - 27.71 0.03 6.39 0.18 - 34.3218 Mizoram 19 1 - 4 59 - 110.04 150.70 - 9.86 92.93 - 2.04 0.11 - 0.04 5.45 - 7.6419 Nagaland 72 9 - 34 71 - 150.00 174.40 - 20.00 80.00 - 10.80 1.57 - 0.68 5.68 - 18.7320 Orissa 15 - 868 2868 113 - 103.28 - 9.93 8.73 28.42 - 1.51 - 8.61 25.04 3.22 - 38.3921 Punjab - - 164 285 18 - - - 11.03 10.78 46.78 - - - 1.81 3.07 0.82 - 5.7022 Rajasthan - 146 786 2019 193 - - 52.54 13.85 12.16 41.86 - - 7.67 10.89 24.55 8.08 - 51.1923 Sikkim* - - - - - - - - - - - - - - - - - - -24 Tamil Nadu 83 126 935 779 46 - 87.37 92.88 9.64 10.58 62.29 - 7.23 11.67 9.02 8.24 2.88 - 39.0425 Tripura - - - - - - - - - - - - - - - - - - -26 Uttar Pradesh - 1054 286 1747 202 - - 120.29 16.36 15.75 44.36 - - 126.82 4.69 27.52 8.95 - 167.9827 Uttaranchal - 15 95 216 19 - - 127.05 14.94 14.14 50.55 - - 1.86 1.42 3.06 0.98 - 7.3228 West Bengal 1204 75 2104 19708 1109 129361 94.94 135.42 7.69 6.77 28.53 1.03 114.31 10.12 16.18 133.33 31.64 132.66 438.2629 A&N Islands - - - - - - - - - - - - 0.07 0.03 0.00 0.14 0.25 0.00 0.4930 Chandigarh@ - - 25 19 3 - - - 12.00 12.00 70.00 - - - 0.30 0.23 0.21 - 0.7431 D.& N. Haveli - - - - - - - - - - - - - - - - - - -32 Daman & Diu - - - - - - - - - - - - - - - - - - -33 Delhi - 148 578 - - - - 122.05 8.00 - - - - 18.06 4.63 - - - 22.6934 Lakshadweep 4 - - 5 - - 80.00 - - 7.00 - - 0.36 - - 0.03 - - 0.3935 Pondicherry 19 3 17 125 2 805 36.79 36.33 11.41 12.32 20.50 1.71 0.70 0.11 0.19 1.54 0.04 1.38 3.96 All India 4405 3821 16768 43931 4483 202039 77.36 108.32 11.45 9.13 31.17 105.00 340.75 413.93 191.94 401.01 139.74 364.06 1851.43
-' denotes no data reported.For some States, goat and sheep are combined.Source: State Animal Husbandry Departments
61
Table 52:Meat Production from registerd sector for the year -State-wise -2000-01No. of animals slaughtered (in 000 Nos. ) Average Yield per animal (in kg ) Meat Production (in 000 Tonnes )
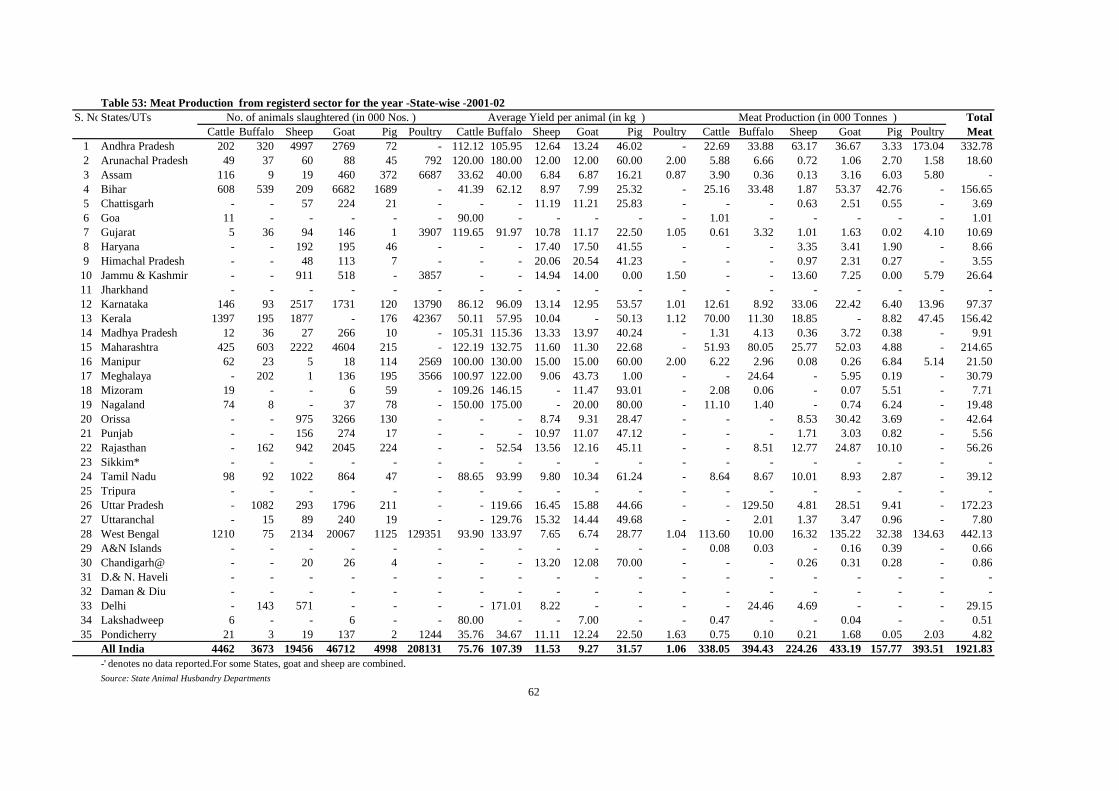
S. No.States/UTs TotalCattle Buffalo Sheep Goat Pig Poultry Cattle Buffalo Sheep Goat Pig Poultry Cattle Buffalo Sheep Goat Pig Poultry Meat
1 Andhra Pradesh 202 320 4997 2769 72 - 112.12 105.95 12.64 13.24 46.02 - 22.69 33.88 63.17 36.67 3.33 173.04 332.782 Arunachal Pradesh 49 37 60 88 45 792 120.00 180.00 12.00 12.00 60.00 2.00 5.88 6.66 0.72 1.06 2.70 1.58 18.603 Assam 116 9 19 460 372 6687 33.62 40.00 6.84 6.87 16.21 0.87 3.90 0.36 0.13 3.16 6.03 5.80 -4 Bihar 608 539 209 6682 1689 - 41.39 62.12 8.97 7.99 25.32 - 25.16 33.48 1.87 53.37 42.76 - 156.655 Chattisgarh - - 57 224 21 - - - 11.19 11.21 25.83 - - - 0.63 2.51 0.55 - 3.696 Goa 11 - - - - - 90.00 - - - - - 1.01 - - - - - 1.017 Gujarat 5 36 94 146 1 3907 119.65 91.97 10.78 11.17 22.50 1.05 0.61 3.32 1.01 1.63 0.02 4.10 10.698 Haryana - - 192 195 46 - - - 17.40 17.50 41.55 - - - 3.35 3.41 1.90 - 8.669 Himachal Pradesh - - 48 113 7 - - - 20.06 20.54 41.23 - - - 0.97 2.31 0.27 - 3.55
10 Jammu & Kashmir - - 911 518 - 3857 - - 14.94 14.00 0.00 1.50 - - 13.60 7.25 0.00 5.79 26.6411 Jharkhand - - - - - - - - - - - - - - - - - - -12 Karnataka 146 93 2517 1731 120 13790 86.12 96.09 13.14 12.95 53.57 1.01 12.61 8.92 33.06 22.42 6.40 13.96 97.3713 Kerala 1397 195 1877 - 176 42367 50.11 57.95 10.04 - 50.13 1.12 70.00 11.30 18.85 - 8.82 47.45 156.4214 Madhya Pradesh 12 36 27 266 10 - 105.31 115.36 13.33 13.97 40.24 - 1.31 4.13 0.36 3.72 0.38 - 9.9115 Maharashtra 425 603 2222 4604 215 - 122.19 132.75 11.60 11.30 22.68 - 51.93 80.05 25.77 52.03 4.88 - 214.6516 Manipur 62 23 5 18 114 2569 100.00 130.00 15.00 15.00 60.00 2.00 6.22 2.96 0.08 0.26 6.84 5.14 21.5017 Meghalaya - 202 1 136 195 3566 100.97 122.00 9.06 43.73 1.00 - - 24.64 - 5.95 0.19 - 30.7918 Mizoram 19 - - 6 59 - 109.26 146.15 - 11.47 93.01 - 2.08 0.06 - 0.07 5.51 - 7.7119 Nagaland 74 8 - 37 78 - 150.00 175.00 - 20.00 80.00 - 11.10 1.40 - 0.74 6.24 - 19.4820 Orissa - - 975 3266 130 - - - 8.74 9.31 28.47 - - - 8.53 30.42 3.69 - 42.6421 Punjab - - 156 274 17 - - - 10.97 11.07 47.12 - - - 1.71 3.03 0.82 - 5.5622 Rajasthan - 162 942 2045 224 - - 52.54 13.56 12.16 45.11 - - 8.51 12.77 24.87 10.10 - 56.2623 Sikkim* - - - - - - - - - - - - - - - - - - -24 Tamil Nadu 98 92 1022 864 47 - 88.65 93.99 9.80 10.34 61.24 - 8.64 8.67 10.01 8.93 2.87 - 39.1225 Tripura - - - - - - - - - - - - - - - - - - -26 Uttar Pradesh - 1082 293 1796 211 - - 119.66 16.45 15.88 44.66 - - 129.50 4.81 28.51 9.41 - 172.2327 Uttaranchal - 15 89 240 19 - - 129.76 15.32 14.44 49.68 - - 2.01 1.37 3.47 0.96 - 7.8028 West Bengal 1210 75 2134 20067 1125 129351 93.90 133.97 7.65 6.74 28.77 1.04 113.60 10.00 16.32 135.22 32.38 134.63 442.1329 A&N Islands - - - - - - - - - - - - 0.08 0.03 - 0.16 0.39 - 0.6630 Chandigarh@ - - 20 26 4 - - - 13.20 12.08 70.00 - - - 0.26 0.31 0.28 - 0.8631 D.& N. Haveli - - - - - - - - - - - - - - - - - - -32 Daman & Diu - - - - - - - - - - - - - - - - - - -33 Delhi - 143 571 - - - - 171.01 8.22 - - - - 24.46 4.69 - - - 29.1534 Lakshadweep 6 - - 6 - - 80.00 - - 7.00 - - 0.47 - - 0.04 - - 0.5135 Pondicherry 21 3 19 137 2 1244 35.76 34.67 11.11 12.24 22.50 1.63 0.75 0.10 0.21 1.68 0.05 2.03 4.82 All India 4462 3673 19456 46712 4998 208131 75.76 107.39 11.53 9.27 31.57 1.06 338.05 394.43 224.26 433.19 157.77 393.51 1921.83
-' denotes no data reported.For some States, goat and sheep are combined.Source: State Animal Husbandry Departments
62
Table 53: Meat Production from registerd sector for the year -State-wise -2001-02No. of animals slaughtered (in 000 Nos. ) Average Yield per animal (in kg ) Meat Production (in 000 Tonnes )
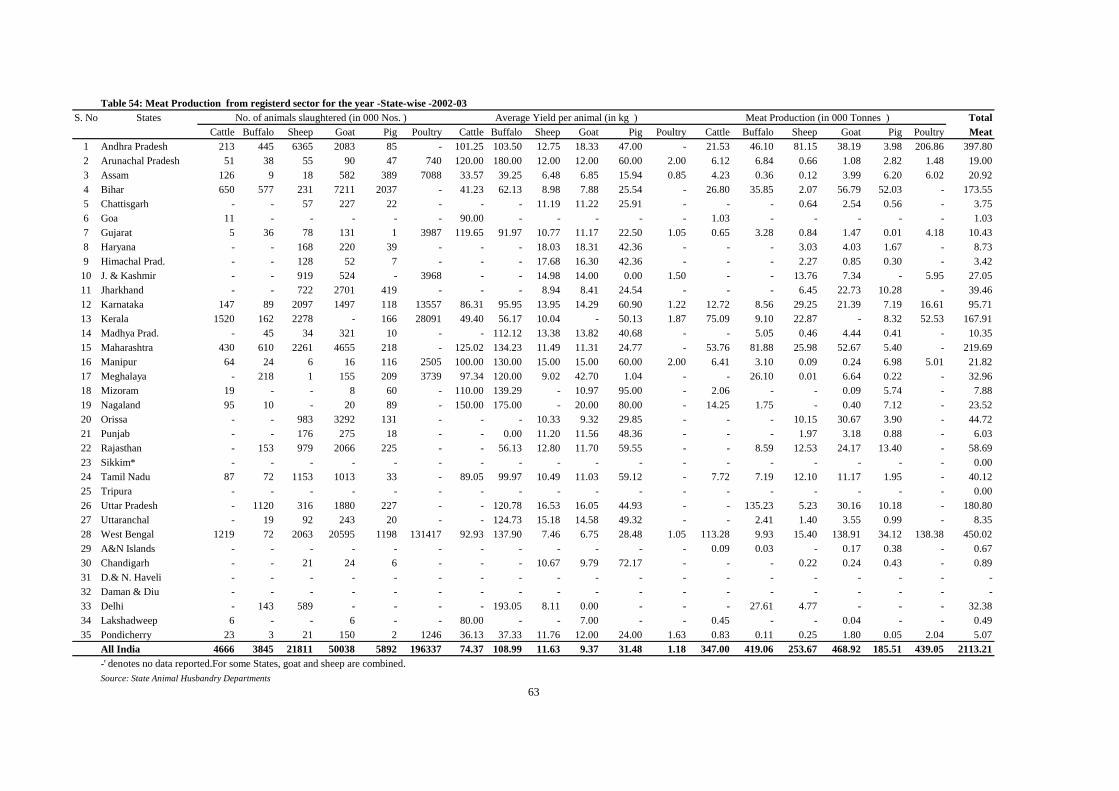
S. No. States TotalCattle Buffalo Sheep Goat Pig Poultry Cattle Buffalo Sheep Goat Pig Poultry Cattle Buffalo Sheep Goat Pig Poultry Meat
1 Andhra Pradesh 213 445 6365 2083 85 - 101.25 103.50 12.75 18.33 47.00 - 21.53 46.10 81.15 38.19 3.98 206.86 397.802 Arunachal Pradesh 51 38 55 90 47 740 120.00 180.00 12.00 12.00 60.00 2.00 6.12 6.84 0.66 1.08 2.82 1.48 19.003 Assam 126 9 18 582 389 7088 33.57 39.25 6.48 6.85 15.94 0.85 4.23 0.36 0.12 3.99 6.20 6.02 20.924 Bihar 650 577 231 7211 2037 - 41.23 62.13 8.98 7.88 25.54 - 26.80 35.85 2.07 56.79 52.03 - 173.555 Chattisgarh - - 57 227 22 - - - 11.19 11.22 25.91 - - - 0.64 2.54 0.56 - 3.756 Goa 11 - - - - - 90.00 - - - - - 1.03 - - - - - 1.037 Gujarat 5 36 78 131 1 3987 119.65 91.97 10.77 11.17 22.50 1.05 0.65 3.28 0.84 1.47 0.01 4.18 10.438 Haryana - - 168 220 39 - - - 18.03 18.31 42.36 - - - 3.03 4.03 1.67 - 8.739 Himachal Prad. - - 128 52 7 - - - 17.68 16.30 42.36 - - - 2.27 0.85 0.30 - 3.4210 J. & Kashmir - - 919 524 - 3968 - - 14.98 14.00 0.00 1.50 - - 13.76 7.34 - 5.95 27.0511 Jharkhand - - 722 2701 419 - - - 8.94 8.41 24.54 - - - 6.45 22.73 10.28 - 39.4612 Karnataka 147 89 2097 1497 118 13557 86.31 95.95 13.95 14.29 60.90 1.22 12.72 8.56 29.25 21.39 7.19 16.61 95.7113 Kerala 1520 162 2278 - 166 28091 49.40 56.17 10.04 - 50.13 1.87 75.09 9.10 22.87 - 8.32 52.53 167.9114 Madhya Prad. - 45 34 321 10 - - 112.12 13.38 13.82 40.68 - - 5.05 0.46 4.44 0.41 - 10.3515 Maharashtra 430 610 2261 4655 218 - 125.02 134.23 11.49 11.31 24.77 - 53.76 81.88 25.98 52.67 5.40 - 219.6916 Manipur 64 24 6 16 116 2505 100.00 130.00 15.00 15.00 60.00 2.00 6.41 3.10 0.09 0.24 6.98 5.01 21.8217 Meghalaya - 218 1 155 209 3739 97.34 120.00 9.02 42.70 1.04 - - 26.10 0.01 6.64 0.22 - 32.9618 Mizoram 19 - - 8 60 - 110.00 139.29 - 10.97 95.00 - 2.06 - - 0.09 5.74 - 7.8819 Nagaland 95 10 - 20 89 - 150.00 175.00 - 20.00 80.00 - 14.25 1.75 - 0.40 7.12 - 23.5220 Orissa - - 983 3292 131 - - - 10.33 9.32 29.85 - - - 10.15 30.67 3.90 - 44.7221 Punjab - - 176 275 18 - - 0.00 11.20 11.56 48.36 - - - 1.97 3.18 0.88 - 6.0322 Rajasthan - 153 979 2066 225 - - 56.13 12.80 11.70 59.55 - - 8.59 12.53 24.17 13.40 - 58.6923 Sikkim* - - - - - - - - - - - - - - - - - - 0.0024 Tamil Nadu 87 72 1153 1013 33 - 89.05 99.97 10.49 11.03 59.12 - 7.72 7.19 12.10 11.17 1.95 - 40.1225 Tripura - - - - - - - - - - - - - - - - - - 0.0026 Uttar Pradesh - 1120 316 1880 227 - - 120.78 16.53 16.05 44.93 - - 135.23 5.23 30.16 10.18 - 180.8027 Uttaranchal - 19 92 243 20 - - 124.73 15.18 14.58 49.32 - - 2.41 1.40 3.55 0.99 - 8.3528 West Bengal 1219 72 2063 20595 1198 131417 92.93 137.90 7.46 6.75 28.48 1.05 113.28 9.93 15.40 138.91 34.12 138.38 450.0229 A&N Islands - - - - - - - - - - - - 0.09 0.03 - 0.17 0.38 - 0.6730 Chandigarh - - 21 24 6 - - - 10.67 9.79 72.17 - - - 0.22 0.24 0.43 - 0.8931 D.& N. Haveli - - - - - - - - - - - - - - - - - - -32 Daman & Diu - - - - - - - - - - - - - - - - - - -33 Delhi - 143 589 - - - - 193.05 8.11 0.00 - - - 27.61 4.77 - - - 32.3834 Lakshadweep 6 - - 6 - - 80.00 - - 7.00 - - 0.45 - - 0.04 - - 0.4935 Pondicherry 23 3 21 150 2 1246 36.13 37.33 11.76 12.00 24.00 1.63 0.83 0.11 0.25 1.80 0.05 2.04 5.07 All India 4666 3845 21811 50038 5892 196337 74.37 108.99 11.63 9.37 31.48 1.18 347.00 419.06 253.67 468.92 185.51 439.05 2113.21
-' denotes no data reported.For some States, goat and sheep are combined.Source: State Animal Husbandry Departments
63
Table 54: Meat Production from registerd sector for the year -State-wise -2002-03No. of animals slaughtered (in 000 Nos. ) Average Yield per animal (in kg ) Meat Production (in 000 Tonnes )

Table 55: Meat Production from registerd sector for the year -State-wise -2003-04S. No. States Total Meat
Cattle & BuffaloCattle Buffalo Cattle Buffalo Cattle Buffalo (000 Tonnes)
1 Andhra Pradesh 126 550 101.33 103.51 12.768 56.929 69.6972 Arunachal Pradesh 38 - 145.98 - 5.562 - 5.5623 Assam - - - - 4.235 0.365 4.6004 Bihar - - - - - - -5 Chhattisgarh - - - - - - -6 Goa 43 - 89.99 - 3.909 - 3.9097 Gujarat 5 38 119.64 91.98 0.578 3.455 4.0338 Haryana - - - - - - -9 Himachal Pradesh - - - - - - -
10 Jammu & Kashmir - - - - - - -11 Jharkhand - - - - - - -12 Karnataka 153 75 86.18 94.61 13.205 7.082 20.28713 Kerala - - - - - - -14 Madhya Pradesh - 59 - 117.29 - 6.873 6.87315 Maharashtra 425 664 124.06 134.10 52.727 89.040 141.76716 Manipur - - - - - - -17 Meghalaya 214 4 97.47 109.44 20.889 0.394 21.28318 Mizoram 12 0.30 109.97 138.51 1.371 0.041 1.41219 Nagaland 85 11 119.97 174.35 10.220 1.890 12.11020 Orissa 1 - 95.09 - 0.122 - 0.12221 Punjab - - - - - - -22 Rajasthan - 148 - 58.11 - 8.600 8.60023 Sikkim - - - - - - -24 Tamil Nadu** 96 71 109.60 127.50 10.469 8.995 19.46425 Tripura - - - - - - -26 Uttar Pradesh - 1143 - 121.68 - 139.043 139.04327 Uttaranchal - 11 - 125.27 - 1.359 1.35928 West Bengal 1218 65 94.51 149.58 115.117 9.723 124.84029 A&N Islands - - - - - - -30 Chandigarh - - - - - - -31 Dadra & Nagar Haveli - - - - - - -32 Daman & Diu - - - - - - -33 Delhi - 144 - 190.00 - 27.360 27.36034 Lakshadweep - - - - - - -35 Pondicherry 23 3 36.99 39.93 0.864 0.119 0.983 All India 2441 2984 101.53 120.95 252 361 613
-' denotes no data reported. ** from both the sectorsSource: State Animal Husbandry Departments
No. of animals Average Yield Rate Meat Production
64
slaughtered (in 000 ) per animal (in kg ) (in 000 Tonnes )
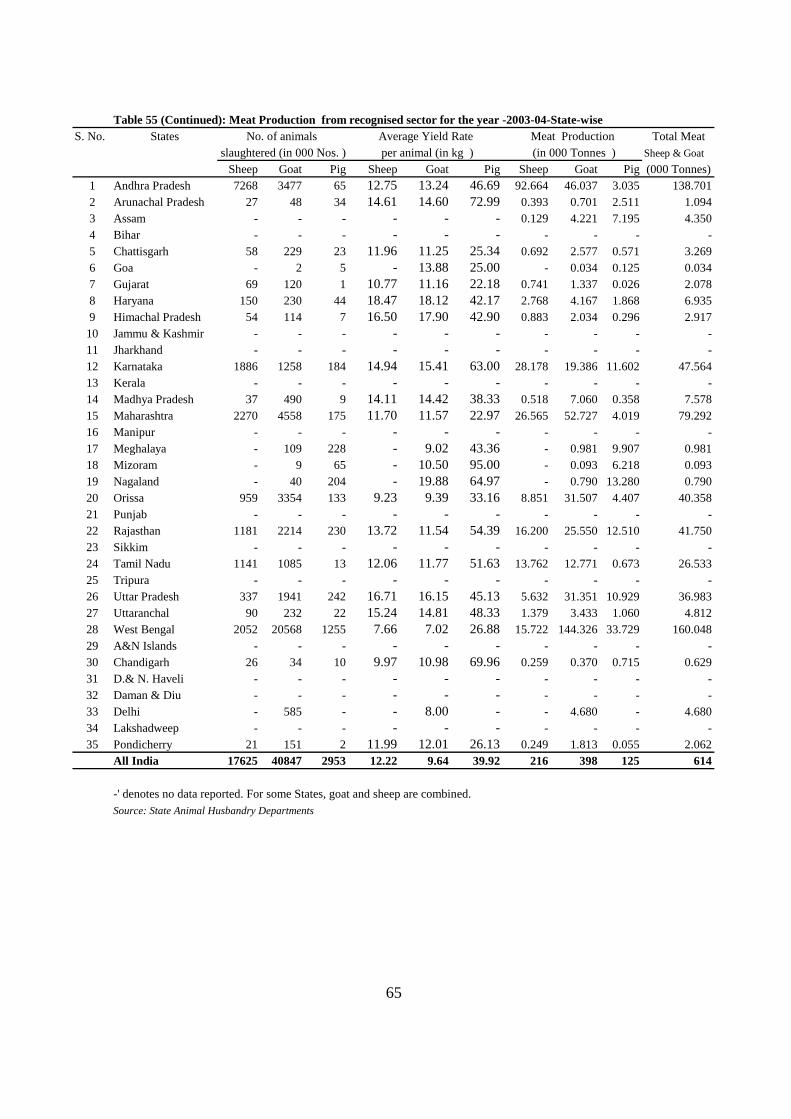
Table 55 (Continued): Meat Production from recognised sector for the year -2003-04-State-wiseS. No. States Total Meat
Sheep & GoatSheep Goat Pig Sheep Goat Pig Sheep Goat Pig (000 Tonnes)
1 Andhra Pradesh 7268 3477 65 12.75 13.24 46.69 92.664 46.037 3.035 138.7012 Arunachal Pradesh 27 48 34 14.61 14.60 72.99 0.393 0.701 2.511 1.0943 Assam - - - - - - 0.129 4.221 7.195 4.3504 Bihar - - - - - - - - - -5 Chattisgarh 58 229 23 11.96 11.25 25.34 0.692 2.577 0.571 3.2696 Goa - 2 5 - 13.88 25.00 - 0.034 0.125 0.0347 Gujarat 69 120 1 10.77 11.16 22.18 0.741 1.337 0.026 2.0788 Haryana 150 230 44 18.47 18.12 42.17 2.768 4.167 1.868 6.9359 Himachal Pradesh 54 114 7 16.50 17.90 42.90 0.883 2.034 0.296 2.917
10 Jammu & Kashmir - - - - - - - - - -11 Jharkhand - - - - - - - - - -12 Karnataka 1886 1258 184 14.94 15.41 63.00 28.178 19.386 11.602 47.56413 Kerala - - - - - - - - - -14 Madhya Pradesh 37 490 9 14.11 14.42 38.33 0.518 7.060 0.358 7.57815 Maharashtra 2270 4558 175 11.70 11.57 22.97 26.565 52.727 4.019 79.29216 Manipur - - - - - - - - - -17 Meghalaya - 109 228 - 9.02 43.36 - 0.981 9.907 0.98118 Mizoram - 9 65 - 10.50 95.00 - 0.093 6.218 0.09319 Nagaland - 40 204 - 19.88 64.97 - 0.790 13.280 0.79020 Orissa 959 3354 133 9.23 9.39 33.16 8.851 31.507 4.407 40.35821 Punjab - - - - - - - - - -22 Rajasthan 1181 2214 230 13.72 11.54 54.39 16.200 25.550 12.510 41.75023 Sikkim - - - - - - - - - -24 Tamil Nadu 1141 1085 13 12.06 11.77 51.63 13.762 12.771 0.673 26.53325 Tripura - - - - - - - - - -26 Uttar Pradesh 337 1941 242 16.71 16.15 45.13 5.632 31.351 10.929 36.98327 Uttaranchal 90 232 22 15.24 14.81 48.33 1.379 3.433 1.060 4.81228 West Bengal 2052 20568 1255 7.66 7.02 26.88 15.722 144.326 33.729 160.04829 A&N Islands - - - - - - - - - -30 Chandigarh 26 34 10 9.97 10.98 69.96 0.259 0.370 0.715 0.62931 D.& N. Haveli - - - - - - - - - -32 Daman & Diu - - - - - - - - - -33 Delhi - 585 - - 8.00 - - 4.680 - 4.68034 Lakshadweep - - - - - - - - - -35 Pondicherry 21 151 2 11.99 12.01 26.13 0.249 1.813 0.055 2.062 All India 17625 40847 2953 12.22 9.64 39.92 216 398 125 614
-' denotes no data reported. For some States, goat and sheep are combined.Source: State Animal Husbandry Departments
No. of animals Average Yield Rate Meat Production
65
slaughtered (in 000 Nos. ) per animal (in kg ) (in 000 Tonnes )
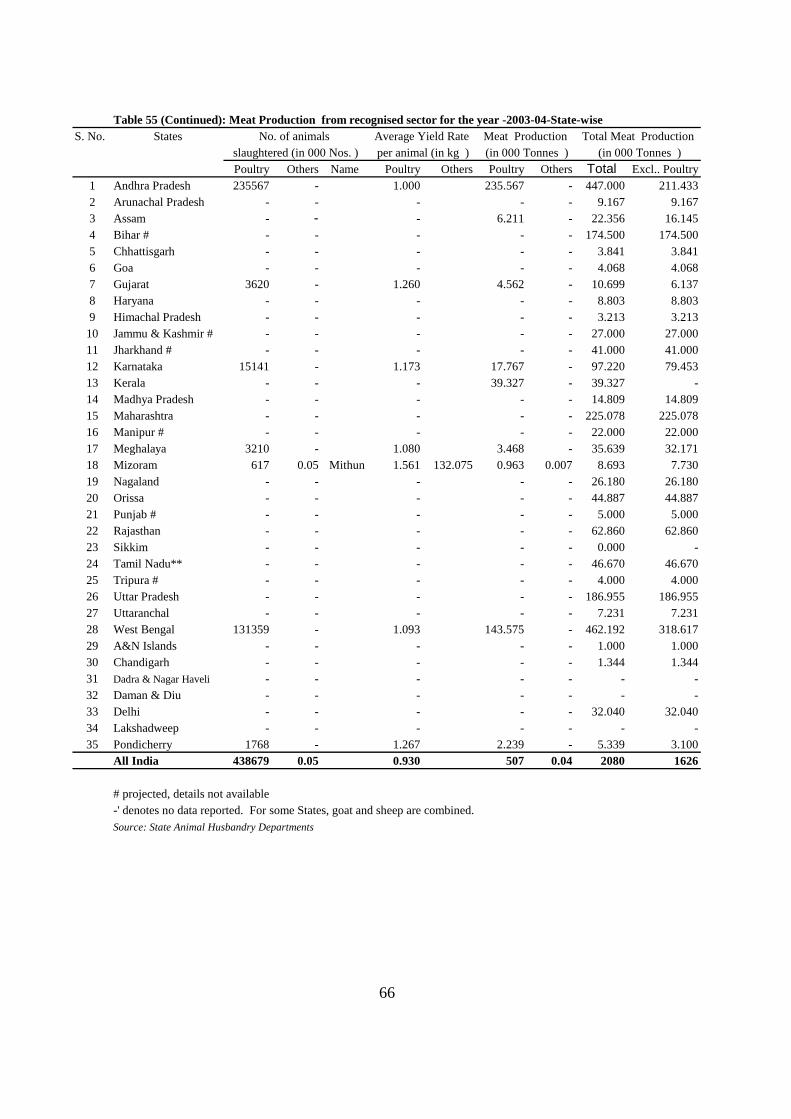
Table 55 (Continued): Meat Production from recognised sector for the year -2003-04-State-wiseS. No. States
Poultry Others Name Poultry Others Poultry Others Total Excl.. Poultry1 Andhra Pradesh 235567 - 1.000 235.567 - 447.000 211.4332 Arunachal Pradesh - - - - - 9.167 9.1673 Assam - - - 6.211 - 22.356 16.1454 Bihar # - - - - - 174.500 174.5005 Chhattisgarh - - - - - 3.841 3.8416 Goa - - - - - 4.068 4.0687 Gujarat 3620 - 1.260 4.562 - 10.699 6.1378 Haryana - - - - - 8.803 8.8039 Himachal Pradesh - - - - - 3.213 3.213
10 Jammu & Kashmir # - - - - - 27.000 27.00011 Jharkhand # - - - - - 41.000 41.00012 Karnataka 15141 - 1.173 17.767 - 97.220 79.45313 Kerala - - - 39.327 - 39.327 -14 Madhya Pradesh - - - - - 14.809 14.80915 Maharashtra - - - - - 225.078 225.07816 Manipur # - - - - - 22.000 22.00017 Meghalaya 3210 - 1.080 3.468 - 35.639 32.17118 Mizoram 617 0.05 Mithun 1.561 132.075 0.963 0.007 8.693 7.73019 Nagaland - - - - - 26.180 26.18020 Orissa - - - - - 44.887 44.88721 Punjab # - - - - - 5.000 5.00022 Rajasthan - - - - - 62.860 62.86023 Sikkim - - - - - 0.000 -24 Tamil Nadu** - - - - - 46.670 46.67025 Tripura # - - - - - 4.000 4.00026 Uttar Pradesh - - - - - 186.955 186.95527 Uttaranchal - - - - - 7.231 7.23128 West Bengal 131359 - 1.093 143.575 - 462.192 318.61729 A&N Islands - - - - - 1.000 1.00030 Chandigarh - - - - - 1.344 1.34431 Dadra & Nagar Haveli - - - - - - -32 Daman & Diu - - - - - - -33 Delhi - - - - - 32.040 32.04034 Lakshadweep - - - - - - -35 Pondicherry 1768 - 1.267 2.239 - 5.339 3.100 All India 438679 0.05 0.930 507 0.04 2080 1626
# projected, details not available-' denotes no data reported. For some States, goat and sheep are combined.Source: State Animal Husbandry Departments
66
Meat Production Total Meat Productionslaughtered (in 000 Nos. ) per animal (in kg ) (in 000 Tonnes ) (in 000 Tonnes )
No. of animals Average Yield Rate

Table 56: Meat Production from registerd sector for the year -State-wise -2004-05S. No. States Total Meat
Cattle & BuffaloCattle Buffalo Cattle Buffalo Cattle Buffalo (000 Tonnes)
1 Andhra Pradesh 76 576 90.10 110.29 6.881 63.481 70.3622 Arunachal Pradesh 38 - 120.00 - 4.602 - 4.6023 Assam 117 6 36.98 56.89 4.343 0.353 4.6974 Bihar 636 580 40.88 62.07 26.000 36.000 62.0005 Chattisgarh - - - - - - -6 Goa - - - - - - -7 Gujarat 3 26 119.65 91.97 0.334 2.437 2.7718 Haryana - - - - - - -9 Himachal Pradesh - - - - - - -
10 Jammu & Kashmir - - - - - - -11 Jharkhand - - - - - - -12 Karnataka 154 86 86.66 95.38 13.321 8.182 21.50313 Kerala 628 182 52.87 54.06 33.181 9.846 43.02714 Madhya Pradesh - 64 - 116.06 - 7.393 7.39315 Maharashtra 485 627 125.73 137.94 60.977 86.486 147.46316 Manipur 65 25 100.00 130.00 6.539 3.298 9.83717 Meghalaya 239 4 88.51 112.90 21.120 0.420 21.54018 Mizoram 12 0 109.97 140.58 1.303 0.044 1.34719 Nagaland 170 17 152.54 172.98 25.920 2.880 28.80020 Orissa - - - - - - -21 Punjab - - - - - - -22 Rajasthan - 163 - 56.20 - 9.160 9.16023 Sikkim - - - - - - -24 Tamil Nadu** 71 50 101.60 115.02 7.214 5.710 12.92525 Tripura - - - - - - -26 Uttar Pradesh - 1158 - 121.73 - 141.022 141.02227 Uttaranchal - 9 - 126.08 - 1.161 1.16128 West Bengal 1236 69 98.83 148.68 122.155 10.259 132.41429 A&N Islands 0 0 202.45 201.44 0.060 0.020 0.08030 Chandigarh - - - - - - -31 D.& N. Haveli - - - - - - -32 Daman & Diu - - - - 0.050 - 0.05033 Delhi - 139 - 190.00 - 26.410 26.41034 Lakshadweep 1 - 45.01 - 0.041 - 0.04135 Pondicherry 22 2 41.97 46.03 0.927 0.112 1.039 All India 3953 3784 84.72 109.59 335 415 750
'-' denotes no data reported. ** Unregistered sector also included.
Source: State Animal Husbandry Departments
No. of animals Average Yield Rate Meat Production
67
slaughtered (in 000 ) per animal (in kg ) (in 000 Tonnes )
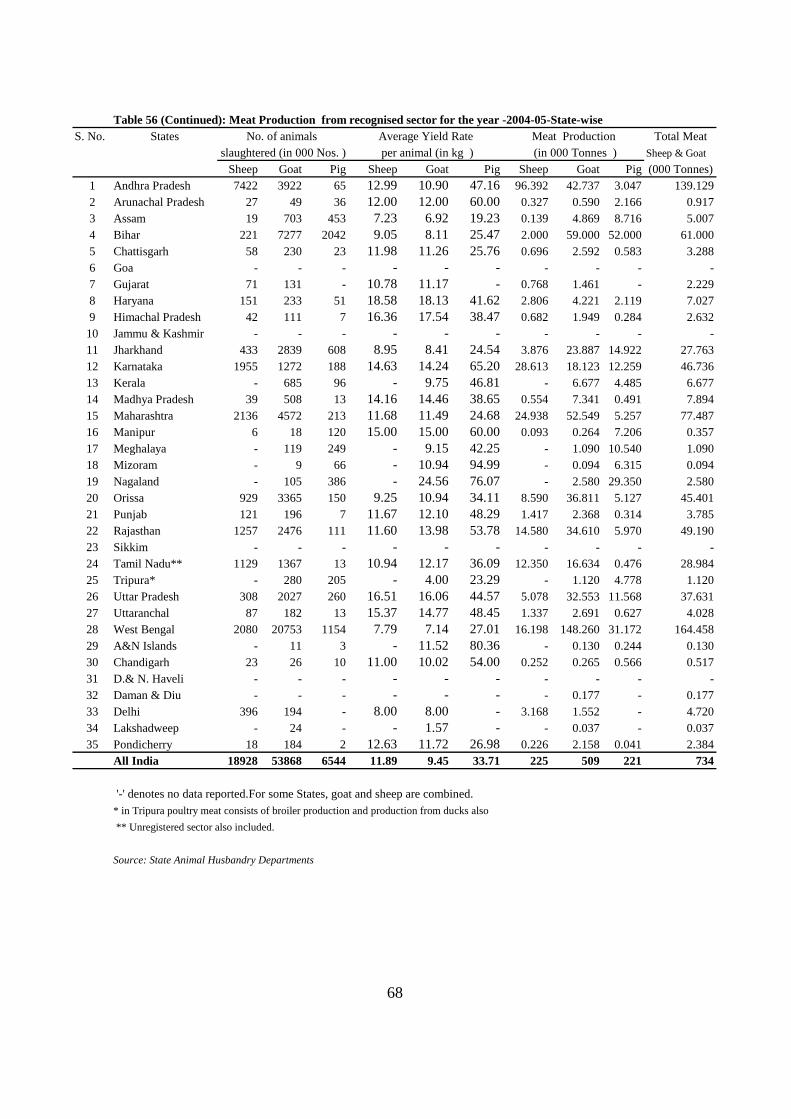
Table 56 (Continued): Meat Production from recognised sector for the year -2004-05-State-wiseS. No. States Total Meat
Sheep & GoatSheep Goat Pig Sheep Goat Pig Sheep Goat Pig (000 Tonnes)
1 Andhra Pradesh 7422 3922 65 12.99 10.90 47.16 96.392 42.737 3.047 139.1292 Arunachal Pradesh 27 49 36 12.00 12.00 60.00 0.327 0.590 2.166 0.9173 Assam 19 703 453 7.23 6.92 19.23 0.139 4.869 8.716 5.0074 Bihar 221 7277 2042 9.05 8.11 25.47 2.000 59.000 52.000 61.0005 Chattisgarh 58 230 23 11.98 11.26 25.76 0.696 2.592 0.583 3.2886 Goa - - - - - - - - - -7 Gujarat 71 131 - 10.78 11.17 - 0.768 1.461 - 2.2298 Haryana 151 233 51 18.58 18.13 41.62 2.806 4.221 2.119 7.0279 Himachal Pradesh 42 111 7 16.36 17.54 38.47 0.682 1.949 0.284 2.632
10 Jammu & Kashmir - - - - - - - - - -11 Jharkhand 433 2839 608 8.95 8.41 24.54 3.876 23.887 14.922 27.76312 Karnataka 1955 1272 188 14.63 14.24 65.20 28.613 18.123 12.259 46.73613 Kerala - 685 96 - 9.75 46.81 - 6.677 4.485 6.67714 Madhya Pradesh 39 508 13 14.16 14.46 38.65 0.554 7.341 0.491 7.89415 Maharashtra 2136 4572 213 11.68 11.49 24.68 24.938 52.549 5.257 77.48716 Manipur 6 18 120 15.00 15.00 60.00 0.093 0.264 7.206 0.35717 Meghalaya - 119 249 - 9.15 42.25 - 1.090 10.540 1.09018 Mizoram - 9 66 - 10.94 94.99 - 0.094 6.315 0.09419 Nagaland - 105 386 - 24.56 76.07 - 2.580 29.350 2.58020 Orissa 929 3365 150 9.25 10.94 34.11 8.590 36.811 5.127 45.40121 Punjab 121 196 7 11.67 12.10 48.29 1.417 2.368 0.314 3.78522 Rajasthan 1257 2476 111 11.60 13.98 53.78 14.580 34.610 5.970 49.19023 Sikkim - - - - - - - - - -24 Tamil Nadu** 1129 1367 13 10.94 12.17 36.09 12.350 16.634 0.476 28.98425 Tripura* - 280 205 - 4.00 23.29 - 1.120 4.778 1.12026 Uttar Pradesh 308 2027 260 16.51 16.06 44.57 5.078 32.553 11.568 37.63127 Uttaranchal 87 182 13 15.37 14.77 48.45 1.337 2.691 0.627 4.02828 West Bengal 2080 20753 1154 7.79 7.14 27.01 16.198 148.260 31.172 164.45829 A&N Islands - 11 3 - 11.52 80.36 - 0.130 0.244 0.13030 Chandigarh 23 26 10 11.00 10.02 54.00 0.252 0.265 0.566 0.51731 D.& N. Haveli - - - - - - - - - -32 Daman & Diu - - - - - - - 0.177 - 0.17733 Delhi 396 194 - 8.00 8.00 - 3.168 1.552 - 4.72034 Lakshadweep - 24 - - 1.57 - - 0.037 - 0.03735 Pondicherry 18 184 2 12.63 11.72 26.98 0.226 2.158 0.041 2.384 All India 18928 53868 6544 11.89 9.45 33.71 225 509 221 734
'-' denotes no data reported.For some States, goat and sheep are combined.* in Tripura poultry meat consists of broiler production and production from ducks also ** Unregistered sector also included.
Source: State Animal Husbandry Departments
No. of animals Average Yield Rate Meat Production
68
slaughtered (in 000 Nos. ) per animal (in kg ) (in 000 Tonnes )
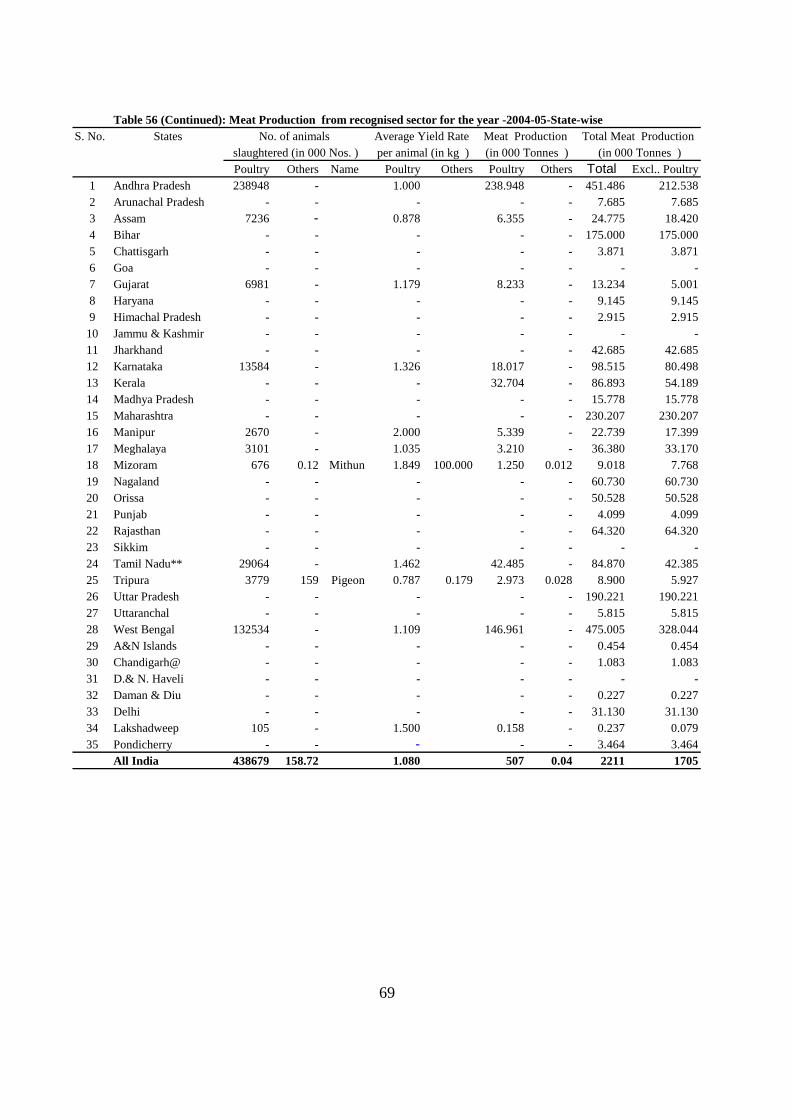
Table 56 (Continued): Meat Production from recognised sector for the year -2004-05-State-wiseS. No. States
Poultry Others Name Poultry Others Poultry Others Total Excl.. Poultry1 Andhra Pradesh 238948 - 1.000 238.948 - 451.486 212.5382 Arunachal Pradesh - - - - - 7.685 7.6853 Assam 7236 - 0.878 6.355 - 24.775 18.4204 Bihar - - - - - 175.000 175.0005 Chattisgarh - - - - - 3.871 3.8716 Goa - - - - - - -7 Gujarat 6981 - 1.179 8.233 - 13.234 5.0018 Haryana - - - - - 9.145 9.1459 Himachal Pradesh - - - - - 2.915 2.915
10 Jammu & Kashmir - - - - - - -11 Jharkhand - - - - - 42.685 42.68512 Karnataka 13584 - 1.326 18.017 - 98.515 80.49813 Kerala - - - 32.704 - 86.893 54.18914 Madhya Pradesh - - - - - 15.778 15.77815 Maharashtra - - - - - 230.207 230.20716 Manipur 2670 - 2.000 5.339 - 22.739 17.39917 Meghalaya 3101 - 1.035 3.210 - 36.380 33.17018 Mizoram 676 0.12 Mithun 1.849 100.000 1.250 0.012 9.018 7.76819 Nagaland - - - - - 60.730 60.73020 Orissa - - - - - 50.528 50.52821 Punjab - - - - - 4.099 4.09922 Rajasthan - - - - - 64.320 64.32023 Sikkim - - - - - - -24 Tamil Nadu** 29064 - 1.462 42.485 - 84.870 42.38525 Tripura 3779 159 Pigeon 0.787 0.179 2.973 0.028 8.900 5.92726 Uttar Pradesh - - - - - 190.221 190.22127 Uttaranchal - - - - - 5.815 5.81528 West Bengal 132534 - 1.109 146.961 - 475.005 328.04429 A&N Islands - - - - - 0.454 0.45430 Chandigarh@ - - - - - 1.083 1.08331 D.& N. Haveli - - - - - - -32 Daman & Diu - - - - - 0.227 0.22733 Delhi - - - - - 31.130 31.13034 Lakshadweep 105 - 1.500 0.158 - 0.237 0.07935 Pondicherry - - - - - 3.464 3.464 All India 438679 158.72 1.080 507 0.04 2211 1705
69
slaughtered (in 000 Nos. ) per animal (in kg ) (in 000 Tonnes ) (in 000 Tonnes )No. of animals Average Yield Rate Meat Production Total Meat Production
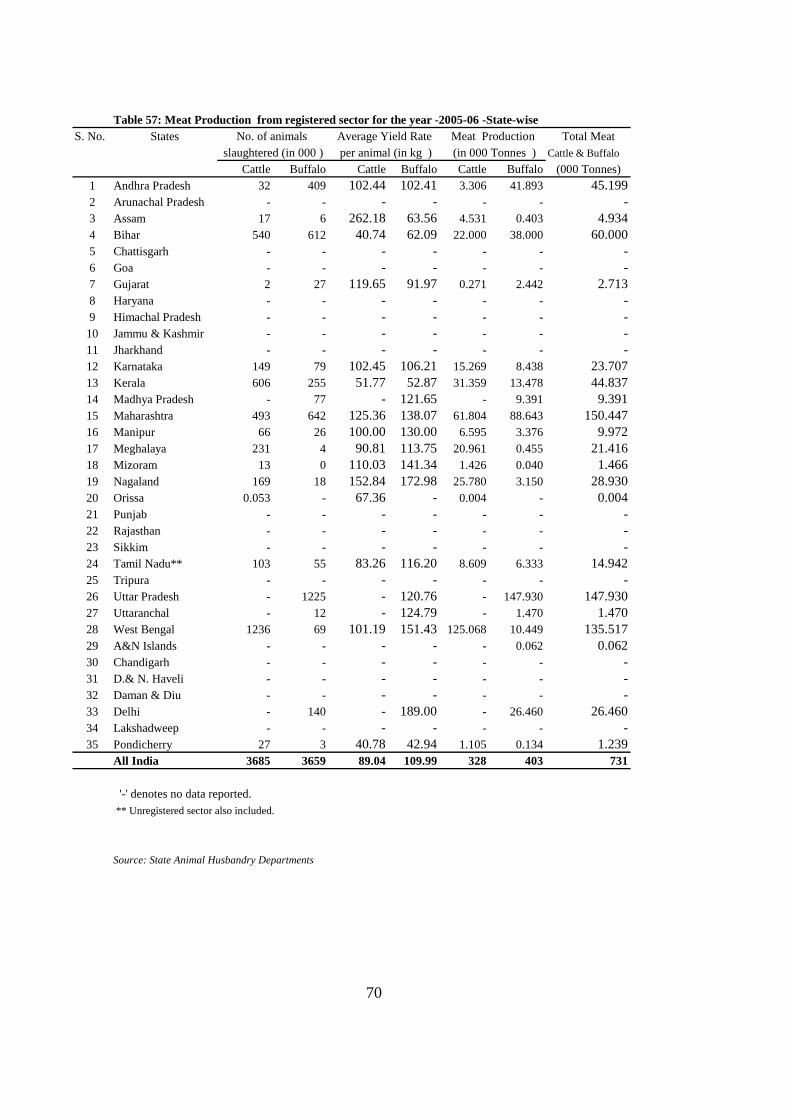
Table 57: Meat Production from registered sector for the year -2005-06 -State-wiseS. No. States Total Meat
Cattle & BuffaloCattle Buffalo Cattle Buffalo Cattle Buffalo (000 Tonnes)
1 Andhra Pradesh 32 409 102.44 102.41 3.306 41.893 45.1992 Arunachal Pradesh - - - - - - -3 Assam 17 6 262.18 63.56 4.531 0.403 4.9344 Bihar 540 612 40.74 62.09 22.000 38.000 60.0005 Chattisgarh - - - - - - -6 Goa - - - - - - -7 Gujarat 2 27 119.65 91.97 0.271 2.442 2.7138 Haryana - - - - - - -9 Himachal Pradesh - - - - - - -
10 Jammu & Kashmir - - - - - - -11 Jharkhand - - - - - - -12 Karnataka 149 79 102.45 106.21 15.269 8.438 23.70713 Kerala 606 255 51.77 52.87 31.359 13.478 44.83714 Madhya Pradesh - 77 - 121.65 - 9.391 9.39115 Maharashtra 493 642 125.36 138.07 61.804 88.643 150.44716 Manipur 66 26 100.00 130.00 6.595 3.376 9.97217 Meghalaya 231 4 90.81 113.75 20.961 0.455 21.41618 Mizoram 13 0 110.03 141.34 1.426 0.040 1.46619 Nagaland 169 18 152.84 172.98 25.780 3.150 28.93020 Orissa 0.053 - 67.36 - 0.004 - 0.00421 Punjab - - - - - - -22 Rajasthan - - - - - - -23 Sikkim - - - - - - -24 Tamil Nadu** 103 55 83.26 116.20 8.609 6.333 14.94225 Tripura - - - - - - -26 Uttar Pradesh - 1225 - 120.76 - 147.930 147.93027 Uttaranchal - 12 - 124.79 - 1.470 1.47028 West Bengal 1236 69 101.19 151.43 125.068 10.449 135.51729 A&N Islands - - - - - 0.062 0.06230 Chandigarh - - - - - - -31 D.& N. Haveli - - - - - - -32 Daman & Diu - - - - - - -33 Delhi - 140 - 189.00 - 26.460 26.46034 Lakshadweep - - - - - - -35 Pondicherry 27 3 40.78 42.94 1.105 0.134 1.239 All India 3685 3659 89.04 109.99 328 403 731
'-' denotes no data reported. ** Unregistered sector also included.
Source: State Animal Husbandry Departments
70
No. of animals Average Yield Rate Meat Productionslaughtered (in 000 ) per animal (in kg ) (in 000 Tonnes )

Table 57 (Continued): Meat Production from recognised sector for the year -2005-06-State-wiseS. No. States Total Meat
Sheep & GoatSheep Goat Pig Sheep Goat Pig Sheep Goat Pig (000 Tonnes)
1 Andhra Pradesh 7205 3606 28 13.57 12.00 109.44 97.752 43.278 3.014 141.0292 Arunachal Pradesh - - - - - - - - - -3 Assam 25 759 488 7.41 6.68 20.47 0.188 5.071 9.988 5.2594 Bihar 130 7873 2170 7.69 7.88 24.42 1.000 62.000 53.000 63.0005 Chattisgarh 58 228 22 12.01 11.41 26.00 0.698 2.602 0.583 3.3006 Goa - - - - - - - - - -7 Gujarat 68 125 3 10.77 11.17 22.50 0.728 1.395 0.068 2.1238 Haryana 1256 1788 366 19.18 19.42 39.50 24.089 34.726 14.456 58.8159 Himachal Pradesh 48 102 6 16.52 18.33 41.45 0.800 1.870 0.265 2.669
10 Jammu & Kashmir - - - - - - - - - -11 Jharkhand 414 2850 616 8.95 8.41 24.54 3.705 23.978 15.121 27.68312 Karnataka 2083 1457 238 14.42 14.11 62.52 30.035 20.554 14.882 50.58913 Kerala - 731 95 - 9.17 46.23 - 6.707 4.379 6.70714 Madhya Pradesh 44 596 21 14.30 14.49 37.46 0.622 8.643 0.798 9.26515 Maharashtra 2249 4642 217 11.72 11.61 25.73 26.361 53.889 5.583 80.25016 Manipur 6 18 121 15.00 15.00 60.00 0.095 0.268 7.249 0.36217 Meghalaya - 114 243 - 8.94 42.99 - 1.022 10.455 1.02218 Mizoram - 8 67 - 8.97 95.00 - 0.075 6.320 0.07519 Nagaland - 201 398 - 18.19 77.01 - 3.650 30.670 3.65020 Orissa 908 3651 177 10.00 10.44 27.31 9.079 38.118 4.842 47.19721 Punjab 131 208 7 11.78 12.31 49.98 1.545 2.563 0.355 4.10822 Rajasthan - - - - - - - - - -23 Sikkim - - - - - - - - - -24 Tamil Nadu** 1571 1394 16 10.93 12.32 37.96 17.174 17.180 0.615 34.35425 Tripura* - 327 483 - 3.85 10.97 - 1.260 5.300 1.26026 Uttar Pradesh 304 2052 276 16.55 16.13 44.51 5.039 33.102 12.288 38.14127 Uttaranchal 83 181 16 15.25 14.81 48.15 1.268 2.686 0.769 3.95428 West Bengal 2079 20755 1154 7.99 7.33 27.59 16.617 152.217 31.839 168.83529 A&N Islands - - - - - - 0.016 - 0.112 0.01630 Chandigarh 29 31 9 10.01 10.99 50.94 0.294 0.342 0.466 0.63631 D.& N. Haveli - - - - - - - - - -32 Daman & Diu - - - - - - - - - -33 Delhi 396 197 - 8.00 8.00 - 3.168 1.576 - 4.74434 Lakshadweep - - - - - - - - - -35 Pondicherry 22 214 2 12.68 12.02 30.28 0.273 2.574 0.046 2.847 All India 19110 54110 7240 12.59 9.63 32.23 241 521 233 762
'-' denotes no data reported.For some States, goat and sheep are combined.* in Tripura poultry meat consists of broiler production and production from ducks also ** Unregistered sector also included.
Source: State Animal Husbandry Departments
No. of animals Average Yield Rate Meat Production
71
slaughtered (in 000 Nos. ) per animal (in kg ) (in 000 Tonnes )
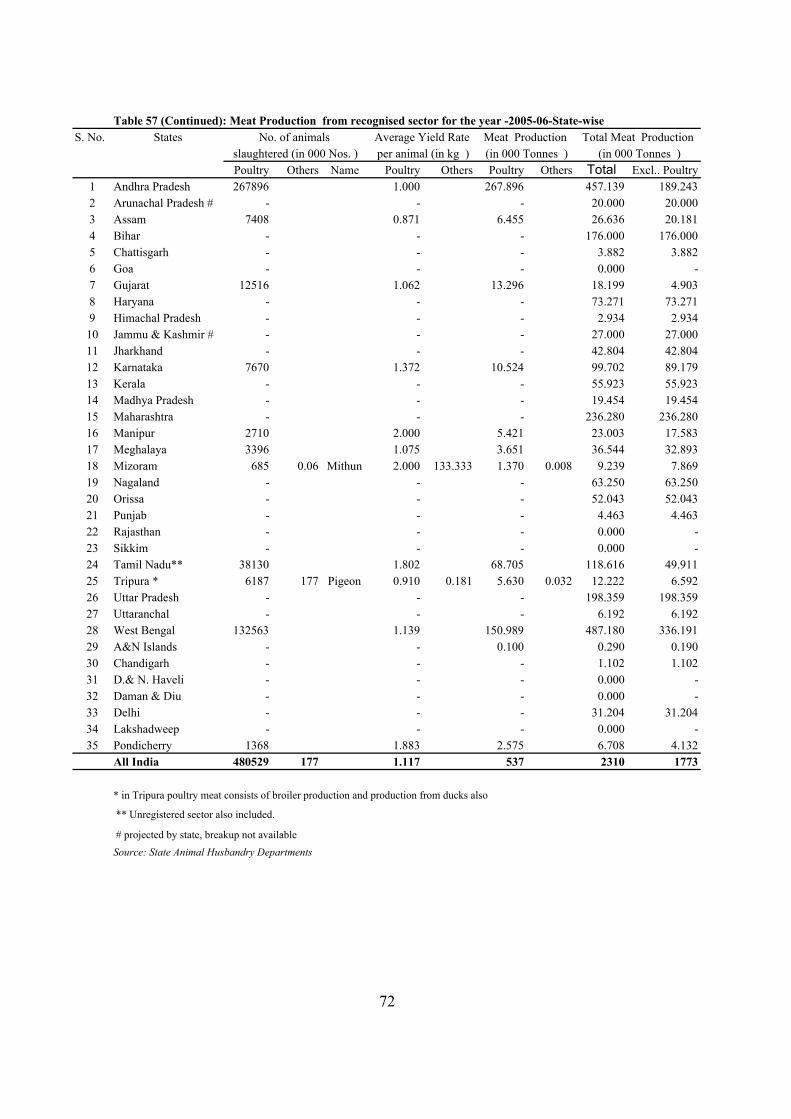
Table 57 (Continued): Meat Production from recognised sector for the year -2005-06-State-wise S. No. States
Poultry Others Name Poultry Others Poultry Others Total Excl.. Poultry1 Andhra Pradesh 267896 1.000 267.896 457.139 189.2432 Arunachal Pradesh # - - - 20.000 20.0003 Assam 7408 0.871 6.455 26.636 20.1814 Bihar - - - 176.000 176.0005 Chattisgarh - - - 3.882 3.8826 Goa - - - 0.000 -7 Gujarat 12516 1.062 13.296 18.199 4.9038 Haryana - - - 73.271 73.2719 Himachal Pradesh - - - 2.934 2.934
10 Jammu & Kashmir # - - - 27.000 27.00011 Jharkhand - - - 42.804 42.80412 Karnataka 7670 1.372 10.524 99.702 89.17913 Kerala - - - 55.923 55.92314 Madhya Pradesh - - - 19.454 19.45415 Maharashtra - - - 236.280 236.28016 Manipur 2710 2.000 5.421 23.003 17.58317 Meghalaya 3396 1.075 3.651 36.544 32.89318 Mizoram 685 0.06 Mithun 2.000 133.333 1.370 0.008 9.239 7.86919 Nagaland - - - 63.250 63.25020 Orissa - - - 52.043 52.04321 Punjab - - - 4.463 4.46322 Rajasthan - - - 0.000 -23 Sikkim - - - 0.000 -24 Tamil Nadu** 38130 1.802 68.705 118.616 49.91125 Tripura * 6187 177 Pigeon 0.910 0.181 5.630 0.032 12.222 6.59226 Uttar Pradesh - - - 198.359 198.35927 Uttaranchal - - - 6.192 6.19228 West Bengal 132563 1.139 150.989 487.180 336.19129 A&N Islands - - 0.100 0.290 0.19030 Chandigarh - - - 1.102 1.10231 D.& N. Haveli - - - 0.000 -32 Daman & Diu - - - 0.000 -33 Delhi - - - 31.204 31.20434 Lakshadweep - - - 0.000 -35 Pondicherry 1368 1.883 2.575 6.708 4.132 All India 480529 177 1.117 537 2310 1773
Source: State Animal Husbandry Departments
72
** Unregistered sector also included.
# projected by state, breakup not available
slaughtered (in 000 Nos. ) per animal (in kg ) (in 000 Tonnes ) (in 000 Tonnes )
* in Tripura poultry meat consists of broiler production and production from ducks also
No. of animals Average Yield Rate Meat Production Total Meat Production

TABLE 58: MEAT PRODUCTION-- 1981 to 2004- All India
(000 tonnes) Year Beef & Veal Buffalo Mutton & Goat Pig Poultry Total Meat
Meat Lamb Meat Meat Meat1981 78 127 125 277 75 120 8501982 80 130 132 298 80 130 8651983 80 132 134 302 80 137 10101984 149 148 135 346 82 150 10471985 150 152 141 358 85 161 1106
1986 160 163 147 370 86 180 12611987 239 207 162 380 80 193 16301988 232 290 148 378 357 225 29741989 845 936 160 385 359 289 35961990 1271 1048 173 410 360 334 3710
1991 1185 1176 168 455 364 362 38001992 1216 1182 167 456 397 382 39501993 1356 1276 193 442 469 599 44671994 1361 1321 209 446 477 549 44941995 1365 1351 213 450 495 624 4631
1996 1370 1382 218 454 514 714 47851997 1378 1365 222 458 462 648 46691998 1401 1382 226 462 466 763 48351999 1421 1399 228 466 473 875 49982000 1442 1416 229 467 476 1136 5304
2001 1452 1433 230 469 483 1307 55152002 1463 1450 233 470 487 1460 57012003 1473 1467 236 473 490 1662 59412004 1483 1483 239 475 497 1715 6032
Source : FAOSTAT Web site year2006 - updated from 1993 onwards.
73
PART IV
Livestock Population -2003
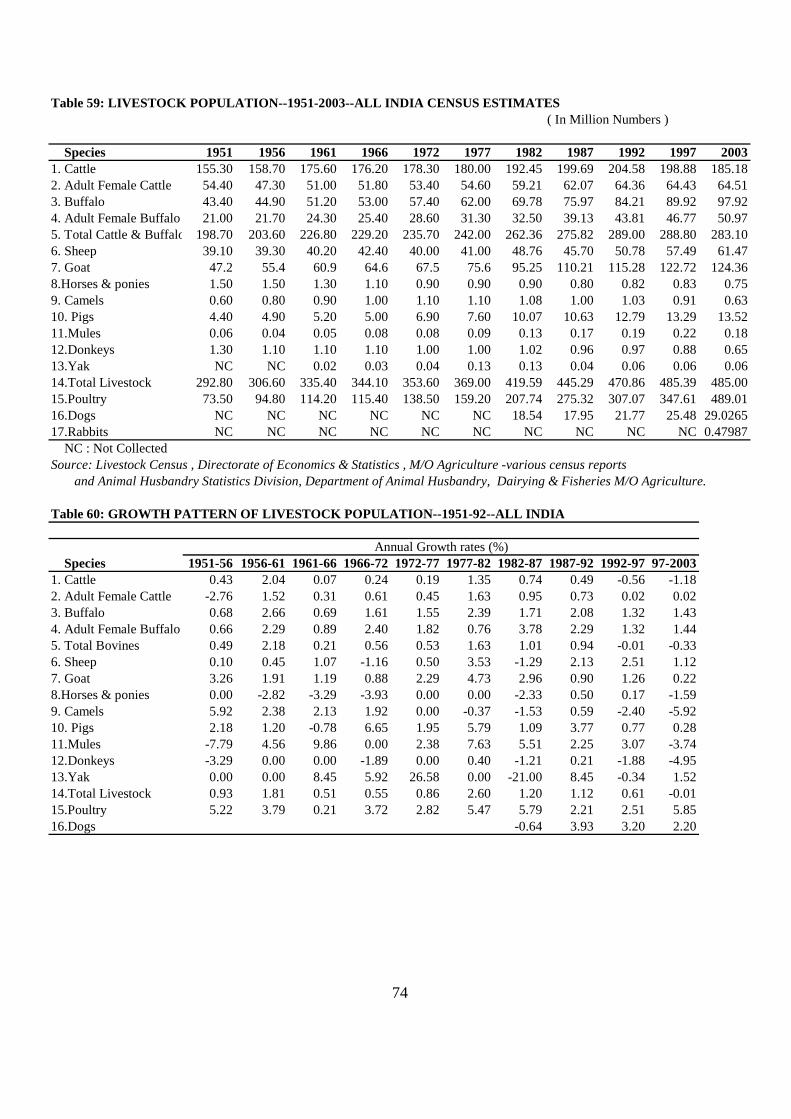
Table 59: LIVESTOCK POPULATION--1951-2003--ALL INDIA CENSUS ESTIMATES
Species 1951 1956 1961 1966 1972 1977 1982 1987 1992 1997 20031. Cattle 155.30 158.70 175.60 176.20 178.30 180.00 192.45 199.69 204.58 198.88 185.182. Adult Female Cattle 54.40 47.30 51.00 51.80 53.40 54.60 59.21 62.07 64.36 64.43 64.513. Buffalo 43.40 44.90 51.20 53.00 57.40 62.00 69.78 75.97 84.21 89.92 97.924. Adult Female Buffalo 21.00 21.70 24.30 25.40 28.60 31.30 32.50 39.13 43.81 46.77 50.975. Total Cattle & Buffalo 198.70 203.60 226.80 229.20 235.70 242.00 262.36 275.82 289.00 288.80 283.106. Sheep 39.10 39.30 40.20 42.40 40.00 41.00 48.76 45.70 50.78 57.49 61.477. Goat 47.2 55.4 60.9 64.6 67.5 75.6 95.25 110.21 115.28 122.72 124.368.Horses & ponies 1.50 1.50 1.30 1.10 0.90 0.90 0.90 0.80 0.82 0.83 0.759. Camels 0.60 0.80 0.90 1.00 1.10 1.10 1.08 1.00 1.03 0.91 0.6310. Pigs 4.40 4.90 5.20 5.00 6.90 7.60 10.07 10.63 12.79 13.29 13.5211.Mules 0.06 0.04 0.05 0.08 0.08 0.09 0.13 0.17 0.19 0.22 0.1812.Donkeys 1.30 1.10 1.10 1.10 1.00 1.00 1.02 0.96 0.97 0.88 0.6513.Yak NC NC 0.02 0.03 0.04 0.13 0.13 0.04 0.06 0.06 0.0614.Total Livestock 292.80 306.60 335.40 344.10 353.60 369.00 419.59 445.29 470.86 485.39 485.0015.Poultry 73.50 94.80 114.20 115.40 138.50 159.20 207.74 275.32 307.07 347.61 489.0116.Dogs NC NC NC NC NC NC 18.54 17.95 21.77 25.48 29.026517.Rabbits NC NC NC NC NC NC NC NC NC NC 0.47987 NC : Not Collected
Table 60: GROWTH PATTERN OF LIVESTOCK POPULATION--1951-92--ALL INDIA
Species 1951-56 1956-61 1961-66 1966-72 1972-77 1977-82 1982-87 1987-92 1992-97 97-20031. Cattle 0.43 2.04 0.07 0.24 0.19 1.35 0.74 0.49 -0.56 -1.182. Adult Female Cattle -2.76 1.52 0.31 0.61 0.45 1.63 0.95 0.73 0.02 0.023. Buffalo 0.68 2.66 0.69 1.61 1.55 2.39 1.71 2.08 1.32 1.434. Adult Female Buffalo 0.66 2.29 0.89 2.40 1.82 0.76 3.78 2.29 1.32 1.445. Total Bovines 0.49 2.18 0.21 0.56 0.53 1.63 1.01 0.94 -0.01 -0.336. Sheep 0.10 0.45 1.07 -1.16 0.50 3.53 -1.29 2.13 2.51 1.127. Goat 3.26 1.91 1.19 0.88 2.29 4.73 2.96 0.90 1.26 0.228.Horses & ponies 0.00 -2.82 -3.29 -3.93 0.00 0.00 -2.33 0.50 0.17 -1.599. Camels 5.92 2.38 2.13 1.92 0.00 -0.37 -1.53 0.59 -2.40 -5.9210. Pigs 2.18 1.20 -0.78 6.65 1.95 5.79 1.09 3.77 0.77 0.2811.Mules -7.79 4.56 9.86 0.00 2.38 7.63 5.51 2.25 3.07 -3.7412.Donkeys -3.29 0.00 0.00 -1.89 0.00 0.40 -1.21 0.21 -1.88 -4.9513.Yak 0.00 0.00 8.45 5.92 26.58 0.00 -21.00 8.45 -0.34 1.5214.Total Livestock 0.93 1.81 0.51 0.55 0.86 2.60 1.20 1.12 0.61 -0.0115.Poultry 5.22 3.79 0.21 3.72 2.82 5.47 5.79 2.21 2.51 5.8516.Dogs -0.64 3.93 3.20 2.20
74
( In Million Numbers )
Source: Livestock Census , Directorate of Economics & Statistics , M/O Agriculture -various census reports and Animal Husbandry Statistics Division, Department of Animal Husbandry, Dairying & Fisheries M/O Agriculture.
Annual Growth rates (%)
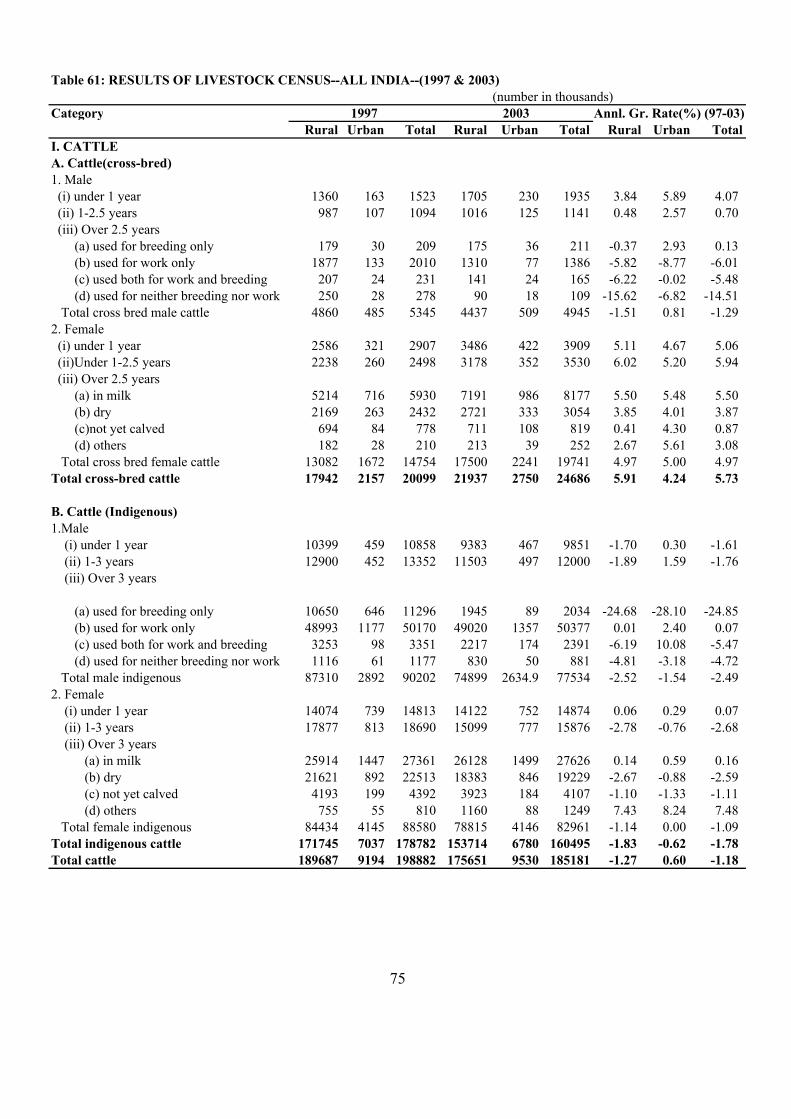
Table 61: RESULTS OF LIVESTOCK CENSUS--ALL INDIA--(1997 & 2003)(number in thousands)
Category Rural Urban Total Rural Urban Total Rural Urban Total
I. CATTLEA. Cattle(cross-bred)1. Male (i) under 1 year 1360 163 1523 1705 230 1935 3.84 5.89 4.07 (ii) 1-2.5 years 987 107 1094 1016 125 1141 0.48 2.57 0.70 (iii) Over 2.5 years (a) used for breeding only 179 30 209 175 36 211 -0.37 2.93 0.13 (b) used for work only 1877 133 2010 1310 77 1386 -5.82 -8.77 -6.01 (c) used both for work and breeding 207 24 231 141 24 165 -6.22 -0.02 -5.48 (d) used for neither breeding nor work 250 28 278 90 18 109 -15.62 -6.82 -14.51 Total cross bred male cattle 4860 485 5345 4437 509 4945 -1.51 0.81 -1.292. Female (i) under 1 year 2586 321 2907 3486 422 3909 5.11 4.67 5.06 (ii)Under 1-2.5 years 2238 260 2498 3178 352 3530 6.02 5.20 5.94 (iii) Over 2.5 years (a) in milk 5214 716 5930 7191 986 8177 5.50 5.48 5.50 (b) dry 2169 263 2432 2721 333 3054 3.85 4.01 3.87 (c)not yet calved 694 84 778 711 108 819 0.41 4.30 0.87 (d) others 182 28 210 213 39 252 2.67 5.61 3.08 Total cross bred female cattle 13082 1672 14754 17500 2241 19741 4.97 5.00 4.97Total cross-bred cattle 17942 2157 20099 21937 2750 24686 5.91 4.24 5.73
B. Cattle (Indigenous)1.Male (i) under 1 year 10399 459 10858 9383 467 9851 -1.70 0.30 -1.61 (ii) 1-3 years 12900 452 13352 11503 497 12000 -1.89 1.59 -1.76 (iii) Over 3 years
(a) used for breeding only 10650 646 11296 1945 89 2034 -24.68 -28.10 -24.85 (b) used for work only 48993 1177 50170 49020 1357 50377 0.01 2.40 0.07 (c) used both for work and breeding 3253 98 3351 2217 174 2391 -6.19 10.08 -5.47 (d) used for neither breeding nor work 1116 61 1177 830 50 881 -4.81 -3.18 -4.72 Total male indigenous 87310 2892 90202 74899 2634.9 77534 -2.52 -1.54 -2.492. Female (i) under 1 year 14074 739 14813 14122 752 14874 0.06 0.29 0.07 (ii) 1-3 years 17877 813 18690 15099 777 15876 -2.78 -0.76 -2.68 (iii) Over 3 years (a) in milk 25914 1447 27361 26128 1499 27626 0.14 0.59 0.16 (b) dry 21621 892 22513 18383 846 19229 -2.67 -0.88 -2.59 (c) not yet calved 4193 199 4392 3923 184 4107 -1.10 -1.33 -1.11 (d) others 755 55 810 1160 88 1249 7.43 8.24 7.48 Total female indigenous 84434 4145 88580 78815 4146 82961 -1.14 0.00 -1.09Total indigenous cattle 171745 7037 178782 153714 6780 160495 -1.83 -0.62 -1.78Total cattle 189687 9194 198882 175651 9530 185181 -1.27 0.60 -1.18
2003 Annl. Gr. Rate(%) (97-03)1997
75
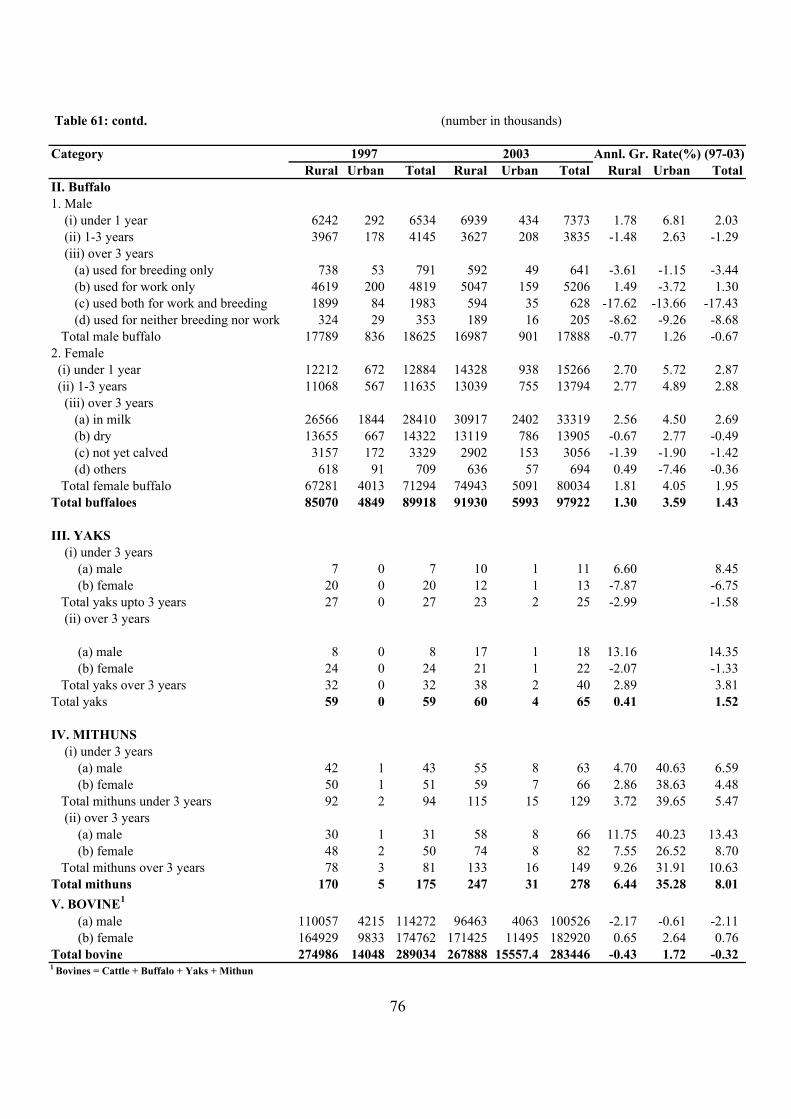
Table 61: contd. (number in thousands)
Category Rural Urban Total Rural Urban Total Rural Urban Total
II. Buffalo1. Male (i) under 1 year 6242 292 6534 6939 434 7373 1.78 6.81 2.03 (ii) 1-3 years 3967 178 4145 3627 208 3835 -1.48 2.63 -1.29 (iii) over 3 years (a) used for breeding only 738 53 791 592 49 641 -3.61 -1.15 -3.44 (b) used for work only 4619 200 4819 5047 159 5206 1.49 -3.72 1.30 (c) used both for work and breeding 1899 84 1983 594 35 628 -17.62 -13.66 -17.43 (d) used for neither breeding nor work 324 29 353 189 16 205 -8.62 -9.26 -8.68 Total male buffalo 17789 836 18625 16987 901 17888 -0.77 1.26 -0.672. Female (i) under 1 year 12212 672 12884 14328 938 15266 2.70 5.72 2.87 (ii) 1-3 years 11068 567 11635 13039 755 13794 2.77 4.89 2.88 (iii) over 3 years (a) in milk 26566 1844 28410 30917 2402 33319 2.56 4.50 2.69 (b) dry 13655 667 14322 13119 786 13905 -0.67 2.77 -0.49 (c) not yet calved 3157 172 3329 2902 153 3056 -1.39 -1.90 -1.42 (d) others 618 91 709 636 57 694 0.49 -7.46 -0.36 Total female buffalo 67281 4013 71294 74943 5091 80034 1.81 4.05 1.95Total buffaloes 85070 4849 89918 91930 5993 97922 1.30 3.59 1.43
III. YAKS (i) under 3 years (a) male 7 0 7 10 1 11 6.60 8.45 (b) female 20 0 20 12 1 13 -7.87 -6.75 Total yaks upto 3 years 27 0 27 23 2 25 -2.99 -1.58 (ii) over 3 years
(a) male 8 0 8 17 1 18 13.16 14.35 (b) female 24 0 24 21 1 22 -2.07 -1.33 Total yaks over 3 years 32 0 32 38 2 40 2.89 3.81Total yaks 59 0 59 60 4 65 0.41 1.52
IV. MITHUNS (i) under 3 years (a) male 42 1 43 55 8 63 4.70 40.63 6.59 (b) female 50 1 51 59 7 66 2.86 38.63 4.48 Total mithuns under 3 years 92 2 94 115 15 129 3.72 39.65 5.47 (ii) over 3 years (a) male 30 1 31 58 8 66 11.75 40.23 13.43 (b) female 48 2 50 74 8 82 7.55 26.52 8.70 Total mithuns over 3 years 78 3 81 133 16 149 9.26 31.91 10.63Total mithuns 170 5 175 247 31 278 6.44 35.28 8.01V. BOVINE1 (a) male 110057 4215 114272 96463 4063 100526 -2.17 -0.61 -2.11 (b) female 164929 9833 174762 171425 11495 182920 0.65 2.64 0.76Total bovine 274986 14048 289034 267888 15557.4 283446 -0.43 1.72 -0.321 Bovines = Cattle + Buffalo + Yaks + Mithun
76
1997 2003 Annl. Gr. Rate(%) (97-03)
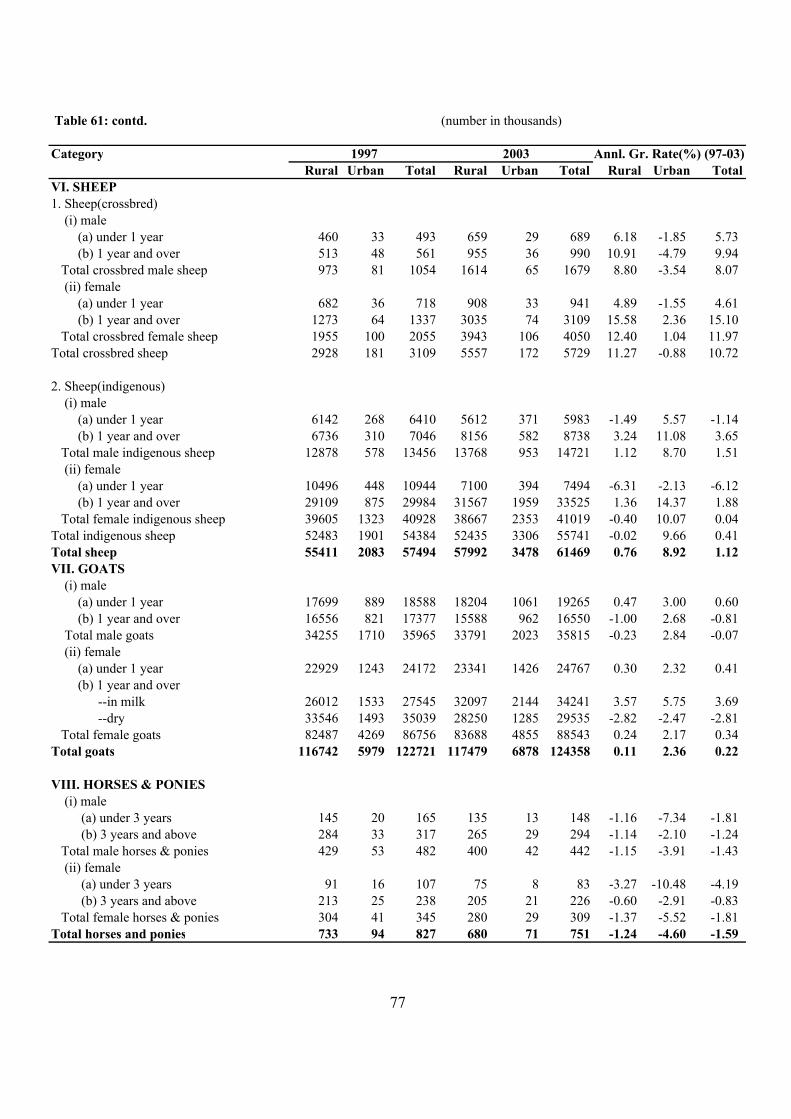
Table 61: contd. (number in thousands)
Category Rural Urban Total Rural Urban Total Rural Urban Total
VI. SHEEP1. Sheep(crossbred) (i) male (a) under 1 year 460 33 493 659 29 689 6.18 -1.85 5.73 (b) 1 year and over 513 48 561 955 36 990 10.91 -4.79 9.94 Total crossbred male sheep 973 81 1054 1614 65 1679 8.80 -3.54 8.07 (ii) female (a) under 1 year 682 36 718 908 33 941 4.89 -1.55 4.61 (b) 1 year and over 1273 64 1337 3035 74 3109 15.58 2.36 15.10 Total crossbred female sheep 1955 100 2055 3943 106 4050 12.40 1.04 11.97Total crossbred sheep 2928 181 3109 5557 172 5729 11.27 -0.88 10.72
2. Sheep(indigenous) (i) male (a) under 1 year 6142 268 6410 5612 371 5983 -1.49 5.57 -1.14 (b) 1 year and over 6736 310 7046 8156 582 8738 3.24 11.08 3.65 Total male indigenous sheep 12878 578 13456 13768 953 14721 1.12 8.70 1.51 (ii) female (a) under 1 year 10496 448 10944 7100 394 7494 -6.31 -2.13 -6.12 (b) 1 year and over 29109 875 29984 31567 1959 33525 1.36 14.37 1.88 Total female indigenous sheep 39605 1323 40928 38667 2353 41019 -0.40 10.07 0.04Total indigenous sheep 52483 1901 54384 52435 3306 55741 -0.02 9.66 0.41Total sheep 55411 2083 57494 57992 3478 61469 0.76 8.92 1.12VII. GOATS (i) male (a) under 1 year 17699 889 18588 18204 1061 19265 0.47 3.00 0.60 (b) 1 year and over 16556 821 17377 15588 962 16550 -1.00 2.68 -0.81 Total male goats 34255 1710 35965 33791 2023 35815 -0.23 2.84 -0.07 (ii) female (a) under 1 year 22929 1243 24172 23341 1426 24767 0.30 2.32 0.41 (b) 1 year and over --in milk 26012 1533 27545 32097 2144 34241 3.57 5.75 3.69 --dry 33546 1493 35039 28250 1285 29535 -2.82 -2.47 -2.81 Total female goats 82487 4269 86756 83688 4855 88543 0.24 2.17 0.34Total goats 116742 5979 122721 117479 6878 124358 0.11 2.36 0.22
VIII. HORSES & PONIES (i) male (a) under 3 years 145 20 165 135 13 148 -1.16 -7.34 -1.81 (b) 3 years and above 284 33 317 265 29 294 -1.14 -2.10 -1.24 Total male horses & ponies 429 53 482 400 42 442 -1.15 -3.91 -1.43 (ii) female (a) under 3 years 91 16 107 75 8 83 -3.27 -10.48 -4.19 (b) 3 years and above 213 25 238 205 21 226 -0.60 -2.91 -0.83 Total female horses & ponies 304 41 345 280 29 309 -1.37 -5.52 -1.81Total horses and ponies 733 94 827 680 71 751 -1.24 -4.60 -1.59
77
1997 2003 Annl. Gr. Rate(%) (97-03)
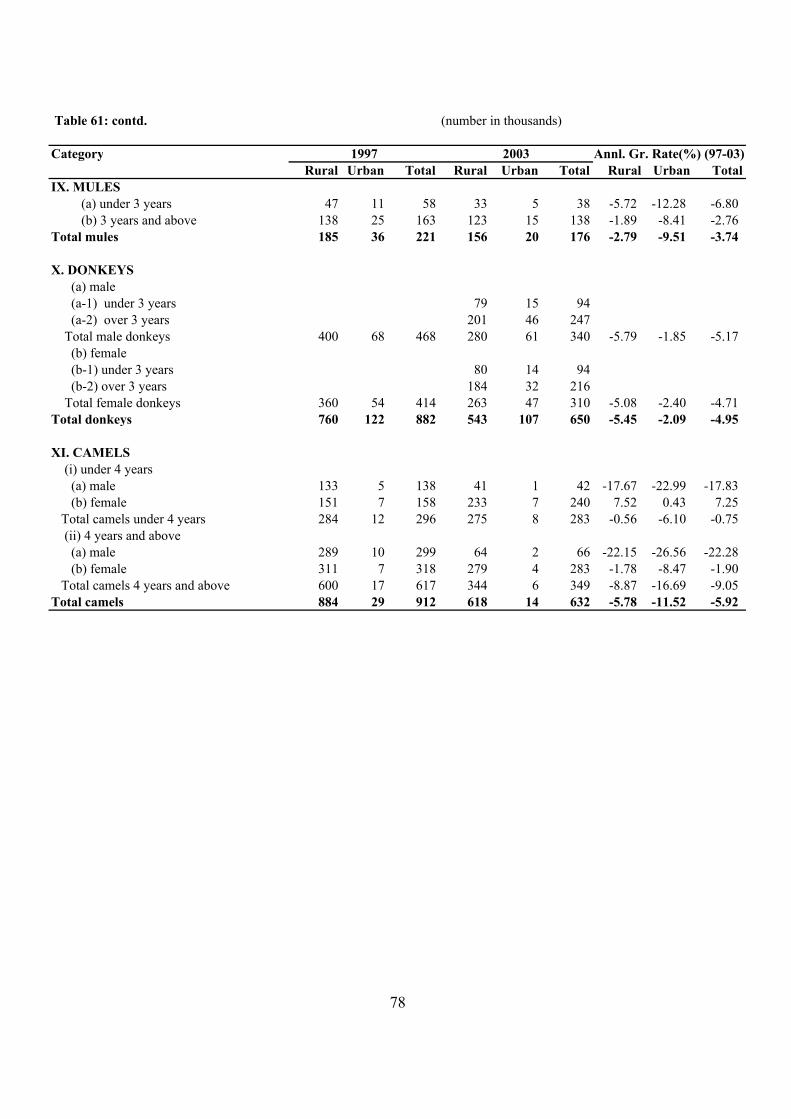
Table 61: contd. (number in thousands)
Category Rural Urban Total Rural Urban Total Rural Urban Total
IX. MULES (a) under 3 years 47 11 58 33 5 38 -5.72 -12.28 -6.80 (b) 3 years and above 138 25 163 123 15 138 -1.89 -8.41 -2.76Total mules 185 36 221 156 20 176 -2.79 -9.51 -3.74
X. DONKEYS (a) male (a-1) under 3 years 79 15 94 (a-2) over 3 years 201 46 247 Total male donkeys 400 68 468 280 61 340 -5.79 -1.85 -5.17 (b) female (b-1) under 3 years 80 14 94 (b-2) over 3 years 184 32 216 Total female donkeys 360 54 414 263 47 310 -5.08 -2.40 -4.71Total donkeys 760 122 882 543 107 650 -5.45 -2.09 -4.95
XI. CAMELS (i) under 4 years (a) male 133 5 138 41 1 42 -17.67 -22.99 -17.83 (b) female 151 7 158 233 7 240 7.52 0.43 7.25 Total camels under 4 years 284 12 296 275 8 283 -0.56 -6.10 -0.75 (ii) 4 years and above (a) male 289 10 299 64 2 66 -22.15 -26.56 -22.28 (b) female 311 7 318 279 4 283 -1.78 -8.47 -1.90 Total camels 4 years and above 600 17 617 344 6 349 -8.87 -16.69 -9.05Total camels 884 29 912 618 14 632 -5.78 -11.52 -5.92
78
1997 2003 Annl. Gr. Rate(%) (97-03)
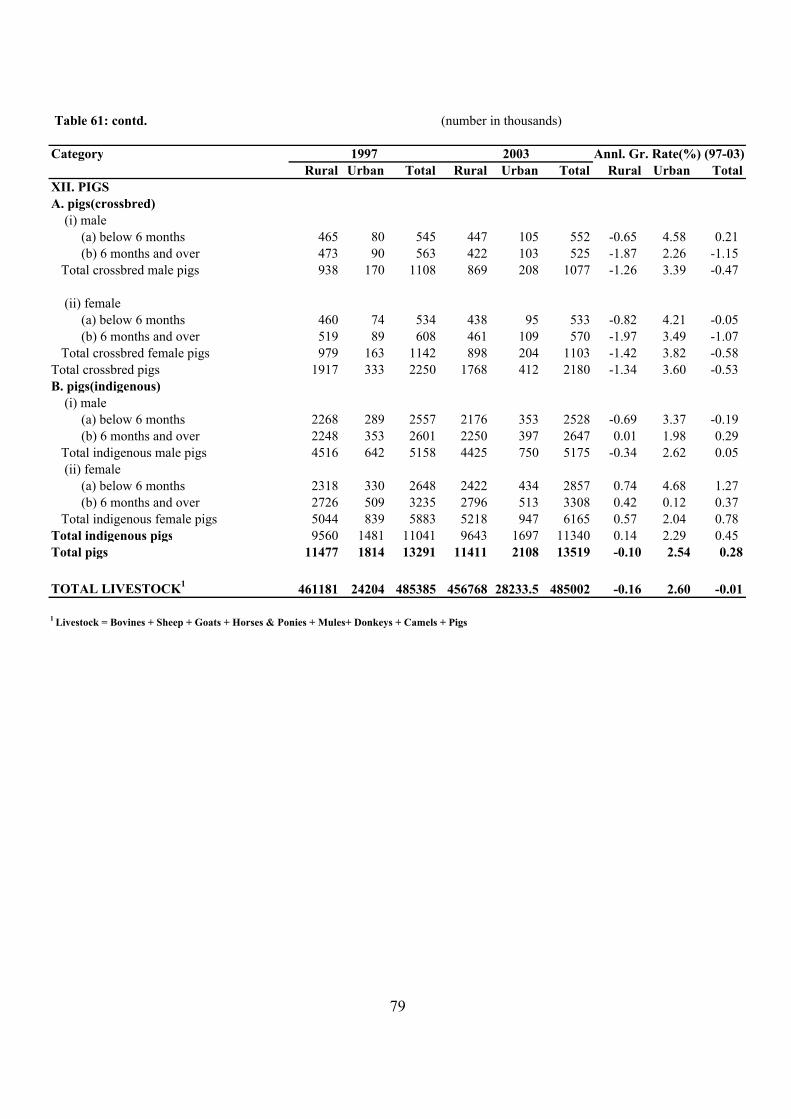
Table 61: contd. (number in thousands)
Category Rural Urban Total Rural Urban Total Rural Urban Total
XII. PIGSA. pigs(crossbred) (i) male (a) below 6 months 465 80 545 447 105 552 -0.65 4.58 0.21 (b) 6 months and over 473 90 563 422 103 525 -1.87 2.26 -1.15 Total crossbred male pigs 938 170 1108 869 208 1077 -1.26 3.39 -0.47
(ii) female (a) below 6 months 460 74 534 438 95 533 -0.82 4.21 -0.05 (b) 6 months and over 519 89 608 461 109 570 -1.97 3.49 -1.07 Total crossbred female pigs 979 163 1142 898 204 1103 -1.42 3.82 -0.58Total crossbred pigs 1917 333 2250 1768 412 2180 -1.34 3.60 -0.53B. pigs(indigenous) (i) male (a) below 6 months 2268 289 2557 2176 353 2528 -0.69 3.37 -0.19 (b) 6 months and over 2248 353 2601 2250 397 2647 0.01 1.98 0.29 Total indigenous male pigs 4516 642 5158 4425 750 5175 -0.34 2.62 0.05 (ii) female (a) below 6 months 2318 330 2648 2422 434 2857 0.74 4.68 1.27 (b) 6 months and over 2726 509 3235 2796 513 3308 0.42 0.12 0.37 Total indigenous female pigs 5044 839 5883 5218 947 6165 0.57 2.04 0.78Total indigenous pigs 9560 1481 11041 9643 1697 11340 0.14 2.29 0.45Total pigs 11477 1814 13291 11411 2108 13519 -0.10 2.54 0.28
TOTAL LIVESTOCK1 461181 24204 485385 456768 28233.5 485002 -0.16 2.60 -0.01
1 Livestock = Bovines + Sheep + Goats + Horses & Ponies + Mules+ Donkeys + Camels + Pigs
79
1997 2003 Annl. Gr. Rate(%) (97-03)
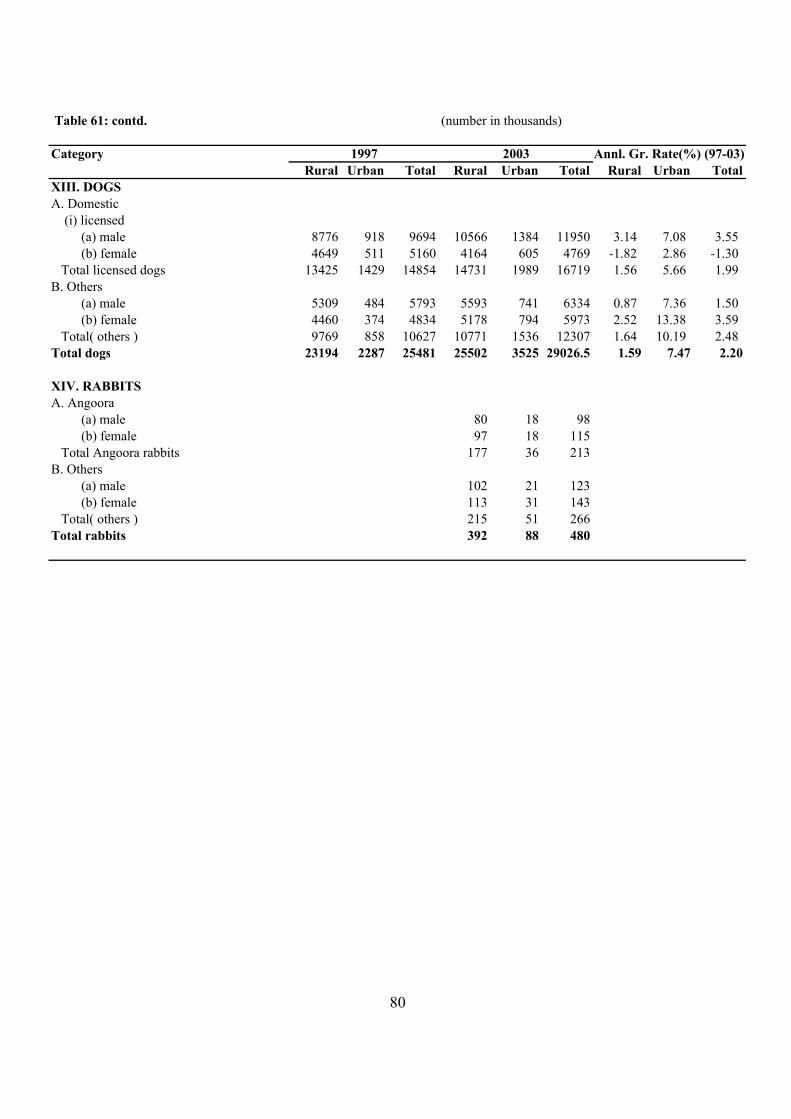
Table 61: contd. (number in thousands)
Category Rural Urban Total Rural Urban Total Rural Urban Total
XIII. DOGSA. Domestic (i) licensed (a) male 8776 918 9694 10566 1384 11950 3.14 7.08 3.55 (b) female 4649 511 5160 4164 605 4769 -1.82 2.86 -1.30 Total licensed dogs 13425 1429 14854 14731 1989 16719 1.56 5.66 1.99B. Others (a) male 5309 484 5793 5593 741 6334 0.87 7.36 1.50 (b) female 4460 374 4834 5178 794 5973 2.52 13.38 3.59 Total( others ) 9769 858 10627 10771 1536 12307 1.64 10.19 2.48Total dogs 23194 2287 25481 25502 3525 29026.5 1.59 7.47 2.20
XIV. RABBITSA. Angoora (a) male 80 18 98 (b) female 97 18 115 Total Angoora rabbits 177 36 213B. Others (a) male 102 21 123 (b) female 113 31 143 Total( others ) 215 51 266Total rabbits 392 88 480
80
1997 2003 Annl. Gr. Rate(%) (97-03)
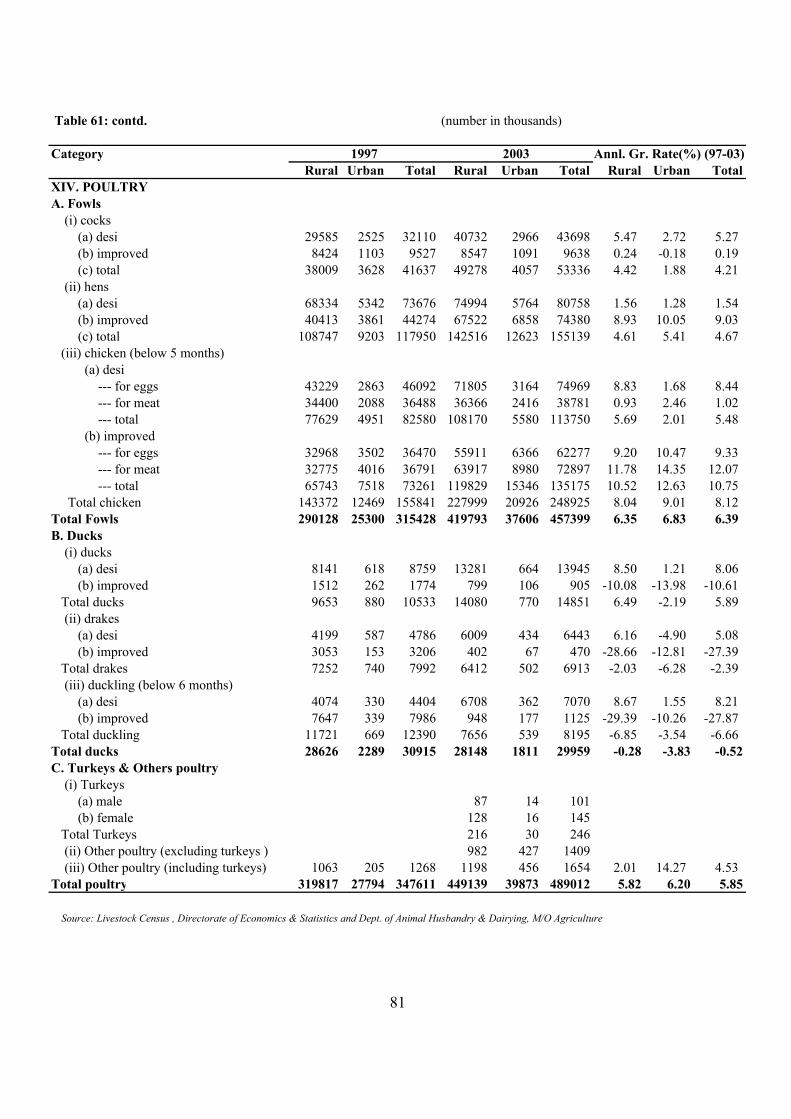
Table 61: contd. (number in thousands)
Category Rural Urban Total Rural Urban Total Rural Urban Total
XIV. POULTRYA. Fowls (i) cocks (a) desi 29585 2525 32110 40732 2966 43698 5.47 2.72 5.27 (b) improved 8424 1103 9527 8547 1091 9638 0.24 -0.18 0.19 (c) total 38009 3628 41637 49278 4057 53336 4.42 1.88 4.21 (ii) hens (a) desi 68334 5342 73676 74994 5764 80758 1.56 1.28 1.54 (b) improved 40413 3861 44274 67522 6858 74380 8.93 10.05 9.03 (c) total 108747 9203 117950 142516 12623 155139 4.61 5.41 4.67 (iii) chicken (below 5 months) (a) desi --- for eggs 43229 2863 46092 71805 3164 74969 8.83 1.68 8.44 --- for meat 34400 2088 36488 36366 2416 38781 0.93 2.46 1.02 --- total 77629 4951 82580 108170 5580 113750 5.69 2.01 5.48 (b) improved --- for eggs 32968 3502 36470 55911 6366 62277 9.20 10.47 9.33 --- for meat 32775 4016 36791 63917 8980 72897 11.78 14.35 12.07 --- total 65743 7518 73261 119829 15346 135175 10.52 12.63 10.75 Total chicken 143372 12469 155841 227999 20926 248925 8.04 9.01 8.12Total Fowls 290128 25300 315428 419793 37606 457399 6.35 6.83 6.39B. Ducks (i) ducks (a) desi 8141 618 8759 13281 664 13945 8.50 1.21 8.06 (b) improved 1512 262 1774 799 106 905 -10.08 -13.98 -10.61 Total ducks 9653 880 10533 14080 770 14851 6.49 -2.19 5.89 (ii) drakes (a) desi 4199 587 4786 6009 434 6443 6.16 -4.90 5.08 (b) improved 3053 153 3206 402 67 470 -28.66 -12.81 -27.39 Total drakes 7252 740 7992 6412 502 6913 -2.03 -6.28 -2.39 (iii) duckling (below 6 months) (a) desi 4074 330 4404 6708 362 7070 8.67 1.55 8.21 (b) improved 7647 339 7986 948 177 1125 -29.39 -10.26 -27.87 Total duckling 11721 669 12390 7656 539 8195 -6.85 -3.54 -6.66Total ducks 28626 2289 30915 28148 1811 29959 -0.28 -3.83 -0.52C. Turkeys & Others poultry (i) Turkeys (a) male 87 14 101 (b) female 128 16 145 Total Turkeys 216 30 246 (ii) Other poultry (excluding turkeys ) 982 427 1409 (iii) Other poultry (including turkeys) 1063 205 1268 1198 456 1654 2.01 14.27 4.53Total poultry 319817 27794 347611 449139 39873 489012 5.82 6.20 5.85
Source: Livestock Census , Directorate of Economics & Statistics and Dept. of Animal Husbandry & Dairying, M/O Agriculture
81
1997 2003 Annl. Gr. Rate(%) (97-03)

Table 62:TOTAL NUMBER OF LIVESTOCK AND POULTRY—1997—STATE-WISE(In Thouands)
Sr.No. Cattle Buffa- Sheep Goats Pigs Horses Mules Don- Camel Yaks Mithun Total Total
States/UTsloes and keys Live- Poultry
ponies stock
1 Andhra Pr. 10602 9658 9743 5213 748 7 1 37 - - - 36009 633962 Arunachal Pr. 451 12 27 154 249 6 - - - 14 124 1037 12923 Assam 8097 728 84 2717 1082 12 - - - - - 12720 182104 Bihar 24598 5879 1956 20229 924 120 8 28 - - - 53742 198905 Chhatisgarh 8786 1941 196 2154 456 9 - 1 - - - 13543 67716 Goa 88 40 0.29 13 105 - - - - - - 247 7907 Gujarat 6749 6285 2158 4386 198 14 - 74 65 - - 19930 72368 Haryana 2401 4823 1275 968 700 49 34 63 99 - - 10413 92259 Himachal Pr. 2174 748 1080 1168 7 13 18 8 - 7 - 5224 865
10 J. & K. 3175 787 3170 1864 12 141 21 23 4 33 - 9228 555711 Karnataka 10831 4367 8003 4875 405 16 - 28 - - - 28526 2139912 Kerala 2491 111 3 1598 88 - - - - - - 4292 1839713 Madhya Pr. 19497 6648 657 6470 375 55 7 49 10 - - 33768 726114 Maharashtra 18072 6073 3368 11434 567 42 1 71 3 - - 39630 3539215 Manipur 508 95 8 33 388 2 - - - - 17 1051 305516 Meghalaya 756 17 17 280 351 2 - 1 - - - 1424 215217 Mizoram 33 5 1 15 163 2 - - - - 3 222 130718 Nagaland 383 36 2 161 571 1 - - - - 33 1188 244419 Orissa 13810 1388 1765 5772 602 - - - - - - 23338 1843520 Punjab 2638 6171 436 414 96 34 17 22 30 - - 9858 1102221 Rajasthan 12141 9770 14585 16971 305 24 3 186 669 - - 54655 440622 Sikkim 143 2 5 86 27 5 - - - 5 - 273 22123 Tamilnadu 9046 2741 5259 6416 609 11 - 43 - - - 24126 3651124 Tripura 1228 18 6 639 211 2 - - - - - 2105 359525 Uttar Prad. 20016 18996 1905 11784 3135 216 84 245 31 - - 56414 1211626 Uttaranchal 2031 1094 311 1070 32 23 24 1 - - - 4586 97127 West Bengal 17832 1233 1462 15648 805 18 - - - - - 36998 3330928 A& Nicobar 60 14 - 71 43 - - - - - - 188 80129 Chandigarh 7 23 0.23 1 3 - - - - - - 35 304
30 D & N. Haveli60 4 0.19 20 0.473 - - 0 - - - 86 411
31 Daman & Diu 5 1 0.02 5 0.13 - - - - - - 11 2432 Delhi 96 203 11 25 31 1 1 1 - - - 369 64733 Lakshadweep 3 - - 26 - - - - - - - 29 7934 Pondicherry 73 4 2 41 1 - - - - - - 121 121
All India 198882 89918 57494 122721 13291 826 220 881 911 59 177 485384 347611
Source: Livestock Census , Department of Animal Husbandry & Dairying , M/O Agriculture-' denotes negligible or less than 500.
82
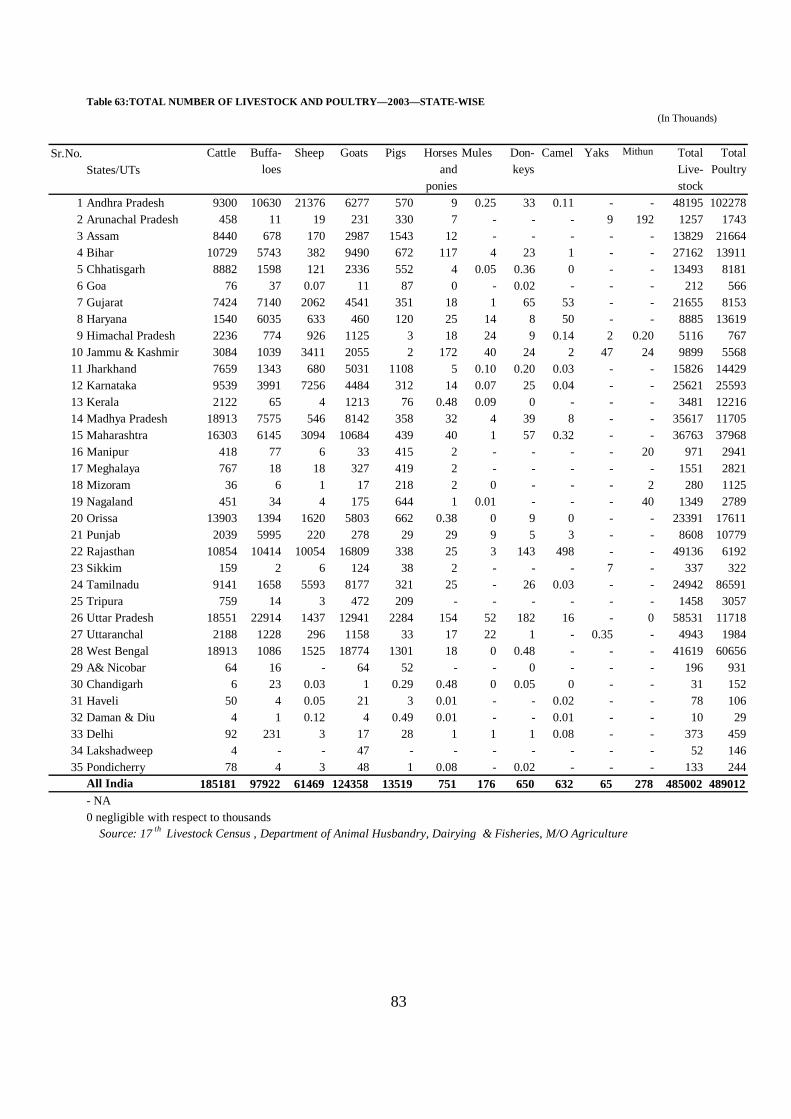
Table 63:TOTAL NUMBER OF LIVESTOCK AND POULTRY—2003—STATE-WISE(In Thouands)
Sr.No. Cattle Buffa- Sheep Goats Pigs Horses Mules Don- Camel Yaks Mithun Total TotalStates/UTs loes and keys Live- Poultry
ponies stock1 Andhra Pradesh 9300 10630 21376 6277 570 9 0.25 33 0.11 - - 48195 1022782 Arunachal Pradesh 458 11 19 231 330 7 - - - 9 192 1257 17433 Assam 8440 678 170 2987 1543 12 - - - - - 13829 216644 Bihar 10729 5743 382 9490 672 117 4 23 1 - - 27162 139115 Chhatisgarh 8882 1598 121 2336 552 4 0.05 0.36 0 - - 13493 81816 Goa 76 37 0.07 11 87 0 - 0.02 - - - 212 5667 Gujarat 7424 7140 2062 4541 351 18 1 65 53 - - 21655 81538 Haryana 1540 6035 633 460 120 25 14 8 50 - - 8885 136199 Himachal Pradesh 2236 774 926 1125 3 18 24 9 0.14 2 0.20 5116 767
10 Jammu & Kashmir 3084 1039 3411 2055 2 172 40 24 2 47 24 9899 556811 Jharkhand 7659 1343 680 5031 1108 5 0.10 0.20 0.03 - - 15826 1442912 Karnataka 9539 3991 7256 4484 312 14 0.07 25 0.04 - - 25621 2559313 Kerala 2122 65 4 1213 76 0.48 0.09 0 - - - 3481 1221614 Madhya Pradesh 18913 7575 546 8142 358 32 4 39 8 - - 35617 1170515 Maharashtra 16303 6145 3094 10684 439 40 1 57 0.32 - - 36763 3796816 Manipur 418 77 6 33 415 2 - - - - 20 971 294117 Meghalaya 767 18 18 327 419 2 - - - - - 1551 282118 Mizoram 36 6 1 17 218 2 0 - - - 2 280 112519 Nagaland 451 34 4 175 644 1 0.01 - - - 40 1349 278920 Orissa 13903 1394 1620 5803 662 0.38 0 9 0 - - 23391 1761121 Punjab 2039 5995 220 278 29 29 9 5 3 - - 8608 1077922 Rajasthan 10854 10414 10054 16809 338 25 3 143 498 - - 49136 619223 Sikkim 159 2 6 124 38 2 - - - 7 - 337 32224 Tamilnadu 9141 1658 5593 8177 321 25 - 26 0.03 - - 24942 8659125 Tripura 759 14 3 472 209 - - - - - - 1458 305726 Uttar Pradesh 18551 22914 1437 12941 2284 154 52 182 16 - 0 58531 1171827 Uttaranchal 2188 1228 296 1158 33 17 22 1 - 0.35 - 4943 198428 West Bengal 18913 1086 1525 18774 1301 18 0 0.48 - - - 41619 6065629 A& Nicobar 64 16 - 64 52 - - 0 - - - 196 93130 Chandigarh 6 23 0.03 1 0.29 0.48 0 0.05 0 - - 31 15231 Haveli 50 4 0.05 21 3 0.01 - - 0.02 - - 78 10632 Daman & Diu 4 1 0.12 4 0.49 0.01 - - 0.01 - - 10 2933 Delhi 92 231 3 17 28 1 1 1 0.08 - - 373 45934 Lakshadweep 4 - - 47 - - - - - - - 52 14635 Pondicherry 78 4 3 48 1 0.08 - 0.02 - - - 133 244
All India 185181 97922 61469 124358 13519 751 176 650 632 65 278 485002 489012- NA
Source: 17 th Livestock Census , Department of Animal Husbandry, Dairying & Fisheries, M/O Agriculture0 negligible with respect to thousands
83

Table 64:TOTAL NUMBER OF LIVESTOCK AND POULTRY (in RURAL INDIA)—2003—STATE-WISE(In Thouands)
Sr.No. Cattle Buffa- Sheep Goats Pigs Horses Mules Don- Camel Yaks Mithun Total TotalStates/UTs loes and keys Live- Poultry
ponies stock1 Andhra Pradesh 8643 9704 19264 5739 459 9 0.23 30 0.11 - - 43849 900942 Arunachal Pradesh 365 11 16 190 265 6 - - - 6 164 1022 14713 Assam 7790 664 152 2785 1365 10 - - - - - 12766 194764 Bihar 10206 5406 375 9161 643 112 4 21 1 - - 25930 133205 Chhatisgarh 8611 1514 117 2249 512 4 0.05 0.22 0 - - 13007 77426 Goa 66 30 0.05 8 55 0 - 0.01 - - - 159 4577 Gujarat 7114 6841 1993 4231 159 16 1 52 50 - - 20456 77968 Haryana 1432 5760 612 444 94 22 12 7 49 - - 8432 130059 Himachal Pradesh 2219 764 923 1121 2 18 24 9 0.14 2 0.20 5082 755
10 Jammu & Kashmir 2940 1019 3313 2026 1 163 37 23 2 46 24 9594 506311 Jharkhand 7495 1289 674 4919 1073 5 0.07 0.07 0 - - 15454 1398812 Karnataka 9191 3798 7069 4346 207 12 0.05 23 0.02 - - 24646 2341813 Kerala 2008 59 3 1140 72 0.32 0.06 0.20 - - - 3283 1121314 Madhya Pradesh 17879 6840 532 7678 247 26 2 26 8 - - 33237 1111715 Maharashtra 14843 5256 2758 9278 290 35 0.24 39 0.13 - - 32500 3338716 Manipur 347 74 6 31 387 2 - - - - 20 867 241417 Meghalaya 748 18 18 319 406 2 - - - - - 1510 265818 Mizoram 26 4 1 15 122 2 0 - - - 2 172 72419 Nagaland 312 33 4 148 506 1 0.01 - - - 38 1043 209920 Orissa 13488 1350 1587 5674 616 0.28 0 7 0 - - 22720 1672121 Punjab 1904 5686 211 261 15 25 8 4 3 - - 8116 970022 Rajasthan 10334 10004 9895 16139 194 23 2 130 490 - - 47210 563823 Sikkim 158 2 6 110 37 2 - - - 7 - 321 28824 Tamilnadu 8272 1422 5273 7484 260 22 - 22 0.02 - - 22754 8200625 Tripura 742 14 3 466 208 - - - - - - 1433 294126 Uttar Pradesh 17921 21934 1389 12088 1913 132 44 149 16 - 0 55586 1071327 Uttaranchal 2137 1195 294 1139 15 16 21 1 - 0.35 - 4817 186928 West Bengal 18216 1015 1500 18124 1212 17 0.35 0.25 - - - 40084 5722029 A& Nicobar 62 16 - 61 52 - - 0 - - - 191 88430 Chandigarh 3 16 - 0.18 0.13 0.06 0 0.01 - - - 19 13831 Haveli 50 4 0 21 3 0.01 - - 0.02 - - 78 10632 Daman & Diu 4 1 0.06 4 0 0 - - 0.01 - - 9 2433 Delhi 62 185 3 10 22 1 0.39 1 0.03 - - 283 44134 Lakshadweep 3 - - 33 - - - - - - - 36 8435 Pondicherry 63 1 2 36 0.25 0.04 - - - - - 102 169
All India 175651 91930 57992 117479 11411 680 156 543 618 60 247 456768 449139- NA
Source: 17 th Livestock Census , Department of Animal Husbandry, Dairying & Fisheries, M/O Agriculture0 negligible with respect to thousands
84
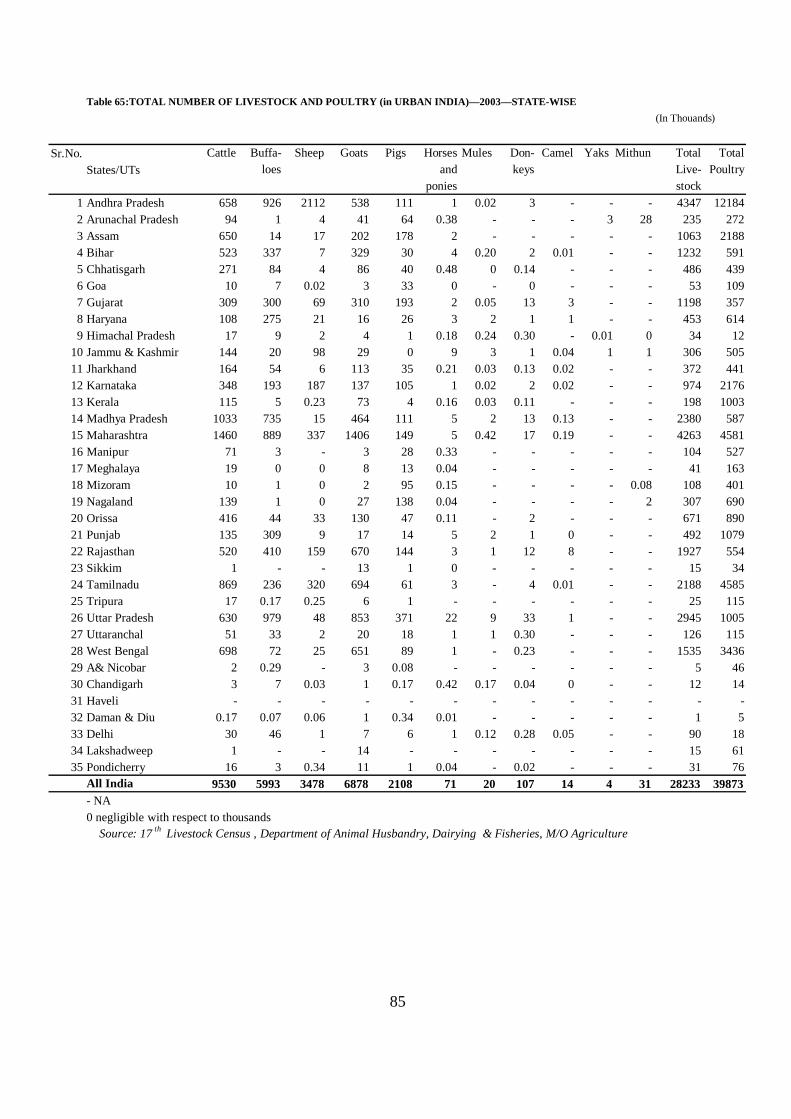
Table 65:TOTAL NUMBER OF LIVESTOCK AND POULTRY (in URBAN INDIA)—2003—STATE-WISE(In Thouands)
Sr.No. Cattle Buffa- Sheep Goats Pigs Horses Mules Don- Camel Yaks Mithun Total TotalStates/UTs loes and keys Live- Poultry
ponies stock1 Andhra Pradesh 658 926 2112 538 111 1 0.02 3 - - - 4347 121842 Arunachal Pradesh 94 1 4 41 64 0.38 - - - 3 28 235 2723 Assam 650 14 17 202 178 2 - - - - - 1063 21884 Bihar 523 337 7 329 30 4 0.20 2 0.01 - - 1232 5915 Chhatisgarh 271 84 4 86 40 0.48 0 0.14 - - - 486 4396 Goa 10 7 0.02 3 33 0 - 0 - - - 53 1097 Gujarat 309 300 69 310 193 2 0.05 13 3 - - 1198 3578 Haryana 108 275 21 16 26 3 2 1 1 - - 453 6149 Himachal Pradesh 17 9 2 4 1 0.18 0.24 0.30 - 0.01 0 34 12
10 Jammu & Kashmir 144 20 98 29 0 9 3 1 0.04 1 1 306 50511 Jharkhand 164 54 6 113 35 0.21 0.03 0.13 0.02 - - 372 44112 Karnataka 348 193 187 137 105 1 0.02 2 0.02 - - 974 217613 Kerala 115 5 0.23 73 4 0.16 0.03 0.11 - - - 198 100314 Madhya Pradesh 1033 735 15 464 111 5 2 13 0.13 - - 2380 58715 Maharashtra 1460 889 337 1406 149 5 0.42 17 0.19 - - 4263 458116 Manipur 71 3 - 3 28 0.33 - - - - - 104 52717 Meghalaya 19 0 0 8 13 0.04 - - - - - 41 16318 Mizoram 10 1 0 2 95 0.15 - - - - 0.08 108 40119 Nagaland 139 1 0 27 138 0.04 - - - - 2 307 69020 Orissa 416 44 33 130 47 0.11 - 2 - - - 671 89021 Punjab 135 309 9 17 14 5 2 1 0 - - 492 107922 Rajasthan 520 410 159 670 144 3 1 12 8 - - 1927 55423 Sikkim 1 - - 13 1 0 - - - - - 15 3424 Tamilnadu 869 236 320 694 61 3 - 4 0.01 - - 2188 458525 Tripura 17 0.17 0.25 6 1 - - - - - - 25 11526 Uttar Pradesh 630 979 48 853 371 22 9 33 1 - - 2945 100527 Uttaranchal 51 33 2 20 18 1 1 0.30 - - - 126 11528 West Bengal 698 72 25 651 89 1 - 0.23 - - - 1535 343629 A& Nicobar 2 0.29 - 3 0.08 - - - - - - 5 4630 Chandigarh 3 7 0.03 1 0.17 0.42 0.17 0.04 0 - - 12 1431 Haveli - - - - - - - - - - - - -32 Daman & Diu 0.17 0.07 0.06 1 0.34 0.01 - - - - - 1 533 Delhi 30 46 1 7 6 1 0.12 0.28 0.05 - - 90 1834 Lakshadweep 1 - - 14 - - - - - - - 15 6135 Pondicherry 16 3 0.34 11 1 0.04 - 0.02 - - - 31 76
All India 9530 5993 3478 6878 2108 71 20 107 14 4 31 28233 39873- NA
Source: 17 th Livestock Census , Department of Animal Husbandry, Dairying & Fisheries, M/O Agriculture0 negligible with respect to thousands
85
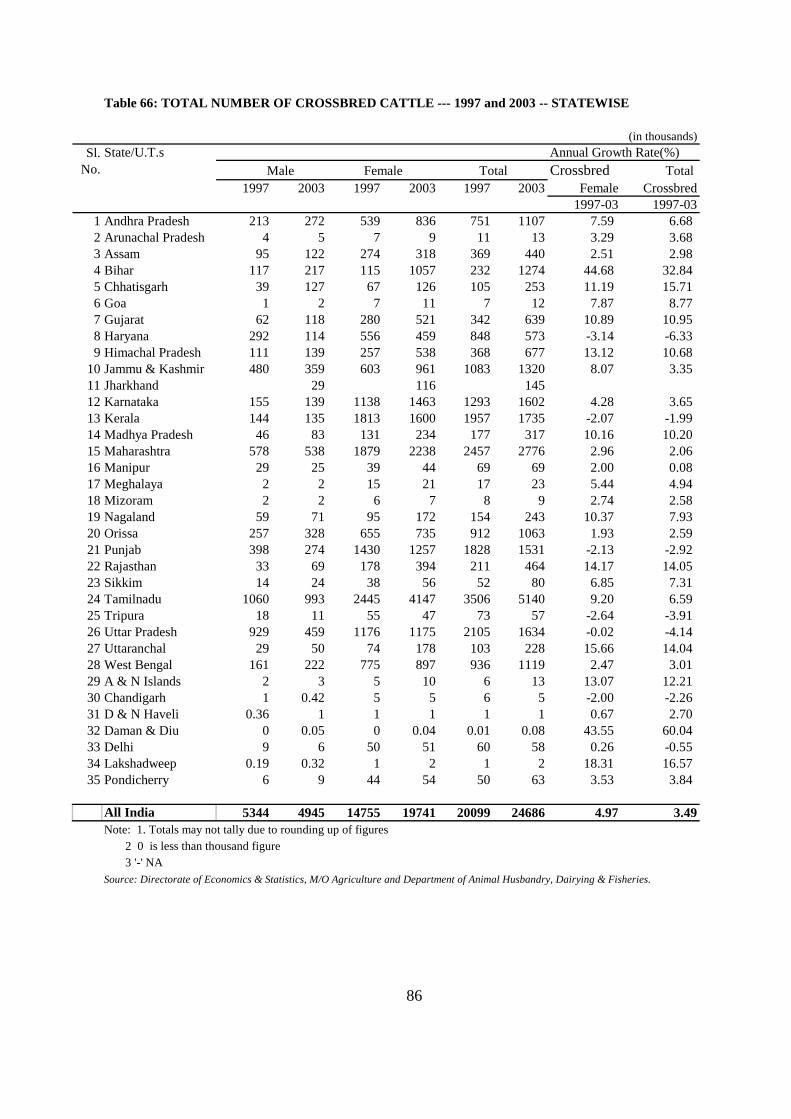
Sl. State/U.T.sNo. Crossbred Total
1997 2003 1997 2003 1997 2003 Female Crossbred1997-03 1997-03
1 Andhra Pradesh 213 272 539 836 751 1107 7.59 6.682 Arunachal Pradesh 4 5 7 9 11 13 3.29 3.683 Assam 95 122 274 318 369 440 2.51 2.984 Bihar 117 217 115 1057 232 1274 44.68 32.845 Chhatisgarh 39 127 67 126 105 253 11.19 15.716 Goa 1 2 7 11 7 12 7.87 8.777 Gujarat 62 118 280 521 342 639 10.89 10.958 Haryana 292 114 556 459 848 573 -3.14 -6.339 Himachal Pradesh 111 139 257 538 368 677 13.12 10.68
10 Jammu & Kashmir 480 359 603 961 1083 1320 8.07 3.3511 Jharkhand 29 116 14512 Karnataka 155 139 1138 1463 1293 1602 4.28 3.6513 Kerala 144 135 1813 1600 1957 1735 -2.07 -1.9914 Madhya Pradesh 46 83 131 234 177 317 10.16 10.2015 Maharashtra 578 538 1879 2238 2457 2776 2.96 2.0616 Manipur 29 25 39 44 69 69 2.00 0.0817 Meghalaya 2 2 15 21 17 23 5.44 4.9418 Mizoram 2 2 6 7 8 9 2.74 2.5819 Nagaland 59 71 95 172 154 243 10.37 7.9320 Orissa 257 328 655 735 912 1063 1.93 2.5921 Punjab 398 274 1430 1257 1828 1531 -2.13 -2.9222 Rajasthan 33 69 178 394 211 464 14.17 14.0523 Sikkim 14 24 38 56 52 80 6.85 7.3124 Tamilnadu 1060 993 2445 4147 3506 5140 9.20 6.5925 Tripura 18 11 55 47 73 57 -2.64 -3.9126 Uttar Pradesh 929 459 1176 1175 2105 1634 -0.02 -4.1427 Uttaranchal 29 50 74 178 103 228 15.66 14.0428 West Bengal 161 222 775 897 936 1119 2.47 3.0129 A & N Islands 2 3 5 10 6 13 13.07 12.2130 Chandigarh 1 0.42 5 5 6 5 -2.00 -2.2631 D & N Haveli 0.36 1 1 1 1 1 0.67 2.7032 Daman & Diu 0 0.05 0 0.04 0.01 0.08 43.55 60.0433 Delhi 9 6 50 51 60 58 0.26 -0.5534 Lakshadweep 0.19 0.32 1 2 1 2 18.31 16.5735 Pondicherry 6 9 44 54 50 63 3.53 3.84
All India 5344 4945 14755 19741 20099 24686 4.97 3.49Note: 1. Totals may not tally due to rounding up of figures
3 '-' NASource: Directorate of Economics & Statistics, M/O Agriculture and Department of Animal Husbandry, Dairying & Fisheries.
2 0 is less than thousand figure
86
Male Female Total
Table 66: TOTAL NUMBER OF CROSSBRED CATTLE --- 1997 and 2003 -- STATEWISE
(in thousands)Annual Growth Rate(%)
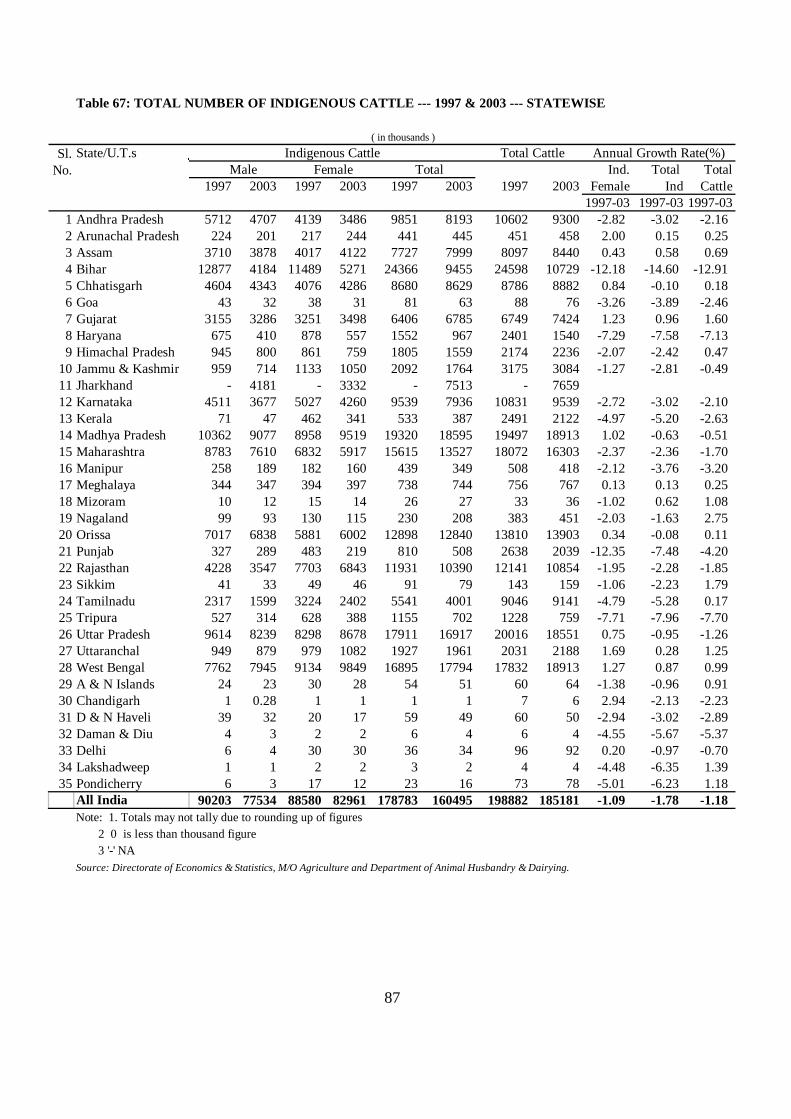
Table 67: TOTAL NUMBER OF INDIGENOUS CATTLE --- 1997 & 2003 --- STATEWISE
Sl. State/U.T.sNo. Ind. Total Total
1997 2003 1997 2003 1997 2003 1997 2003 Female Ind Cattle1997-03 1997-03 1997-03
1 Andhra Pradesh 5712 4707 4139 3486 9851 8193 10602 9300 -2.82 -3.02 -2.162 Arunachal Pradesh 224 201 217 244 441 445 451 458 2.00 0.15 0.253 Assam 3710 3878 4017 4122 7727 7999 8097 8440 0.43 0.58 0.694 Bihar 12877 4184 11489 5271 24366 9455 24598 10729 -12.18 -14.60 -12.915 Chhatisgarh 4604 4343 4076 4286 8680 8629 8786 8882 0.84 -0.10 0.186 Goa 43 32 38 31 81 63 88 76 -3.26 -3.89 -2.467 Gujarat 3155 3286 3251 3498 6406 6785 6749 7424 1.23 0.96 1.608 Haryana 675 410 878 557 1552 967 2401 1540 -7.29 -7.58 -7.139 Himachal Pradesh 945 800 861 759 1805 1559 2174 2236 -2.07 -2.42 0.47
10 Jammu & Kashmir 959 714 1133 1050 2092 1764 3175 3084 -1.27 -2.81 -0.4911 Jharkhand - 4181 - 3332 - 7513 - 765912 Karnataka 4511 3677 5027 4260 9539 7936 10831 9539 -2.72 -3.02 -2.1013 Kerala 71 47 462 341 533 387 2491 2122 -4.97 -5.20 -2.6314 Madhya Pradesh 10362 9077 8958 9519 19320 18595 19497 18913 1.02 -0.63 -0.5115 Maharashtra 8783 7610 6832 5917 15615 13527 18072 16303 -2.37 -2.36 -1.7016 Manipur 258 189 182 160 439 349 508 418 -2.12 -3.76 -3.2017 Meghalaya 344 347 394 397 738 744 756 767 0.13 0.13 0.2518 Mizoram 10 12 15 14 26 27 33 36 -1.02 0.62 1.0819 Nagaland 99 93 130 115 230 208 383 451 -2.03 -1.63 2.7520 Orissa 7017 6838 5881 6002 12898 12840 13810 13903 0.34 -0.08 0.1121 Punjab 327 289 483 219 810 508 2638 2039 -12.35 -7.48 -4.2022 Rajasthan 4228 3547 7703 6843 11931 10390 12141 10854 -1.95 -2.28 -1.8523 Sikkim 41 33 49 46 91 79 143 159 -1.06 -2.23 1.7924 Tamilnadu 2317 1599 3224 2402 5541 4001 9046 9141 -4.79 -5.28 0.1725 Tripura 527 314 628 388 1155 702 1228 759 -7.71 -7.96 -7.7026 Uttar Pradesh 9614 8239 8298 8678 17911 16917 20016 18551 0.75 -0.95 -1.2627 Uttaranchal 949 879 979 1082 1927 1961 2031 2188 1.69 0.28 1.2528 West Bengal 7762 7945 9134 9849 16895 17794 17832 18913 1.27 0.87 0.9929 A & N Islands 24 23 30 28 54 51 60 64 -1.38 -0.96 0.9130 Chandigarh 1 0.28 1 1 1 1 7 6 2.94 -2.13 -2.2331 D & N Haveli 39 32 20 17 59 49 60 50 -2.94 -3.02 -2.8932 Daman & Diu 4 3 2 2 6 4 6 4 -4.55 -5.67 -5.3733 Delhi 6 4 30 30 36 34 96 92 0.20 -0.97 -0.7034 Lakshadweep 1 1 2 2 3 2 4 4 -4.48 -6.35 1.3935 Pondicherry 6 3 17 12 23 16 73 78 -5.01 -6.23 1.18
All India 90203 77534 88580 82961 178783 160495 198882 185181 -1.09 -1.78 -1.18Note: 1. Totals may not tally due to rounding up of figures 2 0 is less than thousand figure 3 '-' NASource: Directorate of Economics & Statistics, M/O Agriculture and Department of Animal Husbandry & Dairying.
( in thousands )Indigenous Cattle Annual Growth Rate(%) Total Cattle
Male Female Total
87
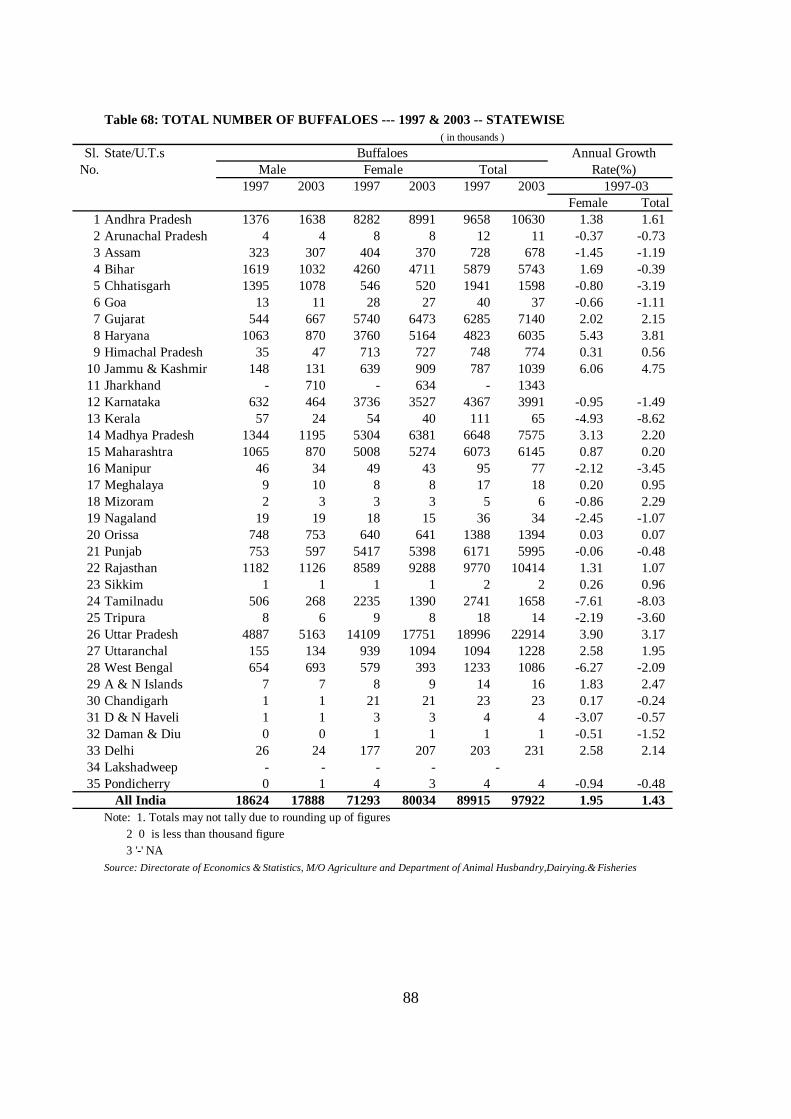
Table 68: TOTAL NUMBER OF BUFFALOES --- 1997 & 2003 -- STATEWISE
Sl. State/U.T.sNo.
1997 2003 1997 2003 1997 2003 Female Total
1 Andhra Pradesh 1376 1638 8282 8991 9658 10630 1.38 1.612 Arunachal Pradesh 4 4 8 8 12 11 -0.37 -0.733 Assam 323 307 404 370 728 678 -1.45 -1.194 Bihar 1619 1032 4260 4711 5879 5743 1.69 -0.395 Chhatisgarh 1395 1078 546 520 1941 1598 -0.80 -3.196 Goa 13 11 28 27 40 37 -0.66 -1.117 Gujarat 544 667 5740 6473 6285 7140 2.02 2.158 Haryana 1063 870 3760 5164 4823 6035 5.43 3.819 Himachal Pradesh 35 47 713 727 748 774 0.31 0.56
10 Jammu & Kashmir 148 131 639 909 787 1039 6.06 4.7511 Jharkhand - 710 - 634 - 134312 Karnataka 632 464 3736 3527 4367 3991 -0.95 -1.4913 Kerala 57 24 54 40 111 65 -4.93 -8.6214 Madhya Pradesh 1344 1195 5304 6381 6648 7575 3.13 2.2015 Maharashtra 1065 870 5008 5274 6073 6145 0.87 0.2016 Manipur 46 34 49 43 95 77 -2.12 -3.4517 Meghalaya 9 10 8 8 17 18 0.20 0.9518 Mizoram 2 3 3 3 5 6 -0.86 2.2919 Nagaland 19 19 18 15 36 34 -2.45 -1.0720 Orissa 748 753 640 641 1388 1394 0.03 0.0721 Punjab 753 597 5417 5398 6171 5995 -0.06 -0.4822 Rajasthan 1182 1126 8589 9288 9770 10414 1.31 1.0723 Sikkim 1 1 1 1 2 2 0.26 0.9624 Tamilnadu 506 268 2235 1390 2741 1658 -7.61 -8.0325 Tripura 8 6 9 8 18 14 -2.19 -3.6026 Uttar Pradesh 4887 5163 14109 17751 18996 22914 3.90 3.1727 Uttaranchal 155 134 939 1094 1094 1228 2.58 1.9528 West Bengal 654 693 579 393 1233 1086 -6.27 -2.0929 A & N Islands 7 7 8 9 14 16 1.83 2.4730 Chandigarh 1 1 21 21 23 23 0.17 -0.2431 D & N Haveli 1 1 3 3 4 4 -3.07 -0.5732 Daman & Diu 0 0 1 1 1 1 -0.51 -1.5233 Delhi 26 24 177 207 203 231 2.58 2.1434 Lakshadweep - - - - -35 Pondicherry 0 1 4 3 4 4 -0.94 -0.48
All India 18624 17888 71293 80034 89915 97922 1.95 1.43Note: 1. Totals may not tally due to rounding up of figures 2 0 is less than thousand figure 3 '-' NASource: Directorate of Economics & Statistics, M/O Agriculture and Department of Animal Husbandry,Dairying.& Fisheries
88
( in thousands )
Total 1997-03
Male Female Annual Growth
Rate(%)Buffaloes
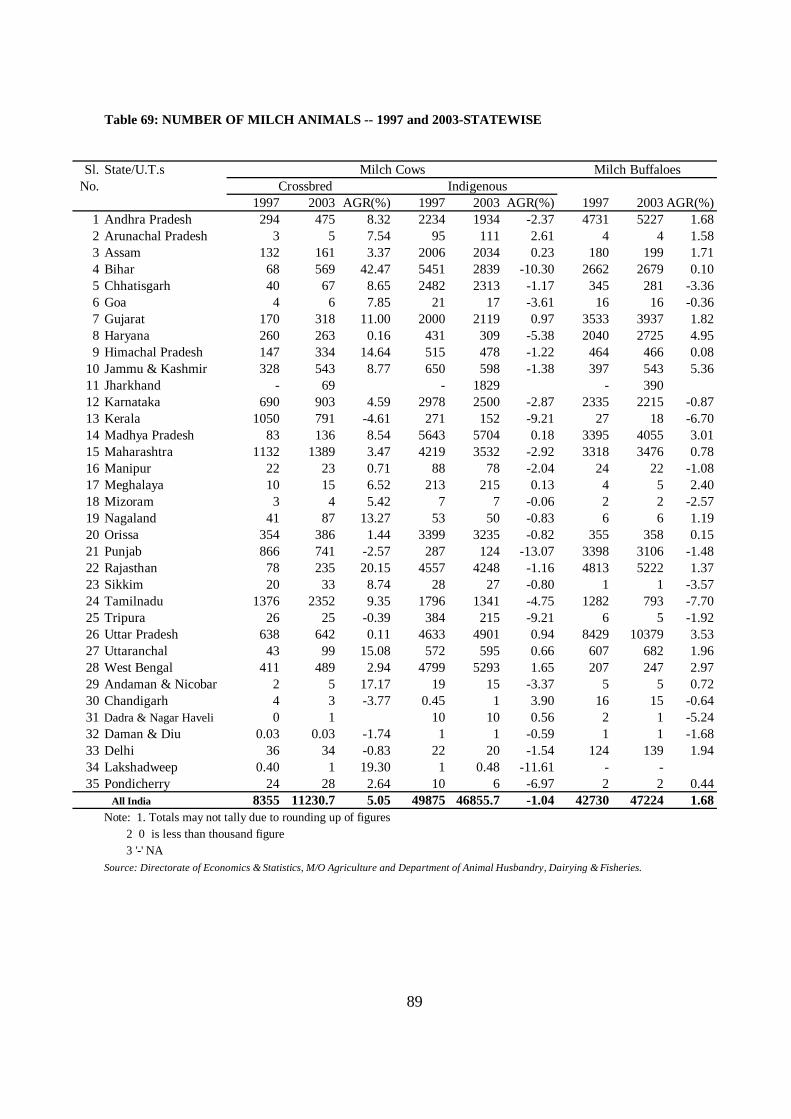
Table 69: NUMBER OF MILCH ANIMALS -- 1997 and 2003-STATEWISE
Sl. State/U.T.sNo.
1997 2003 AGR(%) 1997 2003 AGR(%) 1997 2003 AGR(%)1 Andhra Pradesh 294 475 8.32 2234 1934 -2.37 4731 5227 1.682 Arunachal Pradesh 3 5 7.54 95 111 2.61 4 4 1.583 Assam 132 161 3.37 2006 2034 0.23 180 199 1.714 Bihar 68 569 42.47 5451 2839 -10.30 2662 2679 0.105 Chhatisgarh 40 67 8.65 2482 2313 -1.17 345 281 -3.366 Goa 4 6 7.85 21 17 -3.61 16 16 -0.367 Gujarat 170 318 11.00 2000 2119 0.97 3533 3937 1.828 Haryana 260 263 0.16 431 309 -5.38 2040 2725 4.959 Himachal Pradesh 147 334 14.64 515 478 -1.22 464 466 0.08
10 Jammu & Kashmir 328 543 8.77 650 598 -1.38 397 543 5.3611 Jharkhand - 69 - 1829 - 39012 Karnataka 690 903 4.59 2978 2500 -2.87 2335 2215 -0.8713 Kerala 1050 791 -4.61 271 152 -9.21 27 18 -6.7014 Madhya Pradesh 83 136 8.54 5643 5704 0.18 3395 4055 3.0115 Maharashtra 1132 1389 3.47 4219 3532 -2.92 3318 3476 0.7816 Manipur 22 23 0.71 88 78 -2.04 24 22 -1.0817 Meghalaya 10 15 6.52 213 215 0.13 4 5 2.4018 Mizoram 3 4 5.42 7 7 -0.06 2 2 -2.5719 Nagaland 41 87 13.27 53 50 -0.83 6 6 1.1920 Orissa 354 386 1.44 3399 3235 -0.82 355 358 0.1521 Punjab 866 741 -2.57 287 124 -13.07 3398 3106 -1.4822 Rajasthan 78 235 20.15 4557 4248 -1.16 4813 5222 1.3723 Sikkim 20 33 8.74 28 27 -0.80 1 1 -3.5724 Tamilnadu 1376 2352 9.35 1796 1341 -4.75 1282 793 -7.7025 Tripura 26 25 -0.39 384 215 -9.21 6 5 -1.9226 Uttar Pradesh 638 642 0.11 4633 4901 0.94 8429 10379 3.5327 Uttaranchal 43 99 15.08 572 595 0.66 607 682 1.9628 West Bengal 411 489 2.94 4799 5293 1.65 207 247 2.9729 Andaman & Nicobar 2 5 17.17 19 15 -3.37 5 5 0.7230 Chandigarh 4 3 -3.77 0.45 1 3.90 16 15 -0.6431 Dadra & Nagar Haveli 0 1 10 10 0.56 2 1 -5.2432 Daman & Diu 0.03 0.03 -1.74 1 1 -0.59 1 1 -1.6833 Delhi 36 34 -0.83 22 20 -1.54 124 139 1.9434 Lakshadweep 0.40 1 19.30 1 0.48 -11.61 - -35 Pondicherry 24 28 2.64 10 6 -6.97 2 2 0.44
All India 8355 11230.7 5.05 49875 46855.7 -1.04 42730 47224 1.68Note: 1. Totals may not tally due to rounding up of figures 2 0 is less than thousand figure 3 '-' NASource: Directorate of Economics & Statistics, M/O Agriculture and Department of Animal Husbandry, Dairying & Fisheries.
89
Milch CowsCrossbred Indigenous
Milch Buffaloes
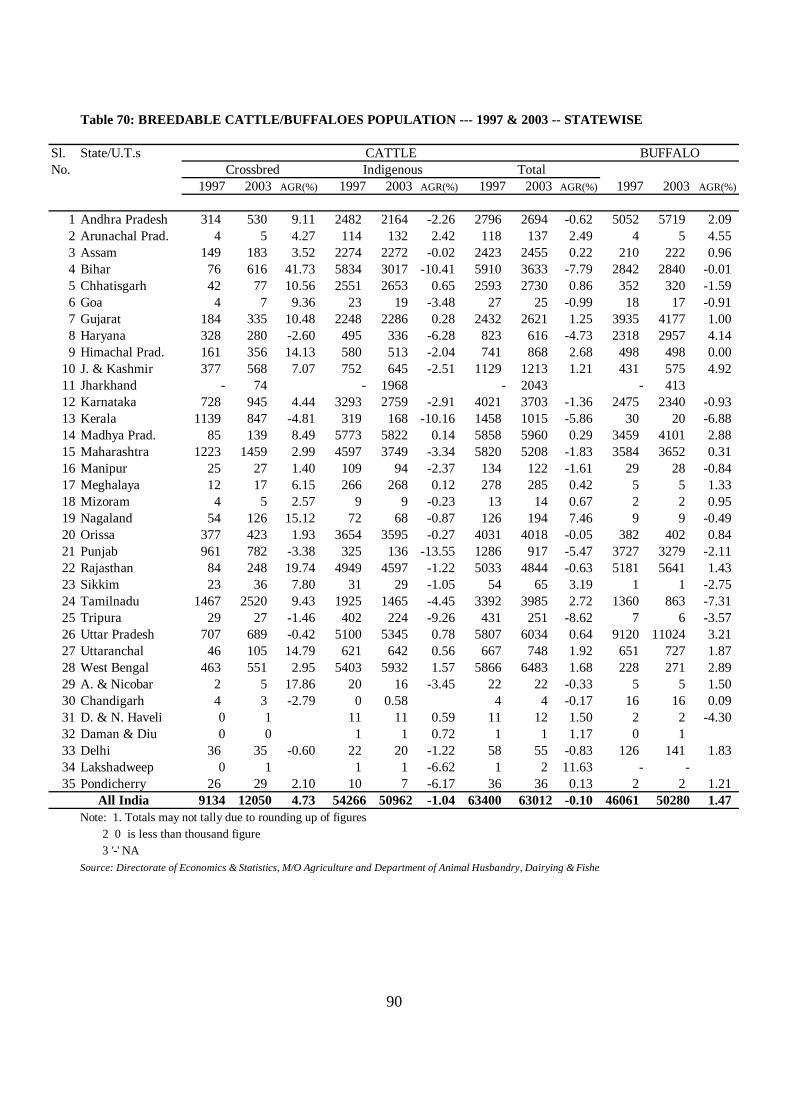
Table 70: BREEDABLE CATTLE/BUFFALOES POPULATION --- 1997 & 2003 -- STATEWISE
Sl. State/U.T.sNo.
1997 2003 AGR(%) 1997 2003 AGR(%) 1997 2003 AGR(%) 1997 2003 AGR(%)
1 Andhra Pradesh 314 530 9.11 2482 2164 -2.26 2796 2694 -0.62 5052 5719 2.092 Arunachal Prad. 4 5 4.27 114 132 2.42 118 137 2.49 4 5 4.553 Assam 149 183 3.52 2274 2272 -0.02 2423 2455 0.22 210 222 0.964 Bihar 76 616 41.73 5834 3017 -10.41 5910 3633 -7.79 2842 2840 -0.015 Chhatisgarh 42 77 10.56 2551 2653 0.65 2593 2730 0.86 352 320 -1.596 Goa 4 7 9.36 23 19 -3.48 27 25 -0.99 18 17 -0.917 Gujarat 184 335 10.48 2248 2286 0.28 2432 2621 1.25 3935 4177 1.008 Haryana 328 280 -2.60 495 336 -6.28 823 616 -4.73 2318 2957 4.149 Himachal Prad. 161 356 14.13 580 513 -2.04 741 868 2.68 498 498 0.00
10 J. & Kashmir 377 568 7.07 752 645 -2.51 1129 1213 1.21 431 575 4.9211 Jharkhand - 74 - 1968 - 2043 - 41312 Karnataka 728 945 4.44 3293 2759 -2.91 4021 3703 -1.36 2475 2340 -0.9313 Kerala 1139 847 -4.81 319 168 -10.16 1458 1015 -5.86 30 20 -6.8814 Madhya Prad. 85 139 8.49 5773 5822 0.14 5858 5960 0.29 3459 4101 2.8815 Maharashtra 1223 1459 2.99 4597 3749 -3.34 5820 5208 -1.83 3584 3652 0.3116 Manipur 25 27 1.40 109 94 -2.37 134 122 -1.61 29 28 -0.8417 Meghalaya 12 17 6.15 266 268 0.12 278 285 0.42 5 5 1.3318 Mizoram 4 5 2.57 9 9 -0.23 13 14 0.67 2 2 0.9519 Nagaland 54 126 15.12 72 68 -0.87 126 194 7.46 9 9 -0.4920 Orissa 377 423 1.93 3654 3595 -0.27 4031 4018 -0.05 382 402 0.8421 Punjab 961 782 -3.38 325 136 -13.55 1286 917 -5.47 3727 3279 -2.1122 Rajasthan 84 248 19.74 4949 4597 -1.22 5033 4844 -0.63 5181 5641 1.4323 Sikkim 23 36 7.80 31 29 -1.05 54 65 3.19 1 1 -2.7524 Tamilnadu 1467 2520 9.43 1925 1465 -4.45 3392 3985 2.72 1360 863 -7.3125 Tripura 29 27 -1.46 402 224 -9.26 431 251 -8.62 7 6 -3.5726 Uttar Pradesh 707 689 -0.42 5100 5345 0.78 5807 6034 0.64 9120 11024 3.2127 Uttaranchal 46 105 14.79 621 642 0.56 667 748 1.92 651 727 1.8728 West Bengal 463 551 2.95 5403 5932 1.57 5866 6483 1.68 228 271 2.8929 A. & Nicobar 2 5 17.86 20 16 -3.45 22 22 -0.33 5 5 1.5030 Chandigarh 4 3 -2.79 0 0.58 4 4 -0.17 16 16 0.0931 D. & N. Haveli 0 1 11 11 0.59 11 12 1.50 2 2 -4.3032 Daman & Diu 0 0 1 1 0.72 1 1 1.17 0 133 Delhi 36 35 -0.60 22 20 -1.22 58 55 -0.83 126 141 1.8334 Lakshadweep 0 1 1 1 -6.62 1 2 11.63 - -35 Pondicherry 26 29 2.10 10 7 -6.17 36 36 0.13 2 2 1.21
All India 9134 12050 4.73 54266 50962 -1.04 63400 63012 -0.10 46061 50280 1.47Note: 1. Totals may not tally due to rounding up of figures 2 0 is less than thousand figure 3 '-' NASource: Directorate of Economics & Statistics, M/O Agriculture and Department of Animal Husbandry, Dairying & Fisheries.
90
BUFFALOCATTLECrossbred Indigenous Total
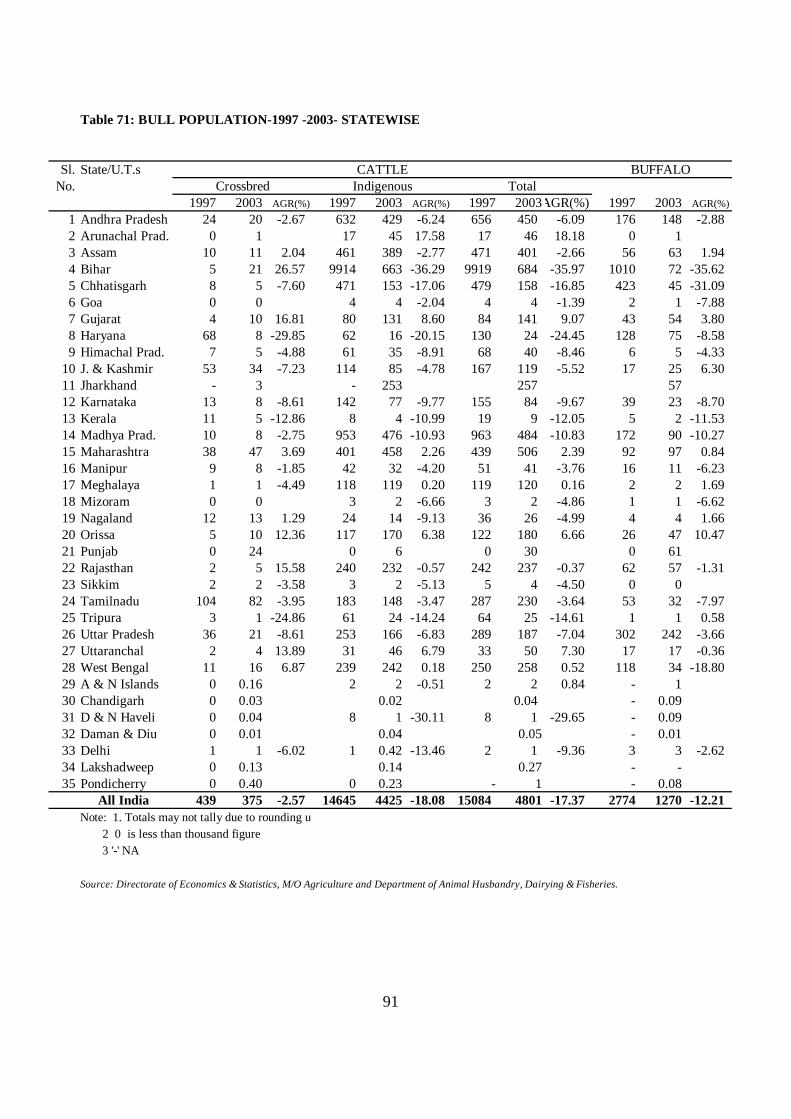
Table 71: BULL POPULATION-1997 -2003- STATEWISE
Sl. State/U.T.sNo.
1997 2003 AGR(%) 1997 2003 AGR(%) 1997 2003AGR(%) 1997 2003 AGR(%)1 Andhra Pradesh 24 20 -2.67 632 429 -6.24 656 450 -6.09 176 148 -2.882 Arunachal Prad. 0 1 17 45 17.58 17 46 18.18 0 13 Assam 10 11 2.04 461 389 -2.77 471 401 -2.66 56 63 1.944 Bihar 5 21 26.57 9914 663 -36.29 9919 684 -35.97 1010 72 -35.625 Chhatisgarh 8 5 -7.60 471 153 -17.06 479 158 -16.85 423 45 -31.096 Goa 0 0 4 4 -2.04 4 4 -1.39 2 1 -7.887 Gujarat 4 10 16.81 80 131 8.60 84 141 9.07 43 54 3.808 Haryana 68 8 -29.85 62 16 -20.15 130 24 -24.45 128 75 -8.589 Himachal Prad. 7 5 -4.88 61 35 -8.91 68 40 -8.46 6 5 -4.33
10 J. & Kashmir 53 34 -7.23 114 85 -4.78 167 119 -5.52 17 25 6.3011 Jharkhand - 3 - 253 257 5712 Karnataka 13 8 -8.61 142 77 -9.77 155 84 -9.67 39 23 -8.7013 Kerala 11 5 -12.86 8 4 -10.99 19 9 -12.05 5 2 -11.5314 Madhya Prad. 10 8 -2.75 953 476 -10.93 963 484 -10.83 172 90 -10.2715 Maharashtra 38 47 3.69 401 458 2.26 439 506 2.39 92 97 0.8416 Manipur 9 8 -1.85 42 32 -4.20 51 41 -3.76 16 11 -6.2317 Meghalaya 1 1 -4.49 118 119 0.20 119 120 0.16 2 2 1.6918 Mizoram 0 0 3 2 -6.66 3 2 -4.86 1 1 -6.6219 Nagaland 12 13 1.29 24 14 -9.13 36 26 -4.99 4 4 1.6620 Orissa 5 10 12.36 117 170 6.38 122 180 6.66 26 47 10.4721 Punjab 0 24 0 6 0 30 0 6122 Rajasthan 2 5 15.58 240 232 -0.57 242 237 -0.37 62 57 -1.3123 Sikkim 2 2 -3.58 3 2 -5.13 5 4 -4.50 0 024 Tamilnadu 104 82 -3.95 183 148 -3.47 287 230 -3.64 53 32 -7.9725 Tripura 3 1 -24.86 61 24 -14.24 64 25 -14.61 1 1 0.5826 Uttar Pradesh 36 21 -8.61 253 166 -6.83 289 187 -7.04 302 242 -3.6627 Uttaranchal 2 4 13.89 31 46 6.79 33 50 7.30 17 17 -0.3628 West Bengal 11 16 6.87 239 242 0.18 250 258 0.52 118 34 -18.8029 A & N Islands 0 0.16 2 2 -0.51 2 2 0.84 - 130 Chandigarh 0 0.03 0.02 0.04 - 0.0931 D & N Haveli 0 0.04 8 1 -30.11 8 1 -29.65 - 0.0932 Daman & Diu 0 0.01 0.04 0.05 - 0.0133 Delhi 1 1 -6.02 1 0.42 -13.46 2 1 -9.36 3 3 -2.6234 Lakshadweep 0 0.13 0.14 0.27 - -35 Pondicherry 0 0.40 0 0.23 - 1 - 0.08
All India 439 375 -2.57 14645 4425 -18.08 15084 4801 -17.37 2774 1270 -12.21Note: 1. Totals may not tally due to rounding up of figures 2 0 is less than thousand figure 3 '-' NA
Source: Directorate of Economics & Statistics, M/O Agriculture and Department of Animal Husbandry, Dairying & Fisheries.
91
CATTLETotal
BUFFALOCrossbred Indigenous
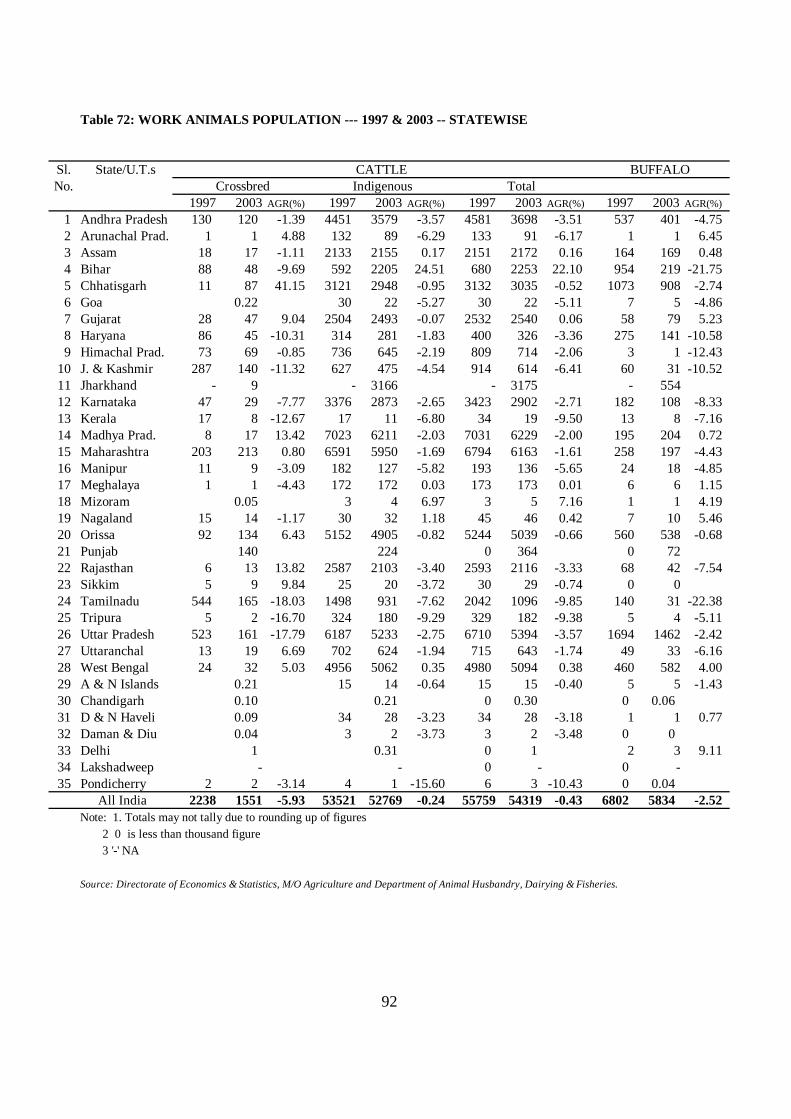
Table 72: WORK ANIMALS POPULATION --- 1997 & 2003 -- STATEWISE
Sl. State/U.T.sNo.
1997 2003 AGR(%) 1997 2003 AGR(%) 1997 2003 AGR(%) 1997 2003 AGR(%)1 Andhra Pradesh 130 120 -1.39 4451 3579 -3.57 4581 3698 -3.51 537 401 -4.752 Arunachal Prad. 1 1 4.88 132 89 -6.29 133 91 -6.17 1 1 6.453 Assam 18 17 -1.11 2133 2155 0.17 2151 2172 0.16 164 169 0.484 Bihar 88 48 -9.69 592 2205 24.51 680 2253 22.10 954 219 -21.755 Chhatisgarh 11 87 41.15 3121 2948 -0.95 3132 3035 -0.52 1073 908 -2.746 Goa 0.22 30 22 -5.27 30 22 -5.11 7 5 -4.867 Gujarat 28 47 9.04 2504 2493 -0.07 2532 2540 0.06 58 79 5.238 Haryana 86 45 -10.31 314 281 -1.83 400 326 -3.36 275 141 -10.589 Himachal Prad. 73 69 -0.85 736 645 -2.19 809 714 -2.06 3 1 -12.43
10 J. & Kashmir 287 140 -11.32 627 475 -4.54 914 614 -6.41 60 31 -10.5211 Jharkhand - 9 - 3166 - 3175 - 55412 Karnataka 47 29 -7.77 3376 2873 -2.65 3423 2902 -2.71 182 108 -8.3313 Kerala 17 8 -12.67 17 11 -6.80 34 19 -9.50 13 8 -7.1614 Madhya Prad. 8 17 13.42 7023 6211 -2.03 7031 6229 -2.00 195 204 0.7215 Maharashtra 203 213 0.80 6591 5950 -1.69 6794 6163 -1.61 258 197 -4.4316 Manipur 11 9 -3.09 182 127 -5.82 193 136 -5.65 24 18 -4.8517 Meghalaya 1 1 -4.43 172 172 0.03 173 173 0.01 6 6 1.1518 Mizoram 0.05 3 4 6.97 3 5 7.16 1 1 4.1919 Nagaland 15 14 -1.17 30 32 1.18 45 46 0.42 7 10 5.4620 Orissa 92 134 6.43 5152 4905 -0.82 5244 5039 -0.66 560 538 -0.6821 Punjab 140 224 0 364 0 7222 Rajasthan 6 13 13.82 2587 2103 -3.40 2593 2116 -3.33 68 42 -7.5423 Sikkim 5 9 9.84 25 20 -3.72 30 29 -0.74 0 024 Tamilnadu 544 165 -18.03 1498 931 -7.62 2042 1096 -9.85 140 31 -22.3825 Tripura 5 2 -16.70 324 180 -9.29 329 182 -9.38 5 4 -5.1126 Uttar Pradesh 523 161 -17.79 6187 5233 -2.75 6710 5394 -3.57 1694 1462 -2.4227 Uttaranchal 13 19 6.69 702 624 -1.94 715 643 -1.74 49 33 -6.1628 West Bengal 24 32 5.03 4956 5062 0.35 4980 5094 0.38 460 582 4.0029 A & N Islands 0.21 15 14 -0.64 15 15 -0.40 5 5 -1.4330 Chandigarh 0.10 0.21 0 0.30 0 0.0631 D & N Haveli 0.09 34 28 -3.23 34 28 -3.18 1 1 0.7732 Daman & Diu 0.04 3 2 -3.73 3 2 -3.48 0 033 Delhi 1 0.31 0 1 2 3 9.1134 Lakshadweep - - 0 - 0 -35 Pondicherry 2 2 -3.14 4 1 -15.60 6 3 -10.43 0 0.04
All India 2238 1551 -5.93 53521 52769 -0.24 55759 54319 -0.43 6802 5834 -2.52Note: 1. Totals may not tally due to rounding up of figures 2 0 is less than thousand figure 3 '-' NA
Source: Directorate of Economics & Statistics, M/O Agriculture and Department of Animal Husbandry, Dairying & Fisheries.
92
BUFFALOCrossbred Indigenous
CATTLETotal
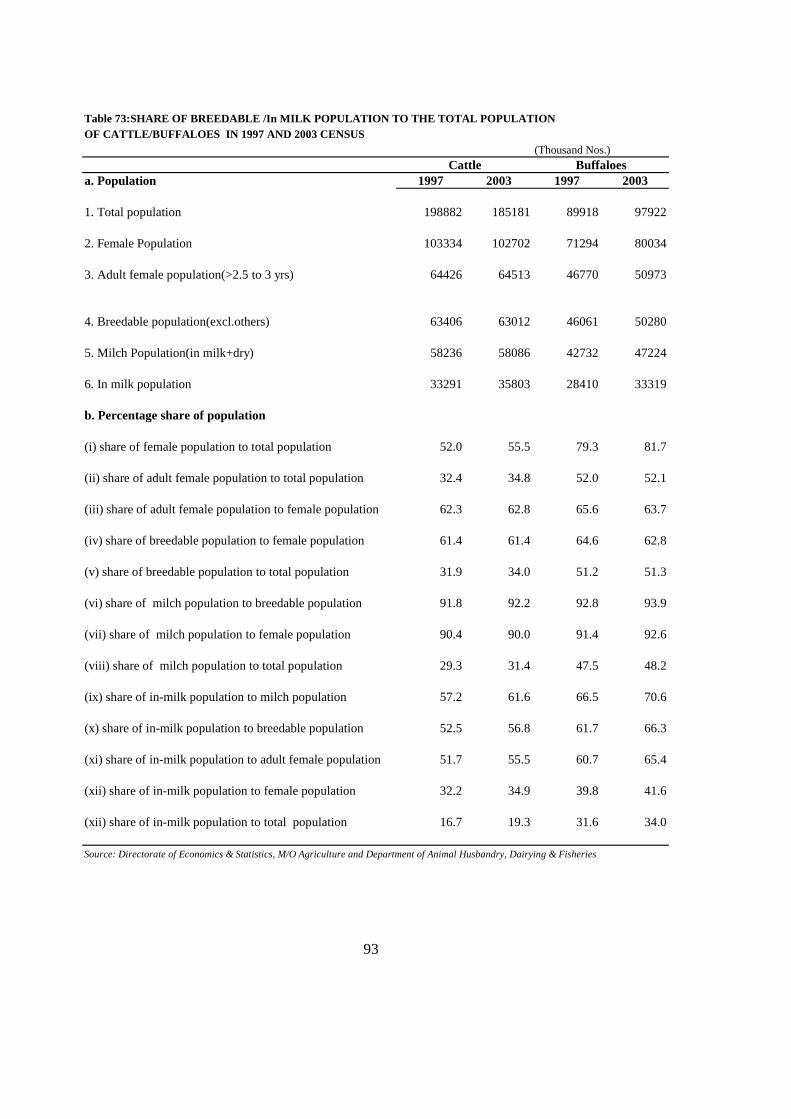
Table 73:SHARE OF BREEDABLE /In MILK POPULATION TO THE TOTAL POPULATIONOF CATTLE/BUFFALOES IN 1997 AND 2003 CENSUS
(Thousand Nos.)
a. Population 1997 2003 1997 2003
1. Total population 198882 185181 89918 97922
2. Female Population 103334 102702 71294 80034
3. Adult female population(>2.5 to 3 yrs) 64426 64513 46770 50973
4. Breedable population(excl.others) 63406 63012 46061 50280
5. Milch Population(in milk+dry) 58236 58086 42732 47224
6. In milk population 33291 35803 28410 33319
b. Percentage share of population
(i) share of female population to total population 52.0 55.5 79.3 81.7
(ii) share of adult female population to total population 32.4 34.8 52.0 52.1
(iii) share of adult female population to female population 62.3 62.8 65.6 63.7
(iv) share of breedable population to female population 61.4 61.4 64.6 62.8
(v) share of breedable population to total population 31.9 34.0 51.2 51.3
(vi) share of milch population to breedable population 91.8 92.2 92.8 93.9
(vii) share of milch population to female population 90.4 90.0 91.4 92.6
(viii) share of milch population to total population 29.3 31.4 47.5 48.2
(ix) share of in-milk population to milch population 57.2 61.6 66.5 70.6
(x) share of in-milk population to breedable population 52.5 56.8 61.7 66.3
(xi) share of in-milk population to adult female population 51.7 55.5 60.7 65.4
(xii) share of in-milk population to female population 32.2 34.9 39.8 41.6
(xii) share of in-milk population to total population 16.7 19.3 31.6 34.0
Source: Directorate of Economics & Statistics, M/O Agriculture and Department of Animal Husbandry, Dairying & Fisheries
BuffaloesCattle
93

Table 74:TOTAL NUMBER OF SHEEP & GOATS --- 1997& 2003 -- STATEWISE( in thousands)
Sl. State/U.T.s Goats Goats GoatsNo. Annl.
Cross- Indige- Total Gr.rate1997 2003 1997 2003 1997 2003 bred neous 1997 2003 (%)
1 Andhra Pradesh 75 380 9668 20996 9743 21376 31.06 13.80 13.99 5213 6277 3.142 Arunachal Prad. 0 0 27 19 27 19 -5.31 -5.29 154 231 7.013 Assam 3 1 81 168 84 170 -12.43 12.95 12.42 2717 2987 1.594 Bihar 47 84 1909 298 1956 382 10.14 -26.61 -23.82 20229 9490 -11.855 Chhatisgarh - 2 195 119 195 121 -7.96 -7.69 2154 2336 1.366 Goa - 0 0 13 11 -2.577 Gujarat 5 1770 2153 291 2158 2062 165.98 -28.35 -0.76 4386 4541 0.588 Haryana 395 70 880 563 1275 633 -24.99 -7.18 -11.02 968 460 -11.659 Himachal Pradesh 84 143 996 783 1080 926 9.26 -3.94 -2.54 1168 1125 -0.62
10 Jammu & Kashmir 1581 2002 1589 1408 3170 3411 4.01 -1.99 1.23 1864 2055 1.6411 Jharkhand 16 664 680 503112 Karnataka 197 12 7807 7244 8004 7256 -36.93 -1.24 -1.62 4875 4484 -1.3813 Kerala 1 - 2 4 3 4 10.45 3.23 1598 1213 -4.4914 Madhya Pradesh 45 120 612 426 657 546 17.81 -5.86 -3.03 6470 8142 3.9115 Maharashtra 68 52 3300 3042 3368 3094 -4.23 -1.35 -1.40 11434 10684 -1.1216 Manipur 0 0 8 6 8 6 -3.78 -3.46 33 33 0.2417 Meghalaya 1 1 17 18 18 18 -7.39 0.55 0.19 280 327 2.6418 Mizoram - 1 1 0 1 1 -12.69 0.90 15 17 1.9619 Nagaland 1 2 2 2 3 4 13.44 0.46 5.71 161 175 1.3920 Orissa 6 12 1759 1608 1765 1620 12.11 -1.48 -1.42 5772 5803 0.0921 Punjab 85 71 352 149 437 220 -2.93 -13.35 -10.80 414 278 -6.4122 Rajasthan 49 66 14535 9988 14584 10054 5.09 -6.06 -6.01 16971 16809 -0.1623 Sikkim 1 0.27 4 6 5 6 -19.81 5.55 2.49 86 124 6.2724 Tamilnadu 256 769 5003 4825 5259 5593 20.12 -0.60 1.03 6416 8177 4.1325 Tripura 1 0.05 5 3 6 3 -39.10 -6.52 -9.09 639 472 -4.9426 Uttar Pradesh 137 38 1769 1399 1906 1437 -19.27 -3.84 -4.60 11784 12941 1.5727 Uttaranchal 49 90 262 206 311 296 10.70 -3.95 -0.83 1070 1158 1.3328 West Bengal 21 23 1440 1502 1461 1525 1.28 0.71 0.72 15648 18774 3.0829 A. & Nicobar 0 - 0 - 0 - 71 64 -1.6830 Chandigarh - 0.01 - 0.03 0.03 1 1 -3.5331 D. & Nagar Haveli - 0.05 - - 0.05 20 21 0.7232 Daman & Diu 0 0.10 0 0.02 0 0.12 5 4 -2.2033 Delhi 1 1 10 2 11 3 0.78 -21.56 -17.87 25 17 -6.4334 Lakshadweep 0 - - - 26 47 10.5035 Pondicherry - 1 2 2 2 3 -1.37 4.40 41 48 2.50
All India 3109 5729 54388 55741 57494 61469 10.72 0.41 1.12 122721 124358 0.22Note: 1. Totals may not tally due to rounding up of figures 2 0 is less than thousand figure 3 '-' NA
Source: Directorate of Economics & Statistics, M/O Agriculture and Department of Animal Husbandry, Dairying & Fisheries.
Annual Growth Rate (%)
94
CrossbredSheep (1997-2003)
Indigenous Total
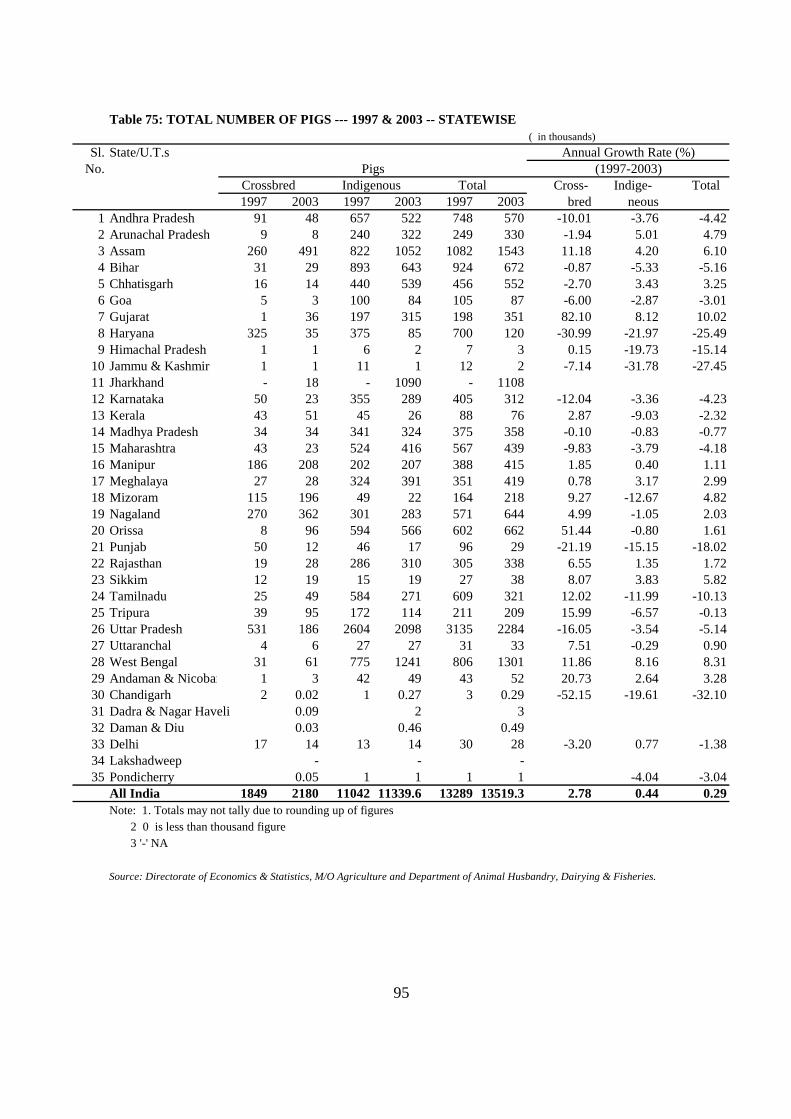
Table 75: TOTAL NUMBER OF PIGS --- 1997 & 2003 -- STATEWISE( in thousands)
Sl. State/U.T.sNo.
Cross- Indige- Total1997 2003 1997 2003 1997 2003 bred neous
1 Andhra Pradesh 91 48 657 522 748 570 -10.01 -3.76 -4.422 Arunachal Pradesh 9 8 240 322 249 330 -1.94 5.01 4.793 Assam 260 491 822 1052 1082 1543 11.18 4.20 6.104 Bihar 31 29 893 643 924 672 -0.87 -5.33 -5.165 Chhatisgarh 16 14 440 539 456 552 -2.70 3.43 3.256 Goa 5 3 100 84 105 87 -6.00 -2.87 -3.017 Gujarat 1 36 197 315 198 351 82.10 8.12 10.028 Haryana 325 35 375 85 700 120 -30.99 -21.97 -25.499 Himachal Pradesh 1 1 6 2 7 3 0.15 -19.73 -15.14
10 Jammu & Kashmir 1 1 11 1 12 2 -7.14 -31.78 -27.4511 Jharkhand - 18 - 1090 - 110812 Karnataka 50 23 355 289 405 312 -12.04 -3.36 -4.2313 Kerala 43 51 45 26 88 76 2.87 -9.03 -2.3214 Madhya Pradesh 34 34 341 324 375 358 -0.10 -0.83 -0.7715 Maharashtra 43 23 524 416 567 439 -9.83 -3.79 -4.1816 Manipur 186 208 202 207 388 415 1.85 0.40 1.1117 Meghalaya 27 28 324 391 351 419 0.78 3.17 2.9918 Mizoram 115 196 49 22 164 218 9.27 -12.67 4.8219 Nagaland 270 362 301 283 571 644 4.99 -1.05 2.0320 Orissa 8 96 594 566 602 662 51.44 -0.80 1.6121 Punjab 50 12 46 17 96 29 -21.19 -15.15 -18.0222 Rajasthan 19 28 286 310 305 338 6.55 1.35 1.7223 Sikkim 12 19 15 19 27 38 8.07 3.83 5.8224 Tamilnadu 25 49 584 271 609 321 12.02 -11.99 -10.1325 Tripura 39 95 172 114 211 209 15.99 -6.57 -0.1326 Uttar Pradesh 531 186 2604 2098 3135 2284 -16.05 -3.54 -5.1427 Uttaranchal 4 6 27 27 31 33 7.51 -0.29 0.9028 West Bengal 31 61 775 1241 806 1301 11.86 8.16 8.3129 Andaman & Nicobar 1 3 42 49 43 52 20.73 2.64 3.2830 Chandigarh 2 0.02 1 0.27 3 0.29 -52.15 -19.61 -32.1031 Dadra & Nagar Haveli 0.09 2 332 Daman & Diu 0.03 0.46 0.4933 Delhi 17 14 13 14 30 28 -3.20 0.77 -1.3834 Lakshadweep - - -35 Pondicherry 0.05 1 1 1 1 -4.04 -3.04
All India 1849 2180 11042 11339.6 13289 13519.3 2.78 0.44 0.29Note: 1. Totals may not tally due to rounding up of figures 2 0 is less than thousand figure 3 '-' NA
Source: Directorate of Economics & Statistics, M/O Agriculture and Department of Animal Husbandry, Dairying & Fisheries.
Pigs
95
Annual Growth Rate (%)(1997-2003)
Crossbred Indigenous Total

Table 76: TOTAL NUMBER OF DESI AND IMPROVED FOWLS --- 1997 & 2003 -- STATEWISE( in thousands)
Sl. State/U.T.sNo.
Desi Improved Total1997 2003 1997 2003 1997 2003
1 Andhra Pradesh 26078 27996 36887 73989 62965 101985 1.19 12.30 8.372 Arunachal Prad. 1013 1424 174 187 1187 1610 5.84 1.18 5.213 Assam 11298 12074 1262 2584 12560 14658 1.11 12.69 2.614 Bihar 16063 10148 539 2672 16602 12820 -7.37 30.58 -4.225 Chhatisgarh 4176 4995 2319 3010 6495 8005 3.03 4.44 3.546 Goa 269 209 519 356 788 565 -4.12 -6.09 -5.397 Gujarat 3023 3362 4208 4738 7231 8100 1.79 2.00 1.918 Haryana 2000 872 7200 12738 9200 13610 -12.92 9.97 6.749 Himachal Prad. 379 207 485 559 864 767 -9.57 2.41 -1.97
10 J. & Kashmir 3606 3529 1425 1796 5031 5325 -0.36 3.93 0.9511 Jharkhand 12366 1099 1346512 Karnataka 11798 9601 9510 15975 21308 25576 -3.38 9.03 3.0913 Kerala 11024 7736 5884 3256 16908 10992 -5.73 -9.39 -6.9314 Madhya Prad. 5734 7613 1518 4063 7252 11676 4.84 17.83 8.2615 Maharashtra 25148 22583 10159 15310 35307 37892 -1.78 7.07 1.1816 Manipur 1468 1426 966 957 2434 2383 -0.48 -0.16 -0.3517 Meghalaya 1994 2625 107 137 2101 2762 4.69 4.15 4.6618 Mizoram 1083 785 211 329 1294 1114 -5.22 7.67 -2.4719 Nagaland 1551 1730 812 943 2363 2673 1.84 2.52 2.0720 Orissa 13452 12910 4112 3977 17564 16886 -0.68 -0.56 -0.6521 Punjab 11022 981 9792 11022 10773 -33.18 -0.3822 Rajasthan 2588 2829 1810 3356 4398 6185 1.50 10.84 5.8523 Sikkim 169 214 51 106 220 321 4.05 13.02 6.4924 Tamilnadu 14350 46367 21442 39753 35792 86120 21.59 10.84 15.7625 Tripura 2456 1910 221 361 2677 2271 -4.10 8.52 -2.7026 Uttar Pradesh 7253 6311 4417 4951 11670 11262 -2.29 1.92 -0.5927 Uttaranchal 425 492 529 1475 1967 2.48 18.6328 West Bengal 7488 33984 9445 9716 16933 43700 28.67 0.47 17.1229 A. & Nicobar 587 673 151 184 738 857 2.30 3.37 2.5330 Chandigarh 1 12 293 140 294 152 51.08 -11.54 -10.3931 D. & N. Haveli 81 81 330 25 117 106 -0.09 -34.85 -1.6732 Daman & Diu 23 26 0 2 23 28 2.03 3.2133 Delhi 631 3 16 455 647 458 -58.25 74.68 -5.6034 Lakshadweep 45 49 31 80 76 129 1.31 17.08 9.1535 Pondicherry 88 82 28 124 116 207 -1.13 28.21 10.09
All India 188364 238206 127061 219193 314177 457399 3.99 9.51 6.46Note: 1. Totals may not tally due to rounding up of figuresSource: Directorate of Economics & Statistics, M/O Agriculture and Department of Animal Husbandry, Dairying & Fisheries.
96
Annual Growth Rate (%)Fowls (1997-2003)
Desi Improved Total
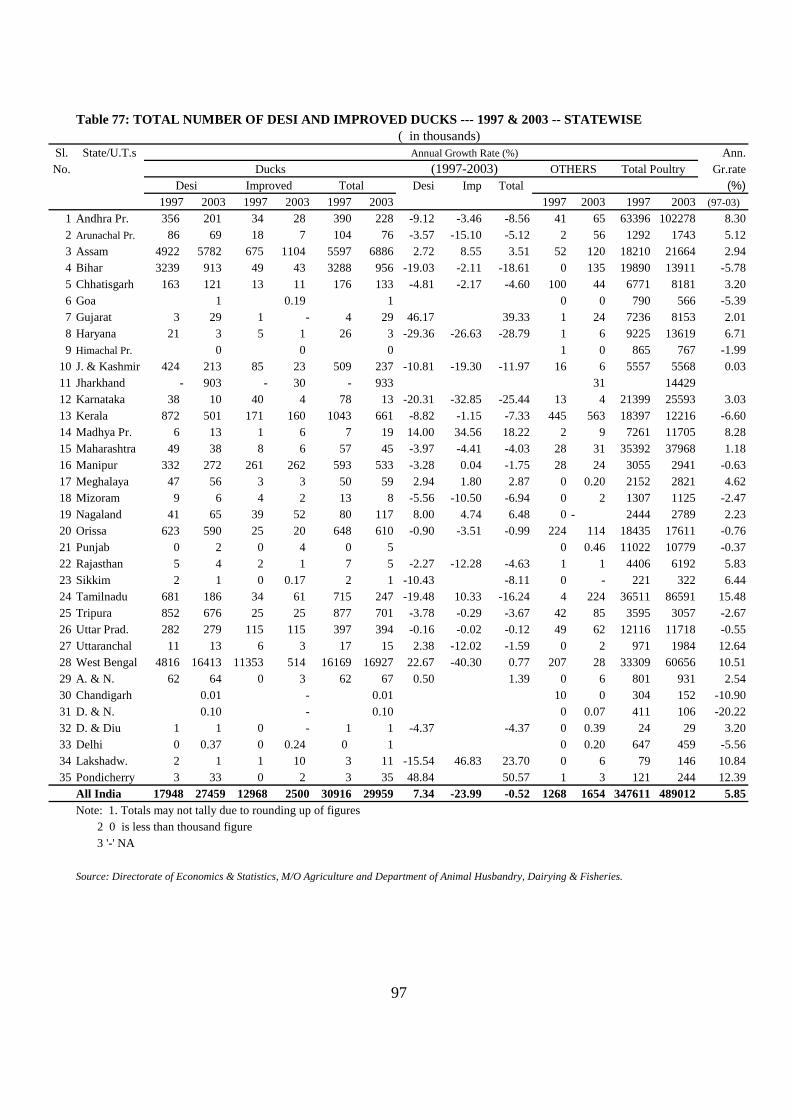
Table 77: TOTAL NUMBER OF DESI AND IMPROVED DUCKS --- 1997 & 2003 -- STATEWISE( in thousands)
Sl. State/U.T.s Ann.No. Gr.rate
Desi Imp Total (%)1997 2003 1997 2003 1997 2003 1997 2003 1997 2003 (97-03)
1 Andhra Pr. 356 201 34 28 390 228 -9.12 -3.46 -8.56 41 65 63396 102278 8.302 Arunachal Pr. 86 69 18 7 104 76 -3.57 -15.10 -5.12 2 56 1292 1743 5.123 Assam 4922 5782 675 1104 5597 6886 2.72 8.55 3.51 52 120 18210 21664 2.944 Bihar 3239 913 49 43 3288 956 -19.03 -2.11 -18.61 0 135 19890 13911 -5.785 Chhatisgarh 163 121 13 11 176 133 -4.81 -2.17 -4.60 100 44 6771 8181 3.206 Goa 1 0.19 1 0 0 790 566 -5.397 Gujarat 3 29 1 - 4 29 46.17 39.33 1 24 7236 8153 2.018 Haryana 21 3 5 1 26 3 -29.36 -26.63 -28.79 1 6 9225 13619 6.719 Himachal Pr. 0 0 0 1 0 865 767 -1.99
10 J. & Kashmir 424 213 85 23 509 237 -10.81 -19.30 -11.97 16 6 5557 5568 0.0311 Jharkhand - 903 - 30 - 933 31 1442912 Karnataka 38 10 40 4 78 13 -20.31 -32.85 -25.44 13 4 21399 25593 3.0313 Kerala 872 501 171 160 1043 661 -8.82 -1.15 -7.33 445 563 18397 12216 -6.6014 Madhya Pr. 6 13 1 6 7 19 14.00 34.56 18.22 2 9 7261 11705 8.2815 Maharashtra 49 38 8 6 57 45 -3.97 -4.41 -4.03 28 31 35392 37968 1.1816 Manipur 332 272 261 262 593 533 -3.28 0.04 -1.75 28 24 3055 2941 -0.6317 Meghalaya 47 56 3 3 50 59 2.94 1.80 2.87 0 0.20 2152 2821 4.6218 Mizoram 9 6 4 2 13 8 -5.56 -10.50 -6.94 0 2 1307 1125 -2.4719 Nagaland 41 65 39 52 80 117 8.00 4.74 6.48 0 - 2444 2789 2.2320 Orissa 623 590 25 20 648 610 -0.90 -3.51 -0.99 224 114 18435 17611 -0.7621 Punjab 0 2 0 4 0 5 0 0.46 11022 10779 -0.3722 Rajasthan 5 4 2 1 7 5 -2.27 -12.28 -4.63 1 1 4406 6192 5.8323 Sikkim 2 1 0 0.17 2 1 -10.43 -8.11 0 - 221 322 6.4424 Tamilnadu 681 186 34 61 715 247 -19.48 10.33 -16.24 4 224 36511 86591 15.4825 Tripura 852 676 25 25 877 701 -3.78 -0.29 -3.67 42 85 3595 3057 -2.6726 Uttar Prad. 282 279 115 115 397 394 -0.16 -0.02 -0.12 49 62 12116 11718 -0.5527 Uttaranchal 11 13 6 3 17 15 2.38 -12.02 -1.59 0 2 971 1984 12.6428 West Bengal 4816 16413 11353 514 16169 16927 22.67 -40.30 0.77 207 28 33309 60656 10.5129 A. & N. 62 64 0 3 62 67 0.50 1.39 0 6 801 931 2.5430 Chandigarh 0.01 - 0.01 10 0 304 152 -10.9031 D. & N. 0.10 - 0.10 0 0.07 411 106 -20.2232 D. & Diu 1 1 0 - 1 1 -4.37 -4.37 0 0.39 24 29 3.2033 Delhi 0 0.37 0 0.24 0 1 0 0.20 647 459 -5.5634 Lakshadw. 2 1 1 10 3 11 -15.54 46.83 23.70 0 6 79 146 10.8435 Pondicherry 3 33 0 2 3 35 48.84 50.57 1 3 121 244 12.39
All India 17948 27459 12968 2500 30916 29959 7.34 -23.99 -0.52 1268 1654 347611 489012 5.85Note: 1. Totals may not tally due to rounding up of figures 2 0 is less than thousand figure 3 '-' NA
Source: Directorate of Economics & Statistics, M/O Agriculture and Department of Animal Husbandry, Dairying & Fisheries.
Annual Growth Rate (%) OTHERS Total Poultry
97
DucksDesi Improved Total
(1997-2003)
PART V
Growth rates&
Plan expenditure
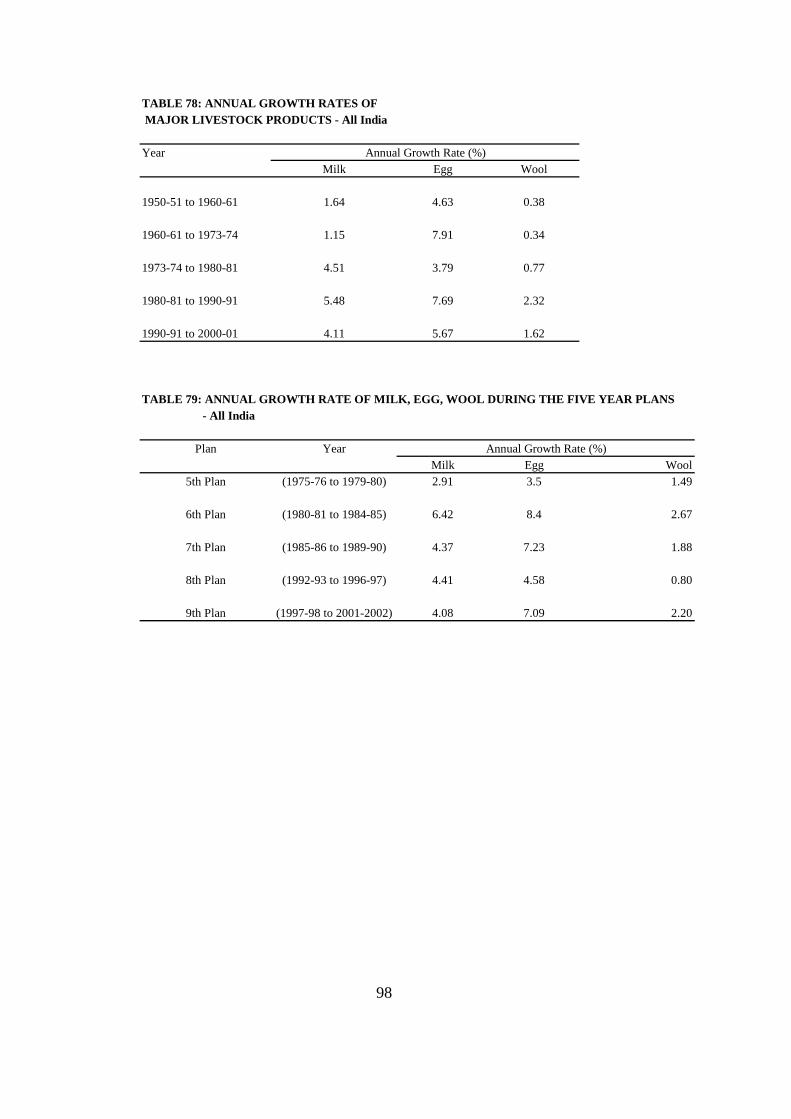
TABLE 78: ANNUAL GROWTH RATES OF MAJOR LIVESTOCK PRODUCTS - All India
YearMilk Egg Wool
1950-51 to 1960-61 1.64 4.63 0.38
1960-61 to 1973-74 1.15 7.91 0.34
1973-74 to 1980-81 4.51 3.79 0.77
1980-81 to 1990-91 5.48 7.69 2.32
1990-91 to 2000-01 4.11 5.67 1.62
TABLE 79: ANNUAL GROWTH RATE OF MILK, EGG, WOOL DURING THE FIVE YEAR PLANS - All India
Plan YearMilk Egg Wool
5th Plan (1975-76 to 1979-80) 2.91 3.5 1.49
6th Plan (1980-81 to 1984-85) 6.42 8.4 2.67
7th Plan (1985-86 to 1989-90) 4.37 7.23 1.88
8th Plan (1992-93 to 1996-97) 4.41 4.58 0.80
9th Plan (1997-98 to 2001-2002) 4.08 7.09 2.20
Annual Growth Rate (%)
Annual Growth Rate (%)
98
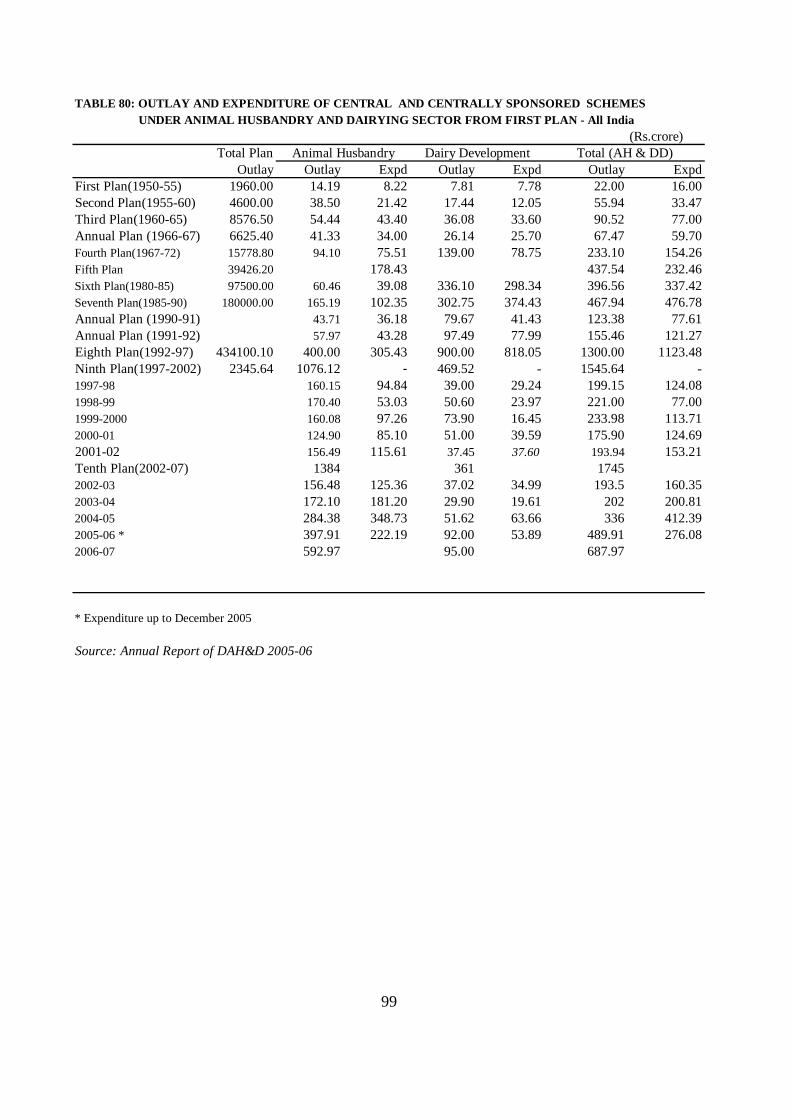
TABLE 80: OUTLAY AND EXPENDITURE OF CENTRAL AND CENTRALLY SPONSORED SCHEMES UNDER ANIMAL HUSBANDRY AND DAIRYING SECTOR FROM FIRST PLAN - All India
(Rs.crore)Total Plan
Outlay Outlay Expd Outlay Expd Outlay ExpdFirst Plan(1950-55) 1960.00 14.19 8.22 7.81 7.78 22.00 16.00Second Plan(1955-60) 4600.00 38.50 21.42 17.44 12.05 55.94 33.47Third Plan(1960-65) 8576.50 54.44 43.40 36.08 33.60 90.52 77.00Annual Plan (1966-67) 6625.40 41.33 34.00 26.14 25.70 67.47 59.70Fourth Plan(1967-72) 15778.80 94.10 75.51 139.00 78.75 233.10 154.26Fifth Plan 39426.20 178.43 437.54 232.46Sixth Plan(1980-85) 97500.00 60.46 39.08 336.10 298.34 396.56 337.42Seventh Plan(1985-90) 180000.00 165.19 102.35 302.75 374.43 467.94 476.78Annual Plan (1990-91) 43.71 36.18 79.67 41.43 123.38 77.61Annual Plan (1991-92) 57.97 43.28 97.49 77.99 155.46 121.27Eighth Plan(1992-97) 434100.10 400.00 305.43 900.00 818.05 1300.00 1123.48Ninth Plan(1997-2002) 2345.64 1076.12 - 469.52 - 1545.64 -1997-98 160.15 94.84 39.00 29.24 199.15 124.081998-99 170.40 53.03 50.60 23.97 221.00 77.001999-2000 160.08 97.26 73.90 16.45 233.98 113.712000-01 124.90 85.10 51.00 39.59 175.90 124.692001-02 156.49 115.61 37.45 37.60 193.94 153.21Tenth Plan(2002-07) 1384 361 17452002-03 156.48 125.36 37.02 34.99 193.5 160.352003-04 172.10 181.20 29.90 19.61 202 200.812004-05 284.38 348.73 51.62 63.66 336 412.392005-06 * 397.91 222.19 92.00 53.89 489.91 276.082006-07 592.97 95.00 687.97
* Expenditure up to December 2005
Source: Annual Report of DAH&D 2005-06
Animal Husbandry Dairy Development Total (AH & DD)
99
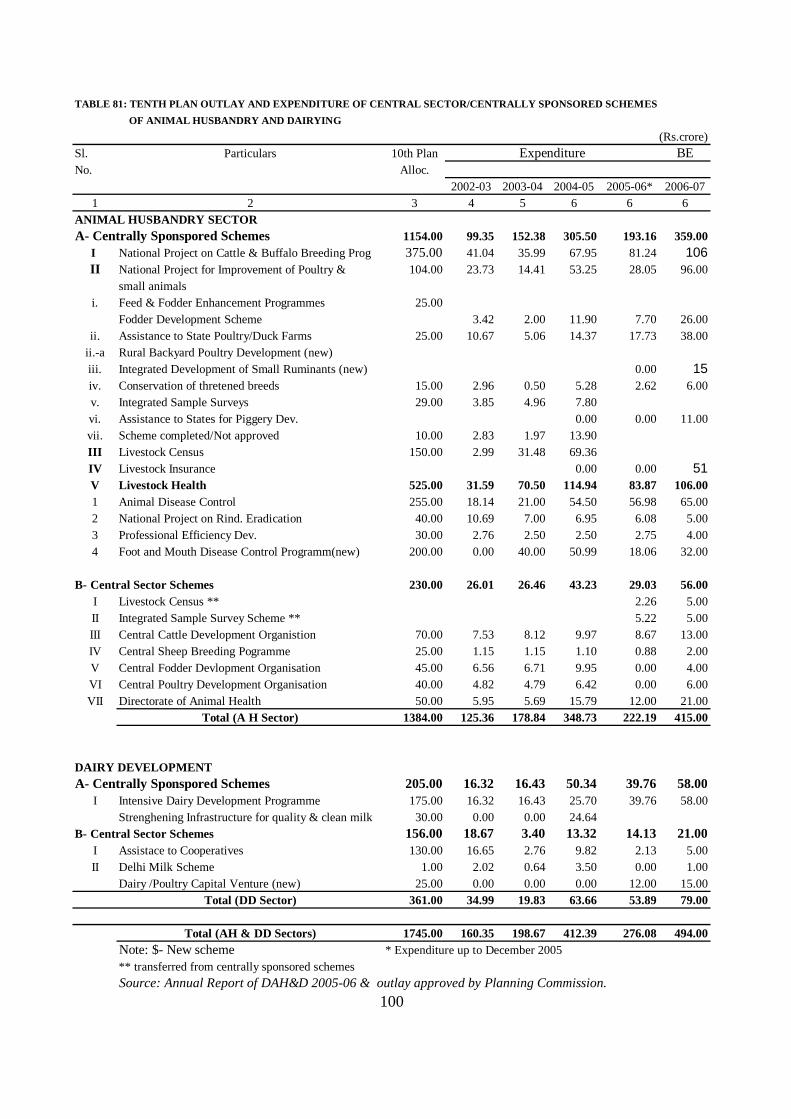
TABLE 81: TENTH PLAN OUTLAY AND EXPENDITURE OF CENTRAL SECTOR/CENTRALLY SPONSORED SCHEMES
(Rs.crore)Sl. Particulars 10th Plan BENo. Alloc.
2002-03 2003-04 2004-05 2005-06* 2006-071 2 3 4 5 6 6 6
ANIMAL HUSBANDRY SECTOR1154.00 99.35 152.38 305.50 193.16 359.00
I National Project on Cattle & Buffalo Breeding Prog 375.00 41.04 35.99 67.95 81.24 106II National Project for Improvement of Poultry & 104.00 23.73 14.41 53.25 28.05 96.00
small animalsi. Feed & Fodder Enhancement Programmes 25.00
Fodder Development Scheme 3.42 2.00 11.90 7.70 26.00ii. Assistance to State Poultry/Duck Farms 25.00 10.67 5.06 14.37 17.73 38.00
ii.-a Rural Backyard Poultry Development (new)iii. Integrated Development of Small Ruminants (new) 0.00 15iv. Conservation of thretened breeds 15.00 2.96 0.50 5.28 2.62 6.00v. Integrated Sample Surveys 29.00 3.85 4.96 7.80vi. Assistance to States for Piggery Dev. 0.00 0.00 11.00vii. Scheme completed/Not approved 10.00 2.83 1.97 13.90III Livestock Census 150.00 2.99 31.48 69.36IV Livestock Insurance 0.00 0.00 51V Livestock Health 525.00 31.59 70.50 114.94 83.87 106.001 Animal Disease Control 255.00 18.14 21.00 54.50 56.98 65.002 National Project on Rind. Eradication 40.00 10.69 7.00 6.95 6.08 5.003 Professional Efficiency Dev. 30.00 2.76 2.50 2.50 2.75 4.004 Foot and Mouth Disease Control Programm(new) 200.00 0.00 40.00 50.99 18.06 32.00
230.00 26.01 26.46 43.23 29.03 56.00I Livestock Census ** 2.26 5.00II Integrated Sample Survey Scheme ** 5.22 5.00III Central Cattle Development Organistion 70.00 7.53 8.12 9.97 8.67 13.00IV Central Sheep Breeding Pogramme 25.00 1.15 1.15 1.10 0.88 2.00V Central Fodder Devlopment Organisation 45.00 6.56 6.71 9.95 0.00 4.00VI Central Poultry Development Organisation 40.00 4.82 4.79 6.42 0.00 6.00VII Directorate of Animal Health 50.00 5.95 5.69 15.79 12.00 21.00
Total (A H Sector) 1384.00 125.36 178.84 348.73 222.19 415.00
DAIRY DEVELOPMENT205.00 16.32 16.43 50.34 39.76 58.00
I Intensive Dairy Development Programme 175.00 16.32 16.43 25.70 39.76 58.00Strenghening Infrastructure for quality & clean milk 30.00 0.00 0.00 24.64
156.00 18.67 3.40 13.32 14.13 21.00I Assistace to Cooperatives 130.00 16.65 2.76 9.82 2.13 5.00II Delhi Milk Scheme 1.00 2.02 0.64 3.50 0.00 1.00
Dairy /Poultry Capital Venture (new) 25.00 0.00 0.00 0.00 12.00 15.00Total (DD Sector) 361.00 34.99 19.83 63.66 53.89 79.00
Total (AH & DD Sectors) 1745.00 160.35 198.67 412.39 276.08 494.00Note: $- New scheme * Expenditure up to December 2005** transferred from centrally sponsored schemesSource: Annual Report of DAH&D 2005-06 & outlay approved by Planning Commission.
A- Centrally Sponspored Schemes
B- Central Sector Schemes
100
OF ANIMAL HUSBANDRY AND DAIRYING
Expenditure
A- Centrally Sponspored Schemes
B- Central Sector Schemes
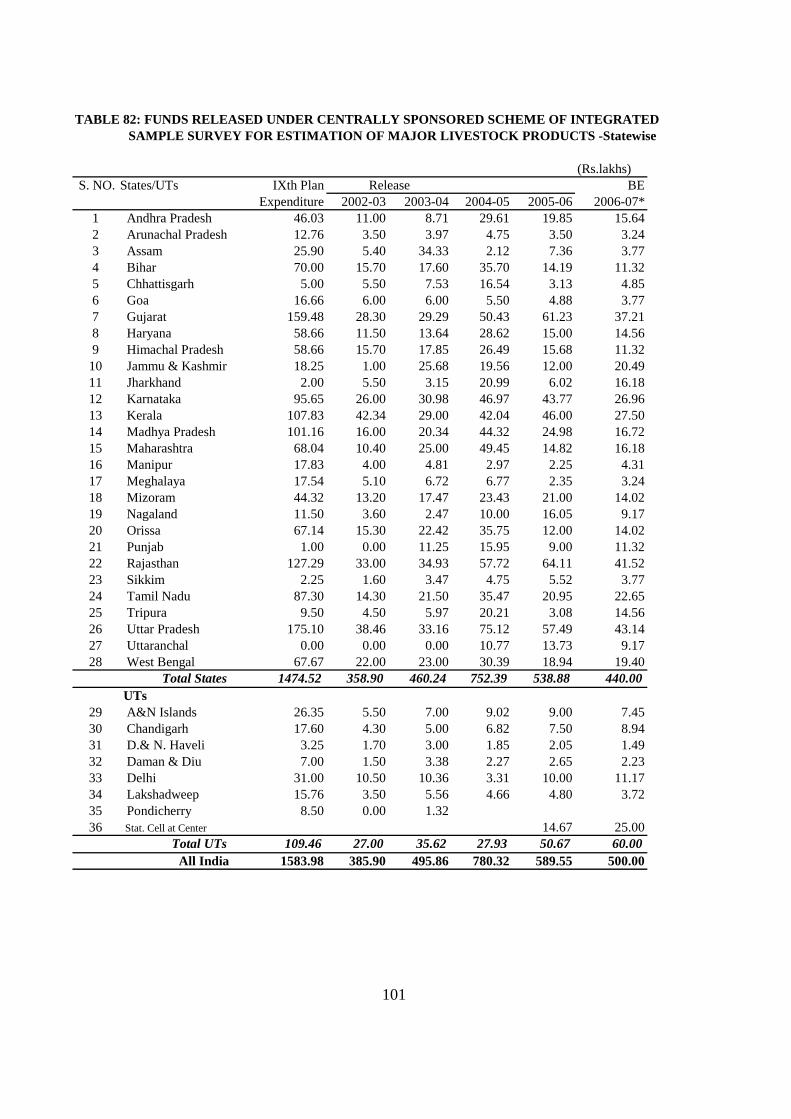
TABLE 82: FUNDS RELEASED UNDER CENTRALLY SPONSORED SCHEME OF INTEGRATED SAMPLE SURVEY FOR ESTIMATION OF MAJOR LIVESTOCK PRODUCTS -Statewise
(Rs.lakhs)S. NO. States/UTs IXth Plan BE
Expenditure 2002-03 2003-04 2004-05 2005-06 2006-07*1 Andhra Pradesh 46.03 11.00 8.71 29.61 19.85 15.642 Arunachal Pradesh 12.76 3.50 3.97 4.75 3.50 3.243 Assam 25.90 5.40 34.33 2.12 7.36 3.774 Bihar 70.00 15.70 17.60 35.70 14.19 11.325 Chhattisgarh 5.00 5.50 7.53 16.54 3.13 4.856 Goa 16.66 6.00 6.00 5.50 4.88 3.777 Gujarat 159.48 28.30 29.29 50.43 61.23 37.218 Haryana 58.66 11.50 13.64 28.62 15.00 14.569 Himachal Pradesh 58.66 15.70 17.85 26.49 15.68 11.32
10 Jammu & Kashmir 18.25 1.00 25.68 19.56 12.00 20.4911 Jharkhand 2.00 5.50 3.15 20.99 6.02 16.1812 Karnataka 95.65 26.00 30.98 46.97 43.77 26.9613 Kerala 107.83 42.34 29.00 42.04 46.00 27.5014 Madhya Pradesh 101.16 16.00 20.34 44.32 24.98 16.7215 Maharashtra 68.04 10.40 25.00 49.45 14.82 16.1816 Manipur 17.83 4.00 4.81 2.97 2.25 4.3117 Meghalaya 17.54 5.10 6.72 6.77 2.35 3.2418 Mizoram 44.32 13.20 17.47 23.43 21.00 14.0219 Nagaland 11.50 3.60 2.47 10.00 16.05 9.1720 Orissa 67.14 15.30 22.42 35.75 12.00 14.0221 Punjab 1.00 0.00 11.25 15.95 9.00 11.3222 Rajasthan 127.29 33.00 34.93 57.72 64.11 41.5223 Sikkim 2.25 1.60 3.47 4.75 5.52 3.7724 Tamil Nadu 87.30 14.30 21.50 35.47 20.95 22.6525 Tripura 9.50 4.50 5.97 20.21 3.08 14.5626 Uttar Pradesh 175.10 38.46 33.16 75.12 57.49 43.1427 Uttaranchal 0.00 0.00 0.00 10.77 13.73 9.1728 West Bengal 67.67 22.00 23.00 30.39 18.94 19.40
Total States 1474.52 358.90 460.24 752.39 538.88 440.00 UTs
29 A&N Islands 26.35 5.50 7.00 9.02 9.00 7.4530 Chandigarh 17.60 4.30 5.00 6.82 7.50 8.9431 D.& N. Haveli 3.25 1.70 3.00 1.85 2.05 1.4932 Daman & Diu 7.00 1.50 3.38 2.27 2.65 2.2333 Delhi 31.00 10.50 10.36 3.31 10.00 11.1734 Lakshadweep 15.76 3.50 5.56 4.66 4.80 3.7235 Pondicherry 8.50 0.00 1.3236 Stat. Cell at Center 14.67 25.00
Total UTs 109.46 27.00 35.62 27.93 50.67 60.00All India 1583.98 385.90 495.86 780.32 589.55 500.00
Release
101
PART VI
Gross Domestic productof
Livestock Sector
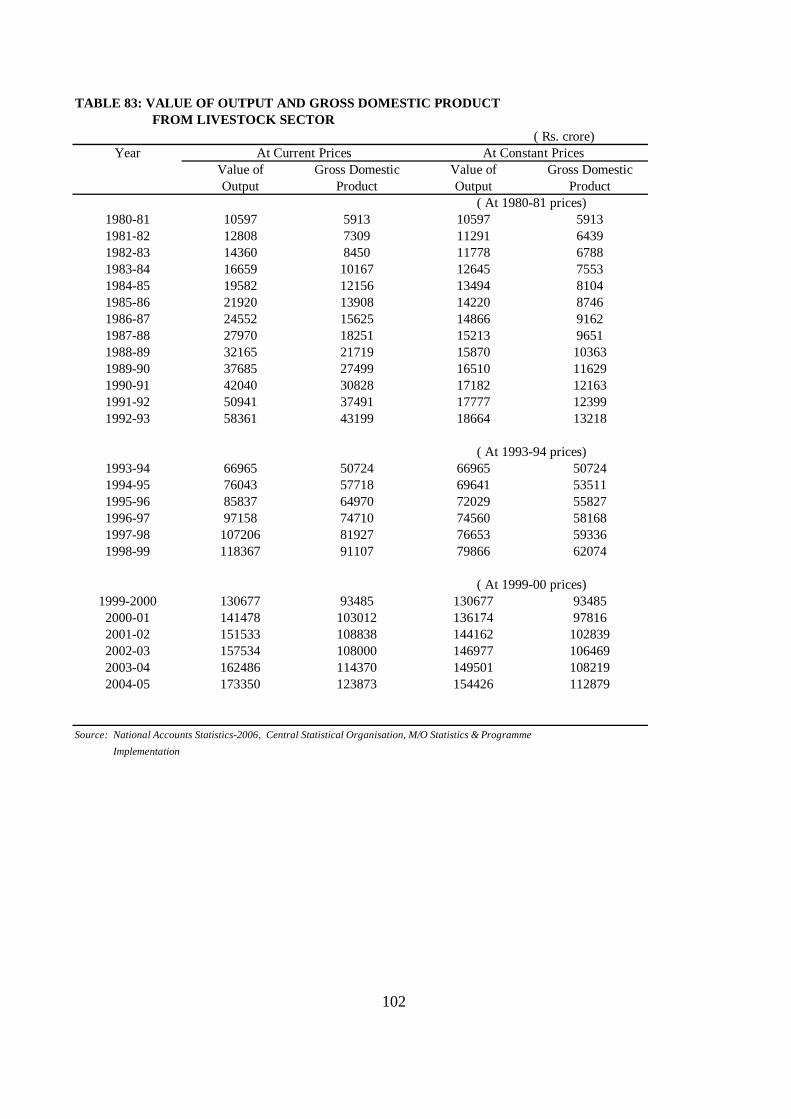
TABLE 83: VALUE OF OUTPUT AND GROSS DOMESTIC PRODUCT FROM LIVESTOCK SECTOR
( Rs. crore)Year
Value of Gross Domestic Value of Gross DomesticOutput Product Output Product
1980-81 10597 5913 10597 59131981-82 12808 7309 11291 64391982-83 14360 8450 11778 67881983-84 16659 10167 12645 75531984-85 19582 12156 13494 81041985-86 21920 13908 14220 87461986-87 24552 15625 14866 91621987-88 27970 18251 15213 96511988-89 32165 21719 15870 103631989-90 37685 27499 16510 116291990-91 42040 30828 17182 121631991-92 50941 37491 17777 123991992-93 58361 43199 18664 13218
1993-94 66965 50724 66965 507241994-95 76043 57718 69641 535111995-96 85837 64970 72029 558271996-97 97158 74710 74560 581681997-98 107206 81927 76653 593361998-99 118367 91107 79866 62074
1999-2000 130677 93485 130677 934852000-01 141478 103012 136174 978162001-02 151533 108838 144162 1028392002-03 157534 108000 146977 1064692003-04 162486 114370 149501 1082192004-05 173350 123873 154426 112879
Source: National Accounts Statistics-2006, Central Statistical Organisation, M/O Statistics & Programme Implementation
At Current Prices At Constant Prices
( At 1993-94 prices)
102
( At 1999-00 prices)
( At 1980-81 prices)
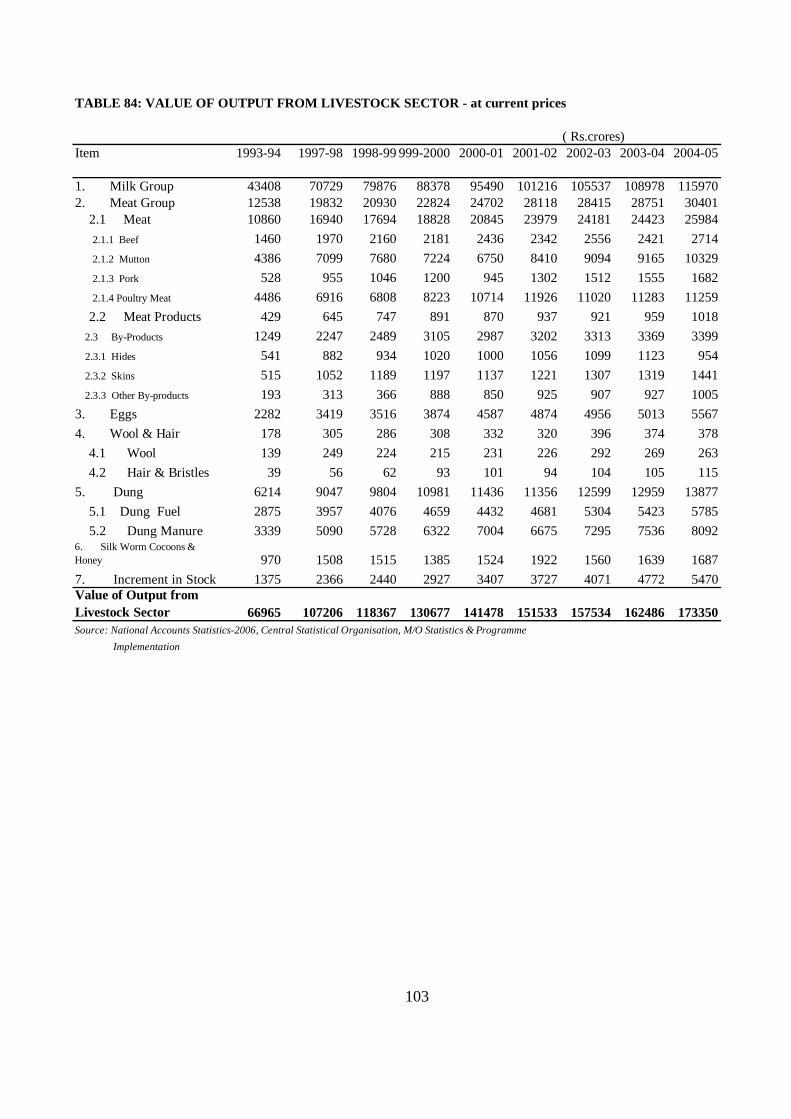
TABLE 84: VALUE OF OUTPUT FROM LIVESTOCK SECTOR - at current prices
( Rs.crores)Item 1993-94 1997-98 1998-991999-2000 2000-01 2001-02 2002-03 2003-04 2004-05
1. Milk Group 43408 70729 79876 88378 95490 101216 105537 108978 1159702. Meat Group 12538 19832 20930 22824 24702 28118 28415 28751 30401 2.1 Meat 10860 16940 17694 18828 20845 23979 24181 24423 25984 2.1.1 Beef 1460 1970 2160 2181 2436 2342 2556 2421 2714 2.1.2 Mutton 4386 7099 7680 7224 6750 8410 9094 9165 10329 2.1.3 Pork 528 955 1046 1200 945 1302 1512 1555 1682 2.1.4 Poultry Meat 4486 6916 6808 8223 10714 11926 11020 11283 11259 2.2 Meat Products 429 645 747 891 870 937 921 959 1018 2.3 By-Products 1249 2247 2489 3105 2987 3202 3313 3369 3399 2.3.1 Hides 541 882 934 1020 1000 1056 1099 1123 954 2.3.2 Skins 515 1052 1189 1197 1137 1221 1307 1319 1441 2.3.3 Other By-products 193 313 366 888 850 925 907 927 10053. Eggs 2282 3419 3516 3874 4587 4874 4956 5013 55674. Wool & Hair 178 305 286 308 332 320 396 374 378 4.1 Wool 139 249 224 215 231 226 292 269 263 4.2 Hair & Bristles 39 56 62 93 101 94 104 105 1155. Dung 6214 9047 9804 10981 11436 11356 12599 12959 13877 5.1 Dung Fuel 2875 3957 4076 4659 4432 4681 5304 5423 5785 5.2 Dung Manure 3339 5090 5728 6322 7004 6675 7295 7536 80926. Silk Worm Cocoons &Honey 970 1508 1515 1385 1524 1922 1560 1639 16877. Increment in Stock 1375 2366 2440 2927 3407 3727 4071 4772 5470Value of Output fromLivestock Sector 66965 107206 118367 130677 141478 151533 157534 162486 173350Source: National Accounts Statistics-2006, Central Statistical Organisation, M/O Statistics & Programme Implementation
103
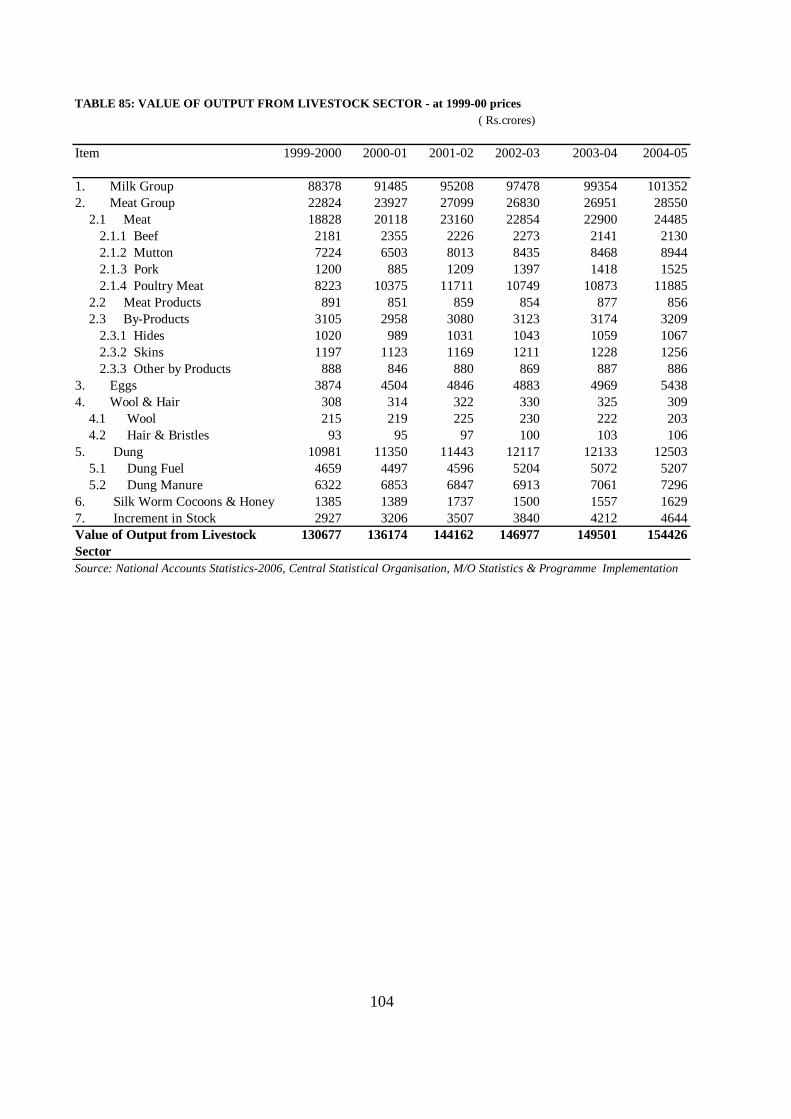
TABLE 85: VALUE OF OUTPUT FROM LIVESTOCK SECTOR - at 1999-00 prices( Rs.crores)
Item 1999-2000 2000-01 2001-02 2002-03 2003-04 2004-05
1. Milk Group 88378 91485 95208 97478 99354 1013522. Meat Group 22824 23927 27099 26830 26951 28550 2.1 Meat 18828 20118 23160 22854 22900 24485 2.1.1 Beef 2181 2355 2226 2273 2141 2130 2.1.2 Mutton 7224 6503 8013 8435 8468 8944 2.1.3 Pork 1200 885 1209 1397 1418 1525 2.1.4 Poultry Meat 8223 10375 11711 10749 10873 11885 2.2 Meat Products 891 851 859 854 877 856 2.3 By-Products 3105 2958 3080 3123 3174 3209 2.3.1 Hides 1020 989 1031 1043 1059 1067 2.3.2 Skins 1197 1123 1169 1211 1228 1256 2.3.3 Other by Products 888 846 880 869 887 8863. Eggs 3874 4504 4846 4883 4969 54384. Wool & Hair 308 314 322 330 325 309 4.1 Wool 215 219 225 230 222 203 4.2 Hair & Bristles 93 95 97 100 103 1065. Dung 10981 11350 11443 12117 12133 12503 5.1 Dung Fuel 4659 4497 4596 5204 5072 5207 5.2 Dung Manure 6322 6853 6847 6913 7061 72966. Silk Worm Cocoons & Honey 1385 1389 1737 1500 1557 16297. Increment in Stock 2927 3206 3507 3840 4212 4644Value of Output from Livestock 130677 136174 144162 146977 149501 154426SectorSource: National Accounts Statistics-2006, Central Statistical Organisation, M/O Statistics & Programme Implementation
104
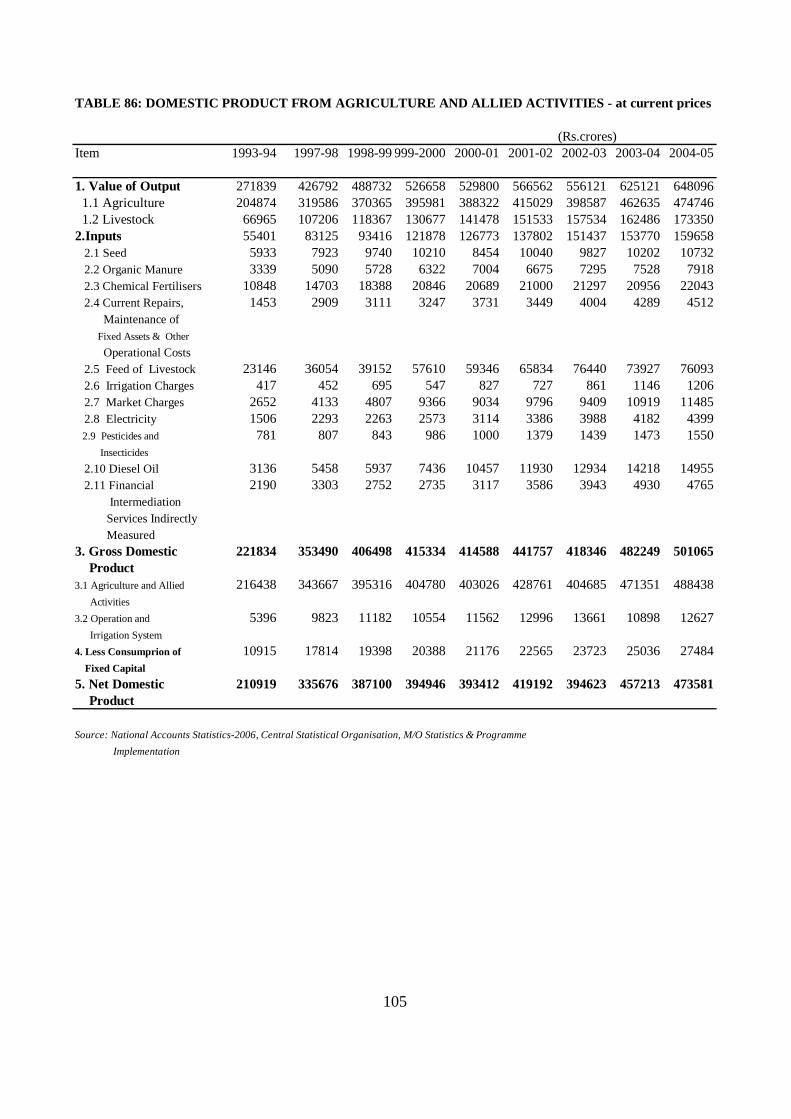
TABLE 86: DOMESTIC PRODUCT FROM AGRICULTURE AND ALLIED ACTIVITIES - at current prices
(Rs.crores)Item 1993-94 1997-98 1998-991999-2000 2000-01 2001-02 2002-03 2003-04 2004-05
1. Value of Output 271839 426792 488732 526658 529800 566562 556121 625121 648096 1.1 Agriculture 204874 319586 370365 395981 388322 415029 398587 462635 474746 1.2 Livestock 66965 107206 118367 130677 141478 151533 157534 162486 1733502.Inputs 55401 83125 93416 121878 126773 137802 151437 153770 159658 2.1 Seed 5933 7923 9740 10210 8454 10040 9827 10202 10732 2.2 Organic Manure 3339 5090 5728 6322 7004 6675 7295 7528 7918 2.3 Chemical Fertilisers 10848 14703 18388 20846 20689 21000 21297 20956 22043 2.4 Current Repairs, 1453 2909 3111 3247 3731 3449 4004 4289 4512 Maintenance of Fixed Assets & Other Operational Costs 2.5 Feed of Livestock 23146 36054 39152 57610 59346 65834 76440 73927 76093 2.6 Irrigation Charges 417 452 695 547 827 727 861 1146 1206 2.7 Market Charges 2652 4133 4807 9366 9034 9796 9409 10919 11485 2.8 Electricity 1506 2293 2263 2573 3114 3386 3988 4182 4399 2.9 Pesticides and 781 807 843 986 1000 1379 1439 1473 1550 Insecticides 2.10 Diesel Oil 3136 5458 5937 7436 10457 11930 12934 14218 14955 2.11 Financial 2190 3303 2752 2735 3117 3586 3943 4930 4765 Intermediation Services Indirectly Measured3. Gross Domestic 221834 353490 406498 415334 414588 441757 418346 482249 501065 Product3.1 Agriculture and Allied 216438 343667 395316 404780 403026 428761 404685 471351 488438 Activities3.2 Operation and 5396 9823 11182 10554 11562 12996 13661 10898 12627 Irrigation System4. Less Consumprion of 10915 17814 19398 20388 21176 22565 23723 25036 27484 Fixed Capital5. Net Domestic 210919 335676 387100 394946 393412 419192 394623 457213 473581 Product
Source: National Accounts Statistics-2006, Central Statistical Organisation, M/O Statistics & Programme Implementation
105

TABLE 87: DOMESTIC PRODUCT FROM AGRICULTURE AND ALLIED ACTIVITIES -at 1999-00 prices (Rs. crores)
Item 1999-2000 2000-01 2001-02 2002-03 2003-04 2004-05
1. Value of Output 526658 523588 556060 520193 567412 571615 1.1 Agriculture 395981 387414 411898 373216 417911 417189 1.2 Livestock 130677 136174 144162 146977 149501 1544262.Inputs 121878 121238 126878 124973 128631 129929 2.1 Seed 10210 8993 9231 8856 9062 9217 2.2 Organic Manure 6322 6853 6847 6913 7061 7182 2.3 Chemical Fertilisers 20846 18811 18393 18378 18210 18520 2.4 Current Repairs, Maintenance 3247 3440 3356 3582 3710 3774 of Fixed Assets and Other Operational Costs 2.5 Feed of Livestock 57610 59376 64006 62537 63765 64222 2.6 Irrigation Charges 547 736 736 691 686 698 2.7 Market Charges 9366 9043 9630 8510 9846 10014 2.8 Electricity 2573 2389 2231 2450 2454 2496 2.9 Pesticides and Insecticides 986 994 1251 1273 1295 1317 2.10 Diesel Oil 7436 7842 8292 8750 9246 9404 2.11 Financial Intermediation Services 2735 2761 2905 3033 3296 3085 Indirectly Measured3. Gross Domestic Product 415334 414270 441123 406586 450182 453141 3.1 Agriculture and Allied Activities 404780 402330 429182 395220 438780 441686 3.2 Operation and Irrigation System 10554 11940 11941 11366 11402 114554. Less Consumption of Fixed Capital 20388 20885 21304 21704 22151 226225. Net Domestic Product 394946 393385 419819 384882 428031 430519
Source: National Accounts Statistics-2006, Central Statistical Organisation, M/O Statistics & Programme Implementation
106
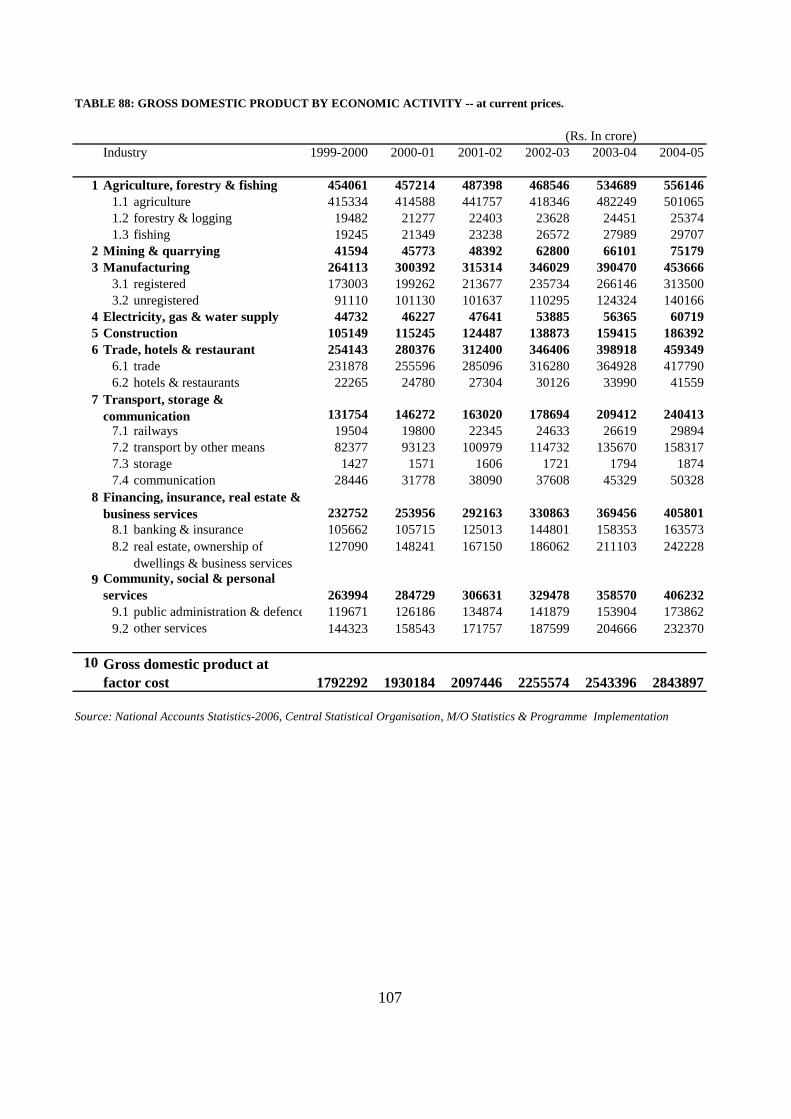
TABLE 88: GROSS DOMESTIC PRODUCT BY ECONOMIC ACTIVITY -- at current prices.
(Rs. In crore)Industry 1999-2000 2000-01 2001-02 2002-03 2003-04 2004-05
1 Agriculture, forestry & fishing 454061 457214 487398 468546 534689 5561461.1 agriculture 415334 414588 441757 418346 482249 5010651.2 forestry & logging 19482 21277 22403 23628 24451 253741.3 fishing 19245 21349 23238 26572 27989 29707
2 Mining & quarrying 41594 45773 48392 62800 66101 751793 Manufacturing 264113 300392 315314 346029 390470 453666
3.1 registered 173003 199262 213677 235734 266146 3135003.2 unregistered 91110 101130 101637 110295 124324 140166
4 Electricity, gas & water supply 44732 46227 47641 53885 56365 607195 Construction 105149 115245 124487 138873 159415 1863926 Trade, hotels & restaurant 254143 280376 312400 346406 398918 459349
6.1 trade 231878 255596 285096 316280 364928 4177906.2 hotels & restaurants 22265 24780 27304 30126 33990 41559
7131754 146272 163020 178694 209412 240413
7.1 railways 19504 19800 22345 24633 26619 298947.2 transport by other means 82377 93123 100979 114732 135670 1583177.3 storage 1427 1571 1606 1721 1794 18747.4 communication 28446 31778 38090 37608 45329 50328
8232752 253956 292163 330863 369456 405801
8.1 banking & insurance 105662 105715 125013 144801 158353 1635738.2 real estate, ownership of
dwellings & business services127090 148241 167150 186062 211103 242228
9263994 284729 306631 329478 358570 406232
9.1 public administration & defence 119671 126186 134874 141879 153904 1738629.2 other services 144323 158543 171757 187599 204666 232370
101792292 1930184 2097446 2255574 2543396 2843897
Source: National Accounts Statistics-2006, Central Statistical Organisation, M/O Statistics & Programme Implementation
Transport, storage &communication
107
Financing, insurance, real estate &business services
Gross domestic product atfactor cost
Community, social & personalservices
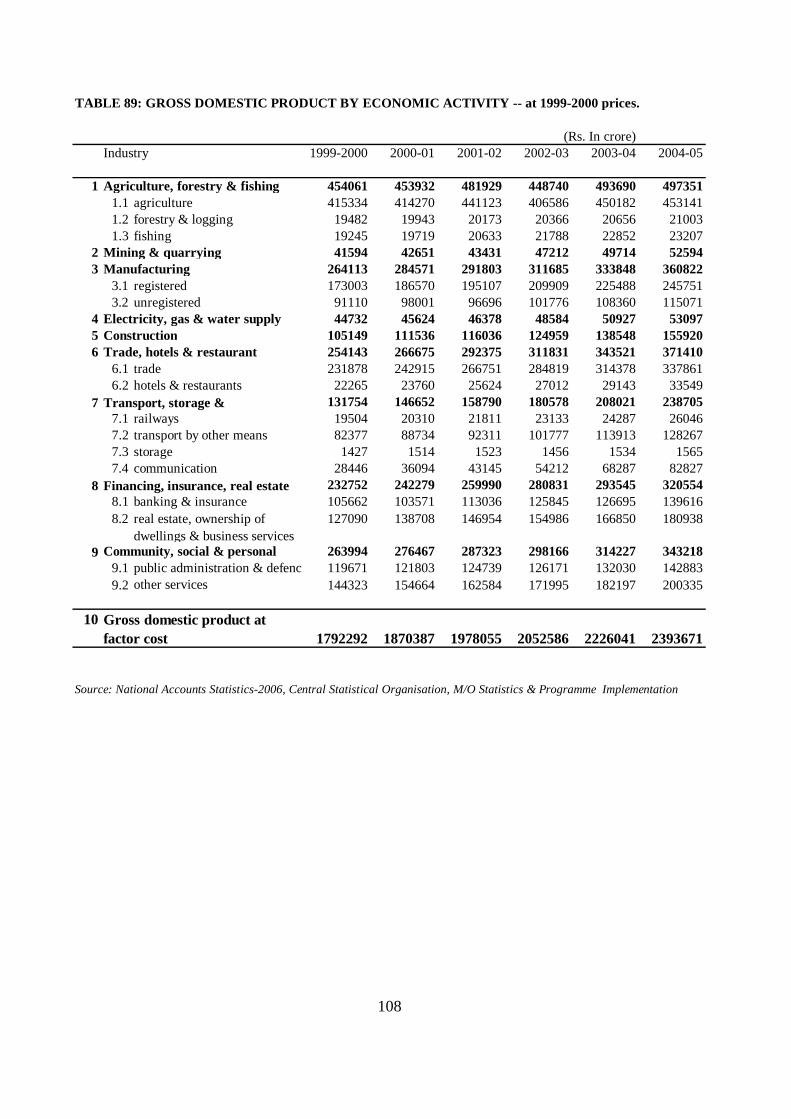
TABLE 89: GROSS DOMESTIC PRODUCT BY ECONOMIC ACTIVITY -- at 1999-2000 prices.
(Rs. In crore)Industry 1999-2000 2000-01 2001-02 2002-03 2003-04 2004-05
1 Agriculture, forestry & fishing 454061 453932 481929 448740 493690 4973511.1 agriculture 415334 414270 441123 406586 450182 4531411.2 forestry & logging 19482 19943 20173 20366 20656 210031.3 fishing 19245 19719 20633 21788 22852 23207
2 Mining & quarrying 41594 42651 43431 47212 49714 525943 Manufacturing 264113 284571 291803 311685 333848 360822
3.1 registered 173003 186570 195107 209909 225488 2457513.2 unregistered 91110 98001 96696 101776 108360 115071
4 Electricity, gas & water supply 44732 45624 46378 48584 50927 530975 Construction 105149 111536 116036 124959 138548 1559206 Trade, hotels & restaurant 254143 266675 292375 311831 343521 371410
6.1 trade 231878 242915 266751 284819 314378 3378616.2 hotels & restaurants 22265 23760 25624 27012 29143 33549
7 131754 146652 158790 180578 208021 2387057.1 railways 19504 20310 21811 23133 24287 260467.2 transport by other means 82377 88734 92311 101777 113913 1282677.3 storage 1427 1514 1523 1456 1534 15657.4 communication 28446 36094 43145 54212 68287 82827
8 232752 242279 259990 280831 293545 3205548.1 banking & insurance 105662 103571 113036 125845 126695 1396168.2 real estate, ownership of
dwellings & business services127090 138708 146954 154986 166850 180938
9 263994 276467 287323 298166 314227 3432189.1 public administration & defence 119671 121803 124739 126171 132030 1428839.2 other services 144323 154664 162584 171995 182197 200335
101792292 1870387 1978055 2052586 2226041 2393671
Source: National Accounts Statistics-2006, Central Statistical Organisation, M/O Statistics & Programme Implementation
108
Transport, storage &
Financing, insurance, real estate
Community, social & personal
Gross domestic product atfactor cost
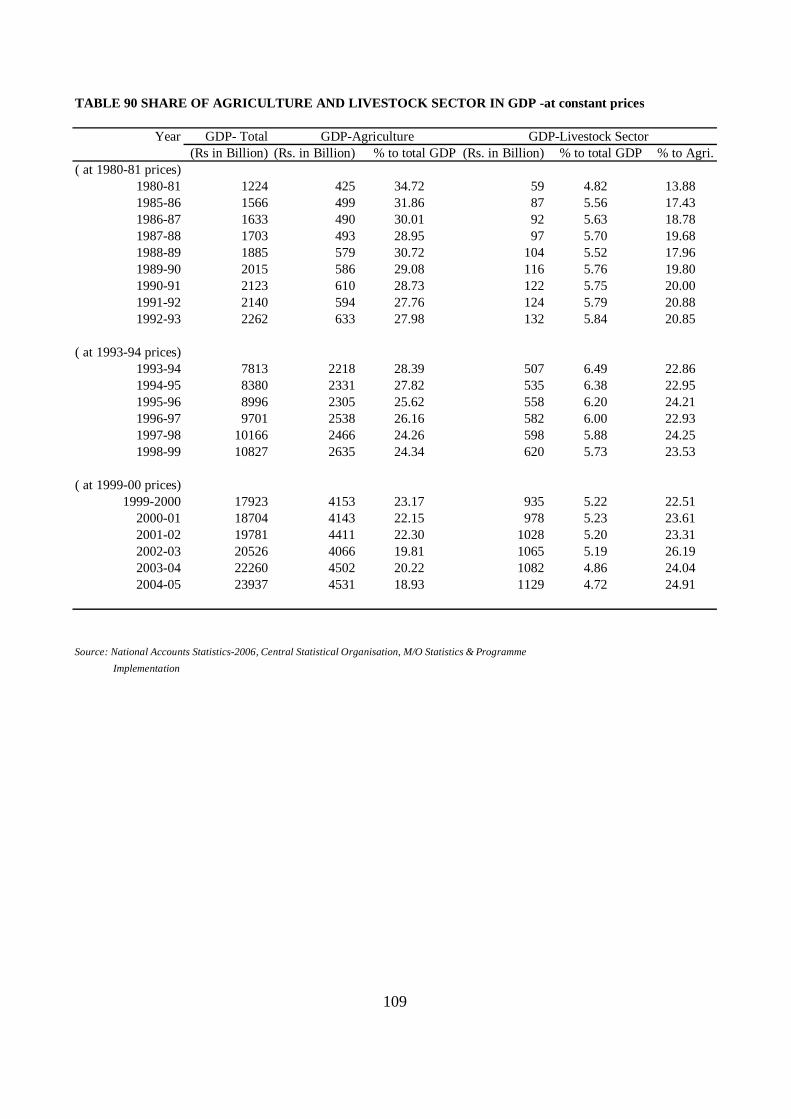
TABLE 90 SHARE OF AGRICULTURE AND LIVESTOCK SECTOR IN GDP -at constant prices
Year GDP- Total(Rs in Billion) (Rs. in Billion) % to total GDP (Rs. in Billion) % to total GDP % to Agri.
( at 1980-81 prices)1980-81 1224 425 34.72 59 4.82 13.881985-86 1566 499 31.86 87 5.56 17.431986-87 1633 490 30.01 92 5.63 18.781987-88 1703 493 28.95 97 5.70 19.681988-89 1885 579 30.72 104 5.52 17.961989-90 2015 586 29.08 116 5.76 19.801990-91 2123 610 28.73 122 5.75 20.001991-92 2140 594 27.76 124 5.79 20.881992-93 2262 633 27.98 132 5.84 20.85
( at 1993-94 prices)1993-94 7813 2218 28.39 507 6.49 22.861994-95 8380 2331 27.82 535 6.38 22.951995-96 8996 2305 25.62 558 6.20 24.211996-97 9701 2538 26.16 582 6.00 22.931997-98 10166 2466 24.26 598 5.88 24.251998-99 10827 2635 24.34 620 5.73 23.53
( at 1999-00 prices)1999-2000 17923 4153 23.17 935 5.22 22.51
2000-01 18704 4143 22.15 978 5.23 23.612001-02 19781 4411 22.30 1028 5.20 23.312002-03 20526 4066 19.81 1065 5.19 26.192003-04 22260 4502 20.22 1082 4.86 24.042004-05 23937 4531 18.93 1129 4.72 24.91
Source: National Accounts Statistics-2006, Central Statistical Organisation, M/O Statistics & Programme Implementation
GDP-Agriculture GDP-Livestock Sector
109
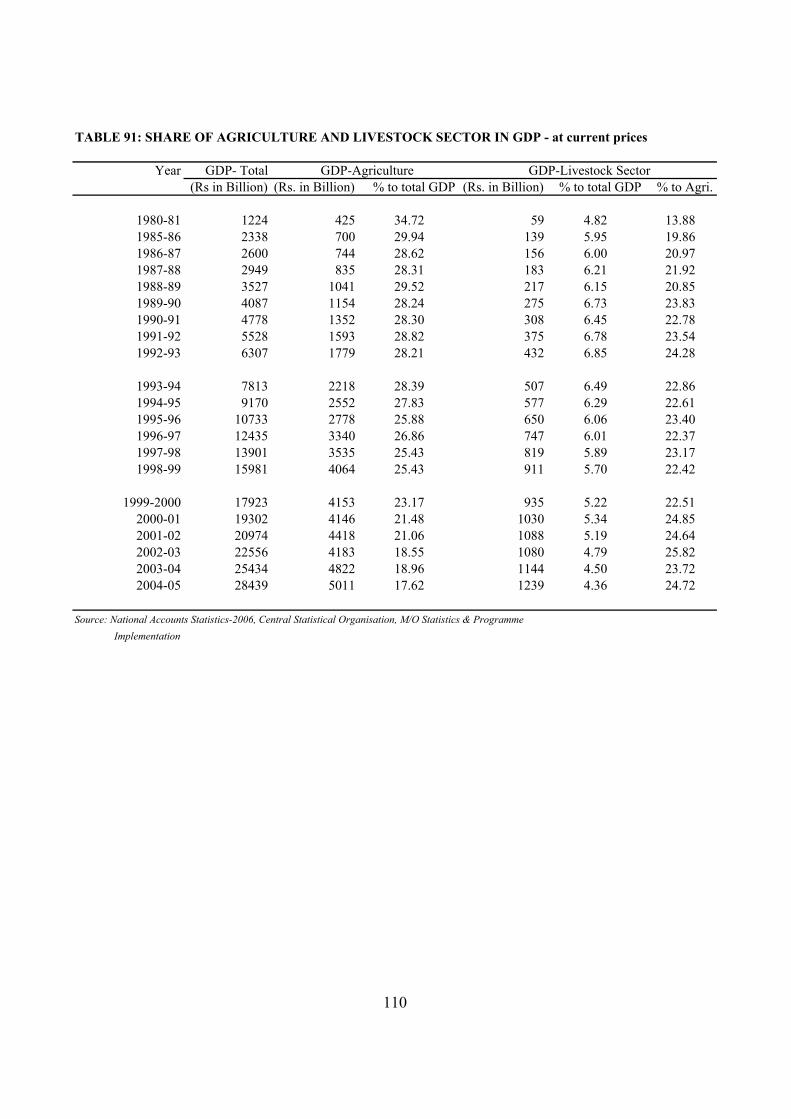
TABLE 91: SHARE OF AGRICULTURE AND LIVESTOCK SECTOR IN GDP - at current prices
Year GDP- Total(Rs in Billion) (Rs. in Billion) % to total GDP (Rs. in Billion) % to total GDP % to Agri.
1980-81 1224 425 34.72 59 4.82 13.881985-86 2338 700 29.94 139 5.95 19.861986-87 2600 744 28.62 156 6.00 20.971987-88 2949 835 28.31 183 6.21 21.921988-89 3527 1041 29.52 217 6.15 20.851989-90 4087 1154 28.24 275 6.73 23.831990-91 4778 1352 28.30 308 6.45 22.781991-92 5528 1593 28.82 375 6.78 23.541992-93 6307 1779 28.21 432 6.85 24.28
1993-94 7813 2218 28.39 507 6.49 22.861994-95 9170 2552 27.83 577 6.29 22.611995-96 10733 2778 25.88 650 6.06 23.401996-97 12435 3340 26.86 747 6.01 22.371997-98 13901 3535 25.43 819 5.89 23.171998-99 15981 4064 25.43 911 5.70 22.42
1999-2000 17923 4153 23.17 935 5.22 22.512000-01 19302 4146 21.48 1030 5.34 24.852001-02 20974 4418 21.06 1088 5.19 24.642002-03 22556 4183 18.55 1080 4.79 25.822003-04 25434 4822 18.96 1144 4.50 23.722004-05 28439 5011 17.62 1239 4.36 24.72
Source: National Accounts Statistics-2006, Central Statistical Organisation, M/O Statistics & Programme Implementation
GDP-Agriculture GDP-Livestock Sector
110
PART VII
Animal Husbandry Statistics
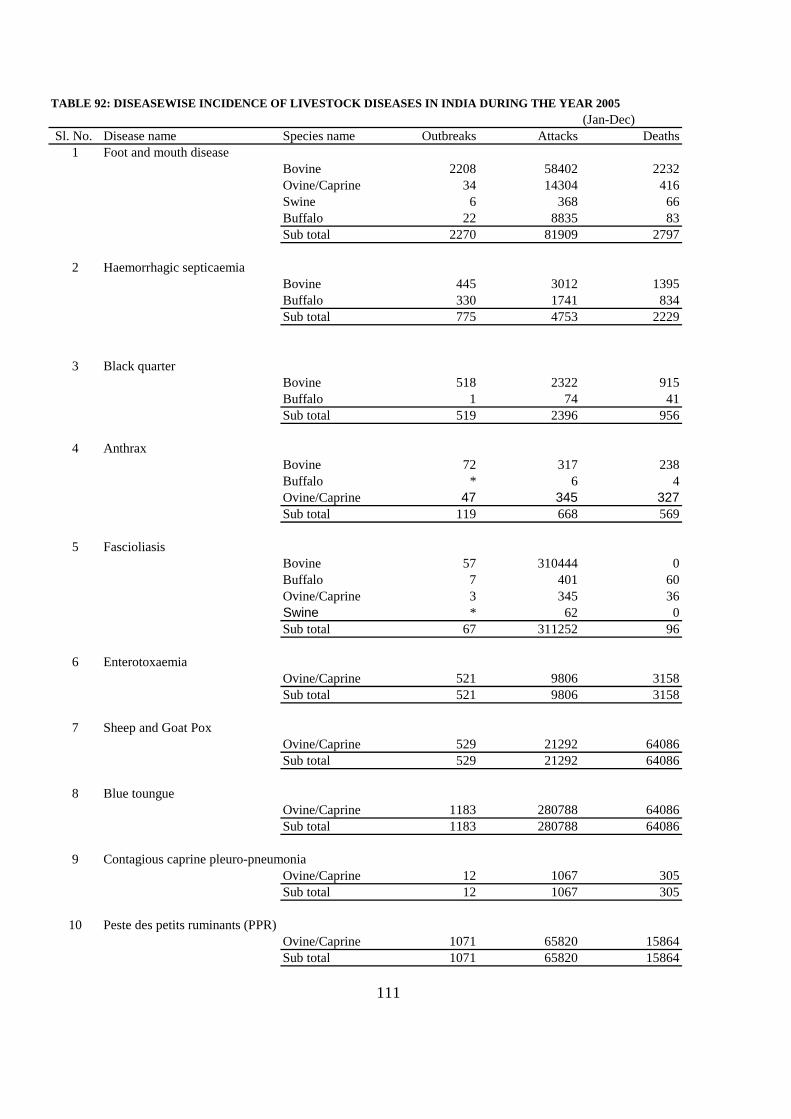
TABLE 92: DISEASEWISE INCIDENCE OF LIVESTOCK DISEASES IN INDIA DURING THE YEAR 2005(Jan-Dec)
Sl. No. Disease name Species name Outbreaks Attacks Deaths1 Foot and mouth disease
Bovine 2208 58402 2232Ovine/Caprine 34 14304 416Swine 6 368 66Buffalo 22 8835 83Sub total 2270 81909 2797
2 Haemorrhagic septicaemiaBovine 445 3012 1395Buffalo 330 1741 834Sub total 775 4753 2229
3 Black quarterBovine 518 2322 915Buffalo 1 74 41Sub total 519 2396 956
4 AnthraxBovine 72 317 238Buffalo * 6 4Ovine/Caprine 47 345 327Sub total 119 668 569
5 FascioliasisBovine 57 310444 0Buffalo 7 401 60Ovine/Caprine 3 345 36Swine * 62 0Sub total 67 311252 96
6 EnterotoxaemiaOvine/Caprine 521 9806 3158Sub total 521 9806 3158
7 Sheep and Goat PoxOvine/Caprine 529 21292 64086Sub total 529 21292 64086
8 Blue toungueOvine/Caprine 1183 280788 64086Sub total 1183 280788 64086
9 Contagious caprine pleuro-pneumoniaOvine/Caprine 12 1067 305Sub total 12 1067 305
10 Peste des petits ruminants (PPR)Ovine/Caprine 1071 65820 15864Sub total 1071 65820 15864
111
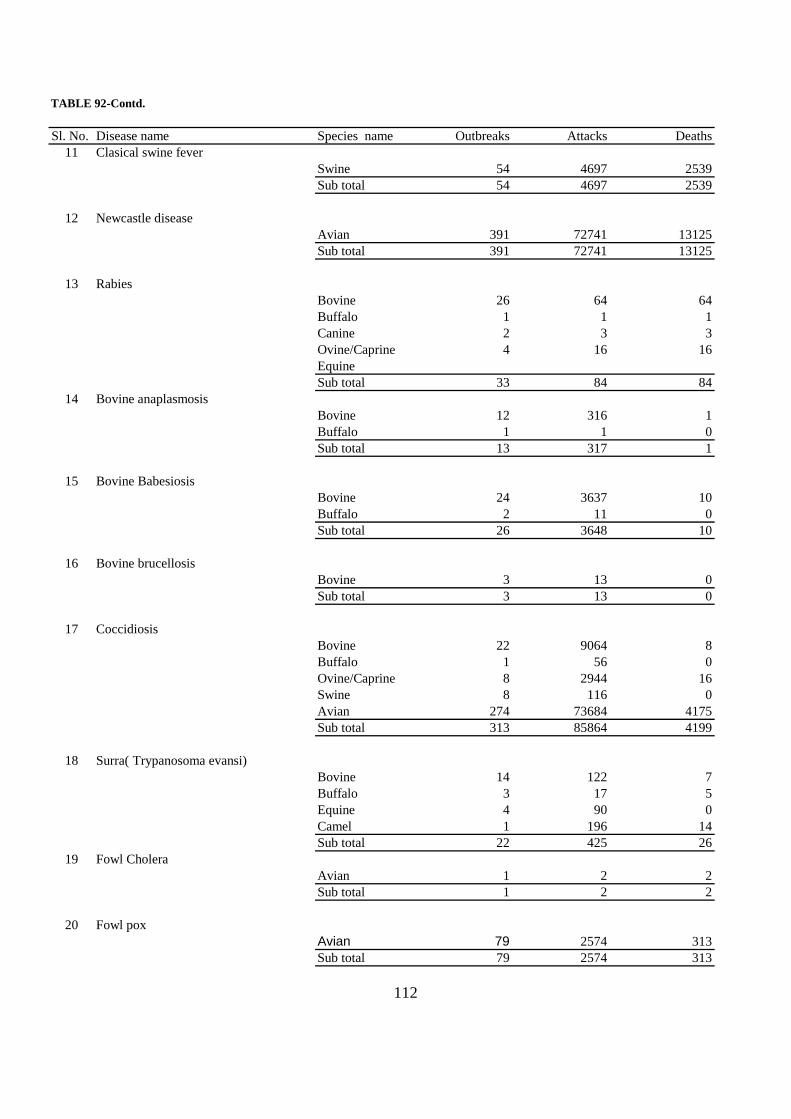
TABLE 92-Contd.
Sl. No. Disease name Species name Outbreaks Attacks Deaths11 Clasical swine fever
Swine 54 4697 2539Sub total 54 4697 2539
12 Newcastle diseaseAvian 391 72741 13125Sub total 391 72741 13125
13 RabiesBovine 26 64 64Buffalo 1 1 1Canine 2 3 3Ovine/Caprine 4 16 16EquineSub total 33 84 84
14 Bovine anaplasmosisBovine 12 316 1Buffalo 1 1 0Sub total 13 317 1
15 Bovine BabesiosisBovine 24 3637 10Buffalo 2 11 0Sub total 26 3648 10
16 Bovine brucellosisBovine 3 13 0Sub total 3 13 0
17 CoccidiosisBovine 22 9064 8Buffalo 1 56 0Ovine/Caprine 8 2944 16Swine 8 116 0Avian 274 73684 4175Sub total 313 85864 4199
18 Surra( Trypanosoma evansi)Bovine 14 122 7Buffalo 3 17 5Equine 4 90 0Camel 1 196 14Sub total 22 425 26
19 Fowl CholeraAvian 1 2 2Sub total 1 2 2
20 Fowl poxAvian 79 2574 313Sub total 79 2574 313
112
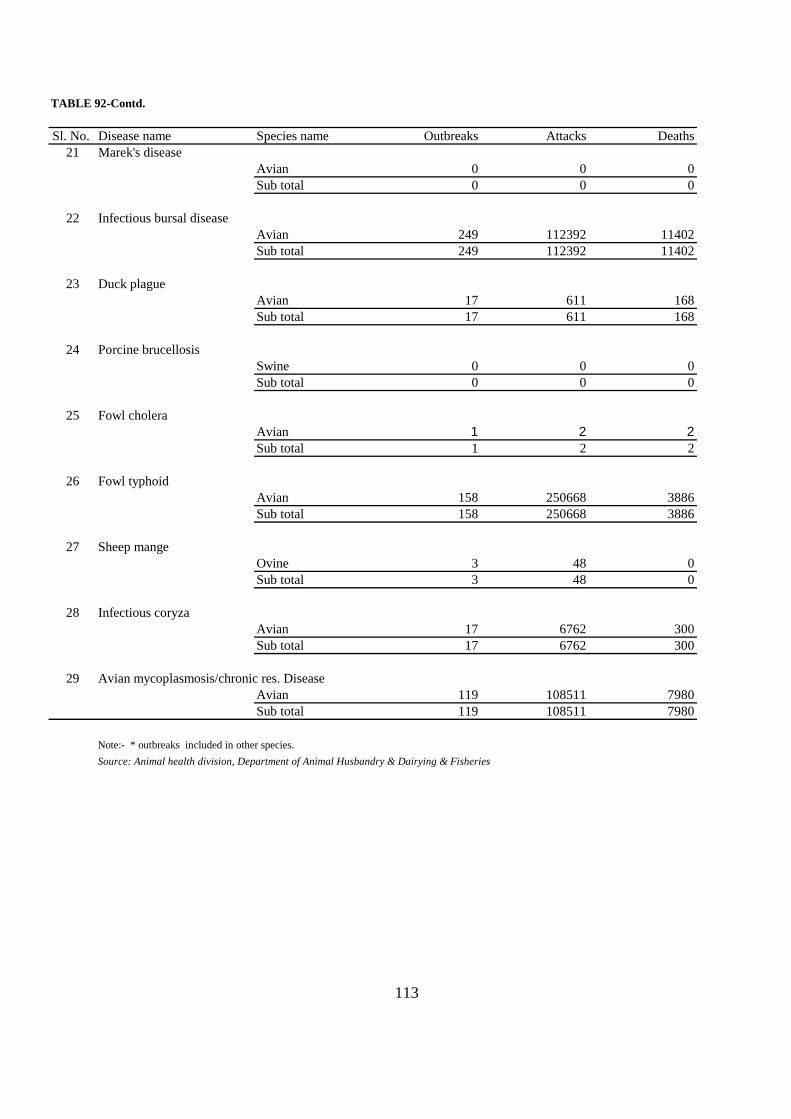
TABLE 92-Contd.
Sl. No. Disease name Species name Outbreaks Attacks Deaths21 Marek's disease
Avian 0 0 0Sub total 0 0 0
22 Infectious bursal diseaseAvian 249 112392 11402Sub total 249 112392 11402
23 Duck plagueAvian 17 611 168Sub total 17 611 168
24 Porcine brucellosisSwine 0 0 0Sub total 0 0 0
25 Fowl choleraAvian 1 2 2Sub total 1 2 2
26 Fowl typhoidAvian 158 250668 3886Sub total 158 250668 3886
27 Sheep mangeOvine 3 48 0Sub total 3 48 0
28 Infectious coryzaAvian 17 6762 300Sub total 17 6762 300
29 Avian mycoplasmosis/chronic res. DiseaseAvian 119 108511 7980Sub total 119 108511 7980
Note:- * outbreaks included in other species.Source: Animal health division, Department of Animal Husbandry & Dairying & Fisheries
113
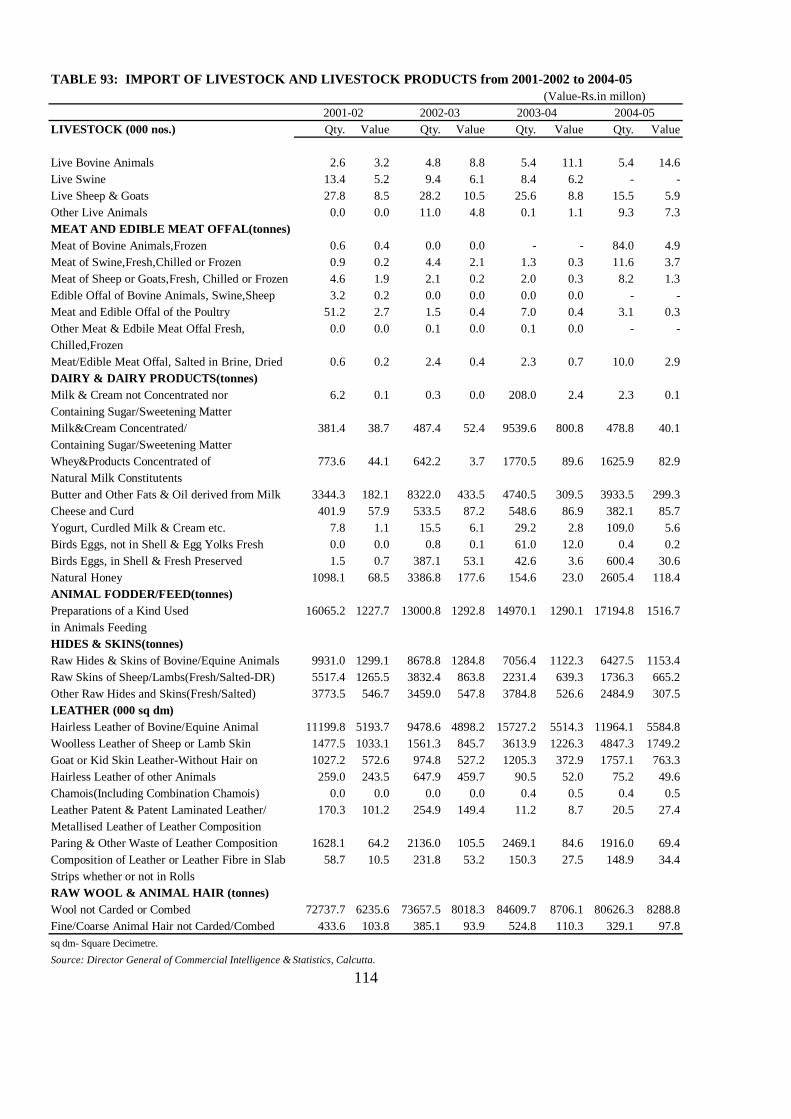
TABLE 93: IMPORT OF LIVESTOCK AND LIVESTOCK PRODUCTS from 2001-2002 to 2004-05 (Value-Rs.in millon)
LIVESTOCK (000 nos.) Qty. Value Qty. Value Qty. Value Qty. Value
Live Bovine Animals 2.6 3.2 4.8 8.8 5.4 11.1 5.4 14.6Live Swine 13.4 5.2 9.4 6.1 8.4 6.2 - -Live Sheep & Goats 27.8 8.5 28.2 10.5 25.6 8.8 15.5 5.9Other Live Animals 0.0 0.0 11.0 4.8 0.1 1.1 9.3 7.3MEAT AND EDIBLE MEAT OFFAL(tonnes)Meat of Bovine Animals,Frozen 0.6 0.4 0.0 0.0 - - 84.0 4.9Meat of Swine,Fresh,Chilled or Frozen 0.9 0.2 4.4 2.1 1.3 0.3 11.6 3.7Meat of Sheep or Goats,Fresh, Chilled or Frozen 4.6 1.9 2.1 0.2 2.0 0.3 8.2 1.3Edible Offal of Bovine Animals, Swine,Sheep 3.2 0.2 0.0 0.0 0.0 0.0 - -Meat and Edible Offal of the Poultry 51.2 2.7 1.5 0.4 7.0 0.4 3.1 0.3Other Meat & Edbile Meat Offal Fresh, 0.0 0.0 0.1 0.0 0.1 0.0 - -Chilled,FrozenMeat/Edible Meat Offal, Salted in Brine, Dried 0.6 0.2 2.4 0.4 2.3 0.7 10.0 2.9DAIRY & DAIRY PRODUCTS(tonnes)Milk & Cream not Concentrated nor 6.2 0.1 0.3 0.0 208.0 2.4 2.3 0.1Containing Sugar/Sweetening MatterMilk&Cream Concentrated/ 381.4 38.7 487.4 52.4 9539.6 800.8 478.8 40.1Containing Sugar/Sweetening MatterWhey&Products Concentrated of 773.6 44.1 642.2 3.7 1770.5 89.6 1625.9 82.9Natural Milk ConstitutentsButter and Other Fats & Oil derived from Milk 3344.3 182.1 8322.0 433.5 4740.5 309.5 3933.5 299.3Cheese and Curd 401.9 57.9 533.5 87.2 548.6 86.9 382.1 85.7Yogurt, Curdled Milk & Cream etc. 7.8 1.1 15.5 6.1 29.2 2.8 109.0 5.6Birds Eggs, not in Shell & Egg Yolks Fresh 0.0 0.0 0.8 0.1 61.0 12.0 0.4 0.2Birds Eggs, in Shell & Fresh Preserved 1.5 0.7 387.1 53.1 42.6 3.6 600.4 30.6Natural Honey 1098.1 68.5 3386.8 177.6 154.6 23.0 2605.4 118.4ANIMAL FODDER/FEED(tonnes)Preparations of a Kind Used 16065.2 1227.7 13000.8 1292.8 14970.1 1290.1 17194.8 1516.7in Animals FeedingHIDES & SKINS(tonnes)Raw Hides & Skins of Bovine/Equine Animals 9931.0 1299.1 8678.8 1284.8 7056.4 1122.3 6427.5 1153.4Raw Skins of Sheep/Lambs(Fresh/Salted-DR) 5517.4 1265.5 3832.4 863.8 2231.4 639.3 1736.3 665.2Other Raw Hides and Skins(Fresh/Salted) 3773.5 546.7 3459.0 547.8 3784.8 526.6 2484.9 307.5LEATHER (000 sq dm)Hairless Leather of Bovine/Equine Animal 11199.8 5193.7 9478.6 4898.2 15727.2 5514.3 11964.1 5584.8Woolless Leather of Sheep or Lamb Skin 1477.5 1033.1 1561.3 845.7 3613.9 1226.3 4847.3 1749.2Goat or Kid Skin Leather-Without Hair on 1027.2 572.6 974.8 527.2 1205.3 372.9 1757.1 763.3Hairless Leather of other Animals 259.0 243.5 647.9 459.7 90.5 52.0 75.2 49.6Chamois(Including Combination Chamois) 0.0 0.0 0.0 0.0 0.4 0.5 0.4 0.5Leather Patent & Patent Laminated Leather/ 170.3 101.2 254.9 149.4 11.2 8.7 20.5 27.4Metallised Leather of Leather CompositionParing & Other Waste of Leather Composition 1628.1 64.2 2136.0 105.5 2469.1 84.6 1916.0 69.4Composition of Leather or Leather Fibre in Slab 58.7 10.5 231.8 53.2 150.3 27.5 148.9 34.4Strips whether or not in RollsRAW WOOL & ANIMAL HAIR (tonnes)Wool not Carded or Combed 72737.7 6235.6 73657.5 8018.3 84609.7 8706.1 80626.3 8288.8Fine/Coarse Animal Hair not Carded/Combed 433.6 103.8 385.1 93.9 524.8 110.3 329.1 97.8sq dm- Square Decimetre.Source: Director General of Commercial Intelligence & Statistics, Calcutta.
114
2001-02 2002-03 2003-04 2004-05
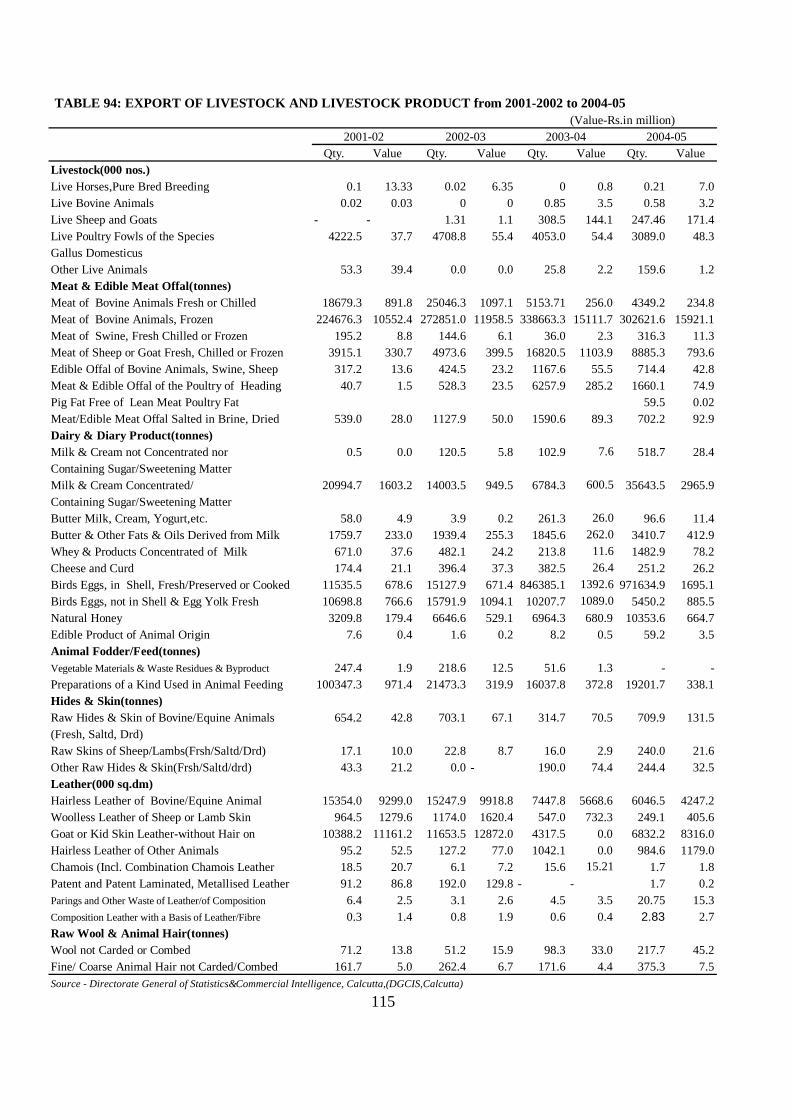
TABLE 94: EXPORT OF LIVESTOCK AND LIVESTOCK PRODUCT from 2001-2002 to 2004-05(Value-Rs.in million)
Qty. Value Qty. Value Qty. Value Qty. ValueLivestock(000 nos.)Live Horses,Pure Bred Breeding 0.1 13.33 0.02 6.35 0 0.8 0.21 7.0Live Bovine Animals 0.02 0.03 0 0 0.85 3.5 0.58 3.2Live Sheep and Goats - - 1.31 1.1 308.5 144.1 247.46 171.4Live Poultry Fowls of the Species 4222.5 37.7 4708.8 55.4 4053.0 54.4 3089.0 48.3Gallus DomesticusOther Live Animals 53.3 39.4 0.0 0.0 25.8 2.2 159.6 1.2Meat & Edible Meat Offal(tonnes)Meat of Bovine Animals Fresh or Chilled 18679.3 891.8 25046.3 1097.1 5153.71 256.0 4349.2 234.8Meat of Bovine Animals, Frozen 224676.3 10552.4 272851.0 11958.5 338663.3 15111.7 302621.6 15921.1Meat of Swine, Fresh Chilled or Frozen 195.2 8.8 144.6 6.1 36.0 2.3 316.3 11.3Meat of Sheep or Goat Fresh, Chilled or Frozen 3915.1 330.7 4973.6 399.5 16820.5 1103.9 8885.3 793.6Edible Offal of Bovine Animals, Swine, Sheep 317.2 13.6 424.5 23.2 1167.6 55.5 714.4 42.8Meat & Edible Offal of the Poultry of Heading 40.7 1.5 528.3 23.5 6257.9 285.2 1660.1 74.9Pig Fat Free of Lean Meat Poultry Fat 59.5 0.02Meat/Edible Meat Offal Salted in Brine, Dried 539.0 28.0 1127.9 50.0 1590.6 89.3 702.2 92.9Dairy & Diary Product(tonnes)Milk & Cream not Concentrated nor 0.5 0.0 120.5 5.8 102.9 7.6 518.7 28.4Containing Sugar/Sweetening MatterMilk & Cream Concentrated/ 20994.7 1603.2 14003.5 949.5 6784.3 600.5 35643.5 2965.9Containing Sugar/Sweetening MatterButter Milk, Cream, Yogurt,etc. 58.0 4.9 3.9 0.2 261.3 26.0 96.6 11.4Butter & Other Fats & Oils Derived from Milk 1759.7 233.0 1939.4 255.3 1845.6 262.0 3410.7 412.9Whey & Products Concentrated of Milk 671.0 37.6 482.1 24.2 213.8 11.6 1482.9 78.2Cheese and Curd 174.4 21.1 396.4 37.3 382.5 26.4 251.2 26.2Birds Eggs, in Shell, Fresh/Preserved or Cooked 11535.5 678.6 15127.9 671.4 846385.1 1392.6 971634.9 1695.1Birds Eggs, not in Shell & Egg Yolk Fresh 10698.8 766.6 15791.9 1094.1 10207.7 1089.0 5450.2 885.5Natural Honey 3209.8 179.4 6646.6 529.1 6964.3 680.9 10353.6 664.7Edible Product of Animal Origin 7.6 0.4 1.6 0.2 8.2 0.5 59.2 3.5Animal Fodder/Feed(tonnes)Vegetable Materials & Waste Residues & Byproduct 247.4 1.9 218.6 12.5 51.6 1.3 - -Preparations of a Kind Used in Animal Feeding 100347.3 971.4 21473.3 319.9 16037.8 372.8 19201.7 338.1Hides & Skin(tonnes)Raw Hides & Skin of Bovine/Equine Animals 654.2 42.8 703.1 67.1 314.7 70.5 709.9 131.5(Fresh, Saltd, Drd)Raw Skins of Sheep/Lambs(Frsh/Saltd/Drd) 17.1 10.0 22.8 8.7 16.0 2.9 240.0 21.6Other Raw Hides & Skin(Frsh/Saltd/drd) 43.3 21.2 0.0 - 190.0 74.4 244.4 32.5Leather(000 sq.dm)Hairless Leather of Bovine/Equine Animal 15354.0 9299.0 15247.9 9918.8 7447.8 5668.6 6046.5 4247.2Woolless Leather of Sheep or Lamb Skin 964.5 1279.6 1174.0 1620.4 547.0 732.3 249.1 405.6Goat or Kid Skin Leather-without Hair on 10388.2 11161.2 11653.5 12872.0 4317.5 0.0 6832.2 8316.0Hairless Leather of Other Animals 95.2 52.5 127.2 77.0 1042.1 0.0 984.6 1179.0Chamois (Incl. Combination Chamois Leather 18.5 20.7 6.1 7.2 15.6 15.21 1.7 1.8Patent and Patent Laminated, Metallised Leather 91.2 86.8 192.0 129.8 - - 1.7 0.2Parings and Other Waste of Leather/of Composition 6.4 2.5 3.1 2.6 4.5 3.5 20.75 15.3Composition Leather with a Basis of Leather/Fibre 0.3 1.4 0.8 1.9 0.6 0.4 2.83 2.7Raw Wool & Animal Hair(tonnes)Wool not Carded or Combed 71.2 13.8 51.2 15.9 98.3 33.0 217.7 45.2Fine/ Coarse Animal Hair not Carded/Combed 161.7 5.0 262.4 6.7 171.6 4.4 375.3 7.5Source - Directorate General of Statistics&Commercial Intelligence, Calcutta,(DGCIS,Calcutta)
115
2004-052001-02 2002-03 2003-04
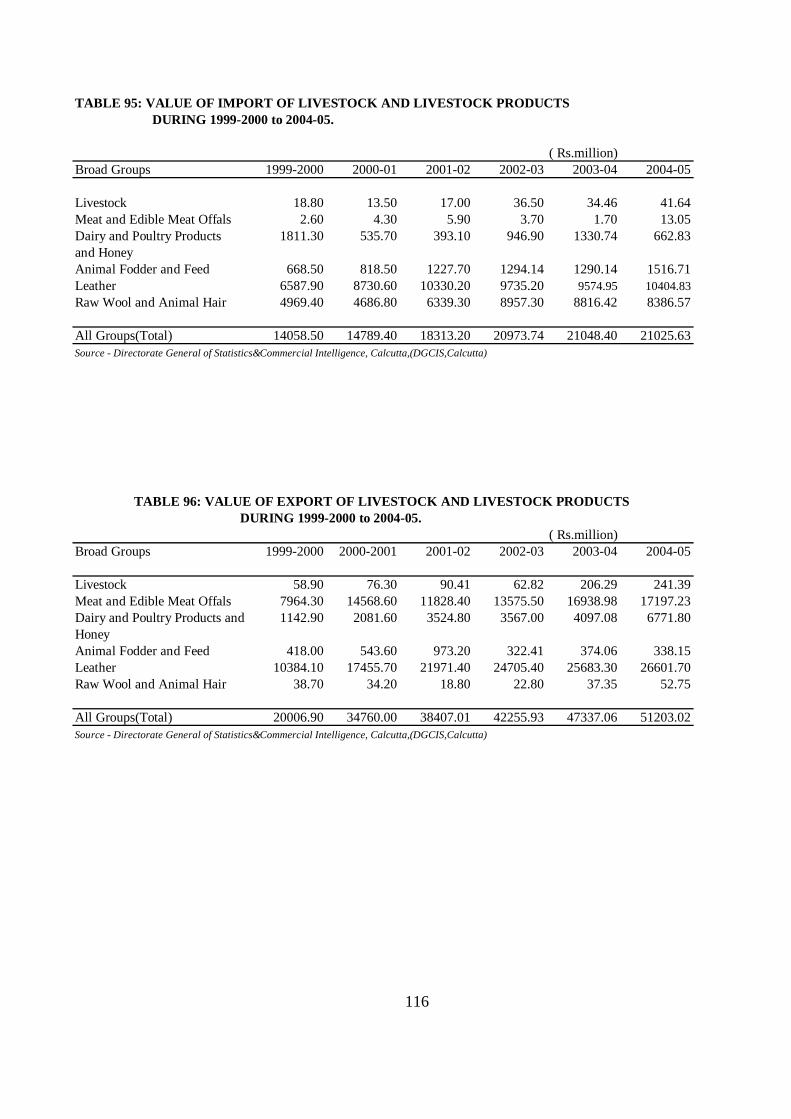
TABLE 95: VALUE OF IMPORT OF LIVESTOCK AND LIVESTOCK PRODUCTS DURING 1999-2000 to 2004-05.
( Rs.million)Broad Groups 1999-2000 2000-01 2001-02 2002-03 2003-04 2004-05
Livestock 18.80 13.50 17.00 36.50 34.46 41.64Meat and Edible Meat Offals 2.60 4.30 5.90 3.70 1.70 13.05Dairy and Poultry Products 1811.30 535.70 393.10 946.90 1330.74 662.83and HoneyAnimal Fodder and Feed 668.50 818.50 1227.70 1294.14 1290.14 1516.71Leather 6587.90 8730.60 10330.20 9735.20 9574.95 10404.83Raw Wool and Animal Hair 4969.40 4686.80 6339.30 8957.30 8816.42 8386.57
All Groups(Total) 14058.50 14789.40 18313.20 20973.74 21048.40 21025.63Source - Directorate General of Statistics&Commercial Intelligence, Calcutta,(DGCIS,Calcutta)
( Rs.million)Broad Groups 1999-2000 2000-2001 2001-02 2002-03 2003-04 2004-05
Livestock 58.90 76.30 90.41 62.82 206.29 241.39Meat and Edible Meat Offals 7964.30 14568.60 11828.40 13575.50 16938.98 17197.23Dairy and Poultry Products and 1142.90 2081.60 3524.80 3567.00 4097.08 6771.80HoneyAnimal Fodder and Feed 418.00 543.60 973.20 322.41 374.06 338.15Leather 10384.10 17455.70 21971.40 24705.40 25683.30 26601.70Raw Wool and Animal Hair 38.70 34.20 18.80 22.80 37.35 52.75
All Groups(Total) 20006.90 34760.00 38407.01 42255.93 47337.06 51203.02Source - Directorate General of Statistics&Commercial Intelligence, Calcutta,(DGCIS,Calcutta)
TABLE 96: VALUE OF EXPORT OF LIVESTOCK AND LIVESTOCK PRODUCTS DURING 1999-2000 to 2004-05.
116
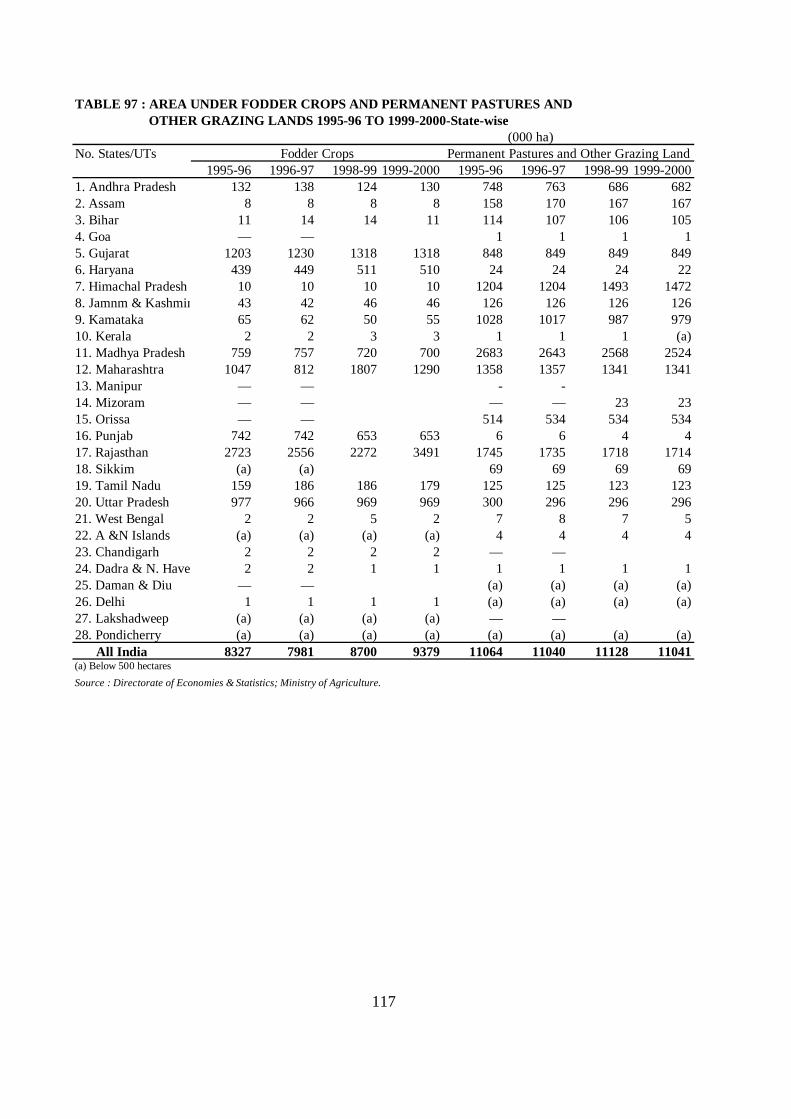
TABLE 97 : AREA UNDER FODDER CROPS AND PERMANENT PASTURES AND OTHER GRAZING LANDS 1995-96 TO 1999-2000-State-wise
(000 ha)No. States/UTs
1995-96 1996-97 1998-99 1999-2000 1995-96 1996-97 1998-99 1999-20001. Andhra Pradesh 132 138 124 130 748 763 686 6822. Assam 8 8 8 8 158 170 167 1673. Bihar 11 14 14 11 114 107 106 1054. Goa — — 1 1 1 15. Gujarat 1203 1230 1318 1318 848 849 849 8496. Haryana 439 449 511 510 24 24 24 227. Himachal Pradesh 10 10 10 10 1204 1204 1493 14728. Jamnm & Kashmir 43 42 46 46 126 126 126 1269. Kamataka 65 62 50 55 1028 1017 987 97910. Kerala 2 2 3 3 1 1 1 (a)11. Madhya Pradesh 759 757 720 700 2683 2643 2568 252412. Maharashtra 1047 812 1807 1290 1358 1357 1341 134113. Manipur — — - -14. Mizoram — — — — 23 2315. Orissa — — 514 534 534 53416. Punjab 742 742 653 653 6 6 4 417. Rajasthan 2723 2556 2272 3491 1745 1735 1718 171418. Sikkim (a) (a) 69 69 69 6919. Tamil Nadu 159 186 186 179 125 125 123 12320. Uttar Pradesh 977 966 969 969 300 296 296 29621. West Bengal 2 2 5 2 7 8 7 522. A &N Islands (a) (a) (a) (a) 4 4 4 423. Chandigarh 2 2 2 2 — —24. Dadra & N. Haveli 2 2 1 1 1 1 1 125. Daman & Diu — — (a) (a) (a) (a)26. Delhi 1 1 1 1 (a) (a) (a) (a)27. Lakshadweep (a) (a) (a) (a) — —28. Pondicherry (a) (a) (a) (a) (a) (a) (a) (a) All India 8327 7981 8700 9379 11064 11040 11128 11041(a) Below 500 hectaresSource : Directorate of Economies & Statistics; Ministry of Agriculture.
Fodder Crops Permanent Pastures and Other Grazing Land
117
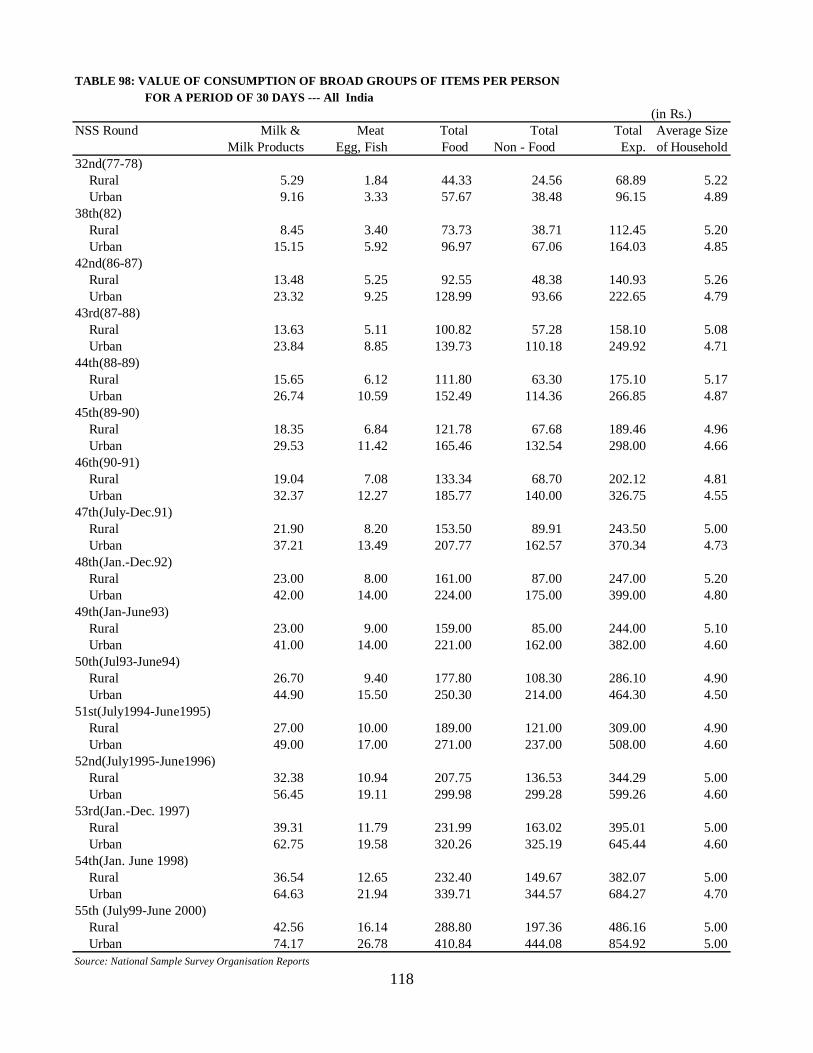
TABLE 98: VALUE OF CONSUMPTION OF BROAD GROUPS OF ITEMS PER PERSON FOR A PERIOD OF 30 DAYS --- All India
(in Rs.)NSS Round Milk & Meat Total Total Total Average Size
Milk Products Egg, Fish Food Non - Food Exp. of Household32nd(77-78) Rural 5.29 1.84 44.33 24.56 68.89 5.22 Urban 9.16 3.33 57.67 38.48 96.15 4.8938th(82) Rural 8.45 3.40 73.73 38.71 112.45 5.20 Urban 15.15 5.92 96.97 67.06 164.03 4.8542nd(86-87) Rural 13.48 5.25 92.55 48.38 140.93 5.26 Urban 23.32 9.25 128.99 93.66 222.65 4.7943rd(87-88) Rural 13.63 5.11 100.82 57.28 158.10 5.08 Urban 23.84 8.85 139.73 110.18 249.92 4.7144th(88-89) Rural 15.65 6.12 111.80 63.30 175.10 5.17 Urban 26.74 10.59 152.49 114.36 266.85 4.8745th(89-90) Rural 18.35 6.84 121.78 67.68 189.46 4.96 Urban 29.53 11.42 165.46 132.54 298.00 4.6646th(90-91) Rural 19.04 7.08 133.34 68.70 202.12 4.81 Urban 32.37 12.27 185.77 140.00 326.75 4.5547th(July-Dec.91) Rural 21.90 8.20 153.50 89.91 243.50 5.00 Urban 37.21 13.49 207.77 162.57 370.34 4.7348th(Jan.-Dec.92) Rural 23.00 8.00 161.00 87.00 247.00 5.20 Urban 42.00 14.00 224.00 175.00 399.00 4.8049th(Jan-June93) Rural 23.00 9.00 159.00 85.00 244.00 5.10 Urban 41.00 14.00 221.00 162.00 382.00 4.6050th(Jul93-June94) Rural 26.70 9.40 177.80 108.30 286.10 4.90 Urban 44.90 15.50 250.30 214.00 464.30 4.5051st(July1994-June1995) Rural 27.00 10.00 189.00 121.00 309.00 4.90 Urban 49.00 17.00 271.00 237.00 508.00 4.6052nd(July1995-June1996) Rural 32.38 10.94 207.75 136.53 344.29 5.00 Urban 56.45 19.11 299.98 299.28 599.26 4.6053rd(Jan.-Dec. 1997) Rural 39.31 11.79 231.99 163.02 395.01 5.00 Urban 62.75 19.58 320.26 325.19 645.44 4.6054th(Jan. June 1998) Rural 36.54 12.65 232.40 149.67 382.07 5.00 Urban 64.63 21.94 339.71 344.57 684.27 4.7055th (July99-June 2000) Rural 42.56 16.14 288.80 197.36 486.16 5.00 Urban 74.17 26.78 410.84 444.08 854.92 5.00Source: National Sample Survey Organisation Reports
118
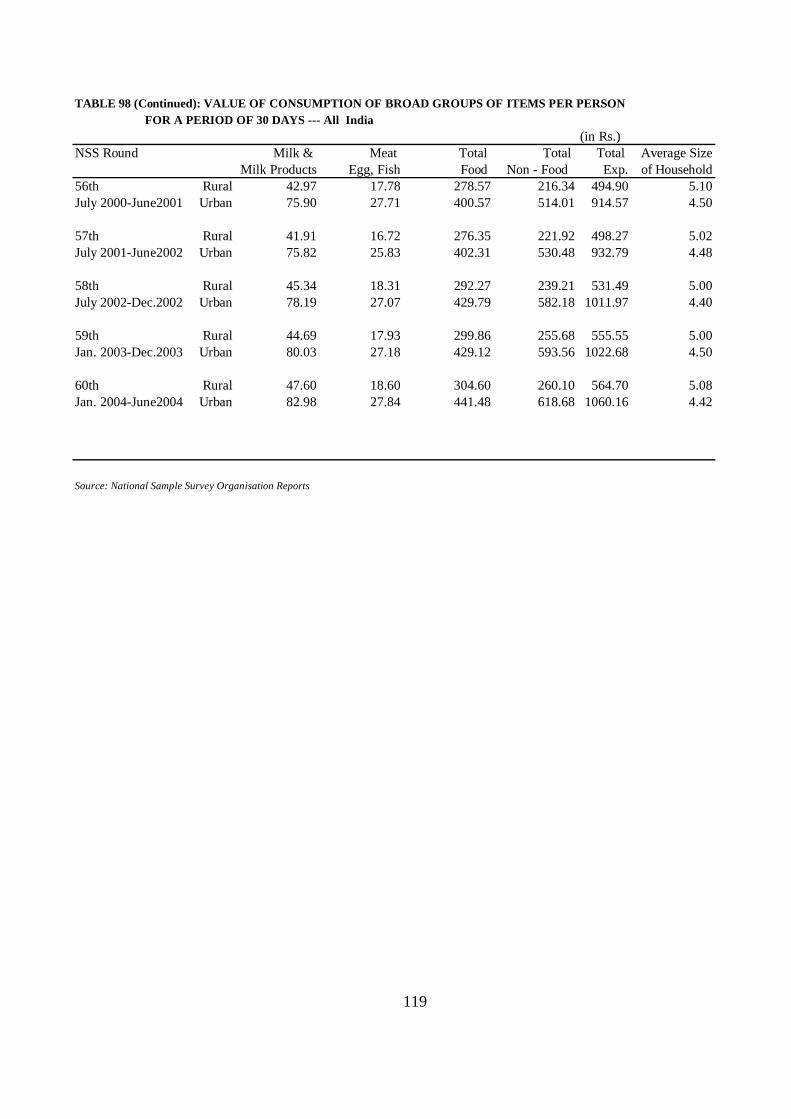
TABLE 98 (Continued): VALUE OF CONSUMPTION OF BROAD GROUPS OF ITEMS PER PERSON FOR A PERIOD OF 30 DAYS --- All India
(in Rs.)NSS Round Milk & Meat Total Total Total Average Size
Milk Products Egg, Fish Food Non - Food Exp. of Household56th Rural 42.97 17.78 278.57 216.34 494.90 5.10July 2000-June2001 Urban 75.90 27.71 400.57 514.01 914.57 4.50
57th Rural 41.91 16.72 276.35 221.92 498.27 5.02July 2001-June2002 Urban 75.82 25.83 402.31 530.48 932.79 4.48
58th Rural 45.34 18.31 292.27 239.21 531.49 5.00July 2002-Dec.2002 Urban 78.19 27.07 429.79 582.18 1011.97 4.40
59th Rural 44.69 17.93 299.86 255.68 555.55 5.00Jan. 2003-Dec.2003 Urban 80.03 27.18 429.12 593.56 1022.68 4.50
60th Rural 47.60 18.60 304.60 260.10 564.70 5.08Jan. 2004-June2004 Urban 82.98 27.84 441.48 618.68 1060.16 4.42
Source: National Sample Survey Organisation Reports
119
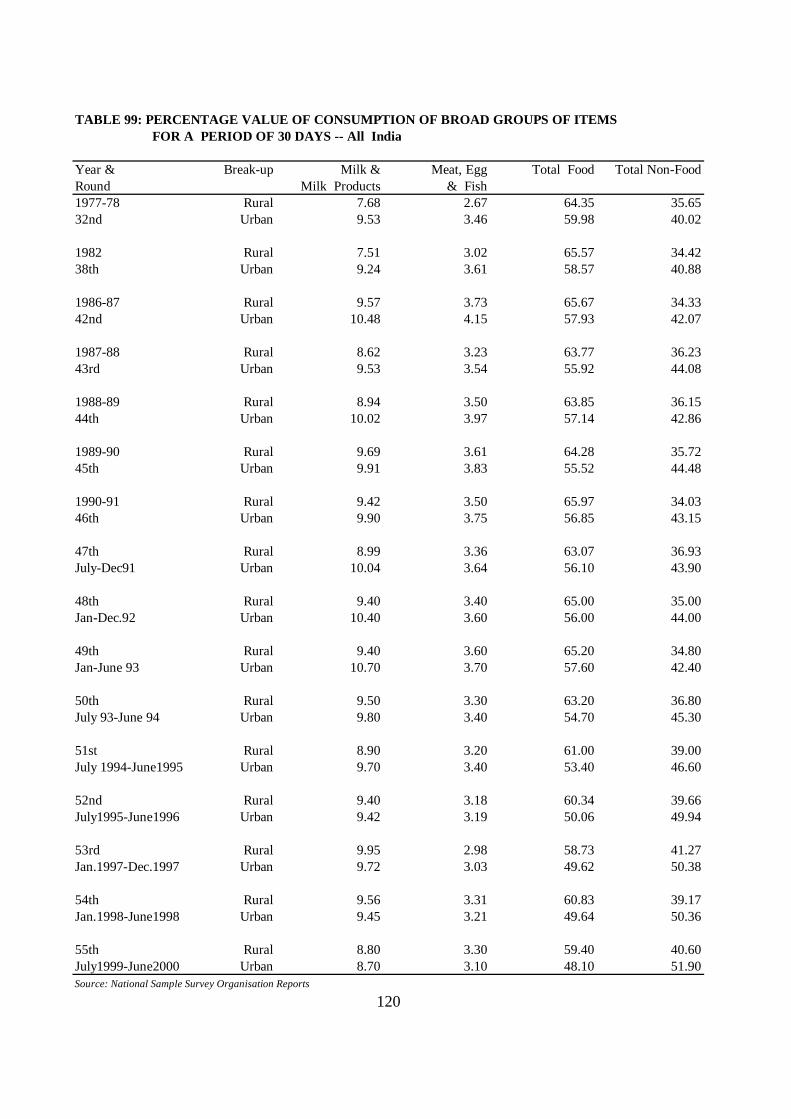
TABLE 99: PERCENTAGE VALUE OF CONSUMPTION OF BROAD GROUPS OF ITEMS FOR A PERIOD OF 30 DAYS -- All India
Year & Break-up Milk & Meat, Egg Total Food Total Non-FoodRound Milk Products & Fish1977-78 Rural 7.68 2.67 64.35 35.6532nd Urban 9.53 3.46 59.98 40.02
1982 Rural 7.51 3.02 65.57 34.4238th Urban 9.24 3.61 58.57 40.88
1986-87 Rural 9.57 3.73 65.67 34.3342nd Urban 10.48 4.15 57.93 42.07
1987-88 Rural 8.62 3.23 63.77 36.2343rd Urban 9.53 3.54 55.92 44.08
1988-89 Rural 8.94 3.50 63.85 36.1544th Urban 10.02 3.97 57.14 42.86
1989-90 Rural 9.69 3.61 64.28 35.7245th Urban 9.91 3.83 55.52 44.48
1990-91 Rural 9.42 3.50 65.97 34.0346th Urban 9.90 3.75 56.85 43.15
47th Rural 8.99 3.36 63.07 36.93July-Dec91 Urban 10.04 3.64 56.10 43.90
48th Rural 9.40 3.40 65.00 35.00Jan-Dec.92 Urban 10.40 3.60 56.00 44.00
49th Rural 9.40 3.60 65.20 34.80Jan-June 93 Urban 10.70 3.70 57.60 42.40
50th Rural 9.50 3.30 63.20 36.80July 93-June 94 Urban 9.80 3.40 54.70 45.30
51st Rural 8.90 3.20 61.00 39.00July 1994-June1995 Urban 9.70 3.40 53.40 46.60
52nd Rural 9.40 3.18 60.34 39.66July1995-June1996 Urban 9.42 3.19 50.06 49.94
53rd Rural 9.95 2.98 58.73 41.27Jan.1997-Dec.1997 Urban 9.72 3.03 49.62 50.38
54th Rural 9.56 3.31 60.83 39.17Jan.1998-June1998 Urban 9.45 3.21 49.64 50.36
55th Rural 8.80 3.30 59.40 40.60July1999-June2000 Urban 8.70 3.10 48.10 51.90Source: National Sample Survey Organisation Reports
120
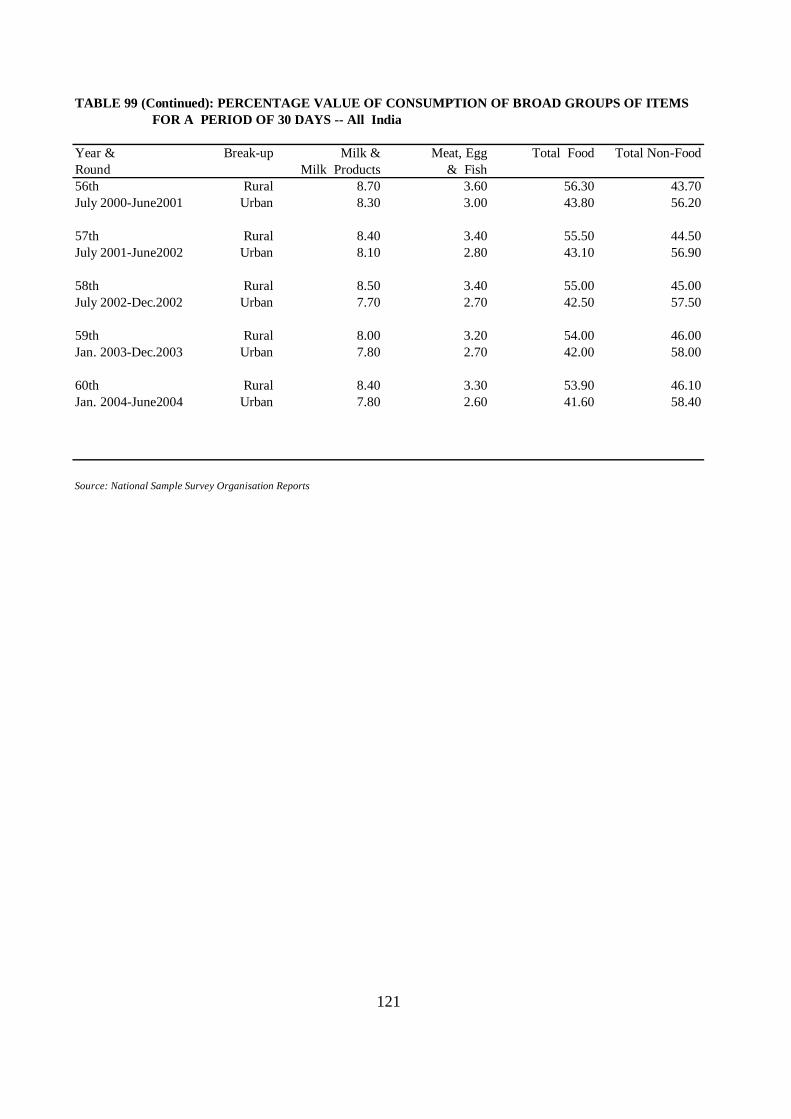
TABLE 99 (Continued): PERCENTAGE VALUE OF CONSUMPTION OF BROAD GROUPS OF ITEMS FOR A PERIOD OF 30 DAYS -- All India
Year & Break-up Milk & Meat, Egg Total Food Total Non-FoodRound Milk Products & Fish56th Rural 8.70 3.60 56.30 43.70July 2000-June2001 Urban 8.30 3.00 43.80 56.20
57th Rural 8.40 3.40 55.50 44.50July 2001-June2002 Urban 8.10 2.80 43.10 56.90
58th Rural 8.50 3.40 55.00 45.00July 2002-Dec.2002 Urban 7.70 2.70 42.50 57.50
59th Rural 8.00 3.20 54.00 46.00Jan. 2003-Dec.2003 Urban 7.80 2.70 42.00 58.00
60th Rural 8.40 3.30 53.90 46.10Jan. 2004-June2004 Urban 7.80 2.60 41.60 58.40
Source: National Sample Survey Organisation Reports
121
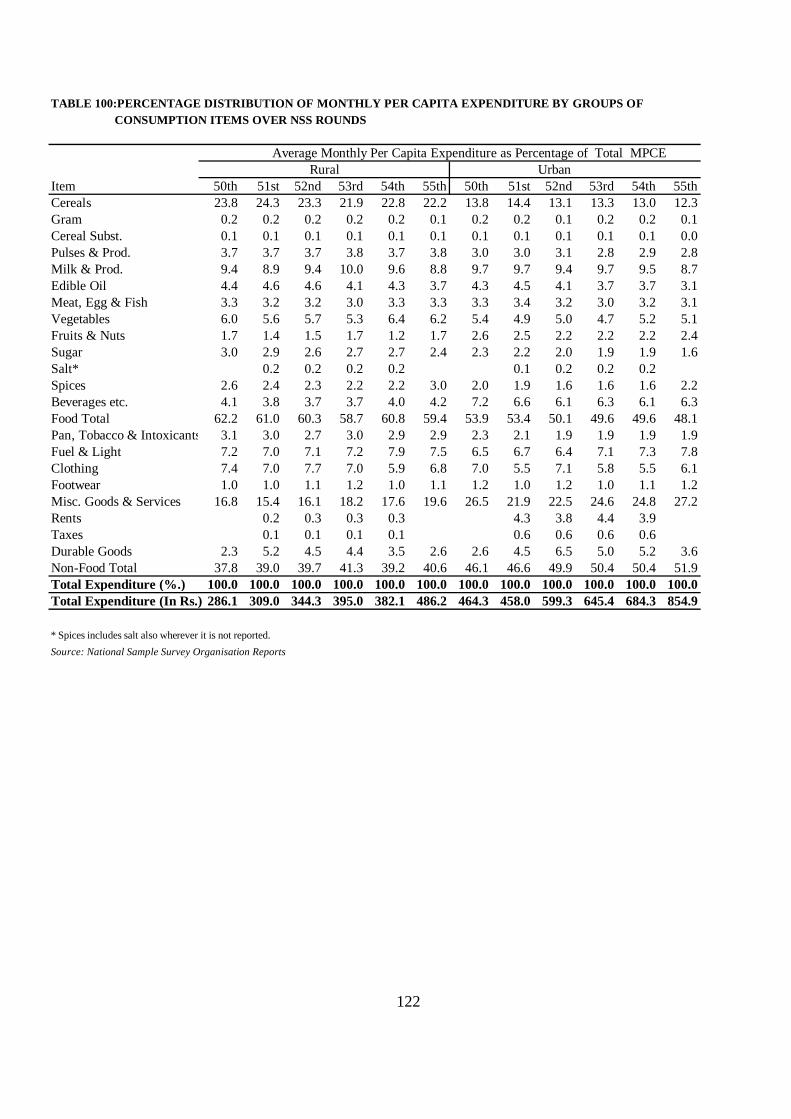
TABLE 100:PERCENTAGE DISTRIBUTION OF MONTHLY PER CAPITA EXPENDITURE BY GROUPS OF CONSUMPTION ITEMS OVER NSS ROUNDS
Item 50th 51st 52nd 53rd 54th 55th 50th 51st 52nd 53rd 54th 55thCereals 23.8 24.3 23.3 21.9 22.8 22.2 13.8 14.4 13.1 13.3 13.0 12.3Gram 0.2 0.2 0.2 0.2 0.2 0.1 0.2 0.2 0.1 0.2 0.2 0.1Cereal Subst. 0.1 0.1 0.1 0.1 0.1 0.1 0.1 0.1 0.1 0.1 0.1 0.0Pulses & Prod. 3.7 3.7 3.7 3.8 3.7 3.8 3.0 3.0 3.1 2.8 2.9 2.8Milk & Prod. 9.4 8.9 9.4 10.0 9.6 8.8 9.7 9.7 9.4 9.7 9.5 8.7Edible Oil 4.4 4.6 4.6 4.1 4.3 3.7 4.3 4.5 4.1 3.7 3.7 3.1Meat, Egg & Fish 3.3 3.2 3.2 3.0 3.3 3.3 3.3 3.4 3.2 3.0 3.2 3.1Vegetables 6.0 5.6 5.7 5.3 6.4 6.2 5.4 4.9 5.0 4.7 5.2 5.1Fruits & Nuts 1.7 1.4 1.5 1.7 1.2 1.7 2.6 2.5 2.2 2.2 2.2 2.4Sugar 3.0 2.9 2.6 2.7 2.7 2.4 2.3 2.2 2.0 1.9 1.9 1.6Salt* 0.2 0.2 0.2 0.2 0.1 0.2 0.2 0.2Spices 2.6 2.4 2.3 2.2 2.2 3.0 2.0 1.9 1.6 1.6 1.6 2.2Beverages etc. 4.1 3.8 3.7 3.7 4.0 4.2 7.2 6.6 6.1 6.3 6.1 6.3Food Total 62.2 61.0 60.3 58.7 60.8 59.4 53.9 53.4 50.1 49.6 49.6 48.1Pan, Tobacco & Intoxicants 3.1 3.0 2.7 3.0 2.9 2.9 2.3 2.1 1.9 1.9 1.9 1.9Fuel & Light 7.2 7.0 7.1 7.2 7.9 7.5 6.5 6.7 6.4 7.1 7.3 7.8Clothing 7.4 7.0 7.7 7.0 5.9 6.8 7.0 5.5 7.1 5.8 5.5 6.1Footwear 1.0 1.0 1.1 1.2 1.0 1.1 1.2 1.0 1.2 1.0 1.1 1.2Misc. Goods & Services 16.8 15.4 16.1 18.2 17.6 19.6 26.5 21.9 22.5 24.6 24.8 27.2Rents 0.2 0.3 0.3 0.3 4.3 3.8 4.4 3.9Taxes 0.1 0.1 0.1 0.1 0.6 0.6 0.6 0.6Durable Goods 2.3 5.2 4.5 4.4 3.5 2.6 2.6 4.5 6.5 5.0 5.2 3.6Non-Food Total 37.8 39.0 39.7 41.3 39.2 40.6 46.1 46.6 49.9 50.4 50.4 51.9Total Expenditure (%.) 100.0 100.0 100.0 100.0 100.0 100.0 100.0 100.0 100.0 100.0 100.0 100.0Total Expenditure (In Rs.) 286.1 309.0 344.3 395.0 382.1 486.2 464.3 458.0 599.3 645.4 684.3 854.9
* Spices includes salt also wherever it is not reported.Source: National Sample Survey Organisation Reports
Average Monthly Per Capita Expenditure as Percentage of Total MPCEUrbanRural
122
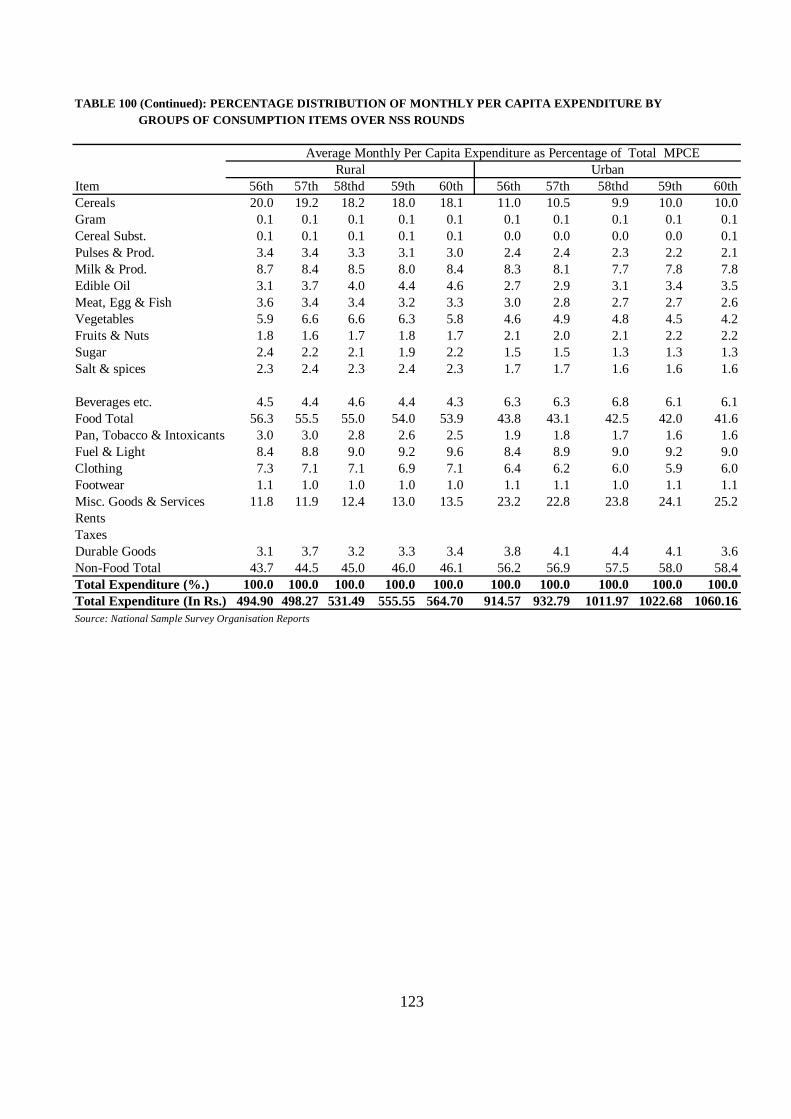
TABLE 100 (Continued): PERCENTAGE DISTRIBUTION OF MONTHLY PER CAPITA EXPENDITURE BY GROUPS OF CONSUMPTION ITEMS OVER NSS ROUNDS
Item 56th 57th 58thd 59th 60th 56th 57th 58thd 59th 60thCereals 20.0 19.2 18.2 18.0 18.1 11.0 10.5 9.9 10.0 10.0Gram 0.1 0.1 0.1 0.1 0.1 0.1 0.1 0.1 0.1 0.1Cereal Subst. 0.1 0.1 0.1 0.1 0.1 0.0 0.0 0.0 0.0 0.1Pulses & Prod. 3.4 3.4 3.3 3.1 3.0 2.4 2.4 2.3 2.2 2.1Milk & Prod. 8.7 8.4 8.5 8.0 8.4 8.3 8.1 7.7 7.8 7.8Edible Oil 3.1 3.7 4.0 4.4 4.6 2.7 2.9 3.1 3.4 3.5Meat, Egg & Fish 3.6 3.4 3.4 3.2 3.3 3.0 2.8 2.7 2.7 2.6Vegetables 5.9 6.6 6.6 6.3 5.8 4.6 4.9 4.8 4.5 4.2Fruits & Nuts 1.8 1.6 1.7 1.8 1.7 2.1 2.0 2.1 2.2 2.2Sugar 2.4 2.2 2.1 1.9 2.2 1.5 1.5 1.3 1.3 1.3Salt & spices 2.3 2.4 2.3 2.4 2.3 1.7 1.7 1.6 1.6 1.6
Beverages etc. 4.5 4.4 4.6 4.4 4.3 6.3 6.3 6.8 6.1 6.1Food Total 56.3 55.5 55.0 54.0 53.9 43.8 43.1 42.5 42.0 41.6Pan, Tobacco & Intoxicants 3.0 3.0 2.8 2.6 2.5 1.9 1.8 1.7 1.6 1.6Fuel & Light 8.4 8.8 9.0 9.2 9.6 8.4 8.9 9.0 9.2 9.0Clothing 7.3 7.1 7.1 6.9 7.1 6.4 6.2 6.0 5.9 6.0Footwear 1.1 1.0 1.0 1.0 1.0 1.1 1.1 1.0 1.1 1.1Misc. Goods & Services 11.8 11.9 12.4 13.0 13.5 23.2 22.8 23.8 24.1 25.2RentsTaxesDurable Goods 3.1 3.7 3.2 3.3 3.4 3.8 4.1 4.4 4.1 3.6Non-Food Total 43.7 44.5 45.0 46.0 46.1 56.2 56.9 57.5 58.0 58.4Total Expenditure (%.) 100.0 100.0 100.0 100.0 100.0 100.0 100.0 100.0 100.0 100.0Total Expenditure (In Rs.) 494.90 498.27 531.49 555.55 564.70 914.57 932.79 1011.97 1022.68 1060.16Source: National Sample Survey Organisation Reports
Rural Urban Average Monthly Per Capita Expenditure as Percentage of Total MPCE
123
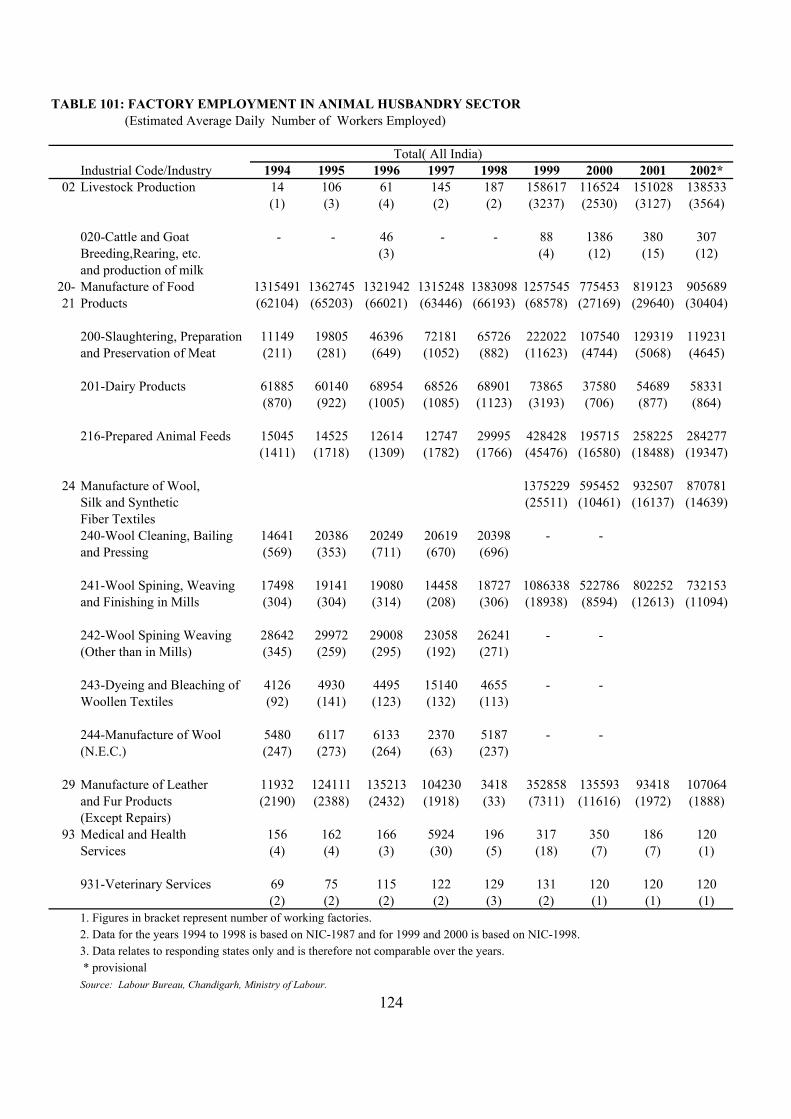
TABLE 101: FACTORY EMPLOYMENT IN ANIMAL HUSBANDRY SECTOR (Estimated Average Daily Number of Workers Employed)
Industrial Code/Industry 1994 1995 1996 1997 1998 1999 2000 2001 2002*02 Livestock Production 14 106 61 145 187 158617 116524 151028 138533
(1) (3) (4) (2) (2) (3237) (2530) (3127) (3564)
020-Cattle and Goat - - 46 - - 88 1386 380 307Breeding,Rearing, etc. (3) (4) (12) (15) (12)and production of milk
20- Manufacture of Food 1315491 1362745 1321942 1315248 1383098 1257545 775453 819123 90568921 Products (62104) (65203) (66021) (63446) (66193) (68578) (27169) (29640) (30404)
200-Slaughtering, Preparation 11149 19805 46396 72181 65726 222022 107540 129319 119231and Preservation of Meat (211) (281) (649) (1052) (882) (11623) (4744) (5068) (4645)
201-Dairy Products 61885 60140 68954 68526 68901 73865 37580 54689 58331(870) (922) (1005) (1085) (1123) (3193) (706) (877) (864)
216-Prepared Animal Feeds 15045 14525 12614 12747 29995 428428 195715 258225 284277(1411) (1718) (1309) (1782) (1766) (45476) (16580) (18488) (19347)
24 Manufacture of Wool, 1375229 595452 932507 870781Silk and Synthetic (25511) (10461) (16137) (14639)Fiber Textiles240-Wool Cleaning, Bailing 14641 20386 20249 20619 20398 - -and Pressing (569) (353) (711) (670) (696)
241-Wool Spining, Weaving 17498 19141 19080 14458 18727 1086338 522786 802252 732153and Finishing in Mills (304) (304) (314) (208) (306) (18938) (8594) (12613) (11094)
242-Wool Spining Weaving 28642 29972 29008 23058 26241 - -(Other than in Mills) (345) (259) (295) (192) (271)
243-Dyeing and Bleaching of 4126 4930 4495 15140 4655 - -Woollen Textiles (92) (141) (123) (132) (113)
244-Manufacture of Wool 5480 6117 6133 2370 5187 - -(N.E.C.) (247) (273) (264) (63) (237)
29 Manufacture of Leather 11932 124111 135213 104230 3418 352858 135593 93418 107064and Fur Products (2190) (2388) (2432) (1918) (33) (7311) (11616) (1972) (1888)(Except Repairs)
93 Medical and Health 156 162 166 5924 196 317 350 186 120Services (4) (4) (3) (30) (5) (18) (7) (7) (1)
931-Veterinary Services 69 75 115 122 129 131 120 120 120(2) (2) (2) (2) (3) (2) (1) (1) (1)
1. Figures in bracket represent number of working factories.2. Data for the years 1994 to 1998 is based on NIC-1987 and for 1999 and 2000 is based on NIC-1998.3. Data relates to responding states only and is therefore not comparable over the years. * provisionalSource: Labour Bureau, Chandigarh, Ministry of Labour.
Total( All India)
124
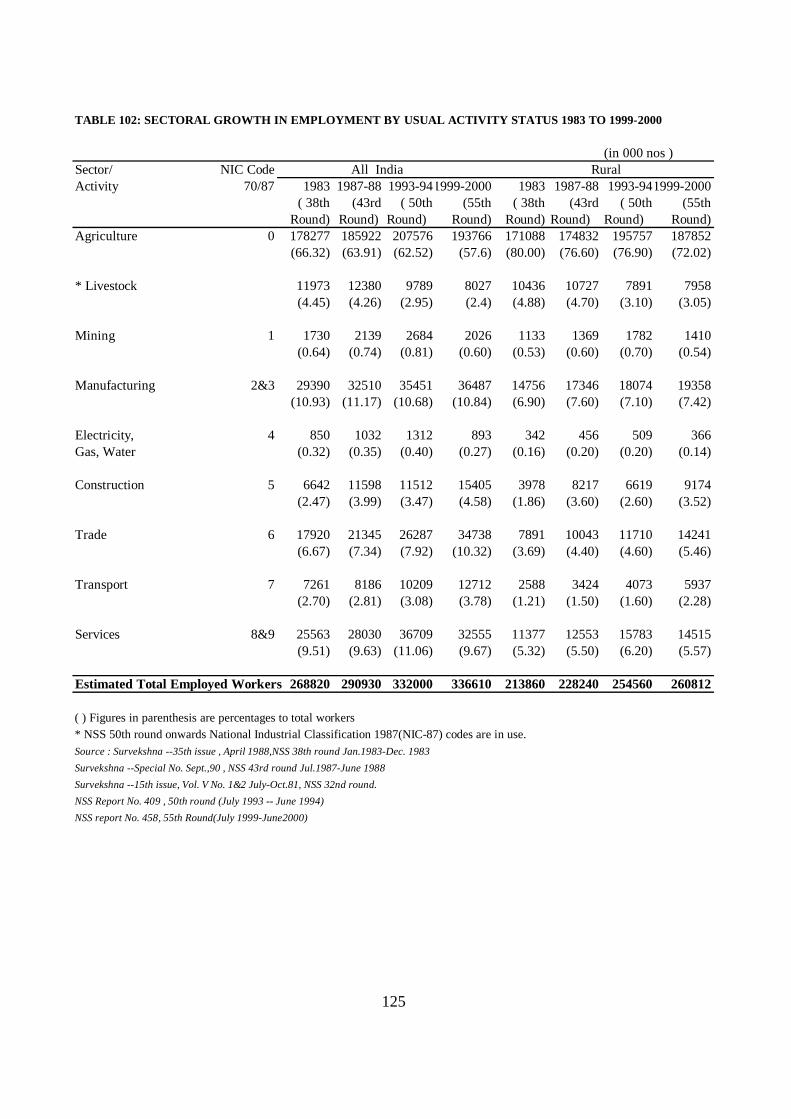
TABLE 102: SECTORAL GROWTH IN EMPLOYMENT BY USUAL ACTIVITY STATUS 1983 TO 1999-2000
(in 000 nos )Sector/ NIC CodeActivity 70/87 1983 1987-88 1993-941999-2000 1983 1987-88 1993-941999-2000
( 38th (43rd ( 50th (55th ( 38th (43rd ( 50th (55thRound) Round) Round) Round) Round) Round) Round) Round)
Agriculture 0 178277 185922 207576 193766 171088 174832 195757 187852(66.32) (63.91) (62.52) (57.6) (80.00) (76.60) (76.90) (72.02)
* Livestock 11973 12380 9789 8027 10436 10727 7891 7958(4.45) (4.26) (2.95) (2.4) (4.88) (4.70) (3.10) (3.05)
Mining 1 1730 2139 2684 2026 1133 1369 1782 1410(0.64) (0.74) (0.81) (0.60) (0.53) (0.60) (0.70) (0.54)
Manufacturing 2&3 29390 32510 35451 36487 14756 17346 18074 19358(10.93) (11.17) (10.68) (10.84) (6.90) (7.60) (7.10) (7.42)
Electricity, 4 850 1032 1312 893 342 456 509 366Gas, Water (0.32) (0.35) (0.40) (0.27) (0.16) (0.20) (0.20) (0.14)
Construction 5 6642 11598 11512 15405 3978 8217 6619 9174(2.47) (3.99) (3.47) (4.58) (1.86) (3.60) (2.60) (3.52)
Trade 6 17920 21345 26287 34738 7891 10043 11710 14241(6.67) (7.34) (7.92) (10.32) (3.69) (4.40) (4.60) (5.46)
Transport 7 7261 8186 10209 12712 2588 3424 4073 5937(2.70) (2.81) (3.08) (3.78) (1.21) (1.50) (1.60) (2.28)
Services 8&9 25563 28030 36709 32555 11377 12553 15783 14515(9.51) (9.63) (11.06) (9.67) (5.32) (5.50) (6.20) (5.57)
Estimated Total Employed Workers 268820 290930 332000 336610 213860 228240 254560 260812
( ) Figures in parenthesis are percentages to total workers* NSS 50th round onwards National Industrial Classification 1987(NIC-87) codes are in use.Source : Survekshna --35th issue , April 1988,NSS 38th round Jan.1983-Dec. 1983Survekshna --Special No. Sept.,90 , NSS 43rd round Jul.1987-June 1988Survekshna --15th issue, Vol. V No. 1&2 July-Oct.81, NSS 32nd round.NSS Report No. 409 , 50th round (July 1993 -- June 1994)NSS report No. 458, 55th Round(July 1999-June2000)
All India Rural
125
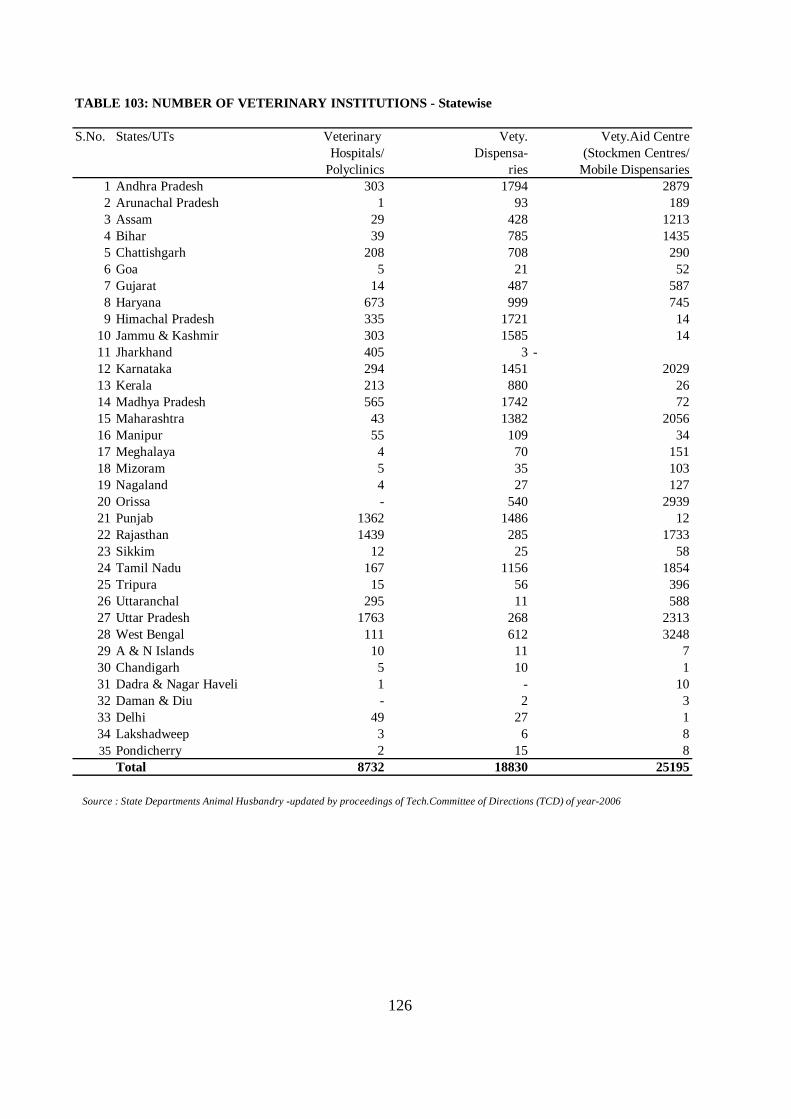
TABLE 103: NUMBER OF VETERINARY INSTITUTIONS - Statewise
S.No. States/UTs Veterinary Vety. Vety.Aid CentreHospitals/ Dispensa- (Stockmen Centres/
Polyclinics ries Mobile Dispensaries1 Andhra Pradesh 303 1794 28792 Arunachal Pradesh 1 93 1893 Assam 29 428 12134 Bihar 39 785 14355 Chattishgarh 208 708 2906 Goa 5 21 527 Gujarat 14 487 5878 Haryana 673 999 7459 Himachal Pradesh 335 1721 14
10 Jammu & Kashmir 303 1585 1411 Jharkhand 405 3 -12 Karnataka 294 1451 202913 Kerala 213 880 2614 Madhya Pradesh 565 1742 7215 Maharashtra 43 1382 205616 Manipur 55 109 3417 Meghalaya 4 70 15118 Mizoram 5 35 10319 Nagaland 4 27 12720 Orissa - 540 293921 Punjab 1362 1486 1222 Rajasthan 1439 285 173323 Sikkim 12 25 5824 Tamil Nadu 167 1156 185425 Tripura 15 56 39626 Uttaranchal 295 11 58827 Uttar Pradesh 1763 268 231328 West Bengal 111 612 324829 A & N Islands 10 11 730 Chandigarh 5 10 131 Dadra & Nagar Haveli 1 - 1032 Daman & Diu - 2 333 Delhi 49 27 134 Lakshadweep 3 6 835 Pondicherry 2 15 8
Total 8732 18830 25195
Source : State Departments Animal Husbandry -updated by proceedings of Tech.Committee of Directions (TCD) of year-2006
126

TABLE 104:STATE FARMS AND OTHER INFRASTRUCTURES
S.No. States/UTs No.of ICD
ProjectsAH Dept. Others AH Dept. Others AH Dept. Others AH Dept. Others
1 Andhra Pradesh - - 4 - 21 4842 2093 4 52 Arunachal Pradesh 1 4 - 1 - 50 - 13 143 Assam 10 3 - 7 - 749 - 1 -4 Bihar 23 1 - 3 - 1401 - 3 -5 Chattishgarh 5 - - - - 22 180 4 -6 Goa - - - - - 52 - 1 -7 Gujarat 10 4 3 - - 1586 2710 4 128 Haryana 7 3 4 7 4 60 36 3 39 Himachal Pradesh 1 3 - 2 - 1324 - 5 -
10 Jammu & Kashmir 1 4 - 1 - 550 - 3 -11 Jharkhand - - - - 1 - 651 - 312 Karnataka - 3 2 4 2 3774 2340 10 113 Kerala 9 - 3 - 7 2445 394 3 -14 Madhya Pradesh 17 - - 4 - 2243 - 8 -15 Maharashtra - 3 2 26 - 4566 - 9 -16 Manipur 1 - - 2 - 76 - 1 -17 Meghalaya 2 2 - 1 - 76 - 4 -18 Mizoram - - - - - 50 - 7 -19 Nagaland 1 - - 2 - 5 - 7 -20 Orissa 4 2 - 2 - 2201 255 8 -21 Punjab - 2 - 2 - - - 2 -22 Rajasthan - - 1 - - 2632 - 4 -23 Sikkim 7 - - - - 35 - - -24 Tamil Nadu - 3 2 12 17 3177 2343 8 125 Tripura 2 3 - 1 - 11 - 1 -26 Uttaranchal 1 1 - 1 - 406 249 2 -27 Uttar Pradesh - 4 - - - 3079 - 4 -28 West Bengal - 2 - 19 - 1262 3072 8 -29 A & N Islands - - - - - 31 - - -30 Chandigarh - - - - - 1 - - -31 Dadra & Nagar Haveli - - - - - - - - -32 Daman & Diu - - - - - - - - -33 Delhi - - - - - - - - -34 Lakshadweep - - - - - 7 - - -35 Pondicherry - - - 1 2 92 46 - -
Total 102 47 21 98 54 36805 14369 127 39Item Total 68 152 51174 166
Source : State Departments Animal Husbandry -updated by proceedings of Tech.Committee of Directions (TCD) of year-2006
Semen Production Frozen Semen No.of AI Centres No.of Cattle
127
underCentres under Banks under under Breeding Farms
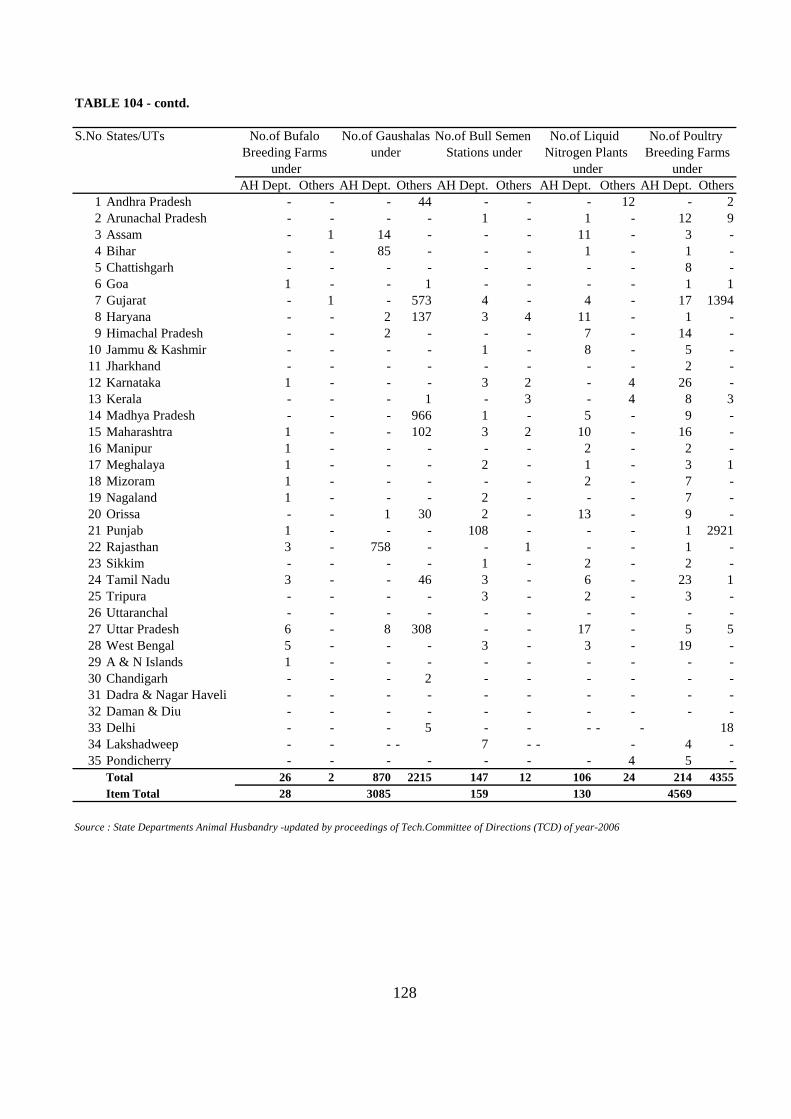
TABLE 104 - contd.
S.No.States/UTs
AH Dept. Others AH Dept. Others AH Dept. Others AH Dept. Others AH Dept. Others1 Andhra Pradesh - - - 44 - - - 12 - 22 Arunachal Pradesh - - - - 1 - 1 - 12 93 Assam - 1 14 - - - 11 - 3 -4 Bihar - - 85 - - - 1 - 1 -5 Chattishgarh - - - - - - - - 8 -6 Goa 1 - - 1 - - - - 1 17 Gujarat - 1 - 573 4 - 4 - 17 13948 Haryana - - 2 137 3 4 11 - 1 -9 Himachal Pradesh - - 2 - - - 7 - 14 -
10 Jammu & Kashmir - - - - 1 - 8 - 5 -11 Jharkhand - - - - - - - - 2 -12 Karnataka 1 - - - 3 2 - 4 26 -13 Kerala - - - 1 - 3 - 4 8 314 Madhya Pradesh - - - 966 1 - 5 - 9 -15 Maharashtra 1 - - 102 3 2 10 - 16 -16 Manipur 1 - - - - - 2 - 2 -17 Meghalaya 1 - - - 2 - 1 - 3 118 Mizoram 1 - - - - - 2 - 7 -19 Nagaland 1 - - - 2 - - - 7 -20 Orissa - - 1 30 2 - 13 - 9 -21 Punjab 1 - - - 108 - - - 1 292122 Rajasthan 3 - 758 - - 1 - - 1 -23 Sikkim - - - - 1 - 2 - 2 -24 Tamil Nadu 3 - - 46 3 - 6 - 23 125 Tripura - - - - 3 - 2 - 3 -26 Uttaranchal - - - - - - - - - -27 Uttar Pradesh 6 - 8 308 - - 17 - 5 528 West Bengal 5 - - - 3 - 3 - 19 -29 A & N Islands 1 - - - - - - - - -30 Chandigarh - - - 2 - - - - - -31 Dadra & Nagar Haveli - - - - - - - - - -32 Daman & Diu - - - - - - - - - -33 Delhi - - - 5 - - - - - 1834 Lakshadweep - - - - 7 - - - 4 -35 Pondicherry - - - - - - - 4 5 -
Total 26 2 870 2215 147 12 106 24 214 4355Item Total 28 3085 159 130 4569
Source : State Departments Animal Husbandry -updated by proceedings of Tech.Committee of Directions (TCD) of year-2006
under
128
under underNitrogen Plants
No.of PoultryBreeding Farms
No.of LiquidBreeding Farms under Stations under
No.of Bufalo No.of Gaushalas No.of Bull Semen
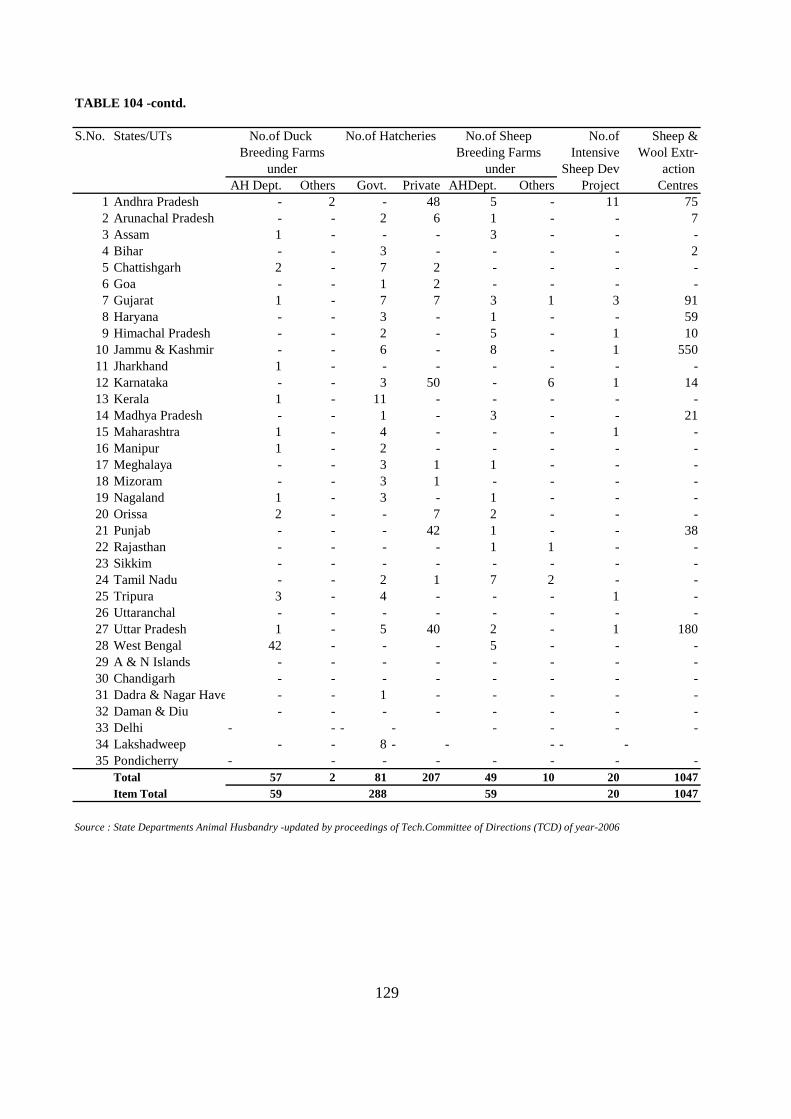
TABLE 104 -contd.
S.No. States/UTs No.of Sheep &Intensive Wool Extr-
Sheep Dev actionAH Dept. Others Govt. Private AHDept. Others Project Centres
1 Andhra Pradesh - 2 - 48 5 - 11 752 Arunachal Pradesh - - 2 6 1 - - 73 Assam 1 - - - 3 - - -4 Bihar - - 3 - - - - 25 Chattishgarh 2 - 7 2 - - - -6 Goa - - 1 2 - - - -7 Gujarat 1 - 7 7 3 1 3 918 Haryana - - 3 - 1 - - 599 Himachal Pradesh - - 2 - 5 - 1 10
10 Jammu & Kashmir - - 6 - 8 - 1 55011 Jharkhand 1 - - - - - - -12 Karnataka - - 3 50 - 6 1 1413 Kerala 1 - 11 - - - - -14 Madhya Pradesh - - 1 - 3 - - 2115 Maharashtra 1 - 4 - - - 1 -16 Manipur 1 - 2 - - - - -17 Meghalaya - - 3 1 1 - - -18 Mizoram - - 3 1 - - - -19 Nagaland 1 - 3 - 1 - - -20 Orissa 2 - - 7 2 - - -21 Punjab - - - 42 1 - - 3822 Rajasthan - - - - 1 1 - -23 Sikkim - - - - - - - -24 Tamil Nadu - - 2 1 7 2 - -25 Tripura 3 - 4 - - - 1 -26 Uttaranchal - - - - - - - -27 Uttar Pradesh 1 - 5 40 2 - 1 18028 West Bengal 42 - - - 5 - - -29 A & N Islands - - - - - - - -30 Chandigarh - - - - - - - -31 Dadra & Nagar Haveli - - 1 - - - - -32 Daman & Diu - - - - - - - -33 Delhi - - - - - - - -34 Lakshadweep - - 8 - - - - -35 Pondicherry - - - - - - - -
Total 57 2 81 207 49 10 20 1047Item Total 59 288 59 20 1047
Source : State Departments Animal Husbandry -updated by proceedings of Tech.Committee of Directions (TCD) of year-2006
129
No.of Duck
under Breeding Farms
under
No.of Hatcheries No.of SheepBreeding Farms
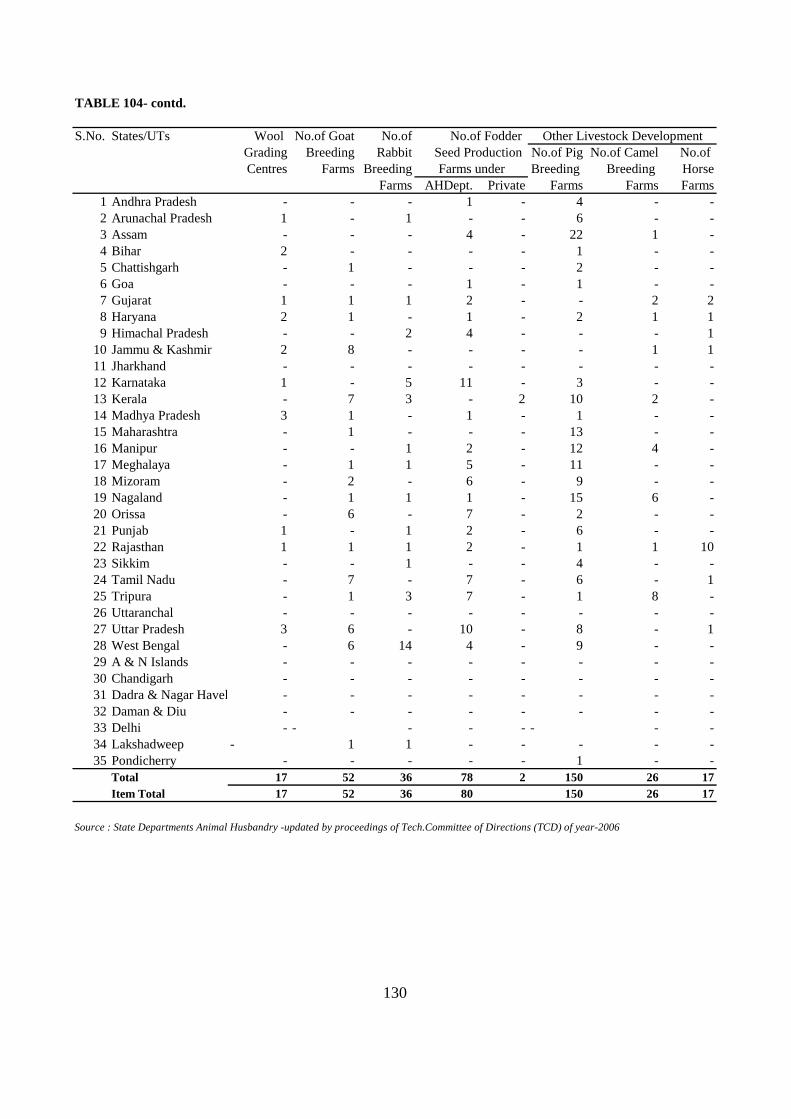
TABLE 104- contd.
S.No. States/UTs Wool No.of Goat No.ofGrading Breeding Rabbit No.of Pig No.of Camel No.ofCentres Farms Breeding Breeding Breeding Horse
Farms AHDept. Private Farms Farms Farms1 Andhra Pradesh - - - 1 - 4 - -2 Arunachal Pradesh 1 - 1 - - 6 - -3 Assam - - - 4 - 22 1 -4 Bihar 2 - - - - 1 - -5 Chattishgarh - 1 - - - 2 - -6 Goa - - - 1 - 1 - -7 Gujarat 1 1 1 2 - - 2 28 Haryana 2 1 - 1 - 2 1 19 Himachal Pradesh - - 2 4 - - - 1
10 Jammu & Kashmir 2 8 - - - - 1 111 Jharkhand - - - - - - - -12 Karnataka 1 - 5 11 - 3 - -13 Kerala - 7 3 - 2 10 2 -14 Madhya Pradesh 3 1 - 1 - 1 - -15 Maharashtra - 1 - - - 13 - -16 Manipur - - 1 2 - 12 4 -17 Meghalaya - 1 1 5 - 11 - -18 Mizoram - 2 - 6 - 9 - -19 Nagaland - 1 1 1 - 15 6 -20 Orissa - 6 - 7 - 2 - -21 Punjab 1 - 1 2 - 6 - -22 Rajasthan 1 1 1 2 - 1 1 1023 Sikkim - - 1 - - 4 - -24 Tamil Nadu - 7 - 7 - 6 - 125 Tripura - 1 3 7 - 1 8 -26 Uttaranchal - - - - - - - -27 Uttar Pradesh 3 6 - 10 - 8 - 128 West Bengal - 6 14 4 - 9 - -29 A & N Islands - - - - - - - -30 Chandigarh - - - - - - - -31 Dadra & Nagar Haveli - - - - - - - -32 Daman & Diu - - - - - - - -33 Delhi - - - - - - - -34 Lakshadweep - 1 1 - - - - -35 Pondicherry - - - - - 1 - -
Total 17 52 36 78 2 150 26 17Item Total 17 52 36 80 150 26 17
Source : State Departments Animal Husbandry -updated by proceedings of Tech.Committee of Directions (TCD) of year-2006
Other Livestock DevelopmentSeed Production
130
No.of Fodder
Farms under
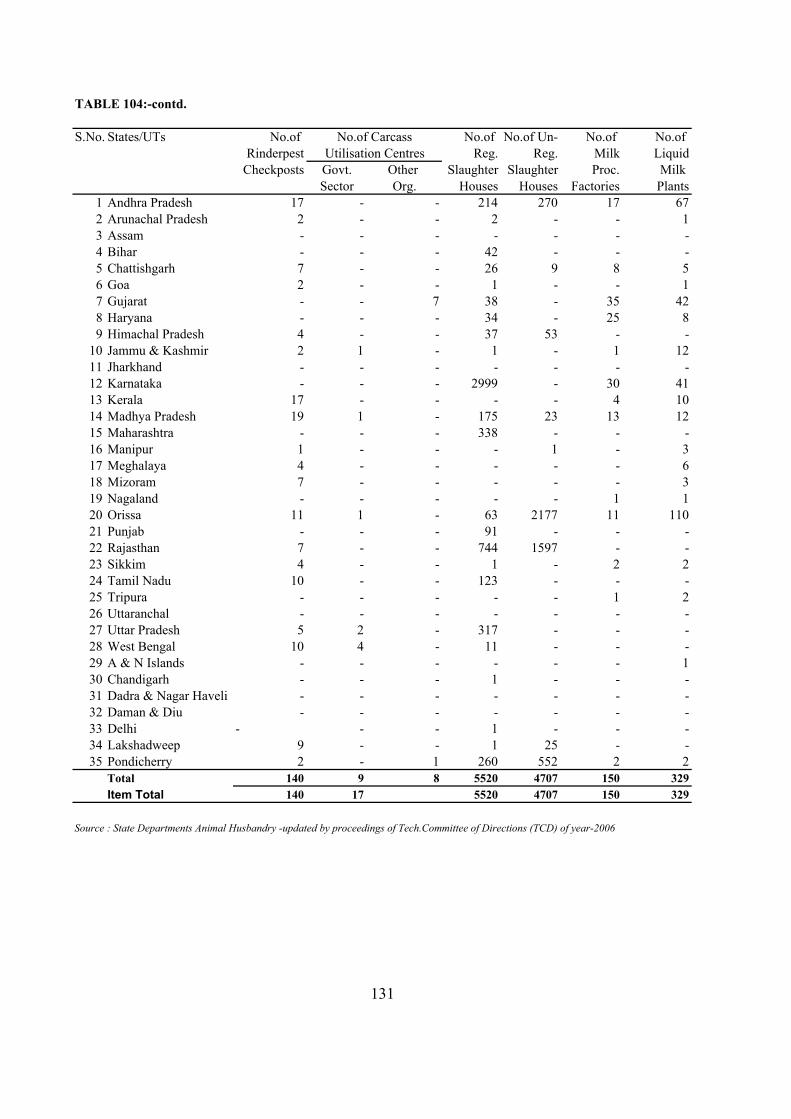
TABLE 104:-contd.
S.No. States/UTs No.of No.of No.of Un- No.of No.of Rinderpest Reg. Reg. Milk Liquid
Checkposts Govt. Other Slaughter Slaughter Proc. Milk Sector Org. Houses Houses Factories Plants
1 Andhra Pradesh 17 - - 214 270 17 672 Arunachal Pradesh 2 - - 2 - - 13 Assam - - - - - - -4 Bihar - - - 42 - - -5 Chattishgarh 7 - - 26 9 8 56 Goa 2 - - 1 - - 17 Gujarat - - 7 38 - 35 428 Haryana - - - 34 - 25 89 Himachal Pradesh 4 - - 37 53 - -
10 Jammu & Kashmir 2 1 - 1 - 1 1211 Jharkhand - - - - - - -12 Karnataka - - - 2999 - 30 4113 Kerala 17 - - - - 4 1014 Madhya Pradesh 19 1 - 175 23 13 1215 Maharashtra - - - 338 - - -16 Manipur 1 - - - 1 - 317 Meghalaya 4 - - - - - 618 Mizoram 7 - - - - - 319 Nagaland - - - - - 1 120 Orissa 11 1 - 63 2177 11 11021 Punjab - - - 91 - - -22 Rajasthan 7 - - 744 1597 - -23 Sikkim 4 - - 1 - 2 224 Tamil Nadu 10 - - 123 - - -25 Tripura - - - - - 1 226 Uttaranchal - - - - - - -27 Uttar Pradesh 5 2 - 317 - - -28 West Bengal 10 4 - 11 - - -29 A & N Islands - - - - - - 130 Chandigarh - - - 1 - - -31 Dadra & Nagar Haveli - - - - - - -32 Daman & Diu - - - - - - -33 Delhi - - - 1 - - -34 Lakshadweep 9 - - 1 25 - -35 Pondicherry 2 - 1 260 552 2 2
Total 140 9 8 5520 4707 150 329Item Total 140 17 5520 4707 150 329
Source : State Departments Animal Husbandry -updated by proceedings of Tech.Committee of Directions (TCD) of year-2006
131
No.of CarcassUtilisation Centres
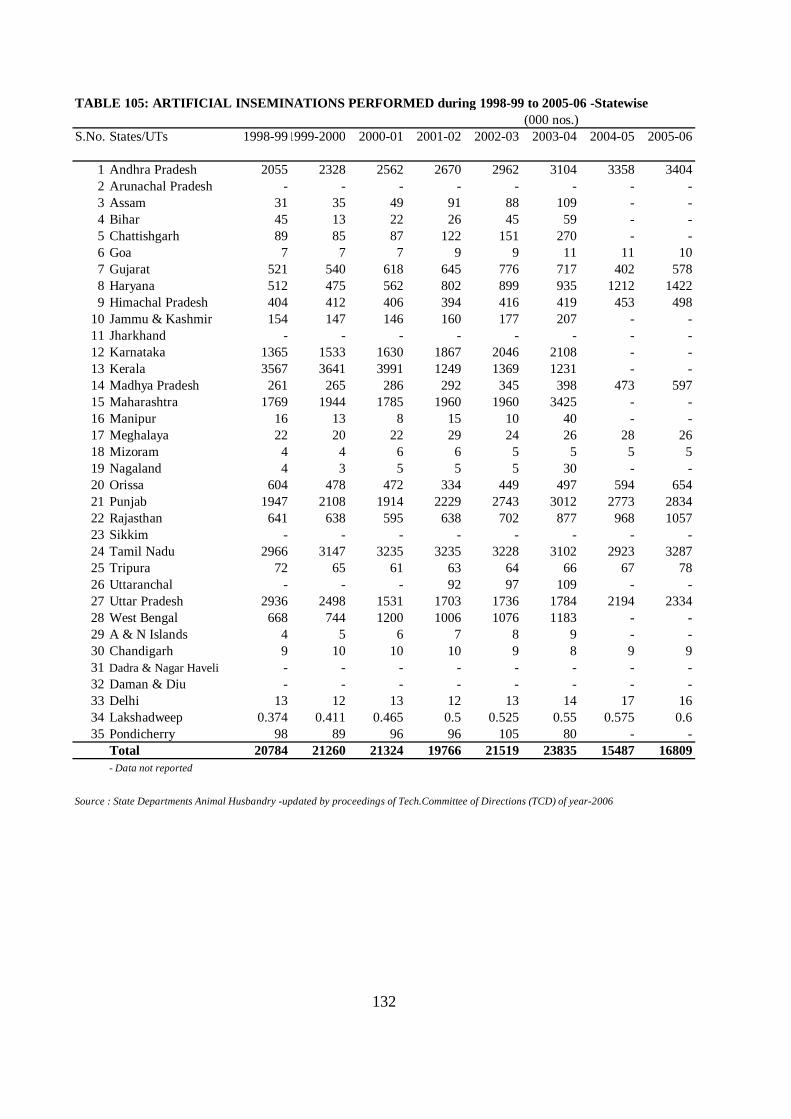
TABLE 105: ARTIFICIAL INSEMINATIONS PERFORMED during 1998-99 to 2005-06 -Statewise(000 nos.)
S.No. States/UTs 1998-99 1999-2000 2000-01 2001-02 2002-03 2003-04 2004-05 2005-06
1 Andhra Pradesh 2055 2328 2562 2670 2962 3104 3358 34042 Arunachal Pradesh - - - - - - - -3 Assam 31 35 49 91 88 109 - -4 Bihar 45 13 22 26 45 59 - -5 Chattishgarh 89 85 87 122 151 270 - -6 Goa 7 7 7 9 9 11 11 107 Gujarat 521 540 618 645 776 717 402 5788 Haryana 512 475 562 802 899 935 1212 14229 Himachal Pradesh 404 412 406 394 416 419 453 498
10 Jammu & Kashmir 154 147 146 160 177 207 - -11 Jharkhand - - - - - - - -12 Karnataka 1365 1533 1630 1867 2046 2108 - -13 Kerala 3567 3641 3991 1249 1369 1231 - -14 Madhya Pradesh 261 265 286 292 345 398 473 59715 Maharashtra 1769 1944 1785 1960 1960 3425 - -16 Manipur 16 13 8 15 10 40 - -17 Meghalaya 22 20 22 29 24 26 28 2618 Mizoram 4 4 6 6 5 5 5 519 Nagaland 4 3 5 5 5 30 - -20 Orissa 604 478 472 334 449 497 594 65421 Punjab 1947 2108 1914 2229 2743 3012 2773 283422 Rajasthan 641 638 595 638 702 877 968 105723 Sikkim - - - - - - - -24 Tamil Nadu 2966 3147 3235 3235 3228 3102 2923 328725 Tripura 72 65 61 63 64 66 67 7826 Uttaranchal - - - 92 97 109 - -27 Uttar Pradesh 2936 2498 1531 1703 1736 1784 2194 233428 West Bengal 668 744 1200 1006 1076 1183 - -29 A & N Islands 4 5 6 7 8 9 - -30 Chandigarh 9 10 10 10 9 8 9 931 Dadra & Nagar Haveli - - - - - - - -32 Daman & Diu - - - - - - - -33 Delhi 13 12 13 12 13 14 17 1634 Lakshadweep 0.374 0.411 0.465 0.5 0.525 0.55 0.575 0.635 Pondicherry 98 89 96 96 105 80 - -
Total 20784 21260 21324 19766 21519 23835 15487 16809- Data not reported
Source : State Departments Animal Husbandry -updated by proceedings of Tech.Committee of Directions (TCD) of year-2006
132
PART VIII
Dairying Statistics

TABLE 106: ACHIEVEMENT OF SOME OF THE KEY COMPONENTS OF DAIRY DEVELOPMENT IN DIFFERENT STATES UNDER COOPERATIVE SECTOR AS ON 31.3.2005
Sl. Name of the DCS Farmer Rural Milk Liquid Milk Processing No. State/ UT Organised* Members* Procurement sale Capacity
(no.) ('000) ('000 Kg. /Day) (000 L/Day) (000 L/Day)1 Andhra Pradesh 4561 762 1055 1028 21502 Assam 66 3 4 7 603 Bihar 5023 254 482 293 6664 Chattisgarh 445 20 18 305 Delhi - - - 2103 13506 Goa 174 19 51 90 757 Gujarat 11615 2428 5857 2226 67208 Haryana 5172 239 367 214 5309 Himachal Pradesh 387 20 28 16 40
10 Jharkhand 80 2 6 17311 Karnataka 9619 1809 2700 1597 253012 Kerala 3238 733 669 801 90513 Madhya Pradesh 4815 239 392 304 100014 Maharashtra 19192 1621 2698 2595 465015 Nagaland 76 3 3 4 1016 Orissa 1896 130 164 151 18517 Pondicherry 100 32 51 59 5018 Punjab 6893 409 780 501 154519 Rajasthan 10852 565 1470 874 129520 Sikkim 194 7 7 7 1521 Tamil Nadu 8031 1998 1981 1329 260122 Tripura 84 4 3 9 1023 Uttar Pradesh 18272 845 958 425 167024 West Bengal 2367 184 326 792 1600
Total 113152 12326 20070 15628 29657DCS- Dairy Cooperative Societies. * Organised (cumulative)Note :- Chattisgarh and Jharkhand started reporting separately from 2003-04.Source: Dairy Division, DAH&DF, M/O Agriculture.
133
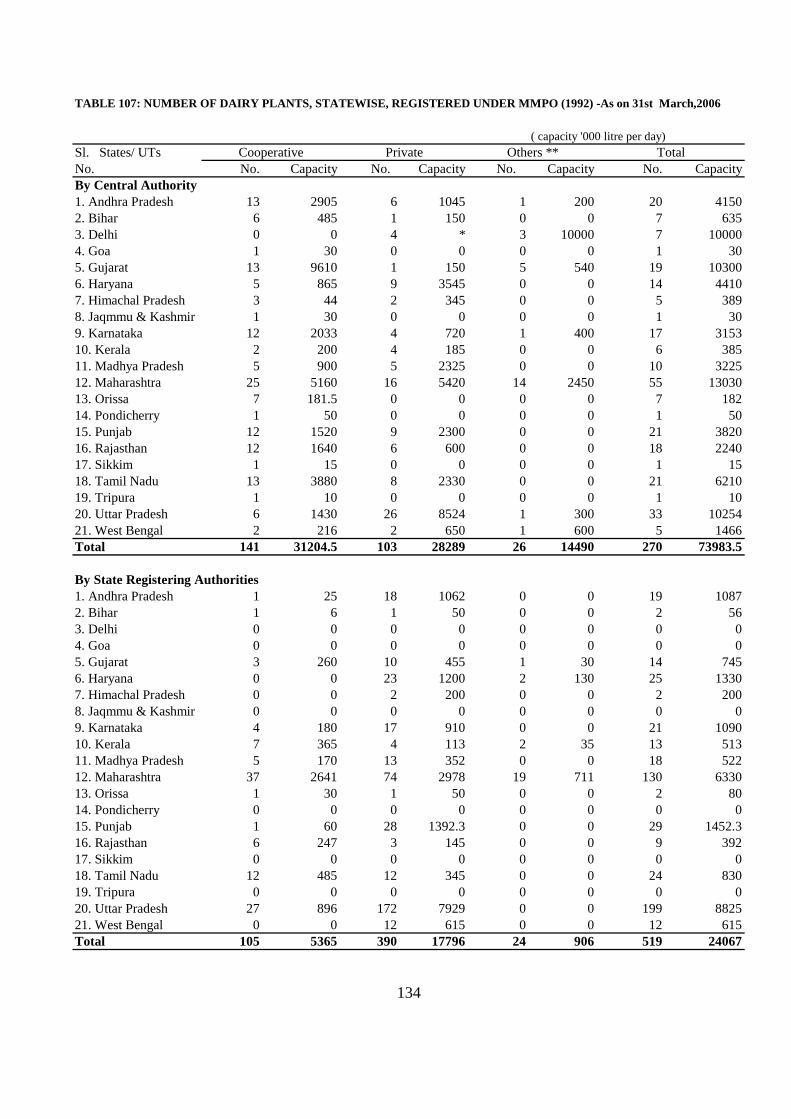
TABLE 107: NUMBER OF DAIRY PLANTS, STATEWISE, REGISTERED UNDER MMPO (1992) -As on 31st March,2006
( capacity '000 litre per day)Sl. States/ UTsNo. No. Capacity No. Capacity No. Capacity No. CapacityBy Central Authority1. Andhra Pradesh 13 2905 6 1045 1 200 20 41502. Bihar 6 485 1 150 0 0 7 6353. Delhi 0 0 4 * 3 10000 7 100004. Goa 1 30 0 0 0 0 1 305. Gujarat 13 9610 1 150 5 540 19 103006. Haryana 5 865 9 3545 0 0 14 44107. Himachal Pradesh 3 44 2 345 0 0 5 3898. Jaqmmu & Kashmir 1 30 0 0 0 0 1 309. Karnataka 12 2033 4 720 1 400 17 315310. Kerala 2 200 4 185 0 0 6 38511. Madhya Pradesh 5 900 5 2325 0 0 10 322512. Maharashtra 25 5160 16 5420 14 2450 55 1303013. Orissa 7 181.5 0 0 0 0 7 18214. Pondicherry 1 50 0 0 0 0 1 5015. Punjab 12 1520 9 2300 0 0 21 382016. Rajasthan 12 1640 6 600 0 0 18 224017. Sikkim 1 15 0 0 0 0 1 1518. Tamil Nadu 13 3880 8 2330 0 0 21 621019. Tripura 1 10 0 0 0 0 1 1020. Uttar Pradesh 6 1430 26 8524 1 300 33 1025421. West Bengal 2 216 2 650 1 600 5 1466Total 141 31204.5 103 28289 26 14490 270 73983.5
By State Registering Authorities1. Andhra Pradesh 1 25 18 1062 0 0 19 10872. Bihar 1 6 1 50 0 0 2 563. Delhi 0 0 0 0 0 0 0 04. Goa 0 0 0 0 0 0 0 05. Gujarat 3 260 10 455 1 30 14 7456. Haryana 0 0 23 1200 2 130 25 13307. Himachal Pradesh 0 0 2 200 0 0 2 2008. Jaqmmu & Kashmir 0 0 0 0 0 0 0 09. Karnataka 4 180 17 910 0 0 21 109010. Kerala 7 365 4 113 2 35 13 51311. Madhya Pradesh 5 170 13 352 0 0 18 52212. Maharashtra 37 2641 74 2978 19 711 130 633013. Orissa 1 30 1 50 0 0 2 8014. Pondicherry 0 0 0 0 0 0 0 015. Punjab 1 60 28 1392.3 0 0 29 1452.316. Rajasthan 6 247 3 145 0 0 9 39217. Sikkim 0 0 0 0 0 0 0 018. Tamil Nadu 12 485 12 345 0 0 24 83019. Tripura 0 0 0 0 0 0 0 020. Uttar Pradesh 27 896 172 7929 0 0 199 882521. West Bengal 0 0 12 615 0 0 12 615Total 105 5365 390 17796 24 906 519 24067
134
Cooperative Private Others ** Total
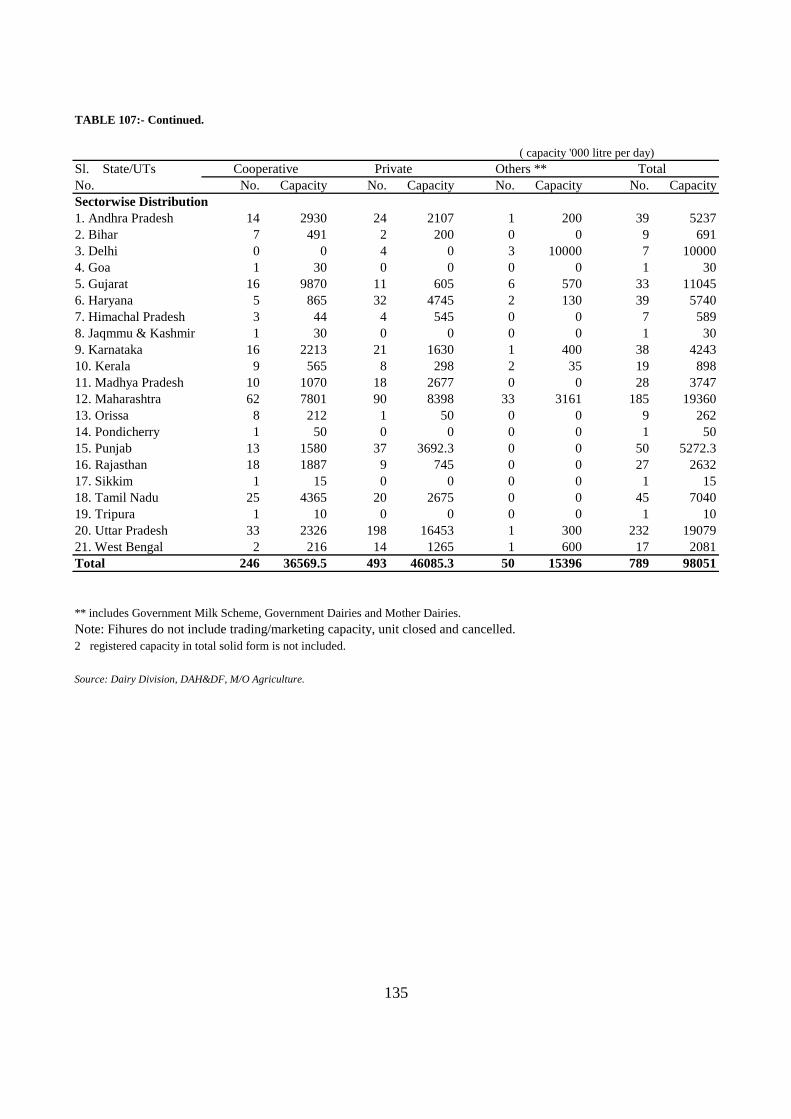
TABLE 107:- Continued.
( capacity '000 litre per day)Sl. State/UTsNo. No. Capacity No. Capacity No. Capacity No. CapacitySectorwise Distribution1. Andhra Pradesh 14 2930 24 2107 1 200 39 52372. Bihar 7 491 2 200 0 0 9 6913. Delhi 0 0 4 0 3 10000 7 100004. Goa 1 30 0 0 0 0 1 305. Gujarat 16 9870 11 605 6 570 33 110456. Haryana 5 865 32 4745 2 130 39 57407. Himachal Pradesh 3 44 4 545 0 0 7 5898. Jaqmmu & Kashmir 1 30 0 0 0 0 1 309. Karnataka 16 2213 21 1630 1 400 38 424310. Kerala 9 565 8 298 2 35 19 89811. Madhya Pradesh 10 1070 18 2677 0 0 28 374712. Maharashtra 62 7801 90 8398 33 3161 185 1936013. Orissa 8 212 1 50 0 0 9 26214. Pondicherry 1 50 0 0 0 0 1 5015. Punjab 13 1580 37 3692.3 0 0 50 5272.316. Rajasthan 18 1887 9 745 0 0 27 263217. Sikkim 1 15 0 0 0 0 1 1518. Tamil Nadu 25 4365 20 2675 0 0 45 704019. Tripura 1 10 0 0 0 0 1 1020. Uttar Pradesh 33 2326 198 16453 1 300 232 1907921. West Bengal 2 216 14 1265 1 600 17 2081Total 246 36569.5 493 46085.3 50 15396 789 98051
** includes Government Milk Scheme, Government Dairies and Mother Dairies.Note: Fihures do not include trading/marketing capacity, unit closed and cancelled.2 registered capacity in total solid form is not included.
Source: Dairy Division, DAH&DF, M/O Agriculture.
135
Cooperative Private Others ** Total
PART IX
Miscellaneous
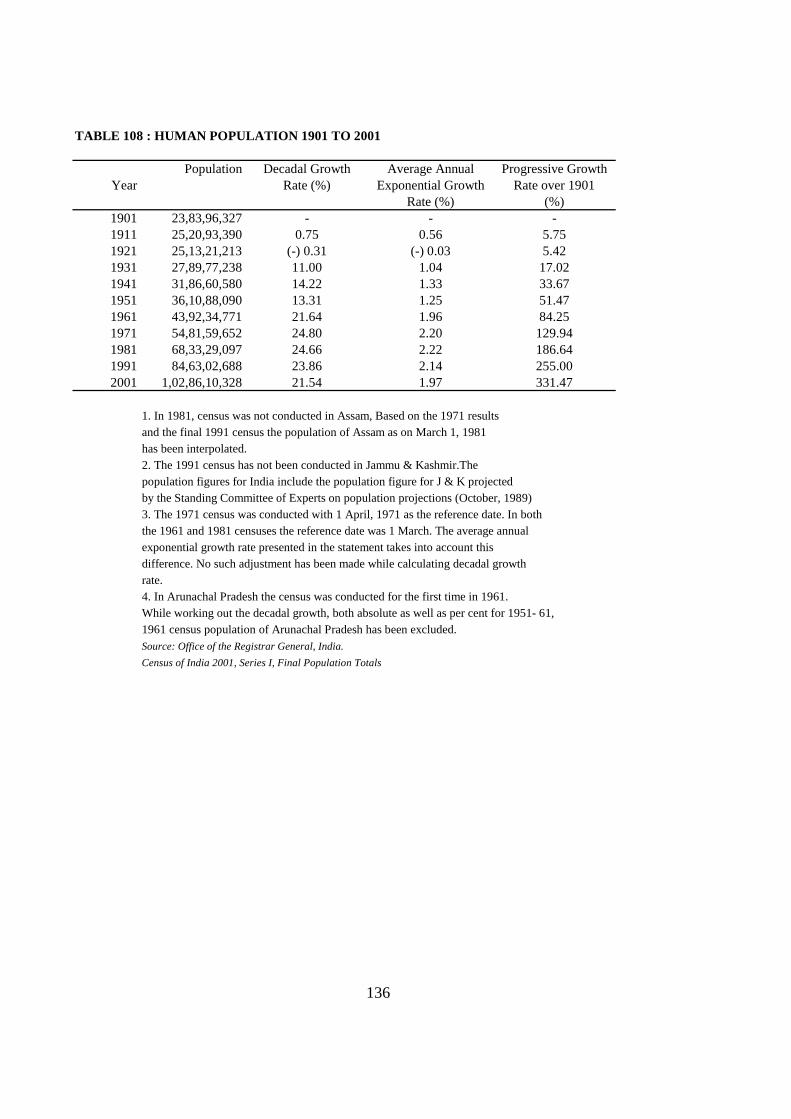
TABLE 108 : HUMAN POPULATION 1901 TO 2001
Population Decadal Growth Average Annual Progressive GrowthYear Rate (%) Exponential Growth Rate over 1901
Rate (%) (%)1901 23,83,96,327 - - -1911 25,20,93,390 0.75 0.56 5.751921 25,13,21,213 (-) 0.31 (-) 0.03 5.421931 27,89,77,238 11.00 1.04 17.021941 31,86,60,580 14.22 1.33 33.671951 36,10,88,090 13.31 1.25 51.471961 43,92,34,771 21.64 1.96 84.251971 54,81,59,652 24.80 2.20 129.941981 68,33,29,097 24.66 2.22 186.641991 84,63,02,688 23.86 2.14 255.002001 1,02,86,10,328 21.54 1.97 331.47
1. In 1981, census was not conducted in Assam, Based on the 1971 resultsand the final 1991 census the population of Assam as on March 1, 1981has been interpolated.2. The 1991 census has not been conducted in Jammu & Kashmir.Thepopulation figures for India include the population figure for J & K projectedby the Standing Committee of Experts on population projections (October, 1989)3. The 1971 census was conducted with 1 April, 1971 as the reference date. In boththe 1961 and 1981 censuses the reference date was 1 March. The average annualexponential growth rate presented in the statement takes into account thisdifference. No such adjustment has been made while calculating decadal growthrate.4. In Arunachal Pradesh the census was conducted for the first time in 1961.While working out the decadal growth, both absolute as well as per cent for 1951- 61,1961 census population of Arunachal Pradesh has been excluded.Source: Office of the Registrar General, India.Census of India 2001, Series I, Final Population Totals
136
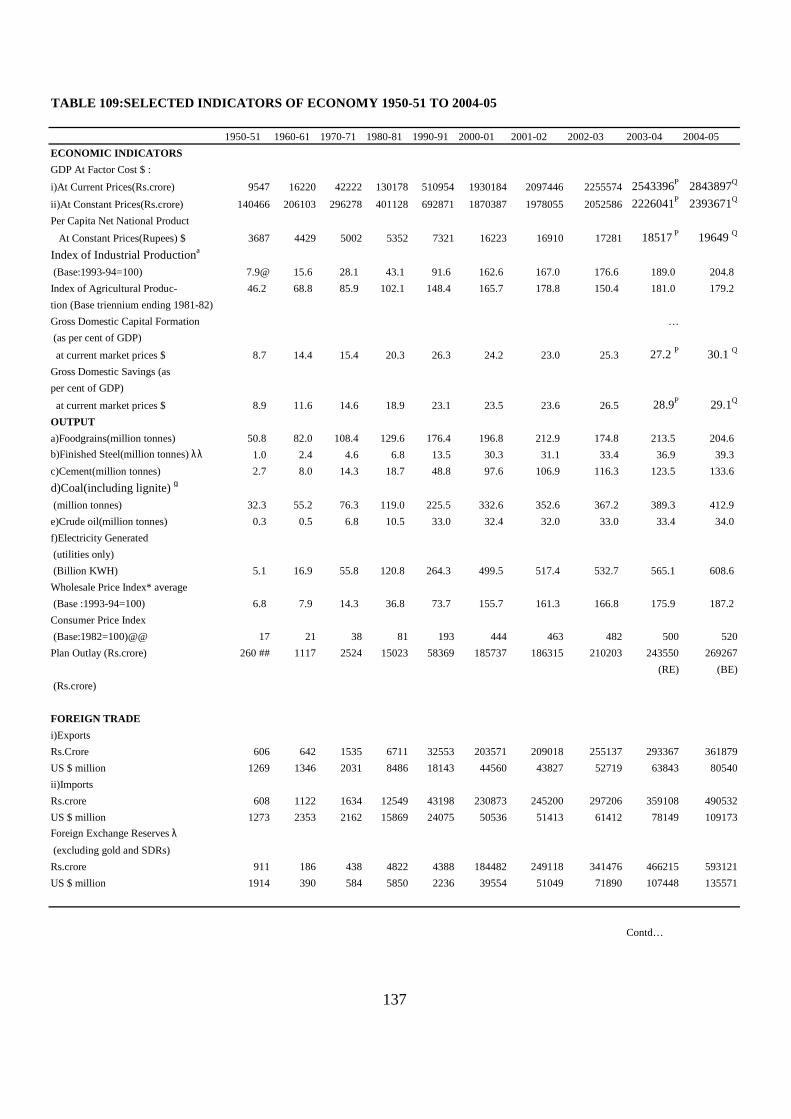
TABLE 109:SELECTED INDICATORS OF ECONOMY 1950-51 TO 2004-05
1950-51 1960-61 1970-71 1980-81 1990-91 2000-01 2001-02 2002-03 2003-04 2004-05ECONOMIC INDICATORSGDP At Factor Cost $ :i)At Current Prices(Rs.crore) 9547 16220 42222 130178 510954 1930184 2097446 2255574 2543396P 2843897Q
ii)At Constant Prices(Rs.crore) 140466 206103 296278 401128 692871 1870387 1978055 2052586 2226041P 2393671Q
Per Capita Net National Product At Constant Prices(Rupees) $ 3687 4429 5002 5352 7321 16223 16910 17281 18517 P 19649 Q
Index of Industrial Productiona
(Base:1993-94=100) 7.9@ 15.6 28.1 43.1 91.6 162.6 167.0 176.6 189.0 204.8Index of Agricultural Produc- 46.2 68.8 85.9 102.1 148.4 165.7 178.8 150.4 181.0 179.2tion (Base triennium ending 1981-82)Gross Domestic Capital Formation … (as per cent of GDP) at current market prices $ 8.7 14.4 15.4 20.3 26.3 24.2 23.0 25.3 27.2 P 30.1 Q
Gross Domestic Savings (asper cent of GDP) at current market prices $ 8.9 11.6 14.6 18.9 23.1 23.5 23.6 26.5 28.9P 29.1Q
OUTPUTa)Foodgrains(million tonnes) 50.8 82.0 108.4 129.6 176.4 196.8 212.9 174.8 213.5 204.6b)Finished Steel(million tonnes) λλ 1.0 2.4 4.6 6.8 13.5 30.3 31.1 33.4 36.9 39.3c)Cement(million tonnes) 2.7 8.0 14.3 18.7 48.8 97.6 106.9 116.3 123.5 133.6d)Coal(including lignite) g
(million tonnes) 32.3 55.2 76.3 119.0 225.5 332.6 352.6 367.2 389.3 412.9e)Crude oil(million tonnes) 0.3 0.5 6.8 10.5 33.0 32.4 32.0 33.0 33.4 34.0f)Electricity Generated (utilities only) (Billion KWH) 5.1 16.9 55.8 120.8 264.3 499.5 517.4 532.7 565.1 608.6Wholesale Price Index* average (Base :1993-94=100) 6.8 7.9 14.3 36.8 73.7 155.7 161.3 166.8 175.9 187.2Consumer Price Index (Base:1982=100)@@ 17 21 38 81 193 444 463 482 500 520Plan Outlay (Rs.crore) 260 ## 1117 2524 15023 58369 185737 186315 210203 243550 269267
(RE) (BE) (Rs.crore)
FOREIGN TRADEi)ExportsRs.Crore 606 642 1535 6711 32553 203571 209018 255137 293367 361879US $ million 1269 1346 2031 8486 18143 44560 43827 52719 63843 80540ii)ImportsRs.crore 608 1122 1634 12549 43198 230873 245200 297206 359108 490532US $ million 1273 2353 2162 15869 24075 50536 51413 61412 78149 109173Foreign Exchange Reserves λ
(excluding gold and SDRs)Rs.crore 911 186 438 4822 4388 184482 249118 341476 466215 593121US $ million 1914 390 584 5850 2236 39554 51049 71890 107448 135571
Contd…
137
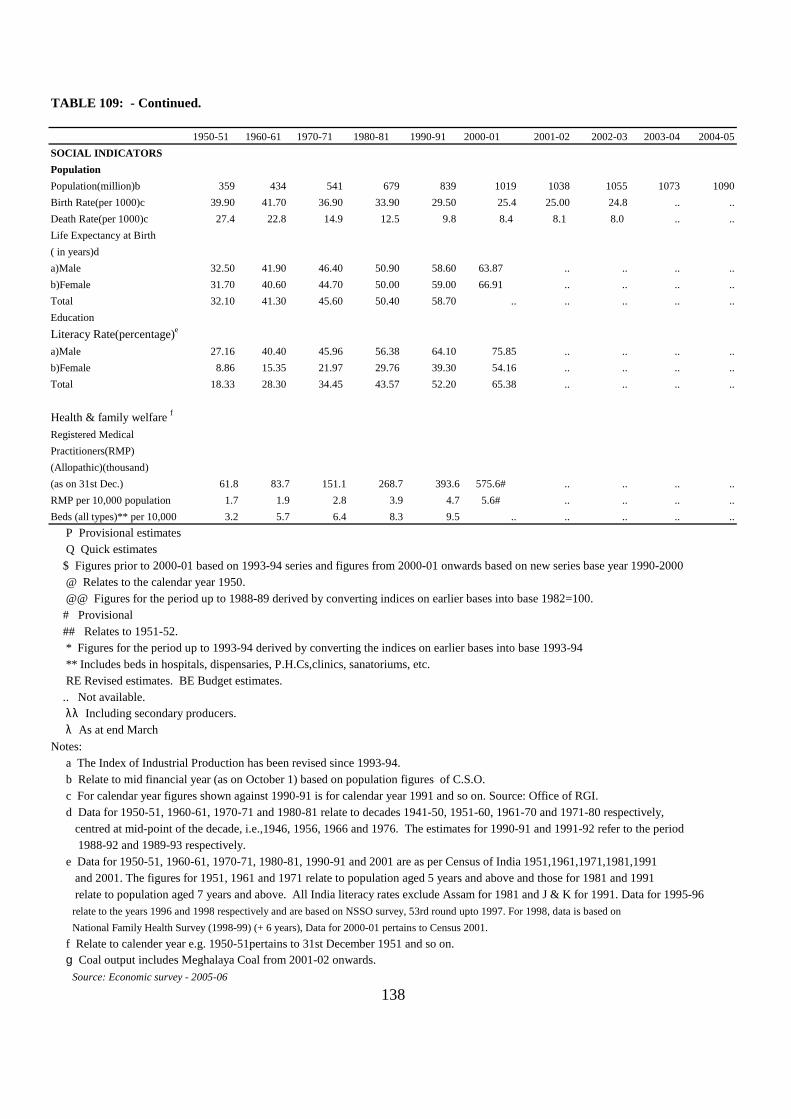
TABLE 109: - Continued.
1950-51 1960-61 1970-71 1980-81 1990-91 2000-01 2001-02 2002-03 2003-04 2004-05SOCIAL INDICATORSPopulationPopulation(million)b 359 434 541 679 839 1019 1038 1055 1073 1090Birth Rate(per 1000)c 39.90 41.70 36.90 33.90 29.50 25.4 25.00 24.8 .. ..Death Rate(per 1000)c 27.4 22.8 14.9 12.5 9.8 8.4 8.1 8.0 .. ..Life Expectancy at Birth( in years)da)Male 32.50 41.90 46.40 50.90 58.60 63.87 .. .. .. ..b)Female 31.70 40.60 44.70 50.00 59.00 66.91 .. .. .. ..Total 32.10 41.30 45.60 50.40 58.70 .. .. .. .. ..EducationLiteracy Rate(percentage)e
a)Male 27.16 40.40 45.96 56.38 64.10 75.85 .. .. .. ..b)Female 8.86 15.35 21.97 29.76 39.30 54.16 .. .. .. ..Total 18.33 28.30 34.45 43.57 52.20 65.38 .. .. .. ..
Health & family welfare f
Registered MedicalPractitioners(RMP)(Allopathic)(thousand)(as on 31st Dec.) 61.8 83.7 151.1 268.7 393.6 575.6# .. .. .. ..RMP per 10,000 population 1.7 1.9 2.8 3.9 4.7 5.6# .. .. .. ..Beds (all types)** per 10,000 3.2 5.7 6.4 8.3 9.5 .. .. .. .. .. P Provisional estimates Q Quick estimates $ Figures prior to 2000-01 based on 1993-94 series and figures from 2000-01 onwards based on new series base year 1990-2000 @ Relates to the calendar year 1950. @@ Figures for the period up to 1988-89 derived by converting indices on earlier bases into base 1982=100. # Provisional ## Relates to 1951-52. * Figures for the period up to 1993-94 derived by converting the indices on earlier bases into base 1993-94 ** Includes beds in hospitals, dispensaries, P.H.Cs,clinics, sanatoriums, etc. RE Revised estimates. BE Budget estimates. .. Not available.
λλ Including secondary producers.λ As at end March
Notes: a The Index of Industrial Production has been revised since 1993-94. b Relate to mid financial year (as on October 1) based on population figures of C.S.O. c For calendar year figures shown against 1990-91 is for calendar year 1991 and so on. Source: Office of RGI. d Data for 1950-51, 1960-61, 1970-71 and 1980-81 relate to decades 1941-50, 1951-60, 1961-70 and 1971-80 respectively, centred at mid-point of the decade, i.e.,1946, 1956, 1966 and 1976. The estimates for 1990-91 and 1991-92 refer to the period 1988-92 and 1989-93 respectively. e Data for 1950-51, 1960-61, 1970-71, 1980-81, 1990-91 and 2001 are as per Census of India 1951,1961,1971,1981,1991 and 2001. The figures for 1951, 1961 and 1971 relate to population aged 5 years and above and those for 1981 and 1991 relate to population aged 7 years and above. All India literacy rates exclude Assam for 1981 and J & K for 1991. Data for 1995-96 relate to the years 1996 and 1998 respectively and are based on NSSO survey, 53rd round upto 1997. For 1998, data is based on National Family Health Survey (1998-99) (+ 6 years), Data for 2000-01 pertains to Census 2001. f Relate to calender year e.g. 1950-51pertains to 31st December 1951 and so on.
g Coal output includes Meghalaya Coal from 2001-02 onwards. Source: Economic survey - 2005-06
138
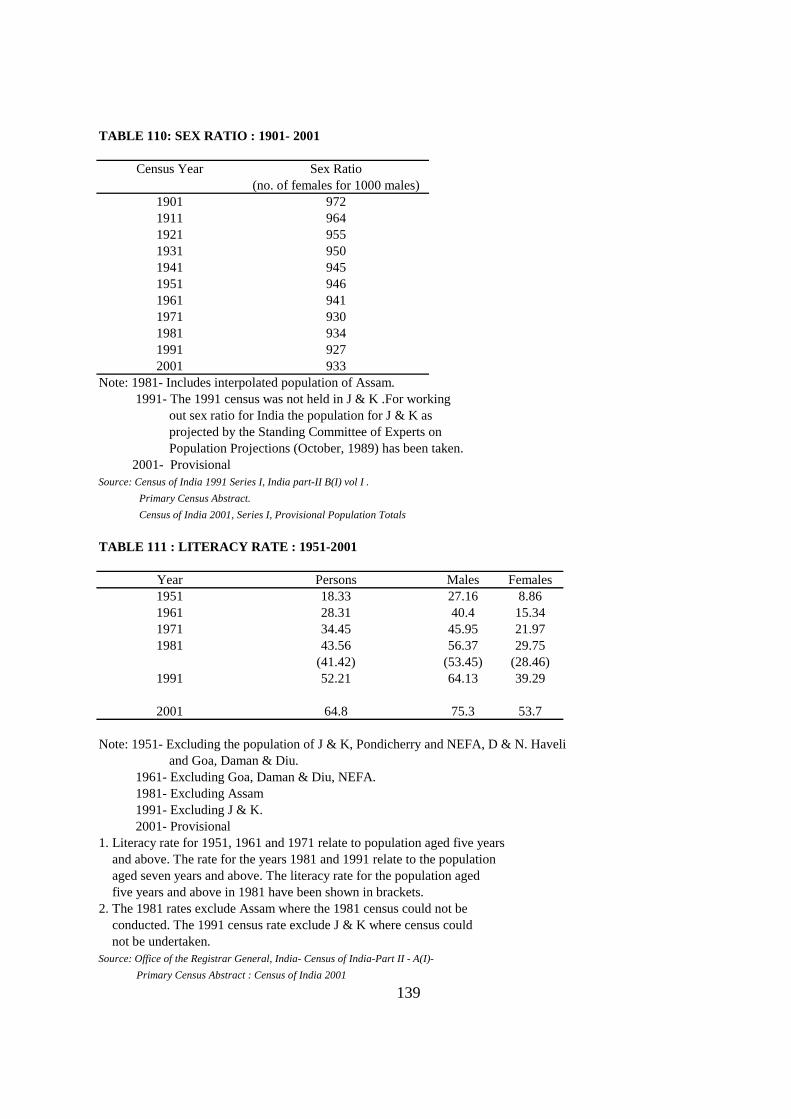
TABLE 110: SEX RATIO : 1901- 2001
Census Year Sex Ratio(no. of females for 1000 males)
1901 9721911 9641921 9551931 9501941 9451951 9461961 9411971 9301981 9341991 9272001 933
Note: 1981- Includes interpolated population of Assam. 1991- The 1991 census was not held in J & K .For working out sex ratio for India the population for J & K as projected by the Standing Committee of Experts on Population Projections (October, 1989) has been taken. 2001- ProvisionalSource: Census of India 1991 Series I, India part-II B(I) vol I . Primary Census Abstract. Census of India 2001, Series I, Provisional Population Totals
TABLE 111 : LITERACY RATE : 1951-2001
Year Persons Males Females1951 18.33 27.16 8.861961 28.31 40.4 15.341971 34.45 45.95 21.971981 43.56 56.37 29.75
(41.42) (53.45) (28.46)1991 52.21 64.13 39.29
2001 64.8 75.3 53.7
Note: 1951- Excluding the population of J & K, Pondicherry and NEFA, D & N. Haveli and Goa, Daman & Diu. 1961- Excluding Goa, Daman & Diu, NEFA. 1981- Excluding Assam 1991- Excluding J & K. 2001- Provisional1. Literacy rate for 1951, 1961 and 1971 relate to population aged five years and above. The rate for the years 1981 and 1991 relate to the population aged seven years and above. The literacy rate for the population aged five years and above in 1981 have been shown in brackets.2. The 1981 rates exclude Assam where the 1981 census could not be conducted. The 1991 census rate exclude J & K where census could not be undertaken.Source: Office of the Registrar General, India- Census of India-Part II - A(I)- Primary Census Abstract : Census of India 2001
139
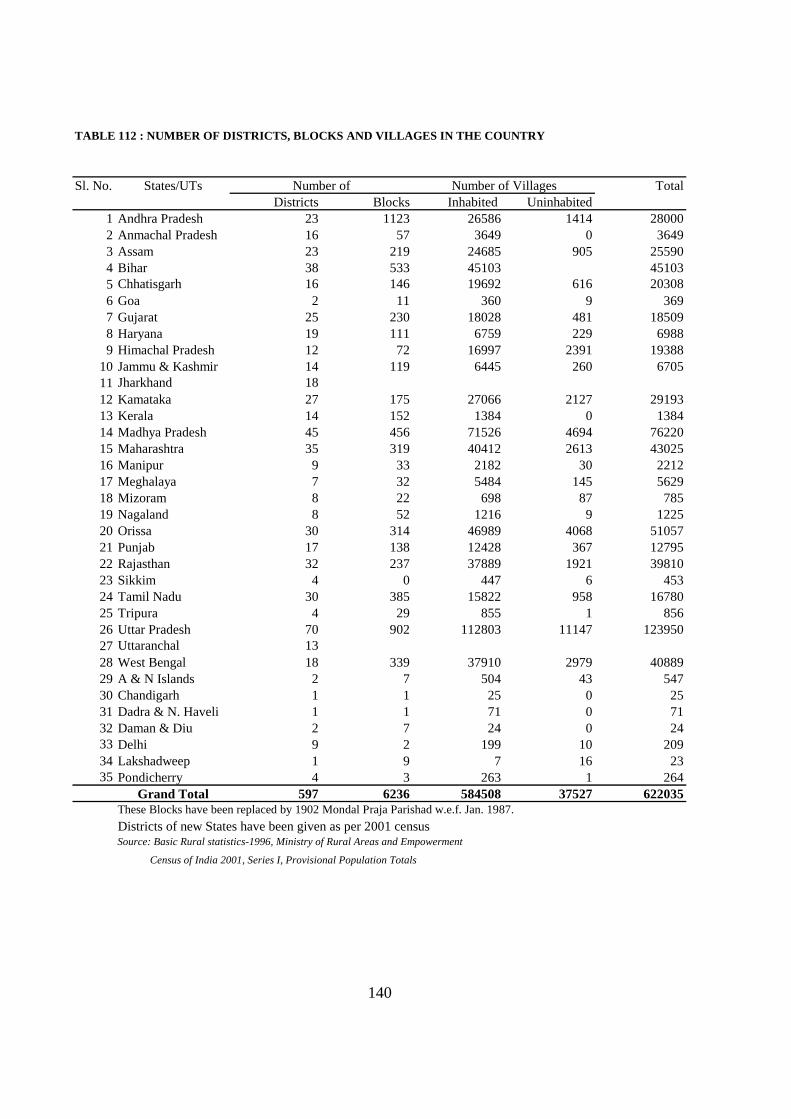
TABLE 112 : NUMBER OF DISTRICTS, BLOCKS AND VILLAGES IN THE COUNTRY
Sl. No. States/UTs Number of TotalDistricts Blocks Inhabited Uninhabited
1 Andhra Pradesh 23 1123 26586 1414 280002 Anmachal Pradesh 16 57 3649 0 36493 Assam 23 219 24685 905 255904 Bihar 38 533 45103 451035 Chhatisgarh 16 146 19692 616 203086 Goa 2 11 360 9 3697 Gujarat 25 230 18028 481 185098 Haryana 19 111 6759 229 69889 Himachal Pradesh 12 72 16997 2391 19388
10 Jammu & Kashmir 14 119 6445 260 670511 Jharkhand 1812 Kamataka 27 175 27066 2127 2919313 Kerala 14 152 1384 0 138414 Madhya Pradesh 45 456 71526 4694 7622015 Maharashtra 35 319 40412 2613 4302516 Manipur 9 33 2182 30 221217 Meghalaya 7 32 5484 145 562918 Mizoram 8 22 698 87 78519 Nagaland 8 52 1216 9 122520 Orissa 30 314 46989 4068 5105721 Punjab 17 138 12428 367 1279522 Rajasthan 32 237 37889 1921 3981023 Sikkim 4 0 447 6 45324 Tamil Nadu 30 385 15822 958 1678025 Tripura 4 29 855 1 85626 Uttar Pradesh 70 902 112803 11147 12395027 Uttaranchal 1328 West Bengal 18 339 37910 2979 4088929 A & N Islands 2 7 504 43 54730 Chandigarh 1 1 25 0 2531 Dadra & N. Haveli 1 1 71 0 7132 Daman & Diu 2 7 24 0 2433 Delhi 9 2 199 10 20934 Lakshadweep 1 9 7 16 2335 Pondicherry 4 3 263 1 264
Grand Total 597 6236 584508 37527 622035These Blocks have been replaced by 1902 Mondal Praja Parishad w.e.f. Jan. 1987.Districts of new States have been given as per 2001 censusSource: Basic Rural statistics-1996, Ministry of Rural Areas and Empowerment
Census of India 2001, Series I, Provisional Population Totals
140
Number of Villages
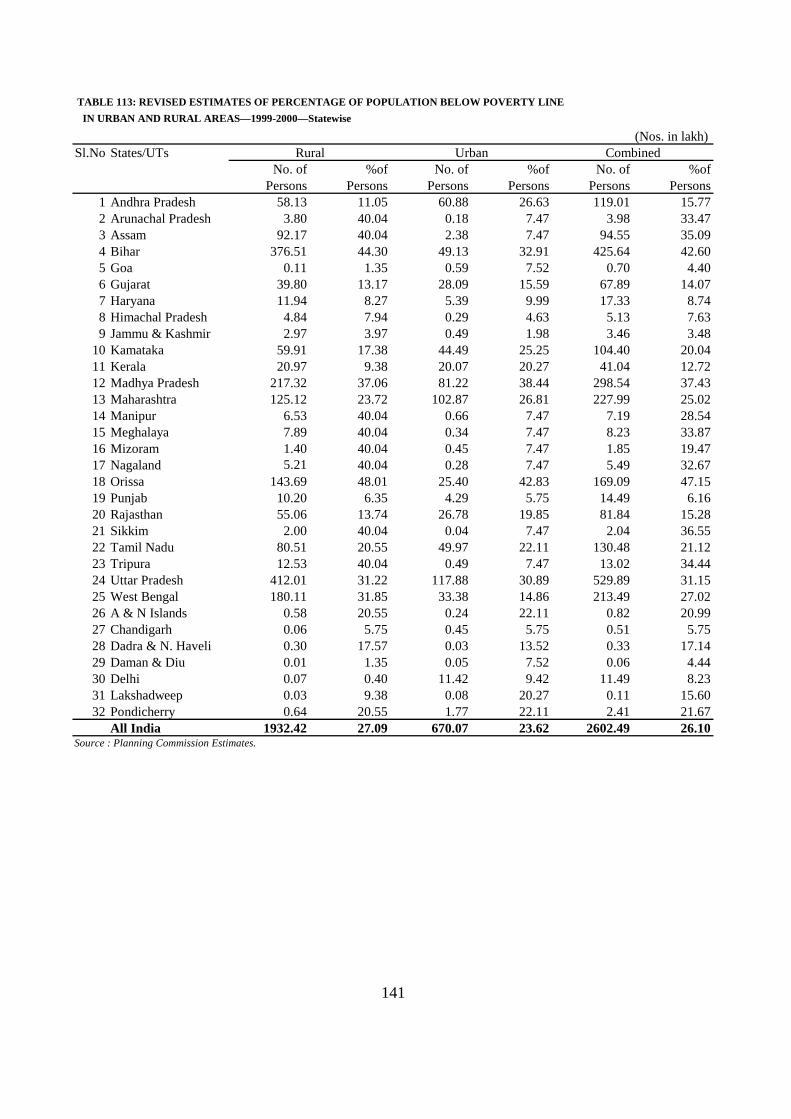
TABLE 113: REVISED ESTIMATES OF PERCENTAGE OF POPULATION BELOW POVERTY LINE IN URBAN AND RURAL AREAS—1999-2000—Statewise
(Nos. in lakh)Sl.No States/UTs Rural Urban Combined
No. of %of No. of %of No. of %ofPersons Persons Persons Persons Persons Persons
1 Andhra Pradesh 58.13 11.05 60.88 26.63 119.01 15.772 Arunachal Pradesh 3.80 40.04 0.18 7.47 3.98 33.473 Assam 92.17 40.04 2.38 7.47 94.55 35.094 Bihar 376.51 44.30 49.13 32.91 425.64 42.605 Goa 0.11 1.35 0.59 7.52 0.70 4.406 Gujarat 39.80 13.17 28.09 15.59 67.89 14.077 Haryana 11.94 8.27 5.39 9.99 17.33 8.748 Himachal Pradesh 4.84 7.94 0.29 4.63 5.13 7.639 Jammu & Kashmir 2.97 3.97 0.49 1.98 3.46 3.48
10 Kamataka 59.91 17.38 44.49 25.25 104.40 20.0411 Kerala 20.97 9.38 20.07 20.27 41.04 12.7212 Madhya Pradesh 217.32 37.06 81.22 38.44 298.54 37.4313 Maharashtra 125.12 23.72 102.87 26.81 227.99 25.0214 Manipur 6.53 40.04 0.66 7.47 7.19 28.5415 Meghalaya 7.89 40.04 0.34 7.47 8.23 33.8716 Mizoram 1.40 40.04 0.45 7.47 1.85 19.4717 Nagaland 5.21 40.04 0.28 7.47 5.49 32.6718 Orissa 143.69 48.01 25.40 42.83 169.09 47.1519 Punjab 10.20 6.35 4.29 5.75 14.49 6.1620 Rajasthan 55.06 13.74 26.78 19.85 81.84 15.2821 Sikkim 2.00 40.04 0.04 7.47 2.04 36.5522 Tamil Nadu 80.51 20.55 49.97 22.11 130.48 21.1223 Tripura 12.53 40.04 0.49 7.47 13.02 34.4424 Uttar Pradesh 412.01 31.22 117.88 30.89 529.89 31.1525 West Bengal 180.11 31.85 33.38 14.86 213.49 27.0226 A & N Islands 0.58 20.55 0.24 22.11 0.82 20.9927 Chandigarh 0.06 5.75 0.45 5.75 0.51 5.7528 Dadra & N. Haveli 0.30 17.57 0.03 13.52 0.33 17.1429 Daman & Diu 0.01 1.35 0.05 7.52 0.06 4.4430 Delhi 0.07 0.40 11.42 9.42 11.49 8.2331 Lakshadweep 0.03 9.38 0.08 20.27 0.11 15.6032 Pondicherry 0.64 20.55 1.77 22.11 2.41 21.67
All India 1932.42 27.09 670.07 23.62 2602.49 26.10Source : Planning Commission Estimates.
141
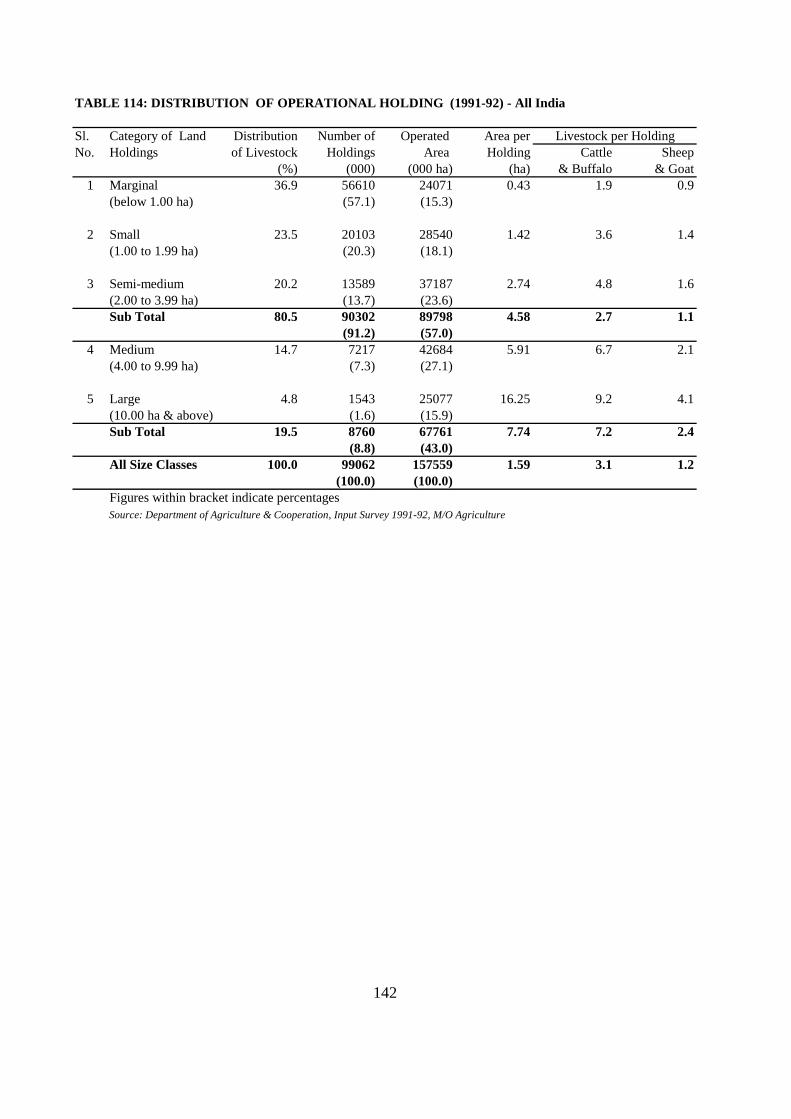
TABLE 114: DISTRIBUTION OF OPERATIONAL HOLDING (1991-92) - All India
Sl. Category of Land Distribution Number of Operated Area perNo. Holdings of Livestock Holdings Area Holding Cattle Sheep
(%) (000) (000 ha) (ha) & Buffalo & Goat1 Marginal 36.9 56610 24071 0.43 1.9 0.9
(below 1.00 ha) (57.1) (15.3)
2 Small 23.5 20103 28540 1.42 3.6 1.4(1.00 to 1.99 ha) (20.3) (18.1)
3 Semi-medium 20.2 13589 37187 2.74 4.8 1.6(2.00 to 3.99 ha) (13.7) (23.6)Sub Total 80.5 90302 89798 4.58 2.7 1.1
(91.2) (57.0)4 Medium 14.7 7217 42684 5.91 6.7 2.1
(4.00 to 9.99 ha) (7.3) (27.1)
5 Large 4.8 1543 25077 16.25 9.2 4.1(10.00 ha & above) (1.6) (15.9)Sub Total 19.5 8760 67761 7.74 7.2 2.4
(8.8) (43.0)All Size Classes 100.0 99062 157559 1.59 3.1 1.2
(100.0) (100.0)Figures within bracket indicate percentagesSource: Department of Agriculture & Cooperation, Input Survey 1991-92, M/O Agriculture
Livestock per Holding
142
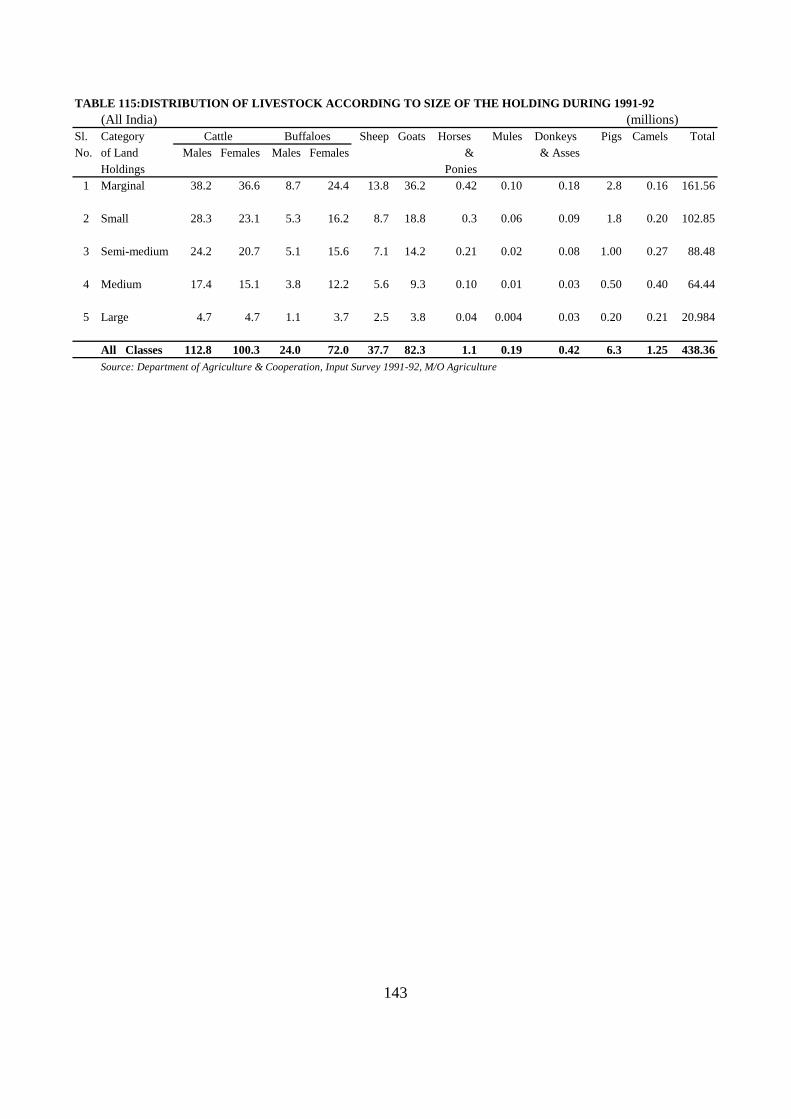
TABLE 115:DISTRIBUTION OF LIVESTOCK ACCORDING TO SIZE OF THE HOLDING DURING 1991-92(All India) (millions)
Sl. Category Sheep Goats Horses Mules Donkeys Pigs Camels TotalNo. of Land Males Females Males Females & & Asses
Holdings Ponies1 Marginal 38.2 36.6 8.7 24.4 13.8 36.2 0.42 0.10 0.18 2.8 0.16 161.56
2 Small 28.3 23.1 5.3 16.2 8.7 18.8 0.3 0.06 0.09 1.8 0.20 102.85
3 Semi-medium 24.2 20.7 5.1 15.6 7.1 14.2 0.21 0.02 0.08 1.00 0.27 88.48
4 Medium 17.4 15.1 3.8 12.2 5.6 9.3 0.10 0.01 0.03 0.50 0.40 64.44
5 Large 4.7 4.7 1.1 3.7 2.5 3.8 0.04 0.004 0.03 0.20 0.21 20.984
All Classes 112.8 100.3 24.0 72.0 37.7 82.3 1.1 0.19 0.42 6.3 1.25 438.36Source: Department of Agriculture & Cooperation, Input Survey 1991-92, M/O Agriculture
143
Cattle Buffaloes

TABLE 116: NUMBER AND AREA OF THE OPERATIONAL HOLDINGS IN INDIA FROM 1970-71 TO 1995-96
Sl. No. Item 1970-71 1976-77 1980-81 1985-86 1990-91 1995-96
1 Number of Operational 71.00 81.57 88.90 97.2 106.6 115.6Holdings (million)
(14.9) (8.9) (9.3) (9.7) (8.4)2 Area Operated 162.10 163.30 163.80 164.60 165.5 163.3
(million hectare) (0.8) (0.3) (0.5) (0.6) (-1.3)Note : Figures in bracket indicate the percentage increase over previous census.
Source: Department of Agriculture & Cooperation, M/O Agriculture
TABLE 117: DISTRIBUTION OF NUMBER OF OPERATIONAL HOLDINGS AND AREA OPERATED IN INDIA BY MAJOR SIZE CLASSES OF HOLDINGS IN 1990-91 AND 1995-96
(numbers in 000's )(area in 000' ha)
Sl. No. Major Size Classes Percentage Area Operated during PercentageChange in Change in
1990-91 1990-911990-91 1995-96 over 1990-91 1995-96 over
1985-86 1985-861 Marginal 63389 71179 +12.3 24894 28121 +13.0
(59.4) (61.6) (15.0) (17.2)2 Small 20092 21643 +7.7 28827 30722 +6.6
(18.8) (18.7) (17.4) (18.8)3 Semi- medium 13923 14261 +2.4 38375 38953 +1.5
(13.1) (12.4) (23.2) (23.9)4 Medium 7580 7092 -6.4 44752 41398 -7.5
(7.1) (6.1) (27.1) (25.3)5 Large 1654 1404 -15.1 28639 24163 -15.6
(1.6) (1.2) (17.3) (14.8)All Size Classes 106637 115580 +8.4 165507 163357 -1.3
(100.0) (100.0) (100.0) (100.0)Note : Figures in bracket indicate the percentage of respective columns.Source: Department of Agriculture & Cooperation, M/O Agriculture
144
Number of Holdingsduring

TABLE 118 :AVERAGE SIZE OF HOLDING BY MAJOR SIZE CLASSES IN INDIA DURING ALL AGRICULTURE CENSUS YEARS
SL Major Size PercentageNo. Classes 1970-71 1976-77 1980-81 1985-86 1990-91 1995-96 Change in
1995-96 over1990-91
1 Marginal 0.40 0.39 0.39 0.39 0.39 0.40 1.92 Small 1.44 1.42 1.44 1.43 1.43 1.42 -1.03 Semi-medium 281.00 2.78 2.78 2.77 2.76 2.73 -1.04 Medium 6.08 6.04 6.02 5.96 5.90 5.84 -1.15 Large 18.10 17.57 17.41 17.21 17.33 17.21 -0.7
All classes 2.28 2.00 1.84 1.69 1.35 1.41 4.4
Source : Agricultural Census —Deptt. of Agri. and Cooperation. Ministry of Agriculture.
TABLE 119: PERCENTAGE DISTRIBUTION OF AREA UNDER FODDER AND GREEN MANURES BY MAJOR SIZE CLASSES IN INDIA -1985-86 AND 1990 -91
Sl Major SizeNo. Classes
1985-86 1990-91 % 1985-86 1990-91 % 1985-86 1990-91 %Increase Increase Increase
1 Marginal 12.9 15 16.3 5.9 6 1.7 7 7.7 10.02 Small 13.7 16.8 22.6 8.1 9.8 21.0 9 11.1 23.33 Semi-medium 22 27.2 23.6 15 15.8 5.3 16.1 18 11.84 Medium 36.5 28.3 -22.5 13.3 29.3 120.3 32.1 29 -9.75 Large 14.9 12.7 -14.8 39.7 39.3 -1.0 35.9 34.2 -4.7
All Classes 100 100 100 100 100 100Source : All India Report on Agricultural Census - 1990-91 —Deptt. of Agri. and Cooperation. Ministry of Agriculture.
145
Average Size of Holding (in hectares) during
Percentage Area Under Fodder and Green ManuresIrrigated Unirrigated Total
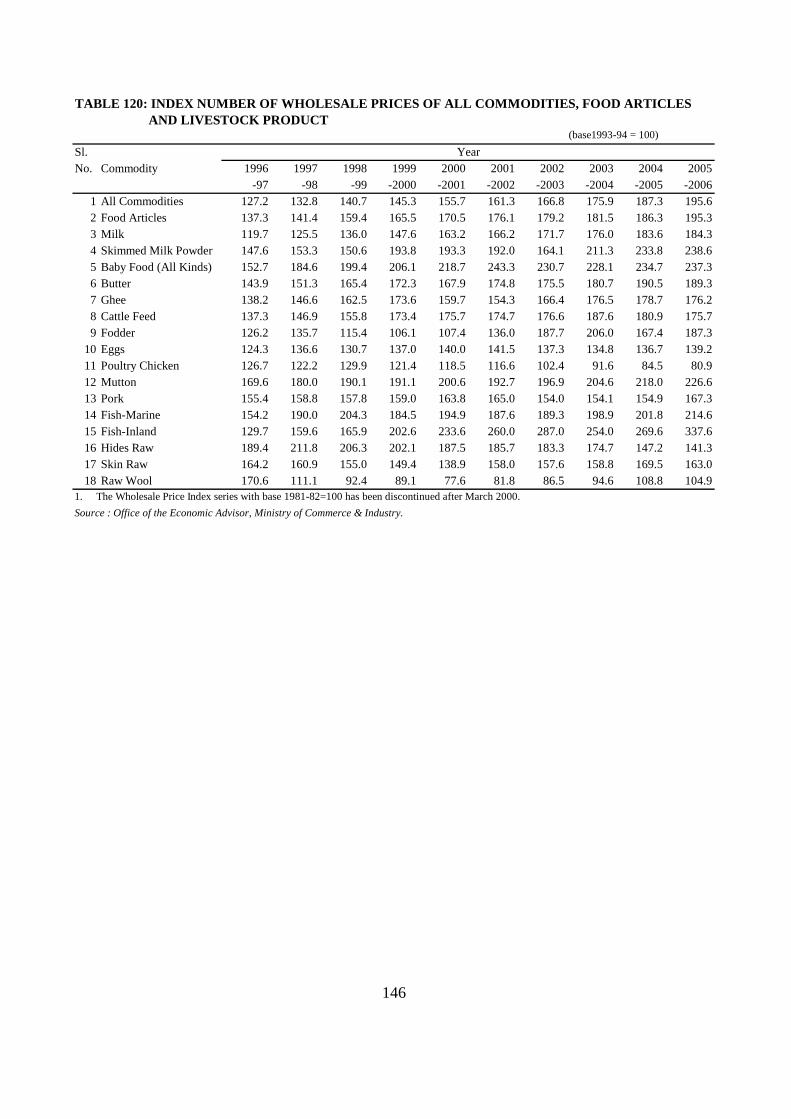
TABLE 120: INDEX NUMBER OF WHOLESALE PRICES OF ALL COMMODITIES, FOOD ARTICLES AND LIVESTOCK PRODUCT
(base1993-94 = 100)Sl.No. Commodity 1996 1997 1998 1999 2000 2001 2002 2003 2004 2005
-97 -98 -99 -2000 -2001 -2002 -2003 -2004 -2005 -20061 All Commodities 127.2 132.8 140.7 145.3 155.7 161.3 166.8 175.9 187.3 195.62 Food Articles 137.3 141.4 159.4 165.5 170.5 176.1 179.2 181.5 186.3 195.33 Milk 119.7 125.5 136.0 147.6 163.2 166.2 171.7 176.0 183.6 184.34 Skimmed Milk Powder 147.6 153.3 150.6 193.8 193.3 192.0 164.1 211.3 233.8 238.65 Baby Food (All Kinds) 152.7 184.6 199.4 206.1 218.7 243.3 230.7 228.1 234.7 237.36 Butter 143.9 151.3 165.4 172.3 167.9 174.8 175.5 180.7 190.5 189.37 Ghee 138.2 146.6 162.5 173.6 159.7 154.3 166.4 176.5 178.7 176.28 Cattle Feed 137.3 146.9 155.8 173.4 175.7 174.7 176.6 187.6 180.9 175.79 Fodder 126.2 135.7 115.4 106.1 107.4 136.0 187.7 206.0 167.4 187.3
10 Eggs 124.3 136.6 130.7 137.0 140.0 141.5 137.3 134.8 136.7 139.211 Poultry Chicken 126.7 122.2 129.9 121.4 118.5 116.6 102.4 91.6 84.5 80.912 Mutton 169.6 180.0 190.1 191.1 200.6 192.7 196.9 204.6 218.0 226.613 Pork 155.4 158.8 157.8 159.0 163.8 165.0 154.0 154.1 154.9 167.314 Fish-Marine 154.2 190.0 204.3 184.5 194.9 187.6 189.3 198.9 201.8 214.615 Fish-Inland 129.7 159.6 165.9 202.6 233.6 260.0 287.0 254.0 269.6 337.616 Hides Raw 189.4 211.8 206.3 202.1 187.5 185.7 183.3 174.7 147.2 141.317 Skin Raw 164.2 160.9 155.0 149.4 138.9 158.0 157.6 158.8 169.5 163.018 Raw Wool 170.6 111.1 92.4 89.1 77.6 81.8 86.5 94.6 108.8 104.9
1. The Wholesale Price Index series with base 1981-82=100 has been discontinued after March 2000.Source : Office of the Economic Advisor, Ministry of Commerce & Industry.
146
Year
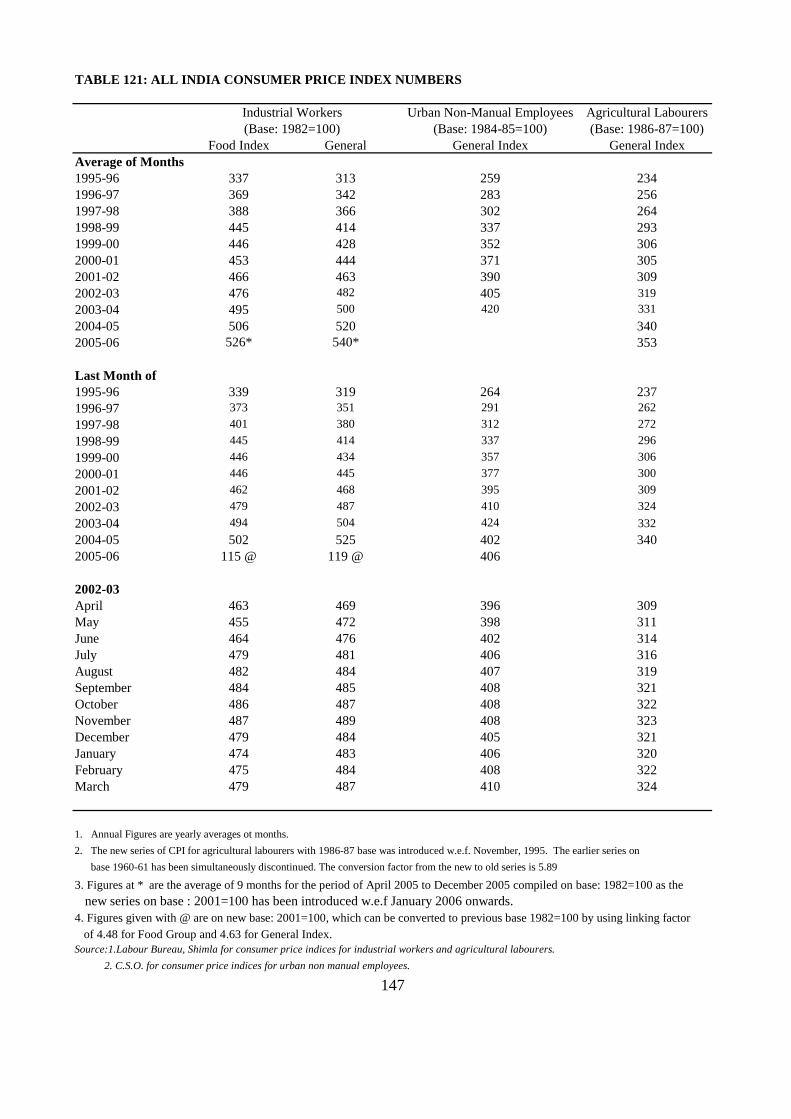
TABLE 121: ALL INDIA CONSUMER PRICE INDEX NUMBERS
Urban Non-Manual Employees Agricultural Labourers(Base: 1984-85=100) (Base: 1986-87=100)
Food Index General General Index General IndexAverage of Months1995-96 337 313 259 2341996-97 369 342 283 2561997-98 388 366 302 2641998-99 445 414 337 2931999-00 446 428 352 3062000-01 453 444 371 3052001-02 466 463 390 3092002-03 476 482 405 3192003-04 495 500 420 3312004-05 506 520 3402005-06 526* 540* 353
Last Month of1995-96 339 319 264 2371996-97 373 351 291 2621997-98 401 380 312 2721998-99 445 414 337 2961999-00 446 434 357 3062000-01 446 445 377 3002001-02 462 468 395 3092002-03 479 487 410 3242003-04 494 504 424 3322004-05 502 525 402 3402005-06 115 @ 119 @ 406
2002-03April 463 469 396 309May 455 472 398 311June 464 476 402 314July 479 481 406 316August 482 484 407 319September 484 485 408 321October 486 487 408 322November 487 489 408 323December 479 484 405 321January 474 483 406 320February 475 484 408 322March 479 487 410 324
1. Annual Figures are yearly averages ot months.2. The new series of CPI for agricultural labourers with 1986-87 base was introduced w.e.f. November, 1995. The earlier series on base 1960-61 has been simultaneously discontinued. The conversion factor from the new to old series is 5.89
3. Figures at * are the average of 9 months for the period of April 2005 to December 2005 compiled on base: 1982=100 as the new series on base : 2001=100 has been introduced w.e.f January 2006 onwards.4. Figures given with @ are on new base: 2001=100, which can be converted to previous base 1982=100 by using linking factor of 4.48 for Food Group and 4.63 for General Index.Source:1.Labour Bureau, Shimla for consumer price indices for industrial workers and agricultural labourers. 2. C.S.O. for consumer price indices for urban non manual employees.
147
Industrial Workers(Base: 1982=100)
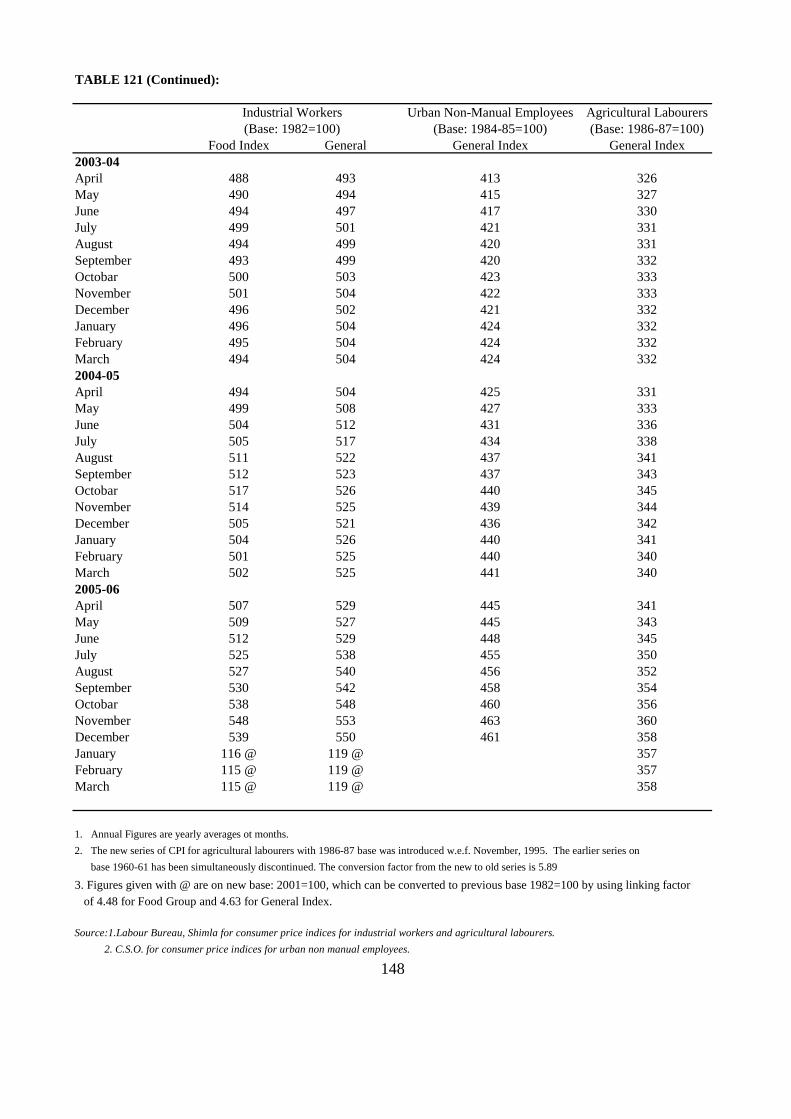
TABLE 121 (Continued):
Urban Non-Manual Employees Agricultural Labourers(Base: 1984-85=100) (Base: 1986-87=100)
Food Index General General Index General Index2003-04April 488 493 413 326May 490 494 415 327June 494 497 417 330July 499 501 421 331August 494 499 420 331September 493 499 420 332Octobar 500 503 423 333November 501 504 422 333December 496 502 421 332January 496 504 424 332February 495 504 424 332March 494 504 424 3322004-05April 494 504 425 331May 499 508 427 333June 504 512 431 336July 505 517 434 338August 511 522 437 341September 512 523 437 343Octobar 517 526 440 345November 514 525 439 344December 505 521 436 342January 504 526 440 341February 501 525 440 340March 502 525 441 3402005-06April 507 529 445 341May 509 527 445 343June 512 529 448 345July 525 538 455 350August 527 540 456 352September 530 542 458 354Octobar 538 548 460 356November 548 553 463 360December 539 550 461 358January 116 @ 119 @ 357February 115 @ 119 @ 357March 115 @ 119 @ 358
1. Annual Figures are yearly averages ot months.2. The new series of CPI for agricultural labourers with 1986-87 base was introduced w.e.f. November, 1995. The earlier series on base 1960-61 has been simultaneously discontinued. The conversion factor from the new to old series is 5.89
3. Figures given with @ are on new base: 2001=100, which can be converted to previous base 1982=100 by using linking factor of 4.48 for Food Group and 4.63 for General Index.
Source:1.Labour Bureau, Shimla for consumer price indices for industrial workers and agricultural labourers. 2. C.S.O. for consumer price indices for urban non manual employees.
148
Industrial Workers(Base: 1982=100)
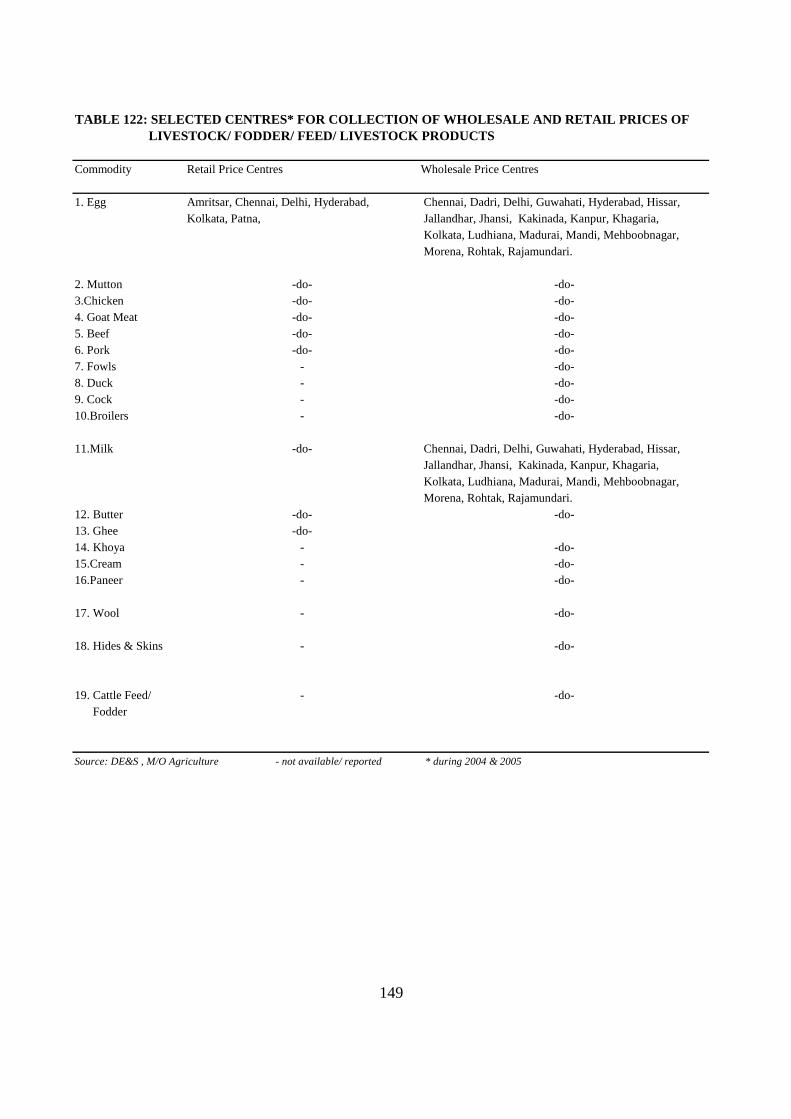
TABLE 122: SELECTED CENTRES* FOR COLLECTION OF WHOLESALE AND RETAIL PRICES OF LIVESTOCK/ FODDER/ FEED/ LIVESTOCK PRODUCTS
Commodity Retail Price Centres Wholesale Price Centres
1. Egg Amritsar, Chennai, Delhi, Hyderabad, Chennai, Dadri, Delhi, Guwahati, Hyderabad, Hissar,Kolkata, Patna, Jallandhar, Jhansi, Kakinada, Kanpur, Khagaria,
Kolkata, Ludhiana, Madurai, Mandi, Mehboobnagar, Morena, Rohtak, Rajamundari.
2. Mutton -do- -do-3.Chicken -do- -do-4. Goat Meat -do- -do-5. Beef -do- -do-6. Pork -do- -do-7. Fowls - -do-8. Duck - -do-9. Cock - -do-10.Broilers - -do-
11.Milk -do- Chennai, Dadri, Delhi, Guwahati, Hyderabad, Hissar, Jallandhar, Jhansi, Kakinada, Kanpur, Khagaria, Kolkata, Ludhiana, Madurai, Mandi, Mehboobnagar, Morena, Rohtak, Rajamundari.
12. Butter -do- -do-13. Ghee -do-14. Khoya - -do-15.Cream - -do-16.Paneer - -do-
17. Wool - -do-
18. Hides & Skins - -do-
19. Cattle Feed/ - -do- Fodder
Source: DE&S , M/O Agriculture - not available/ reported * during 2004 & 2005
149
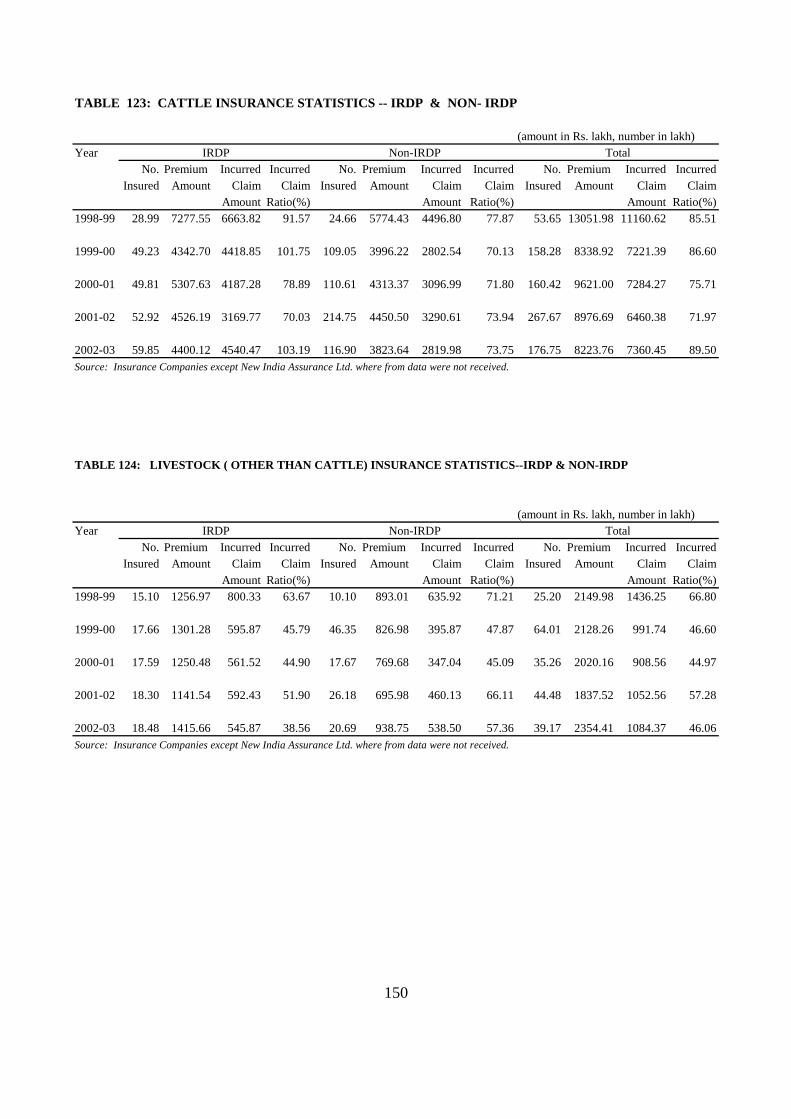
TABLE 123: CATTLE INSURANCE STATISTICS -- IRDP & NON- IRDP
(amount in Rs. lakh, number in lakh)Year
No. Premium Incurred Incurred No. Premium Incurred Incurred No. Premium Incurred IncurredInsured Amount Claim Claim Insured Amount Claim Claim Insured Amount Claim Claim
Amount Ratio(%) Amount Ratio(%) Amount Ratio(%)1998-99 28.99 7277.55 6663.82 91.57 24.66 5774.43 4496.80 77.87 53.65 13051.98 11160.62 85.51
1999-00 49.23 4342.70 4418.85 101.75 109.05 3996.22 2802.54 70.13 158.28 8338.92 7221.39 86.60
2000-01 49.81 5307.63 4187.28 78.89 110.61 4313.37 3096.99 71.80 160.42 9621.00 7284.27 75.71
2001-02 52.92 4526.19 3169.77 70.03 214.75 4450.50 3290.61 73.94 267.67 8976.69 6460.38 71.97
2002-03 59.85 4400.12 4540.47 103.19 116.90 3823.64 2819.98 73.75 176.75 8223.76 7360.45 89.50Source: Insurance Companies except New India Assurance Ltd. where from data were not received.
TABLE 124: LIVESTOCK ( OTHER THAN CATTLE) INSURANCE STATISTICS--IRDP & NON-IRDP
(amount in Rs. lakh, number in lakh)Year
No. Premium Incurred Incurred No. Premium Incurred Incurred No. Premium Incurred IncurredInsured Amount Claim Claim Insured Amount Claim Claim Insured Amount Claim Claim
Amount Ratio(%) Amount Ratio(%) Amount Ratio(%)1998-99 15.10 1256.97 800.33 63.67 10.10 893.01 635.92 71.21 25.20 2149.98 1436.25 66.80
1999-00 17.66 1301.28 595.87 45.79 46.35 826.98 395.87 47.87 64.01 2128.26 991.74 46.60
2000-01 17.59 1250.48 561.52 44.90 17.67 769.68 347.04 45.09 35.26 2020.16 908.56 44.97
2001-02 18.30 1141.54 592.43 51.90 26.18 695.98 460.13 66.11 44.48 1837.52 1052.56 57.28
2002-03 18.48 1415.66 545.87 38.56 20.69 938.75 538.50 57.36 39.17 2354.41 1084.37 46.06Source: Insurance Companies except New India Assurance Ltd. where from data were not received.
IRDP Non-IRDP Total
150
TotalIRDP Non-IRDP

TABLE 125: LIVESTOCK ( INCLUDING CATTLE) INSURANCE STATISTICS--IRDP & NON-IRDP
(amount in Rs. lakh, number in lakh)Year
No. Premium Incurred Incurred No. Premium Incurred Incurred No. Premium Incurred IncurredInsured Amount Claim Claim Insured Amount Claim Claim Insured Amount Claim Claim
Amount Ratio(%) Amount Ratio(%) Amount Ratio(%)1998-99 44.09 8534.52 7464.15 87.46 78.85 15201.96 12596.87 82.86 122.94 23736.48 20061.02 84.52
1999-00 66.89 5643.98 5014.72 88.85 222.29 10467.18 8213.13 78.47 289.18 16111.16 13227.85 82.10
2000-01 67.40 6558.11 4748.80 72.41 195.68 11641.16 8192.83 70.38 263.08 18199.27 12941.63 71.11
2001-02 71.22 5667.73 3762.20 66.38 312.15 10814.21 7512.94 69.47 383.37 16481.94 11275.14 68.41
2002-03 78.33 5815.78 5086.34 87.46 215.92 10578.17 8444.82 79.83 294.25 16393.95 13531.16 82.54Source: Insurance Companies except New India Assurance Ltd. where from data were not received.
151
TotalIRDP Non-IRDP
Part X
World Statistics
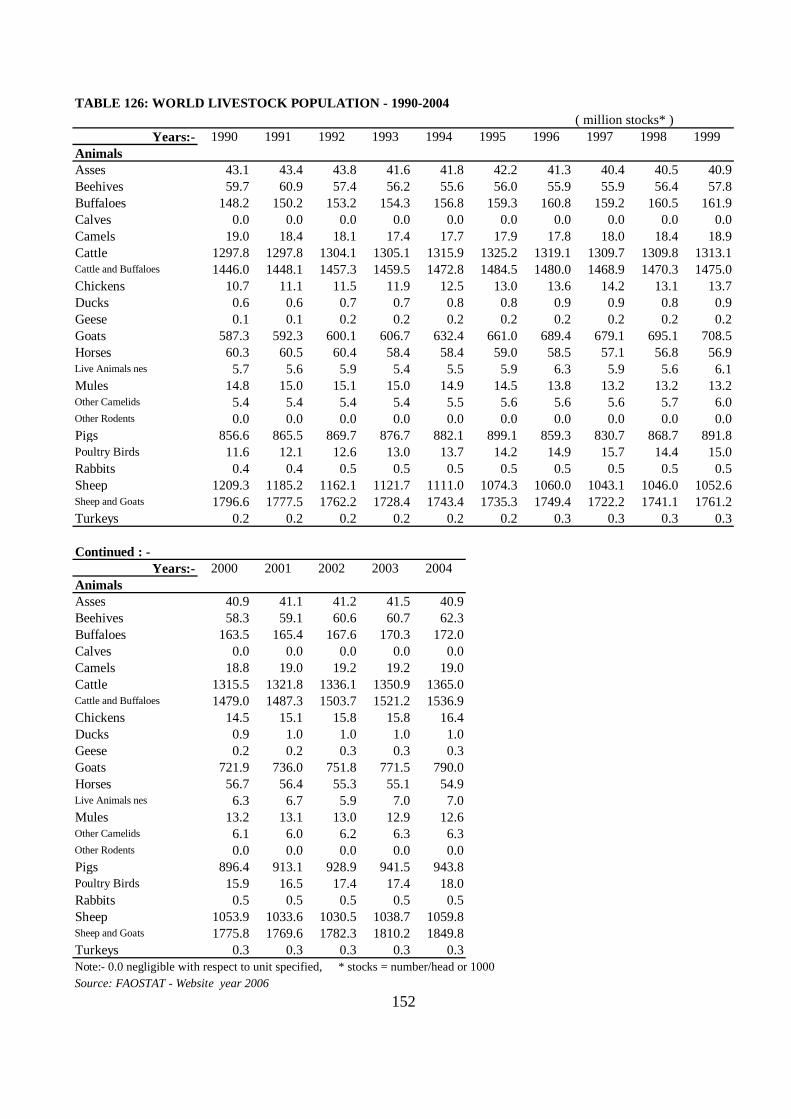
TABLE 126: WORLD LIVESTOCK POPULATION - 1990-2004( million stocks* )
Years:- 1990 1991 1992 1993 1994 1995 1996 1997 1998 1999AnimalsAsses 43.1 43.4 43.8 41.6 41.8 42.2 41.3 40.4 40.5 40.9Beehives 59.7 60.9 57.4 56.2 55.6 56.0 55.9 55.9 56.4 57.8Buffaloes 148.2 150.2 153.2 154.3 156.8 159.3 160.8 159.2 160.5 161.9Calves 0.0 0.0 0.0 0.0 0.0 0.0 0.0 0.0 0.0 0.0Camels 19.0 18.4 18.1 17.4 17.7 17.9 17.8 18.0 18.4 18.9Cattle 1297.8 1297.8 1304.1 1305.1 1315.9 1325.2 1319.1 1309.7 1309.8 1313.1Cattle and Buffaloes 1446.0 1448.1 1457.3 1459.5 1472.8 1484.5 1480.0 1468.9 1470.3 1475.0Chickens 10.7 11.1 11.5 11.9 12.5 13.0 13.6 14.2 13.1 13.7Ducks 0.6 0.6 0.7 0.7 0.8 0.8 0.9 0.9 0.8 0.9Geese 0.1 0.1 0.2 0.2 0.2 0.2 0.2 0.2 0.2 0.2Goats 587.3 592.3 600.1 606.7 632.4 661.0 689.4 679.1 695.1 708.5Horses 60.3 60.5 60.4 58.4 58.4 59.0 58.5 57.1 56.8 56.9Live Animals nes 5.7 5.6 5.9 5.4 5.5 5.9 6.3 5.9 5.6 6.1Mules 14.8 15.0 15.1 15.0 14.9 14.5 13.8 13.2 13.2 13.2Other Camelids 5.4 5.4 5.4 5.4 5.5 5.6 5.6 5.6 5.7 6.0Other Rodents 0.0 0.0 0.0 0.0 0.0 0.0 0.0 0.0 0.0 0.0Pigs 856.6 865.5 869.7 876.7 882.1 899.1 859.3 830.7 868.7 891.8Poultry Birds 11.6 12.1 12.6 13.0 13.7 14.2 14.9 15.7 14.4 15.0Rabbits 0.4 0.4 0.5 0.5 0.5 0.5 0.5 0.5 0.5 0.5Sheep 1209.3 1185.2 1162.1 1121.7 1111.0 1074.3 1060.0 1043.1 1046.0 1052.6Sheep and Goats 1796.6 1777.5 1762.2 1728.4 1743.4 1735.3 1749.4 1722.2 1741.1 1761.2Turkeys 0.2 0.2 0.2 0.2 0.2 0.2 0.3 0.3 0.3 0.3
Continued : - Years:- 2000 2001 2002 2003 2004AnimalsAsses 40.9 41.1 41.2 41.5 40.9Beehives 58.3 59.1 60.6 60.7 62.3Buffaloes 163.5 165.4 167.6 170.3 172.0Calves 0.0 0.0 0.0 0.0 0.0Camels 18.8 19.0 19.2 19.2 19.0Cattle 1315.5 1321.8 1336.1 1350.9 1365.0Cattle and Buffaloes 1479.0 1487.3 1503.7 1521.2 1536.9Chickens 14.5 15.1 15.8 15.8 16.4Ducks 0.9 1.0 1.0 1.0 1.0Geese 0.2 0.2 0.3 0.3 0.3Goats 721.9 736.0 751.8 771.5 790.0Horses 56.7 56.4 55.3 55.1 54.9Live Animals nes 6.3 6.7 5.9 7.0 7.0Mules 13.2 13.1 13.0 12.9 12.6Other Camelids 6.1 6.0 6.2 6.3 6.3Other Rodents 0.0 0.0 0.0 0.0 0.0Pigs 896.4 913.1 928.9 941.5 943.8Poultry Birds 15.9 16.5 17.4 17.4 18.0Rabbits 0.5 0.5 0.5 0.5 0.5Sheep 1053.9 1033.6 1030.5 1038.7 1059.8Sheep and Goats 1775.8 1769.6 1782.3 1810.2 1849.8Turkeys 0.3 0.3 0.3 0.3 0.3Note:- 0.0 negligible with respect to unit specified, * stocks = number/head or 1000Source: FAOSTAT - Website year 2006
152
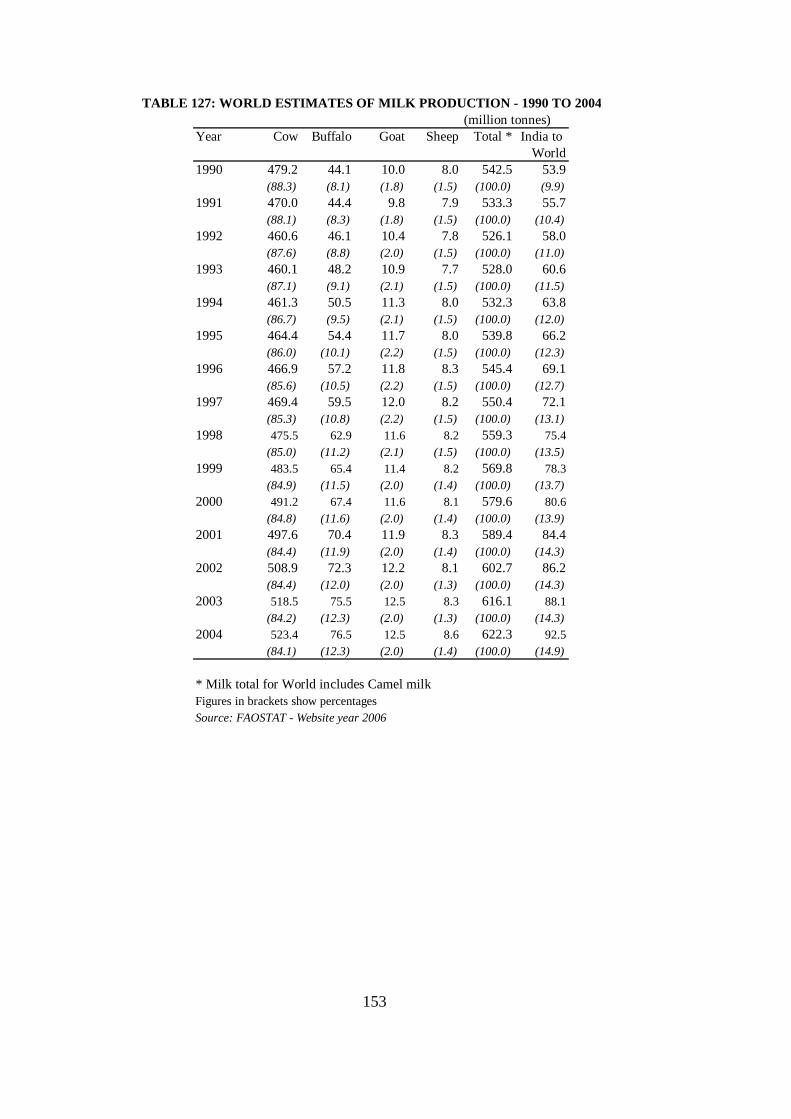
TABLE 127: WORLD ESTIMATES OF MILK PRODUCTION - 1990 TO 2004(million tonnes)
Year Cow Buffalo Goat Sheep Total * India toWorld
1990 479.2 44.1 10.0 8.0 542.5 53.9(88.3) (8.1) (1.8) (1.5) (100.0) (9.9)
1991 470.0 44.4 9.8 7.9 533.3 55.7(88.1) (8.3) (1.8) (1.5) (100.0) (10.4)
1992 460.6 46.1 10.4 7.8 526.1 58.0(87.6) (8.8) (2.0) (1.5) (100.0) (11.0)
1993 460.1 48.2 10.9 7.7 528.0 60.6(87.1) (9.1) (2.1) (1.5) (100.0) (11.5)
1994 461.3 50.5 11.3 8.0 532.3 63.8(86.7) (9.5) (2.1) (1.5) (100.0) (12.0)
1995 464.4 54.4 11.7 8.0 539.8 66.2(86.0) (10.1) (2.2) (1.5) (100.0) (12.3)
1996 466.9 57.2 11.8 8.3 545.4 69.1(85.6) (10.5) (2.2) (1.5) (100.0) (12.7)
1997 469.4 59.5 12.0 8.2 550.4 72.1(85.3) (10.8) (2.2) (1.5) (100.0) (13.1)
1998 475.5 62.9 11.6 8.2 559.3 75.4(85.0) (11.2) (2.1) (1.5) (100.0) (13.5)
1999 483.5 65.4 11.4 8.2 569.8 78.3(84.9) (11.5) (2.0) (1.4) (100.0) (13.7)
2000 491.2 67.4 11.6 8.1 579.6 80.6(84.8) (11.6) (2.0) (1.4) (100.0) (13.9)
2001 497.6 70.4 11.9 8.3 589.4 84.4(84.4) (11.9) (2.0) (1.4) (100.0) (14.3)
2002 508.9 72.3 12.2 8.1 602.7 86.2(84.4) (12.0) (2.0) (1.3) (100.0) (14.3)
2003 518.5 75.5 12.5 8.3 616.1 88.1(84.2) (12.3) (2.0) (1.3) (100.0) (14.3)
2004 523.4 76.5 12.5 8.6 622.3 92.5(84.1) (12.3) (2.0) (1.4) (100.0) (14.9)
* Milk total for World includes Camel milkFigures in brackets show percentagesSource: FAOSTAT - Website year 2006
153

TABLE 128: PRODUCTION OF COW MILK BY MAJOR COUNTRIES OF THE WORLD - 1999-2004(million tonnes)
Country1999 2000 2001 2002 2003 2004 1999 2000 2001 2002 2003 2004
Argentina 10.6 10.1 9.8 8.8 8.2 8.1 2.2 2.1 2.0 1.7 1.6 1.5Australia 10.5 11.2 10.9 10.3 10.1 10.1 2.2 2.3 2.2 2.0 1.9 1.9Austria 3.3 3.3 3.3 3.3 3.2 3.1 0.7 0.7 0.7 0.6 0.6 0.6Bangladesh 0.8 0.8 0.8 0.8 0.8 0.8 0.2 0.2 0.2 0.2 0.2 0.2Belarus 4.7 4.5 4.8 4.8 4.7 5.1 1.0 0.9 1.0 0.9 0.9 1.0Belgium 0.0 3.7 3.7 3.5 3.4 3.4 0.0 0.8 0.7 0.7 0.7 0.6Bhutan 0.0 0.0 0.0 0.0 0.0 0.0 0.0 0.0 0.0 0.0 0.0 0.0Brazil 19.7 20.4 21.1 22.3 23.3 23.3 4.1 4.1 4.2 4.4 4.5 4.5Canada 8.2 8.1 8.1 8.0 8.1 8.0 1.7 1.6 1.6 1.6 1.6 1.5China 7.5 8.6 10.6 13.4 17.8 22.9 1.6 1.8 2.1 2.6 3.4 4.4Colombia 5.7 6.1 6.3 6.6 6.7 6.7 1.2 1.3 1.3 1.3 1.3 1.3Denmark 4.7 4.7 4.6 4.6 4.7 4.6 1.0 1.0 0.9 0.9 0.9 0.9France 24.9 25.0 24.9 25.2 24.6 24.4 5.1 5.1 5.0 5.0 4.7 4.7Germany 28.3 28.3 28.2 27.9 28.4 28.1 5.9 5.8 5.7 5.5 5.5 5.4India 32.8 34.0 35.6 36.2 36.5 37.5 6.8 6.9 7.2 7.1 7.0 7.2Iran, Islamic Rep of 4.4 4.8 4.9 5.0 4.9 5.0 0.9 1.0 1.0 1.0 0.9 1.0Ireland 5.1 5.2 5.4 5.4 5.3 5.5 1.1 1.1 1.1 1.1 1.0 1.1Israel 1.2 1.2 1.2 1.2 1.2 1.2 0.2 0.2 0.2 0.2 0.2 0.2Italy 11.9 12.3 11.3 11.3 11.3 10.0 2.5 2.5 2.3 2.2 2.2 1.9Japan 8.5 8.5 8.3 8.4 8.4 8.3 1.7 1.7 1.7 1.6 1.6 1.6Kazakhstan 3.5 3.7 3.9 4.1 4.3 4.5 0.7 0.8 0.8 0.8 0.8 0.9Mexico 8.9 9.3 9.5 9.7 9.8 9.9 1.8 1.9 1.9 1.9 1.9 1.9Nepal 0.3 0.3 0.3 0.4 0.4 0.4 0.1 0.1 0.1 0.1 0.1 0.1Netherlands 11.2 11.2 11.0 10.7 11.1 10.9 2.3 2.3 2.2 2.1 2.1 2.1New Zealand 10.9 12.2 13.1 13.9 14.4 15.1 2.3 2.5 2.6 2.7 2.8 2.9Pakistan 7.9 8.0 8.2 8.4 8.6 8.8 1.6 1.6 1.6 1.6 1.7 1.7Poland 12.3 11.9 11.9 11.9 11.9 11.8 2.5 2.4 2.4 2.3 2.3 2.3Romania 4.4 4.3 4.5 4.6 4.9 5.7 0.9 0.9 0.9 0.9 0.9 1.1Russian Federation 32.0 32.0 32.6 33.2 33.1 31.7 6.6 6.5 6.6 6.5 6.4 6.1Spain 6.3 6.1 6.3 6.8 7.2 6.3 1.3 1.2 1.3 1.3 1.4 1.2Sri Lanka 0.1 0.1 0.1 0.1 0.1 0.1 0.0 0.0 0.0 0.0 0.0 0.0Sudan 3.1 3.1 3.2 3.2 3.3 3.3 0.6 0.6 0.6 0.6 0.6 0.6Sweden 3.3 3.3 3.3 3.2 3.2 3.2 0.7 0.7 0.7 0.6 0.6 0.6Switzerland 3.9 3.9 3.9 3.9 3.9 3.9 0.8 0.8 0.8 0.8 0.7 0.7Turkey 9.0 8.7 8.5 7.5 9.5 9.6 1.9 1.8 1.7 1.5 1.8 1.8Turkmenistan 0.9 1.0 1.1 1.4 1.5 1.4 0.2 0.2 0.2 0.3 0.3 0.3Ukraine 13.1 12.4 13.2 13.8 13.3 13.5 2.7 2.5 2.6 2.7 2.6 2.6United Kingdom 15.0 14.5 14.7 14.9 15.0 14.6 3.1 2.9 3.0 2.9 2.9 2.8United States of America 73.8 76.0 75.1 77.1 77.3 77.5 15.3 15.5 15.1 15.2 14.9 14.8Uzbekistan 3.5 3.6 3.6 3.6 3.9 4.2 0.7 0.7 0.7 0.7 0.8 0.8Other countries 67.5 64.7 66.0 69.7 70.4 70.8 13.9 13.2 13.3 13.7 13.6 13.5WORLD+ 483.5 491.2 497.6 508.9 518.5 523.4 100 100 100 100 100 100
AFRICA+ 18.7 19.6 20.1 21.1 21.7 21.2 3.9 4.0 4.0 4.1 4.2 4.1ASIA+ 92.8 95.8 99.6 104.2 112.2 119.4 19.2 19.5 20.0 20.5 21.6 22.8EUROPE+ 211.2 209.6 210.5 212.4 212.1 208.9 43.7 42.7 42.3 41.7 40.9 39.9NORTH AMERICA+ 82.0 84.1 83.2 85.1 85.3 85.5 17.0 17.1 16.7 16.7 16.5 16.3SOUTH AMERICA+ 44.6 45.2 46.4 46.9 47.3 47.6 9.2 9.2 9.3 9.2 9.1 9.1USSR IN ASIA+ 11.2 11.7 12.2 12.9 13.7 14.1 2.3 2.4 2.5 2.5 2.6 2.7USSR IN EUROPE+ 53.6 52.6 54.4 55.6 54.9 54.1 11.1 10.7 10.9 10.9 10.6 10.3USSR, FORMER AREA OF+ 64.8 64.3 66.6 68.5 68.6 68.3 13.4 13.1 13.4 13.5 13.2 13.0
+ as combined by FAOSTATSource:FAOSTAT - Website year 2006
Years Percentage Share to World Total
154
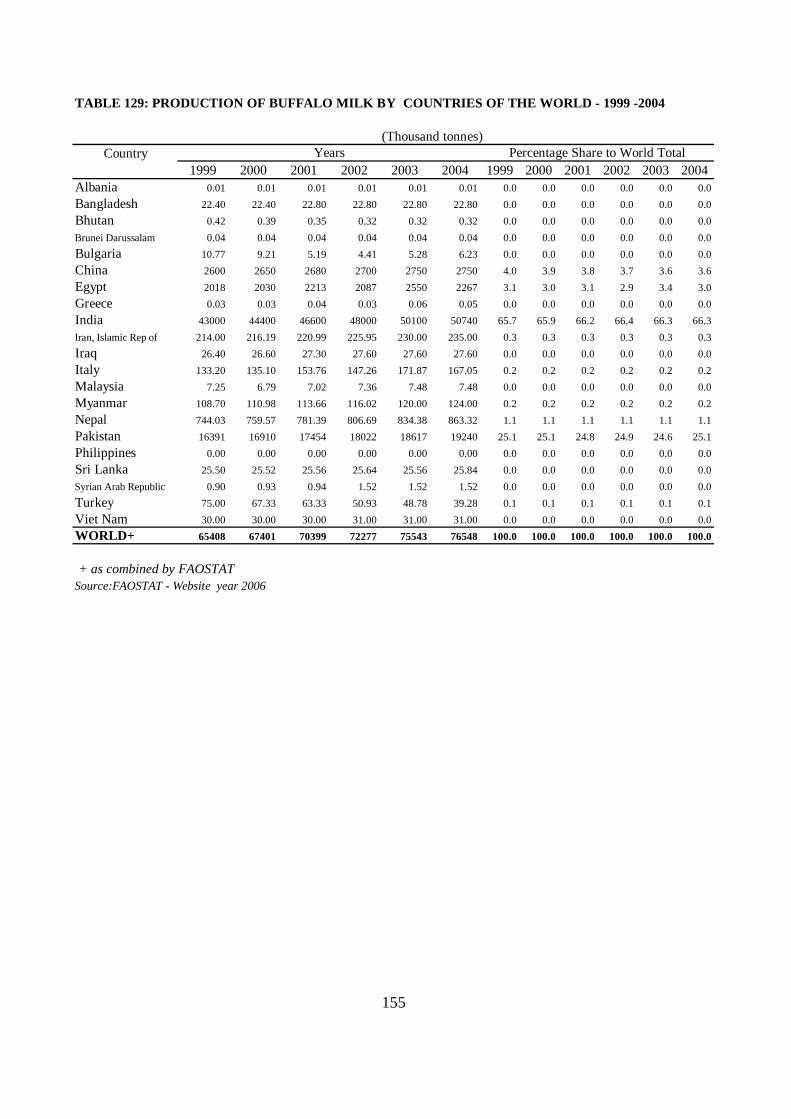
TABLE 129: PRODUCTION OF BUFFALO MILK BY COUNTRIES OF THE WORLD - 1999 -2004
(Thousand tonnes)Country
1999 2000 2001 2002 2003 2004 1999 2000 2001 2002 2003 2004Albania 0.01 0.01 0.01 0.01 0.01 0.01 0.0 0.0 0.0 0.0 0.0 0.0Bangladesh 22.40 22.40 22.80 22.80 22.80 22.80 0.0 0.0 0.0 0.0 0.0 0.0Bhutan 0.42 0.39 0.35 0.32 0.32 0.32 0.0 0.0 0.0 0.0 0.0 0.0Brunei Darussalam 0.04 0.04 0.04 0.04 0.04 0.04 0.0 0.0 0.0 0.0 0.0 0.0Bulgaria 10.77 9.21 5.19 4.41 5.28 6.23 0.0 0.0 0.0 0.0 0.0 0.0China 2600 2650 2680 2700 2750 2750 4.0 3.9 3.8 3.7 3.6 3.6Egypt 2018 2030 2213 2087 2550 2267 3.1 3.0 3.1 2.9 3.4 3.0Greece 0.03 0.03 0.04 0.03 0.06 0.05 0.0 0.0 0.0 0.0 0.0 0.0India 43000 44400 46600 48000 50100 50740 65.7 65.9 66.2 66.4 66.3 66.3Iran, Islamic Rep of 214.00 216.19 220.99 225.95 230.00 235.00 0.3 0.3 0.3 0.3 0.3 0.3Iraq 26.40 26.60 27.30 27.60 27.60 27.60 0.0 0.0 0.0 0.0 0.0 0.0Italy 133.20 135.10 153.76 147.26 171.87 167.05 0.2 0.2 0.2 0.2 0.2 0.2Malaysia 7.25 6.79 7.02 7.36 7.48 7.48 0.0 0.0 0.0 0.0 0.0 0.0Myanmar 108.70 110.98 113.66 116.02 120.00 124.00 0.2 0.2 0.2 0.2 0.2 0.2Nepal 744.03 759.57 781.39 806.69 834.38 863.32 1.1 1.1 1.1 1.1 1.1 1.1Pakistan 16391 16910 17454 18022 18617 19240 25.1 25.1 24.8 24.9 24.6 25.1Philippines 0.00 0.00 0.00 0.00 0.00 0.00 0.0 0.0 0.0 0.0 0.0 0.0Sri Lanka 25.50 25.52 25.56 25.64 25.56 25.84 0.0 0.0 0.0 0.0 0.0 0.0Syrian Arab Republic 0.90 0.93 0.94 1.52 1.52 1.52 0.0 0.0 0.0 0.0 0.0 0.0Turkey 75.00 67.33 63.33 50.93 48.78 39.28 0.1 0.1 0.1 0.1 0.1 0.1Viet Nam 30.00 30.00 30.00 31.00 31.00 31.00 0.0 0.0 0.0 0.0 0.0 0.0WORLD+ 65408 67401 70399 72277 75543 76548 100.0 100.0 100.0 100.0 100.0 100.0
+ as combined by FAOSTATSource:FAOSTAT - Website year 2006
Years Percentage Share to World Total
155
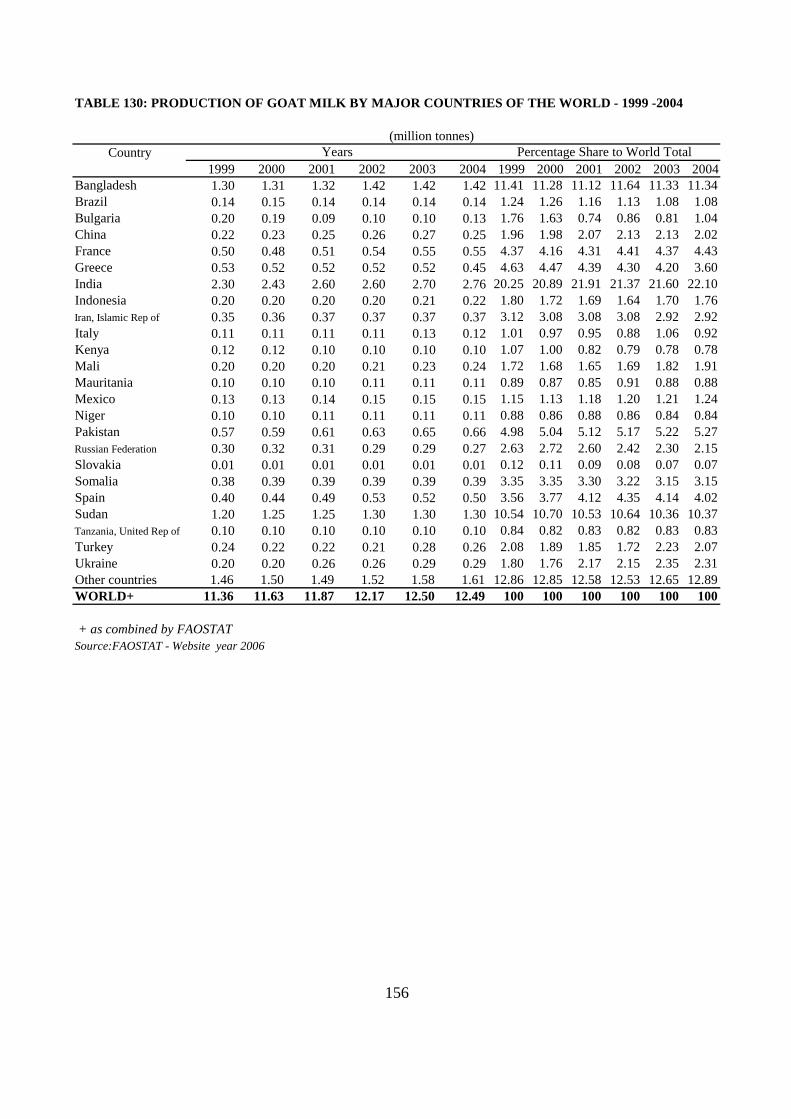
TABLE 130: PRODUCTION OF GOAT MILK BY MAJOR COUNTRIES OF THE WORLD - 1999 -2004
(million tonnes)Country
1999 2000 2001 2002 2003 2004 1999 2000 2001 2002 2003 2004Bangladesh 1.30 1.31 1.32 1.42 1.42 1.42 11.41 11.28 11.12 11.64 11.33 11.34Brazil 0.14 0.15 0.14 0.14 0.14 0.14 1.24 1.26 1.16 1.13 1.08 1.08Bulgaria 0.20 0.19 0.09 0.10 0.10 0.13 1.76 1.63 0.74 0.86 0.81 1.04China 0.22 0.23 0.25 0.26 0.27 0.25 1.96 1.98 2.07 2.13 2.13 2.02France 0.50 0.48 0.51 0.54 0.55 0.55 4.37 4.16 4.31 4.41 4.37 4.43Greece 0.53 0.52 0.52 0.52 0.52 0.45 4.63 4.47 4.39 4.30 4.20 3.60India 2.30 2.43 2.60 2.60 2.70 2.76 20.25 20.89 21.91 21.37 21.60 22.10Indonesia 0.20 0.20 0.20 0.20 0.21 0.22 1.80 1.72 1.69 1.64 1.70 1.76Iran, Islamic Rep of 0.35 0.36 0.37 0.37 0.37 0.37 3.12 3.08 3.08 3.08 2.92 2.92Italy 0.11 0.11 0.11 0.11 0.13 0.12 1.01 0.97 0.95 0.88 1.06 0.92Kenya 0.12 0.12 0.10 0.10 0.10 0.10 1.07 1.00 0.82 0.79 0.78 0.78Mali 0.20 0.20 0.20 0.21 0.23 0.24 1.72 1.68 1.65 1.69 1.82 1.91Mauritania 0.10 0.10 0.10 0.11 0.11 0.11 0.89 0.87 0.85 0.91 0.88 0.88Mexico 0.13 0.13 0.14 0.15 0.15 0.15 1.15 1.13 1.18 1.20 1.21 1.24Niger 0.10 0.10 0.11 0.11 0.11 0.11 0.88 0.86 0.88 0.86 0.84 0.84Pakistan 0.57 0.59 0.61 0.63 0.65 0.66 4.98 5.04 5.12 5.17 5.22 5.27Russian Federation 0.30 0.32 0.31 0.29 0.29 0.27 2.63 2.72 2.60 2.42 2.30 2.15Slovakia 0.01 0.01 0.01 0.01 0.01 0.01 0.12 0.11 0.09 0.08 0.07 0.07Somalia 0.38 0.39 0.39 0.39 0.39 0.39 3.35 3.35 3.30 3.22 3.15 3.15Spain 0.40 0.44 0.49 0.53 0.52 0.50 3.56 3.77 4.12 4.35 4.14 4.02Sudan 1.20 1.25 1.25 1.30 1.30 1.30 10.54 10.70 10.53 10.64 10.36 10.37Tanzania, United Rep of 0.10 0.10 0.10 0.10 0.10 0.10 0.84 0.82 0.83 0.82 0.83 0.83Turkey 0.24 0.22 0.22 0.21 0.28 0.26 2.08 1.89 1.85 1.72 2.23 2.07Ukraine 0.20 0.20 0.26 0.26 0.29 0.29 1.80 1.76 2.17 2.15 2.35 2.31Other countries 1.46 1.50 1.49 1.52 1.58 1.61 12.86 12.85 12.58 12.53 12.65 12.89WORLD+ 11.36 11.63 11.87 12.17 12.50 12.49 100 100 100 100 100 100
+ as combined by FAOSTATSource:FAOSTAT - Website year 2006
Percentage Share to World TotalYears
156
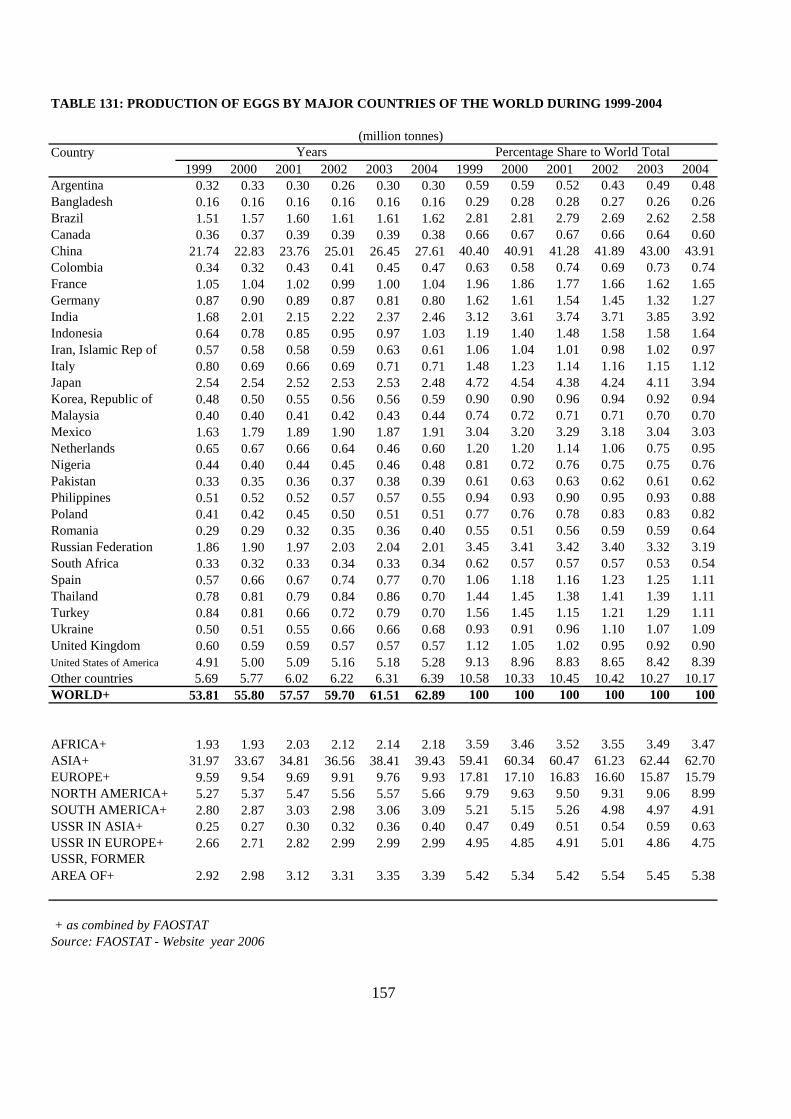
TABLE 131: PRODUCTION OF EGGS BY MAJOR COUNTRIES OF THE WORLD DURING 1999-2004
(million tonnes)Country
1999 2000 2001 2002 2003 2004 1999 2000 2001 2002 2003 2004Argentina 0.32 0.33 0.30 0.26 0.30 0.30 0.59 0.59 0.52 0.43 0.49 0.48Bangladesh 0.16 0.16 0.16 0.16 0.16 0.16 0.29 0.28 0.28 0.27 0.26 0.26Brazil 1.51 1.57 1.60 1.61 1.61 1.62 2.81 2.81 2.79 2.69 2.62 2.58Canada 0.36 0.37 0.39 0.39 0.39 0.38 0.66 0.67 0.67 0.66 0.64 0.60China 21.74 22.83 23.76 25.01 26.45 27.61 40.40 40.91 41.28 41.89 43.00 43.91Colombia 0.34 0.32 0.43 0.41 0.45 0.47 0.63 0.58 0.74 0.69 0.73 0.74France 1.05 1.04 1.02 0.99 1.00 1.04 1.96 1.86 1.77 1.66 1.62 1.65Germany 0.87 0.90 0.89 0.87 0.81 0.80 1.62 1.61 1.54 1.45 1.32 1.27India 1.68 2.01 2.15 2.22 2.37 2.46 3.12 3.61 3.74 3.71 3.85 3.92Indonesia 0.64 0.78 0.85 0.95 0.97 1.03 1.19 1.40 1.48 1.58 1.58 1.64Iran, Islamic Rep of 0.57 0.58 0.58 0.59 0.63 0.61 1.06 1.04 1.01 0.98 1.02 0.97Italy 0.80 0.69 0.66 0.69 0.71 0.71 1.48 1.23 1.14 1.16 1.15 1.12Japan 2.54 2.54 2.52 2.53 2.53 2.48 4.72 4.54 4.38 4.24 4.11 3.94Korea, Republic of 0.48 0.50 0.55 0.56 0.56 0.59 0.90 0.90 0.96 0.94 0.92 0.94Malaysia 0.40 0.40 0.41 0.42 0.43 0.44 0.74 0.72 0.71 0.71 0.70 0.70Mexico 1.63 1.79 1.89 1.90 1.87 1.91 3.04 3.20 3.29 3.18 3.04 3.03Netherlands 0.65 0.67 0.66 0.64 0.46 0.60 1.20 1.20 1.14 1.06 0.75 0.95Nigeria 0.44 0.40 0.44 0.45 0.46 0.48 0.81 0.72 0.76 0.75 0.75 0.76Pakistan 0.33 0.35 0.36 0.37 0.38 0.39 0.61 0.63 0.63 0.62 0.61 0.62Philippines 0.51 0.52 0.52 0.57 0.57 0.55 0.94 0.93 0.90 0.95 0.93 0.88Poland 0.41 0.42 0.45 0.50 0.51 0.51 0.77 0.76 0.78 0.83 0.83 0.82Romania 0.29 0.29 0.32 0.35 0.36 0.40 0.55 0.51 0.56 0.59 0.59 0.64Russian Federation 1.86 1.90 1.97 2.03 2.04 2.01 3.45 3.41 3.42 3.40 3.32 3.19South Africa 0.33 0.32 0.33 0.34 0.33 0.34 0.62 0.57 0.57 0.57 0.53 0.54Spain 0.57 0.66 0.67 0.74 0.77 0.70 1.06 1.18 1.16 1.23 1.25 1.11Thailand 0.78 0.81 0.79 0.84 0.86 0.70 1.44 1.45 1.38 1.41 1.39 1.11Turkey 0.84 0.81 0.66 0.72 0.79 0.70 1.56 1.45 1.15 1.21 1.29 1.11Ukraine 0.50 0.51 0.55 0.66 0.66 0.68 0.93 0.91 0.96 1.10 1.07 1.09United Kingdom 0.60 0.59 0.59 0.57 0.57 0.57 1.12 1.05 1.02 0.95 0.92 0.90United States of America 4.91 5.00 5.09 5.16 5.18 5.28 9.13 8.96 8.83 8.65 8.42 8.39Other countries 5.69 5.77 6.02 6.22 6.31 6.39 10.58 10.33 10.45 10.42 10.27 10.17WORLD+ 53.81 55.80 57.57 59.70 61.51 62.89 100 100 100 100 100 100
AFRICA+ 1.93 1.93 2.03 2.12 2.14 2.18 3.59 3.46 3.52 3.55 3.49 3.47ASIA+ 31.97 33.67 34.81 36.56 38.41 39.43 59.41 60.34 60.47 61.23 62.44 62.70EUROPE+ 9.59 9.54 9.69 9.91 9.76 9.93 17.81 17.10 16.83 16.60 15.87 15.79NORTH AMERICA+ 5.27 5.37 5.47 5.56 5.57 5.66 9.79 9.63 9.50 9.31 9.06 8.99SOUTH AMERICA+ 2.80 2.87 3.03 2.98 3.06 3.09 5.21 5.15 5.26 4.98 4.97 4.91USSR IN ASIA+ 0.25 0.27 0.30 0.32 0.36 0.40 0.47 0.49 0.51 0.54 0.59 0.63USSR IN EUROPE+ 2.66 2.71 2.82 2.99 2.99 2.99 4.95 4.85 4.91 5.01 4.86 4.75USSR, FORMERAREA OF+ 2.92 2.98 3.12 3.31 3.35 3.39 5.42 5.34 5.42 5.54 5.45 5.38
+ as combined by FAOSTATSource: FAOSTAT - Website year 2006
Percentage Share to World TotalYears
157
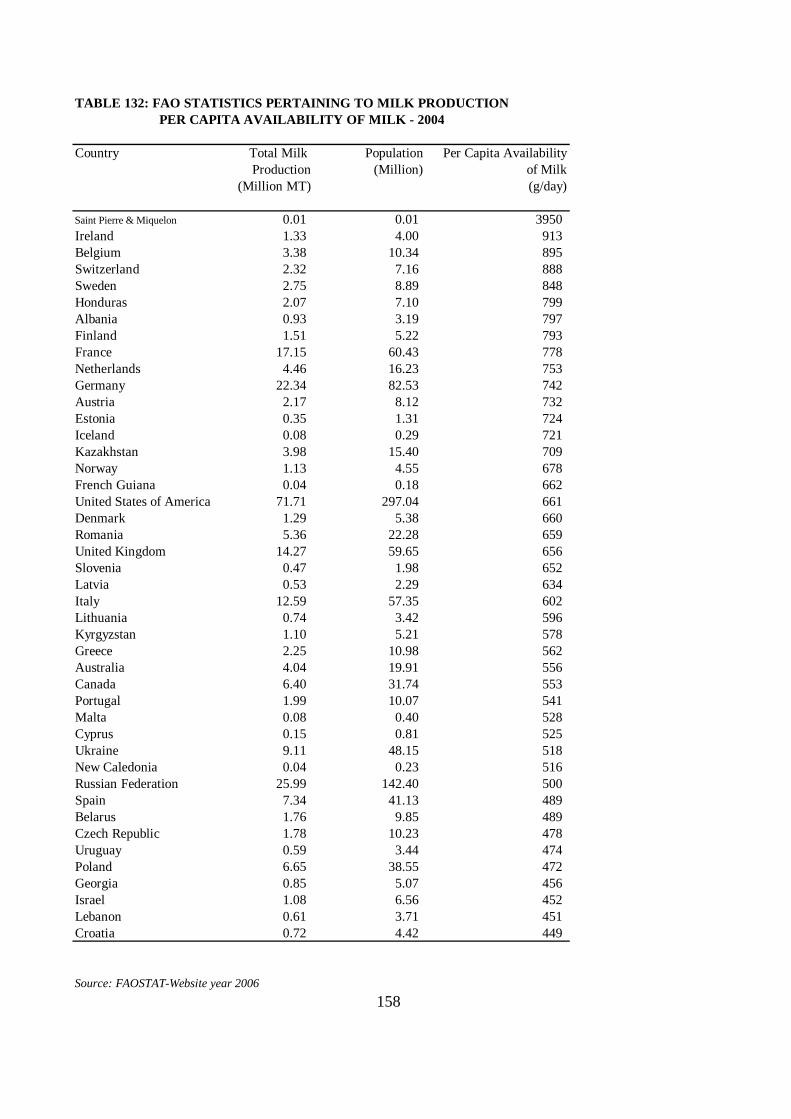
TABLE 132: FAO STATISTICS PERTAINING TO MILK PRODUCTION PER CAPITA AVAILABILITY OF MILK - 2004
Country Total Milk Population Per Capita AvailabilityProduction (Million) of Milk
(Million MT) (g/day)
Saint Pierre & Miquelon 0.01 0.01 3950Ireland 1.33 4.00 913Belgium 3.38 10.34 895Switzerland 2.32 7.16 888Sweden 2.75 8.89 848Honduras 2.07 7.10 799Albania 0.93 3.19 797Finland 1.51 5.22 793France 17.15 60.43 778Netherlands 4.46 16.23 753Germany 22.34 82.53 742Austria 2.17 8.12 732Estonia 0.35 1.31 724Iceland 0.08 0.29 721Kazakhstan 3.98 15.40 709Norway 1.13 4.55 678French Guiana 0.04 0.18 662United States of America 71.71 297.04 661Denmark 1.29 5.38 660Romania 5.36 22.28 659United Kingdom 14.27 59.65 656Slovenia 0.47 1.98 652Latvia 0.53 2.29 634Italy 12.59 57.35 602Lithuania 0.74 3.42 596Kyrgyzstan 1.10 5.21 578Greece 2.25 10.98 562Australia 4.04 19.91 556Canada 6.40 31.74 553Portugal 1.99 10.07 541Malta 0.08 0.40 528Cyprus 0.15 0.81 525Ukraine 9.11 48.15 518New Caledonia 0.04 0.23 516Russian Federation 25.99 142.40 500Spain 7.34 41.13 489Belarus 1.76 9.85 489Czech Republic 1.78 10.23 478Uruguay 0.59 3.44 474Poland 6.65 38.55 472Georgia 0.85 5.07 456Israel 1.08 6.56 452Lebanon 0.61 3.71 451Croatia 0.72 4.42 449
Source: FAOSTAT-Website year 2006158
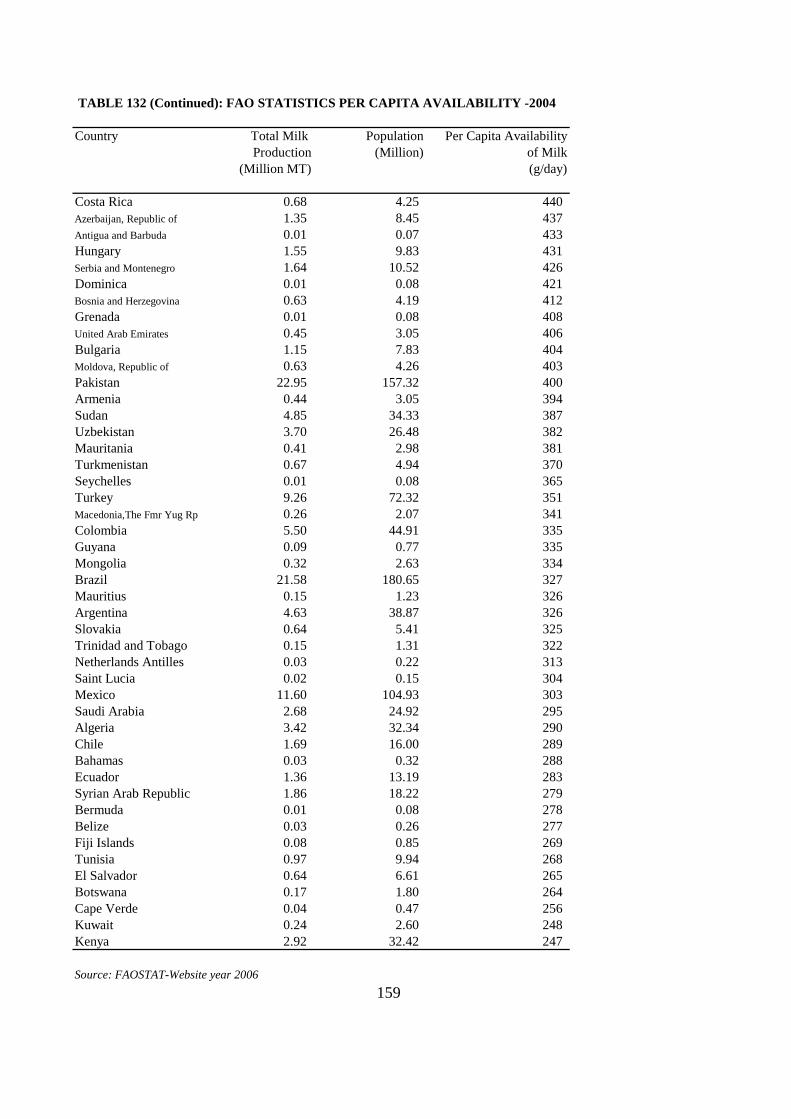
TABLE 132 (Continued): FAO STATISTICS PER CAPITA AVAILABILITY -2004
Country Total Milk Population Per Capita AvailabilityProduction (Million) of Milk
(Million MT) (g/day)
Costa Rica 0.68 4.25 440Azerbaijan, Republic of 1.35 8.45 437Antigua and Barbuda 0.01 0.07 433Hungary 1.55 9.83 431Serbia and Montenegro 1.64 10.52 426Dominica 0.01 0.08 421Bosnia and Herzegovina 0.63 4.19 412Grenada 0.01 0.08 408United Arab Emirates 0.45 3.05 406Bulgaria 1.15 7.83 404Moldova, Republic of 0.63 4.26 403Pakistan 22.95 157.32 400Armenia 0.44 3.05 394Sudan 4.85 34.33 387Uzbekistan 3.70 26.48 382Mauritania 0.41 2.98 381Turkmenistan 0.67 4.94 370Seychelles 0.01 0.08 365Turkey 9.26 72.32 351Macedonia,The Fmr Yug Rp 0.26 2.07 341Colombia 5.50 44.91 335Guyana 0.09 0.77 335Mongolia 0.32 2.63 334Brazil 21.58 180.65 327Mauritius 0.15 1.23 326Argentina 4.63 38.87 326Slovakia 0.64 5.41 325Trinidad and Tobago 0.15 1.31 322Netherlands Antilles 0.03 0.22 313Saint Lucia 0.02 0.15 304Mexico 11.60 104.93 303Saudi Arabia 2.68 24.92 295Algeria 3.42 32.34 290Chile 1.69 16.00 289Bahamas 0.03 0.32 288Ecuador 1.36 13.19 283Syrian Arab Republic 1.86 18.22 279Bermuda 0.01 0.08 278Belize 0.03 0.26 277Fiji Islands 0.08 0.85 269Tunisia 0.97 9.94 268El Salvador 0.64 6.61 265Botswana 0.17 1.80 264Cape Verde 0.04 0.47 256Kuwait 0.24 2.60 248Kenya 2.92 32.42 247
Source: FAOSTAT-Website year 2006159
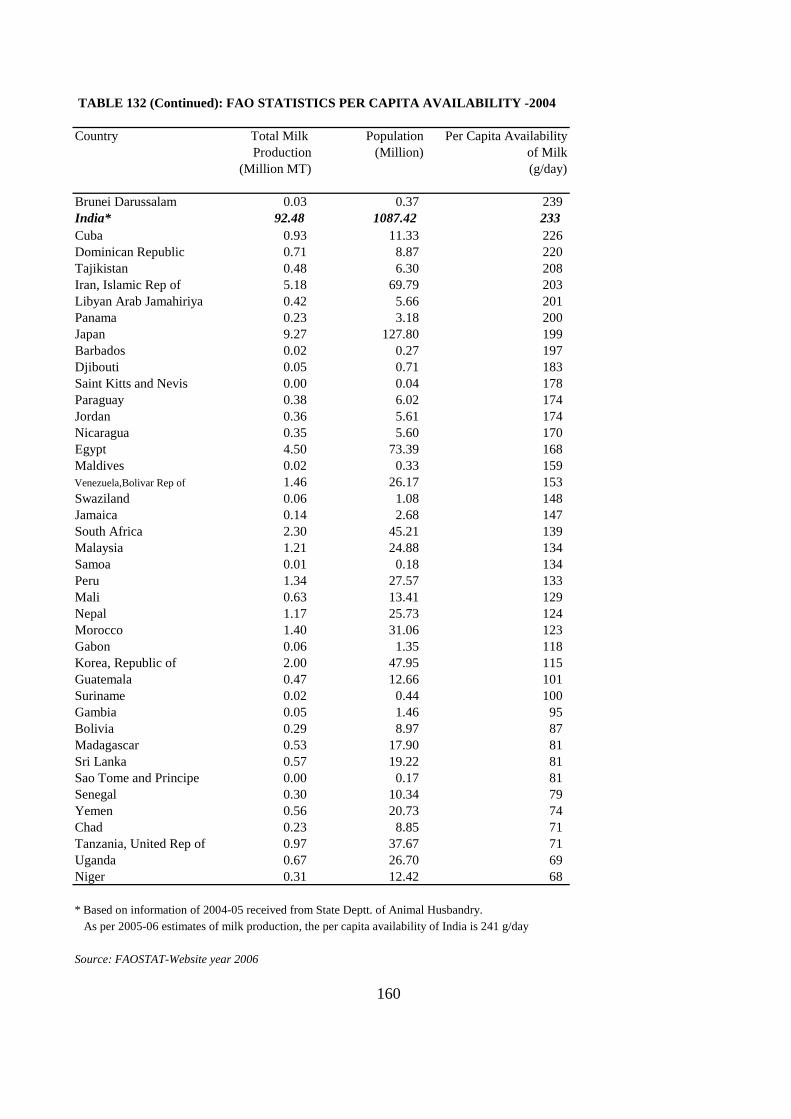
TABLE 132 (Continued): FAO STATISTICS PER CAPITA AVAILABILITY -2004
Country Total Milk Population Per Capita AvailabilityProduction (Million) of Milk
(Million MT) (g/day)
Brunei Darussalam 0.03 0.37 239India* 92.48 1087.42 233Cuba 0.93 11.33 226Dominican Republic 0.71 8.87 220Tajikistan 0.48 6.30 208Iran, Islamic Rep of 5.18 69.79 203Libyan Arab Jamahiriya 0.42 5.66 201Panama 0.23 3.18 200Japan 9.27 127.80 199Barbados 0.02 0.27 197Djibouti 0.05 0.71 183Saint Kitts and Nevis 0.00 0.04 178Paraguay 0.38 6.02 174Jordan 0.36 5.61 174Nicaragua 0.35 5.60 170Egypt 4.50 73.39 168Maldives 0.02 0.33 159Venezuela,Bolivar Rep of 1.46 26.17 153Swaziland 0.06 1.08 148Jamaica 0.14 2.68 147South Africa 2.30 45.21 139Malaysia 1.21 24.88 134Samoa 0.01 0.18 134Peru 1.34 27.57 133Mali 0.63 13.41 129Nepal 1.17 25.73 124Morocco 1.40 31.06 123Gabon 0.06 1.35 118Korea, Republic of 2.00 47.95 115Guatemala 0.47 12.66 101Suriname 0.02 0.44 100Gambia 0.05 1.46 95Bolivia 0.29 8.97 87Madagascar 0.53 17.90 81Sri Lanka 0.57 19.22 81Sao Tome and Principe 0.00 0.17 81Senegal 0.30 10.34 79Yemen 0.56 20.73 74Chad 0.23 8.85 71Tanzania, United Rep of 0.97 37.67 71Uganda 0.67 26.70 69Niger 0.31 12.42 68
* Based on information of 2004-05 received from State Deptt. of Animal Husbandry. As per 2005-06 estimates of milk production, the per capita availability of India is 241 g/day
Source: FAOSTAT-Website year 2006
160
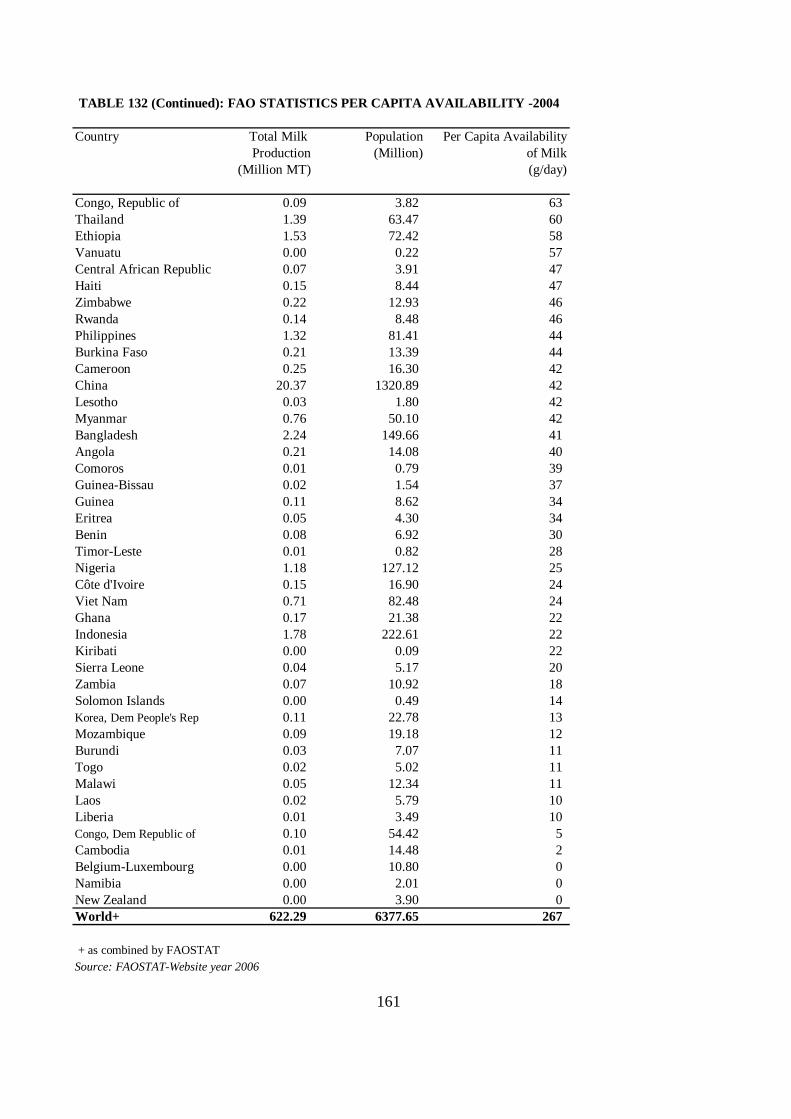
TABLE 132 (Continued): FAO STATISTICS PER CAPITA AVAILABILITY -2004
Country Total Milk Population Per Capita AvailabilityProduction (Million) of Milk
(Million MT) (g/day)
Congo, Republic of 0.09 3.82 63Thailand 1.39 63.47 60Ethiopia 1.53 72.42 58Vanuatu 0.00 0.22 57Central African Republic 0.07 3.91 47Haiti 0.15 8.44 47Zimbabwe 0.22 12.93 46Rwanda 0.14 8.48 46Philippines 1.32 81.41 44Burkina Faso 0.21 13.39 44Cameroon 0.25 16.30 42China 20.37 1320.89 42Lesotho 0.03 1.80 42Myanmar 0.76 50.10 42Bangladesh 2.24 149.66 41Angola 0.21 14.08 40Comoros 0.01 0.79 39Guinea-Bissau 0.02 1.54 37Guinea 0.11 8.62 34Eritrea 0.05 4.30 34Benin 0.08 6.92 30Timor-Leste 0.01 0.82 28Nigeria 1.18 127.12 25Côte d'Ivoire 0.15 16.90 24Viet Nam 0.71 82.48 24Ghana 0.17 21.38 22Indonesia 1.78 222.61 22Kiribati 0.00 0.09 22Sierra Leone 0.04 5.17 20Zambia 0.07 10.92 18Solomon Islands 0.00 0.49 14Korea, Dem People's Rep 0.11 22.78 13Mozambique 0.09 19.18 12Burundi 0.03 7.07 11Togo 0.02 5.02 11Malawi 0.05 12.34 11Laos 0.02 5.79 10Liberia 0.01 3.49 10Congo, Dem Republic of 0.10 54.42 5Cambodia 0.01 14.48 2Belgium-Luxembourg 0.00 10.80 0Namibia 0.00 2.01 0New Zealand 0.00 3.90 0World+ 622.29 6377.65 267
+ as combined by FAOSTATSource: FAOSTAT-Website year 2006
161
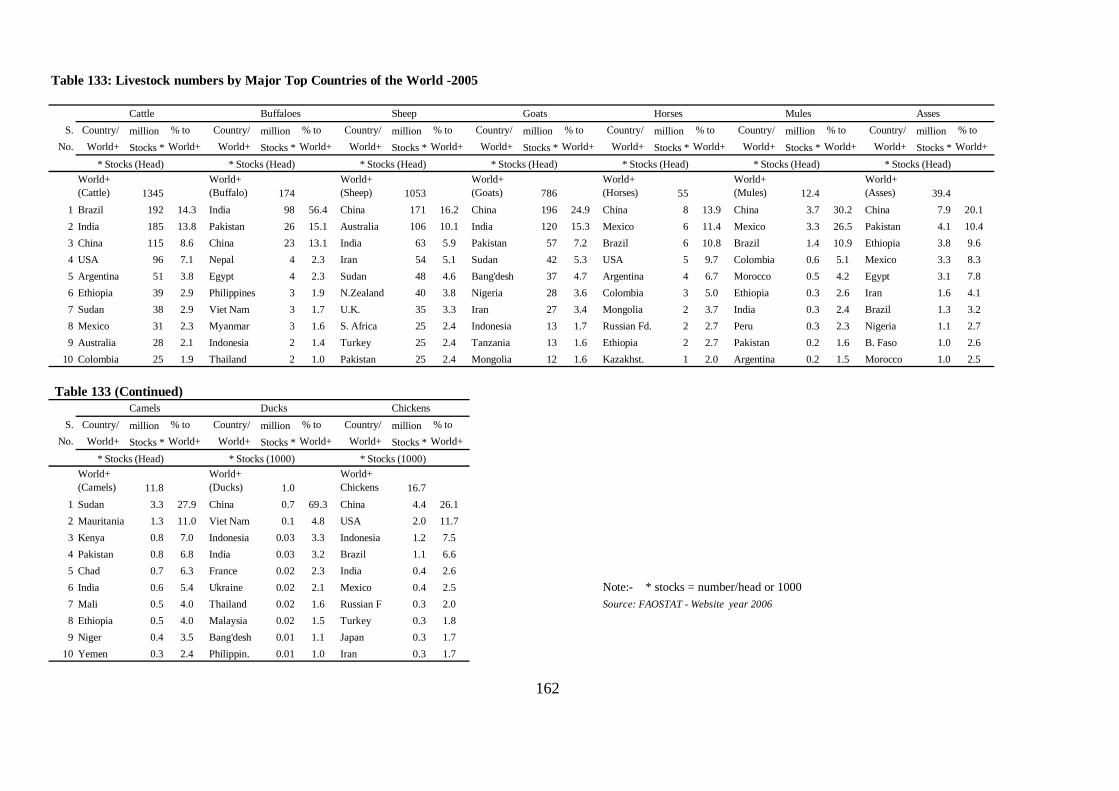
Table 133: Livestock numbers by Major Top Countries of the World -2005
Cattle Buffaloes Sheep Goats Horses Mules AssesS. Country/ million % to Country/ million % to Country/ million % to Country/ million % to Country/ million % to Country/ million % to Country/ million % to
No. World+ Stocks * World+ World+ Stocks * World+ World+ Stocks * World+ World+ Stocks * World+ World+ Stocks * World+ World+ Stocks * World+ World+ Stocks * World+
World+(Cattle) 1345
World+(Buffalo) 174
World+(Sheep) 1053
World+(Goats) 786
World+(Horses) 55
World+(Mules) 12.4
World+(Asses) 39.4
1 Brazil 192 14.3 India 98 56.4 China 171 16.2 China 196 24.9 China 8 13.9 China 3.7 30.2 China 7.9 20.12 India 185 13.8 Pakistan 26 15.1 Australia 106 10.1 India 120 15.3 Mexico 6 11.4 Mexico 3.3 26.5 Pakistan 4.1 10.43 China 115 8.6 China 23 13.1 India 63 5.9 Pakistan 57 7.2 Brazil 6 10.8 Brazil 1.4 10.9 Ethiopia 3.8 9.64 USA 96 7.1 Nepal 4 2.3 Iran 54 5.1 Sudan 42 5.3 USA 5 9.7 Colombia 0.6 5.1 Mexico 3.3 8.35 Argentina 51 3.8 Egypt 4 2.3 Sudan 48 4.6 Bang'desh 37 4.7 Argentina 4 6.7 Morocco 0.5 4.2 Egypt 3.1 7.86 Ethiopia 39 2.9 Philippines 3 1.9 N.Zealand 40 3.8 Nigeria 28 3.6 Colombia 3 5.0 Ethiopia 0.3 2.6 Iran 1.6 4.17 Sudan 38 2.9 Viet Nam 3 1.7 U.K. 35 3.3 Iran 27 3.4 Mongolia 2 3.7 India 0.3 2.4 Brazil 1.3 3.28 Mexico 31 2.3 Myanmar 3 1.6 S. Africa 25 2.4 Indonesia 13 1.7 Russian Fd. 2 2.7 Peru 0.3 2.3 Nigeria 1.1 2.79 Australia 28 2.1 Indonesia 2 1.4 Turkey 25 2.4 Tanzania 13 1.6 Ethiopia 2 2.7 Pakistan 0.2 1.6 B. Faso 1.0 2.6
10 Colombia 25 1.9 Thailand 2 1.0 Pakistan 25 2.4 Mongolia 12 1.6 Kazakhst. 1 2.0 Argentina 0.2 1.5 Morocco 1.0 2.5
Table 133 (Continued)Camels Ducks Chickens
S. Country/ million % to Country/ million % to Country/ million % toNo. World+ Stocks * World+ World+ Stocks * World+ World+ Stocks * World+
World+(Camels) 11.8
World+(Ducks) 1.0
World+Chickens 16.7
1 Sudan 3.3 27.9 China 0.7 69.3 China 4.4 26.12 Mauritania 1.3 11.0 Viet Nam 0.1 4.8 USA 2.0 11.73 Kenya 0.8 7.0 Indonesia 0.03 3.3 Indonesia 1.2 7.54 Pakistan 0.8 6.8 India 0.03 3.2 Brazil 1.1 6.65 Chad 0.7 6.3 France 0.02 2.3 India 0.4 2.66 India 0.6 5.4 Ukraine 0.02 2.1 Mexico 0.4 2.5 Note:- * stocks = number/head or 10007 Mali 0.5 4.0 Thailand 0.02 1.6 Russian F 0.3 2.0 Source: FAOSTAT - Website year 20068 Ethiopia 0.5 4.0 Malaysia 0.02 1.5 Turkey 0.3 1.89 Niger 0.4 3.5 Bang'desh 0.01 1.1 Japan 0.3 1.7
10 Yemen 0.3 2.4 Philippin. 0.01 1.0 Iran 0.3 1.7
* Stocks (Head) * Stocks (Head)
* Stocks (1000) * Stocks (1000)
162
* Stocks (Head) * Stocks (Head) * Stocks (Head)
* Stocks (Head)
* Stocks (Head) * Stocks (Head)
Appendix
Methodology of Estimation ofMilk, Egg, Meat & Wool
(Integrated Sample Survey)
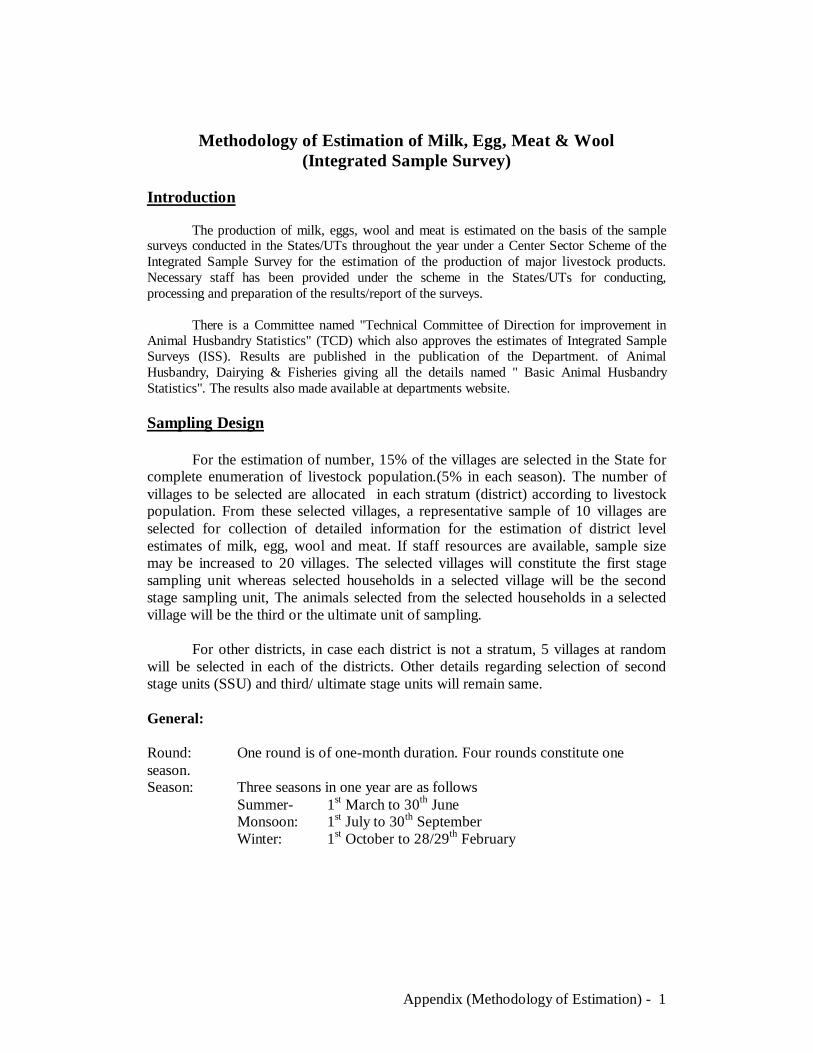
Appendix (Methodology of Estimation) - 1
Methodology of Estimation of Milk, Egg, Meat & Wool(Integrated Sample Survey)
Introduction
The production of milk, eggs, wool and meat is estimated on the basis of the samplesurveys conducted in the States/UTs throughout the year under a Center Sector Scheme of theIntegrated Sample Survey for the estimation of the production of major livestock products.Necessary staff has been provided under the scheme in the States/UTs for conducting,processing and preparation of the results/report of the surveys.
There is a Committee named "Technical Committee of Direction for improvement inAnimal Husbandry Statistics" (TCD) which also approves the estimates of Integrated SampleSurveys (ISS). Results are published in the publication of the Department. of AnimalHusbandry, Dairying & Fisheries giving all the details named " Basic Animal HusbandryStatistics". The results also made available at departments website.
Sampling Design
For the estimation of number, 15% of the villages are selected in the State forcomplete enumeration of livestock population.(5% in each season). The number ofvillages to be selected are allocated in each stratum (district) according to livestockpopulation. From these selected villages, a representative sample of 10 villages areselected for collection of detailed information for the estimation of district levelestimates of milk, egg, wool and meat. If staff resources are available, sample sizemay be increased to 20 villages. The selected villages will constitute the first stagesampling unit whereas selected households in a selected village will be the secondstage sampling unit, The animals selected from the selected households in a selectedvillage will be the third or the ultimate unit of sampling.
For other districts, in case each district is not a stratum, 5 villages at randomwill be selected in each of the districts. Other details regarding selection of secondstage units (SSU) and third/ ultimate stage units will remain same.
General:
Round: One round is of one-month duration. Four rounds constitute oneseason.Season: Three seasons in one year are as follows
Summer- 1st March to 30th JuneMonsoon: 1st July to 30th SeptemberWinter: 1st October to 28/29th February

Appendix (Methodology of Estimation) - 2
Estimation Procedure:
The procedure is discussed for one season and for one category of animals.
Let V = total number of villages in the state
'n = total number of villages for complete enumeration=0.15 * V
n =3'n
T = number of strata formed in a state Vh = number of villages in the stratum
nh = number of villages allocated to the hth stratum for completeenumeration of livestock numbers
Thus, ∑=
=T
hhnn
1
vsh = hv = sub sample of villages selected from the nh villages of the h-thstratum during the r-th round of the s-th season.
(A) -Estimation of Milk Production
srhiM = number of animals in milk as enumerated in the i-th village of the h-thstratum during the r-th round of the s-th season.
Assumption: changes in the number of animals within a season is negligible.
Thus srhiM = shiM for r = 1,2,3,4.
srhiU = number of households in the sample from the i-th village of the h-thstratum during the r-th round of the s-th season.
srhijm = number of animals in milk for which a day’s milk yield is recorded fromthe j-th household in the i-th village of the h-th stratum during the r-thround of the s-th season.
hiM ' = number of animals in milk in the i-th village of the h-th stratumaccording to the livestock census.
Thus ∑=
′=′hV
ihih MM
1
and ∑=
′=′T
hhMM
1
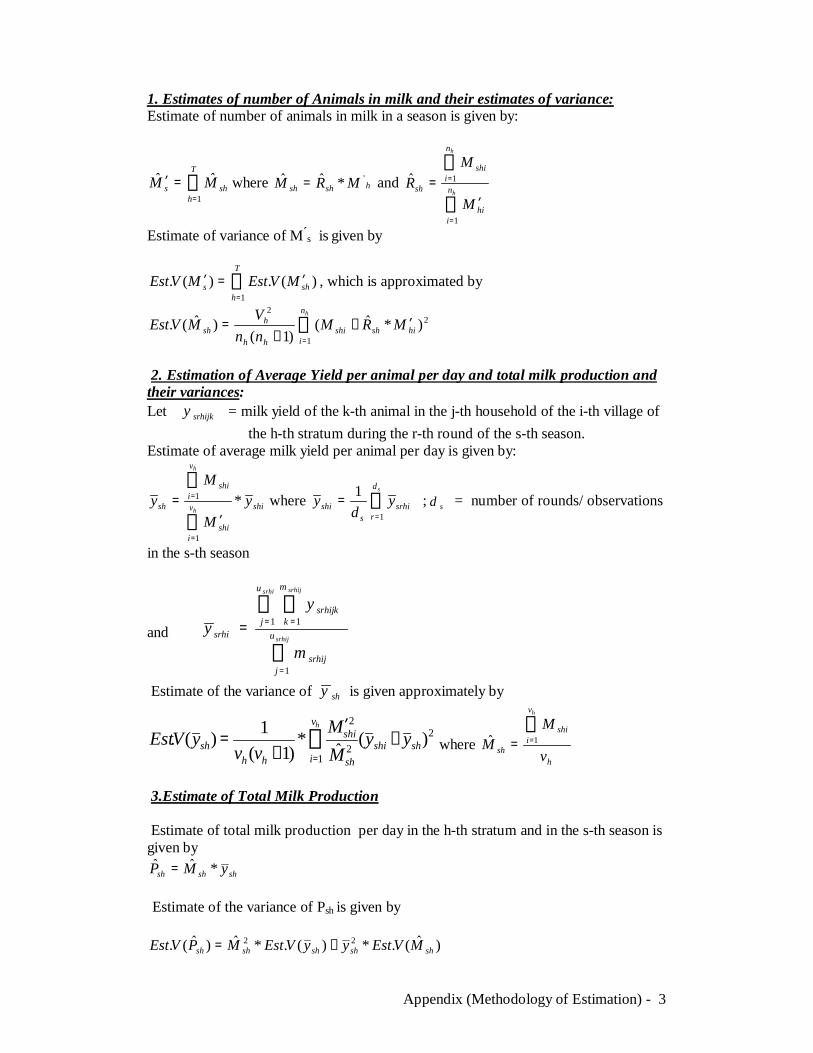
Appendix (Methodology of Estimation) - 3
1. Estimates of number of Animals in milk and their estimates of variance:Estimate of number of animals in milk in a season is given by:
∑=
=′T
hshs MM
1where hshsh MRM '*= and
∑
∑
=
=
′=
h
h
n
ihi
n
ishi
sh
M
MR
1
1
Estimate of variance of M s is given by
)(.)(.1
∑=
′=′T
hshs MVEstMVEst , which is approximated by
∑=
′−−
=hn
ihishshi
hh
hsh MRM
nnVMVEst
1
22
)*()1(
)(.
2. Estimation of Average Yield per animal per day and total milk production andtheir variances:Let srhijky = milk yield of the k-th animal in the j-th household of the i-th village of
the h-th stratum during the r-th round of the s-th season.Estimate of average milk yield per animal per day is given by:
shiv
ishi
v
ishi
sh yM
My
h
h
*
1
1
∑
∑
=
=
′= where ∑
=
=sd
rsrhi
sshi y
dy
1
1 ; sd = number of rounds/ observations
in the s-th season
and∑
∑ ∑
=
= ==srhij
srhi srhij
u
jsrhij
u
j
m
ksrhijk
srhi
m
yy
1
1 1
Estimate of the variance of shy is given approximately by
2
12
2
)(*)1(
1)(. shshi
v
i sh
shi
hhsh yy
MM
vvyVEst
h
−′
−= ∑
=where
h
v
ishi
sh v
MM
h
∑== 1
3.Estimate of Total Milk Production
Estimate of total milk production per day in the h-th stratum and in the s-th season isgiven by
shshsh yMP *=
Estimate of the variance of Psh is given by
)(.*)(.*)(. 22shshshshsh MVEstyyVEstMPVEst +=
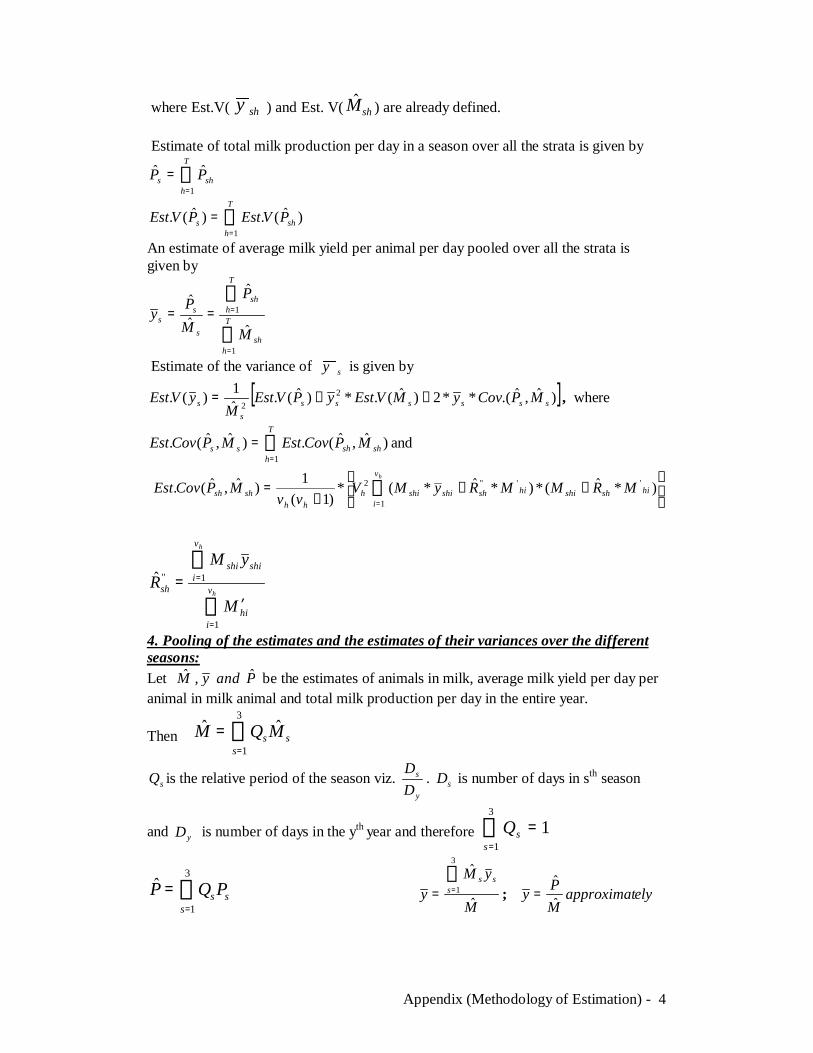
Appendix (Methodology of Estimation) - 4
where Est.V( shy ) and Est. V( shM ) are already defined.
Estimate of total milk production per day in a season over all the strata is given by
∑=
=T
hshs PP
1
)(.)(.1
∑=
=T
hshs PVEstPVEst
An estimate of average milk yield per animal per day pooled over all the strata isgiven by
∑
∑
=
=== T
hsh
T
hsh
s
ss
M
P
MPy
1
1
Estimate of the variance of sy is given by
[ ]),.(**2)(.*)(.1)(. 22 sssssss
s MPCovyMVEstyPVEstM
yVEst −+= , where
),(.),(.1
∑=
=T
hshshss MPCovEstMPCovEst and
−−
−= ∑
=
hv
ihishshihishshishih
hhshsh MRMMRyMV
vvMPCovEst
1
''''2 )*(*)**(*)1(
1),(.
∑
∑
=
=
′=
h
h
v
ihi
v
ishishi
sh
M
yMR
1
1''
4. Pooling of the estimates and the estimates of their variances over the differentseasons:Let M , y and P be the estimates of animals in milk, average milk yield per day peranimal in milk animal and total milk production per day in the entire year.
Then ss
s MQM3
1∑
=
=
sQ is the relative period of the season viz.y
s
DD
. sD is number of days in sth season
and yD is number of days in the yth year and therefore 13
1=∑
=ssQ
ss
s PQP ∑=
=3
1 M
yMy s
ss
3
1∑
== ; elyapproximatMPy =
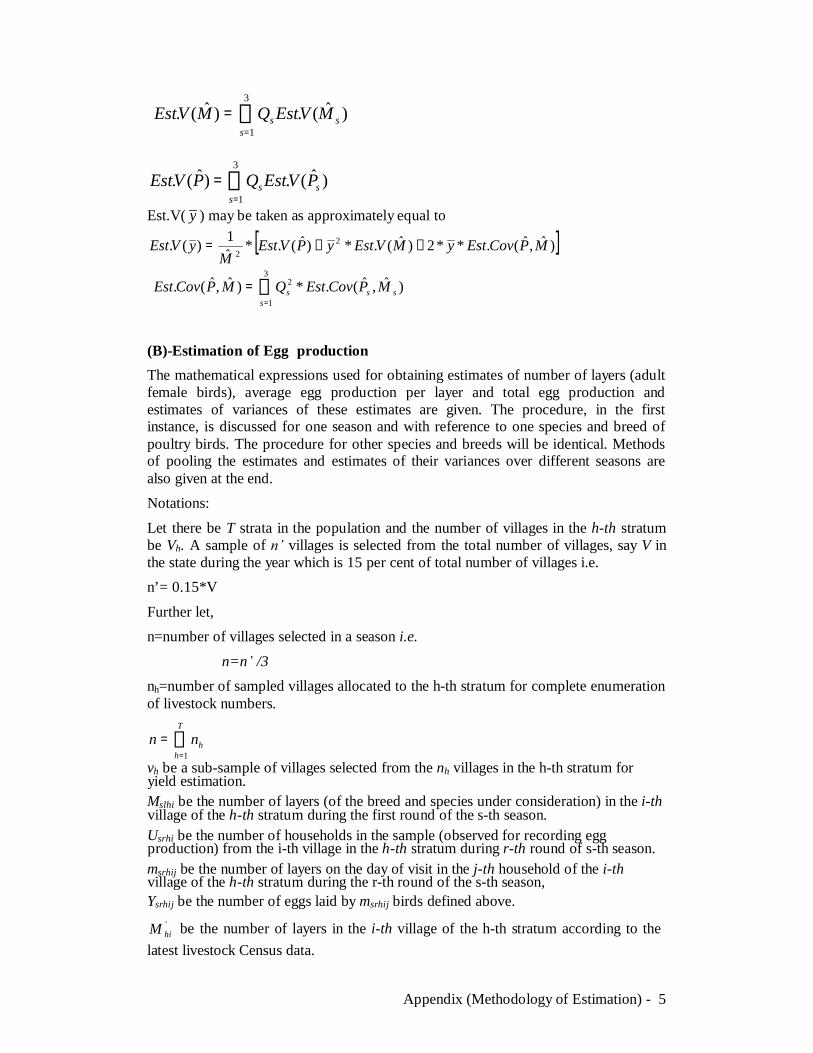
Appendix (Methodology of Estimation) - 5
)(.)(.3
1s
ss MVEstQMVEst ∑
=
=
)(.)(.3
1s
ss PVEstQPVEst ∑
=
=
Est.V( y ) may be taken as approximately equal to
[ ]),(.**2)(.*)(.*1)(. 22
MPCovEstyMVEstyPVEstM
yVEst −+=
),(.*),(.3
1
2ss
ss MPCovEstQMPCovEst ∑
=
=
(B)-Estimation of Egg productionThe mathematical expressions used for obtaining estimates of number of layers (adultfemale birds), average egg production per layer and total egg production andestimates of variances of these estimates are given. The procedure, in the firstinstance, is discussed for one season and with reference to one species and breed ofpoultry birds. The procedure for other species and breeds will be identical. Methodsof pooling the estimates and estimates of their variances over different seasons arealso given at the end.Notations:
Let there be T strata in the population and the number of villages in the h-th stratumbe Vh. A sample of villages is selected from the total number of villages, say V inthe state during the year which is 15 per cent of total number of villages i.e.n’= 0.15*V
Further let,n=number of villages selected in a season i.e.
n=n /3nh=number of sampled villages allocated to the h-th stratum for complete enumerationof livestock numbers.
∑=
=T
hhnn
1vh be a sub-sample of villages selected from the nh villages in the h-th stratum foryield estimation.Mslhi be the number of layers (of the breed and species under consideration) in the i-thvillage of the h-th stratum during the first round of the s-th season.Usrhi be the number of households in the sample (observed for recording eggproduction) from the i-th village in the h-th stratum during r-th round of s-th season.msrhij be the number of layers on the day of visit in the j-th household of the i-thvillage of the h-th stratum during the r-th round of the s-th season,Ysrhij be the number of eggs laid by msrhij birds defined above.
'hiM be the number of layers in the i-th village of the h-th stratum according to the
latest livestock Census data.
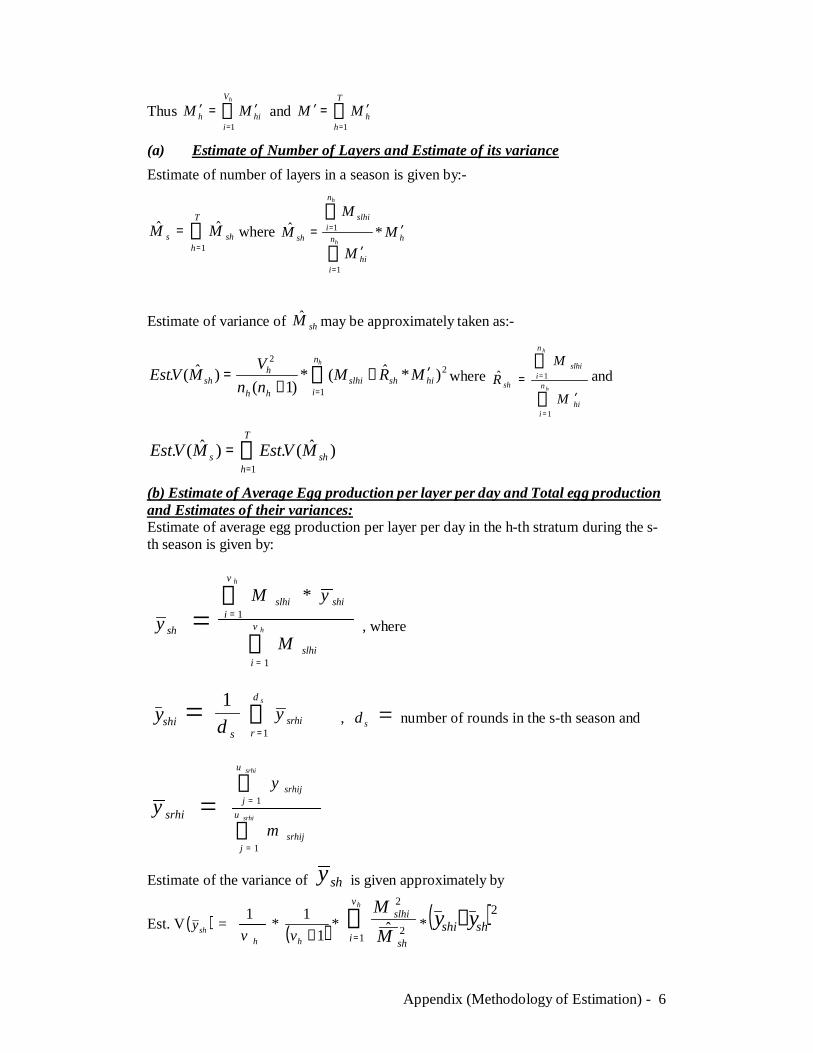
Appendix (Methodology of Estimation) - 6
Thus ∑=
′=′hV
ihih MM
1 and ∑
=
′=′T
hhMM
1
(a) Estimate of Number of Layers and Estimate of its varianceEstimate of number of layers in a season is given by:-
∑=
=T
hshs MM
1where hn
ihi
n
islhi
sh MM
MM
h
h
′′
=
∑
∑
=
= *
1
1
Estimate of variance of shM may be approximately taken as:-
2
1
2
)*(*)1(
)(. ∑=
′−−
=hn
ihishslhi
hh
hsh MRM
nnV
MVEst where
∑
∑
=
=
′=
h
h
n
ihi
n
islhi
sh
M
MR
1
1 and
∑=
=T
hshs MVEstMVEst
1
)(.)(.
(b) Estimate of Average Egg production per layer per day and Total egg productionand Estimates of their variances:Estimate of average egg production per layer per day in the h-th stratum during the s-th season is given by:
shy =∑
∑
=
=h
h
v
islhi
v
ishislhi
M
yM
1
1*
, where
shiy =sd
1∑
=
sd
rsrhiy
1 , sd = number of rounds in the s-th season and
srhiy =∑
∑
=
=
srhi
srhi
u
jsrhij
u
jsrhij
m
y
1
1
Estimate of the variance of shy is given approximately by
Est. V ( )shy =hv
1* )( 1
1−hv
* ∑=
hv
i sh
slhi
MM
12
2
* ( )2shshi yy −
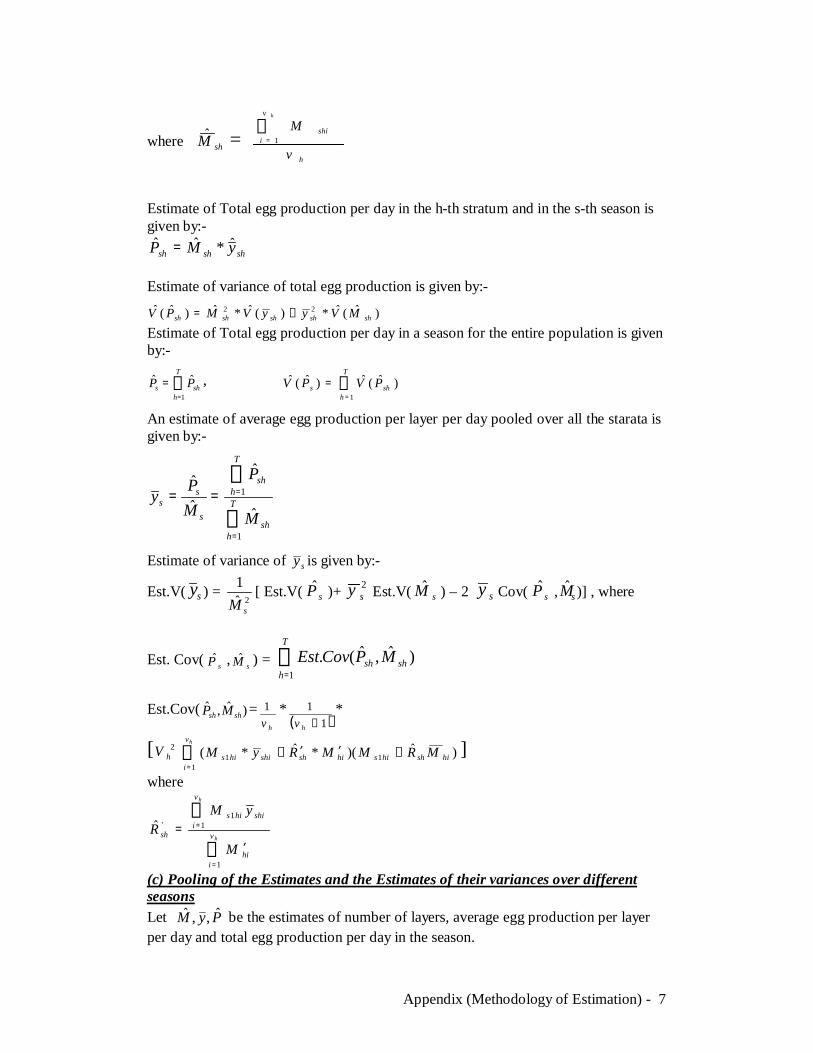
Appendix (Methodology of Estimation) - 7
where shM =h
v
ishi
v
Mh
∑= 1
Estimate of Total egg production per day in the h-th stratum and in the s-th season isgiven by:-
shshsh yMP *=
Estimate of variance of total egg production is given by:-
)(*)(*)( 22shshshshsh MVyyVMPV +=
Estimate of Total egg production per day in a season for the entire population is givenby:-
∑=
=T
hshs PP
1
, )()(1
∑=
=T
hshs PVPV
An estimate of average egg production per layer per day pooled over all the starata isgiven by:-
∑
∑
=
=== T
hsh
T
hsh
s
ss
M
P
MPy
1
1
Estimate of variance of sy is given by:-
Est.V( sy ) =2
1
sM[ Est.V( sP )+ 2
sy Est.V( sM ) – 2 sy Cov( sP , sM )] , where
Est. Cov( sP , sM ) = ),(.1
sh
T
hsh MPCovEst∑
=
Est.Cov( ), shsh MP =hv
1 *)( 1
1−hv
*
[ 2hV ))(**( 1
11 hishhishishshi
v
ihis MRMMRyM
h
−′′−∑=
]where
∑
∑
=
=
′=
h
h
v
ihi
v
ishihis
sh
M
yMR
1
11
'
(c) Pooling of the Estimates and the Estimates of their variances over differentseasonsLet PyM ,, be the estimates of number of layers, average egg production per layerper day and total egg production per day in the season.
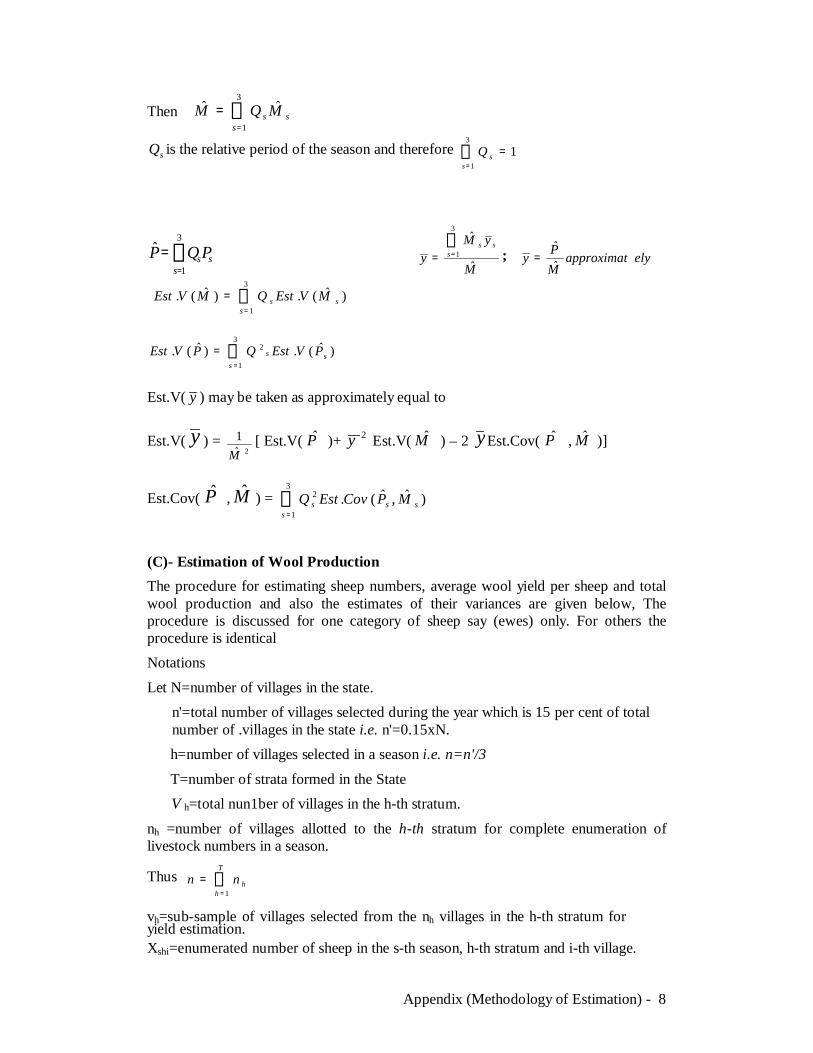
Appendix (Methodology of Estimation) - 8
Then ss
s MQM3
1∑
=
=
sQ is the relative period of the season and therefore 13
1
=∑=s
sQ
ss
sPQP ∑=
=3
1 M
yMy s
ss
3
1∑
== ; elyapproximatMPy =
)(.)(.3
1s
ss MVEstQMVEst ∑
=
=
)(.)(.3
1
2s
ss PVEstQPVEst ∑
=
=
Est.V( y ) may be taken as approximately equal to
Est.V( y ) =2
1M
[ Est.V( P )+ 2y Est.V( M ) – 2 yEst.Cov( P , M )]
Est.Cov( P , M ) = ),(.3
1
2ss
ss MPCovEstQ∑
=
(C)- Estimation of Wool ProductionThe procedure for estimating sheep numbers, average wool yield per sheep and totalwool production and also the estimates of their variances are given below, Theprocedure is discussed for one category of sheep say (ewes) only. For others theprocedure is identicalNotations
Let N=number of villages in the state.n'=total number of villages selected during the year which is 15 per cent of totalnumber of .villages in the state i.e. n'=0.15xN.h=number of villages selected in a season i.e. n=n'/3
T=number of strata formed in the State V h=total nun1ber of villages in the h-th stratum.
nh =number of villages allotted to the h-th stratum for complete enumeration oflivestock numbers in a season.
Thus ∑=
=T
hhnn
1
vh=sub-sample of villages selected from the nh villages in the h-th stratum foryield estimation.Xshi=enumerated number of sheep in the s-th season, h-th stratum and i-th village.
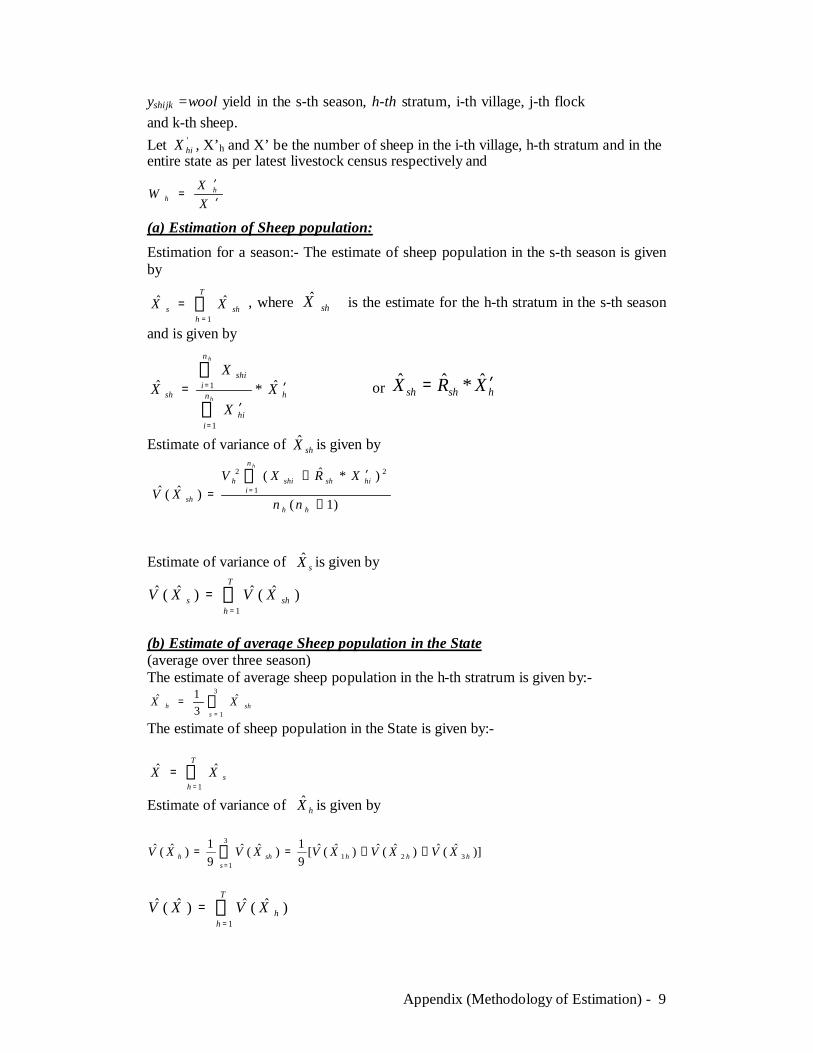
Appendix (Methodology of Estimation) - 9
yshijk =wool yield in the s-th season, h-th stratum, i-th village, j-th flockand k-th sheep.Let '
hiX , X’h and X’ be the number of sheep in the i-th village, h-th stratum and in theentire state as per latest livestock census respectively and
XXW h
h ′′
=
(a) Estimation of Sheep population:Estimation for a season:- The estimate of sheep population in the s-th season is givenby
∑=
=T
hshs XX
1
, where shX is the estimate for the h-th stratum in the s-th season
and is given by
hn
ihi
n
ishi
sh XX
XX
h
h
′′
=
∑
∑
=
= *
1
1 or hshsh XRX * ′=
Estimate of variance of shX is given by
)1(
)*()( 1
22
−
′−=
∑=
hh
n
ihishshih
sh nn
XRXVXV
h
Estimate of variance of sX is given by
∑=
=T
hshs XVXV
1
)()(
(b) Estimate of average Sheep population in the State(average over three season)The estimate of average sheep population in the h-th stratrum is given by:-
∑=
=3
131
sshh XX
The estimate of sheep population in the State is given by:-
∑=
=T
hsXX
1
Estimate of variance of hX is given by
)]()()([91)(
91)( 321
3
1hhh
sshh XVXVXVXVXV ++== ∑
=
)()(1
∑=
=T
hhXVXV
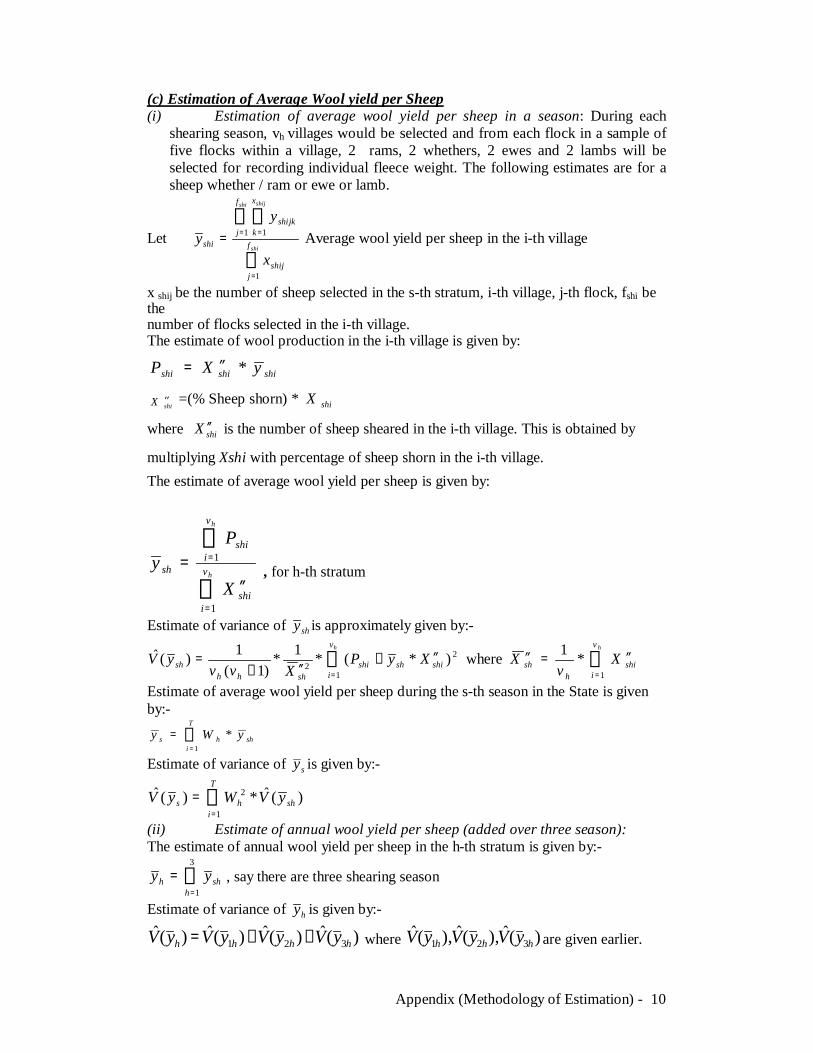
Appendix (Methodology of Estimation) - 10
(c) Estimation of Average Wool yield per Sheep(i) Estimation of average wool yield per sheep in a season: During each
shearing season, vh villages would be selected and from each flock in a sample offive flocks within a village, 2 rams, 2 whethers, 2 ewes and 2 lambs will beselected for recording individual fleece weight. The following estimates are for asheep whether / ram or ewe or lamb.
Let
∑
∑∑
=
= ==shi
shi shij
f
jshij
f
j
x
kshijk
shi
x
yy
1
1 1 Average wool yield per sheep in the i-th village
x shij be the number of sheep selected in the s-th stratum, i-th village, j-th flock, fshi bethenumber of flocks selected in the i-th village.The estimate of wool production in the i-th village is given by:
shishishi yXP *′′=
shiX ′′ =(% Sheep shorn) * shiX
where shiX ′′ is the number of sheep sheared in the i-th village. This is obtained by
multiplying Xshi with percentage of sheep shorn in the i-th village.The estimate of average wool yield per sheep is given by:
∑
∑
=
=
′′=
h
h
v
ishi
v
ishi
sh
X
Py
1
1 , for h-th stratum
Estimate of variance of shy is approximately given by:-
∑=
′′−′′−
=hv
ishishshi
shhhsh XyP
XvvyV
1
22 )*(*1*
)1(1)( where ∑
=
′′=′′hv
ishi
hsh X
vX
1*1
Estimate of average wool yield per sheep during the s-th season in the State is givenby:-
∑=
=T
ishhs yWy
1
*
Estimate of variance of sy is given by:-
∑=
=T
ishhs yVWyV
1
2 )(*)(
(ii) Estimate of annual wool yield per sheep (added over three season):The estimate of annual wool yield per sheep in the h-th stratum is given by:-
∑=
=3
1hshh yy , say there are three shearing season
Estimate of variance of hy is given by:-
)()()()( 321 hhhh yVyVyVyV ++= where )(),(),( 321 hhh yVyVyV are given earlier.
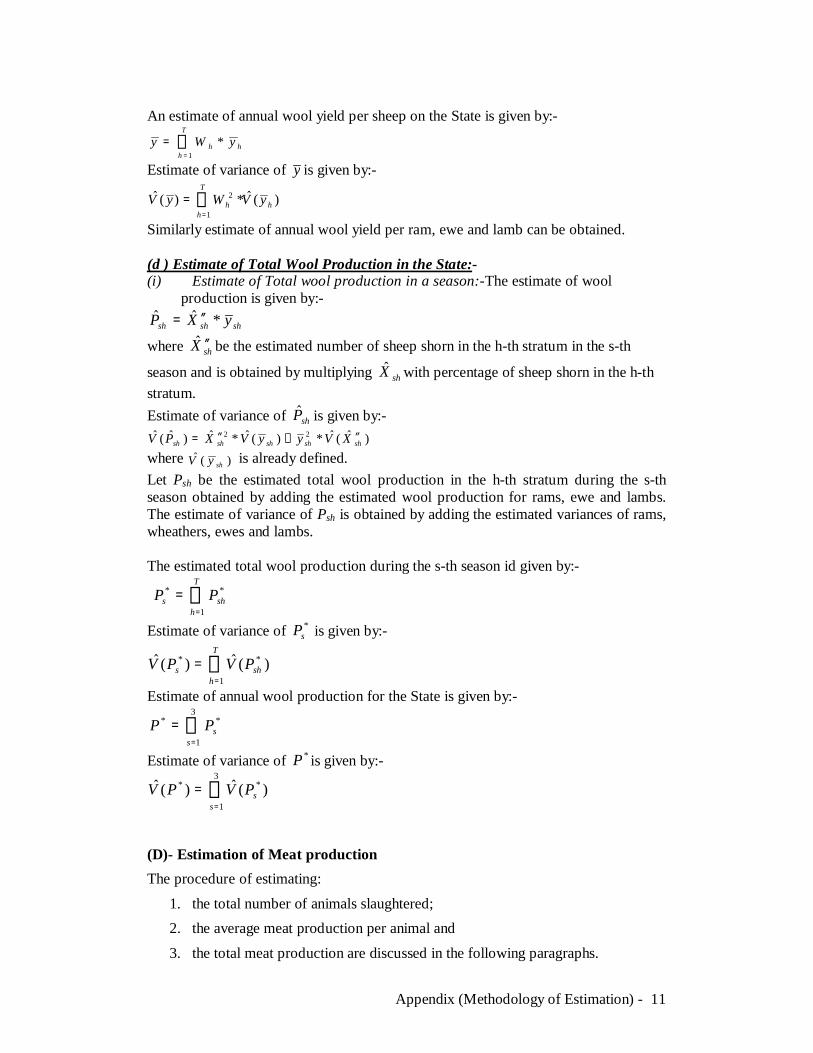
Appendix (Methodology of Estimation) - 11
An estimate of annual wool yield per sheep on the State is given by:-
∑=
=T
hhh yWy
1*
Estimate of variance of y is given by:-
)(*)(1
2h
T
hh yVWyV ∑
=
=
Similarly estimate of annual wool yield per ram, ewe and lamb can be obtained.
(d ) Estimate of Total Wool Production in the State:-(i) Estimate of Total wool production in a season:-The estimate of wool
production is given by:-
shshsh yXP *′′=
where shX ′′ be the estimated number of sheep shorn in the h-th stratum in the s-th
season and is obtained by multiplying shX with percentage of sheep shorn in the h-thstratum.Estimate of variance of shP is given by:-
)(*)(*)( 22shshshshsh XVyyVXPV ′′+′′=
where )( shyV is already defined.Let Psh be the estimated total wool production in the h-th stratum during the s-thseason obtained by adding the estimated wool production for rams, ewe and lambs.The estimate of variance of Psh is obtained by adding the estimated variances of rams,wheathers, ewes and lambs.
The estimated total wool production during the s-th season id given by:-
∑=
=T
hshs PP
1
**
Estimate of variance of *sP is given by:-
)()(1
** ∑=
=T
hshs PVPV
Estimate of annual wool production for the State is given by:-
∑=
=3
1
**
ssPP
Estimate of variance of *P is given by:-
)()(3
1
** ∑=
=s
sPVPV
(D)- Estimation of Meat productionThe procedure of estimating:
1. the total number of animals slaughtered;2. the average meat production per animal and
3. the total meat production are discussed in the following paragraphs.
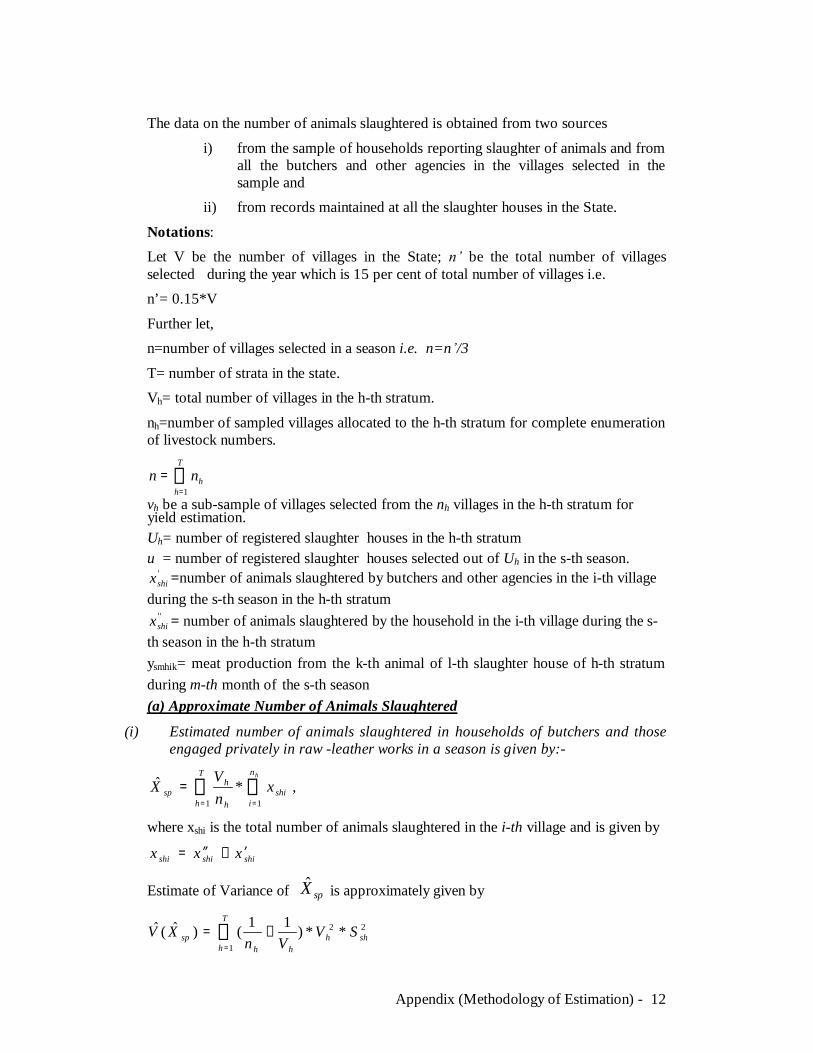
Appendix (Methodology of Estimation) - 12
The data on the number of animals slaughtered is obtained from two sources
i) from the sample of households reporting slaughter of animals and fromall the butchers and other agencies in the villages selected in thesample and
ii) from records maintained at all the slaughter houses in the State.
Notations:Let V be the number of villages in the State; be the total number of villagesselected during the year which is 15 per cent of total number of villages i.e.n’= 0.15*V
Further let,n=number of villages selected in a season i.e. n=n /3
T= number of strata in the state.Vh= total number of villages in the h-th stratum.
nh=number of sampled villages allocated to the h-th stratum for complete enumerationof livestock numbers.
∑=
=T
hhnn
1
vh be a sub-sample of villages selected from the nh villages in the h-th stratum foryield estimation.Uh= number of registered slaughter houses in the h-th stratumu = number of registered slaughter houses selected out of Uh in the s-th season.
'shix =number of animals slaughtered by butchers and other agencies in the i-th village
during the s-th season in the h-th stratum''
shix = number of animals slaughtered by the household in the i-th village during the s-th season in the h-th stratumysmhik= meat production from the k-th animal of l-th slaughter house of h-th stratumduring m-th month of the s-th season(a) Approximate Number of Animals Slaughtered
(i) Estimated number of animals slaughtered in households of butchers and thoseengaged privately in raw -leather works in a season is given by:-
∑∑==
=hn
ishi
T
h h
hsp x
nV
X11
* ,
where xshi is the total number of animals slaughtered in the i-th village and is given by
shishishi xxx ′+′′=
Estimate of Variance of spX is approximately given by
22
1**)11()( shh
h
T
h hsp SV
VnXV −= ∑
=
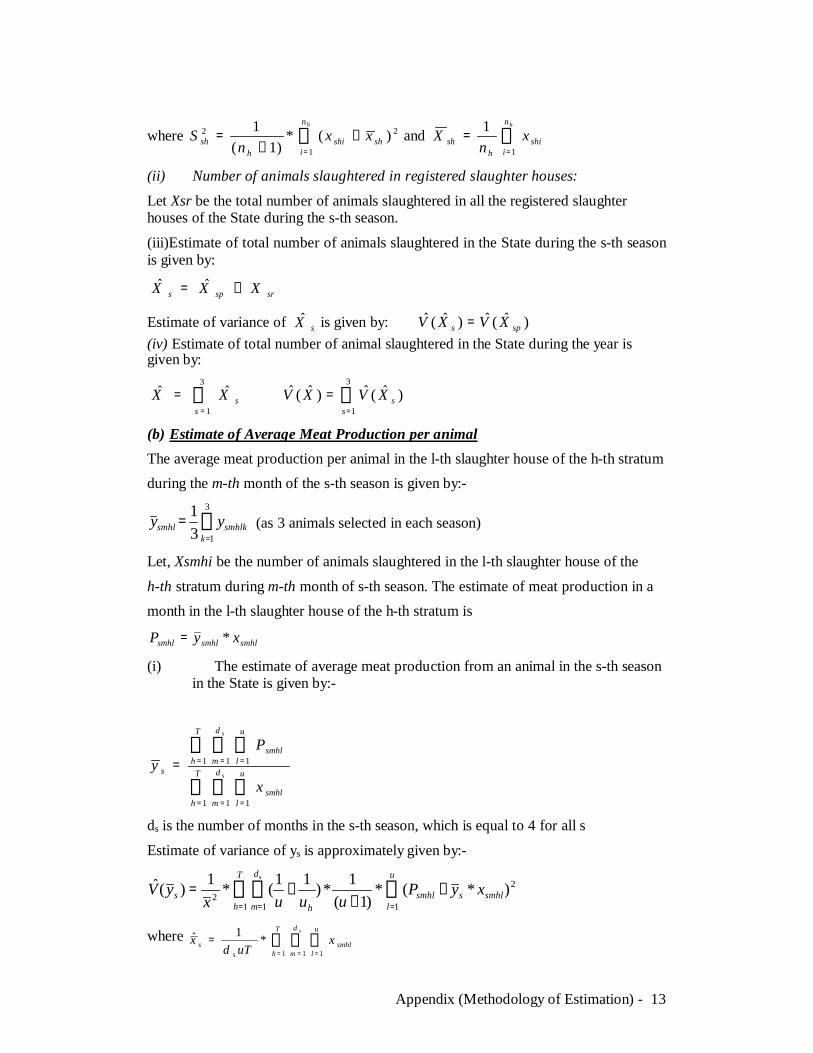
Appendix (Methodology of Estimation) - 13
where ∑=
−−
=hn
ishshi
hsh xx
nS
1
22 )(*)1(
1 and ∑=
=hn
ishi
hsh x
nX
1
1
(ii) Number of animals slaughtered in registered slaughter houses:
Let Xsr be the total number of animals slaughtered in all the registered slaughterhouses of the State during the s-th season.
(iii)Estimate of total number of animals slaughtered in the State during the s-th seasonis given by:
srsps XXX +=
Estimate of variance of sX is given by: )()( sps XVXV =(iv) Estimate of total number of animal slaughtered in the State during the year isgiven by:
∑=
=3
1ssXX )()(
3
1∑
=
=s
sXVXV
(b) Estimate of Average Meat Production per animalThe average meat production per animal in the l-th slaughter house of the h-th stratumduring the m-th month of the s-th season is given by:-
∑=
=3
131
ksmhlksmhl yy (as 3 animals selected in each season)
Let, Xsmhi be the number of animals slaughtered in the l-th slaughter house of the
h-th stratum during m-th month of s-th season. The estimate of meat production in amonth in the l-th slaughter house of the h-th stratum is
smhlsmhlsmhl xyP *=
(i) The estimate of average meat production from an animal in the s-th seasonin the State is given by:-
∑ ∑ ∑
∑ ∑ ∑
= = =
= = ==T
h
d
m
u
lsmhl
T
h
d
m
u
lsmhl
s s
s
x
Py
1 1 1
1 1 1
ds is the number of months in the s-th season, which is equal to 4 for all s
Estimate of variance of ys is approximately given by:-
2
11 12 )*(*
)1(1*)11(*1)( ∑∑∑
== =
−−
−=u
lsmhlssmhl
h
T
h
d
ms xyP
uuuxyV
s
where ∑ ∑ ∑= = =
=T
h
d
m
u
lsmhl
ss
s
xuTd
x1 1 1
*1
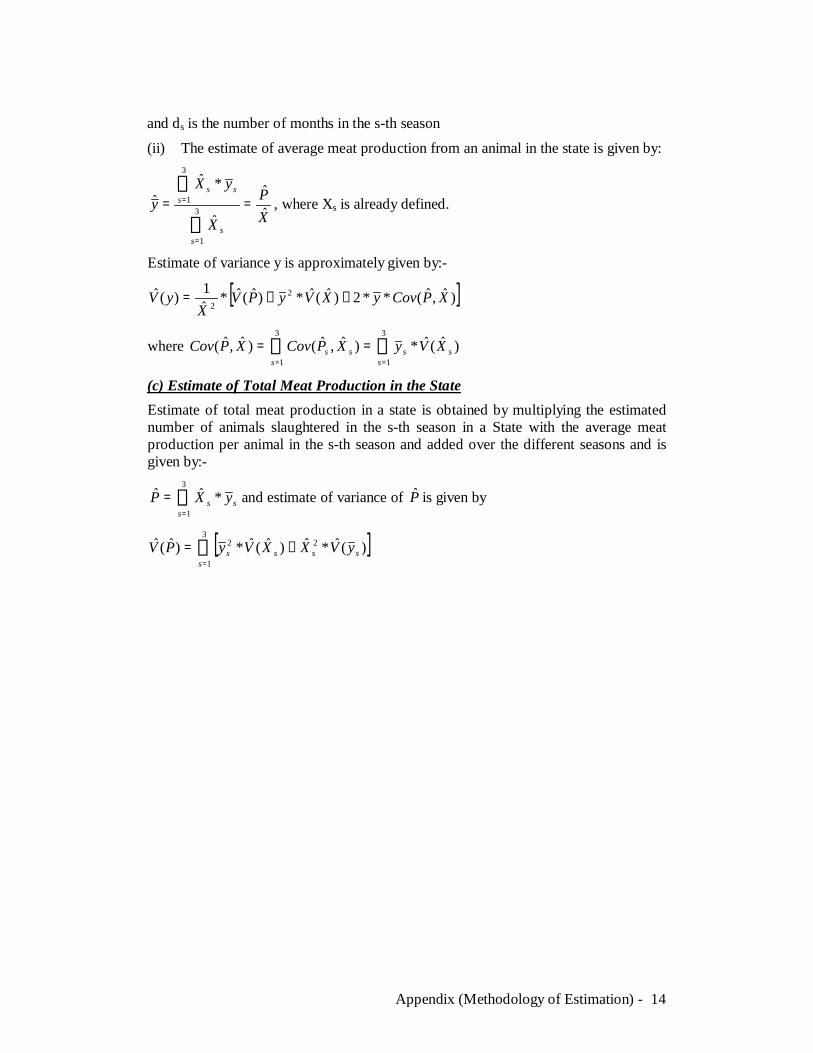
Appendix (Methodology of Estimation) - 14
and ds is the number of months in the s-th season
(ii) The estimate of average meat production from an animal in the state is given by:
XP
X
yXy
ss
sss *
3
1
3
1 ==
∑
∑
=
= , where Xs is already defined.
Estimate of variance y is approximately given by:-
[ ]),(**2)(*)(*1)( 22
XPCovyXVyPVX
yV −+=
where ∑ ∑= =
==3
1
3
1
)(*),(),(s s
ssss XVyXPCovXPCov
(c) Estimate of Total Meat Production in the StateEstimate of total meat production in a state is obtained by multiplying the estimatednumber of animals slaughtered in the s-th season in a State with the average meatproduction per animal in the s-th season and added over the different seasons and isgiven by:-
∑=
=3
1
*s
ss yXP and estimate of variance of P is given by
[ ]∑=
+=3
1
22 )(*)(*)(s
ssss yVXXVyPV


![Animal husbandry and mollusc gathering [in the Hellenistic town of New Halos]](https://static.fdokumen.com/doc/165x107/632b357dba70062a77056249/animal-husbandry-and-mollusc-gathering-in-the-hellenistic-town-of-new-halos.jpg)

