Development of voicing perception in French: Comparing adults, adolescents, and children
11
Development of voicing perception in French: Comparing adults, adolescents, and children Victoria Medina a, , Ingrid Hoonhorst b,d , Caroline Bogliotti c , Willy Serniclaes a a Laboratoire Psychologie de la Perception, CNRS UMR8158 & U. Descartes, 45, rue des Saints P eres, 75270 Paris Cedex 06, France b Unite´ de Recherche en Neurosciences Cognitives, Universite´ Libre de Bruxelles, Campus du Solbosch, B-1050 Bruxelles, Belgium c Laboratoire Modyco, CNRS UMR7114 & Universite´ Paris Ouest Nanterre la De´fense, 200 avenue de la Re ´publique, 92000 Nanterre, France d Fonds National de la Recherche Scientifique (FNRS), 1000 Bruxelles, Belgium article info Article history: Received 9 February 2009 Received in revised form 17 June 2010 Accepted 18 June 2010 abstract Previous studies suggest that the development of the perception of speech features is based on the adaptation of universal predispositions to the particular categories present in the native language. Previous studies point to a long-lasting development of the location and the precision of perceptual boundaries. However, there is no clear evidence about changes in ‘‘categorical perception’’, i.e. in the degree of equivalence of identification and discrimination boundaries. The objective of the present study was to investigate the development of boundary location and precision between late childhood and adulthood, and to gather evidence for possible changes in categorical perception during this period. Voicing perception in French stops was investigated with both identification and discrimination data in children (9-year-olds), adolescents (17-year-olds), and adults. The results confirmed the effect of age on boundary precision, but did not show an effect of age on either boundary location or on categorical perception. The results also suggest that the development of categorization performance starts around the boundary and is followed by decreased sensitivity near the prototypes. & 2010 Elsevier Ltd. All rights reserved. 1. Introduction A basic problem in the study of speech development is to understand how universal properties contribute to the perception of language-specific categories. Studies with children below one year of age point to their ability to perceive the multiple phonetic contrasts present in the world’s languages (for a review: Vihman, 1996). This universal potential consists not only sound categories but also auditory boundaries between different sound categories, i.e. ‘‘basic cuts’’ in the acoustic space (Kuhl, 2004 1 ). These boundaries are conceptually close to the ‘‘features’’ of the linguistic systems, especially when the latter are defined in acoustic terms (Jakobson, Fant, & Halle, 1952). Features are units of difference: not categories but oppositions between categories (Jakobson, 1973, p. 130). Boundaries correspond to the limits between categories, have measurable properties, and can be used as the empirical correlates of features. The adaptation of these universal boundaries to the phonolo- gical categories of the linguistic environment (i.e. to the phonetic categories specific to a given language) is a complex process. The boundaries are not only simply selected but also combined in specific ways in order to cope with the multiple possible phonological contrasts in the world’s languages (Hoonhorst et al., 2009a). The development of language-specific boundaries is also a long-lasting process which starts fairly early, before one year of age, and continues later all through childhood (Burnham, Tyler, & Horlyck, 2002). Both the location and the precision of the perceptual boundaries change during these periods, revealing a progressive attunement of the universal settings to the contrasts prevailing in the ambient language (Aslin & Pisoni, 1980). One pending question about the development of speech perception is whether it also entails changes in ‘‘Categorical Perception’’ (CP). CP depends on the relationship between discrimination and identification: the stronger the relationship, the higher the degree of CP (Damper & Harnad, 2000; Harnad, 1987; Liberman et al., 1957). CP is perfect when observed discrimination scores coincide with those expected from identi- fication, and the degree of CP is assessed by the difference between the observed and expected discrimination scores. Observed discrimination scores correspond to actual discrimina- tion responses (e.g. the correct discrimination scores or Contents lists available at ScienceDirect journal homepage: www.elsevier.com/locate/phonetics Journal of Phonetics 0095-4470/$ - see front matter & 2010 Elsevier Ltd. All rights reserved. doi:10.1016/j.wocn.2010.06.002 Corresponding author. Tel.: + 33 142864320; fax: + 33 142863322. E-mail address: [email protected] (V. Medina). 1 The boundary along the stimulus continuum corresponds to the point on the continuum, which leads to a 50% identification score. Notice that there are instances where identification scores hover around 50% (e.g. see Caramazza et al., 1973), indicating that boundary precision is so low that it is not possible to assign it to a single point along the acoustic continuum. Notice also that when identification data cannot easily be collected, e.g. with young children, the location and precision of the boundary can be assessed with discrimination data. The location of the boundary is then defined as the point on the continuum for which there is a peak in the discrimination function. Journal of Phonetics 38 (2010) 493–503
-
Upload
independent -
Category
Documents
-
view
1 -
download
0
Transcript of Development of voicing perception in French: Comparing adults, adolescents, and children

Journal of Phonetics 38 (2010) 493–503
Contents lists available at ScienceDirect
Journal of Phonetics
0095-44
doi:10.1
� Corr
E-m1 Th
continu
instance
1973), i
it to a
identific
location
The loc
which t
journal homepage: www.elsevier.com/locate/phonetics
Development of voicing perception in French: Comparing adults, adolescents,and children
Victoria Medina a,�, Ingrid Hoonhorst b,d, Caroline Bogliotti c, Willy Serniclaes a
a Laboratoire Psychologie de la Perception, CNRS UMR8158 & U. Descartes, 45, rue des Saints P�eres, 75270 Paris Cedex 06, Franceb Unite de Recherche en Neurosciences Cognitives, Universite Libre de Bruxelles, Campus du Solbosch, B-1050 Bruxelles, Belgiumc Laboratoire Modyco, CNRS UMR7114 & Universite Paris Ouest Nanterre la Defense, 200 avenue de la Republique, 92000 Nanterre, Franced Fonds National de la Recherche Scientifique (FNRS), 1000 Bruxelles, Belgium
a r t i c l e i n f o
Article history:
Received 9 February 2009
Received in revised form
17 June 2010
Accepted 18 June 2010
70/$ - see front matter & 2010 Elsevier Ltd. A
016/j.wocn.2010.06.002
esponding author. Tel.: +33 142864320; fax:
ail address: [email protected] (V. Medin
e boundary along the stimulus continuum co
um, which leads to a 50% identification s
s where identification scores hover around 5
ndicating that boundary precision is so low th
single point along the acoustic continuu
ation data cannot easily be collected, e.g
and precision of the boundary can be assess
ation of the boundary is then defined as the
here is a peak in the discrimination function
a b s t r a c t
Previous studies suggest that the development of the perception of speech features is based on the
adaptation of universal predispositions to the particular categories present in the native language.
Previous studies point to a long-lasting development of the location and the precision of perceptual
boundaries. However, there is no clear evidence about changes in ‘‘categorical perception’’, i.e. in the
degree of equivalence of identification and discrimination boundaries. The objective of the present
study was to investigate the development of boundary location and precision between late childhood
and adulthood, and to gather evidence for possible changes in categorical perception during this period.
Voicing perception in French stops was investigated with both identification and discrimination data in
children (9-year-olds), adolescents (17-year-olds), and adults. The results confirmed the effect of age on
boundary precision, but did not show an effect of age on either boundary location or on categorical
perception. The results also suggest that the development of categorization performance starts around
the boundary and is followed by decreased sensitivity near the prototypes.
& 2010 Elsevier Ltd. All rights reserved.
1. Introduction
A basic problem in the study of speech development is tounderstand how universal properties contribute to the perceptionof language-specific categories. Studies with children below oneyear of age point to their ability to perceive the multiple phoneticcontrasts present in the world’s languages (for a review: Vihman,1996). This universal potential consists not only sound categoriesbut also auditory boundaries between different sound categories,i.e. ‘‘basic cuts’’ in the acoustic space (Kuhl, 20041). Theseboundaries are conceptually close to the ‘‘features’’ of thelinguistic systems, especially when the latter are defined inacoustic terms (Jakobson, Fant, & Halle, 1952). Features are unitsof difference: not categories but oppositions between categories(Jakobson, 1973, p. 130). Boundaries correspond to the limits
ll rights reserved.
+33 142863322.
a).
rresponds to the point on the
core. Notice that there are
0% (e.g. see Caramazza et al.,
at it is not possible to assign
m. Notice also that when
. with young children, the
ed with discrimination data.
point on the continuum for
.
between categories, have measurable properties, and can be usedas the empirical correlates of features.
The adaptation of these universal boundaries to the phonolo-gical categories of the linguistic environment (i.e. to the phoneticcategories specific to a given language) is a complex process. Theboundaries are not only simply selected but also combined inspecific ways in order to cope with the multiple possiblephonological contrasts in the world’s languages (Hoonhorstet al., 2009a). The development of language-specific boundariesis also a long-lasting process which starts fairly early, before oneyear of age, and continues later all through childhood (Burnham,Tyler, & Horlyck, 2002). Both the location and the precision of theperceptual boundaries change during these periods, revealing aprogressive attunement of the universal settings to the contrastsprevailing in the ambient language (Aslin & Pisoni, 1980).
One pending question about the development of speechperception is whether it also entails changes in ‘‘CategoricalPerception’’ (CP). CP depends on the relationship betweendiscrimination and identification: the stronger the relationship,the higher the degree of CP (Damper & Harnad, 2000; Harnad,1987; Liberman et al., 1957). CP is perfect when observeddiscrimination scores coincide with those expected from identi-fication, and the degree of CP is assessed by the differencebetween the observed and expected discrimination scores.Observed discrimination scores correspond to actual discrimina-tion responses (e.g. the correct discrimination scores or
V. Medina et al. / Journal of Phonetics 38 (2010) 493–503494
d0-transforms of stimulus pairs in an AX discrimination task)whereas the expected discrimination scores are derived fromidentification responses (e.g. the identification scores of the samestimuli presented individually).
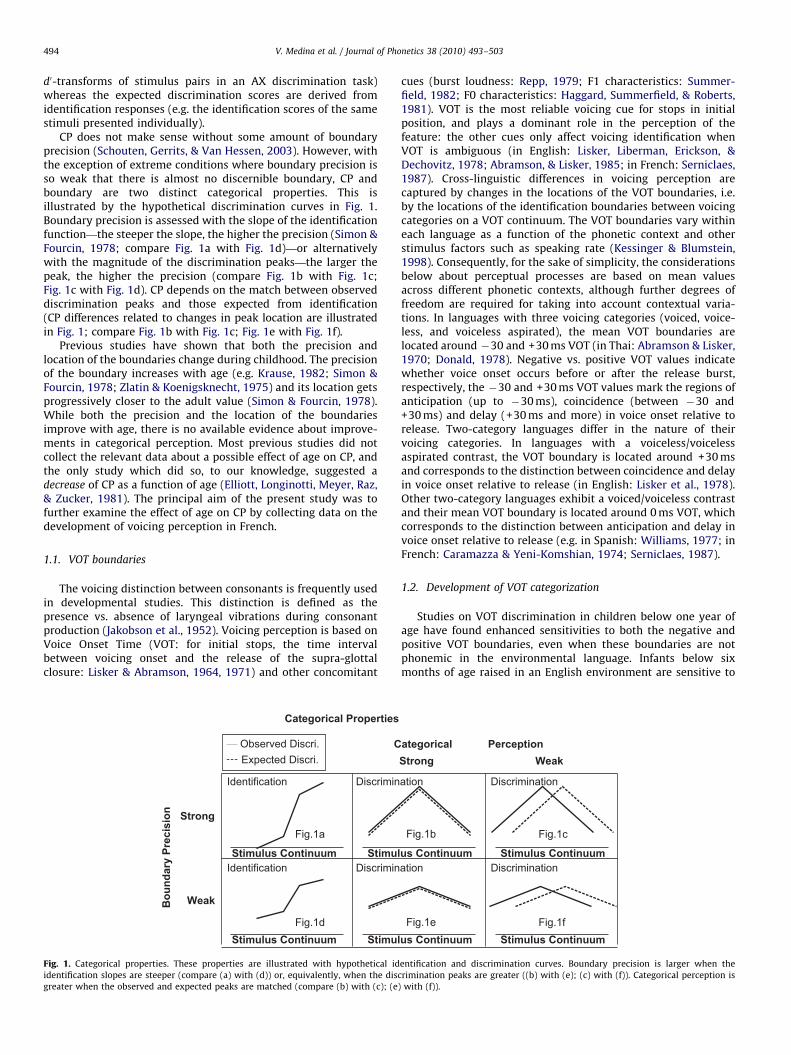
CP does not make sense without some amount of boundaryprecision (Schouten, Gerrits, & Van Hessen, 2003). However, withthe exception of extreme conditions where boundary precision isso weak that there is almost no discernible boundary, CP andboundary are two distinct categorical properties. This isillustrated by the hypothetical discrimination curves in Fig. 1.Boundary precision is assessed with the slope of the identificationfunction—the steeper the slope, the higher the precision (Simon &Fourcin, 1978; compare Fig. 1a with Fig. 1d)—or alternativelywith the magnitude of the discrimination peaks—the larger thepeak, the higher the precision (compare Fig. 1b with Fig. 1c;Fig. 1c with Fig. 1d). CP depends on the match between observeddiscrimination peaks and those expected from identification(CP differences related to changes in peak location are illustratedin Fig. 1; compare Fig. 1b with Fig. 1c; Fig. 1e with Fig. 1f).
Previous studies have shown that both the precision andlocation of the boundaries change during childhood. The precisionof the boundary increases with age (e.g. Krause, 1982; Simon &Fourcin, 1978; Zlatin & Koenigsknecht, 1975) and its location getsprogressively closer to the adult value (Simon & Fourcin, 1978).While both the precision and the location of the boundariesimprove with age, there is no available evidence about improve-ments in categorical perception. Most previous studies did notcollect the relevant data about a possible effect of age on CP, andthe only study which did so, to our knowledge, suggested adecrease of CP as a function of age (Elliott, Longinotti, Meyer, Raz,& Zucker, 1981). The principal aim of the present study was tofurther examine the effect of age on CP by collecting data on thedevelopment of voicing perception in French.
1.1. VOT boundaries
The voicing distinction between consonants is frequently usedin developmental studies. This distinction is defined as thepresence vs. absence of laryngeal vibrations during consonantproduction (Jakobson et al., 1952). Voicing perception is based onVoice Onset Time (VOT: for initial stops, the time intervalbetween voicing onset and the release of the supra-glottalclosure: Lisker & Abramson, 1964, 1971) and other concomitant
Bou
ndar
y Pr
ecis
ion
Weak
C
Fig.1a
Categorical Properties
Expected Discri.Observed Discri.
Strong
Identification
Identification
Discrimin
Discrimin
Fig.1d
Stimulus Continuum Stimul
Stimulus Continuum Stimul
Fig. 1. Categorical properties. These properties are illustrated with hypothetical id
identification slopes are steeper (compare (a) with (d)) or, equivalently, when the disc
greater when the observed and expected peaks are matched (compare (b) with (c); (e)
cues (burst loudness: Repp, 1979; F1 characteristics: Summer-field, 1982; F0 characteristics: Haggard, Summerfield, & Roberts,1981). VOT is the most reliable voicing cue for stops in initialposition, and plays a dominant role in the perception of thefeature: the other cues only affect voicing identification whenVOT is ambiguous (in English: Lisker, Liberman, Erickson, &Dechovitz, 1978; Abramson, & Lisker, 1985; in French: Serniclaes,1987). Cross-linguistic differences in voicing perception arecaptured by changes in the locations of the VOT boundaries, i.e.by the locations of the identification boundaries between voicingcategories on a VOT continuum. The VOT boundaries vary withineach language as a function of the phonetic context and otherstimulus factors such as speaking rate (Kessinger & Blumstein,1998). Consequently, for the sake of simplicity, the considerationsbelow about perceptual processes are based on mean valuesacross different phonetic contexts, although further degrees offreedom are required for taking into account contextual varia-tions. In languages with three voicing categories (voiced, voice-less, and voiceless aspirated), the mean VOT boundaries arelocated around �30 and +30 ms VOT (in Thai: Abramson & Lisker,1970; Donald, 1978). Negative vs. positive VOT values indicatewhether voice onset occurs before or after the release burst,respectively, the �30 and +30 ms VOT values mark the regions ofanticipation (up to �30 ms), coincidence (between �30 and+30 ms) and delay (+30 ms and more) in voice onset relative torelease. Two-category languages differ in the nature of theirvoicing categories. In languages with a voiceless/voicelessaspirated contrast, the VOT boundary is located around +30 msand corresponds to the distinction between coincidence and delayin voice onset relative to release (in English: Lisker et al., 1978).Other two-category languages exhibit a voiced/voiceless contrastand their mean VOT boundary is located around 0 ms VOT, whichcorresponds to the distinction between anticipation and delay invoice onset relative to release (e.g. in Spanish: Williams, 1977; inFrench: Caramazza & Yeni-Komshian, 1974; Serniclaes, 1987).
1.2. Development of VOT categorization
Studies on VOT discrimination in children below one year ofage have found enhanced sensitivities to both the negative andpositive VOT boundaries, even when these boundaries are notphonemic in the environmental language. Infants below sixmonths of age raised in an English environment are sensitive to
PerceptionWeakStrong
ategorical
Fig.1c
ation Discrimination
Discriminationation
Fig.1b
Fig.1fFig.1e
us Continuum Stimulus Continuum
us Continuum Stimulus Continuum
entification and discrimination curves. Boundary precision is larger when the
rimination peaks are greater ((b) with (e); (c) with (f)). Categorical perception is
with (f)).
V. Medina et al. / Journal of Phonetics 38 (2010) 493–503 495
both VOT boundaries, although only the positive VOT boundary isphonological in this language (Aslin, Pisoni, Hennessy, & Perey,1981). Similarly, infants below six months of age raised in aSpanish or in a French environment also react to both the negativeand positive VOT boundaries, even though the phonologicalboundary is located at 0 ms in these languages (in Spanish: Lasky,Syrdal-Lasky, & Klein, 1975; in French: Hoonhorst et al., 2009a).This suggests that the negative and positive VOT boundaries areeither innate or arise very early in perceptual development, andthat language-specific boundaries are acquired later throughexposure to the environment. Children raised in a French-speaking environment react more strongly to the �30 and+30 ms VOT boundaries around four months of age, but theyreact more to the French/Spanish 0 ms boundary around eightmonths of age (Hoonhorst et al., 2009a). However, English-speaking infants also react more to the 0 ms VOT boundaryaround six to eight months of age and they react (again) more tothe English VOT boundary (positive VOT) only at around10–12 months of age (Burns, Yoshida, Hill, & Werker, 2007;Rivera-Gaxiola, Silva-Peyrera, & Kuhl, 2005; in production:Whalen, Levitt, & Goldstein, 20072). In summary, data collectedfrom children raised in different languages suggest that there is auniversal sensitivity to negative and positive boundaries beforesix months of age, and that language-specific boundaries areobtained either by combination between universal boundaries(French and Spanish) or by selection between these boundaries(English). Combination between universal boundaries means thatnew boundaries emerge at other locations on the VOT continuum.Selection between universal boundaries does not mean that theunselected boundaries are lost, but instead that the selectedboundaries are perceived with higher precision.
The early development of VOT boundaries is fairly complex,and we can ask whether the changes in VOT categorization arecompleted around one year of age or whether they continue todevelop later. Previous studies make it clear that the discrimina-tion accuracy of contrasts straddling phonological boundariescontinues to increase after one year of age (Elliott, Busse,Partridge, Rupert, & de Graaf, 1986; Elliott et al., 1981).Furthermore, the slope of the identification function becomessteeper between two years of age and adulthood (Burnham,Earnshaw, & Clark, 1991; Hazan & Barrett, 2000; Krause, 1982;Simon & Fourcin, 1978; Zlatin & Koenigsknecht, 1975). As boththe slope of the identification function and the magnitude of theboundary discrimination peak are categorical precision para-meters, the results of these studies indicate that categoricalprecision continues to increase up to the end of childhood. Thelocation of the VOT boundary also continues to change after oneyear of age (Simon & Fourcin, 1978). However, none of thesestudies showed an improvement of categorical perception, i.e. ofthe relationship between identification and discrimination.Rather, they only showed that the precision of the VOTboundaries continues to increase well after one year of age.
1.3. The present study
In summary, previous studies show that the location and theprecision of the perceptual boundaries change before one year of ageand that there is a long-lasting development in boundary precision,which only ends during adolescence. However, there is no clear
2 The relatively slow development of the phonemic boundary in children from
English-language environments might be related to the development of speech
production. A study on VOT production in French and English babbling of infants
at 9 and 12 months suggests that infants are able to control the voiced category
(negative VOT) more successfully than the aspiration category (positive VOT) and
the later is not mastered by English infants before 12 months (Whalen et al., 2007).
evidence for changes in either the locations of the boundaries or intheir categorical perception (i.e. in the match between identificationand discrimination boundaries) after one year of age.
The aim of the present study was to examine the developmentof voicing perception in French by comparing the identificationand discrimination performance of 9-year-old children, 17-year-old adolescents, and adults. This study wanted to confirm the latedevelopment of boundary precision at the end of infancy, alreadyfound in English for ages ranging between 2 and 14 years(Burnham et al., 1991; Elliott et al., 1981, 1986; Hazan & Barrett,2000; Krause, 1982; Simon & Fourcin, 1978; Zlatin & Koenigs-knecht, 1975). We also wanted to gather evidence about possiblechanges in boundary location and categorical perception duringthis period. We investigated the period between the age of nineand adulthood in order to avoid low categorical precision in thechildren’s responses, which would hinder the assessment ofcategorical perception, and also to be able to offer evidence aboutpossible changes in categorical perception, as previous studies inEnglish indicate that there still are changes in categoricalprecision between the age of nine and adulthood.
Boundary location was measured with both identification anddiscrimination data (see above: location of the 50% identificationscore and of the discrimination peak). Boundary precision wasalso measured with both identification and discrimination data(see above: slope of the identification curve and magnitude of thediscrimination peak). The assessment of categorical perception ofthe boundary was based on the match between the location andprecision of the identification and discrimination boundaries. Weused a /d=/-/t=/ VOT continuum, as in this contrast bothconsonant and vowel articulation are fairly neutral and the VOTboundary was expected to be close to 0 ms, which corresponds toits mean value in French (Serniclaes, 1987).
2. Method
2.1. Participants
Three groups of native French speakers participated in thisstudy. One group included 17 normal-hearing children (11 boysand six girls) aged 8–11 years old (average age: 9.0 years, SD¼0.7)who were attending primary schools (classes from the second tothe fourth grade). The second group included 17 normal-hearingadults who were the mothers of these children. The mothersgroup was aged from 35 to 50 years (average age: 43.5 years,SD¼5.5). The third group included 35 adolescents3 (18 males and17 females) aged 17 years (average age: 16.9 years, SD¼0.3).None of the subjects had known hearing or speech deficits (self-reports). They spoke the same dialect, namely Central French,spoken in the Parisian region, and did not speak other languages.
2.2. Stimuli
The location of the VOT boundary depends on both theconsonant’s place of articulation and on the vowel context(e.g. Lisker et al., 1978). We used a /d=/-/t=/ contrast in whichboth consonant articulation (apical consonants /d/ and /t/ occupya medial position between labials and velars) and vowelarticulation (/=/ stands for the neutral schwa vowel produced bya uniform vocal tube) are fairly neutral.
3 The adolescent data were part a doctoral thesis (Bogliotti, 2005) and were
collected as part of a longitudinal study on the specific difficulties of reading
directed by Liliane Sprenger–Charolles (Sprenger-Charolles, 2003). This
longitudinal study was subsidized by the Ministry for Health, Family and
Handicapped People (Research contract 17-02-001).
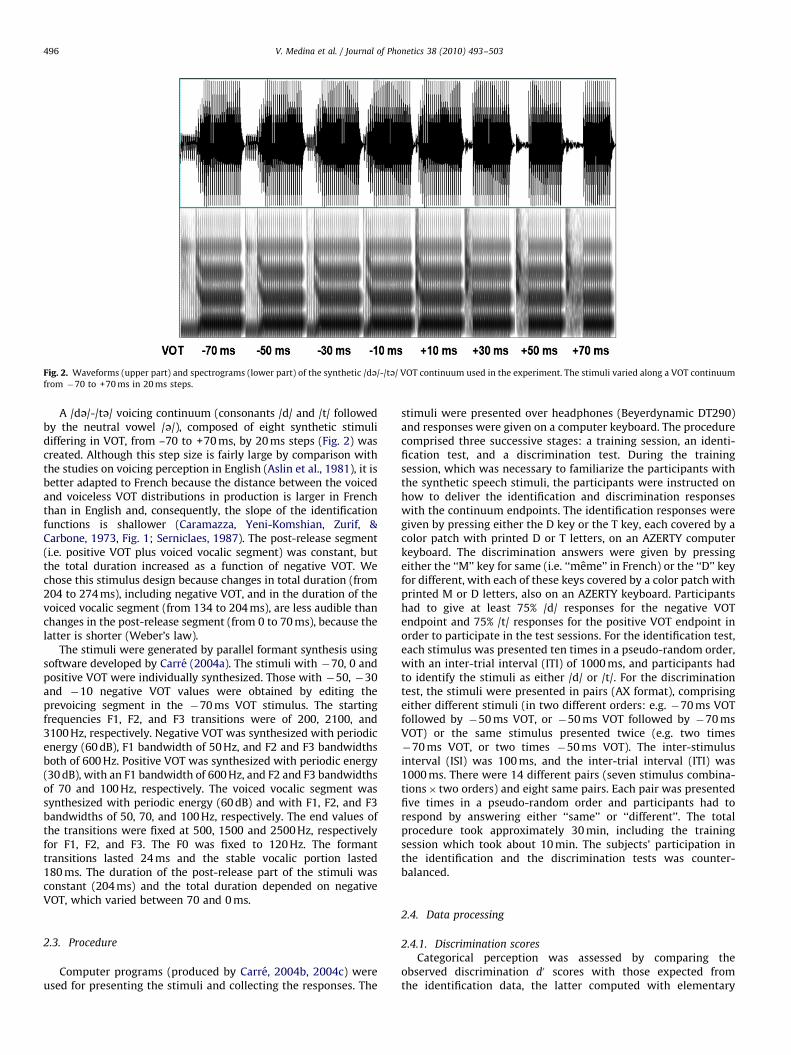
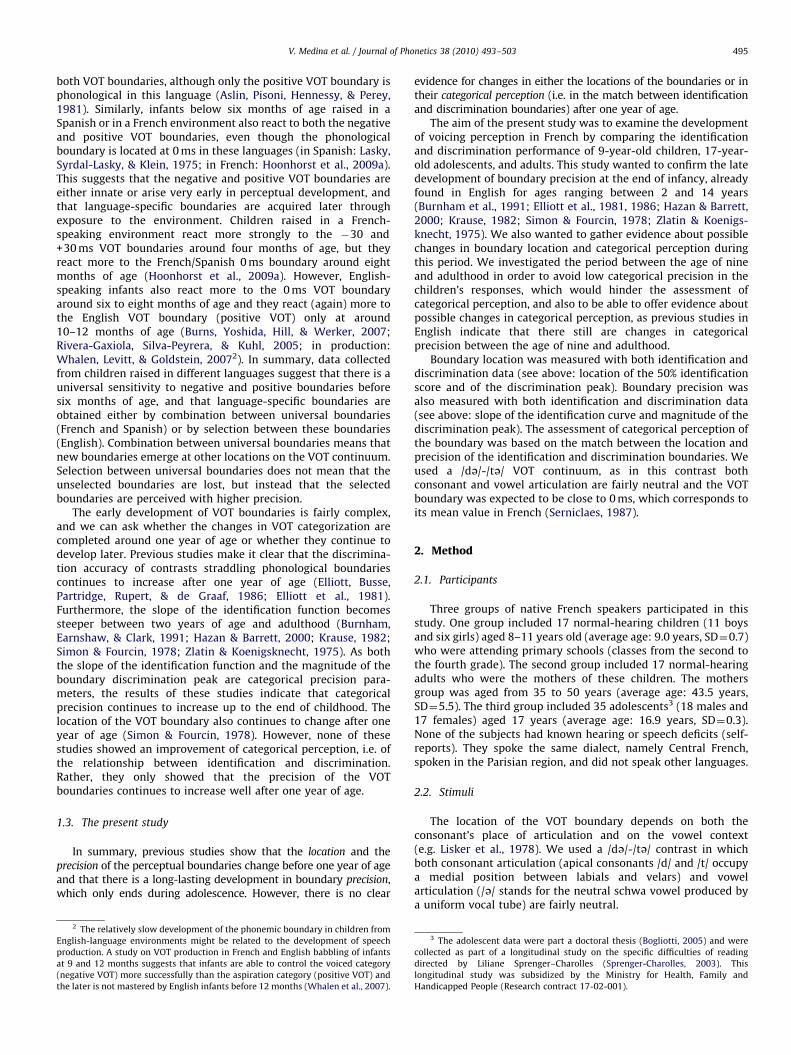
Fig. 2. Waveforms (upper part) and spectrograms (lower part) of the synthetic /d=/-/t=/ VOT continuum used in the experiment. The stimuli varied along a VOT continuum
from �70 to +70 ms in 20 ms steps.
V. Medina et al. / Journal of Phonetics 38 (2010) 493–503496
A /d=/-/t=/ voicing continuum (consonants /d/ and /t/ followedby the neutral vowel /=/), composed of eight synthetic stimulidiffering in VOT, from –70 to +70 ms, by 20 ms steps (Fig. 2) wascreated. Although this step size is fairly large by comparison withthe studies on voicing perception in English (Aslin et al., 1981), it isbetter adapted to French because the distance between the voicedand voiceless VOT distributions in production is larger in Frenchthan in English and, consequently, the slope of the identificationfunctions is shallower (Caramazza, Yeni-Komshian, Zurif, &Carbone, 1973, Fig. 1; Serniclaes, 1987). The post-release segment(i.e. positive VOT plus voiced vocalic segment) was constant, butthe total duration increased as a function of negative VOT. Wechose this stimulus design because changes in total duration (from204 to 274 ms), including negative VOT, and in the duration of thevoiced vocalic segment (from 134 to 204 ms), are less audible thanchanges in the post-release segment (from 0 to 70 ms), because thelatter is shorter (Weber’s law).
The stimuli were generated by parallel formant synthesis usingsoftware developed by Carre (2004a). The stimuli with �70, 0 andpositive VOT were individually synthesized. Those with �50, �30and �10 negative VOT values were obtained by editing theprevoicing segment in the �70 ms VOT stimulus. The startingfrequencies F1, F2, and F3 transitions were of 200, 2100, and3100 Hz, respectively. Negative VOT was synthesized with periodicenergy (60 dB), F1 bandwidth of 50 Hz, and F2 and F3 bandwidthsboth of 600 Hz. Positive VOT was synthesized with periodic energy(30 dB), with an F1 bandwidth of 600 Hz, and F2 and F3 bandwidthsof 70 and 100 Hz, respectively. The voiced vocalic segment wassynthesized with periodic energy (60 dB) and with F1, F2, and F3bandwidths of 50, 70, and 100 Hz, respectively. The end values ofthe transitions were fixed at 500, 1500 and 2500 Hz, respectivelyfor F1, F2, and F3. The F0 was fixed to 120 Hz. The formanttransitions lasted 24 ms and the stable vocalic portion lasted180 ms. The duration of the post-release part of the stimuli wasconstant (204 ms) and the total duration depended on negativeVOT, which varied between 70 and 0 ms.
2.3. Procedure
Computer programs (produced by Carre, 2004b, 2004c) wereused for presenting the stimuli and collecting the responses. The
stimuli were presented over headphones (Beyerdynamic DT290)and responses were given on a computer keyboard. The procedurecomprised three successive stages: a training session, an identi-fication test, and a discrimination test. During the trainingsession, which was necessary to familiarize the participants withthe synthetic speech stimuli, the participants were instructed onhow to deliver the identification and discrimination responseswith the continuum endpoints. The identification responses weregiven by pressing either the D key or the T key, each covered by acolor patch with printed D or T letters, on an AZERTY computerkeyboard. The discrimination answers were given by pressingeither the ‘‘M’’ key for same (i.e. ‘‘meme’’ in French) or the ‘‘D’’ keyfor different, with each of these keys covered by a color patch withprinted M or D letters, also on an AZERTY keyboard. Participantshad to give at least 75% /d/ responses for the negative VOTendpoint and 75% /t/ responses for the positive VOT endpoint inorder to participate in the test sessions. For the identification test,each stimulus was presented ten times in a pseudo-random order,with an inter-trial interval (ITI) of 1000 ms, and participants hadto identify the stimuli as either /d/ or /t/. For the discriminationtest, the stimuli were presented in pairs (AX format), comprisingeither different stimuli (in two different orders: e.g. �70 ms VOTfollowed by �50 ms VOT, or �50 ms VOT followed by �70 msVOT) or the same stimulus presented twice (e.g. two times�70 ms VOT, or two times �50 ms VOT). The inter-stimulusinterval (ISI) was 100 ms, and the inter-trial interval (ITI) was1000 ms. There were 14 different pairs (seven stimulus combina-tions� two orders) and eight same pairs. Each pair was presentedfive times in a pseudo-random order and participants had torespond by answering either ‘‘same’’ or ‘‘different’’. The totalprocedure took approximately 30 min, including the trainingsession which took about 10 min. The subjects’ participation inthe identification and the discrimination tests was counter-balanced.
2.4. Data processing
2.4.1. Discrimination scores
Categorical perception was assessed by comparing theobserved discrimination d0 scores with those expected fromthe identification data, the latter computed with elementary
V. Medina et al. / Journal of Phonetics 38 (2010) 493–503 497
probability formulas (Pollack & Pisoni, 1971) which were adaptedhere for use with the AX format. With two categories (/d/ and /t/),a binary discrimination choice (AX discrimination experiment),two adjacent stimuli on the VOT continuum (e.g. S1 and S2), andwith two different response proportions to each stimulus (P(d/S1)and P(t/S1); P(d/S2) and P(t/S2)), the predicted discriminationscore is the mean of the predicted score for the different pairs andthe one for the same pairs:
Pred: discr: for different pairs S1S2, S2S1
¼ Pðd=S1Þ � Pðt=S2ÞþPðt=S1Þ � Pðd=S2Þ,
Pred: discr: for same pairs S1S1, S2S2
¼ ðPðd=S1Þ � Pðd=S1ÞþPðt=S1Þ � Pðt=S1ÞþPðd=S2Þ
� Pðd=S2ÞþPðt=S2Þ � Pðt=S2ÞÞ=2:
For each VOT pair (e.g. for the 50/70 ms VOT pair), theobserved discrimination responses and those derived from theidentification data (expected scores) were converted into d0 scoressumming the normal deviate (z-value) corresponding to the scoreof ‘‘same’’ responses to the ‘‘same’’ pairs (e.g., the ‘‘same’’responses to the 50/50 ms pair and to the 70/70 ms pair) andthe z-value corresponding to the score of ‘‘different’’ responses tothe ‘‘different’’ pairs (e.g., the ‘‘different’’ responses to the 50/70 ms and 70/50 ms pairs). As 0% and 100% scores correspond toinfinite z-values, response scores were adjusted following theprocedure described by Macmillan and Creelman (2005) beforeconversion into z-values. Response scores above 50% werereduced by 2.5% (with 20 responses per couple of pairs, 2.5%corresponds to one half of the precision of theresponse scale, i.e. one half of 1/20), and those below 50% wereincreased by 2.5%.
The magnitude of the discrimination peak was assessed foreach participant by taking the difference between the highestdiscrimination score, among those collected by the seven differentVOT pairs, and the mean score of the six other VOT pairs. Themagnitude of the peak was computed both for observedand expected discrimination scores. The location of the peakalong the VOT continuum was defined as the VOT of the pair (i.e.the mean VOT of the two stimuli in the pair, e.g. 60 ms for the 50/70 ms VOT pair) with the highest score.
2.4.2. Slopes of the identification functions
The slope was assessed separately for each participant usinglogistic regression (McCullagh & Nelder, 1983). The logisticfunction (McCullagh & Nelder, 1983) has frequently been usedfor fitting identification curves in studies on speech perception(e.g. Nearey, 1990), and is similar to the cumulative normalfunction (Finney, 1971) which has also been used in speechperception studies (e.g. Hazan & Barrett, 2000). The most generalform of the logistic function (McCullagh & Nelder, 1983, p. 111) isgiven by
P¼ ey=ðeyþ1Þ, ð1Þ
where P is the mean value of a binary response, and y is definedby
y¼ logitðPÞ ¼ logðP=ð1�PÞÞ ¼ IþS� VOT, ð2Þ
where I stands for the intercept and S corresponds to the slope ofthe function.
The ‘‘logit’’ (log (P/(1�P)) in the logistic function is theequivalent of the z-value (normal deviate) in the cumulativenormal function. For instance, if P¼0.5, logit(P)¼ log(0.5/0.5)¼ log(1)¼0.
The logistic function is S-shaped but the relationshipbetween the logits and the independent variable is linear:
logitðPÞ ¼ IþS�VOT ð1Þ
The VOT boundary corresponds to the VOT value for which P¼0.5,hence to logit(P)¼0, and is obtained as follows:
IþS� VOTboundary ¼ 0,
VOTboundary ¼�I=S:
2.5. Statistical tests
Data were analyzed with analysis of variance (ANOVAs).Whenever Mauchly’s sphericity test was significant, Green-house-Geisser-corrected degrees-of-freedom values were used.The identification data were tested with four ANOVAs: two single-factor ANOVAs with Group as factor and with either the slope orthe boundary of the identification curve as dependent variable,and two single-factor ANOVAs with Group as factor and witheither the floor or the ceiling value of the identification curve asdependent variable. Floor and ceiling values correspond to themean identification scores collected by the stimuli three lowestVOT values (�70, �50, and �30 ms) and the three highest VOTvalues (+70, +50, and +30 ms), respectively. The relationshipsbetween the observed discrimination scores and those expectedfrom the identification data were tested with three repeated-measures ANOVAs: one Group� Task (discrimination vs. identi-fication)�VOT (8 values) ANOVA with both the observed andexpected discrimination scores as dependent variables; and twoGroup�Task (discrimination vs. identification) ANOVAS witheither the locations or the magnitudes of both the observed andexpected discrimination peaks as dependent variables. TheANOVAs were performed first on the three groups and—wheneverthe interaction involving group was significant—also on the pairsof groups in successive age categories (child–adolescent andadolescent–adult). Corrections for multiple tests were notperformed because comparisons between groups were planned.
3. Results
3.1. Identification
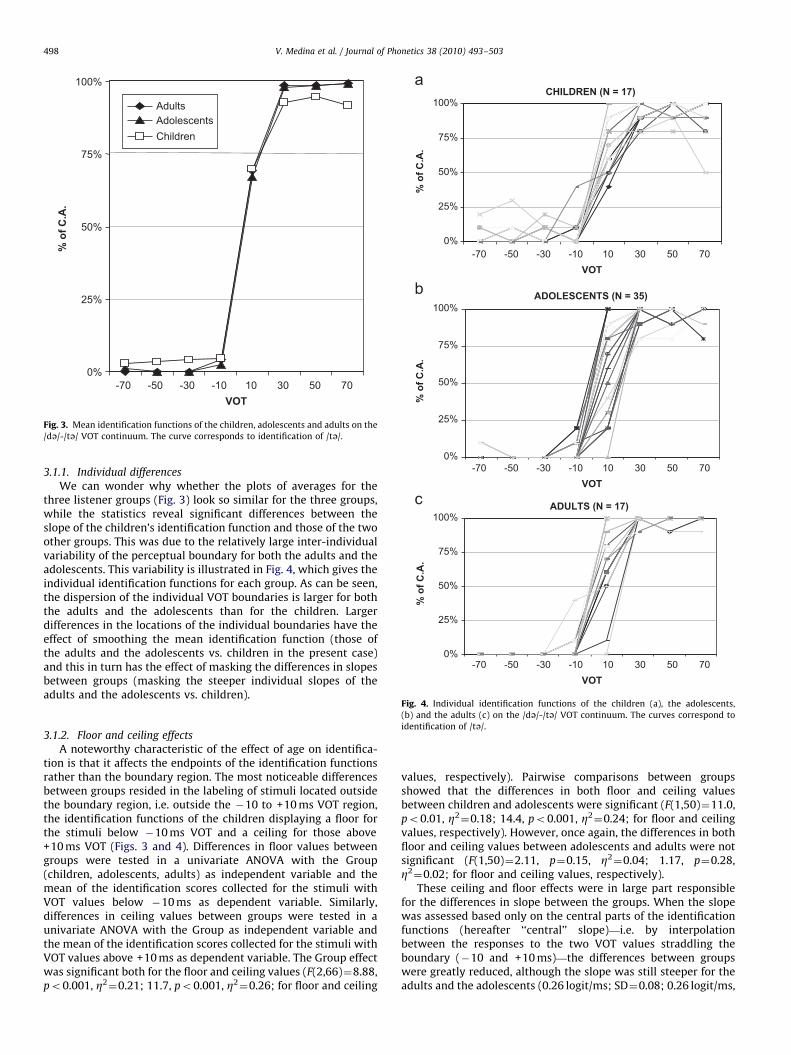
The mean identification curves of the adults, adolescents, andchildren are fairly similar (Fig. 3). The perceptual boundary islocated around 0 ms VOT for each group and the adult andadolescent functions overlap almost perfectly. Differences inmean boundaries and slopes between the groups were testedusing single-factor ANOVAs. The mean boundary was notsignificantly related to the groups (Fo1). The mean boundaryfor the three groups taken together was located at +7.3 ms VOT(SD¼6.3) and was significantly above 0 ms (t(68)¼9.6, po0.001,Z2¼0.54). However, the slope was significantly related to the
groups (F(2,66)¼9.4, po0.001, Z2¼0.22), the mean slope being
steeper for the adults (0.87 logit/ms; SD¼0.62), slightly shallowerfor the adolescents (0.83 logit/ms; SD¼0.57) and much shallowerfor the children (0.30 logit/ms; SD¼0.19). Examination ofcontrasts between groups showed that the difference in slopebetween adolescents and children was significant (F(1,50)¼18.22,po0.001, Z2
¼0.27, respectively). However, the difference inslope between adults and adolescents was not significant (Fo1).
0%
25%
50%
75%
100%
-70VOT
AdultsAdolescentsChildren
% o
f C.A
.
-50 -30 -10 10 30 50 70
Fig. 3. Mean identification functions of the children, adolescents and adults on the
/d=/-/t=/ VOT continuum. The curve corresponds to identification of /t=/.
CHILDREN (N = 17)
0%
25%
50%
75%
100%
-70VOT
ADULTS (N = 17)
0%
25%
50%
75%
100%
ADOLESCENTS (N = 35)
0%
25%
50%
75%
100%
% o
f C.A
.%
of C
.A.
% o
f C.A
.
-50 -30 -10 10 30 50 70
-70VOT
-50 -30 -10 10 30 50 70
-70VOT
-50 -30 -10 10 30 50 70
V. Medina et al. / Journal of Phonetics 38 (2010) 493–503498
3.1.1. Individual differences
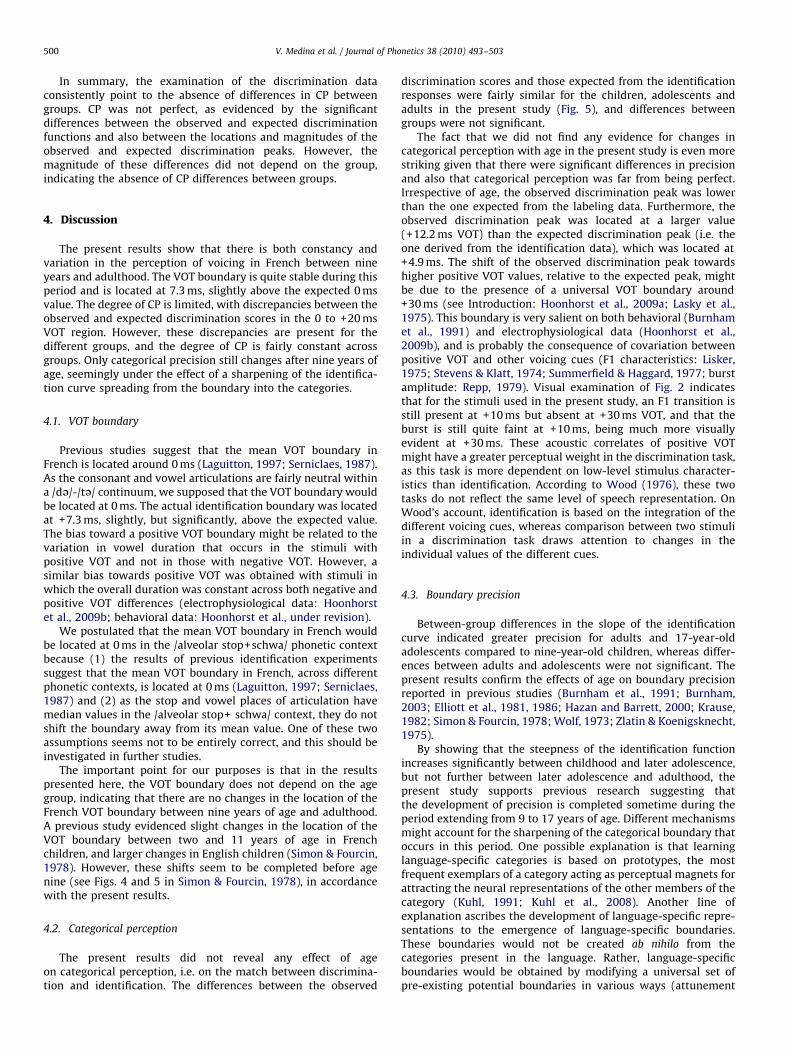
We can wonder why whether the plots of averages for thethree listener groups (Fig. 3) look so similar for the three groups,while the statistics reveal significant differences between theslope of the children’s identification function and those of the twoother groups. This was due to the relatively large inter-individualvariability of the perceptual boundary for both the adults and theadolescents. This variability is illustrated in Fig. 4, which gives theindividual identification functions for each group. As can be seen,the dispersion of the individual VOT boundaries is larger for boththe adults and the adolescents than for the children. Largerdifferences in the locations of the individual boundaries have theeffect of smoothing the mean identification function (those ofthe adults and the adolescents vs. children in the present case)and this in turn has the effect of masking the differences in slopesbetween groups (masking the steeper individual slopes of theadults and the adolescents vs. children).
Fig. 4. Individual identification functions of the children (a), the adolescents,
(b) and the adults (c) on the /d=/-/t=/ VOT continuum. The curves correspond to
identification of /t=/.
3.1.2. Floor and ceiling effectsA noteworthy characteristic of the effect of age on identifica-tion is that it affects the endpoints of the identification functionsrather than the boundary region. The most noticeable differencesbetween groups resided in the labeling of stimuli located outsidethe boundary region, i.e. outside the �10 to +10 ms VOT region,the identification functions of the children displaying a floor forthe stimuli below �10 ms VOT and a ceiling for those above+10 ms VOT (Figs. 3 and 4). Differences in floor values betweengroups were tested in a univariate ANOVA with the Group(children, adolescents, adults) as independent variable and themean of the identification scores collected for the stimuli withVOT values below �10 ms as dependent variable. Similarly,differences in ceiling values between groups were tested in aunivariate ANOVA with the Group as independent variable andthe mean of the identification scores collected for the stimuli withVOT values above +10 ms as dependent variable. The Group effectwas significant both for the floor and ceiling values (F(2,66)¼8.88,po0.001, Z2
¼0.21; 11.7, po0.001, Z2¼0.26; for floor and ceiling
values, respectively). Pairwise comparisons between groupsshowed that the differences in both floor and ceiling valuesbetween children and adolescents were significant (F(1,50)¼11.0,po0.01, Z2
¼0.18; 14.4, po0.001, Z2¼0.24; for floor and ceiling
values, respectively). However, once again, the differences in bothfloor and ceiling values between adolescents and adults were notsignificant (F(1,50)¼2.11, p¼0.15, Z2
¼0.04; 1.17, p¼0.28,Z2¼0.02; for floor and ceiling values, respectively).These ceiling and floor effects were in large part responsible
for the differences in slope between the groups. When the slopewas assessed based only on the central parts of the identificationfunctions (hereafter ‘‘central’’ slope)—i.e. by interpolationbetween the responses to the two VOT values straddling theboundary (�10 and +10 ms)—the differences between groupswere greatly reduced, although the slope was still steeper for theadults and the adolescents (0.26 logit/ms; SD¼0.08; 0.26 logit/ms,

CHILDREN (N = 17)
-0.50
0.00
0.50
1.00
1.50
2.00
-60VOT
-0.50
0.00
0.50
1.00
1.50
2.00
-0.50
0.00
0.50
1.00
1.50
2.00d’
sco
res
d’ s
core
s
d’ s
core
s
-40 -20 0 20 40 60 -60VOT
-40 -20 0 20 40 60 -60VOT
-40 -20 0 20 40 60
ADOLESCENTS (N = 35) ADULTS (N = 17)
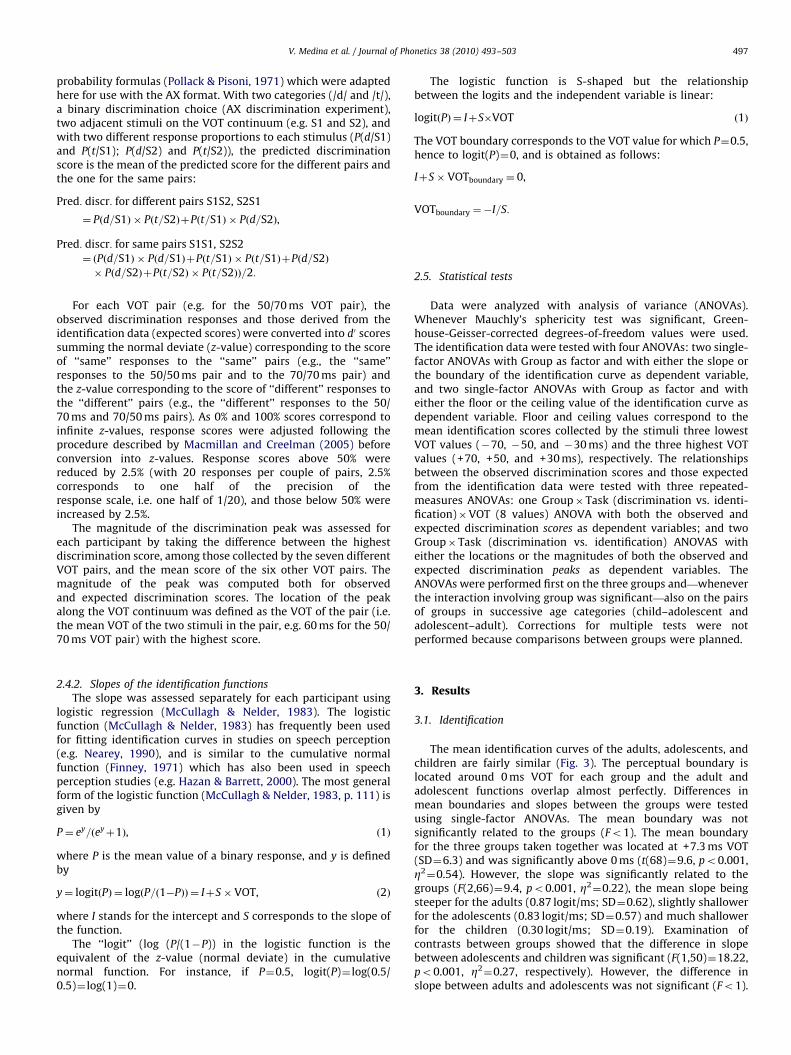
Fig. 5. Observed and expected discrimination scores on the /d=/-/t=/ VOT continuum for the children (a), the adolescents, (b) and the adults (c). The observed scores are
represented by continuous lines. The scores expected from identification are represented by dotted lines. Error bars represent the standard deviations of the observed
scores. The x-axis VOT labels represent the central value of AX stimulus pairs (e.g. �60 corresponds to the �70 vs. �50 ms VOT pair).
V. Medina et al. / Journal of Phonetics 38 (2010) 493–503 499
SD¼0.07, respectively) than for the children (0.21 logit/ms;SD¼0.08). The central slope was not significantly related tothe group when tested with an ANOVA including the three groups(F(2,66)¼2.9, p¼0.064, Z2
¼0.08). However, the examinationof planned contrasts between groups showed that differencesin central slope between adolescents and children wassignificant (F(1,66) 4.76, po0.05, Z2
¼0.07), and that thedifference in central slope between adults and adolescents wasnot significant (Fo1).
4 Although both are based on the identification data, the location of the
expected discrimination peak (4.9 ms) is slightly different from the location of the
identification boundary (7.2 ms). This is due to the fact that the expected
discrimination peak corresponds to the VOT value with largest increase in
identification scores whereas the identification boundary corresponds to the 50%
identification point, two values which should coincide if the empirical curve was
perfectly logistic, which is not the case here.
3.2. Discrimination
Categorical perception refers to the similarity between theobserved and expected discrimination functions, the latter beingcalculated from the identification scores (see Introduction). Exam-ination of Fig. 5 reveals that for all groups both the observed andexpected discrimination functions exhibited a peak at 0 ms VOT,and that this peak was higher for the expected function than for theobserved one, irrespective of the group.
The differences in CP were tested in three different repeated-measures ANOVAs, with different dependent variables, as follows:discrimination scores relative to each VOT pair (d0 values), as wellas the magnitude (d0 value) or the location (VOT value) of thediscrimination peak.
The design of the ANOVA run on the discrimination scoresrelative to each VOT pair comprised Task (observed vs. expectedscore) and VOT (seven pairs) as within-subjects factors, and Group(adults, adolescents, and children) as a between-subjects factor.The main effect of VOT and the Task�VOT interaction weresignificant (F(2.2,147)¼70.6, po0.001, Z2
¼0.52; F(2.8,184)¼3.93, po0.05; Z2
¼0.06; respectively). However, the Group�VOTand Group�Task x VOT interactions were not significant(F(4.4,147)¼1.07; p¼0.38, Z2
¼0.03; Fo1 respectively). The othermain effects and interactions were also not significant (Task:F(1,66)¼1.32, p¼0.25, Z2
¼0.02; Task�Group: Fo1; Group-� Task�VOT: Fo1; Group: F(2,66)¼2.05, p¼0.14, Z2
¼0.06).
3.2.1. Differences in the locations and magnitudes of the
discrimination peaks
The fact that the Group�Task�VOT interaction was notsignificant suggests that there were no reliable CP differencesbetween the three groups. CP was not perfect, as evidenced by thesignificant differences between the observed and expecteddiscrimination functions. However, the magnitude of thesedifferences did not depend on the group. Nevertheless,between-group differences in categorical perception might nothave been captured in these analyses because the dependentvariables were the discrimination scores of the individual VOTpairs. Instead, the analyses that follow are more specific as theyare based on the characteristics of the discrimination peaks.
A further test of the CP differences between groups was basedon the magnitudes and locations of the observed and expecteddiscrimination peaks. Two other ANOVAs were run, one on thepeak magnitudes and the other on the peak locations, with Task(observed vs. expected score) as a within-subjects factor andGroup (adults, adolescents, and children) as a between-subjectsfactor. The Group� Task ANOVA run on the peak magnitudesshowed that the magnitude of the expected peak was significantlylarger than the observed one (1.82 vs. 1.31 d0 difference; Taskeffect: F(1,66)¼7.54, po0.01, Z2
¼0.10), a difference which didnot depend on the group (Group�Task interaction; F(2,66)¼1.10,p¼0.34, Z2
¼0.03). The Group�Task ANOVA run on the location ofthe peak indicated a difference between observed and expected d0
(Task effect: F(1,66)¼6.06, po0.05; Z2¼0.08), the mean observed
peak being located at a larger VOT value than the expected peak(at 12.2 vs. 4.9 ms, respectively), irrespective of the Group(Group�Task interaction: Fo1, p¼0.604).
V. Medina et al. / Journal of Phonetics 38 (2010) 493–503500
In summary, the examination of the discrimination dataconsistently point to the absence of differences in CP betweengroups. CP was not perfect, as evidenced by the significantdifferences between the observed and expected discriminationfunctions and also between the locations and magnitudes of theobserved and expected discrimination peaks. However, themagnitude of these differences did not depend on the group,indicating the absence of CP differences between groups.
4. Discussion
The present results show that there is both constancy andvariation in the perception of voicing in French between nineyears and adulthood. The VOT boundary is quite stable during thisperiod and is located at 7.3 ms, slightly above the expected 0 msvalue. The degree of CP is limited, with discrepancies between theobserved and expected discrimination scores in the 0 to +20 msVOT region. However, these discrepancies are present for thedifferent groups, and the degree of CP is fairly constant acrossgroups. Only categorical precision still changes after nine years ofage, seemingly under the effect of a sharpening of the identifica-tion curve spreading from the boundary into the categories.
4.1. VOT boundary
Previous studies suggest that the mean VOT boundary inFrench is located around 0 ms (Laguitton, 1997; Serniclaes, 1987).As the consonant and vowel articulations are fairly neutral withina /d=/-/t=/ continuum, we supposed that the VOT boundary wouldbe located at 0 ms. The actual identification boundary was locatedat +7.3 ms, slightly, but significantly, above the expected value.The bias toward a positive VOT boundary might be related to thevariation in vowel duration that occurs in the stimuli withpositive VOT and not in those with negative VOT. However, asimilar bias towards positive VOT was obtained with stimuli inwhich the overall duration was constant across both negative andpositive VOT differences (electrophysiological data: Hoonhorstet al., 2009b; behavioral data: Hoonhorst et al., under revision).
We postulated that the mean VOT boundary in French wouldbe located at 0 ms in the /alveolar stop+schwa/ phonetic contextbecause (1) the results of previous identification experimentssuggest that the mean VOT boundary in French, across differentphonetic contexts, is located at 0 ms (Laguitton, 1997; Serniclaes,1987) and (2) as the stop and vowel places of articulation havemedian values in the /alveolar stop+ schwa/ context, they do notshift the boundary away from its mean value. One of these twoassumptions seems not to be entirely correct, and this should beinvestigated in further studies.
The important point for our purposes is that in the resultspresented here, the VOT boundary does not depend on the agegroup, indicating that there are no changes in the location of theFrench VOT boundary between nine years of age and adulthood.A previous study evidenced slight changes in the location of theVOT boundary between two and 11 years of age in Frenchchildren, and larger changes in English children (Simon & Fourcin,1978). However, these shifts seem to be completed before agenine (see Figs. 4 and 5 in Simon & Fourcin, 1978), in accordancewith the present results.
4.2. Categorical perception
The present results did not reveal any effect of ageon categorical perception, i.e. on the match between discrimina-tion and identification. The differences between the observed
discrimination scores and those expected from the identificationresponses were fairly similar for the children, adolescents andadults in the present study (Fig. 5), and differences betweengroups were not significant.
The fact that we did not find any evidence for changes incategorical perception with age in the present study is even morestriking given that there were significant differences in precisionand also that categorical perception was far from being perfect.Irrespective of age, the observed discrimination peak was lowerthan the one expected from the labeling data. Furthermore, theobserved discrimination peak was located at a larger value(+12.2 ms VOT) than the expected discrimination peak (i.e. theone derived from the identification data), which was located at+4.9 ms. The shift of the observed discrimination peak towardshigher positive VOT values, relative to the expected peak, mightbe due to the presence of a universal VOT boundary around+30 ms (see Introduction: Hoonhorst et al., 2009a; Lasky et al.,1975). This boundary is very salient on both behavioral (Burnhamet al., 1991) and electrophysiological data (Hoonhorst et al.,2009b), and is probably the consequence of covariation betweenpositive VOT and other voicing cues (F1 characteristics: Lisker,1975; Stevens & Klatt, 1974; Summerfield & Haggard, 1977; burstamplitude: Repp, 1979). Visual examination of Fig. 2 indicatesthat for the stimuli used in the present study, an F1 transition isstill present at +10 ms but absent at +30 ms VOT, and that theburst is still quite faint at +10 ms, being much more visuallyevident at +30 ms. These acoustic correlates of positive VOTmight have a greater perceptual weight in the discrimination task,as this task is more dependent on low-level stimulus character-istics than identification. According to Wood (1976), these twotasks do not reflect the same level of speech representation. OnWood’s account, identification is based on the integration of thedifferent voicing cues, whereas comparison between two stimuliin a discrimination task draws attention to changes in theindividual values of the different cues.
4.3. Boundary precision
Between-group differences in the slope of the identificationcurve indicated greater precision for adults and 17-year-oldadolescents compared to nine-year-old children, whereas differ-ences between adults and adolescents were not significant. Thepresent results confirm the effects of age on boundary precisionreported in previous studies (Burnham et al., 1991; Burnham,2003; Elliott et al., 1981, 1986; Hazan and Barrett, 2000; Krause,1982; Simon & Fourcin, 1978; Wolf, 1973; Zlatin & Koenigsknecht,1975).
By showing that the steepness of the identification functionincreases significantly between childhood and later adolescence,but not further between later adolescence and adulthood, thepresent study supports previous research suggesting thatthe development of precision is completed sometime during theperiod extending from 9 to 17 years of age. Different mechanismsmight account for the sharpening of the categorical boundary thatoccurs in this period. One possible explanation is that learninglanguage-specific categories is based on prototypes, the mostfrequent exemplars of a category acting as perceptual magnets forattracting the neural representations of the other members of thecategory (Kuhl, 1991; Kuhl et al., 2008). Another line ofexplanation ascribes the development of language-specific repre-sentations to the emergence of language-specific boundaries.These boundaries would not be created ab nihilo from thecategories present in the language. Rather, language-specificboundaries would be obtained by modifying a universal set ofpre-existing potential boundaries in various ways (attunement
V. Medina et al. / Journal of Phonetics 38 (2010) 493–503 501
theory: Aslin & Pisoni, 1980; coupling theory: Hoonhorst et al.,2009a).
Whereas studies on the early development of speech percep-tion, before one year of age, point to a re-shaping of the universalboundaries (see Introduction: Aslin & Pisoni, 1980; Hoonhorstet al., 2009a), the present study suggests that the late develop-ment of precision—after nine years of age—is mainly due toimprovement in categorization of stimuli remote from theboundary, rather than of those located around the boundary.The main difference between the identification behavior of thechildren and those of the adolescents and adults does not reside inthe slope of the response function around the boundary region,but rather in the shape of the functions within the VOT categories(Figs. 3 and 4). The reduced precision of the children’s identifica-tion functions was mainly due to differences in the ceiling andfloor effects inside the negative and positive VOT regions, ratherthan to differences in the ‘‘central’’ slope, measured by interpola-tion around the boundary. This finding is not unique to thepresent results. Examination of the literature shows thatthe gradual sharpening of the identification function from theboundary toward the center of the categories as a function of agewas present in the results of previous studies (Hazan & Barrett,2000; Krause, 1982; Zlatin & Koenigsknecht, 1975). In all thesestudies, the most obvious effect of age was to improve thecategorization of the least ambiguous stimuli, i.e. those located atthe end of the stimulus continuum. It is noteworthy that all ofthese studies used synthetic stimuli, and that the continuaendpoints did not correspond to the category prototypes becausethey differed in several ways from natural exemplars of voicedand voiceless stops. The different cues which covary with VOT innatural speech also covaried with VOT in the present stimuli, withthe exception of F0 which was constant. The absence of F0variation might be responsible for the floor and ceiling effects.Children might be more sensitive than adults to differencesbetween full-cued natural stimuli and impoverished syntheticstimuli, and this could explain why the latter stimuli are notidentified with 100% accuracy. A recent study found that five-year-old children and adults achieved similar performance in thediscrimination of natural VCV syllables (Bertoncini, Serniclaes, &Lorenzi, 2008). Should direct comparisons between natural andsynthetic speech confirm this point in the future, it might beconcluded that the greater sensitivity of the children to within-category differences was due to a greater dependency of theircategorical prototypes on the acoustic cues present in the stimuli.
According to the ‘‘Native Language Magnet’’ theory, experiencewith the sounds of a particular language increases sensitivity nearthe boundaries between categories and decreases sensitivity nearthe category prototypes (Kuhl et al., 2008). Results on the latedevelopment of speech perception suggest that the increase incategorical precision is more a matter of decreased sensitivitynear the prototypes than of increased sensitivity around theboundary. However, accounts of phonological development interms of either prototype magnets or boundary attunement arenot incompatible. Depending on the type of training, soundsbecome either more similar or more distinct (Guenther, Husain,Cohen, & Shinn-Cunningham, 1999). Categorization training, inwhich participants learn to identify stimuli within a particularrange of acoustic properties as members of the same category,leads to a decrease in sensitivity to stimulus differences withinsome stimulus distribution, whereas discrimination training, inwhich subjects learn to perceive differences between stimuli,leads to an increase in sensitivity to differences within the samestimulus distribution (Guenther et al., 1999). Furthermore, anfMRI investigation on the effects of categorization and discrimi-nation training on brain activity indicates that neural resourcesare shifted away from acoustic regions where discrimination is
not behaviorally important and towards regions where accuratediscrimination is required (Guenther, Nieto-Castanon, Ghosh, &Tourville, 2004). Possible implications of these training studies forthe development of phonological categories are that exposureto modal category values (i.e. to the most frequent ones) leads toreduced discrimination when faced with within-category differ-ences (i.e. prototype formation), whereas exposure to stimuli atthe limits of different categories leads to increased discriminationof between-category differences, i.e. boundary attunement. Bothmechanisms might potentially contribute to the buildup ofphonological categories; their relative contributions to categoryformation during the different phases of perceptual developmentare still not entirely clear. However, the present results, togetherwith those of other investigations on the development ofcategorization performance (Guenther, Nieto-Castanon, Ghosh, &Tourville, 1999, 2004), suggest that boundary attunement occursfirst and is followed by prototype consolidation.
The late development of boundary precision might be relatedto the general development of auditory function, as changes inintensity thresholds are not completed at nine years of age (for areview on the effect of age on auditory sensitivity see Schneider &Trehub, 1992). Other results indicate that auditory sensitivity forsounds in noise continues to develop throughout adolescence(from 8 to 19 years: Howell & Williams, 2004). A study using atest battery compiled to diagnose auditory processing disordersshows a developmental effect when children (aged from 9 to 12years) and adolescents (aged from 14 to 16 years) are compared toadults (Neijenhuis, Snik, Priester, van Kordenoordt, & van denBroek, 2002). A longitudinal study with a battery of auditory testssuggests maturational effects up to an age of 12–13 years(Stollman, van Velzen, Simkens, Snik, & van den Broek, 2004).Data on the development of temporal-interval discriminationduring adolescence (Huyck & Wright, 2007) show that theperformance of children differs from that of adolescents butthe performance of adolescents does not differ from that ofadults. These results indicate that there is also a long-lastingdevelopment of auditory abilities. Overall, studies on auditorydevelopment suggest that auditory sensitivity continues toprogress throughout adolescence. However, the present results,like those of previous studies (Hazan & Barrett, 2000; Krause,1982; Zlatin & Koenigsknecht, 1975), indicate that the increase incategorical precision with age is not only due to increasedsensitivity across the boundaries, but also to decreased sensitivitywithin categories. The children’s identification functions, contraryto those of the adults, exhibited floor and ceiling effects,suggesting that the acoustic differences between impoverishedsynthetic stimuli and natural exemplars of the category proto-types become less perceptible with age. Other factors, distinctfrom those related to general auditory processes and whichcontribute to increase auditory sensitivity, therefore likely play arole in the development of feature perception.
4.4. Boundary precision vs. categorical perception
According to the original definition (Liberman et al., 1957),categorical perception resides in the consistency between dis-crimination and identification behavior. Many studies haveexamined the effect of age on boundary precision by using eitherdiscrimination or identification responses (e.g. discrimination:Elliott et al., 1981, 1986; identification: Hazan & Barrett, 2000;Krause, 1982; Simon & Fourcin, 1978; Zlatin & Koenigsknecht,1975), but few of them have used both tasks, and thus there wereuntil recently only few indications about the effect of age oncategorical perception. The present study showed that age had noeffect on categorical perception. Although this is a null finding, it

V. Medina et al. / Journal of Phonetics 38 (2010) 493–503502
should be taken seriously for three different reasons. Firstly, thestep magnitude on the VOT continuum (20 ms) was small enoughto capture differences between identification and discrimination,as shown by the significant effect of task on the responsefunctions. It should presumably also have captured anyTask�Group interaction. Secondly, as there was a strong effectof development on boundary precision in the present study, acomparable effect of age on categorical perception should alsohave been detected. Thirdly, two other studies using VOTcontinua similar to the present study, but conducted on othergroups of French children, lead to the same conclusion. One studyexamined the development of different groups of normal-hearingchildren, between 4 and 10 years of age, and of deaf children withcochlear implants (Medina & Serniclaes, 2009). Similar resultswere obtained for the normal-hearing children and for thecochlear-implant children with the same amount of perceptualexperience, and these results showed that boundary precisionincreased with age whereas categorical perception did notchange. Another study compared children aged from six to eightyears and adults, and the results also lead to the conclusion thatage affects boundary precision but not categorical perception(Hoonhorst et al., under revision). While these studies suggestthat there is no effect of age on CP, the results reported by Elliottet al. (1981) suggest that the effect of age on CP, if any, is anegative one: indeed, the distance between identification anddiscrimination boundaries was larger for adults than for children,indicating a decrease in CP.
While the present study suggests that categorical perception isacquired earlier than boundary precision, this is not true for allchildren. Dyslexic children display a deficit in both categoricalperception and boundary precision relative to normal-readingchildren (for a review see Sprenger-Charolles, Cole, & Serniclaes,2006). These deficits have not been found in all studies, but theyhave often been found both for comparisons with chronological-age controls and also sometimes for comparisons with reading-age controls, i.e. with younger children with the same readingperformance (Bogliotti, Serniclaes, Messaoud-Galusi, & Sprenger-Charolles, 2008). According to the ‘‘allophonic perception’’ theory,the categorical perception deficit of dyslexic children is due toenhanced discrimination of within-category distinctions whichare not phonemic in the ambient language (Dufor, Serniclaes,Sprenger-Charolles, & Demonet, 2009; Serniclaes, Van Heghe,Mousty, Carre, & Sprenger-Charolles, 2004). However, bothdyslexia and age have similar effects on boundary precision,dyslexic children behaving in this respect much like youngernormal-reading children (e.g. Serniclaes, Blomert, & Froyen,2007).
5. Conclusion
In conclusion, there is a late effect of age on boundaryprecision, after nine years of age, whereas categorical perceptiondoes not change any further during this period. The latedevelopment of categorization performance is more a matter ofprototype consolidation than of boundary attunement, suggestingthat the boundaries between categories develop faster thancategory prototypes. Further investigations should make itpossible to test the generality of the present findings for differentphonological features and different acoustic cues.
Acknowledgments
We would like to thank Marie-Pierre Geron for her help in datacollection, Liliane Sprenger-Charolles for her comments on earlier
versions of the manuscript, Cecile Houard and Paul Reeves fortheir help in the preparation of the English manuscript.
References
Abramson, A. S., & Lisker, L. (1970). Discriminability along the voice onset timecontinuum: Cross-language tests. In B. Hala, M. Romportl, & P. Janota (Eds.),Proceedings of the 6th international congress of phonetic sciences, Prague 1967(pp. 569–573). Prague: Academia.
Abramson, A. S., & Lisker, L. (1985). Relative power of cues: F0 shift vs. voicetiming. In V. Fromkin (Ed.), Phonetic linguistics: Essays in honor of PeterLadefoged (pp. 25–33). New York: Academic Press.
Aslin, R. N., & Pisoni, D. B. (1980). Some developmental processes in speechperception. In G. H. Yeni-Komshian, J. F. Kavanagh, & C. A. Ferguson (Eds.),Child phonology-volume 2-perception (pp. 67–96). New York: Academic Press.
Aslin, R. N., Pisoni, D. B., Hennessy, B. L., & Perey, A. V. (1981). Discrimination ofvoice onset time by human infants: New findings and implications for theeffect of early experience. Child Development, 52, 1135–1145.
Bertoncini, J., Serniclaes, J., & Lorenzi, C. (2008). Speech discrimination based upontemporal envelope versus fine structure cues in 5-to-7 year-old children.Journal of Speech, Language, and Hearing Research. doi:10.1044/1092-4388(2008/07-0273).
Bogliotti, C. (2005). Categorical perception and allophonic perception: Effect of age,reading level and coupling between phonetic predispositions. Doctoral thesis, UFRde Linguistique, Universite Denis Diderot-Paris 7. Available on /http://caroline.bogliotti.googlepages.com/phdthesisS.
Bogliotti, C., Serniclaes, W., Messaoud-Galusi, S., & Sprenger-Charolles, L. (2008).Discrimination of speech sounds by children with dyslexia: Comparisons withchronological age and reading level controls. Journal of Experimental ChildPsychology, 101, 137–155.
Burnham, D. K. (2003). Language specific speech perception and the onset ofreading. Reading and Writing: An Interdisciplinary Journal, 16, 573–609.
Burnham, D. K., Earnshaw, L. J., & Clark, J. E. (1991). Development of categoricalidentification of native and non-native bilabial stops: Infants, children andadults. Journal of Child Language, 18, 231–260.
Burnham, D., Tyler, M., & Horlyck, S. (2002). Periods of speech perceptiondevelopment and their vestiges in adulthood. In An integrated view of languagedevelopment (papers in honor of Henning Wode) (pp. 281–300). Burmeister,Piske & Rohde Eds. Trier: WVT Wissenschaftlicher Verlag.
Burns, T. C., Yoshida, K. A., Hill, K., & Werker, J. F. (2007). The development ofphonetic representation in bilingual and monolingual infants. AppliedPsycholinguistics, 28, 455–474.
Caramazza, A., & Yeni-Komshian, G. H. (1974). Voice onset time in two Frenchdialects. Journal of Phonetics, 2, 239–245.
Caramazza, A., Yeni-Komshian, G. H., Zurif, E., & Carbone, E. (1973). Theacquisition of a new phonological contrast: The case of stop consonantsin French-English bilinguals. Journal of the Acoustical Society of America, 54,421–428.
Carre, R. (2004a). Program SyntFormVoy. Laboratoire Dynamique du Language,CNRS, Lyon, France. From Rene Carre Personal Web site: /http://pagesperso-orange.fr/ren.carre/index.htmS.
Carre, R. (2004b). Program Percept A. Laboratoire Dynamique du Language, CNRS,Lyon, France. From Rene Carre Personal Web site: /http://pagesperso-orange.fr/ren.carre/index.htmS.
Carre, R. (2004c). Program Percept AB. Laboratoire Dynamique du Language, CNRS,Lyon, France. From Rene Carre Personal Web site: /http://pagesperso-orange.fr/ren.carre/index.htmS.
Damper, R. I., & Harnad, S. R. (2000). Neural network modeling of categoricalperception. Perception and Psychophysics, 62, 843–867.
Donald, S. L. (1978). The perception of voicing contrasts in Thai and English.Dissertation, University of Connecticut at Storrs.
Dufor, O., Serniclaes, W., Sprenger-Charolles, L., & Demonet, J.-F. (2009). Left pre-motor cortex and allophonic speech perception in dyslexia: A PET study.NeuroImage. doi:10.1016/j.neuroimage.2009.01.035.
Elliott, L. L., Busse, L. A., Partridge, R., Rupert, J., & de Graaf, R. (1986). Adult andchild discrimination of CV syllables differing in Voice Onset time. ChildDevelopment, 57, 628–635.
Elliott, L. L., Longinotti, C., Meyer, D., Raz, I., & Zucker, K. (1981). Developmentaldifferences in identifying and discriminating CV syllables. Journal of theAcoustical Society of America, 70, 669–677.
Finney, D. J. (1971). Probit analysis (3rd ed.). Cambridge: University Press.Guenther, F. H., Husain, F. T., Cohen, M. A., & Shinn-Cunningham, B. G. (1999).
Effects of categorization and discrimination training on auditory perceptualspace. Journal of the Acoustical Society of America, 106, 2905–2912.
Guenther, F. H., Nieto-Castanon, A., Ghosh, S. S., & Tourville, J. A. (2004).Representation of sound categories in auditory cortical maps. Journal ofSpeech, Language, and Hearing Research, 47, 46–57.
Haggard, M., Summerfield, Q., & Roberts, M. (1981). Psychoacoustical and culturaldeterminants of phoneme boundaries: Evidence from trading F0 cues in thevoiced–voiceless distinction. Journal of Phonetics, 9, 49–62.
Harnad, S. (1987). Categorical perception. Cambridge: University Press.Hazan, V., & Barrett, S. (2000). The development of phonemic categorization in
children aged 6–12. Journal of Phonetics, 28, 377–396.
V. Medina et al. / Journal of Phonetics 38 (2010) 493–503 503
Hoonhorst, I., Colin, C., Markessis, E., Radeau, M., Deltenre, P., & Serniclaes, W.(2009a). French native speakers in the making: From language-general tolanguage-specific voicing boundaries. Journal of Experimental Child Psychology,104, 353–366.
Hoonhorst, I., Serniclaes, W., Collet, G., Colin, C., Markessis, E., & Radeau, M.(2009b). The acoustic correlates of voicing perception in French. ClinicalNeurophysiology, 120, 897–903.
Hoonhorst, I., Medina, V., Colin, C., Markessis, E., Radeau, M., Deltenre, P., &Serniclaes, W. (under revision). The development of categoricalperception: Comparisons between voicing, colors and facial expressionsSpeech Communication.
Howell, P., & Williams, S. M. (2004). Development of auditory sensitivity inchildren who stutter and fluent children. Ear and Hearing, 25, 265–274.
Huyck, J. J., & Wright, A. (2007). Development of temporal-interval discriminationduring adolescence. Journal of the Acoustical Society of America, 121, 3133.
Jakobson, R. (1973). Essais de Linguistique GeneraleParis: Editions de Minuit.Jakobson, R., Fant, G., & Halle, M. (1952). Preliminaries to speech analysis. The
distinctive features and their correlates. Cambridge, MA: M.I.T. Press.Kessinger, R. H., & Blumstein, S. E. (1998). Effects of speaking rate on voice-onset
time and vowels production: Some implications for perception studies. Journalof Phonetics, 26, 117–128.
Krause, S. F. (1982). Vowel duration as a perceptual cue to post-vocalic consonantvoicing in young children and adults. Journal of the Acoustical Society ofAmerica, 71, 990–995.
Kuhl, P. K. (1991). Human adults and human infants show a ‘perceptual magneteffect’ for the prototypes of phonetic categories, monkeys do not. Perceptionand Psychophysics, 50, 93–107.
Kuhl, P. K. (2004). Early language acquisition: Cracking the speech code. NatureReviews Neuroscience, 5, 831–843.
Laguitton, V. (1997). Indices acoustiques et perception de la parole: Nature etlateralisation hemispherique des processus de traitement (etudes comportemen-tales et electrophysiologiques). Doctoral Thesis, Universite Rennes 2.
Lasky, R. E., Syrdal-Lasky, A., & Klein, R. E. (1975). VOT discrimination by four to sixand a half month old infants from Spanish environment. Journal ofExperimental Child Psychology, 20, 215–225.
Liberman,, A. M., Harris,, K. S., Hoffman,, H. S., & Griffith, B. C. (1957). Thediscrimination of speech sounds within and across phoneme boundaries.Journal of Experimental Psychology, 54, 358–368.
Lisker, L. (1975). Is it VOT or a first formant transition detector?. Journal of theAcoustical Society of America 57, 1547–1551.
Lisker, L., & Abramson, A. S. (1964). A cross-language study of voicing in initialstops: Acoustical measurements. Word, 20, 384–422.
Lisker, L., & Abramson, A. S. (1971). Distinctive features and laryngeal control.Language, 47, 767–785.
Lisker, L., Liberman, A. M., Erickson, D. M., & Dechovitz, D. (1978). On pushing thevoice onset time boundary about. Language and Speech, 20, 209–216.
Macmillan, N. A., & Creelman, C. D. (2005). Detection theory: A user’s guide. London:Lawrence Erlbaum.
McCullagh, P., & Nelder, J. A. (1983). Generalized linear models. London: Chapman &Hall.
Medina, V., & Serniclaes, W. (2009). Development of voicing categorization in deafchildren with cochlear implant. In Interspeech 2009 Brigthon, 10th ISCAconference, Abstract Book, 53.
Neijenhuis, K., Snik, A., Priester, G., van Kordenoordt,, S., & van den Broek, P. (2002).Age effects and normative data on a Dutch test battery for auditory processingdisorders. International Journal of Audiology, 41, 334–346.
Nearey, T. M. (1990). The segment as a unit of speech perception. Journal ofPhonetics, 18, 347–373.
Pollack,, S., & Pisoni, D. (1971). On the comparison between identification anddiscrimination tests in speech perception. Psychonomic Science, 24, 299–300.
Repp, B. H. (1979). Relative amplitude of aspiration noise as a voicing cue forsyllable-initial stop consonants. Language and Speech, 22, 173–189.
Rivera-Gaxiola, M., Silva-Peyrera, J., & Kuhl, P. (2005). Brain potentials to native-and non native speech contrasts in seven- and eleven-months-old Americaninfants. Developmental Science, 8, 162–172.
Kuhl, P. K., Conboy, B. T., Coffey-Corina, S., Padden, D., Rivera-Gaxiola, M., & Nelson,T. (2008). Phonetic learning as a pathway to language: New data and nativelanguage magnet theory expanded (NLM-e). Philosophical Transactions of theRoyal Society B, 363, 979–1000.
Schneider, B. A., & Trehub, S. E. (1992). Sources of developmental change inauditory sensitivity. In L. A. Werner, & E. W. Rubel (Eds.), Developmentalpsychoacoustics (pp. 3–46). Washington: American Psychological Association.
Schouten, B., Gerrits, E., & Van Hessen, A. (2003). The end of categorical perceptionas we know it. Speech Communication, 41, 71–80.
Serniclaes, W. (1987). Etude experimentale de la perception du trait de voisement desocclusives du franc-ais. Doctoral thesis, Universite Libre de Bruxelles.
Serniclaes, W., Blomert, L., & Froyen, D. (2007). Allophonic theory of dyslexia: Newevidence from speech sound identification and discrimination. In Society forthe scientific study of reading conference, Prague, July 2007.
Serniclaes, W., Van Heghe, S., Mousty, Ph., Carre, R., & Sprenger-Charolles, L.(2004). Allophonic mode of speech perception in dyslexia. Journal ofExperimental Child Psychology, 87, 336–361.
Simon, C., & Fourcin, A. J. (1978). Cross-language study of speech-pattern learning.Journal of the Acoustical Society of America, 63, 925–935.
Sprenger-Charolles, L. (2003). Evolution des difficultes specifiques de lecture et desdeficits associes: Etude longitudinale (5-17 ans). Rapport du contratd’etudes 17-02-001. Minist�ere de la Sante, de la Famille et des PersonnesHandicapees.
Sprenger-Charolles, L., Cole, P., & Serniclaes, W. (2006). Reading acquisition anddevelopmental dyslexia (essays in developmental psychology). Hove, UK, & NewYork, USA: Psychology Press (Taylor & Francis).
Stevens, K. N., & Klatt, D. H. (1974). Role of formant transitions in the voiced–voiceless distinction for stops. Journal of the Acoustical Society of America, 55,653–659.
Stollman, M. H., van Velzen, E. C., Simkens, H. M., Snik, A. F., & van den Broek, P.(2004). Development of auditory processing in 6–12-year-old children: Alongitudinal study. International Journal of Audiology, 43, 34–44.
Summerfield, Q. (1982). Differences between spectral dependencies in auditoryand phonetic temporal processing: Relevance to the perception of voicing ininitial stop. Journal of the Acoustical Society of America, 72, 51–61.
Summerfield, Q., & Haggard, M. (1977). On the dissociation of spectral andtemporal cues to the voicing distinction in initial stop consonants. Journal ofthe Acoustical Society of America, 62, 435–448.
Vihman, M. V. (1996). Phonological development: The origins of language in the child.Cambridge, MA: Blackwell.
Whalen, D. H., Levitt, A. G., & Goldstein, L. M. (2007). VOT in the babbling ofFrench- and English-learning infants. Journal of Phonetics, 35, 341–352.
Williams, L. (1977). The voicing contrast in Spanish. Journal of Phonetics, 5,169–184.
Wolf, C. G. (1973). The perception of stop consonants by children. Journal ofExperimental Child Psychology, 16, 318–331.
Wood, C. C. (1976). Discriminability, response bias, and phoneme categories indiscrimination of voice onset time. Journal of the Acoustical Society of America,60, 1381–1389.
Zlatin, M. A., & Koenigsknecht, R. A. (1975). Development of the voicingcontrast: Perception of stop consonants. Journal of Speech and Hearing Research,18, 541–553.