development of test batteries for diagnostics of motor
254
DEVELOPMENT OF TEST BATTERIES FOR DIAGNOSTICS OF MOTOR LATERALITY MANIFESTATION – LINK BETWEEN CEREBELLAR DOMINANCE AND HAND PERFORMANCE A Dissertation Submitted to the Faculty of Physical Education and Sport Charles University In Partial Fulfillment of the Requirements for the Degree of Doctor of Philosophy Kinanthropology by Martin Musálek Prague, Czech Republic 2012
-
Upload
khangminh22 -
Category
Documents
-
view
1 -
download
0
Transcript of development of test batteries for diagnostics of motor

DEVELOPMENT OF TEST BATTERIES FOR DIAGNOSTICS OF MOTOR
LATERALITY MANIFESTATION – LINK BETWEEN CEREBELLAR
DOMINANCE AND HAND PERFORMANCE
A Dissertation Submitted to the Faculty of
Physical Education and Sport
Charles University
In Partial Fulfillment of the
Requirements for the Degree of
Doctor of Philosophy
Kinanthropology
by
Martin Musálek
Prague, Czech Republic
2012

I hereby declare that this thesis is the result of my own work. I have indicated all used
information and literature sources. This thesis has not been used for obtaining either
another or the same academic title.
Prague 31st of August 2012 ………………………………………..

Evidence list
I agree to loan this dissertation thesis for study purposes. User`s signature confirms that
this thesis was used for studying purposes, and s/he declares that they have listed it in
used sources.
First name/ Surname: Faculty/ Department: Date of loan: Signature:

4
ACKNOWLEDGEMENTS
A number of individuals contributed significantly to this thesis. First I would
like to thank my supervisor Associate Professor Jitka Chytráčková who supported me
during whole doctoral study. Her approachability and useful lectures were crucial for
the final realization of the thesis. I would also like to thank my special consultant Dr.
Jan Štochl for his help in the field of psychometrics. Sincere appreciations are due to
Prof. Frank Danes from University of Puget Sound, to Associate Professor František
Véle from Faculty of Physical Education and Sport and František Synek who gave me
invaluable reccommendations and ideas which pushed me beyond my expectation. I
would like to especiall thank Prof. Jiří Tichý from Faculty of Medicine for his support
and insightful comments on the thesis.
I am also very greatful to the Wilfrid Laurier University for having me stay and
arranging my stay comfortable and unforgettably. Special recognition and thank is to
Prof. Pamela J. Bryden for her patient, great support and constructive critism an
invaluable lectures.
Individuals thank to Dr. Anna Brown from Cambridge, UK for her help and
reccommendations in problematic of IRT and SEM.
My family on the other hand helped me in more ways than I am capable of expressing. I
would like to express my deepest gratitude to my parents and aunt, for inexhaustible
devotion and support. A huge debt of graditude goes to my partner Monika Raczová for
being unlimited supportive, understanding and patience.
Last but not least, I am greatful to Theres, Fritz and Anton Kesting and to their friends
who was my second family in Canada in Waterloo during my intership. A great thanks
also to my friends Guaner Rojas and Martin Komarc for their patience in psychometrics
discussions.

5
Dedication:
Dedicated to my parents which I greatly appreciate and to the memory of Prof. Blahuš
who teached me first psychometric steps.

6
The only one unique painting of left-handed archer in the world at castle Houska in
Czech republic

7
CONTENTS
ACKNOWLEDGEMENTS.............................................................................................. 4
LIST OF TABLES.......................................................................................................... 10
LIST OF FIGURES ........................................................................................................ 15
ABSTRACT.................................................................................................................... 18
1. PHENOMENON CALLED LATERALITY........................................................... 20
1.1 Laterality as Concept ........................................................................................ 20
1.1.1 Asymmetry in Universe............................................................................. 20
1.1.2 Asymmetry and Chirality in Life System.................................................. 22
1.2 Laterality as Characteristic of Human .............................................................. 23
2. HUMAN BRAIN..................................................................................................... 25
2.1 Strucutral Hemispheric Asymmetry ................................................................. 25
2.2 Brain Organization and Motor Control ............................................................ 30
3. GENETIC MODELS OF RIGHT AND LEFT SIDEDNESS................................. 33
3.1 Different Gene Expression in Right and Left Hemispehere as Based of Neural
Hemispheric Asymmetry.................................................................................. 33
3.2 Genetic Model of Handedness Marion Annett, Right Shift Theory................. 35
3.3 Genetic Model of Handedness Chris McManus, D and C alleles .................... 37
3.4 Other Genetic Models of Handedness .............................................................. 38
4. ENVIROMENTAL FACTORS AS POSSIBLE CAUSE IN CHANGE OF
LATERALITY AT HUMAN.................................................................................. 42
4.1 Birth Stress ....................................................................................................... 42
4.2 Higher Level of Hormone Testosteron in Uterus ............................................. 43
5. TYPES OF LATERALITY ..................................................................................... 45
5.1 Functional Motor Laterality Manifestation ...................................................... 45
5.1.1 Preference .................................................................................................. 45
5.1.2 Performance Expression of Different Skill of Locomotive Organs in Motor
Activity ...................................................................................................... 46
5.1.3 Are Preference and Performance Communicating Vessels or Different
Attributes? ................................................................................................. 47
5.1.4 Dominance................................................................................................. 47
5.1.5 Laterality of Locomotive and Senzoric Organs......................................... 48

8
5.2 Structural Laterality of Locomotive Organs..................................................... 52
5.3 Structural and Motor Manifestations of Laterality in the Ontogenetic
Development of the Individual ......................................................................... 56
5.3.1 Prenatal Asymmetry .................................................................................. 57
5.3.2 Craniofacial Development......................................................................... 58
5.3.3 Motor Manifestations of Laterality in the Prenatal Period ........................ 58
5.3.4 Postnatal Development of Motor Manifestations of Laterality ................. 59
5.3.5 Corpus Callosum and Hemispheric Specialization ................................... 60
6. DIAGNOSTICS OF FUNCTIONAL MOTOR LATERALITY
MANIFESTATION................................................................................................. 63
6.1 Diagnostic Tools............................................................................................... 64
6.1.1 Preference Tasks........................................................................................ 65
6.1.2 Preference Self-reported Questionnaires ................................................... 71
6.1.2.1 Methodological and psychometric shortcomings of the most frequently
cited diagnostic tool, the Edinburgh Handedness Inventory ................ 76
6.1.3 Performance Tests ..................................................................................... 81
6.2 Evaluation of Cerebellar Dominance, New Approach for Approximation of
Hemispheric Superiority................................................................................... 84
7. EMPIRICAL RESEARCH...................................................................................... 87
8. RESEARCH QUESTIONS ..................................................................................... 90
9. HYPOTHESES........................................................................................................ 91
10. METHODS.............................................................................................................. 92
10.1 Definition of Theoretical Concept .................................................................... 92
10.2 Determination of Specific Theoretical Concepts.............................................. 94
10.3 Determination of Structure of Diagnostic Tool ................................................ 95
10.4 Creating a Complete List of Relevant Items .................................................... 96
10.5 Content Validity ............................................................................................... 98
10.6 First Version of Test Batteries........................................................................ 101
10.7 Verification of Intelligibility of Items ............................................................ 103
10.8 The Research Sample and Its Size.................................................................. 104
10.9 Final versions of Test Batteries Before Collecting the Data .......................... 107
10.10 Data Analysis, Evaluation of Structure .......................................................... 114
10.11 Approximation of Reliability.......................................................................... 114

9
11. STRUCTURAL EQUATION MODELING (SEM) ............................................. 117
11.1 Introduction .................................................................................................... 117
11.2 Types of SEM models .................................................................................... 118
11.3 Confirmatory Factor Analysis (CFA)............................................................. 119
11.4 Categorical Variables and SEM ..................................................................... 122
11.5 Types of Parameters Used in SEM Method for Parameters Estimation......... 125
11.6 Model Testing Fit Evaluation ........................................................................ 126
11.7 Residuals......................................................................................................... 129
12. RESULTS .............................................................................................................. 130
12.1 Test Battery for Adult Population .................................................................. 130
12.1.1 Questionnaire........................................................................................... 131
12.1.2 Preference Tasks...................................................................................... 141
12.1.3 Performance Tests ................................................................................... 155
12.2 Test Battery for Child Population................................................................... 170
12.2.1 Preference Tasks...................................................................................... 170
12.2.2 Performance Tests ................................................................................... 184
13. SCORING.............................................................................................................. 196
14. DISCUSSION........................................................................................................ 200
15. CONCLUSION...................................................................................................... 209
16. REFERENCES ...................................................................................................... 211
17. APPENDIX............................................................................................................ 251

10
LIST OF TABLES
1. Recommended values of panelists conformity
2. Fit of the 2-factor model questionnaire 1. version of test battery (adult
population)
3. Residual matrix 2-factor model questionnaire 1. version of test battery (adult
population)
4. Fit of the 2-factor model questionnaire 1. version of test battery without items
HD and GD (adult population)
5. Residual matrix 2-factor questionnaire 1. version of test battery without items
HD and GD (adult population)
6. Fit of the 1-factor model questionnaire 1. version of test battery without items
HD, GD and ST (adult population)
7. Residual matrix 1-factor model questionnaire 1. version of test battery without
items HD, GD and ST (adult population)
8. Generic reliability – questionnaire part 1 version (adult population)
9. Fit of the 1-factor model questionnaire 2. version of test battery (adult
population)
10. Residual matrix 1-factor model questionnaire 2. version of test battery (adult
population)
11. Fit of the 1-factor model questionnaire 2. version of test battery without item HS
(adult population)
12. Fit of the 2-factor model questionnaire 2. version of test battery without items
HS and HD (adult population)
13. Residual matrix 2-factor model questionnaire 2. version of test battery without
items HS and HD (adult population)
14. Generic reliability – questionnaire part 2. version (adult population)
15. Fit of the 2-factor model preference tasks 1. version of test battery (adult
population)
16. Residual matrix 2-factor model preference tasks 1. version of test battery (adult
population)
17. Fit of the 2-factor model preference tasks 1. version of test battery without items
PO, MC and LJ (adult population)

11
18. Residual matrix 2-factor model preference tasks 1. version of test battery
without items PO, MC and LJ (adult population)
19. Fit of the 2-factor model preference tasks 1. version of test battery without items
PO, MC, LJ a THR (adult population)
20. Residual matrix 2-factor model preference tasks 1. version of test battery
without items PO, MC, LJ a THR (adult population)
21. Fit of the 1-factor model preference tasks 1. version of test battery without items
PO, MC, LJ a THR (adult population)
22. Residual matrix 1-factor model preference tasks 1. version of test battery
without items PO, MC, LJ a THR (adult population)
23. Generic reliability – preference tasks 1. version (adult population)
24. Fit of the 1-factor model preference tasks 2. version of test battery (adult
population)
25. Residual matrix 1-factor model preference tasks 2. version of test battery (adult
population)
26. Fit of the 1-factor model preference tasks 2. version of test battery without items
RI, TU and STO (adult population)
27. Residual matrix 1-factor model preference tasks 2. version of test battery
without items RI, TU and STO (adult population)
28. Fit of the 2-factor model preference tasks 2. version of test battery without items
RI, TU and STO (adult population)
29. Generic reliability – preference tasks 2. version (adult population)
30. Residual matrix 2-factor model preference tasks 2. version of test battery
without items RI, TU and STO (adult population)
31. Fit of the hierarchic model with one general factor without items RI, TU and
STO (adult population)
32. Correlation matrix hand preference tasks and eye dominance (adult population)
33. Fit of the 2-factor model performance tests 1. version of test battery (adult
population)
34. Residual matrix 2-factor model performance tests 1. version of test battery (adult
population)
35. Fit of the 2-factor model performance tests 1. version of test battery without
items HGR and CM (adult population)

12
36. Residual matrix 2-factor model performance tests 1. version of test battery
without items HGR and CM (adult population)
37. Fit of the 2-factor model performance tests 1. version of test battery without
items HGR, CM and JO (adult population)
38. Residual matrix 2-factor model performance tests 1. version of test battery
without items HGR, CM and JO (adult population)
39. Fit of the 2-factor model performance tests 1. version of test battery without
items HGR, CM and TW (adult population)
40. Residual matrix 2-factor model performance tests 1. version of test battery
without items HGR, CM and TW (adult population)
41. Generic reliability – performance tests 1. version (adult population)
42. Fit of the 2-factor model performance tests 2. version of test battery (adult
population)
43. Residual matrix 2-factor model performance tests 2. version of test battery (adult
population)
44. Fit of the 2-factor model performance tests 2. version of test battery without
items PT and TDS (adult population)
45. Residual matrix 2-factor model performance tests 2. version of test battery
without items PT and TDS (adult population)
46. Fit of the 2-factor model performance tests 2. version of test battery without
items PT, TDS and PG (adult population)
47. Residual matrix 2-factor model performance tests 2. version of test battery
without items PT, TDS and PG (adult population)
48. Generic reliability – performance tests 2. version (adult population)
49. Fit of the 2-factor model preference tasks 1. version of test battery (child
population)
50. Residual matrix 2-factor model preference tasks 1. version of test battery (child
population)
51. Fit of the 2-factor model preference tasks 1. version of test battery without items
TC, DM and CM (child population)
52. Residual matrix 2-factor model preference tasks 1. version of test battery
without items TC, DM and CM (child population)
53. Fit of the 2-factor model preference tasks 1. version of test battery without items
TC, DM, CM and OPB (child population)

13
54. Residual matrix 2-factor model preference tasks 1. version of test battery
without items TC, DM, CM and OPB (child population)
55. Generic reliability – preference tasks 1. version of test battery (child population)
56. Fit of the 1-factor strucutre preference tasks 1. version of test battery without
items TC, DM, CM, OPB, SLI and TU
57. Fit of the 2-factor model preference tasks 2. version of test battery (child
population)
58. Residual matrix 2-factor model preference tasks 2. version of test battery (child
population)
59. Fit of the bi-factor model preference tasks 2. version of test battery without
items THR, DM, ER, SBS, CAL, WT and LJ (child population)
60. Fit of the 1-factor model preference tasks 2. version of test battery without items
THR, DM, ER, SBS, CAL, WT and LJ (child population)
61. Generic reliability – preference tasks 2. version of test battery (child population)
62. Correlation matrix hand preference tasks and eye dominance (child population)
63. Fit of the 2-factor model performance tests 1. version of test battery (child
population)
64. Residual matrix 2-factor model performance tests 1. version of test battery (child
population)
65. Fit of the 2-factor model performance tests 1. version of test battery without
tests PM, SL and RKB (child population)
66. Residual matrix 2-factor model performance tests 1. version of test battery
without tests PM, SL and RKB (child population)
67. Fit of the 2-factor model performance tests 1. version of test battery without
tests PM, SL, RKB and STB (child population)
68. Residual matrix 2-factor model performance tests 1. version of test battery
without tests PM, SL, RKB and STB (child population)
69. Generic reliability – performance tests 1. version of test battery (child
population)
70. Fit of the 2-factor model performance tests 2. version of test battery (child
population)
71. Residual matrix 2-factor model performance tests 2. version of test battery (child
population)

14
72. Fit of the 2-factor model performance tests 2. version of test battery without
tests SCN, CM, MF and SL (child population)
73. Residual matrix 2-factor model performance tests 2. version of test battery
without tests SCN, CM, MF and SL (child population)
74. Generic reliability – performance tests 2. version of test battery (child
population)

15
LIST OF FIGURES
1. S and Z type of galaxy
2. Human brain, below perspective
3. Distribution of handedness based on performance between right and left hand,
RS model with alells RS--, RS+- a RS++.
4. Laterality score bimodal distribution of hand preference in population
5. Motor preference tasks for hand preference from „Harris test for lateral
dominance“
6. Examples of tasks which assess spontaneous hand preference
7. Recommended values of research sample size
8. Example of CFA model, independent clusters
9. Path diagram of 2-factor model questionnaire 1. version of test battery (adult
population)
10. Path diagram of 2-factor model questionnaire 1. version of test battery without
items HD and GD (adult population)
11. Path diagram of 1-factor model questionnaire 1. version of test battery without
items HD, GD and ST (adult population)
12. Path diagram 1-factor model questionnaire 2. version of test battery (adult
population)
13. Path diagram 1-factor model questionnaire 2. version of test battery without item
HS (adult population)
14. Path diagram 2-factor model questionnaire 2. version of test battery without
items HS and HD (adult population)
15. Path diagram 2-factor model preference tasks 1. version of test battery (adult
population)
16. Path diagram 2-factor model preference tasks 1. version of test battery without
items PO, MC and LJ (adult population)
17. Path diagram 2-factor model preference tasks 1. version of test battery without
items PO, MC, LJ a THR (adult population)
18. Path diagram 1-factor model preference tasks 1. version of test battery without
items PO, MC, LJ a THR (adult population)

16
19. Path diagram 1-factor model preference tasks 2. version of test battery (adult
population)
20. Path diagram 1-factor model preference tasks 2. version of test battery without
items RI, TU and STO (adult population)
21. Path diagram 2-factor model preference tasks 2. version of test battery without
items RI, TU and STO (adult population)
22. Path diagram 2-factor model performance tests 1. version of test battery (adult
population)
23. Path diagram 2-factor model performance tests 1. version of test battery without
items HGR and CM (adult population)
24. Path diagram 2-factor model performance tests 1. version of test battery without
items HGR, CM and JO (adult population)
25. Path diagram 2-factor model performance tests 1. version of test battery without
items HGR, CM and TW (adult population)
26. Path diagram 2-factor model performance tests 2. version of test battery (adult
population)
27. Path diagram 2-factor model performance tests 2. version of test battery without
items PT and TDS (adult population)
28. Path diagram 2-factor model performance tests 2. version of test battery without
items PT, TDS and PG (adult population)
29. Path diagram 2-factor model preference tasks 1. version of test battery (child
population)
30. Path diagram 2-factor model preference tasks 1. version of test battery without
items TC, DM and CM (child population)
31. Path diagram 2-factor model preference tasks 1. version of test battery without
items TC, DM, CM and OPB (child population)
32. Path diagram 1-factor model preference tasks 1. version of test battery without
items TC, DM, CM, OPB, SLI and TU (child population)
33. Path diagram 2-factor model preference tasks 2. version of test battery (child
population)
34. Path diagram bi-factor model preference tasks 2. version of test battery without
items THR, DM, ER, SBS, CAL, WT and LJ (child population)
35. Path diagram 2-factor model performance tests 1. version of test battery (child
population)

17
36. Path diagram 2-factor model performance tests 1. version of test battery without
tests PM, SL and RKB (child population)
37. Path diagram 2-factor model performance tests 1. version of test battery without
tests PM, SL, RKB and STB (child population)
38. Path diagram 2-factor model performance tests 2. version of test battery (child
population)
39. Path diagram 1-factor model performance tests 2. version of test battery without
tests SCN, CM, MF and SL (child population)
18
ABSTRACT
The aim of this study is to contribute to the standardization of the new diagnostic
tools assessing the motor manifestations of laterality in adults and children aged 8 to 10
years, both in terms of determining the theoretical concept and the selection of
appropriate items, and the verification of structural hypotheses concerning the design of
acceptable models, including the diagnostic quality of individual parts of the test
battery. Moreover in this study we try to suggest new approach in assessing of motor
laterality manifestation by means of relationship between cerebellar dominance and
hand performance.
The first part of this thesis deals with the concept of laterality, its manifestations
and meaning in non-living systems and living organisms. As a human characteristic,
laterality is manifested in a variety of functional and structural asymmetries. This part
also discusses ways of diagnosing motor manifestations of laterality and the issue of
cerebellar dominance, including its reflection in the form of asymmetry of the extinction
physiological syndrome of upper limbs.
The second part focuses on the process of the standardization study, the
statistical method of structural equation modelling, and the actual design of test battery
construction.
The last part of this thesis presents the results of structural equation modelling,
i.e., the dimensionality and diagnostic quality, including the reliability of various
proposed models. The results are two test batteries.
The test battery for the adult population consists of three parts: a questionnaire, a
preference motor task part, and a performance test part. The questionnaire part of the
test battery has a unidimensional nature called “Preference of Locomotive Organs”. The
strongest indicators were those of an instrumental nature. An interesting finding is that
the frequently used indicator “which hand do you use to write” had to be removed in the
modelling of the structure of this part, because it showed strong multicollinearity.
The preference motor task part has a two-factor structure with the factors “Upper
Limb Preference” and “Lower Limb Preference”. The results of modelling in this part
of the test battery show that in order to obtain a more precise picture of motor
manifestations of laterality it is appropriate to include tasks exhibiting the nature of
unskilled spontaneous activity, in addition to skilled instrumental motor tasks.

19
The performance tests have a two-factor structure with the factors “Upper Limb
Performance” and “Lower Limb Perfromance”. This part of the test battery tested the
relationship between the cerebellar dominance and hand performance, which was found
to be statistically significant, reaching the level of p < 0.001.
The test battery for the child population consists of two parts: a preference motor
task part and a performance test part.
The preference motor task part has a two-factor structure with the factors “Upper
Limb Preference” and “Lower Limb Preference”. It was found that the factor “Upper
Limb Preference” is closely related to “reaching tasks”, where the subject can
repeatedly work across the natural body axis. The perspective of the advantages and
disadvantages of handling an object across the natural body axis could be the main
indicator of preference.
The performance tests have a one-factor structure with the “Performance of
Locomotive Organs” factor. The results of this part of the battery display a different
lateralization of upper and lower limbs. The tests focusing on lower limbs showed that
the more significant fine-motor nature emphasizing balance a certain activity exhibited,
the less sensitive the tests were. This part also tested the relationship between cerebellar
dominance and hand performance; as in the adult population, this relationship was
statistically significant, reaching the level of p < 0.001.
The diagnostic quality in the form of generic reliability in both test batteries
range from 0.78 to 0.95.
Keywords: asymmetry, laterality, handedness, cerebellar dominance, structural
equation modelling, test development, dimensionality, reliability, kinesiology, motor
control

20
1. PHENOMENON CALLED LATERALITY
The entire next chapter is devoted to the concept of laterality, its derivation, and
the place it holds within both non-living and living systems. All of this information will
help us at the end of the chapter to formulate the actual relationship between laterality
and humans.
1.1 Laterality as ConceptThe basis for the definition of the concept of laterality, derived from the Latin
word latus, meaning “side” (Kábrt, Kucharský, Schams,Vránek, Wittichová, & Zelinka,
2001), was the finding that most manifestations in living nature result from the
spontaneous violation of symmetry, which is generally considered to be unstable
(Coleman, Weinberg, & Lyman Laboratory of Physics, Harvard University, Cambridge,
1973). One of the possible causes of this violation is a loss of symmetry due to a
transition from a certain energy state to a lower energy state (some symmetry is
conserved in a certain energy state, but after the transition to a lower state, this
symmetry disappears: spinning flywheel, stopping flywheel). Another case of
spontaneous violation of symmetry is violation of parity – sameness (Riehl, 2010).
Spontaneous violation of symmetry leads to the creation of asymmetry (Senjanovic,
Mohapatra, & Department of Physics, The City College of the City University of New
York, New York, 1975; Viedma, 2007). The word asymmetry comes from Greek and
refers to irregularity. Asymmetry can even be observed in the basic manifestation of the
existence of matter – movement.
1.1.1 Asymmetry in Universe
When it comes to determining the origin of asymmetry in living nature,
numerous studies deal with asymmetry and its manifestations in the universe. Many
studies dealing with asymmetry of galaxy spin are currently available. Observation and
subsequent simulation studies have been performed, focusing on spiral galaxies that
rotate the disk of baryonic matter (composed of protons, electrons, and neutrons). These
studies are particularly concerned with the evolution of galaxy spin. In contemporary
modern theory dealing with this issue, the “Tidal Torque Theory” model (Schäfer,
21
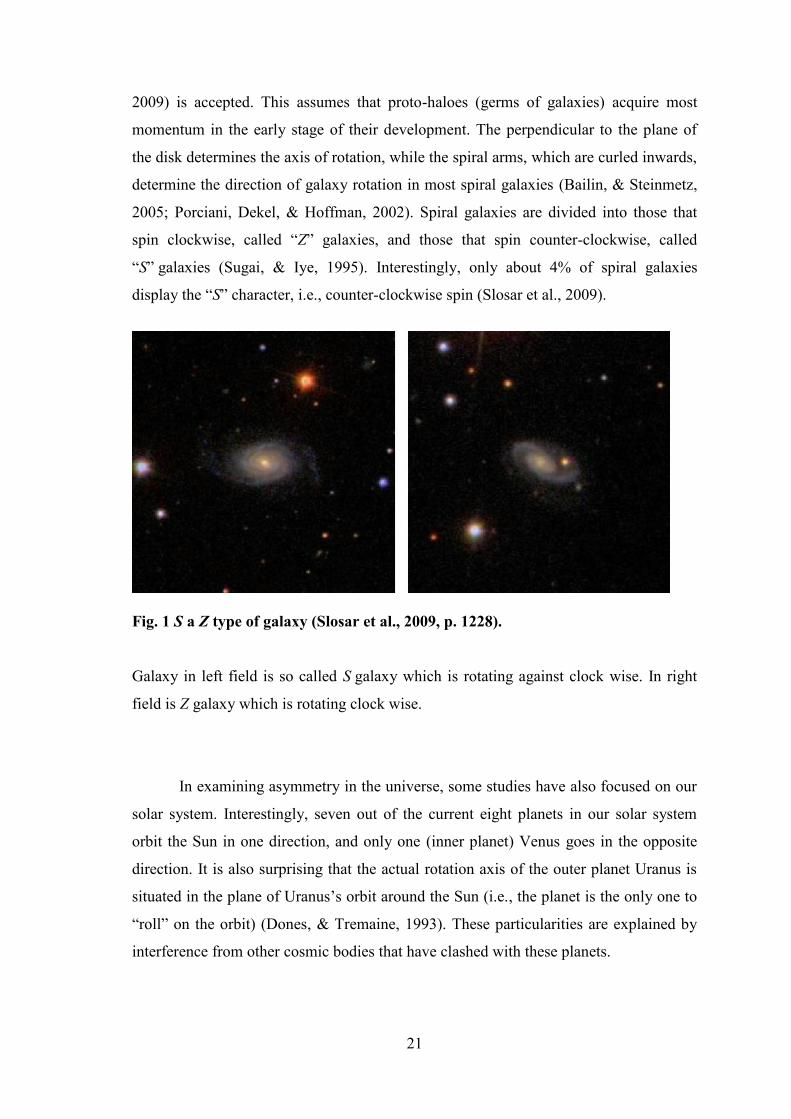
2009) is accepted. This assumes that proto-haloes (germs of galaxies) acquire most
momentum in the early stage of their development. The perpendicular to the plane of
the disk determines the axis of rotation, while the spiral arms, which are curled inwards,
determine the direction of galaxy rotation in most spiral galaxies (Bailin, & Steinmetz,
2005; Porciani, Dekel, & Hoffman, 2002). Spiral galaxies are divided into those that
spin clockwise, called “Z” galaxies, and those that spin counter-clockwise, called
“S” galaxies (Sugai, & Iye, 1995). Interestingly, only about 4% of spiral galaxies
display the “S” character, i.e., counter-clockwise spin (Slosar et al., 2009).
Fig. 1 S a Z type of galaxy (Slosar et al., 2009, p. 1228).
Galaxy in left field is so called S galaxy which is rotating against clock wise. In right
field is Z galaxy which is rotating clock wise.
In examining asymmetry in the universe, some studies have also focused on our
solar system. Interestingly, seven out of the current eight planets in our solar system
orbit the Sun in one direction, and only one (inner planet) Venus goes in the opposite
direction. It is also surprising that the actual rotation axis of the outer planet Uranus is
situated in the plane of Uranus’s orbit around the Sun (i.e., the planet is the only one to
“roll” on the orbit) (Dones, & Tremaine, 1993). These particularities are explained by
interference from other cosmic bodies that have clashed with these planets.

22
1.1.2 Asymmetry and Chirality in Life System
The issue of asymmetry can also be examined in microcosm. Back in the 19th
century, while observing the process of grape fermentation under a microscope, the
famous French scientist Louis Pasteur discovered that two chemically identical
substances can display different effects in the rotation of polarized light. Pasteur found
that the acid from the natural fermentation process contains one type of crystal that
rotates polarized light clockwise. However, the acid from the industrial fermentation of
grapes contained two types of crystals that exhibited mirror uniformity, and did not
rotate polarized light. When the two types of crystals from industrially produced acid
were separated, it was found that the crystals in one type of acid rotated polarized light
clockwise, while the crystals in the other type rotated polarized light counter-clockwise.
It is also interesting that the acid-containing crystals that rotated polarized light
clockwise enabled implemented microorganisms to reproduce and metabolize, while in
the second type of acid (containing crystals that rotated polarized light counter-
clockwise), microorganisms were not able to start the metabolism. At present, it is
known that most molecules in laboratory conditions occur in two forms that are of
mirror character (stereoisomer) to each other (Nicolle, 1962). These are also known as
chiral molecules (Barron, 1982; Salam & Meath, 1998; Woolley, 1976). The term
“chirality” is derived from the Greek word for hand, “kheir”, and refers to the
asymmetry of spatial distribution of an object that is not identical with its mirror image
(Riehl, 2010). Although the molecules that make up the human body also occur in two
forms in laboratory conditions, the human body always contains only one of them: with
respect to saccharides, it is the D-form (dextral), derived from the Latin word for right
side; with regard to amino acids, it is solely the L-form (laevo), derived from the Latin
word for left side. Identification of the side is always based on where the substance
rotates polarized light – whether to the right or to the left. This dominance of one type
over another is not unique to humans, but applies to most living organisms on our planet
(McManus, 2002). The state in which a substance naturally exists in the environment in
only one form is called homochirality (Suzuki, Tanaka, Shiro, Shibata, Osaka, & Asahi,
2010).
The current view on the issue of asymmetry formation in biological substances
provides two basic hypotheses. One assumes that the original representation of both
forms was roughly the same (i.e., 50%), and that homochirality progressively changed
depending on evolution. The second hypothesis is based on the idea that asymmetry

23
leading to homochirality preceded the formation of life and comes from the universe
(Origin of Life on Earth: ‘Natural’ Asymmetry of Biological Molecules May Have
Come from Space, 2011; Breslow, 2011).
Based on the above examples and the outline of the importance of asymmetry
and homochirality, viewed from different scientific perspectives, it is evident that these
concepts form the basis for the selection of the side or direction in order to obtain
certain features or benefits. Chirality clearly shows that due to differences in the spatial
arrangement of molecules, two chemically identical compounds display vastly different
characteristics. These can be generally termed favourable or unfavourable asymmetry,
especially in the context of living organisms.
1.2 Laterality as Characteristic of HumanThe important information arising from the previous chapter is that even organic
substances – both the basic building blocks of living organisms (amino acids) and the
basic units of energy (saccharides) – display chiral asymmetry. As mentioned in the
previous chapter, in most cases amino acids occur in living organisms in the L-form and
saccharides in the D-form. Due to their specific spatial arrangement, these substances
acquire a certain characteristic. Since the concept of laterality is based on the concepts
of asymmetry and chirality, it is possible to view laterality and its manifestations in the
human organism as a human characteristic.
This characteristic is probably genetically determined, and some of its aspects
are determined during early embryonic development (Wood, 2005). One area in which
laterality is manifested (which is explored in detail in humans) is the left-right
asymmetry of the arrangement of internal organs according to the vertical axis of the
body. Deviations of this left-right asymmetry of internal organs in the form of inverted
arrangement in the abdominal cavity (Guichard et al., 2001; Wood, 2005), called situs
inversus (Kosaki & Casey, 1998; Lopez-Garcia & Ross, 2007; Yokoyama, Copeland,
Jenkins, Montgomery, Elder, & Overbeek, 1993), have frequently been detected in
Kartagener syndrome, whose symptoms include reduced or absent mucus clearance
from the lungs and male infertility (Kartagener, 1933). A heterozygous mutation of
DNA/1 gene, which according to scientists is linked to a change in the asymmetry of
internal organs, has been found in the genetic code of patients with Kartagener

24
syndrome (Failly et al., 2009; Guichard et al., 2001; Leigh et al., 2009). Among other
things, the change in this asymmetry may also lead to severe congenital defects
affecting mainly the cardiovascular system. Some authors say that gene mutations may
cause changes in several aspects of chirality, which may in turn lead to situs inversus
(Oliverio, Digilio, Versacci, Dallapiccola, & Marino, 2010). Despite the fact that
laterality most likely forms a genetically determined human characteristic that displays
more stable personality traits, it is important to realize that it does not have absolute
stability over time. Laterality is influenced by various environmental factors that may
affect its form, even in the early postnatal period (Alibejk, & Angaji, 2010; Bakan,
1978; Elliot, & Roy, 1996; McManus, 1981; Orsini, & Satz, 1986).
As can be seen, laterality, as a human characteristic, plays a very important role
in the own existence of humans. Therefore, the next chapter will focus on the most
complex system known to us in which individual structural asymmetries are directly
reflected in the external motor manifestations of humans: the human brain.

25
2. HUMAN BRAIN
The human brain is currently the most complex system known to us that has a
certain structure and very specifically differentiated functional centres. Damaged to
them results in temporary or permanent loss of a certain function. Brain research and
issues related to the exploration of asymmetry and laterality are nothing new. For
instance the relationship between speech and a particular area of the brain was
discovered by Pierre Paul Broca as early as in the 19th century.
2.1 Strucutral Hemispheric AsymmetryThis section deals with the issue of structural asymmetry of cerebral
hemispheres related to motor activity and motor manifestations of laterality. The
following information is based on current approaches to the assessment of brain
structure.
Starting from the subcortical area of diencephalon, the brain displays a paired
arrangement of its individual parts: the right and left part of the thalamus (Sherman, &
Guillery, 2000), and the right and left half of the hypothalamus (Swaab, 2003). The
cortical area is divided into two functionally distinct hemispheres (left and right), which
are divided by a longitudinal fissure, and which communicate with each other through
the corpus callosum. Since the function is superior to the organ, the most significant
structural differences in the human brain are demonstrated by lateralization in cortical
areas of the telencephalon.
Basic human brain asymmetry is evident at a glance. The right hemisphere is
mostly wider than the left hemisphere in the frontal region. In addition, the right
anterior frontal region is larger than the same region of the left hemisphere. By contrast,
the occipital region is wider in the left hemisphere, and its posterior part is larger than
the same region of the right hemisphere (Bradshaw, & Nettleton, 1983).

26
Fig. 2 Human brain, below perspective (Toga, & Thompson, (2003, p. 43).
It is generally accepted that the most significant relationship to structural
asymmetries of the brain hemispheres is represented by hand preference. Several
anatomical asymmetries have been documented in right-handed individuals
(Geschwind, & Galaburda, 1987). One of the most frequently observed asymmetries is
the length and shape of cortical sulci, known as the Sylvian fissure. These deep sulci on
the outer surface of the cerebral hemispheres form the boundary between the frontal,
parietal, and temporal lobes. It is known from the postmortem studies conducted by
Cunningham and Eberstaller in the late 19th century that the right Sylvian fissure and
the left Sylvian fissure are typically asymmetric at the posterior end (Cunningham,
1892; Eberstaller, 1884). In most brains examined, the Sylvian fissure rises more at the
end in the right hemisphere (Geschwind, & Galaburda, 1987; Hellige, 2001; Jäncke, &
Steinmetz, 2004). This asymmetry has been verified in many contemporary studies, and
it has been proved to be stronger in right-handed individuals than in non-right-handed
individuals. Based on the results of their research, in 1975 Hochberg and LuMay
confirmed a significant difference in the height of the posterior end of the Sylvian
fissure between right-sided and left-sided individuals. In right-sided individuals, the
Sylvian fissure rose more in the right hemisphere in 67% of the cases examined. In left-
sided individuals, the Sylvian fissure rose more in the left hemisphere in only 22% of
the cases examined (Hochberg, & LuMay, 1975). It is also typical that the Sylvian

27
fissure is longer in the left hemisphere than in the right hemisphere. Another observed
structural asymmetry is the proportion of the range of cortical areas in the Rolandic
sulcus, representing the upper limbs.
The area in the left Rolandic sulcus representing the right upper limb is larger
than the same area representing the left upper limb in the right Rolandic sulcus (White
et al., 1994). Results of studies have also shown that the left Rolandic sulcus is deeper
in right-handed individuals (the opposite being true in left-handed individuals), and that
this asymmetry is more visible in right-sided individuals (Amunts, Hlaug, Schleicher, &
Steinmetz, 1996). However, current research into Rolandic sulcus asymmetry has also
led to the opposite results, and the original assumption of a strong correlation between
structural asymmetry in this area and hand preference has been refuted by the findings
of a study carried out by Davatzikos and Bryan (2002). In their study, a deeper and
longer Rolandic sulcus was found in the right hemisphere; in addition, the study
revealed that the variability of this asymmetry also depends on gender. The structural
asymmetry was significantly higher in men than in women (Davatzikos, & Bryan,
2002). Based on these results, an analysis was carried out that found correlation
between the level of asymmetry, i.e., the depth in the Rolandic sulcus, and age; it
supported the previous assumption concerning the variability of this asymmetry related
to the gender of individuals (Cykowski et al., 2008). Other cytoarchitectonic
asymmetries were found in the temporal lobes, which are important for receiving speech
stimuli. Structural differences were found between the left and right Heschl’s gyrus
where the primary auditory cortex is located. Results of studies have shown that
Heschl’s gyrus is larger in the left hemisphere (Rademacher, Caviness, Steinmetz, &
Galaburda, 1993), due to the greater amount of white matter that Heschl’s gyri are
composed of. However, from the statistical point of view, the actual size of the primary
auditory cortex in both Heschl’s gyri is not significantly different (Morosan,
Rademacher, Schleicher, Amunts, Schormann, & Zilles, 2001). In addition to Heschl’s
gyri, the structure of another part of the temporal lobes has been compared, specifically
the left and right planum temporale. The planum temporale is larger (and longer) in the
left hemisphere in right-sided individuals. Research has focused on the area known as
the “Tpt”, located around the planum temporale, which has been found to be larger in
the left hemisphere in three out of four right-handed individuals examined (Galaburda,
Sanides, & Geschwind, 1978). Interestingly, left-sided individuals did not exhibit a
reversed size of the planum temporale but rather symmetry of these two areas of the

28
temporal lobes (Geschwind, & Galaburda, 1987; Geschwind, & Lewitsky, 1968; Jäncke
& Steinmetz, 2004). Particularly interesting results were produced by studies comparing
the structural asymmetry in the temporal regions of different populations using
magnetic resonance. The research group consisted of children with dyslexia, children
with attention deficit hyperactivity disorder (ADHD), and a group of normally
developing children. 70% of children with ADHD and normally developing children
showed a larger planum temporale in the left hemisphere. In contrast, 90% of children
with dyslexia showed a larger planum temporale in the right hemisphere. These children
exhibited a significantly smaller planum temporale in the left hemisphere in comparison
with the other groups, while the planum temporale in the right hemisphere did not differ
in size from the average in other children (Hynd, Semrud-Clikeman, Lorys, Novey, &
Eliopulos, 1990). Differences in cytoarchitectonic structure and size were also
confirmed in the parietal lobes: the left parietal lobe was larger than the right parietal
lobe in most individuals (Eidelberg, & Galaburda, 1984). A significant correlation
between the asymmetry in PG (the area related to speech) and the asymmetry in the
planum temporale was also observed. With respect to the parietal lobe called PEG (the
area in the parietal lobe including non-speech functions), in which the importance of
visual-orientation function is hypothetically assumed, the same study also revealed a
generally larger area in the right hemisphere (Eidelberg, & Galaburda, 1984; Toga, &
Thompson, 2003). Differences in the size of the planum temporale and in a certain
parietal area were also found in children and adolescents (Larsen, Hoien, Lundberg, &
Odegaard, H. 1990). Therefore, it was suggested that planum temporale asymmetry is
not constant throughout life, but that it can probably be modelled using environmental
and genetic factors (Schlaug, Jäncke, Huang, & Steinmetz,1995). Distinct structural
asymmetry has also been found in the inferior part of the frontal gyrus called the pars
opercularis (injury to it leads to aphasia in the Broca’s area), the size of which is closely
correlated with right-sidedness or left-sidedness. In right-sided individuals, this area is
significantly larger in the left hemisphere (Dorsaint-Pierre et al., 2006; Foundas,
Leonard, Gilmore, Fennell, & Heilman, 1996; Geschwind, & Galaburda, 1987; Keller,
Crow, Fiundas, Amunts, & Roberts, 2007). The study by Foundas et al. (1998) first
proved asymmetry also in left-sided individuals with a larger pars opercularis in the
right hemisphere (Foundas, Hong, Leopard, & Heilman, 1998). These asymmetries in
the inferior part of the frontal cortex are also supported by the finding of asymmetry in
the white matter in this area, which connects the inferior part of the frontal cortex with

29
the anterior part of the temporal cortex. Highley et al. (2002) discovered asymmetry in
the white matter in this area in the brains of both men and women. White matter was on
average 27% larger, and contained 33% more fibres in the right hemisphere (Highley,
Walker, Esiri, Crow, & Harrison, 2002). Apart from cytoarchitectonic changes in
individual cortical areas, research has also focused on possible structural differences in
the corpus callosum, which forms the main communication channel between the
hemispheres. The following variables were related: the size of the corpus callosum and
the laterality of individuals (their side preference). It was found that in left-handed
individuals and individuals without a definite side preference the corpus callosum is on
average 11% larger than in right-handed individuals (Driesen, & Naftali, 1995;
Witelson, 1985). Significant differences in the size of the corpus callosum were also
confirmed by studies comparing the size of the corpus callosum in musically gifted
individuals and the general population (Schlaug, Jäncke, Huang, Staiger, & Steinmetz,
1995).
Several structural asymmetries were also found in areas involved in motor and
sensory functions, such as the caudate nucleus (Watkins et al., 2001) or cerebellum
(Snyder, Bilder, Wu, Borgets, & Lieberman, 1995). The studies carried out by
Volkmann et al. (1998) using magnetoencephalography revealed that grey matter is
significantly larger in the motor cortex, which is located contralaterally to the preferred
upper limb (Volkmann, Schnitzler, Witte, & Freund, 1998).
Other studies have dealt with assessing the amount of grey matter cells in the
right and left primary motor area. They found that this amount was generally greater in
the right primary motor cortex, both in adults and children. The space between cells in
the cortex, called the neuropil, which is composed of axons, dendrites, and synapses,
was generally found to be greater in the left primary motor cortex. In the analysis of
individual layers of primary motor cortex, differences in asymmetry of the cortex due to
age were also identified. The supragranular layers showed significantly less asymmetry
in children than in adults, while the infragranular layers showed similar levels of
asymmetry in both age groups (Amunts, Schmidt-Passos, Schleicher, & Zilles, 1997).
Macrostructural asymmetry is complemented by microstructural differences.
With respect to the Brodmann area, right-sided individuals exhibited a more
complicated and extensive internal structure in the left hemisphere. These asymmetries
indicate a connection between hand preference and increased segmentation of the
internal sulcus surface of the precentral gyrus (Hellige, 2001). Morphometry also

30
revealed correlations between anatomic asymmetries in the planum temporale, the
planum parietale, and hand preferences (Steinmetz, 1991). According to Chance, most
hemispheric asymmetries are suppressed in individuals with the psychiatric diagnosis of
schizophrenia (Chance, Casanova, Switala, & Crow, 2008). Despite the identification of
many cytoarchitectonic differences between the two brain hemispheres, which are
mainly related to hand preference in motor activity, it should be noted that hemispheric
asymmetry is subject to interindividual variability (shape, size), which is also related to
the functional lateralization of the human brain (Amunts, Schleicher, Bürgel, Mohlberg,
Uylings, & Zilles, 1999; Eickhoff, 2005).
2.2 Brain Organization and Motor ControlIn this part of thesis we will deal with basic description of six brain areas that
involved different level of motor control of human.
a) Brainstem
The brainstem, formed inside the skull and structurally continuous with the
spinal cord, consists of three basic structures: the medulla oblongata, the pons, and the
mesencephalon. The anatomy of the brainstem, whose structure is represented by the
reticular formation, is important. The reticular formation consists of more than 50 brain
nuclei (reticular formation is also located in the thalamus), which form a polysynaptic
and multisensory system in the brainstem; the system receives impulses from all
specific neural pathways. The brainstem is the area that receives input from receptors
that are directly linked to vital and other somatic functions and internal organs (Urban,
& Caplan, 2011).
b) Cerebellum
The cerebellum “sits” directly on the brainstem; it is located partly between the
occipital lobes of the brain hemispheres and partly under them. The cerebellum consists
of two cerebellar hemispheres; each hemisphere is responsible for carrying out the
function ipsilaterally. All information processed by it serves both to consciously
maintain the balance of the postural system and to co-ordinate controlled fine motor
movements in space (Barlow, 2002).

31
c) Thalamus
The thalamus, which is a grouping of different types of nuclei, is located in the
rear of the diencephalon. Its structure contains, for example, nuclei that transfer
impulses from the periphery to the sensory cortex areas. Furthermore, there are nuclei
that transfer impulses from the cerebellum to the motor cortex, and nuclei transferring
impulses from the diencephalon to the limbic cortex. The thalamus mediates the transfer
of information from the periphery to specific projection and association areas of the
cerebral cortex and to the important centres of the cerebellum. The thalamus also has
another important function: it enables mutual interaction of higher parts of the CNS
(Beaumont, 2008).
d) Basal ganglia
The basal ganglia are composed of the caudate nucleus, the globus pallidus, and
the putamen; they are related to a wide range of systems in the cerebral cortex
responsible for different behaviours. They operate simultaneously with other output
systems of the cerebral cortex. These other corticofugal systems have a leading role in
generating specific behaviour. The function of the basal ganglia is associated with the
extrapyramidal motor system. Increased activity of the basal ganglia has been observed
before the beginning of movement, as well as during constant slow and focused
movements. In contrast, increased activity was not observed during fast or jerky
movements (Steiner, & Tseng, 2010).
e) Primary motor cortex
The primary motor cortex is composed of six layers of neurons; it is a crucial
structure for the control of fine and precise voluntary movements. The primary motor
cortex is located in both frontal lobes anterior to the Rolandic sulcus in the gyrus
praecentralis. Cells in this area are directly contralaterally connected with spinal motor
neurons through a single-neuron pyramidal tract: the tractus corticospinalis. Damage to
the pyramidal tract leads to a reduction in the functionality of acral muscles, i.e.,
muscles at rear parts of the body, in this case particularly the function of hand muscles.
Destruction of the primary motor cortex in one of the frontal lobes leads contralaterally
to a chronic loss of fine motor activity of the hand, fingers, and face. It also leads to a
reduction in limb movement speed and the power capabilities of limbs (Beaumont,
2008). The primary motor cortex also plays a key role in the early stages of the

32
acquisition of many motor skills (Brashers-Krug, T., Shadmehr, R. & Bizzi, 1996; Lu,
& Ashe, 2005; Pascual-Leone, Grafman, & Hallett, 1994), and under certain conditions,
it can facilitate the process of learning specific motor tasks through the modulation of
its activity (Antal, Nitsche, Kincses, Kruse, Hoffmann, & Paulus, 2004).
f) Premotor cortex
The premotor cortex (supramotoric area, suplementar motor area) (Amber, 2008) is
located in the rear parts of the frontal gyri anterior to the primary motor cortex (Bear,
Connors, & Paradiso, 2007). Cells in this area contribute to motor control by creating
links in several subcortical centres, particularly in the basal ganglia. Premotor cortex
lesions mainly cause an inability to integrate individual limb movements and gross
motor activity into a smooth movement pattern (Beaumont, 2008).

33
3. GENETIC MODELS OF RIGHT AND LEFT SIDEDNESS
Each of us comes into the world with a certain genetic makeup that creates the
originality of our personality. We are born with character traits, physical proportions,
and predispositions to diseases. Therefore, it is no surprise that human laterality has also
a genetic basis. Since approximately 90% of individuals in society prefer their right
hand for motor activity, with only 10% preferring their left hand, researchers have been
trying, for more than 40 years, to discover whether and how this strong right-hand
preference could be genetically determined, and what factors influence the formation of
left-hand preference. However, at the present time the exact genetic determination of
this phenomenon has not yet been specified. This chapter will deal with three proposed
genetic models determining handedness that are based on different principles. These are
supplemented by additional hypotheses about the possible genetic determination of
laterality.
3.1 Different Gene Expression in Right and Left Hemispehere as
Based of Neural Hemispheric AsymmetryDuring the development of the central nervous system, the telencephalon
displays a three-dimensional structure consisting of an anterior-posterior part, a
dorsoventral part, and a left-right part (Grove, & Fukuchi-Shimogori, 2003; O’Leary,
Chou, & Sahara, 2007). Brain development and formation is probably initiated by
molecules secreted from these parts, known as pattern centres. With respect to the early
stages of the development and formation of the brain, three pattern centres have been
identified:
– Ventral characteristics are regulated by the sonic hedgehog (Shh) from the
mesendoderm under the telencephalon (Machold et al., 2003). The sonic
hedgehog is a protein that plays a key role in vertebrate organogenesis; for
example, it controls the growth of phalanges, and it is involved in the structural
organization of the brain (Wilson, & Maden, 2005).
– Anterior characteristics are controlled by the fibroblast growth factor 8 (Fgt8),
which occurs in the middle of the anterior telencephalon (Garel, Hoffman, &
Rubenstein, 2003). Fibroblast growth factors are heparin proteins that play a key

34
role in the processes of proliferation and differentiation of various cells and
tissues (Coumoul, & Deng, 2003).
– Bone morphogenetic proteins (BMP) and signalling proteins (Wnts) that occur
in the middle of the dorsal cortex regulate the formation of dorsal characteristics,
and play a key role in the process of embryogenesis and cell division (Golden,
Bacilovi, McFadden, Beesley, Rubenstein, & Grinspan 1999; Zhao, Avilés,
Abel, Almli, McQuillen, & Pleasure, 2005).
Since it was discovered that the signalling pathways of Shh, Fgt8, and other
molecules, together with their downstream genes (transcription suppressing genes), play
a crucial role in determining left-right asymmetry of the body, including the orientation
of internal organs (Hamada, Meno, Watanabe, & Saijoh, 2002; Wright, 2001), research
has been carried out in order to determine whether genes that are involved in shaping
the asymmetry of internal organs also differ in their expression in the right and left
hemisphere, i.e., whether the different expression of genes is involved in the formation
of hemispheric asymmetry. Current research into 12-week human foetuses has
identified 27 genes that showed different expressions in both the left hemisphere and in
the right hemisphere (Sun, & Walsh, 2006). The function of these genes with different
expressions in the right and left hemisphere was related to the regulation of cell signal
communication and gene control or protein expression (Sun, Collura, Rubilo, & Walsh,
2006). The conclusions of this research suggest that different gene expressions may play
an important role in the neurogenesis and formation of neural connections, through the
regulation of cell signalling and gene expression in the early development of the brain.
On the basis of this assumption, they probably also lead to the formation of hemispheric
asymmetry (Hugdahl, & Westernhausen, 2010).
The formation of a tubular structure called the neural tube is the decisive
moment in the early development of the central nervous system. The cortex is located in
the anterior part of the neural tube (Tanabe, & Jessell, 1996). The study by Dodd et al.
(1998) suggested that the middle structures in the anterior part of the neural tube, i.e.,
the future cerebral cortex, called the notochord and floor plate, may be potential
molecular candidates forming neural asymmetry (Dodd, Jessell, & Placzek, 1998). This
hypothesis was expanded with further research carried out by Tannahill et al. (2005)
suggesting that the notochord secretes molecules such as Shh between the left and right
telencephalon unevenly, leading to the formation of hemispheric asymmetry (Tannahill,

35
Harris, & Keynes, 2005). In addition, a certain part of the neural tube is also a source of
morphogens such as BMP and Wnts (Chiznikov, & Millen, 2005), and the fibroblast
growth factor 8 (Fgt8) also occurs temporarily in the most anterior cortical area
(Fukuchi-Shimogori, & Grove, 2001). Based on this information, despite an
unconfirmed relationship between the development of hemispheric asymmetry and
right-left orientation of internal organs or hand preference (Kennedy, O`Craven, Ticho,
Goldstein, Makris, & Henson, 1999; McManus, Martin, Stubbings, Chung, &
Mitchison, 2004; McManus, 2005), it is assumed that the joint secretion of BMP, Wnts,
and Fgt8 molecules is in a way involved in the formation of the left and right
telencephalon asymmetry in the early stage (Hugdahl, & Westernhausen, 2010). Other
subsequent studies that have focused on the verification of different gene transcripts in
specific brain regions have identified 44 genes with enriched expressions in the frontal
cortex and in the superior temporal area of human foetuses’ brains (Abrahams, Tentler,
Perederiy, Oldham, Coppola, & Geschwind, 2007).
The following reported genetic models have been designed mainly on the basis
of the results of diagnostics of motor manifestations of laterality through questionnaire
surveys or simple motor tests. The psychometric characteristics of questionnaires, as
screening tools determining the level of preference, are further discussed in section
6.1.2.
3.2 Genetic Model of Handedness Marion Annett, Right Shift TheoryThe single gene model is based on the assumption that there is a gene (genetic
factor) that can determine the inheritance of right-handedness, but not the inheritance of
left-handedness (Annett, 1972). In her study from 1972, Annett assumes that normal
distribution of differences between parts is an essential characteristic of laterality,
although she also suggests that there is a right-shift (RS) factor that shifts this
distribution to the right. According to Annett, the side preference itself is influenced by
two main factors:
– an unpredicted and congenital, but not genetic factor,
– a possible genetic RS factor.

36
The genetic information for the formation of the left and right side could be the
same, but the RS genetic factor affects the transfer of genetic information to muscles,
nerves, blood supply, and other characteristics important for organ function (Annett,
2006). An important shift in this model is represented by the assumption that people’s
hand preference (handedness) is considered to be a result depending on the aspect of
probability. If a person lacks the RS+ factor, the probability of left-hand preference is
equal to the probability of right-hand preference (PL = PR = 0.50) (Van Strien, 2000).
In other studies, Annett modified her model with the aspect of the relationship between
hand preference and speech representation, whose centre is usually located in the left
hemisphere, concluding that in humans the RS+ allele determines the left hemisphere as
dominant – and more favourable. If the RS+ allele is not present, the formation of
cerebral dominance and hand preference is accidental (Annett, 1995). In the following
research, the model was refined with the information that in the homozygous genotype
RS++ the right shift (RS) tendency is expressed more strongly, about two standard
deviations to the right, compared to the heterozygous genotype RS+-, whose rightward
tendency is expressed by one standard deviation. In individuals displaying recessive
homozygous allele RS--, the distribution of data, capturing left or right upper limb
preference, shows the shape of a normal Gaussian distribution curve without deviation
to any side, and handedness is accidental. According to Annett, lateralization of speech
and hand preference is independent in this case (Annett, 2000). Interestingly, Annett
points to the assumption that the presence of the RS gene does not determine hand
preference directly, it only increases the probability of better motor skills of the upper
right limb (Annett, 2006).
Fig. 3 Distribution of handedness based on performance between right and left
hand, RS model with alells RS--, RS+- a RS++ (Annett, 1998, p. 463)

37
The important information in this model is that, according to Annett, the
occurrence of the RS+ gene is only typical for humans, and the whole model is to some
extent influenced by the social aspect of the right-hand oriented society and other
environmental influences that can change hand preference in humans (e.g., birth stress).
Subsequent studies dealing with the relationship of the single gene model and
inheritance of hand preference in humans supported the idea that there is a gene for
speech lateralization in the left hemisphere that affects handedness distribution to the
right (Annett, 2003). Support for this model has also come from research into the
heritability of the size of cerebral lobes in twins. The conclusions of this research
showed that genetic factors in right-handed twins affect the size of the right and left
cerebral hemisphere twice as significantly as in twins with at least one left-handed
representative. In contrast, these pairs displayed significant attenuation in the genetic
control of the size of cerebral hemispheres (Geschwind, Miller, DeCarli, & Carmelli,
2002).
Annett concludes her current research with a very interesting question. What is
the primary cause of the right side (RS) tendency in human handedness, and what is the
advantage of the left hemisphere? (Annett, 2006). Her model also views handedness as
a continuous variable, i.e., hand laterality may show some degrees of distinction
projected to the different level of performance of the left and right hand, from extreme
left-handedness to extreme right-handedness (Annett, 2002).
3.3 Genetic Model of Handedness Chris McManus, D and C allelesChris McManus, the author of another genetic model, shares Marion Annett’s
opinion that both hand preference and cerebral dominance are influenced by one gene.
Therefore, his approach can also be described as a single gene model. According to
McManus, handedness is determined by the autosomal centre, which contains two
alleles: D (dextral) and C (chance). If individuals’ genotype contains the homozygous
dominant allele DD, it means that the individuals should all be right-handed. The
presence of the heterozygote DC reduces the probability of right-handedness to 75%
(McManus a), 1985). In the case of homozygous recessive allele CC, the individuals’
lateralization is affected by the mechanism of randomness, called fluctuating
asymmetry; therefore, the predicted probability of right-handedness or left-handedness

38
equals 50%. In his studies, McManus also applies this model to speech dominance. The
main assumption in this model is that the D allele implies the determination of right-
hand preference and the location of the speech centre in the left hemisphere, while the C
allele implies a chance factor for both hand preference and speech dominance; both of
these variables are mutually independent (McManus, & Bryden, 1992). There is an
important difference between the interpretation of Annett’s and McManus’s single gene
model hypothesis: McManus considers handedness to be a discrete variable with
dichotomic division, clearly separating boundaries of preference, as a centre located in
one of the hemispheres, and quality of performance between upper limbs in a motor
activity (McManus, 1984; McManus, 1985).
Fig.4 Laterality score, bimodal distribution of hand preference in population
(McManus, 1984, p. 128)
In the study “On the Genetics and Measurement of Human Handedness”, the
authors, including McManus, argue that, despite the proposed single gene model, the
issue of handedness heritability has a multifactorial nature with many laterality profiles,
though a strong relationship among them has not yet been found (Bryden, Roy,
McManus, & Bulman-Fleming, 1997).
3.4 Other Genetic Models of HandednessSingle gene models are not the only genetic models that have been created in the last 40
years.
a) In their study, Levy and Nagylak (1972) suggested that cerebral dominance and hand
preference are determined by two diallelic loci. One genetic locus determines the

39
dominant speech hemisphere, (L) or (l). The second genetic locus determines whether
the preferred hand is the ipsilateral hand or the contralateral hand, (c) or (C), in relation
to the dominant hemisphere. The dominant alleles (L) and (C) should represent a speech
centre in the left hemisphere and hand preference for motor activity controlled
contralaterally. Recessive alleles (l) and (c) should then show the dominance of the right
hemisphere and ipsilaterally controlled motor activity of the hand. According to this
model, left-handers should possess either the dominant (L) and recessive (c) allele or
the recessive (l) and dominant (C) allele. Right-handers should possess either both
alleles in the dominant form (LC) or both alleles in the recessive form (lc) (Levy, &
Nagylak, 1972). With respect to this model, however, a sufficient model fit was not
confirmed by later studies; therefore, the model is no longer used due to a number of
discrepancies in estimates of heritability of cerebral dominance and hand preference in
the data of monozygotic and dizygotic twins (Van Strien, 2000).
b) The polygenetic model of Gangestad and Yeo (1994) is another genetic model of
handedness. This model was created on the basis of studies carried out by Van Valen
(1978) and Markow (1992) dealing with handedness control in relation to fluctuating
asymmetry (Van Valen, 1978; Markow, 1992), as well as a study carried out by
McManus and Bryden (1992). This study found that the probability of left-handed
parents having a left-handed child is only 26.5%; the probability of right-handed parents
having a left-handed child is 9.5% (McManus, & Bryden, 1992). Therefore, the results
of these studies contradict classic Mendelian laws of inheritance.
According to Gangestadt and Yeo, the development design of handedness is generally
based on slight right-handedness: this design may be affected by genetic factors of
developmental instability that affect the stability of the expected slight tendency to
right-handedness. Developmental instability may be caused by minor physical
anomalies (MPA) and fluctuating asymmetry (FA). They may cause a change from the
expected slight right-handedness to left-handedness or extreme right-handedness
(Gangestadt, & Yeo, 1994). Minor physical anomalies are characteristics associated
with a number of neurodevelopmental disorders, including schizophrenia (Gualtieri,
Adams, Shen, & Loiselle, 1982; Woods, 1998), autism (Campbell, Keller, Small, Petti,
& Ferrit, 1978; Zoghbi, 2003), and hyperactivity (Barkley, 1997; Rapoport, & Quinn,
1975). Fluctuating asymmetries are deviations in the size of physical characteristics
(foot width, ear width) on the right and left side of the body (Markow, & Wandler,

40
1986; Van Valen, 1962). The authors support their assumptions with the results of
studies. The first of them showed a significant correlation between the composite score
of developmental instability, consisting of the MPA and FA variables, and the lateral
preference score of the upper limb in the questionnaire survey. In the second study, the
composite score of developmental instability, consisting of the MPA and FA variables,
significantly correlated with the results of a peg-moving task (Annett, 1985), which
assesses the skill level of the hand. The results of these studies suggest that both left-
handed and extremely right-handed individuals showed higher occurrence of
developmental instabilities, and these individuals were more often children of left-
handed parents. This model assumes that stabilizing factors have a polygenetic basis
and that both left-handed and extremely right-handed individuals have a similar
genotype (what is hereditary here is the level of deviation from modal handedness,
rather than handedness tendency) (Markow, & Wandler, 1986).
c) A slightly different approach in the genetic determination of right-sidedness and left-
sidedness is seen in the form of a hypothesis called the “gene-cultural model”, presented
by Laland, Kumm, Van Horn, and Feldman (1995), who argue that both left-handers
and right-handers have the same genotype, and that there is no genetic variability
conditioning (determining) handedness variability. Handedness variability arises in the
early development of the individual, and it may be affected by various causes, which
randomly provide the individual with a better skill or greater strength of one side. The
crucial role in determining handedness is played by natural selection, which, say the
authors, determines the probability of right-handedness at 0.78. Cultural factors are
considered to be essential in this model hypothesis, with the most important being
parents’ handedness. If both parents are right-handed, the probability of a right-handed
child reaches 0.92 (0.78 + 0.14); if both parents are left-handed, the probability of a
right-handed child drops to 0.64 (0.78 – 0.14). If parents differ in their handedness, their
child’s handedness is not affected by this parental factor, and the probability of the
child’s right-handedness reaches 0.78 (Laland, Kumm, Van Horn, & Feldman, 1995).
What is also fundamental in this theory is the fact that, according to the authors, the
children’s handedness is influenced by the overt motor activity of the parents. This
aspect, however, contradicts the results of a previous study. It monitored the handedness
of children in foster care and examined whether left-handed foster families display a

41
higher frequency of left-handed children, although it did not confirm this relationship
(Carter-Saltzman, 1980).
d) Other hypotheses about genes influencing hand preference
In recent years, there have also been attempts to identify the candidate single gene that
is responsible for the expression of hand preference. Crow’s study (2002) suggested that
this gene is located on chromosomes X and Y in the homology region Xq21.3/Yp11.2,
and that the most likely candidate is the protocadherin XY (Crow, 2002). However,
subsequent extensive screening of the genome did not find any strong support for this
hypothesis. The region 2p11.2-12 on chromosome 2 was identified as another possible
region of the candidate gene’s occurrence (Francks et al., 2002). However, this
suggestion was also refuted by later research (Francks et al., 2003). One of the last
hypotheses about the candidate gene determining handedness appeared in a study
dealing with dyslexic siblings. In this research, the leucine-rich repeat transmembral
neuronal 1 (LRRTM1) gene on chromosome 2p12, which is suppressed in the mother
and is, according to the authors, associated with male gender, handedness, and
schizophrenia, was chosen for the single gene (Francks et al., 2007). It was also found
that LRRTM1 occurs only in chimpanzees and humans. However, this theory was not
supported by the study of twins, and the research itself was heavily criticized due to
methodological shortcomings (Crow, Close, Dagnall, & Priddle, 2009). In addition,
other authors have argued that it is very unlikely that handedness and cerebral
asymmetry were only determined by this gene. Therefore, LRRTM1 is currently viewed
rather as a gene associated with dyslexia and schizophrenia, affecting human laterality
only indirectly (Hughdal, & Westernhausen, 2010).

42
4. ENVIROMENTAL FACTORS AS POSSIBLE CAUSE IN
CHANGE OF LATERALITY AT HUMAN
In parallel with genetic models that present hypotheses on the genetic
determination of right-sidedness or left-sidedness in relation to handedness,
assumptions have been postulated and hypotheses proposed concerning environmental
factors affecting human laterality, especially left-sidedness. These hypotheses began to
be of interest mainly because the heritability of laterality was not clearly demonstrated.
In addition, as implied by chapter 3. in determining the probability of a right-handed or
left-handed individual being born, classic Mendelian laws of inheritance were violated.
Most hypotheses dealing with environmental factors affecting human laterality are
based on the foundations of certain deviations which are considered pathological.
4.1 Birth StressOne of the best known theories falling into the category of pathologically
affected sidedness deals with problems related to birth stress and complications during
the prenatal period of the foetus. Based on the results of the research, Bakan et al.
(1973) suggested that left-handedness may be caused by cerebral anoxia, which can
result from birth stress factor. According to the authors, anoxia may cause malfunction
or even destruction of the motor area in the left hemisphere, which in order to preserve
the function subsequently leads to a change in laterality in preference of motor activity
of the hand – handedness. This research discovered that left-handers showed a double
score in the medical history concerning conditions of birth stress (Bakan, Dibb, & Reed,
1973; Coren, 1992). The hypothesis concerning the influence of the environmental
factor of birth stress on human sidedness was further supported by research which, in
addition to the anoxia variable, included premature birth, low birth weight, and severe
infections, including neonatal jaundice, among other aspects of the possible influence
on laterality (Coren, 1995; Van Strien, Bouma, & Bakker, 1987). With respect to these
results, Geschwind and Galaburda suggest that birth complications are the effect of the
same factors that affect the brain development of the human foetus rather than the cause
of left-handedness (Geschwind, & Galaburda, 1987). On the other hand, it should be
noted that in the course of time the results differed considerably from the initial

43
hypothesis, especially due to the research samples they were based on. For example, the
results of the study by Leviton and Kilti (1976) and Badian (1983) only supported this
hypothesis in the population of boys (Badian, 1983; Leviton, & Kilt, 1976). In contract,
Annett and Ockwell (1980) and McKeever et al. (1995) confirmed the correlation of
birth stress and left-handedness only in girls (Annett, & Ockwell, 1980; McKeever,
Suter, & Rich, 1995). Research results presented by Baily and McKeever (2004) even
point out that, out of the 25 selected birth stressors, only the mother’s age stressor
(variable) had a significant relationship to the left-handedness of the individuals born
(Bailey, & McKeever, 2004).
4.2 Higher Level of Hormone Testosteron in UterusAnother hypothesis dealing with the influence on laterality was presented by
Geschwind and Galaburda (1987), who suggested that laterality related to the motor
activity of the hand (handedness) can be changed depending on the level of testosterone
in the womb (Geschwid, & Galaburda, 1987). According to Geschwind, functional
asymmetry has its origin in the anatomical asymmetry of the cerebral cortex. The
planum temporale asymmetry is one of the major anatomical asymmetries related to the
specialization of speech: the planum temporale was found to be larger in the left
hemisphere in more than 65% of the population (Geschwind, & Levitsky, 1968). Since
the right hemisphere develops earlier, Geschwind and Galaburda suggest that it can be
much easier for intrauterine factors to affect the left hemisphere, which is vulnerable for
a longer period. This theory is based on research which found that higher or lower
levels of testosterone in the womb can either speed up or slow down the embryological
migration of neurons from the neural crest to the cerebral cortex. An increased level of
testosterone found in male foetuses is the cause of reduced migration, especially in the
left hemisphere, and therefore a reduced level of hemispheric specialization was
observed (Geschwind, & Behan, 1982; Johnson, 2005). Based on this hypothesis,
individuals with significantly smaller differences in brain asymmetry show the same
probability of being right-handed or left-handed, and thus fall into to a group called
anomalous dominance. This group also includes individuals with less clear-cut left-
hemispheric dominance for speech.

44
Increasing levels of testosterone in the womb can also affect the development
and function of the thymus, which may subsequently lead to a higher incidence of
immune disorders. As early as 1982, Geschwind and Behan created a model which
related the variables of handedness and autoimmune disorders (Geschwind, & Behan,
1982). A meta-analytical study by Bryden, McManus, and Bulman-Fleming (1994),
using a sample of over 56,000 correlating handedness and immune disorders, found that
left-handers exhibit only negligibly higher frequency (1,003) of these disorders than the
control group of right-handers (Bryden, McManus, & Bulman-Fleming, 1994). Another
debated area of this hypothesis is the fact that any manifestation of non-right-
handedness is automatically viewed as a manifestation of abnormal dominance,
regardless of whether the individual is, for example, a natural left-hander. According to
the model created, any person who is not right-handed is automatically classified as
exhibiting abnormal dominance (Previc, 1994). Moreover, it has been shown in recent
years that it is the right hemisphere that is more sensitive to the effect of intrauterine
factors (Lutchmaya, Baron-Cohen, & Raggatt, 2002; Van Strien, 2000). Some authors
consider the position of the foetus in utero with limited space and possibilities of
moving the head and hand on one side as another environmental factor affecting
laterality and thus the hemispheric specialization of an individual. This limitation is
based on the shape of the uterus (Johnson, 2005; Previc, 1991). As a result, a hypothesis
was presented, based on the finding that newborns exhibit a strong tendency to tilt –
lean – the head to one side (Turkewitz, & Kenny, 1982). Several studies confirmed that
if a newborn lies on its back, its head is generally tilted to the right, and only rarely to
the left. As a result of the head tilt to one side in the course of an infant’s passive lying,
one hand is often placed in the individual’s visual field. According to the findings, this
spontaneously observed limb becomes preferred (Hopkins, Lems, Janssen, &
Butterworth, 1987). However, the study also found that this development was only
confirmed in infants not older than two months.
The previous two chapters clearly show that both laterality and its motor
manifestations form a very complex multi-factor field in humans which is, in addition to
the genetic basis of an individual, also affected by environmental factors; these can
most probably affect genetic information.

45
5. TYPES OF LATERALITY
The following chapter and subchapters analyze the multifactoriality of laterality
also in terms of motion control. We will also focus on the two basic types of laterality,
which are closely related, as well as various kinds of functional manifestations of
laterality.
Laterality can be either morphological or functional. Morphological laterality
assesses disproportions of parts of the body and organs (Mohr, Thut, Landis, &
Brugger, 2003). Functional laterality is understood as asymmetry of locomotive (hands,
legs) or sensory (an eye, ear) paired organs (Hatta, Ito, Matsyuama, & Hasegawa, 2005)
that is demonstrated by preferred use of one the paired organs.
5.1 Functional Motor Laterality ManifestationFunctional laterality is a sign of brain activity that is reflected both in the motor
activity of motor organs and direction and the coding of (the impulse of) the signal
through sensory organs, both paired and unpaired (tongue). Control of motor activity is
projected onto paired motor organs differently, which is expressed by different levels of
motor manifestations of the left or right motor organ (legs, hands). The direction and
coding of the signal, which, in the form of an impulse, is processed by a sensory organ,
is usually based on a different function of this paired organ: different processing of
auditory information by the right and left ear; different processing of visual information
by the right and left eye.
Therefore, functional laterality means functional asymmetry of paired motor
organs (hands, legs) or paired sensory organs (eyes, ears) (Hatta, Ito, Matsyuama, &
Hasegawa, 2005). This is manifested in the preferred use (preference) of one of the
paired organs, which usually also operates faster or better. Functional lateralization is
thus a reflection of the dominance of one cerebral hemisphere (Annett, 1985; Bryden,
2000; Mohr, Thut, Landis, & Brugger, 2003).
5.1.1 Preference
Preference is defined as the preferred use of one of the motor or sensory organs
whose control centre is located in the right or left hemisphere of the telencephalon.
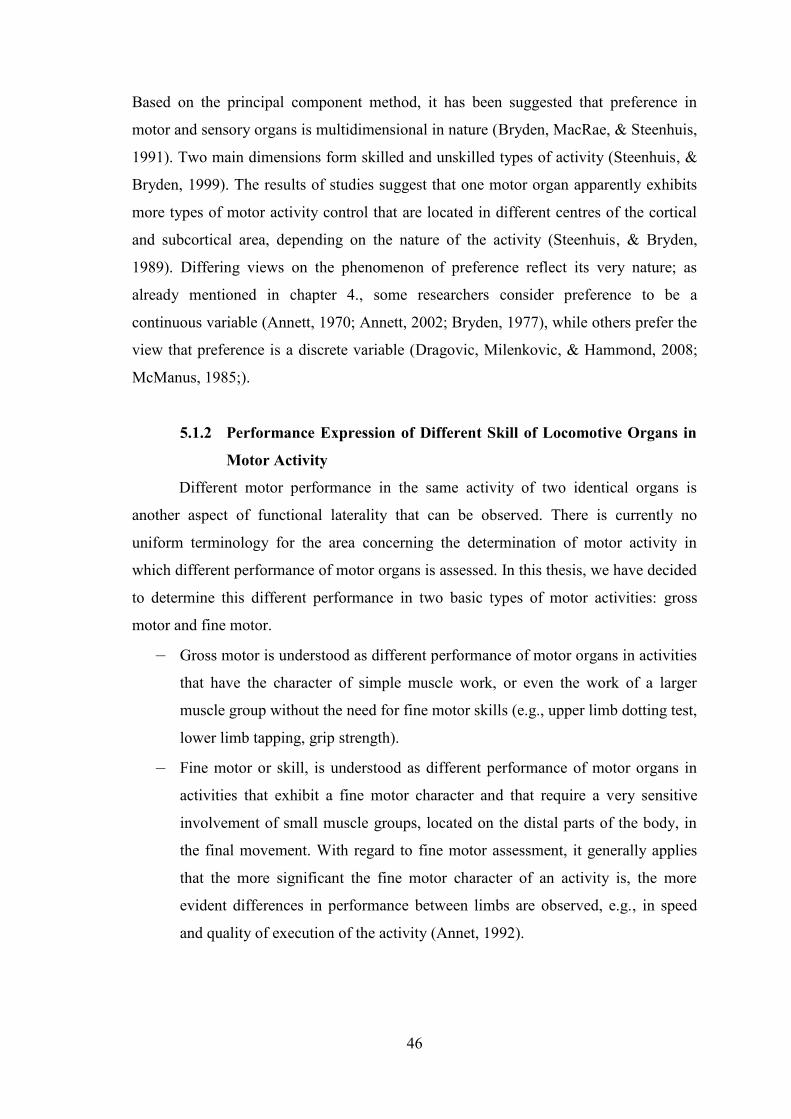
46
Based on the principal component method, it has been suggested that preference in
motor and sensory organs is multidimensional in nature (Bryden, MacRae, & Steenhuis,
1991). Two main dimensions form skilled and unskilled types of activity (Steenhuis, &
Bryden, 1999). The results of studies suggest that one motor organ apparently exhibits
more types of motor activity control that are located in different centres of the cortical
and subcortical area, depending on the nature of the activity (Steenhuis, & Bryden,
1989). Differing views on the phenomenon of preference reflect its very nature; as
already mentioned in chapter 4., some researchers consider preference to be a
continuous variable (Annett, 1970; Annett, 2002; Bryden, 1977), while others prefer the
view that preference is a discrete variable (Dragovic, Milenkovic, & Hammond, 2008;
McManus, 1985;).
5.1.2 Performance Expression of Different Skill of Locomotive Organs in
Motor Activity
Different motor performance in the same activity of two identical organs is
another aspect of functional laterality that can be observed. There is currently no
uniform terminology for the area concerning the determination of motor activity in
which different performance of motor organs is assessed. In this thesis, we have decided
to determine this different performance in two basic types of motor activities: gross
motor and fine motor.
– Gross motor is understood as different performance of motor organs in activities
that have the character of simple muscle work, or even the work of a larger
muscle group without the need for fine motor skills (e.g., upper limb dotting test,
lower limb tapping, grip strength).
– Fine motor or skill, is understood as different performance of motor organs in
activities that exhibit a fine motor character and that require a very sensitive
involvement of small muscle groups, located on the distal parts of the body, in
the final movement. With regard to fine motor assessment, it generally applies
that the more significant the fine motor character of an activity is, the more
evident differences in performance between limbs are observed, e.g., in speed
and quality of execution of the activity (Annet, 1992).

47
In connection with research dealing with distinguishing characteristics of individual
indicators for determining the level of performance, it has been stated that the attribute
of performance, like preference, has a multidimensional nature (Brown, Roy, Rohr,
Snider, & Bryden, 2004; Corey, Hurley, & Foundas, 2001; Steenhuis, 1996).
5.1.3 Are Preference and Performance Communicating Vessels or
Different Attributes?
Some authors consider the level of performance to be a result of the power of
preference (Annett, 2002; Bryden, 1977); therefore, they tend to believe that motor
manifestations of laterality represent a continuum.
However, other authors’ studies have not confirmed a strong relationship
between the attribute of preference and the attribute of performance (Peters, 1998).
Other studies dealing with this issue have focused on determining the difference
in preference and the level of performance in autistic and normally developing children.
In comparison with normally developing children, autistic children showed the same
level of preference in the use of upper limbs, but significantly lower levels of
performance (Hauck, & Deset, 2001; McManus, 2002). These authors consider
preference and performance to be different attributes of the motor manifestations of
laterality; preference is obviously projected onto the performing organs based on the
location of the motor centre in the brain, but performance probably depend on the
quality of brain connections.
5.1.4 Dominance
In connection with motor manifestations of laterality, the concepts of preference
and performance are associated with the concept of dominance. The word “dominance”
means “leadership” or “superiority” (Holubová et al., 2005). With respect to motor
organs, the concept of dominance is only used for activities that have the character of
bimanual actions, i.e., one organ has a leading function, and a second organ has an
auxiliary function. In contrast, dominance in paired sensory organs is clearly determined
by different functions. For example, ears have different functions in processing auditory
information. One of the ears is dominant in processing speech stimuli, and the other is
dominant in processing non-speech stimuli. Similar characteristics are displayed by
eyes. Therefore, the concept of dominance is used in cases where paired organs have
different determined functions in performing an activity or processing a stimulus, or
48
they represent leading organs in the given activity. This is also related to the concept of
“cerebral hemisphere dominance”. Currently, the hemisphere that contains the centre of
speech is considered to be the dominant (leading, superior) cerebral hemisphere. In 95%
of the population, the centre of speech is located in the left hemisphere, and, therefore,
the left hemisphere is considered to be the dominant hemisphere in the majority of the
population (Knecht et al., 2000).
5.1.5 Laterality of Locomotive and Senzoric Organs
a) Handedness
Human handedness is the most transparent functional asymmetry. It is based on
high demands on the manipulative function of the upper limb, which is also structurally
adapted to this activity (spherical joint in the shoulder, opposition position of the thumb,
rich innervation of fingers, etc.). The issue of handedness is often associated with the
term “manual dexterity”, which includes both the ability to handle objects and the fact
that most people have one preferred upper limb to handle objects (Hughdal, &
Westernhausen, 2010). For approximately 90% of people, the right upper limb is the
preferred one; for 10% of people, the left upper limb is the preferred one (McManus,
1985). In connection with this proportion of handedness in society, the term “right-
handed world” is used.
According to Hugdahl and Westernhausen (2010), this preference is easily
recognizable in everyday activities, especially in unimanual activities where only one
upper limb is involved. This preference can also be observed in bimanual activities
where the dominant upper limb plays the leading role, and the non-dominant upper limb
plays the auxiliary role (Hugdahl, & Westernhausen, 2010). Given the diversity of
movements and types of activities that can be performed by upper limbs, research has
focused on the question of whether handedness in both preference and performance is a
unidimensional variable or a multidimensional variable. Steenhuis and Bryden (1989)
have characterized the area of preference as multidimensional, with two main factors:
– skilled, including manifest variables that are culturally influenced (writing),
– unskilled, including spontaneous activities (picking items up, stroking a dog or
cat) (Steenhuis, & Bryden, 1989).

49
Other research has also pointed to the multidimensionality of the actual activity
of upper limbs, i.e., whether it is unimanual or bimanual activity (Büsch, Hagemann, &
Bender, 2010). The research carried out by Beukelaar and Kroonenberg (1983), who
performed an exploratory factor analysis of the results of an extensive questionnaire
survey identifying handedness, suggests that there may even be four factors in upper
limb preference. The first factor represents the activities performed by the hand and
wrist; the second factor involves the shoulder joint activity (throwing); the third factor
only relates to activities performed by fingers; and the fourth factor represents bimanual
activities (holding a broom) (Beukelaar, & Kroonenberg, 1983). With regard to upper
limb performance, the hypothesis that performance is a multidimensional trait with
independent factors (Fleishman, 1964) has long been accepted. In 1970, Barnsley and
Rabovitch, using the exploratory factor analysis, found that hand performance
comprises nine factors: reaction time, dexterity, stabilized hand preference, wrist and
finger speed, targeting, hand stability, arm movement stability, finger tapping, and grip
strength. Five of these factors (targeting, finger dexterity, tapping, hand stability, and
grip strength) were found to be valid factors in determining handedness (Annett, 1976;
Barnsley, & Rabovitch, 1970). An explorative approach was used by the researchers to
determine the dimensionality of upper limb performance. Based on the results, a
multidimensional structure was also proposed, consisting of the factor of proximal
movements, which involve the whole upper limb including the shoulder joint, and the
factor of distal movements, which mainly involve end parts of the upper limb, from the
wrist to the fingers. These studies supported the hypothesis that the control of the upper
limb motor activity can be performed by different areas of the brain (Healy et al., 1986;
Rigal, 1992; Steenhuis, & Bryden, 1989)
b) Footedness
The main function of the human lower limb is locomotion, i.e., a change in path
with respect to time using force (Alexander, 2003). Humans mostly perform locomotion
by motor activity in the form of bipedal walking. However, the lower limb also fulfils
the manipulative function, so, just as in handedness, most people exhibit dominance of
one of the lower limbs for a specific activity. Footedness thus represents another
manifestation of functional laterality. Functionally, however, the lower limb is not
adapted for such a wide range of movements as the upper limb. In addition, many
activities display bilateral co-operation of the lower limbs; therefore, the manifestation

50
of functional laterality in the lower limbs is not as distinct as in handedness. For a long
time, it was not entirely clear which of the lower limbs should be considered dominant,
whether the one used for springing, swinging, handling, or performing the postural
function. It is currently accepted that one of the lower limbs fulfils the mobilization
(manipulative) function, which is the lower limb that manipulates objects or that
actively leads movement. This lower limb is considered dominant. The second lower
limb fulfils the stabilizing, supporting, or postural function (Peters, 1988). Previc and
Saucedo (1992) suggest in their study that footedness is apparently also closely related
to human “turning behaviour” (Previc, & Saucedo, 1992). It is also very interesting that
some authors consider footedness to be a more sensitive indicator of hemispheric
specialization (which also includes specific cognition and motor proficiency) than
handedness (Elias, Bryden, & Bulman-Fleming, 1998; Elias & Bryden, 1998; Iteya, &
Kimura, 2004; MacNeilage, 1991; Peters, 1990).
c) Eyedness
Despite the amount of literature dealing with the issue of ocular dominance, this
part of functional laterality remains less clear. The main function of eyes is to receive
visual cues (stimuli) from the environment (Dylevský, Druga, & Mrázková, 2000),
which is made possible by three basic abilities of the eye: detail recognition, spatial
orientation, and object tracking using tools. Either eye projects the stimulus from a
different half of the visual field. With regard to the functional laterality of eyes, it is
very important that the brain is not lateralized for eyes (Mapp, Ono, & Barbeito, 2003);
a hypothesis was even accepted in the past that ocular dominance is not related to
cerebral laterality (Clark, 1957; White, 1969).
The most supported hypothesis views motor eye control as a manifestation of
asymmetry (Annett, 1985; Bourassa, McManus, & Bryden, 1996). Money (1972)
provides evidence from tachistoscopic experiments that found higher perception
accuracy by the dominant eye in situations that require fast control (motor control)
(Money, 1972). Based on research, it was found that ocular dominance comprises three
factors:
– Acuity factor, i.e., one of the eyes exhibits a greater sensitivity to recognize
contrast and depth of acuity (Coren, & Kaplan, 1973).

51
– Binocular rivalry factor, first described in 1593 by John Porta Babtista, i.e., one
of the eyes plays a leading role in spatial orientation (Clark, & Warren, 1938;
Coren & Kaplan, 1973; Porta, 1593).
– Observation (sighting) factor, i.e., preference of one of the eyes in monocular
activities such as sighting down a telescope (Kommerell, Schmitt, Kromeier, &
Bach, 2003).
Since the functions of the eye represent a natural manifestation of brain activity,
and they are not influenced by social pressure as in handedness, some authors have
considered the determination of ocular dominance as crucial in determining the motor
manifestations of laterality (Bishop, 1983; Delacato, 1966; O’Connor, 1965).
However, this does not solve the problem of which of the basic factors of the eye
should be considered the most significant in determining ocular dominance. Many
authors have considered preference of the eye in monocular activity identified in the
observation (sighting) factor as a manifestation of ocular dominance (Coren, & Porac,
1978; Crovitz & Zener, 1962; Hull, 1936); this preference is then related to hand
preference (Howard, & Rogers, 2002; Porac, & Coren, 1976; Walls, 1951). However,
according to other studies, the result of the binocular rivalry factor is decisive in
determining ocular dominance, because, from a functional point of view, this is the
most important role of the eye (Berens, & Zerbe, 1953). With regard to the observation
(sighting) factor, say some authors, the preferred eye does not have a specific functional
role in monocular activities (Mapp, Ono, & Barbeito, 2003). Other studies have
suggested that monocular activity is probably related to the preferential activation of the
systems ensuring attention in the contralateral hemisphere (Roth, Lora, & Heilman,
2002). Given that the functional nature of all three factors is different, several studies
have also confirmed that the observation (sighting) factor does not strongly correlate
with either with the binocular rivalry factor or with the acuity factor (Norman, Norman,
& Bilotta, 2000). Compared to the observation factor, the binocular rivalry factor and
the acuity factor correlated much less with hand preference (Bourassa, McManus, &
Bryden, 1996). These results suggest that ocular dominance is probably related to
factors of eye defects, mostly spherical (Eser, Durrie, Schwendeman, & Stahl, 2008).
However, studies dealing with the relation between hand preference and ocular
dominance (expressed through monocular activity) have found that unstable ocular

52
dominance was displayed, for example, by dyslexic children (Stein, & Fowler, 1982;
Stein, Richardson, & Fowler, 2000) or individuals with Williams-Beuren Syndrome
(Van et al., 2005).
d) Earedness
Earedness is another manifestation of the functional laterality of sensory organs.
The main function of the ear is to receive and process auditory stimuli. There are also
two main capabilities: to receive and process logical symbolism in the form of speech,
and to receive and process the tone and pitch of the sound stimulus. Both functions are
controlled contralaterally. Since cerebral dominance and functional laterality are
associated with the phenomenon of speech, the ear that processes the symbolism of
speech stimuli is considered to be the dominant one. Determining earedness is usually
performed by means of dichotic listening (Cherry, 1953), i.e., a different sound stimulus
is presented to each ear of an individual. When determining ear dominance, it is
assessed which stimulus the individual is able to discern: the stimulus that is presented
to the left ear, or the stimulus that is presented to the right ear (Kimura, 1961). This
method of determining ear dominance was adjusted by Johnson et al. (1977), who chose
speech sounds as sound stimuli, calling the method the Dichotic Fused Words Test
(DFWT) (Johnson, Sommer, & Weidner, 1977). Further modification of the stimuli was
performed by Wexler and Hawles (1983), who used rhyming monosyllabic words
(Wexler, & Hawles, 1983). In determining cerebral dominance and (functional) motor
manifestations of laterality, the aspect of ear dominance is often left out due to its
complexity (Reiss, & Reiss, 1999). For example, various studies have found that
earedness is not related to eyedness (Noonan, & Axelrod, 1981), and that there is no
genetic relationship between earedness and eyedness (Reiss, & Reiss, 1999). At the
same time, some recent studies associate ear dominance with working memory in the
brain (Penner, Schlafli, Opwis, & Hugdahl, 2009).
5.2 Structural Laterality of Locomotive OrgansChapter 2.1 describes some important structural asymmetries of the brain. This
chapter analyzes the issue of shape laterality of motor organs, which is a result of
functional asymmetry. Shape laterality reflects the asymmetry of body segments and

53
organs (Mohr, Thut, Landis, & Brugger, 2003). This asymmetry is viewed both in terms
of dimensions (length or width) and in terms of the tissue size or density of individual
parts of motor organs.
Several recent studies show that a general model has been found that confirms
asymmetry in the bones of both upper and lower limbs. The basic dimensions that
determine limb asymmetry include bone length, diaphyseal width, and joint width of the
upper and lower limbs. Bone length, diaphyseal width, and joint width of the upper and
lower limbs, determined particularly on distal epicondyles, show a consistent right-
sided asymmetry in all dimensions. The conclusions of the studies agree that shape
asymmetries observed in upper limbs are more significant, and they exhibit a regular
tendency to right-sided asymmetry. Therefore, upper limbs display generally more
noticeable asymmetry than lower limbs, and many authors suggest that this result has
probably been caused by the release of upper limbs from motor limitations, their
specialization, and less symmetrical mechanical loads. Lower limbs exhibit less obvious
differences, and they can mainly be found in the knee area (Auerbach, & Ruff, 2006).
Both limbs also show consistent differences in the size of asymmetry for
different structural characteristics. When comparing the measurements of individual
segments, the most significant absolute asymmetry was observed in diaphyseal width,
followed by bone length and bone size. Increased asymmetry in external diaphyseal
width may be caused by the possible expansion in the subperiosteal area of long bones
after the termination of growth in length (and possibly also joint size) (Garn, Rohmann,
Wagner, & Ascoli, 1967; Heaney, Bargerlux, Davies, Ryan, Johnson, & Gong, 1997;
Lazenby, 1990). Therefore, diaphyseal asymmetry may increase in adults due to bone
length and joint asymmetry. When measuring individuals with respect to bone length
and diaphyseal width asymmetries, no significant correlations were found, supporting
their relative independence. Some correlations were found between articular
asymmetries, bone length, and diaphyseal width asymmetries (Ruff, Walker, &
Trinkaus, 1994). This finding also suggests that length and diaphyseal width are
modular in the sense of autonomous development (Hallgrı´msson, Willmore, & Hall,
2002). It is possible that although, in the course of development, limbs are subject to the
same perturbations, some bone dimensions can probably change more sensitively, both
in utero and after birth (Hallgrı´msson, Muyake, Wilmore, & Hall, 2003). As shown
earlier, joints follow a growth pattern that is similar to that seen in bone length. Both
articular size and bone length appear to be less sensitive to mechanical stimuli than the

54
influence of the cross-sectional dialysis dimension, i.e., they are more genetically
regulated during growth (Biewener, & Bertram, 1993; Lanyon, 1980; Ruff, 2003). It is
possible that mechanisms governing joint growth are, in some respects, a mediator
between the length and width of the diaphysis (i.e., they are more genetically regulated
than diaphyseal width, and they also have greater mechanical sensitivity than in length).
This could explain the correlation of joint asymmetry with the above segments. Much
narrower limited ranges of asymmetry in other limb dimensions are probably subject to
higher genetic control. Differences in asymmetry can be observed both between
individuals within a certain geographical area and across multiple geographical areas.
Research has also revealed that the bone asymmetry of upper and lower limbs both
between and within the populations examined is the most significant in diaphyseal
width (Auerbach, & Ruff, 2004). Bone length and joint width do not exhibit such
significant signs of asymmetry. This conclusion was based on the assumption that
diaphyseal width is not dependent on completed bone growth, i.e., bone length and joint
width (Ahlborg, Johnell, Turner, Rannevik, & Karlsson, 2003). However, in addition to
right-sided bone shape asymmetry, left-sided asymmetry was found in the bones of
lower limbs. This is primarily diaphyseal width and length of the thigh bone (femur)
(Plochocki, 2004). Shape asymmetries are more noticeable in upper limbs. There are
also significant differences in the described asymmetry between genders. Men exhibit
considerable differences in the humeral diaphysis, while the length of the radius is more
asymmetrical in women (Parker, Round, Sacco, & Jones, 1990; Round, Jones, Honour,
& Nevill, 1999). Research has also been conducted that found that, despite changes in
the load of upper limbs of current humans and paleolithic humans, changes towards the
right-sided world do not occur (Gentry, & Gabbard, 1995; Porac, & Coren,1981), i.e.,
the percentage of left-handers does not change. An interesting result concerning lower
limb asymmetry was presented by Faulkner et al. (1991). The authors found increased
mineral mass in the non-dominant lower limb in children (Faulkner, Bailey, Drinkwater,
McKay, Arnold, & Wilkinson, 1991). In contrast, tomographic research into upper
limbs found that the distal end of the radius of the dominant upper limb shows increased
bone density and increased mineral mass, which is, according to the authors, the result
of the different load of upper limbs (MacIntyre, Adachi, & Weber, 1999).
It was also found that there is crossed symmetry in bone length and diaphyseal
width of bones between the upper and lower limb – contralaterally (Auerbach, & Ruff,
2004).

55
Shape asymmetry was also found in the hand and fingers. The volumetric
analysis conducted by Purves et al. (1994) showed that the right hand is generally about
3.5% longer than the left hand (Purves, White, & Andrews, 1994). Radiography
revealed asymmetry in the morphology of the hand: the second metacarpus, i.e., on the
index finger, of right-handers showed a significantly longer dimension on the right hand
than on the left (Vehmas, Solovieva, Riihimaki, Luoma, & Leino-Arjas, 2005;). In
addition to differences in the morphology of the hand, research has focused on the
dimensions and asymmetry of fingers. The best known asymmetry is the different
length of the index finger and ring finger in men and women. Men usually exhibit a
significant difference between the length of the index finger and ring finger, and the
ring finger is significantly longer (Plato, Wood, & Norris, 2005). With regard to
women, the difference in length is usually less significant, but the ring finger also tends
to be slightly longer. The difference between the length of the index finger and ring
finger in men and women is attributed to the level of testosterone to which the foetus is
exposed during the prenatal period (Manning, Scutt, Wilson, & Lewis-Jones, 1998).
This difference has also been found in some ethnic groups, e.g., in children from the
Han ethnic group and in Afro-Caribbean children (Manning, Stewart, Bundred, &
Trivers, 2004). Another study by Manning et al. has found differences between
Europeans, Africans, and Chinese (Manning, Churchill, & Peters, 2007). Some studies
have related the length and proportion of the index finger and ring finger to the
increased activity of the right hemisphere. Men who displayed significant differences in
the proportion of the length between the two fingers mentioned also showed better
results in mental rotation tasks concerning two- and three-dimensional objects (Sanders,
Bereczkei, Casatho, & Manning, 2005). Mental rotation is an aspect of imagination, i.e.,
part of the ability of abstraction, which is, as a complex process, one of the main
specializations of the right cerebral hemisphere (Parsons, 2003). A relationship between
the proportions of the index finger, ring finger, and reduced functionality of the left
cerebral hemisphere has also been found. The study by Beech and Beauvois suggests
that the masculine proportion of the index finger and ring finger in right-handers is
related to impaired hearing (Beech, & Beauvois, 2006). The proportion of the length of
the index finger and ring finger was also measured in right-handed and left-handed
individuals. The individuals’ handedness was mostly determined on the basis of
preferences in holding a writing instrument. It was found that right-handers exhibit
stronger asymmetry in the proportion of the length of fingers of the right hand. Left-

56
handers exhibit the opposite asymmetry, and this asymmetry is not as noticeable
(Manning, & Peters, 2009).
Significant shape asymmetries are visible, for example, in athletes. Shape
laterality and its differences have been examined in tennis players in particular. Studies
dealing with repetitive load in tennis players found that repeated load of the preferred
upper limb leads to the formation of anatomical differences between the dominant and
non-dominant upper limb (Colak, Bamac, Ozbek, Budak, & Bamac, 2004). Various
studies have shown that adult tennis players at the top level exhibit more weight in the
forearm, by approximately 12%, and arm, by approximately 6%, of the dominant upper
limb (Noffal, 1999). At the widest point of the forearm circumference, the length was
longer by 6–7% in the dominant upper limb, both in women and in men (Lucki, &
Nicolay, 2007). Average 3% differences in forearm circumference and 5% differences
in arm circumference were observed in adult female tennis and squash players. Shape
asymmetry between the dominant and non-dominant upper limb, which is manifested in
the difference in size, is explained by the increase in bone mass and muscle hypertrophy
in the dominant upper limb (Kannus, Haaspasalo, & Sankelo, 1995).
In young tennis players, the mechanical load of the upper limb has a positive
effect on bone development. With regard to muscle development, it is generally
accepted that the intermittent activity of prepubertal children has a major impact on
neural adaptations and only a minimal impact on muscle hypertrophy. Increased muscle
mass was found in the dominant arm of prepubertal female players using magnetic
resonance imaging (Daly, Saxon, Turner, Robling, & Bass, 2004). This result suggests
that the increase in muscle mass in the upper limb in response to performance occurs
before puberty.
5.3 Structural and Motor Manifestations of Laterality in the
Ontogenetic Development of the IndividualThis subchapter describes the development of structural and motor manifestations
of laterality during human ontogeny. The main emphasis is on the period from prenatal
development to the 12th year of life. At this age, the process of lateralization should be
completed. The end of the subchapter also mentions the development of hemispheric
specialization and maturation of the corpus callosum.

57
5.3.1 Prenatal Asymmetry
Asymmetry is assessed according to the speed and nature of hemisphere
maturation. Certain areas of the right hemisphere mature much faster than the same
areas in the left hemisphere. Delay in the appearance of cortical characteristics around
the Sylvian fissure on the left side, compared to the right, has been observed. Similarly,
bends around the Sylvian region appear later on the left side than on the right (Chi,
Dooling, & Gilles, 1977). Chi et al. also found that some cortical signs at the top of the
temporal region appear 1–2 weeks later on the left side than on the right. Interestingly,
the dendritic protrusions which are important for speech and which are located mostly
in the left hemisphere also develop with a delay. Eventually, however, the extent of
these protrusions in the left hemisphere of adults is much larger (Simonds, & Scheibel,
1989). In the prenatal period, the right hemisphere develops more when the brain of the
foetus receives various non-language sounds. Therefore, it is possible that the
dominance of the right hemisphere is reflected in the behaviour and sorting of input –
stimuli. This early experience is explained by the later dominance of the right
hemisphere in the recognition of non-speech sounds. Further development of the left
hemisphere is associated with the ability of the foetus to perceive the mother’s voice.
This new acoustic information related to the dominance of the left hemisphere is
explained by two factors (Turkewitz, & Kenny, 1982). The right hemisphere is
determined for the perception of non-speech sounds (signals) and it becomes dominant
for this function. This means that the right hemisphere is less available to respond to the
mother’s speech than the left hemisphere. Since speech will be the primary function of
communication, the left hemisphere becomes dominant, and this fact becomes the
precursor of left hemisphere dominance for the whole process of speech.
Another view of asymmetry and its development is based on the idea that the
development of areas important for visual cognition is associated with greater
dominance of the right hemisphere at the time of birth and a short time afterwards. The
right hemisphere is more sensitive to the visual information it receives. The visual
system of newborns in particular is limited in sending visual information at high
frequencies. This ability is improved in the first six months of the infant’s development.
Therefore, the right hemisphere is dominant for a short period after birth. This
hemisphere is responsible for the transfer of global information gained via ocular
perception (Hellige, & Cox, 1989). In later development, relevant areas of the left
hemisphere develop more than in the period after birth, and the individual receives

58
visual information through the eyes at higher scales of visual frequencies (Hellige,
2001).
5.3.2 Craniofacial Development
In the general theory of the prenatal origin of hemispheric asymmetry in
humans, several asymmetries are discussed. In approximately two-thirds of newborns,
most cranial bones are wider on the right side, while the chin and jaw area is slightly
larger on the left side. The craniofacial asymmetries begin to appear during the first
trimester of pregnancy. These facts lead to the assumption that such asymmetries in the
prenatal period are the basis for the dominance of the left hemisphere for speech
comprehension and production (Previc, 1991).
5.3.3 Motor Manifestations of Laterality in the Prenatal Period
Based on the use of ultrasound, thumb sucking was observed in human foetuses
beginning in the 15th week of pregnancy. Interestingly, it was found that the right hand
was preferred (Hepper, Shahidullah, & White, 1991). However, subsequent studies
focusing on the connection between hand preference (thumb sucking) and the position
of the foetus in utero, conducted from the 32nd to the 38th week of pregnancy, did not
confirm any significant relationship. In contrast, this motor manifestation of laterality in
the form of thumb sucking strongly correlated with head turning in newborns tested
shortly after birth. The head was oriented to the same side as the preferred hand during
thumb sucking (Hopkins, Lems, Janssen, & Butterworth, 1987).
The most discussed issue is the question of whether the position of the foetus in
utero influences prenatal asymmetry. Monitoring was conducted during the last
trimester of pregnancy, especially in the last month. Three-quarters of foetuses were in
the position with the head in the caudal direction and the back oriented to the left side of
the mother. The left arm is in the position against the mother’s pelvis and spine. The
right arm is oriented to the outer part of the uterus. These facts lead to the conclusion
that such asymmetric positions of the foetus are important for pre-dominance of right-
handedness in the human population (Hellige, 2001). The foetus has more freedom for
activity of the right arm, which is in a more independent position than the left arm
(Corballis, 1991).
However, current studies confirm that this is only an indirect fact. In addition to
determining pre-dominance of handedness depending on the position of the foetus in

59
utero, the development of hemispheric specialization for postural functions and motor
control has also been studied. The position of the foetus and the pressure caused by the
mother’s walk develop an otolith (an organ inside the ear maintaining balance) and,
particularly, neural pathways leading to the brain. In most individuals, this development
leads to the dominance of the left otolith, which is essential to emphasizing the fact that
in the postural position a large part of the population looks for support in the left side of
the body. Therefore, the right side of the body, controlled by the left hemisphere,
becomes dominant for the control of motor behaviour.
5.3.4 Postnatal Development of Motor Manifestations of Laterality
The seeds of motor manifestations of laterality can be observed very soon after
birth. When turned on the abdomen, the newborn shows a preference to lie with its head
oriented to one side. Research has shown that 70% of children turn their heads to the
right. In order to improve accuracy, this research was conducted with a modified
position of the newborn on its back. The results of both studies were almost identical. In
four months, most infants exhibit right-hand preference – in pointing to objects and
touching them. The left hand usually only holds objects in a passive way (Cornwell,
Harris, & Fitzgerald, 1991; Young, Segatowitz, Misek, Alp, & Boulet, 1983;). Other
studies were conducted in the area of cognitive perception asymmetry in three-month
infants. Individuals had to identify photos of their mothers shown to them in the right
and left visual field. Infants exhibited preference fixation time with the photograph
placed on the left side. This result thus showed stronger activation of their right
hemisphere (Molfese, & Segalowitz, 1988).
After infants reach one year of age, gradual upper limb preferences for various
types of activities are observed. Between the first and the third year, there is not a
substantial difference in capabilities of both upper limbs, and preference of one of them
is not clearly apparent. Therefore, it is not suitable to assess handedness for such small
children using motor tests. However, there are studies that have dealt with cognitive
perception asymmetries between the first and the second year of age using tactile tests
of eye–hand co-ordination. Based on palpation, individuals examined a three-
dimensional object that they did not see. Different pictures of objects were gradually
shown on the screen, and their task was to identify the picture that represented the
object (Witelson, 1985). It is not possible to determine motor manifestations of lower
limb laterality in this age, mainly because of the postural system formation. A wide
60
range of handedness is gradually finalized in the third year of age. The proportion
between left-handed and right-handed individuals almost reflects the proportion in the
adult population. This finalization of handedness is tested using motor tests, e.g., peg
tests (speed test of putting pegs into holes) (Annett, 1985). The process of lower limb
lateralization is only gradual. Children aged four to eight years exhibited weak low limb
preference finalization, and they were more ambidextrous (Gentry, & Gabbard, 1995).
This fact is supported by the idea that footedness is less subject to right-sided social
pressure (Chapman, Chapman, & Allen, 1987). Slow low limb preference finalization
was found only in the age categories of eight to 11 years. Current studies suggest that
the age range from five to 11 years contains a turning point in the development of limb
preference (Oeztuerk, Durmazlar, Ural, Karaagaoglu, Yalaz, & Anlar, 1999; Mori,
Iteya, & Kimura, 2004). According to the authors, laterality levels off after the fifth year
of age, based on the corpus callosum myelination, which subsequently causes effective
communication between the dominant and non-dominant cerebral hemisphere (Barnea-
Goraly et al., 2005). Upper limb and eye laterality, manifested by reading and writing, is
also associated with speech stabilization, which should end around the 11th year of age.
Individual differences in cognitive development can be understood in the relationship
between the level of behaviour refinement and level of laterality (brain laterality in
children).
However, the process of lateralization is not only observed in comparing
different age categories, but also within groups. Individuals may differ from one another
not only in the degree of lateralization, but also in the pace of preference finalization
(Zebrowská, 1987).
5.3.5 Corpus Callosum and Hemispheric Specialization
An important role in interhemispheric communication is played by the corpus
callosum, which most likely contributes to hemispheric specialization (Witelson, 1985).
The corpus callosum is the largest cerebral commissure that contains 200 to 300 million
nerve fibres. It connects the cortex of the opposite frontal, parietal, and occipital lobes.
With regard to the temporal lobe, it only connects auditory areas; the other temporal
areas are connected in the anterior commissure (Franz, & Fandy, 2007; Fix, 2002). The
corpus callosum forms an integral part of the neural network that is involved in the
support of higher cognitive functions (Roessner, Banaschewski, Uebel, Becker, &
Rothenberger, 2004). It begins to develop in the prenatal period, between the 10th and

61
24th week of foetal development (Giedd et al., 1999). It was already presented by
Trevarthen (1974) that the corpus callosum matures between the fifth and the 10th year
of age (Trevarthen, 1974). Fagard et al. (2001) found that the link between cerebral
hemispheres matures during the first 10 years of age (Fagard, Hardy, Kervella, &
Marks, 2001). Kalat (1995) thought that the corpus callosum begins to mature during
the period from the third to the fifth year of age (Kalat, 1995). These findings indicate
that the maturation of the corpus callosum corresponds to the development of limb
preference during childhood, from insufficient communication to specialized
communication between the hemispheres (Mori, Iteya, & Kimura, 2004). Interesting
results were presented in a study by De Bellis et al. (2001), which states that
myelination and the corpus callosum development process is not the same in boys and
girls aged six to 18 years. The boys exhibited significantly greater size of corpus
callosum and longer anterior region (genu) (De Bellis et al., 2001). Studies dealing with
research in this area conclude that the relationship between the maturation of the corpus
callosum limb preference finalization can answer the question of the nature of
permanent sidedness (right-handedness, left-handedness) or ambilaterality. The basic
idea is that the stronger lateralized individual is less variable in hemispheric
specialization, and shows more distinct functional asymmetries, than ambilateral
individuals (Iteya, 1998). Based on the differences in motor co-ordination, i.e.,
inconsistent laterality (ambilateral individuals) and consistent laterality (right-handers,
left-handers) in children of pre-school age, it was concluded that the question
concerning the extent of individuals’ lateralization depends on the maturation of the
corpus callosum between the right and left hemisphere. This means that
interhemispheric communication is stronger in children with consistent preference of
one limb than in individuals with inconsistent preference (Kalat, 1995). Sigmundsson
and Whitting (2002) pointed out the relationship between motor co-ordination and
interhemispheric communication. They believed that unskilful and other motor
handicapped children usually have a problem with hand–eye co-ordination
(Sigmundsson, & Whitting, 2002). Other research using magnetic resonance imaging
found that dyslexic children had a significantly smaller anterior region (genu) of the
corpus callosum (Hynd et al., 1995).
The next chapter deals with the diagnosis of motor manifestations of laterality. It
provides information on the most widely used instruments and their development,

62
relationships and shortcomings, which should serve as guidelines for the construction of
new test batteries.

63
6. DIAGNOSTICS OF FUNCTIONAL MOTOR
LATERALITY MANIFESTATION
Research into laterality in relation to the functional asymmetry of brain
hemispheres and its diagnosis has been conducted by experts for almost 200 years.
During this period, a number of studies regarding the relationship between laterality,
mental disorders, functional asymmetry, and cerebral dominance have been written
(Musálek, & Štochl, 2010). The diagnosis of laterality is particularly associated with
neurology and psychology, especially in the diagnosis of specific disorders (Johnson,
2005).
The first major study dealing with the diagnosis of laterality emerged in the
medical field. In the second half of the 19th century, autopsies were performed on stroke
patients paralyzed in one half of the body in the sagittal plane that found a cross-lateral
brain function. The presumption that the right half of the body is motorically controlled
by the left cerebral hemisphere and vice versa was published by the French
anthropologist and anatomist Paul Broca in 1867 (McManus, 2002). Along with this
discovery, the speech centre, “Broca’s area”, was also localized in the brain; in right-
handed individuals, it was almost always located in the left hemisphere. This hypothesis
was then confirmed, particularly by a study presented by Liepmann, which showed,
based on 83 patients affected by apraxia, that voluntary movements are controlled from
the contralateral hemisphere (Liepmann, 1908). At that time, left-handedness was still
considered a pathological phenomenon. In the 1930s, S.T. Orton, a leading speech
pathologist, published the monograph Reading, Writing and Speech Problems in
Children: A Presentation of Certain Types of Disorders in the Development of the
Language Faculty, in which he pointed out the relationship between insufficient
dominance of one of the cerebral hemispheres and disorders of speech and writing in
children (Orton, 1937). Studies, which followed on from medical and psychometric
research, looked at the relationships and diagnosis of laterality of motor and sensory
organs (Green, Satz, Smith, & Nelson, 1989; Kimura, 1964; Nagae, 1983). The results
of this work showed that the issue of functional laterality and its diagnosis is very
important in addressing the causes of specific disorders of children, pathological
phenomena in psychiatric fields (schizophrenia), neurology, and professional diagnosis
(Taylor, Dalton, & Fleminger, 1980). Manifestations of laterality were thus also

64
examined in the area of neuropsychology: the issue was, for example, dealt with by the
leading Soviet neuropsychologist Alexander Luria in relation to mental disorders (Luria,
1962; Luria, 1976). The relationship of laterality and speech is a long and intensely
discussed issue in the area of laterality. This relationship is currently being addressed
primarily using magnetic and functional magnetic resonance imaging (Vikingstad,
George, Johnson, & Cao, 2000; Sommer, Ramsey, & Kahn, 2001; Binder, Frost,
Hammeke, Cox, Rao, & Prieto, 1997).
In the former Czechoslovakia, the issue of laterality and its diagnosis was
addressed most intently by Sovák (1962). His studies focused mainly on mental
disorders of naturally left-handed children who had been forcibly retrained (Sovák,
1962). The issue of retrained children and children with specific disorders related to
manifestations of laterality was also dealt with by Synek, (Synek, 1991). Another view
on laterality was presented by Drnková and Syllabová (1983). Their study discusses the
very concept of laterality, various types of laterality, and their diagnosis in relation to
cross-laterality (different preference of upper and lower limbs or upper limbs and eyes)
and speech (Drnková & Syllabová, 1983). In the field of neurology, laterality was dealt
with in the first half of the 20th century by Henner, who outlined a possible relationship
between cerebellar function and the motor manifestations of laterality in his work
(Henner, 1927). Currently, with regard to the neurological-neurodegenerative view,
laterality in the context of left-handedness and right-handedness is being addressed by
Koukolík, (Koukolík, 2008). The issue of motor manifestations of laterality is also
discussed in a study presented by Štochl, who verified the structure of motor symptoms
of Parkinson’s disease using motor tests focused on upper limb performance (Štochl,
2008).
6.1 Diagnostic ToolsThe current literature does not contain uniform fixed terms for concepts in the
assessment of preference and performance in motor limb activity. This chapter presents
two basic views on the assessment of motor manifestations of laterality:
– determining the level of preference using the preference task method or self-
assessment preference questionnaires,
– assessing different performance of motor organs using performance tests.

65
6.1.1 Preference Tasks
A number of motor tasks have been created in order to determine upper and
lower limb preference, but, surprisingly, not all authors consider them to be reliable
predictors in determining individual laterality (Annett, 1970). Others question the
creation and use of motor tasks, citing the (unsubstantiated) higher validity and
reliability of self-assessment questionnaires, as well as the time needed for processing
(Bryden, Mandal, & Ida, 2000; Oldfield, 1971; Sharman, & Kulhavy, 1976). Preference
tasks are motor activities given by the examiner to the subject. The result is thus an
immediate spontaneous response to a command. Items in the form of motor tasks are
mostly scored dichotomously, according to whether the individual performs the task
with the right limb or with the left limb.
The simplest tasks that were used at the beginning of research into this area
identified laterality of the subject based on determining the preferred hand in unimanual
writing or drawing task (Gordon, 1920; Haefner, 1929). Very simple procedures were
also used to determine lateral preference (left-sidedness and right-sidedness). According
to the Rife test battery (1940), which contained 10 unimanual tasks, everyone who used
the left hand in at least one task was considered left-handed (Rife, 1940).
To this day, one of the world’s best known batteries that include motor tasks that
determine motor and sensory manifestations of laterality is the Harris Test of Lateral
Dominance (Harris, 1958). It is a set of preference motor tasks determining motor
manifestations of laterality. According to the author, motor tasks are suitable to
diagnose population older than seven years of age, where writing ability is assumed.
The motor-task part includes items that are instrumental in nature and that determine
hand preference using unimanual and bimanual tasks. The battery contains items where
the subject shows, for example, hand preference in writing, drawing, or cutting with
scissors.

66
Fig. 5 Motor preference tasks for hand preference from „Harris test for lateral
dominance“ (Harris, 1958). Figure is take over from study of Rigal (1992), (Rigal,
1992 p. 853).
The battery includes monocular and binocular tasks in order to determine ocular
dominance. The author extended preference tasks with performance tests, which
determine different writing ability of the right and left hand, and performance tests,
which examine different performance in upper limb tapping and different hand grip
strength. The author is convinced that all items are sufficiently valid in terms of the
content, even though they are only based on intuition and logical validity. With regard
to this battery, numerical representation of validity of individual indicators was not
prepared. The observed reliability of the items to determine hand preference using the
test-retest method ranged from 0.75 to 0.83 (Harris, 1958). Expression of the degree of
laterality was calculated using the formula 100*)()(
LRLRLQ
(where LQ is the
laterality quotient in per cent, R is the number of tasks performed by the right hand, and
L is the number of tasks performed by the left hand). This study does not discuss the
constructs of hand preference, performance, and ocular dominance in detail. It neither
creates nor determines any diagnostic tool structure, and it does not contain the
expression of several important aspects of diagnostic quality, such as the factorial
validity of indicators and the generic reliability of constructs.
Another well-known preference task battery is that presented by Humphrey
(1951) comprising 45 items determining upper and lower limb preference and ocular
dominance, which is determined using the result of the monocular task. Thirty items
from this battery are designed to determine hand preference. The items are of unimanual
and bimanual nature, largely of instrumental type. Some of the indicators are very
specific, and not every subject has the opportunity to perform the activity (e.g., holding

67
a golf club or a cricket bat). In addition, the battery includes tasks of simple
spontaneous activity, such as folding the arms or lacing fingers together. In these items,
the preferred limb is the one whose part (finger, part of arm) is on top.
Prerequisite of left-hand preference Prerequisite of right-hand preference
Fig. 6 Examples of tasks which assess spontaneous hand preference
The calculation of lateral tendency is based on the formula 100*)()(
LRLRLQ
(Humphrey,1951). However, not even this study discusses sufficiently the issue of
manifestations of functional laterality in relation to hemispheric asymmetry that would
lead to the creation of an acceptable structure of the whole tool. Basic characteristics of
individual psychometric indicators are unavailable.
In determining lower limb preference, the most frequently used motor tasks
include kicking a ball or moving an object (Bryden, 2000). A more complete picture of
motor tasks to determine lateral lower limb preference is shown by the test battery
derived from the Waterloo Footedness Questionnaire, which was originally compiled by
Bryden (1977) in the form of a questionnaire (Bryden, 1977). The battery contains nine
motor tasks with repetition which are scored dichotomously each time. Upon
completion of a motor task in a given number of repetitions, the total score achieved is
recorded (Elias, & Bryden 1998).
Motor tasks to determine motor and sensory manifestations of laterality were
created by a number of Czech (Czechoslovak) experts (Sovák, 1962; Kučera, 1961;
Matějček & Žlab, 1972; Zaháněl & Vaverka, 1990). The best-known set of such motor
tasks is Matějček and Žlab’s “Laterality Test” (1972). Based on motor preference tasks,

68
this diagnostic tool determines upper limb, lower limb, and eye laterality, in both
children and adults. It contains a total of 18 preference tasks. Twelve items assess upper
limb preference, four items determine lower limb preference, and two items assess
ocular dominance using the observation (sighting) factor. Since preference tasks are
designed to make the subject repeat the task several times, all items are scored
polytomically (in contrast to previous studies) – right, left, absence of preference. The
examiner monitors whether the individual performed the task using the right limb, left
limb, or whether the individual alternates both limbs in the repeated execution of the
same task. With regard to ocular dominance, it is determined which eye is preferred in
monocular activity. The calculation of lateral tendency is based on the above formula
100*)()(
LRLRLQ
. The authors used the formula presented in Harris’s study or, more
precisely, Humphrey’s study (1951) to calculate the laterality quotient. The authors
chose those tasks that were considered particularly valid by the literature. However,
these motor tasks were created solely to reflect the needs of clinical practice, and they
were not properly validated. Individual items have both unimanual and bimanual
character.
However, due to the nature of most motor tasks used in the previous batteries, it
is very difficult to diagnose the population younger than seven years in terms of
ontogeny of motor activity. Therefore, researchers are currently focussing on the
population of younger children, particularly those aged four–six years, for whom they
seek to validate mainly hand preference tasks. Krombholz (1993) and Tirash et al.
(1999) proposed methods for observing children’s spontaneous daily activities using
video recordings. Based on the analysis of the video footage, it would be possible, using
a certain process of hand preference coding in motor activity, to determine the lateral
tendency of the child (Krombholz, 1993; Tirosh, Stein, Harel, & Scher, 1999). In the
studies carried out by Pryde et al. (2000) and Fagard and Marks (2000), the authors
even focused on the possible standardization of these proposed procedures using video
technology (Fagard, & Marks, 2000; Pryde, Bryden, & Roy, 2000). However, these
procedures faced the problem of identification and differentiation of hand preference in
the motor activities of children, as well as enormous time demands concerning the
analysis of movements.
Bryden et al. (2007) attempted to create a comprehensive approach to the
diagnosis of upper limb preference in children: the WatHand Cabinet Test (WHCT).

69
The WHCT uses a cabinet on which and into which various objects can be placed; it is
also possible to handle the objects around the cabinet. The child is instructed as to
exactly what to do by the examiner. The manipulative items predominantly have the
character of unimanual activities. Lateral preference is then expressed using three
scores:
1) skilled performance score, which has the same mathematical expression as the
previous battery: 100*)()(
LRLRLQ
2) internal consistency score, which measures the average of how many times the child
opened the cabinet using the right hand
3) bimanual performance score, which focuses on the activity where the child has to
take something from the cabinet after opening it. It assesses whether the same hand that
opened the cabinet is used or not
(Bryden, Roy, & Spence, 2007)
Using composite scores, this diagnostic tool has been correlated with the
pegboard performance test, 0.563 (Annett, 1976), and the Waterloo Handedness
Questionnaire (WHQ), 0.853 (Bryden, 1977). In both cases, the author shows
significant correlations of the WHCT vs. the pegboard = 0.563, and the WHCT vs. the
WHQ = 0.853 (Bryden, Roy, & Spence, 2007). The study does not explain whether the
interpretation was based on adequate polychoric correlations or not. The WHCT itself
does not have a verified structure including diagnostic quality in terms of reliability.
Another battery of 16 motor tasks determining upper limb preference in the
population of children aged four–six years was created by Kastner-Koller et al. (2007).
This diagnostic tool has a four-dimensional structure according model Steenhuis and
Bryden (1989) that divides upper limb motor activity into proximal movements; distal
movements; spontaneous picking-up movements; and handling movements. Each
dimension contains four motor tasks. In addition, individual dimensions have been
further divided into groups according to whether the movement is accurate or automatic.
Each of the tasks is performed by the child three times (Kastner-Koller, Reimann, &
Bruckner, 2007). Apart from the expression of specific reliability of individual tasks,
the battery does not have an interpreted structure with quantified relations between
indicators and constructs, or between individual constructs.

70
A very interesting procedure for estimating upper limb preference – the
“reaching the card task” – was employed by Connolly and Bishop (1992). Seven
coloured cards are placed in front of the child, i.e., in the half-circle with a diameter in
the direction from the child’s left hand to its right hand. The child is asked to hold a
card of a certain colour and move it to the prepared box. The aim is to determine
whether the child will take the cards using the same hand, even if it has to take a card
across the body axis (Bishop, Ross, Daniels, & Bright, 1996; Connolly, & Bishop,
1992). Doyen and Carlier (2002) attempted to validate this motor task. In their study,
Doyen and Carlier correlated the results of Bishop’s reaching card task with the results
of a questionnaire survey determining upper limb preference and with the results of
Annett’s peg moving test (1985) identifying the difference in the performance of upper
limbs. However, the conclusion of this research did not confirm a relationship between
preference and performance, and the authors recommend using both preference
unimanual tasks and the reaching task in examining motor manifestations of laterality
(Doyen, & Carlier, 2002). This research only used manifest variables in the form of
tasks, questionnaire items, and tests. The study did not differentiate the character of the
data, i.e., whether it dealt with ordinal or interval data; therefore, the correlations were
only expressed using Pearson’s correlation coefficient. However, this coefficient can
only be used for interval data. The study did not determine polyserial correlations,
which was necessary in this case. In addition, the manifest variables in the form of a
motor task, test, and questionnaire items were not related to the dimension determining
handedness, so in this case the entire diagnosis of handedness lacks any more detailed
expression of the structure of this characteristic and relations within it.
In other studies, Calvert and Bishop (1998) focused on the modification of this
motor task. The child examined was first asked to point at the card, and then it was
instructed to take the card and place it in a box. A certain percentage of probands
pointed at the card ipsilaterally, but the relocation was performed contralaterally using
the upper limb across the body axis. The results of this research showed that, in addition
to the construct of preference for relocating an object (card), there also seems to be a
construct for hand preference in pointing to an object. This finding was explained by the
need to distinguish between the difficulty of the task (handling an object) and a mere act
of pointing to an object (Calvert, & Bishop, 1998). A study by Bryden et al. (2003)
modified this type of motor task into a form where everyday tools (pen, toothbrush,
hammer, paint brush, spoon) were placed in the half-circle instead of the cards.

71
Assessment of this procedure was then performed in the adult population. The subjects
were first asked to lift an object and mime the relevant activity with it. The result of the
study was the finding that upper limb preference is stronger in motor tasks that include
demonstration of activity (Bryden, Roy, & Mamolo, 2003). This assumption was
supported by another study Mamolo et al.(2004). Results showed direct link between
hand manipulation with subjects and space comformity (Mamolo, Roy, & Bryden,
2004). In addition to manipulative activities, diagnosis of preference in the use of upper
limbs in motor tasks also focused on determining the feeling of comfort that subjects
experience in handling. Mark et al. (1997) conducted research in which the subjects
were asked to move small cubes, based on the instructions provided. The movement
was first limited to the arm area only. Then the task was repeated, but the probands
could also turn and bow their trunk. In addition to determining the subjects’ upper limb
preference, the degree of comfort was also assessed using the three-point Likert scale (1
– comfortable movement, 2 – uncomfortable movement, 3 – very uncomfortable or
even impossible movement). The result of the research showed a connection between
the spatial arrangement of objects and limb preference (Mark et al., 1997). A finer
distinction of comfort using a continuous 100-point scale, the Comfort Rating Scale,
was performed by Mamolo et al. (2006). Interestingly, this study found a significant
relationship between the determination of the degree of comfort and the non-preferred
hand (Mamolo, Roy, Rohr, & Bryden, 2006).
However, motor preference tasks only show an individual’s side tendency; they
do not express, in a more precise context, the individual’s degree of lateralization. In
addition, at present no adequate validation study has been conducted that meets both
methodological and psychometric requirements.
6.1.2 Preference Self-reported Questionnaires
Self-assessment questionnaires are designed primarily to determine upper and
lower limb preference in motor activity without the possibility of comparing the degree
of lateralization. It is only in exceptional cases, e.g., in a diagnostic tool presented by
Bryden (1977), that the item determining whether the individual was retrained in the
course of development is included. The latent variable which, in this case, represents
lateral preference of motor organs or dominance of sensory organs is generally regarded
as a continuous variable (Annett, 1970; Annett, 2002; Bryden, 1977; Nettle, 2003;
Oldfield, 1971, Sharman, & Kulhavy, 1976). According to Dragovic, this approach is

72
also chosen because it is almost impossible to statistically normalize nonparametric
distribution of lateral preference (Dragovic, 2007). Most preference questionnaires
currently used have been compiled from the results of questionnaires for the adult
population. The questions in the questionnaires focus on motor tasks that usually
display unimanual nature, i.e., when responding, the individual only decides between
the left and right limb. In scoring the responses, three types of lateral preference are
often distinguished, depending on whether the activity is performed with the right limb,
left limb, or both with the right and left limb (Annett, 1970 a); Coren, & Porac 1978;
Oldfield, 1971). Each of these options has its value in the questionnaire: +1 for the right
limb, -1 for the left limb; if the subject does not exhibit any preferred limb for the
activity, the response is marked with 0. Laterality quotient, calculated using the formula
100*)()(
LRLRLQ
, and given in percentage, is most often used for the subsequent
interpretation of the results of the subject’s lateral preference (Barut, Murat, Ozdemir,
Mustafa, & Yunten, 2007; Chapman, 1987; Oldfield, 1971; Rackowitz, 1974; and
others). Other authors, such as Coren and Porac, calculate right-sidedness and left-
sidedness in their itemized questionnaire by adding up individual values. Therefore, if
the result of an eight-item questionnaire is positive, the subject is considered to be right-
sided (Coren, & Porac, 1978). The right-sided individual is the person who reaches the
score from +1 to +8 in the questionnaire.
In some studies, the authors work with five response options. Besides the three
above-mentioned responses, there are more options: I usually perform the activity using
the right limb, I usually perform the activity using the left limb (Bryden, 1977;
Sharman, & Kulhavy, 1976). However, the meaning of the word usually is not clearly
defined. Some questionnaires even offer the response options rarely or slightly.
Bishop, Ross, Daniels, and Brigit (1996) argue that there is no “gold standard”
for determining the lateral preference of motor organs, not even handedness (Bishop,
Ross, Daniels, & Bright, 1996; Dragovic, 2007). In addition, different researchers use
different items or questionnaires and, in almost all cases, they make arbitrary decisions
about how they call sub-groups expressing lateral preference and how they are divided
(Annett, 2002; Dragovic, 2007; Peters, 1995). Some of these diagnostic tools also
contain items that determine laterality of sensory organs – eyedness and earedness
(Coren, 1993). Ocular dominance (eyedness) is mostly determined in the questionnaire
survey with questions focusing only on monocular activities (see chapter 5.1.5

73
Eyedness). Determination of ear dominance is one of the less diagnosed areas in the
questionnaires. Ear dominance is typically determined by questions relating to listening
to both non-speech and speech stimuli (listening to a watch, listening to the radio)
(Coren, 1993; Coren, & Porac, 1978;). Determination of both eye and ear dominance in
the questionnaire survey may only represent approximate output, due to the complexity
of sensory organ laterality. Yet some authors, e.g., Bourassa et al. (1996), consider
questionnaire items to be a better diagnostic tool for measuring eyedness than
preference motor tasks (Bourassa, McManus, & Bryden, 1996).
At present, the best known globally used questionnaires determining lateral
preference of motor limbs include the Annett Hand Preference Questionnaire (AHPQ)
(Annett, 1967), the Edinburgh Handedness Inventory (EHI) (Oldfield, 1971), and the
Waterloo Handedness Questionnaire (WHQ) (Bryden, 1977).
The AHQP only assesses hand preference, and includes 12 items that form a
combination of unimanual and bimanual everyday activities (in the form of questions).
The entire questionnaire is divided into two parts. The first six questions are considered
the primary items that strongly correlate with hand preference. The second six questions
are considered secondary by Annett, and their correlation with hand preference is not as
strong. The items are scored on the three-point Likert scale, and the interpretation of the
overall laterality quotient is expressed by the formula 100*)()(
LRLRLQ
. In her study,
Annett also proposes to divide lateral preferences of the hand into eight different
categories, ranging from extremely left-handed individuals to extremely right-handed
individuals. The questionnaire does not lack an item determining hand preference in
writing (Annett, 1967). However, this indicator is considered to be misleading by some
authors due to the social pressure that generally prefers right-handed writing (Riehl,
2010). The first study attempting to approximate the specific reliability of all AHPQ
indicators was conducted as late as 1975 by McMeekan and Lishman. On average, it
was around the value of 0.75 (McMeekan & Lishman 1975). Dragovic (2007)
performed both the latent class analysis and confirmatory factor analysis, including
generic reliability approximation, of the AHPQ. The latent class analysis showed that
the proposed eight categories of upper limb lateral preference cannot be accepted for the
12-item model in the AHPQ. However, the confirmatory factor analysis found
satisfactory psychometric properties and a good model fit of the 12 items of the AHPQ.

74
Despite this, Dragovic proposed eliminating some items that create the
multidimensional nature of the entire diagnostic tool (Dragovic, 2007).
The most frequently cited and most widely used questionnaire designed for the
diagnosis of human lateral preference is the EHI, created by R. C. Oldfield (1971).
Oldfield argues that the conclusions of previous studies showed insufficient
differentiation of upper limb laterality using performance tests. Therefore, the inventory
method, which sufficiently distinguishes the level of hand preference, is used for the
diagnosis of upper limb laterality. Low time and economic requirements constitute
another reason for favouring the inventory method.
The author of the EHI selected 20 items from Humphrey’s battery (1951), which
assesses hand preference in the adult population. The items subsequently underwent
item analysis. The final version of the EHI contains 10 essential items examining hand
preference that, according to the results of the item analysis, exhibited the strongest
correlation. Furthermore, the questionnaire includes an additional question about lower
limb preference and a question assessing ocular dominance based on monocular
activity. This questionnaire also uses the formula 100*)()(
LRLRLQ
to calculate the
individual’s lateral preference. In individual items, test subjects express their upper limb
preference by placing a cross, or crosses, in the appropriate column behind the question.
The left column represents the left hand; the right column represents the right hand.
Two crosses in one column indicate strong preference in the given activity; one cross
indicates weak preference. If the person tested does not exhibit a preferred upper limb
for an item, one cross is written in each column. Like Annett, R.C. Oldfield views
handedness as a continuous variable, i.e., a variable that displays certain degrees,
ranging from extremely right-handed individuals to extremely left-handed individuals
(Oldfield, 1971). The results of the EHI take the form of ordinal data marked by the
author on the five-point Likert scale. Dragovic (2004) also conducted a confirmatory
factor analysis of the EHI, which showed that three out of the 10 questionnaire items are
redundant. These were two items of bimanual nature that disrupted the
unidimensionality of the EHI, and one item of unimanual nature (which hand do you
use for drawing) that showed strong collinearity with the item determining hand
preference in writing (Dragovic, 2004).
The original version of the Waterloo Handedness Questionnaire by Bryden
(1977) comprises 32 items that form a combination of unimanual and bimanual

75
activities of instrumental nature, both skilled and unskilled. The questionnaire also
includes an item that determines whether the individual was retrained. In order to
determine lateral preference, the items in this study are scored on the five-point Likert
scale, depending on whether the person always uses the right upper limb, usually uses
the right upper limb, has no preferred upper limb, usually uses the left upper limb, or
always uses the left upper limb to perform an activity. The author explains the
difference between the terms always and usually by stating that if the person uses one
limb in 95% or more cases to perform the activity, the response is always. If the person
uses one limb in approximately 75% of cases to perform the activity, the response is
usually. The question is whether the subject is able to express percentage for activities
that are not so familiar and automatic.
The calculation of lateral preference is based on the same formula that is used in
the previous two diagnostic tools: 100*)()(
LRLRLQ
. In order to determine the
structure of the WHQ, Steenhuis and Bryden (1989) conducted an analysis using the
principal component method. The authors state that the WHQ is based on a three-factor
structure. The first factor contains items of a skilled nature, the second factor contains
items of an unskilled (spontaneous) nature, and the third factor is related to bimanual
activities. In addition to the proposed structure, it was found that activities of a skilled
nature have a closer relationship to hand preference than those of an unskilled nature
(Steenhuis, & Bryden, 1989). Using the principal component method, the structure of
the WHQ was also verified by Obrzut et al. (1992). However, the research set consisted
of individuals with specific learning disabilities. The three-factor structure was also
confirmed, but there were different loads expressing relations of items to hand
preference. Research carried out by Oberutz et al. showed that, compared to the results
of the previous study, the items of unskilled nature have a closer relationship to the
expression of upper limb lateral preference in this specific population. Therefore, this
finding indicates instability of validity concerning some items in specific populations
(Obrzut, Dalby, Boliek, & Cannon, 1992). In order to obtain a fuller picture of motor
organ lateral preference, Bryden (1977) also created the Waterloo Footedness
Questionnaire (WFQ). The methodological basis of the WFQ is the same as in the
WHQ. The WFQ contains 10 items determining lower limb lateral preference, both in
instrumental and spontaneous activity (Bryden, 1977).

76
The most commonly used questions in the questionnaires:
Which hand do you use to hold a writing instrument for writing?
Which hand do you use to hold a writing instrument for drawing?
Which hand do you use to hold a toothbrush?
Which hand do you use to hold a knife when cutting bread?
Which hand do you use to hold scissors when cutting?
Which hand do you use to throw a ball?
Which hand do you use to hammer a nail into wood?
Which hand do you use to hold a spoon when eating?
Which foot do you use to kick a ball?
Which eye do you use when looking down a telescope?
(Annett, 1967; Barut et al., 2007; Bryden, 1977; Coren, 1993; Crovitz, & Zener, 1962;
Chapman, & Chapman, 1987; Hatta et al., 2005; Kovac, 1973; Oldfield, 1971; Porac, &
Coren, 1978; Raczkowski et al., 1974; Van Strien, 2002; and others)
However, according to some authors, diagnosis of motor manifestations of
laterality using questionnaires implies several pitfalls. According to Nisbett and Wilson
(1977), as well as Bryden (2000) Brown et al. (2006), self-assessment questionnaires
are affected by the subjective opinions of individuals, unlike spontaneous responses
observable by another person (Brown, Roy, Rohr, & Bryden, 2006; Bryden, 2000;
Nisbett, & Wilson, 1977). In addition, simple questionnaire questions that were
developed based on hypotheses about a connection of handedness with footedness and
earedness certainly cannot determine ear dominance very well.
In the course of the 1970s, additional questionnaires were created (Kovac, 1973;
Rackowitz, 1974; Sharman, Kulhavy, 1976), but since they simply duplicate the EHI,
AHQP, and WHQ (Oldfield, 1971) they are almost never used.
6.1.2.1 Methodological and psychometric shortcomings of the most frequently
cited diagnostic tool, the Edinburgh Handedness Inventory
The author Oldfield (1971) states that the purpose was to create a simple
diagnostic tool to determine handedness, which could be used in experimental and
clinical studies.

77
The EHI consists of indicators that examine hand preference by asking the
following questions: Which hand do you use to:
1. Write?
2. Draw?
3. Throw?
4. Cut with scissors?
5. Brush your teeth?
6. Cut with a knife?
7. Eat with a spoon?
8. Sweep with a broom?
9. Strike a match?
10. Open a box?
Additional questions:
i. Which foot do you prefer to kick with?
ii. Which eye do you use when using only one?
(Oldfield, 1971)
Methodological shortcomings
The fact that no reference to a scientific source dealing with scientific and
standardisation studies, methods, and procedures is mentioned is the cause of the
essential imperfection of the study. The problems of the research are therefore not
specified sufficiently: The laterality of the so-called behavioural domain, which is
considered to be a super-construct and which needs to be examined on the basis of
scientific theory, and its inner relations need to be explained (Štochl, & Musálek, 2010).
The study is not grounded in other studies on the actual determination of handedness
and does not explain basic concepts such as hemispheric domination, laterality, its types
and possible development in the course of human life. The main construct –
handedness, i.e., an indirectly observable variable – is not analysed (Blahuš, 1985).
Possible sub-constructs are not specified, as is the case with their relations to the main
construct, e.g., fine or rough motor of upper limb, skill/tool or non-skill/spontaneous
manifestation of hand preference (Bryden, Mandal, & Ida, 2000) or the distinction of
preference according to muscle engagement: proximal movements – of arm and
shoulder; or distal movements – of the fingers and hand (Steenhuis, & Bryden, 1989).

78
The study thus uses only a general concept of handedness, which is intended to express
the common examined character of the whole diagnostic tool.
However, information on the development of laterality in the child and on
different cultural perceptions of laterality (today distorted by immigration) is lacking.
When choosing a method of handedness determination, Oldfield decided to apply the
method of inventory for the reason of insufficient differentiation of hand preference by
performing tasks (Oldfield, 1971). The EHI study does not contain any evaluation of
possible questionnaire problems, e.g., sensitivity. For example, a study by McMeekan
and Lishman (1975) discovered, during an approximation of the reliability of the EHI
by the test-retest method, that tested individuals often changed the intensity of
preference for specific answers when completing the questionnaire repeatedly
(McMeekac, & Lishman, 1975). According to Bishop et al. (1996), the self-assessing
EHI thus has neither a sufficient theoretical basis nor empirical validity and overlooks
the important issue of the dimensionality of the handedness construct (Bishop, Ross,
Daniels, & Bright, 1996).
When selecting specific indicators, the method of content validity was not used
either. Oldfield only states that the basic set of items for the EHI consisted of 20
indicators that he had used for his previous study, the aim of which was to find left-
handed musicians (Oldfield, 1969). These items were originally used in a hand
preference questionnaire by Humphrey (1951). However, he does not mention the
diagnostic quality of this tool, i.e., generic and specific reliability, construct validity, or
the validity of specific indicators. Its possible limitations are not mentioned either.
Quote: “As to the choice of items, it seems probable that no selection could be
exempt from criticism. The present set of questions, however, proved capable of answer
by a very high percentage of undergraduate subjects.” (Oldfield, 1971 p. 99) The
process of selecting specific items therefore remains unfounded.
Based on his previous experience, the author admits that he is not able to
respond to essential methodological questions: whether all the items should be given
equal weight, or how to work with indicators between which there is such a high
correlation that the presence of both of them is superfluous and may thus cause false
overvaluation of the diagnostic tool. He points out that the main role of the EHI is as a
general screening tool that does not attempt to describe the development of laterality in
the individual.

79
In the part of the study titled Method, Procedure, Subject, the author describes
the selection of the observed file. (Quote) “Copies of the inventory were sent to
departments of psychology in several English and Scottish Universities.” (Oldfield,
1971 p. 99) Yet the aspects or the process of selecting the observed file are not stated.
At the same time, the study does not deal with the issues of random or intentional
selection; nor does it explain the basic differences between these two approaches. A
critical work by McMeekan & Lishman (1975) points out a serious problem: The
observed file for the creation of the EHI was not based on intentional selection and its
results cannot therefore be generalised to the whole population. Among other things, an
emphasis was placed upon the selection of left-handed individuals from the London
psychiatric registry. The observed file consisted of 1,128 undergraduates (394 M, 734
F). The work does not offer substantiation of the size of the file connected to the
standardisation of the diagnostic tool; moreover, it fails to offer a reason for the age
category of subjects. The mean age of subjects of both sexes was higher than 20 years.
The author merely states that handedness is stabilised by the age of 20. However, he
does not describe the development of handedness with regard to the ontogenesis of the
individual (McMeekan, & Lishman, 1975).
Psychometric shortcomings
During the filling out the EHI with appropriate crosses and subsequent
calculation of the LQ, the results can be easily misinterpreted. If a subject makes only
one cross for each of the 10 items, which means that he or she expresses weak
preference for a given act, he or she will obtain the same result (according to the
mathematic formula of the level of lateral preference of the LQ: LQ = (R – L)/(R +
L)*100) as a subject that made two crosses for each of the 10 items as an expression of
strong preference (Bryden et al., 2000). The data obtained thereby may therefore
eliminate one of the characteristics of the test: that is its ability to discriminate – to tell
the difference between specific levels of a given feature (Bryden, Mandal, & Ida, 2000;
Schachter, Ransil, & Geschwind, 1987). However, there is no reason to scale strong
preference as the double size of weak preference just because it is noted by two crosses
instead of one (Williams, 1986).
Later studies dealing with the diagnostic quality of the EHI assessed its validity,
reliability and unidimensionality (conceptual homogeneity). They discovered that the
EHI is not unidimensional; that means that not all indicators are the function of the

80
same feature (Furr, & Bacharach, 2008). Specific EHI indicators thus do not assess only
one common characteristic. The multidimensionality of this diagnostic tool is affirmed
by the item “holding a broom” – which is a bimanual act with a weak relation to other
indicators (Bryden, 1977). Other studies dealing with these issues suggest deleting those
items from the EHI that have only a weak connection to the factor of handedness; along
with the mentioned “holding a broom” indicator, the item “box opening” should also be
deleted in order to secure unidimensionality (Williams, 1986). The results of the study
by Büsch et al. (2010), in which the dimensionality of the EHI was determined by mix
Rasch-model IRT (Item Response Theory), imply that the EHI is not unidimensional.
The structure of two classes, right-handed and left-handed type – with qualitative
differences between individuals – seems to be the best model. Ambilateral individuals
do not appear to be an independent group and their interpretation should be considered
(Büsch, Hagemann, & Bender, 2010).
The selection of a model for data analysis is a quite problematic and not very
clarified part of the study. As handedness in general has an asymmetrical bimodal
character (Briggs, & Nebes, 1975; Dellatolas, Annesi, Jallon, Chavance, & Lellouch,
1990), data cannot be analysed by using parametric models. The set of items in the EHI
was analysed using a method of item analysis in which all items have the same weight
(McFarland, & Anderson, 1980). These authors suggest putting the EHI to a procedure
that would find out the weights of specific items with regard to the handedness factor.
By eliminating the weakest indicators, the overall validity of the EHI would increase.
However, this method was never implemented. Dragovic (2004) tried to explain in his
analysis whether all the EHI indicators should have the same value or not. He claims
that the study by R.C. Oldfield describes the scoring in the EHI by composite scoring. It
is determined by the overall sum of specific items and based on the assumption that all
items have the same weight when explaining one common characteristic. In this case,
the EHI explains the whole construct of handedness, which is expressed by hand
preference in different acts. A single-factor congeneric model of confirmative factor
analysis, where the same true-scores with different singularity and indicator error are
generated, was used in the analysis (Jöreskog, 1971). Dragovic discovered that two
items “sweeping with a broom” and “opening a box” have higher dispersion error and
the lowest factor validity (sweeping with a broom 0.43, opening a box 0.35). Dragovic
subsequently eliminated the item “drawing” from the EHI, as its factor validity was
0.96, while the item “writing”, with a factor validity of 0.98, was considered redundant.

81
This selection consequently led to better inner consistency of the whole diagnostic tool
(Dragovic, 2004).
6.1.3 Performance Tests
Motor performance compare the performance and execution quality between the
same two motor organs within one motor test. These tests represent motor activities
given to the subject by the examiner. They thus focus on immediate spontaneous
responses to commands. According to the creators of the tests, performance is directly
connected to preference. This is expressed by the fact that the preferred hand is usually
also the hand that is more powerful and skilled (Ward, Milliken, & Stafford, 1993). The
result of a performance test is the difference in the achieved test score between the right
and left limb. The data exhibit an interval nature. Performance tests are usually designed
to assess different performance of upper limbs. Given the complexity of movement
control, an assumption was made about the multidimensionality of performance, just as
in preference. A performance model was designed as far back as in the 1960s, dividing
upper limb movements into movements of distal and proximal parts (Lawrence, &
Kuypers, 1968). This study was later developed by, for example, Bryden and Steenhuis
(1989), who said that the distal part of the upper limb is apparently controlled in a
different way than the proximal part (Steenhuis, & Bryden, 1989). In his study dealing
with the diagnosis of motor manifestations of laterality using performance tests, Rigal
(1992) discovered two basic areas of these tests with four factors. The first area is
represented by performance tests, primarily focused on identifying differences in
neuromuscular activity performance/speed or neuromuscular activity/strength without
placing a demand on the fine motor skills. These tests include various forms of tapping,
i.e., a dot-filling test without space constraints from study Peters and Surrfing (1978),
grip strength (which is one of the static performance tests), or static targeting (which
hand exhibits greater stability) (Peters, & Surfing, 1978). The second area is represented
by skill performance tests of fine-motor nature that are focused on movement accuracy
(Rigal, 1992). What is assessed here is the number of errors made, the time needed, or
both (Borod, Caron, & Koff, 1984a)). The best known tests include the pegboard test
(Tiffin, & Asher, 1948), Purdue test (modification of the pegboard test with a specific
shape of the peg) (Annett, 1970 b)), dot-filling test (Tapley & Bryden, 1985), and others
(Bishop, 1990; Borod, Koff, & Caron, 1984 b)). The pegboard test was first created by
Tiffin and Asher (1948). The tool is a board with small holes for pegs. The subject’s

82
task is to insert as many pegs into the holes as possible within a specified time, first
with the preferred hand and then with the non-preferred hand (Tiffin, & Asher, 1948).
The test was later expanded by Marion Annett, who increased the difficulty of this test
by introducing pegs and holes with certain shapes so it was not possible just to insert a
peg into a hole in any way (Annett, 1970 b)). However, examiners sometimes face a
problem of imitation and short-term transfer in this performance test. This is one of the
factors of motor learning, especially in the adult population. Transfer generally implies
positive transmission of learned and proved activities in the process of motor learning.
It is based on the effect of abilities, skills, and knowledge gained in one activity being
used in another activity. Motor transfer has two basic components: a motor part and an
emotional part.
– Motor part of transfer – after the subject performs the action with the preferred
upper limb, the movement pattern is temporarily kept in the memory within the
central nervous system, due to the process of sensorimotor learning; based on
self-reflection, the central nervous system specifies the parameters for further
performance of the action.
– Emotional part of transfer – the motivation factor is the most significant factor in
this part; it is very closely related to the learning process, and affects the level of
effort to reach or even improve on the previous performance.
(Schmidt, & Lee, 2011; Schmidt, & Wrisberg, 2000)
Based on these facts, the adult subjects did not always show substantively
significant differences in the number of pegs inserted with the preferred and non-
preferred hand, not even after instruction. Moreover, due to demands on the fine motor
activity of fingers, this type of test is not entirely suitable for the children category.
Another fine motor performance hand test used is the “modified dot-filling test” (dot
circles). The main objective is to mark a dot into each circle with a diameter from 3 mm
to 8 mm using a pencil. This motor test is again performed with the preferred and non-
preferred hand (Tapley, & Bryden, 1985). With regard to the diagnosis of laterality by
means of performance tests, especially in children, part of Ozeretsky’s test that
diagnoses the maturity of the nervous system in children is also sometimes used. The
entire battery consists of six basic parts determining the level of co-ordination of upper
and lower limbs and right-left orientation. The battery also includes a test determining

83
dynamic co-ordination of upper limbs (the child throws a ball), as well as motor speed
and precision (the child moves and assembles objects) (Ozeretzky, 1931). General
characteristics and definition of handedness fine motor performance in children were
dealt with by Gabbard (Gabbard, Iteya, & Rabb, 1997).
In the Czech Republic, the assessment of different performance was performed
by Fremelová and Blahutková (2004). They created an instrument for assessing hand
fine motor perfromance and lower limb gross motor performance in the form of tapping
(Fremelová, & Blahutková, 2004).
A very interesting finding relating to the diagnosis of motor manifestations of
laterality and performance was a strong correlations between the pegboard test and the
preference task of hammering a nail, or the dot-filling test and the drawing task. This
finding supported the view that performance apparently have a complex multi-
dimensional structure; this is also the reason that the performance component is
neglected in the test batteries used (Elliot, & Roy, 1996). However, some studies point
to time demands, as well as the generally weak relationship between the constructs of
preference and performance (Porac, & Coren, 1981). Therefore, experts dealing with the
diagnosis of motor manifestations of laterality still do not want to fully accept
performance tests, and many studies supporting the preference questionnaire method
point out their uselessness. On the other hand, according to Peters, the assumption that
preference and performance are closely related is correct. He states that emphasis
should primarily be placed on the relationship between preference and performance
(quality and performance of motor organs) (Peters, 1998; Wachter, Cong, Staude, &
Wolf, 2008). In addition, the work of Elliot and Roy (1996) highlights the advantage of
monitoring a proband when performing a task, which ensures increased objectivity in
the diagnosis of laterality, compared to subjective statements in questionnaire
responses. According to Elliot and Roy, the test battery containing valid gross and fine
motor tests would enable more comprehensive diagnosis of motor manifestations of
laterality (Elliot & Roy, 1996).
An interesting view was presented by Van Strien (2002), who compared all three
methods (preference tasks, self-assessment questionnaires, and performance tests) for
the diagnosis of motor manifestations of laterality with an emphasis on the assessment
of upper limb laterality. Based on research, the author states that the best method is to
use a questionnaire whose items exhibit the highest reliability (Van Strien, 2003).
However, the study does not deal with issues such as collinearity of items and artificial
84
overestimation of diagnostic quality, which is probably caused by including specific
instrument items adapted to the needs of right-sided society.
Within the multifactorial issue of motor manifestations of laterality, gross motor
performance and fine motor performance are as yet not fully elucidated. The authors
are particularly faced with the problem of determining which of the dimensions is the
most important for the diagnosis of motor manifestations and why (Elliot, & Roy 1996).
6.2 Evaluation of Cerebrall Dominance, New Approach for
Approximation of Hemispheric SuperiorityIn addition to the aforementioned traditional approaches to the assessment of motor
manifestations of laterality, which are often used to determine the dominant cerebral
hemisphere, this section of the thesis outlines a possible new approach. It is the
determination of cerebellar dominance, which, according to Professor Henner’s
hypothesis, should be directly related to motor manifestations of laterality or
hemispheric superiority.
The cerebellum is one of the most important areas of the brain, playing a key
role in motor control. The cerebellum itself does not initiate movement, but decides
about and contributes to the co-ordination, precision, accuracy, and timing of
movement. The cerebellum receives inputs from the sensory system and from other
parts of the brain and spinal cord. This is information from muscles concerning
corticospinal activity and almost simultaneously also information from proprioreceptors
concerning the resultant muscle movements. The cerebellum then compares this
information with information coming from the eye, ear, and tactile receptors, and
integrates the inputs into the final motor activity (Barlow, 2002). It is very interesting
that the cerebellum itself contains more synapses than the rest of the brain together
(Llinas, Walton, & Lang, 2004).
As mentioned in section 2.2, the cerebellum is composed of three basic
functional parts. The oldest and the smallest is archicerebellum, which forms the
flocculonodular lobe. This part processes information from the vestibular organ and
controls posture. Its removal would result in an inability to maintain upright stance, as
well as gait disorders. The medial part of the anterior and posterior lobe of the

85
cerebellum forms paleocerebellum, which processes tactile, proprioceptive, visual, and
auditory input signals coming from the spinal cord and from both the auditory and
visual system. Fibres from the paleocerebellum lead to both the cortex and the
brainstem. This part of the cerebellum activates the descending inhibitory system of the
reticular formation, and is responsible for maintaining muscle tone and limb
movements. The lateral zone contains the youngest part, the neocerebellum, which is
connected with motor areas. The neocerebellum particularly receives inputs from the
cortex of the parietal lobe. Outputs are then sent mainly to the ventral part of the
thalamus to the contact motor area – the premotor and primary motor areas. All three
parts of the cerebellum (the archicerebellum, the paleocerebellum, and the
neocerebellum) work as one functional unit (Fine, Ionita, & Lohr, 2002).
Similarly to the telencephalon, the cerebellum consists of two hemispheres. Each
cerebellar hemisphere is in contact with the contralateral cerebral hemisphere. Since the
motor cortex of the brain controls movements of the opposite half of the body through
the pyramidal tract, double crossing occurs (in the pyramidal tract and in the superior
cerebellar peduncle). Therefore, either cerebellar hemisphere controls voluntary
movements on the ipsilateral side of the body (Čihák, 2001; Fine, Ionita, & Lohr, 2002).
During intentional targeted movements, the cerebellum integrates information about the
plan, initiation, course, and aim of the movement. Based on this information, together
with close co-operation with the extrapyramidal system, the cerebellum continuously
performs fine control of muscle tension. In addition, the cerebellum is particularly
involved in the control of eye movements (Prsa, 2010). It was discovered that the
cerebellum also contains “memory circuits” that seem to be responsible for recalling
events, i.e., previously performed motor patterns (Barlow, 2002). Subsequent research
has also shown that memory circuits are related to the motor and cognitive subregions
of the cerebellum (Ding, Qin, Jiang, Zhang, & Yu, 2012). Therefore, within the
movement control, the cerebellum is also involved in the process of motor learning. In
this research, which is currently producing hypotheses on the possible structure and
principles of motor learning, adaptation to changes in sensorimotor relations is one of
the best known types of learning. This learning process is explained by the term
“synaptic plasticity within the cerebellum”. This hypothesis of synaptic plasticity is
referred to as the Marr-Albus theory (Ito, 1982; Sanger, 2003). Destruction or removal
of the cerebellar area does not lead to a complete physical paralysis of an individual, but
results in inability with regard to motor learning, fine motor activity, and balance (Wolf,

86
Rapoport , & Schweizer, 2009). With regard to motor activity, such an individual is not
able to perform, for example, continuous limb movement in space (Schmahmann,
2004).
Interestingly, removal of only one cerebellar hemisphere does not result in
permanent and irreversible loss of the complex function of the cerebellum, but in
gradual compensation and significant improvement in functional manifestation. In the
event of damage to the cerebellar hemispheres, wide base gait, also called “drunken
gait”, with considerable accompanying upper limb movement, can be observed (Tichý
et al., 1997). Dysarthria, i.e., apraxia of speech, where only basic gross movements of
speech organs are preserved, is another symptom of cerebellar disorders, especially in
lesions.
The connection between the function of the cerebellum and motor manifestations of
laterality was first assumed by Professor Kamil Henner. Given that the neocerebellum is
responsible for the control of muscle tone, Henner (1927) points out “neocerebellar
extinction syndrome”. As a result of cerebellar hypotonia of one of the cerebellar
hemispheres, neocerebellar extinction syndrome manifests itself in increased muscle
hypotonia, passivity, and increased joint extensibility. The cerebellar hypotonia can be
observed in humans during walking, and it is manifested by a more noticeable
accompanying arm movement on one side of the body. According to Henner, the
neocerebellar syndrome should be well detectable in joints. Based on these findings, he
pointed out the existence of physiological extinction syndrome (Henner, 1927).
Subsequently, he identified slight left-sided neocerebellar extinction syndrome in right-
handed individuals in his clinical studies (Henner, 1936). Since the pathways from the
motor centres of the cerebral cortex lead to the cerebellum contralaterally, a model was
proposed that considers the cerebellar hemisphere which is on the ipsilateral side of the
preferred upper limb as dominant (Henner, 1927; Tichý et al., 1997; Tichý, & Běláček,
2009). Apart from the assumption about the relationship between cerebellar dominance
and upper limb preference, Tichý and Běláček (2008) attempted to reveal the
relationship between cerebellar dominance and lower limb preference. However, no
significant relationship was found, probably also due to the selection of the tests (Tichý,
& Běláček, 2008). Nonetheless, diagnosis of cerebellar dominance could help in the
assessment of natural hemispheric dominance without the influence of the right-sided
world phenomenon.

87
7. EMPIRICAL RESEARCH
The aim of this study is to contribute to the standardization of the new diagnostic
tools assessing the motor manifestations of laterality in adults and children aged 8 to 10
years, both in terms of determining the theoretical concept and the selection of
appropriate items, and the verification of structural hypotheses concerning the design of
acceptable models, including the diagnostic quality of individual parts of the test
battery. Moreover in this study we try to suggest new approach in assessing of motor
laterality manifestation by means of relationship between cerebellar dominance and
hand performance. In order to fulfil this objective it was essential to determine in detail
the area of motor manifestations of laterality. Therefore, it was necessary to base the
study on extensive theoretical knowledge that shows motor manifestations of laterality
as a multidisciplinary concept.
The conclusions of this thesis should become the basis for the completion of the
diagnostic tools necessary for a wide range of disciplines (neurology, psychology,
kinanthropology, special education, phoniatrics).
In the past, the diagnosis of motor manifestations of laterality was most often
associated with the determination of hand preference. Any potential case of determined
left-handedness represented a deviation and implied a certain disorder. Until recently,
left-handedness was a serious social handicap, and there was a tendency to retrain the
left-handed individuals to become right-handed. This trend did not appear only in this
country, but also abroad (Annett, 2002; Beaton, 2004; Porac, & Martin, 2007). In some
societies, this phenomenon is quite common even today (Bryden, Mandal, & Ida, 2000).
If innate laterality is retrained, entire structures can be moved in the brain, which
may lead to a variety of specific disorders (Robinson, & Downhill, 1995). It may result,
for example, in a decline in intellectual performance. Studies in psychodiagnostics also
suggest that, apart from retraining, other environmental factors may change relations in
the cerebral architecture (Annett, 2002). Research also shows that people also differ in
speed and intensity of the lateralization process. Especially with regard to children,
apart from early and highly lateralized individuals, those displaying slow lateralization
and weak intensity were also observed. There is a risk of disorders of speech, reading,
and concentration (Gabbard, 1992; Medland, Perelle, De Monte, & Ehrman, 2004;
Żebrowska, 1987).

88
In the former Czechoslovakia, the issue of laterality and its diagnostics was dealt
with in the second half of the 20th century by studies focusing on mental disorders as a
result of the retraining of naturally left-handed individuals (Sovák, 1958; Sovák, 1962).
As stated in section 6.1.2, the most common tools used in the world to diagnose
motor manifestations of laterality are questionnaires, which are primarily intended for
the adult population. The best known questionnaires include the Edinburgh Handedness
Inventory (Oldfield, 1971), the Waterloo Handedness Questionnaire (Bryden, 1977),
and the Annett Handedness Questionnaire (Annett, 1970). Preference questionnaires
were also created by other authors (Coren, 1993; Dean, 1988; Elias, 1998; Kovac, 1973;
Porac & Coren, 1981; Raczkowski, 1974; Sharman, Kulhavy, 1976;and others).
In the Czech Republic, the best-known diagnostic tool is a set of preference
tasks called “Zkouška laterality” (Laterality Test) (Matějček, & Žlab, 1972), created in
the early 1970s, which measures upper and lower limb laterality and ocular dominance
in both children and adults.
However, most of the aforementioned diagnostic tools are only designed to
detect preference (Donaldson, & Johnson, 2006). When a more detailed analysis of
these diagnostic tools was conducted, some basic methodological and psychometrics
problems were discovered (Musálek, 2011).
With respect to field research, the aforementioned diagnostic tools have been
used almost unchanged since the 1970s.
Disciplines such as psychodiagnostics, kinanthropology, psychology, and
neuroscience indicate the need for innovation and completion of diagnostic tools to
determine laterality. Currently, there are tests that are fragmented, incomplete, and
created exclusively for the needs of clinical practice. Moreover, tests to diagnose motor
manifestations of laterality in the Czech Republic have not been honed for many years.
With respect to the risk population of children aged 7 to 12 years, diagnostic tools have
not been created that would adequately differentiate individuals’ lateralization. Thus,
the development and standardization of tests for the diagnosis of motor manifestations
of laterality has long been neglected in the Czech Republic.
The standardization process will be based on existing questionnaires and
preference tasks intended to diagnose preference, as well as on motor performance tests,
even non-validated. The set of items will be enriched by other assessable indicators
focused on the field of task preference and test performance. An indicator for estimating
cerebellar dominance will also be created. Based on the implementation of this indicator

89
in the test battery, the hypothesis concerning the relationship between cerebellar
dominance and motor manifestations of upper limb laterality will be subsequently
tested. The verification of this hypothesis could help identify natural hemispheric
dominance.
We expect that this broad concept of laterality examination will be beneficial:
a) to conducting a comprehensive diagnosis of motor manifestations of laterality in
children, including the diagnosis of retrained individuals and unsuccessful
individuals with good and above-average abilities (Beaton, 2004; Mori, Iteya &
Gabbard, 2006; Synek, 1991);
b) to diagnosing conditions after neurosurgical interventions, and to diagnosing other
manifestations related to hemispheric dysfunctions (McManus, 2002; Nobuyuki,
2005);
c) to facilitating the selection of candidates for demanding professions and sports
disciplines (Carlstedt, 2001).

90
8. RESEARCH QUESTIONS
The previous studies dealing with the development of diagnostic tools to assess
the motor manifestations of laterality did not always choose adequate methodology. In
addition, the statistical procedures used to express the structure and dimensionality of
these instruments are now obsolete. Within the test battery construction, very few
studies dealt with the connection of larger units of laterality diagnosis and the creation
of a multi-level diagnostic tool. With respect to the finding of the link between
cerebellar dominance and motor manifestations of laterality, there are only sporadic
attempts that do not offer a broader interpretation. Therefore, the following scientific
questions are addressed:
- What is the diagnostic quality of all items (both existing and newly created)
used to diagnose motor manifestations of laterality?
- Which empirical indicators should be chosen to determine the individual
constructs of handedness and footedness using motor performance tests?
- Does it exist significant relationship between hand performance and
cerebellar dominance?

91
9. HYPOTHESES
H1: At least 75% of the items in both final forms of the test batteries (for adult and child
populations) will exhibit the factor validity of at least 0.6, based on the structural
equation modelling method.
H2: The best models of the individual parts of the test battery for both the child and
adult populations will exhibit multidimensionality.
H3: The generic reliability of individual constructs will be at least 0.75.
H4: The factor loading of the indicator assessing cerebellar dominance in relation to the
upper limb performance factor will be significant in both test batteries, reaching the
level of p < 0.001.
H5: Statistically significant relationship to the assessment of upper limb preference in
the child population reaching the level of p < 0.001 will be represented by
indicators in which the subjects will also have to work across the natural axis of the
body.
The individual values of the coefficients in the hypotheses were chosen based
both on previous research (Dragovic, 2004; Dragovic, & Hammond, 2007) and on
accepted standards of validation studies and structural equation modelling (Kline,
2011).

92
10. METHODS
The entire chapter (including all the subchapters) deals with the issue of the
standardization study, or more precisely with the parts that are used in this thesis. We
will focus on the definition of the theoretical concept, the selection of items and
research sample, and the expression of the diagnostic quality of individual parts of the
test battery. Given the scope of the thesis, the issue of the creation of standards is not
discussed here.
Based on their character, standardization studies fall into “tightly structured
research”. They come mostly from the field of quantitative research, which firmly
determines the structure of the research plan with clear and specific research questions,
clear conceptual framework, and structured scheme (Punch, 2008). In this case, the
actual design of the research plan is the most critical point of the entire research process
(Brink, & Wood, 1994).
In order to form the test batteries within the standardization procedure, we used
the principles of psychometry, which is a theoretical and interdisciplinary tool for
creating high-quality diagnostic methods (Michell, 1997).
10.1 Definition of Theoretical ConceptThe theoretical concept represents an indirectly measurable characteristic that
determines the field and objective of investigation. The theoretical concept is sometimes
also called a “hypothetical construct” or “behavioural domain” (Furr, & Bacharach,
2008). Within the standardization process, the definition of the theoretical concept, i.e.,
the exact demarcation of the field of research, is probably the most important part. In
order to determine the theoretical concept, analyses and syntheses of scientific theories
concerning the given field are used. Definitions and classifications concerning the issue
are reviewed (Anderson, & Gerbing, 1982; Štochl, & Musálek, 2009). It is also
important to determine the possible structure of the theoretical concept, i.e., to
determine which specific concepts (empirical attributes) of indirectly measurable
smaller units the theoretical concept is composed of (Cronbach, & Meehl, 1955;
Takane, 2007). This is based on the analysis of the current diagnostic tools used to

93
evaluate the theoretical concept. This has to be complemented with the specification of
the tools, i.e., which population they are intended for, and what psychometric properties
they exhibit (validity, reliability). After reviewing the theories related to the research
problem, defining the parts of the theoretical concepts and diagnostic tools that are
suitable for our research, and identifying the research design, it is possible to conduct
high-quality specification of the theoretical concept. The theoretical concept, even if
only indirectly measurable, must be defined by the researcher in an operationalized way
as a latent variable representing the objective of investigation (Byrne, 2001; Štochl &
Musálek, 2009).
Based on the study of the theoretical foundations, in order to define the
theoretical concept, we first determined the most important concepts – the cerebral
hemispheres, the activity of the central nervous system, motion control, motor
pathways, muscular activity, laterality, the preferred use of a motor organ, skill,
accuracy. The theoretical concept represents the field of research concerning
neuromuscular activity controlled by the brain and projected in motor organs. During
the biological development of the individual, the neuromuscular activity exhibits a
certain development which particularly depends on the maturation of the central
nervous system. The projection of the motor activity displays a noticeable difference in
the use of the motor organ, i.e., preference. In addition, it is also possible to observe a
different quality of performing the movement by both paired motor organs, i.e.,
performance in gross motor and performance in fine motor activity. In order to specify
the basic structure of the theoretical concept, we determined two subfields – preference
and performance. The entire field of the theoretical concept is currently being measured
by different types of diagnostic tools. These include questionnaires, preference tasks,
and performance tests (see sections 6.1.1, 6.1.2, 6.1.3), focusing especially on the motor
activity of motor organs. In order to demarcate the theoretical concept, we only used
those tools that displayed diagnostic quality. Based on all the aforementioned
information, we have defined the theoretical concept: “motor manifestations of
laterality”.

94
10.2 Determination of Specific Theoretical ConceptsWith respect to the empirical research, it is necessary that data in the form of
manifest variables is directly related to the concepts, and that this connection is tight,
logical, and consistent. It is very common that a set of manifest variables (tests, items,
tasks) reflects more than one attribute within a theoretical concept. In this case, the
theoretical concept consists of a number of specific concepts, and the structure of the
theoretical concept defined by us displays a multidimensional nature. Within the
multidimensional structure, the indicators (tests, tasks, items) are not directly related to
the theoretical concept as a general attribute. In this case, it is necessary to determine
the specific concepts that are directly related to the indicators and that the general
attribute consists of. The combination of the indicators and the theoretical concept
(general attribute) is then indirect – through specific concepts (Punch, 2008).
As mentioned in section 10.1 (Definition of the theoretical concept), two specific
concepts of preference and performance were initially established for motor
manifestations of laterality. Each of these specific concepts was then further divided
into two areas that will be directly related to the observable variables – indicators. In
total, the theoretical concept has thus been divided into four specific concepts:
upper limb preference
lower limb preference
upper limb performance
lower limb performance
The assessment of ocular dominance using the sighting factor forms a separate
part which will be conducted through a single indicator.
Based on the findings of the theoretical part, all specific concepts were
determined to be latent variables that are continuous in nature, i.e., they allow the
assessment of different levels of the investigated trait. In our case, this trait is
represented by sidedness – right-sidedness or left-sidedness. The assessment of motor
manifestations of laterality is thus based on the continuum from the strong left-
sidedness to the strong right-sidedness.

95
10.3 Determination of Structure of Diagnostic ToolOn the basis of the definition of the theoretical concept and specific concepts,
the concept of the diagnostic tool is subsequently determined. This concept is always
based on currently accepted hypotheses and the nature of the created diagnostic tools. In
determining the concept of the future diagnostic tool, the shortcomings of the previous
tools and proposals for new procedures are particularly taken into account for the
assessment of the attribute (Butcher, Graham, Haynes, & Nelson, 1995).
In this thesis, we determined the concept of two test batteries for both the adult
and child populations. The concept of both test batteries has the same basis, i.e., an
assessment of preference and performance of motor organs with the quantification of
ocular dominance. Based on the ontogeny of cognitive functions and human motor
activity, with respect to the adult population, we decided to use a test battery that would
assess the motor manifestations of laterality in three ways. The first part of the test
battery, which will display the screening nature, will form a short questionnaire
(containing no more than ten items) determining upper and lower limb preference. This
part should identify the basic lateral trend of adult individuals.
The second part of the test battery will consist of up to eight motor tasks
determining upper and lower limb preference. The tasks (in the form of spontaneous
motor activity) should specify the lateral trend of preference. This part of the test battery
will also determine ocular dominance using a motor task.
The third part will include performance tests that will assess differences in the
performance of both upper and lower limbs. It will contain up to eight indicators. An
indicator determining cerebellar dominance will also be implemented in this part of the
test battery. The test battery for the diagnosis of motor manifestations of laterality in the
adult population will not contain more than 26 indicators. Based on the consultation
with the Institute of Pedagogical and Psychological Counselling, the time of diagnosis
should not exceed 20 minutes.
Due to the lower levels of self-perception with respect to lateral manifestations,
the test battery designed for the child population aged 8–12 years will not contain the
questionnaire part and will assess motor manifestations of laterality in two ways.
The first part of the test battery will consist of up to twelve motor tasks for
assessing upper and lower limb preference. Based on the motor task focused on the eye
sighting factor, ocular dominance will be determined.

96
The second part of the battery will include performance tests that will assess
differences in performance of both upper and lower limbs. This part will contain up to
eight indicators, including an indicator determining cerebellar dominance. The entire
test battery for the diagnosis of motor manifestations of laterality in the adult population
will not contain more than 20 indicators. Based on the consultation with the Institute of
Pedagogical and Psychological Counselling, the time of diagnosis should not exceed 15
minutes.
10.4 Creating a Complete List of Relevant ItemsThe most important step is the selection of appropriate indicators (manifest
variables) for the measurement of individual specific concepts (Loevinger, 1957). It is
very important that each specific concept is measured using a sufficient number of
manifest variables (Clark, & Watson, 1995). The selection of indicators already used in
the diagnosis is performed according to the results of already standardized tests whose
validity and reliability are known. In addition to the indicators selected in this way, the
list should also contain newly created indicators. New approaches to the evaluation of
the theoretical concept should be based on the currently accepted scientific theory of the
issue studied. With respect to the selection and creation of new items, it is very
important to take into account which population the diagnostic tool is intended for
(Štochl, & Musálek, 2009).
The creation of a list of relevant items was based on the batteries and individual
indicators already standardized, as well as on the ontogeny of human motor activity and
maturation of the human central nervous system.
The test battery designed for the adult population.
The list of relevant items for the creation of the questionnaire part of the test
battery primarily consists of indicators that display the nature of unimanual tool
questions. These are items that reflect the motor activity of common everyday activities.
The preferential tasks for upper and lower limbs represent activities of a
unimanual nature. It is not necessary that the subjects have experience of the activities.

97
When selecting preferential tasks, particular emphasis was laid on the simplicity and
low material requirements of the motor tasks.
In order to determine the different performance of upper and lower limbs,
performance tests are based on both gross and fine motor activity. In order to determine
the level of the upper limb fine motor activity, tests for separate involvement of the
distal part as well as for the joint involvement of proximal and distal parts have been
used and developed.
The indicator for determining cerebellar dominance is based on the
determination of the level of articular passivity in the wrist.
The test battery designed for the child population.
Preferential tasks for upper and lower limbs focus on motor activity of a
unimanual nature. Relevant indicators for the upper limb in the part containing
preference tasks are primarily focused on motor activity where the proband will work
across the natural body axis. During the selection and creation of preference tasks,
particular emphasis was laid on the simplicity and low material requirements of the
motor tasks.
In order to determine the different performance of upper and lower limbs,
performance tests are based on both gross and fine motor activity. In order to determine
the level of the upper limb fine motor activity, tests for separate involvement of the
distal part as well as for the joint involvement of proximal and distal parts have been
used and developed.
The indicator for determining cerebellar dominance is based on the
determination of the level of articular passivity in the wrist.
The complete list of relevant items for the creation of the test battery for the
adult population contained 75 indicators assessing motor manifestations of upper limb
laterality, 34 indicators assessing motor manifestations of lower limb laterality, and 1
indicator assessing the sighting factor of ocular dominance. The list of relevant items
for the creation of the test battery for the child population contained 51 indicators
assessing motor manifestations of upper limb laterality, 22 indicators assessing motor
manifestations of lower limb laterality, and 1 indicator assessing the sighting factor of
ocular dominance.

98
10.5 Content ValidityContent validity of indicators determines to what extent these indicators are
likely to reflect, by their importance and content, the indirectly measurable and specific
theoretical concept (Carmines, & Zeller, 1991; Ebel, & Frisbie, 1991). In other words,
content validity is the extent to which individual elements (tests, items) of a diagnostic
tool are relevant for assessing the intended concept (trait), for a specific purpose (Polit,
& Beck, 2004; Wynd, Schmidt, & Schaefer, 2003). It is essential to realize that the
relevance of the diagnostic tool may vary depending on the function of the assessment
(Messick, 1993). According to some authors, the phrase “to which extent” in defining
“content validity” is an indicator that content validity has a quantitative basis (Haynes,
Richard, & Kubany, 1995; Lennon, 1956). According to McDonald (1999), in assessing
the content of individual indicators, it is important to conduct a conceptual analysis,
which is an important prerequisite for acceptable validity of manifest variables. The
semantic content of these directly measurable variables should correspond with the
general attribute and specific concepts that form the conceptual framework of the entire
diagnostic tool and that are objectives of our research (McDonald, 1999).
The assessment of the content validity of indicators is conducted using the
“expert survey” (Lawshe, 1975; Lynn, 1986; Mastaglia, Toye, & Kristjanson, 2003).
One of the frequently used methods for determining the content validity of indicators is
C.H. Lawshe’s. This method is based on the agreement between independent panellists
(experts) who, based on their knowledge of the issue, decide the extent of the
fundamental importance that a certain item has for the reflection of the construct
(Lawshe, 1975). In his study, Lynn (1986) suggests ensuring at least three independent
experts. These panellists should form a heterogeneous group, each of them seeing the
issue from a different perspective (Štochl, & Musálek, 2009). The panellists are first
asked whether a certain indicator measures the specified trait. Their second task is to
assess the extent to which this indicator is essential to express the concept. This can be
achieved by using a scale (mostly the Likert scale) whose selected values describe the
strength of the content relationship between the indicator and the concept (Clark, &
Watson, 1995; Štochl, & Musálek, 2009;). In his study, Lawshe notes that the more
panellists determine an item as essential and having a strong relationship to the
expression of the theoretical concept, the greater content validity the item has. Lawshe
expressed this dependence mathematically:

99
)2
(
)2
(
N
NnCVR
e
CVR ....content validity
ne .........number of panellists that viewed the item as essential
N .........total number of panellists
Based on this mathematical expression for determining the content validity of
indicators, the following table with recommended values of panellists’ conformity was
proposed:
Table 1
Reccommended values of panelists conformity
(Lawshe, 1975, p. 568)
Number ofPanelists
MinimumValue
5 .996 .997 .998 .859 .7810 .6211 .5912 .5613 .5414 .5115 .4920 .4225 .3730 .3335 .3140 .29

100
When creating a scale assessing the content validity of indicators, two types of
scales were considered: a scale with an even number of options and scale with an odd
number of options. According to Davis (1992), it is generally advisable to have an
ordinal scale with 4 categories. The researcher thus prevents a situation where the
expert notes that the item displays a neutral character of relevance towards the construct
(from the character 1 – not acceptable, to the character 4 – highly relevant). Based on
the results, the indicators are selected from categories 3 and 4 (Davis, 1992).
In our case, in order to assess the content validity of indicators, we finally
decided to create the five-point Likert scale which did not contain a neutral option and,
simultaneously, displayed a fine distinction between individual degrees of the
indicators’ content validity with regard to the defined theoretical concept:
1. the indicator does not measure the theoretical concept at all
2. the indicator measures the theoretical concept weakly
3. the indicator measures the theoretical concept
4. the indicator measures the theoretical concept strongly
5. the indicator measures the theoretical concept very strongly
In order to assess content validity, the lists of relevant indicators for both the
adult and child populations were sent to six experts from different disciplines related to
the motor manifestations of laterality. The following disciplines were used: special
education, neurology, psychiatry, anthropomotorics, kinesiology, and neurophysiology.
All experts were informed of the aim of this thesis, and in addition to the assessment of
the indicators’ content validity, the experts were asked to specify whether the indicator
is appropriate in the form of the question in the questionnaire, motor task, or motor test.
This specification was conducted by the experts by assigning shortcuts to the indicators:
Q question in the questionnaire
PT preference task
PET performance test
When assessing the content validity, the fact whether the indicator represents a
spontaneous activity or activity that is currently subject to social pressure was also taken
into account. The lists of items were sent to the experts repeatedly, three times in total.
The lists were always re-sent to the experts 14 days after returning the previous
assessment. In order to determine the most appropriate content items, we used the

101
method of conformity developed by Lawshe (1975). The calculation of conformity was
carried out according to the formula)
2(
)2
(
N
NnCVR
e (Lawshe, 1975). Subsequently,
we selected the indicators where all experts repeatedly agreed on the value of 5. Then
we incorporated the indicators where more than half of experts agreed on the value of 5,
but other panellist(s) assigned the value of 4 to this item. The last part of the indicators
included in the creation of the test batteries was represented by items to which all the
panellists assigned the value 4.
10.6 First Version of Test BatteriesBased on the results of the previous section (10.5), the first version of the entire
diagnostic tool was created. It contains all the indicators that in the process of content
validity were identified as relevant and essential with respect to the assessment of the
defined theoretical concept. At this stage of the creation of the diagnostic tool, it is
necessary to have a sufficiently large number of indicators for the assessment of the
attribute and its specific parts. Within the standardization procedure, it is very likely
that, based on statistical techniques, their number will be reduced (Štochl, & Musálek,
2009). With respect to the items that display the character of a question in the
questionnaire, it is necessary to decide which scale the answers will be scored on, i.e.,
whether, for example, the Likert scale will be used, and how many points it will have.
Along with this, it is also important to determine whether the scale will have an odd or
even number of points, and verify, based on a scientific theory, whether the respondents
from the selected population are able to distinguish between different levels of response
options (Furr, & Bacharach, 2008).
In the test battery for the diagnosis of motor manifestations of laterality in the
adult population, the following numbers of indicators were selected, based on the results
of content validity: 15 indicators for the questionnaire part, 16 indicators for the part
containing preference motor tasks, and 15 indicators of performance tests. In total,
46 indicators were selected.

102
In the test battery for the diagnosis of motor manifestations of laterality in the
child population, the following numbers of indicators were selected, based on the results
of the content validity: 22 for the part containing preference motor tasks and 14
performance tests. In total, 36 indicators were selected.
In order to answer the questions in the questionnaire part of the test battery for
the adult population, the five-point Likert scale was created. With respect to the
question assessing upper or lower limb preference, the respondents selected from the
following options:
1 = I always use my left upper/lower limb.
2 = I prefer to use my left upper/lower limb.
3 = I don’t have a preferred limb for this activity.
4 = I prefer to use my right upper/lower limb.
5 = I always use my right upper/lower limb.
Many authors use this five-point scale (Bryden, 1977; Oldfield, 1971; Sharman
& Kulhavy, 1976), but only Bryden (1977) dealt with the instructions to differentiate
between individual degrees in a more detailed way. Bryden (1977) attempted to separate
the degrees of preference in terms of percentage, i.e., if a person uses one limb in 95%
or more of the activities, he/she selects the option “always”; if a person uses the limb at
about 75% of the activities, he/she selects the option “usually” (Bryden, 1977). The
question is whether the proband is able to determine the percentage in activities that are
not so familiar and automatic. Since we believe that probands are not able to determine
exactly the percentage of their limb use, we conceived this division of individual
degrees of preference differently. First, we did not use the word “usually”, but
rephrased the option using the expression “prefer”. This means that the proband has
encountered a situation in regular activity when he/she used the non-preferred limb
spontaneously (except for situations involving injury and inability to use the preferred
limb). However, the involvement of the non-preferred limb is isolated, and the use of
the preferred limb to perform the activity is more natural. The answer “I don’t have
a preferred limb for this activity” means that the proband spontaneously uses both
paired limbs in the activity. It is natural to use both the right limb and the left limb to
perform the activity, and the performance exhibits the same quality in both cases.
Instructions specified in this way differ from the current concept, and they try to explain

103
degrees of preference to the respondent individual. Each of the answers in this part of
the test battery is a directly observable variable that takes the form of ordinal data.
Motor tasks assessing upper and lower limb preference in both the adult and
child populations are directly observable variables that are scored dichotomously
(whether the individual performs the activity using the right or left limb). Since in this
study they have the character of latent variables of continuous nature, the
dichotomously scored, directly observable variables can be considered ordinal data
(McDonald, 1999; Muthén, 1984). In order to express the degree of preference, some
motor tasks include more repetition (e.g., repeated throwing or kicking at a target). In
this case, despite the dichotomous scoring of individual attempts, the data are
polytomous in the overall view. Using these three attempts, the individual can achieve
more than two different scores.
Performance tests are continuous, directly observable variables the results of
which are data of an interval nature. Motor performance tests are divided into two types
in this thesis. The first type includes the tests in which time represents a constant (e.g.,
the test is performed for 30 seconds). In indicators where time was used as a constant,
the duration of the test had to be determined. The second type includes tests where time
is not a constant (e.g., the test is performed until it is completed, based on the specified
rules). The resultant scores in individual tests that expressed the degree of laterality
were obtained from the calculation of the difference in the performance of the right limb
and the left limb.
10.7 Verification of Intelligibility of ItemsThe aim of this part of the standardization procedure is to verify the clarity of the
indicators (questions, tasks or tests) in their text form for the intended population. It
includes, for example, the wording of a question in the questionnaire or a request to
perform motor activity. The verification of clarity is performed using a pilot sample of
the population. A sufficient sample is represented by 20 individuals. The participants in
the pilot study are first asked to express their opinions on the individual items of the
first version of the diagnostic tool, in terms of clarity, difficulty or simplicity of an item
or a technical solution, including feelings during performance (Štochl, & Musálek,

104
2009). The verification procedure concerning the items’ clarity may be repeated several
times with independent pilot samples (Moore, & Benbasat, 1991).
The clarity of the items in the first version of the test battery was assessed in
both the adult and child population in the pilot set containing 25 representatives of the
adult population and 25 representatives of the child population. The pilot set for the
adult population consisted of the students of the master’s degree programme at the
Faculty of Physical Education and Sport, Charles University, field of study Physical
Education and Sport. The pilot set for the child population consisted of the students of
the Albrechtická Primary School in Kbely, Prague 9.
The adult population displayed problems with the clarity of the questionnaire
part where the probands were not able to clearly distinguish between the 5th and the 4th
option, and the 1st and the 2nd option. The most significant problem in the clarity was
found in the pilot samples of both populations in the performance test part. Apart from
the problems with understanding the assignment and subsequent execution of motor
activity, shortcomings were identified in the objectivity of the test assessment,
especially in fine motor activity of the lower limb in children. Based on the feedback
and analysis of these shortcomings, the instructions in the questionnaire part of the test
battery designed for the adult population were modified. The instructions and
requirements of the problematic indicators in the performance tests, in both test
batteries, were also modified.
10.8 The Research Sample and Its SizeThe size and specification of the research sample is one of the fundamental
questions of standardization studies (Peers, 1996).
In order to determine the research sample size it is important to specify the
margins of error of the items that are the most important for the evaluation of the
theoretical concept (Cochran, 1977). In quantitative types of research, a hypothesis is
generally accepted that a 5% margin of error for categorical data and a 3% margin of
error for continuous data is acceptable (Krejcie, & Morgan, 1970). A very difficult part
of determining the research sample size is an estimate of the variance in the most
important variables. Some of the other ways of determining the research sample size
include the use of the results of studies with the same or a similar number of probands

105
(Cochran, 1977), or compliance with the recommended minimum values of research
sample sizes given in the table from the study by Bartlett, Kotrlik, and Higgins (2001),
which contains values for both continuous and categorical variables (Bartlett, Kotrlik, &
Higgins, 2001).
Fig. 7 Recommended values of research sample size (Bartlett, Kotrlik, & Higgins,2001, p. 48)
One of the accepted standards in standardization studies, where methods such as
structural equation modelling are used for data analysis, is to test one item by at least
fifteen independent measurements (Loehlin, 2004; Hair, Anderson, Tatham, & Black,
1995). Some authors suggest that for a quick estimate of the research sample size it is
necessary to have at least 50 probands more than eight times the variables used (Kaplan,
2009). Barrett (2007) emphasizes, apart from the minimum research sample size (which
should contain more than 200 individuals according to him), the homogeneity of the

106
research sample that should be ensured based on a scientific theory from the demarcated
area of the theoretical concept (Barrett, 2007).
The specification of the research samples was based on two fundamental
aspects:
The first was the need for diagnosis, especially in the child population, which
could reveal the cause of possible specific disorders.
The second was the practical aspect of availability of the research sample. The
selection area of our research sample was the City of Prague. We based the selection on
the results of studies which suggest that the ratio of left-sided and right-sided normally
developing individuals in many populations is 1:9. Therefore, we do not assume that
this ratio would be currently different in different parts of the Czech Republic. The first
research sample consisted of children aged 8 to 10 years. At this age, the lateralization
process is still at the fixing phase, and it is a period with a very high occurrence of a
variety of specific disorders. The second research sample was represented by young
people aged 17 to 19 years. At this age, the lateralization process is already completed,
and the test battery can be used to diagnose adults. The probands representing the child
population were individuals from state primary schools of the City of Prague which had
no specific specialization (arts, technology, sports, languages), and their classes
contained no integrated children. The probands representing the adult category were
students of Prague general upper secondary schools without a specific specialization
(arts, technology, sports, languages). When determining the sample size, the procedure
proposed by Kaplan (2009), i.e., eight times the indicators used plus 50 probands, was
used as the basic estimation (Kaplan, 2009).
Adult population:
434
508*48
ssss
Child population:
338
508*36
ssss
As both interval and ordinal data occur in the assessment in both test batteries,
we compared the calculated values with the table presented by Bartlett et al. (2001),
based on the 3% margin of error for interval data and the 5% margin of error for ordinal

107
data. The research sample size we specified in the confidence interval of 95% in the
table (p = 0.05) was consistent with the previous calculation. The final research sample
size for the adult population was set at 440 probands. Due to availability, the research
sample size of the child population was eventually adjusted to 400 probands.
In order to support the selection, we used a complete list of primary schools and
four-year and multiple-year general upper secondary schools from the City of Prague
which we obtained at the Institute of Educational and Psychological Counselling. With
respect to the complexity of a randomized selection of probands from Prague schools
and accurate definition of the area of the City of Prague, we decided to obtain both
research samples based on the method of purposive sampling which met the following
conditions. In co-operation with the Institute of Educational and Psychological
Counselling, both secondary and primary schools from each district of the city were
selected. As we set the number of the tested individuals at one school to 40, only those
schools that were attended by at least 50 individuals of the given age were selected. Out
of these schools, a list was created from which one primary school and one secondary
school were randomly selected from each district of Prague. In total, 10 primary schools
and 11 secondary schools were selected. Due to the large number of items in both test
batteries, we subsequently decided to divide both research samples into two halves.
Each part of the research sample of the adult population included 220 individuals. Each
part of the research sample of the child population included 200 probands. Furthermore,
two versions of the test battery were also created for each population. Several of the
strongest identical indicators, chosen based on the results of the content validity, were
incorporated in both versions. Other indicators were different in both versions.
10.9 Final versions of Test Batteries Before Collecting the Data
A) ADULT POPULATION:
Questionnaire:
Based on the results of the content validity, the following 4 strongest indicators were
selected for both versions of the test battery:
- Which hand do you use to hold a writing instrument for drawing?
- Which hand do you use to hammer a nail into wood?

108
- Which hand do you use to hold a knife when cutting bread?
- Which foot do you use to kick a ball?
The remaining 11 items of the questionnaire part were divided: 6 items were added to
the first version, and 5 items were added to the second version, i.e. one version of the
test battery contained 10 items in the questionnaire part, and the second version of the
test battery contained 9 items.
Preference motor tasks:
Based on the results of the content validity, the following 3 strongest indicators were
selected for both versions of the test battery:
- Throw the ball at the target.
- Erase the drawn line.
- Demonstrate how you would write the letter T on the floor using one of your feet.
The remaining 13 motor tasks were divided: the groups of 7 items were added to both
versions of the test battery, to the 3 strongest indicators. One version of the test battery
contained 10 items in the peference tasks part, and the second version of the test battery
contained 9 items.
Performance tests:
Based on the results of the content validity, the following 4 strongest indicators were
selected for both versions of the test battery – two for the upper limb and two for the
lower limb:
- Tracing the spiral
- Dot-filling fine motor test
- Lower limb tapping
- Slalom with a ball between obstacles
Subsequently, the item for the diagnosis of cerebellar dominance was implemented into
these tests (into both versions of the test battery).

109
Of the remaining 11 performance tests, 5 were added to one version and 6 to another
version, i.e. one version of the test battery contained 9 indicators in the performance test
part, and the second version of the test battery contained 10 indicators.
The first version of the test battery for the adult population
The questionnaire part:
- Which hand do you use to hold a writing instrument for drawing?
- Which hand do you use to hammer a nail into wood?
- Which hand do you use to hold a knife when cutting bread?
- Which hand do you use to hold a toothbrush when brushing your teeth?
- Which hand do you use to hold a rubber when erasing?
- Which hand do you use to hold a key when unlocking the door?
- Which hand do you use to hold a glass if you want to drink?
-Which foot do you use to kick a ball?
- Which foot do you place on the first step when walking upstairs?
- While standing, which of your lower limbs do you place forward when you want to
slide without the support of your hands?
Preference task part:
- Throw the ball at the target.
- Erase the line.
- Demonstrate how you would comb your hair.
- Use the pointer to point at the following object.
- Demonstrate how you would spread butter on bread.
- Demonstrate how you would write the letter T on the floor using one of your feet.
- Perform standing on one leg.
- Kick the ball at the target.
- Move the cube on the floor using one of your feet.
- Demonstrate a long jump.
Use the tube to look at the object.
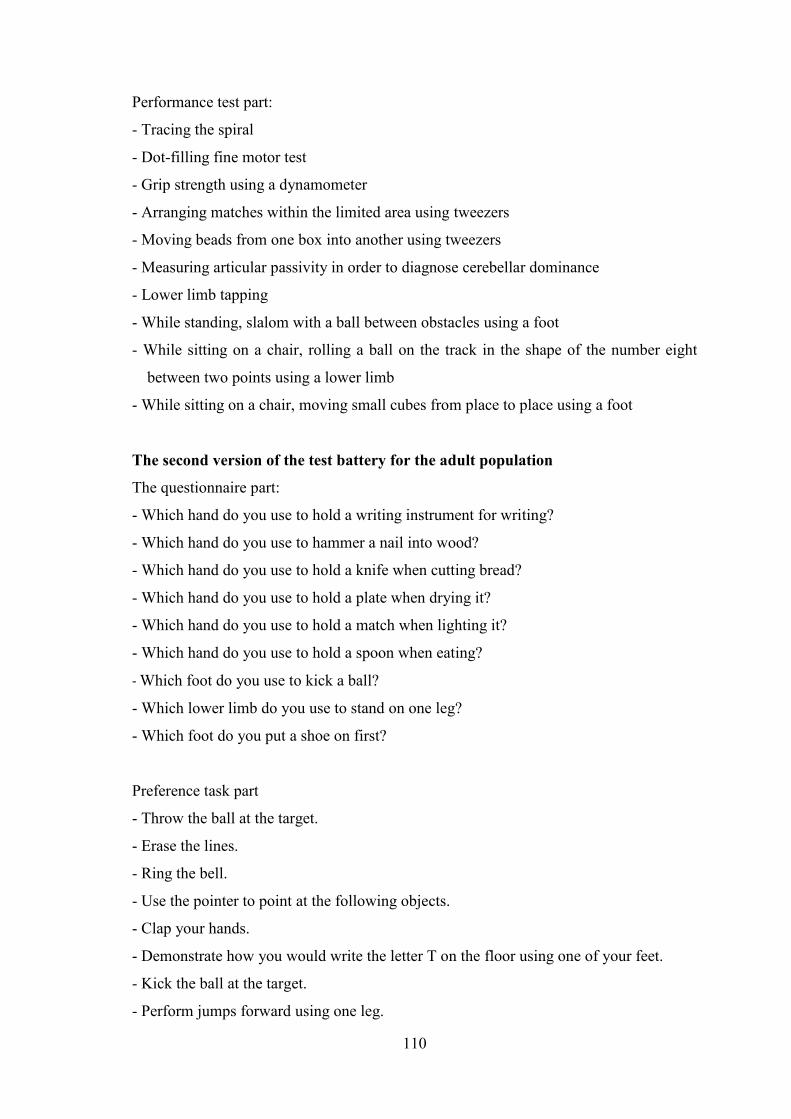
110
Performance test part:
- Tracing the spiral
- Dot-filling fine motor test
- Grip strength using a dynamometer
- Arranging matches within the limited area using tweezers
- Moving beads from one box into another using tweezers
- Measuring articular passivity in order to diagnose cerebellar dominance
- Lower limb tapping
- While standing, slalom with a ball between obstacles using a foot
- While sitting on a chair, rolling a ball on the track in the shape of the number eight
between two points using a lower limb
- While sitting on a chair, moving small cubes from place to place using a foot
The second version of the test battery for the adult population
The questionnaire part:
- Which hand do you use to hold a writing instrument for writing?
- Which hand do you use to hammer a nail into wood?
- Which hand do you use to hold a knife when cutting bread?
- Which hand do you use to hold a plate when drying it?
- Which hand do you use to hold a match when lighting it?
- Which hand do you use to hold a spoon when eating?
-Which foot do you use to kick a ball?
- Which lower limb do you use to stand on one leg?
- Which foot do you put a shoe on first?
Preference task part
- Throw the ball at the target.
- Erase the lines.
- Ring the bell.
- Use the pointer to point at the following objects.
- Clap your hands.
- Demonstrate how you would write the letter T on the floor using one of your feet.
- Kick the ball at the target.
- Perform jumps forward using one leg.

111
- Perform the basic (starting) position, and then step forward.
- Make a 360-degree turn
Use the tube to look at the object.
Performance test part:
- Tracing the spiral
- Dot-filling fine motor test
- Pegboard test
- Threading beads on a metal wire
- Collecting toothpicks (matches)
- Measuring articular passivity in order to diagnose cerebellar dominance
- Lower limb tapping
- While standing, slalom with a ball between obstacles using a foot
- While sitting on a chair, moving a cube in the “maze” provided
- While sitting on a chair, taking off a knitted sock from one foot using the other foot
B) CHILD POPULATION
Preference motor tasks:
Based on the results of the content validity, the following 4 strongest indicators were
selected for both versions of the test battery:
- Draw a leaf according to the model.
- Ring the bell.
- Throw the ball at the target.
- Kick the ball at the target.
The remaining 18 motor tasks were divided: 9 tasks were added to each version, to the
strongest indicators, i.e. the preference motor task part contained 13 indicators in both
versions of the test battery.

112
Performance tests:
Based on the results of the content validity, the following 4 strongest indicators were
selected for both versions of the test battery – two for the upper limb and two for the
lower limb:
- Tracing the spiral
- Dot-filling fine motor test
- Lower limb tapping
- Slalom with a ball between obstacles
Of the remaining 10 tests, 6 were added to each version of the test battery to the
4 strongest indicators. In the performance test part, each version contained 10
indicators.
Subsequently, the item for the diagnosis of cerebellar dominance was implemented into
these tests (into both versions of the test battery).
The first version of the test battery for the child population
Preference task part:
- Draw a leaf according to the model.
- Take the bell in one hand and ring it.
- Take the ball in one hand and throw it at the target.
- According to the instructions, turn the cards of the given colours placed on the sheet of
paper.
- Create a line in the marked space using matches.
- Show how many points you can roll with the dice on three attempts.
- Demonstrate how you brush your teeth.
- Open the box.
- Kick the ball placed on the floor at the target.
- Using one foot, tap the rhythm that I am clapping.
- While standing, demonstrate how you slide without the support of your hands.
- Stretch your arms sideways and make a 360-degree turn around your axis.
- Move the cube along the line on the floor using one of your feet.
Use the tube to look at the object.

113
Performance test part:
- Tracing the spiral
- Dot-filling fine motor test
- Moving beads from one box into another using tweezers
- Turning a box alternately with the front and the rear side on the table
- Threading beads on a metal wire
- Moving matches using a hand
- Measuring articular passivity in order to diagnose cerebellar dominance
- Lower limb tapping
- Slalom with a ball between obstacles
- Kicking a ball against the wall
The second version of the test battery for the child population
Preference task part:
- Draw a leaf according to the model.
- Take the bell in one hand and ring it.
- Take the ball in one hand and throw it at the target.
- Erase the line.
- Show me the following objects using one hand.
- Demonstrate how you stir with a teaspoon in a cup.
- Press number 5 on the calculator.
- Show me how you comb your hair.
- Kick the ball placed on the floor at the target.
- Show me jumps forward on one leg.
- Start running and make a long jump.
- Demonstrate how you would write the letter T on the floor using one of your feet.
- Step on the platform.
Use the tube to look at the object.
Performance test part:
- Tracing the spiral
- Dot-filling fine motor test
- Screwing a nut on a bolt

114
- Pegboard
- Turning a card between fingers
- Measuring articular passivity in order to diagnose cerebellar dominance
- Lower limb tapping
- Slalom with a ball between obstacles
- While standing, moving a cube in the “maze” provided
- While sitting on a chair, moving small cubes from place to place using a foot
10.10Data Analysis, Evaluation of StructureFollowing the data collection procedure, the final selection of items and
determination of the structure and diagnostic quality of the entire test battery are
conducted in this part of the standardization procedure. In order to determine the final
structure of the diagnostic tool that is designed to assess the pre-defined theoretical
concept, currently the most frequently used methods are structural equation modelling
methods (SEM), specifically the confirmatory approach. This approach quantifies, in a
reflective manner, relations between indicators and specific concepts which make up the
general attribute – the theoretical concept (see more in sections 11.1 and 11.2.1). Based
on SEM methods, models of the diagnostic tool structure are verified whose quality and
appropriateness for the data are expressed through model fit indices. In addition,
possible collinearity (strong correlation of two indicators in one dimension) is
determined, using the correlations between the individual indicators. In order to
compare the quality of the individual models, a residual matrix of indicators is also used
that points out unexplained correlations of individual indicators within the model. Based
on the results of SEM, the final number of specific concepts (dimensions) and relations
between them are determined.
10.11Approximation of ReliabilityReliability is an indirectly observable character of test scores determining their
diagnostic quality (Blahuš, 2008). The conceptual basis of reliability and features of the
main procedures for the approximation of reliability are defined, for example, by the
Classical Test Theory (CTT), which represents a theory of measurement (Gulliksen,
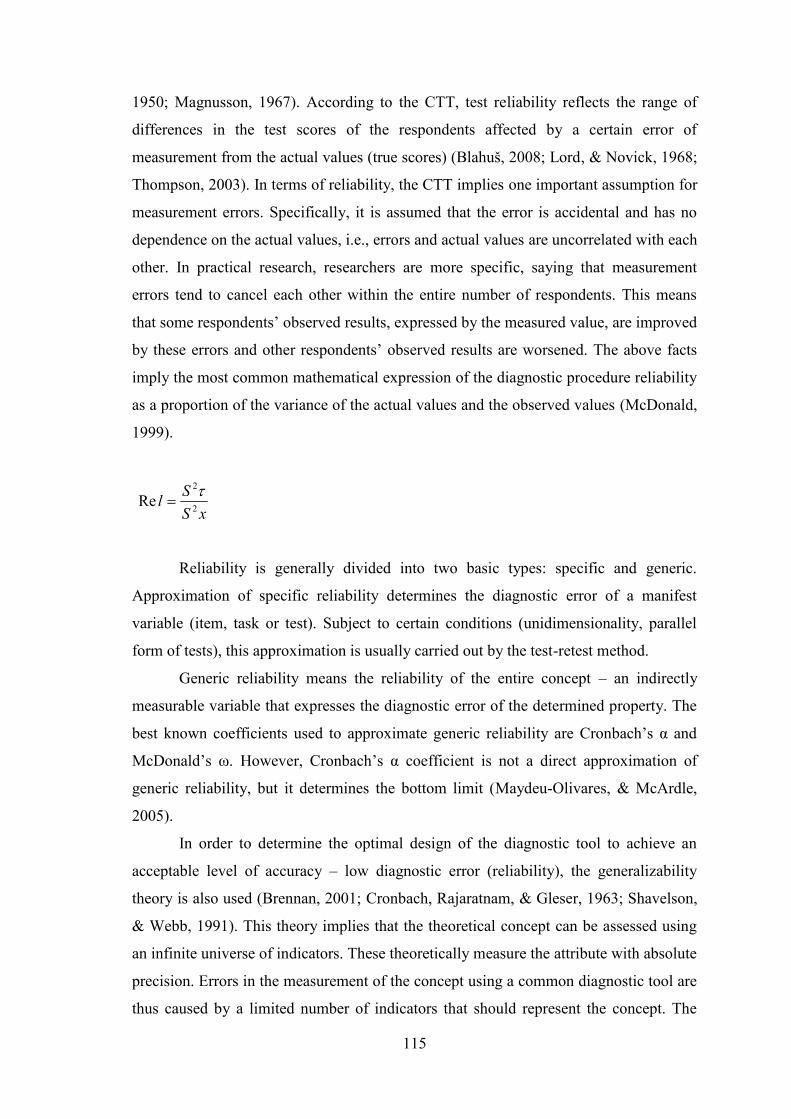
115
1950; Magnusson, 1967). According to the CTT, test reliability reflects the range of
differences in the test scores of the respondents affected by a certain error of
measurement from the actual values (true scores) (Blahuš, 2008; Lord, & Novick, 1968;
Thompson, 2003). In terms of reliability, the CTT implies one important assumption for
measurement errors. Specifically, it is assumed that the error is accidental and has no
dependence on the actual values, i.e., errors and actual values are uncorrelated with each
other. In practical research, researchers are more specific, saying that measurement
errors tend to cancel each other within the entire number of respondents. This means
that some respondents’ observed results, expressed by the measured value, are improved
by these errors and other respondents’ observed results are worsened. The above facts
imply the most common mathematical expression of the diagnostic procedure reliability
as a proportion of the variance of the actual values and the observed values (McDonald,
1999).
xSSl 2
2
Re
Reliability is generally divided into two basic types: specific and generic.
Approximation of specific reliability determines the diagnostic error of a manifest
variable (item, task or test). Subject to certain conditions (unidimensionality, parallel
form of tests), this approximation is usually carried out by the test-retest method.
Generic reliability means the reliability of the entire concept – an indirectly
measurable variable that expresses the diagnostic error of the determined property. The
best known coefficients used to approximate generic reliability are Cronbach’s α and
McDonald’s ω. However, Cronbach’s α coefficient is not a direct approximation of
generic reliability, but it determines the bottom limit (Maydeu-Olivares, & McArdle,
2005).
In order to determine the optimal design of the diagnostic tool to achieve an
acceptable level of accuracy – low diagnostic error (reliability), the generalizability
theory is also used (Brennan, 2001; Cronbach, Rajaratnam, & Gleser, 1963; Shavelson,
& Webb, 1991). This theory implies that the theoretical concept can be assessed using
an infinite universe of indicators. These theoretically measure the attribute with absolute
precision. Errors in the measurement of the concept using a common diagnostic tool are
thus caused by a limited number of indicators that should represent the concept. The

116
generalizability theory implies one important assumption, namely homogeneity or
unidimensionality of indicators (Brennan, 2001). Unidimensionality means that all the
indicators in a particular area of research measure the same attribute (McDonald, 1999;
Blahuš, 1985).
In this study, we have focused on the approximation of generic reliability. For
each construct, it has been estimated using McDonald’s ω coefficient, which is also the
generalizability coefficient.
22
2
jj
j
ω .... reliability McDonald coefficient
j .... factor loading
j .... uniqueness
(Blahuš, 1991; McDonald, 1999)
The reliability coefficient is always shown only in models that met the eligibility
conditions of the diagnostic quality.

117
11. STRUCTURAL EQUATION MODELING (SEM)
11.1 IntroductionStructural equation modelling (SEM) is a statistical technique used to verify
structural theories of a certain attribute. The concept of SEM or casual modelling is not
only one statistical method used to assess the diagnostic quality of a certain tool, but
contains a variety of procedures. SEM works with two types of variables.
Directly observable (manifest) variables represent individual items, tests or
tasks. These variables can have the nature of categorical, ordinal or continuous data.
The second type of variables includes latent variables that represent
operationalized, indirectly measurable specific concepts. The basic assumption is that
the latent variables in SEM must be continuous. Directly observable variables that
indirectly measure the concept are also called indicators or items (Kline, 2011). Latent
variables in SEM are called factors (Bollen, 2002).
The basic statistical term in SEM is covariance, which is defined for two
continuous, directly observable variables by the relationship:
rxy ......correlation between variables
SDx ....standard deviation of one variable
SDy ....standard deviation of the second variable
The SEM analysis has two main objectives:
– to understand covariances between individual indicators,
– to explain their variance as much as possible using a selected model.
(Kline, 2011)
The basic task of SEM is to determine relations between latent and directly
observable variables, which differentiates SEM from other statistical techniques, such
as ANOVA or multiple regression (MR). These techniques only allow us to analyze
directly measurable variables. Another major difference between SEM and ANOVA or
MR is that in SEM it is possible to separate measurement errors from true scores of
attributes. This is what allows SEM to model latent variables directly (Yuan, & Bentler,
xyxy rcov xSD ySD

118
2007). Measurement errors, called non-reliability, are directly related to measurable
variables, and constitute a part of unexplained variance – residue. This residue
represents variance which was not explained for the indicator relating to the identified
factor (Kline, 2011).
The SEM analysis consists of two parts: the measurement model and the structural
model.
– The measurement model represents a regression model which, using linear
regressions, describes the relations between the directly observable variables
(indicators) and latent variables (factors).
– The structural model describes, using multivariate regressions, three types of
relations:
a. between factors and indicators,
b. between indicators,
c. between factors and those indicators that are not related to the identified
factor.
(Jöreskog, & Sörbom, 1979; Muthén, 1984)
Based on the statistical analysis, it is decided whether the proposed model can be
accepted or not.
If it is revealed, based on the results of SEM, that the proposed model is not
consistent with the data, i.e., that the model fit is inadequate, the model is rejected.
However, if the quality of the model based on the data expressed by the model fit is
acceptable, the proposed model may be accepted (Marsh, Hau, & Grayson, 2005).
11.2 Types of SEM modelsAs suggested in the previous section, SEM is not just a statistical method, but an
umbrella term for more specific statistical procedures. The basic concept of SEM
distinguishes three basic analyses:
1) The path analysis represents the oldest of a series of structural models designed
for directly observable variables. The structural model represents the hypothesis
about the effect of a certain variable. The aim of the path analysis is the
separation of direct and indirect relations between variables (Duncan, 1966;

119
Loehlin, 2004). Although the path analysis is not considered by some authors as
a typical SEM model, its creation was a very important step for the further
development of SEM (Štochl, 2008).
2) Factor analyses – the confirmatory approach (CFA) is a technique aimed at
determining the relations between factors and indicators that are explicitly
specified (see section 11.3 for more information on CFA).
3) Structural regression models – structural regression models (SRM), sometimes
also called “full LISREL models”, represent the most general SEM model. The
structural regression model is a synthesis of the structural model and the
measurement model. As with the path analysis, the SRM allows us to test the
hypothesis regarding the direct and indirect causal effects of variables. However,
unlike the path analysis, these effects may also be related to factors (latent
variables) in the SRM, because the SRM includes measurement components that
represent the relationship between directly observable variables (indicators) and
the factors identified as in CFA.
(Kaplan, 2009; Kline, 2011)
11.3 Confirmatory Factor Analysis (CFA)CFA is one of the techniques of SEM used to test or verify structural theories
and to test the validity of a certain tool (McDonald, 1999). This statistical technique
requires sufficient knowledge of the scientific theory of the subject by the researcher,
who, prior to CFA, explicitly specifies both factors and indicators (Morrison, 1990).
Since CFA only focuses on explaining the relations between factors and indicators, it
represents a measurement model within SEM (Thompson, 2004; Vandenberg, & Lance,
2000). Statistical estimates of the relations between indicators and factors are called
factor loadings, and they are generally interpreted as regression coefficients that can be
both in the standardized and non-standardized form. CFA indicators are continuous
variables. As mentioned in section 11.1, it is an important prerequisite that the factor is
also a continuous latent variable.

120
The basic mathematical expression for the general factor model:
fx
x… is a directly observable response (answer in the questionnaire, performance in the
test)
Λ… (λjk) is (p x m) matrix of factor loadings (e.g., regression weights of j observable
variable on k factor for j = 1, ..., p and k = 1, ...m)
f… is (m x 1) random vector of factors
ε… is a random vector of the uniquenesses of variables
An important assumption is that uniquenesses do not correlate with factors.
These uniquenesses are thus specified as independent.
Fig. 8 Example of CFA model, independent clusters (Kline, 2011, p. 112)
Ovals F1 a F2…. Latent variables mathematically called factors faktory
Squares x1 - x6…Manifest variables called indicators indikátory
Circles E1 - E6…Uniqueness
When using CFA in standard models, it is essential to follow the rules of model
identification. In the one-factor CFA model, in order to identify the model, it is
necessary that the factor includes at least three indicators. In this case, we use the “just-
identified” model, in which the number of observations equals the number of
F1 F2
x1 x2 x3 x4 x5 x6
E1 E2 E3 E4 E5 E6

121
parameters. However, the number of degrees of freedom (df) = 0. Although the model is
identified in this case, this just-identified model is not sufficient in SEM for its zero
degree of freedom. When using CFA, it is thus always necessary to ensure the “over-
identified” model, in which the number of observations exceeds the number of
parameters. For a one-factor model, it is necessary to have at least four indicators. The
simplest example of the two-factor over-identified CFA model is a model where each of
the two factors contains at least two indicators (Kline, 2011; Ullman, 2006).
The prerequisite for the use of SEM – CFA in this case – for the interval data
analysis is multivariate normality, which is a generalization of one-dimensional
(univariate) normal distribution (Stein, 1981). Every case of a one-dimensional
(univariate) normal distribution exhibits a normal character. Each variable has a normal
distribution for each value of every other variable (Kline, 2011). This assumption is
particularly important for the estimation of parameters with the maximum likelihood
(ML) method used for continuous data type (Hoogland, 1999). Multivariate normality
can be determined, for example, using a statistical test such as the Cox-Small Test (Cox,
& Small, 1978). In other estimation methods, e.g., weighted least mean square of
variance, the assumption of multivariate normality is not required (Muthén & Muthén,
2010). Another requirement is linearity, which assumes linear relations between
indicators and factors, as well as mutual relations between factors (Bollen, & Lennox,
1991). Apart from another requirement in the form of a sufficiently large research
sample, which was described in section 10.9, it is necessary to prevent multicollinearity
between indicators in CFA. In model testing, multicollinearity is a very strong
relationship of two or more independent variables measuring a certain attribute. Among
these variables, the correlation coefficient is close to –1 or 1. In such a case, it is likely
that the covariance matrices are singular, and the model cannot be identified (Grewal,
Cote, & Baumgartner, 2004).
In this study, in order to determine the structure of motor manifestations of
laterality in indicators of continuous nature, we decided to use CFA. It was a part of the
test battery that determined motor manifestations of laterality using performance tests in
which data display interval character. To verify the multivariate normality we used Cox-
Small Test. In all four parts of performance tests (two versions for the child population
and two versions for the adult population), possible multicollinearity was first
investigated using correlation matrices. Multicollinearity was subsequently excluded,
based on the results. When determining the model itself, a two-factor structure was

122
always set as a basis, i.e., in all versions of the test battery, in the performance test part.
One factor formed hand performance, and the second factor formed foot performance.
11.4 Categorical Variables and SEMFundamentally, categorical variables are of two types:
– dichotomous (binary) variables contain two response options that estimate
the degree of the determined characteristic (Brown, 2006; Muthén, 1984);
– polytomous ordinal variables include at least three response options
(categories). These options have a natural order which reflects the level of
the determined characteristic or trait through the selection of categories in
individual observable variables (Andrich, 1978; McDonald, 1999; Muthén &
Asparouhov, 2002).
An important feature of ordinal variables is that even though their categories
define different levels of determined characteristics, exact distances are not known in
this order between determined degrees in the form of categories. Therefore, we cannot
talk about the average or variance (Furr, & Bacharach, 2008; Mellenbergh, 1995).
Against this background, it is appropriate to use different techniques that are based on
the general factor model for the ordinal data analysis (Lubke, & Neale, 2008).
As in continuous data, a general one-factor model has been derived for binary
variables.
fx
x… is a directly observable response (answer in the questionnaire, performance in the
test)
Λ… (λjk) is (p x m) matrix of factor loadings (e.g., regression weights of j observable
variable on k factor for j = 1, ..., p and k = 1, ...m)
f… is (m x 1) random vector of factors
ε… is a random vector of the uniquenesses of variables

123
The regression equation represents the probability of a certain answer of the
proband with a certain value of the level of the characteristic f. This means that the
regression equation is a functional equation of conditional probability (McDonald,
1999).
However, this general model of a linear function of conditional probability has
three main limitations:
1) If f is too small, the result is negative probability; if f is too large, the probability
of a response is greater than 1.
2) We must assume that the indicator uniqueness variance is independent of the
latent variable.
3) Estimation error of the factor score is constant for all values of the latent
variable.
These restrictions can be eliminated by normal ogive model (Christofferson, 1975;
Muthén, 1978) which is derived from factor analytic framework. Within this
framework, it is assumed that a latent response variable yi* underlies each observed
categorical response variable yi. The latent response yi* are related to the latent traits η
via a standard factor analytic model.
ii *yi
β‘iη……….is a 1x p vector of factor loadings
ε…………..is a measurement error
Since in this model is assumption that latent traits and measurement errors are normally
distributed so that latent response variables are also normally distributed. On the other
side, the latent response variables are related to the observed categorical responses
through a threshold relation,
kyi if 1* ,, kiiki y
where αi0 = - and αi,m-1 = + . That is, under this model, a respondent chooses a
response alternative based on her location on the response variable yi* relative to a set

124
of m - 1 item threshold parameters, αi,k. Response alternative k will be endorsed when
the respondent’s latent response value yi* lies between thresholds αi,k and αi,k+1.
In this technique are using tetrachoric correlations for categorical binary data, and
polychoric ordinal correlations for categorical polytomous data. This procedure is called
categorical confirmatory factor analysis (CCFA). CCFA is a statistical technique that,
by its nature, falls into Item Response Theory (IRT) (Forero, & Maydeu-Olivares,
2009).
An important advantage of IRT is that it is based on the item and its
characteristic. Otherwise it is CTT that deals with items almost exclusively in the
context of a particular test, and thus it is not separable from the test (Hambleton,
Swaminathan, & Rogers, 1991). IRT is used for both dichotomous and polytomous
categorical data to model the relationship between the indirectly observable variables
that are always continuous in nature, usually conceptualized as the capacity of the
proband and the probability of a certain response (e.g., the correct answers of the
proband to individual items in the test battery or test). The core of IRT lies in the
psychometric approach, which emphasizes the fact that an individual’s response to
individual items in the test is affected by the level of the individual’s skills or qualities
and the character of the item (e.g., difficulty or discrimination). In CCFA parameter of
difficulty is the same as threshold and parameter of discrimination represent factor
loading. IRT also displays an equivalent of the unidimensionality requirement, known
as the principle of local independence (Lord, & Novick, 1968; Wright, 1999). This
assumption implies that the probability of a correct or a specific answer by the proband
(obtained from the one-dimensional model) is not affected by the performance or a
decision in other items of the test. The assumption of local independence in the one-
dimensional model means that the probability of any response by the proband is
determined by the probability amount related to the correct or wrong answers to the test
items. The main advantage of IRT is that both persons and indicators are assessed on
the same scale – a continuum expressing capability levels and the probability of correct
answers (Ayala, 2009; Hambleton, Swaminathan, & Rogers, 1991;). CCFA thus
represents a suitable method for modelling ordinal categorical data even data have
multidimensional character (Mislevy, 1986; Forero, & Maydeu-Olivares, 2009).
Both CCFA and CFA require a continuous character of the latent variable
(Yuan, & Bentler, 2007).

125
The relationship between the probability of certain responses and the level of the
determined latent variable of the trait, measured using a certain universe of test items, is
expressed by a mathematical function which, in the graphical form, forms the
“characteristic curve” (von Davier, & Carstensen, 2007). IRT thus provides higher
model strength for a comprehensive assessment, and, unlike CTT, does not follow the
creation of parallel forms of tests using the same tasks (Lord, 1962; Wang, Bradlow, &
Wainer, 2002).
The proposed versions of the test batteries contain both ordinal categorical data
(questionnaire part in the test battery for the adult population) and dichotomous
categorical data (preference task part). In order to verify the structural theory for these
types of data we decided to use “Categorical Confirmation Factor Analysis” (CCFA).
11.5 Types of Parameters Used in SEM Method for Parameters
EstimationOur objective is to achieve the maximum fit of the estimated covariance matrix
with the covariance matrix formed from the results of directly observable variables,
using statistical techniques SEM and CCFA. This process is called parameter
estimation, and it is obtained by minimizing the discrepant function between the data
and the model (Yuan, & Bentler, 2007). When using the discrepant feature, it is very
important to consider what type of data is used in modelling. Muthén (1984) described
the diversity of approaches when working with continuous and categorical data, which
he summarized in the continuous/categorical variable methodology (CVM) (Muthén,
1984). In a situation where the data is categorical, the relations between variables are
estimated using tetrachoric and polychoric correlations.
The most common features include:
– Maximum Likelihood (ML) – due to its complexity, this function is called
the “full information method”, and it is used in cases of multivariate normal
distribution of indicator results (endogenous variables) in the population.
ML is most often used for interval data type in CFA (Ferron & Hess, 2007);
– Robust Maximum Likelihood (RML) – this function is used in cases of
violation of multivariate normal distribution. Just as ML, it is used for
interval data type (Yuan, & Bentler, 2007);

126
– Weighted Least Square Mean Variance (WLSMV) – this function is used for
categorical data of both dichotomous and polytomous character. WLSMV is
thus suitable for the CCFA technique. The asymptotic correlation matrix is
used here. In dichotomously scored data, the estimated matrix is a tetrachoric
correlation matrix; in ordinal categorical data, the estimated matrix is based
on a polychoric correlation matrix. This function is also suitable for the
sample analysis n ≥ 200 (Muthén et al., 1997; Swygert, McLeod, & Thissen,
2001).
The indicators compiled in the test battery have the character of both continuous
and categorical variables. After verifying the multivariate normality of data using the
Cox-Small text, we decided to use the ML function for continuous, directly observable
variables. For the model with categorical data of dichotomous and ordinal nature, we
decided to use the WLSMV function in this research, based on consultation with and
adopting the recommendations of Professor Bengt Muthén.
11.6 Model Testing Fit EvaluationThe main objective in SEM is to test certain theories using the selected models
that are conceptualized according to currently accepted hypotheses in the field. These
conceptualized models represent a prediction of this theory between operationalized
latent variables that are measured using appropriate indicators (Hayduk, Cummings,
Boadu Pazderka-Robinson, & Boulianne, 2007). When testing a model, it is important
to realize whether the model analyses in SEM solve the researcher’s theoretical
questions, regardless of whether the model is preserved that was created based on the
theory (Millsap, 2007). Since statistical models are only estimate tools, it often happens
in model testing in SEM that there is not only one model whose fit (i.e., how well the
model captures the determined data) would lead to its absolute acceptance. In addition,
research is conducted using various samples that do not constitute basic population
samples, but only their parts. Therefore, research with the same models, tested in the
same population but with different samples, determine different model fits, and
sometimes even structures of the entire theoretical concept. The crucial question then is
how to proceed if there are multiple models that even in different structure alternatives

127
fit data equally well or very similarly. The researcher can only perform the
interpretation and make the final decision based on knowing the theoretical concept that
was defined in the research (Raykov, & Marcoulides, 2000). This decision is, of course,
based on the subjective level of knowing and understanding the connections within the
theoretical concept (Kirk, 1996).
In order to determine the quality of a model, model fit indices are used. Model
fit indicates how well the proposed model fits the data obtained from measurements
using selected indicators in the research sample (Kline, 2011). A very important role in
the interpretation of fit indices is played by the research sample size. If the research
sample size is not sufficiently large, there is a danger that the fix index will not reflect
the real applicability of the model for its generalization to the population (Barrett,
2007). Another requirement for the applicability of fit indices is to fulfil the assumption
of the over-identified model type (see 11.3). In SEM, more fit indices are generally used
to express the quality of a model. The use of at least three fit indices is considered the
gold standard by some authors.
Due to the type of indicators, we decided to use the following indices which
were considered suitable by McDonald & Marsh and Hu & Bentler to assess the model
fit (Hu & Bentler, 1999; McDonald & Marsh, 1990).
A) Basic index
Chi-square: It is the basic and probably the most widely used model test
statistics, and, like asymptotic chi-square statistics, it expresses model
discrepancy. With its numerical expression, this fit index shows a “wrong fit”,
i.e., the higher the chi-square value, the worse the model fit. Along with this, the
significance of the difference between the covariance structure model and
covariance matrix of directly observable variables is tested. The significance
level of chi-square is usually set at p > 0.05. If p is less than 0.05, the considered
model should be rejected (Marsh, Hau & Grayson, 2005).
B) Index approximating error
Root Mean Square Error of Approximation (RMSEA): This index represents
standardized measurement of empirical discrepancy (Browne, & Cudeck 1993).
RMSEA does not approximate the central chi-square distribution. RMSEA
follows the non-central chi-square distribution where the non-centralized

128
parameter allows for discrepancies between the proposed model and the
covariances of directly observable variables (Steiger, 1990). The lower the value
of RMSEA, the better the model fit. Some authors have proposed approximate
values for expressing the fit quality using RMSEA. Values ≥ 0.10 show a poor
model fit; values ranging from 0.08 to 0.10 show an average model fit; values
ranging from 0.05 to 0.08 show a good model fit; and values ≤ 0.05 show a very
good model fit (McDonald & Ho, 2002; Steiger 1990).
Standardized Root Mean Square Residual (SRMR): This fit index is based
on comparing the differences between covariance residuals, specifically on the
differences between the observed covariances (from directly observed variables)
and the predicted covariances (of the model). The SRMR fit index ranges in the
closed interval from 0 to 1; the closer the values are to zero, the better the model
fit. It is generally accepted that values ≤ 0.08 show an acceptable model fit
(Kline, 2011).
Weighted Root Mean Square Residual (WRMR): WRMR is based on a
similar principle to SRMR, i.e., on comparing differences in residual
covariances, namely on differences between observed covariances (from directly
observed variables) and the predicted covariances (of the model). However, this
index is set for assessing the model fit using categorical dichotomous or ordinal
data, or in cases where data lose normality. WRMR does not only show values
in the closed interval from 0 to 1, but can also show values greater than 1. The
closer the values are to zero, the better the model fit. Only values ≤ 1 are
considered to be acceptable for this index (Muthén & Muthén, 2010).
C) Incremental (progressive) index unmodified for model complexity
Comparative Fit Index (CFI): CFI is an index that measures the relative
improvement of the fit in the proposed model compared with the baseline model
(Bentler, 1990). The CFI index is also a rescaled standardized version of the
Relative Noncentrality Index (RNI) (McDonald & Marsh, 1990). CFI depends
on the same distribution assumptions as the RMSEA index (Kline, 2011). CFI
index values are in the closed interval from 0 to 1, with values close to one
indicating a good model fit. According to Hu & Bentler (1999), the
recommended acceptable CFI index value is 0.95.

129
D) Incremental (progressive) index modified for model complexity
Tucker-Lewis (TLI): TLI represents a non-standardized fit index whose values
are not only in the closed interval from 0 to 1, but can also be greater than 1. The
recommended acceptable value of this fit index was set at 0.95 (Hu & Bentler,
1998).
11.7 ResidualsResiduals represent the differences between the model correlation and directly
observed determined correlation. Residual correlations are standardized covariance
residuals that represent the differences between directly observed and expected
modelled covariances (Kline, 2011). When assessing the residual correlation matrix for
categorical data, the value up to 0.10 is generally considered an acceptable limit of
unexplained correlations. Values in the residual correlation matrix > 0.10 indicate that
the model does not explain well the directly observable correlations (Bollen, 1989).
Cases of residual matrices for interval data mostly involve standardized covariance
residuals. In this case, a hypothesis is tested whether the residual covariance of the
population equals zero. If these residuals have values greater than 2.58, which
corresponds to the confidence interval of 0.01, they are considered high (Jöreskog &
Sörbom, 1993). Some authors even recommend regarding standardized values in the
residual matrix greater than 1.96 as high residuals, which corresponds to the confidence
interval of 0.05 (Kline, 2011).
130
12. RESULTS
The aim of this thesis is to determine the structure and the diagnostic quality of
the test batteries for diagnosing motor manifestations of laterality. One of the test
batteries is intended for the adult population and one for the child population. Both test
batteries contain the part with motor preference tasks and the part with performance
tests. The test battery for the adult population also includes the questionnaire part,
determining the preference in the use of upper and lower limbs in everyday activities.
In order to determine the structure, the SEM method and the confirmatory
approach were used for the continuous data type. For categorical data, of both
dichotomous and polytomous ordinal nature, the categorical confirmatory factor
analysis (CCFA) was used. For the interval data type, the confirmatory factor analysis
(CFA) was used. All of data for both baterries were analyse in statistical software M-
plus version 6 (Muthén & Muthén, 2010). The approximation of reliability of all parts
of both test batteries was determined by calculating McDonald’s ω coefficient.
The actual results are divided into two basic areas:
– sample characteristics and structural models of the test battery and their parts for
the adult population
– sample characteristics and structural models of the test battery and their parts for
the child population
12.1 Test Battery for Adult PopulationSample characteristics and structural models of the test battery and their parts for the
adult population
A total of 440 probands participated in the research (212 men and 228 women)
aged 17–19 years (average age 18.2 years). They were students of Prague general upper
secondary schools without a specific specialization (arts, technology, sports, languages).
The entire research sample was divided into two subgroups, each containing 220
probands. The first subset marked as A consisted of 104 men and 116 women. The
second subset marked as B consisted of 108 men and 112 women.

131
The subset A was diagnosed with the first version of the test battery, and the
subset B was diagnosed with the second version of the test battery.
12.1.1 Questionnaire
The data in both versions of the questionnaire part was scored on the five-point
Likert scale. It is thus a categorical data of polytomous character. Due to the categorical
data type, the WLSMV method was used as a parameter estimation.
The items of the questionnaire part of the first version of the test battery:
- Which hand do you use to hold a writing instrument for drawing? HD
- Which hand do you use to hammer a nail into wood? NA1
- Which hand do you use to hold a knife when cutting bread? KC
- Which hand do you use to hold a toothbrush when brushing your teeth? THB
- Which hand do you use to hold a rubber when erasing? ER
- Which hand do you use to hold a key when unlocking the door? UNL
- Which hand do you use to hold a glass if you want to drink? GD
-Which foot do you use to kick a ball? KB
- Which foot do you place on the first step when walking upstairs? ST
- While standing, which of your lower limbs do you place forward when you want to
slide without the support of your hands? SLI
We first tested the model where we divided the upper and lower limb preference
into two dimensions.
1 This item is scored reversely therefore, the analysis contains a negative loading for this item. The personbeing tested is not deliberately asked about the preferred upper limb but about the non-preferred upperlimb in order to hold the attention of the persons being tested

132
Table 2
Fit of the 2-factor model questionnaire 1. version of test battery (adult population)Model Chi-square P-value df CFI TLI RMSEA WRMR
2-factor 57.51 0.0071 34 0.99 0.99 0.056 0.532
HD NA THB ER GD KC UNL KB ST SLI
Upper LimbPreference
1.07 -0.83 0.92 0.89 0.670.881.05
Lower LimbPreference
0.83 0.21 0.53
0.93
Fig. 9 Path diagram of 2-factor model questionnaire 1. version of test battery
(adult population)
The proposal of this structure displayed what is called a Heywood case, when
the covariance matrix it is not positively defined. The HD item (Which hand do you use
to hold a writing instrument for drawing?) and the GD item (Which hand do you use to
hold a glass if you want to drink?) for the “Upper Limb Preference” factor showed a
factor loading greater than 1, which led to the negative variance of uniqueness, and,
therefore, this model was rejected. In addition to problems with items whose loadings
exceeded the value of 1, a very weak correlation of the ST item (Which foot do you
place on the first step when walking upstairs?) to the “Lower Limb Preference” factor,
ST = 0.21, was found in this model. It is, therefore, possible that this item will be
removed in further analyses. An interesting finding is also the strong correlation
between both factors (0.93), which indicates that the questionnaire part may show a
one-factor structure.
With respect to the Heywood case, the results of the residual matrix are not very
decisive, but it is clear that the problems in this model were associated with the GD item
(holding a glass) and the KB item (Which foot do you use to kick a ball), whose
residuals are higher than the value of 0.100.

133
Table 3
Residual matrix 2-factor model questionnaire 1. version of test battery (adult
population)
For further analysis of the two-factor model, we decided to remove the HD item
and GD item from the model.
Table 4
Fit of the 2-factor model questionnaire 1. version of test battery withou items HD and
GD (adult population)
Upper LimbPreference
NA THB ER KC UNL
-0.83 0.92 0.89 0.680.85
Lower LimbPreference
KB ST SLI
0.84 0.24 0.49
0.94
Model Chi-square P-value df CFI TLI RMSEA WRMR
2-factor 26.68 0.1122 19 0.99 0.99 0.045 0.454

134
Fig. 10 Path diagram of 2-factor model questionnaire 1. version of test battery
without items HD and GD (adult population)
After removing the problematic items, we achieved an acceptable model fit,
including acceptable levels of P-value. The “Lower Limb Preference” factor again
displayed ST (0.24) (Which foot do you place on the first step when walking upstairs?)
as the weakest item; it probably measures a different attribute than lower limb
preference. In addition, despite the presence of this weak item, the correlation between
the two factors is still strong, and it is thus likely that after removing the ST item, this
correlation would be even stronger. Therefore, this model was also rejected. The results
of the residual matrix were better in this model, but the SLI item (While standing, which
of your lower limbs do you place forward when you want to slide without the support of
your hands?) still displayed a higher residual than generally accepted, i.e., greater than
0.100.
Table 5
Residual matrix 2-factor questionnaire 1. version of test battery without items HD and
GD (adult population)
In the next design of the questionnaire structure, we decided to remove the ST
item in the “Lower Limb Preference” factor, and added the remaining items of this
factor to the items determining upper limb preference. We then called the whole factor
“Preference of Locomotive Organs”.

135
Table 6
Fit of the 1-factor model questionnaire 1. version of test battery without items HD, GD
and ST (adult population)Model Chi-square P-value df CFI TLI RMSEA WRMR
1-factor 16.25 0.29 14 0.99 0.99 0.028 0.381
Preferenceof Locomotive Organs
NA THB ER KC UNL
-0.85 0.850.88
KB SLI
0.68 0.65 0.520.93
Fig. 11 Path diagram of 1-factor model questionnaire 1. version of test battery
without items HD, GD and ST (adult population)
This one-factor structure of the questionnaire part proved to be the most
appropriate in the first version of the test battery. All fit index values showed a very
good model fit. The residual matrix did not contain any residual values that would be
unacceptable in the model.
Table 7
Residual matrix 1-factor model questionnaire 1. version of test battery without items
HD, GD and ST (adult population)

136
Table 8
Generic reliability – questionnaire part 1. version (adult population)
Name of the factor McDonald
Preference of Locomotive Organs 0.90
Based on the determined quality of this proposed structure, this model was
adopted. During the analysis of the questionnaire part, very strong factor loadings were
clearly identified in the instrumental-skill items related to upper limb preference NA (-
Which hand do you use to hammer a nail into wood?) NA = -0.85, THB (Which hand
do you use to hold a toothbrush when brushing your teeth?) THB = 0.93, ER (Which
hand do you use to hold a rubber when erasing?) Er = 0.88 a KC (Which hand do you
use to hold a knife when cutting bread?) KC = 0.85 that apparently display possible
influence of motor expression of laterality through imitation or socially-culture
environment.
The questionnaire part items of the second version of the test battery:
- Which hand do you use to hold a writing instrument for drawing? HD
- Which hand do you use to hammer a nail into wood? NA2
- Which hand do you use to hold a match when lighting it? MAT
- Which hand do you use to hold a spoon when eating? HS
- Which hand do you use to hold a plate when drying it? WE3
- Which hand do you use to hold a knife when cutting bread? KC
- Which foot do you use to kick a ball? KB
- Which lower limb do you use to stand on one leg? STA
- Which foot do you put a shoe on first? SHO
In next step we analysed questionnaire part in second version of test battery for adult
apopulation.
Based on the results of the previous modelling in the questionnaire part of the
first version of the test battery, we verified the one-factor structure.
2, 3 These items are scored reversely therefore, the analysis contains a negative loading for these items.The person being tested is not deliberately asked about the preferred upper limb but about the non-preferred upper limb in order to hold the attention of the persons being tested
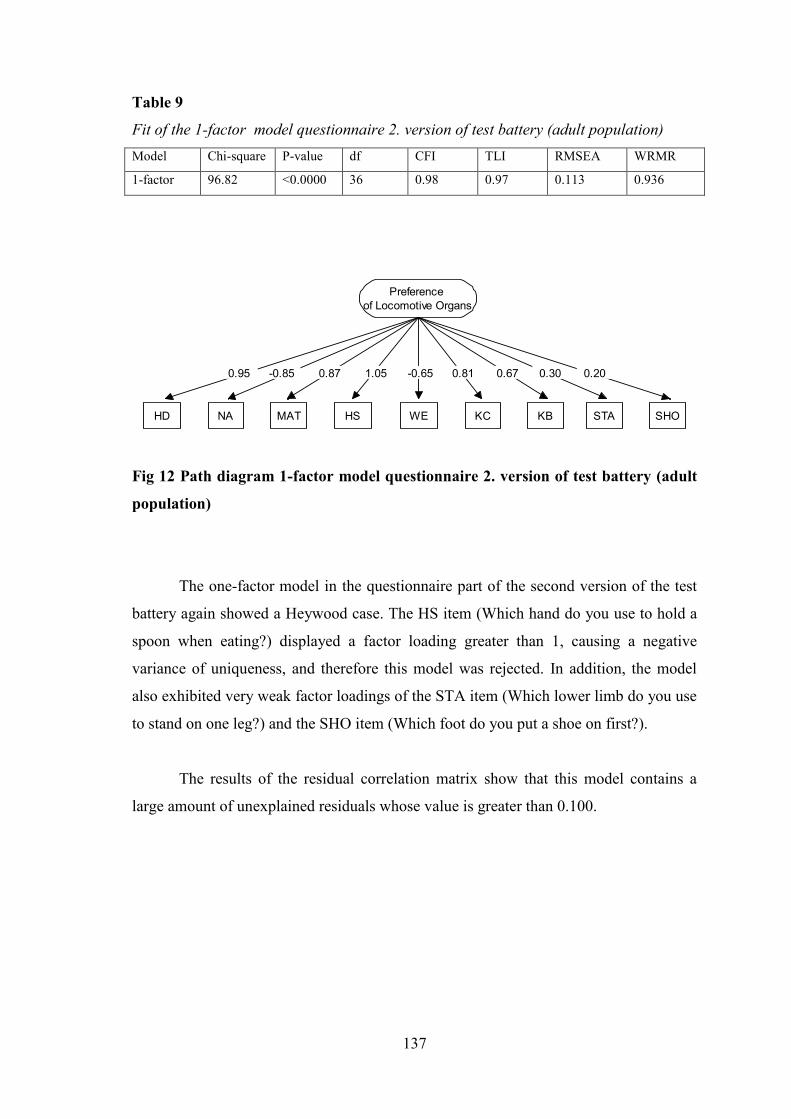
137
Table 9
Fit of the 1-factor model questionnaire 2. version of test battery (adult population)Model Chi-square P-value df CFI TLI RMSEA WRMR
1-factor 96.82 <0.0000 36 0.98 0.97 0.113 0.936
Preferenceof Locomotive Organs
NA MAT HS WE KC
-0.85 -0.651.05
KB STA
0.81 0.67 0.300.87
SHOHD
0.95 0.20
Fig 12 Path diagram 1-factor model questionnaire 2. version of test battery (adult
population)
The one-factor model in the questionnaire part of the second version of the test
battery again showed a Heywood case. The HS item (Which hand do you use to hold a
spoon when eating?) displayed a factor loading greater than 1, causing a negative
variance of uniqueness, and therefore this model was rejected. In addition, the model
also exhibited very weak factor loadings of the STA item (Which lower limb do you use
to stand on one leg?) and the SHO item (Which foot do you put a shoe on first?).
The results of the residual correlation matrix show that this model contains a
large amount of unexplained residuals whose value is greater than 0.100.

138
Table 10
Residual matrix 1-factor model questionnaire 2. version of test battery (adult
population)
When analyzing collinearity, it was found that the HS item displays strong
collinearity with HD, NA ,and MAT; therefore, we decided to remove this item from
further modelling. We again tested the one-factor model, but without the HS item.
Table 11
Fit of the 1-factor model questionnaire 2. version of test battery without item HS (adult
population)Model Chi-square P-value df CFI TLI RMSEA WRMR
1-factor 55.95 <0.0000 20 0.98 0.97 0.095 0.798
Preferenceof Locomotive Organs
NA MAT WE KC
-0.82 0.64
KB STA
0.81 0.67 0.320.79
SHOHD
1.06 0.22
Fig. 13 Path diagram 1-factor model questionnaire 2. version of test battery
without item HS (adult population)

139
Even after removing the HS item, however, the second one-factor structure
exhibited a Heywood case. As in the questionnaire part in the first version of the test
battery, it was the HD item (Which hand do you use to hold a writing instrument for
drawing?). Therefore, this model also had to be rejected. The results of the residual
correlation matrix showed no improvement in this case.
When analyzing the content and character of both items whose factor loadings in
the proposed models exceeded the value of 1, it was concluded that these results may
result from the social pressure to which these activities are subjected within society.
The proposed models revealed that, in the one-factor structure under the
umbrella name “Preference of Locomotive Organs”, STA and SHO display the weakest
factor loadings. Based on their character and content, they were related to the
determination of lower limb preference. Therefore, with respect to further analysis, it
was decided to divide the one-factor structure into two factors: 1. “Upper Limb
Preference”, 2. “Lower Limb Preference”.
Table 12
Fit of the 2-factor model questionnaire 2. version of test battery without items HS and
HD (adult population)Model Chi-square P-value df CFI TLI RMSEA WRMR
2-factor 26.04 0.016 13 0.98 0.97 0.071 0.573
Upper LimbPreference
NA MAT WE KC
-0.88 0.74 0.59 0.78
Lower LimbPreference
KB STA SHO
0.80 0.38 0.28
0.74
Fig. 14 Path diagram 2-factor model questionnaire 2. version of test battery
without items HS and HD (adult population)

140
This two-factor model in the questionnaire part of the second version of the test
battery finally showed the best model fit. However, this proposed structure did not
achieve a level of diagnostic quality like the resulting structure of the questionnaire part
of the first version of the test battery, which is evident from the values in the residual
matrix.
Table 13
Residual matrix 2-factor model questionnaire 2. version of test battery without items
HS and HD (adult population
Table 14
Generic reliability – questionnaire part 2. version (adult population)
Name of the factor McDonald
Upper Limb Preference 0.83
Lower Limb Preference 0.51
The generic reliability value in the “Lower Limb Preference” factor, McDonald =
0.51, was also unacceptable.
This two-factor model in the questionnaire part of the second version of the test
battery finally showed the best model fit. However, this proposed structure did not
achieve a level of diagnostic quality like the resulting structure of the questionnaire part
of the first version of the test battery, which is evident from the values in the residual
matrix.
141
Summary:
The final form of the questionnaire consists of a one-factor structure from the
first version of the test battery which met all the assumptions of diagnostic quality of the
model acceptability. The CCFA results of the questionnaire parts also suggest that the
items of skilled character for assessing the level of preference for both upper and lower
limbs represent more of a unidimensional structure. This assumption is supported by the
very nature of the testing. The questionnaire determining the degree of preference of
upper and lower limbs has a self-assessment nature, so it is likely that the respondents’
answers may be influenced by subjective opinions. Another possible explanation is the
very nature of the items. Since the tested individuals could choose from five options in
each item, the questions in the questionnaire had to be related to standard activities
known by everybody from everyday life, so every individual is able to determine the
degree of preference in the activity. However, the questions with such a focus in the
self-assessment questionnaire usually display the nature of activities subject to imitation
or social pressure. In the actual result of the modelling of the questionnaire parts,
support for this assumption can be found in the form of weaker factor loadings in
activities that are not subject to the current right-sided world.
The UNL item (Which hand do you use to hold a key when unlocking the door?)
is based on a non-skilled activity, and perhaps for this reason the factor loading is not so
strong. The weakest item in this part of the test battery is SLI (While standing, which of
your lower limbs do you place forward when you want to slide without the support of
your hands?). The character of this item shows the spontaneous activity that is probably
also related to the rotation attribute. However, after removing this item, there was a
significant deterioration of the entire model fit, including the P-value.
12.1.2 Preference Tasks
The data in this part of the test battery is scored dichotomously; therefore, the
WLSMV method was used as a parameter estimation.
Research points out differences between upper and lower limbs (Sahyoun,
2004); therefore, we decided to use the two-factor model:
– “Upper Limb Preference”,
– “Lower Limb Preference”.

142
The motor task LT “Use the tube to look at the object”, which is included in
both versions of the test batteries, was not used in the structural equation modelling
method. In order to express the relationship between this indicator and motor
manifestations of laterality, using the tetrachoric correlation, the LT indicator was
correlated with the final indicators that formed the most suitable model of preference
tasks in the test battery designed for the adult population.
Preference task items of the first version of the test battery:
- Throw the ball at the target. THR
- Erase the line. ER
- Demonstrate how you would comb your hair. CO
- Use the pointer to point at the following object. PO
- Demonstrate how you would spread butter on bread. SPR
- Demonstrate how you would write the letter T on the floor using one of your feet. WT
- Perform standing on one leg. ST
- Kick the ball at the target. KB
- Move the cube on the floor using one of your feet. MC
- Demonstrate a long jump. LJ
Use the tube to look at the object. LT
Table 15
Fit of the 2-factor model preference tasks 1. version of test battery (adult population)
Model Chi-square P-value df CFI TLI RMSEA WRMR
2-factor 83.31 0.0002 34 0.98 0.98 0.069 0.856

143
WT
1.02Upper LimbPreference
CO PO ER SPR
0.98 0.59
Lower LimbPreference
MC ST
0.94 0.88 0.28
THR KB LJ
0.88 0.900.99 0.87 -0.23
Fig. 15 Path diagram 2-factor model preference tasks 1. version of test battery
(adult population)
This model also displayed a Heywood case in the form of a negatively defined
covariance matrix. This time, a correlation greater than 1 was found between upper and
lower limb preference factors. Therefore, this structure proposal was rejected. The
model also reveals collinearity of the indicators THR (Throw the ball at the target) and
PO (Use the pointer to point at the following object) whose regression coefficient, with
respect to the upper limb preference factor, is almost 1. In the lower limb preference
factor, collinearity between KB (Kick the ball at the target) and MC (Move the cube on
the floor using one of your feet) was found. In addition, a weak loading of the LJ item
(Demonstrate a long jump) was found, LJ = -0.23.
Particularly in the indicators determining lower limb preference, the residual
matrix contains very high values, greater than 0.100.
Table 16
Residual matrix 2-factor model preference tasks 1. version of test battery (adult
population)

144
In further modelling, we kept the two-factor structure, but we decided to remove
the PO item, which showed strong collinearity, from the “Upper Limb Preference”
factor. We also removed the MC task, which showed collinearity with the KB task, and
the weakest indicator, the LJ motor task, from the factor.
Table 17
Fit of the 2-factor model preference tasks 1. version of test battery without items PO,
MC and LJ (adult population)Model Chi-square P-value df CFI TLI RMSEA WRMR
2-factor 21.34 0.31 19 0.99 0.99 0.025 0.514
KB
0.99Upper LimbPreference
THR CO ER SPR
1.00 0.90 0.590.89
Lower LimbPreference
WT ST
0.87 0.290.94
Fig. 16 Path diagram 2-factor model preference tasks 1. version of test battery
without items PO, MC and LJ (adult population)
Despite very good model fit index values, this structure was rejected for the
following reasons: The THR indicator (Throw the ball at the target.) displayed the
absolute factor loading equal to 1 in the “Upper Limb Preference” factor. In this model,
a very strong correlation between both factors, r = 0.99, was also found, and the residual
correlation matrix in this model also showed some high residuals, greater than 0.100.

145
Table 18
Residual matrix 2-factor model preference tasks 1. version of test battery without items
PO, MC and LJ (adult population)
In further modelling, we removed the THR indicator whose factor loading was
equal to 1, and we decided to verify the most restrictive two-factor structure with three
indicators for each.
Table 19
Fit of the 2-factor model preference tasks 1. version of test battery without items PO,
MC, LJ a THR (adult population)Model Chi-square P-value df CFI TLI RMSEA WRMR
2-factor 13.90 0.38 8 0.99 1.01 0.019 0.491
KB
0.96Upper LimbPreference
CO ER SPR
0.97 0.56
Lower LimbPreference
WT ST
0.87 0.290.950.89
Fig. 17 Path diagram 2-factor model preference tasks 1. version of test battery
without items PO, MC, LJ a THR (adult population)
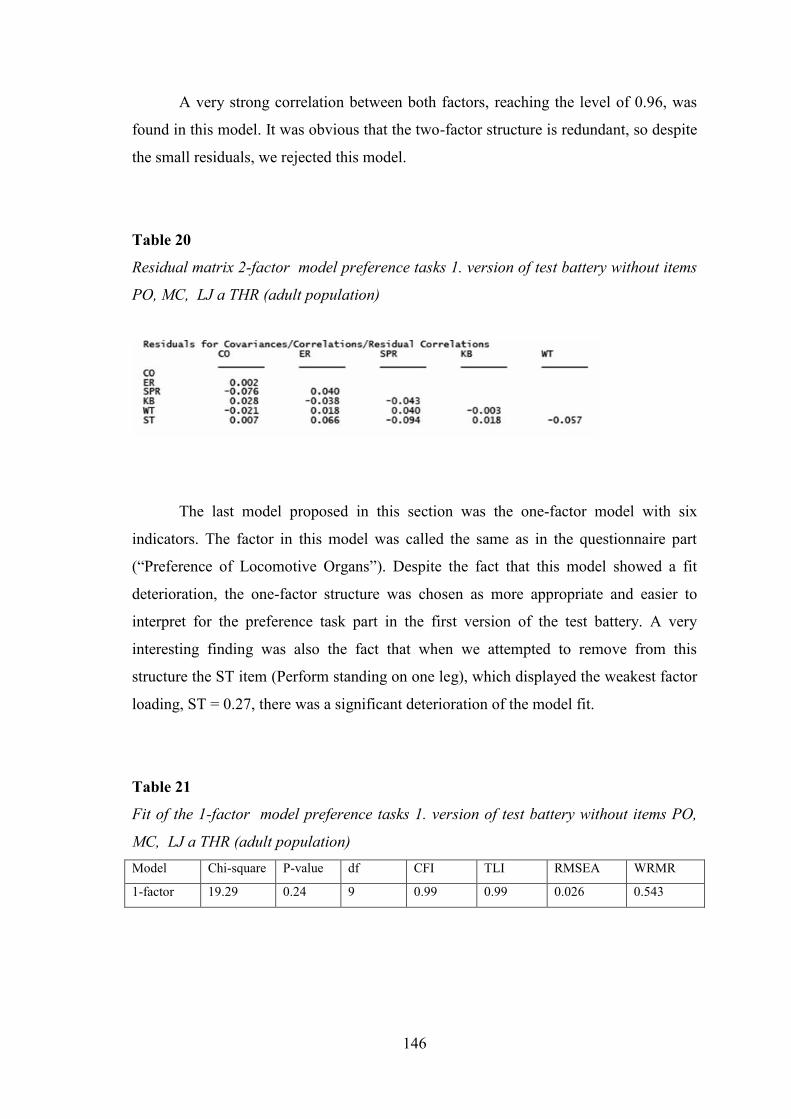
146
A very strong correlation between both factors, reaching the level of 0.96, was
found in this model. It was obvious that the two-factor structure is redundant, so despite
the small residuals, we rejected this model.
Table 20
Residual matrix 2-factor model preference tasks 1. version of test battery without items
PO, MC, LJ a THR (adult population)
The last model proposed in this section was the one-factor model with six
indicators. The factor in this model was called the same as in the questionnaire part
(“Preference of Locomotive Organs”). Despite the fact that this model showed a fit
deterioration, the one-factor structure was chosen as more appropriate and easier to
interpret for the preference task part in the first version of the test battery. A very
interesting finding was also the fact that when we attempted to remove from this
structure the ST item (Perform standing on one leg), which displayed the weakest factor
loading, ST = 0.27, there was a significant deterioration of the model fit.
Table 21
Fit of the 1-factor model preference tasks 1. version of test battery without items PO,
MC, LJ a THR (adult population)Model Chi-square P-value df CFI TLI RMSEA WRMR
1-factor 19.29 0.24 9 0.99 0.99 0.026 0.543

147
Preferenceof Locomotive Organs
CO ER SPR KB WT ST
0.91 0.92 0.270.850.92 0.59
Fig. 18 Path diagram 1-factor model preference tasks 1. version of test battery
without items PO, MC, LJ a THR (adult population)
Table 22
Residual matrix 1-factor model preference tasks 1. version of test battery without items
PO, MC, LJ a THR (adult population)
Table 23
Generic reliability – preference part 1. version (adult population)
Name of the factor McDonald
Preference of Locomotive Organs 0.89
Both in the questionnaire part and in the preference task part of the first version
of the test battery, most high factor loadings were observed in the indicators of a skilled
nature, both with a tool and without a tool. The weakest indicators in this one-factor
structure were SPR (Demonstrate how you would spread butter on bread.) and ST
(Perform standing on one leg.). Despite the nature of the task in the form of a skilled
activity, the SPR indicator only displayed the factor loading of 0.59. Therefore, we
presume that the performance of this task can be affected by the “unenforced” social

148
pressure, i.e., imitation, especially in left-handed individuals. In addition, it is the only
task to involve bimanual activity. The preference task ST, which exhibits a factor
validity of 0.27, was, after consultation, chosen deliberately as a suitable indicator
because of its generality and unskilled nature, with a very low probability of any
imitation. Based on the results, it was concluded that this task measures a different
attribute, not motor organ preference, i.e., lower limb preference in this case.
Preference task items of the second version of the test battery:
- Throw the ball at the target. THR
- Erase the lines. ER
- Ring the bell. RI
- Use the pointer to point at the following objects. POC4
- Clap your hands. CL
- Demonstrate how you would write the letter T on the floor using one of your feet. WT
- Kick the ball at the target. KB
- Perform jumps forward using one leg. HOP
- Perform the basic (starting) position, and then step forward. STO
- Make a 360-degree turn. TU
Use the tube to look at the object. LT
Based on the results from the preference task part in the first version of the test
battery, the one-factor structure “Preference of Locomotive Organs” was first proposed.
Table 24
Fit of the 1-factor model preference tasks 2. version of test battery (adult population)Model Chi-square P-value df CFI TLI RMSEA WRMR
1-factor 68.60 0.0007 35 0.96 0.95 0.069 0.933
4 This task is performed across the natural body axis of the individual

149
Preferenceof Locomotive Organs
CL KB WT
0.41
TU
0.79 0.11
HOPRI
0.52
ER
0.89 1.01 0.77
THR POC STO
0.170.820.91
Fig. 19 Path diagram 1-factor model preference tasks 2. version of test battery
(adult population)
The proposed model contained a Heywood case. The factor loadings of the RI
item (Ring the bell.) was greater than 1. For this reason, this model was rejected, and
the RI item was removed from modelling for further analysis. In this one-factor model,
weak factor loading of the TU item (Make a 360-degree turn.), TU item = 0.11, and
STO item (Perform the basic [starting] position, and then step forward.), STO = 0.17,
were also found. The TU item is likely to have a strong relationship with another latent
variable, probably to the attribute of rotation. With respect to the STO item, an
inappropriate procedure in making motor activity was probably chosen. It is possible
that this item is too general to assess preference.
Table 25
Residual matrix 1-factor model preference tasks 2. version of test battery (adult
population)

150
In subsequent modelling, RI, TU, and STO were removed from the analysis, and
the one-factor structure was again verified using the remaining 7 items.
Table 26
Fit of the 1-factor model preference tasks 2. version of test battery without items RI, TU
and STO (adult population)Model Chi-square P-value df CFI TLI RMSEA WRMR
1-factor 25.12 0.029 14 0.97 0.96 0.064 0.780
Preferenceof Locomotive Organs
ER CL KB
0.89
WT
0.78 0.80
HOPPOC
0.49
THR
0.88 0.81 0.42
Fig. 20 Path diagram 1-factor model preference tasks 2. version of test battery
without items RI, TU and STO (adult population)
After removing the problematic items, the model fit was improved. However,
the model signification was weak, not exceeding the value of 0.05. This model was not
accepted.
Looking at the residual correlation matrix, we can see that this model contains a
number of unexplained residuals that exceed the generally acceptable level of the
absence of explanation, i.e., the value of 0.100.

151
Table 27
Residual matrix 1-factor model preference tasks 2. version of test battery without items
RI, TU and STO (adult population)
These high residuals may indicate a poorly selected number of factors, and,
therefore, it was decided to divide the items into two factors and model a two-factor
structure: 1. “Upper Limb Preference”, 2. “Lower Limb Preference”.
Table 28
Fit of the 2-factor model preference tasks 2. version of test battery without items RI, TU
and STO (adult population)Model Chi-square P-value df CFI TLI RMSEA WRMR
2-factor 13.13 0.43 13 0.99 1.00 0.017 0.494
0.78Upper LimbPreference
THR POC
0.96 0.85 0.460.86
Lower LimbPreference
0.86 0.570.97
ER CL KB WT HOP
Fig. 21 Path diagram 2-factor model preference tasks 2. version of test battery
without items RI, TU and STO (adult population)

152
The proposed model with two separate factors for upper limb preference and
lower limb preference showed a significant improvement of all fit index values,
including the model significance expressed by the P-value = 0.43. Moreover, only one
value greater than 0.100 (KB – ER) was also identified in the residual correlation
matrix.
Table 29
Residual matrix 2-factor model preference tasks 2. version of test battery without items
RI, TU and STO (adult population)
Table 30
Generic reliability – preference tasks 2. version (adult population)
Name of the factor McDonald
Upper Limb Preference 0.89
Lower Limb Preference 0.85
The correlation between the factors at r = 0.78 indicated that the entire model
should have a bi-factor or hierarchical structure. However, the result of the hierarchical
model showed a significant deterioration in the fit of all p < 0.05. The bi-factor structure
displayed a Heywood case, so these models were both rejected.

153
Table 31
Fit of the hierarchic model with one general factor without items RI, TU and STO (adult
population)Model Chi-square P-value df CFI TLI RMSEA WRMR
hierarchic 35.59 0.001 14 0.85 0.80 0.097 1.128
The two-factor structure of preference motor tasks proved to be the most
appropriate in the second version of the test battery (see Table 28); therefore, this model
was accepted for determining the degree of preference.
The relationship of eyedness and preference tasks assessing upper and lower
limb preference:
Along with motor tasks assessing motor organ preference, ocular dominance was
determined in both versions of the test batteries using the LT indicator (Use the tube to
look at the object.). Therefore, we correlated the LT indicator with individual preference
tasks contained by the two-factor model, adopted from the second version of the test
battery.
- Throw the ball at the target. THR
- Erase the lines. ER
- Use the pointer to point at the following objects. POC5
- Clap your hands. CL
- Demonstrate how you would write the letter T on the floor using one of your feet. WT
- Kick the ball at the target. KB
- Perform jumps forward using one leg. HOP
Tetrachoric correlations were used in the matrix. The significance of these
correlations was assessed. The significance of the correlations was set at p < 0.05.
5 This task is performed across the natural body axis of the individual.

154
Table 32
Correlation matrix hand preference tasks and eye dominance (adult population)
*significance correlation p<0.05
Surprisingly, the correlation matrix shows that the LT indicator displays two
significant correlations with motor tasks assessing lower limb preference KB (Kick the
ball at the target) and WT (Demonstrate how you would write the letter T on the floor
using one of your feet) and only one significant correlation with the motor task
assessing upper limb preference (THR), although literature reports 80% lateral
correspondence of hand preference and ocular dominance (measured by means of the
sighting factor) (Bourrasa & McManus, Bryden, 1996).
Summary:
Based on the results of the analysis of the questionnaire part, in the preference
task also we expected strong factor loadings in items of an instrumental or skilled nature
related to upper and lower limb preference. This assumption was confirmed.
The “Upper Limb Preference” factor contains 4 items, none of them displaying
the same course of motor pattern. The character of the motor task THR, based on
throwing at the target, activates the entire upper limb in terms of movement, so this task
involves the work of both distal and proximal parts of the upper limb. Apart from the
motor activation of the entire upper limb, the POC indicator (Use the pointer to point at
the following objects pointing across the natural body axis) also includes determination
of the spatial advantage of pointing at the object. This motor task assumes that the more
varied the upper limb sidedness of the subject is, the higher probability that the person
also uses the non-preferred upper limb when pointing at objects across the natural body
axis. The motor task ER (Erase the lines) particularly activates the area of the hand and

155
fingers. It is, therefore, an activity that mainly involves the distal part of the upper limb
in the movement. The lowest factor loading in this model, in the factor “Upper Limb
Preference”, was displayed by the CL indicator (Clap your hands.). This indicator has
the character of unskilled motor activity that is not subject to any obvious imitation or
pressure of the socially-culture environment. This activity is the only one to display
a bimanual nature. The preferred hand is the controlling hand in this task, and the non-
preferred hand has a supportive function.
The three indicators determining lower limb preference displayed the strongest
factor loadings in the motor task WT (Demonstrate how you would write the letter T on
the floor using one of your feet.). This task has the nature of a static skilled activity that
places emphasis on the right lower limb movement in the sagittal and frontal plane. The
second indicator is KB (Kick the ball at the target.) which represents a skilled task
associated with the control and management of the tool that the subject has to set in
motion in a certain direction. The motor task HOP (Perform jumps forward using one
leg.) places emphasis mainly on the stability of the lower limb in the cyclical jump
movement. This involves unskilled activity that had the weakest correlation to the
“Lower Limb Preference” factor in this model. Compared to the two remaining
indicators, this different tightness of the relationship is probably caused by the unskilled
nature of this task, along with a different foundation of the motor pattern.
12.1.3 Performance Tests
The data in this part of the test battery are of an interval nature. Both versions of
the draft performance tests included tests with the reverse scoring character. These were
the tests in which time was not a constant.
Performance test items of the first version of the test battery:
- Tracing the spiral SP6
- Dot-filling fine motor test DO
- Grip strength using a dynamometer HGR
- Arranging matches within a limited area using tweezers MAC
- Moving beads from one box into another using tweezers TW
- Measuring articular passivity in order to diagnose cerebellar dominance JO
6 Time is not a constant in this test, so the factor loading indicates a negative value.

156
- Lower limb tapping TA
- While standing, slalom with a ball between obstacles using a foot SL7
- While sitting on a chair, rolling a ball on the track in the shape of the number eight
between two points using a lower limb RB8
- While sitting on a chair, moving small cubes from place to place using a foot CM9
The two-factor model was proposed as the starting model, because the human
lower limb is not as adapted to such an extent to fine motor activity as the upper limb.
Factors:
– “Upper Limb Performance”,
– “Lower Limb Performance”.
With respect to the fact that our data met the condition of multivariate normality,
we used the maximum likelihood (ML) method as a parameter estimation.
Table 33
Fit of the 2-factor model performance tests 1. version of test battery (adult population)Model Chi-square P-value df CFI TLI RMSEA SRMR
2-factor 66.27 0.0008 34 0.94 0.92 0.069 0.057
RB
Upper LimbPerformance
SP TW HGR TA CM
-0.65 -0.73
Lower LimbPerformance
MAC DO JO
0.64 0.85 0.570.75-0.81 0.53
SL
-0.310.46
0.57
Fig. 22 Path diagram 2-factor model performance tests 1. version of test battery
(adult population)
7, 8, 9 Time is not a constant in these tests, so the factor loading indicates a negative value.

157
The results of the proposed two-factor structure did not show a satisfactory
model fit. Fit indices CFI and TLI were below average, and the model significance
(P < 0.05) was also unsatisfactory. The residual covariance matrix of this model shows
a large amount of unexplained covariances, i.e., values greater than 2.58.
Table 34
Residual matrix 2-factor model performance tests 1. version of test battery (adult
population)
The most problematic test was clearly the CM test (While sitting on a chair,
moving small cubes from place to place using a foot), whose factor loading is the
weakest in this model (CM = 0.31). Another test which, based on the results, is not
entirely suitable for this section is the HGR test (Grip strength using a dynamometer); it
has the weakest factor validity to the “Upper Limb Performance” factor. The results
also show that although the TA test (Lower limb tapping) displayed the 100%
consensus of experts in assessing the content validity, it exhibits a weak factor loading
(TA = 0.46) in this model.
Based on the results of the two-factor model, it was decided to remove the
weakest item from each factor. In the “Upper Limb Performance” factor, it was the

158
HGR test (Grip strength using a dynamometer) with the factor loading HGR = 0.53.
This test assesses the static strength of the hand which does not involve any movement
that would express the quality or speed of execution. The second removed test was the
CM test (While sitting on a chair, moving small cubes from place to place using a foot)
from the “Lower Limb Performance” factor. The CM indicator showed an insufficient
distinction of differences in the performance of both lower limbs (cohen d < 0.3)
already in the course of testing.
Table 35
Fit of the 2-factor model performance tests 1. version of test battery without items HGR
and CM (adult population)Model Chi-square P-value df CFI TLI RMSEA SRMR
2-factor 36.29 0.0097 19 0.96 0.95 0.068 0.037
RB
Upper LimbPerformance
SP TW TA
-0.65
Lower LimbPerformance
MAC DO JO
0.64 0.85 0.570.75-0.81
SL
0.57
0.46-0.73
Fig. 23 Path diagram 2-factor model performance tests 1. version of test battery
without items HGR and CM (adult population)
After removing the two weakest tests from each factor, the model fit improved,
and the values of the fit indices CFI and TLI allowed us to accept the model, but this
improvement was not sufficient in the P-value. The residual covariance matrix still
displays three values greater than 2.58 (SP – TW, MAC – DO, DO – RB), and there was
no substantial improvement in unexplained residuals.

159
Table 36
Residual matrix 2-factor model performance tests 1. version of test battery without
items HGR and CM (adult population)
The “Upper Limb Performance” factor included an innovative indicator, JO
(Measuring articular passivity in order to diagnose cerebellar dominance), which had
the weakest factor validity (JO = 0.57) in the tested structure. We decided to remove the
test from the next model and verify whether the nature of this test does not affect the
quality of the whole structure.
Table 37
Fit of the 2-factor model performance tests 1. version of test battery without items
HGR, CM and JO (adult population)Model Chi-square P-value df CFI TLI RMSEA SRMR
2-factor 22.48 0.048 13 0.97 0.96 0.061 0.034

160
RB
Upper LimbPerformance
SP TW TA
Lower LimbPerformance
DO SL
0.56
MAC
-0.81 0.62 0.76 0.85 -0.66 -0.73 0.48
Fig. 24 Path diagram 2-factor model performance tests 1. version of test battery
without items HGR, CM and JO (adult population)
However, after removing the JO indicator (Measuring articular passivity in order
to diagnose cerebellar dominance), there was no significant improvement in the entire
model fit. Moreover, the residual covariance matrix shows that there is one value that
greatly exceeds the value of 2.58 (SP – TW) and that there are two other values which
are close to the value of 2.58 (MAC – DO and DO – RB). It was revealed, therefore,
that this test does not affect the proposed structure.
Table 38
Residual matrix 2-factor model performance tests 1. version of test battery without
items HGR, CM and JO (adult population)

161
The TW indicator (Moving beads from one box into another using tweezers) was
eventually removed due to an insufficient distinction of differences in the performance
of both lower limbs, where the substantive significance of this test was below average.
In this case, cohen d = 0.4. The last model proposed in this section was a two-factor
model without the HGR indicator (grip strength using a dynamometer), CM indicator
(while sitting on a chair, moving small cubes from place to place using a foot), and TW
indicator (Moving beads from one box into another using tweezers).
Table 39
Fit of the 2-factor model performance tests 1. version of test battery without items
HGR, CM and TW (adult population)Model Chi-square P-value df CFI TLI RMSEA SRMR
2-factor 21.48 0.078 13 0.98 0.97 0.055 0.032
RB
Upper LimbPerformance
SP MAC TA
-0.64
Lower LimbPerfromance
JO
0.77 0.56-0.83
SL
0.48
0.56
-0.76
DO
0.82
Fig. 25 Path diagram 2-factor model performance tests 1. version of test battery
without items HGR, CM and TW (adult population)
This two-factor model without the HGR, CM, and TW indicators, which showed
a further slight improvement in the model fit and signification, was finally determined
as the most appropriate model in the first version of the test battery. The results of the
residual covariance matrix also show that a number of high residuals were reduced in
this model – to only one value greater than 2.58 (DO – RB).

162
Table 40
Residual matrix 2-factor model performance tests 1. version of test battery without
items HGR, CM and TW (adult population)
Table 41
Generic reliability – performance tests 1. version (adult population)
Name of the factor McDonald ω
Upper Limb Performance 0.83
Lower Limb Performance 0.66
The results of the performance tests of the first version of the test battery have
shown that the performance of human motor organs is composed of two different
dimensions: “Upper Limb Performance” and “Lower Limb Performance”. This finding
could be explained by the fact that upper limbs are relaxed, compared to lower limbs,
and they are adapted primarily to manipulation, whereas lower limbs primarily perform
a support function. The SP indicator (tracing the spiral), MAC indicator (Arranging
matches within the limited area using tweezers), and DO indicator (Dot-filling fine
motor test) related to the factor “Upper Limb Performance” represent fine motor tests,
while the MAC test involves the entire upper limb in the activity. The SP and DO tests
mainly involve the hand and fingers. The strength of relations of these indicators to the
“Upper Limb Performance” factor confirms the results of the studies (Annett, 2002)
which indicate that the more a test is of a fine-motor nature, the more the performance

163
of both limbs differs (Annett, 2002; Brown et al., 2006). In the “Lower Limb
Performance” factor, the strongest indicators in this version of the test battery were the
tests of a manipulative nature, i.e., SL (While standing, slalom with a ball between
obstacles using a foot) and RB (While sitting on a chair, rolling a ball on the track in the
shape of the number eight between two points using a lower limb). An interesting result
in this part of the first version of the test battery is that the model fit and its significance
are lower than in the models in the previous two parts of the test battery. This is
probably due to the size of factor loadings of the indicators in the “Lower Limb
Performance” factor, in which an unacceptable value of generic reliability (McDonald ω
= 0.66) has been found.
As in the previous section, the confirmatory factor analysis for interval data was
used for analysing the data from the performance tests of the second version of the test
battery. The performance tests included four tests with a reverse scoring nature. These
were the indicators SP, SL, MF, and TDS, in which “time” was not a constant.
Performance test items from the second version of the test battery:
- Tracing the spiral: SP10
- Dot-filling fine motor test: DO
- Pegboard test: PG
- Threading beads on a metal wire: STB
- Collecting toothpicks (matches): PT
- Measuring articular passivity in order to diagnose cerebellar dominance: JO
- Lower limb tapping: TA
- While standing, slalom with a ball between obstacles: SL11
- While sitting on a chair, moving a cube in the “maze” provided: MF12
- While sitting on a chair, taking off a knitted sock from one foot using the other foot:
TDS13
10, 11, 12, 13 Time is not a constant in these tests, so the factor loadings indicates a negative values.

164
Based on the previous modelling, the two-factor structure was first verified:
Factors:
– “Upper Limb Performance”,
– “Lower Limb Performance”.
As the data from the second version also met the condition of multivariate
normality, we used the maximum likelihood (ML) method as a parameter estimation
again.
Table 42
Fit of the 2-factor model performance tests 2. version of test battery (adult population)Model Chi-square P-value df CFI TLI RMSEA SRMR
2-factor 142.56 <0.000 34 0.83 0.77 0.126 0.063
SL
Upper LimbPerformance
STB PG DO
0.41
Lower LimbPerformance
TA TDS
-0.64 -0.190.66
PTSP JO MF
-0.55 0.86-0.70 0.540.790.65
0.61
Fig. 26 Path diagram 2-factor model performance tests 2. version of test battery
(adult population)
The fit of the two-factor model with all performance tests in the second version
of the test battery showed a very poor model fit. All fit indices were significantly below
average, which was subsequently also reflected in the values of standardized covariance
residuals, which reached extreme values (SP – DO, STB – PG, PG – DO, JO – PG).

165
Table 43
Residual matrix 2-factor model performance tests 2. version of test battery (adult
population)
Very interesting findings were yielded by the results, particularly in the second
factor, “Lower Limb Performance”. The strongest factor loading was revealed by the
TA test (Lower limb tapping), TA = 0.86, which is a significantly closer relationship of
this indicator to the “Lower Limb Performance” factor than in the first version of the
test battery. Additional support for the hypothesis about the relationship between
cerebellar dominance and motor manifestations of laterality was brought by the JO test
(Measuring articular passivity in order to diagnose cerebellar dominance), which also in
the second version of the performance tests showed a significant factor validity of JO =
0.54. The weakest factor loading was displayed by the TDS indicator (While sitting on a
chair, taking off a knitted sock from one foot using the other foot), TDS = -0.19. In the
diagnosis alone, this test showed a strong variability with no clear recognition of
differences in the skill of the lower limb, and was, therefore, removed in further
modelling. In the factor “Upper Limb Performance”, the weakest factor loading was
displayed by the PT test (Collecting toothpicks). This test also showed a very weak
sensitivity in determining the difference in the performance between the upper limbs,
cohen d < 0.3. In further modelling, we removed both of these tests, as they did not
measure the latent variable we determined.

166
Table 44
Fit of the 2-factor model performance tests 2. version of test battery without items PT
and TDS (adult population)Model Chi-square P-value df CFI TLI RMSEA SRMR
2-factor 99.39 <0.000 19 0.87 0.80 0.118 0.065
SL
Upper LimbPerformance
KOR PG DO
Lower LimbPerformance
TA
-0.680.75
SP KP NB
-0.57 0.86-0.73 0.540.790.66
0.61
Fig. 27 Path diagram 2-factor model performance tests 2. version of test battery
without items PT and TDS (adult population)
However, even after removing the two weakest indicators, PT (Collecting
toothpicks) and TDS (While sitting on a chair, taking off a knitted sock from one foot
using the other foot), from the previous model, this proposed structure did not display
any fit improvement, and all the acquired values were still significantly below average.
Likewise, there was no improvement in values in the residual covariance matrix, which
still contained a number of extreme values (PG – STB, PG – DO, PG – JO, STB – DO).
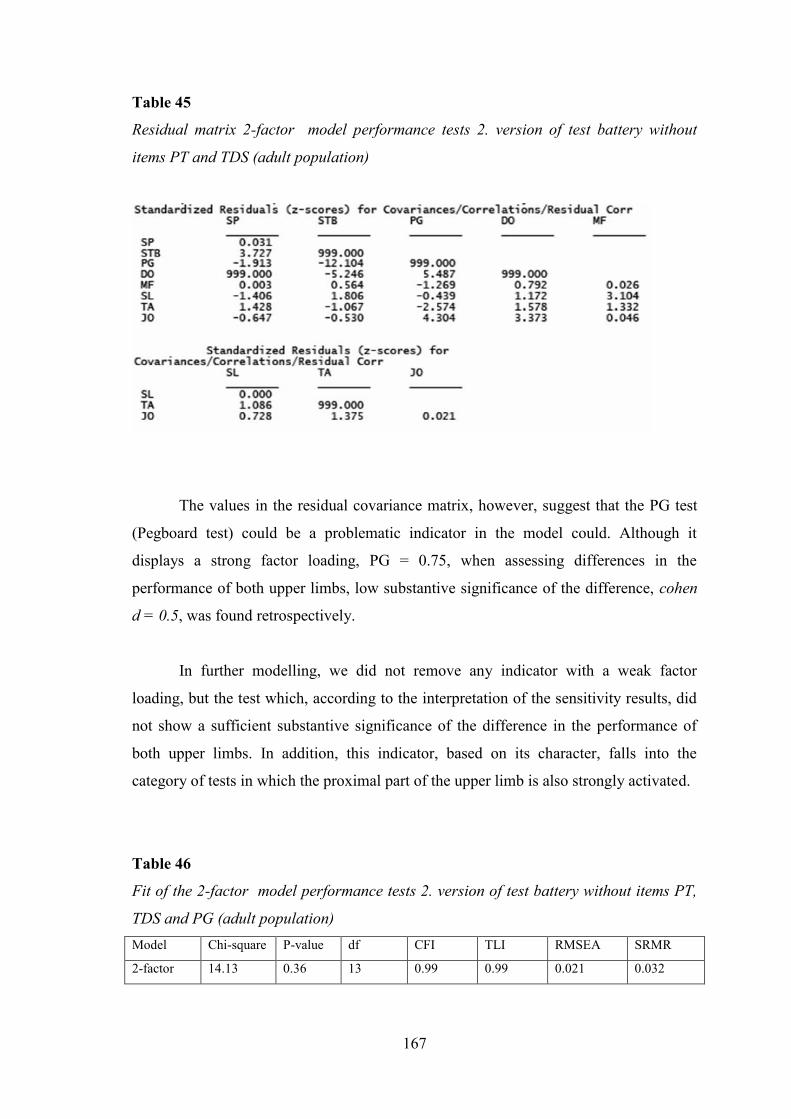
167
Table 45
Residual matrix 2-factor model performance tests 2. version of test battery without
items PT and TDS (adult population)
The values in the residual covariance matrix, however, suggest that the PG test
(Pegboard test) could be a problematic indicator in the model could. Although it
displays a strong factor loading, PG = 0.75, when assessing differences in the
performance of both upper limbs, low substantive significance of the difference, cohen
d = 0.5, was found retrospectively.
In further modelling, we did not remove any indicator with a weak factor
loading, but the test which, according to the interpretation of the sensitivity results, did
not show a sufficient substantive significance of the difference in the performance of
both upper limbs. In addition, this indicator, based on its character, falls into the
category of tests in which the proximal part of the upper limb is also strongly activated.
Table 46
Fit of the 2-factor model performance tests 2. version of test battery without items PT,
TDS and PG (adult population)Model Chi-square P-value df CFI TLI RMSEA SRMR
2-factor 14.13 0.36 13 0.99 0.99 0.021 0.032

168
0.58
SL
Upper LimbPerformance
STB DO
Lower LimbPerformance
TA
-0.72
SP JO MF
-0.61 0.84-0.83 0.580.870.64
Fig. 28 Path diagram 2-factor model performance tests 2. version of test battery
without items PT, TDS and PG (adult population)
The two-factor model without the PG indicator (Pegboard test) showed a
significant improvement in all values of fit indices. Moreover, the values of CFI, TLI,
and RMSEA reached the level of a very good model fit. The signification of the model
P – the value of 0.36 – was also considerable. It was thus confirmed that the character
and low sensitivity of the PG test had a profound impact on the quality of the entire
model. The removing of the PG test was also reflected in the residual covariance matrix,
where the value of the residuals decreased significantly. Only two values in the matrix
were greater than 2. Therefore, this two-factor model without the PT, TDS, and PG tests
was chosen as the best.
Table 47
Residual matrix 2-factor model performance tests 2. version of test battery without
items PT, TDS and PG (adult population)

169
Table 48
Generic reliability – performance tests 2. version (adult population)
Name of the factor McDonald ω
Upper Limb Performance 0.82
Lower Limb Performance 0.78
Summary:
In order to diagnose motor manifestations of laterality using performance tests
the two-factor model, obtained from the second version of the test battery, was adopted.
This model displayed a very good fit with a high diagnostic quality with two different
factors. The final form of the adopted model of the performance test part contained
seven performance indicators. They were fine motor tests, gross motor tests, and an
indicator determining articular passivity. The correlation between the two factors is at
r = 0.58, which is a very similar result as in the performance test part in the first version
of the test battery. In the second version of the test battery, it is also clear that human
motor organ performance consists of two clearly distinct dimensions: “Upper Limb
Performance” and “Lower Limb Performance”. These findings in both versions of the
test battery with some different indicators support the hypothesis of different motor
control and control of the upper and lower limb motion in relation to their functional
nature in human life.
The SP and DO indicators, as in fine motor tests, displayed a close relation to the factor
“Upper Limb Performance”. A weaker factor validity was shown by the STB test
(Moving beads), STB = 0.64. Although this test was sensitive in distinguishing
differences in the performance of both upper limbs, it also exhibited considerable
variability, which could be caused by a covariance variable in the form of the amount of
sweat on fingers when handling the beads. The last indicator in the “Upper Limb
Performance” factor was the JO test (Measuring articular passivity in the wrist). The JO
test had the weakest factor validity in this factor, but, with respect the nature of this test,
it was understandable. By contrast, a very interesting finding was that the JO indicator
retained an almost unchanged factor loading, JO = 0.58, also in the second version of
the test battery. This fact suggests a relationship between motor manifestations of
laterality and cerebellar dominance. In the “Lower Limb Performance” factor, which

170
includes three tests, the TA test (Lower limb tapping), TA = 0.84, was the strongest
indicator. As opposed to the modelling in the first part of the test battery, this was a new
finding. The different strength of the relationship of the TA test in both versions could
be caused by errors in the calculations of the examiner. According to the study by
Fremelová & Blahutková (2004), this indicator should have a strong relationship with
the lower limb performance attribute. The remaining two tests of the “Lower Limb
Performance” factor, MF (While sitting on a chair, moving a cube in the “maze”
provided) and SL (While standing, slalom with a ball between obstacles), had a nature
of manipulative activity, and, therefore, both of these indicators showed similar factor
loadings. A stronger relationship of the MF test (MF = –0.72) to this factor could be
caused by the fact that this test was carried out while sitting. Both lower limbs were
relaxed, and only one of them worked in the activity itself. In the SL test (SL = –0.61),
which was performed while standing, one lower limb had a leading function – handling
the ball, and the other lower limb had a supportive function – ensuring stability. The
activity thus involved the co-operation of both lower limbs. In the test, this could result
in affecting the outcome, in terms of different capability of stability of each lower limb.
12.2 Test Battery for Child PopulationA total of four hundred probands participated in the research (193 boys and 207
girls) aged from 8 to 10 years (average age 9.1 years). They were students of Prague
primary schools without a specific specialization (arts, technology, sports, languages).
The entire research sample was divided into two subsets, each including 200 probands.
The first subset, marked as A, consisted of 96 boys and 104 girls. The second subset,
marked as B, consisted of 97 boys and 103 girls.
The subset A was diagnosed using the first version of the test battery; the subset
B was diagnosed using the second version of the test battery. Both versions of the test
battery contained a preference motor task part and a performance tests part.
12.2.1 Preference Tasks
The data in this part of the test battery is of a categorical nature, and it is scored
dichotomously. Indicators were also used where the activity in motor tasks is repeated
several times. The WLSMV method was used as a parameter estimation.

171
The ontogeny of children’s motor skills is different in upper and lower limbs.
Lower limbs are lateralized later in children. Therefore, it was decided to use the two-
factor model:
1. “Upper Limb Preference”,
2. “Lower Limb Preference”.
The motor task “Use the tube to look at the object. LT”, which is included in
both versions of the test battery, was not used in the structural equation modelling
method. In order to express the relationship between this indicator and motor
manifestations of laterality, the LT indicator was correlated, using tetrachoric
correlations, with the final indicators that formed the most suitable preference task
model for the test battery designed for the child population.
Preference task items from the first version of the test battery:
- Draw a leaf according to the model. DM
- Take the bell in one hand and ring it. RI
- Take the ball in one hand and throw it at the target. THR
- According to the instructions, turn the cards of the given colours placed on the sheet
of paper. CAB14
- Create a line in the marked space using matches. MAR15
- Show how many points you can roll with the dice on three attempts. CTH
- Demonstrate how you brush your teeth. TC
- Open the box. OPB
- Kick the ball placed on the floor at the target. KB
- Using one foot, tap the rhythm that I am clapping. TR
- While standing, demonstrate how you slide without the support of your hands. SLI
- Stretch your arms sideways and make a 360-degree turn around your axis. TU
- Move the cube along the line on the floor using one of your feet. CM
Use the tube to look at the object. LT
14, 14 These tasks can be performed across the natural body axis of the individual

172
As in the test battery for the adult population, the relationship of the motor task
determining ocular dominance using the sighting factor with the upper limb preferences
and lower limb preference factor was also tested for each model.
Table 49
Fit of the 2-factor model preference tasks 1. version of test battery (child population)Model Chi-square P-value df CFI TLI RMSEA WRMR
2-factor 208.54 <0.0000 64 0.95 0.95 0.118 1.535
0.73Upper LimbPreference
0.90
Lower LimbPreference
1.01 -0.420.86
TC THR RI DM CAB MAR CTH OPB CM KB TR SLI TU
1.03 0.92 1.01 0.93 0.94 0.44 0.90 0.84 0.52
Fig. 29 Path diagram 2-factor model preference tasks 1. version of test battery
(child population)
In the first model tested, a Heywood case was found, so this model was rejected.
Factor loadings greater than 1 were found in the TC indicator (Demonstrate how you
brush your teeth.), DM indicator (Draw a leaf according to the model.), and CM
indicator (Move the cube along the line on the floor using one of your feet.). For further
analysis, these indicators were removed due to collinearity with other motor tasks. In
the “Upper Limb Preference” factor, the OPB task (Open the box.), OPB = 0.44, was
the motor task with the weakest factor loading, which could be explained by the nature
of this indicator. Unlike other motor tasks, it involves a bimanual activity. In the
“Lower Limb Preference” factor, the TU indicator (Stretch your arms sideways and
make a 360-degree turn around your axis.), TU = –0.42, was found to be the weakest,
which is also associated with the rotation attribute. The results of the residual
correlation matrix show a considerable amount of unexplained residuals greater than
0.100.

173
Table 50
Residual matrix 2-factor model preference tasks 1. version of test battery (child
population)
Another proposed model was the two-factor model without the TC, DM, and
CM indicators, which were removed due to collinearity.
Table 51
Fit of the 2-factor model preference tasks 1. version of test battery without items TC,
DM and CM (child population)Model Chi-square P-value df CFI TLI RMSEA WRMR
2-factor 49.96 0.038 34 0.98 0.97 0.048 0.630

174
TRTHR RI CAB SLI TUMAR OPBCTH KB
0.72Upper LimbPreference
0.92
Lower LimbPreference
-0.430.94 0.90 0.92 0.94 0.43 0.91 0.87 0.54
Fig. 30 Path diagram 2-factor model preference tasks 1. version of test battery
without items TC, DM and CM (child population)
After removing the problematic indicators, the entire model fit was improved.
All fit indices in this two-factor structure showed values that reached a good model fit.
The results of the residual matrix displayed some improvement, but the OPB indicator
(Open the box.) clearly proved to be problematic. This preference task is of a bimanual
nature, and thus could affect the unidimensionality of the “Upper Limb Preference”
factor.
Table 52
Residual matrix 2-factor model preference tasks 1. version of test battery without items
TC, DM and CM (child population)

175
This model showed an unsatisfactory significance, P-value = 0.038. The
correlation between the factors at r = 0.72 indicated that the upper limb preference
attribute and lower limb preference attribute probably have a common basis in the
background, “motor organ preference”. This common basis, however, has a certain
degree of uniqueness in each factor that does not allow us to consider the upper limb
preference and lower limb preference diagnosed by motor tasks as unidimensional. It
was interesting to find in the “Preference o upper limb” factor strong factor loadings of
the CAB indicator (According to the instructions, turn the cards of the given colours
placed on the sheet of paper.), CAB = 0.90, and MAR indicator (Create a line in the
marked space using matches.), MAR = 0.92, where the emphasis is placed on the
activity of upper limbs, even across the natural body axis.
In the following modelling procedure, it was decided to maintain the two-factor
structure, from which the bimanual activity character indicator, OPB, was removed.
This step was taken in order to maintain the unidimensionality of the “Upper Limb
Preference” factor.
Table 53
Fit of the 2-factor model preference tasks 1. version of test battery without items TC,
DM, CM and OPB (child population)Model Chi-square P-value df CFI TLI RMSEA WRMR
2-factor 26.71 0.22 26 0.99 0.99 0.034 0.534
TRTHR RI CAB SLI TUMAR CTH KB
0.71Upper LimbPreference
0.90
Lower LimbPreference
-0.450.91 0.88 0.91 0.93 0.90 0.86 0.54
Fig. 31 Path diagram 2-factor model preference tasks 1. version of test battery
without items TC, DM, CM and OPB (child population)

176
By removing the OPB indicator, the entire two-factor model fit was significantly
improved, including the value of the P-value, which was at an acceptable level of P-
value = 0.22. The assumption that the bimanual motor task OPB may affect the
structure by its character proved to be justified.
The residual matrix was also improved; no values greater than 0.100 were
detected.
Table 54
Residual matrix 2-factor model preference tasks 1. version of test battery without items
TC, DM, CM and OPB (child population)
Table 55
Generic reliability – preference tasks 1. version (child population)
Name of the factor McDonald ω
Upper Limb Preference 0.95
Lower Limb Preference 0.81
This two-factor structure with nine motor indicators finally proved to be the
most appropriate in this first version of the test battery.
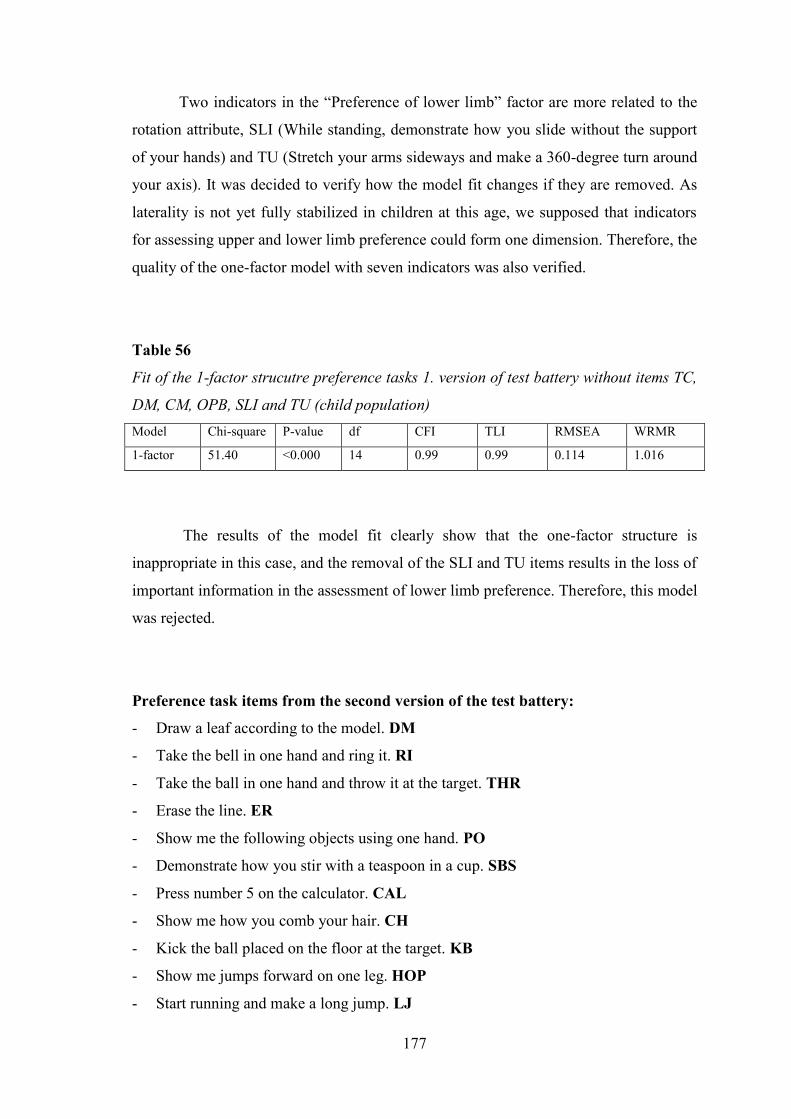
177
Two indicators in the “Preference of lower limb” factor are more related to the
rotation attribute, SLI (While standing, demonstrate how you slide without the support
of your hands) and TU (Stretch your arms sideways and make a 360-degree turn around
your axis). It was decided to verify how the model fit changes if they are removed. As
laterality is not yet fully stabilized in children at this age, we supposed that indicators
for assessing upper and lower limb preference could form one dimension. Therefore, the
quality of the one-factor model with seven indicators was also verified.
Table 56
Fit of the 1-factor strucutre preference tasks 1. version of test battery without items TC,
DM, CM, OPB, SLI and TU (child population)Model Chi-square P-value df CFI TLI RMSEA WRMR
1-factor 51.40 <0.000 14 0.99 0.99 0.114 1.016
The results of the model fit clearly show that the one-factor structure is
inappropriate in this case, and the removal of the SLI and TU items results in the loss of
important information in the assessment of lower limb preference. Therefore, this model
was rejected.
Preference task items from the second version of the test battery:
- Draw a leaf according to the model. DM
- Take the bell in one hand and ring it. RI
- Take the ball in one hand and throw it at the target. THR
- Erase the line. ER
- Show me the following objects using one hand. PO
- Demonstrate how you stir with a teaspoon in a cup. SBS
- Press number 5 on the calculator. CAL
- Show me how you comb your hair. CH
- Kick the ball placed on the floor at the target. KB
- Show me jumps forward on one leg. HOP
- Start running and make a long jump. LJ

178
- Demonstrate how you would write the letter T on the floor using one of your feet.
WT
- Step on the platform. GOS
Use the tube to look at the object. LT
Based on the results in the preference task part of the first version of the test
battery, the two-factor structure was first proposed in the same part of the second
version of the test battery for the child population.
Table 57
Fit of the 2-factor model preference tasks 2. version of test battery (child population)Model Chi-square P-value df CFI TLI RMSEA WRMR
2-factor 105.73 0.013 64 0.97 0.97 0.054 0.790
0.92 Lower LimbPreference
KB PSP ODR PO ST
0.93 1.02 -0.21 0.72 0.44
Upper LimbPreference
RI CH PO KB HOP GOS
0.97 0.89 0.90 0.90 0.66 -0.36
Fig. 32 Path diagram 2-factor model preference tasks 2. version of test battery
(child population)
As in the preferential motor task part in the first version of the test battery for the
child population, this two-factor model also displayed a Heywood case. Therefore, this
model was rejected. The “Upper Limb Preference” factor exhibited a strong
multicollinearity of the THR indicator (Take the ball in one hand and throw it at the
target.), DM indicator (Draw a leaf according to the model.), ER indicator (Erase the

179
line.), SBS indicator (Demonstrate how you stir with a teaspoon in a cup.), and CAL
indicator (Press number 5 on the calculator.). This multicollinearity is probably based
on the nature of the items through which a very similar or even identical movement
pattern is activated. From this perspective, an assumption has been inferred that these
items are redundant in this factor, and they were not selected appropriately. The “Lower
Limb Preference” factor displayed collinearity between the KB indicator (Kick the ball
placed on the floor at the target.) and WT indicator (Demonstrate how you would write
the letter T on the floor using one of your feet.). On the contrary, the LJ item
(Demonstrate a long jump.) was the weakest indicator in this factor, LJ = –0.21. During
the test itself this item pointed out its inappropriateness of use, due to the incomplete
lateralization stabilizing process of the lower limb in jumping activities. This indicator
proved to be the most problematic in the residual matrix, where most of the unexplained
residuals were related to this motor task.
Table 58
Residual matrix 2-factor model preference tasks 2. version of test battery (child
population)

180
The entire model exhibited a strong correlation between the two factors, r =
0.92, which suggests that in this case the indicators used could form a bi-factor structure
with a general factor in the background. In the further analysis, all the aforementioned
problematic indicators (THR, DM, ER, SBS, CAL, WT), including the LJ indicator,
were rejected. A bi-factor structure in which the correlations between the individual
factors were fixed to 0 was also tested. The general factor in the background was termed
“Preference of Locomotive Organs”.
Table 59
Fit of the bi-factor model preference tasks 2. version of test battery without items THR,
DM, ER, SBS, CAL, WT and LJ (child population)Model Chi-square P-value df CFI TLI RMSEA WRMR
bi-factor 27.69 0.002 10 0.98 0.96 0.094 0.751
0.00
CH PO KB HOPRI GOS
Preferenceof Locomotive Organs
0.93 0.670.851.04 0.92 -0.38
Lower LimbPreference
Upper LimbPreference
-0.060.050.06-0.09-0.100.07
Fig. 33 Path diagram bi-factor model preference tasks 2. version of test battery
without items THR, DM, ER, SBS, CAL, WT and LJ (child population)
The RI (Ring the bell) indicator factor loading in this proposed bi-factor
structure was greater than 1, which again represented a Heywood case. Therefore, the
model was rejected. The results in this model, however, supported the hypothesis that

181
the indicators of preference motor tasks in this version of the test battery probably form
a unidimensional structure with the “Preference of Locomotive Organs” factor.
The last proposed structure was the one-factor model with six indicators.
Table 60
Fit of the 1-factor model preference tasks 2. version of test battery without items THR,
DM, ER, SBS, CAL, WT and LJ (child population)Model Chi-square P-value df CFI TLI RMSEA WRMR
1-factor 30.90 0.0057 14 0.96 0.95 0.078 0.883
Preferenceof Locomotive Organs
RI CH PO KB HOP GOS
0.96 0.89 0.84 0.88 0.66 -0.37
Fig. 34 Path diagram 1-factor model preference tasks 2. version of test battery
without items THR, DM, ER, SBS, CAL, WT and LJ (child population)
Although the results of the one-factor model did not show a Heywood case, the
quality of the model was not acceptable. In particular, the RMSEA index (RMSEA =
0.078) only displayed an average value, and the same applied to WRMW (WRMW =
0.883). Furthermore, this proposed one-factor structure was below the chosen level of
the model signification, 0.05, and the P-value was in this case only 0.0057. We assume
that this model is too restrictive for quality assessing preference.
Although the value of generic reliability reached an acceptable level (table 61),
this model was for previous reasons rejected.

182
Table 61
Generic reliability – preference tasks 2. version (child population)
Name of the factor McDonald
Preference of Locomotive Organs 0.88
The relationship between eyedness and preference tasks assessing upper and
lower limb preference:
Along with motor tasks assessing motor organ preference, ocular dominance was
determined in both versions of the test batteries using the LT indicator (Use the tube to
look at the object.). We thus correlated the LT indicator (Use the tube to look at the
object.) with the individual preference tasks included in the adopted two-factor model
from the first version of the test battery.
- Take the ball in one hand and throw it at the target. THR
- Take the bell in one hand and ring it. RI
- According to the instructions, turn the cards of the given colours placed on the sheet
of paper. CAB16
- Create a line in the marked space using matches. MAR17
- Show how many points you can roll with the dice on three attempts. CTH
- Kick the ball placed on the floor at the target. KB
- Using one foot, tap the rhythm that I am clapping. TR
- Stretch your arms sideways and make a 360-degree turn around your axis. TU
- While standing, demonstrate how you slide without the support of your hands. SLI
16, 16 These tasks can be performed across the natural body axis of the individual

183
Table 62
Correlation matrix hand preference tasks and eye dominance (children population)
*significance correlation p< 0.05
** significance correlation p< 0.01
The correlation matrix shows that the LT indicator that determines the ocular
dominance factor, through the sighting factor, significantly correlates with a total of
three motor tasks assessing upper limb preference and two motor tasks assessing lower
limb preference. Three of these motor tasks even displayed a significant correlation p <
0.01. However, the results show that a stronger relationship is observed between the LT
indicator and motor tasks assessing lower limb preference, just as in the correlation
matrix for the adult population. The KB (Kick the ball placed on the floor at the target)
and TR (Using one foot, tap the rhythm that I am clapping) indicators showed a
significant correlation with the LT indicator at the significance level of p < 0.01.
Summary:
The final form of the preference motor task part for the child population is
composed of a two-factor structure with nine indicators from the first version of the test
battery. This structure met all requirements of the diagnostic quality of an acceptable
model. The results show that the indicators in the “Upper Limb Preference” factor,
where the subjects worked across the natural body axis, CAB (According to the

184
instructions, turn the cards of the given colours placed on the sheet of paper.) and MAR
(Create a line in the marked space using matches.) very well indicated the strength of
the upper limb preferences. The “Upper Limb Preference” factor also contains three
different motor indicators:
– the THR indicator (Throw the ball at the target.), involving both proximal and
distal parts of the upper limb in movement,
– the RI indicator (Ring the bell.), involving mainly the distal part of the upper
limb in movement,
– the CTH indicator (Show how many points you can roll with the dice on three
attempts.), which is a combination of the movements of the two previous motor
tasks.
The “Lower Limb Preference” factor contains four indicators. A very strong
relationship with this factor was found in the motor tasks KB (Kick the ball at the
target.) and TR (Using one foot, tap the rhythm that I am clapping.). While the KB task
is a traditional motor task involving both lower limbs in the activity (one has a control
function – kicking; the other has a stabilizing function), the TR indicator is designed to
allow the subject to have both lower limbs relaxed. This condition is fulfilled by the fact
that the subject is sitting on a chair while performing this motor task. The other two
indicators, SLI (While standing, demonstrate how you slide without the support of your
hands) and TU (Stretch your arms sideways and make a 360-degree turn around your
axis), are more related to the assessment of the rotation attribute. However, recent
studies show that there is a significant relationship between lower limb preference and
rotation (Mohr, Landis, Bracha, & Brugger, 2003; Štochl & ,Croudace, 2012, in press).
In performing these tasks, lower limb preference is assessed indirectly.
12.2.2 Performance Tests
The data in this part of the test battery are of an interval nature. Both versions of
the proposed performance tests contained tests with the reverse scoring character. These
were the tests in which time was not a constant.

185
Performance test items from the first version of the test battery:
- Tracing the spiral SP18
- Moving beads from one box into another using tweezers TW
- Dot-filling fine motor test DO
- Measuring articular passivity in order to diagnose cerebellar dominance JO
- Moving matches using a hand PM
- Threading beads on a metal wire STB
- Turning a box alternately with the front and the rear side on the table BTW
- Lower limb tapping TA
- Slalom with a ball between obstacles SL19
- Kicking a ball against the wall RKB
In the performance test part, the two-factor model was first tested. Conceptually,
this model was based on the theory that, viewed functionally, upper and lower limbs are
controlled differently. In addition, it was assumed for the child population that the lower
limb would not display such a degree of lateralization due to its slower motor ontogeny.
Factors:
– “Upper Limb Performance”,
– “Lower Limb Performance”.
–With respect to the fact that our data met the condition of multivariate normality,
we used the maximum likelihood (ML) method as a parameter estimation.
Table 63
Fit of the 2-factor model performance tests 1. version of test battery (child population)Model Chi-square P-value df CFI TLI RMSEA SRMR
2-factor 98.93 <0.000 34 0.90 0.87 0.098 0.076
18 Time is not a constant in this test, so the factor loading indicates a negative value19 Time is not a constant in this test, so the factor loading indicates a negative value

186
TA
0.61Upper Limb
Performance
DO JO PM
0.47
Lower LimbPerformance
SL RKB
0.320.61
TWSP STB BTW
0.92 -0.43-0.80 0.780.160.81 0.70
Fig. 35 Path diagram 2-factor model performance tests 1. version of test battery
(child population)
Based on all fit indices, the results from this two-factor structure show a weak
model fit. Therefore, this model was rejected. The PM test (Moving matches using a
hand) (PM = 0.16) proved to be highly problematic in the “Upper Limb Performance”
factor. During the actual data collection the PM test already showed very low sensitivity
in determining differences in the performance of upper limbs, cohen d < 0.5. In
addition, in this test, upper limb dexterity often did not correspond with the results of
the fine motor tests, SP (Tracing the spiral) and DO (Dot-filling fine motor test). An
important finding was the relationship between the “Upper Limb Performance” factor
and the JO test (Measuring articular passivity in order to diagnose cerebellar
dominance) (JO = 0.61). It was at a very similar level as in the adult population. This
result suggests that the upper limb muscle tonus is genetically determined, and,
therefore, this indicator has a similarly strong relationship with the “Upper Limb
Performance” factor for both children and adults. The test results pertaining to the
“Lower Limb Performance” factor displayed a weak relationship between the SL test
(Slalom with a ball between obstacles) and RKB test (Kicking a ball against the wall).
These tests have a manipulative nature, and it is likely that in these motor activities they
showed a weaker lower limb lateralization in children. In the course of performing both
tests, stability, balance, and handling problems were observed. This resulted in an
unclear determination of the “more skilled” lower limb.
The problems with tests for the lower limb showed that assessing differences in
the performance of lower limbs will probably be only possible if the TA performance
test (Lower limb tapping), which does not require fine motor skills, is used. The results

187
of the residual covariance matrix display a noticeable amount of unexplained residuals.
The critical value of 2.58 was most frequently exceeded in the RKB test.
Table 64
Residual matrix 2-factor model performance tests 1. version of test battery (child
population)
Based on the previous results, the problematic tests were excluded from further
modelling. The PM indicator was removed from the “Upper Limb Performance” factor,
and the SL and RKB indicators were removed from the “Lower Limb Performance”
factor.
Since two of the three tests were removed from the “Lower Limb Performance”
factor, a one-factor model with the “Performance of Locomotive Orans” factor was
subsequently tested.
Table 65
Fit of the 1-factor model performance tests 1. version of test battery without tests PM,
SL and RKB (child population)Model Chi-square P-value df CFI TLI RMSEA SRMR
1-factor 29.86 0.008 14 0.97 0.96 0.075 0.031

188
Performanceof Locomotive Organs
DO JO STB
0.58 0.61
TWSP BTW TA
-0.80 0.700.800.81 0.54
Fig. 36 Path diagram 1-factor model performance tests 1. version of test battery
without tests PM, SL and RKB (child population)
The one-factor model showed improvement in all values of fit indices, but the
RMSEA index was at the level of the average RMSEA fit (0.075), and the model
significance in the form of the P-value was unacceptable. The results of the residual
covariance matrix pointed to a possible problem with the STB test (Threading beads on
a metal wire). Despite the high factor loading on the “Upper Limb Performance” factor,
STB = 0.80, high values greater than 2.58 were found in the residual covariance matrix
in this test.
Table 66
Residual matrix 1-factor model performance tests 1. version of test battery without tests
PM, SL and RKB (child population)

189
Therefore, in the final analysis of performance tests in the first version of the test
battery, the STB (Threading beads on a metal wire) test was removed, and a one-factor
structure with six indicators was proposed.
Table 67
Fit of the 1-factor model performance tests 1. version of test battery without tests PM,
SL, RKB and STB (child population)Model Chi-square P-value df CFI TLI RMSEA SRMR
1-factor 5.57 0.78 9 0.99 0.99 0.004 0.021
Performanceof Locomotive Organs
DO JO
0.63 0.64
TWSP BTW TA
-0.81 0.670.82 0.54
Fig. 37 Path diagram 1-factor model performance tests 1. version of test battery
without tests PM, SL, RKB and STB (child population)
Table 68
Residual matrix 1-factor model performance tests 1. version of test battery without tests
PM, SL, RKB and STB (child population)

190
Table 69
Generic reliability – performance testss 1. version (child population)
Name of the factor McDonald
Performance of Locomotive Organs 0.83
The results of the residual matrix show that this one-factor model does not
contain any residuals greater than 2.58, and that in previous analyses the STB test was
truly the disturbing manifest variable.
This one-factor model with six motor tests in the first version of the test battery
met all the conditions of the acceptable model. The values of all fit indices showed a
very good fit, including high model significance, P-value = 0.78. Four of the tests assess
differences in the performance of upper limbs, and one test, TA (Lower limb tapping, is
designed to determine differences in the performance between the lower limbs. The JO
test (Measuring articular passivity in order to diagnose cerebellar dominance) measures
cerebellar dominance, by means of different muscle tonus in the wrist. The variables
determining the lower limb dexterity based on handling objects proved to be unsuitable
in the course of testing. None of the tests distinguished well the “dexterity” of both
lower limbs. This fact points out the unequal ontogeny of lower and upper limb motor
activity in children.
Performance test items test in the second version of the test battery:
- tracing the spiral SP20
- dot-filling fine motor test DO
- screwing a nut on a bolt SCN21
- pegboard PG
- turning a card between fingers TWC
- measuring articular passivity in order to diagnose cerebellar dominance JO
- lower limb tapping TA
20, 20 Time is not a constant in these tests, so the factor loadings indicates a negative values.

191
- slalom with a ball between obstacles SL22
- while standing, moving a cube in the “maze” provided MF23
- while sitting on a chair, moving small cubes from place to place using a foot CM24
Table 70
Fit of the 2-factor model performance tests 2. version of test battery (child population)Model Chi-square P-value df CFI TLI RMSEA SRMR
2-factor 119.08 <0.0000 34 0.83 0.77 0.112 0.072
CM
0.72Upper LimbPerformance
TWC JO PG
0.78
Lower LimbPerformance
MF SL
0.67
DOSP SCN TA
-0.23-0.84 0.250.690.41 -0.32-0.380.81
Fig. 38 Path diagram 2-factor model performance tests 2. version of test battery
(child population)
The results from this two-factor structure showed a very weak model fit, which
was determined in all fit indices; this model was therefore rejected. In the “Upper Limb
Performance” factor, the SCN test (Screwing a nut on a bolt) proved to be highly
problematic. During the actual data collection the SCN test already showed very low
sensitivity in determining differences in the performance of upper limbs. In addition, in
this test, upper limb dexterity often did not correspond with the results of the fine motor
tests, SP (Tracing the spiral) and DO (Dot-filling fine motor test). These facts are
probably reflected in the low factor loading of this test, SCN = 0.25. However, an
important result in this analysis of the second version of the test battery was the
confirmation of the extent of the relationship between the “Upper Limb Performance”
22, 22, 23 Time is not a constant in these tests, so the factor loadings indicates a negative values.

192
factor and the JO test (Measuring articular passivity in order to diagnose cerebellar
dominance), JO = 0.67, which supported the hypothesis of the existence of the
relationship between cerebellar dominance and handedness also in the child population.
The “Lower Limb Performance” factor displayed very weak factor loadings of the CM
(While sitting on a chair, moving small cubes from place to place using a foot), MF
(While standing, moving a cube in the “maze” provided), and SL (Slalom with a ball
between obstacles) in all manifest variables that emphasized handling of the object. This
finding was supported by the results of the performance tests from the first version of
the test battery, where it was suggested that lower limb tests of a manipulative nature
are not appropriate for children at this age due to the unstable lower limb lateralization.
As in the testing of the first version, the SL test displayed problems with stability,
balance, and handling, which resulted in ambiguous determination of the more skilled
lower limb. Low sensitivity was also determined in the MF and CM tests that were
performed while sitting.
The low quality of the model is also evident from the results of the residual
covariance matrix that contains a large number of values greater than 2.58.
Table 71
Residual matrix 2-factor model performance tests 2. version of test battery (child
population)

193
In the course of further modelling, it was decided to exclude the CM, MF, and
SL tests which had a very weak relationship to the “Lower Limb Performance” factor.
This step led to the design of a one-factor structure from which the SCN test was
removed due to its weak relationship to the “Upper Limb Performance” factor. The
name of the factor was the same as in the previous case in the first version of the test
battery “Performance of Locomotive Organs”.
Table 72
Fit of the 1-factor model performance tests 2. version of test battery without tests SCN,
CM, MF and SL (child population)Model Chi-square P-value df CFI TLI RMSEA SRMR
1-factor 31.90 0.0002 9 0.94 0.91 0.108 0.041
Performanceof Locomotive Organs
CTW JO
0.77 0.68
DOSP PG TA
-0.86 0.670.44 0.48
Fig. 39 Path diagram 1-factor model performance tests 2. version of test battery
without tests SCN, CM, MF and SL (children population)
This one-factor structure with six indicators did not show satisfactory model fit
values. All indices reached below-average values, including model significance. Despite
the fact that the quality of this model was low, the approximation of generic reliability
(Tab. 74) was the only one to meet the diagnostic quality with it value. However, this
model was found unsatisfactory, also based on the results of the residual covariance
matrix, which displayed high unexplained residuals; the model was therefore rejected.

194
Table 73
Residual matrix 1-factor model performance tests 2. version of test battery without tests
SCN, CM, MF and SL (child population)
Table 74
Generic reliability – performance tests 2. version (child population)
Name of the factor McDonald
Peformance of Locomotive Organs 0.81
Summary:
The model chosen as the best was the one-factor model of performance tests
from the first version of the test battery, which met all requirements of diagnostic
quality, including the acceptable level of the diagnostic error of the construct
approximated by the coefficient McDonald = 0.83.
The adopted one-factor structure of performance tests consists of six indicators.
The motor tests SP (Tracing the spiral) and DO (Dot-filling fine motor test) are focused
on fine motor activity involving mainly the distal part of the upper limb, i.e., hand and
fingers. While the SP test emphasizes the rotational movements of the wrist to keep the
firmest spiral line, the DO test is focused on controlled flexion and extension in the
wrist with the requirements for targeting the tool in small space. The motor test TW
(Moving beads from one box into another using tweezers) combines the activity of the
distal and proximal parts of the upper limb, the more difficult part being the handling of
the tweezers in the hand and grasping the bead. However, in addition to difficulties in

195
grasping the bead with the non-preferred upper limb, an important phenomenon in this
test was also the problem of estimating the distance when moving the beads from one
box into another. A new approach to assessing the upper limb performance is
represented by the BTW test (Turning a box alternately with the front and the rear side
on the table), which involves the entire upper limb from the proximal to distal part,
while the movement coming from the shoulder joint represents hand pronation and
supination. When this test was being performed with the non-preferred limb, greater
accompanying movements of the preferred hand that were supposed to be passive were
observed in children. The JO test (Measuring articular passivity in order to diagnose
cerebellar dominance) was the last indicator related to upper limb performance.
Surprisingly, the JO test did not display the weakest factor validity in this case. In both
versions for the child population in diagnosing motor manifestations of laterality, the
test exhibited a stable strength of the relationship to the “Preference of Locomotive
Organs ” factor. This fact thus indicates the relationship between motor manifestations
of laterality and cerebellar dominance (in the form of the physiological extinction
syndrome), proposed by Professor Henner, also in the child population.
The only test that determines the different performance between the lower limbs
was the TA test (Lower limb tapping), which displayed the weakest factor loading in the
adopted one-factor model. However, given the functional differences of upper and
lower limbs, this degree of relationship is understandable. Interestingly, this diversity
was not as sharp in the child population as in the adult population. It was already found
in the course of the testing that children are able to distinguish very well the preferred
lower limb in preference motor tasks. However, the borders were blurred in the
manipulative tests determining differences in dexterity between the preferred and non-
preferred lower limb. Both lower limbs displayed the same unskilfulness. This fact
could be explained by lower requirements concerning the stabilization of the lower limb
lateralization in children that subsequently result in the stabilization of both preference
and observable proficiency (fine motor activity) of the lower limb. This hypothesis was
also supported by the results of analyses which showed that the tests focusing on finer
activity of the lower limb or the foot alone showed instability, and thus were not
appropriate for the child population.

196
13. SCORING
Although the scoring of the items in the newly created test batteries is not the
primary objective of this thesis, we decided to design a simple scoring for practical use
and interpretation of results. We realize that it is necessary to take into account the
diversity of weights of individual indicators, as well as the non-linearity of the results,
in the precise scoring of categorical items and interval tests. All these aspects go beyond
the objectives and possibilities of this thesis; therefore, we believe that the creation of
high-quality scales for the precise interpretation of the results obtained from the
diagnosis of motor manifestations of laterality is a task for a specialized study.
Questionnaire score sheet (adult population):
Interpretation of results:
We chose for scoring a five-point scale with values 0, 25, 50, 75, and 100. Each of these
values represents specific degree of preference. Since the chosen numbers are ordered
according to their magnitude from the left to the right, we assign number 0 to each of
the items 2 – 7 in case that the subject responds that s/he always uses left limb in given
situation. We assign number 25 to each of the items 2 – 7 in case the subject responds
that s/he rather uses left limb in given situation. We assign number 50 to each of the
items 2 – 7 in case that the subject responds that s/he does not have any preferred limb
for given situation. We assign number 75 to each of the items 2 – 7 in case that the
subject responds that s/he rather uses right limb in given situation. We assign number
100 to each of the items 2 – 7 in case that the subject responds that s/he always uses
right limb in given situation. Since the item is reverse, we assign number 100 in case
that the subject responds that s/he always uses left limb; 75 in case s/he rather uses left
limb; 50 in case s/he does not have any preferred limb for given situation; 25 in case
s/he rather uses rather right limb and 0 in case that the subject always uses right limb in
given situation.
The laterality quotient is then the product of number 100 and fraction, where the
numerator is the addition of numbers assigned to all items, and the denominator is the
addition of maximum achievable values (i.e. 700).

197
100*700
7
1
ixLQ
where xi is the number assigned to the i-th attempt
Values of LQ are in the interval <0, 100>
If the LQ is in the interval <0, 50), the individual is left-sided and it is true that the more
the coefficient approaches values 50, the more the left-side preference of the subject
decreases. If the LQ is in the interval (50, 100>, the individual is right-sided. The more
the value of the coefficient approaches the value 100, the more the right-side preference
of the subject is stronger. If the result for the subject has value 50 in the questionnaire
part, the individual is ambilateral with no preference.
Preference tasks:
Interpretation of results:
To asses this part of the test battery, we use essentially the same formula for each factor
as in the questionnaire part.
Since the factor of upper limb preference contains indicators with more than one
attempt, the laterality quotient (LQ) of these factors must be calculated for n attempts
partial.
We thus get for given indicators:
100*100*
1
n
xLQ
n
i , where
xi.......... is the number assigned to the i-th attempt
n........... is number of attempts
The values of the laterality quotients of both factors lie in the interval <0, 100>
The benefit of the preference tasks part is that “partial” LQs, i.e. laterality quotients of
indicators with repeated attempts, allow us to better determine the degree of sidedness.
The case that LQ = 50, is not possible, i.e. a certain degree of lateralization is always
manifested.

198
If the LQ is in the interval <0, 50), the individual is left-sided and it is true that the
closer the coefficient is to the value of 50, the more the left-side preference of the
diagnosed person decreases. If the LQ is from the interval (50, 100>, the individual is
right-sided. The closer the coefficient is to the value of 100, the more the right-side
preference of the diagnosed person increases.
Performance tests:
Interpretation of the results:
The third part of the test battery compares the “skilfulness” of both paired limbs. The
individual tests show which of the two limbs is:
1) more efficient within the time provided ....................................tests of the 1st type
2) faster in the performance of the required quality ......................tests of the 2nd type
In the tests of the first type, performance of the left and right limb in a given time is
compared, i.e. time is constant. The laterality quotient LQA shows here the share of
performance of the right limb in the total, i.e. 100% performance of both limbs. This is
determined based on the formula 100*LR
RLQ
, where R is the numerical
assessment of the performance of the right limb, and L is the numerical assessment of
the performance of the left limb.
In the tests of the second type, the times needed to perform the test in the required
quality using either of the paired limbs are compared.
The time of the right limb is denoted as R, the time of the left limb as L, so the
expressionR1 expresses the part of the test performed in a unit of time (i.e.
performance) by the right limb. Likewise, the expressionL1 is used. In order to
calculate LQ, the formula with the numerical expression of performances is used again:
100*11
1
LP
PLQ
Based on the algebraic adjustment, the result is:

199
100*100**1100*
1
PLL
PLPL
PPL
PLPLQ
100*PL
LLQ
Interpretation of the indicator “Determination of articular passivity in the wrist”
After measuring the angles in the wrists of both upper limbs, the following relation is
used:
Angle α, right wrist ..... R
Angle α‘, left wrist ...... L
(R–L RELATION)
a) if the angle α at the wrist of the right limb R is greater than the angle α‘ at the wrist of
the left limb L – R > L, LQ = 100 – estimated dominance of the left cerebral hemisphere
for motor activity
b) if the angle α at the wrist of the right limb R is equal to the angle α‘ at the wrist of the
left limb L – R = L, LQ = 50 – estimated uncertain dominance of the cerebral
hemispheres for motor activity
c) if the angle α at the wrist of the right limb R is less than the angle α‘ at the wrist of
the left limb L – R < L, LQ = 0 – estimated dominance of the right cerebral hemisphere
for motor activity

200
14. DISCUSSION
The aim of this study was to contribute to the standardization of new diagnostic
tools – test batteries – assessing motor manifestations of laterality in adults and children
aged 8–10 years. It included:
determination of the theoretical concept;
selection of appropriate items;
verification of structural hypotheses concerning the proposal of acceptable models;
expression of diagnostic quality of the individual parts of the test batteries.
Similarly to Annett, Oldfield, and Bryden (Annett, 1970; Oldfield, 1971;
Bryden, 1977), motor manifestations of laterality were considered to be continuous
latent variables.
The discussion is divided into two parts. The first part deals with the test battery
for the adult population; the second part deals with the test battery for the child
population aged 8–10 years.
a) The test battery for the adult population:
The test battery for the adult population consists of three parts:
questionnaire;
preference task;
performance test.
The questionnaire part of the test battery has a unidimensional nature called
“Preference of Locomotive Organs”. This is consistent with the results presented by
Suar et al. (2007), who, using the CFA, established the one-factor structure of questions
assessing upper and lower limb preference as the most suitable (Suar et al., 2007).
The five-point Likert scale that we chose to assess individual levels of
preference within the questionnaire proved to be sufficiently precise. We also focused
on a clear definition of individual levels of preference and instructions on how to
distinguish them. These instructions are not included in most previous studies (Annett,
1970; Oldfield, 1971; Sharman, & Kulhavy1976), so the results can be distorted by the
subjective view of the respondent.

201
The questionnaire does not contain items of a bimanual nature. The CCFA
analysis of the questionnaire items showed that the items of a bimanual nature displayed
weak factor loadings, and they probably form a different dimension, as opposed to
unimanual questions. This finding supports the results of the studies by Dragovic
(2004), Büsch (2010), and Bryden and Steenhuis (1989), who point out that the
multidimensionality of hand preference depends on the type of activity (Bryden &
Steenhuis, 1989; Büsch et al., 2010; Dragovic, 2004).
The final structure of the questionnaire part is consistent with the results of the
previous studies, which point out the fact that the strongest indicators are questions of a
skilled and instrumental nature (Annett, 1998; McManus, 2002). The structural equation
modelling (SEM) of the questionnaire part showed that the traditional questions (which
hand do you use to write; which hand do you use to draw; and which hand do you use to
hold a spoon while eating) are redundant. Motor activity covered by these questions is
likely to be subject to cultural and social pressure. With respect to these indicators, a
strong multicollinearity and interference in the structural model was detected. This
finding is contrary to the trends of hand preference questionnaires where the
aforementioned items are very often used (Annett, 1985; Bryden, 1977; Coren, 1993;
Oldfield, 1971; Porac, & Coren, 1978).
When analyzing the data, multicollinearity was also found in some items
assessing lower limb preference. The CCFA results showed that the variability of lower
limb motion patterns is probably more limited than in upper limbs, based on their
function. Therefore, the structure of the questionnaire contains only one question
directly determining lower limb preference (kicking the ball). Other questions of this
nature (one supporting lower limb, one leading lower limb) were redundant in the
models. We could only reveal this fact using the selected statistical techniques.
Therefore, our questionnaire was different from the previously compiled questionnaires
(Porac, & Coren, 1978; Coren, 1993), which contain more items of this type. The
studies by Porac and Coren (1978) only used the test-retest method to determine the
stability of responses over time. The questionnaire by Coren (1993) only refers to the
results of the exploratory factor analysis presented in a study by Porac and Coren
(1981), which identified a cluster of questions suitable for the determination of lower
limb preference. The exploratory factor analysis, however, does not show collinearity;
in addition, the authors worked with Pearson’s correlation coefficient, which is not
suitable for ordinal data type.

202
An interesting finding is that the best structural model of the questionnaire also
includes an item relating to rotation. This item indirectly estimates lower limb
preference. It was the first time that its relationship to the concept of motor
manifestations of laterality was expressed in a questionnaire. Although this item shows
the weakest factor validity in relation to the selected specific concept, it could not be
removed, in order to guarantee the most appropriate model. The result indicates that
rotation and motor manifestations of laterality are probably closely linked, which would
support the hypothesis of the study presented by Mohr et al. (2003) and Štochl &
Croudace (2012, in press).
Given the complexity of sensory organs and the differences in experts’ opinions
regarding their laterality, we believe that it is inappropriate to include items assessing
eye and ear dominance in the questionnaire survey, as is the case in the studies by
Bourassa and Coren (Bourassa et al., 1996; Coren, 1993).
We are aware that the diagnostic tool in the form of a questionnaire is, to a
certain degree, affected by the subjectivity of the respondent, and we therefore agree
with the views of Nisbett and Wilson (1977), Bryden (2000), and Brown et al. (2006).
Furthermore, we believe that a questionnaire determining motor organ preference using
a five-point scale is an appropriate screening tool only for the adult population, based on
imagination and the assumption of a certain level of abstraction.
Preference tasks:
Within the test battery, the preference motor task part has a two-factor structure
consisting of the “Upper Limb Preference” and “Lower Limb Preference” factors. As in
the case of the questionnaire part, this part also confirmed that the strongest indicators
are instrumental skilled tasks. This finding supports the hypotheses of those authors
who believe that the questions in the questionnaire assess motor organ preference as
precisely as motor tasks (Bryden, McManus, & Bulman-Fleming, 1994; Oldfield, 1971;
Sharman, & Kulhavy, 1976; Singh, Manjary, & Dellatolas, 2001).
When modelling and selecting the most appropriate preference tasks, it was
revealed that the diagnosis should also contain indicators that do not display a skilled
instrumental nature. These indicators do not seem to be affected by the possible
imitation or targeted learning of the activities. Within the “Upper Limb Preference”
factor, it is the CL indicator (Clap your hands), and within the “Lower Limb
Preference” factor, it is the HOP indicator (Perform jumps forward using one leg).

203
We believe that the combination of skilled and unskilled indicators presents a
more precise assessment of upper and lower limb preferences.
In our model, the unskilled indicators display the weakest factor validity, so they
could probably form a different dimension. This view supports the assumption of
Bryden and Steenhuis (1989), who, using the principal component method, determined
that the items assessing upper limb preference (questions in the questionnaire and motor
preference tasks) can be divided into the skilled factor and the unskilled factor (Bryden,
& Steehuis, 1989). Likewise, these views support the assumption of Kalaycioğlu et al.
(2008), who, using the exploratory factor analysis, showed that lower limb preference is
probably multidimensional in nature and that skilled and unskilled preference activities
exist separately (Kalaycıoğlu, Kara, Atbaşoğlu, & Nalçacı, 2008).
Therefore, we believe that the indicators that are not of a skilled nature helped
establish the two-factor structure.
The correlation between the factors at the level r = 0.78 shows that both the
“Upper Limb Preference” factor and the “Lower Limb Preference” factor measure a
similar area of the determined concept. Thus, an interesting finding was that the SEM
displayed a significant deterioration in the model fit in designing a bi-factor structure
and hierarchical structure. We believe that there is a general factor, “Preference of
Locomotive Organs”, behind these two factors. Furthermore, we believe that if the
preference task part only contained skilled indicators, the structure could have a
unidimensional nature with the “Preference of Locomotive Organs in Skilled Activities”
factor.
Performance tests:
The performance tests have a two-factor structure with the factors “Upper Limb
Performance” and “Lower Limb Performance”. In line with other studies (Annett,
2002), our results also showed that if an upper limb test has a more fine motor nature, it
reflects the specific concept of performance more strongly (Annett, 2002). The
following tests in particular were used: SP (Tracing the spiral) and DO (Dot-filling fine
motor test). In the process of SEM, the “pegboard test” had to be excluded from the
final version. This is at variance with the fact that this test is described in the literature
as particularly relevant to assessing the level of upper limb fine motor activity (Annett,
1985; Brown, Roy, Rohr, & Bryden, 2006; and others). In our view, the aforementioned
fact is caused by the low sensitivity of the test. The substantive significance of the
204
difference in the performance of both upper limbs in this test was found to be
inadequate. The difference in the performance of both upper limbs averaged 2 pins.
Therefore, the question is whether a longer period of time is necessary for testing or
whether the test has to be more difficult for the adult population.
By contrast, the JO indicator (Measuring articular passivity in order to diagnose
cerebellar dominance), which represents a new approach in the estimation of natural
hemispheric dominance, proved suitable in this model. Despite the completely different
nature of this indicator, it was found that it is significantly related to motor
manifestations of laterality. Its relationship to upper limb performance was significant.
This result supports the hypothesis of Professor Henner (1927) and recent studies by
Tichý & Běláček (2008) about the connection of the cerebellar extinction physiological
syndrome and handedness (Henner, 1927; Tichý & Běláček, 2008). However, we are
aware that the execution of the test is purely of a field nature. This test could reflect an
examiner’s error, resulting from practical (in)experience with the measurement of
angles and proportions of the human body. We believe that in order to determine the
specific reliability of this test it will be necessary to carry out more extensive
measurements, perhaps even by more examiners. It was very interesting to observe that
about 30% of left-handed subjects showed a reverse articular passivity, i.e., according to
the results of this test, they would have been categorized as right-handers. It is possible
that this finding is related to the long-debated question as to the extent to which
laterality is determined genetically. The reverse asymmetry of articular passivity
observed in some left-handed individuals could indicate the original genetic makeup,
according to which these individuals should be right-handed. Due to the environment
and stressors, this right-sided tendency could have been changed.
The lower limb tests did not confirm the assumption that if a test has a finer
motor nature, it differentiates the performance of both lower limbs better. The strongest
test of the “Lower Limb Performance” factor was TA (Lower limb tapping), which is
not focused on the quality of movement, but on the speed of movement and balance. In
our view, this fact is caused by the functional orientation of lower limbs, which are not
free for work and which primarily perform the stabilization and locomotor functions.
The correlation between the factors “Upper Limb Performance” and “Lower
Limb Performance” at the level r = 0.56 indicates that these factors probably have a
common general basis in the form of the assessment of motor organ performance.
However, the different functions of both paired motor organs cancel out this correlation,

205
and they probably indicate a different control of the motor activity of upper and lower
limbs.
b) Test battery for the child population:
The test battery for the child population consists of only two parts: preference
tasks and performance tests. The questionnaire part was deliberately not included due to
the undeveloped abstraction and imagination in the self-assessment of the level of
preference.
Preference tasks
This part of the test battery has a two-factor structure with the factors “Upper
Limb Preference” and “Lower Limb Preference”. The results of SEM showed that
strong factor loadings are displayed by motor tasks of a manipulative nature (Throwing
at the target; Ringing the bell; Kicking the ball). This finding is consistent with the
study by Kastner-Koller et al. (2007).
The “Upper Limb Preference” factor also displayed a strong relationship of the
reaching tasks – CAB (According to the instructions, turn the cards of the given colours
placed on the sheet of paper) and MAR (Create a line in the marked space using
matches) – where the subject can repeatedly work across the natural body axis. As in
the study by Doyen & Carlier (2002), it has been shown that the tasks in which motor
activity is repeated several times are a sensitive indicator of the degree of upper limb
preference (Doyen, & Carlier, 2002). We believe that, unlike in traditional unimanual
tasks, the perspective of an advantage or disadvantage in handling an object across the
body axis is the main indicator of preference in reaching tasks. Therefore, in our view,
these tasks should form the basis for determining upper limb preference.
A surprising result was that the “Lower Limb Preference” factor also contained,
in the final form, motor tasks related to the rotation attribute – SLI (While standing,
demonstrate how you slide without the support of your hands) and TU (Stretch your
arms sideways and make a 360-degree turn around your axis). These indicators
measured lower limb preference indirectly, and they, of course, displayed the weakest
factor loadings in connection with the aforementioned factor; however, these factor
loadings were significant. This finding supports the results of the recent study by Štochl
and Croudace (2012, in press), who, using structural equation modelling, showed a
significant relationship of laterality of motor organs and rotation (Štochl, & Croudace,

206
2012, in press). The resulting factor loading of the TU item (Stretch your arms sideways
and make a 360-degree turn around your axis), TU = –0.45, also supported the results of
previous studies (Mohr, Landis, Bracha, & Brugger, 2003). These show that right-sided
individuals turn more to the left, i.e., towards their left shoulder.
The correlation between the two factors at the level r = 0.71 again showed a
common basis of these two latent variables, which can be called “Preference of
Locomotive Organs”. However, the correlation was not as strong as in the preference
tasks for the adult population. This finding could possibly be explained by the presence
of indicators measuring the rotation attribute, apart from lower limb preference.
Performance tests:
The performance tests have a one-factor structure with the “Performance of
Locomotive Organs” factor. The upper limb tests also showed that if a test has a more
fine motor nature, it differentiates the performance of both upper limbs better (Annett,
2002). The CFA of the performance tests revealed an evident ontogeny of children’s
motor activity, which is also reflected in motor manifestations of laterality.
The upper limbs, which are used to handle objects from an early age, did not
show, in comparison with the adult population, significantly worse performance in the
fine motor tests – SP (Tracing the spiral) and DO (Dot-filling fine motor test). There are
not many studies dealing with the preparation of tests for the determination of
performance for the child population. Therefore, these findings could be used as
guidelines in further research.
The JO indicator (Measuring articular passivity in order to diagnose cerebellar
dominance), which represents a new approach in the estimation of natural hemispheric
dominance, as in the test battery for the adult population, also proved to be suitable in
this model. The factor loading of this test was even higher than in the test battery for the
adult population. As in the first part of the discussion, this result supports the hypothesis
of Henner (1927) and recent studies by Tichý & Běláček (2008). Of course, a question
arises also in this case as to the extent to which this form of field form of the test is
reliable and sensitive. It was very interesting to find that even the child population
showed about 25% left-handed individuals who displayed a reverse articular passivity,
i.e., according to the results of this test, they would have been categorized as right-
handers. This finding further deepened our assumption of the genetic determination of
laterality, including cerebellar dominance. As in the case of the results of the adult

207
population, this reverse asymmetry of articular passivity could indicate the original
genetic makeup that was changed by environmental stressors.
The tests designed for lower limbs, i.e., limbs which are not used for specific
activities in this age, did not show significant differences in the performance of both
limbs in the SL test (Slalom with a ball between obstacles) and the MF test (while
standing, moving a cube in the “maze” provided). The results in the determination of
lower limb performance were very unstable in these cases. The more the activity
displayed a fine-motor nature with an emphasis on balance, the less sensitive the test
was. The TA test (Lower limb tapping) proved to be the strongest test assessing lower
limb performance. Surprisingly, this test was the only appropriate test to assess the
difference in the performance of both lower limbs of children aged 8–10 years. In our
view, these findings can be explained by the slower fixing of lower limb laterality,
which may end as late as after the pubescent period. If the lower limb tests were
performed without the need for balance, children might display a better concentration
on the activity itself, which could lead to the increased sensitivity of the test.
An additional task when evaluating motor manifestations of laterality was LT
(Use the tube to look at the object), which, using the sighting factor, determined eye
dominance. The correlation of the results between handedness and this task is reported
around 80%. Interestingly, the LT task in this study, in both populations, more strongly
correlated with indicators assessing lower limb preference. This result does not support
the current hypotheses; on the contrary, we believe that it could indicate that eye
dominance and lower limb preference are not affected by social pressure.
The results of the study confirmed the hypothesis H1, which assumed that at
least 75% of the final indicators of both versions of the test batteries would have a
factor validity of at least 0.6. This assumption was very important in confirming the
hypothesis H2, i.e., that generic reliability of individual constructs would be at least
0.75. Generic reliability of all constructs of both test batteries ranged from 0.78 to 0.95.
By contrast, the hypothesis H3 was refuted, because not all parts of both test batteries
had a multidimensional structure. The questionnaire part for the adult population and
performance tests for the child population have a one-factor structure. By determining
the factor loadings of the JO indicator (Measuring articular passivity in order to
diagnose cerebellar dominance) of both test batteries, the hypothesis H4 was confirmed.
Both of these factor loadings of the indicator assessing cerebellar dominance in the

208
performance part were significant in both test batteries, reaching the level of p < 0.001.
The results also showed that motor tasks in which the subject can work across the
natural body axis are very sensitive indicators in assessing the level of upper limb
preference. This was shown especially in the child population, and this finding
confirmed the hypothesis H5, which had assumed a high significance of these
indicators, at the level of p < 0.001.

209
15. CONCLUSION
The result of the thesis is the construction of two test batteries for the diagnosis
of motor manifestations of laterality. One is intended for the adult population, and the
second for children aged 8–10 years. Both have a clear structure and diagnostic quality.
The generic reliability of both test batteries ranges between McDonald ω 0.78 and 0.95.
The test battery for the adult population consists of a questionnaire part, a
preference motor task part, and a performance test part; it includes a total of 23
indicators. For the first time, the structure of these three diagnostic methods (which are
otherwise used separately) was verified together, using SEM.
As the only part in this test battery, the questionnaire has a unidimensional
structure with the “Motor Organ Preference” factor. The generic reliability of the
“Preference of Locomotive Organs” factor is McDonald ω = 0.89.
The preference motor tasks have a two-factor structure with the factors “Upper
Limb Preference” and “Lower Limb Preference”. The generic reliability of the “Upper
Limb Preference” factor is McDonald ω = 0.89. The generic reliability of the “Lower
Limb Preference” factor is McDonald ω = 0.85.
The performance tests also have a two-factor structure with the factors “Upper
Limb Performance” and “Lower Limb Performance”. This part of the test battery found
a significant relationship between the “Upper Limb Performance” factor and a
manifestation of cerebellar dominance in the form of articular passivity in the wrist. The
generic reliability of the “Upper Limb Performance” factor is McDonald ω = 0.82. The
generic reliability of the “Lower Limb Performance” factor is McDonald ω = 0.78.
The test battery for the child population has two parts, preference motor tasks
and performance tests, and it contains 16 indicators. For the first time, the structure of
these two diagnostic methods was verified together, using SEM.
The preference motor tasks have a two-factor structure with the factors “Upper
Limb Preference” and “Lower Limb Preference”. In the “Upper Limb Preference”
factor, the indicators where the subjects could work across the natural body axis were
first tested. The results showed that these indicators have a high correlation to the given

210
factor, i.e., they are very sensitive indicators in assessing the level of upper limb
preference.
The generic reliability of the “Upper Limb Preference” factor is McDonald ω =
0.95. The generic reliability of the “Lower Limb Preference” factor is McDonald ω =
0.81.
The performance tests have a one-factor structure with the “Performance of
Locomotive Organs” factor. The child population also displayed a significant
relationship between this factor and indicator evaluating cerebellar dominance, JO =
0.64. The generic reliability of the “Performance of Locomotive Organs” factor is
McDonald ω = 0.83.
The construction of both test batteries and the results of SEM showed that the
long-debated dimensionality of the theoretical concept of motor manifestations of motor
organ laterality is different in adults and children, probably due to the ontogeny of
human motor activity. The results of the verification of the structural hypotheses also
show that the level of dimensionality is based on the different functionality of limbs and
their parts, as well as on the character of the indicators that are (in different degrees)
subject to socio-cultural pressure. Socio-cultural pressure can apparently affect the
human motor control in some socially ingrained unimanual activities, which, in this
study, often showed collinearity in the process of SEM. Therefore, we assume that the
assessment as well as (primarily) scoring and interpretation of the results of motor
manifestations of laterality will remain a challenge for researchers with respect to the
understanding of the functional asymmetry of cerebral hemispheres, due to complex
genetic, physiological, and social interaction.

211
16. REFERENCES
2011. Origin of Life on Earth: ‘Natural’ Asymmetry of Biological Molecules May Have
Come from Space. Asian Journal of Earth Sciences, 4, 127–128.
Aboitiz, F., Ide, A., & Olivares, R. (2003). Corpus Callosum, Morphology in Relation
to Cerebral Asymmetries in Postmortem Human. In E. Zaidel, & M. Iacoboni
(Eds.), The Parallel Brain: The Cognitive Neuroscience of the Corpus Callosum
(Issues in Clinical and Cognitive Neuropsychology) (pp. 33–46). Cambridge
MA: Massachusetts Institute of Technology.
Abrahams, B. S., Tentler, D., Perederiy, J. V., Oldham, M. C., Coppola, G., &
Geschwind, D. H. (2007). Geonome-wide Analyse of Human Perisylvian
Cerebral Cortical Patterning. Proceeding the National Academy of Science of the
United States of America, 104(45), 17849–17854.
Alexander, R. M. N. (2003). Principles of animal locomotion. Princeton, N.J: Princeton
University Press.
Alibejk, H., & Angaji A. (2010). Developmental Aspects of Left-handedness.
Australian Journal of Basic and Applied Sciences, 4(5), 877–881.
Amber, Z. (2008). Motorický systém, In: Amber, Z., Bednařík, J., Růžička, E., et al.
(Eds.), Klinická neurologie (pp. 65–66). Praha: TRITON.
Amunts, K., Hlaug, G., Schleicher, A., & Steinmetz, H. (1996). Asymmetry in the
human motor cortex and handedness. Neuroimage 4(3), 216–222.
Amunts, K., Schmidt-Passos, F., Schleicher, A., & Zilles, K. (1997). Postnatal
development of interhemispheric asymmetry in the cytoarchitecture of human
area 4. Anatomy and Embryology, 196(5), 393–402.
Amunts, K., Schleicher, A., Bürgel, U., Mohlberg, H., Uylings, H. B., & Zilles, K.
(1999). Broca’s region revisited: Cytoarchitecture and intersubject variability.
Journal of Comparative Neurology, 412(2), 319–341.
Anderson, J. C. & Gerbing, D. W. (1982). Some methods for respecifying measurement
models to obtain unidimensional construct measurement. Journal of Marketing
Research, 19(4), 453–460.
Andrich, D. (1978). A rating formulation for ordered response categories.
Psychometrika, 43(4), 561–573.

212
Annett, M. (1967). The binomial distribution of right, mixed and left handedness.
Quarterly Journal of Experimental Psychology, 19(4), 327–333.
Annett, M. (1970a). A classification of hand preference by association analysis. British
Journal of Psychology, 61(3), 303–321.
Annett, M. (1970b). The growth of manual performance and speed. British Journal of
Psychology, 61(4), 545–548.
Annett, M. (1972). The distribution of manual asymmetry. British Journal of
Psychology, 63(3), 343–358.
Annett, M. (1976). A coordination of hand preference and skill replicated. British
Journal of Psychology, 67(4), 587–592.
Annett, M. (1985). Left, Right, Hand and Brain: The right shift theory. London;
Hillsdale, New Jersey: Erlbaum.
Annett, M. (1992). Five tests of hand skill. Cortex, 28(4), 583–600.
Annett, M. (1995). The right shift theory of a genetic balanced polymorphism for
cerebral dominance and cognitive processing. Cahiers de Psychologie, 14(5),
427–480.
Annett, M. (1998). Handedness and cerebral dominance: The right shift theory. The
Journal of Neuropsychiatry and Clinical Neurosciences, 10(4), 459–469.
Annett, M. (2000). Predicting combinations of left and right asymmetries. Cortex,
36(4), 485–505.
Annett, M. (2002). Handedness and brain asymmetry: The right shift theory. Hove, UK:
Psychology Press.
Annett, M. (2003). Cerebral asymmetry in twins: Predictions of The right shift theory.
Neuropsychologia, 41(4), 469–479.
Annett, M. (2006). The Right Shift Theory of handedness and brain asymmetry in
evolution, development and psychopathology. Cognition, Brain, Behavior,
10(2), 235–250.
Annett, M., & Ockwell, A. (1980). Birth Order, Birth Stress and Handedness. Cortex,
16(1), 181–188.
Antal, A., Nitsche, M. A., Kincses, T.Z., Kruse, W., Hoffmann, K.P., & Paulus, W.
(2004). Facilitation of visuo-motor learning by transcranial direct current
stimulation of the motor and extrastriate visual areas in humans. European
Journal of Neuroscience, 19(10), 2888–2892.

213
Auerbach, B. M., & Ruff, C. B. (2004). Human body mass estimation: a comparison of
‘‘morphometric’’ and ‘‘mechanical’’ methods. American Journal of Physical
Antropology 125(4), 331–342.
Ayala, R. J. (2009). The theory and practice of item response theory. New York:
Guilford.
Badian, N. A. (1983). Birth order, maternal age, season of birth, and handedness.
Cortex, 19(4), 451–463.
Bailey, L. M., & McKeever, W. F. (2004). A large-scale study of handedness and
pregnancy/birth risk events: Implication for genetic theories of handedness.
Laterality, 9(2), 175–188.
Bailin, J., & Steinmetz, M. (2005). Internal and external alignment of the shapes and
angular momenta of LCDM Halos. The Astrophysical Journal, 627(2), 647–665.
Bakan, P. (1978). Handedness and birth order: A critical note on a critical note.
Perceptual and Motor Skill, 46(2), 556.
Bakan, P., Dibb, G., & Reed, P. (1973). Handedness and birth stress. Neuropsychologia,
11(3), 363–366.
Barkley, R. A. (1997). Behavioral inhibition, sustained attention, and executive
functions: Constructing a unifying theory of ADHD. Psychological Bulletin,
121(1), 65–94.
Barlow, J. S. (2002). The cerebellum and adaptive control. New York: Cambridge
University Press.
Barnea-Goraly, N., Menon, V., Eckert, M., Tamm, L., Bammer, R., Karchemskiy, A.,
Dant, C. C., & Reiss, A. L. (2005). White matter development during childhood
and adolescence: A crosssectional diffusion tensor imaging study. Cerebral
Cortex, 15(12), 1848–1854.
Barnsley, R. H., & Rabovitch, S. (1970). Handedness: Proficiency versus state
preference. Perceptual and Motor Skills, 30(2), 343–362.
Barrett, P. (2007). Structural equation modeling: Adjudging model fit. Personality and
Individual Differences, 42(5), 815–824.
Barron, L. D. (1982). Molecular Light Scattering and Optical Activity. Cambridge, UK:
Cambridge University Press.
Bartlett, J. E., Kotrlik, J. W., & Higgins, C. C. (2001). Organizational research:
Determining appropriate sample size in survey research. Information Technology
Learning and Performance Journal, 19(1), 43–50.

214
Barut, C., Murat, C., Ozdemir, O., Mustafa, S., & Yunten, G. Z. (2007). Relationship
between hand and foot preference. Journal of Neuroscience, 117(2), 177–185.
Bear, M. F., Connors, B. W., & Paradiso, M. A. (2007): Neuroscience: Exploring the
Brain (3. Ed). Baltimore: Lippincot Williams & Wilkins.
Beaton, A .A. (2004). The nature and determinants of handedness: In K. Hugdahl & R.
J. Davidson (Eds.), The asymmetriacal brain (pp. 105–158).Cambridge: MA:
MIT Press.
Beaumont, J. G. (2008). Introduction to Neuropsychology. (2. ed.). New York: The
Guilford Press.
Beech, J. R., & Beauvois,M. W. (2006). Early experience of sex hormones as a
predictor of reading, phonology and auditory expression. Brain & Language,
96(1), 49–58.
Bentler, P. M. (1990). Comparative fit indexes in structural models. Psychological
Bulletin, 107(2), 238–246.
Benton, A. L. (1968). Differential effetcs of Frontal lobe disease, Neuropsychologia,
6(1), 53– 60.
Berens, C., & Zerbe, J. (1953). A new pinhole test and eye-dominance tester. American
Journal of Ophthalmol. 36(7), 980–981.
Beukelaar, L. J., & Kroonenberg, P. M. (1983). Towards conceptualization of hand
preference. British Journal of Psychology, 74(1), 34–45.
Biewener, A. A., & Bertram, J. E. A. (1993). Mechanical loading and bone growth in
vivo. In B. K. Hall (Eds.), Bone (pp. 1–36). CRC Press, Boca, Raton FL.
Binder, J. R., Frost, J. A., Hammeke, T. A., Cox, R. W., Rao, S. M., & Prieto, T. (1997).
Human brain language areas identified by functional magnetic resonance
imaging. The Journal of Neuroscience: the Official Journal of the Society for
Neuroscience, 17(1), 353–362.
Birmbaum, A. (1968). Some latent trait models and their use in infering and examinee`s
ability. In F. M. Lord & M. R. Novick (Eds.), Statistical theories of mental test
scores (pp. 397–479). Massachusetts: Addion-Wesley, Reading.
Bishop, D. V. M. (1983). How sinister is sinistrality? Journal of the Royal College of
Physicians of London, 17(3), 161–172.
Bishop, D. V. M. (1990). Handedness and developmental disorder. Oxford: Blackwell
Scientific Publications.

215
Bishop, D. V. M., Ross, V., Daniels, M. S., & Bright, P. (1996). The measurement of
hand preference: A validation study comparing three groups of right-handers.
British Journal of Psychology, 87(2), 269–285.
Blahuš, P. (1985). Faktorová analýza a její zobecnění. Praha: SNTL.
Blahuš, P. (1998). Concept formation via latent variables modeling of motor abilities.
Kinesiology, 30, 12–21.
Blahuš, P. (2008). Some myths, and misunderstandings in test reliability:
Mehodological foundations. In D. Milanovi, & F. Prot (Eds.), Kinesiology
research trends and applications, (pp. 44–57). Zagreb: Croatia Academy of
Science and Arts.
Bloom, F. E., Nelson, C. A., & Lazarson, A. (2000). Brain, Mind, and Behavior.
Cranbury, New York: Worth.
Bock, D. R., & Moustaki, I. (2007). Item response theory in a general framework. In C.
R. Rao & S. Sinharay (Eds.), Handbook of statistics 26 (pp. 469–509).
Amsterdam: Elsevier.
Bollen, K. A. (1989). Structural equations with latent variables. New York: Wiley-
Interscience.
Bollen, K. A. (2002). Latent variables in psychology and the social sciences. Annual
Review of Psychology, 53, 605–634.
Bollen, K., & Lennox, R. (1991). Conventional wisdom on measurement: A structural
equation perspective. Psychological Bulletin, 110(2), 305–314.
Borod, J. C., Caron, S. H., & Koff, E. (1984a). Left-handers and right-handers
compasred on performance and preference measures of lateral dominance.
British Journal of Psychology, 75(2), 177–186.
Borod, J. C., Koff, E., & Caron, H. S. (1984b). The target test: a brief laterality measure
of speed and accuracy. Perceptual and Motor Skills, 58(3), 743–748.
Bourassa, D. C., McManus, I. C., & Bryden, M. P. (1996). Handedness and Eye-
dominance: A Meta-analysis of Their Relationship, Laterality, 1(1), 5–34.
Bradshaw, J. L., & Nettleton, N. (1983). Human Cerebral Asymmetry. New Jersey:
Prentice-Hall.
Brashers-Krug, T., Shadmehr, R., & Bizzi, E. (1996). Consolidation in human motor
memory. Nature, 382(6588), 252–255.
Brennan, R. L. (2001). Generalizability theory. New York: Springer.

216
Breslow, R. (2011). A likely possible origin of homochirality in amino acids and sugars
on prebiotic earth. Tetrahedron Letters, 52(17), 2028–2032.
Briggs, G. G., & Nebes, R. D. (1975). Patterns of hand preference in a student
population. Cortex, 11(3), 230–238.
Brink, P., & Wood, M. J. (1994). Basic steps in Planning Nursing Research. From
Question to Propsal,(4th Ed). Boston, MA: Jones and Bartlett.
Brown, T. A. (2006). Confirmatory factor analysis for applied research. New York:
Guilford Press.
Brown, S. G., Roy, E. A., Rohr, L. E., Snider, B. R., & Bryden, P. J. (2004). Preference
and performance measures of handedness. Brain and Cognition, 55(2), 283–285.
Brown, S., Roy, E. A., Rohr, L., & Bryden, P. J. (2006). Using hand performance
measures to predict handedness. Laterality, 11(1), 1–14.
Browne, M. W., & Cudeck, R. (1993). Alternative wals of assessing model fit. In: K. A.
Bollen & J. S. Long (Eds.), Testing structural equation models (pp. 136–162).
Newbury Park, CA: Sage.
Bryden, M. P. (1977). Measuring handedness with questionnaires. Neuropsychologia,
15(4–5), 617–624.
Bryden, M. P. (1982). Laterality: Functional asymmetry in the intact brain. New York:
Academic Press.
Bryden, M. P., MacRae, L., & Steenhuis, R. E. (1991). Hand preference in school
children. Developmental Neuropsychology, 7(4), 477–486.
Bryden, M. P., McManus, I. C., & Bulman-Fleming, M. B. (1994). Evaluating the
empirical support for the Geschwind-Behan-Galaburda model of cerebral
lateralization. Brain & Cognition, 26(2), 103–167.
Bryden, M. P., Singh, M., Steenhuis, R. & Clarkson, K. S. (1994). A behavioral
measure of hand preference as oposed to hand skill. Neuropsychologia, 32(8),
991–999.
Bryden, M. P., Roy, E. A., McManus, I. C., & Bulman-Fleming, M. B. (1997). On the
genetic and measurement of human handedness. Laterality, 2(3–4), 314–336.
Bryden, M. P., Mandal, M. K., & Ida, Y.(2000). Factor structure of hand preference
questionnaires. In M. B. Bulman-Fleming, M. K. Mandal & G. Tiwari (Eds.),
Side Bias: Neuropsychological perspective (pp. 175–190). Dordrecht: Kluwer
Academic Publisher.

217
Bryden, P. J. (2000). Lateral preference, Skilled behavior and Task complexity. In M.
B. Bulman-Fleming, M. K. Mandal & G. Tiwari (Eds.), Side Bias:
Neuropsychological perspective (pp. 225–248). Dordrecht: Kluwer Academic
Publisher.
Bryden, P. J., Roy, E. A., & Mamolo, C. M. (2003). The effects of skill demands and
object characteristics on the distribution of preferred hand reaches in working
space. Brain and Cognition, 53, 111–112.
Bryden, P. J., Roy, E. A., & Spence, J. (2007). An observational method of assessing
handedness in children and adults. Developmental Neuropsychology, 32(3), 825–
846.
Büsch, D., Hagemann, N., & Bender, N. (2010). The dimensionality of the Edinburgh
Handedness Inventory: An analysis with models of the item response theory.
Laterality, 15(6), 610–628.
Butcher, J. N., Graham, J. R., Haynes, S. N., & Nelson, L. D. (1995). Special issue:
Methodological issues in psychological assessment research. Washington, DC:
American Psychological Association.
Butler, A. B., & Hodos, W. (2005). Comparative Vertebrate Neuroanatomy: Evolution
and Adaptation. New Jersey: John Wiley & Sons.
Byrne, B. (2001). Structural equation modelling with AMOS: Basic concepts,
applications, and programming. Mahvah, New Persey:Lawrence Erlbaum.
Calvert, G. A., & Bishop, D. V. M. (1998). Quantifying Hand Preference Using a
Behavioural Continuum. Laterality, 3(3), 255–268.
Campbell, M., Keller, B., Small, A., Petti, T., & Ferrit, S. (1978). Minor physical
anomalies in young psychotic children. American Journal of Psychiatry, 135(5),
573–575.
Cameron, S. L., Johnson, K. P., & Whiting, M. F. (2007). The Mitochondrial genome of
the screamer louse bothriometopus (Phthiraptera: Ischnocera): Effects of
extensive gene rearrangements on the evolution of the genome. Journal of
Molecular Evolution, 65(5), 589–604.
Carlstedt, A. R. (2001). Line bisecting test revelas relative left brain hemispheric
predominance in higly skilled athletes: Relationship Among cerebral laterality,
personality and sport performance. San Franscisco: University of San Francisco.
Carmines, E. G., & Zeller, R. A. (1991). Reliability and validity assesment. Newbury
Park: Sage.

218
Carter-Saltzman, L. (1980). Biological and sociocultur effects on handedness:
Comparison between biological and adoptive families, Science, 209(4462),
1263–1265.
Clark, B., & Warren, N. (1938). A consideration of the use of the term ocular
dominance. Optometry and Vision Science, 15(11), 406–411.
Clark, L. A., & Watson, D. (1995). Constructing Validity: Basic issues in objective
scale development. Psychological Assessment, 7(3), 309–319.
Clark, M. M. (1957). Left-handedness. London: University of London Press.
Clarke, S. (2003). Complexity of human interhemispheric. In E. Zaidel, & M. Iacoboni
(Eds.), The Parallel Brain: The Cognitive Neuroscience of the Corpus Callosum
(Issues in Clinical and Cognitive Neuropsychology) (pp. 47–50). Cambridge
MA: MIT Press.
Cochran, W. G. (1977). Sampling techniques (3rd Ed.). New York: John Wiley & Sons.
Colak, T., Bamac, B., Ozbek, A., Budak, F., & Bamac, Y. S. (2004). Nerve conduction
studies of upper extremities in tenis players. British Journal of Sports Medicine,
3(5), 632–635.
Coleman, S., Weinberg, E., & Lyman Laboratory of Physics, Harvard University,
Cambridge, Massachusetts 02138. (1973). Radiative corrections as the origin of
spontaneous symmetry breaking. Physical Review D, 7(6), 1888–1910.
Connolly, K. J., & Bishop, D. V. M. (1992). The measurement of handedness: A gross
culture comparison of samples from England and Papua New Guinea.
Neuropsychologia, 30(1), 13–26.
Corballis, M. C. (1991). The lopside ape: Evolution of the generative mind. Oxford:
Oxford University Press.
Corballis, M. C. (2010). Handedness and Cerebral Asymmetry. In K. Hugdahl, & R.
Westernhausen (Eds.), The Two Halves of the Brain: Information Proceesing in
the Cerebral Hemispeheres (pp. 65–88). Cambridge MA: MIT Press.
Coren, S. (1992). The left-hander syndrome: The causes and consequences of left-
handedness. New York: Free Press.
Coren, S. (1993). The lateral preference inventory for measurement of handedness,
footedness, eyedness and earedness: Norms for young adults. Bulletin of the
Psychonomic Society, 31(1), 1–3.
Coren, S. (1995). Family patterns in handedness evidence for indirect inheritance
Mmediated by birth stress. Behavior Genetics, 25(6), 517–524.

219
Coren, S., & Kaplan, C. P. (1973). Patterns of ocular dominance. American Journal of
Optometry and Archives of American Academy of Optometry, 50(4), 283–292.
Coren, S. & Porac, C. (1978). The validity and reliability of self-report items for the
measurement of lateral preference. British Journal of Psychology, 69(2), 207–
211.
Corey, D., Hurley, M., & Foundas, A. L. M. (2001). Right and left handedness defined:
A multivariate approach using hand preference and hand performance measures.
Neuropsychiatry, Neuropsychology, & Behavioral Neurology, 14(3), 144–152.
Cornwell, K. S., Harris, L. J., & Fitzgerald, H. E. (1991). Task effects in the
development of hand preference in 9-, 13-, and 20-month-old infant girls.
Developmental Neuropsychology, 7(1), 19–34.
Coumoul, X., & Deng, C. X. (2003). Roles of FGF receptors in mammalian
development and congenital diseases. Birth Defects Research. Part C, Embryo
Today : Reviews, 69(4), 286–304.
Cox, D. R., & Small, N. J. H. (1978). Testing multivariate normality. Biometrika, 65(2),
263–272.
Cronbach, L. J., & Meehl, P. E. (1955). Construct validity in psychological test.
Psychological Bulletin, 52, 281–302.
Cronbach, L. J., Rajaratnam, N., & Gleser, G. C. (1963). Theory of generalizability: A
liberalization of reliability theory. British Journal of Statistical Psychology, 16,
137–163.
Crovitz, H. F., & Zener, K. (1962). A group test for assessing hand and eye-dominance.
American Journal of Psychology, 75(2), 271–276.
Crow, T. J. (2002). Sexual selection, timing, and X-Y homologous gene: Did Homo
Sapiens Speciate on the Y Chromosome? In T. J. Crow (Eds.), The speciation of
modern Homo Sapiens (pp. 197–216). Oxford: Oxford University Press.
Crow, T. J., Close, J. P., Dagnall, A. M., & Priddle, T. H. (2009). Where and what is the
right shift factor or cerebral dominance gene? A critique of Francks et al. (2007).
Laterality, 14(1), 3–10.
Cui, J-W., He, H-J., Lv, L-Ch., & Yin, F-R. (2012). Spontaneous mirror parity
violation, common origin of matter and dark matter, and the LHC signatures.
Physical Review, in Press, arXiv:1110.6893v3.

220
Cunningham, D. J. (1892). Contribution of the Surface Anatomy of the Cerebral
Hemispheres. Dublin: Royal Irish Academy. Citated in Geschwind and
Galaburda, 1987.
Cykowski, M. D., Coulon, O., Kochunov, P. V., Amunts, K., Lancaster, J. L., Laird, A.
R., et al. (2008). The central sulcus: An observer-independent characterization of
sulcal landmarks and depth asymmetry. Cerebral Cortex, 18(9), 1999–2009.
Čihák, R. (2001). Anatomie I., II., III. Praha: Grada.
Daly, R. M., Saxon, L., Turner, C. H., Robling, A. G., & Bass, S. L. (2004). The
relationship between muscle size and bone geometry dutiny growth and in
response to exercise. Bone, 34(2), 281–287.
Darlington, R. B., Morrison, Donald F. (1990) Multivariate Statistical Methods. New
York: McGraw-Hill.
Davatzikos, C., & Bryan, R. N. (2002). Morphometric Analysis of Cortical Sulci Using
Parametric Ribbons: A Study of the Central Sulcus. Journal of Computer
Assisted Tomography, 26(2), 298–307.
Davis, L. L. (1992). Instrument review: Getting the most from your panel of experts.
Applied Nursing Research, 5(4), 194–197.
De Bellis, M. D., Keshavan, M. S., Beers, S. R., Hall, J., Frustaci, K., Masalehdan, A.,
Noll, J., & Boring, A. M. (2001). Sex differences in brain maturation during
childhood and adolescence. Cerebral Cortex, 11(6), 552–557.
Dean, R. S. (1988). Lateral preference schedule. Odessa, Florida: Psychological
Assessement Resources.
Delacato, C. H. (1966). Neurological organisation and reading. Springfield, IL: C. C.
Thomas.
Dellatolas, G., Annesi, I., Jallon, P., Chavance, M., & Lellouch, J. (1990). An
epidemiological reconsideration of the Geschwind – Galaburda Theory of
cerebral lateraliozation. Archives of Neurology, 47(7), 778–782 .
Ding, H., Qin, W., Jiang, T., Zhang, Y., & Yu, C. (2012). Volumetric variation in
subregions of the cerebellum correlates with working memory performance.
Neuroscience Letters, 508(1), 47–51.
Dodd, J., Jessell, T. M., & Placzek, M. (1998). The when and where of floor plate
induction. Science, 282(5394), 1654–1657.
Donaldson, G., & Johnson, G. (2006). The clinical relevance of hand preference and
laterality. Physical therapy reviews, 11(3), 195–203.
221
Dones, L., & Tremaine, S. (1993). Why does the earth spin forward? Science,
259(5093), 350–354.
Dorsaint-Pierre, R., Penhune, V. B., Watkins, K. E., Neelin, P., Lerch, J. P., Bouffard
M., & Zatorre, R. J. (2006). Asymmetries of the planum temporale and Heschl’s
gyrus: relationship to langure lateralization. Brain, 129(5), 1164–1174.
Doyen, A. L., & Carlier, M. (2002). Measuring handedness: A validation study of
Bishop's reaching card test. Laterality, 7(2), 115–130.
Dragovic, M. (2004). Towards an improved measure of the Edinburgh Handedness
Inventory: A one-factoe congeneric measurement model usány confirmatory
factor analysis. Laterality, 9(4), 411–419.
Dragovic, M., & Hammond, G. (2007). A classification of handedness using the Annett
Hand Preference Questionnaire. British Journal of Psychology, 98(3), 375–387.
Dragovic, M., Milenkovic, S., & Hammond, G. (2008). The distribution of hand
preference is discrete: A taxometric examination. British Journal of Psychology,
99(4), 445–459.
Driesen, N. R., & Naftali, R. (1995). The influence of sex, age, and handedness on
corpus callosum morphology: A meta-analysis, Psychobiology 23(3), 240–247.
Drnková, Z., & Syllabová, R. (1983). Záhada leváctví a praváctví. Praha, Avicenum.
Duncan, O. D. (1966). Path analysis: sociological examples. American Journal of
Sociology, 72(1), 1–16.
Dylevský, I., Druga, R., & Mrázková, O. (2000). Funkční anatomie člověka. Praha:
Grada.
Ebel, R. L. & Frisbie, D. A. (1991). Essentials of educational measurement. (5th Ed.).
Englewood Cliffs, NJ: Prentice-Hall.
Eberstaller, O. (1884). Zur oberflachten anatomie des grosshirn hemispharen. Wien Med
Blätter, 7(1), 479–481. Citated in Geschwind and Galaburda, 1987.
Eickhoff, S. B., Stephan, K. E., Mohlberg, H., Grefkes, C., Fink, G. R., Amunts, K., et
al. (2005). A new SPM toolbox for combining probalistic cytoarchitectonic
maps and functional imaging data. NeuroImage, 25(4), 1325–1335.
Eidelberg, D., & Galaburda, A. (1984). Inferior parietal lobule. Divergent architectonic
asymmetries in the human brain. Archives of Neurology 41(8), 843–852.
Elias, L. J., & Bryden, M. P. (1998). Footedness is a Better Predictor of Language
Lateralisation than Handedness. Laterality, 3(1), 41–51.

222
Elias, L. J., Bryden, M. P., & Bulman-Fleming, M. B. (1998). Footedness is a better
predictor than is handedness of emotional lateralization. Neuropsychologia,
36(1), 37–43.
Elliott, D., & Roy, E. A. (1996). Manual asymmetries in motor performance. Boca
Raton: CRC Press.
Embretson, S. E. (1991). A multidimensional latent trait model for measuring learning
and change. Psychometrika, 56(3), 495–515.
Eser, I., Durrie, D. S., Schwendeman, F., & Stahl, J. E. (2008). Association between
ocular dominance and refraction. Journal of Refractive Surgery (thorofare, N.j. :
1995), 24(7), 685–689.
Fagard, J., & Marks, A. (2000). Unimanual and bimanual tasks and the assessment of
handedness in toddlers. Developmental Science, 3(2), 137–147.
Fagard, J., Hardy – Léger, I., Kervella, C., & Marks, A. (2001). Changes on
interhemispheric transfer rate and the developmenatl of bimanual coordination
dring childhood. Journal of experimental childpsychology, 80(1), 1–22.
Failly, M., Bartoloni, L., Letourneau, A., Munozl, A., Falconnet, E., Rossier, C., M de
Santi, M., Santamaria, F., Sacco, O., DeLozier-Blanchet, C. D., Lazor, R., &
Blouin, J-L. (2009). Mutations in DNAH5 account for only 15% of a non-
preselected cohort of patients with primary ciliary dyskinesia, Journal of
Medical Genetics, 46(4), 281–286.
Faulkner, R. A., Bailey, D. A., Drinkwater, D. T., McKay, H. A., Arnold, C., &
Wilkinson, A. A. (1996). Bone densitometry in Canadian children 8–17 years of
age. Calcified Tissue International, 59(5), 344–351.
Ferron, J. M., & Hess, M. R. (2007). Estimation in SEM: A concrete example. Journal
of Educational and Behavioral Statistics, 32(1), 110–120.
Fine, E. J., Ionita, C. C., & Lohr, L. (2002). The history of the development of the
cerebellar examination. Seminars in Neurology, 22(4), 375–384.
Fix, J. D. (2002). Neuroanatomy (3rd Ed.). Baltimore, MD: Lippincott, Williams, &
Williams.
Fleishman, E. A. (1964). The Structure and Measurement of Physical Fitness.
Englewood Cliff, New Jersey: Prentice-Hall.
Flora, D. B., & Curran, P. J. (2004). An empirical evaluation of alternative methods of
estimation for confirmatory factor analysis with ordinal data. Psychological
Methods, 9(4), 466–491.

223
Forero, C. G., & Maydeu-Olivares, A. (2009). Estimation of IRT Graded Response
Models: Limited Versus Full Information Methods. Psychological Methods,
14(3), 275–299.
Foundas, A. L., Leonard, Ch. M., Gilmore, R. L., Fennell, E. B., & Heilman, K. M.
(1996). Pars triangularis asymmetry and language dominance. Proceedings of
the National Academy of Sciences of the United States of America, 93(2), 719–
722.
Foundas, A. L., Hong, K., Leopard, C. M., & Heilman, K. M. (1998). Hand preference
and magnetic resonance imaging asymmetries of the central sulcu.
Neuropsychiatry, Neuropsychology and Behavioral Neurology, 11(2), 65–71.
Francino M. P., & Ochman, H. (1997). Strand asymmetries in DNA evolution. Trends
in Genetics 13(6), 240–245.
Francks, C., Fisher, S. E., McPhie, I. L., Richardson, A. J., Marlow, A. J., Stein, J. F., et
al., (2002). A genome-wide linkage screen for relative handskill in sibling pairs.
American Journal of Human Genetics, 70(3), 800–805.
Francks, C., DeLisi, L. E., Shaw, S. H., Fisher, S. E., Richardson, A. J., Stein, J. F. et
al., (2003). Parent of Origin Effects on Handedness and Schizophrenia
Susceptibility on Chromosome 2p12-q11. Human Molecular Genetics, 12(24),
3225–3230.
Francks, C., Maegawa, S., Laurén, J., Abrahams, B. S., Velayos-Baeza, A., Medland, S.
E., et al. (2007). LRRTM1 on Chromosome 2P12 is a Maternally Suppressed
gene that is Associates Paternally with Handedness and Schizophrenia.
Molecular Psychiatry, 12(12), 1129–1139.
Franz, E. A., & Fahey, S. (2007). Developmental change in interhemispheric
communication. Psychological Science, 18(12), 1030–1031.
Fremelová, A., & Blahutková, M., (2004), Přístroj na zjišťování jemné motoriky a
laterální preference ruky a nohy In: Sport a kvalita života. První vydání, (pp.
25–28). Brno: FSpS MU Brno.
Fukuchi-Shimogori, T., & Grove, E. A. (2001). Neocortex patterning by the secreted
signaling molecule FGT8. Science, 294(5544), 1071–1074.
Furr, M. R., & Bacharach, V. R. (2008). Psychometrics: An Introduction. Sage
Publication: California.
Gabbard, C. (1992). Associations between hand and foot preference in 3 to 5 year olds.
Cortex, 28(3), 1–7.

224
Gabbard, C., Iteya, M., & Rabb, C. (1997). A lateralized comparison of handedness and
object proximity. Canadian Journal of Experimental Psychology, 51(2), 176–
180.
Galaburda A., Sanides, F., & Geschwind, N. (1978). Human brain: cytoarchitectonic
left–right asymmetries in the temporal speech region. Archives of Neurology
35(1), 812–817.
Gangestadt, S. W., & Yeo, R. A. (1994). Parental handedness and relative hand skill: A
test of the developmental instability hypothesis. Neuropsychology, 8(4), 572–
578.
Garel, S., Hoffman, K. J., & Rubenstein, J. L. (2003). Molecular Rregionalization of the
neocortex is disrupted in Fgt8 hypomorphic mutants. Development (Cambridge
England), 130(26), 1903–1914.
Garn, S. M., Rohmann, C. G., Wagner, B., & Ascoli, W. (1967). Continuing
bonegrowth throughout life: a general phenomenon. American Journal of
Physical Antropology, 26(3), 313–318.
Gentry, V., & Gabbard, C. (1995). Foot-preference behavior: a developmental
perspective. The Journal of General Psychology, 122(1), 37–45.
Geremek, M., Ziętkiewicz, E., Diehl, S. R., Alizadeh, Z. B., Wijmenga, C., & Witt, M.
(2006). Linkage analysis localises a Kartagener syndrome gene to a 3.5 cM
region on chromosome 15q24–25. Journal of Medical Genetics, 43(1), e1.
Geschwind, N., & Levitsky, W. (1968). Human Brain: Left-right Asymmetries in
Temporal Speech Region. Science, 161(3837), 186–187.
Geschwind, N., & Behan, P. (1982). Left Handedness: Association with immune
disease, migraine, and developmental learning disorders. Proceedings of the
National Academy of Science U.S.A, 79(16), 5097–5100.
Geschwind, N. & Galaburda, A. (1987). Cerebral Lateralization: Biological
Mechanisms Associations and Patology. Cambridge, MA: MIT Press.
Geschwind, D. H., Miller, B. L., DeCarli, Ch., & Carmelli, D. (2002). Heritability of
lobar brain volumes in twins supports genetic models of cerebral laterality and
handedness. Proceedings of the National Academy of Sciences of the United
States of America, 99(5), 3176–3181.
Giedd, J. N., Blumenthal, J., Jeffries, N. O., Rajapakse, J. C., Vaituzis, A. C., Liu, H.,
Berry, Y. C., Tobin, M., Nelson, J., & Castellanos, F. X. (1999). Development of
the human corpus callosum during childhood and adolescence: A longitudinal
225
MRI study. Progress in Neuro-Psychopharmacology and Biological Psychiatry,
23(4), 571–588.
Glavin, D. P., & Dworkin, J. P. (2009). Enrichment of the amino acid L-isovaline by
aqueous alteration on CI and CM meteorite parent bodies. Proceedings of the
National Academy of Science, 106(14), 5487–5492.
Goldberg, E. (2001). The executive brain: Frontal lobes and the civilized mind. Oxford:
Oxford University Press.
Golden, J. A., Bacilovi, A., McFadden, K. A., Beesley, J. S., Rubenstein, J. L., &
Grinspan, J. B. (1999). Ectopic bone morphogenetic proteins 5 and 4 in the
chicken forebrain lead to cyclopia and holoprosencephaly. Proceeding of the
National Academy of Science of the United States of America, 96(5), 2439–2444.
Gordon, H. (1920). Left-handedness and mirror writing. Brain, 43, 313–368.
Green, M. F., Satz, P., Smith, C., & Nelson, L. (1989). Is there atypical handedness in
schizophrenia? Journal of Abnormal Psychology, 98(1), 57–61.
Grewal, R., Cote, J. A., & Baumgartner, H. (2004). Multicollinearity and measurement
error in structural equation models: Implications for theory testing. Marketing
Science, 23(4), 519–529.
Grove, E. A., & Fukuchi-Shimogori, T. (2003). Generating the cerebral cortical area
map. Annual Review of Neuroscience, 26, 355–380.
Gualtieri, C. T., Adams, A., Shen, C. D., & Loiselle, D. (1982). Minor physical
anomalies in alcoholic and schizophrenic adults and hyperactive and autistic
children. American Journal of Psychiatry, 139(5), 640–643.
Guichard, C., Harricane, M-C., Lafitte, J. J., Godard, P., Zaegel, M., Tack, V., Lalau,
G., & Bouvagnet, P. (2001). Axonemal dynein intermediate-chain gene (DNAI1)
mutations result in situs inversus and primary ciliary dyskinesia (Kartagener
Syndrome). American Journal of Human Genetics, 68(4), 1030–1035.
Gulliksen, H. (1950). Theory of mental tests. New York: John Wiley.
Haefner, R. (1929). The educational significance of left-handedness. New York:
Teachers College, Columbia: University Press.
Hair, J., Anderson, R., Tatham, R., & Black, W. (1995). Multivariate data analysis (4th
ed.). Upper Saddle River, New Jersey: Prentice Hall.
Hallgrı´msson, B.,Willmore, K., & Hall, B. K. (2002). Canalization, developmental
stability, and morphological integration in primate limbs. Yearbook of Physical
Anthropology 45, 131–158.

226
Hallgrı´msson, B., Muyake, T., Wilmore, K., & Hall, B. K. (2003).
Embryologicalorigins of developmental stability: Size, shape and fluctuating
asymmetryin prenatal random bred mice. Journal of Experimantal Zoology
296(1), 40–57.
Hamada, H., Meno, C., Watanabe, D., & Saijoh, Y. (2002). Establishment of vertebrate
left-right asymmetry. Nature Reviews Genetics, 3(2), 103–113.
Hambleton, R. K., Swaminathan, H., & Rogers, H. J. (1991). Fundamentals of item
response theory. Newbury Park, Calif: Sage Publications.
Harris, A. J. (1958). Harris Tests of Lateral Dominance, Manual of Direction for
Administration and Interpretation. (3rd Ed.). New York: The Psychological
Corporation.
Harris, J. M. (2012). Visual Cortex: Anatomy, Functions & Injuries (Neuroscience
Research Progress). London: Nova Science Publisher.
Hassanin, A., Leger, N., & Deutsch, J. (2005). Evidence for multiple reversals of
asymmetric mutational constraints during the evolution of the mitochondrial
genome of Metazoa, and consequences for phylogenetic inferences. Systematic
Biology 54(2), 277–298.
Hatta, T., Ito,Y., Matsyuama, Y., & Hasegawa, Y. (2005). Lower limbs asymmetries in
early and late middle age, Assessement of handedness, footedness,and muscle
strenght of lower limbs. Laterality, 10(3), 267–277.
Hauck, J. A., & Dewey, D. (2001). Hand preference and motor functioning in children
with autism. Journal of Autism and Developmental Disorders, 31(3), 265–277.
Hayduk, L., Cummings, G., Boadu, K., Pazderka-Robinson, H., & Boulianne, S. (2007).
Testing! testing! one, two, three – Testing the theory in structural equation
models! Personality and Individual Differences, 42(5), 841–850.
Haynes, S. N., Richard, D. C. S., & Kubany, E. S. (1995). Content validity in
psychological assessment: A functional approach to concepts and methods.
Psychological Assessment, 7(3), 238–247.
Healey, J. M., Liederman, J., & Heschweind, N. (1986). Handedness is not a
unidimensional trait. Cortex, 22(1), 33–53.
Heaney, R. P., Bargerlux, M. J., Davies, K. M., Ryan, R. A., Johnson, M. L., & Gong,
G. (1997). Bone dimensional change with age: interactions of genetic, hormonal,
and body size variables. Osteoporosis International 7(5), 426–431.

227
Hellige, J. B. (2001). Hemispheric Asymmetry. Cambridge Massachusetts: Harvard
University Press.
Hellige, J. B., & Cox, P. J. (1989). Multitask investigation of individual differences in
hemispheric asymmetry. Journal of Experimental Psychology: Human
Perception and Performance, 14(2), 176–187.
Henner, K. (1927). Příznaky vznikající z nadměrné činnosti mozečku. Praha: Kamil
Henner.
Henner, K. (1936). Všeobecná diagnostika chorob mozečkových. Praha: Bursík &
Kohout.
Hepper, P. G., Shahidullah, S., & White, R. (1991). Handedness in the human fetus.
Neuropsychologia, 29(11), 1107–1112.
Herdman, C. M., & Friedman, A. (1985). Multiple resources in divided attention: a
cross-modal test of the independence of hemispheric resources. Journal of
Experimental Psychology. Human Perception and Performance, 11(1), 40–49.
Highley, J. R., Walker, M. A., Esiri, M. M., Crow, T. J., & Harrison, P. J. (2002).
Asymmetry of the Unicinate Fasciculus: A post-mortem study of normal
subjects and patiens with schizophrenia. Cerebral Cortex, 12(11), 1218–1224.
Hochberg, F. M., & LeMay, M. (1975). Arteriographic correlates of handedness.
Neurology, 25(3), 218–222.
Holubová, V., a kol. (2005). Nový akademický slovník cizích slov A-Ž. Praha:
Academia.
Hoogland, J. J. (1999). The robustness of estimation methods for covariance structure
analysis. Groningen: University of Groningen.
Hopkins, B., Lems, W., Janssen, B., & Butterworth, G. (1987). Postural and motor
asymmetries in newlyborns. Human Neurobiology, 6(3), 153–156.
Howard, I. P., & Rogers, B. J. (2002). Seeing in depth. Toronto: I. Porteous.
Hu, L., & Bentler, P. M. (1998). Fit indices in covariance structure modeling:
Sensitivity to underparametrized model misspecification. Psychological
Methods, 3(4), 424–453.
Hu, L., & Bentler, P. M. (1999). Cutoff criteria for fit indexes in covariance structure
analysis: Conventional criteria versus new alternatives. Structural Equation
Modeling, 6(1), 1–55.
Hugdahl, K., & Westernhausen, R. (2010). The Two Halves of the Brain: Information
Proceesing in the Cerebral Hemispeheres. Cambridge MA: MIT Press.

228
Hull, C.J. (1936). A study of laterality test items. Journal of Experimental Education,
4(3), 287–290.
Humphrey, M. (1951). Handedness and Cerebral Dominance. B.Sc. Thesis: Oxford
University.
Hynd, G.W., Semrud-Clikeman, M., Lorys, A.R., Novey, E.S. & Eliopulos, D. (1990).
Brain morphology in developmental dyslexia and attention deficit
disorder/hyperactivity. Archives of Neurology 47(8), 919–926.
Hynd, G. W., Hall, J., Novey, E. S., Eliopulos, D., Black, K., Gonzalez, J. J., Edmonds,
J. E., & Cohen, M. (1995). Dyslexia and corpus callosum morphology. Archives
of Neurology, 52(1), 32–38.
Chance, S. A., Casanova, M. F., Switala, A. E., & Crow, T. J. (2008). Auditory cortex
asymmetry altered minicolumn spacing and absence of ageing effects in
schizophrenia. Brain, 131(12), 3178–3192.
Chapman, J. P., Chapman, L. J., & Allen, J. J. (1987). The measurement of foot
preference. Neuropsychologia, 25(3), 579–584.
Chen, J. X., Gong, J., Zhang, T. M., Wu, Q. L., & Xu, H. (2006). Correlations between
bone mineral density of the hand and other skeletal sites as measured by DXA in
Chinese women and men. Journal of Clinical Densitometry, 9(4), 461–468.
Cherry, E. C. (1953). Some experiments on the recognition of speech, with one and two
ears. Journal of the Acoustical Society of America 25(5), 975–979.
Chi, J. G., Dooling, E. C., & Gilles, F. H. (1977). Left – right asymmetries of the
temporal speech areas sof the human fetus. Archives of Neurology, 34(6), 346–
348.
Chiznikov, V. V., & Millen, K. J. (2005). Roof plate-dependent patterning of the
vertebrate dorsal central nervous system. Developmental Biology, 277(2), 287–
295.
Christoffersson, A. (1975). Factor analysis of dichotomized variables. Psychometrika,
40(5), 32.
Inui, N. (2005). Lateralization of bilateral transfer of visuomotor information in right –
handers and left – handers, Journal of Motor Behavior, 37(4), 275–283.
Iteya, M. (1998). Limb laterality and motor proficiency in children – behavioral
research on footeedness and handedness dissertation. Japan: University of
Tsukuba, Health and sport science.

229
Ito, M. (1982). Experimental verification of Marr-Albus' plasticity assumption for the
cerebellum. Acta Biologica Academiae Scientiarum Hungaricae, 33(2–3), 188–
199.
Jäncke, L., & Steinmetz, H. (2004). Anatomical brain asymmetries and thein relevance
for functional asymmetries. In K. Hugdahl & R. J. Davidson (Eds.), The
asymmetrical brain (pp. 187–229). Cambridge, Massachusetts: MIT Press.
Johnson, J. P., Sommers, R. K., & Weidner, W. E. (1977). Dichotic ear preference in
aphasia. Journal of Speech and Hearing Research, 20(1), 116–129.
Johnson, M. H. (2005). Developmental cognitive neuroscience (2nd ed.). Victoria:
Blackwell publishing.
Jöreskog, K. G. (1971). Statistical analysis of congeneric test. Psychometrika, 36(2),
109–133.
Jöreskog, K. G., & Sörbom, D. (1979). Advances in factor analysis and structural
equation models. New York: University Press of America.
Jöreskog, K. G., & So ̈rbom, D. (1993). LISREL 8 user's reference guide. Chicago, Ill:
Scientific Software International.
Kábrt, J., Kucharský, P., Schams, R.,Vránek, Č., Wittichová, D., & Zelinka, V. (2001).
Latinsko-český slovník. Praha: Leda.
Kalat, J. W. (1995). Biological psychology. Brooks/Cole. USA.
Kalaycıoğlu, C., Kara, C., Atbaşoğlu, C., & Nalçacı, E. (2008). Aspects of foot
preference: Differential relationships of skilled and unskilled foot movements
with motor asymmetry. Laterality, 13(2), 124–142.
Kannus, P., Haaspasalo, H., & Sankelo, M. (1995). Effect of starting age of physical
activity on bone mass in the dominant arm of tennis and squash players. Annals
International Medicine 123(1), 27–31.
Kaplan, D. (2009). Structural equation modeling: Foundation and extensions (2nd ed.).
Thousands Oaks, CA: Sage.
Karni, A., Meyer, G., Jezzard, P., Adams, M.M., Turner, R. & Ungerleider, L.G.
(1995). Functional MRI evidence for adult motor cortex plasticity during motor
skill learning. Nature, 377(6545), 155–158.
Kartagener M. (1933). Zur pathogenese der bronkiektasien. Bronkiektasien bei Situs
viscerum inversus. Beitr Klin Tuberk, 83, 489.

230
Kastner-Koller, U., Reimann, P., & Bruckner, J. (2007). Assessing handedness in pre-
schoolers: Construction and initial validation of a hand preference test for 4-6-
year-olds. Psychology Science, 49(3), 239–254.
Keller, S. S., Crow, T., Fiundas, A., Amunts, K., & Roberts, N. (2007). Sulcal
variability, stereological measurement and asymmetry of Broca`s are on MR
images. Journal of Anatomy, 211(4), 534–555.
Kennedy, D. N., O`Craven, K. M., Ticho, B. S., Goldstein, A. M., Makris, N., &
Henson, J. W. (1999). Structural and functional brain asymmetries in human
situs inversus totalit. Neurology, 53(6), 1260–1265.
Kertesz, A., Polk, M., Blafl, S. E., & Howell, J. (1992). Anatomical asymmetries and
functional laterality. Brain 115(2), 589–605.
Kimura, D. (1961). Cerebral dominance and the perception of verbal stimuli. Canadian
Journal of Psychology, 15(3), 166–171.
Kimura, D. (1964). Left-right differences in the perception of melodie. The Quarterly
Journal of Experimental Psychology, 16(4), 355–358.
Kirk, R. (1996). Practical significance: A concept whose time has come. Educational
and Psyhoclogical Measurement, 56(5), 746–759.
Knecht, S., Dräger, B., Deppe, M., Bobe, L., Lohmann, H., Flöel, A., Ringelstein, E.-B.,
& Henningsen, H. (2000). Handedness and hemispheric language dominance in
healthy humans. Brain, 123(12), 2512–2518.
Kommerell, G., Schmitt, C., Kromeier, M., & Bach, M. (2003). Ocular prevalence
versus ocular dominance. Vision Research, 43(12), 1397–1403.
Kosaki, K & Casey, B. (1998). Genetics of human left–right axis malformations.
Seminars in Cell & Developmental Biology, 9(1), 89–99.
Koukolník, F. (2008). Mozek a jeho duše. Praha, Galén.
Kovac, D. (1973). Measuring lateral preference on the basis of subjective data. Stud.
Psychology, 15(3), 235–248.
Krejcie, R. V., & Morgan, D. W. (1970). Determining sample size for research
activities. Educational and Psychological Measurement, 30(3), 607–610.
Krombholz, H. (1993). Händigkeit, Körperschema und kognitive und motorische
Leistungen im Kindesalter – eine Literaturübersicht. Schweizerische Zeitschrift
für Psychologie, 52(4), 271–286.
Kučera, O. (1961). Psychopatologické projevy při lehkých dětských encefalopatiích.
Praha: Státní zdravotnické nakladatelství.

231
Laland, K. N., Kumm, J., Van Horn, J. D., & Feldman, M. W. (1995). A gene-culture
model of human handedness. Behavior Genetics, 25(5), 433–445.
Lanyon, L. E. (1980). The influence of function on the development of bone
curvature.An experimental study on the rat tibia. Journal of Zoology, 192(4),
457–466.
Larsen, J. P., Hoien, T., Lundberg, I., & Odegaard, H. (1990). MRI evaluation of the
size and symmetry of the planum temporale in adolescents with developmental
dyslexia. Brain and Language, 39(2), 289–301.
Lawrence, D.G., & Kuypers, H. G. J. M. (1968). The functional organization of the
motor system in the monkey: The effects of bilateral pyramida lesions. Brain,
91(1), 15–36.
Lawshe, C. H. (1975). A quantitative approach to content validity. Personnel
Psychology, 28(4), 563–575.
Lazenby, R. A., (1990). Continuing periosteal apposition. I: Documentation,
hypotheses,and interpretation. American Journal of Physical Anthropology
82(4), 451–472.
Leigh, M. W., Pittman, J. E., Carson, J. L., Ferkol, T. W., Dell, S. D., Davis, S. D.,
Knowles, M. R., & Zariwala, M. A. (2009). Clinical and genetic aspects of
primary ciliary dyskinesia/Kartagener syndrome. Genetics in Medicine, 11(7),
473–487.
Lennon, R. T. (1956). Assumptions underlying the use of content validity. Educational
and Psychological Measurement, 16(3), 294–304.
Leviton, A., & Kilty, T. (1976). Birth order and left handedness. Archives of
Neurology, 33(9), 664.
Levy, J., & Nagylaki, T. (1972). A model for the genetics of handedness. Genetics,
72(1), 117–128.
Liepmann, h. (1908). Drei Aufsätze aus dem Apraxiegebiet: Kleine Hilfsmittel bei der
Untersuchung von Gehirnkranken (1905), Die links Hemisphäre und das
Handeln (1905), Über die Funktion des Balkens beim Handeln und die
Beziehungen von Aphasie und Apraxie zur Intelligenz (1907). Berlin: Karger.
Llinas, R. R., Walton, K. D., & Lang, E. J. (2004). Cerebellum. In G. M. Shepherd
(Eds.), The Synaptic Organization of the Brain (pp. 271–294). New York:
Oxford University Press.

232
Loehlin, J. C. (2004). Latent variable models: An introduction to factor, path, and
structural analysis. Mahwah, N.J: Lawrence Erlbaum.
Loevinger, J. (1957). Objective tests as instruments of psychological theory. Missoula,
Mont.: Southern Universities Press.
Lopez-Gracia, M. L., Ros, M. A. (2007). Left-Right Asymmetry in Vertebrate
Development (Advances in Anatomy, Embryology and Cell Biology). Springer:
Heidelberg.
Lord, F. M. (1962). Estimating norms by item sampling. Educational and Psychological
Measurement, 22(2), 259–267.
Lord, F. M., & Novick, M. R. (1968). Statistical theories of mental test scores. Reading,
Mass: Addison-Wesley Public Company.
Lu, X. & Ashe, J. (2005). Anticipatory activity in primary motor cortex codes
memorized movement sequences. Neuron, 45(6), 967–973.
Lubke, G., & Neale, M. (2008). Distinguishing between latent classes and continuous
factors with categorical outcomes: Class invariance of parameters of factor
mixture models. Multivariate Behavioral Research, 43(4), 592–620.
Lucki, N., & Nicolay, C. (2007). Phenotypic plasticity and functional asymmetry in
response to grip forces exterted by intercollegiate tennis player. American
Journal of Human Biology 19(4), 566–577.
Luria, A. R. (1962) Higher Cortical Functions in Man. Moscow University Press:
Library of Congress Number.
Luria, A. R. (1976). The Cognitive Development: Its Cultural and Social Foundations.
Cambridge, Mass: Harvard University Press.
Lutchmaya, S., Baron-Cohen, S., & Raggatt, P. (2002). Foetal testosterone and
vocabulary size in 18- and 24-month-old infants. Infant Behaviour and
Development, 24(4), 418–424.
Lynn, M. R. (1986). Determination and quantification of content validity. Nursing
Research, 35(6), 382–385.
MacIntyre, N., Adachi, J., & Weber, C. (1999). In vivo detection of structural
differences between dominant and nondominant radii using peripheral
quantitative computed tomography. Journal of Clinical Densitometry, 2(4), 413–
422.
MacNeilage, P. (1991). The postural origins theory of primate neurobiological
asymmetries. In N. A. Krasnegor, D. M. Rumbaugh, R. L. Schiefelbusch, & M.

233
Studdert-Kennedy (Eds.), Biological and behavioral determinants of language
development (pp. 165–188). Hillsdale, New Jersey: Erlbaum.
Magnusson, D. (1967). Test theory. Reading, MA: Addison-Wesley.
Machold , R., Hayashi, S., Rutlin, M., Muzumdar, M. D., Nery, S., Corbin, J., J. G. et
al. (2003). Sonic hedgehog is Rrequired for progenitor cell maintenance in
telencephalon stem cell niches. Neuron, 39(6), 937–950.
Mallik, R., Carter, B. C., Lex, S. A., Kin. S. J., & Gross, S. P. (2004). Cytoplasmic
dynein functions as a gear in response to load, Nature, 427(6975), 649–652.
Mamolo, C. M., Roy, E. A., & Bryden, P. J. (2004). The effects of skill demands and
object position on the distribution of preferred hand reaches. Brain and
Cognition , 55(2), 349–351.
Mamolo, C., Roy, E., Rohr, L., & Bryden, P. J. (2006). Reaching patterns across
working space: The effects of handedness, task demands, and comfort levels.
Laterality, 11(5), 465–492.
Manning, J. T., Scutt, D., Wilson, J., & Lewis-Jones, D. I. (1998). The ratio of 2nd to
4th digit length: A predictor of sperm numbers and concentrations of
testosterone, luteinizing hormone and oestrogen. Human Reproduction, 13(11),
3000–3004.
Manning, J. T., Stewart, A., Bundred, R. E., & Trivers, R. L. (2004). Sex and ethnic
differences in 2nd to 4th digit ratio of children. Early Human Development,
80(2), 161–168.
Manning, J. T., Churchill, A. J. G., & Peters, M. (2007). The effects of sex, ethnicity,
and sexual orientation on self-measured digit ratio (2D:4D). Archives of Sexual
Behavior, 36(2), 223–233.
Manning, J. T., & Peters, M. (2009). Digit ratio (2D:4D) and hand preference for
writing in the BBC Internet Study. Laterality, 14(5), 528–540.
Mapp, A. P., Ono, H., & Barbeito, R. (2003). What does the dominant eye dominate? A
brief and somewhat contentious review. Perception & Psychophysics, 65(2),
310–317.
Mark, L. S., Nemeth, K., Gardner, D., Dainoff, M. J., Paasche, J., Duffy, M., et al.
(1997). Postural dynamics and the preferred critical boundary for visually guided
reaching. Journal of Experimental Psychology: Human Perception and
Performance, 23(5), 1365–1379.

234
Markow, T. A. (1992). Human handedness and the concept of developmental
instability. Genetica, 87(2), 87–94.
Markow, T. A., & Wandler, K. (1986). Fluctuating asymmetry and the genetics of
liability to schizophrenia. Psychiatry Research, 19(4), 323–328.
Marsh, H.W., Hau, K-T, & Grayson, D. (2005). Goodness of fit in structural equation
modeling. In: J. J. McArdle, & M. A. Olivares (Eds.), Contemporary
Psychometrics: A Festschrift for Roderic P. McDonald, (pp. 276–336).
Routledge: New York.
Mastaglia, B., Toye, C., & Kristjanson, L. J. (2003). Ensuring content validity in
instrument development: Challenges and innovative approaches. Contemporary
Nurse, 14(3), 281–291.
Masters, G. N (1982). A Rasch model for partial credit scoring. Psychometrika, 47(2),
149–174.
Masters, G. N., & Wright, B. D. (1997). The partial credit model. In: W. J. van der
Linden, & R. K. Hambleton (Eds.), Handbook of modern item response theory
(pp. 101–122). Springer: NewYork.
Matějček, Z.,& Žlab, Z. (1972). Zkouška laterality. Psychodiagnostické & didaktické
testy, 3–13.
Maydeu-Olivares, A., & McArdle, J. J. (2005). Contemporary psychometrics. Mahwah,
N.J: Lawrence Erlbaum.
McDonald, R. P. (1999). Test theory: A unified treatment. Mahwah, N.J: L. Erlbaum
Associates.
McDonald, R. P., & Marsh, H. W. (1990). Choosing a multivarite model: Noncentrality
and goodness of fit. Psychological Bulletin, 107(2), 247–255.
McDonald, R. P., & Ho, R. M. (2002). Principles and practise in reporting structural
equation analysis. Psychological Methods, 7(1), 64–82.
McFarland, K., & Anderson, J. (1980). Factor stability of the Edinburgh Handedness
Inventory as a function of test-retest performance, age, and, sex. British Journal
of Psychology, 71(1), 135–142.
McKeever, W. F., Suter, P. J., & Rich, D. A. (1995). Maternal age and parity correlates
of handedness: Gender but no parental handedness modulation of effetcs. Cortex
31(3), 543–553.
Mckenzie, B. E. (1990). Early cognitive development: Notion of objects space and
causality in Infancy. In: C. A. Hauert. Developmental psychology: Cognitive,

235
perceptuo-motor, and neuropsychological perspectives (pp. 19–42). Amsterdam:
North-Holland.
McManus, I. C. (1981). Handedness and birth stress. Psychological Medicine, 11(3),
485–496.
McManus, I. C. (1984). Genetic of handedness in relation to langure disorder. Advances
in Neurology, 42, 125–138.
McManus, I. C. (1985). Handedness, language dominance and aphasia: A genetic
model. Psychological Medicine, Monograph Suplement, 8, 1–40.
McManus, I. C. (1985b). On testing the right shift theory: A reply to Annett. British
Journal of Psychology, 76(1), 31–34.
McManus, I. C. (1985)c). Right-hand and left-hand skill: Failure of the Right Shift
Model. British Journal of Psychology, 76(1), 1–16.
McManus, CH. (2002). Right Hand Left Hand The Origins of Asymmetry n Brain,
Bodies, Atoms and Culture. Harvard University Press: Cambridge,
Massachusetts.
McManus, I. C. (2005). Reversed bodies, reversed brains, and (some) reversed
behaviors: Of zebra fish and men. Developmental Cell, 8, 796–797.
McManus, I. C., & Bryden, M. P. (1992). The Genetics of Handedness and Cerebral
Lateralization, In: I. Rapin, & S. J. Segalowitz (Eds.), Handbook of
Neuropsychology Vol. 8, (pp. 299–321). Amsterdam: Elsevier.
McManus, I. C., Martin, N., Stubbings, G. F., Chung, E. M., & Mitchison, H. M.
(2004). Handedness and situs inversus in primary ciliary dyskinesia.
Proceedings Biological Science, 271(1557), 2579–2582.
McMeekan, E. R. L., & Lishman, W. A. (1975). Retest reliabilities and interrelationship
of the Annett Hand Preference Questionnaire and the Edinburgh Handedness
Inventory. British Journal of Psychology, 66(1), 53–59.
Medland, S. E., Perelle, I., De Monte, V., & Ehrman, L. (2004). Effects of culture, sex,
and age on the distribution of handedness. Laterality, 9(3), 287–297.
Mellenbergh, G. J. (1995). Conceptual notes on models for discrete polytomous item
responses. Applied Psychological Measurement, 19(1), 91–100.
Messick, S. (1993). Validity. In R. L. Linn (Eds.), Educational measurement (pp. 13–
104). Phoenix: American Council on Education and Oryx Press.
Michell, J. B. (1997). Quantitative science and the definition of measurement in
psychology. British Journal of Psychology, 88(3), 355–383.

236
Millsap, R. E. (2007). Structural equations modeling made difficult. Personality and
Individual Differences, 42(5), 869–881.
Mislevy, R. J. (1986). Recent developments in the factor analysis of categorical
variables. Journal of Educational Statistics, 11(1), 3–31.
Mohr, C., Landis, T., Bracha, H. S., & Brugger, P. (2003). Opposite turning behavior in
right-handers and non-right-handers suggests a link between handedness and
cerebral dopamine asymmetries. Behavioral Neuroscience, 117(6), 1448–1452.
Mohr, C., Thut, G., Landis, T., & Brugger, P. (2003). Hands, arms and minds:
Interaction between posture and thought. Journal of clinical Experimental
Neuropsychology, 25(7), 1000–1010.
Molfese, D. L., & Segalowitz, S. J. (1988). Brain lateralization in children
developmental implication. London: Guildford Press.
Money, J. (1972). Studies on the functioning of sighting dominance. Quarterly Journal
of Experimental Psychology, 24(4), 454–464.
Moore, G. C., & Benbasat, I. (1991). Development of a instrument to measure the
perception of adopting an information technology innovation. Information
Systems Research, 2(3), 192–222.
Mori, S., Iteya, M., & Kimura, M. (2004). Foot Preference and Hand-Foot Coordination
in Preschool Children. Bulletin of Tokyo Gakugei University, 55, 151–154.
Mori, S., Iteya, M., & Gabbard, C. (2006). Hand preference and hand – eye
coordination in young children during a motor task. Perceptual and Motor Skill,
102(1), 29–34.
Morosan, P., Rademacher, J., Schleicher, A., Amunts, K., Schormann, T., & Zilles, K.
(2001). Human primary auditory cortex: Cytoarchitectonic subdivisions and
mapping into a spatial reference system. NeuroImage, 13(4), 684–701.
Morrison, D. F. (1990) Multivariate Statistical Methods (3nd ed.). New York: McGraw-
Hill.
Musálek, M. (2011). Metodologické problémy a psychometrické vlastnosti Edinburgh
handedness Inventory. Česká kinantropologie, 15(2), 16–21.
Musálek, M., & Štochl, J. (2010). A means of field diagnostics of motor manifestation
of laterality and its flaws. Acta Universitatis Carolinae, 46(2), 89–96.
Muthén, B. O. (1978). Contributions to factor analysis of dichotomized variables.
Psychometrika, 43(4), 551–560.

237
Muthén, B. O. (1984). A general structural equation model with dichotomous, ordered
categorical, and continuous latent variable indicators. Psychometrika, 49(1),
115–132.
Muthén, B. O. (2002). Beyond SEM: General latent variable modeling.
Behaviormetrika, 29(1), 81–117.
Muthén, B. O., du Toi, S. H. C., & Spisic, D. (1997). Robust inference using weighted
lest square and quadratic estimation equations in latent variable modeling with
categorical and continuous outcomes. Unpublished Manuscript.
Muthén, B. O., & Asparouhov, T. (2002). Latent variable analysis with categorical
outcomes: Multiply-group and growth modeling in Mplus. el form 2009.
www.statmodel.com/download/webnotes/CatMGLong.pdf
Muthén, L. K., & Muthén, B. O. (2010). Mplus: Statistical analysis with latent
variables : User's Guide. Los Angeles: Muthén & Muthén.
Nagae, S. (1983). Development of hand-eye dominance in relation to verbal self-
regulation of motor behavior. American Journal of Psychology, 9(4), 539–552.
Nicola, A. J., & Barres, B. A. (2009). Neuroscience: Glia - more than just brain glue.
Nature, 457(7230), 675–677.
Nicolle, J. (1962). Louis Pasteur: A Master of Scientific Enquiry. London.
Nicholls, J. G., & Nicholls, J. G. (2001). From neuron to brain. Sunderland, Mass:
Sinauer Associates.
Nisbett, R. E., & Wilson, T. D. (1977). Telling more than we can know: Verbal reports
on mental processes. Psychological Review, 84(3), 231–259.
Noback, C. R., Strominger, N. L., Demarest, R. J., & Ruggiero, D. A. (2005). The
Nervous System: Structure and Function. (6th Eds.), Totowa, NJ: Humana Press.
Nobuyuki, I. (2005). Lateralization of Bilateral Transfer of Visuomotor Information in
Right – Handers and Left – Jandera. Journal of Motor Behavior, 37(4),
275–283.
Noffal, G. J. (1999). Anthropometric upper limb characteristics of the high performance
tennis player. Medicine and Science in Tennis 4, 7.
Noonan, M., & Axelrod, S. (1981). Earedness (ear choice in monaural tasks): its
measurement and relationship to other lateral preferences. The Journal of
Auditory Research, 21(4), 263–277.
Norman, H. F., Norman, J. F., & Bilotta, J. (2000). The temporal course of suppression
during binocular rivalry. Perception, 29(7), 831–841.

238
O’ Connor, J. (1965). Eyedness and cross-dominance. Boston, MA: Johnson O’ Connor
Research Foundation.
O’Leary, D. D., Chou, S. J., & Sahara, S. (2007). Area Patterning of the Mammalian
Cortex, Neuron, 56(2), 252–269.
Obrzut, J. E., Dalby, P. R., Boliek, C. A., & Cannon, G. E. (1992). Factorial structure of
the Waterloo Handedness Questionnaire for control and learning-disabled adults.
Journal of Clinical and Experimental Neuropsychology, 14(6), 935–950.
Oeztuerk, C., Durmazlar, N., Ural, B., Karaagaoglu, E., Yalaz, K., & Anlar, B. (1999).
Hand and eye preference in normal preschool children. Clinical Pediatrics,
38(11), 677–680.
Oldfield, R. C. (1969). Handedness in musicians. British Journal of Psychology, 60(1),
91–99.
Oldfield, R. C. (1971). The assessment and analysis of handeness: The Edinburgh
inventory. Neuropsychologia, 9, 97–113.
Oliverio, M., Digilio, M. C., Versacci, P., Dallapiccola, B., & Marino, B. (2010). Shells
and heart: are human laterality and chirality of snails controlled by the same
maternal genes? America Journal of Medical Genetic, 152(10), 2419–2425.
Orsini, D. L., & Satz, P. (1986). A syndrome of pathological left-handedness: Correlates
of early eft hemispehere injury. Archives of Neuropsychology, 43(4), 333–337.
Orton, S. T. (1937). Reading, writing and speech problems in children: A presentation
of certain types of disorders in the development of the language faculty. New
York: W.W. Norton & Co.
Ozeretzky, N. (1931). Psychomotorik. Methoden zur Untersuchung der Motorik. Leip:
s. n.
Parker, D. F., Round, J. M., Sacco, P., & Jones, D. A. (1990). A cross-sectional survey
of upper and lower-limb strength in boys and girls during childhood and
adolescence. Annals of Human Biology 17(3), 199–211.
Parsons, L. M. (2003). Superior parietal cortices and varieties of mental rotation. Trends
in Cognitive Sciences, 7(12), 515–517.
Pascual-Leone, A., Grafman, J., & Hallett, M. (1994). Modulation of cortical motor
output maps during development of implicit and explicit knowledge. Science,
263(5151), 1287–1289.
Peers, I. S. (1996). Statistical analysis for education and psychology researchers.
London: Falmer Press.

239
Penner, I. K., Schlafli, K., Opwis, K., & Hugdahl, K. (2009). The role of working
memory in dichotic-listening studies of auditory laterality. Journal of Clinical
and Experimental Neuropsychology, 31(8), 959–966.
Perelle, I. B., & Ehrman, L. (1994). An international study of human handedness: the
data. Behavior Genetics, 24(3), 217–227.
Peters, M. (1988). Footedness: Asymmetries in foot preference and skill and
neuropsychological assessment of foot movement. Psychological Bulletin,
103(2), 179–192.
Peters, M. (1990). Neuropsychological identification of motor problems: Can we learn
something from the feet and legs that hands and arms will not tell us?
Neuropsychology Review, 1(2), 165–183.
Peters, M. (1995). Handedness and its relation to other indices of cerebral lateralisation.
In R. J. Davidson & K. Hugdahl (Eds.), Brain asymmetry (pp. 183–214).
Cambridge, MA: MIT Press.
Peters, M. (1998). Description and validation of a flexible and broadly usable
handedness questionnaire. Laterality, 3(1), 77–96.
Peters, M., & Surfing, B. (1978). Handedness measure by finger tapping: A continuous
variable. Canadian Journal of Psychology, 32(4), 257–261.
Plato, C. C., Wood, J. L., & Norris, A. H. (2005). Bilateral asymmetry in bone
measurement of the hand and lateral hand dominance. American Journal of
Physical Anthropology, 52(1), 27–31.
Plochocki, J. H. (2004). Bilateral variation in limb articular surface dimensions.
American Journal of human Biology, 16(3), 328–333.
Polit, D. F., & Beck, C. T. (2004). Nursing research: Principles and methods (7th ed.)
Philadelphia: Lippincott, Williams, & Wilkins.
Polit, D. F., & Beck, C. T. (2006). The content validity index: are you sure you know
what's being reported? Critique and recommendations. Research in Nursing &
Health, 29(5), 489–497.
Porac, C. (2009). Hand preference and skilled hand performance among individuals
with successful rightward conversions of the writing hand, Laterality, 14(2),
105–121.
Porac, C., & Coren, S. (1976). The dominant eye. Psychological Bulletin, 83(5), 880–
897.
240
Porac, C., & Coren, S. (1981). Laterality preferences and human behavior. New York:
Springer-Verlag.
Porac, C., & Martin, W. L. B. ( 2007). A cross – cultural comparison of pressure to
switch left-handed writing: Brazil versus Canada. Laterality, 12(3), 273–291.
Porciani, C., Dekel, A., & Hoffman, Y. (2002). Testing tidal-torque theory – I. Spin
amplitude and direction. Monthly Notices of the Royal Astronomical Society,
332(2), 325–338.
Porta, G. (1593). De refractione optices parte: Libri novem. Neapoli: Ex officina
Horatii Salviani, apud Jo. Jacobum Carlinum, & Antonium Pacem.
Previc, F. H. (1991). A general theory concerning the prenatal origins of cerebral
lateralization in humans. Psychological Review, 98(3), 299–334.
Previc, F. H. (1994). Assessing the GBG model. Brain & Cognition, 26(2), 174–180.
Previc, F. H., & Saucedo, J. C. (1992). The relationship between turning behavior and
motoric dominance in humans. Perceptual and Motor Skills, 75(3), 935–944.
Prsa, M. (2010). Adaptive control of eye movement accuracy by the cerebellum: The site
of plasticity and functional mechanisms. (Adaptive control of eye movement
accuracy by the cerebellum.) Tübingen: University
Pryde, K. M., Bryden, P. J., & Roy, E. A. (2000). A developmental analysis of the
relationship between hand preference and performance: I. Preferential reaching
into hemispace. Brain and Cognition, 43(1–3), 370–374.
Punch, K. F. (2008). Úspěšný návrh výzkumu. (J. Hendl, Trans. 1. ed.). Praha: Portál.
Purves, D. (2008). Neuroscience. Sunderland, Mass: Sinauer.
Purves, D., White, L. E., & Andrews, T. J. (1994). Manual asymmetry and handedness.
Proceedings of the National Academy of Sciences, 91(11), 5030–5032.
Raczkowski, D., Kalat, J. W., & Nebes, R. (1974). Reliability and validity of some
handedness questionnaire items, Neuropsychologia, 12(1), 43–47.
Rademacher, J., Caviness, J., Steinmetz, H., & Galaburda, A. M. (1993). Topographical
variation of the human primary cortices: Implications for neuroimaging, brain
mapping, and neurobiology. Cerebral cortex, 3(4), 313–329.
Rapoport, J. L., & Quinn, P. O. (1975). Minor physical anomalies and early
developmental deviation: A major subgroup of hyperactive children.
International Journal of Mental Health, 4(1–2), 29–44.
Raykov, T., & Marcoulides, G. A. (2000). A first course in structural equation
modeling. London: Lawrence Erlbaum Associates.

241
Reckase, M. (2009). Multidimensional item response theory. New York: Springer.
Reiss, M., & Reiss, G. (1999). Earedness and handedness: distribution in a German
sample with some family data. Cortex; a Journal Devoted to the Study of the
Nervous System and Behavior, 35(3), 403–412.
Riehl, J. P. (2010). Mirror-image asymmetry: An introduction to the origin and
consequences of chirality. Hoboken, NJ: Wiley.
Rife, D. C. (1940). Handedness with special reference to twins. Genetics, 25(2), 178–
186.
Rigal, R. A. (1992). Which handedness: Preference or Performance, Perceptual and
Motor Skills, 75(3), 851–866.
Roberts, J. S., Donoghue, J. R., & Laughlin, J. E. (2000). A general item response
theory model for unfolding unidimensional polytomous response. Applied
Psychological Measurement, 24(1), 3–32.
Robinson, R. G., & Downhill, J. E. (1995). Lateralization of Psychopatology in
Response to Focal Brain Injury. In R. J. Davidson & K. Hugdahl (Eds.), Brain
Asymmetry (pp. 693–711), Cambridge: MA: MIT Press
Roessner, V., Banaschewski, T., Uebel, H., Becker, A., & Rothenberger, A. (2004).
Neuronal network models of ADHD – Lateralization with respect to
interhemispheric connectivity reconsidered. European Child & Adolescent
Psychiatry, 13(1), 71–79.
Root-Bernstein, R. (2010). Experimental test of L- and D-Amino acid binding to L- and
D-codons suggests that homochirality and codon directionality emerged with the
genetic code. Symmetry, 2(2), 1180–1200.
Roth, H. L., Lora, A. N., & Heilman, K. M. (2002). Effects of monocular viewing and
eye dominance on spatial attention. Brain, 125(9), 2023–2035.
Round, J. M., Jones, D. A., Honour, J. W., & Nevill, A. M. (1999). Hormonal factors in
the development of differences in strength between boys and girls during
adolescence: A longitudinal study. Annals of Human Biology 26(1), 49–62.
Ruff, C. B. (2003). Ontogenetic adaptation to bipedalism: age changes in femoral to
humeral length and strength proportions in humans, with a comparison to
baboons. Journal of Human Evolution. 45(4), 317–349.
Ruff, C .B., Walker, A., & Trinkaus, E. (1994). Postcranial robusticity in Homo. III:
Ontogeny. American Journal of Physical Anthropology 93(1), 35–54.

242
Sahyoun, C. (2004). Towards an understanding of gait control: brain activation during
the anticipation, preparation and execution of foot movements. Neuroimage,
21(2), 568–575.
Salam, A., & Meath, W. J. (1998). On enantiomeric excesses obtained from racemic
mixtures by using circularly polarized pulsed lasers of varying durations.
Chemical Physics, 228(1–3), 115–129.
Sanders, G., Bereczkei, T., Casatho, A., & Manning, J. T. (2005). The ratio of the 2nd
to 4th finger length predicts spatial ability in men but not women. Cortex, 41(6),
789–795.
Sanger, T. (2003). Pathophysiology of pediatric movement disorders. Journal of Child
Neurology, 18(1), 9–24.
Senjanovic, G., Mohapatra, R. N., & Department of Physics, The City College of the
City University of New York, New York, New York 10031. (1975). Exact left-
right symmetry and spontaneous violation of parity. Physical Review D, 12(5),
1502–1505.
Sharman, J. L., Kulhavy, R. W. (1976). The Assessment of Cerebral Laterality: The
Sharman-Kulhavy Laterality Assessment Inventory: Some validaton data.
Perceptual and motor Skill, 42, 1314.
Shavelson, R. J., & Webb, N. M. (1991). Generalizability Theory: A Primer. Thousand
Oaks, CA: Sage
Sherman, S. M., & Guillery, R. W. (2000). Exploring the Thalamus. California:
Academic Press.
Schäfer, M. B. (2009). Galactic angular momenta and angular momentum correlations
in the cosmological large-scale structure. International Journal of Modern
Physics D, 18(2), 173–222.
Schachter, S. C., Ransil, B. J., & Geschwind, N. (1987). Association of handedness with
hair colour and learning disabilities. Neuropsychologia, 25(1), 269–276.
Schlaug, G., Jäncke, L., Huang, Y., & Steinmetz, H. (1995). In vivo evidence of
structural brain asymmetry in musicians. Science, 267(5198), 699–701.
Schlaug, G., Jäncke, L., Huang, Y., Staiger J. F., & Steinmetz, H. (1995). Increased
corpus callosum size in musicians. Neuropsychologia, 33(8), 1047–1055.
Schmahmann, J. D. (2004). Disorders of the cerebellum: Ataxia, dysmetria of thought,
and the cerebellar cognitive affective syndrome. Journal of Neuropsychiatry,
16(3), 367–378.

243
Schmidt, R. A., & Lee, T. D. (2011). Motor control and learning: A behavioral
emphasis. (5th ed.), Champaign, IL: Human Kinetics.
Schmidt, R. A., & Wrisberg, C. A. (2000). Motor learning and performance.
Champaign, IL: Human Kinetics.
Sigmundsson, H., & Whiting, H. T. A. (2002). Hand preference in children with
developmental coordination disorders cause and effect? Brain and Cognition,
49(1), 45–53.
Silva1, T. H. (2008). Chiral universes and quantum effects produces by electromagnetic
fields. Ingeniare. Revista chilena de ingeniería, 16(1), 99–110.
Simonds, R. J., & Scheibel, A. B. (1989). The postnatal development of the motor
speech area: A preliminary study. Brain and Language, 37(1), 42–58.
Simon, C., Frati, F., Beckenbach, A., & Crespi, B. (1994). Evolution, weighting, and
phylogenetic utility of mitochondrial gene sequences and a compilation of
conserved polymerase chain reaction primers. Annals- Entomological Society of
America, 87(6), 651.
Singh, M., & Kindu, A. (1994). Hand preference and approval among Hinud and
Muslims in India. International Journal of Neuroscience, 75(1–2), 19–29.
Singh, M., Manjary, M., & Dellatolas, G. (2001). Lateral preferences among Indian
school children. Cortex, 37(2), 231–241.
Slosar, A., Land, K., Bamford, S., Lintott, Ch., Andreescu, D., Murray, P., Nichol, R.,
Raddick M. J., Schawinski, K, Szalay, A., Thomas, D., & Vandenberg, J.
(2009). Galaxy Zoo: chiral correlation function of galaxy spins. Monthly Notices
of the Royal Astronomical Society 392(3), 1225–1232.
Snyder, P. J., Bilder, R. M., Wu, H., Borgets, B., & Lieberman, J. A. (1995). Cerebrall
volume asymmetries are related to handedness: A quantitative study.
Neuropsychologia, 33(4), 407–419.
Sommer, I. E. C., Ramsey, N. F., & Kahn, R. S. (2001). Language lateralization in
schizophrenia, an fMRI study. Schizophrenia Research, 52(1–2), 57–67.
Sovák, M. (1962). Lateralita jako pedagogický problém, Praha:Univerzita Karlova.
Sovák, M. (1958). Výchova leváků v rodině. Praha: SPN.
Steenhuis, R. E. (1996). Hand preference and performance in skilled and unskilled
activities. In D. Elliott & E. Roy (Eds.), Manual asymmetries in motor
performance (pp. 123–142). Boca Raton, FL: CRC Press.

244
Steenhuis, R. E., & Bryden, M. P. (1989). A differet dimensions of hand preference that
relate to skilled and unskilled activities. Cortex, 25(2), 289–304.
Steenhuis, R. E., & Bryden, M. P. (1999). The relation between hand preference and
hand performance: What You Get Depends on What you Measure. Laterality,
4(1), 3–26.
Steiger, J. H. (1990). Structure model evaluation and modification: An interval
estimation approach. Multivariate Behavioral Research, 25(2), 173–180.
Stein, J. F., & Fowler, S. (1982). Diagnosis of dyslexia by means of a new indicator of
eye dominance. Brtish Journal of Ophthalmology, 66(5), 332–336.
Stein, J. F., Richardson, A. J., & Fowler, M. S. (2000). Monocular occlusion can
improve binocular control and reading in dyslexics. Brain, 123(1), 164.
Stein, M. Ch. (1981). Estimation of the mean of a multivariate normal distibution. The
Annals of Statistics, 9(6), 1135–1151.
Steiner, H. & Tseng, K. Y. (2010). Handbook of Basal Ganglia Structure and Function,
Volume 20 (Handbook of Behavioral Neuroscience). Oxford: Academic Press
Steinmetz, H., Volkman, J., Jäncke, L., & Freund, H. J. (1991). Anatomical left-right
asymmetry of langure-related temporal cortex is different in left- and right-
handers. Annual Neurology 29(3), 315–319.
Suar, D., Mandal, M. K., Misra, I., & Suman, S. (2007). Lifespan trends of side bias in
India. Laterality, 12(4), 302–320.
Sugai, H., & Iye, M. (1995). A statistical search for correlations of rotational spin
angular momentum between galaxie. Monthly Notices of the Royal Astronomical
Society, 276(1), 327–335.
Sun, T. (2010). Differential Gene Transcription in the Left and Right Cerebral Cortex.
In K. Hugdahl & R. Westernhausen (Eds.), The Two Halves of the Brain:
Information Proceesing in the Cerebral Hemispeheres (pp. 21–36). Cambridge
MA: MIT Press.
Sun, T., & Walsh, C. A. (2006). Molecular approaches to brain asymmetry and
handedness. Nature Reviews Neuroscience, 7(8), 655–662.
Sun, T., Collura, R. V., Rubilo, M., & Walsh, C. A. (2006). Genomic and evolutionary
analyse of asymmetrical expressed genes in human fetal left and right cerebral
cortex. Cerebral Cortex, 16(1), 18–25.
Suzuki, T., Tanaka, M., Shiro, M., Shibata, N., Osaka, T., & Asahi, T. (2010).
Evaluation of stability difference between asymmetric homochiral dimer in (S)-

245
thalidomide crystal and symmetric heterochiral dimer in (RS)-thalidomide
crystal. Phase Transitions, 83(10), 223–234.
Swaab, D. F. (2003). Human Hypothalamus: Basic and Clinical Aspects, Part II:
Handbook of Clinical Neurology (Series Editors: Aminoff, Boller and
Swaab).Cambridge US: Elsevier.
Swygert, K. A., McLeod, L. D., & Thissen, D. (2001). Factor analysis for items or
testlets scored in more than two categories. In D. Thissen, & H. Wainer (Eds.),
Test scoring (pp. 217–248). Mahwah, NJ: L. Erlbaum Associates.
Synek, F. (1991). Záhada levorukosti – Asymetrie u člověka. Praha: Horizont
Štochl, J., & Univerzita Karlova. (2008). Structure of motor symptoms of Parkinson's
disease. Prague: Karolinum.
Štochl, J. & Musálek, M. (2009). A practical guide to pilot standardization of tests. Acta
Universitatis Carolinae, 45(2), 5–15.
Štochl, J., & Croudace, T. (2012). Prediction of human rotation, Laterality (in press).
Takane, Y. (2007). Applications of Multidimension a Scaling in Psychometrics. In C. R.
Rao & S. Sinharay (Eds.), Handbook of statistics 26 Psychometrics, (pp. 359–
400). Amsterdam: Elsevier.
Tanabe, Y., & Jessell, T. M. (1996). Diversity and pattern in the developing spinal cord.
Science, 274(5290), 1115–1123.
Tannahill, D., Harris, L. W., & Keynes, R. (2005). Role of morphogens in brain growth.
Journal of Neurobiology, 64(4), 367–375.
Tapley, S. M., & Bryden, M. P. (1985). A group test for the assessment of performance
between the hands. Neuropsychologia, 23(2), 215–221.
Taylor, P. J., Dalton, R., & Fleminger, J. J. (1980). Handedness in schizophrenia. The
British Journal of Psychiatry, 136, 375–383.
Tervaniemi, M., & Hugdahl, K. (2003) Lateralization of auditory-cortex functions,
Brain Research Reviews, 43(3), 231–246.
Thissen, D., & Steinberg, L. (1986). A taxonomy of item response models.
Psychometrika, 51(4), 567–577.
Thissen, D., Nelson, L., Rosa, K., & McLeod, L. D. (2001). Item response theory for
items scored in more than two categories. In D. Thissen, & H. Wainer (Eds.),
Test scoring (pp 141–184). Mahwah, N.J: L. Erlbaum Associates.
Thompson, B. (2003). Score reliability: Contemporary thinking on reliability issues.
Thousand Oaks, Calif: SAGE Publications.
246
Thompson, B. (2004). Exploratory and confirmatory factor analysis: Understanding
concepts and applications. Washington, DC: American Psychological
Association.
Tiffin, J., & Asher, E. J. (1948). The Purdue Pegboard: norms and studies of reliability
and validity. Journal of Applied Psychology, 32(3), 234–247.
Tichý, J., & Běláček, J. (2008). Pravo/levorukost a preference druhostranné dolní
končetiny. Testování laterality a mozečkové dominance. Česko Slovenská
Neurologie, 71(5), 552–558.
Tichý, J., & Běláček, J. (2009). Laterality in children: cerebellar dominance,
handedness, footedness nd hair whorl. Activitas Nervosa Superior Reditiva,
51(1–2), 9–20.
Tichý, J., Adam, P., Bauer, J, Dočekal, P., Faber, J., Fixa, J., Havlová, & et al.(1997).
Neurologie. Praha: Univerzita Karlova
Tirosh, E., Stein, M., Harel, J., & Scher, A. (1999). Hand preference as related to
development and behavior in infancy. Perceptual and Motor Skills, 89(2), 371–
380.
Tobin, Y. C., Nelson, M., J., & Castellanos, F. X. (1999). Development of the human
corpuscallosum during childhood and adolescence: A longitudinal MRI study.
Progress in Neuro-Psychopharmacology and Biological Psychiatry, 23(4), 571–
588.
Toga, A. W., & Thompson, P. M. (2003). Mapping brain asymmetry. Nature Reviews
Neuroscience, 4(1), 37–48.
Trevarthen, C. (1974). Cerebral embryology and the split brain. In A. C. M. Kisbourne,
& W. L. Smith (Eds.), Hemispheric disconnection and cerebral function (pp.
208–237). Springfield, IL: Charles C. Thomas.
Tucker, L. R., & Lewis, C. (1973). The reliability coefficient for maximum likelihood
factor analysis. Psychometrika, 38(1), 1–10.
Turkewitz, G., & Kenny, P. A. (1982). Limitation on input as a basis for neural
organization and perceptual development: A preliminary theoretical statement.
Development Psychobology, 15(4), 357–368.
Ullman, J. (2006). Structural equation modeling: Reviewing the basics and moving
forward. Journal of Personality Assessment, 87(1), 35–50.
Urban, P. P., & Caplan, R. L. (2011). Brainstem Disorders. Heidelberg: Springer.

247
Van Strien, J. W. (2000). Genetic, intrauterin, and cultural origins of human
handedness. In M. K. Mandal, M. B. Bulman-Fleming, & G. Tiwari (Eds.), Side
Bias: A Neuropsychological Perspective (pp. 41–61). Dordrecht: Kluwer
Academic Publishers.
Van Strien, J. W. (2003). The Dutch Handedness Questionnaire. Rotterdam: Faculty of
Social Sciences (FSS), Erasmus University Rotterdam: Erasmus University
Rotterdam
Van Strien, J. W., Bouma, A., & Bakker, D. J. (1987). Birth stress, autoimmune disease,
and handedness. Journal of Clinical and Experimental Neuropsychology, 9(6),
775–780.
Van Valen, L. (1962). A study of fluctuating asymmetry. Evolution, 16(2), 125–142.
Van Valen, L. (1978). The control of handedness. Behavioral and Brain Sciences, 1(2),
320.
Van, S. J. W., Haselen, G. C. L. V., Van, H. J. M., De, C. I. F. M., Frens, M. A., & Van,
D. G. J. N. (2005). Increased Prevalences of Left-handedness and Left-eye
Sighting Dominance in Individuals with Williams-Beuren Syndrome. Journal of
Clinical and Experimental Neuropsychology, 27(8), 967–976.
Vandenberg, R. J., & Lance, C. E. (2000). A review and synthesis of the measurement
invariance literature: Suggestions, practices, and recommendations for
organizational research. Organizational Research Methods, 3(1), 4–69.
Vehmas, T., Solovieva, S., Riihimaki, H., Luoma, K., & Leino-Arjas, P. (2005). Hand
workload and the metacarpal cortical index: A study of middle-aged teachers
and dentists. Osteoporosis International, 16(6), 672–680.
Verhelst, N. D., & Verstralen, H. H. F. M. (1997). Modeling sums of binary repsonses
by the partial credit model. Arnhem: Cito.
Viedma, C. (2007). Chiral symmetry breaking and complete chiral purity by
thermodynamic-kinetic feedback near equilibrium: Implications for the origin of
biochirality. Astrobiology, 7(2), 312–319.
Vikingstad, E. M., George, K. P., Johnson, A. F., & Cao, Y. (2000). Cortical language
lateralization in right handed normal subjects using functional magnetic
resonance imaging. Journal of the Neurological Sciences, 175(1), 17–27.
Volkmann, J., Schnitzler, A., Witte, O. W., & Freund, H-J. (1998). Handedness and
asymmetry of hand representation in human motor cortex. Journal of
Neurophysiology, 79(4), 2149–2154.

248
von Davier, M., & Carstensen, C. H. (2007). Multivariate and Mixture Distribution
Rasch Models: Extensions and Applications. New York: Springer.
Wachter,Ch., Cong, K. D., Staude, G., & Wolf, W. (2008). Coordination of a discrete
response with periodic finger tapping: Additional experimental aspects for a
subtle mechanism, Journal of Motor Behavior, 40(5), 417–432.
Walls, G. L. (1951). Theory of ocular dominance. Archives of Ophthalmology, 45(4),
387–412.
Wang, X., Bradlow, E. T., & Wainer, H. (2002). General bayesian model for testlets:
Theory and applications. Applied Psychological Measurement, 26(1), 109–128.
Ward, J. P., Milliken, G. W., & Stafford, D. K. (1993). Patterns of lateralized behavior
in Prosimians. In J. P. Ward, & W. D. Hopkins (Eds.), Primate laterality:
Current behavioral evidence of primate asymmetries (pp. 43). New York:
Springer-Verlag.
Watkins, K. E., Paus, T., Lerch, J. P., Zjindenbos, A., Collins, D. L., Neelin, P., et al.
(2001). Structural asymmetries in the human brain: A voxel-based satistical
analysis of 142 MRI scans. Cerebal Cortex, 11(9), 868–877.
Webb, N. M., Shavelson, R. J., & Haertel, E. H. (2007). Reliability coefficient and
generalizability theory. In C. R. Rao & S. Sinharay (Eds.), Handbook of
statistics 26. (pp. 81–121). Amsterdam: Elsevier.
Wexler, B. E., & Halwes, T. (1983). Increasing the power of dichotic methods: The
fused rhymed words test. Neuropsychologia, 21(1), 59–66.
White, M. J. (1969). Laterality differences in perception: A review. Psychological
Bulletin, 72, 387–405.
White, L. E., Lucas, G., Richards, A., et al. (1994). Cerebral asymmetry and
handedness. Nature, 368(6488), 197–198.
Williams, M. S. (1986). Factor analysis of the Edinburgh Handedness Inventory.
Cortex, 22(2), 325–326.
Wilson, L., & Maden, M. (2005). The mechanisms of dorsoventral patterning in the
vertebrate neural tube. Developmental Biology, 282(1), 1–13.
Wilson, M. (2005). Constructing measures: An item response modeling approach.
Mathwah, New Jersey: Erlbaum.
Witelson, S. F. (1985). The brain connection: The corpus callosum is larger in the left
hemisphere. Science, 229(4714), 665–668.

249
Wolf, U., Rapoport M. J., & Schweizer, T. A. (2009). Evaluating the affective
component of the cerebellar cognitive affective syndrome. Journal of
Neuropsychiatry Clinical Neuroscience, 21(3), 245–253.
Wood, M. D. (1998). Is schizophrenia a progressive neurodevelopmental disorder?
Toward and unitary pathogenetic mechanism. Americal Journal of Psychiatry,
155(12), 1661–1670.
Wood, W. B. (2005) The Left–Right polarity puzzle: Determining embryonic
handedness. PLoS Biology, 3,e292.
Woolley, R. G. (1976). Quantum theory and molecular structure. Advances in Physics,
25(1), 27–52.
Wright, B. D. (1999). Fundamental measurement for psychology. In S. E. Embretson &
S. L. Hershberger (Eds.), The New Rules of Measurement (pp. 65–104).
Mahwah, New Jersey: Erlbaum.
Wright, C. V. (2001). Mechanisms of left-right asymmetry: What`s Right and What`s
Left? Developmental Cell, 1(2), 179–186.
Wynd, C. A., Schmidt, B., & Schaefer, M. A. (2003). Two quantitative approaches for
estimating content validity. Western Journal of Nursing Research, 25(5), 508–
518.
Ye, S. Q., Usher, D. C., & Zhang, L. Q. (2002). Gene expression profiling of human
diseases by serial analysis of gene expression. Journal of Biomedical Science,
9(5), 384–394.
Yokoyama, T., Copeland, N. G., Jenkins, N. A., Montgomery, C. A., Elder, F. F., &
Overbeek, P. A. (1993). Reversal of left-right asymmetry: a situs inversus
mutation. Science, 260(5108), 679–682.
Young, G., Segalowitz,S. J., Misek, P., Alp, I. E. & Boulet, R. (1983). Is early reaching
left-handed? Review of manual specialization research: In G. Young, S. J.
Segalowitz, C. Porter, & S. E. Trehaub (Eds.), Manual Specialization and the
Developing Brain (pp. 13–32). New York: Academic Press.
Yuan, K-H, & Bentler, P. M. (2007). Structural Equation modelling. In C. R. Rao & S.
Sinharay (Eds.), Handbook of statistics 26 (pp. 297–358). Amsterdam: Elsevier.
Zaháněl, J., Vaverka, F. (1990) Testování laterality dolních končetin. Sborník Tělesná
kultura, 22. Olomouc: Univerzita Palackého, 101–109.
Zebrowská, M. (1987). Vývinová psychológia detí a mládeže, Bratislava:
Psychodiagnostické a didaktické testy, 37.

250
Zhao, C., Avilés, C., Abel, R. A., Almli, C. R., McQuillen, P., & Pleasure, S. J. (2005).
Hippocampal and visuospatial learning defects in mice with a deletion of
frizzled 9, a gene in the Williams syndrome deletion interval. Development
(cambridge, England), 132(12), 2917–2927.
Zigmond, M. J., Bloom, F. E., Landis, S. C., Roberts, J. L., & Squire, L. R. (1999).
Fundamental Neuroscience. San Diego: Academic Press.
Zoghbi, H. Y. (2003). Postnatal neurodevelopmental disorders: Meeting at the synapse?
Science, 302(5646), 826–830.
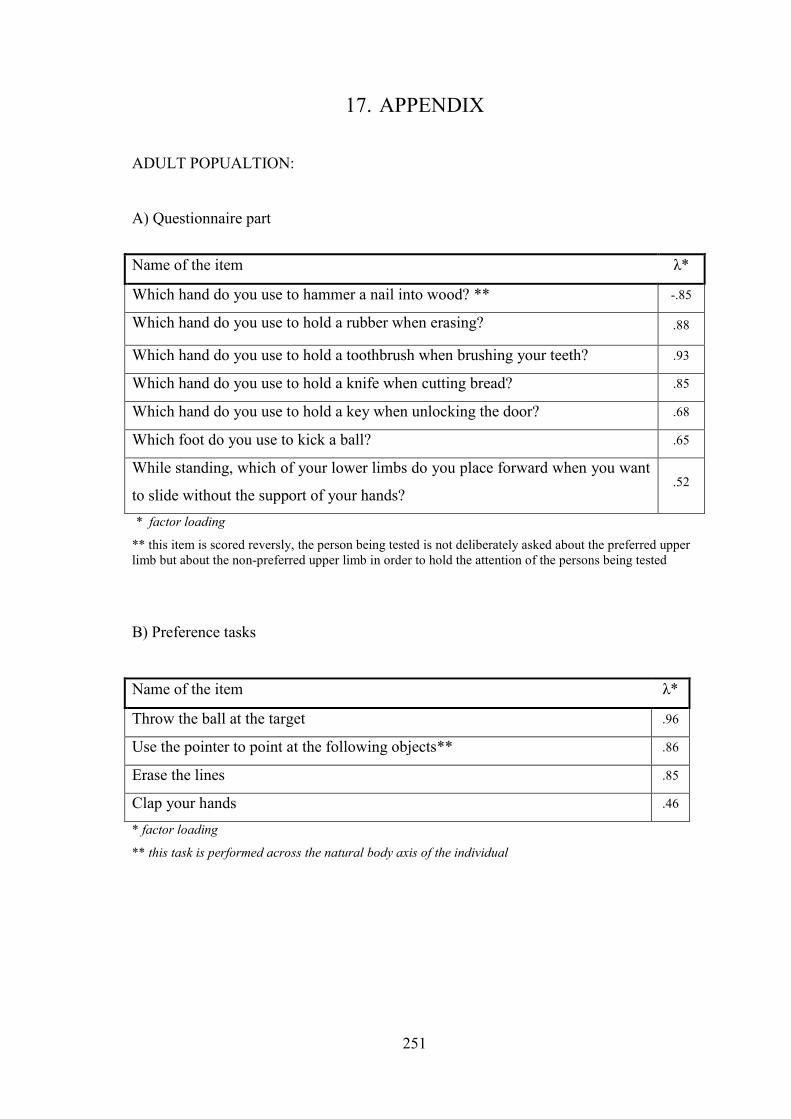
251
17. APPENDIX
ADULT POPUALTION:
A) Questionnaire part
* factor loading
** this item is scored reversly, the person being tested is not deliberately asked about the preferred upperlimb but about the non-preferred upper limb in order to hold the attention of the persons being tested
B) Preference tasks
* factor loading
** this task is performed across the natural body axis of the individual
Name of the item λ*
Which hand do you use to hammer a nail into wood? ** -.85
Which hand do you use to hold a rubber when erasing? .88
Which hand do you use to hold a toothbrush when brushing your teeth? .93
Which hand do you use to hold a knife when cutting bread? .85
Which hand do you use to hold a key when unlocking the door? .68
Which foot do you use to kick a ball? .65
While standing, which of your lower limbs do you place forward when you want
to slide without the support of your hands?.52
Name of the item λ*
Throw the ball at the target .96
Use the pointer to point at the following objects** .86
Erase the lines .85
Clap your hands .46

252
Name of the item λ*
Kick the ball at the target .86
Demonstrate how you would write the letter T on the floor using one of your
feet.97
Perform jumps forward using one leg .57
* factor loading
Eye dominance
Name of the item
Use the tube to look at the object
C) Performance tests
Name of the item λ*
tracing the spiral** -.83
threading beads on a metal wire .64
dot-filling fine motor test .87
measuring articular passivity in order to diagnose cerebellar dominance .58
* factor loading
** time is not a constant in this test, so the factor loading indicates a negative value
Name of the item λ*
while sitting on a chair, moving a cube in the “maze” provided** -.72
while standing, slalom with a ball between obstacles** -.61
lower limb tapping .84
* factor loading
** time is not a constant in these tests, so the factor loadings indicates a negative values

253
CHILD POPULATION
A) Preference tasks
Name of the item λ*
Take the ball in one hand and throw it at the target .91
Take the bell in one hand and ring it .90
According to the instructions, turn the cards of the given colours placed on the
sheet of paper.88
Create a line in the marked space using matches .91
Show how many points you can roll with the dice on three attempts .93
* factor loading
Name of the item λ*
Kick the ball placed on the floor at the target .90
Using one foot, tap the rhythm that I am clapping .86
While standing, demonstrate how you slide without the support of your hands .54
Stretch your arms sideways and make a 360-degree turn around your axis -.45
* factor loading
Eye dominance
Name of the item
Use the tube to look at the object

254
B) Performance tests
Name of the item λ*
tracing the spiral** -.81
moving beads from one box into another using tweezers .63
dot-filling fine motor test .82
measuring articular passivity in order to diagnose cerebellar dominance .64
turning a box alternately with the front and the rear side on the table .67
lower limb tapping .54
* factor loading
** time is not a constant in this test, so the factor loading indicates a negative value