DEVELOPMENT OF OIL SPILL SCENARIOS FOR CONTINGENCY PLANNING ALONG THE BRAZILIAN COAST
15
DEVELOPMENT OF OIL SPILL SCENARIOS FOR CONTINGENCY PLANNING ALONG THE BRAZILIAN COAST José Antonio Lima 1 , Angelo Sartori 1 , Eduardo Yassuda 2 , Eric Anderson 3 , José Edson Pereira 2 , Edmo Campos 4 1 PETROBRAS – Petroleo Brasileiro S.A., 2 ASATM Brasil, 3 Applied Science Associates, Inc., 4 LABMON – IOUSP ABSTRACT After an oil spill in Guanabara Bay due to the collapse of a marine fuel pipeline in January 2000, PETROBRAS (a Brazilian company among the 15 largest oil companies in the world) is facing important challenges regarding its environmental commitment to Brazilian society. To face these new challenges, PETROBRAS launched a program for excellence in environmental, health and safety management that includes the development of oil spill contingency plans for its facilities. The present paper describes an oil spill modeling project for 25 facilities along the Brazilian coast. The implementation of the project involved a detailed meteorological and oceanographic characterization of each study area with a review of existing data, data collection, and hydrodynamic modeling covering more than 9,000 km of coastline. Based on the requirement of scenarios for both typical and critical conditions, the oil fates and trajectory modeling system OILMAP was applied to simulate oil spill incidents in all 25 sites, most of them oil terminals from TRANSPETRO, a PETROBRAS subsidiary. Due to Brazil’s continental dimensions, the environmental conditions simulated ranged from the subtropical Patos Lagoon in the southernmost part of the country to the equatorial Solimoes River, including estuaries, coastal zones, and offshore sites. The developed modeling system allows oil spill contingency specialists to develop response plans for typical spills in the selected locations. By performing reverse trajectory calculations from sensitive sites such as water intakes or fragile wetlands, it is also be possible to identify probable release locations of spills and principal avenues of vulnerability for these important resources. This paper presents a description of the implementation of the system and the results of this modeling approach for a typical oil terminal located in the city of Vitoria, eastern Brazilian coast.
-
Upload
independent -
Category
Documents
-
view
0 -
download
0
Transcript of DEVELOPMENT OF OIL SPILL SCENARIOS FOR CONTINGENCY PLANNING ALONG THE BRAZILIAN COAST

DEVELOPMENT OF OIL SPILL SCENARIOS FOR CONTINGENCY PLANNING ALONG THE BRAZILIAN COAST
José Antonio Lima1, Angelo Sartori1, Eduardo Yassuda2, Eric Anderson3, José Edson Pereira2, Edmo Campos4
1 PETROBRAS – Petroleo Brasileiro S.A., 2 ASATM Brasil,
3 Applied Science Associates, Inc., 4 LABMON – IOUSP
ABSTRACT
After an oil spill in Guanabara Bay due to the collapse of a marine fuel pipeline in
January 2000, PETROBRAS (a Brazilian company among the 15 largest oil companies in the
world) is facing important challenges regarding its environmental commitment to Brazilian
society. To face these new challenges, PETROBRAS launched a program for excellence in
environmental, health and safety management that includes the development of oil spill
contingency plans for its facilities. The present paper describes an oil spill modeling project
for 25 facilities along the Brazilian coast. The implementation of the project involved a
detailed meteorological and oceanographic characterization of each study area with a review
of existing data, data collection, and hydrodynamic modeling covering more than 9,000 km
of coastline. Based on the requirement of scenarios for both typical and critical conditions,
the oil fates and trajectory modeling system OILMAP was applied to simulate oil spill
incidents in all 25 sites, most of them oil terminals from TRANSPETRO, a PETROBRAS
subsidiary. Due to Brazil’s continental dimensions, the environmental conditions simulated
ranged from the subtropical Patos Lagoon in the southernmost part of the country to the
equatorial Solimoes River, including estuaries, coastal zones, and offshore sites. The
developed modeling system allows oil spill contingency specialists to develop response plans
for typical spills in the selected locations. By performing reverse trajectory calculations from
sensitive sites such as water intakes or fragile wetlands, it is also be possible to identify
probable release locations of spills and principal avenues of vulnerability for these important
resources. This paper presents a description of the implementation of the system and the
results of this modeling approach for a typical oil terminal located in the city of Vitoria,
eastern Brazilian coast.
1. INTRODUCTION
In April 2000, PETROBRAS launched a Program for Excellence in Environmental
and Operational Safety Management called PEGASO with investments in the order of US$ 1
billion until 2003 to reduce emissions and residues, and to improve the prevention and
control of accidents in all its facilities. The PETROBRAS subsidiary TRANSPETRO is
applying a portion of this budget to develop automated contingency plans for oil terminals
and to improve the maintenance and operational control over its 10,500 km pipeline network.
As a part of this program, the present paper describes the development of oil spill
modeling for 25 sites along the Brazilian Coast. The implementation of a project this size was
designed in five phases (Lima et al., 2001). Initially, a detailed meteorological and
oceanographic (hereafter abbreviated as metocean) characterization of each study area was
developed including a far-reaching review of existing data from federal, state, and municipal
agencies, universities, and private organizations. This first phase provided the background
information for the relevant processes to be simulated as a basis for the design of
computational grid and boundary conditions. The second phase involved data collection for
the sites where existing datasets were not sufficient to calibrate the hydrodynamic model. The
third phase comprised the implementation and calibration of the hydrodynamic model. The
fourth phase produced preliminary oil spill scenarios for fine tuning of the models, and the
fifth phase provided the definitive oil spill scenarios for the development of contingency
plans. Highlights of the project and modeling approach are presented in the following text.
2. CHARACTERIZATION OF THE STUDY AREAS
One of the main challenges of this project was to develop a detailed metocean
characterization of each study area. Figure 1 shows the map of Brazil with the locations of
the 25 sites. The Brazilian territory contains very diverse environmental conditions ranging

from latitude 32o S in the southernmost part of the country where the oil terminal Rio Grande
is located all the way to latitude 1o S where terminal Belem is situated, including tropical
estuaries, coastal zones, offshore sites and equatorial rivers where terminals Manaus and
Coari are located.
Available metocean data including wind, tide, current, salinity, and temperature time
series were acquired from many different sources. The time series were initially analyzed for
quality control. The QC tests were developed to identify errors and correct them whenever
possible. Acceptance criteria for the data were based on the specifications presented in a
PETROBRAS standard for metocean measurements (PETROBRAS, 1998). Only data
collected with properly identified methods by reliable sources were used.
Figure 1 – Locations of PETROBRAS and TRANSPETRO facilities comprising this project.

Available metocean data were used to develop datasets for model evaluation, to
provide inputs for the model simulations, and to assist in the design of data measurement
programs, where appropriate.
3. APPLICATION OF COMPUTATIONAL MODELS FOR OIL SPILL
SCENARIOS
The selection of the most suitable modeling system to accurately simulate the variety
of environments described in the previous section was based on the physics used in the model
formulation, as well as on operational aspects of the model structure and facilities to input
data and output simulation results.
3.1. HYDRODYNAMIC MODEL
The criteria used to select the hydrodynamic model was a balance between its
scientific background considering: a) relevant physical processes (e.g., tide, wind and
baroclinic forcings); b) operational aspects covering many different conditions; c) open
source code with easily modified model routines; and d) a user-friendly interface to achieve
the needs of the project. Based on these criteria, a hydrodynamic modeling system based on
the Princeton Ocean Model (POM) was selected. Originally developed by Blumberg &
Mellor (1987), the hydrodynamic model is written on a tri-dimensional sigma coordinate
structure, fully non-linear, curvilinear orthogonal discretization scheme, second order
turbulent closure formulation, and split barotropic and baroclinic modes.
Using this modeling approach, all the information collected or generated for a specific
study area was pre-processed and compiled in one file. The model was modified to read from
this file all the forcing and variables required to start a simulation. The run keys and model
parameters were intentionally kept separate, to assist in future developments of the model
structure.

Figure 2 shows the sketch of the modeling structure. At its center resides a netCDF
(Brown et al., 1993) file that contains and describes all the information required to run the
model under calibration conditions or in operational conditions. The upper part of the
flowchart presents the initial procedures to compile that input file, including the curvilinear
grid generation, meteorological and oceanographic boundary conditions, river inflows and
mean sea level variations. The hydrodynamic model provides feedback to that file providing
grid corrections and the coastline shape final tuning. Model results are then automatically
transferred to the OILMAP format requirements.
The development of this modeling system is an ongoing process and at this point it is
partially automated. The model structure is now highly user-friendly. Improvements are
being made as the project progresses.
Figure 2 - Hydrodynamic model input-output structure.
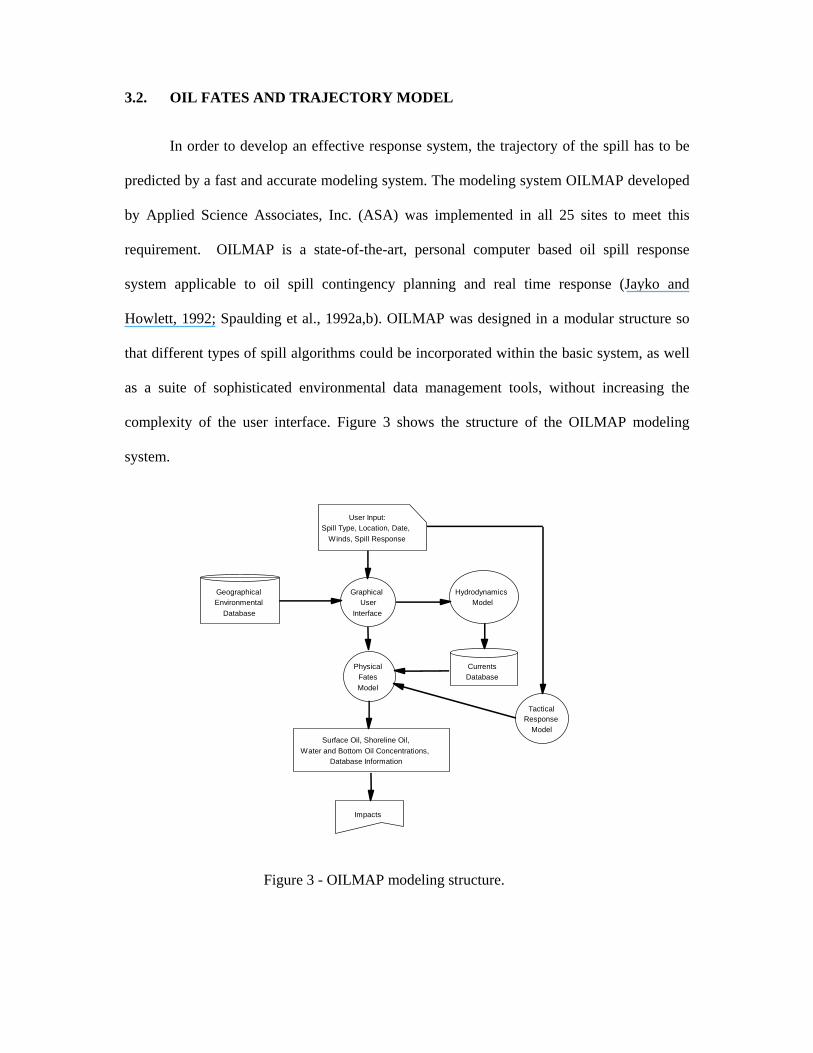
3.2. OIL FATES AND TRAJECTORY MODEL
In order to develop an effective response system, the trajectory of the spill has to be
predicted by a fast and accurate modeling system. The modeling system OILMAP developed
by Applied Science Associates, Inc. (ASA) was implemented in all 25 sites to meet this
requirement. OILMAP is a state-of-the-art, personal computer based oil spill response
system applicable to oil spill contingency planning and real time response (Jayko and
Howlett, 1992; Spaulding et al., 1992a,b). OILMAP was designed in a modular structure so
that different types of spill algorithms could be incorporated within the basic system, as well
as a suite of sophisticated environmental data management tools, without increasing the
complexity of the user interface. Figure 3 shows the structure of the OILMAP modeling
system.
User Input:
Spill Type, Location, Date,Winds, Spill Response
Geographical Graphical HydrodynamicsEnvironmental User Model
Database Interface
Physical CurrentsFates DatabaseModel
TacticalResponse
ModelSurface Oil, Shoreline Oil,
Water and Bottom Oil Concentrations,Database Information
Impacts
Figure 3 - OILMAP modeling structure.

The trajectory and fates model predicts the transport and weathering of oil from
instantaneous or continuous spills. Predictions show the location and concentration of the
surface and subsurface oil versus time. The model estimates the time variation of the oil’s
area coverage, oil thickness, and oil viscosity. The model also predicts the oil mass balance:
the amount of oil on the free surface, in the water column, evaporated, on the shore, and
outside the study domain versus time. The fate processes in the model include spreading,
evaporation, entrainment or natural dispersion, and emulsification. Spreading is represented
using the thick slick portion of Mackay et al.’s (1980, 1982) thick-thin approach.
Evaporation is based on Mackay’s analytic formulation parameterized in terms of evaporative
exposure (Mackay et al., 1980, 1982). Entrainment or natural dispersion is modeled using
Delvigne and Sweeney’s (1988) formulation, which explicitly represents oil injection rates
into the water column by droplet size. The entrainment coefficient, as a function of oil
viscosity, is based on Delvigne and Hulsen (1994). Emulsification of the oil, as function of
evaporative losses and changes in water content, is based on Mackay et al. (1980, 1982). Oil-
shoreline interaction is modeled based on Reed et al. (1989) which formulates the problem in
terms of a shore type dependent holding capacity and exponential removal rate.
The basic configuration of the model also includes a variety of graphically based tools
that allow the user to specify the spill scenario, animate spill trajectories, currents and winds,
import and export environmental data, grid any area within the model operational domain,
generate mean and/or tidal current fields, enter and edit oil types in the oil library, enter and
display data into the embedded geographic information system (GIS) and determine
resources impacted by the spill. The GIS allows the user to enter, manipulate, and display
point, line, polyline, and polygon data geographically referenced to the spill domain. Each
object can be assigned attribute data in the form of text descriptions, numeric fields or
external link files.

In the stochastic mode spill simulations are performed stochastically varying the
environmental data used to transport the oil. Either winds, currents, or both may be
stochastically varied. Utilizing sufficiently long time series, the start time for each of the
individual trajectory simulations is chosen at random among the years available and within
the month(s) selected for the statistical representation. The multiple trajectories generated are
then re-sampled to produce contour maps showing the probability of surface and shoreline
oiling. The trajectories are also analyzed to give travel time contours for the spill. These
oiling probabilities and travel time contours can be determined for user-selected spill
durations. If resource information is stored in the GIS database, a resource hit calculation can
be performed to predict the probability of oiling important resources
OILMAP has been applied to hindcast a variety of spills. These hindcasts were used
to calibrate the performance of the model. Hindcasts of the Amoco Cadiz, Ixtoc and Persian
Gulf War spills and an experimental spill in the North Sea by Warren Springs Laboratory are
reported in Kolluru et al. (1994). Spaulding et al. (1993) also present a hindcast of the Gulf
War spill. Spaulding et al. (1994) present the application of the model to the Braer spill
where subsurface transport of the oil was critical to understanding the oil’s movement and
impact on the sea bed. Recently Spaulding et al. (1996a) have applied the model to hindcast
the surface and subsurface transport and fate of the fuel oil spilled from the North Cape
barge. Integration of OILMAP with a real time hydrodynamic model and the hindcast of the
movement of oil tracking buoys in Narragansett Bay are presented in Spaulding et al.
(1996b).
4. EXAMPLE OF THE OIL SPILL MODEL FOR A BRAZILIAN COAST SITE
The oil terminal of Vitoria is located at latitude 20o 19´ S and longitude 40o 17´ W,
within the harbor complex of Tubarao, inside Espirito Santo Bay. The hydrodynamic

circulation in the bay is affected by tidal and wind forcing. Figure 4 presents the model grid
domain over nautical chart DHN 1410 of the Brazilian Navy.
The grid was designed to have a higher resolution close to the terminal (on the order
of 50-meter grid spacing) and gradually increase the spacing when approaching the
boundaries. It was required to extend the grid over the continental shelf in order to avoid
distortions of the tidal long waves. The effects of wind forcing were also better represented
with this extended grid.
Figure 4 - Orthogonal curvilinear grid used to simulate the hydrodynamic circulation within Espirito Santo Bay and adjacent continental shelf.
The model was carefully calibrated to reproduce current measurements made in
February 2002 at the harbor entrance. Many other simulations were performed and the model
provided good results for both the currents within the bay and in the adjacent area. The

hydrodynamic current fields were transferred to the oil model OILMAP to run the fates and
trajectory model. Figure 5 presents a snapshot of the predicted ebb tidal currents of the
hydrodynamic model.
Figure 5 – Ebb tidal currents in the Espirito Santo Bay as simulated using the hydrodynamic model.
Statistical analysis of one year of wind time series at Port of Tubarao, combined with
typical oceanographic conditions (flood, ebb tides and adjacent shelf currents) force the final
oil spill scenarios used in the contingency planning. Meteocean statistics, selected spill sites,
volumes and products result in 288 possible scenarios to be simulated.

Typical oceanographic conditions were simulated, which allows a contingency
planner to review the patterns of the oil trajectories, select a suite of predicted oil transport
conditions, and position of oil booms and skimmers to combat these predicted oil trajectories.
To illustrate the spill behavior, Figures 6 and 7 show some results achieved. The
meteorological situation for the example was fixed as Eastern Winds. The oceanographic
condition chosen was spring tides at the beginning of flood currents (Figure 6) and at the
beginning of ebb currents (Figure 7).
Figure 6 – Flood spring tidal condition, eastern winds, 8 hours after the oil release. Red dots are the oil already retained in land, black dots are the instantaneous oil particles and the grey patch is the swept area.

Figure 7 – Ebb Spring tidal condition, eastern winds, 8 hours after the spill. Red dots are oil retained in land, black dots are instantaneous oil particles and the grey patch is the swept area.
5. CONCLUDING REMARKS
This paper presents a brief description of the oil spill modeling efforts developed by
PETROBRAS, ASATM Brasil, and Applied Science Associates, Inc. (ASA) to build a robust
oil spill contingency planning for diverse oil facilities along the Brazilian coast. It is a
pioneering and challenging project that clearly shows the importance placed by
PETROBRAS and its subsidiary TRANSPETRO to achieve excellence in their
environmental and operational safety focus.
It has been a complex study to perform. For instance, the study team had considerable
difficulty to retrieve available metocean data from different agencies and institutions,
working under tight time restrictions for the planning and execution of accurate measurement

programs over a limited period of time, implementing a generic stepwise procedure to design
and improve model grids, introducing initial and boundary conditions comparing the results
and calibration standards, and the finally interacting with contingency plan specialists who
may have biased views about the results of oil spill models. Overall, the project has achieved
very good quality standards and can be considered a remarkable advance to build up an
efficient oil spill response system for marine oil facilities in Brazil.
It is also important to note that oil spill scenarios can be used for both contingency
planning and environmental licensing of oil facilities. After the recent deregulation of the
Brazilian oil sector and the consequent opening of the market, the environmental regulatory
agencies have been developing standards to be followed with requirements equivalent to
other oil producing regions in the world, such as the North Sea and Gulf of Mexico. Aware of
the potential power of numerical modeling as a computational tool for the evaluation of
possible impacts of activities related to the petroleum industry, Brazilian environmental
agencies are already asking for results of hydrodynamic and oil spill models to meet their
requirements.
As an example, the Brazilian institute for the environment (IBAMA) is the agency
that provides licenses for offshore oil activities. IBAMA requires that the interested company
present simulations of dispersion, trajectory and fate of an accidental oil spill, considering
scenarios with specific modeling implementations. This includes probabilistic simulations
considering seasonal conditions, and a critical deterministic condition referring to the worst
case scenario. The modeling projects are to present all the hypotheses, parameters and values
employed. These data should be in accordance with those presented in the diagnostic
definition of the physical environment. The studies are to be based on a combination of
hydrodynamic and oil spill models, with recognized effectiveness and reliability. The project
developed by PETROBRAS, ASATM Brasil, and Applied Science Associates, Inc. (ASA)
was designed to meet these requirements.
6. ACKNOWLEDGMENTS
The authors would like to thank the entire project team without whom this challenge
could not be accomplished. Especially, Dr. Marco Antonio Correa, Dr. Andrea Gallo Xavier,
Marcelo Martinelli, Eoin Howlett, Tatsu Isaji, Ricardo Busoli, Prof. Joseph Harari, Prof.
Ricardo Camargo, Prof. João Luiz Batista de Carvalho, Prof. Osmar Möller, Prof. Ivan
Soares, Prof. Mauricio Mata, Leandro Calado, Hemerson Tonin, Carlos Fonseca, Roderick
Gama, Ágata Romero, André Marquez, João Marcos Azevedo, Leandro Franklin da Silva,
Rafael Bonanata, and PETROBRAS/TRANSPETRO staff.
7. REFERENCES
Blumberg, A.F. and G.L. Mellor, 1987: A description of a three-dimensional coastal ocean circulation model. In: Three-dimensional Coastal Ocean Models, Coastal and Estuarine Sciences, Vol.4 (Heaps, N.S., Ed). Washington, D.C., AGU, 1-16.
Brown, S. A., M. Folk, G. Goucher, and R. Rew, 1993: Software for Portable Scientific Data Management. Computers in Physics, American Institute of Physics, vol. 7, no. 3.
Delvigne, G.A.L., and C.E. Sweeney, 1988: Natural dispersion of oil. Oil & Chemical Pollution 4 (1988) 281-310.
Delvigne, G.A.L., and L.J.M. Hulsen, 1994: Simplified laboratory measurement of oil dispersion coefficient – Application in computations of natural oil dispersion. Proceedings of the Seventeenth Arctic and Marine Oil Spill Program, Technical Seminar, June 8-10, 1994, Vancouver, BC Canada, pp. 173-187.
Jayko, K. And E. Howlett, 1992: OILMAP an interactive oil spill model, OCEANS 92, October 22-26, 1992, Newport, RI.
Kolluru, V., M. L. Spaulding, and E. Anderson, 1994: A three dimensional subsurface oil dispersion model using a particle based technique, 17th Arctic and Marine Oil Spill Program, Technical Seminar, June 8-10, 1994, Vancouver, British Columbia, Canada, pp. 767-784.
Lima, Jose A. M., M. R. Martinelli, W. Tavares Jr, E. L. Freitas and A M. Scofano, 2000: Technical Specifications for Development of Oil Spill Scenarios for Oil Terminals. PETROBRAS technical report RL-4732/2000, (in portuguese).
Mackay, D., S. Paterson, and K. Trudel, 1980: A mathematical model of oil spill behavior, Department of Chemical Engineering, University of Toronto, Canada, 39 pp.

Mackay, D., W. Shui, K, Houssain, W. Stiver, D. McCurdy, and S. Paterson, 1982: Development and calibration of an oil spill behavior model, Report No. CG-D027-83, US Coast Guard Research and Development Center, Groton, CT.
PETROBRAS, 1998: Measurement and Retrieval of Metocean Data, Commission of Technical Standards-CONTEC, Environmental Sub-committee SC-34, Standard N-2557, (in portuguese).
Spaulding, M. L., E. Howlett, E. Anderson, and K. Jayko, 1992a: OILMAP a global approach to spill modeling. 15th Arctic and Marine Oil Spill Program, Technical Seminar, June 9-11, 1992, Edmonton, Alberta, Canada, p. 15-21.
Spaulding M. L., E. Holwett, E. Anderson, and K. Jayko, 1992b: Oil spill software with a shell approach. Sea Technology, April 1992. P. 33-40.
Spaulding, M.L., E.L. Anderson, T. Isaji and E. Howlett, 1993: Simulation of the oil trajectory and fate in the Arabian Gulf from the Mina Al Ahmadi Spill, Marine Environmental Research, Vol. 36, No. 2, p. 79-115.
Spaulding, M. L., V. S. Kolluru, E. Anderson, and E, Howlett, 1994: Application of three dimensional oil spill model (WOSM/OILMAP) to hindcast the Braer spill, Spill Science and Technology Bulletin, Vol. 1., No. 1, 23-35.
Spaulding, M. L., T Opishinski, E. Anderson, E. Howlett, and D. Mendelsohn, 1996a: Application of OILMAP and SIMAP to predict the transport and fate of the North Cape spill, Narragansett, RI. 19th Arctic and Marine Oil Spill Program, Technical Seminar, June 12-14, 1996, Calgary, Alberta, Canada, p. 745-776.
Spaulding, M. L., T. Opishinski, and S, Haynes, 1996b: COASTMAP: An integrated monitoring and modeling system to support oil spill response, Spill Science and Technology Bulletin, Vol. 3, No. 3, pp. 149-169.