
The Role of Positive Youth Development, Family and ... - PolyU
Upload
khangminh22Category
view
0download
0
HAL Id: tel-00670363https://tel.archives-ouvertes.fr/tel-00670363
Submitted on 15 Feb 2012
HAL is a multi-disciplinary open accessarchive for the deposit and dissemination of sci-entific research documents, whether they are pub-lished or not. The documents may come fromteaching and research institutions in France orabroad, or from public or private research centers.
L’archive ouverte pluridisciplinaire HAL, estdestinée au dépôt et à la diffusion de documentsscientifiques de niveau recherche, publiés ou non,émanant des établissements d’enseignement et derecherche français ou étrangers, des laboratoirespublics ou privés.
Development of new approaches to study the role ofchromatin in dna damage response
Muhammad Shoaib
To cite this version:Muhammad Shoaib. Development of new approaches to study the role of chromatin in dna damageresponse. Biochemistry, Molecular Biology. Université Paris Sud - Paris XI, 2011. English. �NNT :2011PA11T058�. �tel-00670363�

UNIVERSITY OF PARIS-SUD XIFACULTY OF MEDICINE
Graduate School : Oncology: Biology, Medicine, HealthSpecialty : Biochemistry, Cell & Molecular Biology
Thesis submitted to obtain the degree ofDOCTOR OF THE UNIVERSITY OF PARIS-SUD XI
Presented byMuhammad SHOAIB
Defended on 6th of October 2011
DEVELOPMENT OF NEW APPROACHES TO STUDY THE
ROLE OF CHROMATIN IN DNA DAMAGE RESPONSE
Thesis Supervisor : Dr. Vasily OGRYZKO
Thesis Jury :
Dr. Myriam FERRO CEA, Grenoble ReviewerDr. Carl MANN CEA, Saclay ReviewerDr. Thierry GRANGE Institut Jacques Monod ExaminerDr. François DAUTRY Institut André Lwoff ExaminerProf. Christian AUCLAIR ENS, Cachan PresidentDr. Vasily OGRYZKO Institut Gustave Roussy Thesis Supervisor


UNIVERSITÉ PARIS-SUD XIFACULTÉ DE MÉDECINE
École Doctorale : Cancérologie: Biologie, Médecine, SantéDiscipline : Biochimie, Biologie Cellulaire et Moléculaire
Thèse pour l’obtention du grade deDOCTEUR DE L’UNIVERSITÉ PARIS-SUD XI
Présentée et soutenue publiquement parMuhammad SHOAIB
le 6 octobre 2011
DÉVELOPPEMENT DE NOUVELLES APPROCHES POUR
ÉTUDIER LE RÔLE DE LA CHROMATINE EN RÉPONSE
AUX DOMMAGES DE L’ADN
Directeur de Thèse : Dr. Vasily OGRYZKO
Devant le jury composé de :
Dr. Myriam FERRO CEA/Grenoble RapporteurDr. Carl MANN CEA/Saclay RapporteurDr. Thierry GRANGE Institut Jacques Monod ExaminateurDr. François DAUTRY Institut André Lwoff ExaminateurProf. Christian AUCLAIR ENS, Cachan PrésidentDr. Vasily OGRYZKO Institut Gustave Roussy Directeur de Thèse

iv
dedicated to my parents, Shahida SALAM & Abdul SALAMfor they raised me, supported me, taught me, and loved me.

v
Acknowledgments
Foremost, I would like to express my sincere gratitude to my supervisor and mentor Dr.Vasily Ogryzko for accepting me in his group and for the confidence he entrusted to meknowing that I had zero experience in molecular biology. I am grateful to him for the time hespent and the efforts he put to teach me the very basics of molecular biology starting fromholding a micro-pipette to the complex proteomics experiments on anything, anytime ba-sis. His continuous support, enthusiasm, availability and motivation not only nurtured myscientific curiosity but also provided me a strong methodological insight towards answer-ing many outstanding questions in molecular biology. I have certainly benefited from hisintelligent ideas, problem solving skills and his eagerness to explain me science.
I am extremely thankful to Dr. Carl Mann and Dr. Myriam Ferro, Engineer-Researcher fromCEA Saclay and CEA Grenoble, respectively, for reviewing this thesis and helping me toameliorate the quality of thesis. I am also thankful to Prof. Christian Auclair, Professor atENS Cachan, Dr. François Dautry, Researcher at Institute André Lwoff, and Dr. ThierryGrange, Researcher at Institute Jacques Monod, for evaluating this work by participatingas examiners.
I am extremely grateful to Dr. Marc Lipinski, the then Director of UMR8126, for his effortsin getting me admitted in the Masters program in oncology and his continuous support andguidance throughout my stay in this lab. I would also like to appreciate Dr. Joëlle Wiels,the current Director of UMR8126, for her help on various scientific as well as administrativefronts. I am thankful to them for their positive criticism on my work during lab seminars,which certainly allowed me to evaluate and eventually improve my work. I am also thankfulto Mme. Muriel Nicoletti, the secretary of Graduate School of Oncology, for her patience andassistance that she provided during the last six years.
I would like to express my deep gratitude to Chloé Robin, Meriem Hasmim, Yosra Messaiand Zaeem Noman for their strong support, encouragement and caring, especially duringdifficult times, and for providing me a helping hand whenever needed. Their advices havealways been a valuable asset to me and my stay in IGR would have been much less funwithout their significant presence. I would also like to thank Arman Kulyyassov, who was apost-doc in our group, for his help and support on many projects. I would like to take thisopportunity to thank all the current and previous members of our group including EmilieCochet, Ulykbek Kairov, Evelyne Saade, Damien Vertut and Martine Comisso for their helpand guidance during all this time.
I would also like to extend my thanks to many internees that have worked with me duringlast six years in this lab and provided me the opportunity to pass on knowledge that I haveacquired. I would especially thank Kinga Winczura, with whom I enjoyed working the mostand became very good friends. Besides, while I was busy writing my thesis, she obtainedsome very interesting results related to my project. Many thanks to her for all the hard workshe has done and the motivation she showed on my project.
During this work I have collaborated with many colleagues for whom I have great regard,

vi
and I wish to extend my warmest thanks to Dr. Filippo Rosselli, Dr. Valeria Naim and Dr.Philippe Dessen. I have learned a lot during long discussions with them and the ideas gen-erated during these discussions have certainly helped me achieve my goals.
I would also like to express my appreciation to Syed Qasim Raza, Shoaib Ahmad Malik, Ab-dul Qadir, Adnan Arshad and Afaq Ali for their time, friendship and never-ending amusingdiscussions during lunch and tea time in IGR, which were not only entertaining but alsorefreshing for all of us. I appreciate all my acquaintances in IGR for their time and help theyhave offered to me during last six years including M’barka Mokrani, Marie Boutet, IntissarAkalay, Laëitia Thomas, Charle-Henri Gattoliat and Petr Dmitriev.
I cannot forget to mention my friends outside IGR for their support, encouragement andfriendship during my stay in Paris. Special mention to Kashif Saeed, Aamer Baqai, HusainParvez, Shehzad Hanif, Khurram Khurshid and Kashif Zahoor with whom I have learnedand enjoyed a great deal during traveling, eating, endless hours of table tennis and discus-sions on a wide variety of subjects. I would also like to thank Kashif Mehmood, Abdul Rauf,Shehab Aamer, Sheraz Khan, Imran Siddiqui, and Masood Maqbool for their kind support.My stay in France would have been much less exciting and pleasurable if it were not thecompany of these friends.
My mother and father have always been a consistent and perpetual source of motivation andencouragement throughout my studies and personal life. I owe them all my achievementstill today for their profound devotion, unconditional love and endless faith they have in me.This thesis is as much an achievement of theirs as it is mine. I am highly indebted to themfor their strong affection towards me and their earnest attachment to my career goals. I amalso thankful to my kind sister Sobia Salam and my loving brothers Muhammad Atif andMuhammad Jawad for their emotional support and encouragement over the last six years.
In the end, I would like to humbly acknowledge the Higher Education Commission of Pak-istan, Socièté Française d’Hématologie and my PhD. supervisor for the financial supportduring the last six years.

Abstract
In eukaryotic cells, the genome is packed into chromatin, a hierarchically organized com-plex composed of DNA and histone and non-histone proteins. In this thesis we have ad-dressed the role of chromatin in cellular response to DNA damage (DDR) using variousmethodologies encompassing functional genomics and proteomics. First, we analyzed his-tone post-translational modifications (PTM) in the context of specific kind of DNA lesions(ICL-Interstrand Crosslinks) in Fanconi anemia using quantitative proteomics methodology,SILAC (Stable Isotope Labeling of Amino acids during Cell Culture). Using mass spectrom-etry (MS), we have successfully identified and quantified a number of histone PTM marksin histone H3 and H4, mainly acetylations and methylations, which have shown depen-dence upon functional FA-pathway. As a next step, we applied a functional genomics ap-proach to study DDR in FA cells. In this analysis we first monitored the expression profileof histone modifying enzymes related to histone acetylations and methylations. Our resultssuggest some correlations between histone PTMs and gene expression of histone modifyingenzymes, although conclusive evidence warrants further investigations. Next, we analyzedthe total transcriptome after DNA damage induction in FA mutant and wild type cells. Wealso included in this analysis IR irradiation, in an attempt to dissociate more generic DDRfrom more specific changes that are associated with the role of FA pathway to the DNA ICLs.By performing a factorial interaction analysis, we were able to isolate the part of transcrip-tional response to DNA damage that was requiring functional FA pathway, as well as thegenes that were sensitized to DNA damage by the inactivation of FA pathway. In the finalpart of the thesis, we attempted to solve one of the limitations that we encountered in the hi-stone PTM analysis. The current approaches used to study histone PTMs from particular lociinvolves classical chromatin immunoprecipitation, which due to involvement of formalde-hyde crosslinking render the protein part mostly unavailable for MS-based proteomics. Wehave proposed a novel methodology, which is based upon the biotin tagging of histonesproximal to a protein of interest and subsequent purification of nucleosomes carrying thetagged histone. This methodology does not involve any crosslinking, enabling us to purifyhistones from specific loci, and subject them to large scale MS-based histone PTM analysis. Atime dimension can also be added to our approach, as we can follow the modification statusof particular fraction of histones once they get biotinylated. Another advantage is the use ofalternate variant histones, which allows us to study the PTM profile of different functionalstates of chromatin.
KEYWORDS: chromatin, histone PTM,DNAdamage response, transcriptome analysis, SILAC,biotinylation, native chromatin immunoprecipitation.


Résumé
Le génôme des cellules eucaryotes est condensé au sein d’une structure complexe hiérar-chiquement organisée : la chromatine. La chromatine est composée d’ADN, de protéineshistone et non-histone. Cette thèse a pour but d’étudier le rôle de la chromatine dans laréponse cellulaire aux dommages de l’ADN (DDR) par les méthodologies de génomiquefonctionnelle et de protéomique. Nous avons tout d’abord analysé les modifications post-traductionnelles (PTM) des histones dans le cadre des pontages inter-brins (ou "InterstrandCrosslinks", ICL), type particulier de lésions de l’ADN, en choisissant le modèle de l’Anémiede Fanconi (FA). Ceci a été réalisé grâce aux techniques de protéomique quantitative SILAC(Stable Isotope Labeling of Amino acid during Cell culture) et de spectrométrie de masse(MS). Nous avons ainsi réussi à identifier et à quantifier de nombreuses PTMs dans les hi-stones H3 et H4, et à démontrer que certaines de ces PTM sont dépendantes d’une voiefonctionnelle de la signalisation de FA. Nous avons également approfondi l’étude des DDRdans les cellules de FA par une approche de génomique fonctionnelle. Pour cela, nous avonsanalysé le profil d’expression d’enzymes associées à l’acétylation et à la méthylation des hi-stones. Nos résultats suggèrent l’existence de corrélations entre le profil d’expression de cesenzymes et les PTMs des histones. Des études complémentaires sont nécessaires en vue deconfirmer ces corrélations. Nous avons également comparé le transcriptome de deux lignéescellulaires de FA (mutée en FANCC et corrigée en FANCC) après induction de dommagesà l’ADN. Afin de différencier les changements spécifiquement associés à la voie de signali-sation de FA en réponse aux ICL de l’ADN des réponses plus générales aux dommages del’ADN, nous avons inclus des cellules traitées par rayonnement ionisant. En réalisant uneanalyse d’interactions factorielles, nous avons pu identifier une réponse transcriptionnelleaux dommages de l’ADN nécessitant une voie fonctionnelle de la signalisation de FA. Nousavons également tenté de pallier aux limitations rencontrées dans l’analyse des PTMs deshistones. En effet, les PTMs des histones que nous avons identifiées représentent l’ensembledes modifications, c’est-à-dire les PTMs concernant les histones se trouvant immédiatementà proximité du site du dommage et en relation directe avec celui-ci, et les PTMs se trou-vant à distance du dommage et pouvant ne pas être en relation directe avec celui-ci. Lesapproches courantes pour identifier les PTMs se trouvant à des loci particuliers sont baséessur l’immunoprécipitation classique de la chromatine où l’utilisation de formaldéhyde al-tère les protéines, ce qui en rend impossible l’analyse par MS. Nous avons proposé unenouvelle méthodologie basée sur la biotinylation expérimentale d’histones situées à prox-imité d’une protéine particulière, suivie de la purification des nucléosomes contenant ceshistones biotinylées. Contrairement à l’immunoprécipiatation classique de la chromatine,cette méthode n’induit pas d’altération des protéines, permettant ainsi de purifier les his-tones à partir d’un locus spécifique et d’analyser à grande échelle leurs PTMs par MS. Cetteapproche permet aussi de suivre dans le temps les PTMs d’une fraction des histones juste

après leur biotinylation. Enfin, elle présente l’avantage de pouvoir étudier le profil des PTMsde différents états fonctionnels de la chromatine grâce à l’utilisation de variants d’histones.
MOTS CLÉS : chromatine, modification post-traductionnelle des histones (PTM), réponseaux dommages de l’ADN (DDR), analyse du transcriptome, SILAC, biotinylation, immuno-précipitation de chromatine native.

Contents
1 Introduction 1
1.1 Epigenetics . . . . . . . . . . . . . . . . . . . . . . . . . . . . . . . . . . . . . . . 1
1.1.1 The Central Dogma of Molecular Biology . . . . . . . . . . . . . . . . . 1
1.1.2 The Changing Definitions of Epigenetics . . . . . . . . . . . . . . . . . 2
1.1.3 Epigenetic information: Heritability vs Stability . . . . . . . . . . . . . 4
1.1.4 Role of Epigenetic Information . . . . . . . . . . . . . . . . . . . . . . . 5
1.1.5 Epigenetic Templating . . . . . . . . . . . . . . . . . . . . . . . . . . . . 6
1.2 The Chromatin Template . . . . . . . . . . . . . . . . . . . . . . . . . . . . . . . 6
1.2.1 The Nucleosome . . . . . . . . . . . . . . . . . . . . . . . . . . . . . . . 7
1.2.2 Structure of Core Histones . . . . . . . . . . . . . . . . . . . . . . . . . . 9
1.2.3 Molecular Genetics of Core Histones . . . . . . . . . . . . . . . . . . . . 10
1.3 Higher Order Chromatin Organization . . . . . . . . . . . . . . . . . . . . . . . 11
1.3.1 Cis VS Trans-Effects . . . . . . . . . . . . . . . . . . . . . . . . . . . . . . 12
1.3.2 Solenoid VS Zigzag Model . . . . . . . . . . . . . . . . . . . . . . . . . 13
1.3.3 Role of Linker Histone . . . . . . . . . . . . . . . . . . . . . . . . . . . . 14
1.3.4 Chromatin Domains and Chromosome Territories . . . . . . . . . . . . 14
1.4 Modifications of Chromatin Structure . . . . . . . . . . . . . . . . . . . . . . . 15
1.4.1 Histone Post-translational Modifications . . . . . . . . . . . . . . . . . 15
1.4.2 Variant Histones . . . . . . . . . . . . . . . . . . . . . . . . . . . . . . . 16
1.4.3 Histone Modifying Enzymes . . . . . . . . . . . . . . . . . . . . . . . . 28
1.4.4 Functional Consequences of Histone Modifications . . . . . . . . . . . 34
1.4.5 Histone Modification Cross-talk . . . . . . . . . . . . . . . . . . . . . . 37
1.5 Histone Code Hypothesis . . . . . . . . . . . . . . . . . . . . . . . . . . . . . . 40
1.5.1 Histone Code in Transcriptional Regulation . . . . . . . . . . . . . . . . 42
1.5.2 Histone Code in DNA Damage Response . . . . . . . . . . . . . . . . . 44
1.6 Methodologies to Study Histone Post-Translational Modifications . . . . . . . 56
1.6.1 Classical Methods . . . . . . . . . . . . . . . . . . . . . . . . . . . . . . 57
1.6.2 Mass Spectrometry . . . . . . . . . . . . . . . . . . . . . . . . . . . . . . 59
1.7 DNA Damage . . . . . . . . . . . . . . . . . . . . . . . . . . . . . . . . . . . . . 79
xi

xii Contents
1.8 Fanconi Anemia - A Model to Study DNA Damage Response . . . . . . . . . 82
1.9 Project Presentation . . . . . . . . . . . . . . . . . . . . . . . . . . . . . . . . . . 83
2 Results - I 87
2.1 Mass Spectrometry-Based Histone Modification Profiling of Cellular Response
to DNA-ICL . . . . . . . . . . . . . . . . . . . . . . . . . . . . . . . . . . . . . . 87
2.1.1 MS-Based Identification of Histone PTMs . . . . . . . . . . . . . . . . . 88
2.1.2 Quantitative Analysis of Histone PTMs in Fanconi Anemia . . . . . . 90
2.2 Discussion . . . . . . . . . . . . . . . . . . . . . . . . . . . . . . . . . . . . . . . 97
3 Results - II 101
3.1 Experimental Setup . . . . . . . . . . . . . . . . . . . . . . . . . . . . . . . . . . 102
3.2 Transcriptome Analysis of Histone Modifying Enzymes in Fanconi Anemia
Model . . . . . . . . . . . . . . . . . . . . . . . . . . . . . . . . . . . . . . . . . . 103
3.2.1 Histone Acetyltransferases (HATs) . . . . . . . . . . . . . . . . . . . . . 104
3.2.2 Histone Deacetylases (HDACs) . . . . . . . . . . . . . . . . . . . . . . . 104
3.2.3 Histone Methylation . . . . . . . . . . . . . . . . . . . . . . . . . . . . . 106
3.3 Global Transcriptional Analysis . . . . . . . . . . . . . . . . . . . . . . . . . . 109
3.3.1 Transcriptional responses to DSB and DNA ICL are different . . . . . . 110
3.3.2 Transcriptome is dramatically affected by defect in FA pathway . . . . 116
3.3.3 Role of Fanconi Anemia pathway in the Transcriptional Response to
DNA Damage . . . . . . . . . . . . . . . . . . . . . . . . . . . . . . . . . 118
3.4 Discussion . . . . . . . . . . . . . . . . . . . . . . . . . . . . . . . . . . . . . . . 126
4 Results - III 131
4.1 Design and features of the system . . . . . . . . . . . . . . . . . . . . . . . . . . 132
4.2 Analysis of post-translational modifications of a specific protein fraction using
PUB . . . . . . . . . . . . . . . . . . . . . . . . . . . . . . . . . . . . . . . . . . . 134
4.3 PUB-NChIP reveals a specific pattern of H4 acetylation in the Rad18-proximal
chromatin . . . . . . . . . . . . . . . . . . . . . . . . . . . . . . . . . . . . . . . 136
4.4 The Rad18-specific pattern changes after the proximity with Rad18 has been
diminished . . . . . . . . . . . . . . . . . . . . . . . . . . . . . . . . . . . . . . . 138
4.5 The pattern of H4 acetylation near Rad18 is different in the case of H2AZ
containing chromatin . . . . . . . . . . . . . . . . . . . . . . . . . . . . . . . . . 140
4.6 Discussion . . . . . . . . . . . . . . . . . . . . . . . . . . . . . . . . . . . . . . . 142
5 Conclusions and Future Lines of Research 145

xiii
5.1 High Throughput Analysis of Histone PTMs in Response to DNA-ICL . . . . 145
5.2 Transcriptional Profile in DNA-ICL Damage Response . . . . . . . . . . . . . 147
5.3 PUB-NChIP . . . . . . . . . . . . . . . . . . . . . . . . . . . . . . . . . . . . . . 149
5.4 General Conclusions . . . . . . . . . . . . . . . . . . . . . . . . . . . . . . . . . 150
6 Materials and Methods 153
6.1 Recombinant DNA . . . . . . . . . . . . . . . . . . . . . . . . . . . . . . . . . . 153
6.2 Cell Culture and Cell Lines . . . . . . . . . . . . . . . . . . . . . . . . . . . . . 153
6.3 Biochemistry and Western Blot Analysis . . . . . . . . . . . . . . . . . . . . . . 154
6.4 Mass Spectrometry Analysis . . . . . . . . . . . . . . . . . . . . . . . . . . . . . 154
6.5 Immunoflourescent Microscopy . . . . . . . . . . . . . . . . . . . . . . . . . . . 155
6.6 Proteome Fractionation . . . . . . . . . . . . . . . . . . . . . . . . . . . . . . . . 156
6.7 Calcium Phosphate Transfections . . . . . . . . . . . . . . . . . . . . . . . . . . 157
6.8 Native Chromatin Immunoprecipitation . . . . . . . . . . . . . . . . . . . . . . 158
6.9 RNA Preparation and Microarray Analysis . . . . . . . . . . . . . . . . . . . . 159
Publications 163
Bibliography 165
7 Annex - I 213
8 Annex - II 231
9 Annex - III 233
10 Annex - IV 235


List of Figures
1.1 Waddington’s Epigenetic Landscape . . . . . . . . . . . . . . . . . . . . . . . . 31.2 Scheme of epigenetic templating . . . . . . . . . . . . . . . . . . . . . . . . . . 71.3 Nucleosome core particle . . . . . . . . . . . . . . . . . . . . . . . . . . . . . . . 81.4 Ribbon traces of the H3-H4 and H2A-H2B histone-fold pairs . . . . . . . . . . 101.5 Higher order structuring of chromatin. . . . . . . . . . . . . . . . . . . . . . . . 121.6 Schematic representation of two different topologies for 30-nm chromatin fiber
folding . . . . . . . . . . . . . . . . . . . . . . . . . . . . . . . . . . . . . . . . . 131.7 Histone modifications chart . . . . . . . . . . . . . . . . . . . . . . . . . . . . . 161.8 Proteins domain structure of canonical histones and histone variants . . . . . 181.9 Histone modifying enzymes and their sites of modification . . . . . . . . . . . 291.10 Histone lysine methyltransferases and demethylases along with their speci-
ficity for particular histone residue. . . . . . . . . . . . . . . . . . . . . . . . . . 321.11 Models showing how histone PTMs affect the chromatin template . . . . . . . 361.12 Histone modifications cross-talk . . . . . . . . . . . . . . . . . . . . . . . . . . 391.13 Context dependent outcomes of histone code in transcriptional regulation . . 441.14 Histone modifications in DNA damage response . . . . . . . . . . . . . . . . . 551.15 Work flow of a typical MS-based histone PTM analysis. . . . . . . . . . . . . . 601.16 Schematic representation of the fraction of a proteome that can by identified
or quantified by MS-based proteomics . . . . . . . . . . . . . . . . . . . . . . . 661.17 SILAC principle . . . . . . . . . . . . . . . . . . . . . . . . . . . . . . . . . . . . 701.18 Label-free quantitative proteomics . . . . . . . . . . . . . . . . . . . . . . . . . 73
2.1 Representative TIC of Histone H4 residues 68-78 (K77UM) along with EICs ofdaughter peptides and MS/MS spectrum. . . . . . . . . . . . . . . . . . . . . . 91
2.2 Representative "Light" (A) and "Heavy" (B) MS2 Spectrum of Histone H3 pep-tide 9-17 (KSTGGKAPR). . . . . . . . . . . . . . . . . . . . . . . . . . . . . . . . 93
2.3 SILAC schematics and workflow diagram. . . . . . . . . . . . . . . . . . . . . 942.4 15% SDS-PAGE of FA-C corr and FA-C SILAC Light and Heavy samples . . . 952.5 Histone H3 PTM profile after DNA-ICL Induction . . . . . . . . . . . . . . . . 962.6 Histone H4 PTM profile after DNA-ICL Induction . . . . . . . . . . . . . . . . 97
3.1 cDNA microarray experiment design. . . . . . . . . . . . . . . . . . . . . . . . 1033.2 Gene expression profile of HATs in MOP/UVA treated FA-D2 corrected and
mutant cells . . . . . . . . . . . . . . . . . . . . . . . . . . . . . . . . . . . . . . 105
xv

xvi List of Figures
3.3 Gene expression profile of HDACs in MOP/UVA treated FA-D2 corrected andmutant cells . . . . . . . . . . . . . . . . . . . . . . . . . . . . . . . . . . . . . . 105
3.4 Gene expression profile of HMTs in MOP/UVA treated FA-D2 corrected andmutant cells . . . . . . . . . . . . . . . . . . . . . . . . . . . . . . . . . . . . . . 107
3.5 Gene expression profile of HMTs in MOP/UVA treated FA-D2 corrected andmutant cells . . . . . . . . . . . . . . . . . . . . . . . . . . . . . . . . . . . . . . 108
3.6 Gene expression profile of KDMs in MOP/UVA treated FA-D2 corrected andmutant cells . . . . . . . . . . . . . . . . . . . . . . . . . . . . . . . . . . . . . . 109
3.7 The overall transcriptional response to two types of DNA damage . . . . . . . 1103.8 Venn diagrams . . . . . . . . . . . . . . . . . . . . . . . . . . . . . . . . . . . . . 1133.9 Numbers of genes up and down-regulated in FA-D2 mutated cells, as com-
pared to the wild type (FA-D2 corrected )without any DNA damage induction. 1173.10 2-Dimensional cluster of MOP/UVA treated samples . . . . . . . . . . . . . . 1193.11 2-Dimensional cluster of IR treated samples . . . . . . . . . . . . . . . . . . . . 1203.12 2x2 Factorial experiment and the idea of interaction . . . . . . . . . . . . . . . 1213.13 Interaction analysis in FA-D2 corrected and mutant cells after induction of
DNA damage (MOP/UVA & IR) . . . . . . . . . . . . . . . . . . . . . . . . . . 1223.14 Scatter Plots . . . . . . . . . . . . . . . . . . . . . . . . . . . . . . . . . . . . . . 1233.15 Graph showing number of sequences having ε values≥ 3.0 or≤ 0.3 in MOP/UVA
and IR samples. . . . . . . . . . . . . . . . . . . . . . . . . . . . . . . . . . . . . 1233.16 Graph showing number of sequences in various sub-categories based on ε
values in MOP/UVA and IR samples. . . . . . . . . . . . . . . . . . . . . . . . 125
4.1 Design and features of the system . . . . . . . . . . . . . . . . . . . . . . . . . . 1334.2 Analysis of post-translational modifications of a specific protein fraction using
"PUB" . . . . . . . . . . . . . . . . . . . . . . . . . . . . . . . . . . . . . . . . . . 1354.3 PUB-NChIP reveals a specific pattern of H4 acetylation in the Rad18-proximal
chromatin . . . . . . . . . . . . . . . . . . . . . . . . . . . . . . . . . . . . . . . 1374.4 The Rad18-specific pattern changes after the proximity with Rad18 has been
diminished . . . . . . . . . . . . . . . . . . . . . . . . . . . . . . . . . . . . . . . 1394.5 Use of alternative histone variants . . . . . . . . . . . . . . . . . . . . . . . . . 141
7.1 MS2 spectrum of Histone H3 residues 9-17 (K14ac) . . . . . . . . . . . . . . . . 2147.2 MS2 spectrum of Histone H3 residues 9-17 (K9UM + 14UM) . . . . . . . . . . 2157.3 MS2 spectrum of Histone H3 residues 9-17 (K9me + K14UM) . . . . . . . . . . 2167.4 MS2 spectrum of Histone H3 residues 54-63 (K56UM) . . . . . . . . . . . . . . 2177.5 MS2 spectrum of Histone H3 residues 54-63 (K56me) . . . . . . . . . . . . . . 2187.6 MS2 spectrum of Histone H3 residues 73-83 (K79UM) . . . . . . . . . . . . . . 2197.7 MS2 spectrum of Histone H3 residues 73-83 (K79me) . . . . . . . . . . . . . . 2207.8 MS2 spectrum of Histone H4 residues 68-78 (K77UM) . . . . . . . . . . . . . . 2217.9 MS2 spectrum of Histone H4 residues 68-78 (K77me) . . . . . . . . . . . . . . 2227.10 MS2 spectrum of Histone H4 residues 24-35 (K31UM) . . . . . . . . . . . . . . 2237.11 MS2 spectrum of Histone H4 residues 24-35 (K31me) . . . . . . . . . . . . . . 2247.12 MS2 spectrum of Histone H4 residues 4-17 (4ac) . . . . . . . . . . . . . . . . . 225

xvii
7.13 MS2 spectrum of Histone H4 residues 4-17 (3ac) . . . . . . . . . . . . . . . . . 2267.14 MS2 spectrum of Histone H4 residues 4-17 (2ac) . . . . . . . . . . . . . . . . . 2277.15 MS2 spectrum of Histone H4 residues 4-17 (1ac) . . . . . . . . . . . . . . . . . 2287.16 MS2 spectrum of Histone H4 residues 4-17 (K5, 8, 12, 16 UM) . . . . . . . . . . 229


List of Tables
1.1 Nucleosome core particles with suggested traditional names . . . . . . . . . . 91.2 Different classes of modifications identified on histones. . . . . . . . . . . . . . 17
2.1 List of Histone H3 Peptides. . . . . . . . . . . . . . . . . . . . . . . . . . . . . . 892.2 List of Histone H4 Peptides. . . . . . . . . . . . . . . . . . . . . . . . . . . . . . 90
3.1 Gene Ontology (GO) analysis of up-regulated sequences in FA-D2 corrected(1h-MOP/UVA) cells VS FA-D2 corrected untreated cells. . . . . . . . . . . . . 111
3.2 Gene Ontology (GO) analysis of down-regulated sequences in FA-D2 cor-rected (1h-MOP/UVA) cells VS FA-D2 untreated cells. . . . . . . . . . . . . . . 111
3.3 Gene Ontology (GO) analysis of up-regulated sequences in FA-D2 corrected(1h-IR) cells VS FA-D2 untreated cells. . . . . . . . . . . . . . . . . . . . . . . . 112
3.4 Gene Ontology (GO) analysis of down-regulated sequences in FA-D2 cor-rected (1h-IR) cells VS FA-D2 untreated cells. . . . . . . . . . . . . . . . . . . . 112
3.5 Gene Ontology (GO) analysis of up-regulated sequences in FA-D2 corrected(6h-MOP/UVA) cells VS FA-D2 untreated cells. . . . . . . . . . . . . . . . . . . 114
3.6 Gene Ontology (GO) analysis of down-regulated sequences in FA-D2 cor-rected (6h-MOP/UVA) cells VS FA-D2 untreated cells. . . . . . . . . . . . . . . 114
3.7 Gene Ontology (GO) analysis of common sequences in 1h and 6h MOP/UVAtreated FA-D2 corrected cells VS FA-D2 untreated cells. . . . . . . . . . . . . . 115
3.8 Gene Ontology (GO) analysis of Up-regulated sequences after 6h IR treatedFA-D2 corrected cells VS FA-D2 untreated cells. . . . . . . . . . . . . . . . . . 115
3.9 Gene Ontology (GO) analysis of Down-regulated sequences after 6h IR treatedFA-D2 corrected cells VS FA-D2 untreated cells. . . . . . . . . . . . . . . . . . 116
3.10 Gene Ontology (GO) analysis of common sequences in 1h and 6h IR treatedFA-D2 corrected cells VS FA-D2 untreated cells. . . . . . . . . . . . . . . . . . 116
3.11 Gene Ontology (GO) analysis of common sequences in 6h MOP/UVA and IRtreated FA-D2 corrected cells VS FA-D2 untreated cells. . . . . . . . . . . . . . 117
3.12 Up-regulated chromatin-related genes in untreated FA-D2 mutant VS wildtype cells. . . . . . . . . . . . . . . . . . . . . . . . . . . . . . . . . . . . . . . . . 118
3.13 Gene Ontology (GO) analysis of genes down-regulated in untreated FA-D2mutant cells as compared to the wild type (FA-D2 corrected). . . . . . . . . . . 118
xix


Nomenclature
ADP Adenosine Diphosphate
ASF-1 Anti Silencing Factor-1
ATM Ataxia Telangiectasia Mutated
ATP Adenosine Triphosphate
ATR Ataxia Teleangiestasia and Rad3 Related
Au-PAGE Acid-Urea Polyacrylamide Gel Electrophoresis
BAP Biotin Acceptor Peptide
BBAP B-lymphoma and BAL-associated protein
BER Base Excision Repair
BirA Biotin Ligase A
BRCA1 Breast Cancer Associated-1
BRCT BRCA1 C-terminus
BSA Bovine Serum Albumin
C-terminal Carboxy-terminal
CAF-1 Chromatin Assembly Factor-1
CBP Creb-Binding Protein
CDK Cyclin Dependent Kinase
CE-ESI-MS Capillary Electrophoresis-Electrospray Ionization-Mass Spectrometry
CenpA Centromere protein A
CenpA Ubiquitin Conjugating Enzyme-13
CHD1 Chromodomain Helicase DNA Binding Protein-1
ChIP Chromatin Immunoprecipitation
xxi

xxii Nomenclature
CID Collision Induced Dissociation
CK2 Casein Kinase-2
CMV Cytomegalo Virus
Co-REST Corepressor to RE1 Silencing Transcription Factor/Neural Restrictive Silenc-ing Complexes
COMPASS Complex Proteins Associated with Set1
Cy3 Cyanine3
DamID DNA Adenine Methyltransferase Identification
DDR DNA Damage Response
DMEM Dulbecco’s Modified Eagle Medium
DNA Deoxyribonucleic Acid
DNA-PK DNA Dependent Protein Kinase
DNMT1 DNA Methyltransferase-1
DNMT3L [DNA Methyltransferase-3L
DSB Double Strand Break
DTT Dithiothreitol
ECD Electron Capture Dissociation
EHMT1 Euchromatic Histone-Lysine N-methyltransferase-1
EIC Extracted Ion Chromatogram
emPAI Exponentially Modified Protein Abundance Index
ESI Electrospray Ionization
ETD Electron Transfer Dissociation
EYA1 Eyes Absent-1
EZH2 Enhancer of Zest-2
FA Fanconi Anemia
FACT (Facilitates Chromatin Transcription
FHA forkhead-associated
FOSL1 Fos-Related Antigen-1

xxiii
FT-ICR Fourier Transform - Ion Cyclotron Resonance
GeLCMS Gel Enhanced Liquid Chromatography Mass Spectrometry
GFP Green Fluorescent Protein
GNAT GCN5-related N-acetyltransferase
GO Gene Ontology
H/L Heavy/Light Ratio
H2A-Bbd H2A-Bar Body deficient
HA Hydroxyapatite
HA-Tag Hemagglutinin
HAT histone acetyltransferase
HCl Hydrochloric Acid
HDAC Histone Deacetylase
HEPES 4-(2-hydroxyethyl)-1-piperazineethanesulfonic acid
HFD Histone Fold Domain
HILIC Hydrophilic Interaction Chromatography
HIRA HIR Histone Cell Cycle Regulation Defective Homolog A
HKDM Histone Lysine Demethylase
HKMT Histone Lysine Methyltransferase
HMR Hidden MAT Right
HMT histone methyltransferase
HP1 Heterochromatin Protein-1
HPCE High Performance Capillary electrophoresis
HPLC-MS/MS High Performance Liquid Chromatography-Tandem Mass Spectrometry
HPMC Hydropropylmethylcellulose
HR Homologous Recombination
HRP Horse Raddish Peroxidase
HSB High Salt Buffer
ICL Interstrand Crosslink

xxiv Nomenclature
ICPL Isotope Coded Protein Label
IEX Ion Exchange Chromatography
IMAC Immobilized Metal Affinity Chromatography
ING Inhibitor of Growth
INHAT [Inhibitor of Histone Acetyltransferase
IR Ionizing Radiation
IRIF Ionizing Radiation Induced Foci
iTRAQ Isotope Tags for Relative and Absolute Quantification
JMJD6 Jumonji Domain Containing-6
KDM Lysine Demthylase
KDM2A Lysine Demethylase-2A
LC Liquid Chromatography
LDS Lithium Dodecyl Sulphate
LSB Low Salt Buffer
LSD1 Lysine Specific Demthylase-1
m/z mass/charge
MALDI Matrix Assisted Laser Desorption Ionization
MDC1 Mediator of DNA Damage Checkpoint Protein-1
MLL Mixed Lineage Leukemia
MMC Mitomycin C
MMR Mismatch Repair
MNase Micrococcal Nuclease
MOF Males Absent on the First
MOP Methoxypsoralen
MRM Multiple Reaction Monitoring
MRN Mre11/Rad50/Nbs1
mRNA Messenger RNA
MS Mass Spectrometry

xxv
MSK1/2 Mitogen and Stress-Activated Protein Kinase
MYST MOZ, YBF2/SAS3, SAS2 and Tip60
N-CoR/SMRT Nuclear Receptor-Corepressor/Silencing Mediator for Retinoid and ThyroidHormone Receptors
N-terminal Amino-terminal
NAP1L1 Nucleosome Assembly Protein 1-Like 1
NChIP Native Chromatin Immunoprecipitation
NER Nucleotide Excision Repair
NHEJ Non-Homologous End Joining
NuRD Nucleosome Remodeling and Histone Deacetylation
P-TEFb Positive Transcription Elongation Factor-b
p53BP1 p53 Binding Protein-1
PBS Phosphate Buffered saline
PCAF P300/CBP-Associated Factor
PCNA Proliferating Cell Nuclear Antigen
PHD Plant Homeodomain
PHF8 PHD Finger Protein-8
PI3K Phosphatidyl Inositol 3’ Kinase
PIKK Phosphatidyl Inositol 3’ Kinase-Related Kinases
PIM1 Proto-oncogene Serine/Threonine-Protein Kinase Pim-1
PKD2 Polycystic Kidney Disease-2
PMSF Phenylmethanesulfonylfluoride
PP2A Protein Phosphatase-2A
PP4C Protein Phosphatase-4C
PPP Protein-Protein Proximity
PRDM2 PR-Domain Zinc Finger Protein-2
PRMT Protein Arginine Methyltransferase
PTM Post-translational Modification

xxvi Nomenclature
PUB-MS Proximity Utilizing Biotinylation - Mass Spectrometry
PVDF Polyvinylidene Fluoride
rDNA Replication Independent
rDNA Ribosomal Deoxyribonucleic Acid
RNA Ribonucleic Acid
RP Reverse Phase
RSC Remodels the Structure of Chromatin Complex
SAM S-Adenosylmethionine
SCX Strong Cation Exchange Chromatography
SDS-PAGE Sodium Dodecyl Sulphate-Polyacrylamide Gel Electrophoresis
SET SU(VAR)39, Enhancer of Zest, Trithorax
SH2 Src Homology 2
SILAC Stable Isotope Labeling of Aminoacids during Cell Cuture
SMYD1 SET and MYND Domain Containing-1
SNF2 Sucrose Non Fermentable-2
SWI/SNF SWItch/Sucrose NonFermentable
TCR T Cell Receptor
TIC Total Ion Chromatogram
Tip60 Tat Interacting Protein-60
TMT Tandem Mass Tags
TOF Time of Flight
TRRAP Transformation-Domain Associated Protein
TSA Trichostatin A
TSS Transcription Start Site
UBZ Ubiquitin Binding Zinc Finger Domain
UHRF1 Ubiquitin-like, containing PHD and RING Finger Domains-1
UV Ultra Violet
UVA Ultra Violet-A

xxvii
UVC Ultra Violet-C
V(D)J Variable(Diverse)Joining
WCX-HILIC Weak Cation Exchange-HILIC
WICH WSTF-ISWI ATP-dependent chromatin-remodeling complex
WSTF WilliamsBeuren Syndrome Transcription Factor
XPC Xeroderma Pigmentosum Protein C


1Introduction
1.1 Epigenetics
1.1.1 The Central Dogma of Molecular Biology
Epigenetic phenomena have recently gained a renewed interest and represent a topic of ac-tive research in current biology, owing in part due to going "against the grain" of the CentralDogma of Molecular Biology. If understood in an over-simplified way, the Central Dogmaprofesses a "genocentric" view of a biological system, according to which all informationnecessary to define the state of an organism (up to the reaction norm due to the effects ofenvironment) is contained in the sequence of its genome. Although it adequately describesthe situation in simple single-cellular organisms, such as bacteria, the "genocentric" viewcertainly runs into problem when one start to deal with the multicellular organisms that ex-hibit the phenomenon of cellular differentiation. Different cell types from the same organismcan be taken from an organism and propagated in a cell culture, in identical environmentalconditions. The genome sequence of these different cell types is identical (as demonstratedby the phenomenon of somatic cloning), nevertheless they exhibit very different but stablephenotypes. This observation suggests that there should be an additional information re-sponsible for the maintenance of the stable differentiated phenotypes. Understanding thenature and the mechanisms of processing and propagation of this information represent oneof the major topics in the epigenetic studies.
In fact, the Central Dogma, as it was first formulated by Francis Crick in 1958 and re-statedin 1970 [Crick, 1970] asserts:
1

2 Chapter 1. Introduction
"The central dogma of molecular biology deals with the detailed residue-by-residue transfer of sequential information. It states that such information cannotbe transferred from protein to either protein or nucleic acid".
A careful reading of this definition shows that it leaves the door open for other types of infor-mation that could be required to specify the state of the organism (e.g. stored in macromolec-ular conformations, interactions and post-translational modifications) and might propagateindependently from the DNA sequence. Thus, while the existence of epigenetic phenomenaconflicts with the ’genocentric’ view of biological systems, it is compatible with the CentralDogma of Molecular Biology as it was formulated by Crick. The importance of epigeneticshas also been renewed more recently by James Watson, while celebrating the 50th anniver-sary of the double helix, in 2003. He gave the following comment while revisiting the CentralDogma:
"The major problem, I think, is chromatin.... you can inherit something be-yond the DNA sequence. That’s where the real excitement of genetics is now"[Watson, 2003].
1.1.2 The Changing Definitions of Epigenetics
Historically, the term epigenetics was used to describe various biological phenomena thatcould not be explained by genetic principles. Towards the middle of the twentieth centurythe field of genetics was rapidly progressing, however, the embryologists and developmen-tal biologists were not yet enlightened by the cause and effects of gene regulation. There werea few leading scientists who realized that genetics and developmental biology were indeedrelated and should eventually come together in a common discipline. Conrad Waddington(1905-1975), who was an expert in both fields of research, took the Greek word epigenesis,a theory of development which proposed that the early embryo was undifferentiated, andtransformed it to epigenetics. Although Waddington was given credit for coining the termepigenetics, his initial understanding of epigenetics was very broad and not much differ-ent from embryology. According to him, all those events which lead to the unfolding of thegenetic program for development can be grouped under the term epigenetics. However, in1942, Waddington defined epigenetics more precisely as "the branch of biology which stud-ies the causal interactions between genes and their products, which bring the phenotype intobeing" [Waddington, 1942]. Later, in 1957, he proposed the idea of an epigenetic landscapeto represent the process of cellular decision making during various phases of developmentin a multicellular organisms [Waddington, 1957] [Figure1.1].
Over the years, after its birth, the term epigenetics was very scarcely used and often con-fused with the developmental biology. In the decades of 70’s and 80’s very few people usedthe term in the same manner as Waddigton did. However, in late 1980’s and early 1990’s,the term moved into a new era where it began to be considered as a distinct field of biologyinstead of rather a concept. In 1987, Robin Holliday described the inheritance of epigenetic

1.1. Epigenetics 3
Figure 1.1: Waddington’s Epigenetic Landscape that defines different stable trajectories that a cell can takeduring development and differentiation.
defects where he revisited the term epigenetics and applied it to a scenario where he de-scribed that changes in DNA methylation also changed the gene activity, in an attempt toexplain epigenetics in a more specific manner [Holliday, 1987]. At that time the word epimu-tation was introduced to describe heritable changes in genes, which were not due to changesin DNA sequence. This publication is considered as the critical paper that laid the founda-tions for the explosion in the use of the term "epigenetics" in 1990s.
Later, in 1992, Hall described epigenetics as "the sum of the genetic and non genetic factorsacting upon cells to selectively control the gene expression that produces increasing pheno-typic complexity during development" [Hall, 1992]. This decisive change in the way howthe term epigenetics is defined came about as the molecular mechanisms controlling geneactivity and the cellular inheritance of phenotypes began to be unraveled. Holliday’s workon cell memory paved way for further narrowing the field as the decade progressed. Hewrote that "epigenetics can be defined as the study of the mechanisms of temporal and spa-tial control of gene activity during the development of complex organisms". He also addedthat, "Mechanisms of epigenetic control must include the inheritance of a particular spec-trum of gene activities in each specialized cell. In addition to the classical DNA code, it isnecessary to envisage the superimposition of an additional layer of information which com-prises part of the hereditary material, and in many cases this is very stable. The term epige-netic inheritance has been introduced to describe this situation" [Holliday, 1990]. A few yearslater Holliday redefine epigenetics as 1- The study of the changes in gene expression, whichoccur in organisms with differentiated cells, and the mitotic inheritance of given patternsof gene expression, and 2- Nuclear inheritance which is not based on differences in DNAsequence [Holliday, 1994]. In 1996, a book entitled "Epigenetic Mechanisms of Gene Regula-tion" defined the term as "The study of mitotically and/or meiotically heritable changes in

4 Chapter 1. Introduction
gene function that cannot be explained by changes in DNA sequence".
By the end of twentieth century, epigenetics had already been recognized as a sub disciplineof biology owing to the unraveling of the molecular mechanisms controlling gene activityand the inheritance of cell phenotypes. Epigenetics, in a broad sense, is considered to be abridge between genotype and phenotype, a phenomenon that changes the final outcome ofa locus or chromosome without changing the underlying DNA sequence. For instance, de-spite the identical genotype of vast majority of cells in a multicellular organism, organismaldevelopment generates a diversity of cell types with disparate, yet stable, profiles of geneexpression and distinct cellular functions. Thus, cellular differentiation may be consideredan epigenetic phenomenon, largely governed by changes in what Waddington described asthe "epigenetic landscape" rather than alterations in genetic inheritance [Figure1.1].
Although the distinction between DNA and non-DNA inheritance can be easily made, thereare no simple criteria for distinguishing between genetic and epigenetic phenomena. In gen-eral, genetics today deals with the transmission and processing of information in DNA,whereas epigenetics deals with its interpretation and integration with information fromother sources and reflect this information into a phenotype. Epigenetics is therefore con-cerned with the systems of interactions that lead to predictable and usually functional phe-notypic outcomes. Thus in today’s modern terms, epigenetics can be mechanistically de-fined as "The sum of the alterations to the chromatin template that collectively establish andpropagate different patterns of gene expression (transcription) and silencing from the samegenome" [Allis et al., 2007].
1.1.3 Epigenetic information: Heritability vs Stability
The above discussion suggests an explanation of how the meaning of the current term ’epi-genetic’ came about. However, it appears that the requirement of ’heritability’, currently em-phasized as the criterion for a particular phenomenon to fall under the scope of epigeneticresearch, might be too restrictive.
Terminally differentiated cells such as neurons and muscle cells live for decades, maintainingtheir distinct phenotypic differences in spite of environmental stresses, thermal noise andDNA damage/repair (Green and Almouzni, 2002; Ikura and Ogryzko, 2003). These cells donot proliferate, thus the term ’heritable’ does not apply to their distinct and stable traits. Onthe other hand, it is reasonable to expect that maintenance and propagation of informationresponsible for these traits employs mechanisms that are similar to those that are utilizedin the replicating cells. Thus, although one cannot use the criteria of ’heritability’, there aregood reasons to qualify these variations (and the underlying mechanisms) as epigenetic. Theterm "epigenetic stability" refers to a broader phenomenon that encompasses maintenanceof phenotypic traits in both replicating and non-replicating cells independent from DNAsequence [Ogryzko, 2008]; [Viens et al., 2006].

1.1. Epigenetics 5
1.1.4 Role of Epigenetic Information
Why life needs epigenetic information? As discussed above, one of its roles is in facilitatingmaintenance of differentiated cell phenotypes during development of multicellular organ-isms, that is in supporting alternative interpretations of genetic information. However, onemight argue that from evolutionary perspective, a more fundamental and primary role couldhave been protection of genetic information. Cells have developed systems to distinguish be-tween their own DNA and foreign DNA, as a form of defense mechanism to protect them-selves from invading DNA. One example of such mechanisms is seen in bacteria, where arestriction endonuclease and DNA methylase enzymes target the same DNA sequence, de-pending on its methylated status. A foreign DNA invading the cell is not methylated andthus becomes a target of the endonuclease. However, the same target sequence present orig-inally in the cell is fully methylated, and the methylated state is maintained after replicationdue to the action of methylase. Thus, cellular machinery that helps cell to protect its owngenetic information is based on recognition of epigenetic information associated with DNA.
A similar mechanism of replication of methylated status of DNA serves additional protec-tive purpose, by helping to prevent errors during replication of genetic information. In orderto correctly remove the erroneously incorporated nucleotide, mismatch repair mechanismsneed to recognize the parental strand of the newly duplicated DNA. While the newly repli-cated DNA is in the hemi-methylated state, the parental strand is labeled with methyl, whichallows the mismatch repair machinery to correctly identify which base of a mismatch pairhas to be removed. Importantly, this mechanism works only if there is a time window whenthe hemi-methylated DNA has not yet been converted to the fully methylated state. Thus,the increased accuracy of replication of genetic information is ensured by the difference be-tween the rates of replication of genetic and epigenetic information, making mismatch repairan example of a general kinetic proofreading scheme [Hopfield, 1974].
In the above examples, epigenetic information acts as a part of protection system servingto differentiate the ’self’ from the ’foreign’ and the ’old’ from the ’new’. Thus, at least twodistinct roles of epigenetic information can be distinguished: interpretation of genetic in-formation and its protection. What could be the evolutionary relation between these twofunctions? We can speculate that the protection of genetic information might have emergedfirst in evolution, since it would be beneficial for the single cellular organisms. Only later,epigenetic mechanisms could be recruited to play a role in differentiation. Supporting thisidea is the evidence that many epigenetic mechanisms appear to be related to mechanismsof suppression of parasitic genetic elements. Only after the establishment of the machinerythat allows recognition of different epigenetic marks and channeling the signals encoded inthese marks along appropriate response pathways, these mechanisms of processing of epi-genetic information could be recruited for other purposes, such as for stabilizing differentalternative states of the same organism.

6 Chapter 1. Introduction
1.1.5 Epigenetic Templating
After having discussed the role of epigenetic information and its evolving nature, we nextask this question, how epigenetic information can be propagated and maintained? Studiesof DNA methylation (an earliest recognized epigenetic mark) provided an early clue on onemechanism, which is based on a different behavior of the so called maintenance methylaseenzyme towards un-methylated versus hemi-methylated DNA. The semi-conservative DNAreplication of a methylated double strand gives rise to hemi-methylated bases comprising amethylated parental strand and an unmethylated newly synthesized one. Methyltransferaseenzymes bind to the hemi-methylated sites where they methylate the new strand. The mod-ifying machinery is not recruited to non methylated strands.
Later on, this model motivated Francis Crick to propose a similar mechanism as the molec-ular basis for neurobiological memory, essentially an epigenetic phenomenon [Crick, 1984].He postulated that i) the strength of a synapse is determined by phosphorylation of a proteinmolecule, ii) this protein can form dimers (or oligomers) and iii) the kinase responsible forthe modification will only modify monomer in a dimer that has second monomer alreadyphosphorylated.
Consistent with the recognized role of chromatin as a principal carrier of epigenetic infor-mation, very similar mechanisms have been suggested for perpetuation of post-translationalhistone modifications. Some histone acetyltransferase (HAT) complexes could be preferen-tially recruited to acetylated chromatin due to the presence of bromodomains, recogniz-ing acetylated lysines, whereas the chromodomain containing histone methyl transferase(HMT) complexes could be likewise recruited to methylated chromatin [Owen et al., 2000];[Ogryzko, 2001]; [Jenuwein and Allis, 2001]. Also, domain structure of some protein kinasessuggests that similar mechanism could operate not only on the level of chromatin, but in con-trolling the organization of cytoplasm as well. Tyrosine kinases often contain SH2-domains, which recognize phosphotyrosine, whereas some serine/threonine kinases contain FHAdomains that recognize phosphoserine/phosphothreonine. If some of the targets of these ki-nases form dimers (or oligomers), their phosphorylation status can be perpetuated accordingto the Crick’s original proposal.
For the absence of a accepted terminology, Vasily Ogryzko’s group used the term ’epigenetictemplating’ [Ogryzko, 2008]; [Viens et al., 2006] to refer to a mechanism of perpetuation ofepigenetic information that is based on the preferential activity of enzymes that deposit aparticular epigenetic mark on macromolecular complexes already containing the same mark[Figure 1.2]. They tested whether this model can also apply to variant histones, putativeepigenetic marks on chromatin different from post-translational histone modifications.
1.2 The Chromatin Template
In eukaryotic cells, the genetic material is organized into a complex structure that is knownas chromatin (from the Greek "khroma" meaning colored), which was first detected with

1.2. The Chromatin Template 7
Figure 1.2: Scheme of epigenetic templating. In case I, the modifying machinery is recruited to sites ex-hibiting a particular mark and therefore it amplifies the information. In case II, if the mark is absent, themachinery is not recruited. In case III, the recruitment occurs but no additional modification takes placebecause target sites are already modified. Adapted from [Ogryzko, 2008].
basic dyes as a stainable substance in the nucleus, towards the end of the nineteenth cen-tury. Currently, it is considered as a principal carrier of epigenetic information. It is an hi-erarchically organized complex of DNA, histones and non-histone proteins. Histones, beingthe most abundant and notable protein components of chromatin, have two properties thatwould allow them to carry epigenetic information. First, they are very tightly associatedwith DNA, as demonstrated by biochemical methods and also by direct measurements oftheir mobility in vivo by photobleaching experiments [Kimura and Cook, 2001]. This tightassociation can persist through mitosis [Gerlich et al., 2003], thus histones can provide astable mark on a particular locus of genome. Second, they are known to carry many post-translational modifications, which can dictate specific biological readouts and stably trans-mitted across generations (Discussed later).
1.2.1 The Nucleosome
Packaging of chromatin is a distinctive feature of eukaryotic genomes. The fundamentalpackaging unit of chromatin is the nucleosome that consists of a core histone octamer com-posed of two copies of each core histone protein H2A, H2B, H3 and H4, with 145-147 basepairs of DNA wrapped around this core. This nucleosome core particle represents the basicrepeating unit in chromatin and exist in the form of arrays that forms basis for higher-orderchromatin structure [Kornberg, 1974]. As the principal packaging element of DNA within

8 Chapter 1. Introduction
Figure 1.3: Nucleosome core particle. Ribbon traces for the 146-bp DNA phosphodiester backbones (brownand turquoise) and eight histone protein main chains (blue: H3; green: H4; yellow: H2A; red: H2B. Theviews are down the DNA super helix axis for the left particle and perpendicular to it for the right particle.Adapted from [Luger et al., 1997].
the nucleus, it is the primary determinant of DNA accessibility during fundamental cellularprocesses such as recombination, replication, mitotic condensation, transcription and DNAdamage sensing and repair.
The basic structure of the nucleosome core particle was resolved by X-ray crystallographyat 2.8 A◦, showing in atomic detail how the histone protein octamer is assembled and howDNA base pairs are organized into a super helix around it [Luger et al., 1997]. It showed adisc shaped structure resulting from the flat 1.65 left-handed super helical DNA structure,corresponding to 145-147 base-pair stretch of genomic DNA. It also helped to understandthe secondary structure of the core histones [Figure1.3]. Nucleosomes are connected by alinker DNA of variable length (10-80 base pairs [Widom, 1992]) that forms a 10-nm beads-on-a-string array [Giannasca et al., 1993].
Ever since the discovery of the nucleosome in 1974, there has been evidence, appearing inthe literature from time to time, that in-vivo structure of nucleosome is subject to both staticand dynamic variations in structure and composition. Scientists have discovered discreteparticles in which DNA is wrapped around histone complexes of different stoichiometries:octasomes, hexasomes, tetrasomes, "split" half-nucleosomes, and, recently, hemisomes (re-viewed in [Lavelle and Prunell, 2007] and [Zlatanova et al., 2009]). These observations havecompletely changed the way how scientists looked at the nucleosome as it they can no longerbe viewed as a single static entity: rather, it is a family of particles differing in their structuraland dynamic properties. Such variations in nucleosome structure have important functionalimplications during essential cellular processes like transcription, replication, repair and re-
1.2. The Chromatin Template 9
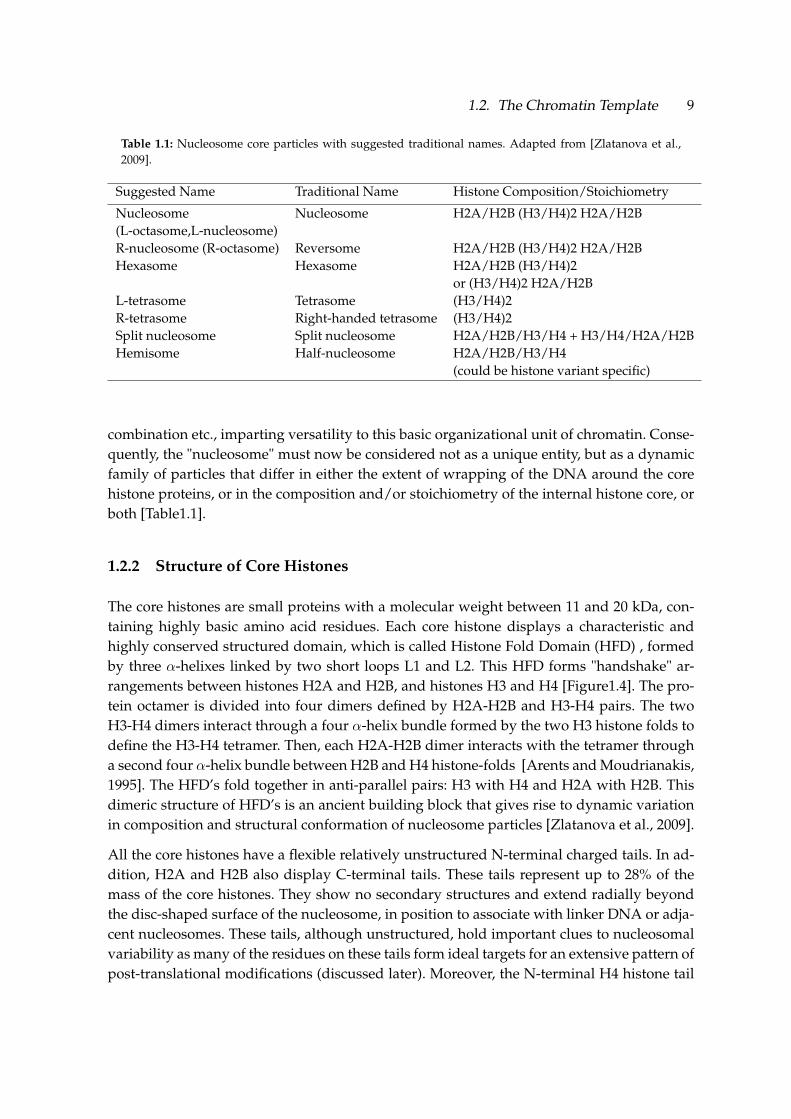
Table 1.1: Nucleosome core particles with suggested traditional names. Adapted from [Zlatanova et al.,2009].
Suggested Name Traditional Name Histone Composition/Stoichiometry
Nucleosome Nucleosome H2A/H2B (H3/H4)2 H2A/H2B(L-octasome,L-nucleosome)R-nucleosome (R-octasome) Reversome H2A/H2B (H3/H4)2 H2A/H2BHexasome Hexasome H2A/H2B (H3/H4)2
or (H3/H4)2 H2A/H2BL-tetrasome Tetrasome (H3/H4)2R-tetrasome Right-handed tetrasome (H3/H4)2Split nucleosome Split nucleosome H2A/H2B/H3/H4 + H3/H4/H2A/H2BHemisome Half-nucleosome H2A/H2B/H3/H4
(could be histone variant specific)
combination etc., imparting versatility to this basic organizational unit of chromatin. Conse-quently, the "nucleosome" must now be considered not as a unique entity, but as a dynamicfamily of particles that differ in either the extent of wrapping of the DNA around the corehistone proteins, or in the composition and/or stoichiometry of the internal histone core, orboth [Table1.1].
1.2.2 Structure of Core Histones
The core histones are small proteins with a molecular weight between 11 and 20 kDa, con-taining highly basic amino acid residues. Each core histone displays a characteristic andhighly conserved structured domain, which is called Histone Fold Domain (HFD) , formedby three α-helixes linked by two short loops L1 and L2. This HFD forms "handshake" ar-rangements between histones H2A and H2B, and histones H3 and H4 [Figure1.4]. The pro-tein octamer is divided into four dimers defined by H2A-H2B and H3-H4 pairs. The twoH3-H4 dimers interact through a four α-helix bundle formed by the two H3 histone folds todefine the H3-H4 tetramer. Then, each H2A-H2B dimer interacts with the tetramer througha second four α-helix bundle between H2B and H4 histone-folds [Arents and Moudrianakis,1995]. The HFD’s fold together in anti-parallel pairs: H3 with H4 and H2A with H2B. Thisdimeric structure of HFD’s is an ancient building block that gives rise to dynamic variationin composition and structural conformation of nucleosome particles [Zlatanova et al., 2009].
All the core histones have a flexible relatively unstructured N-terminal charged tails. In ad-dition, H2A and H2B also display C-terminal tails. These tails represent up to 28% of themass of the core histones. They show no secondary structures and extend radially beyondthe disc-shaped surface of the nucleosome, in position to associate with linker DNA or adja-cent nucleosomes. These tails, although unstructured, hold important clues to nucleosomalvariability as many of the residues on these tails form ideal targets for an extensive pattern ofpost-translational modifications (discussed later). Moreover, the N-terminal H4 histone tail

10 Chapter 1. Introduction
Figure 1.4: Ribbon traces of the H3-H4 and H2A-H2B histone-fold pairs. The α1-L1-α2-L2-α3 structure isshown. Adapted from [Luger et al., 1997].
has internucleosomal interactions with histone H2A (α-helix 2) that could stabilize higherorder structures [Luger et al., 1997].
Structural analysis of nucleosomes containing core histones from different species have re-vealed that the overall nucleosome structure is surprisingly resistant to structural alterationsand highly conserved from yeast to humans. It is believed that sequence differences in strate-gic regions of the histone fold create subtle structural changes at histone-histone interfaces,which may have significant functional implications. The high degree of evolutionary conser-vation of the major type core histones may therefore have a purpose above and beyond ar-chitectural preservation of nucleosomes [Chakravarthy et al., 2005]. Although histones havetraditionally been viewed as slowly evolving architectural proteins that lack diversificationbeyond their abundant tail modifications, recent studies have revealed that variant histoneshave evolved for diverse functions (discussed later). This diversity in form and function ofhistones act as a switch to dictate when genetic information is turned on or off, it’s faithfullypropagation through cell division and it’s repair.
1.2.3 Molecular Genetics of Core Histones
Histone protein synthesis is essential for cell proliferation and required for the packaging ofDNA into chromatin. The genes encoding the core histones and histone H1 exist as multipleclusters on several chromosomes in mammalian cells. Each cluster includes several copiesof the gene. Furthermore, the genes show a specific structure lacking introns [Tripputi et al.,1986]. These genes are mostly expressed during S phase of the cell cycle, with a 10 to 50fold increase compared to the level of expression observed in quiescent cells, and with theexception of alternative histone variants (discussed later). They produce mRNAs displayingshort 5’ and 3’ untranslated regions and a stem-loop structure at their 3’ end instead of apolyadenylated tail [Marzluff and Pandey, 1988]. Core histone gene expression has beenshown to be evolutionarily conserved from yeast to humans [Marino-Ramirez et al., 2006].

1.3. Higher Order Chromatin Organization 11
1.3 Higher Order Chromatin Organization
The first observations of eukaryotic interphasic nuclei have shown the presence of two formsof chromatin on the basis of differential compaction; a condensed form named heterochro-matin, and a more relaxed one named euchromatin [Heitz, 1928]. Euchromatin has been re-ported to exist under two states of condensation. The more relaxed one, representing only tenpercent of euchromatin, seems to be transcriptionally active, whereas the more condensedform, does not display any transcriptional activity [Lamond and Earnshaw, 1998]; [Spec-tor, 2001]. The euchromatin consists largely of coding sequences that accounts for only lessthan 4% of mammalian genomes. It represents a complex and dynamic state of chromatinthat harbours and interacts with a dedicated cellular machinery (transcription machinery,chromatin modifying and remodelling complexes etc.) to bring about the transcription offunctional RNAs. The exact nature of these interactions between transcription apparatusand chromatin "processing" machines is currently an exciting area of research.
Heterochromatin is generally described as transcriptionally inactive, unlike euchromatin,which tends to be associated with the active part of the genome. However, all inactive genesand non-transcribed regions of the genome do not appear as heterochromatin. Heterochro-matin can also exist in two forms i.e. "constitutitve" and "facultative" heterochromatin. Con-stitutive heterochromatin is the permanently silent chromatin and contains a high densityof repetitive DNA elements such as clusters of satellite sequences and transposable ele-ments [Birchler et al., 2000]. These regions remain condensed throughout the cell cycle. Fac-ultative heterochromatin, on the other hand, is found at the developmentally regulated loci,where the chromatin state can change in response to cellular signals and gene activity. Itrepresents genomic regions in the nucleus of a eukaryotic cell that have the opportunity toadopt open or compact conformations within temporal and spatial contexts [Trojer and Rein-berg, 2007]. In general, heterochromatin serves important genome maintenance functions byimparting stability to the genome.
In vitro reconstitution of chromatin in low ionic strength conditions shows that the nucleo-somes are spaced by 10 to 90 bp of linker DNA and organized on a continuous DNA helix,in a linear string [Giannasca et al., 1993]. These arrays of regularly separated nucleosomesgive rise to the classical 11-nm "beads on a string" template [Figure 1.5], which is also calledthe primary structure of chromatin. The addition of divalent cations results in the furthercompaction of the arrays of nucleosomes into a more compact 30-nm fibre that is typicallyregarded as the secondary structure of chromatin [Robinson and Rhodes, 2006]; [Robinsonet al., 2006]. Binding of the linker histone, H1/H5, to the linker DNA, between the two adja-cent nucleosomes, stabilizes the structure of the nucleosome, and determines the trajectoryof the entering and exiting DNA [Sivolob and Prunell, 2003]. Consequently, the linker his-tone is likely to direct the relative positioning of successive nucleosomes and the pattern ofnucleosome-nucleosome contacts.

12 Chapter 1. Introduction
Figure 1.5: Higher order structuring of chromatin.
1.3.1 Cis VS Trans-Effects
Interestingly, the histone tails are essential for intra-molecular folding as well as fiber-fiberinteraction in vitro. These observations indicate that the histone tails are indeed mediatorsof key nucleosome interactions in vivo. The covalent modifications of histones along withincorporation of variant histones may lead to the rearrangement of 11-nm fiber by cis-effectsor trans-effects. The cis-effects are brought about by alteration in the physical properties ofmodified histone tails, such as modulation in the electrostatic charge or tail structure that,in turn, alters inter-nucleosomal contacts. A widely accepted example of this kind of effectis histone acetylation that neutralizes positive charges of highly basic histone tails, therebygenerating a local expansion of chromatin fiber, increasing access to various cellular ma-chineries to the DNA double helix [Gorisch et al., 2005]. Histone modifications may alsolead to the trans-effect by recruiting modification-binding proteins to the chromatin. This iskind of a "reading" phenomena where certain binding proteins, present in much larger com-plex of proteins, recognizes or have preferences for certain type of histone modifications,leading to "docking" of this complex onto the chromatin. The well known examples of thiskind of modulation include the bromodomain and chromodomain containing proteins thatread acetylated and methylated histone residues respectively. Histone modifications of bothHFD and tail region can also recruit ATP-dependent remodeling complexes to the 11-nm

1.3. Higher Order Chromatin Organization 13
Figure 1.6: Schematic representation of two different topologies for 30-nm chromatin fiber folding. Solenoid(a) VS Zig-zag (b) model. Adapted from [Robinson et al., 2006] and [Khorasanizadeh, 2004].
fiber, which brings about transitions from inactive euchromatin to transcriptionally activestate [Cosgrove et al., 2004].
1.3.2 Solenoid VS Zigzag Model
Although it is clear that the hierarchical formation of chromatin higher-order structure toeventually achieve the compacted chromosome, includes both intra- and inter-nucleosomeinteractions, intra- and inter-chromatin fiber interactions and interactions between chro-matin and chromatin architectural proteins, the interplay between these interactions andthe detailed arrangement of nucleosomes within chromatin higher-order structures, includ-ing 30 nm fibers, still remains largely uncharacterized. None-the-less, over the period ofyears, scientists have proposed two models to describe how the 30-nm chromatin fiber isorganized, i.e. the one-start helix or "solenoid model" and the two-start helix or "Zig-Zagmodel" [Robinson et al., 2006]; [Khorasanizadeh, 2004], [Figure 1.6]. The solenoids involve4-6 consecutive nucleosomes arranged in a turn of a helix that can condense into a super coilstructure with a pitch of 11 nm. This structure is predicted to be held together by histone-histone interactions. In the solenoid model, a nucleosome array coils up in such a mannerthat successive nucleosomes are adjacent in the compact structure and connected by variablelengths of interiorly bent linker DNA [Finch and Klug, 1976]. The two-start helix model isbased on a zigzag arrangement of nucleosomes, with essentially straight linker DNA con-necting nucleosomes on opposite sides of the fiber [Williams et al., 1986]; [Woodcock et al.,1993]. Biochemical and electron microscopy studies favors the zigzag model over solenoidmodel for the arrangement of nucleosomes in a 30-nm fiber. In the zigzag model, the en-try and exit paths of DNA were used to establish the relative positioning of nucleosomesand not protein-protein interaction between nucleosomes. Also, in zigzag model, alternatenucleosomes are physically closer than the adjacent nucleosomes.

14 Chapter 1. Introduction
1.3.3 Role of Linker Histone
Although condensation has been shown to be an intrinsic property of the nucleosome ar-rays, the presence of linker histone H1 or its variant H5 helps compaction of the chromatinfiber. Two models have been proposed regarding the compaction of 30-nm fiber, the firstone proposed a two-start crossed linker model derived from the crystal structure of a four-nucleosome core array lacking the linker histone [Schalch et al., 2005]. The second model wasbased on electron microscopy (EM) analysis and proposed an alternative one-start interdigi-tated solenoid structure [Robinson and Rhodes, 2006]; [Robinson et al., 2006]. These two op-posing models of 30-nm chromatin fiber based on the presence or absence of linker histonemight reflect the existence of at least two different levels of higher order chromatin structure:one highly compact structure containing the linker histone, which represents the 30 nm fiber,and a looser structure formed in the absence of linker histone. Both structures are likely tobe present in the nuclear environment, which promotes nucleosome-nucleosome contacts.Much evidence suggests the two structures represent two functional states, however, it re-mains to be elucidated how and if the two structural conformations of 30-nm chromatin fiberswitches topology.
1.3.4 Chromatin Domains and Chromosome Territories
The 30-nm fiber must compact at least a few hundred-folds to ultimately fit a total of about2 meters of human DNA within the nucleus [Figure 1.5]. Thus, considerably more levelsof higher-order chromatin organization exist leading to interphase and mitotic chromatinstates. Organization into larger looped chromatin domains (300-700 nm) occurs through an-choring the chromatin fiber to the nuclear periphery or other nuclear scaffolds via chromatinassociated proteins such as nuclear laminins. The association of these chromatin domainsto particular regions of the nucleus may lead to the formation of chromosome territoriesbut how these associations are controlled and how they affect the genome regulation needsfurther attention by the research community. Nonetheless, there is an increasing body ofevidence higlighting the correlations of active and silent chromatin configurations with aparticular nuclear territory [Cremer and Cremer, 2001]; [Chakalova et al., 2005].
The faithful segregation of chromosomes during mitosis or meiosis depends upon the highdegree of condensation of chromatin. This condensation leads to an astonishing reorganiza-tion of 2 meters of nuclear DNA into 1.5 µM diamater discrete chromosomes. There is about10,000-fold compaction that is achieved by the hyperphosphorylation of histone H3 (Serines10 and 28) and linker histone H1, and the ATP-dependent action of condensin and cohesincomplexes, and topoisomerase II.
Apart from overall high degree of condensation of chromatin during metaphase into distinctchromosomes, there also exist specialized chromosome domains, for instance, telomeres andcentromeres, which serve dedicated functions in chromosome dynamics and faithful chro-mosome segregation. Telomeres represent a region of repetitive DNA that mark the ends ofchromosome and provide protection and devise a solution for proper replication of the DNA

1.4. Modifications of Chromatin Structure 15
ends. Centromeres represent a region of DNA in the middle of chromosome and provide anattachment anchor for spindle microtubules during cell division. Both of these regions arestrongly heterochromatic and have distinct molecular signatures e.g., hypoacetylated his-tones and presence of histone H3 variant CenpA in the centromeres, which plays an essentialrole in chromosome segregation. Intriguingly, its the epigenetic signatures in these domainsand not the DNA sequence, which mark these domains.
1.4 Modifications of Chromatin Structure
The structure of chromatin is tightly regulated in the eukaryotic nuclei. Being the buildingblock of the eukaryotic chromatin, the nucleosome plays an essential role in the major nu-clear functions (e.g. transcription, replication, recombination and DNA damage response &repair). Packing into chromatin represents a common obstacle for most of the DNA based cel-lular processes. To overcome this obstacle, eukaryotic cells developed mechanisms to "open"or remodel chromatin to make it accessible to cellular machineries that bring about the abovementioned functions. Three different ways for the cells to act on the nucleosomes have beendescribed so far: post-translational modifications of the histones (mainly their tails), ATP-dependent nucleosome remodeling and incorporation of alternative histone variants. Con-sistent with the notion that chromatin provides an additional level of control of gene expres-sion in eukaryotes, many regulators of transcription have been shown to have chromatinmodifying activity or to be able to recruit various modifiers of chromatin.
1.4.1 Histone Post-translational Modifications
Histones can be subject to a rich variety of post-translational modifications (PTM) [All-frey et al., 1964] that are central to the regulation of chromatin dynamics, and hence, reg-ulate many biological processes invloving chromatin, such as replication, repair, recombina-tion, transcription, and genome integrity [Ehrenhofer-Murray, 2004]; [Groth et al., 2007]; [Liet al., 2007]; [Kouzarides, 2007a]. Although there are at least nine distinct types of modi-fications found on histones, namely, acetylation, methylation, phosphorylation, ubiquitina-tion, sumoylation, ADP ribosylation, deimination, proline isomerization, and most recentlyadded to this list, β-N-acetylglucosamine, the most studied among them are the first four[Figure1.7]; [Table1.2], reviewed in [Bannister and Kouzarides, 2011]. Most of these modifi-cations target the protruding amino or carboxy terminal tails of the core histones, however,more recently some modifications have also been described in the globular domain (HFD).A relatively different kind of PTM has also been detected in histones, where there is removalof a part of histone N-terminal tail, a process referred to as "tail clipping" [Santos-Rosa et al.,2009]. There are more than 60 different residues on histones which have found to be modi-fied [Kouzarides, 2007a], however, this number may represent only a tip of the iceberg andwith every passing day, with the recent application of mass spectrometry to histone biology,the list is continuously expanding. This vast array of modifications gives enormous potential

16 Chapter 1. Introduction
for their biological readouts. It is also worth noting that the timing and presence of differentmodifications on different histones depends upon the signaling conditions within the cell.
Figure 1.7: Histone modifications chart. All histones are subject to post-translational modifications. Themain PTMs are depicted in this figure: acetylation(blue), methylation (red), phosphorylation (yellow) andubiquitination (green). The number in gray under each amino acid represents its position in the sequence.
Considerable amounts of work has been done in the past decade to elucidate the enzymesystems behind the "writing" and "removal" of these histone modifications. The biochemi-cal and genetic studies have shown a number of chromatin modifying enzymes, being partof large multi-subunit complexes, can catalyze incorporation or removal of covalent mod-ifications on histones. Many of them have remarkable specificity to target residue and thecellular context. The identification of these enzyme groups have lead to the idea of histonemodification "writers" and "erasers" along with a third class of proteins the "readers", whichrecognize a particular modification to bring about its function.
1.4.2 Variant Histones
Studies of chromatin as a carrier of epigenetic information were mostly focused on DNAmethylation and histone modifications as epigenetic marks on chromatin. An additionallayer of complexity has been added to chromatin dynamics with the renewed interest inalternative variants of the canonical core histones. These paralogues, now known as histonevariants, share the same overall structure with the canonical histones, displaying for instance

1.4. Modifications of Chromatin Structure 17
Table 1.2: Different classes of modifications identified on histones.
Chromatin Modifications Residues Modified Functions Regulated
Acetylation K-ac Transcription, Repair,Replication, Condensation
Methylation (lysines) K-me1 K-me2 K-me3 Transcription, RepairMethylation (arginines) R-me1 R-me2a R-me2s TranscriptionPhosphorylation S-ph T-ph Transcription, Repair,
CondensationUbiquitylation K-ub Transcription, RepairSumoylation K-su TranscriptionADP ribosylation E-ar TranscriptionDeimination R > Cit TranscriptionProline Isomerization P-cis > P-trans Transcriptionβ-N-acetylglucosamine S-O-GlcNAc/T-O-GlcNAc Mitosis
the histone fold, but differ in terms of primary sequence from their canonical relatives [Fig-ure 1.8]. They are found in all eukaryotes and their presence was found to be correlated withparticular regions in the genome. Unlike canonical histones which are assembled into bulkchromatin behind the replication fork, variant histones seem to be implicated in replace-ment processes under certain conditions. Furthermore, at least some of the variant histonesappear to be incorporated at specific sites, replacing canonical histones. In addition, thisdeposition seems to occur outside of S-phase, unlike for the canonical histones. The substi-tution of a canonical histone by a variant will then create a new nucleoprotein complex, withan alternate structure and stability. Thus, the presence of such variant histones is likely toadd another level of complexity, and therefore regulation to the nucleosome arrays. Givenvery stable association of histones with DNA that can last through all stages of cell cycle,some alternative histone variants also present good candidates for an epigenetic marking ofgenome.
Histone H3 Variants
The number of histone H3 variants varies among species. Today, we can distinguish fivevariants in mammals: H3.1 and H3.2 are the replicative histones expressed during the Sphase, H3.3 is the replacement histone expressed throughout the cell cycle, CenpA is theH3 paralog found in centromeric regions [Palmer et al., 1991]; [Perpelescu and Fukagawa,2011], and H3t the testis-specific histone which is not present in somatic cells [Govin et al.,2005]. Human H3.1 and H3.2 are 99% identical; and H3.3 is 96% identical to H3.1, differing atfive amino acid positions. Human CenpA is highly divergent and shares only 46% identitywith H3.1, whereas H3t differs from H3.1 by just four amino acids (reviewed in [Loyola andAlmouzni, 2007]).
How these variants could contribute in establishing epigenetic information and how theycould ensure its maintenance is not completely elucidated. However, in the past years many

18 Chapter 1. Introduction
Figure 1.8: Proteins domain structure of canonical histones and histone variants. The regions of proteinsthat differ in histone variants are shown in red. Adapted from [Allis et al., 2007].
reports have shed light on this issue, proving that these histone variants play an importantrole in alternative chromatin states’ formation and some constitute marks stably transmittedfrom one cell generation to another.
I CenpA
During mitosis, chromosome segregation requires alignment of all the chromosomesat the cell equator. This alignment is due to the attachment of the microtubules ofthe mitotic spindle to centromeres and this process is controlled by kinetochores. Noconsensus DNA sequence could be identified in centromeric regions. However, mem-bers of the CenH3 family of histone H3 variants including CenpA in human, Cidin Drosophila and Cse4p in yeast have been found in all functional centromeres ineukaryotes. Furthermore, CenpA inactivation has been shown to impair kinetochoreformation and chromosome segregation in yeast, Drosophila and mammals [Sullivan,2002]; [Santaguida and Musacchio, 2009]. In addition, CenpA knock out experimentsin mice resulted in mitotic deficiencies and in embryonic lethality, arguing for a keyrole of this variant in mitosis [Howman et al., 2000]. Despite large divergence in cen-tromere DNA sequences across organisms, CENPs are highly conserved proteins [Ma-lik and Henikoff, 2009]. Human centromeric nucleosomes are thought to be composedof eight histones, and most are homotypic octamers containing two copies of CENPA.More recent work, however, has shown that about 10% of human centromeric nucleo-

1.4. Modifications of Chromatin Structure 19
somes form a heterotypic octamer containing one CENPA-containing histone and onecanonical H3- containing histone [Foltz et al., 2006]. CENPA is a variant of histone H3,and the homology is found mainly at the a-helical carboxy-terminal histone-fold do-main [Luger et al., 1997]. The N-terminal tail of CENPA is highly variable betweenspecies and is required to recruit kinetochore proteins to the centromere [Van Hooseret al., 2001]; [Henikoff and Dalal, 2005].
Centromeric chromatin is organized as interspersed stretches of CenH3- and H3- con-taining nucleosomes [Blower et al., 2002]. However, it is still not clear how CenpAassembly is maintained at pre-existing CenpA containing sites. One way to depositCenH3 in the correspondent sites could be its incorporation following nucleosomeloss due to anaphase tension on CenH3 containing chromatin [Ahmad and Henikoff,2002a]; [Mellone and Allshire, 2003]. The other explanation is that a particular pat-tern of modification in interspersed and flanking stretches of nucleosomes predisposecentromeres for deposition of CenH3 [Sullivan and Karpen, 2004]. More recent reportsidentify HJURP as a chaperone for soluble CENP-A [Dunleavy et al., 2009]; [Foltz et al.,2009]; [Shuaib et al., 2010]. Once assembled on DNA and flanked by H3 chromatinstretches, CENP-A nucleosomes might impose unusual chromatin arrangements andtorsions where they (and implicitly the CATD) are more exposed. It might be that thisspecial distribution provides the apparent difference between the two types of nucleo-somes, recognizable by certain CENPs and remodeling factors [Perpelescu and Fuka-gawa, 2011].
II H3.3
The H3.3 variant is nearly identical to canonical histones H3, with only a four aminoacid difference in Drosophila and respectively 5 and 4 amino acid difference with H3.2and H3.1 in mammals. Yet, H3.3 function is different from canonical histone H3.
H3.3 at active sites
Back in 1984, H3S, a H3.3-like histone, was only found in the active macronucleusin ciliates whereas H3F, the canonical H3-like histone was found in the micronucleuswhere chromatin is usually condensed [Allis and Wiggins, 1984]. More recently, usinghistones fused with green fluorescent protein GFP, H3.3 was shown to be depositedthroughout the cell cycle including S phase in Drosophila cells, whereas canonical hi-stone H3 deposition was seen only during replication [Ahmad and Henikoff, 2002b].Furthermore, in the same study it was shown that in Drosophila H3.3 deposition lo-calizes to active rDNA arrays and to euchromatin but not heterochromatin. In humancells, H3.3 deposition took place on transgene array when its transcription was ac-tivated [Janicki et al., 2004]. The concomitant loss of heterochromatic marks in bothDrosophila and human cells reveals that H3.3 takes place following removal of pre-existing histones [Loppin et al., 2005]. H3.3 enrichment at promoter regions has beenobserved not only at active genes but also at inactive genes, possibly accounting fora "poised" state of these genes [Mito et al., 2007]; [Tamura et al., 2009]. Furthermore,H3 replacement also occurs at genic and intergenic regulatory regions in various meta-zoans [Mito et al., 2007]; [Nakayama et al., 2007]; [Jin et al., 2009].

20 Chapter 1. Introduction
H3.3 histone was extracted from a Drosophila cell line and mass spectrometry anal-ysis revealed that H3.3 is enriched in marks associated with active chromatin andis deprived of marks of repressed chromatin such as di-methyl lysine 9 [McKittricket al., 2004]. Consistent with these results, microarrays genome-scale profiling follow-ing biotin-H3 and biotin-H3.3 pull down demonstrated that H3.3 deposition occursmainly on sites enriched in methylated lysine 4 of histone H3, as well as in RNA poly-merase II [Mito et al., 2005].
A similar study was conducted on mammalian cells. All three histones, H3.1, H3.2and H3.3 showed different patterns of modifications, which suggests that they havedifferent biological functions. As in the Drosophila case, the majority of modificationsdetected on H3.3 were marks of active chromatin (such as methylation of lysine 4 andlysine 79 and acetylation of lysine 14, lysine 18 and lysine 23) whereas H3.2 showedmostly silencing modifications [Hake and Allis, 2006]. Interestingly, H3.1 modificationpattern comprised marks of both active and repressed chromatin, though the latterwere not the same as those of H3.2. These data suggest that mammalian H3.1 and H3.2should not be treated as equivalent proteins.
Taken together, these results might suggest that H3.3 plays a causal role in transcrip-tional activation. However, H3.3 is the dominant H3-subtype in non dividing differen-tiated cells in vertebrates [Pina and Suau, 1987]; [Urban and Zweidler, 1983], replacingup to 80% of total histones in terminally differentiated cells. It also represents 25% of allhistone H3 in Drosophila cells. Considering the fact that only a small percentage of thegenome is actively transcribed, these results strongly suggest that H3.3 presence can-not be absolutely correlated with active transcription. Another argument towards thenotion that H3.3 deposition is not necessarily coupled with transcription comes fromthe studies of HIRA-H3.3 role in fertilized oocyte development (see below). These factssuggest an alternative explanation of the correlation between H3.3 and actively tran-scribed sites of genome. The relative enrichment of H3.3 on active chromatin could thedue to two factors: 1. More dynamic state of active chromatin, which renders it moreprone to histone exchange, and 2. In non-replicating cells H3.3 is the only histone typethat can be involved in the replacement. The former and latter explanations do notnecessarily exclude one another, but both possibilities have to be taken into account.
Preexisting modifications before nucleosome assembly are important to evaluate if theenzyme target specific modified substrates. In order to have a better understandingon this issue, H3.1 and H3.3 post translational modifications were characterized be-fore and after chromatin assembly. Pre-deposited and nucleosomal histones showeddifferent patterns. A typical signature of non nucleosomal H3/H4 is the enrichment inacetylated lysine 5 and 12 of the histone H4, regardless of the H3 variant present in thedimer. Moreover, H3.1 and H3.3 are deficient in methylation marks, with the exceptionof lysine 9 [Loyola et al., 2006]. These results suggest that the establishment of a givenmodification pattern does not depend only on a specific variant when it is soluble, butis rather affected by the local environment where the histone is incorporated.

1.4. Modifications of Chromatin Structure 21
Deposition onto chromatin
As described above, H3 and H3.3 containing complexes comprise different proteincomposition and chromatin assembly factors [Tagami et al., 2004]. CAF-1 copurifieswith H3.1 and is responsible for its DNA-synthesis/replication-coupled (RC) depen-dent deposition. HIRA was found in H3.3 complex and promotes its incorporationinto DNA in a replication-independent (RI) manner. Furthermore, the chaperone ASF1was also shown to be necessary for an efficient nucleosome assembly in vivo [Galvaniet al., 2008]. Authors generated H3.1 and H3.3 mutants unable to interact with ASF1Aand ASF1B. Although these mutants still bind to their respective chaperones, CAF1and HIRA , they were not effectively incorporated onto DNA. While HIRA is requiredfor H3.3 deposition at genic regions in mouse embryonic stem (ES) cells, H3.3 enrich-ment at telomeres and most regulatory elements is HIRA-independent [Goldberg et al.,2010]. Instead, the SWI/SNF-type chromatin remodeler ATRX mediates localization ofH3.3 to telomeres [Goldberg et al., 2010]; [Wong et al., 2010].
To test how the ability to participate in RI assembly depends on the aminoacid differ-ences in H3 and H3.3 sequences, Henikoff and coworkers examined the effect of differ-ent aminoacid replacement in histones’ sequences. Changing any one of the residues inH3.3 to its H3 counterpart did not affect the RI assembly of H3.3. Interestingly, chang-ing any one of the residues in H3 to H3.3 counterpart relieved the block to RI assemblyand allowed histone H3 deposition outside of S phase [Ahmad and Henikoff, 2002b].These findings suggested that RI deposition is the default pathway and that H3 is ac-tively recognized and blocked from the RI deposition. This conclusion is supported bythe fact that in the yeast S. cerevisiae, the only H3 histone involved in regular chro-matin structure is similar to H3.3, reinforcing the notion that H3.3 assembly is the de-fault H3 deposition pathway. Contrary to what was believed previously [Wolffe, 1992],it was shown that the H3/H4 are deposited as dimers and not as tetramers [Tagamiet al., 2004], leading to the proposal of a semi-conservative mechanism of nucleo-some duplication. On the other hand, it was also shown that the H3 and H3.3 vari-ants form so called homotypic nucleosomes, having both H3 molecules of the sametype in the histone octamer. These findings bear on the possibility that, in addition topost-translation histone modifications and DNA methylation, the ’epigenetic templat-ing’ mechanism can also work for chromatin marks of a different kind, e.g., varianthistones. Since the new H3 histones are deposited on DNA only in the form of H3/H4dimers, the deposition machinery must match the types of new and old H3 histones inorder to keep the nucleosome homotypic.
H3.3 in development
As mentioned earlier, fertilization study in D. melanogaster revealed an important roleof the HIRA-H3.3 deposition pathway as a way to replace protamines to histones inthe male pronucleus [Loppin et al., 2005]. Consistent with this result, H3.3 is presentin the mice oocytes as a maternal factor and is incorporated into the male pronucleusgenome before its activation [Torres-Padilla et al., 2006]. As mentioned before, thesedata strongly suggest that H3.3 assembly could take place independent from transcrip-

22 Chapter 1. Introduction
tion. Unlike in mice and flies, H3.3 is incorporated in both male and female pronucleiin C. elegans, suggesting a need to distinguish between paternal and maternal genomein mice and flies but not in worms [Ooi et al., 2006]. Despite potential compensatorymechanisms in flies, HIRA and H3.3 play crucial roles in sexual reproduction in allstudied metazoans [Bonnefoy et al., 2007]; [Sakai et al., 2009]; [Hodl and Basler, 2009].Both male and female H3.3 null flies are sterile. In mice, the hypomorphic gene trap ofH3.3A also led to male sub-fertility [Couldrey et al., 1999].
Histone H2A Variants
The H2A family contains so far four subfamilies that differ in terms of sequence and length.In mammals, the members of the first subfamily, H2A.1 and H2A.2, are synthesized mostlyduring S phase of the cell cycle, in parallel with DNA replication. Unlike the canonical his-tones, the members of two other subfamilies, H2AZ and H2AX are synthesized at a constantlow level throughout the cell cycle. Interestingly, these two proteins are also synthesized inquiescent cells, but at a significantly lower level than in proliferating cells. Finally, the lastsubfamily members, macroH2A1 and macroH2A2, have approximately three times the sizeof histone H2A. The first third of the proteins share approximately 65% homology with thesequence of histone H2A. The remaining two thirds of the proteins do not contain histone-fold motives and share 84% homology.
Unlike the genes encoding the canonical histones and histone H1, the variant histones (H2AZ,H2AX and macroH2A) are encoded by single copy genes, containing introns. These genesproduce polyadenylated mRNAs with longer 5’ and 3’ untranslated regions than those ofthe canonical histones mRNAs.
I H2AX
H2AX or its homologues are found throughout evolution among animals, plants, fungiand protists, arguing for an important role for this histone variant. In mammals, it ispresent in all cell types. This H2A variant contains a conserved SQ(E,D)(I,L,F,Y) motifin its C-terminal domain.
As mentioned before, H2AX is encoded by a unique gene, however, it produces twomRNAs. One of these RNAs is polyadenylated mRNA with long 5’- and 3’-untranslatedregions which is produced in a replication independent manner, characteristic for analternative histone variant. The second product is a shorter mRNA produced in replica-tion linked manner [Mannironi et al., 1989]. H2AX mRNA also displays the conservedmotives needed to process the replication dependent canonical histones. Thus, H2AXgene expression combines features of both canonical and alternative histones.
H2AX in DNA-damage repair
H2AX has been shown to undergo several post-translational modifications, includingacetylation, ADP-ribosylation and phosphorylation. The phosphorylation of serine 139of the C-terminal tail of H2AX by the PI3K-related ATM kinase (ataxia teleangiectasia

1.4. Modifications of Chromatin Structure 23
mutated) seems to be important for DNA repair by non-homologous end joining [Ro-gakou et al., 1998]. After introduction of DNA double strand breaks by ionizing ra-diations, H2AX is rapidly phosphorylated (H2AX) at the sites of the lesions, alongwith recruitment to these lesions of proteins involved in DNA-damage repair, such asmembers of the MRN complex (Mrell/Rad50/Nbs1) , BRCA1 and p53BP1 (Schultz etal., 2000). Furthermore, H2AX phosphorylation is apparently involved in this process,as the recruitment is inhibited when the cells are treated with inhibitors of PI3K ki-nase family, which includes ATM kinase [Paull et al., 2000]. Also, the kinetic of H2AXphosphorylation is similar to the kinetics of the recruitment of the repair complexesand to the kinetics of the DSB repair. It is apparent within a minute and reaches a peakat approximately ten minutes after irradiation. After thirty minutes, H2AX is dephos-phorylated with a half-life of two hours. Thus, H2AX is likely to play a key role inDNA-damage repair initiation and control (Discussed later [Section 1.5.2]).
H2AX in normal cell processes
Interestingly, besides environmentally and metabolically caused DNA double strandbreaks, H2AX also seems to play a role in several eukaryotic processes involving gen-eration of double strand breaks, such as recombination. Foci of H2AX have been foundaround double strand breaks during meiosis in germ cells [Mahadevaiah et al., 2001].In addition, an accumulation of H2AX has been reported in B and T cell nuclei duringimmune system development. H2AX is targeted to the locus of the receptor, which issubject to V(D)J recombination to form a genomic library of variable regions [Soulas-Sprauel et al., 2007]. An accumulation of H2AX has also been observed in T lympho-cytes at the locus of the T cell receptor (TCR) , also subject to rearrangements. H2AXknock out in mice resulted in an alteration of these recombinations, suggesting an im-portant function of H2AX in this process [Petersen et al., 2001].
Finally, H2AX accumulation has also been observed at the early stages of DNA frag-mentation during apoptosis, when high molecular weight DNA fragments appear asa result of caspase-activated DNase. In addition to the replication-independent pro-cesses described above, H2AX could take part in the control of DNA replication. Whenreplication is inhibited by hydroxyurea, H2AX is phosphorylated by ATR kinase andH2AX is then accumulated in the arrested replication forks [Ward and Chen, 2001]. Asdescribed above, H2AX is recruited to DNA double strand breaks of diverse origins.Because H2AX is a histone, it is tightly bound to DNA when incorporated into nucleo-somes, and is likely to function as an anchor for mobile factors when phosphorylated.
II macroH2A
The macroH2A variant differs from the other H2A variants by its unusual size, 372amino acids, which makes it approximately three times larger than canonical histoneH2A. The defining feature of this histone variant is the 30 kDa carboxyl-terminal glob-ular domain called a macro domain. MacroH2A is the founding member of a largefamily of macro domain-containing proteins [Kraus, 2009]. MacroH2A can be dividedin two parts; the first third of the protein displays histone fold domains, and shares 64%homology with the sequence of canonical H2A. The remaining two thirds of the protein

24 Chapter 1. Introduction
are characterized by the absence of histone fold domains. Two sub-types of macroH2Ahave been identified so far; macroH2A1 and macroH2A2, each one encoded by a sin-gle gene containing eight exons. Furthermore, macroH2A1 gene is coding for two iso-forms, named macroH2A1.1 and macroH2A1.2, resulting from an alternative splicing.macroH2A1 and macroH2A2 share 84% homology in the histone domain, and 68%in the non-histone domain. In addition, macroH2A1.1 and 1.2 sequences display onlya twenty amino acid difference in the non-histone domain. The non-histone regionof the macroH2A variants is characterized by the presence of a leucine zipper motif,which is also found in many transcription-related factors, arguing for a potential roleof these variants in the control of transcription. Finally, all isoforms are evolutionarilyconserved [Pehrson et al., 1997].
MacroH2A1.1 is found in quiescent cells, whereas macroH2A1.2 is generally expressedin proliferating cells [Pehrson et al., 1997], suggesting a different function for these sub-types. Interestingly, macroH2A, which is present both in male and female cell nuclei,seems to be more concentrated in the area of the inactive X chromosome in femalecells [Mermoud et al., 1999]. However, the association of macroH2A with the inactiveX chromosome seems to occur after the proper extinction mechanism. In addition, aloss of macroH2A at the inactive X chromosome has been reported in several tumorcell lines, indicating a potential role in the maintenance of the inactive state of the Xchromosome. Finally, the presence of macroH2A throughout the nucleus in male andfemale cells seems to indicate a more general role for macroH2A. Recent studies haveshown the involvement of macroH2A in repression of transcription. The non-histonepart of macroH2A has been shown to repress transcription when targeted near an ac-tive promoter [Ouararhni et al., 2006]; [Buschbeck et al., 2009]. In addition, macroH2A,when incorporated into nucleosomes, prevents the recruitment of transcription factorsand impairs remodeling by SWI/SNF complex, thus interfering with transcriptionalactivation [Angelov et al., 2003].
III H2A.Bbd
In contrast to the large C-terminal macrodomain of mH2As, the mammal specific H2ABarr body-deficient (H2A.Bbd) has a short C-terminus with a truncation of the dock-ing domain. It is only 48% identical to canonical H2A and lacks the residues that aremodified in other H2As. H2A.Bbd seems to be associated with active chromatin, beingdeficient on Xi chromosomes in fibroblasts and coinciding cytologically with acetylatedH4 [Chadwick and Willard, 2001].
In A431 human cell lines, H2A.Bbd tagged with green fluorescent protein (H2A.BbdGFP) is exchanged more quickly in the nucleosome than H2AGFP [Gautier et al., 2004].H2A.BbdH2B are preferentially exchanged, in vitro, by nucleosome assembly protein1-like 1 (NAP1L1) for H2AH2B dimers in reconstituted nucleosomes, and this is moreefficient in H3.3 nucleosomes than H3 nucleosomes [Okuwaki et al., 2005]. Reconsti-tuted H2A.Bbd nucleosomes are unstable without DNA, protect only 110130 bp ofDNA, have more divergently oriented DNA ends (180◦) than canonical nucleosomesand do not undergo remodeling by SWI/SNF properties that are largely attributable to

1.4. Modifications of Chromatin Structure 25
the H2A.Bbd docking domain [Gonzalez-Romero et al., 2008]. H2A.Bbd has a smalleracidic patch than H2A, which inhibits the folding of reconstituted H2A.Bbd nucleo-some arrays into 30-nm fibers and reduces the ability of these arrays to inhibit tran-scription [Zhou et al., 2007]. Despite the evidence that H2A.Bbd forms accessible chro-matin, no specific function has yet been identified for this interesting variant.
The phylogenetic analyses of canonical histones and replacement histone variants re-vealed that histone H2A.Bbd is a highly variable quickly evolving mammalian replace-ment histone variant, in striking contrast to all other histones [Malik and Henikoff,2003]. The incorporation of H2A.Bbd variant into the nucleosomes result in an un-folded highly unstable nucleoprotein complex, which resembles the previously de-scribed hyperacetylated nucleosomes associated with transcriptionally active regionsof the genome. Nevertheless, the structure of nucleosome core particles reconstitutedfrom H2A.Bbd is not affected by the presence of a hyperacetylated histone comple-ment. This suggests that replacement by H2A.Bbd provides an alternative mechanismto unfold chromatin structure, possibly in euchromatic regions, in a way that is notdependent on acetylation [Eirin-Lopez et al., 2008]
IV H2AZ
The histone variant H2AZ has been found in organisms ranging from protists likeTetrahymena to higher eukaryotes, and is highly conserved, with approximately 90%homology in the peptide sequence in these organisms. However, despite a similarstructure, H2AZ peptide sequence has only 60% homology with the one of histoneH2A. The H2AZ variant is referred to as HV1 in Tetrahymena, HTZ1 or HTA3 in yeast,H2AvD in Drosophila, H2AZ/F in human. For clarity, they will be all referred to asH2AZ.
Structural characteristics of H2AZ
The crystal structure of H2AZ-containing nucleosomes has been resolved and shows acore particle surprisingly similar to the one of H2A-containing nucleosomes, consider-ing the numerous differences in peptide sequence between the two proteins. Actually,no apparent changes in the path of the DNA double helix or in protein-DNA interac-tions can be observed [Suto et al., 2000]. However, a subset of discrete differences existsbetween canonical nucleosomes and H2AZ-containing nucleosomes in the tetramer-docking domain, where H2AZ-H2B dimer interfaces with H3-H4 tetramer. In H2AZcontaining nucleosomes, the overall shape of the interaction domain is conserved, aswell as most of the intermolecular hydrogen bonds, but the substitution of a glutamine(Gln 104 in H2A) by a glycine (Gly 106 in H2AZ) induces the loss of three hydrogenbonds, thus slightly destabilizing the interaction between H2AZ and H3 compared toH2A and H3. In addition, unlike H2A, H2AZ displays two histidine residues, capa-ble of binding a metallic ion in an area of the tetramer-docking domain located at thesurface of the nucleosome. The presence of this ion is likely to create an interactiondomain with H2AZ-specific interacting proteins. Additional differences exist in theacidic patch formed between amino acids from the docking domain of H2A/H2AZand H2B at the surface of the nucleosome. This acidic patch seems to be involved
26 Chapter 1. Introduction
in protein-protein interactions, possibly with histone H4 basic tails from neighboringnucleosomes, making it an important feature of the nucleosome surface [Luger andRichmond, 1998]. In the case of H2AZ, the patch appears to be extended, resulting ina larger acidic surface across the face of the H2AZ-containing histone octamer [Sutoet al., 2000].
Interestingly, H2AZ appears to play an essential role in all the tested organisms. Inac-tivation of the gene coding for H2AZ leads to a decreased growth rate in yeast and todeath in Tetrahymena, Drosophila, Mouse and Xenopus leavis [Liu et al., 1996]; [Clark-son et al., 1999]; [Jackson and Gorovsky, 2000]; [Faast et al., 2001]; [Ridgway et al.,2004]. Furthermore, the replacement of the tetramer-interacting region of H2AZ bythe one from H2A in Drosophila has been shown to impair fly development, arguingfor different roles of H2A and H2AZ in cellular mechanisms, and thus demonstrat-ing the importance of the structural differences between the two proteins. In addition,Drosophila null embryos could be rescued by expressing chimeric constructs includingH2AZ tetramer-binding domain. Taken together, these observations indicate a key rolefor H2AZ specific tetramer-binding domain in mechanisms related to cell proliferationand development.
Recent studies in Tetrahymena showed the importance of acetylation of the amino-terminal tail of H2AZ, which includes six lysines instead of the three normally presentin H2A. Complete replacement of the lysine residues by arginines, which preventsacetylation, or by glutamines, mimicking acetylated lysines, was lethal or led to re-duced growth rate, indicating the need of H2AZ acetylation to ensure its proper cel-lular functions [Ren and Gorovsky, 2001]; [Ren and Gorovsky, 2003]. Because of theproximity of the lysines in the amino-terminal tail of H2AZ, it has been hypothesizedthat this area could behave as a charge patch. The reduction of the positive charge ofthe histone tail by acetylation could result in a reduced association of H2AZ tail withDNA, making it more accessible for DNA-binding proteins.
In addition, sedimentation and ultra-centrifugation analysis conducted on reconsti-tuted chromatin suggest that H2AZ has a destabilizing effect on intranucleosomalhistone-histone interactions [Abbott et al., 2001], and prevents internucleosomal inter-actions [Fan et al., 2002]. Furthermore, H2AZ has been shown to influence nucleosomepositioning in vitro, which may be part of its biological function in vivo.
Finally, the L1 loop domain, which mediates interactions between H2A molecules inthe same nucleosome, is altered in the case of H2AZ in such a way that it may favorthe interaction with another H2AZ molecule. The pairing of one H2A and one H2AZmolecule in the same nucleosome could lead to sterical clashes, and no stabilizing in-teraction could be formed between the two molecules [Suto et al., 2000]. Interestingly,the same observation can be made about the L1 loop of macroH2A [Pehrson and Fuji,1998], suggesting that the L1 loop could ensure the incorporation of only one type ofH2A histone into one nucleosome. However, this remains to be demonstrated in vivo.
H2AZ and transcriptional activation
Early observations in Tetrahymena showed that H2AZ was present in the transcrip-

1.4. Modifications of Chromatin Structure 27
tionally active macronucleus and absent from the micronucleus. In addition, duringearly conjugation, H2AZ was detected in the micronucleus just before its transcrip-tional activation [Stargell et al., 1993], thus linking H2AZ to active chromatin. Furtherstudies by immunofluorescence on polytene chromosomes and chromatin immuno-precipitation (ChIP) in diploid chromosomes in D. melanogaster showed that H2AZwas widely but non-randomly distributed across the genome. H2AZ was found tobe associated with thousand euchromatic bands, but also with the heterochromaticchromocentre of polytene chromosomes. Furthermore, the ChIP analysis showed thatH2AZ was found both in transcribed and non-transcribed genes, as well as in non-coding euchromatic and heterochromatic sequences [Leach et al., 2000]. Similar stud-ies conducted in S. cerevisiae expressing a HA-tagged version of H2AZ showed anon-uniform pattern of distribution of the variant across the PHO5 and GAL1 loci,with a preferential localization in the promoter regions of these genes [Santistebanet al., 2000]. In addition, H2AZ was preferentially found at these locations under re-pressing conditions, and was decreased after activation, suggesting a role for H2AZ inthe establishment of transcription. Furthermore, deletion of H2AZ gene compromisedtranscriptional activation of these genes. Other experiments showed a defect in the re-cruitment of RNA polymerase II and the TATA-binding protein on GAL1 promoter,in strains lacking H2AZ gene [Adam et al., 2001], arguing for a role for H2AZ in therecruitment of the basal transcriptional machinery, and thus in the establishment oftranscription. Finally, the transcriptional activation defect observed for the deletion ofH2AZ gene was further exacerbated when associated with the deletion of GCN5 geneor SNF2 gene, involved in histone acetylation or chromatin remodeling, indicating apartially redundant role of these three chromatin modification pathways in the estab-lishment of transcriptionally active chromatin [Santisteban et al., 2000].
According to these observations, H2AZ could participate, along with ATP-dependentchromatin remodelling complexes and histone modification complexes, in the estab-lishment of higher-order chromatin domains poised for activation. In addition, H2AZcould also serve to recruit the basal transcription complex.
H2AZ and transcriptional repression
Surprisingly, H2AZ was also reported to be involved in transcriptional repression[Svotelis et al., 2009]. Over-expression of H2AZ was able to restore silencing in Sir1-impaired cells. Furthermore, H2AZ was shown to be present at the HMR locus and intelomeres by chromatin immunoprecipitation, and the deletion of H2AZ led to a lossof silencing at the two loci [Dhillon and Kamakaka, 2000]. These results are consistentwith the presence of H2AZ in non-transcribed genes and in non-coding heterochro-matic regions in Drosophila [Leach et al., 2000] and in pericentric heterochromatin dur-ing early mammalian development [Rangasamy et al., 2003], and suggest that H2AZcan be involved both in gene activation and gene silencing. Furthermore, the H2AZ-containing nucleosomes are more stable than canonical ones. According to the authorsof this finding, this stabilisation could potentially attenuate the transcription processesby impeding the displacement of a histone dimer [Park et al., 2004].

28 Chapter 1. Introduction
Interestingly, identification of H2AZ-regulated genes by whole-genome microarrayanalysis in yeast showed that H2AZ-activated genes are highly enriched near telom-eres and often clustered together. Furthermore, H2AZ was found to antagonize Sir-dependent silencing in telomeric locations and in regions flanking the HMR locus. InH2AZ-impaired cells, Sir proteins were shown to spread outside the HMR locus in theneighboring euchromatic regions. In addition, this spreading was concomitant withectopic transcriptional silencing and with the appearance of histone acetylation andmethylation patterns characteristic of heterochromatin formation.
According to all these observations, H2AZ seems to play a critical role in gene expres-sion, maybe by protecting euchromatic genes from silencing. This anti-silencing effectcould be due to the establishment of permissive higher-order chromatin structure, re-sulting from the destabilizing effect of H2AZ on intra- and inter-nucleosomal interac-tions [Abbott et al., 2001]; [Fan et al., 2002]. However, the exact function of H2AZ intranscriptional activation and silencing remains to be determined.
1.4.3 Histone Modifying Enzymes
Histone modifying enzymes catalyze the addition or removal of a large array of covalentmodifications on histone and non-histone proteins. These enzymes can be classified intoseveral distinct classes such as, acetyltransferases, deacetylases, lysine methyltransferases,lysine demethylases, arginine methyltransferases, serine/threonine kinases, ubiquitilases,sumoylases, deiminases, and proline isomerases [Figure 1.9]; [Kouzarides, 2007b]. Histonemodifications have found to be dynamic, and enzymes that remove the modification havealso been identified. Arginine methylation is an exception as despite of being dynamic, asgenerally, deiminases can convert methylarginine to citrulline via demethylimination theprocess that antagonize the arginine methylation [Cuthbert et al., 2004]; [Wang et al., 2004a].However, Chang et al. reported in vitro and in vivo data that clearly indicated that JMJD6functions as an arginine demethylase [Chang et al., 2007]. Of all the histone modifying en-zymes, the methyltransferases and kinases are the most specific. This might explain the factwhy histone methylation is the most characterized modification to date. While consideringthe specificity of enzymes that modify histones it must be kept in mind that they can be in-fluenced by other factors, for instance, complexes in which enzymes are found may specify apreference for nucleosomal verses free histones [Lee et al., 2005]; proteins that associate withthe enzyme may affect its selection of residue to modify [Metzger et al., 2005] or the degreeof methylation (mono-, di-, or tri-) at a specific site [Steward et al., 2006]. Here, we will fo-cus our discussion to the enzymes mainly responsible for maintaining the balance betweenhistone acetylation and deacetylation and methylation and demethylation.
Histone Acetylatransferases (HATs) & Histone Deacetylases (HDACs)
Lysine acetylation is a reversible and highly regulated post-translational modification re-ported on histones in early 1960’s [PHILLIPS, 1963]; [Allfrey et al., 1964], while its chem-

1.4. Modifications of Chromatin Structure 29
Figure 1.9: Histone modifying enzymes and their sites of modification. Adapted from [Kouzarides, 2007b].
ical nature was defined as Nε - acetylation a few years later [Gershey et al., 1968]; [Vidaliet al., 1968]. Since its discovery, it took scientists a while to find out the enzymes responsi-

30 Chapter 1. Introduction
ble for acetyl group addition to or removal from target proteins. These enzymes known ashistone acetyltransferases (HATs) and deacetylases (HDACs) , respectively, were identifiedin mid 1990’s and these discoveries lead to the renewed interest in this PTM as they werefound to be linked with gene regulation [Brownell and Allis, 1995]; [Kleff et al., 1995]; [Ban-nister and Kouzarides, 1996]; [Brownell et al., 1996]; [Mizzen et al., 1996]; [Ogryzko et al.,1996]; [Taunton et al., 1996]; [Yang et al., 1996b]; [Yang et al., 1996a]. The general model oftranscription is based on the interaction among RNA Pol II, general transcription factors,coactivators, corepressors, and sequence-specific DNA-binding proteins (DBPs), which con-fer tissue and signal-dependent specificity. Coactivator and corepressor complexes contain avariety of chromatin-modifying enzymes, including HATs and HDACs.
Although all HATs contain an acetyltransferase domain (proven or suspected), but sequencecomparison divide them into subfamilies according to additional shared domains. Gener-ally, HATs are classified into two groups, HAT A and HAT B, depending on the mechanismof catalysis and on cellular localization. The HAT B family act predominantly in cytoplasm,acetylating free histones prior to their deposition into chromatin. This class of HATs is highlyconserved and all type-B HATs share sequence homology with scHat1, the founding mem-ber of this type of HAT. Type-B HATs acetylate newly synthesized histone H4 at K5 andK12 (as well as certain sites within H3), and this pattern of acetylation is important for de-position of the histones, after which these PTM marks are removed [Parthun, 2007]. Themembers of the HAT A family are more diverse class of enzymes. They are found in thenucleus, where they transfer the acetyl group from Acetyl-CoA to an ε-NH2 group of his-tone N-terminal after the assembly into nucleosomes. The HAT A family can be further di-vided into three subclasses depending on the amino acid homology with yeast proteins andconformational structure. These classes include GNAT, MYST and CBP/p300 families [Ho-dawadekar and Marmorstein, 2007]. Each of these enzymes targets multiple sites within thehistone N-terminal tails. Indeed, their presence in numerous transcriptional coactivators isperfectly correlated with their ability to neutralize positive charges, thereby disrupting thestabilizing influence of electrostatic interactions between DNA and histones [Yang and Seto,2007]. It has been shown that acetylation on some histone fold domain residues, speciallyH3K56, by hGNC5 is also involved in this regulation [Tjeertes et al., 2009]. The H3K56 sidechain points towards the DNA major groove, suggesting that acetylation would affect hi-stone/DNA interaction, a situation reminiscent of the proposed effects of acetylating thehistone N-terminal tail lysines. Interestingly, knockdown of the p300 HAT has also beenshown to be associated with the loss of H3K56ac [Das et al., 2009], suggesting that p300 mayalso target this site. However, unlike GCN5 knockdown, p300 knockdown increases DNAdamage, which may indirectly affect H3K56ac levels [Tjeertes et al., 2009].
HDACs can be grouped into four classes in relation to their phylogenetic conservation [Gre-goretti et al., 2004]; [Yang and Seto, 2007]. Class I, class II, and class IV, which are closelyrelated to the yeast Rpd3, Had1, and Hos3 proteins, respectively, encompass the classicalfamily of zinc-dependent HDACs, while class III consists of the NAD+-dependent yeastSir2 homologues, which comprise the sirtuin family [de Ruijter et al., 2003]; [Haigis andGuarente, 2006]. HDAC enzymes oppose the effects of HATs and reverse lysine acetyla-

1.4. Modifications of Chromatin Structure 31
tion, an action that restores the positive charge of the lysine. This potentially stabilizes thelocal chromatin architecture and is consistent with HDACs being predominantly transcrip-tional repressors. In general, HDACs have relatively low substrate specificity by themselves,a single enzyme being capable of deacetylating multiple sites within histones. The issueof enzyme recruitment and specificity is further complicated by the fact that the enzymesare typically present in multiple distinct complexes, often with other HDAC family mem-bers. For instance, HDAC1 is found together with HDAC2 within the NuRD , Sin3a andCo-REST [Yang and Seto, 2008]. Thus, it is difficult to determine which activity (specificHDAC and/or complex) is responsible for a specific effect. Nevertheless, in certain cases, itis possible to at least determine which enzyme is required for a given process. For example,it has been shown that HDAC1, but not HDAC2, controls embryonic stem cell differentia-tion [Dovey et al., 2010].
Histone Lysine Methyltransferases (HMTs) & Histone Demethylases (HDMs)
Histone methylation mainly occurs on the side chains of lysines and arginines. Unlike acety-lation and phosphorylation, however, histone methylation does not alter the charge of thehistone protein but it does affect the hydrophobic and steric properties. Histone methylationincreases the affinity of certain proteins, such as transcription factors, toward DNA. Further-more, there is an added level of complexity to bear in mind when considering this modifi-cation, depending on the specific functional properties of the associated methyltransferase;lysines may be mono-, di- or tri-methylated, whereas arginines may be mono-, symmetri-cally or asymmetrically di-methylated [Ng et al., 2009]; [Bedford and Clarke, 2009]; [Lanand Shi, 2009].
I Lysine methylation
Histone methyltransferase (HMTs) can be divided into three classes: SET domain con-taining lysine methyltransferases, non-SET domain containing lysine methyltransferases,and arginine methyltransferases [Figure 1.10]. All three classes use S-adenosylmethionine(SAM) as a co-enzyme to transfer methyl groups [Smith and Denu, 2009]. Lysine methyl-transferases have striking target specificity, and they usually modify one single lysineon a single histone and their output can be either activation or repression of tran-scription. SUV39H1 that targets H3K9 was the first histone lysine methyltransferase(HKMT) to be identified [Rea et al., 2000]. Numerous HKMTs have since been iden-tified, the vast majority of which methylate lysines within the N-terminal tails. Strik-ingly, all of the HKMTs that methylate N-terminal lysines contain a so-called SET do-main that harbors the enzymatic activity. However, an exception is the Dot1 enzymethat methylates H3K79 within the histone globular core and does not contain a SETdomain. Why this enzyme is structurally different than all of the others is not clear, butperhaps this reflects the relative inaccessibility of its substrate H3K79.
The SET domain-containing class of methyltransferases is best characterized and hasbeen associated with metabolic diseases [Lee et al., 2008]; [El-Osta et al., 2008]; [Brasac-

32 Chapter 1. Introduction
Figure 1.10: Histone lysine methyltransferases and demethylases along with their specificity for particularhistone residue.
chio et al., 2009]. The SET domain is an evolutionary conserved domain, initially iden-tified in Drosophila PEV (positive effect variegation) suppressor SU(VAR)39 [Tschier-sch et al., 1994], the polycomb group protein Enhancer of zeste [Jones and Gelbart,1993], and the trithorax group protein Trithorax [Stassen et al., 1995]. Although themajor role of these methyltransferases is the modulation of gene activity via histonemethylation and alteration of chromatin structure [Rea et al., 2000], they also targetseveral non-histone proteins. In particular, the tumor suppressors p53 [Chuikov et al.,2004]; [Huang et al., 2010]; and pRb [Munro et al., 2010], and the estrogen receptora [Subramanian et al., 2008] are substrates of SET-domain-containing methyltrans-ferases.
HKMTs tend to be relatively specific enzymes. For instance, Neurospora crassa DIM5specifically methylates H3K9 whereas SET7/9 targets H3K4. Furthermore, KMT en-zymes also modify the appropriate lysine to a specific degree (i.e., mono-, di- and/ortri-methyl state). Maintaining the same examples, DIM5 can trimethylate H3K9 [Tamaruet al., 2003] but SET7/9 can only mono-methylate H3K4 [Xiao et al., 2003]. These spe-cific reaction products can be generated using only the purified enzymes; so the abilityto discriminate between different histone lysines and between different methylatedstates is an intrinsic property of the enzyme. It turns out from X-ray crystallographicstudies that there is a key residue within the enzymes catalytic domain that determines

1.4. Modifications of Chromatin Structure 33
whether the enzyme activity proceeds past the mono-methyl product. In DIM5, thereis a phenylalanine (F281) within the enzymes lysine-binding pocket that can accommo-date all the methylated forms of the lysine, thereby allowing the enzyme to generatethe tri-methylated product [Zhang and Tang, 2003]. In contrast, SET7/9 has a tyrosine(Y305) in the corresponding position such that it can only accommodate the mono-methyl product [Xiao et al., 2003]. Elegant mutagenesis studies have shown that muta-genesis of DIM5 F281 to Y converts the enzyme to a monomethyltransferase, whereasthe reciprocal mutation in SET7/9 (Y305 to F) creates an enzyme capable of trimethy-lating its substrate [Zhang and Tang, 2003]. More generally speaking, it seems thatthe aromatic determinant (Y or F) is a mechanism widely employed by SET domain-containing HKMTs to control the degree of methylation [Collins et al., 2005].
II Arginine methylation
There are two classes of arginine methyltransferase, the type-I and type-II enzymes[Figure 1.10]. The type-I enzymes generate Rme1 and Rme2as (asymmetric), whereasthe type-II enzymes generate Rme1 and Rme2s (symmetric). Together, the two typesof arginine methyltransferases form a relatively large protein family (11 members), themembers of which are referred to as PRMTs . All of these enzymes transfer a methylgroup from SAM to the ω-guanidino group of arginine within a variety of substrates.With respect to histone arginine methylation, the most relevant enzymes are PRMT1, 4,5 and 6 [Wolf, 2009]. Methyltransferases, for both arginine and lysine, have a distinctiveextended catalytic active site that distinguishes this broad group of methyltransferasesfrom other SAM-dependent enzymes [Copeland et al., 2009]. Interestingly, the SAM-binding pocket is on one face of the enzyme, whereas the peptidyl acceptor channel ison the opposite face. This indicates that a molecule of SAM and the histone substratecome together from opposing sides of the enzyme [Copeland et al., 2009]. Indeed, thisway of entering the enzymes active site may provide an opportunity to design selectivedrugs that are able to distinguish between histone arginine/lysine methyltransferasesand other methyltransferases such as DNMTs.
III Histone demethylases
For many years, histone methylation was considered a stable, static modification. Nev-ertheless, in 2002, a number of different reactions/pathways were suggested as poten-tial demethylation mechanisms for both lysine and arginine [Bannister et al., 2002],which were subsequently verified experimentally. Initially, the conversion of arginineto citrulline via a deimination reaction was discovered as a way of reversing argininemethylation [Cuthbert et al., 2004]; [Wang et al., 2004a]. Although this pathway is nota direct reversal of methylation, this mechanism reversed the dogma that methylationwas irreversible. More recently, a reaction has been reported which reverses argininemethylation. The jumonji protein JMJD6 was shown to be capable of performing ademethylation reaction on histones H3R2 and H4R3 [Chang et al., 2007]. However,these findings have yet to be recapitulated by other independent researchers.
In 2004, the first lysine demethylase was identified. It was found to utilize FAD as co-factor, and it was termed as lysine-specific demethylase 1 (LSD1) [Shi et al., 2004]. The

34 Chapter 1. Introduction
demethylation reaction requires a protonated nitrogen and it is therefore only com-patible with mono- and dimethylated lysine substrates. In vitro, purified LSD1 catal-yses the removal of methyl groups from H3K4me1/2, but it cannot demethylate thesame site when presented within a nucleosomal context. However, when LSD1 is com-plexed with the Co-REST repressor complex, it can demethylate nucleosomal histones.Thus, complex members confer nucleosomal recognition to LSD1. Furthermore, theprecise complex association determines which lysine is to be demethylated by LSD1.As already mentioned, LSD1 in the context of Co-REST demethylates H3K4me1/2, butwhen LSD1 is complexed with the androgen receptor, it demethylates H3K9. This hasthe effect of switching the activity of LSD1 from a repressor function to that of a coac-tivator [Klose and Zhang, 2007].
In 2006, another class of lysine demethylase was discovered [ichi Tsukada et al., 2006].Importantly, certain enzymes in this class were capable of demethylating trimethy-lated lysines [Whetstine et al., 2006]. They employ a distinct catalytic mechanism fromthat used by LSD1, using Fe(II) and α-ketoglutarate as co-factors, and a radical at-tack mechanism. The first enzyme identified as a trimethyl lysine demethylase wasJMJD2 that demethylates H3K9me3 and H3K36me3 [Whetstine et al., 2006]. The en-zymatic activity of JMJD2 resides within a JmjC jumonji domain. Many histone lysinedemethylases are now known and, except for LSD1, they all possess a catalytic jumonjidomain [Mosammaparast and Shi, 2010]. As with the lysine methyltransferases, thedemethylases possess a high level of substrate specificity with respect to their targetlysine. They are also sensitive to the degree of lysine methylation; for instance, someof the enzymes are only capable of demethylating mono- and dimethyl substrates,whereas others can demethylate all three states of the methylated lysine.
1.4.4 Functional Consequences of Histone Modifications
As discussed earlier, histone PTMs, in general, affect genome regulation by altering the nu-cleosome architecture. Several mechanisms have been described [Allis et al., 2007]; first, his-tone modifications can directly modify the structure of chromatin by preventing crucial con-tacts that facilitates certain chromatin conformation or higher order structures. Such effectsare termed as cis-modifying effects. On the other hand, two other mechanisms can be con-sidered to operate in trans i.e. some histone PTMs may disrupt the binding of proteins thatassociate with chromatin or alternatively, may provide binding platforms to attract variouseffector proteins. This second trans-acting mechanism has been studied and characterizedin most detail. Therefore, various modifications or set of modifications on a given histonedictate a set of proteins to bind or occlude from chromatin. These proteins may also carrywith them enzymatic activities (e.g., remodeling ATPases) that further modify chromatin.The need to recruit an ordered series of enzymatic activities comes from the fact that theprocesses regulated by modifications (transcription, replication, repair) have several steps.Each one of these steps may require a distinct type of chromatin-remodeling activity and adifferent set of modifications to recruit them.
1.4. Modifications of Chromatin Structure 35
I Direct Structural Perturbations or CIS-modifying effects
Among the modifications that disrupt certain chromatin conformations by reducingthe positive charge of histones are acetylations and phosphorylations. These mod-ifications perturb the electrostatic interactions between histones in adjacent nucleo-somes or histone DNA interactions. Hence, these modifications may lead to less com-pact chromatin structure, thereby facilitating DNA access by cellular machineries in-volved in DNA-based processes, such as transcription, DNA damage response & re-pair, replication and recombination. Histones are found to be hyper-acetylated on mul-tiple residues (H3K9, H3K14, H3K18, H4K5, H4K8, H4K12, H4K16 [Kouzarides, 2007a])in particular regions of genome (enhancers, promotors etc. [Wang, 2008]), thereby neu-tralizing the positive charge, leading to profound effects on the chromatin structure.However, multiple acetylations are not a prerequisite for inducing the structural changein chromatin as for example acetylation on H4K16 can in vitro negatively affect the for-mation of 30-nm chromatin fiber [Shogren-Knaak et al., 2006].
Histone phosphorylation is another example of cis-modifying change that alters thechromatin structure by altering the charge on a single site like H4K16Ac. A well knownexample of this mechanism is H3S10 phosphorylation during mitosis, which occursgenome-wide and associated with highly condensed form of chromatin [Wei et al.,1998]. Although phosphorylation imparts negative charge to the histones and in prin-ciple it should decrease its interaction with the negatively charged DNA, it may bethat the displacement of heterochromatin protein 1 (HP1) from heterochromatin dur-ing metaphase by uniformly high levels of H3S10 phosphorylation [Fischle et al., 2005]is required to promote the detachment of chromosomes from the interphase scaffold-ing. This would facilitate chromosomal remodeling that is essential for its attachmentto the mitotic spindle. Ubiquitination, on the other hand does not impart any chargeto the histones but due to its extremely large size, it might affect intra-nucleosomalinteractions and/or interactions with other chromatin bound proteins.
II Regulating the Binding of Chromatin Proteins or TRANS-modifying effects
There is an ever-increasing number of chromatin proteins that interact specifically withhistones through a variety of distinct domains. These proteins are generally part oflarge proteins complexes and hence each complex has many distinct domains that al-low simultaneous recognition of various modifications, sometimes on the same histoneand sometimes on different histones in the same neighborhood. In general, methy-lations are recognized by chromo-like domains of the Royal family (chromo, tudor,PWWP and MBT domains) and PHD domains [Champagne and Kutateladze, 2009];[Maurer-Stroh et al., 2003]; [Kim et al., 2006], acetylations are recognized by bromod-omains and more recently a PHD domain has also been shown to recognize histoneacetylation [Zeng et al., 2010]. Phosphorylation is recognized by a domain within 14-3-3 proteins.
Experimental evidence that histone lysine methylation is recognized by many distinctdomain types, underscores the relative importance of this modification. It has beenshown that numerous lysine methyl binding domains can recognize the same modi-

36 Chapter 1. Introduction
Figure 1.11: Models showing how histone PTMs affect the chromatin template. Model-1 corresponds to cis-modifying effects, while Model-2 & -3 corresponds to trans-modifying effects. Adapted from [Allis et al.,2007].
fied histone lysine. For example, H3K4me3 - a marker of active transcription, is rec-ognized by the PHD finger domain of ING family of proteins (ING1-5) (The ING pro-tein binding leads to the recruit of additional chromatin modifiers such as HATs andHDACs. For example, ING2 tethers the repressive mSin3a-HDAC1 HDAC complexto active growth-specific genes following DNA damage [Shi et al., 2006]), by tandemchromodomains within CHD1 , an ATP-dependent remodeling complex, capable ofrepositioning the nucleosomes [Sims et al., 2005], and by tandem tudor domains withinJMJD2A, a histone demethylase [Huang et al., 2006]. Another example of specific bind-ing of methylated lysine is the recognition of H3K9me3 by HP1. H3K9me3 is a markassociated with repressive heterochromatin. HP1 binds to this mark via its N-terminalchromodomain [Bannister et al., 2001]; [Lachner et al., 2001] and dimerize via their C-terminal chromoshadow domains to form a bivalent chromatin binder. HP1 has alsobeen shown to bind to methylated H1.4K26 via its chromodomain [Daujat et al., 2005].All these interactions of HP1 (H3K9me and H1.4K26me) regulate the heterochromatinarchitecture and plays fundamental role in chromatin compaction.
HATs and several chromatin remodeling complexes often contains bromodomains thatspecifically recognize acetylated histone lysines [Mujtaba et al., 2007]. For instance, thebromodomain of Swi2/Snf2 targets it to acetylated histones and in turn recruits theSWI/SNF remodeling complex, which "relaxes" the chromatin [Hassan et al., 2002].More recently, the PHD fingers have been shown to recognize the acetylated histones.

1.4. Modifications of Chromatin Structure 37
The DPF3b protein is a component of the BAF chromatin remodeling complex and itcontains tandem PHD fingers that are responsible for recruiting the BAF complex toacetylated histones [Zeng et al., 2010]. Among the proteins that bind specifically tophosphorylated histones is MDC1, which is involved in the DNA damage recognitionand is recruited to the sites of DNA double strand breaks (DSB). MDC1 , through itstandem BRCT domains, binds to γH2AX, the DSB induced phosphorylated H2A vari-ant [Stucki et al., 2005].
Various histone modifications can also function to prevent docking of non-histone pro-teins onto the chromatin. Examples include H3K4me disrupting the binding of theNuRD complex and H3T3ph preventing the binding of the INHAT complex to theH3 tail. Both of these complexes have transcriptional repressor activity, so their oc-clusion by modifications associated with active transcription makes sense [Zegermanet al., 2002]; [Schneider et al., 2004b]. H3K4 methylation also disrupts the binding ofDNMT3L’s PHD finger to the H3 tail [Adams-Cioaba and Min, 2009].
Another way of avoiding the binding of non-histone proteins is to remove respec-tive histone modifications by removing the histone N-terminal tail in which they re-side, a process referred to as tail clipping. It was first identified in Tetrahymena [Al-lis et al., 1980] but much more recently also detected in mouse [Duncan et al., 2008]and yeast [Santos-Rosa et al., 2009]. It has been shown that the endopeptidase activ-ity is sensitive to the modification status of the H3 tail. For instance, the presence ofH3K4me3, an active mark, is inhibitory for clipping, whereas the repressive H3R2me2mark is not. This suggests that the presence of an active mark on the H3 tail impedesbinding of the endopetidase. Furthermore, it also suggests that during activation H3tails methylated at H3K4 may be protected from being clipped, which indicates theselectivity of the tail clipping towards repressive marks, consistent with the idea thatclipping may be necessary for the removal of transcription inhibitors at the onset ofgene expression. Repressive protein complexes bound to the H3 tail at promoter re-gions may thus be removed to allow activator protein complexes to take over duringthe induction process. Thus, H3 tail clipping can be considered as a histone modifi-cation that allows "mass clearance" of repressive marks and proteins at promoters, aprocess that may be a necessary prelude to gene activation.
1.4.5 Histone Modification Cross-talk
To summarize, a decade of extensive research in the field of histone biology has revealed thathistones are not merely static architectural proteins whose only function is to wrap DNA, butthey are decorated with abundance of various covalent modifications, which adds an extralevel of complexity to the dynamic chromatin structure. The presence of these modifications,either on the same histone or on adjacent histones, makes their "cross talk" with each otherhighly likely, providing grounds for their mechanistic communications during various cellu-lar processes. This communication might occur via several different mechanisms [Bannisterand Kouzarides, 2011], which are numerated below with examples, [Figure 1.12];

38 Chapter 1. Introduction
I There may be competitive antagonism between modifications if distinct type of modi-fications occur on the same residue(s). This is, in particular true for lysines that can beacetylated, methylated or ubiquitylated. So in this case these modifications are mutu-ally exclusive [Table1.2].
II There are situations where one modification may be dependent upon another or is re-quired for the other modification, either on the same histone or a different histone, totake place. The best studied example of this trans-regulation comes from the work inSaccharomyces cerevisiae, where methylation of H3K4 by scCOMPASS and of H3K79by scDot1 is completely dependent upon the ubiquitination of H2BK123 by scRad6/Bre1[Lee et al., 2007]. Intriguingly, this mechanism is conserved in higher eukaryotes too,including humans [Kim et al., 2009]. However, it has also been shown that H3K4methylation can be interfered by H3R2 methylation [Guccione et al., 2007]; [Kirmiziset al., 2007].
III The docking of a protein to a particular modification can be disrupted or occluded byan adjacent modification. For example, as discussed above, HP1 binds to H3K9me2/3,but during mitosis, the binding is disrupted due to phosphorylation of H3S10 [Fis-chle et al., 2005]. This eviction of HP1 from H3K9me2/3 can be viewed as a binary’methyl/phospho switch’, which permits the dynamic control of the HP1H3K9me in-teraction [Fischle et al., 2003]. A similar binary switch has also been discovered inlinker histone H1.4, where HP1 binding to H1.4K26me is occluded by phosphorylationof H1.4S27 [Daujat et al., 2005]. For this kind of communication, the modified aminoacids do not necessarily have to be directly adjacent to each other. For example, in S.pombe, acetylation of H3K4 inhibits binding of spChp1 to H3K9me2/3 [Xhemalce andKouzarides, 2010].
IV An enzyme’s catalytic activity may be affected due to modification of its substraterecognition site. In yeast, for example, the interconversion of the H3P38 peptide bondis catalysed by scFpr4 proline isomerase and this conformational change affects theability of the scSet2 methyltransferase to methylate H3K36, which is linked to the ef-fects on gene transcription [Nelson et al., 2006].
V There may be cooperation between modifications, where the presence of certain modi-fications effectively increases the recognition and binding of a protein to another modi-fication. For example, PHF8 specifically binds to H3K4me3 via its PHD finger, and thisinteraction is stronger when H3K9 and H3K14 are also acetylated on the same tail ofH3 [Vermeulen et al., 2010]. However, this might not be the direct effect of these markson PHF8, but instead some additional proteins in a complex with PHF8 can ultimatelylead to stabilization of PHF8.
VI A cross-talk may exist between histone modifications and DNA methylation. For in-stance, the UHRF1 protein binds to nucleosomes bearing H3K9me3, but this binding issignificantly enhanced when the nucleosomal DNA is CpG methylated [Bartke et al.,2010]. Conversely, DNA methylation can inhibit protein docking to specific histone

1.4. Modifications of Chromatin Structure 39
modifications. A good example here is KDM2A , which only binds to nucleosomesbearing H3K9me3 when the DNA is not CpG methylated [Bartke et al., 2010].
Figure 1.12: Histone modifications cross-talk. Adpated from [Bannister and Kouzarides, 2011].
VII It is known that histone-modifying enzymes are often found in large multi-subunitcomplexes. In order, for these large complexes, to anchor onto the nucleosome, a mod-ification on the nearby residues can create binding sites for the components of thecomplex. For example, the PHD finger of Yng1, a subunit of the NuA3 histone acetyl-transferase complex, recognizes methylated H3K4 and helps recruit this histone acetyl-transferase complex for acetylation of H3K14 [Martin et al., 2006]; [Taverna et al., 2006].An ING family protein, ING2, through its PHD finger, can also bind methylated H3K4,although it is present in a histone deacetylase complex [Shi et al., 2006]. Therefore,H3K4 methylation can serve as a landing platform for a variety of histone-modifyingenzymes with opposing activities.
VIII A crosstalk between two different modifications on histone H3 and H4 tails can regu-late transcription elongation through the sequential recruitment of proteins that bindthese modifications. For instance, activation of FOSL1 gene requires the binding of akinase PIM1 to the FOSL1 enhancer. PIM1 phosphorylates histone tail residue H3S10.Phosphorylated H3S10 creates a binding site for 14-3-3, a phosphoserine binding pro-tein, which interacts with histone acetyltransferase MOF to acetylate histone H4 tailresidue H4K16. Acetylated H4K16 can in turn provide a binding platform for thebromodomain-containing protein Brd4, a component of P-TEFb , a kinase that phos-phorylates the C-terminal domain of RNA Pol II to facilitate transcription elongation.However, the timing, location, and perhaps the identity of the H3 kinase, and not theH3S10 modification alone, determines downstream events, as it has also been shownthat at an earlier stage of serum stimulation, an MSK1/2 kinase is recruited to the pro-

40 Chapter 1. Introduction
moter where it phosphorylates H3S10. 14-3-3 is then recruited to the promoter, butunlike the situation at the enhancer, MOF is not recruited to the promoter [Zippo et al.,2009].
It is obvious from the above examples that various types of histone cross-talk mechanisms,involving numerous histone modifying and nucleosome remodeling complexes, could existin the cells. This cross-talk leads us towards two functional categories of biological readouts,i.e. the establishment of global chromatin environments and the orchestration of DNA-basedbiological processes. To establish a global chromatin environment, modifications help to par-tition the genome into distinct domains such as euchromatin, where DNA is kept "accessible"for transcription, and heterochromatin, where chromatin is "inaccessible" for transcription.Although there is a high degree of overlap between different chromatin regions, there arestill regions of demarcation between heterochromatin and euchromatin. These boundary el-ements have specific histone modification signatures [Barski et al., 2007]; [Ong and Corces,2009]. On the other hand, in order to facilitate DNA-based functions, modifications orches-trate the unravelling of chromatin to help the execution of a given biological function. Thismay be a very local function, such as transcription of a gene or the DNA damage responseand subsequent repair or it may be a more global genome wide function, such as DNAreplication or chromosome condensation. All these biological tasks require the sequentiallyordered recruitment of the machinery to unravel DNA, manipulate it and then put it back tothe correct chromatin state. In order to correctly undertake these tasks, whether its the estab-lishment of global chromatin domain or execution of a particular cellular function, it requiresa definite set of modifications, which act either sequentially or in a combinatorial manner.This idea of combination of various histone modifications for specific biological readoutsor alternative chromatin states was the basis of the "Histone Code Hypothesis" [Turner,2000]; [Strahl and Allis, 2000]; [Jenuwein and Allis, 2001].
1.5 Histone Code Hypothesis
As described previously, chromatin is subject to a variety of post-translational modifications.These modifications are evolutionarily conserved, and have been shown to affect chromatinstructure and as a result affect essential processes involving DNA, such as transcription,replication, DNA damage response, recombination and mitotic condensation of chromo-somes. Furthermore, some of these changes are inherited from one cell generation to another,thus providing epigenetic information. The extremely high diversity and distinct patterns ofthese post-translational modifications and their involvement in specific biological processeshave lead scientists to believe in existence of so called "Histone Code", encoded onto bothN-terminal tails and HFD of histones [Turner, 2000]; [Strahl and Allis, 2000]; [Jenuwein andAllis, 2001]. These histone modifications, which can also be regarded as ’epigenetic marks’,are deposited by a large panel of histone modifying enzymes (histone code writers) andsubsequently read or recognized by various non-histone proteins (histone code readers).The readers, thus, can act as a translation machinery for the information encoded in the

1.5. Histone Code Hypothesis 41
histone modifications. These epigenetic marks on histones, represent a critical feature of agenome-wide mechanism of information storage and retrieval that is only beginning to beunderstood. It has becoming more and more evident that "histone code" has the ability toconsiderably extend and complement the information potential of the genetic (DNA) code.
Thus histone code hypothesis predicts that:
• Distinct modifications on histone tails and HFD generate docking sites for a large num-ber of non-histone chromatin-associated proteins.
• Modifications on the same or different histone tails may be interdependent and gener-ate various combinations or act sequentially on any one nucleosome, thereby creatingunique biological outcomes.
• Distinct regions of higher order chromatin, such as euchromatic or heterochromaticdomains, are largely dependent on the local concentration and combination of differ-entially modified nucleosomes and/or the presence of alternative histone variants, andhence, give rise to the idea of alternative chromatin states.
As a further extension of the initial hypothesis of histone code, the idea of "binary switches"and "modification cassettes" has been suggested [Fischle et al., 2003]. Binary switch repre-sents the differential readout of distinct combinations of marks on two neighboring residues,where one modification influences the binding of an effector module onto another modifi-cation on an adjacent or nearby residue. A "methyl/phospho" switch on histone H3 canbe regarded as the prototype example of this model. Methylation of histone H3K9 is rec-ognized and bound by heterochromatin protein 1 (HP1), however, during mitosis and chro-matin condensation, H3S10 is phosphorylated, which reduces HP1 binding to H3K9me. Thisbinding is further reduced when H3 becomes acetylated at K14, which removes HP1 fromthe mitotic chromosomes [Mateescu et al., 2004]. In addition to the inhibition of HP1 bind-ing to the H3K9me, phosphorylation of H3S10 interferes with the methylation of H3K9 bySUV39H1 [Garcia et al., 2005]; [Rea et al., 2000].
Similarly, the combination of short clusters of modifications, situated at strategic locationsin the histones, could be regarded as "modification cassettes". Depending upon their mod-ification state, they can lead to distinct biological readouts. Such short ’cassettes’ where atleast three out of five sites separated by no more than one residue can be covalently mod-ified are readily spotted in the H3 and H4 tails, e.g. the stretch between H3K9 and H3T11can carry four different covalent marks. Various combinations of modification on adjacentsites within these short clusters can exist which will influence the recognition and binding ofmodules to their respective binding mark. Especially since the recognition of short clustersof 510 amino acids is a hallmark of the interaction of most modules with their target interac-tion marks [Pawson et al., 2001]. Furthermore, modules that directly read complex patternsof marks might exist [Fischle et al., 2003].

42 Chapter 1. Introduction
1.5.1 Histone Code in Transcriptional Regulation
Scientists have been studying the regulation of gene expression for a very long time and theirunderstanding has grown from identifying transcription factors and their binding sites toinclude a wide variety of other binding events regulated or affected by the covalent modifi-cations of histones that package the DNA. Experimental evidence suggest that these histonemodifications act as signals to attract various proteins, which in turn influence the gene ex-pression. As discussed in [subsection 1.4.5], histone modifications do not occur in isolationbut rather in combinatorial fashion, and hence an extensive cross-talk could be imaginedamong various modifications that can be summed up as the language of histone code. Tra-ditionally, histone code has been studied in the context of transcriptional regulation andvarious histone marks have been shown to represent alternative forms of gene expression.
It has been demonstrated that reversible acetylation of specific lysines of core histones is cor-related with gene activity. Active genes exhibited high levels of histone acetylation, whereasrepressed genes usually have low levels of acetylation [Turner, 2000]. Localization in differ-ent regions of genes suggests that these modifications have different functions. For exam-ple, H3K9ac, H3K14ac and H4K8ac is elevated in promoter regions, consistent with a role intranscriptional initiation [Agalioti et al., 2002]; [Wang, 2008], whereas H4K12ac was detectedat high levels in transcribed regions, suggesting a role in transcriptional elongation [Careyet al., 2006].
Active transcriptional enhancers contain relatively high levels of H3K4me1, a reliable predic-tive feature [Hon et al., 2009]. However, active genes themselves possess a high enrichmentof H3K4me3, which marks the transcriptional start site (TSS) [Barski et al., 2007]; [Schnei-der et al., 2004a]. It has been shown that H3K4me2 exists in both active and repressivegenes [Santos-Rosa et al., 2002], which strongly suggests that not only the particular sitebut also the number of methyl groups in a modification plays an important role in the func-tional consequences of histone methylation on gene expression. Further on, histone methy-lations on H3K9, H3K27, and H4K20 are generally associated with a repressed chromatinstate. Histone H3K27me3, along with Polycomb repressor complexes, is a marker of fac-ultative heterochromatin, which consists of genomic regions containing genes that are dif-ferentially expressed through development and/or differentiation and which then becomesilenced [Hansen et al., 2008]. However, high levels of H3K9me3, along with HP1 α/β arefound in constitutive heterochromatin, which contains permanently silenced genes in ge-nomic regions such as the centromeres and telomeres [Trojer and Reinberg, 2007].
As discussed in 1.4.5, histone modifications do not occur in isolation but rather in combina-torial fashion, and hence an extensive cross-talk could be imagined among various modifi-cations. Evident from the variety and density of the modifications identified so far, it is likelythat the histone modifications, in combinatorial way, have an impact on one another, bothin a cis or trans-acting manner. Indeed, H4K20 methylation, which is a mark of silent chro-matin, has been shown to prevent acetylation on H4K16, a mechanism involved in gene acti-vation [Nishioka et al., 2002a]. Furthermore, methylation of H3K4 by Set9 has been shown toimpair H3K9 methylation by Suv39h1 and to abolish the recruitment of the ATP-dependent

1.5. Histone Code Hypothesis 43
HDAC-containing chromatin remodeling complex NuRD, involved in gene silencing [Nish-ioka et al., 2002b]. Finally, H3K4 methylation seems to be controlled by the ubiquitinationstate of H2BK123
A common theme of recent research on histone code interpretation is that the order andmechanism of the addition and removal of histone modifications are important for the tran-scriptional readout of a gene. The recent examples of histone crosstalk discussed earlier 1.4.5illustrate this point. In one study, the implementation of H3S10 phosphorylation at two dif-ferent locations, by two different enzymes, and at two different times after serum stimulationhad disparate effects on subsequent histone acetylation at the respective locations [Zippoet al., 2009]. Zippo and colleagues were able to propose a mechanism of gene activation byidentifying the histone-modifying enzymes, the histone modifications, and a set of proteinsthat recognized these modifications on the FOSL1 gene after serum stimulation. In anotherstudy [Wang et al., 2009], Wang and colleagues found that artificially recreating histone mod-ifications that correlate with gene expression could result in the recruitment of RNA Pol II,but this was not sufficient for transcription. Thus, simply mapping histone modification pat-terns without understanding the recruitment, regulation, and interactions of the complexesimplementing these marks is not sufficient to understand the mechanisms regulating geneexpression. Genome-wide profiling techniques have now become widely adopted, enablingone to map histone modifications, and identify the enzymes implementing these marks, to-gether with the factors that recruit them under different experimental conditions. Hence,the more we look into the histone code, the more it will become obvious that "context" iseverything [Figure 1.13].
The idea that certain marks make categoric distinction between active or repressed chro-matin may, on some occasions, represent a highly simplistic view as it has been challengedin more recent studies. For example, it has been shown that activation-related H3K4me3 andrepression-related H3K27me3 of the same histone can happen in close proximity
These consistent conclusions point out that many modifications occur together, suggestingthat combinatorial complexity is limited and that interdependent networks linking differ-ent marks could help understanding the modification patterns. However, it is importantto understand how the histone-modifying enzymes and ATP-dependent chromatin remod-ellers are targeted to specific loci in order to regulate gene expression. Evidence suggeststhat during transcription, the targeting does not seem to occur through direct binding of theeffector proteins to the underlying DNA sequence. Instead, interactions between histone-modifying enzymes and sequence-specific transcription factors seem to be necessary. Forexample, SWI/SNF, an ATP-dependent nucleosome remodeling complex, and HAT com-plexes are recruited to promoters by direct interaction with transcriptional activators [Ryanet al., 1998]; [Brown et al., 2001]. After a modification pattern has been established, it is "read"by chromatin-remodelling factors (effectors) that increase the efficiency of transcription ei-ther by altering the position or mobility of nucleosomes or by promoting the eviction ofhistones. The large network of histone PTMs appears to represent a mechanism for shortand long term regulation of chromatin structure and activity. Fully deciphering this codewill certainly impact on our understanding of DNA-templated processes in the cell.

44 Chapter 1. Introduction
Figure 1.13: Context dependent outcomes of histone code in transcriptional regulation. [A]. Activation ofFOSL1 requires the binding of PIM1 to the FOSL1 enhancer, which leads to the phosphorylation of H3S10.H3S10ph creates a binding site for a phosphoserine binding protein, 14-3-3, which through its interactionwith MOF (HAT) acetylates H4K16. H4K16ac provides a binding plateform for Brd4 through its bromod-omain. Brd4 is a component of P-TEFb, which phosphorylates RNA Pol II to facilitate transcription elon-gation. However, at an earlier stage of serum stimulation, an MSK1/2 kinase is recruited to the promoterwhere it phosphorylates H3S10. 14-3-3 is then recruited to the promoter, but unlike the situation at the en-hancer, MOF is not recruited to the promoter. Thus, the timing, location, and perhaps identity of the H3kinase, and not the H3S10 modification alone, determines downstream events. [B]. Another example ofhow the order of implementation of histone modifications can affect transcription comes from work fromWang et al. (2009). They report that despite correlations between histone acetylation and H3K4 methylation,artificially increasing acetylation through treatment of cells with deacetylase inhibitors (HDACs) does notlead to productive transcription, despite the presence of H3K4 methylation and Pol II recruitment. There-fore, patterns of histone modifications cannot simply be "read" but instead have distinct effects dependingon the cellular context and upstream signaling events. Adapted from [Zippo et al., 2009] & [Wang et al.,2009].
1.5.2 Histone Code in DNA Damage Response
Given that chromatin is the physiological template for all DNA-based cellular processes, itsstructure fulfills essential functions not only by condensing and protecting DNA but alsoin terms of maintenance of genome stability and controlling gene repression. However, thecomplexity and compactness of chromatin structure presents an obstacle in dealing withsuch structures as DNA lesions, which has to be repaired or eliminated in order to preservegenome stability and to faithfully transmit genetic information across generations. This canonly be made possible due to the dynamic nature of chromatin. Recent studies suggest thatthe chromatin changes not only help to overcome the obstacles to repair machinery, butthat chromatin also plays an active role in DNA damage response (DDR) , a complex signal

1.5. Histone Code Hypothesis 45
transduction pathway that starts by sensing DNA damage and transduces this informationto trigger cellular responses to DNA damage. Various mechanisms such as DNA methy-lation [Kulis and Esteller, 2010], incorporation of variant histones [Talbert and Henikoff,2010], histone PTMs [Bannister and Kouzarides, 2011], and nucleosome repositioning byATP-dependent remodeling complexes [Clapier and Cairns, 2009] have been suggested tobe involved in DDR.
Recent evidences suggest that the mechanisms similar to the histone code in transcriptionregulation, might exist for DNA damage response [Zhu and Wani, 2010] ; [Mendez-Acunaet al., 2010], where various chromatin modifications function by sensing and marking thelesion, recruiting components of repair machineries, facilitating their action, and finally re-assemble the chromatin into its original form [Ikura and Ogryzko, 2003] ; [Escargueil et al.,2008]; [Zhu and Wani, 2010]. Below we describe the functions of various chromatin modifi-cations and their possible combinatorial patterns before, during and after DNA damage.
I Histone Modifications Before DNA Repair
While studying the DNA damage response in cellular context, the modifications ofchromatin structure have to be considered pivotal, as chromatin is the physiologicalsubstrate for the DDR machinery. When we talk about chromatin modifications, it en-compass DNA methylation, histone PTMs, incorporation of variant histones and ATP-dependent nucleosome remodeling. However, we will focus our discussion to varioushistone PTMs that take part in cellular DDR pathways, although ATP-dependent nu-cleosome remodeling activities are also an integral part of such pathways, making thelesion more accessible to the damage sensing proteins and exposing some constitu-tive HFD modifications that are usually hidden under normal circumstances [Kruhlaket al., 2006].
• Histone Phosphorylation
H2AX phosphorylation
Among the histone PTMs in DDR, the earliest, best characterized and still in-tensively studied hallmark modification is the phosphorylation of H2AX to formγH2AX, which spreads, within minutes, to around 2 Mb of DNA region (in hu-man cells) around the lesion and forms foci that are easily detectable by im-munofluorescence microscopy [Rogakou et al., 1998]. In yeast, phosphorylatedH2A can be detected as far as 50 kb on either side of double-strand break [Shroffet al., 2004]. H2AX, as described earlier, is one of the H2A variants in humans, thatis expressed constitutively, distributed throughout the genome and constitutesabout 2-25% of histone H2A depending upon the cell type [Redon et al., 2002]. Thephosphorylation of H2AX occurs at the serine 139 of the H2AX in humans, presentin a highly conserved SQ(E/D) motif in its extended C-terminal domain (corre-sponding to yeast S128 of histone H2A [Downs et al., 2000]). H2AX is known tobe phosphorylated by members of phosphatidylinositol-3-OH-kinase-like kinases(PIKKs), principally ATM (Tel1 in S. cerevisiae), ATR (Mec1 in S. cerevisiae) and

46 Chapter 1. Introduction
DNA dependent protein kinase (DNA-PK; also known as PRKDC) in response togenomic insult. ATM and DNA-PK function redundantly to phosphorylate H2AXafter ionizing radiation (IR) [Stiff et al., 2004], while ATR phosphorylates H2AXin response to replication stress and UV irradiation [Ward and Chen, 2001]. DNA-PKcs is known to mediate H2AX phosphorylation in hypertonically stressed cellsas well as in response to DNA fragmentation during apoptosis [Reitsema et al.,2005]; [Mukherjee et al., 2006].
How do phosphorylation of H2AX influences the state of cellular DDR has beenactively investigated. Research has shown that the phosphorylation of H2AX it-self does not affect the chromatin organization, but rather has a role in the lo-calization of repair factors at the break. The importance of this modification washighlighted by the knockout studies where H2AX−/− cells or cells with H2AX-S139A mutation showed sensitivity to ionizing radiation or camptothecin [Ce-leste et al., 2002]. Although the presence of γH2AX is not required for the initialrecruitment of signaling and repair factors [Celeste et al., 2003], it is found to beessential for their accumulation and retention at the breaks and for the amplifica-tion of DDR signal [Celeste et al., 2002]; [Paull et al., 2000]. It has been shown thatH2AX phosphorylation generates a carboxyl-terminal phospho-motif that is thenrecognized by the tandem BRCA1-carboxyl-terminal (BRCT) domain-containingprotein, mediator of DNA damage checkpoint 1 (MDC1) [Stucki et al., 2005].MDC1 acts as a critical scaffold for mediating downstream events, and alongwith γH2AX, leads to the recruitment of two downstream protein complexes:MRE11RAD50NBS50 [Chapman and Jackson, 2008]; [Melander et al., 2008]; [Spy-cher et al., 2008] and an E2/E3 ubiquitin ligase complex, UBC13/RNF8 [Wangand Elledge, 2007]; [Kolas et al., 2007]. It is also to be noted that H2AX is phos-phorylated in its C-terminal domain, a region of the nucleosome where the DNAenters and exits. In condensed structures, such as the 30-nm fibre, this region ofthe nucleosome is obscured at the center of the fiber. In order to efficiently phos-phorylate this motif, decondensation of the chromatin might be required throughthe action of ATP-dependent nucleosome remodeling complexes [Kruhlak et al.,2006]. In this context, it has been shown that in the absence of RSC (Remodelsthe Structure of Chromatin Complex) or SWI/SNF mediated nucleosome remod-eling, although the phosphorylation of H2AX is not lost, it is delayed or reducedrelative to that in wild-type cells [Shim et al., 2007]; [Park et al., 2006b]. This sug-gests that chromatin remodeling might either facilitate the exposure of this motifto the PIKKs or allow the efficient translocation of the PIKKs along the flankingchromatin to phosphorylate the H2AX molecules. Another mechanism by whichPIKKs gain entry into the condensed chromatin is through phosphorylation oflinker histone H1. It has been noted earlier that the C-terminal phosphorylablemotif of H2AX is located inside of the 30-nm chromatin fiber,i.e., very close towhere linker histone is bound, accordingly, one can speculate that the phospho-rylation of linker histone, known to decondense chromatin [Contreras et al., 2003]; [Hale et al., 2006], exposes the hidden C-terminal domains of H2AX.

1.5. Histone Code Hypothesis 47
The very large domains of γH2AX around double strand breaks (DSBs) are alsothought to be binding platforms for cohesins. These are proteins responsible fortethering sister chromatids together [Unal et al., 2004], which has been shownto support chromosome stability and keep DNA ends in close proximity for therepair process [Unal et al., 2004].More recently, histone H2AX was found to be phosphorylated at another C- ter-minal residue Y142, mediated by WSTF (WilliamsBeuren syndrome transcriptionfactor, also known as BAZ1B) , a component of the WICH complex (WSTF-ISWIATP-dependent chromatin-remodeling complex) [Xiao et al., 2009]. This phos-phorylation is critical for the DDR as it may be needed initially at the break toadjust local chromatin structure for the later maintenance of H2AX-S139 phos-phorylation. Subsequent dephosphorylation of Y142 could act to enhance MDC1and ATM recruitment to extend and maintain H2AX phosphorylation after DNAdamage. Finally, the absence of Y142 phosphorylation may lead to alteration inthe kinetics of phosphorylation/dephosphorylation cycle of γH2AX, such thatboth the phosphorylation and dephosphorylation of γH2AX on S139 occur muchmore rapidly, and the foci assemble and disassemble in less than 4 h [Xiao et al.,2009]. At the same time, EYA1 (Eyes Absent) [Krishnan et al., 2009], was shownto be the protein phosphatase targeting H2AX-Y142ph in DNA damage signal de-pendent pathway. This modification, hence determines the recruitment of eitherpro-apoptotic or DNA repair complex to γH2AX in response to DNA damage, al-lowing it to function as an active determinant of repair/survival versus apoptoticresponses to DNA damage [Cook et al., 2009].Histone H1 PhosphorylationThe linker histone H1, which seals the nucleosome at the DNA entry and exitpoints, is important for the stability of higher order chromatin structure. Incorpo-ration of linker histone into nucleosomes inhibits DNA end-joining by DNA ligaseIV/XRCC4 (LX) in vitro. Since LX is important for non-homologous end joining(NHEJ), the linker histone may inhibit NHEJ-mediated DNA repair. However,this inhibition is compromised by the phosphorylation of histone H1 by DNA-PK, which reduces its affinity for DNA and decreases its capacity to inhibit end-joining, thereby facilitating NHEJ-mediated repair [Kysela et al., 2005].
• Histone UbiquitinationThe ubiquitination of specific histone residues has emerged as an important post-translational modification that regulates DNA damage responses. Histone ubiq-uitination participates in chromatin remodeling and facilitates the accumulationof DNA damage sensing and repair proteins at the sites of DNA damage. As dis-cussed earlier, after induction of γH2AX, MDC1 is recruited, which in turn re-cruits the UBC13/RNF8 complex to the sites of DSBs. As a consequence, γH2AXbecomes ubiquitinated on chromatin surrounding the DSBs. The ubiquitinationis initiated by UBC13/RNF8 (E2/E3) ubiquitin ligase complex, and the ubiquitinconjugates are amplified by another E3 ligase RNF168 [Doil et al., 2009]; [Stewartet al., 2009]. Its recruitment depends upon the interaction and docking of FHA

48 Chapter 1. Introduction
domains of RNF8 onto the phosphorylated TQXF motifs in MDC1. H2AX phos-phorylation is a pre-requisite for this ubiquitination of H2AX as its ubiquitinationis impaired in S139-mutants [Huen et al., 2007].
Ubiquitination leads to the formation of K63linked polyubiquitin chains on bothγH2AX and H2A, leading to subsequent recruitment of Rap80/Abraxas/ Brca1/Brcc36 complex [Wang and Elledge, 2007]. Not surprisingly, Ubc13deficient cellsare compromised for homologous recombination (HR) pathway of DSB repair[Zhao et al., 2007]. It has been shown that it is the ubiquitination of H2A ratherthan γH2AX, which is a more critical event in subsequent signaling cascade inDDR as mutations of all lysines in H2AX neither abrogate the accumulation ofubiquitin conjugates at DSBs nor affect the recruitment of downstream factors[Doil et al., 2009]. In addition to H2A and γH2AX, histone H2B has also beenfound as a substrate of RNF8 [Wu et al., 2009]. It is not known whether H2B ubiq-uitination contributes to DDR in mammalian cells, although absence of histoneH2B ubiquitination at K123 in yeast negatively affects the DDR induced by UVdamage [Giannattasio et al., 2005]. H2A ubiquitination by UBC13/RNF8 ubiqui-tin ligase complex also occurs at the sites of UV-induced DNA damage [Marteijnet al., 2009]. Depletion of these enzymes causes UV hypersensitivity, without af-fecting nucleotide excision repair (NER) , suggesting that UBC13 and RNF8 areonly involved in initial UV-induced DDR signaling and not the repair itself. TheDDR signaling and recruitment events at UV-induced DNA damage sites are sim-ilar to recruitment events at DSBs as MDC1-dependent RNF8 recruitment is ob-served at the sites of UV damage, but requires ATR as well as NER-generatedsingle stranded repair intermediates. Thus, there may be a conserved commonpathway of H2A ubiquitination for both DSBs and UV lesions.
UV irradiation results in a CUL4-DDB-ROC1dependent increase in the levels ofH3 and H4 ubiquitination [Wang et al., 2006]. The enzyme CUL4-DDB-ROC1 isalso known to ubiquitinate DDB2 and XPC at UV damage sites [El-Mahdy et al.,2006]; [Sugasawa et al., 2005]. A small fraction of histone H3 and H4 (0.3% and0.1%, respectively) is found ubiquitinated in vivo, and siRNA-mediated knock-down of CUL4A,B and DDB1 decreases the H3 and H4 ubiquitination levels. Inaddition, the dynamics of CUL4DDBROC1-mediated H3 and H4 ubiquitination issimilar to that of XPC. Further evidence showed that CUL4-DDB-ROC1-mediatedH3 and H4 ubiquitination results in histone eviction from nucleosomes by weak-ening DNA-histone interactions that in turn facilitates recruitment of NER repairproteins like XPC to the damaged foci. Hence, these studies point to a role of H3and H4 ubiquitination in chromatin disassembly at the sites of UV lesions [Wanget al., 2006].
Another DNA damage related mono-ubiquitination has also been observed in hi-stone H4 at histone fold residue K91 [Yan et al., 2009]. BBAP (B-lymphoma andBAL-associated protein) is a RING domain containing E3 ligase that selectivelymono-ubiquitinates histone H4K91 and protects cells exposed to DNA-damagingagents. The presence of this modification in the HFD suggests its substantial im-

1.5. Histone Code Hypothesis 49
pact on the nucleosome conformation. As ubiquitin is a large molecule, it altersthe histone folding and may expose some buried residues like H4K20me, whichare known binding sites for checkpoint mediators like 53BP1 [Botuyan et al.,2006]. Disruption of BBAP-mediated mono-ubiquitination of histone H4K91 isassociated with the loss of chromatin-associated H4K20 methylase, mono- anddimethyl H4K20, and a delay in the kinetics of 53BP1 foci formation at sites ofDNA damage [Yan et al., 2009].
• Histone Acetylation & Deacetylation
To achieve accurate DNA damage repair, the chromatin needs to be relaxed inorder to facilitate access for the repair factors at the site of the DNA lesion. Hi-stone modifiers and ATP-dependent chromatin remodelers are recruited at thebreak to modulate the chromatin architecture. The destabilization of the nucle-osome is thought to require acetylation of histones through the action of HATs.Evidence suggests a link between histone acetylation and DNA repair by ana-lyzing TIP60 histone acetyltransferase (HAT) and the proteins associated withit in the TIP60 complex [Ikura et al., 2000]. Since, a transient acetylation of H3and H4 in their amino-terminal tails has been found to occur at DSBs in bothmammalian and yeast cells [van Attikum and Gasser, 2005], a direct link show-ing that this acetylation is mediated by Tip60 complex (comprises of Tip60 HAT,SNf2-related p400, TRRAP , and other components) in mammals or its homologueNuA4, SWR1, and INO80 in yeast is provided by Murr and colleagues [Murr et al.,2006]. This large multiprotein complex acetylates several lysine residues (H3 K14,K23, H4 K5, K8, K12, and K16) of core histones in vitro [Kimura and Horikoshi,1998]. It has been shown that mutations of N-terminal lysine residues in H4 con-fer sensitivity to ionizing radiation and defective cell cycle checkpoints [Tam-burini and Tyler, 2005]; [Murr et al., 2006]. Tip60 is recruited to DSBs, where itbinds to and acetylates H4 with cofactor TRRAP [Murr et al., 2006]. Depletion ofTRRAP impairs recruitment of DNA repair protein 53BP1 and RAD51 but notMDC1, and affects DSB repair. In addition to H3 and H4 acetylation, the hu-man Tip60 complex also acetylates γH2AX in response to ionizing radiation in-duced DSBs. Moreover, Tip60 forms a complex with UBC13 to promote the DNA-damage-dependent ubiquitination of acetylated γH2AX [Ikura et al., 2007]. Theseresults suggest that the Tip60-mediated acetylation of γH2AX is most likely a pre-requisite for its ubiquitination. Given that UBC13-dependent ubiquitylation ofγH2AX is in turn necessary for eviction of this variant, we can assume that TIP60and ubiquitination facilitate γH2AX dephosphorylation and/or turnover [Keoghet al., 2006]. Hence, recruitment of Tip60 and subsequent acetylation and ubiqui-tination of γH2AX represent an important cross-talk mechanism during DDR.
hMOF (males absent on the first) is a Tip60 related histone acetyltransferase (HAT)that has been shown to interact with ATM kinase [Gupta et al., 2005]. This inter-action is directly reflected in the activity of ATM and its downstream events inDDR. It has been observed that expression of a dominant negative hMOF mu-tant blocked IR-induced increases in histone H4K16 acetylation and resulted in

50 Chapter 1. Introduction
decreased ATM autophosphorylation, ATM kinase activity, and phosphorylationof downstream effectors of ATM and DNA repair, while increasing sensitivity toIR-induced cell killing. In addition, decreased hMOF activity was associated withloss of the cell-cycle checkpoint response to DSBs. Taken together, these resultssuggest that hMOF functions upstream of ATM and its modification of histoneH4 may contribute to DSB sensing.
The histone acetylation is regulated by the concerted action of histone acetyltrans-ferases (HATs) and histone deacetylases (HDACs), which work by adding andremoving acetyl groups from lysine residues respectively. The acetylation of hi-stone H3K56 in response to DSB repair in human cells has been a matter of de-bate [Das et al., 2009]; [Tjeertes et al., 2009]. Das et al. showed that DNA damagingagents, such as IR, UV, hydroxyurea, and MMS induce histone H3K56 acetyla-tion in human cells, and histone acetyltransferase CBP/ p300 is responsible forsuch an acetylation. Acetylated H3K56 co-localizes with γH2AX immediately fol-lowing IR, indicating that the acetylated H3K56 is enriched at the sites of DNAdamage. Moreover, acetylated H3K56 is assembled into chromatin at the sitesof DNA repair by CAF-1 and Asf1. By contrast, Tjeertes et al. observed that theH3K56 acetylation was rapidly and reversibly reduced in response to DNA dam-age. Histone acetyltransferase GCN5/KAT2A, rather than CBP/p300 acetylatesH3K56 in vitro and in vivo. However, a recent work of SP Jackson’s group high-lighted the role of HDACs in DDR. It has been shown that human histone deacety-lases HDAC1 and HDAC2 are the two participants that function in the DDRpathway [Miller et al., 2010]. It was observed that acetylation of histone residuesH3K56 and H4K16 was regulated by HDAC1 and HDAC2 and that HDAC1 andHDAC2 were rapidly recruited to DNA-damage sites to promote hypoacetylationof these two residues. Furthermore, HDAC1- and 2-depleted cells were hypersen-sitive to DNA-damaging agents and showed sustained DNA-damage signaling,phenotypes that reflect defective DSB repair, in particular by non-homologousend-joining (NHEJ) pathway. Collectively, these results show that HDAC1 andHDAC2 function in the DNA-damage response by promoting DSB repair.
• Histone Methylation
Histone H3K79 methylation and H4K20 methylation are important modificationsinvolved in DDR. These modifications represent the constitutive marks, buried inthe chromatin structure, not induced by DNA damage. It has been reported thatmethylation of H4K20 recruits mammalian repair factor 53BP1 (Crb2 in fissionyeast/Rad9 in Saccharomyces cerevisiae) to the sites of DSB [Botuyan et al., 2006].The same work had shown that the tandem tudor domains of 53BP1 recognizeand bind specifically to H4K20me2, and this binding may work in conjunctionwith its BRCT domain-dependent recognition of γH2AX by 53BP1. This methyla-tion is mediated by the histone methyltransferase PR-SET7 [Botuyan et al., 2006],and PR-SET7 appears to be crucial for the maintenance of genome integrity andS-phase progression [Houston et al., 2008];

1.5. Histone Code Hypothesis 51
II Chromatin Dynamics After DNA Repair
In order to fully comprehend the distinct roles of histone modifications during thecourse of DDR, it is imperative to distinguish the events occurring before and after therepair of DNA damage. First, the chromatin structure has to be modulated to allowaccess of repair factors to the damaged DNA, however, after the damage is removed,the DNA damage signal has to be switched off. It is becoming increasingly apparentthat some histone modifications occur as "post-repair" events, as they are linked tothe restoration of chromatin after DNA repair. The plethora of histone modificationsoccurring upon DNA damage induction suggest that the chromatin in the vicinity ofdamaged sites undergoes substantial processing and rearrangements. Thus, it is in-tuitive to reason that histone modifications are also critical steps in the execution ofpost-repair DDR.
• Histone Phosphorylation & Dephosphorylation
H4S1 is phosphorylated by the complex casein kinase II (CK2) in response toDNA damage [Utley et al., 2005]; [Cheung et al., 2005]. CK2 associates with theHDAC complex Sin3Rpd3, which facilitates late events in the repair process. In-terestingly, phosphorylation of H4S1 inhibits the ability of NuA4 to acetylate theN-terminal tail of H4, suggesting a mechanism by which the chromatin modifica-tions are re-established. In other words, after the NuA4-dependent acetylation isremoved by the HDAC Sin3Rpd3, the associated CK2 phosphorylates H4S1, thuspreventing reacetylation by NuA4 and turning off DNA-damage signals.
Another study showed that at late time points after irradiation, at late time points,the H2B N-terminal tail residue S14 is rapidly phosphorylated at DSB sites [Capetilloet al., 2004]. This induction of H2B-S14ph is independent of γH2AX, however, theirradiation induced foci (IRIF) of H2B-S14ph are dependent on γH2AX. It has alsobeen shown that the kinetics of H2B-S14ph IRIF formation is significantly delayedwith respect to γH2AX, which may indicate that H2B-S14ph foci are a late eventin response to DSBs [Capetillo et al., 2004]. Furthermore, this modification maylead to greater condensation of chromatin around the break in a manner similarto nuclear condensation during apoptosis, and γH2AX may lead to accumulationof the H2B kinase. This phosphorylation is mediated by sterile 20 kinase (Mst1)and is well known for its role during apoptosis [Cheung et al., 2003], therefore itcould play a direct role in regulating chromatin condensation at sites of DSBs.
The elimination of γH2AX from chromatin surrounding the repaired DSB canbe regarded as a signal to the cell that the repair process is achieved. There aretwo ways to eliminate γH2AX, either by eviction or dephosphorylation. It hasbeen speculated that the presence of SWR1 at the break may allow γH2AX re-moval from chromatin surrounding the DSB [Altaf et al., 2007]. Alternatively,γH2AX signal can be turned down by dephosphorylation through the action ofprotein phosphatases PP2A and PP4C [Chowdhury et al., 2005]; [Chowdhuryet al., 2008], and more recently added to this list, hPP6 and hWip1 [Douglas et al.,2010]; [Macurek et al., 2010]. It is speculated that γH2AX is evicted from chro-

52 Chapter 1. Introduction
matin proximal to DSB, whereas it is dephosphorylated in the chromatin fartheraway. This model is supported by two different dynamics of γH2AX accumula-tion and/or removal, depending on the position relative to the break [Savic et al.,2009].
• Histone UbiquitinationHuman histone H2A has been found to be mono-ubiquitinated at K119 in thevicinity of UV-induced DNA lesions [Bergink et al., 2006]. The UV-induced ubiq-uitination requires functional NER, and coincides with the sequestration of PCNA,suggesting that the ubiquitination is linked to DNA repair. Since ubiquitin mu-tations that eliminate all lysine residues from ubiquitin do not affect the H2Aubiquitination, mono-ubiquitination, instead of poly-ubiquitination, is the mostprobable feature of this NER-dependent process. Further studies suggest that theobserved H2A ubiquitination may be a post-repair process related to chromatinrestoration [Zhu et al., 2009]. As determined by the formation of H2A-K119ub fociat local UV damage sites, dynamics of H2A-K119ub and XPC foci formation ex-hibits a clear temporal difference. For example, XPC foci are seen in almost all thedamaged cells within 15 min and completely disappear at 4 h after local UV irra-diation. On the other hand, the H2A-K119ub foci persist for 24 h post-irradiation,suggesting that the formation of H2A-K119ub foci is not directly associated withdamage recognition. More importantly, the H3H4 chaperone CAF-1 is requiredfor H2A-K119ub foci formation. Depletion of CAF-1 p60 by siRNA impairs re-cruitment of CAF-1 to DNA damage and eliminates H2A-K119ub foci. Moreover,the H2A ubiquitin ligase Ring2/Ring1b, a component of PRC2, is not detected atdamage sites [Zhu et al., 2009]. Therefore, it is very likely that H2A ubiquitina-tion occurs at newly assembled nucleosomes, or the H2A-K119ub is deposited onDNA repair region from an existing pool.It must be noted that the UV-induced H2A ubiquitination differs from γH2AXor H2A ubiquitination, observed following IR, in many ways. First, RNF8 andUBC13 are known to form K63-ubiquitin poly-ubiquitin chains [Plans et al., 2006].Second, the ubiquitination by RNF8 is dependent on γH2AX and MDC1, whereBRCT domain of MDC1 binds γH2AX. Deficiency in γH2AX abolished RNF8 re-cruitment and eliminated IR-induced ubiquitination after IR [Huen et al., 2007]. Incontrast, γH2AX deficiency did not affect UV-induced H2A ubiquitination [Berginket al., 2006]. Therefore, H2AX ubiquitination is integral part of checkpoint signal-ing in response to DSBs and UV-induced DNA damage, while NER-dependentH2A mono-ubiquitination is related to the chromatin restoration after repair ofUV-induced lesions.
• Histone Acetylation & DeacetylationRecent studies have uncovered a role of histone H3K56 acetylation in chromatinassembly following DNA replication and DSB repair [Chen et al., 2008]; [Li et al.,2008]. It was found in yeast that H3K56 acetylation drives Asf1-dependent re-assembly of chromatin after the completion of DSB repair [Chen et al., 2008].Mutation of K56 to glutamine, mimicking permanent acetylation, partially by-

1.5. Histone Code Hypothesis 53
passes the requirement of Asf1 in resistance to DSB-generating agents. Never-theless, DSB repair itself was operational in Asf1 mutants. On the other hand,lack of H3K56 acetylation in HAT Rtt109 mutants leads to persistence of DNAdamage signals in the form of prolonged phosphorylation of checkpoint pro-tein Rad53. These observations indicated that restoration of chromatin, driven byacetylated H3K56, is a "turn off" signal and points towards the completion of DSBrepair. Similarly, CAF-1 is involved in chromatin restoration, driven by acetylatedH3K56 [Li et al., 2008]. H3K56 acetylation promotes the association of histone H3with CAF-1 and Rtt109, and facilitates CAF-1-dependent nucleosome assembly,thus, coordinating the function of H3H4 chaperones in nucleosome assembly.
The action of HDACs is regarded as a late event in the DNA-repair process andfunctions to reduce the amount of histone acetylation once repair has been com-pleted [Tamburini and Tyler, 2005]. Therefore, HDACs may have a role in therestoration of the original acetylation state, which eventually leads to the recov-ery of the higher-order chromatin structure, once the DNA repair is finished.Likewise, the reduction of chromatin relaxation upon deacetylation contributesto the termination of the associated checkpoint activity [Murr et al., 2006]. A linkbetween mammalian HDAC3 and the repair of DSBs has recently been discov-ered [Bhaskara et al., 2008]. Although its precise role in repair is unknown, giventhat HDAC3 is an essential component of the N-CoR/SMRT repression complex,it can be speculated that it could be involved in reinstating the acetylation status,which would give rise to a repressive chromatin structure.
• Chromatin Restoration
During cell proliferation, histone modifications are tightly associated with DNAreplication-coupled nucleosome assembly. As DNA replicates, the parental his-tones are randomly transferred onto either the leading or the lagging strand [Jack-son, 1988]. For chromatin restoration after DNA repair it is logical to assumethat histone chaperones, such as chromatin assembly factor-1 (CAF-1), Asf1, andFACT are involved and recruited to the site of DNA damage and hence repre-sent an integral part of DDR, reviewed in [Ransom et al., 2010]. When nucleo-somes are disrupted during the repair process, H2A-H2B dimers and one H3-H4 tetramer are separated and later is randomly transfered to one of the nascentDNA strands. These histones then serve as a template for newly synthesized hi-stones to be deposited with the correct histone variant and modifications, whichrepresent the original state of the chromatin. The H3-H4 tetramer deposition in-volves histone chaperones, and among them, chromatin-assembly factor 1 (CAF-1) plays a pivotal role in chromatin assembly during DNA replication and DNArepair [Green and Almouzni, 2003]; [Polo et al., 2006]. CAF-1 is an evolutionaryconserved protein complex, consisting of various subunits (p150, p60, and p48),with a unique ability to preferentially deposit newly synthesized H3 and H4 ontoreplicating DNA [Shibahara and Stillman, 1999]. It has been shown that histoneH3.1/H4 and H3.3/H4 tetramers make complex with two different predeposi-tion complexes: CAF-1 and HIRA, respectively [Tagami et al., 2004], where CAF-

54 Chapter 1. Introduction
1 is necessary to mediate replication dependent nucleosome assembly. Throughits interaction with PCNA, a DNA polymerase processivity factor, CAF-1 is tar-geted to the sites of DNA synthesis and deposit H3.1-H4 dimers onto nascentDNA strands [Benson et al., 2006]. CAF-1 works alongside with another H3-H4 chaperone Asf1, which synergistically cooperates with CAF-1 in DNA re-pair and replication-coupled chromatin assembly [Mello et al., 2002]. It has alsobeen shown that CAF-1 is required for Ring1b-dependent mono-ubiquitinationof H2A-K119, a mark involved in the chromatin restoration after the UV-inducedDNA damage [Zhu et al., 2009].
During chromatin reassembly after DNA repair, it is important to preserve or re-cover the epigenetic information specific to a particular chromatin domain. Cellshave evolved mechanisms to inherit this information by reproducing original his-tone modification pattern and/or replacement of "correct" histone variant. PCNAmolecules, acting as a hub, recruits a number of chromatin-modulating enzymes,for example, DNA methyltransferase DNMT1 and CAF-1, to re-establish epige-netic memory based on DNA methylation and histone modifications. Both DNMT1and CAF-1 also have the ability to recruit histone modifying enzymes for PTMs.For example, DNMT1 interacts with H3K9 methyltransferase G9a [Esteve et al.,2006] and EZH2 component of PRC2 [Vire et al., 2006], which catalyzes trimethy-lation of H3K27. PRC2 binds to H3K27me3 and colocalizes with this modifica-tion in G1 phase, and with the sites of ongoing DNA replication [Hansen et al.,2008]. The ability of PRC2 to recognize a previously established mark triggers itsrenewal [Margueron et al., 2009], in accord with the general "epigenetic templat-ing" scheme of reproduction of epigenetic information (see Section1.2. DNMT1also forms a complex with G9a, which is required for recruitment of G9a to repli-cation sites and for maintenance of H3K9 methylation at epigeneticaly silencedrDNA repeat [Esteve et al., 2006]. CAF-1 also plays a role in maintaining the re-pressed state of silenced chromatin [Houlard et al., 2006]. Consistent with this, ithas also been shown that depletion of CAF-1 p150, In embryonic stem cells, resultsin the alteration of epigenetic histone methylation marks at the level of pericentricheterochromatin. Additionally, CAF-1 is found to link replication-coupled chro-matin assembly to DNA and histone H3K9 methylation [Reese et al., 2003]; [Sar-raf and Stancheva, 2004]. CAF-1 forms a replication-dependent complex withH3K9 methyltransferase SETDB1 and MBD1, a protein that binds to methylatedCpG dinucleotide. This complex is required for maintenance of H3K9 methyla-tion and stable silencing of certain genes in proliferating cells. During DNA repli-cation, MBD1 recruits SETDB1 to CAF-1 p150 and mediates H3K9 methylationin replication-coupled chromatin assembly. A similar mechanism also operatesfor H3K9 methylation of newly synthesized H3 deposited by CAF-1 in pericen-tric heterochromatin [Loyola et al., 2009]. In this case, SETDB1 associates withHP1α-CAF-1 complex and monomethylates H3K9 on non-nucleosomal histoneH3, providing H3K9me1 for further trimethylation in pericentric regions. Whileboth HP1 and CAF-1 are reported to localize to the sites of DNA damage [Green

1.5. Histone Code Hypothesis 55
and Almouzni, 2003]; [Luijsterburg et al., 2009], it is not known whether HP1α-CAF-1-SETDB1 complex works in DNA repair-dependent nucleosome assembly.
All this data suggest that histone chaperones along with chromatin modifying en-zymes play an essential role in restoring the state of chromatin back to its originalpre-DNA damage form. However, further studies are required to reveal the de-tails of molecular interactions among various chromatin modifiers, remodelers,and histone chaperones in repairing DNA and faithfully reinstating the biologicalinformation associated with chromatin.
Figure 1.14: Histone modifications in DNA damage response. Adapted from [Zhu and Wani, 2010].
In recent years, a remarkable progress has been made in revealing an orchestra of histonePTMs and their effector proteins in DDR. The ultimate goal for the cells after DNA damageand repair is the restoration of chromatin to its original state. It becomes evident that varioushistone PTMs organize this response for the prompt execution of checkpoint signaling, DNA

56 Chapter 1. Introduction
repair and reinstatement of chromatin architecture. Timing and features of modifications ap-pear to be critical factors in determining the physiological effect of a specific modification.For example, H3 acetylation occurs both before and after DSB repair. The former, acetyla-tion at H3K14 and H3K23, leads to γH2AX ubiquitination, checkpoint activation, and DNArepair [Ikura et al., 2007]. On the other hand, the latter, H3 acetylation at K56, leads to restora-tion of chromatin and termination of checkpoint activation [Chen et al., 2008]. Also, the sameconcept appears to hold true for histone ubiquitination. The γH2AX and H2A ubiquitinationlead to checkpoint signaling, whereas the H2A ubiquitination after NER is associated withchromatin restoration. Similarly, literature indicates that specific combinations of chromatinmodifications, read by distinct effector proteins along with ATP-dependent chromatin re-modeling allow binding of DNA repair factors and efficient healing of the DNA lesion. Forinstance, it has been shown that mammalian SWI/SNF remodeler is critical for efficient in-duction of γH2AX [Park et al., 2006b], because inhibition of its catalytic core subunits, BRG1and Brm, compromises phosphorylation and subsequent foci formation of H2AX. More re-cently, Lee and colleagues have shown that SWI/SNF binds to γH2AX containing nucleo-somes via an interaction between its bromodomain-containing BRG1 subunit with GCN5-dependent acetylated H3, and this binding is important for DSB repair [Lee et al., 2010].
These scenarios or more precisely different combinations of modifications along with theirdocking proteins raise an important question whether these modifications are an extensionof histone code in the context of DDR? Although there is a degree of overlap in chromatinmodifications in DDR to various different DNA damaging agents, evidence shows certainlevel of specificity of particular modifications occurring in response to particular type ofDDR and repair, e.g. poly-ubiquitination of γH2AX in response to DSBs and UV-inducedDDR in contrast to NER-dependent H2A mono-ubiquitination. It might be possible that theinitial response of the cells to various DNA insults is conserved, however, it is only laterthe cell decides to follow a certain response trajectory depending upon the DNA lesion andthe choice of DNA repair pathway it is going to employ. We can intuitively observe thiskind of phenomena by going back to Waddington’s epigenetic landscape [Figure 1.1], wheredynamic histone modifications and their binding partners, on the crossroads of various pos-sible trajectories, dictate and influence the cellular decision making for DDR and repair. Thiswill again lead us towards our question if a "histone code" really exist for DDR. However, thedeciphering of this code requires better understanding of detailed molecular mechanisms bywhich each modification functions in a specific DDR pathway.
1.6 Methodologies to Study Histone Post-Translational Modifica-tions
Biological research in the post-genomic era has been accelerated by the advent of new method-ologies to explore the proteomes, which not only complement the existing information avail-able through the analysis of genomes but also provide opportunities to look beyond thegenomes. In this proteomics era, the fundamental challenge of molecular and cell biology is

1.6. Methodologies to Study Histone Post-Translational Modifications 57
to unravel the mechanisms and pathways that govern the proper functioning of a cell. Since,all cellular processes inevitably involve proteins, their abundance, post-translational modifi-cation (PTM) state, and localization has come into the limelight of proteomics research. Thecharacterization of protein post-translational modifications, in particular, has contributedextensively to our understanding of many key aspects of cellular processes both during nor-mal functioning and diseased states. Different modifications influence each other in an in-terdependent manner and lead to an intricate network of cellular signaling that by affectingproteinprotein interactions, enzymatic activities and their sub-cellular localizations, regulatethe subtle balance of various cellular functions. A wide spectrum of these PTMs exist on pro-teins ranging from relatively small groups such as methyl, acetyl and phosphoryl groups tothe attachment of larger sugar moieties or the addition of small peptides like Ubiquitin andSUMO to a protein of interest [Walsh, 2005].
Histones, small basic proteins that fundamentally function to pack eukaryotic genomes,are among the best characterized proteins in terms of their post-translational modifications,their combinatorial patterns and their pivotal role in various DNA-based cellular processes,such as transcription, replication, DNA damage response etc. ([Section 1.4.4]). As discussedabove, histone PTMs function either alone or in a combinatorial fashion to store and translateepigenetic information in the form of a histone code, and thus have an enormous potentialfor regulating DNA-based processes by selectively and appropriately using this information.One of the biggest challenges for proteomics has been to analyze these codes in a quantitativeand reliable way in order to get insight into the complex signaling mechanisms regulated bythese codes. Here we review both the historical and recent progress towards routine andrapid histone PTM analysis, mainly focusing on mass spectrometry-based methods for thestudy of histone PTMs. However, a brief description of non-MS-based methods along withtheir disadvantages is also presented in the beginning.
1.6.1 Classical Methods
The chromatin in eukaryotic cells is perceived as a dynamic structure, where the interplayof various histone PTMs determines the output of all the DNA-templated cellular processes.Histone PTMs are, therefore, the fundamental regulators of all DNA-based cellular processesand, consequently, their characterization has been the focus of proteomics methodologiesduring the last decade. Traditionally, targeted approaches were used to measure the abun-dance of various PTMs of histones, however, due to their inability to measure these changesin a combinatorial way, they only provide a glimpse of a complex system governing theessential DNA-based cellular processes. Classical methods to analyze histone PTMs weremainly based on microsequencing and immunoassays.
• Microsequencing
Classically, histone modifications have been detected using specialized gel systemswith or without the incorporation of radioactive precursor molecules, which is fol-lowed by a complete protein hydrolysis and the subsequent analysis of resulting amino

58 Chapter 1. Introduction
acids [Waterborg and Matthews, 1983]; [Waterborg, 1993]. As majority of these mod-ifications were found on N-termini of histones, it was possible to map these modifi-cations using Edman degradation, which is a method of amino acid sequencing [So-bel et al., 1994]. However, although these procedures can be automated, they requirelarge amount of purified material, in addition to multiple time consuming purificationsteps. Also, using Edman sequencing, only 25-30 residues can be routinely character-ized. Due to these reasons, they were not feasible for comprehensive analysis of histonePTMs from small cell numbers and the combinatorial histone codes.
• Immunoassays
The antibody based immunoassays have been developed in late 1980’s when researchers,in the quest of new and more sensitive methods, that allowed for detailed study ofhistone PTMs, developed sets of specific antibodies that could recognize specific his-tone PTMs with distinction of modification sites [Hebbes et al., 1989]; [Turner et al.,1992]; [Turner, 2002]. These antibodies, on one hand, could be used in western blotsto study changes in specific modifications, while on the other hand were also usedin immunofluorescence experiments, which allowed for the localization of specificallymodified histones within particular regions of genome [Turner et al., 1992]; [Jeppesenand Turner, 1993]. Moreover, chromatin immunoprecipitation using antibodies againstspecific histone PTMs and subsequent analysis of DNA sequences could also provideinformation regarding its location and association with particular DNA sequences.
Although the sensitivity of such methods was quite high they suffer from certain draw-backs. The similarity between different modification sites, on the same or an adjacenthistone molecule, leads to significant cross-reactivity of antibodies, rendering themless specific [Cheung, 2004]. Secondly, the combinatorial nature of histone PTMs mayleads to strong interference in epitope binding. In this case, a neighboring modificationmay occlude the epitope that the antibody recognizes despite the presence of this PTMmark. This shortcoming can be resolved by making antibodies specific for combina-tions of modifications, however, considering the huge number of combinations evenin a short stretch of amino acids, it is virtually impossible to generate antibodies foreach set of modifications. Thirdly, different antibodies have varying affinities towardtheir epitopes and therefore the signal obtained by one antibody cannot be comparedon absolute scale with that of another antibody. Finally, it is impossible to detect newmodifications using immunoassays as they require a priori knowledge of the site ofPTM under question.
It is clear from the above discussion that these classical methods had quite a few seriouspitfalls that needed to be addressed in order to comprehensively analyze histone PTMs.Scientists, in the search of newer and more direct methods to study combinatorial histonePTM networks, found their heaven in mass spectrometry (MS) based proteomics, which hasenormous potential to study histone code at a high throughput level.

1.6. Methodologies to Study Histone Post-Translational Modifications 59
1.6.2 Mass Spectrometry
The complete structural and functional characterization of all proteins in the cell has al-ways been the goal of proteomics. Proteins can be described by many features includingbut not limited to expression, localization, interaction, domain structure, post-translationalmodification, and activity. If the proteome of an organism is considered together with allthese aspects of the proteome, this represents a considerably complex body of informationin comparison to the genome of an organism, which generally does not vary from cell to cell.Traditionally, the proteomics techniques have focused on understanding the structure andfunction of individual proteins, which, no doubt, improves the general understanding ofthe working of organisms, however, do not allow systems level understanding of completeproteome.
For the comprehensive and large scale high throughput proteome analysis, mass spectrom-etry (MS) has gained much popularity in the last decade owing to its ability to handle thecomplexities associated with the proteome. Other techniques such as two-dimensional gelelectrophoresis (2DE), two-hybrid analysis, and protein microarrays fail to achieve the depthof informative proteome analysis seen with MS. Mass spectrometry has been widely used toanalyze biological samples and has evolved into an indispensable tool for proteomics re-search.
Mass spectrometry is an analytical technique that measures the mass to charge ratio ofcharged particles. By definition, a mass spectrometer consists of an ion source, a mass an-alyzer that measures the mass-to-charge ratio (m/z) of the ionized analytes, and a detectorthat registers the number of ions at each m/z value. Electrospray ionization (ESI) and matrix-assisted laser desorption/ionization (MALDI) are the two techniques most commonly usedto volatize and ionize the proteins or peptides for mass spectrometric analysis [Karas andHillenkamp, 1988]; [Fenn et al., 1989]. Mass spectrometry based proteomics has matured intoa useful tool for the global analysis of protein composition, post-translational modifications,and dynamics of proteins in various physiological and pathological cellular states [Waltherand Mann, 2010]. Mass spectrometry based proteomics has seen enormous growth duringthe last decade owing to the great many advances in the development and innovation in therange of mass spectrometers and analysis techniques. In the field of chromatin biology, massspectrometry has emerged as an important platform for characterizing the specific locationsof various types of histone post-translational modifications. Moreover, the quantitative anal-ysis of combinatorial histone codes has been made possible due to the recent advances inhigh resolution mass spectrometry.
[Figure 1.15] shows the work flow of a typical MS-based histone PTM analysis.
Chromatography
MS-based proteomics is tightly linked and highly dependent on separation technologies thatsimplify incredibly complex biological samples before subjecting them to MS analysis. Be-cause proteins are identified by the mass-to-charge ratios of their peptides and fragments,sufficient separation is required for unambiguous identifications. Therefore, both accuracy

60 Chapter 1. Introduction
Figure 1.15: Work flow of a typical MS-based histone PTM analysis.
and sensitivity of a mass spectrometric experiment rely on the efficient separation. Selectionof appropriate separation methods is often the first step in designing the proteomic applica-tion. Two major approaches to separation widely used in proteomics are gel based and gelfree.
Gel based methods generally rely on 2D-PAGE, where proteins are separated in two dimen-sions, first on the basis of charge and second according to mass. With the advent of latest MSinstruments coupled with online high performance liquid chromatography (HPLC), the 2D-PAGE based separation of proteins is largely out of practice in large scale proteomics stud-ies. Also, to separate proteins or peptides, HPLC is advantageous because liquid handling iswell-suited to automation, an important consideration in high throughput analysis. The fol-lowing types of HPLC chromatographic techniques are most commonly used in MS-basedproteomics: reverse phase (RP), ion exchange (IEX) , hydrophilic interaction chromatogra-phy (HILIC), affinity chromatography, such as IMAC, and hybrid techniques.
Among the hybrid techniques, gel-enhanced liquid chromatography mass spectrometry (GeL-CMS) is worth mentioning as it combines pre-separation of proteins by gel electrophoresisfollowed by analysis of the peptides resulting from an in-gel digest step by online high per-formance liquid chromatography-tandem mass spectrometry (HPLC-MS/MS) [Shevchenkoet al., 1996]; [Lundby and Olsen, 2011]. It is beneficial to separate complex protein mixturesinto several fractions to reduce sample complexity and increase the dynamic range of pep-tide identification. Splitting the proteins to be analyzed in several gel slices, which are in-dividually processed, increases the chances of identification of proteins and their PTMs. Aconsiderable disadvantage of the in-gel protein digestion procedure compared to that of in-solution digest is the risk of contaminating the samples with, for instance, skin and woolkeratins, when handling or excising protein bands from the gel.

1.6. Methodologies to Study Histone Post-Translational Modifications 61
Separation of intact histones, histone variants and peptides derived from the enzymatic di-gest of histone is an important task in order to get a clean, high purity sample before MSanalysis. Gel electrophoresis methods have been used to separate histones for over half a cen-tury [NEELIN and CONNELL, 1959]; [NEELIN and NEELIN, 1960]. These electrophoretictechniques can also be used in a 2D gel separation for even greater resolution [Bonner et al.,1980]. Although these gel based approaches have proved to be excellent ways to separatecomplex samples, such methods are difficult to incorporate into high throughput methodsas they are both labor intensive and not directly compatible with mass spectrometry.
Capillary electrophoresis (HPCE) [Gurley et al., 1991]; [Lindner et al., 1992] is a powerfulseparation technique with many distinct advantages including low sample requirement, bet-ter resolution of histones, ease of separation and high efficiency. One of its major limitation isrelated to the fact that while analyzing histones, their highly basic tails interact strongly withthe surface of the fused silica tubing used in HPCE. A lot of effort has been done to minimizethis problem. One such example is the work of Aguilar et al. [Aguilar et al., 2001], in whichthey used hydropropylmethylcellulose (HPMC)-coated capillaries and an MS-compatiblesolvent system to perform capillary electrophoresis-electrospray ionization-mass spectrom-etry (CE-ESI-MS) on calf thymus histones. Such an approach definitely continues to havepotential in histone PTM analysis however, it received scant attention. Another extensionof HPCE is shown by the work of Mizzen [Mizzen and McLachlan, 2000], where they in-troduced some degree of cation exchange behavior to the capillary surface. Overall, HPCEprovides excellent histone separations and has the capacity to be used on-line with massspectrometry, making it potentially high-throughput; however, recent work in histone PTMshas primarily focused on liquid chromatography approaches.
In the vast majority of the chromatin studies, where histone PTMs and variant histones areanalyzed by mass spectrometry, reverse-phase HPLC was used to chromatographically sep-arate the digested histone peptides. While satisfactory for the separation of histone familiesand some variants, other chromatography techniques can be adopted for reducing spectrumcomplexity (i.e., enhance chromatographic resolution) or for enriching lower level modifica-tion states. For instance, cation exchange HPLC has been demonstrated as an effective toolwhich can separate hyperacetylated histone forms primary by their degree of acetylation.Zhang et al. used this technique to analyze an Arg-C digestion of histone H3 from HeLacells and observed a progressive link between H3 acetylation and H3K4 and H3K79 methy-lation [Zhang and Freitas, 2004].
An important problem in histone PTM analysis is examining the roles of phosphorylation,which are known to be involved in the transition from interphase to mitotic (i.e., condensed)chromatin, but whose exact mechanistic roles in this process have not yet been determined.Immobilized metal affinity chromatography (IMAC) has emerged as a very useful separa-tion protocol for enriching phosphopeptides. For instance, IMAC was used in a MS analysisof the five major isoforms of H1 (i.e., H1.1, H1.2, H1.3, H1.4, and H1.5) and H1.X from asyn-chronous HeLa cells [Garcia et al., 2004]. In this study, 19 phosphorylation sites were identi-fied, where 14 fit the CDK consensus motif, and the H1.4 peptide exhibited serine phospho-rylation adjacent to lysine methylation, suggesting a possible "binary switch" hypothesis for

62 Chapter 1. Introduction
linker histones which had been previously suggested for core histones [Fischle et al., 2003].A similar IMAC-MS/MS experiment was conducted for protease digests of histone H3 frommitotically arrested HeLa cells [Garcia et al., 2005]. The study identified other potential bi-nary switches, including H3T3ph/K4me1, H3K9me1-3/S10ph, and H3K27me1-3/S28ph. Itwas notably observed that phosphopeptides containing lysine methylation were found inmuch higher abundances than phosphopeptides containing lysine acetylation.
The resolution capabilities of cation-exchange chromatography and IMAC were combinedfor the MS interrogation of H1 in Tetrahymena Thermophila cells [Garcia et al., 2006]. Fivephorphorylation sites (T34, S42, S44, T46, T53) in H1 were confirmed and two novel sites ofphosporylation were identified (S4 and S5), in addition to the discovery of two novel mi-nor sites of acetylation (K77 or K78 and K154). The cation-exchange chromatography alsorevealed a hierarchical pattern of phosphorylation, where T34, T46, and T53 are phosphory-lated first, followed by S4 and S5 next, and then finally S42 and S44. Lastly, it was shown byFreitas and co-workers that offline hydroxyapatite (HA) chromatography using salt step orsalt gradient elution can improve the dynamic range of subsequent online reversed-phasedliquid chromatography for histone analysis [Su et al., 2009]. The hydoxyapatite separatesthe histones based on their relative binding affinity to DNA and resulted in the detectionof lower abundance histone variants and their PTMs when compared to the traditional acidextraction of histones.
The compatibility of RP-HPLC with ESI-MS makes it an ideal choice for analysis of histones.However, the similarity of highly basic histone variants limits the effectiveness of this tech-nique. Hydrophilic interaction LC (HILIC) is a powerful technique that has proved to bewell suited for histone isoform separation. Linder and coworkers [Lindner et al., 1996] opti-mized this technique to attain excellent resolution of core and linker histones. Later Sard andcolleagues used HILIC and achieved separation and identification of K20 methylation statesof acetylated H4 isoforms [Sarg et al., 2002]; [Sarg et al., 2004]. Their results revealed thatH4 hyperacetylation blocked tri-methylation of H4K20. Furthermore, H4K20 methylation inmammals was related to aging. HILIC separations, often at the peptide level, in conjunctionwith mass spectrometry approaches have been essential to many methods that thoroughlyand effectively characterize combinatorial histone codes [Sarg et al., 2006]; [Pesavento et al.,2006]; [Taverna et al., 2007]; [Garcia et al., 2007]. HILIC methods, however, rely on a non-volatile mobile phase additive, such as a chaotropic agent to improve resolution, and/orsalt gradients for elution of the histone forms. This makes the most effective separation notdirectly compatible with mass spectrometry, which is the most effective means to sequenceand quantitate the separated combinatorial histone codes. Recently, Garcia’s group has ad-dressed this long-standing problem in histone analysis by creating a mass spectrometry-compatible weak cation exchange-HILIC method (WCX-HILIC) [Young et al., 2009]. Theyremoved all non-volatile components from the mobile phase and used a pH gradient to neu-tralize the cation exchange character of the stationary phase. This was done in conjunctionwith a decreasing organic solvent gradient for elution based on purely HILIC mechanisms.In this way, a highly effective WCX-HILIC-based separation is achieved that is also directlycompatible with mass spectrometry.

1.6. Methodologies to Study Histone Post-Translational Modifications 63
Bottom-Up MS Analysis
Currently, mass spectrometric analysis of proteins relies upon two complementary tech-niques, i.e., bottom up and top down approaches, which represent two different trendsin MS-based proteomics [Chait, 2006]. The bottom-up approach it still considered as thestronghold of proteomics research, although much more recently the focus is drawn towardthe top down analysis of proteins. Each of these two approaches has its own advantages anddrawbacks and relative fields of application. The bottom-up approach is mainly used foridentifying proteins and determining details of their sequence and post-translational mod-ifications. Classically, in bottom up approach, proteins are digested with proteases (usuallytrypsin) and the corresponding peptides are analyzed by electrospray ionization (ESI) ormatrix assisted laser desorption/ionization (MALDI). In this approach, the ESI or MALDIbased mass spectrometric analysis take place in two steps. First, the masses of the intacttryptic peptides are determined; next, these peptide are fragmented to produce informationon their sequence and modifications.
Bottom up proteomics has many undeniable advantages: (i) It is relatively easy to perform,because trypsin, due to its versatility, reproducibility and reliability, works well in a varietyof different conditions (denaturing agents, organic solvents, relatively extreme pH values).(ii) Small peptides (500 2000 Da) can be easily analyzed with every MALDI and ESI in-struments, with high sensitivity (reaching the femtomoles range in ordinary instrumentalsetups). (iii) Good MS/MS spectra of one or two peptides can be sufficient to confidently as-sign a protein hit. (iv) Extremely large and complex proteomes, such as serum or cell lysates,can be confidently analyzed with the multidimensional protein identification technology or"shotgun" approach [Delahunty and Yates, 2007]; [Kislinger et al., 2005] and a list of hun-dreds of trustworthy protein hits can be obtained in a single automated experiment. (v) Sev-eral protocols for absolute and relative quantitative proteomics [Barnidge et al., 2004]; [Ra-mus et al., 2006]; [Mann, 2006]; [Perkel, 2009] have been implemented over the last 10 years,yielding reliable data of protein expression levels often ranging over several orders of mag-nitude in very complex matrices.
However, the bottom up approach is suboptimal for determining protein PTMs and alter-native splice variants or alternately modified variants of proteins, as usually only a smallfraction of tryptic peptides are detected and only a fraction of these yield useful fragmenta-tion ladders. The peptides, after tryptic digestion, represent pieces of a jigsaw puzzle wheremany of the pieces are missing. Therefore, we can identify the protein on the basis of a lim-ited number of peptides, but we have no clue to the effective complete sequence of the intactprotein and a comprehensive full set of its PTMs. Even if we manage to detect all the piecesof the puzzle, the picture would still be incomplete as we cannot reconstitute the intact pro-tein with its full set of modification pattern. Given the combinatorial nature of various PTMsand their correlations, there exist many different forms of the same protein containing dif-ferent sets of modifications. However, using the bottom up approach, by identification ofindividual peptides, we certainly lose information regarding the combinatorial pattern ofPTMs.

64 Chapter 1. Introduction
Regardless of these limitations, bottom up approaches have been extensively used for theidentification and characterization of histone PTMs in various cell lines and cellular states.It has been shown more than a decade ago that mass spectrometry, employing bottom upapproaches, can be used for discovering novel histone PTMs [Strahl et al., 2001]; [Ng et al.,2002]; [van Leeuwen et al., 2002]. Burlingame and co-workers were the first to publish com-prehensive mass spectrometric investigations of histone H3 and H4 in chicken erythrocytes[Zhang et al., 2002a] and found abundant methylations and acetylations at known residues.They have also found a "zip" model of H4 acetylation at N-terminal residues K5, K8, K12and K16 in HeLa cells, where acetylation progressed from K16 down to K5 and deacetyla-tion followed in opposite direction [Zhang et al., 2002b]. Recent mass spectrometry basedstudies have also identified or confirmed a variety of modifications such as novel methyla-tion and acetylation sites [Ye et al., 2005]; [Morris et al., 2007]; [Garcia et al., 2007a]; [Drogariset al., 2008]; [Das et al., 2009], as well as new or unique modifications including biotinylation,propionylation, butyrylation and formylation on many histone proteins [Camporeale et al.,2004]; [Chen et al., 2007]; [Zhang et al., 2009]; [Jiang et al., 2007b], however, the significanceof many of these PTMs during nuclear processes still remain unclear.
As have been already mentioned, one major limitation of bottom-up mass spectrometry,which involves extensive digestion of the histones, is that it can provide very limited com-binatorial information. However, some early examples of the analysis of combinatorial pat-tern of the histone code were in fact shown by such methods. For example, Fischle et al.blocked lysine residues of histone H3 by propionylation and trypsin digested to achievereproducible ArgC-like peptides. They showed that HP1, which normally binds the silenc-ing mark H3K9me3, is released from chromatin during mitosis by phosphorylation of theadjacent S10 residue [Fischle et al., 2005]. Later Garcia et al. used ion metal affinity chro-matography (IMAC) and performed an analysis of phosphorylations on histone H1 fromTetrahymena thermophila. They found as many as three phosphorylations on a single smallpeptide [Garcia et al., 2006]. Although these examples showed some utility of bottom-upMS in the histone code combinatorial analysis, they fail to document the full complementof combinatorial information embedded on histone proteins, which can sufficiently be pre-served by top-down and middle-down approaches (discussed later).
Chemical Derivatization
A fundamental step in the Bottom Up MS approach is the proteolytic digestion of the pro-teins into smaller peptide sequences, which are more amenable to the standard LC-MS pro-tocol. Typically, the enzyme of choice is trypsin since it produces peptides that have a ba-sic C-terminal arginine or lysine residue, which usually results in more complete ion seriescoverage during collision induced dissociation (CID) since a positive charge is always re-tained with the C-terminal moiety. However, the N-terminal tails of histone proteins areextremely basic and contain an unusually large number of lysines and arginines (e.g., the1-50 N-terminal tail of H3 contains 15 and the 1-23 N-terminal tail of H4 contains 9). A stan-dard tryptic digest of a purified mixture of H3 or H4 modified histone forms generates alarge number of extremely short peptide sequences, resulting in several analytical problemsdue to poor fragmentation, poor retention on RP-HPLC columns, and lack of reproducibility.

1.6. Methodologies to Study Histone Post-Translational Modifications 65
One should note that the use of the Arg-C protease does result in cleavage only after argi-nine residues, but is known to be less efficient and less specific than trypsin. Alternatively,proteolysis with enzymes that cleave after acidic residues (e.g., Glu-C) generates larger mul-tiply charged peptides whose MS/MS spectra are difficult if not impossible to interpret.Therefore, several groups have utilized chemical derivatization of histones peptides to fa-cilitate downstream MS experiments. The derivatization strategies reported in the literatureexploit the unique amino acid composition of the histone proteins and the PTMs known tobe present predominantly on the lysine residues.
One of the earliest chemical derivatization approaches used deuterated acetic anhydride toanalyze H3 changes in Drosophila embryos [Bonaldi et al., 2004] and the 4-17 amino acidsof H4 in mutant cells [Smith et al., 2002]; [Smith et al., 2003]. Acetic anhydride is known toreadily acetylate alcohols and amines, and thus reacts with the unmodified lysine residuesand the N-terminus of histones. This subsequently blocks tryptic digestion on the carboxylside of lysine residues, leaving arginine as the sole site of enzymatic cleavage. A drawbackto this approach is that the introduction of a deuterated acetyl group on the lysine residuesis very close in mass with endogenous lysine acetylation or trimethylation. To get aroundthis issue, alternative derivatization methods were developed.
In particular, several research groups have pursued the use of propionic anhydride for thechemical derivatization of endogenously unmodified or monomethylated lysines. This re-action is very similar to that for acetic anhydride, with the exception that an additionalCH2 group is added to the side-chain modification, thereby inducing an observed shift of56 Daltons per derivatized lysine. One of the earliest applications of this approach enabledthe investigation of the quantitative effects of H3 methylation after knocking down spe-cific methyltransferases [Peters et al., 2003]. Since then, it has guided the discovery of newhistone modifications, enabled the investigation of PTM changes under distinct cellular con-ditions and elucidated modification differences between the lower and higher eukaryotespecies [Johnson et al., 2004]; [Syka et al., 2004b]; [Garcia et al., 2007a]; [Drogaris et al., 2008].
Propionic anhydride derivatization serves two practical purposes: 1. By blocking all lysineresidues by the addition of a chemical group (propionyl) or by endogenous modifications,trypsin digestion results in proteolysis only C-terminal to arginine residues. This reactionmimicks an Arg-C digestion, but with the efficiency and reproducibility of trypsin. 2. Thederivatization step neutralizes the charge at the N-termini, and unmodified and monomethy-lated lysine residues thereby making the resulting histone peptides less hydrophilic. Theycan now be easily resolved by standard RP-HPLC; in addition, the peptides produce dou-bly and triply charged ions in electrospray ionization MS, and so are pseudo-tryptic-likefragments whose MS/MS spectra are facile to interpret. This is an advantage over using theArg-C protease, which will cleave at Arg residues, but does not remove the charge fromlysine residues [Garcia et al., 2007b].
Quantification
The quantification of differences among different physiological states of a biological systemis not only the most important but also the most challenging technical tasks in proteomics.

66 Chapter 1. Introduction
Figure 1.16: Schematic representation of the fraction of a proteome that can by identified or quantified byMS-based proteomics. Adapted from [Bantscheff et al., 2007].
The ability to accurately measure how the levels specific modifications change in response todifferent conditions, such as cell cycle changes, disease states or treatment with therapeuticagents, is essential for fully understanding the mechanisms by which histone modificationsact [Knapp et al., 2007]. The primary function of the mass spectrometer in proteomics is theidentification of peptides and proteins, however, it is not limited to mere identification ofproteins in a given sample. The second important function of mass spectrometer is to pro-vide quantitative information relating to relative or absolute peptide abundance. Mass spec-trometry is, however, not inherently quantitative because proteolytic peptides exhibit a widerange of physico-chemical properties such as size, charge, hydrophobicity, etc. which lead tolarge differences in mass spectrometric response. For accurate quantification, it is thereforegenerally required to compare each individual peptide between experiments. During the lastdecade, several methods that add a quantitative dimension to mass spectrometric measure-ments have been developed [Ong and Mann, 2005]; [Bantscheff et al., 2007]; [Vermeulen andSelbach, 2009].
Despite the phenomenal impact of mass spectrometry and peptide separation techniques onproteomics, the identification and quantification of all of the proteins in a biological systemis still an unmet technical challenge. While for unicellular organisms proteomic coverageof the genome has been occasionally achieved beyond 50%, coverage for higher organismsrarely exceeds 10%. For protein quantification, these figures are significantly smaller due tothe fact that the data quality, in terms of information content, required for quantification byfar exceeds that for protein identification [Figure 1.16] [Bantscheff et al., 2007].
In most proteomics workflows, these quantification strategies can be divided into threegroups: chemical labeling, stable isotope labeling and label free approaches.

1.6. Methodologies to Study Histone Post-Translational Modifications 67
I Chemical Labeling
The simplest form of chemical labeling involves 18O method, where isotope label is in-troduced into peptides by digesting one sample using trypsin or Glu-C in the presenceof H2
18O while the other sample is digested in ordinary aqueous solution to differen-tially label at the carboxyl terminus [Yao et al., 2001]; [Reynolds et al., 2002]; [Ye et al.,2009]. This has originally been employed to aid de novo sequencing of peptides bymass spectrometry [Rose et al., 1983] but has recently also been applied to quantitativeproteomic applications [Miyagi and Rao, 2007]; [Ye et al., 2009]. A practical disadvan-tage is that full labeling is rarely achieved and that different peptides incorporate thelabel at different rates which complicates data analysis [Ramos-Fernandez et al., 2007].
The chemical derivatization procedure can be labeled by esterification using deuter-ated alcohols. This is accomplished by converting the carboxylic acid functional groupson the histones to their corresponding esters via either ethyl or methyl esterficiation.For instance, after propionylation and trypic digesion of the two samples, the pep-tides in the control sample are derivatized into d0-ethyl or d0-methyl esters using d0-ethanol/HCl or d0-methanol/HCl, and the peptides in the experimental sample areconverted to their corresponding d5-ethyl or d3-methyl esters using d6-ethanol/HClor d4-methanol/HCl, respectively. The two samples can then be combined in equalamounts and analyzed in a single LC-MS/MS experiment, where the same modifiedhistone peptide from the two samples will be simultaneously detected with a +5 Dashift per label for ethyl esterfication and a +3 Da shift per label for methyl esterfication.
The stable-isotope labeling via ethyl esterfication has allowed for the quantificationof the PTMs between physiologically different cell types [Syka et al., 2004b], differen-tial expression analysis of histones from wild-type and methyltransferase mutant Ara-bidopsis Thaliana [Johnson et al., 2004], and quantification of PTM differences betweena mouse model of lupus and control mice, where it was observed that site-specific hy-poacetylation states on H3 and H4 were corrected with treatment by trichostatin A(TSA, a histone deacetylase inhibitor) and resulted in an improvement in disease phe-notype [Garcia et al., 2005]. The latter study also reported novel histone PTMs cor-responding to H3K18 methylation and K4K31 methylation and acetylation. Likewise,methyl esterification derivatization has been used to quantify the levels of modifica-tions between all of the histone H3 variants [Hake and Allis, 2006].
Although an extremely useful quantitative tool, the esterification reaction is knownto be particularly sensitive to moisture [Garcia et al., 2007b]. This requires samples tobe completely dried prior to the reactions, which can potentially lead to sample loss.Furthermore, retained water and fluctuating reaction temperatures can result in re-duced product yield or undesired side products. Motivated by these issues, a one potapproach was recently introduced which can identify and quantify nearly all histonevariants and their corresponding PTMs in a single LC-MS/MS experiment withoutthe need for prior HPLC or SDS-PAGE purification of the individual histone families.A second derivatization step using d0- and d10-propionic anhydride for the controlsample and sample of interest, respectively, incorporates a stable isotope-label mass

68 Chapter 1. Introduction
shift on the new peptide N-termini created from the tryptic digest. Since d10-propionicanhydride incorporates a stable d5-propionyl amide label on the N-terminus of thepeptides in the infected sample, the modified peptides appearing in both the con-trol and infected samples are simultaneously detected with a +5 Dalton shift betweenthem [Plazas-Mayorca et al., 2009]. While the incorporation of stable isotopes pro-vides an important means for identifying and quantitating peptides containing post-translational modifications, the accuracy of these methods critically depends on thereproducibility of the derivatization reactions.
Post-biosynthetic labeling of proteins and peptides can also be achieved by incorpora-tion of an isotope-coded affinity tag by chemical derivatization. This method knownas the isotope-coded affinity tag (ICAT) approach uses cysteine residues specificallyderivatized with a reagent containing either zero or eight deuterium atoms as wellas a biotin group for affinity purification of cystein-derivatized peptides and subse-quent MS analysis [Gygi et al., 1999]; [Shiio and Aebersold, 2006]. The rarity of cys-teine makes ICAT and related methods advantageous by significantly reducing thecomplexity of the peptide mixture when highly complex samples are analyzed. How-ever, ICAT is obviously not suitable for quantifying the significant number of proteinsthat do not contain any (or a few) cysteine residues and is of limited use for analysis ofpost-translational modifications and splice isoforms.
Another group of labeling reagents targets the peptide N-terminus and the epsilon-amino group of lysine residues. This is realized via the very specific N- hydroxysuc-cinimide (NHS) chemistry or other active esters and acid anhydrides as in, e.g., theisotope coded protein label (ICPL) [Schmidt et al., 2005], isotope tags for relative andabsolute quantification (iTRAQ) [Ross et al., 2004], tandem mass tags (TMT) [Thomp-son et al., 2003]. The isobaric mass tagging in iTRAQ and TMT introduces tags thatinitially produce isobaric labeled peptides which precisely comigrate in liquid chro-matography separations. Only upon peptide fragmentation are the different tags dis-tinguished by the mass spectrometer and the relative quantification is performed in theMS/MS spectra, in which each tag generates specific fragment ions. This permits thesimultaneous determination of both identity and relative abundance of peptide pairsin tandem-mass spectra. The commercially available iTRAQ reagent [Ross et al., 2004]provides a further refinement of this approach, allowing multiplexed quantitation ofup to eight samples. This has turned out to be particularly useful for following bio-logical systems over multiple time points or, more generally, for comparing multipletreatments in the same experiment.
Chemical labeling is applicable to all sample types. The primary disadvantage of themethod is the inevitable presence of chemical side products, which can interfere withthe analysis of rare PTMs and adversely affects quantification results.
II Metabolic Labeling
The metabolic labeling approaches introduce a stable isotope signature (light or heavy)into proteins through the growth medium or food during cell growth and division.This allows for the samples to be mixed immediately after the experiment at the level

1.6. Methodologies to Study Histone Post-Translational Modifications 69
of intact cells before any protein extraction, thus, minimizing experimental errors in-troduced by biochemical and mass spectrometric preparation procedures as these willaffect both protein populations the same way.
Metabolic labeling was initially described for global labeling by replacing all nitro-gen atoms in the medium by 15N [Oda et al., 1999], although this technique is gener-ally restricted to specialized applications, such as bacterial and plant species, becauseit leads to broad isotope distributions in the heavy forms. Furthermore, the cost andtime required to routinely apply this technology is neither possible nor practical. Moretargeted approach of metabolic labeling is SILAC (Stable Isotope Labeling by Aminoacids in Cell culture), where incorporation is achieved by replacing essential aminoacids with their heavy counterparts.
SILAC, first described in the literature almost a decade ago [Ong et al., 2002]; [Blagoevet al., 2003], is conceptually a straight forward experimental setup: it involves grow-ing two populations of cells, one in a medium supplemented with "light" form of anamino acid and the other contains a "heavy" amino acid. The heavy amino acid usuallycontains either 13C or 15N or both. Arginine and lysine labeling are most commonlyused. Cells are cultured in heavy medium for at least five cell doublings to allow theincorporation of the heavy amino acid. After five cell doublings, 97%of the proteinsshould be present in the heavy state. In practice, the proteomes reach full incorpora-tion of the heavy amino acid more rapidly through a combined process of cell division,new protein synthesis and degradation. Once, full labeling is achieved, cells are mixedin equal numbers, their proteomes extracted and analysed by LC-MS [Figure 1.17-A].Since, trypsin cleaves at the C-terminal of arginine and lysine residues, it ensures thatevery tryptic peptide contains at least one labeled amino acid. For every peptide, twoisotope clusters can be observed, one from each sample, a so-called SILAC pair [Fig-ure 1.17-B]. The mass difference between the SILAC pairs is exactly the mass differencebetween the light and heavy amino acids. Generally Arg10 and Lys8 are used, gener-ating shifts of 10.0083 Da and 8.0142 Da, respectively. For every identified peptide, aratio can be directly assigned , and this ratio represents the relative expression level ofthat protein in the two experimental samples. A large variety of different establishedcell lines, including mouse and human ES cells, have already been labeled and theproteome is quantified [Graumann et al., 2008]; [Prokhorova et al., 2009]; [Tian et al.,2011]; [Rigbolt et al., 2011].
Analysis of PTMs is one of the daunting task in MS-based proteomics [Mann andJensen, 2003]. Understanding PTMs and their regulation demands knowledge of theirchange in abundance in distinct cellular conditions. This regulation could occur at thelevel of protein abundance through gene expression, cellular localization and by site-specific PTM modulation. Any change in the levels of modification often leads to im-portant biological consequences and therefore there is intense interest in the quantita-tive study of modifications. Stable isotope labeling in various forms is now being usedto quantify protein levels on a large scale. A well-designed quantitative proteomicsexperiment could provide such key pieces of information in a single experiment. Twostrategies for quantification of PTMs are available: either labeling of the peptides them-

70 Chapter 1. Introduction
Figure 1.17: SILAC principle. A, on mixing of samples from two SILAC states, histones can be extractedand processed further for nanoLC-MS/MS analysis. B, SILAC pairs can be observed for every peptide. Thechromatogram shows the co-eluting heavy and light peptide (upper graph), while the mass spectrum isused to calculate the relative abundances of light and heavy peptides (lower graph).
selves by a stable isotope method as described above, or introduction of the label intothe modification. The first approach can be used for any modification and is mainlyapplied to achieve differential quantification of a modification of interest in two dif-ferent samples. The latter approach has so far only been described for methylation, aSILAC strategy called "heavy methyl SILAC" [Ong et al., 2004].
Histone PTMs holds a fundamental place in chromatin biology and MS has proved tobe the most reliable and unbiased method to identify and quantify these PTMs [Eberlet al., 2011]. Freitas and co-workers used SILAC to quantify changes in histone H4 withrespect to HDAC inhibitor treatment, such as depsipeptide (DDP). The histones werefirst labeled with D4-lysine, since this residue is most modified, and then separatedusing acid-urea polyacrylamide gel electrophoresis (AU-PAGE). After in-gel digestionwith trypsin, the histones are analyzed using MADLI-TOF MS. This approach was ableto detect time-dependent changes in histone H4 during apoptosis after DDP exposure[Su et al., 2007a]. An Arg-C digestion of H4 followed by LC-MS/MS was also used touncover patterns regarding the ordering of acetylations, where K16 was found to beacetylated first, K12 subsequently, and then lastly K8 or K5 [Zhang et al., 2007]. SILAC

1.6. Methodologies to Study Histone Post-Translational Modifications 71
has also been used for characterizing the modification patterns of the core histones inHeLa cells across the cell cycle (i.e., for cells arrested in G1, S1, and G2/M) [Bonenfantet al., 2007]. It was observed that the modifications were essentially identical in the G1and S phases, but certain phosphorylation events were observed to occur exclusivelyin the G2/M phase for H3 and H4 (but not for H2A) in combination with a loss ofacetylation across all histones. Furthermore, Jensen and coworkers used a knock-downof Suz12, a Prc2 component in mouse ES cells and found a methyl/acetyl switch in aSILAC based quantitative mass spectrometry analysis of histones H3.2 and H3.3. Thisknock-down led to reduction of K27 di- and trimethylation but also to an increase inK27 acetylation [Jung et al., 2010]. A SILAC approach was likewise applied to comparePTMs on histones H3 and H4 between breast cancer cell lines and normal epithelialbreast cells, which demonstrate the possibility of defining cancer-specific methylationsignature [Cuomo et al., 2011].
PTM enrichment strategies can be applied to enrich peptides containing a particularmodification. Lysine-acetylated peptides, for example, can be enriched by appropriateantibodies [Zhao et al., 2010]; [Wang et al., 2010]. Choudhary et al. applied this strat-egy to identified as well as used SILAC to quantify 3600 lysine acetylation sites (ma-jority were novel sites) in human cells upon treatment with the deacetylase inhibitorssuberoylanilide hydroxamic acid and MS-275 [Choudhary et al., 2009]. These studiesrevealed a great diversity acetyl-regulated cellular processes. Another PTM that hasfrequently been the target of large scale proteomics studies is phosphorylation. Maceket al. described the major techniques available for enrichment for phosphopeptides[Macek et al., 2009]. These include 1) enrichment of peptides containing phosphory-lated tyrosines by antibodies specific for this modification, 2) immobilized metal affin-ity chromatography (IMAC) utilizing coordination of phosphopeptides by metal ions,3) titanium-dioxide-based enrichment, typically with a specificity enhancing reagent,and 4) enrichment in the flowthrough and early fractions in strong cation exchangechromatography (SCX), because of the presence of additional charge on phosphate atacidic pH, which leads to reduced retention times of phosphorylated peptides. Fur-thermore, Matsuoka et al. performed a large-scale SILAC-based proteomic analysis ofproteins phosphorylated in response to DNA damage on consensus sites recognizedby ATM and ATR and identified more than 900 regulated phosphorylation sites en-compassing over 700 proteins. Functional analysis of a subset of this data set indicatedthat this list is highly enriched for proteins involved in the DDR [Matsuoka et al., 2007].Recently a titanium dioxide enrichment strategy was used to identify and quantify, us-ing SILAC, more than 10,000 phosphorylation sites throughout the HeLa cell cycle byMann and coworkers [Olsen et al., 2010]. These findings suggest that mining of thedata from large-scale, high-accuracy screens could provide useful insights and poten-tial leads for further studies in elaborating the role of chromatin in essential cellularprocesses.
Apart from cell lines, whole organisms can also be metabolically labeled [Heck andKrijgsveld, 2004]. Thus far, S. cerevisiae (lysine auxotroph strains growing in minimalmedium with heavy lysine) [Gruhler et al., 2005], Drosophila melanogaster (feeding

72 Chapter 1. Introduction
on heavy yeast) [Sury et al., 2010] and mice (by means of a special lysine-free dietsupplemented with heavy lysine) [Kruger et al., 2008] have been labeled and used forfunctional in vivo proteomics experiments.
Although SILAC is a powerful tool for histone quantification, it is important to notethat not all samples are compatible with this labeling technique, including certain tis-sues and body fluids. However, as an alternative to the classical SILAC approach, adifferent approachthe use of SILAC as an internal or "spike-in" standard [Geiger et al.,2010]; [Geiger et al., 2011], wherein SILAC is only used to produce heavy labeled refer-ence proteins or proteomes. These are added to the proteomes under investigation aftercell lysis and before protein digestion. The actual experiment is therefore completelydecoupled from the labeling procedure. Spike-in SILAC is very economical, robust andin principle applicable to all cell- or tissue-based proteomic analyses. Spike-in SILAC isespecially advantageous when analyzing the proteomes of whole tissues or organisms.
While many cell lines can be labeled quite readily, some do require special attention.For example, some cell lines require careful titration of the amount of arginine in themedium in order to prevent metabolic conversion of excess arginine into proline whichin turn complicates data analysis [Ong et al., 2003]. Cell lines that are sensitive tochanges in media composition or are otherwise difficult to grow or maintain in cul-ture may not be amenable to metabolic labeling at all. A further limitation of metaboliclabeling is the restricted number of available labels. For SILAC, a limited number oflabels can be used, meaning that a limited number of conditions can be compared inone experimetnal setting, however, the use of spike-in SILAC allows for the compari-son of more conditions than previously possible. Because of the early combination ofsamples, metabolic labeling and SILAC, in particular, is probably the most accuratequantitative MS method in terms of overall experimental process. This makes it par-ticularly suitable for assessing relatively small changes in protein levels or those ofpost-translational modifications [Blagoev et al., 2004]; [Park et al., 2006a]; [Olsen et al.,2006]; [Choudhary et al., 2009]; [Olsen et al., 2010]; [Monetti et al., 2011].
III Label Free Quantification
Currently, three widely used label-free quantification strategies can be distinguished:(a) Relative Quantification by Peak Intensity of LC-MS, (b) counting and comparing thenumber of fragment spectra identifying peptides of a given protein [Liu et al., 2004],(c) exponentially modified protein abundance index (emPAI) [Ishihama et al., 2005].These approaches rely on the fact that the signal intensity from electrospray ioniza-tion (ESI) correlates with ion concentration. Hence, more abundant the protein is in agiven sample, the more MS/MS fragmentation spectra it will generate as compared tolow-abundance proteins. An advantage of these methods is their applicability to anyqualitative dataset, including low-resolution data. Spectral counting and emPAI canestimate the absolute amounts of proteins in a sample, as well as the relative amountsunder two or more different sets of conditions. However, a significant drawback isthat the correlation between the number of times that peptides are sequenced and pro-tein amount is only approximate. In particular, proteins with low peptide counts show

1.6. Methodologies to Study Histone Post-Translational Modifications 73
high quantification variability. Also, a general disadvantage in label free approaches isthat samples have to be processed and measured separately and that the accuracy istherefore compromised by experimental variability between different runs. A generalworkflow of label free proteomics is given in [Figure 1.18].
Figure 1.18: Label-free quantitative proteomics. Control and sample are subject to individual LC-MS/MSanalysis. Quantification is based on the comparison of peak intensity of the same peptide or the spectralcount of the same protein.
Label free approaches have been used in chromatin biology to quantify changes inhistone PTMs as an alternate to stable isotope-based strategies. Using label free quan-tification, it was shown for an Arg-C digestion of H3 extracted from Drosophila celllines that H3.3 accounts for 25% of total histone H3 in bulk chromatin, enough toessentially pack all actively transcribed genes. Modifications were observed that areconsistent with the formation of euchromatin, or transcriptionally active genes. It hadbeen previously believed that H3.3 was interchangeable with H3, however this studydemonstrated the presence of H3.3 at active loci [McKittrick et al., 2004]. Thelabel-freeapproach has also been successfully applied in a number of cancer studies. Fraga etal. utilized high-performance capillary electrophoresis (HPCE) to resolve histone H4

74 Chapter 1. Introduction
forms by their degree of acetylation and methylation and LC-MS/MS to analyze 25human cancer cell lines [Fraga et al., 2005]. It was determined that a hallmark commonto all cancers is the loss of monoacetylation at H4K16 and trimethylation at H4K20,predominantly located at DNA repetitive sequences. In a study of small cell lung can-cer [Beck et al., 2006], SDS-PAGE followed by in-gel tryptic digestion and reverse phaseLC-MS/MS revealed 32 modifications on all core histones, including several novelmodification sites for H2B, H2A, and H4. Triplicate runs for 6 different concentrationsof the HDAC inhibitor PXD101 were shown to significantly change the abundances ofmany modified peptides. Alignment and calibration of the data with respect to peptideretention times and m/z values were used to enhance the quantification accuracy forthe core histones. One important issue with the label-free approach for quantificationthat should be considered is the requirement that reproducible peptide sequences canbe routinely generated. The ETD fragmentation technique has been applied to largehistone fragments, enabling quantification of 74 unique H4 modification combinationsin differentiating human ES cells by a labelfree approach [Phanstiel et al., 2008].
Top-Down MS Analysis
In the previous sections, we have described Bottom Up mass spectrometry as an invaluableand sensitive tool for the discovery and characterization of the post-translational modifica-tions present on histone proteins. However, the necessary enzymatic digestion of the histoneproteins into smaller peptide sequences loses important information regarding the connec-tivity of modifications on the molecular level. The ability to simultaneously analyze the mod-ifications across an intact sequence is of paramount importance, as there is well-establishedcross-talk between sites of modification in histones and quantitative changes within the indi-vidual sites may not accurately reflect their collective changes. Recent evidence also supportsthe hypothesis that specific combinations of histone modifications are the driving force be-hind important cellular and nuclear events. For instance, it has been shown that differencesin global histone modifications in tissues can be used to predict the clinical outcome of can-cer patients [Seligson et al., 2005]; [Barlesi et al., 2007]; [Seligson et al., 2009], supporting thetheory that the Histone Code works on a combinatorial basis.
In recent years, top down proteomics has emerged as another effective MS platform for PTMidentification and quantification, where the digestion step is omitted and electron transferdissociation (ETD) or electron capture dissociation (ECD) is utilized to fragment the intactprotein sequence (described in the next section). The ETD and ECD fragmentation tech-niques have advantages over CID in that (a) their fragmentation is not inhibited by basicamino acids (e.g., arginine, lysine, and histidine) and (b) the PTM is retained on the residueside chain, whereas oftentimes in CID the PTM bond is the energetically favorable cleavagesite.
Top Down MS usually involves initial separation of proteins from a complex mixture downto a single protein or few proteins. The protein sample is then either directly injected intothe mass spectrometer through ESI, or further fractionated by on-line RP-HPLC followed byESI. After injection, the intact protein precursor ion mass is normally measured at high mass

1.6. Methodologies to Study Histone Post-Translational Modifications 75
accuracy, usually on high-resolution instruments such as on Orbitrap or a Fourier transformion cyclotron resonance mass spectrometer (FT-ICR-MS). Tandem mass spectrometry is thenperformed in a targeted or data-dependent mode and data is then analyzed, often manu-ally, or with specialized software. Additionally, entire protein sequences are deduced by topdown MS, this results in 100% protein sequence determination, which is near impossible togenerate with bottom up approaches as well.
It has been demonstrated that ion abundances from top down and middle down fragmen-tation (described below) in association with the ion abundances from the parent ions can beused for quantification of isomeric histone forms in the same mixture [Pesavento et al., 2006].A review of recent studies is presented below, which have applied ECD or ETD for the topdown MS analyses of histone variants and their PTMs.
The first report regarding the application of top down MS for the analysis of histone post-translational modifications was published by Kelleher research group. FT-ICR ECD datafor histone H4 extracted from asynchronously grown HeLa cells was searched against adatabase derived from known histone modifications using ProSight Retriever. Several acety-lated and methylated forms were observed and sodium butyrate was used to enhance thesignal of hyperacetylated forms [Pesavento et al., 2004]. Protocol enhancements for the anal-ysis of histone variants were achieved by the use of mild performic acid for oxidizing me-thionine into methionine sulfone and cysteine into cysteic acid [Pesavento et al., 2007]. Thisalleviated issues associated with partial oxidation, since the masses of oxidization (16 Da)and methylation (14 Da) are similar and can result in overlapping isotopic distributions.
Mizzen and co-workers combined the quantitative labeling approach SILAC with Top DownMS to detect quantitative changes in H4K20me throughout the cell cycle for asynchronousHeLa cells [Pesavento et al., 2008]. It was reported that newly synthesized H4 is gradu-ally methylated during the G2, M, and G1 phases of the cell cycle and within two to threecell cycles is almost entirely dimethylated. Interestingly, new H4 is methylated regardless ofthe prior acetylation state and acetylation is observed to occur on H4 that is dimethylated,which was in contradiction to the former hypothesis that H4K20 methylation antagonizesH4 acetylation. Top Down ECD tandem MS confirmed the previously observed ordering ofH4 acetylation, where K16 is acetylated first, then K12 subsequently, and finally K8 or K5.
Reverse phase HPLC was used in the majority of the aforementioned top down MS stud-ies. This approach fails to chromatographically resolve isobaric modifications and results inthe analysis of bulk histones. As a result, there is a decrease in both the specificity and sen-sitivity due to competing ionization efficiencies among the modified forms. However, theability to detect and analyze the combinatorial modifications across single histone forms isof great interest to chromatin biologists. Previous studies have notably demonstrated theutility of acid-urea cation exchange chromatography [Thomas et al., 2006] and acid-ureagel electrophoresis [Jiang et al., 2007a] for separating modified histone forms based upontheir degree of acetylation. The later study also showed a top-down analysis of intact yeasthistones H2A, H2B, H4 and H3 and characterized over 50 distinct total histone forms. Sub-sequent experiments using methyltransferase knockout strains revealed the cointerdepen-

76 Chapter 1. Introduction
dence of histone H3 acetylation with H3K4 methylation as well.
Successful off-line techniques (in which the eluate is not directly coupled to a tandem massspectrometer) for the separation of highly-modified histone forms have been achieved usingcation exchange hydrophilic interaction chromatography (HILIC). Two-dimensional liquidchromatography (i.e., RP-HPLC and HILIC) coupled with top down ECD MS was used toidentify and quantify 42 modified H4 forms from asynchronous and cycling HeLa cells [Pe-savento et al., 2008]. Two novel modifications, namely H4K20me2 and H4N-acR3me2K20me2,were identified by this approach. A major disadvantage of these HILIC approaches is thatthe off-line nature of the experimental protocol is extremely time consuming (on the order ofmonths) and thus prohibits the ability to conduct multiple runs for high-throughput studiesand statistical validation.
Top down analysis of intact histone H2B in Tetrahymena using ECD fragmentation found13 versions of this protein (variants and their modifications) [Medzihradszky et al., 2004],while the human version revealed the presence of seven unmodified H2B variants in addi-tion to one monomethylated isoform [Siuti et al., 2006]. A similar analysis on H2A found atleast 14 forms of this protein expressed in human cells. These experiments also detected thepresence of an H2Aubiquitin- conjugated protein [Boyne et al., 2006]. Multiple approaches,including a top-down analysis, were used in one study to reveal the modifications of histoneH4 [Zhang et al., 2004]. Lastly, top down analysis lead to the characterization of human hi-stone H3.1, H3.2 and H3.3 modification site occupancy. Histone H3 was found to be mostlyand pervasively post-translationally modified as less than 3% of the unmodified protein wasfound for all three H3 variants [Thomas et al., 2006]. Again, none of these methods can beconsidered high throughput, as they involve both extensive off-line prefractionation and thesubsequent analysis of many fractions. Progress has been made towards top-down analysison a chromatographic time scale, including some characterization of histone H4 combinato-rial forms in the process [Parks et al., 2007]. Such an approach is very appealing, but thereremain technical challenges to overcome before on-line top-down LC-MS will be used rou-tinely in the proteomics labs as the most effective approach.
Middle-Down MS Analysis
Middle down mass spectrometry, an alternate version of top down approach (analysis ofpeptides with mass greater than 3000 Da) has also been recently popularized. Middle downmass spectrometry requires the proteolysis of proteins with enzymes that target less abun-dant amino acid residues than trypsin, such as GluC or AspN, before a similar path as TopDown MS is taken. A particular advantage of top down and middle down approaches is thatif a protein is multiply modified at residues that are not very close in sequence, this combi-natorial modification pattern can be deduced by Top Down MS or partially by Middle DownMS, but would mostly likely not be deciphered by bottom up mass spectrometry methods.Middle down approach gives rise to shorter but still highly charged peptides that are idealfor thorough analysis by ETD or ECD analysis. However, the physical separation of thesesmaller, but still substantial, peptides is a significant problem that has to be overcome. Inessence, the middle down approach is currently considered as a thorough and reasonably

1.6. Methodologies to Study Histone Post-Translational Modifications 77
high-throughput method.
Middle down approach, until recently, have utilized primarily off-line separations followedby analysis of fractions, as is the case with top-down methods. These off-line methods usu-ally require large amounts of sample and are quite long for the analysis of a single polypep-tide. With such off-line separations, the analysis of all fractions of a single sample represent-ing one biological state could take more than 100 h of analysis time. Yet these still relativelynew approaches have led the way toward more high-throughput approaches.
Pesavento et al. performed middle-down analyses on histones, first without up-front separa-tion [Pesavento et al., 2004], and later fractionating with HILIC chromatography [Pesaventoet al., 2006], and were able to achieve reasonable results on the relatively simple H4 system.Reversed phase and PolyCAT A-based HILIC separations have been used to fractionate outthe H3-(150) peptide from Tetrahymena into distinct acetylation states before ETD analysison a modified Orbitrap [Taverna et al., 2007]. This identified over 40 modified forms of hi-stone H3 from this lower eukaryote. Around the same time, modified histone H3.2 formsextracted from asynchronously grown and butyrate treated HeLa cells were fractionatedinto 30 fractions and over 150 unique modified forms were identified using middle downECD, revealing partial ordering patterns for H3K14, K18, and K23 acetylation and H3K4methylation correlations with acetylation [Garcia et al., 2007]. Here, the separation occursfirst by separating isoforms by acetylation status (weak cation exchange) and then by a sec-ond mode of separation based on the methylation (HILIC). HILIC fractions were staticallyinfused into an FT-ICR mass spectrometer, and fragmentation was induced using ECD [Gar-cia et al., 2007]. In another study, middle down approach was used and HeLa cells weretreated with 5-aza-2’-deoxycytidine, a DNA methylating inhibitor, which resulted in a sig-nificant reduction in global methylation states for H3.1 and a simultaneous rise in relativeacetylation levels [Siuti and Kelleher, 2010].
A reasonable online separation with an ETD capable of fragmentation on chromatographictimescale has only recently been achieved when Phanstiel et al. perfomed reverse phaseLC-MS/MS using a custom-built ETD-capable quadrupole ion trap mass spectrometer. 74discrete combinatorial codes on the tail of histone H4 from human embryonic stem (ES)cells were detected in this study [Phanstiel et al., 2008]. Due to the reverse phase LC, mostof the combinatorial forms, however, co-eluted with others and had to be deconvoluted bymathematical analysis. Similarly, Nicklay et al. analyzed both H3 and H4 from Xenopuslaevis, but only the H4 was analyzed by middle-down methods. They also used on-linereversed phase LC-MS methods in conjunction with ETD on the H4 123 peptide tail, wherethey observed 66 discreet isoforms [Nicklay et al., 2009].
Young et al. recently developed a method to identify and quantitate combinatorial histonecodes, utilizing a pH gradient to elute histone codes from a weak cation exchange and hy-drophilic interaction (WCX-HILIC) nano flow liquid chromatography column directly into amass spectrometer using electron transfer dissociation [Young et al., 2009]. This was demon-strated on the histone H3 and histone H4 N-terminal peptide (first 50 and 23 amino acids,respectively). With this approach, they have shown an effective chromatographic separation

78 Chapter 1. Introduction
of the structural isomers of histones H3 and H4 and they have characterize over 200 modifiedforms of histone H3.2 in one LC-MS/MS experiment and over 70 modified forms from his-tone H4. This was a dramatic improvement over previous approaches that required weeksworth of work to produce similar data. There remains room for improvement in this currentstate of high throughput histone code analysis, yet it is truly a high-throughput method, andthe quality and confidence in the data are greater than previous lower throughput methods.Cation exchange HILIC chromatography had been used previously, but with non-volatilebuffers, and was based on an ionic strength gradient [Garcia et al., 2007], however, the crit-ical step here was to convert this chromatography into a high-throughput on-line LC-MSmethod. This was achieved by the use of a pH gradient to take advantage of the weak cationexchange properties of the PolyCAT A stationary phase. In this manner, the cation exchangeretention mechanism could be disrupted while being compatible with directly introducingthe eluent into the mass spectrometer.
Dissociation Methods for MS/MS Analysis
I Collision Induced Dissociation (CID)
Tandem mass spectrometry (MS/MS) is a key technique for protein or peptide se-quencing and PTM analysis. Collision-induced dissociation (CID) [Shukla and Futrell,2000] has been the most widely used MS/MS technique in proteomics research. In thismethod, gas-phase peptide/protein cations are internally heated by multiple collisionswith rare gas atoms. This leads to peptide backbone fragmentation of the CN bond re-sulting in a series of b-fragment and y-fragment ions. Because of the slow-heating,energetic feature associated with this method, the internal fragmentation and neutral-losses of H2O, NH3 , and labile PTMs are common. This also results in limited sequenceinformation for large peptides (>15 amino acids) and intact proteins.
II Electron Capture Dissociation (ECD)
A new fragmentation technique, electron-capture dissociation (ECD) was introducedby the McLafferty laboratory in [Zubarev et al., 2000]; [Zubarev, 2006], by which thecapture of a thermal electron by a multiply protonated peptide/protein cation in-duces backbone fragmentation at the NCα bond to produce c-type and z-type fragmentions. ECD provides more extensive fragmentation resulting in richer MS/MS spec-tra and better sequence coverage, and the nonergodic feature of ECD preserves labilePTMs. Therefore, it has become a powerful tool for top-down analysis of intact pro-teins [Medzihradszky et al., 2004]; [Thomas et al., 2006]; [Zabrouskov and Whitelegge,2007]. However, ECD is most often constrained to the expensive, highly sophisticatedFTICR instruments.
III Electron Transfer Dissociation (ETD)
An analogous technique, electron-transfer dissociation (ETD) was developed by theHunt laboratory in 2004 and extends electron-capture-like fragmentation to more com-mon bench top mass spectrometers [Syka et al., 2004a]. In this process, the electronstransfer from radical anions with low electron affinity to multiply protonated peptide

1.7. DNA Damage 79
cations initiating backbone fragmentation to produce c-ion and z-ion series. Becausethe ion/ion reaction is highly efficient and fast, ETD can easily be performed with fem-tomole quantities of peptides on a chromatographic timescale. ETD MS/MS providessuperior sequence coverage for small-sized to medium-sized peptides and is highlycomplementary to conventional CID for proteome identification applications [Goodet al., 2007]. ETD can be utilized to analyze very large peptides as well as intact pro-teins with a sequential ion/ion reaction, proton transfer/charge reduction (PTR) bywhich the ETD produced multiply charged fragments are deprotonated with evenelec-tron anions resulting in singly and doubly charged ions that are readily measured bythe bench-top low resolution ion trap instrument [Coon et al., 2005]; [Chi et al., 2007b].This allows for the sequence analysis of 1540 amino acids at both N-terminus and C-terminus of the protein. ETD has also shown great promise in labile PTM analyses suchas phosphorylation and glycosylation [Chi et al., 2007a]; [Navajas et al., 2011]; [Wanget al., 2011].
1.7 DNA Damage
Damage to our genetic material is an ongoing threat to both our ability to faithfully trans-mit genetic information to our offspring as well as our own survival. To respond to thesethreats, living organisms have evolved the DNA damage response (DDR). The DDR is acomplex signal transduction pathway that has the ability to sense DNA damage and trans-duce this information to the cell to influence cellular responses to DNA damage. To maintaingenomic integrity, DNA must be protected from damage induced by environmental agentsor generated spontaneously during DNA metabolism.
Environmental DNA damage can be produced by physical or chemical sources. Examplesof physical genotoxic agents are ionizing radiation (IR) and ultraviolet (UV) light from sun-light,which can also induce up to 105 DNA lesions (pyrimidine dimers and 64 photoprod-ucts) per cell per day [Hoeijmakers, 2009]. Ionizing radiation (from, e.g., cosmic radiationand medical treatments employing X-rays or radiotherapy) can induce oxidation of DNAbases and generate single-strand and double-strand DNA breaks (SSBs and DSBs, respec-tively). Chemical agents used in cancer chemotherapy can cause a variety of DNA lesions:alkylating agents such as methyl methanesulfonate (MMS) and temozolomide attach alkylgroups to DNA bases, while crosslinking agents such as mitomycin C (MMC), cisplatin,psoralen, and nitrogen mustard introduce covalent links between bases of the same DNAstrand (intrastrand crosslinks) or of different DNA strands (interstrand crosslinks or ICLs).Other chemical agents, such as the topoisomerase inhibitors camptothecin (CPT) and etopo-side, which inhibit topoisomerase I or II respectively, induce the formation of SSBs or DSBsby trapping topoisomerase-DNA covalent complexes. Cigarette smoking, one of the mostcommon mechanisms of self-inflicted DNA damage, causes a wide variety of adducts andoxidative damage in lung and other tissues. Hydrolytic reactions and non-enzymatic methy-lations also generate thousands of DNA-base lesions. DNA damage can also be generated
80 Chapter 1. Introduction
by reactive species that attack DNA leading to base loss, DNA single-strand breaks (SSBs)or adducts that impair base pairing and/or block DNA replication and transcription.
To counteract DNA damage, repair mechanisms specific for many types of lesion have evolved.Different DNA-repair pathways exist and perform major roles at both cellular and organ-ismic levels. These pathways include (1) mismatch repair (MMR) pathway [Jiricny, 2006],where mispaired DNA bases are replaced with correct bases, (2) SSBs are repaired by single-strand break repair (SSBR) [Caldecott, 2008], (3) the nucleotide excision repair (NER) path-way, which repairs more complex lesions, such as pyrimidine dimers and intrastrand crosslinks,through the removal of an oligonucleotide of approximately 30 bp containing the damagedbases, while ICLs are excised by ICL repair employing Fanconi anemia pathway [Moldovanand D’Andrea, 2009], (4) the base excision repair (BER) pathway, where small chemical alter-ations of DNA bases are repaired through excision of the damaged base and finally, (4) thehomologous recombination (HR) pathway, and (5) the non-homologous end joining (NHEJ)pathway, which deals with the DSBs. While NHEJ promotes the potentially inaccurate re-ligation of DSBs, HR precisely restores the genomic sequence of the broken DNA ends byutilizing sister chromatids as template for repair.
I Mismatch Repair (MMR)
The MMR pathway plays an important role in both prokaryotes and eukaryotes in re-pairing mismatches, which are small insertions and deletions that take place duringDNA replication [Jiricny, 2006]. Failure of MMR commonly results in microsatellite in-stability (MSI). Several homologues of the bacterial MMR genes MutS and MutL havebeen identified in yeast and mammals. The importance of the MMR pathway becameevident upon identification of mutations in certain human MMR genes in hereditarynon-polyposis colorectal cancer (HNPCC), a highly penetrant autosomal dominantcancer syndrome [Vasen et al., 2007]. Whereas most HNPCC human individuals carryheterozygous germline mutations of MMR genes, which predisposes them to cancer,mice heterozygous for MMR mutations do not appear to have an increased risk fordeveloping cancer. This difference is not specific for MMR mutations, as heterozygousmutations in certain genes involved in other DNA-damage repair pathways are alsoable to predispose humans, but not mice, to cancer.
II Base Excision Repair (BER)
The BER pathway deals with base damage, the most common insult to cellular DNA[Wilson and Bohr, 2007]. Two sub-pathways, short-patch BER and long-patch BER,are involved in BER. The short-patch BER sub-pathway typically replaces a single nu-cleotide, whereas the long-patch sub-pathway results in the incorporation of 213 nu-cleotides. recent studies have demonstrated the existence of a human disorder linkedto defective BER. This autosomal recessive disorder, referred to as MUTYH-associatedpolyposis (MAP), is associated with biallelic germline mutations of the human MU-TYH, and is characterized by multiple colorectal adenomas and carcinomas [Cheadleand Sampson, 2007]. Despite the presumed important role for the BER pathway in

1.7. DNA Damage 81
maintaining genomic integrity, mutations in this pathway have not significantly pre-disposed mutant mice for cancer. This is in contrast to mutations of other excisionrepair pathways, such as NER and MMR.
III Nucleotide Excision Repair (NER)
The NER pathway is a multistep process that serves to repair a variety of DNA dam-age, including DNA lesions caused by UV radiation, mutagenic chemicals, or chemother-apeutic drugs that form bulky DNA adducts. Over 30 different proteins are involvedin the mammalian NER, whereas only three proteins (UvrA, UvrB, and UvrC) are re-quired by prokaryotes [Truglio et al., 2006]. Two NER sub-pathways that have beenidentified are as follows: the global genome NER (GG-NER) that detects and removeslesions throughout the genome, and the transcription-coupled NER (TC-NER), whichrepairs actively transcribed genes. NER begins with the recognition of the DNA lesion,followed by incisions at sites flanking the DNA lesion, and culminates in the removalof the oligonucleotide containing the DNA lesion. NER has attracted a great deal ofattention due to its role in three rare human syndromes characterized by increasedcancer frequencies, neurodegeneration and ageing. These syndromes are xerodermapigmentosum (XP), Cockayne syndrome (CS), and trichothiodystrophy (TTD) [Thomset al., 2007].
IV Homologous Recombination (HR)
DSB repair can be mediated by two major repair pathways depending on the contextof the DNA damage, HR or NHEJ repair pathways [Kanaar et al., 2008]. In bacteriaand yeast, DSBs are preferentially repaired by HR, whereas more than 90% of DSBin mammalian cells are repaired by NHEJ. Both pathways are well defined and theirimpairment is associated with defects and pathologies, including increased cell death,cell-cycle arrest, telomere defects, genomic instability, meiotic defects, immunodefi-ciency, and cancer [Sung and Klein, 2006]. HR is a multistep process that requires sev-eral proteins and operates at the S or G2 phase of the cell cycle. Although it accountsonly for the repair of 10% of DSBs in mammalian cells, HR defects can have severeconsequences, as demonstrated by the human syndromes AT-like disorder (ATLD)and the NBS [Thompson and Schild, 2002]. The predisposition to either syndromehas been linked to mutations in the MRN complex, which is important for the resec-tion of DSBs [Thoms et al., 2007]. However, it is important to note MRN functions arenot restricted to HR, as is also involved in NHEJ, checkpoint activation, and telomeremaintenance [Niida and Nakanishi, 2006]. BRCA1 and BRCA2, the early-onset breastcancer-susceptibility genes, have also been demonstrated to partake in HR-mediatedDSB repair. Thus the human syndromes and early onset of breast cancer, and the devel-opmental defects, increased genomic instability and tumorigenesis associated with im-paired HR in mouse models, all demonstrate the in vivo requirement for HR-mediatedDNA-damage repair.
V Non-Homologous End Joining (NHEJ)
NHEJ is the predominant pathway of DSBs repair in mammalian cells [Kanaar et al.,

82 Chapter 1. Introduction
2008]. This repair pathway is active especially at the G1, but is error prone. NHEJ isalso essential for T-cell receptor α & β and Ig V(D)J recombination, and thus this repairpathway is required for the development of the T and B-cell repertoires. The core pro-tein components of the mammalian NHEJ include the Ku subunits (Ku70 and Ku80),DNAPKcs, XRCC4, DNA ligase IV (LigIV), Artemis, and the recently identified Cer-nunnosXLF (also known as NHEJ1). The radiosensitivity, genomic instability, immun-odeficiency, growth retardation, embryonic development, and cancer predispositionassociated with defective NHEJ all demonstrate the major role this DNA-damage re-pair pathway plays in vivo.
The coordination of DNA repair processes plays a critical role in allowing the proper devel-opment and survival of organisms. They are responsible for preventing numerous humandiseases and conditions, including cancer and aging. Therefore, a better and more in depthunderstanding of various DNA damage responses along with other associated cellular path-ways is one of the essential goals in developing therapeutics approaches for human diseases
1.8 Fanconi Anemia - A Model to Study DNA Damage Response
Fanconi anemia is a rare, recessive (autosomal or X-linked) inherited disease, characterizedby severe bone marrow failure, a multitude of congenital defects and elevated risk of devel-oping malignancies including acute myeloid leukemia, squamous cell carcinomas of headand neck, and hepatic tumors [D’Andrea and Grompe, 2003]; [Mace et al., 2007]; [Wanget al., 2007]; [Moldovan and D’Andrea, 2009]. FA is a highly heterogeneous genetic disor-der: it consists of at least 13 complementation groups (A, B, C, D1, D2, E, F, G, I, J, L, Mand N), each of which is associated with a distinct gene disease. A possible 14th FA gene,RAD51C, has recently been identified [Vaz et al., 2010]. Eight FANC proteins are assembledto form a large E3 ubiquitin ligase nuclear complex known as "FA-core complex" [Kennedyand D’Andrea, 2005], which mono-ubiquitinates the FANCI-FANCD2 complex after DNAdamage [Smogorzewska et al., 2007]; [Alpi et al., 2008]. Ubiquitinated FANCI-FANCD2 isrecruited to the chromatin where it colocalizes with DNA repair factors [Taniguchi et al.,2002]; [Wang et al., 2004b]. The FANC proteins, all working together in concert, constitute acommon pathway in the DNA damage repair signaling. The pathway, termed as "FanconiAnemia Pathway", is a major signaling cascade in response to stalled replication forks andDNA interstrand crosslinks (ICL) in addition to other types of DNA damage including ioniz-ing radiation (IR) induced DNA double strand breaks and UV-induced damage [Moldovanand D’Andrea, 2009].
Interstrand crosslinks covalently link both strands of a DNA, thereby blocking its unwind-ing by DNA helicases and stopping the progression of the replication and transcription ma-chineries. These kinds of lesions pose an extreme danger to the cell’s fate if not repaired orbypassed [Scharer, 2005]. The FA-pathway is primarily activated during S-phase [Taniguchiet al., 2002]; [Raschle et al., 2008]; [Thompson and Hinz, 2009], and it has been shown that

1.9. Project Presentation 83
DNA ICLs are removed almost exclusively during replication [Akkari et al., 2000], althoughFA-pathway might also play a minor role in ICL repair during G1-phase of the cell cy-cle [Ben-Yehoyada et al., 2009]. These results suggest that ubiquitinated FANCI-FANCD2controls ICL repair in S phase, but the underlying mechanism how the ’Fanconi AnemiaPathway’ functions is unknown. It is, however, hypothesized to regulate molecular pro-cesses that stabilize and/or resume the arrested fork by influencing nucleotide excision re-pair, homologous recombination and translesion DNA synthesis [D’Andrea and Grompe,2003]; [Rosselli et al., 2003]; [Wang et al., 2007]; [Moldovan and D’Andrea, 2009].
At molecular level, the cells derived from patients of FA show spontaneous chromosomeinstability and striking sensitivity to DNA interstrand cross-linking (ICL) agents like mito-mycin C (MMC), methoxypsoralen (8-MOP), or Cisplatin. These two features are thought tobe responsible for the cancer susceptibility aspect of the disease [Niedernhofer et al., 2005].The hypersensitivity of FA cells to DNA-ICL agents and increased chromosomal breakagewith clinically strong predisposition to cancer implies a profoundly impaired ability to rec-ognize or repair DNA ICL [Mathew, 2006].
The fact that Fanconi anemia pathway is activated not only by DNA-ICLs inducing chem-icals, but also by other DNA damaging agents such as ultraviolet radiation (UV), ioniz-ing radiation (IR), hydroxyurea, and even spontaneously during replication [Dunn et al.,2006]; [Howlett et al., 2002]; [Taniguchi et al., 2002], suggests the FA pathway is likely to beinvolved in the replication-dependent repair of many types of lesions. But unlike ICLs, mostof these lesions are also repairable by other pathways. Thus, loss of FA proteins only mildlyor not at all affects survival rates in response to IR or UV [Bridge et al., 2005]; [Dunn et al.,2006]; [Niedzwiedz et al., 2004]. However, the FA pathway is the principal mechanism thatcan remove crosslinks efficiently, accounting for the hypersensitivity of FA patient cells toICLs.
1.9 Project Presentation
Cells are constantly exposed to endogenous (metabolic) and environmental agents (e.g. ion-izing radiation) that induce potentially harmful DNA lesions. Therefore, preventing genomicinstability is essential for maintaining integrity of the organisms. Accordingly, cells have de-veloped diverse systems that integrate DNA damage detection and checkpoint mechanismsto coordinate repair and cell cycle progression [Hoeijmakers, 2007]; [Lobrich and Jeggo,2007]. Loss of these mechanisms invariably results in accumulation of genetic changes andoften leads to cancer predisposition [Lobrich and Jeggo, 2007]. However, in eukaryotes, thepackaging of DNA into chromatin constitutes a physical barrier to enzymes and regulatoryfactors, generally preventing their access to DNA necessary for its proper functioning, suchas replication, transcription, recombination and repair. Recent work has also revealed theimportance of histone PTMs in other aspects of genome functioning, both as a mechanismfor factor recruitment and for signal propagation [van Attikum and Gasser, 2009]; [Bannisterand Kouzarides, 2011]. These observations underscore the importance of chromatin, and not

84 Chapter 1. Introduction
naked DNA, as the natural substrate of most genome based transactions.
The role of covalent histone modifications in transcriptional regulation and replication havebeen studied extensively, however, their implication in DNA damage response has startedgaining interest more recently. The recent research suggests that the language of covalent his-tone PTMs termed as Histone Code [Strahl and Allis, 2000]; [Jenuwein and Allis, 2001] playsan essential role in maintaining the genome integrity and multi-step process of carcinogen-esis [van Attikum and Gasser, 2005]; [Hake et al., 2007]; [Escargueil et al., 2008]. This codeis believed to regulate chromatin accessibility either by disrupting histone-DNA contacts orby recruiting non-histone proteins to chromatin [Section 1.4.5]. Phosphorylation of histoneH2AX (γH2AX), one of the most well-characterized modifications, caused by DNA DSBs (aswell as by other kinds of DNA damage), on the chromatin surrounding the DNA lesion, isrequired for the recruitment and stabilization of DNA repair proteins to the damaged chro-matin. It has also been shown to be required for the recruitment of FANCD2 protein to thestalled replication forks [Bogliolo et al., 2007]. However, it is also not clear whether inductionof histone modifications is dependent upon functional FA-pathway. Accordingly, the role ofhistone code "writers" and "erasers" needs to be elaborated in detail in order to get an insightinto the epigenetic regulation of DNA damage response.
The first goal of this thesis was to study histone code in the context of Fanconi anemia, inorder to elucidate the role of chromatin in DNA-ICL damage response. AIn this regard, wehave quantitatively analyzed the dynamics of histone PTMs in FA mutated and corrected celllines after inducing DNA-ICL damage, using high throughput mass spectrometry approach.For quantitative comparisons, we have used an established quantitative approach, SILAC,which offers efficient metabolic labeling of cells. FA mutated cells provided a good modelto study DDR to DNA-ICL, as these cells (derived from FA patients) are unable to senseand repair the DNA-ICLs. Accordingly, the FA corrected cells (FA mutated cells corrected byintroduction of wild type gene) provided an adequate control for our experiments.
Out of the various DNA-ICL inducing chemicals, we used 8-methoxypsoralen (8-MOP) (10µM). 8-MOP belong to a class of the group of furocoumarins, present in plants and cosmetics[Scott et al., 1976]. 8-MOP can be activated by UVA light to induce thymine mono-adductsand ICLs between thymines at d(TpA) sequences in DNA. The ratio of ICL to mono-adductcan be influenced by the wavelength and dose of UVA. In this way, up to 40% of the adductscan be converted to ICLs at a suitable UVA dose [Brendel and Ruhland, 1984]; [Dronkert andKanaar, 2001].
Histones are covalently modified by chromatin modifying proteins. Our histone PTM anal-ysis revealed interesting differences in various modifications after induction of DNA-ICLdamage, and we were next intrigued to understand what histone modifying enzymes couldbe responsible for the observed PTM patterns. As a second step, using tools of functionalgenomics, we have analyzed the gene expression level of various histone acetyltransfer-aes (HATs), histone deacetylases (HDACs), histone methyltransferases (HMTs), and lysinedemethylases (KDMs), as our histone code analysis was focused on histone lysine acetyla-tions and lysine methylations.

1.9. Project Presentation 85
DNA interstrand cross-links (ICLs) create a serious threat to cell survival by posing a com-plete blockade to DNA replication and transcription. To improve our general understandingof DDR to DNA-ICL at transcriptome level, we next decided to study the global transcrip-tional response to DNA damage in FA mutated cells after inducing two different kinds ofDNA damage i.e., ICL and IR damage. We have chosen to study IR induced DDR in FAscreen, in addition to DNA-ICL, in order to understand the role of functional FA pathwayin different kinds of DNA damage and also to find out if the FA-screen based transcrip-tional profile shows differences in the two DDRs. This would ultimately help us to narrowdown our analysis of genes, which are affected, after DNA-ICL induction, by the presenceor absence of functional FA pathway.
In the "histone code analysis" part of this thesis, we have performed a global analysis ofhistone PTM changes in response to DNA damage. However, DNA repair occurs in distinctand localized regions of the nucleus, as evident from the appearance of γH2AX foci afterinduction of DNA DSBs. It is therefore important to study histone PTM profile at a more locallevel than on global scale. The third and final part of this thesis comprised of a developinga new proteomics methodology to study local changes in histone modification profile, incontrast to global analysis that we have performed earlier. For developing this technique,we have used a different model system based upon an E3 ubiquitin ligase Rad18, whichforms detectable foci in the nucleus. Due to technical limitations we could not use FA model.We, however, believe that this technique has a much larger scope, and can be eventuallyused to study histone PTM changes related to DDR in Fanconi anemia.


2Results - I
2.1 Mass Spectrometry-Based Histone Modification Profiling of Cel-lular Response to DNA-ICL
A rapidly emerging evidence suggests that histones, the architectural proteins that packageDNA into nucleosomal arrays, are major carriers of epigenetic information. This informa-tion, mostly in the form of histone post-translational modifications, is likely to have an im-pact on many essential cellular processes including DNA damage response. In this part ofwork, we sought to examine the histone PTM profile in response to DNA damage of a partic-ular kind, namely DNA interstrand cross links (DNA-ICL). We have chosen Fanconi Anemia(FA) as a model for this study since the cells derived from patients of FA, show striking sensi-tivity to DNA-ICL inducing agents, such as mitomycin C (MMC), 8-methoxypsoralen/UVA(8-MOP), or Cisplatin. In order to comprehensively analyze the various histone PTM marksin both FA mutant and control cells, after induction of DNA-ICL damage, we decided to usethe mass spectrometry (MS)-based high throughput approach. For quantitative analysis ofhistone PTM, a stable isotope labeling technique, SILAC (Stable Isotope Labeling of Aminoacids during cell Culture) was used, which is based on incorporation of stable isotope-codedlysines and arginines into newly synthesized proteins through normal metabolic processes.Before performing the actual experiment, we found it necessary to optimize the detection ofvarious histone PTMs on our mass spectrometer and devise ways to quantify the detectedpeptides. Accordingly, first we describe how we achieved this preparatory goal, and thenwe will describe what kinds of changes in histone PTMs we have observed after subjectingcells to DNA-ICL damage, in both FA mutant and control cell lines.
87

88 Chapter 2. Results - I
2.1.1 MS-Based Identification of Histone PTMs
For the analysis of histone PTM profiles, automated nano-flow liquid chromatography cou-pled with tandem mass spectrometry (Agilent’s nano-HPLC ESI-Ion Trap) was used. As anexperimental model we selected FA-C cells, which corresponds to fibroblasts obtained froma FA patient having mutation in FANCC gene. The protein product of FANCC gene partici-pates in the formation of "FA core complex", which later leads to the mono-ubiquitination of"FA ID complex", one of the critical events in the cellular response to DNA-ICL damage. FA-C corrected fibroblasts (corrected for FANCC mutation by introducing the wild type FANCgene [Zanier et al., 2004] were also taken along with the mutated cells to serve as a control.
For induction of DNA-ICL, we used a DNA intercalating agent 8-methoxypsoralen (8-MOP)(10 µM). Cells were kept at 37◦C for 20 minutes and then irradiated with a suitable dose ofUVA (10 KJ/m2) (8-MOP can be activated by UVA light to induce thymine mono-adductsand ICLs between thymines at d(TpA) sequences in DNA). Out of several known agentsinducing DNA-ICL, 8-MOP was selected because it can induce up to 30-40% of DNA ICLsdepending upon the UVA dose [Brendel and Ruhland, 1984]; [Dronkert and Kanaar, 2001].Cells were then harvested at different time intervals. Histones were subsequently extracted,by acid extraction method [Chapter 6], and histones from different time points were mixedtogether in order to increase the chances of detection of modified peptides. Samples werethen quantified on Nano Drop and about 5 µg was loaded on 15% SDS-PAGE gel elec-trophoresis. Gel bands corresponding to different core histones were excised, treated withpropionic anhydride and in-gel trypsin digested and run on nanoLC-MS/MS as describedin Materials and Methods [Chapter 6]. Although the mass spectrometer can only detect ions,for our convenience we will use the term "peptide" instead of ions throughout this thesis.The purpose of treatment with propionic anhydride was to block trypsin digestion of un-modified and mono-methylated C-terminal lysines [Garcia et al., 2007b], which significantlysimplifies the comparison between modified and unmodified peptides.
In preparation for this analysis, a list of histone peptides (modified and unmodified) alongwith their mass to charge (m/z) ratios was compiled using previously published data forcore histones H3 and H4 [Zhang et al., 2002b]; [Zhang et al., 2003]; [Beck et al., 2006]; [Suet al., 2007b]; [Garcia et al., 2007a]. In addition, as we were hoping to identify new, previ-ously unobserved modifications, the predicted m/z ratios for several potential candidatepeptides were also included in the list (Table2.1 & Table2.2). The samples were then loadedonto the LC-MS/MS instrument and analyzed in multiple reaction monitoring mode (MRM)to search for ions with specific m/z ratios corresponding to the peptides present from thelist ([Table2.1]); ([Table2.2]). A total of 47 peptides of H3 (including 16 modified and 8 un-modified) and H4 (including 15 modified and 8 unmodified) were searched, and 28 were de-tected, among them 15 were of H3, 13 were of H4. Several new modifications, which have notyet been described in the literature, have also been observed. These include H4K77 mono-methylation, and H3H56 mono-methylation. For histones H2A and H2B, MS analysis wasdifficult to perform due to the low ion intensities of modified peptides and the presence ofnumerous histone aminoacid sequence variants. Also, in case of H2A and H2B, the peptides

2.1. Mass Spectrometry-Based Histone Modification Profiling of Cellular Response to DNA-ICL 89
obtained after in-gel propionylation and trypsin digestion were either too small or too largeto be identified on our mass spectrometer, hence, making it difficult for us to include themin our analysis.
Table 2.1: List of Histone H3 Peptides.
Histone H3Peptide Sequence Modification(s) m/z+2
Residues 3-8, TKQTAR K4 Unmodified 380,43Residues 9-17, KSTGGKAPR K9,K14 Unmodified 506,58Residues 18-26, KQLATKAAR K18,23 Unmodified 549,65Residues 27-40, KSAPATGGVKKPHR K27,36,27 Unmodified 801.50Residues 54-63, YQKSTELLIR K56 Unmodified 653.76Residues 64-69, KLPFQR K64 Unmodified 422.51Residues 73-83, EIAQDFKTDLR K79 Unmodified 695.77Residues 117-128, VTIMPKDIQLAR K122 Unmodified 720,00Residues 3-8, TKQTAR K4 ac 372,92Residues 3-8, TKQTAR K4 me1 387,21Residues 64-69, KLPFQR K64 me1 429,52Residues 18-26, KQLATKAAR K18 ac and K23 ac 536,65Residues 18-26, KQLATKAAR K18 ac or K23 ac 542,70Residues 27-40, KSAPATGGVKKPHR K27 me1 and 36 me1 815,46Residues 54-63, YQKSTELLIR K56 me1 660,77Residues 54-63, YQKSTELLIR K56 ac 646,76Residues 73-83, EIAQDFKTDLR K79 me1 703,28Residues 73-83, EIAQDFKTDLR K79 ac 689,50Residues 117-128, VTIMPKDIQLAR M121 Ox 728,00Residues 117-128, VTIMPKDIQLAR K122 me1 727,00Residues 117-128, VTIMPKDIQLAR K122 me1 and M121 Ox 735,00Residues 9-17, KSTGGKAPR K9 ac or K14 ac 499,57Residues 9-17, KSTGGKAPR K9 me1 or K14 me1 521,09Residues 9-17, KSTGGKAPR K9 me1 and K14 me1 514,09
In MRM mode the samples were separated using nano LC gradient, and the ion trap was setto isolate, fragment and generate MS/MS (MS2) scans of six parental peptides having pre-determined m/z ratios. Collision induced dissociation (CID) was used for internal fragmen-tation of the peptides, which creates "daughter" peptides for every given "parent" peptide.We have used reverse-phase (RP) chromatography, which separates peptides on the basis oftheir hydrophobicity. This was reflected on the retention times (RT) of the peptides, as themore hydrophobic the peptide was, the higher was the corresponding RT value. The relativequantity of each peptide in the different fractions was estimated by comparison between thepeak areas in the Extracted Ion Chromatograms (EIC) for each fragment or daughter pep-tide obtained from Total Ion Chromatogram (TIC) in MRM analysis of these fractions. The

90 Chapter 2. Results - I
Table 2.2: List of Histone H4 Peptides.
Histone H4Peptide Sequence Modification(s) m/z+2
Residues 4145, GGVKR K44 Unmodified 286,34Residues 4655, ISGLIYEETR Unmodified 590,66Residues 20-23, KVLR K20 Unmodified 285,86Residues 68-78, DAVTYTEHAKR K77 Unmodified 673,73Residues 24-35, DNIQGITKPAIR K31 Unmodified 691,29Residues 56-67, GVLKVFLENVIR K59 Unmodified 721,88Residues 4-17, GKGGKGLGKGGAKR K5,8,12,16 Unmodified 747,38Residues 79-92, KTVTAMDVVYALKR K79,91 Unmodified 854,03Residues 68-78, DAVTYTEHAKR K77 me1 680,74Residues 24-35, DNIQGITKPAIR K31 me1 698,31Residues 20-23, KVLR K20 me1 292,88Residues 20-23, KVLR K20 me3/ac 278,88Residues 4145, GGVKR K44 me1 293,34Residues 4-17, GKGGKGLGKGGAKR K5,8,12,16 ac(tetra) 719,33Residues 4-17, GKGGKGLGKGGAKR K5,8,12,16 ac(tri) 726,34Residues 4-17, GKGGKGLGKGGAKR K5,8,12,16 ac(di) 733,35Residues 4-17, GKGGKGLGKGGAKR K5,8,12,16 ac(mono) 740,37Residues 4-17, GKGGKGLGKGGAKR K5,8,12,16 me(tetra) 754,38Residues 4-17, GKGGKGLGKGGAKR K5,8,12,16 me(tri) 761,38Residues 4-17, GKGGKGLGKGGAKR K5,8,12,16 me(di) 768,38Residues 4-17, GKGGKGLGKGGAKR K5,8,12,16 me(mono) 775,38Residues 56-67, GVLKVFLENVIR K59 ac 728,88Residues 79-92, KTVTAMDVVYALKR K79 me1 or K91 me1 868,03
RT’s of various peptides (with or without modifications) were highly reproducible betweendifferent samples. The RT of the parent peptide along with the alignment of EICs of a givenpeptide at the same RT helped us to identify the correct peptide [Figure 2.1]. For a givenpeptide, the sum of the intensities of its daughter peptides, observed in the MS2 spectrumwas taken to calculate the intensity of the peptide in a given sample [Chapter 7]. Agilent’s"Data Analysis" software was used to visualize the chromatograms from each MRM andMS2 spectrum at each RT point of the corresponding chromatogram.
2.1.2 Quantitative Analysis of Histone PTMs in Fanconi Anemia
After learning how to detect various histone modifications with our LC-MS/MS instrument,we proceeded to analyze the dynamics of these modifications in response to DNA-ICL dam-age. For quantitative comparison of various histone PTMs, we used an established approachin quantitative proteomics, termed SILAC. This method involves growing two populations

2.1. Mass Spectrometry-Based Histone Modification Profiling of Cellular Response to DNA-ICL 91
Figure 2.1: Representative TIC of Histone H4 residues 68-78 (K77UM) along with EICs of daughter peptidesand MS/MS spectrum.

92 Chapter 2. Results - I
of cells, one in a medium that contains "light" (normal) amino acids and the other in a med-ium that contains "heavy" (stable isotope labeled) version of the same amino acids. Theheavy amino acids contain C13 instead of C12 , and/or N15 instead of N14 . Incorporationof the heavy amino acid into a protein leads to a detectable mass shift in its tryptic peptidesas compared to the peptides with the light version of the same amino acid (for example, 6 Dain the case of 6C13-Lys), but no substantial physico-chemical changes are expected to occur.Usually, Lysine and Arginine are chosen to be labeled by stable isotopes, because in most ofthe cases tryptic peptides contain only one of these amino acids located at the C-terminus,which significantly facilitates the calculation of mass shifts. Cells are cultured in SILAC lightand heavy medium for at least five cell doublings to allow the incorporation of these aminoacid. After five cell doublings, 97% of the proteins were expected to be present in the lightand heavy state in the corresponding cell population [Ong and Mann, 2006]. For many pro-teins, such level of incorporation is achieved more rapidly because of contribution of proteinturnover.
The cells from light and heavy samples were mixed in equal ratio (1:1) and from this timeon were processed in the same manner during the proteome fractionation steps and prepa-ration for MS and mass spectrometry analysis. Because of being treated in the same mixture,the presence of heavy and light versions of peptides originating from the two samples arenot subject to variations between runs. This gave us more confidence in interpreting thedifferences in their abundance, measured by LC-MS/MS, as reflecting the true differencesbetween the samples compared. Thus, SILAC is generally expected to be more accurate inthe quantitative comparison of two proteomes due to the presence of internal standard. H/Lratios are then calculated either manually by comparing the intensities of MS2 fragments ofthe two versions of the same peptide [Figure 2.2] or by using specialized softwares (e.g. Spec-trum Mill), which automatically gives the H/L comparison of various proteins identified inthe two conditions. The representative MS/MS spectra of various modified and unmodifiedhistone peptides along with the lists of theoretical masses of fragment peptides are presentedin the Annex - I at the end [Chapter 7].
In our preliminary experiments, the sufficient levels of incorporation efficiency after fivecell doublings was confirmed when we detected less than 5% of "light" version of a histonepeptide in histones prepared from "heavy" sample. Also, comparison of the cells grown ineither light or heavy SILAC medium did not show any substantial differences in growthrate, viability and overall cell morphology.
[Figure 2.3] shows the scheme of SILAC experiment that we have performed. We used Fan-coni anemia cell lines FA-C (pd331 + empty vector) and FA-C Corr (pd331 + FANCC). FA-C cells are the fibroblasts obtained from a Fanconi anemia patient having a mutation in"FANCC" gene, stably transfected with an empty vector, whereas the control cells, FA-Ccorr, are the same cells stably transfected with functional FANCC gene. Both of these celllines were separately grown, for at least five cell doublings, in SILAC medium containingthe heavy isotope versions of lysine (6C13) and arginine (6C13 and 4N15). Cells were treatedwith 8-MOP+UVA, harvested after 1h and 6h and mixed in equal ratios (1:1) with the con-trol cells (untreated FA-C & FA-C corr), which were grown in SILAC medium with a light

2.1. Mass Spectrometry-Based Histone Modification Profiling of Cellular Response to DNA-ICL 93
Figure 2.2: Representative "Light" (A) and "Heavy" (B) MS2 Spectrum of Histone H3 peptide 9-17 (KSTG-GKAPR).
isotope version of these amino acids (6C12 for Lys and 6C12 , 4N14 for Arg).
The histones were extracted from these samples with the acid extraction protocol. The puri-fied histones were quantified and loaded onto 15% SDS-PAGE gel electrophoresis as shownin [Figure 2.4]. As the four core histones were well separated by SDS-PAGE, the bands corre-sponding to histones H3 and H4 (each band now containing light and heavy versions of thesame protein) were excised and propionylated using 75% propionic anhydride in methanol.After several washings, the bands were subjected to overnight in-gel trypsin digestion. Later,the digested peptides were analyzed by nano-LC-MS/MS [Chapter6].
As explained previously, we limited our histone PTM analysis to only H3 and H4 histones.

94 Chapter 2. Results - I
Figure 2.3: SILAC schematics and workflow diagram.
A total of 94 different peptides (both light and heavy versions) from core histones H3 andH4 were analyzed by mass spectrometer in MRM mode. The heavy m/z ratios for the heavyversion of every peptide were calculated individually by taking into account the number oflysine and arginine residues in that peptide. A mass of 6 Da for each lysine and 10 Da for eacharginine was added into the "heavy" version of the peptide. The H/L ratios of relative inten-sities of each peptide were calculated by taking the sum of the intensities of correspondinglight and heavy daughter fragments. For normalization, the H/L ratios calculated for eachmodified peptide was divided by the H/L ratios calculated for the unmodified version ofthe same peptide from the same sample. These values (normalized H/L ratios) are shown asgraphs in the next section. In these graphs, light (L) represents the untreated cells and heavy(H) represents cells harvested either 1h or 6h after DNA-ICL induction. We term the changein modification status after 1h as "early response" and 6h as "late response" to DNA-ICL in-duction. We show here only those modifications that manifest an interesting dynamics inour analysis.
I Histone H3 PTM Profile In case of histone H3, we have identified mono-methylationson three different lysine residues (H3K9, H3K56 and H3K79), showing different re-sponses to DNA-ICL damage in Fanconi anemia corrected and mutated cells. Among

2.1. Mass Spectrometry-Based Histone Modification Profiling of Cellular Response to DNA-ICL 95
Figure 2.4: 15% SDS-PAGE of FA-C corr and FA-C SILAC Light and Heavy samples, where FA-C corr standsfor corrected cells and FA-C stands for mutated cells
acetylations, we were able to detect only H3K14ac in all the samples. Figure 2.5 showsthese responses.
• H3K79me: Among various histone H3 PTMs identified the strongest response toDNA-ICL damage was shown by mono-methylation on H3K79. In FA-C corr cells,a substantial increase was observed in H3K79me after 1h of damage inductionwhich subsided at 6h time point. In sharp contrast, no such increase was observedin FA-C mutated cells. The absence of response of H3K79me to DNA-ICL damagein mutated cell line suggests that this modification is dependent on functional FApathway [Figure 2.5-A].
• H3K9me: In case of H3K9me, a similar response profile was observed in both cor-rected and mutated cells. The most prominent increase is seen after 6h, whereasit is barely detectable after 1h of DNA damage induction, thus the response isqualified as ’late’. However, the intensity of the change is detectably lower in themutant cells, indicating that the functional FA-pathway is involved in the appear-ance of this modification after DNA-ICL damage [Figure 2.5-B].
• H3K56me: H3K56me has also been detected in our screen. This modification isnotably decreased in FA-C mutated cells at 1h after induction of DNA-ICL dam-age, whereas no decrease was observed in the case of control FA-C corr cells. After6h of treatment, the same profile was observed for both cell lines, which quali-fies this modification as an ’early responder’ to DNA-ICL damage. Importantly,

96 Chapter 2. Results - I
Figure 2.5: Histone H3 PTM profile after DNA-ICL Induction. The H/L ratios represent single experimentwhere L represents the untreated cells and H represents cells harvested either 1h or 6h after DNA-ICLinduction.
however, this response happens in the absence of the functional FA-pathway [Fig-ure 2.5-C].
• H3K14ac: We also observed differential acetylation of lysine 14 of histone H3 inFanconi anemia corrected and mutated cells in response to DNA damage. Whilecomparing the FA-C corr cells treated and untreated, an initial increase after 1h oftreatment was observed, which subsequently decreases after 6 hours of treatment.A reverse kinetic was observed in case of FA-C mutated cells, where an initialdecrease in H3K14ac after 1h of DNA-ICL induction marked the early response,which became less prominent after 6 hours [Figure 2.5-D].
II Histone H4 PTM Profile
• H4K(5,8,12,16)ac: The analysis of core histone H4 revealed an increased acetyla-tion response on the N-terminal tail residues K5, 8, 12, and 16 after 1h of treatmentin case of corrected cells. Importantly, no such response was observed in case ofmutated cells, suggesting that functional FA pathway is required for this modifi-cation to occur in response to ICL damage. Evidently, a slight decrease in H4 N-terminal acetylation was observed in mutant cells after 1h of DNA-ICL damage.The response after 6h treatment in both cases was more similar as a significantdecrease in H4 acetylation status was observed in both cell lines, suggesting thatthe initially increased acetylation response was transient in nature [Figure 2.6-A].

2.2. Discussion 97
• H4K77me: Similarly, a slight increase in mono-methylation was observed on H4K771h after damage induction in corrected cells, while no such response was ob-served in mutated cells [Figure 2.6-B]. Interestingly, an increase was also observedin FA-C mutated cells, however after 6h, instead of 1h. This profile suggests thatin the absence of functional FA pathway, the response is delayed.
• H4K31me: Other noteworthy modification that was detected in histone H4 in-cluded H4K31 mono-methylation. No difference was observed in mutated andcorrected cells after 1h suggesting that it was not involved in the early cellularresponse to DNA-ICL damage. However, a slight decrease in this modificationwas observed in FA-C mutated cells after 6h when compared to the response inFA-C corr cells. This may indicate that mono-methylation of H4K31 is requiredin late response to DNA-ICL damage, however, due to the absence of functionalFA pathway in mutated cells, this modification is decreased, which qualifies thismodification as an example of a histone PTM that is affected by the absence offunctional FA proteins [Figure 2.6-C].
Figure 2.6: Histone H4 PTM profile after DNA-ICL Induction. The H/L ratios represent single experimentwhere L represents the untreated cells and H represents cells harvested either 1h or 6h after DNA-ICLinduction.
2.2 Discussion
In this part of our work we performed analysis of "histone code" part of cellular responseto DNA-ICL damage. We have chosen Fanconi anemia as a model, as the cells derived from

98 Chapter 2. Results - I
FA patients are hypersensitive to DNA-ICL damage, which manifests their inability to ad-equately respond to such kind of DNA lesions. Overall, we have identified several acety-lations and mono-methylations on both histone H3 and H4, which showed dependency onfunctional FA pathway.
We have observed an FA-dependent early increase in acetylation of the N-tails of histonesH3 and H4 ((K14 in H3 & K5, 8, 12, 16 in H4). As shown earlier, these residues play animportant role in chromatin dynamics during DDR especially in the case of DSBs, as mu-tations in H4 N-terminal tail confers sensitivity to ionizing radiation [Tamburini and Tyler,2005]; [Murr et al., 2006]. Moreover, a transient acetylation was observed at these residues atthe sites of DSBs and it has also been shown that this acetylation is mediated by Tip60 his-tone acetyltransferase complex [Murr et al., 2006]. Our results appear consistent with thesestudies, as we also observe an early increase in acetylation of H4 N-terminal tail. However,in our model, this acetylation depends on functional FA pathway, as no such increase wasobserved in case of FA mutant cells. If we assume that these modifications are similarly dueto Tip60 complex, the most natural next assumption is that FA proteins function upstreamto Tip60 complex in this response pathway. The mutation in FANCC, which we used, doesnot allow assembly of the FA core complex. The established function of core complex is tomono-ubiquitinate the FA-ID complex, through the action of FANCL, an E3 ubiquitin ligase.However, it is possible that the FA core complex has other substrates too. We can specu-late that it mono-ubiquitinates Tip60, leading to its activation or physical recruitment to theDNA-ICL lesions. On the other hand, since the levels of histone acetylation are influencedby both histone acetyltransferases (HATs) and histone deacetylases (HDACs), we can expectthat the increase in acetylation might also be due to decreased activity of HDACs, whichmay be directly or indirectly influenced by functional FA proteins.
In addition to Tip60 HAT, other HATs might also be responsible for this pattern of H4 acety-lations as well. These include MOF (MYST1/KAT8), HBO1 (MYST2/KAT7), CBP (KAT3A),and EP300 (KAT3B) [Kouzarides, 2007b]. It must be worth looking for their possible interac-tions with FA-proteins as they might be regulated or affected by the mutation in FA proteinsor alternatively, they may play a role in DDR to DNA-ICL damage.
In any case, it appears that that the acetylation of N-tails of H4 and H3 is a generic responseto many kinds of DNA damage. Although we have observed it in response to DNA-ICLdamage, other studies have detected these modifications in the case of DSBs, a differentkind of damage. One simple explanation of why this acetylation is important is the well es-tablished fact that acetylation of histone H4 N-terminal tails leads to an open conformationof chromatin [Kouzarides, 2007a], which might be a prerequisite for any kind of repair ac-tivity. Apart from making chromatin more accessible for the repair machinery, acetylationon these residues can also participate in sensing DNA damage. For example, histone acetyl-transferase hMOF was shown to function upstream of ATM in sensing DSB, via modificationof histone H4K16 [Gupta et al., 2005].
Among methylations, histone H3K79 methylation and H4K20 methylation have shown in-teresting dynamics in DDR to DNA-ICL. Although H3K79 methylation represents a con-

2.2. Discussion 99
stitutive mark, and so far has not been shown to be induced by DNA damage, our resultssurprisingly showed a substantial increase in this modification after induction of DNA-ICL.Moreover, this increase was only observed in the wild type cells and early after the dam-age, strongly suggesting that this modification requires functional FA proteins or at least afunctional FA-core complex formation. Study of the mechanistic role of this modification inDDR has shown that it provides a docking site for 53BP1, which recognizes this modificationthrough its tandem tudor domains [Huyen et al., 2004]; [Wysocki et al., 2005]. 53BP1 inter-acts with p53 and is an important checkpoint protein that is recruited to the DNA DSBs inminutes after exposure to ionizing radiation and colocalizes with γH2AX. The lack of con-sistency of our results with the current state of knowledge regarding this modification couldreflect a differential DDR pathway in case of DNA-ICL, as H3K79Me has been so far studiedonly in the context of DNA DSBs, which represent a different kind of lesion. This, H3K79Memight be one of the modifications that distinguishes the cellular response to DNA-ICL fromthat to DSBs and potentially other kind of lesions.
A relatively uncharacterized modifications H3K56me and H4K77me were also identified inour screen as showing differential response to DNA-ICL damage in wild type and mutantcell lines. These two residues, H3K56 and H4K77, are located in the core domains of H3 andH4, respectively, and participate in DNA-histone contacts. It is possible that any modifica-tion of these residues would affect the nucleosomal structure either positively or negatively.The striking early decrease in H3K56 mono-methylation in mutant cells [Figure 2.5-C] couldreflect either an active demethylase activity or eviction of H3K56me carrying histone H3,however, the later is less probable due to the early nature of the response. The absence ofsuch response in wild type cells suggests that the demethylase activity is controlled eitherdirectly or indirectly by FA-pathway. In case of H4K77me, the detectable increase in wildtype cells after 1h of DNA-ICL induction and its delayed response in mutants suggests thatit could provide a docking site for a downstream effector protein, which works in DNA dam-age signaling in the manner similar to H3K79me-53BP1. Therefore, it would be intriguing tosearch for its binding partners in DNA damage response.
Mono-methylation on histone H3K9 is a mark associated with euchromatin. Our resultsshowed a remarkable increase in this modification in wild type cells but only after 6h ofDNA-ICL induction. An attenuated response was also seen in FA mutant cells after 6h. Thislate responding modification might signal the end of DNA repair in wild type cells and dueto either delayed repair or persistent damage in FA mutant cells, this late response was notas significant as in wild type cells. Another mono-methylation, on H4K31, also showed adelayed decrease in FA mutant cells while no change was observed in wild type cells at thetwo time points. This decrease in methylation, as discussed earlier may be due to the activityof demethylases or due to the removal of histone H4 carrying this modification.
Overall, our results showed a number of histone PTMs that responded dynamically to theDNA-ICL damage, often in FA-dependent manner. We also were able to classify these mod-ifications as early responders and late responders. This dynamic behavior of histone PTMslead us to propose the following model of ’histone code’ part in DDR to DNA ICL. We hy-pothesize that immediately upon induction of DNA damage, chromatin is locally destabi-

100 Chapter 2. Results - I
lized to facilitate the access to DNA damage sensing and repair machinery. The PTMs mostlikely responsible for this part are acetylations of histones H3 and H4 N-terminal tails, asthese modifications are believed to loosen up histone-DNA interactions and hence create arelaxed nucleosome. This relaxation leads to additional modifications, now on the histonecore domain residues, such as H3K79 and H4K77, which are expected to become more ac-cessible, both to the modifying enzymes and to the downstream effector proteins. The lat-ter specifically recognize these marks and bring about important changes in recruitment ofother proteins and checkpoint activation. H3K79me-53BP1, for instance, is an example ofsuch binding event. The late response modifications, on the other hand, most likely signalthe end of repair. In our system, the H3K9me is increased late after the DNA damage induc-tion and may signal an increase in transcriptional activity. The proposed interpretation of thehistone PTM changes is consistent with the general Access-Repair-Restore model for DNAdamage and repair activities [Section1.5.2], supporting the notion that, similar to other kindsof DNA damage, the efficient execution of cellular response to DNA ICL requires changes inchromatin structure.

3Results - II
In the previous chapter we have analyzed the dynamics of various histone post-translationalmodifications in response to induction of DNA-ICL lesions and observed that some of thesePTMs interestingly depend on the functional Fanconi Anemia pathway. There are many dif-ferent enzymatic activities in the cell responsible for histone modifications, thus in orderto obtain further insight into the role of histone PTMs in Fanconi Anemia, we resorted tofunctional genomics approach. We analyzed the transcriptome of normal and FA-defectivecells after induction of DNA-ICL damage. One goal of such an approach was to monitorthe changes in expression of known histone modifying enzymes, in order to find genes thatbest correlate in their expression profiles with the changes in histone PTMs that we have ob-served. Given that our analysis was focused on histone acetylations and methylations, thispart of analysis was mostly focused on enzymes responsible for these modifications or fortheir removal.
However, our functional genomics analysis had a second goal, extending it beyond the mon-itoring of histone modifying enzymes. Regardless of the implications for histone code, wealso decided to study the general differences between FA mutant and corrected cell linesat transcriptional level and the transcriptional response to DNA-ICL damage in these cells.One of the goals was to understand what part of the cellular response to DNA-ICL is depen-dent on functional FA pathway. The second goal was to understand what else can happento the cells after DNA-ICL damage if the FA pathway is not working. For this purpose, thefunctional genomics experiments were designed in a way that allowed to apply the so calledinteraction analysis to the data obtained [Section 3.3.3]
In this global transcriptome analysis, in addition to the transcriptional response to DNA-ICLs, we also decided to include a different kind of DNA damage, i.e., ionizing radiation
101

102 Chapter 3. Results - II
induced damage, which generates mostly double DNA strand breaks (DSB). As FA mutantcells are highly sensitive to DNA-ICL damage, the goal of this comparative analysis was tounderstand what part of the transcriptional response is specific for DNA-ICL damage, andwhat part of the same response could reflect a more general cellular response to any kind ofDNA damage.
We also have to admit two caveats in our analysis. As described earlier, the DNA damage re-sponse to DNA-ICLs depends upon the functional FA pathway, which is based upon the con-certed activities of at least 13 different FA proteins. A mutation in any one of these proteinsleads to inactivation of the whole FA pathway and thus affects the DDR to DNA-ICL dam-age. Our histone PTM study [Chapter 2] was performed using FA-C mutated cells, whereasour transcriptome analysis was done with FA-D2 mutation. We would like to point out thatalthough FANCC, a core complex protein, functions upstream of FANCD2 protein, and isessential for the activation of FANCD2, the mutation in either of them leads to the similarphenotypic changes in general, i.e. inactivation of FA-pathway. We acknowledge, however,that the results of our transcription data may not be reflected directly on the histone codechanges, as the experiments were performed in two different cell lines, representing twodifferent stages of FA-pathway.
The second caveat in our analysis is due to a different ways of comparison between thesamples that we have used in our SILAC-based analysis of histone PTMs and in our tran-scriptome analysis. Because there was no direct comparison between the reference and ev-ery sample in our histone PTM analysis, this somewhat limited the possibility to make directcomparisons, especially for the early response in the FA mutant cell lines. Nevertheless, evenwith these limitations in mind, we still hope that our analysis allowed us to rule out someexplanations of the observed changes in histone PTM patterns and thus to narrow down thenumber of potential mechanisms of the cellular response to DNA-ICL.
3.1 Experimental Setup
In order to setup our experiments, FA-D2 mutated and corrected cells were incubated with8-MOP at 37◦C for 20 minutes and then irradiated with a suitable dose of UVA (10 KJ/m2).In order to study the kinetics of DNA damage response (DDR) in these cells after DNA-ICLinduction, two time points were chosen, i.e. 1h and 6h. For ionizing radiation, which inducesdouble stand breaks on DNA (DSB), we used Cesium based irradiator. Cells were irradiatedat 10 Gy and later incubated for 1h and 6h as for DNA-ICL induction. These two time pointsallowed us to quantify and classify changes in gene expression in FA-D2 corrected and mu-tated cells as early and late responses to DNA damage induction. [Figure 3.1] describes theschematics of microarray experiment.

3.2. Transcriptome Analysis of Histone Modifying Enzymes in Fanconi Anemia Model 103
Figure 3.1: cDNA microarray experiment design.
In microarray experiments FA-D2 corrected untreated cells were taken as reference for allthe samples. RNAs were prepared from different samples using Trizol reagent and RNeasycolumns as described in [Chapter 6].
3.2 Transcriptome Analysis of Histone Modifying Enzymes in Fan-coni Anemia Model
The first goal of the functional genomics analysis was to obtain clues on what histone modi-fying enzymes could be responsible for the patterns of modifications that we have observedin our PTM analysis. Accordingly, we specifically searched for the histone modifying en-zymes, aiming to identify those genes that show changes in their levels that correlate andthus could explain the changes in particular histone modification. Here, we focused ouranalysis towards histone acetyltransferases (HATs), histone deacetylases (HDACs), histonemethyltransferases (HKMTs) and histone demethylases (HKDMs), as we detected and an-alyzed mainly histone acetylations and methylations in proteome analysis part. In general,the gene expression profile analysis of these enzymes showed notable differences betweenFanconi anemia mutated and corrected cell lines, which indicates that the expression of someof these enzymes is directly or indirectly affected by the mutation in Fanconi Anemia genes.
104 Chapter 3. Results - II
We again have to admit a design flaw in our experiment, as the samples were not comparedin exactly the same way as in the previous section, which somewhat limited our possibilityto make direct comparisons, especially for the early response in the FA mutant cell lines. Thesecond interpretational caveat, common for all functional genomics data, is that the proteinactivity can be modulated in different ways independent on total protein/RNA levels. Nev-ertheless, we still hope that this analysis allowed us to rule out some simple mechanismsand thus narrow down the search.
3.2.1 Histone Acetyltransferases (HATs)
We analyzed the expression profile of 10 histone acetyltransferases, including the GNAT-family (GCN5 & PCAF), MYST-family (Tip60, HBO1, MOF, MOZ, MORF) and others in-cluding p300, CBP and HAT1.
We have noticed that, among these HATs, the changes in expression of PCAF and MORFacetyltransferases appear to match most closely the changes in acetylation of the H4 termi-nal tail [Figure 2.6-A]. Indeed, both of these HATs were up-regulated 1h after MOP/UVAtreatment, however, the levels go down at 6h time point. In the mutant cell lines, the tran-scriptional response is also less pronounced 6h after treatment as compared to the 1h timepoint [Figure 3.2]. Note that we cannot comment directly on the levels of 1h response inmutant cells, as we did not compare mutant and wild type cells in our SILAC experiments.With this caveat in mind, both of these HATs could be considered as plausible candidatesresponsible for the observed dynamics of H4 acetylation. However, taking into account thatPCAF does not acetylate H4 histone but is responsible for H3 acetylation, the simplest inter-pretation of the observed changes in H4 acetylation is that they are due to the changes in thelevels of MORF histone acetyltransferase (see however, next section about a potential role ofhistone deacetylases).
Unlike H4 acetylation, the profile of H3 acetylation [Figure 2.5-D] was not possible to ex-plain by the changes in expression of one HAT only. Given their specificity towards H3K14residue, GCN5 and PCAF histone acetyltransferases appear as the most plausible candidatesfor the H3 acetylation. Moreover, the levels of PCAF mirror the dynamics of the H3K14ac 1hand 6h after treatment. However, in the mutant cells, the levels of H3K14ac are higher 6hafter damage as compared to 1h, whereas the levels of PCAF go down from 1h to 6h aftertreatment. Thus, additional factors should be considered in explanation of this pattern (seethe HDAC section).
3.2.2 Histone Deacetylases (HDACs)
As discussed earlier, the function of HDACs is opposite to that of HATs in that they areresponsible for the removal of acetyl groups from the lysines of target proteins. Therefore,their dynamics can also contribute to the explanation of observed acetylation patterns, if it

3.2. Transcriptome Analysis of Histone Modifying Enzymes in Fanconi Anemia Model 105
Figure 3.2: Gene expression profile of HATs in MOP/UVA treated FA-D2 corrected and mutant cells, where,R1 is an array Mutated Untreated/Corrected Untreated, R2 is Corrected 1h Treated/Corrected Untreated,R3 is Mutated 1h Treated/Corrected Untreated, R4 is Corrected 6h Treated/Corrected Untreated, R5 isMutated 6h Treated/Corrected Untreated. The bars represent ratios of expression values of correspondinggenes from single microarray.
Figure 3.3: Gene expression profile of HDACs in MOP/UVA treated FA-D2 corrected and mutant cells. Thebars represent ratios of expression values of corresponding genes from single microarray.

106 Chapter 3. Results - II
anti-correlates with the acetylation levels. Accordingly, we analyzed expression levels of 11HDACs in our experiment.
Concerning H4 acetylation, the pattern of expression of HDAC10 and HDAC11 could be thebest candidate to explain the dynamics of acetylation of H4 histone, as their levels of expres-sion are higher 6h after treatment than 1h after treatment. However, HDAC10 could not beresponsible for the early increase in H4 acetylation, because its levels are not changed 1hafter treatment [Figure 3.3]. On the other hand, the levels of HDAC11 do not change as dra-matically as the acetylation levels. Therefore, we still believe that the simplest explanationof the observed changes in H4 acetylation is due to the changes in the levels of MORF HAT.
Concerning H3 acetylation, no HDAC gene appears to be solely responsible for the observeddynamics of this modification. However, the HDAC2 and HDAC6 show a significant de-crease in expression in the mutant cells 6h after treatment as compared to 1h time point [Fig-ure 3.3]. Assuming that PCAF is responsible for the H3 acetylation pattern, the behavior ofthese deacetylases could be responsible for the increase in H3 acetylation 6h after treatmentin mutant cells, which could not be explained solely via the changes in PCAF levels.
Overall, we have noticed that HDAC genes manifested less varied response to DNA damageinduction and FA mutation, as compared to HAT genes. One strong exception was HDAC9(transcriptional variant 3), that showed a dramatic 10 fold increase in expression in the FAdefective cell line [Figure 3.3]. Also notably, the expression levels of this gene went down6h after MOP/UVA treatment. Therefore, the changes in the levels of this protein could alsoexplain the observed increase in H3 acetylation in mutant cells 6h after treatment, if taken to-gether with PCAF dynamics. One have to keep in mind, however, that this particular variantof HDAC9 is catalytically inactive [Petrie et al., 2003].
3.2.3 Histone Methylation
We next applied similar logic to the analysis of 23 histone methyltransferases and 15 histonedemethylases. Histone lysine methyltransferases are much more specific than histone acetyl-transferases, as for example, histone methyltransferases SUV39H1/2, SETDB1/2, EHMT1/2and PRDM2 are specific for methylation on histone H3K9. Likewise, MLL, SET1A/B, SMYD1-/3, SET7/9 are specific for methylation on histone H3K4. Most histone KMTs have character-istic SET (Su(Var)3-9, Enhancer of Zest, Trithorax) domain that methylates specific residueson histones and non-histone proteins. The only exception to this rule is H3K79 methyltrans-ferase, DOT1L, which does not have SET domain [Feng et al., 2002]; [Martin and Zhang,2005]. We grouped and analyzed the gene expression profile of various histone KMTs ac-cording to their specificity of residues on histones [Figure 1.10].
Unlike in the case of histone acetylation and despite the greater variety of analyzed genesand a larger number of modified residues with different profiles, it was not easy to find asingle methyl-transferase and/or demethylase gene that could explain the observed profilefor any of the H3 or H4 methylations. The closest match was the expression of PRDM2 andEHMT2 and the profile of H3K9 methylation [Figure 3.4]. Indeed, both the levels of these

3.2. Transcriptome Analysis of Histone Modifying Enzymes in Fanconi Anemia Model 107
enzymes and the histone modification levels increase late after DNA damage in the wildtype cells, and they are also higher 6h than 1h after damage in the FA mutants. The secondcase was the profile of H4K31 methylation and the expression of KDM1B demethylase thatwas sharply up-regulated late after treatment in mutant cell lines, which could explain thedecrease in the histone modification in the same sample [Figure 3.6].
Figure 3.4: Gene expression profile of HMTs in MOP/UVA treated FA-D2 corrected and mutant cells. Thebars represent ratios of expression values of corresponding genes from single microarray.
Concerning the H3K79 methylation, which was increased 10 fold early after damage (onlyin the wild type cells), only EZH1 and SetDB2 were up-regulated at this time point [Fig-ure 3.5]. However, the former gene had even higher expression levels later after treatment,whereas the later gene manifested significant differences in expression in the mutant celllines between the 1h and 6h sample. Thus, no single gene expression could account forthe pattern of H3K79 methylation. However, a number of demethylases, such as KDM2B,

108 Chapter 3. Results - II
Figure 3.5: Gene expression profile of HMTs in MOP/UVA treated FA-D2 corrected and mutant cells. Thebars represent ratios of expression values of corresponding genes from single microarray.
KDM4A and KDM6B had an increased expression levels late after treatment, suggestingthat the concerted action of these two classes of enzymes could be the simplest explanationof the observed pattern of H3K79 methylation, based on our data [Figure 3.6].
The simplest explanation of the dramatic decrease in H3K56 methylation in the mutantcells 1h after treatment would be an increased level of a histone demethylase. However, wecould not find any gene that showed a desired expression pattern. The KDM3A demethylaseshowed a little increase, but it was not significant to explain the observed effects. Also, wecould not find a methyltransferase that could, in combination with the KDM3A, account forthe observed pattern of this histone modification [Figure 3.6].
To summarize, by performing functional genomics analysis, we were able to find enzymesthat could be responsible for some of the changes in the histone modifications that wehave observed after induction of DNA-ICL damage in the wild type and FA-defective cells.In some cases, such as H4 acetylation, we found a single gene with the expression levelsthat were matching the changes in this modification in the samples studied. In most of theother cases, it was possible with two enzymes having opposite activities (such as HATs vsHDACs).
One have to keep in mind, however, that the changes in gene expression level do not nec-essarily translate into increased protein levels, let alone to the increased levels of enzymeactivity. Various post-translational regulation steps could also be involved in the observed

3.3. Global Transcriptional Analysis 109
Figure 3.6: Gene expression profile of KDMs in MOP/UVA treated FA-D2 corrected and mutant cells. Thebars represent ratios of expression values of corresponding genes from single microarray.
patterns of histone modifications, including activation or repression of the enzymes respon-sible, as well as their recruitment to chromatin. Such analysis, however, was beyond thescope of our study. In any case, the results of transcriptional analysis of histone modifyingenzymes showed intriguing differences between wild type and mutated cells both at thebasal level and also after induction of DNA-ICL damage. These differences may reflect thedependence of these enzymes on the presence of functional FA-pathway. Given that manyhistone modifying enzymes have, in addition to histones, other protein targets, these datamight prove useful for better understanding of cellular response to DNA-ICL damage.
3.3 Global Transcriptional Analysis
The second goal of transcriptional analysis was to analyze the total transcriptome after dam-age in mutant or wild type cells. We also included in this analysis, in addition to DNA-ICL,ionizing radiation induced DNA damage, as we wanted to dissociate more generic responseto DNA damage from a more specific changes that are associated with the role of FA path-way to the DNA ICLs.

110 Chapter 3. Results - II
3.3.1 Transcriptional responses to DSB and DNA ICL are different
At first, we analyzed the generic transcriptional response to two kinds of DNA damage inFA-D2 corrected cells, which are considered as "wild type" or normal cells. For this, we com-pared the transcriptomes from untreated cells with the same cells treated with MOP/UVAor IR at 1h and 6h time points. [Figure3.7-A & -B] shows the numbers of differentially ex-pressed genes in cells where either DNA-ICL and DSB were induced, at the early (1h) andlate (6h) times after treatment. These signature sequences were selected by filtering the dataat fold change ±1.5 and P<=1.0E-5. Curiously, we have observed that the early responsewas significantly more prominent in the case of MOP/UV treatment, as compared to the IR.Moreover, the overwhelming majority of the genes affected were up-regulated, whereas theIR-treatment affected genes showed opposite pattern.
Figure 3.7: The overall transcriptional response to two types of DNA damage. The bars represent the num-ber of genes. The filter was set at fold change ±1.5 and P<=1.0E-5.
We performed the functional annotation analysis of affected genes in case of MOP/UVAtreated cells after 1h. For convenience, we divided this analysis into two categories, i.e. thefunctions enriched in up-regulated and down-regulated genes. As seen in [Table 3.1], theanalysis of up-regulated genes in 1h-MOP/UVA treated cells showed that mainly the se-quences corresponding to transcription related activity and kinase based signaling pathwayswere enriched. As expected from the much smaller number of down-regulated genes, the en-richment in a particular GO class was less specific, although transcriptional regulation andnucleosome assembly related functions were enriched with low p-values [Table 3.2].

3.3. Global Transcriptional Analysis 111
Table 3.1: Gene Ontology (GO) analysis of up-regulated sequences in FA-D2 corrected (1h-MOP/UVA) cellsVS FA-D2 corrected untreated cells.
Primary GO Term Name P-valueTranscription factor activity 3,64E-06Transcription corepressor activity 0,00007Negative regulation of transcription factor activity 0,0014Regulation of transcription, DNA-dependent 0,00255Positive regulation of transcription from RNA polymerase II promoter 0,00451Transcription factor binding 0,00855Mitogen-activated protein kinase kinase binding 4,13E-06Negative regulation of lipopolysaccharide-mediated signaling pathway 0,00001Regulation of MAP kinase activity 0,00006MAP kinase tyrosine/serine/threonine phosphatase activity 0,00055Inactivation of MAPK activity 0,00263JNK cascade 0,00291Protein kinase inhibitor activity 0,00306Negative regulation of protein kinase activity 0,00456Mitogen-activated protein kinase binding 0,00612Protein kinase activity 0,00634
Table 3.2: Gene Ontology (GO) analysis of down-regulated sequences in FA-D2 corrected (1h-MOP/UVA)cells VS FA-D2 untreated cells.
Primary GO Term Name P-valuenucleosome 0,0376nucleosome assembly 0,04322positive regulation of transcription, DNA-dependent 0,04463transcription from RNA polymerase II promoter 0,05715chromosome 0,06487
[Table 3.3] & [Table 3.4] show similar analysis of IR treated cells. As seen from the [Table 3.3],among the up-regulated genes, apart from transcription related activity, there is a notable en-richment of sequences related to histone acetylation, which is consistent with the establishedfact that histone acetylation is increased early after DNA damage. Moreover, unlike in thecase of MOP/UVA treatment, cell cycle arrest function is also enriched. Among the down-regulated genes [Table 3.4], cell cycle progression, especially mitosis and spindle checkpointrelated functions are enriched, also consistent with a faster cell cycle response in the case ofIR induced DNA damage, as compared to the DNA-ICLs.
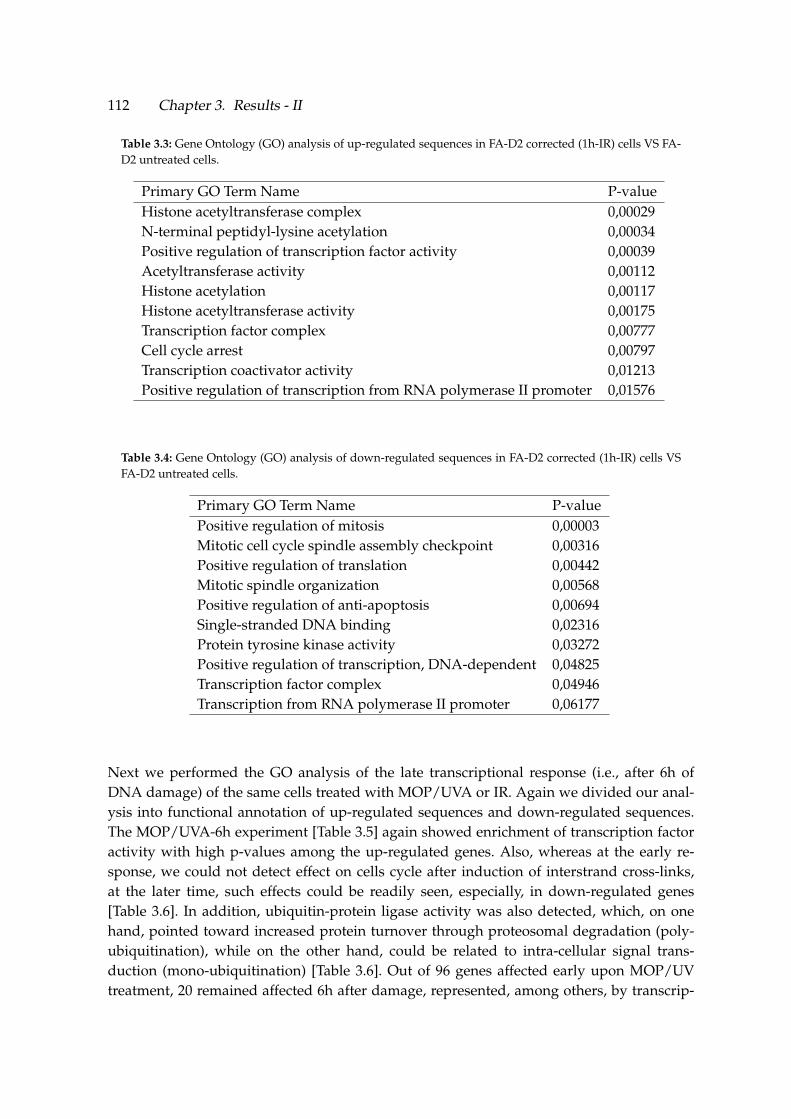
112 Chapter 3. Results - II
Table 3.3: Gene Ontology (GO) analysis of up-regulated sequences in FA-D2 corrected (1h-IR) cells VS FA-D2 untreated cells.
Primary GO Term Name P-valueHistone acetyltransferase complex 0,00029N-terminal peptidyl-lysine acetylation 0,00034Positive regulation of transcription factor activity 0,00039Acetyltransferase activity 0,00112Histone acetylation 0,00117Histone acetyltransferase activity 0,00175Transcription factor complex 0,00777Cell cycle arrest 0,00797Transcription coactivator activity 0,01213Positive regulation of transcription from RNA polymerase II promoter 0,01576
Table 3.4: Gene Ontology (GO) analysis of down-regulated sequences in FA-D2 corrected (1h-IR) cells VSFA-D2 untreated cells.
Primary GO Term Name P-valuePositive regulation of mitosis 0,00003Mitotic cell cycle spindle assembly checkpoint 0,00316Positive regulation of translation 0,00442Mitotic spindle organization 0,00568Positive regulation of anti-apoptosis 0,00694Single-stranded DNA binding 0,02316Protein tyrosine kinase activity 0,03272Positive regulation of transcription, DNA-dependent 0,04825Transcription factor complex 0,04946Transcription from RNA polymerase II promoter 0,06177
Next we performed the GO analysis of the late transcriptional response (i.e., after 6h ofDNA damage) of the same cells treated with MOP/UVA or IR. Again we divided our anal-ysis into functional annotation of up-regulated sequences and down-regulated sequences.The MOP/UVA-6h experiment [Table 3.5] again showed enrichment of transcription factoractivity with high p-values among the up-regulated genes. Also, whereas at the early re-sponse, we could not detect effect on cells cycle after induction of interstrand cross-links,at the later time, such effects could be readily seen, especially, in down-regulated genes[Table 3.6]. In addition, ubiquitin-protein ligase activity was also detected, which, on onehand, pointed toward increased protein turnover through proteosomal degradation (poly-ubiquitination), while on the other hand, could be related to intra-cellular signal trans-duction (mono-ubiquitination) [Table 3.6]. Out of 96 genes affected early upon MOP/UVtreatment, 20 remained affected 6h after damage, represented, among others, by transcrip-

3.3. Global Transcriptional Analysis 113
tion corepressor activity, SMAD binding and DNA methylation [Figure 3.8-A & Table 3.7].Similarly, the IR-6h experiment showed mainly the transcription related activity among theup-regulated genes. Interestingly, some chromatin related functions were also enriched in-cluding histone demethylase, acetyltransferase, and ubiquitination activity [Table 3.8]. Thedown-regulated sequences again showed cell cycle related functions and response to stressand radiation, as an expected late response [Table 3.9]. Among the chromatin related activ-ities, HDAC binding was observed. In case of IR treated 1h and 6h samples [Figure 3.8-B &Table 3.10], 9 genes consistently showed altered gene regulation after 6h of damage, repre-senting stress response (mostly related to heat shock) and histone acetyltransferase activitiesamong the most prominent functions indicating that histone acetylation is an integral partof IR induced DNA damage response at both early and late time points.
Figure 3.8: Venn dagrams showing comparisons of MOP/UVA 1h and IR 1h (A), MOP/UVA 6h and IR 6h(B), MOP/UVA 1h and 6h (C), and IR 1h and 6h (D).
Next, we analyzed whether there is anything common between the transcriptional responsesto MOP/UVA and IR treatments. As shown in [Figure 3.8-C] only one gene was moderatelyupregulated 1h after both treatments, which corresponds to PKD2 (poly-cystic kidney dis-ease 2), a membrane protein involved in calcium transport. Intriguingly, the literature searchshowed no link of this gene to DNA damage response. However, a significant overlap wasobserved in the late responding genes, as shown in [Figure 3.8-D]. As one might expect, geneontology analysis [Table 3.11] revealed the most similarity in cell proliferation related genes,as well as in the induction of apoptosis.
To summarize, the cellular responses of the wild type cells to the two kinds of DNA damageappear to be quite different, especially at the early times. In the case of DNA-ICLs, transcrip-

114 Chapter 3. Results - II
Table 3.5: Gene Ontology (GO) analysis of up-regulated sequences in FA-D2 corrected (6h-MOP/UVA) cellsVS FA-D2 untreated cells.
Primary GO Term Name P-valueSequence-specific DNA binding 9,79E-13Regulation of transcription, DNA-dependent 2,58E-12Transcription factor activity 2,01E-10Nucleus 4,67E-06Zinc ion binding 5,23E-06DNA binding 0,00001Negative regulation of cell proliferation 0,00064Cyclin-dependent protein kinase inhibitor activity 0,00082Cell growth 0,00091
Table 3.6: Gene Ontology (GO) analysis of down-regulated sequences in FA-D2 corrected (6h-MOP/UVA)cells VS FA-D2 untreated cells.
Primary GO Term Name P-valueCell cycle 5,02E-13Cell division 5,41E-11Ubiquitin-protein ligase activity 1,65E-10Mitosis 1,99E-10Protein amino acid phosphorylation 1,09E-08Negative regulation of transcription 9,05E-06Cell cycle arrest 0,00002Cellular response to UV 0,00002ATP-dependent helicase activity 0,00005G1/S transition of mitotic cell cycle 0,00006Positive regulation of transcription from RNA polymerase II promoter 0,00007Negative regulation of DNA recombination 0,00009Protein serine/threonine kinase activity 0,00012Positive regulation of phosphorylation 0,00019Intra-S DNA damage checkpoint 0,00022Negative regulation of cell growth 0,00023Response to DNA damage stimulus 0,00025Single-stranded DNA binding 0,00026Protein ubiquitination 0,00032Negative regulation of mitotic cell cycle 0,00038Double-stranded DNA binding 0,00063Ubiquitin ligase complex 0,00093
tion regulation appears to be more significantly affected than in the case of double-strandbreaks. On the other hand, histone acetylation appears to play a more significant role in the

3.3. Global Transcriptional Analysis 115
Table 3.7: Gene Ontology (GO) analysis of common sequences in 1h and 6h MOP/UVA treated FA-D2corrected cells VS FA-D2 untreated cells.
Primary GO Term Name P-valueTranscription corepressor activity 0,00063SMAD binding 0,00177DNA methylation 0,01131SMAD protein signal transduction 0,01131
Table 3.8: Gene Ontology (GO) analysis of Up-regulated sequences after 6h IR treated FA-D2 corrected cellsVS FA-D2 untreated cells.
Primary GO Term Name P-valueRegulation of transcription, DNA-dependent 2,10E-08Nucleus 2,24E-07Zinc ion binding 4,93E-06Induction of apoptosis 0,00003Transcription factor activity 0,00003Negative regulation of cyclin-dependent protein kinase activity 0,00009Cyclin binding 0,00046Cell cycle arrest 0,00238Chromatin organization 0,00264Response to DNA damage stimulus 0,00276Negative regulation of apoptosis 0,00325Negative regulation of phosphorylation 0,00401Histone demethylation 0,0167Histone demethylase activity (H3-K36 specific) 0,0222Histone acetyltransferase complex 0,03312Nucleosome positioning 0,03312Chromatin silencing complex 0,03853Histone ubiquitination 0,04392
response to DSB as compared to ICL. Also, consistent with a more rapid response to DSB,the cell cycle regulation is prominently affected early after IR treatment, and only 6h afterthe MOP/UVA treatment. By comparing transcriptional DDR between DNA-ICL and DSB,we were also able to detect the genes that most probably reflect a generic response to a DNAdamage. Not surprisingly, cell proliferation and apoptosis-related genes were most promi-nent among this category.

116 Chapter 3. Results - II
Table 3.9: Gene Ontology (GO) analysis of Down-regulated sequences after 6h IR treated FA-D2 correctedcells VS FA-D2 untreated cells.
Primary GO Term Name P-valueNucleus 7,98E-32Cell cycle 4,12E-23Cell division 1,45E-20Transcription factor activity 1,47E-12Positive regulation of transcription from RNA polymerase II promoter 6,72E-11Cell proliferation 4,13E-09Protein serine/threonine kinase activity 5,64E-09Transcription repressor activity 2,38E-08Apoptosis 1,48E-07Negative regulation of cell growth 0,00001DNA damage response 0,00008Negative regulation of transcription factor activity 0,00021Histone deacetylase binding 0,00045Single-stranded RNA binding 0,00056SMAD binding 0,00058Response to stress 0,00058Response to radiation 0,00069Mitotic cell cycle spindle assembly checkpoint 0,00096Ubiquitin protein ligase binding 0,00123Chromatin binding 0,01298G1/S transition checkpoint 0,02095Nucleosome binding 0,04114DNA replication 0,05995
Table 3.10: Gene Ontology (GO) analysis of common sequences in 1h and 6h IR treated FA-D2 correctedcells VS FA-D2 untreated cells.
Primary GO Term Name P-valueResponse to heat 0,00006Heat shock protein binding 0,00036Unfolded protein binding 0,00089N-terminal peptidyl-lysine acetylation 0,00826Acetyltransferase activity 0,00826Histone acetylation 0,00826Histone acetyltransferase complex 0,00826
3.3.2 Transcriptome is dramatically affected by defect in FA pathway
Before analyzing how the cellular response to DNA damage is affected in the cells defectivein the FA pathway, we wanted to see the differences in transcriptional profile between FA-D2

3.3. Global Transcriptional Analysis 117
Table 3.11: Gene Ontology (GO) analysis of common sequences in 6h MOP/UVA and IR treated FA-D2corrected cells VS FA-D2 untreated cells.
Primary GO Term Name P-valueMitosis 0,00177Induction of apoptosis 0,00703Cell division 0,00711
corrected and mutated cells without induction of any DNA damage. Approximately equalnumbers of genes were up- and down-regulated in the mutant cells [Figure 3.9]. Quite sur-prisingly, the GO analysis of up-regulated genes showed many chromatin related functionsto be affected by FA-D2 mutation, most prominently including histone acetyltransferase ac-tivities and ubiquitination. Most notable genes in this category are presented in [Table 3.12].In this respect, the cellular response to FA-D2 mutation was more reminiscent of the wildtype cell response to the DNA double strand breaks than to the DNA-ICLs. This was some-what surprising, however, might be reflecting the fact that defect in FA pathway leads topermanent elevation of DSB levels in the cells (e.g., resulting from stalled replication forks).
The analysis of down-regulated genes in FA-D2 mutant vs FA-D2 corrected (both untreated)does not show any significant enrichment of pathways related to chromatin modifying activ-ities. However, protein demethylation and dephosphorylation activities were enriched alongwith cell cycle arrest and anti-apoptosis activities [Table 3.13].
Figure 3.9: Numbers of genes up and down-regulated in FA-D2 mutated cells, as compared to the wild type(FA-D2 corrected )without any DNA damage induction.

118 Chapter 3. Results - II
Table 3.12: Up-regulated chromatin-related genes in untreated FA-D2 mutant VS wild type cells.
Gene Name & Symbol Fold Change P-valueCullin 9 (CUL9) 5,49321 8,49163E-16MYST histone acetyltransferase 3 (MYST3) 4,9904 5,04243E-13MYST histone acetyltransferase 4 (MYST4) 3,17932 2,43832E-09Chromodomain helicase DNA binding protein 7 (CHD7) 3,16401 1,69855E-10E1A binding protein p300 (EP300) 2,59095 3,93592E-17High-mobility group nucleosome binding domain 5 (HMGN5) 2,5607 9,49204E-17Chromodomain helicase DNA binding protein 7 (CHD7) 2,45127 7,80561E-08Cullin 4A (CUL4A), transcript variant 1 2,36822 1,02539E-07K(lysine) acetyltransferase 2B (KAT2B) 2,2195 7,98776E-06M-phase phosphoprotein 8 (MPHOSPH8) 2,21176 6,40402E-07K(lysine) acetyltransferase 2B (KAT2B) 2,07674 3,91118E-06N(alpha)-acetyltransferase 16 (NAA16), transcript variant 1 1,66772 0,00062CREB binding protein (CREBBP), transcript variant 1 1,54194 0,0032
Table 3.13: Gene Ontology (GO) analysis of genes down-regulated in untreated FA-D2 mutant cells ascompared to the wild type (FA-D2 corrected).
Primary GO Term Name P-valueProtein amino acid demethylation 0,00002Positive regulation of cell cycle 0,00056Anti-apoptosis 0,00219Cell proliferation 0,00502Protein amino acid dephosphorylation 0,0052Response to stress 0,00751Cell cycle arrest 0,00857Mismatch repair 0,00864
3.3.3 Role of Fanconi Anemia pathway in the Transcriptional Response to DNADamage
The next step of our analysis was to compare the responses to the two kinds of DNA damagebetween the wild type and FA-defective cells. Given that FA-negative cells are hypersensi-tive to the ICL type of DNA damage, this analysis could help us to understand what part ofthe cellular response to ICL that we have observed in the wild type cells requires functionalFA pathway. These FA-dependent changes most likely constitute the bona-fide cellular re-sponse to ICLs. Equally importantly, by finding genes that are affected by DNA damage onlyin the mutant cells, the same experiments should also help us to find out what unwantedconsequences of DNA damage the FA pathway protects the cells from.

3.3. Global Transcriptional Analysis 119
At first, we compared the gene expression profiles between wild type and mutant cells foreither MOP/UVA-(1h and 6h samples), [Figure 3.10] or IR-(1h & -6h treated samples), [Fig-ure 3.11] induced damage. For this purpose, we used cluster analysis to visualize generalsimilarities between different samples. Clustering in two dimensional space is often usedto give ordering by identifying groups of genes that show the most similarity in their be-havior and then arranging these groups so that the closest groups of genes are adjacent toeach other. In addition, the samples are also ordered in clusters according to their similari-ties among each other. The numbers of samples are significantly smaller that the numbers ofgenes, and thus they are easier to directly compare on the heatmaps. Accordingly, at first wecompared two different DNA damage treatments in terms of similarities between the sam-ples. We have noticed an intriguing difference between MOP/UVA treatment and IR treat-ment in this respect. In both types of DNA damage, all samples that correspond to mutantcells cluster closest to each other, with the untreated and 1h samples being most close, andthe 6h treatment being slightly more apart. The clustering of mutant samples most likely re-flects the abundant differences between mutant and wild type cells, which keeps them moresimilar to each other regardless of what DNA damage treatment was used. However, weobserved a difference between MOP/UVA and IR treatment in how it affected the wild typecells. The 1h and 6h IR-treated wild type samples were closer to each other than to any ofthe mutant IR-treated samples. On the other hand, the 1h and 6h MOP/UVA-treated wildtype samples did not cluster together, but the 1h sample was closer to the ’mutant cluster’than the 6h sample. This observation suggests that the dramatic long term response to ICLdamage (6h) that is observed in the case of wild type cells is significantly compromised inthe FA-negative cells. This is consistent with the known role of FA pathway in response toICL damage.
Figure 3.10: 2-Dimensional cluster of MOP/UVA treated samples. Sequences having FC ≥ 3.0 and/or p-value ≤ 1.0E − 5 in any one of the five experiments were included in the cluster analysis.
After comparing between different samples in the cluster analysis, we set out to find genes

120 Chapter 3. Results - II
Figure 3.11: 2-Dimensional cluster of IR treated samples. Sequences having FC ≥ 3.0 and/or p-value ≤1.0E − 5 in any one of the five experiments were included in the cluster analysis.
that are affected differently by DNA damage in the wild type and FA-defective cells. Suchanalysis should help us to address two different questions:
I What part of the transcriptional response to DNA damage requires functional FA-pathway?
II What happens to cells after DNA damage if FA pathway is inactive?
In order to extract this information from our functional genomics data, we applied interac-tion analysis. We can define the notion of interaction or non-additivity of effects as "The jointeffect of two factors differs from what might be predicted on the basis of their independenteffects alone. It is the measurement of the extent to which the presence or absence of onefactor affects the differential expression of a gene in response to the presence or absence ofthe other factor" [Yang and Speed, 2002].
First we will use a toy example to explain the notion of interaction between two factors in agiven functional genomics experiment [Figure 3.12].
We have "factor A" and "factor B", which could affect the expression of a given gene. Thesefactors could be a particular experimental condition (DNA damage) or a particular mutation,etc. Now we consider an experiment where cells affected by factor A or by factor B arecompared to a control C. We also have an experiment where we combine these two factorsin an experiment AB and the expression of gene is measured in A, B, and AB. Now, if thefactors A and B act on the gene independent from each other, then the fold change in thelevel of expression of the gene in AB, as compared to control C (we designate it Rab), shouldbe the product of the fold changes in its expression in A and B experiments : Rab = Ra*Rb.

3.3. Global Transcriptional Analysis 121
Figure 3.12: 2x2 Factorial experiment and the idea of interaction. In this factorial experiment, we havefactor "A" and "B" which could affect the expression of a given gene. We consider an experiment wherecells affected by factor A or by factor B are compared to a control C. We also have an experiment where wecombine these two factors in an experiment AB and the expression of gene is measured in A, B, and AB. Ifthe factors A and B act on the gene independent from each other, then the expression of the gene in AB, ascompared to control C (we designate it Rab), should be the product of the fold changes in its expression inA and B experiments : Rab = Ra*Rb. This situations means no interaction between factor A and B in theireffects on the gene expression. Any deviation from this value will point toward the existence of interaction.
In this case, we can say that there is no interaction between factor A and B in their effectson the gene expression. Any deviation from this value will point toward the existence ofinteraction.
Applying this analysis to our system, we have two factors, the mutation in FA-D2 gene andparticular DNA damage, represented by R1 and R2 respectively for 1h time point experi-ments and R1 and R4 for 6h experiments [Figure 3.13]. Their combined effect is representedby R3 and R5 in 1h and 6h experiments, respectively. If we denote interaction by ’ε’ it can becalculated for 1h and 6h experiments by the following equations;
ε =R3
R1×R2(3.1)
ε =R5
R1×R4(3.2)
The interaction analysis corresponds to search of genes for which there is a significant devi-ation of epsilon = 1. Accordingly, we calculated the "ε" values for each 1h and 6h accordingto equations 1 and 2 respectively.
As shown on the [Figure 3.14], most of the genes do not show interaction. In order to identifythe genes which manifest most significant levels of interaction, we have applied another fil-ter on the "ε" values such that only the sequences having values ≥ 3.0 or ≤ 0.3 were selectedfor both 1h and 6h. [Figure 3.15] shows the number of sequences selected after applying this

122 Chapter 3. Results - II
Figure 3.13: Interaction analysis in FA-D2 corrected and mutant cells after induction of DNA damage(MOP/UVA & IR). We applied this factorial approach to our microarray data where we tried to find out theeffect of DNA damage (factor A) and mutation (factor B) on gene expression.
filter. To our big surprise, we found that significantly more genes show interaction in thecase of IR, than in the case of MOP/UVA treatment at the later stage of response, indicatingthat late IR induced DDR highly depends on the functional FA pathway.
The simple interaction analysis shown above is not sufficient, because it does not allow oneto differentiate between different explanations for the observed interactions between twofactors for every individual gene. In two simplest cases, the epsilon could deviate from 1(unity) for the following reasons : a) The defect in FA pathway suppresses the response toDNA damage and b) The FA defect ’activates’ the response to DNA damage for a gene thatwas otherwise not sensitive to it in the wild type cells. The first class of genes correspondsto the part of the transcriptional response that requires functional FA pathway, whereas thesecond class of genes reflects what happens with the cells after DNA damage when theFA pathway is not functioning properly. Thus, this step in analysis is necessary in order toaddress the two questions posed at the beginning of this section [Figure 3.16].
To find the genes that demonstrate a FA-dependent suppression of the effect of DNA dam-age, we filtered the data on the genes that show interaction, according to the following con-straint :

3.3. Global Transcriptional Analysis 123
Figure 3.14: Scatter Plots representing Log(R1+R2)-Y-axis VS Log(R3)-X-axis in case of MOP/UVA 1h whileLog(R1+R4)-Y-axis VS Log(R5)-X-axis in case of 6h treatment revealed that majority of genes show no in-teraction.
Figure 3.15: Graph showing number of sequences having ε values ≥ 3.0 or ≤ 0.3 in MOP/UVA and IRsamples.
[R3
R1∼ 1]and[ε 6= 1] (3.3)

124 Chapter 3. Results - II
In other words, we were looking for the genes that showed a response in the case of wildtype (R2 or R4), but no response in the case of the FA mutant (R3, R5 = 1) [Figure 3.16].
Next, we uploaded the list of sequences corresponding to each of these categories for func-tional annotation analysis to DAVID Bioinformatics Resources web page [ [Huang et al.,2009a]; [Huang et al., 2009b]] in order to look for the functional correlation of the epsilonvalues. Given that wild type cells responded to MOP/UVA treatment by largely changingexpression of transcription regulation factors, it is not surprising that at least some of DNAbinding activities and regulation of transcription was affected by the FA mutation, indicat-ing that many of these genes require functional FA pathway in order to respond to DNA-ICLdamage. The similar analysis for 1h-IR treated set of genes revealed different functional en-richment, including functions related to phosphoproteins, cell cycle, metabolic processes,zinc finger proteins, DNA damage and proteins acetylation related pathways.
Next, we looked at the genes showing dependence on FA pathway after 6h of DNA damage.In case of MOP/UVA we observed mostly the chromosome condensation and mitosis re-lated functions as dependent on functional FA pathway, while in case of 6h-IR we observedfunctions related to cytoskeleton, intra-cellular signaling, and metabolic processes. Againthe cellular response to these two kinds of DNA damage at later stages of damage inductionshow striking differences, which indicates activation of different pathways in response todifferent kinds of DNA damage.
To find the genes that normally do not respond to DNA damage, but start to show a responsewhen the FA pathway is inactivated, we applied a different constraint to the same set ofgenes that demonstrated interaction [Figure 3.16], given by the following equation;
[R2 ∼ 1]and[ε 6= 1] (3.4)
As discussed before, these genes should reflect ’what could happen to cells after DNA dam-age that does not happen in the presence of functional FA-pathway’, i.e., most likely, theunwanted consequences of not having FA pathway in the case of DNA damage. The func-tional annotation analysis in case of 1h MOP/UVA showed enrichment of mostly the cellcycle and mitosis related functions along with phosphorylations and chromatin modifica-tions and chromatin remodeling activities. As discussed before, we have not seen any cellcycle and mitosis effects that early after the DNA-ICL induction, and can conclude that in-activation of FA-pathway sensitizes some cell-cycle regulatory genes that otherwise wouldnot be responding to MOP/UVA treatment. However, the similar analysis of 1h-IR treatedsamples showed enrichment of various zinc finger proteins related functions, which mightbe related to mono- or poly-ubiquitinations, and also, DNA-binding, transcriptional regu-lation and DNA damage response functions. The difference between functions enriched inthese two genes sets might reflect that differences in the early cellular response to these twokinds of DNA damage inductions.
The similar analysis for 6h post-MOP/UVA treated experiment revealed functions relatedto cytoskeleton, proteins post-translational modifications including phosphorylations and

3.3. Global Transcriptional Analysis 125
acetylations and proteins turnover, and again cell cycle checkpoint. The analysis of 6h post-IR treated sample showed enrichment of zinc finger proteins related function with highlysignificant p-values and also transcriptional regulation, DNA binding and phosphoryla-tions. In general, we have observed disproportionally many genes that showed sensitizationto FA-inactivation at the later stages of response to DSB damage, as compared to DNA-ICLdamage.
Figure 3.16: Graph showing number of sequences in various sub-categories based on ε values in MOP/UVAand IR samples.
To summarize this part of our analysis, we were able to detect many differences in the tran-scriptional response to DSB and DNA-ICL. Early after damage, significantly more genesare up-regulated in the case of DNA-ICL, mostly comprising transcriptional regulation andsignal transduction. Interestingly, in the case of DSB damage, we detected an enrichmentin histone acetylation activity, already early after treatment. Also, consistent with the fasterresponse to IR, cell cycle arrest-related signature was detectable early after DSB induction,whereas DNA-ICL was causing such response only at later times.

126 Chapter 3. Results - II
Intriguingly, practically no common genes were detected among early responders to DNA-ICL and IR. Later, however, both treatments were inducing cell proliferation arrest and apop-tosis activation, which most likely constitute a generic cellular response to any kind of DNAdamage.
Comparison of transcriptomes of FA mutant and control cells revealed dramatic differencesbetween these cells. Intriguingly, many chromatin-related activities were affected by the FAmutation, which was somewhat reminiscent of the cellular response to DSB. This surprisingobservation might reflect the fact that defect in FA pathway leads to permanent elevation ofDSB levels in the cells (e.g., resulting from stalled replication forks).
Finally, by performing an interaction analysis, we were able to find the part of transcriptionalresponse to DNA damage that was requiring functional FA pathway, as well as find thegenes that were sensitized to DNA damage by the inactivation of FA pathway. We foundthat the number of transcriptional regulators are indeed dependent on FA pathway in theirresponse to DNA-ICL. Surprisingly, we observed that inactivation of FA-pathway sensitizessome cell-cycle regulatory genes to DNA-ICL.
3.4 Discussion
Understanding the molecular details of complex signaling cascade of DNA damage responseinevitably requires the analysis of transcriptional changes in the various players involved inDDR. Chromatin modifying enzymes are among one of the important classes of effectorproteins that take part in DDR signaling as chromatin the physiological substrate of DNAdamage repair. Although chromatin acts a physical barrier to the detection and repair ofDNA lesions, the chromatin modifying enzymes confer a degree of flexibility to the normalcompacted state of chromatin by making it more dynamic and responsive to the needs ofa damaged cell. Histone modifying enzymes, among the various chromatin modifiers werethe focus of our attention owing to our interest in the role of histone PTMs in DDR. Sinceour focus remained on the acetylations and methylations of histones in response to DDR,in this part of the project we looked at the transcriptional profile of enzymes related to saidmodifications, which include HATs, HDACs, HMTs, and KDMs.
Although a kind of an unorthodox approach, we tried here to correlate the histone PTM datawith the transcriptional profile of enzymes responsible for these modifications. This analysisproved to be fruitful as we have found a few correlations among the histone acetylations andmethylations after inducing DNA-ICL damage and the expression levels of possible genes,whose protein products could be responsible for creating these marks. To our knowledge,no study has been reported in the literature that attempts to correlate histone modificationswith the gene expression profile of the enzymes responsible for them. This kind of analysis, areverse functional genomics analysis, can be considered as a new and potentially interestingway to study the chromatin response to DNA damage at transcriptional level by reversecorrelating the increase or decrease in particular protein PTMs with the gene expressionprofile of the enzymes responsible for such modifications.

3.4. Discussion 127
In general, a few studies report the transcriptional profile of histone modifying genes butmostly in the context of various cancers [Ozdag et al., 2006]; [Lucio-Eterovic et al., 2008]. Inthese studies, the expression patterns of HATs, HDACs, and HMTs suggest that these geneshave important implications in neoplastic transformation and have characteristic patterns ofexpression depending on tissue of origin. Another study reported the increased expressionof SETDB1, an H3K9 methyltransferase, and suggested that this HMT acts as an oncogenesignificantly accelerating melanoma formation in zebrafish [Ceol et al., 2011]. This studyalso speculated that SETDB1 over-expression can increase the activity of the H3K9 methyl-transferase complex, leading to alterations in its target specificity. Inactivating mutations inhistone methyltransferases and histone demethylases were recently described in renal cellcarcinoma [Dalgliesh et al., 2010]; [Staller, 2010]. Moreover, SETDB1 is focally amplified in abroad range of malignancies, suggesting that alterations in histone methyltransferase activ-ity could define a biologically related subset of cancers. Another study correlated the varioustranscripts encoding histone methyltransferases and demethylases and altered proteasomeinhibition using drugs &/or hormones. As proteasome inhibitors are currently in clinicaltrials as therapy for multiple myeloma, HIV/AIDs and leukemia, the possibility that someof the target molecules are regulated by chromatin modifying enzymes is intriguing in thisera of epigenetic therapy.
Our results showed an increased expression of certain HATs (MOZ and MORF) and SETDB2,an HMT, in mutant FA-D2 cells compared to the corrected FA-D2 cells without any DNAdamage induction. Generally, increased histone acetylation, due to increased expression ofHATs or decreased expression of HDACs, leads to increased gene transcription. If this al-tered acetylation pattern is observed at any oncogene promotor, it inevitably leads to in-creased expression of that gene and can contribute to neoplastic changes. Similarly, the re-cent implication of SETDB1 over-expression in melanoma lead us to suspect another H3K9methyltransferase, which is over-expressed in FA-D2 mutant cells, as a potential target forfurther investigation towards it plausible role in malignant transformation. Fanconi anemiapatients have increased prevalence of leukemias and head and neck squamous cell carcin-nomas, therefore, a more comprehensive approach towards identifying the potential genesinvolved in malignancies in FA patients is worth an effort.
DNA-ICLs induced by 8-MOP plus UVA (8-MOP/UVA) are critical genotoxic lesions andhave strong anti-proliferative effects [Zheng et al., 2006] by initiating a cascade of eventsleading to cytotoxic, mutagenic and carcinogenic responses. Transcriptional activation playsan important part in these responses. Therefore, keeping in mind the specificity and thecomplexity of the damage induced by 8-MOP/UVA, it was of particular interest to analyzethe global transcriptional response after induction of 8-MOP/UVA damage in human cells.Not much work is done on elucidating the transcriptional response elicited by this kind ofDNA damaging drug, however, a comprehensive genome wide study was performed byDardalhon and colleagues in Saccharomyces cerevisiae [Dardalhon et al., 2007], where theyused DNA microarrays to examine genome-wide transcriptional changes produced after in-duction of 8-MOP/UVA photo-lesions. In order to gain a functional overview of the genesinvolved in the transcriptional response, they have performed a Gene Ontology (GO) anal-

128 Chapter 3. Results - II
ysis. The GO assignments show that 8-MOP/UVA response genes are implicated in a widevariety of biological processes that concern three main activities: (1) DNA metabolism andcell cycle-related functions; (2) cellular functions and maintenance of cellular structures; and(3) general metabolism. They have found that the up-regulated genes belong to DNA dam-age response and cell cycle related. Our results, on the other hand, showed the transcriptionrelated and kinase based signaling functions to be enriched in the early (1h) up-regulatedgenes, however, in late response (6h), our results also show cell cycle related functions tobe enriched but mostly in the down-regulated gene set. Among the repressed genes, ourresults showed some enrichment of nucleosome assembly related functions, which is consis-tent with the findings of Dardalhon et al. as they have also found some functions enriched inrepressed genes involved in structural modification of chromatin after DNA damage. Thesedifferences in transcriptional response may well be explained by the nature of experimentalsystem used as human cells are much more complex and dynamic than lower eukaryotes,such as Saccharomyces cerevisiae.
Most experimental investigations of the DDR are carried out in commonly used cell lines,most of them derived from human tumors. Such cell lines are expected to exhibit a widespread variation in their response to DNA damage, most notably to IR. This variation stemsprimarily from genetic variation among the donors, which is known to markedly affect theirradiation response [Chistiakov et al., 2008]; [Pugh et al., 2009]; [Popanda et al., 2009]; [Niuet al., 2010]. Variations in response to IR also come from the multiple genetic changes thattake place in the course of prolonged culturing, particularly in tumor cell lines. In a recentstudy where, Rashi-Elkeles and coworkers [Rashi-Elkeles et al., 2011] performed a large-scale expression analysis to examine the transcriptional response induced by 5 Gy of IR infive malignant and non-malignant cell lines. They compared three different time points 0h,3h and 6h after irradiation. The majority of the transcriptional response of these cell linesto IR was cell line-specific, with substantial differences from one line to another. There was,however, a core of induced or repressed genes common to the different cell lines, with the in-duced ones consisting almost exclusively of validated p53 targets. Interestingly, hierarchicalclustering demonstrated that cell line was the principal determinant of the expression pro-files, as samples from the same cell line (treated and untreated) were clustered closest to eachother. Our results are consistent with this finding. As shown in [Figure 3.11], samples fromFA-D2 corrected cells were clustered close to one another while those from FA-D2 mutantcells, treated or untreated, were clustered closer to each other than to the corrected cells.
The IR-induced DNA DSB response involves a marked modulation of the cellular tran-scriptome [Begley and Samson, 2004]; [Elkon et al., 2005], as numerous large-scale expres-sion studies collectively profiled cellular responses to a multitude of DNA-damaging agents[Heinloth et al., 2003a]; [Heinloth et al., 2003b]. They demonstrated that the transcriptionalresponse to genotoxic stress goes beyond the core DDR pathways of DNA repair and cellcycle regulation to affect most aspects of cell physiology, including modulation of cell deathpathways, energy metabolism, cell-cell communication, and RNA processing. While lookingat the early response (1h) after IR-induced DSBs, our data, on one hand, is in line with theprevious observations that IR-induced DNA damage lead to the cell cycle modulation, while

3.4. Discussion 129
on the other hand, reveals enrichment of histone acetyltranferase activity related genes in theup-regulated category. This finding, although not reported before, is consistent with the ob-servation that histone acetylation is induced early after DNA DSBs [Tamburini and Tyler,2005]; [Murr et al., 2006]. The late response (6h) in FA-D2 corrected cells again showed hi-stone acetyltransferase activity among up-regulated sequences, which clearly indicates thisfunction as an integral part of IR-induced DNA damage response. At six hours, other chro-matin related activities were also observed among the up-regulated genes including histonedemethylase activity, histone ubiquitination and chromatin organization. Among the down-regulated sequences, cell cycle related functions and response to stress and radiation wereenriched, which is consistent with an expected late response. Moreover, HDAC activity wasalso observed, which probably indicates the end of repair and restoration of chromatin to itsoriginal state by histone deacetylation. In general, the transcriptional response to IR-inducedDNA damage in FA-D2 corrected fibroblasts clearly demonstrates the increased activity ofchromatin related functions, which highlights the importance of chromatin signaling cas-cades in DDR.
In order to improve our understanding of Fanconi anemia syndrome, bearing in mind thegenome instability and chemical sensitivity of FA cells to DNA-ICL inducing agents, it is im-perative to study the deficiencies of transcriptional response in FA mutant cells as comparedto their corrected "wild type" counterparts. A few studies previously reported the transcrip-tional profile of FA cells [Zanier et al., 2004]; [Martinez et al., 2008]. However, firstly, theydid not compare the transcriptional response of FA cells before and after inducing DNA-ICL, secondly, they mostly focused on p53 dependent transcriptional changes in FA cells,and thirdly, they worked with FA cells mutated in core complex proteins, i.e., FANCC andFANCA respectively. We, on the other hand, performed a large scale analysis, where wenot only compared the wild type versus mutant cells, but also analyzed the transcriptionalresponse in both cells lines after inducing DNA-ICL damage. Also, we used FA-D2 genemutated cell line (and its corrected cell version), which represents a different level of FA-pathway, down stream of core complex. At basal level our results indicate an increased HATactivity in mutant cells as compared to wild type cells, which resembles more the transcrip-tional response to IR in wild type cells. This finding suggests that FA-D2 mutant cells behavelike IR damaged normal cells as if the defect in FA-pathway leads to accumulation of DSBsin these cells.
Next, we sought to find out the genes that are differently affected in FA mutated and wildtype cells. Here, the analysis was not a straight forward direct comparison of genes affectedin the two cell lines after induction of DNA-ICL damage. Rather, the special nature of exper-imental design lead us to apply interaction analysis. Our experimental design belongs to amore complex class of functional genomics experiments, where there is involvement of morethan one factor, and thus a factorial design approach is required. Factorial experiments areused to study differences that result from the joint effect of two or more factors [Yang andSpeed, 2002]; [Glonek and Solomon, 2004]. Our design corresponds to 2x2 factorial experi-ments, where we analyzed the transcriptional response to DNA damage in FA mutated andcorrected cells. Here, we have two factors that might affect this transcriptional response to a

130 Chapter 3. Results - II
varying degree, these include, DNA damage and FA mutation. For some genes the responsemay be interactive (i.e., the effect of one factor depends on the other factor), while for othergenes the response may be additive (i.e., the effect of one factor does not depend on the otherfactor). Therefore, in this part we tried to measure the interactive response in our model toanswer two basic questions, i.e., 1- What part of the transcriptional response to DNA dam-age requires functional FA-pathway? and, 2- What happens to cells after DNA damage ifFA pathway is inactive? We applied a simple epsilon analysis to our microarray data in anattempt to answer these questions according to equations 3.1 and 3.2, where a value of "1"was considered "no interaction".
In a recent study, Wong and colleagues [Zhou et al., 2010] employed the idea of interac-tion, where they used factorial analysis to analyze the impact of age on the temporal generesponse to burn injury in a large-scale clinical study and revealed that 21% of the genes re-sponsive to burn are age-specific. Their analysis is based upon the classical statistical methodof analysis of variance (ANOVA), which they used to model the dependency of gene expres-sion on the experimental factors. Our approach of factorial analysis, although different fromthis study, showed interesting differences in the transcriptional response to DNA-ICL and IRin FA mutant and corrected cells. In spite of the fact that most of the genes do not show anyinteraction, we have found much more genes showing interaction in IR treated cells thanMOP/UVA treated cells at the later stages of response (6h), which either indicates that lateresponse in IR damaged cells is highly dependent on functional FA-pathway or this may bedue to the secondary and indirect effects on gene transcription. The interaction analysis notonly helped us to identify the part of transriptional response to DDR that requires functionalFA-pathway, but also revealed the genes that were sensitized to DNA damage due to the in-activation of FA-pathway. This kind of analysis, on one hand, certainly improves the currentunderstanding of the transcriptional response to DDR in FA mutated and corrected cells,while on the other hand, provides a simple way of analyzing multi-factorial interaction databased on two or more factors.

4Results - III
In the previous two sections, we have studied global changes in histone modification profileafter inducing DNA damage, as well as the global transcriptional response to this damage,both in the context of their dependence on functional Fanconi anemia pathway. Some ofour results are consistent with the existing literature, however we have also presented somepreviously uncharacterized modifications that manifest an interesting dynamics in responseto DNA-ICL damage.
However, one big shortcoming of such global analysis resides in the fact that the cell is astructured system, highly organized in space. For example, nucleus is not a homogeneousobject, but it contains a number of structures and domains, each with its own function. Ac-cordingly, it might be significantly more informative, instead of studying the global changesin histone PTMs, to focus on the PTMs that are specific to a particular nuclear domain thatis most relevant for the cellular response to a DNA damage. A canonical example here isγH2AX foci, which mark the regions of active DNA damage and repair very early after DSBinduction. Accordingly, it would be important to study the histone PTMs in a more localizedregions of the chromatin that bear most relevance to DNA repair (such as repair foci), whichcould be significantly more informative for understanding the role of histone code in DDR.However, so far, there was no methodology that would allow one to accomplish such a taskin hight throughput manner.
In our next section we describe a new approach to study local changes in histone PTM profilein the vicinity of a particular protein of interest. Due to technical limitations (mainly, largesize of FANCD2 protein), we used an experimental model, unrelated to Fanconi anemia,to develop and validate this methodology. We have chosen an E3 ubiquitin ligase, Rad18,which is convenient, as it forms detectable foci in the nucleus. These foci represent the repli-
131

132 Chapter 4. Results - III
cation factories, although Rad18 foci increase significantly after UVC irradiation inducedDNA damage. Using our novel methodology, we were able to purify histones in the prox-imity of this protein and to analyze their PTMs with methods of quantitative proteomics.Although this approach has been validated on Rad18/UVC model, we believe that it hasa much larger scope, and can be eventually used to study histone PTM changes related toDDR in Fanconi anemia.
4.1 Design and features of the system
PUB-MS (Proximity Utilizing Biotinylation) has been developed in our laboratory, origi-nally as a new method to study protein-protein proximity (PPP-networks) in vivo usingmass spectrometry (the vectors are described in [Figure 4.1-B]). Similar method, althoughnot designed for mass-spectrometry analysis, was also developed in the laboratory of Dr. AY Ting [Fernandez-Suarez et al., 2008].
The general principle of the method is presented in [Figure 4.1-A]. Two proteins to be testedfor their proximity in vivo are co-expressed in the cells of interest, the first protein beingexpressed as a BirA fusion, and the second one as a fusion to the Biotin Acceptor Peptide(BAP). More efficient biotinylation of the BAP is expected when the two proteins are in prox-imity to each other, e.g., when interaction occurs [Figure 4.1-A(bottom)], as compared to thebackground biotinylation arising from random collisions between noninteracting proteins[Figure 4.1-A(top)]. The biotinylation status of the BAP fusion can be further monitored byWestern blot or mass spectrometry.
To implement this principle, we constructed two types of vectors: for expression of the BirAfusion and for expression of the BAP fusion, correspondingly [Figure 4.1-B(top)]. We con-structed each vector in two forms, with the protein expression regulated either by a strongCMV or a weaker MoMuLV enhancer. In this work, we used the CMV enhancer for the ex-pression of both BirA fusions and BAP fusions. Different amounts of BirA fusion and BAPfusion vectors are cotransfected, which allowed us to achieve an excess of the BAP fusion(biotinylation target) over the BirA fusion (biotinylating enzyme), which is essential for thefurther quantitative analysis.
In addition, we significantly modified the sequence of the BAP, by introducing two flankingarginines that yield a peptide of an ’MS/MS-friendly’ size after trypsin digestion of the BAPsequence. We also included a 7XHis tag in the BAP-domain, to have the option of purifyingor/and monitoring the amounts of the target protein regardless of its biotinylation status[Figure 4.1-B(bottom)].

4.1. Design and features of the system 133
Figure 4.1: Design and features of the system. [A] The principle. Two candidate interaction proteins X andY are co-expressed in the cells of interest, the first protein being expressed as a BirA fusion, and the secondone as a fusion to the Biotin Acceptor Peptide (BAP). The cells are pulse-labeled with biotin. Where thereis interaction (top), the BAP-X fusion should be more efficiently biotinylated. [B] Vector design. Top - thepositions of the CMV/MoMuLV enhancers, and of the BAP and BirA sequences, relative to the clonedORF, are indicated. Bottom - nucleotide and aminoacid sequences encoding the newly designed His-BAPare shown. [C] New BAP is biotinylated with slower kinetics as compared to the old BAP. Left - Westernanalysis of biotinylation of the new BAP-GFP (ILEAQKIVR, left) versus previously used efficient old BAP-GFP (MAGLNDIFEAQKIEWHE, right) in the presence of BirA-GFP fusion. (top) -α-6XHis-HRP signal,(bottom) - streptavidin-HRP signal. Right - quantification of the kinetics of biotinylation of the two BAPs.The streptavidin signal was first normalized by taking a ratio with the respective -6XHis signal. For everyindividual experiment, the normalized value of the biotinylation level for each time point was divided bythe respective value for the 24h time point from the same experiment, which was taken as 100%. Plotted areaveraged results from three independent experiments.
To test if the newly designed BAP could be biotinylated by BirA, we co-transfected 293T cellswith BirA-GFP and BAP-GFP. Regardless of the fact that GFP can form dimers at high con-centrations [Chalfie and Kain, 2005], the main aim of this experiment was not to detect theGFP-GFP interaction, but rather to test the BAP biotinylation, as even background biotiny-lation due to random collisions between non-interacting proteins could be sufficient to givedetectable signal. As seen in [Figure 4.1-C], the biotinylation was indeed observed; moreover,as expected, the level of biotinylated BAP-GFP linearly increased with the time of incubation

134 Chapter 4. Results - III
of the cells with biotin. Notably, in parallel co-transfections, the GFP carrying a different BAPsequence (MAGLNDIFEAQKIEWHE), used previously [Viens et al., 2004], was biotinylatedwith significantly faster kinetics (the time of half-saturation was 15 min, contrasting with680 min for the newly designed BAP). Because saturation in the BAP biotinylation levelsobscures differences in biotinylation efficiency, the slower kinetics of biotinylation of thenew BAP was welcome given our ultimate goal to correlate BAP biotinylation with protein-protein proximity.
4.2 Analysis of post-translational modifications of a specific pro-tein fraction using PUB
The same protein can exist in several complexes in the same cell, and its properties can varydepending on the proximity partners (PP). Given that PUB allows labeling a PP-dependentfraction of the BAP-fusion of the protein of interest, one can expand the scope of the PUBapproach beyond the mere study of protein-protein proximity. Namely, one can purify aparticular PP-dependent subfraction of a BAP-fused protein biochemically, and then studyits properties, e.g., its post-translational modifications (PTMs).
To test this possibility experimentally, we have analyzed the ubiquitination status of thesubset of PCNA protein that is located in proximity to the translesion polymerase PolH afterirradiation of cells with UV. Ubiquitination is a convenient model to study PTMs, becauseit is easy to detect as a shift in protein mobility on SDS-PAGE. UV irradiation induces ubiq-uitination of PCNA, which then recruits PolH to the sites of DNA damage [Kannouche andLehmann, 2004]; [Prakash et al., 2005]. The PolH has a PCNA-binding and ubiquitin bindingdomains (PIP and UBZ, respectively), both believed to be involved in the interaction.
To analyze the ubiquitination status of PCNA located in proximity to PolH in vivo, the cellswere transfected with the plasmids expressing BAP-PCNA and BirA-PolH. Two days later,the UV damage was induced and 6h afterwards, the cell were pulse-labeled with biotin.The cells were harvested, and the biotinylated BAP-PCNA was separated from the non-biotinylated BAP-PCNA using streptavidin-sepharose pulldown. The ubiquitination statusof the two fractions was analyzed by Western with PCNA antibodies. As one can see fromthe [Figure 4.2-B, lane 5], a significant part of the biotinylated BAP-PCNA is present in ubiq-uitinated form, whereas such form is absent in the non-biotinylated BAP-PCNA fraction re-maining in the flowthrough [Figure 4.2-B, lane 3]. Control experiment, performed in parallelwith BirA-GFP fusion, showed no such enrichment in the biotinylated BAP-PCNA fraction[Figure 4.2-B, lane 2 & 4].

4.2. Analysis of post-translational modifications of a specific protein fraction using PUB 135
Figure 4.2: Analysis of post-translational modifications of a specific protein fraction using "PUB". [A] Exper-imental scheme. 293T cells are transfected with the plasmids expressing BAP-PCNA and BirA-PolH. Twodays later, the cells are treated with UVC (20 J/m2 ) and 6h afterwards, the cell are pulse-labeled (5’) withbiotin. The cells are harvested, and the biotinylated BAP-PCNA is separated from the non-biotinylatedBAP-PCNA using streptavidin-sepharose pulldown. [B] Ubiquitination status of PolH-proximal PCNA.Western with α-PCNA antibodies. 1 - untrasfected cells. 2,4 - BAP-PCNA cotransfected with BirA-GFP fu-sion. 3,5 - BAP-PCNA cotransfected with Bir-PolH fusion. 2,3 - Flowthrough fraction, 4,5 - Eluate. Note thatthe BAP-PCNA from the flowthrough fraction was further purified via Ni-NTA chromatography, in orderto decrease the signal from the endogenous PCNA. The endogenous PCNA, the BAP-PCNA fusion and theubiquitinated BAP-PCNA are indicated by arrows. [C] Ub-BAP-PCNA is preferentially biotinylated due toits specific interaction with PolH. Western analysis of nuclear extracts from transfected 293T cells. Middle -strepatividin-HRP, detecting two forms of biotinylated BAP-PCNA, in the presence of different Bir-PolH fu-sions, treated or untreated with UV. Top left: Expression of different forms of BirA-PolH, detected by α-HisWestern. Bottom left: PCNA in the transfected 293 cells, showing that BAP-PCNA constitutes undetectablefraction of total PCNA in the transfected cells.
To confirm that the ubiquitinated fraction of BAP-PCNA is preferentially biotinylated dueto its specific interaction with PolH, we used mutations in PolH lacking the PIP or/and UBZdomains in our next experiments. This time, the ubiquitination status of the biotinylatedBAP-PCNA was analyzed directly in nuclear lysates by Western with streptavidin-HRP. Asone can see on the [Figure 4.2-C middle], the higher molecular form of biotinylated PCNA(lane 1) was decreased after we used the BirA-PolH PIP and BirA-PolH UBZ, and practicallydisappeared when the double mu- tant BirA-PolH was used (lanes 4,5 and 3, respectively).Consistent with the notion that the higher molecular fraction of BAP-PCNA corresponds

136 Chapter 4. Results - III
to ubiquitinated BAP-PCNA, a BAP-PCNA carrying a mutation in the ubiquitination siteshowed no such fraction [Figure 4.2-C lane 2], when cotransfected with BirA-PolH in a par-allel experiment.
We conclude from these experiments, that the purification of biotinylated fraction of a BAP-fusion of a protein of interest allowed us to study PTMs specific for the particular fraction ofthis protein that is located in proximity to another protein of interest, fused to BirA. Whereasin the case of ubiquitination, the PTM analysis could be done by Western of cellular extractswith streptavidin-HRP, in most other cases it will require biochemical purification of thebiotinylated fraction of the protein.
4.3 PUB-NChIP reveals a specific pattern of H4 acetylation in theRad18-proximal chromatin
Next, we applied the same principle for the analysis of chromatin in proximity to a proteinof interest fused to BirA. For this purpose, we fused the BAP domain to the core histoneproteins H3.1 and H2A. After incorporation to chromatin, their biotinylation by a proteinof interest fused to BirA is expected to lead to specific labeling of chromatin located in theproximity of the BirA-fusion. Purification and analysis of such biotinylated chromatin is theprinciple beyond the PUB-NChIP approach.
To verify that only the BAP-histones that are located in proximity to a BirA fusion are bi-otinylated in such conditions, we used repair-related Rad18 protein as a convenient mo-del. This protein is known to form characteristic foci in the nuclei, clearly seen after UVtreatment of cells (these foci are believed to correspond to specialized compartments in thenuclei, containing repair and replication proteins, including PCNA). HEK 293T cells wereco-transfected with the BirA-Rad18 fusion together with BAP-H2A. Two days after transfec-tion, the cells were irradiated with UV and pulse-labeled with biotin 6h later, i.e., at the timewhen Rad18 forms distinct foci in the nuclei. The cells were fixed immediately after the biotinpulse. The staining of the pulse-labeled cells with streptavidin-Cy3 revealed foci of biotinyla-tion signal, which colocalized with Rad18 [Figure 4.3-A top], detected by specific antibodies.Importantly, staining with H2A antibodies that detect H2A regardless of its biotinylation sta-tus, gave very different pattern, consistent with known homogeneous distribution of H2Ahistone over the nucleus [Figure 4.3-A bottom]. Western analysis [Figure 4.3-B bottom left]shows that only the BAP-H2A histone is biotinylated in cells under these conditions, thusthe Cy3 signal that we observe in microscopy should reflect the localization of biotinylatedBAP-H2A. On the other hand, pulse labeling for different time lengths shows that during the15 minutes of exposure to biotin, only a small part of BAP-H2A is biotinylated [Figure 4.3-B bottom right]. These data clearly demonstrate that only the part of BAP-H2A containingchromatin located in proximity to Rad18 was biotinylated in our experiments.

4.3. PUB-NChIP reveals a specific pattern of H4 acetylation in the Rad18-proximal chromatin 137
Figure 4.3: PUB-NChIP reveals a specific pattern of H4 acetylation in the Rad18-proximal chromatin. [A]Chromatin is biotinylated at the sites of RAD18 foci. Confocal microscopy analysis of colocalization of (top)Rad18 and biotinylated chromatin or (bottom) H2A histone and biotinylated chromatin. [B] Biotinylationsignal is due to BAP-H2A in proximity to Rad18-BirA. Left: Western blot analysis with streptavidin-HRP,showing that a specific signal appears only after BirA-Rad18 and BAP-histones are cotransfected. 1 - BAP-H2A, 2 - BAP-H3, 3 - BirA-Rad18 + BAP-H2A, 4 - BirA-Rad18 + BAP-H3. Top - α-His antibodies, bottom -streptavidin-HRP. Right: Western blot analysis of biotinylation status of BAP-H2A or BAP-H3 after differenttimes of biotin-labeling. Top -α-His antibodies, bottom - streptavidin-HRP. [C] Purification of biotinylatedchromatin. Bottom: SDS-PAGE gel stained with coommassie blue, with the identities of histones indicated.The H4 band in elution also contains streptavidin, and thus is thicker than the other histone bands. Middle:Western analysis of the same samples with streptavidin-HRP, showing that all biotinylated BAP-H2A waspulled down with immobilized streptavidin. Top: Agarose gel electrophoresis and EtBr staining for thesame samples, showing that mostly the mononucleosome fractions were purified. [D] Relative acetylationstatus of H4 N-terminal tail (aa 4-17). The relative presence of a particular form of H4 tail (UM - unmodified,1Ac, 2Ac, 3Ac, 4Ac - mono, di- tri- and tetra- acetylated forms, respectively), as a ratio to the unmodifiedform. 1 - control BirA-GFP cotransfected with BAP-H2A, 2 - BirA-Rad18 cotransfected with BAP-H2A.
The biotinylated chromatin was purified on streptavidin sepharose without prior crosslink-ing. As one can see from the [Figure 4.3-C bottom, lane 7], the composition of the puri-fied histone octamers is consistent with the presence of one BAP-tagged H2A/H2B protein.Whereas in both input and flowthrough samples [Figure 4.3-C bottom lane 5 & 6, respec-tively], all core histones are present in stoichiometric amounts, there is approximately twiceas less of H2A in the eluate. Judging by the Western with streptavidin-HRP, all biotinylated

138 Chapter 4. Results - III
BAP-H2A is purified [Figure 4.3-C middle, lane 7]. However, confirming that not every BAP-H2A molecule is biotinylated in our experiment, the flowthrough also contains BAP-H2Aband stained by Coomassie [Figure 4.3-C bottom, lane 6]. Note that after elution from strep-tavidin beads by boiling with Laemmli buffer, significant amounts of streptavidin appear inthe sample, overlapping with the H4 histone band [Figure 4.3-C bottom, lane 7]. As expected,the comparison of DNA content of the input, flow-through and eluate samples indicates thatonly a small fraction of total chromatin has been purified in this experiment [Figure 4.3-Ctop, lane 5, 6 & 7, respectively].
Next we set out to analyze the post-translational modifications, and compare them withcontrol BirA-GFP biotinylated chromatin. We used SILAC (Stable Isotope Labeling withAminoacids in Culture) in order to quantitatively compare the presence of specific modifi-cations in the chromatin in proximity to Rad18, as opposed to the GFP-BirA fusion. The cellswere grown in medium, containing either light version of lysine and arginine aminoacids ortheir heavy counterparts (labeled with C13 and N15). The heavy labeled cells were cotrans-fected with BAP-H2A and either BirA-RAD18 or BirA-GFP. The control, light labeled cellswere cotransfected with BAP-H2A and BirA-GFP. As in the previous experiment, two daysafter transfection, the cells were UV irradiated, and 6h afterwards they were pulse-labeledwith biotin for 15 min. Then the cells were harvested, mixed, and biotinylated chromatinwas purified as described above. The bands corresponding to histones were excised, treatedwith trypsin and then MRM analysis was performed to quantitatively detect the presence ofdifferent histone PTMs and compare their presence between the experimental and controlsamples (Rad18 and GFP, respectively).
The [Figure 4.3-D] shows that the H4 histone in proximity to BirA-Rad18 has an increasedacetylation of its N-terminal tail (aa 4-17). Notable, the di- and tetra- acetylated forms areover-represented, as compared to H4 from the control chromatin biotinylated by GFP-BirA-fusion. Intriguingly, we have also observed under-representation of the tri-acetylated formof H4 in the Rad18 proximal chromatin.
4.4 The Rad18-specific pattern changes after the proximity withRad18 has been diminished
The distinctive feature of the PUB-NChIP method is that chromatin in proximity to the BirA-fusion is left with a permanent molecular mark (i.e. biotin), which can persist after the prox-imity between BAP- and BirA-fusions have been lost. We decided to take advantage of thisproperty to ask what happens with the H4 acetylation pattern of the Rad18-labeled chro-matin at a determined time after the biotinylation.

4.4. The Rad18-specific pattern changes after the proximity with Rad18 has been diminished 139
Figure 4.4: The Rad18-specific pattern changes after the proximity with Rad18 has been diminished. [A]Decrease in colocalisation between Rad18 and biotinylated chromatin after 6h chase. Top - Confocal mi-croscopy showing strong colocalization between Rad18 and biotinylated chromatin in the nucleus of 293Tcell immediately after pulse labeling. Middle - Confocal microscopy showing different localization of Rad18and biotinylated chromatin 6h after pulse labeling. Bottom - zoomed area from the chase sample showingan example of biotinylated foci that do not colocalize with the Rad18 foci and vice versa (indicated by ar-rows). Right - scatterplot with the coefficient of correlation (top left corner) between the intensities of thered and green signals for every pixel (above a background threshold), showing stronger colocalization ofthe biotin and Rad18 signals in the pulse sample. [B] No increase in biotinylation signal after chase. Westernanalysis showing that the level of biotinylation of BAP-H3 and BAP-H2A is not increased 6h after the cellshave been washed from biotin. Top - α-His antibody, bottom - strepavidin-HRP. P- pulse sample, Ch - chasesample. [C] The scheme of pulse-chase experiment. Cells grown in light SILAC medium are transfectedby BirA-GFP and BAP-H2A (reference sample). Cells grown in heavy SILAC medium are transfected withBirA-Rad18 (or BirA-GFP) and BAP-H2A. The heavy labeled cells are either harvested immediately afterbiotin labeling or washed from biotin and left for 6h before harvest. The heavy and light labeled cells aremixed and chromatin is prepared as in [Figure 4.3]. [D] Acetylation status of H4 N-terminal tail. Relativepresence of a particular form of the H4 tail (marked as in the [Figure 4.3]). Heavy labeled samples weremixed with the light labeled ’BirA-GFP + BAP-H2A pulse’ sample. The heavy samples are: 1 - BirA-GFPpulse, 2 - BirA-Rad18 pulse; 3 - BirA-GFP chase; 4 - BirA-Rad18 chase.
First, we used immunofluorescent microscopy to monitor the distribution of biotinylatedchromatin 2h after its labeling by BirA-Rad18. Until the biotin labeling, the cells were treatedas in previous experiment. Then they were either fixed immediately after the biotin pulse(pulse sample), or else intensively washed to eliminate biotin and then left in fresh medium

140 Chapter 4. Results - III
for 2h before fixation (chase sample). Western analysis shows that the biotinylation levelsare not increasing after the chase [Figure 4.4-B bottom]. Consistent with the previous experi-ments, streptavidin-Cy3 staining of the pulse-labeled cells revealed foci of labeled BAP-H2Acolocalizing with Rad18 [Figure 4.4-A top]. However, the chase sample manifested a differ-ent pattern [Figure 4.4-A middle]. Whereas Rad18 formed foci, the biotin signal appearedmore diffuse, and we generally observed a smaller number of foci per cell, whereas the colo-calization of the remaining biotinylated foci with the PCNA or Rad18 foci was considerablyless pronounced [Figure 4.4-A bottom for an example].
The observations are consistent with the notion that after BAP-H2A was biotinylated in theproximity of BirA-Rad18 at the moment of the biotin pulse labeling, the Rad18 started to as-sociate with different parts of chromatin, as could be seen by the loss of colocalization of theRad18 (and PCNA) foci with the biotinylated histones. This observation demonstrates thatone can monitor the state of proximally-biotinylated chromatin at later times after labeling -e.g., after the proximity with Rad18 could have been lost.
At the next step, we purified the PUB-labeled chromatin after 6h chase and analyzed thepattern of H4 acetylation. The SILAC labeling was again used to quantitatively compare themodifications between different samples. All experimental samples were grown in heavymedium, and as a common reference sample (grown in the light medium), the pulse-labeled"BirA-GFP + BAP-H2A" transfected cells were used. Judging by the more modest H/L ratiosin the case of the chased sample, the characteristic under-representation of the tri-acetylatedform, which was clearly seen in the RAD18- proximal chromatin at the moment of biotiny-lation pulse (i.e., 6h after UV irradiation), became less pronounced and more resembling themodification pattern of the control chromatin, i.e., biotinylated by GFP-BirA.
4.5 The pattern of H4 acetylation near Rad18 is different in the caseof H2AZ containing chromatin
Another advantage of PUB-NChIP method resides in the fact that, instead of the canoni-cal core histones (e.g., H3.1, H2A), one can use their alternative forms, which have specialrole in chromatin functioning and have been shown to preferentially associate with differentfunctional states of chromatin.
Immunofluorescent microscopy together with Western analysis shows that, similar to thecanonical histone H2A, co-transfection of BirA-Rad18 with BAP-H2AZ, BAP-macroH2A andBAP-H2A.BBD leads to appearance of biotinylated foci in the nuclei that are due to the BAP-histone fusion [Figure 4.5-A & B]. As expected, BAP-macroH2A foci are mostly coincidentwith DNA-dense areas of nuclei, whereas BAP-BBD foci associate with less densely stainedareas. Given a more complicated distribution of H2AZ in the nucleus [Viens et al., 2006], nocorrelation with DNA density was detected for this protein. Overall, the results are consis-tent with the notion that using alternative histones in PUB-NChIP should lead to labeling offunctional chromatin states associated with these histone variants.

4.5. The pattern of H4 acetylation near Rad18 is different in the case of H2AZ containing chromatin 141
Figure 4.5: Use of alternative histone variants. [A] Alternative histones are biotinylated at the locations ofRad18. Confocal microscopy of 293T cells cotransfected by BirA-Rad18 and BAP-H2ABBD (Top), BAP-macroH2A (Middle) and BAP-H2AZ (Bottom). Shown are staining with Topro-3 (left), Rad18 (middle)and streptavidin (right). [B] BAP-histone fusions. Top, Middle: Western analysis, showing that a specificbiotinylation signal appears only after BirA-Rad18 and BAP-macroH2A or BAP-H2ABBD fusions are co-transfected. 1,4 - BAP-histone + BirA-Rad18; 2,5 - BAP-histone; 3,6 - control untransfected samples, Top -α-His antibodies, Middle - streptavidin. Bottom: The Western analysis for the BAP-H2AZ fusion. The twoforms of H2AZ (non-ubiquitinated and ubiquitinated), both biotinylated in this experiment, are indicatedby arrows. [C] Acetylation status of H4 N-terminal tail. Relative presence of a particular form of the H4tail (marked as in the [Figure 4.4]). Heavy labeled samples were mixed with the light labeled ’BirA-GFP +BAP-H2A pulse’ sample. The heavy samples are: 1 - BirA-GFP + BAP-H2A, 2 - BirA-Rad18 + BAP-H2A; 3- BirA-GFP + BAP-H2AZ; 4 - BirA-Rad18 + BAP-H2AZ.
To test the possibility to study histone PTMs both in the vicinity of a protein of interest and incontext of a particular alternative histone, we performed SILAC experiment with alternativehistone H2AZ, which is implicated in many cellular functions, including cellular responseto DNA damage [Ahmed et al., 2007]; [Kalocsay et al., 2009]; [Morillo-Huesca et al., 2010].
As before, all experimental samples were labeled in heavy medium, and as a reference (light)sample, the pulse-labeled "BirA-GFP + BAP-H2A" transfected cells were used. The relativeabundance of heavy versus light peptides was analyzed by MRM. As the [Figure 4.5-C]shows, when BAP-H2A is replaced by BAP-H2AZ, the levels of di-acetylated forms of H4clearly increase in the Rad18-proximal chromatin. The same modification also appears to

142 Chapter 4. Results - III
increase in the control GFP-BirA labeled chromatin, containing BAP-H2AZ. The most parsi-monious interpretation of this observation is that the two factors (Rad18-proximity vs GFP,and presence of H2AZ vs H2A) affect the di-acetylated form of H4 independently, resultingin the additive effect in the case of ’Rad18 + H2AZ’ combination.
Strikingly, however, we have observed a non-additive response to the two factors in the caseof tri- and tetra- acetylated forms of H4. Unlike in the case of ’Rad18 + H2A’, there was nodecrease in the tri-acetylated form in the case of the ’Rad18 + H2AZ’ combination. On theother hand, the four-acetylated form was under-represented in the case of ’Rad18 + H2AZ’,as compared to ’Rad18 + H2A’.
The results show that the patterns of post-translational histone modifications in proximity toRad18 protein depends on the histone composition, and moreover, the histone replacementcan affect the modification pattern in a non-trivial way.
4.6 Discussion
We describe here a new methodology to study chromatin in proximity of the protein ofinterest in vivo. The well established approach for such analysis is chromatin immunopre-cipitation (ChIP). However, it suffers from the following limitation. Due to the cross-linkingof DNA to histones, only the DNA part of chromatin purified after ChIP is useful, and theprotein part is discarded, being irreversibly damaged by the cross-linking procedure. On theother hand, the analysis of histone modifications and replacement histone variants couldprovide valuable information about the state of chromatin around the particular proteinof interest. So far, the correlations between a protein and histone PTMs could be inferredonly indirectly, after comparison between the results of parallel ChIP experiments that useantibodies against the protein and antibodies against particular PTMs. Here, a more directmethod to access the chromatin state is proposed.
The principle of PUB-NChIP is somewhat similar to the DamID approach, an alternativeto ChIP way to map DNA binding sites of nuclear proteins [van Steensel and Henikoff,2000]; [Greil et al., 2006]. This methodology has been used in several high profile studiesand is based on expression of a fusion of bacterial Dam-methylase to a protein of interestthat leads to labeling the protein’s genomic binding site by adenine methylation. The labelon DNA can be detected by various methods. Our approach is conceptually similar, but in-stead of Dam-methylase, we fuse biotin-ligase BirA to the protein of interest and, instead ofDNA, we label the histone part of chromatin. The scopes of these approaches are also dif-ferent, as PUB-NChIP is mostly aimed to analyze the histone PTMs. However, we cannotexclude that PUB-NChIP can be also used for DNA analysis as well. Although we have notexplored such possibility in the present work, one can point to several potential advantagesof PUB-NChIP in this respect. There is a wide variety of commercially available resourcesfor detection and/or purification of biotinylated macromolecules, and the NChIP with bi-otinylated chromatin has been shown to work [Ooi et al., 2010]. In addition, by substituting

4.6. Discussion 143
the canonical core histone by its replacement variants, the analysis can be made dependenton the context of particular functional state of chromatin.
As far as the histone PTM analysis is concerned, we present here a proof of principle thatit can be done with the PUB-NChIP purified chromatin, focusing mostly on the acetylationstatus of H4 N-termini. Our approach to analyze histone PTM is based on SILAC, whichallowed us to quantitatively analyze the histone modifications in the Rad18-proximal chro-matin, their dynamics after labeling and their dependence on histone variant. This particu-lar approach is well suited for the type of mass-spectrometer (ion-trap) used. However, be-cause it requires trypsin digestion, the information about correlations between different his-tone modifications on individual histone molecules is not accessible. On the other hand, themore powerful mass-spectrometry instruments (such as FTICR and Orbitrap) can be used inthe so called Top-down approach that targets histones without tryptic digestion [Armirottiand Damonte, 2010]; [Macht, 2009]. Using these instruments for downstream analysis of thePUB-NChIP prepared chromatin, one will be able to detect correlations between PTMs onindividual histone molecule. Notably, such analysis is impossible with the traditional ChIPtechnique.
Another type of additional information that could be provided by PUB-NChIP is based onthe fact that biotinylation leaves the BAP-histone fusion with a permanent modification,which persist after the proximity to the BirA-fusion could have been lost. We presented away to take advantage of this feature that adds kinetic dimension to the studies of the histonePTMs in proximity to a protein of interest. Using BAP-fused histone H2Aand BirA-Rad18 asa model, we demonstrated that one can use a pulse-chase labeling with biotin to monitor thefate of histone PTMs in the chromatin that was in proximity to a given BirA-fused protein atthe moment of labeling. Thus, in addition to helping to analyze histone PTMs in chromatinlocated close to a protein of interest, our approach has a potential to add temporal dimensionto such studies.
In respect to the biological significance of our findings, the simplest interpretation is that thechromatin is vicinity to Rad18 is locally destabilized to facilitate the access to DNA damagerepair machinery. This is consistent with the notion that acetylation of N-terminal tails ofH4 loosens up histone-DNA interactions and hence creates a relaxed nucleosome. After therepair is completed, the chromatin returns to its original state.
The acetylation pattern of the H2AZ containing chromatin in proximity with Rad18 is moredifficult to interpret. It is possible that the chromatin containing H2AZ histone in the prox-imity to Rad18 corresponds to a specific stage of DNA lesion processing, which could bereflected in the different histone PTM signature. Regardless of a specific mechanistic inter-pretation of these observations, our data strongly demonstrate that one can analyze howchanges in specific histone modifications in the proximity of the nuclear protein of interestdepend on the particular chromatin type, represented by a specific histone variant.

5Conclusions and Future Lines of Research
5.1 High Throughput Analysis of Histone PTMs in Response toDNA-ICL
Cells have evolved complex signal transduction pathways to detect and repair differentkinds of DNA lesions. These pathways constitute cellular response to DNA damage (DDR -DNA Damage Response), which in eukaryotes occurs primarily in the context of chromatin.The chromatin, a DNA-protein complex, that exists as arrays of nucleosomes containing twocopies of each H2A, H2B, H3, and H4, wrapped with 146 bp of DNA, is a dynamic struc-ture that regulates DNA accessibility during essential nuclear events, such as replication,transcription, recombination, and DNA damage repair. The chromatin structure has severallevels of compactness and needs to be modulated in the event of DNA damage. This mod-ulation is regulated by various mechanisms, the most important among them being post-translational histone modifications mainly occurring on histone tails protruding from thenucleosome.
Histone PTMs, in the form of "histone code" have largely been studied and most well char-acterized in the context of transcription regulation, however, their precise role in DDR re-mained in the shadows. Apart from the most well known example of γH2AX and its rolein DDR, the roles of other histone modifications that accompany this response remain im-precise and mostly unknown. Given an increasing evidence that histone PTMs are criticalin modulating many process related to chromatin, it is of utmost importance to characterizetheir role in cellular response to various kinds of DNA damages.
Accordingly, in this thesis we have quantitatively analyzed various core histone PTMs in re-
145

146 Chapter 5. Conclusions and Future Lines of Research
sponse to DNA-ICL damage, a particular type of DNA damage where the two DNA strandsare covalently linked and form a formidable barrier to replication fork progression. The cellsrespond to this kind of DNA damage in a sophisticated way by activating a specialized path-way named the Fanconi anemia pathway, which is dependent upon the concerted activitiesof at least 13 FA proteins. The cells mutated in any one of these FA proteins can serve as amodel to study cellular response to DNA-ICL damage.
In the first part of this thesis, we have presented data on histone PTM changes in cellularresponse to DNA-ICL damage, where we were able to identify several histone PTM modi-fications that show interesting dynamics in response to DNA-ICL, often in the manner de-pendent on the functional FA pathway.
Some of these modifications, for example, acetylation of the N-terminal tails of histone H3and H4, have a relatively straightforward interpretation, whereas the role of various mono-methylated lysines requires further investigation.
In any case, the variable behavior of histone PTMs in the presence and absence of functionalFA lead us to propose a model of "histone code" role in response to DNA-ICL damage. Ac-cording to this model, DNA-ICL induction leads to local destabilization of chromatin aroundthe DNA damage to facilitate access to not only DNA damage sensing and repair machinerybut also to additional chromatin modifying and remodeling factors. The local relaxation ofchromatin leads to surfacing of core domain residues, which may become more efficientlymodified and in turn serve as docking sites for repair factors and checkpoint proteins. Thelate acting modifications leads to the restoration of chromatin to its original state. The depen-dence of some modifications on functional FA pathway indicates that FA proteins and hencethe FA pathway may be the prerequisite for such modifications to occur, and this could bepartly how the FA complex coordinates the response to DNA-ICL damage.
Concerning further lines of research of the histone PTMs in DNA-ICL damage response, itwould be interesting to take into account other modifications, such as phosphorylation andubiquitination. Moreover, given the fact that other core histones, such as H2A and H2B, areequally prone to PTMs as histone H3 and H4, they should also be included in the histonecode analysis in the context of DNA damage response. Our limitation, however, was thechoice of mass spectrometer, where we could only perform "bottom up" mass spectrometry,using trypsin digested samples. The comprehensive analysis of global histone modificationson all the core histones using a high resolution and more accurate mass spectrometer, such asOrbitrap or FT-ICR employing the "top down" or "middle down" approach, would be muchmore informative.
Whereas we had done some search for the potential histone code ’writers’ and ’erasers’ thatcould be responsible for the observed histone PTM pattern, the downstream effects of thesemodifications in response to DNA-ICL remains elusive. One perspective line of research isto search for the histone code ’readers’ that recognize these modifications. This could be ac-complished by immobilization of the histone peptides carrying the modifications of intereston a solid support and then performing affinity pulldown experiments followed by mass-spectrometry, with the aim of identifying proteins that specifically recognize these PTMs.

5.2. Transcriptional Profile in DNA-ICL Damage Response 147
5.2 Transcriptional Profile in DNA-ICL Damage Response
The histone PTMs are result of coordinated activities of various histone modifying enzymes,i.e., histone code "writers" and "erasers". In order to gain insight into their plausible role inDNA-ICL damage response in FA, we employed functional genomics approach. One goalof such an approach was to monitor the changes in expression of known histone modifyingenzymes, mainly related to lysine acetylations and methylations, in order to find genes thatbest correlate in their expression profiles with the changes in histone PTMs that we haveobserved.
We were able to find candidate enzymes that could be responsible for some of the changes inthe histone modifications that we have observed after induction of DNA-ICL damage in thewild type and FA-defective cells. In some cases, such as H4 acetylation, we found a singlegene with the expression levels that were matching the changes in this modification throughthe samples studied. In most of the other cases, it was possible with two enzymes havingopposite activities (such as HATs vs HDACs).
However, we again have to address several technical and interpretational caveats, discussedpreviously. Two of these caveats are related to the inconsistency between our histone codeand functional genomics analysis. First, the more correct way to compare the histone codedata and functional genomics data would be to perform the experiments on the same celllines. Although the two FA-C and FA-D2 cell lines give the same phenotype, they still rep-resent different steps of FA-pathway. Therefore, the direct comparison of proteomics datawith genomics data would only be possible by performing the experiments on the same cellline. Second, the sample comparison in our proteomics analysis should have been done inthe same way as in the functional genomics analysis. Namely, control untreated cells shouldhave been taken as a reference sample, and labeled with one isotope, whereas all other sam-ples (including the control untreated as well) labeled with another isotope and mixed withthe reference sample. In fact, such an analysis that takes these two caveats into account, iscurrently underway in the lab.
Finally, one has to keep in mind that the changes in gene expression level do not necessarilytranslate to the changes in protein levels, let alone to the increased levels of enzyme activ-ity. Various post-translational regulation steps could also affect enzymatic activity, withoutchanges in the protein amounts. Also, their recruitment to chromatin could be affected viachanges in interaction with other proteins. Such analysis, however, was beyond the scope ofour study. In any case, the results of transcriptional analysis of histone modifying enzymesshowed intriguing differences between wild type and mutated cells both at the basal leveland also after induction of DNA-ICL damage. These differences may reflect the dependenceof these enzymes on the presence of functional FA-pathway. Given that many histone mod-ifying enzymes have, in addition to histones, other protein targets, these data might proveuseful for better understanding of cellular response to DNA-ICL damage.
The second goal of functional genomics analysis was to analyze the total transcriptome afterdamage and in mutant and wild type cells. We also included in this analysis IR irradiation,

148 Chapter 5. Conclusions and Future Lines of Research
as we wanted to dissociate more generic response to DNA damage from a more specificchanges that are associated with the role of FA pathway to the DNA ICLs.
We were able to detect many differences in the transcriptional response to DSB and DNA-ICL. Early after damage, significantly more genes were up-regulated in the case of DNA-ICL, mostly comprising transcriptional regulation and signal transduction. Interestingly, inthe case of DSB damage, we detected an enrichment in histone acetylation activity, alreadyearly after treatment. Also, consistent with the faster response to IR, cell cycle arrest-relatedsignature was detectable early after DSB induction, whereas DNA-ICL was causing suchresponse only at later times.
Intriguingly, practically no common genes were detected among early responders to DNA-ICL and IR. Later, however, both treatments were inducing cell proliferation arrest and apop-tosis activation, which most likely constitute a generic cellular response to any kind of DNAdamage.
Comparison of transcriptomes of FA mutant and control cells revealed dramatic differencesbetween these cells. Intriguingly, many chromatin-related activities were affected by the FAmutation, which was somewhat reminiscent of the cellular response to DSB. This surprisingobservation might reflect the fact that defect in FA pathway leads to permanent elevation ofDSB levels in the cells (e.g., resulting from stalled replication forks).
Finally, by performing an interaction analysis, we were able to find the part of transcriptionalresponse to DNA damage that was requiring functional FA pathway, as well as find thegenes that were sensitized to DNA damage by the inactivation of FA pathway. We foundthat a number of transcriptional regulators are indeed dependent on FA pathway in theirresponse to DNA-ICL. Surprisingly, we observed that inactivation of FA-pathway sensitizessome cell-cycle regulatory genes to DNA-ICL.
As far as the global cellular response to DNA-ICL is concerned, it would be beneficial tocomplement the transcriptome data by proteomics data. In addition to histone PTM analy-sis, the SILAC technique also allows to perform the comparison of various sub-fractions ofproteins, which will complement both our analysis of histone PTMs as well as transcriptomecomparisons. Again, with the ion trap mass spectrometer, the proteomic analysis requires socalled gel-LC/MS protocol, a tedious and time consuming procedure, which allows to detectmaximum of 500 proteins. However, with more powerful instruments, such as Orbitrap orFT-ICR one can perform in-solution trypsin digestion and directly analyze the resulting pep-tide mixture on LC-MS/MS, reliably detecting up to 2000 different proteins. In addition, onecan reduce the dynamic range of the samples by using commercially available "ProteoMiner"columns [Boschetti and Righetti, 2008a]; [Boschetti and Righetti, 2008b], which when com-bined with SILAC not only allows to reduce the dynamic range of proteins in a given sample,but also permits to keep the quantitative information about compared proteomes.

5.3. PUB-NChIP 149
5.3 PUB-NChIP
In the last part of this thesis, we presented a new methodological approach to study histonePTMs in a more localized context instead of global histone PTM analysis. The techniquewe have developed, called PUB-NChIP (Proximity Utilizing Biotinylation and Native Chro-matin ImmunoPrecipitation) is based on co-expression of a) the protein of interest, fusedwith the bacterial biotin ligase BirA together with b) a histone fused with BAP (biotin ac-ceptor peptide), which is specifically biotinylated by BirA. With the incorporation of BAP-histones into chromatin, the chromatin located in proximity of the BirA-fusion of protein ofinterest is preferentially biotinylated. The further steps of the procedure take advantage ofthe strong interaction between core histones and DNA, that allow one to avoid cross-linkingfor the purification of the biotinylated chromatin (so called native ChIP). In the absence of thecrosslinking-induced modifications, the analysis of the protein component of the chromatin(e.g., histone post-translational modifications) becomes feasible.
We have chosen an E3 ubiquitin ligase, Rad18, as an experimental model to develop andvalidate PUB-NChIP. However, we believe that this approach has a much larger scope, andcan be eventually used to study histone PTM changes related to DDR in Fanconi anemia.
In this part of the thesis we also demonstrated additional advantages of the PUB-NChIPapproach.
First, the distinctive feature of this method is that chromatin in proximity to the BirA-fusionis left with a permanent molecular mark (i.e. biotin), which can persists after the proxim-ity between BAP- and BirA-fusions have been lost. We took advantage of this property byshowing that we can follow the dynamics of histone PTMs over a given period of time in aquantitative way. Namely, by using biotin pulse-labeling, we could see what happens withthe histone modifications in the chromatin that was in proximity to a protein of interest at adetermined moment of time before cell harvesting.
The second advantage of our technique is the possibility to use, instead of the canonical hi-stones, their alternative variants expressed as BAP-fusions. Given that different functionalstates of chromatin are enriched in different alternative histone variants, one can use thesehistones to narrow down the PTM analysis to chromatin corresponding to a specific func-tional state.
We have to note that, because of the scarcity of material obtained in PUB-NChIP, we wereable to analyze only the histone H4 modifications in proximity to Rad18, because they arerelatively easy to detect. Further research will focus on other histone PTMs.
Concerning further perspectives of PUB-NChIP, our analysis of PTMs was based on SILAC,which allowed us to quantitatively analyze the histone modifications in the Rad18-proximalchromatin, their dynamics after labeling and their dependence on histone variant. How-ever, due to technical limitations of ion-trap mass-spectrometer, we could not study thecombinatorics of histone PTMs on the individual histone molecules. The more powerfulmass-spectrometry instruments (such as FT-ICR and Orbitrap) can be used in "Top-down"

150 Chapter 5. Conclusions and Future Lines of Research
approach that targets histones without tryptic digestion [Armirotti and Damonte, 2010];[Macht, 2009]. Using these instruments for downstream analysis of the PUB-NChIP pre-pared chromatin, one will be able to detect correlations between PTMs on individual histonemolecule. Importantly, such analysis is impossible with the traditional ChIP technique.
In addition to histones, many other proteins sufficiently strongly associate with DNA andthus are expected to be purified in PUB-NChIP. Thus, instead of the histone component,one can also use PUB-NChIP for analysis of the non-histone fraction of the chromatin inproximity to the nuclear protein of interest. This task is complicated in the case of regularChIP methodology because of the use of chemical crosslinking that irreversibly damages theprotein part of chromatin, making it difficult to analyze by mass-spectrometry.
In addition to the analysis of the protein component of chromatin in proximity to the pro-tein of interest, the scope of our PUB-NChIP approach can be broadened by using it for theanalysis of its DNA fraction as well. Although we have not explored such possibility in thepresent work, one can point to several potential advantages of PUB-NChIP, as an alternativeto the traditional ChIP. There is a wide variety of commercially available resources for detec-tion and/or purification of biotinylated macromolecules, and the NChIP with biotinylatedchromatin has been shown to work [Ooi et al., 2010]. In addition, we can also perform thisanalysis in the context of a particular functional state of chromatin by using replacementhistone variants, which is impossible in the case of regular ChIP methodology.
To summarize, the PUB-NChIP methodology that we have developed in this part of thework, can significantly expand the repertoire of techniques available for epigenetic research.In particular, it will allow one to analyze the role of histone PTMs in cellular response toDNA damage from a new, and hopefully, more informative perspective.
5.4 General Conclusions
Differential gene expression between two different samples is commonly determined bymRNA profiling, with the aid of microarrays and recently also by high throughput se-quencing technology. Although these methods achieve impressive coverage of global mRNAexpression, they are based on the fundamental assumption that mRNA levels are accu-rately reflecting protein abundance. This assumption is not always true, as protein post-transcriptional regulation, for example by miRNAs or by targeted protein degradation, es-capes detection in mRNA profiling experiments. Therefore, as an aid to large scale tran-scriptional profiling, MS-based proteomics is particularly attractive as it can be employed tosequence proteomes as comprehensively as possibly.
In this thesis we have addressed the role of chromatin in DNA damage response using var-ious methodologies encompassing functional genomics and proteomics. First, we analyzedhistone code in the context of a specific kind of DNA lesions in Fanconi anemia screen usingquantitative proteomics methodology, SILAC, which enabled us to quantify changes in his-tone PTMs in the presence and absence of DNA-ICL damage. We have successfully identified

5.4. General Conclusions 151
a number of histone PTM marks in histone H3 and H4, acetylations and methylations, whichhave shown dependence upon functional FA-pathway. Since, chromatin is the physiologicaltemplate for all DNA-templated cellular process, histone PTMs most invariably representan important signaling mechanism that take part in DDR cross talk and coordination. There-fore, identification of various histone PTM marks, which takes part in FA-pathway of DDRsignaling is a first step towards enlightening the role of chromatin in DDR.
The histone PTM analysis represents a "global" form of histone code investigation, whichalthough quite informative yet suffers from intrinsic limitations. Some limitations were oftechnical nature, while others were related more to the methodology. The technical limita-tions were related to the choice of mass spectrometer and the use of bottom up proteomicsapproach. We analyzed our samples using ion trap mass spectrometer, which due to its lowto medium resolution, is not an instrument of choice for such kind of analysis. Secondly,we performed MRM analysis using this machine, which again is possible, but has its ownlimitations. Ion trap has no separate collision cell for MS/MS fragmentation, however, it stillhas the capability to preselect ions by resetting the RF (Radiofrequency) voltage of the threeelectrodes corresponding to the predetermined m/z ratios and letting all other ions out ofthe machine. We have tried to perform a comprehensive histone code combinatorial analy-sis, which ideally requires a middle down or at least top down approach. We were unable touse any of these approaches, instead we used bottom up approach, as our mass spectrom-eter is unable to detect larger peptides or proteins, which usually is the case with middledown and top down approaches. Despite of all these difficulties, we managed to perform arelatively large scale quantitative analysis of histone code and we confidently detected thealternately modified and unmodified versions of many peptides, which is verified by theaccurate MS/MS fragmentation spectra that we have observed.
As a next step, we applied a functional genomics approach to study DDR in FA cells. In thisanalysis we first looked at the expression profile of histone modifying enzymes related tohistone acetylations and methylations. We used this approach based upon the assumptionthat the histone PTM profile reflects the levels of various enzymes that establish them. Op-posite to the approach usually found in literature, where first at the mRNA levels of histonemodifying enzymes are analyzed and then they are correlated with the changes in proteinmodifications, we first analyzed the protein PTMs and then targeted our functional analysisto the mRNA levels of the enzymes responsible for them. Interestingly, we have found somecorrelations in the histone PTM profile and the gene expression levels of some histone mod-ifying enzymes, although conclusive evidence warrants further investigations. Nonetheless,this kind of approach has not being reported before and we believe that it could be a veryuseful form of analysis, as it has the advantage of focusing only on those genes whose pro-tein products have found to be implicated in important cellular signaling events.
For identifying the specific transcriptional response we have applied a statistical method-ology to our complex data. We have designed our experiments in 2x2 factorial way andapplied interaction analysis in order to decipher more specific response from the genericDDR response. This kind of methodology is very useful when two or more than two factorsare being considered in one experiment, as we can dissociate the additive from non-additive

152 Chapter 5. Conclusions and Future Lines of Research
response. The next step after finding out the which genes are specifically involved in a partic-ular type of DNA damage response, is to verify them using q-PCRs and also at protein levelby western blots. Once, specific target proteins are identified, siRNAs can be used to blockthe protein expression and observe the effects on DDR. Identification of proteins, which arespecifically involved in a particular kind of DNA damage response bears important signif-icance in painting the overall picture of how a cell reacts and responds to various genomicinsults.
In the final part of the thesis, we attempted to solve one of the major limitations that isusually encountered in the histone code analysis. Ideally, any investigation regarding his-tone code in DNA damage response should involve isolation of histones from DNA damageregions, i.e., from the chromatin surrounding the damage site. However, the current pro-teomics methodologies are unable to purify histones from a particular region of the chro-matin, instead they rely on whole cell lysis and mostly acid extraction of all the histones.This "global" analysis does not reflect the exact changes in histone PTM levels as a result ofDNA damage, as histones from surrounding the DNA lesion (most likely accounting for lessthan 1% of total chromatin), are diluted by the histones from the rest of the genome. The cur-rent approaches to purify histones from particular loci involves classical chromatin immuno-precipitation, which due to involvement of formaldehyde crosslinking renders the proteinpart mostly unavailable for MS-based proteomics. We have proposed a novel methodology,which is based upon the biotin tagging of histones surrounding a protein of interest andhence, does not involve any crosslinking, enabling us to purify histones from specific loci,and subject them to large scale MS-based histone code investigation. A time dimension canalso be added to our approach as we can follow the modification status of particular set of hi-stones once they get biotinylated. Another advantage is the use of alternate variant histonesand study their modification profile in different conditions, as they represent different func-tional states of chromatin. This methodology certainly has an edge on current techniquesto study histone codes surrounding a particular protein of interest or in particular cellularstates.
In general, in this thesis we have applied various functional genomics, biostatistics, and pro-teomics approaches to study the role of chromatin in DNA damage response. These method-ologies have allowed us to understand the chromatin signaling pathways in response to var-ious kinds of DNA lesions. One of the future developments essential to understanding thebiology of combinatorial histone codes is to connect them back to specific genomic locationsin a manner similar to how ChIP-seq technologies are able to with single modifications. Webelieve that our PUB-NChIP methodology has the potential to perform such kind of anal-ysis where both DNA and protein from the same sample are equally good for subsequenthigh throughput analysis. This kind of approach will enable chromatin researchers to answermany relevant questions in chromatin biology - and also generate MORE questions.

6Materials and Methods
6.1 Recombinant DNA
For the pCMV enhancer vectors, the pCDNA3.1 (Invitrogen) backbone was used. The BirAORF was PCR amplified from the vector pBBHN [Viens et al., 2004]. The BAP domain frag-ments were prepared by designing oligonucleotides and sequential PCR, followed by restric-tion digest and insertion into the pCDNA3.1 vector. The insert sequences were confirmedby sequencing. The vectors generated were used to clone the ORFs of Rad18, GFP, H2AZ,H2ABBD, macroH2A, H3.1, and H3.3.
6.2 Cell Culture and Cell Lines
FA-D2, FA-C (corrected and mutated), and HEK293T cells were grown in Dulbecco’s mod-ified Eagle’s medium with high glucose (PAA) and 10% fetal bovine serum (FCS, PAA).For transient transfection and Western analysis, a standard calcium phosphate precipitationmethod was used (described later), and the cells were analyzed one or two days after trans-fection, as indicated. For the biotin labeling in vivo, cells were grown for several days beforetransfection in the DMEM supplied with dialyzed FCS, and for the specified time of labeling,biotin (Sigma) was added to a final concentration of 5 µg/ml, while the pH was stabilized byaddition of 50 mM HEPES (pH 7.35) to the medium. For SILAC experiments, the cells weregrown in either DMEM with lysine 6C12 and arginine 6C12 , 4N14 (Light Medium) or lysine6C13 and arginine 6C13 , 4N15 (Heavy Medium) (Thermo Scientific, cat 89983) for at least 5divisions before transfection, and kept in the same medium until harvest. For the Western
153

154 Chapter 6. Materials and Methods
analysis, 3*105 of cells (corresponding to one well in a 6-well plate) were used for transfec-tion. For the mass-spectrometry analysis, 3*106 of cells were transfected per data point. DNAdamage was induced either with 8-MOP/UVA (10 µM of 8-MOP + 10 KJ/m2 of UVA), UVC(20 J/m2), or Ionizing radiation (10 Gy). The time of incubation after various treatments isindicated in the results section.
6.3 Biochemistry and Western Blot Analysis
Except where indicated otherwise, cell nuclei were used for analysis. They were preparedby cell disruption in CSK buffer (100 mM NaCl, 300 mM Sucrose, 10 mM Tris pH 7.5, 3 mMMgCl2, 1 mM EGTA, 1.2 mM PMSF, 0.5% Triton X-100), and centrifugation for 5 min at 4000rpm. For the analysis of chromatin-associated histones (chromatin fraction), the nuclei werefirst incubated in CSK buffer containing 450 mM NaCl by 30 min rotation at 4◦C, then spun at4000 rpm, and the supernatant containing soluble histones was discarded. For Western anal-ysis, 1x NuPAGE LDS Sample buffer (Invitrogen, NP0007) with DTT (10 mM) was added,the nuclei were sonicated, boiled for 5 min at 96◦ C and loaded on 4-12% gradient NovexTris-Glycine precast gels (Invitrogen, NP0315). After separation, the proteins were trans-ferred to PVDF membranes and probed with HRP-conjugated streptavidin (Sigma, S5512)or HRP conjugated anti-PentaHis antibody (QiaGen, 34460) according to the manufacturersprotocol, except that for the detection of biotinylated proteins by the HRP-conjugated strep-tavidin, 500 mM NaCl was added to he washing buffer (PBS + 0.1% Tween). The blockingof membranes as well as preparation of streptavidin-HRP or anti-PentaHis-HRP dilutionswere made in 5% ECL blocking agent (GE Healthcare, RPN418V) as milk powder containsmolecules that interact with streptavidin, resulting in background HRP activity. For proteinvisualization, the gels were stained with PageBlue (Fermentas, R0579). For the densitomet-ric analysis of Western blots, the program ImageJ 1.42q (freely available online) was used.To compare the biotinylation levels between different samples, the value of the streptavidin-HRP signal was normalized by taking a ratio with the value of PentaHis signal, which re-flects the amount of the transfected protein regardless of its biotinylation status. Every West-ern analysis was performed three times, with a representative figure shown.
6.4 Mass Spectrometry Analysis
The protein bands were excised from the gel and processed as in [Shevchenko et al., 1996].The gel slices were dehydrated with 300 µL of 50% acetonitrile followed by 300 µL of 100%acetonitrile, then re-hydrated with 300 µL of 50 mM ammonium bicarbonate. A final dehy-dration was performed with 2 washes of 300 µL of 50% acetonitrile, followed by 2 washes of300 µL of 100% acetonitrile. Each wash was carried out for 10 min at 25◦C with shaking at1400 rpm. The gel slices were dried in a SpeedVac at 35◦ C for 10 min. For trypsin digestion,the gel slices were pre-incubated with 7 ml of 15 ng/mL trypsin (Promega V5280) at roomtemperature for 10 min. Afterwards, 25 µL of 50 mM ammonium bicarbonate was added,

6.5. Immunoflourescent Microscopy 155
and the gel slices were incubated at 37◦C for 16 h. The peptide-containing supernatantswere dried at 56◦C by SpeedVac for 30 min, then resuspended in 20 µL of solution containing0.05% formic acid and 3% acetonitrile for mass spectrometry experiments. The resulting pep-tides were analyzed with a nano-HPLC (Agilent Technologies 1200) directly coupled to anion-trap mass spectrometer (Bruker 6300 series) equipped with a nano-electrospray source.The separation gradient was 7 min from 5% to 90% acetonitrile. The fragmentation voltagewas 1.3 V. The analysis of the spectra was performed with the DataAnalysis for the 6300Series Ion Trap LC/MS Version 3.4 software package. The samples were run in two differ-ent modes. For peptide identification, the ion trap acquired successive sets of 4 scan modesconsisting of: full scan MS over the ranges of 200-2000 m/z, followed by 3 data-dependentMS/MS scans on the 3 most abundant ions in the full scan. Alternatively, for the confirma-tion and quantification of the presence of a particular peptide in the sample, the ion trap wasset in MRM mode. The sample was separated using the same nanoLC gradient, and the iontrap was set to isolate, fragment and MS/MS scan six parental ions having predeterminedM/Z ratios.
For quantitative comparisons of various histone PTMs in different samples extracted ionchromatograms (EICs) representing each fragment peptide of a particular light or heavyparent peptide were generated in Agilent’s "Data Analysis" software. The peak intensitiesof light fragment peptides and their respective heavy fragment peptides were summed upand used for H/L ratio calculation. A similar ratio was also calculated for the unmodifiedversion of the same peptide. The proportions were calculated using these two ratios, i.e. H/L(modified) / H/L (unmodified) and represented in the form of graphs in the results section.
6.5 Immunoflourescent Microscopy
MRC-5 foetal lung fibroblasts were grown on cover slips in 6-well plates in DMEM high glu-cose containing dialyzed FBS. Cells were co-transfected with the plasmid constructs BirA-Rad18 (0.1 µg) and BAP-H2AZ (1 µg) using TurboFect (Cat. R0531, Fermentas). 24h aftertransfection, cells were treated with UVC (20 J/m2 , Philips TUV 15W/G 15 TB lamp). After6h of irradiation, the DMEM containing dialyzed FBS was removed and the cells were pulse-labeled for 5 min with biotin (5 µg/mL final concentration). The biotin-containing mediumwas then removed, and cells were fixed either immediately (pulse) or 2h after the pulse(chase). For staining, cells were washed once with cold PBS and treated with CSK buffer(100 mM NACl, 300 mM Sucrose, 3 mM MgCl2 , 10 mM tris-HCl pH 7.5, 1 mM EGTA, Triton0.2%) for 5 min with light agitation. Cells were then washed twice with cold PBS. Fixationwas done in 4% formaldehyde for 20 min at room temperature (RT). After fixation, cells wererinsed with ice-cold methanol at -20◦C for 10 sec. Cells were then washed 3 times for 5 minwith PBS (1X) at RT. Blocking was done for 30 min using 3% BSA and 0.5% Tween20 in PBS.Cells were then incubated with either mouse monoclonal anti-PCNA antibody (Santa Cruz;PC10; sc-56) for 1h (1/500 in blocking solution) or mouse monoclonal anti-Rad18 antibody(Abcam; ab57447) followed by 3 washes in PBS (1X) at RT. Cells were then incubated withgoat anti-mouse secondary antibody conjugated with Alexa-488 (Invitrogen; A11017) for 1h

156 Chapter 6. Materials and Methods
(1/1000). Streptavidin-Cy3 conjugate (Sigma; S-6402) was also added to the same incubationmix (1/500). After 3 washes in PBS (1X) at RT, cover slips were mounted on glass slides us-ing VectaShield mounting medium (Vector Laboratories; H-1000). The cells were observedunder a Zeiss LSM 510 Meta confocal microscope, using a Plan-Apochromat 63x 1.4 oil im-mersion objective. Imaging was performed with sequential multitrack scanning using the488 and 543 nm wavelengths lasers separately. The colocalization analysis was performedwith LSM Examiner software. Pearson’s correlation coefficient was calculated with settingthe threshold signal common for all images compared.
For HEK293T cells a slightly different preparation method was used as these cells adheremuch less strongly to the surfaces and can be easily detached. Briefly, after biotin pulse cellswere washed two times with cold PBS and were fixed by immersion in -20◦C methanol for 5min at -20◦C without agitation. Cells were washed again with cold PBS and were then per-meabilized with 0.2% Triton X-100 in PBS for 10 min at 4◦C in mild agitation. Fixation wasdone in 4% formaldehyde for 20 min at room temperature with mild agitation. Cells werewashed twice with PBS at room (RT) without agitation. Blocking was done with 3% BSAfor 30 min under mild agitation. Cells were then incubated with mouse monoclonal anti-Rad18 antibody (Abcam; ab57447) followed by 3 washes in PBS (1X) at RT. Cells were thenincubated with goat anti-mouse secondary antibody conjugated with Alexa-488 (Invitrogen;A11017) for 1h (1/1000). Streptavidin-Cy3 conjugate (Sigma; S-6402) and ToPro (Invitrogen;T3605) was also added (1/500 and 1/1000 respectively) to the same incubation mix. After 3washes in PBS (1X) at RT, cover slips were mounted on glass slides using VectaShield mount-ing medium (Vector Laboratories; H-1000). Cells were visualized under Zeiss LSM 510 Metaconfocal microscope as previously. For histones H2A and H3 staining, cells were incubatedwith anti-H2A antibody (Cell Signaling; 2572) and anti-H3 antibody (Abcam; ab1791) re-spectively.
6.6 Proteome Fractionation
• Preparation of Nuclei
Prepare CSK buffer with Triton 0.5% final, PMSF 1 mM final, and Na-Butyrate 5 mMfinal. Centrifuge cells at 700 g for 5 min. Wash cells twice with PBS in 10 times thevolume of the pellet. Spin at 700 rcf for 5 min. Wash cells in CSK buffer, 10 times thevolume of the pellet, without Triton. Spin at 700 g for 5 min. Incubate in CSK bufferwith Triton in 10 times the volume of the pellet for 5 min at room temperature [withinhibitors including protease inhibitor cocktail (Roche; 1697498), 10 mM Na-Butyrate,2 mM PMSF, 5 mM Nicotinamide (Sigma; N5535), 5 mM Na-Orthovanadate (Sigma;S6508)]. Observe under microscope if the nuclei are released. Spin nuclei at 4000 rpmfor 20 min. Mark the supernatant as cytoplasmic extract and keep it frozen in -80◦C.Measure the volume of the pellet.

6.7. Calcium Phosphate Transfections 157
• Preparation of Nuclear Extract
Add 1/2 volume of the pellet of LSB + PMSF, and resuspend. Add drop wise 1/2the volume of the pellet of HSB + PMSF (as earlier) and 0.07% β-mercaptoethanol (β-ME). Rotate in cold room for 30 min. Spin down at 13000 rpm for 30 min. Keep thesupernatant (nuclear extract) and freeze in -80◦C. Measure the volume of the pellet.
• Preparation of Histones (Acid Extraction)
Prepare 1 M H2SO4 and put it in ice box. Also take 100% acetone in glass bottle and putit in the ice box. Now resuspend the pellet in H2SO4 0,4 M final. Add PMSF and Na-butyrate as usuall. Put the tubes in cold room in rotation for 1h. Centrifuge at 2500 g for10 min and collect the supernatant containing histones. Keep the pellet which has DNAand matrix proteins and freeze it in -80◦C. Add 100% acetone 6 times the volume of thesupernatant. Incubate overnight in rotation at 4◦C for histone precipitation. Next day,centrifuge at 4000 rpm for 20 min. Remove the supernatant and speed vac to removethe acetone. Then 200 µL of distilled water was added to each tube in two steps andtry to resuspend the histones. They were then kept in -20◦C till further use.
6.7 Calcium Phosphate Transfections
One day (20-24h) before the experiment 293T cells were seeded at a concentration of 0.5M/well in a 6-well plate in 1.5 ml DMEM containing dialyzed FBS, 4 mM glutamine and 1%pen/strep. Two hours before the transfection, the medium was removed and cells were sup-plemented with 1.5 ml of fresh DMEM containing dialyzed FBS. For plasmid transfections,add the following in sterile 1.5 mL tubes, in the order listed,:
• 1 µL DNA (1 µg in sterile molecular biology water)
• 54 µL Molecular Biology Water
• 6 µL 2.5 M CaCl2
The above mixture was mixed gently by pipetting. In a second sterile 1.5 ml micro-centrifugetube, 60 µL of 2 X HEPES-Buffered Saline (HeBS) pH 7.05 was added. The CaCl2/DNAsolution was added to the HeBS buffer dropwise with a sterile pipette tip. Vortex for 2-4seconds. The precipitate was allowed to sit undisturbed for 20 min at room temperature andlater distributed over the cells in the culture dish and gently agitate to mix the precipitateand medium. The cells were incubated for 16h in a cell culture incubator (37◦C). After 16h,the medium was removed and 1,5 ml of fresh DMEM supplemented with 10% dialyzedserum, 4 mM glutamine, 1% pen/strep was added to the cells. The cells were incubated for24h in a cell culture incubator (37◦C). Cells were pulsed with biotin (when needed) for 5-15min, depending upon the experiment and were then harvested.

158 Chapter 6. Materials and Methods
6.8 Native Chromatin Immunoprecipitation
• Preparation of Nuclei
Cells were washed with PBS in 10 times the volume of the pellet [with inhibitors in-cluding protease inhibitor cocktail (Roche; 1697498), 10 mM Na-Butyrate, 2 mM PMSF,5 mM Nicotinamide (Sigma; N5535), 5 mM Na-Orthovanadate (Sigma; S6508)]. Aftercentrifuging at 700 rcf for 5 min, cells were lysed in 1 mL of CSK buffer (Sucrose 2.052g, MgCl2, 3 mM, Tris-HCl 10 mM pH 7.5, EGTA 1 mM, 0.5% Triton with inhibitors) for5 min at RT. Nuclei were centrifuged at 4000 rpm for 10 min and kept at 4◦C if the nextstep was performed immediately or kept at 20◦C if not used immediately.
• Micrococcal Nuclease Digestion
Nuclei were resuspended in 500 mL of TM2 buffer (10mMTris-HCl, 2 mM MgCl2, 0.1%Triton, inhibitors). In case of aggregate formation, nuclei were sonicated very brieflyto dissolve the aggregates. 2.5 µL of 0.5 M CaCl2 was added to the suspended nucleiand then 3 µL of micrococcal nuclease (MNase) (1 U/µL) (Sigma; N3755) was addedand incubated at 37◦C for 10 min. The reaction was stopped by adding 15 µL of 0.1 MEGTA. Nuclei were collected by spinning at 400 rcf (2000 rpm on tabletop eppendorfcentrifuge) for 10 min at 4◦C.
• Nucleosome Extraction
After micrococcal digestion, the nuclei pellet was resuspended in 500 µL of pre-chilled0.4 M salt extraction buffer (385 mM NaCl, 10 mM Tris-HCl pH 7.4, 2 mM MgCl2, 2mM EGTA, 0.1% Triton X-100 with inhibitors). The tubes were rotated at 4◦C for 30min. Nuclei were collected by spinning at 400 rcf (2000 rpm on tabletop eppendorfcentrifuge) for 10 min at 4◦C. Supernatant with digested chromatin was transferred toa new tube and kept at 4◦C for further processing.
• Streptavidin Pulldown
An equal volume of TM2 buffer was added to the extracted chromatin to make 0.2M final salt concentration. The sample was centrifuged at maximum speed (13,000g/16,000 rpm) on Eppendorf centrifuge) for 5 min at 4◦C. 200 µL of suspension ofSepaharose-streptavidin beads (GE Healthcare; 17-5113-01) were washed 3 times with0.2M salt extraction buffer with Triton and finally resuspended in 100 µL of the samebuffer. Beads suspension was combined with chromatin and rotated for 3h at 4◦C. Af-terwards, the beads were washed twice in 500 mL of 0.4 M salt extraction buffer withTriton for 5 min at 4◦C.
• Elution
For elution of biotinylated proteins from the streptavidin-sepharose beads, 100 µL of1X LDS sample buffer (with reducing agent + 2% SDS) to each sample and heat at 99◦Cfor 10 min. Eluant was collected in a fresh tube after spinning the beads very quicklyon table-top centrifuge for 10 s and kept at 20◦C. Elution was repeated again in 100 µLas before and pool the two eluates.

6.9. RNA Preparation and Microarray Analysis 159
• Western Blot and DNA analysis
Aliquots were taken after each step and the quality of preparation of DNA and proteinswas verified by running these samples on 1.5% agarose gels and 15% SDS-PAGE gelsrespectively. In order to verify the efficiency of biotinylation, samples were run on 15%SDS-PAGE gels, tranfered on PVDF membrane and blotted with streptavidin-HRP.
6.9 RNA Preparation and Microarray Analysis
• Total RNA extraction
FA-D2 corrected and mutated cells were grown in DMEM high glucose medium andtreated with either MOP/UVA or IR (doses described earlier) and incubated for either1h or 6h. Total RNA was isolated from the cells by lyzing the cells in Trizol reagent(SigmaAldrich), and later RNA was purified on RNeasy columns (Qiagen) accordingto the manufacturer’s protocols.
Briefly cells are mixed with 350 µL RLT buffer with β-Mercaptoethanol 1%. Then add350 µL ethanol 70% and mix thoroughly by vortexing. The mixture is transferred toa RNA-binding spin cup and centrifuged at 8,000 g for 20 seconds. The spin cup iswashed with 350 µL 1x low-salt wash buffer, incubated with RNase-free DNase-I at37◦C for 15 min, washed with 350 µL 1x high-salt wash buffer, then washed with 500µL 1x low-salt wash buffer and finally with 500 µL ethanol 80%. Total RNA is eluted byaddition of 15 µL nuclease free water to the RNA-binding spin cup and centrifugationat 20,000 g for 1 min. 1 µL of the eluted RNA is used for determination of concen-tration using Nanodrop spectrophotometer. Quality of RNA preparations is assessedusing Lab-on-a-chip Bioanalyser 2000 technology (Agilent technologies), based on the28S/18S ribosomal RNAs ratio. All samples included in this study displayed a ratioof ribosomal RNAs between 1.5 and 2. Concentration of all RNAs is adjusted at 100ng/µL, and verified with a second measurement on Nanodrop spectrophotometer.
• Labeling Protocol Cy3/Labeling Protocol Cy5
Agilent Low RNA Input Linear Amplification kit (ref 5188-5340) adapted for smallamount of total RNA (500 ng total RNA per reaction) was used for probe labeling.In 1,5 ml tubes add 500 ng total RNA from sample. Add 1,2 µL T7 promoter primer,2 µL spike in dilution 1/3200 (ref 5188-5279), use Spike in A to label Cy3 target andSpike In B to label Cy5 target, then add nuclease free water (Invitrogen ref:10977-015)to bring the volume up to 11,5 µL. Denature by incubating at 65◦C for 10 minutes. Placethe reactions on ice and incubate 5 min. Spin briefly. Prepare a Reverse Transcriptionmaster mix, adding for one reaction 4 µL first strand buffer 5X, 2 µL DTT 0,1 M, 1 µLdNTP 10 mM mix, 0.5 µL random hexamer, 1 µL MMLV Reverse Transcriptase (200U/µL), 0.5 µL RNAse out (40 U/µL). Master mix is prepared in batch for all the sam-ples included in the study (vol. per one reaction multiplied by number of samples. Ineach reaction tube containing denaturated RNA and T7 promoter primer in a volume

160 Chapter 6. Materials and Methods
of 11,5 µL, add 9 µL of Reverse Transcriptase master mix, and mix by gently pipet-ting. Incubate at 40◦C in a circulating water bath for 2 h. Move samples to 65◦C for15 min to inactivate MMLV RT, and incubate on ice for 5 min. Spin briefly. Prepare ain vitro transcription master mix, adding for one reaction : 20,1 µL nuclease free wa-ter, 20 µL Transcription buffer 4X, 6 µL DTT 0.1 M, 8 µL NTP mix, 0,5 µL RNAse out,0.6 µL inorganic pyrophosphatase, 0,8 µL T7 RNA Polymerase. Transcription mastermix is prepared in batch for all the samples included in the study. (vol. per one re-action multiplied by number of samples). Master mix is splited in two aliquots, onefor Cy5 and one for Cy3. Add 1,6 µL (multiplied by reactions number) CTP-Cy5 25mM (Perkin Elmer ref NEL 581) or 2,4 µL CTP-Cy3 (multiplied by reactions number)(Perkin Elmer, ref NEL 582) to a total volume of 60 µL/ reaction. To each RT reaction,add 60 µL Transcription master mix. Incubate at 40◦C for 2 h. Add 20 µL nuclease freewater and freeze at -20◦C. Labeled probes are purified using Qiagen RNeasy mini kitand protocol provided by Agilent. For each probe, add 350 µL RLT buffer, and 250 µLethanol 100◦C. Mix by gently vortexing. Apply 700 µL on RNeasy columns and spinat 13,000 g for 30 s at 4◦C. Discard flow-through. Wash twice with RPE buffer. Dry thecolumn and elute in 60 µL nuclease free water. Measure concentration and Cy5/3 in-corporation using a Nanodrop spectrophotometer. Adjust concentration at 100 ng/µL.Freeze at -20◦C until hybridization.
• Hybridization and washing protocol
Agilent Hybridization Protocol (Gene expression Hyb kit Large (ref 5188-5280), Cham-ber type: Agilent SureHyb Chamber; Quantity of labeled extract: 825 ng; duration: 17h; volume: 110 µL ; Temperature in ◦C: 65)
Add the following components in clean 1.5 ml tubes: 825 ng linearly amplified cRNAlabeled with Cy5 for each sample, and 825 ng linearly amplified cRNA labeled withCy3 for the control. Conversely, for dye swapped arrays, mix 825 ng linearly amplifiedcRNA labelled with Cy3 for each sample, and 825 ng linearly amplified cRNA labeledwith Cy5 for the control. In each case, add 11 µL 2X Blocking Agent, 2,2 µL of fragmen-tation buffer 25X and nuclease free water up to 110 µL. Mix by vortexing. Incubate at60◦C for 30 min in dark. Spin briefly, add 110 µL of 2X hybridization buffer. Mix gen-tly. Assembly the Sure-Hyb hybridization chamber from Agilent. Place a backing sidewith the plastic inner on upper side. Gently add 650 µL of 1X hybridization solutionand cover with the Agilent 44k array properly oriented (active surface in contact withliquid). Finish to assemble the chamber and tight the screw. Hybridization carry out for17 h at 65◦C in a rotating oven (Robbins Scientific, Mountain View, CA) at 4 rpm. Thearrays are disassembled at room temperature in SSPE Wash 1 Buffer (ref 5188-5327),then wash 1 min in a glass dish (Wheathon) at room temperature in wash 1 Buffer,then 1 minute in SSPE Wash 2 Buffer (ref 5188-5327) at 37◦C and finally acetonitrylwash (sigma aldrich), then 1 min at room temperature.
• Scanning Protocol
Scanning perform with a Agilent G2505C DNA Microarray scanner using default pa-

6.9. RNA Preparation and Microarray Analysis 161
rameters : 20 bits mode, 5 µm resolution, at 20◦C in low ozone concentration environ-ment.
• Normalization protocol
Microarray images are analysed by using Feature extraction software version 10.5.1.1from Agilent technologies and Agilent normalization protocol. Default settings areused.
• Transformation Protocol
Raw data files from the Agilent Feature Extraction software 10.5.1.1 for image analy-sis are then imported into Resolver (TM) system (version 7.2.1.1.9) for gene expressiondata analysis from Rosetta Inpharmatics. Then combined experiments are generated,to obtain average values from the dye swap experiments in order to avoid dye incor-poration bias.


Publications
• PUB-NChIP - "In-vivo biotinylation" approach to study chromatin in proximity of aprotein of interest.Shoaib M, Kulyyassov A, Robin C, Winczura K, Kannouche P, Ramankulov E, LipinskiM, Ogryzko V.In preparation
• PUB-MS - a mass-spectrometry-based method to monitor protein-protein proximityin-vivo. (2011)Kulyyassov A, Shoaib M, Pichugin A, Kannouche P, Ramankulov E, Lipinski M, OgryzkoV.J Proteome Res Sept 2 [Epub ahead of print]
• Use of In-Vivo Biotinylation for Chromatin Immunoprecipitation. (2011)Kulyyassov A, Shoaib M, Ogryzko V.Curr Protoc Cell Biol. 2011 Jun; Chapter 17: Unit17.12
• Multiple Displacement Amplification for Complex Mixtures of DNA Fragments. (2008)Shoaib M, Baconnais S., Mechold U., Le Cam. E., Lipinski M., and Ogryzko V.BMC. Genomics 9: 415.
163


Bibliography
[Abbott et al., 2001] Abbott, D. W., Ivanova, V. S., Wang, X., Bonner, W. M. and Ausio, J.(2001). Characterization of the stability and folding of H2A.Z chromatin particles: impli-cations for transcriptional activation. J Biol Chem 276, 41945–41949.
[Adam et al., 2001] Adam, M., Robert, F., Larochelle, M. and Gaudreau, L. (2001). H2A.Z isrequired for global chromatin integrity and for recruitment of RNA polymerase II underspecific conditions. Mol Cell Biol 21, 6270–6279.
[Adams-Cioaba and Min, 2009] Adams-Cioaba, M. A. and Min, J. (2009). Structure andfunction of histone methylation binding proteins. Biochem Cell Biol 87, 93–105.
[Agalioti et al., 2002] Agalioti, T., Chen, G. and Thanos, D. (2002). Deciphering the transcrip-tional histone acetylation code for a human gene. Cell 111, 381–392.
[Aguilar et al., 2001] Aguilar, C., Hofte, A. J., Tjaden, U. R. and van der Greef, J. (2001). Anal-ysis of histones by on-line capillary zone electrophoresis-electrospray ionisation massspectrometry. J Chromatogr A 926, 57–67.
[Ahmad and Henikoff, 2002a] Ahmad, K. and Henikoff, S. (2002a). The histone variant H3.3marks active chromatin by replication-independent nucleosome assembly. Mol Cell 9,1191–1200.
[Ahmad and Henikoff, 2002b] Ahmad, K. and Henikoff, S. (2002b). Histone H3 variantsspecify modes of chromatin assembly. Proc Natl Acad Sci U S A 99 Suppl 4, 16477–16484.
[Ahmed et al., 2007] Ahmed, S., Dul, B., Qiu, X. and Walworth, N. C. (2007). Msc1 actsthrough histone H2A.Z to promote chromosome stability in Schizosaccharomyces pombe.Genetics 177, 1487–1497.
[Akkari et al., 2000] Akkari, Y. M., Bateman, R. L., Reifsteck, C. A., Olson, S. B. and Grompe,M. (2000). DNA replication is required To elicit cellular responses to psoralen-inducedDNA interstrand cross-links. Mol Cell Biol 20, 8283–8289.
[Allfrey et al., 1964] Allfrey, V. G., Faulkner, R. and Mirsky, A. E. (1964). Acetylation andmethylation of histones and their possible role in the regulation of RNA synthesis. ProcNatl Acad Sci U S A 51, 786–794.
165

166 Bibliography
[Allis et al., 1980] Allis, C. D., Bowen, J. K., Abraham, G. N., Glover, C. V. and Gorovsky,M. A. (1980). Proteolytic processing of histone H3 in chromatin: a physiologically regu-lated event in Tetrahymena micronuclei. Cell 20, 55–64.
[Allis et al., 2007] Allis, C. D., Jenuwein, T. and Reinberg, D. (2007). Epigenetics. Cold SpringHarbor Laboratory Press, Cold Spring Harbor, New York.
[Allis and Wiggins, 1984] Allis, C. D. and Wiggins, J. C. (1984). Proteolytic processing ofmicronuclear H3 and histone phosphorylation during conjugation in Tetrahymena ther-mophila. Exp Cell Res 153, 287–298.
[Alpi et al., 2008] Alpi, A. F., Pace, P. E., Babu, M. M. and Patel, K. J. (2008). Mechanistic in-sight into site-restricted monoubiquitination of FANCD2 by Ube2t, FANCL, and FANCI.Mol Cell 32, 767–777.
[Altaf et al., 2007] Altaf, M., Saksouk, N. S. and Cote, J. (2007). Histone modifications inresponse to DNA damage. Mutat Res 618, 81–90.
[Angelov et al., 2003] Angelov, D., Molla, A., Perche, P.-Y., Hans, F., Cote, J., Khochbin, S.,Bouvet, P. and Dimitrov, S. (2003). The histone variant macroH2A interferes with tran-scription factor binding and SWI/SNF nucleosome remodeling. Mol Cell 11, 1033–1041.
[Arents and Moudrianakis, 1995] Arents, G. and Moudrianakis, E. N. (1995). The histonefold: a ubiquitous architectural motif utilized in DNA compaction and protein dimeriza-tion. Proc Natl Acad Sci U S A 92, 11170–11174.
[Armirotti and Damonte, 2010] Armirotti, A. and Damonte, G. (2010). Achievements andperspectives of top-down proteomics. Proteomics 10, 3566–3576.
[Bannister and Kouzarides, 1996] Bannister, A. J. and Kouzarides, T. (1996). The CBP co-activator is a histone acetyltransferase. Nature 384, 641–643.
[Bannister and Kouzarides, 2011] Bannister, A. J. and Kouzarides, T. (2011). Regulation ofchromatin by histone modifications. Cell Res 21, 381–395.
[Bannister et al., 2002] Bannister, A. J., Schneider, R. and Kouzarides, T. (2002). Histonemethylation: dynamic or static? Cell 109, 801–806.
[Bannister et al., 2001] Bannister, A. J., Zegerman, P., Partridge, J. F., Miska, E. A., Thomas,J. O., Allshire, R. C. and Kouzarides, T. (2001). Selective recognition of methylated lysine9 on histone H3 by the HP1 chromo domain. Nature 410, 120–124.
[Bantscheff et al., 2007] Bantscheff, M., Schirle, M., Sweetman, G., Rick, J. and Kuster, B.(2007). Quantitative mass spectrometry in proteomics: a critical review. Anal BioanalChem 389, 1017–1031.
[Barlesi et al., 2007] Barlesi, F., Giaccone, G., Gallegos-Ruiz, M. I., Loundou, A., Span, S. W.,Lefesvre, P., Kruyt, F. A. E. and Rodriguez, J. A. (2007). Global histone modificationspredict prognosis of resected non small-cell lung cancer. J Clin Oncol 25, 4358–4364.

167
[Barnidge et al., 2004] Barnidge, D. R., Hall, G. D., Stocker, J. L. and Muddiman, D. C. (2004).Evaluation of a cleavable stable isotope labeled synthetic peptide for absolute proteinquantification using LC-MS/MS. J Proteome Res 3, 658–661.
[Barski et al., 2007] Barski, A., Cuddapah, S., Cui, K., Roh, T.-Y., Schones, D. E., Wang, Z.,Wei, G., Chepelev, I. and Zhao, K. (2007). High-resolution profiling of histone methyla-tions in the human genome. Cell 129, 823–837.
[Bartke et al., 2010] Bartke, T., Vermeulen, M., Xhemalce, B., Robson, S. C., Mann, M. andKouzarides, T. (2010). Nucleosome-interacting proteins regulated by DNA and histonemethylation. Cell 143, 470–484.
[Beck et al., 2006] Beck, H. C., Nielsen, E. C., Matthiesen, R., Jensen, L. H., Sehested, M.,Finn, P., Grauslund, M., Hansen, A. M. and Jensen, O. N. (2006). Quantitative proteomicanalysis of post-translational modifications of human histones. Mol Cell Proteomics 5,1314–1325.
[Bedford and Clarke, 2009] Bedford, M. T. and Clarke, S. G. (2009). Protein arginine methy-lation in mammals: who, what, and why. Mol Cell 33, 1–13.
[Begley and Samson, 2004] Begley, T. J. and Samson, L. D. (2004). Network responses toDNA damaging agents. DNA Repair (Amst) 3, 1123–1132.
[Ben-Yehoyada et al., 2009] Ben-Yehoyada, M., Wang, L. C., Kozekov, I. D., Rizzo, C. J.,Gottesman, M. E. and Gautier, J. (2009). Checkpoint signaling from a single DNA in-terstrand crosslink. Mol Cell 35, 704–715.
[Benson et al., 2006] Benson, L. J., Gu, Y., Yakovleva, T., Tong, K., Barrows, C., Strack, C. L.,Cook, R. G., Mizzen, C. A. and Annunziato, A. T. (2006). Modifications of H3 and H4during chromatin replication, nucleosome assembly, and histone exchange. J Biol Chem281, 9287–9296.
[Bergink et al., 2006] Bergink, S., Salomons, F. A., Hoogstraten, D., Groothuis, T. A. M.,de Waard, H., Wu, J., Yuan, L., Citterio, E., Houtsmuller, A. B., Neefjes, J., Hoeijmakers, J.H. J., Vermeulen, W. and Dantuma, N. P. (2006). DNA damage triggers nucleotide excisionrepair-dependent monoubiquitylation of histone H2A. Genes Dev 20, 1343–1352.
[Bhaskara et al., 2008] Bhaskara, S., Chyla, B. J., Amann, J. M., Knutson, S. K., Cortez, D.,Sun, Z.-W. and Hiebert, S. W. (2008). Deletion of histone deacetylase 3 reveals criticalroles in S phase progression and DNA damage control. Mol Cell 30, 61–72.
[Birchler et al., 2000] Birchler, J. A., Bhadra, M. P. and Bhadra, U. (2000). Making noise aboutsilence: repression of repeated genes in animals. Curr Opin Genet Dev 10, 211–216.
[Blagoev et al., 2003] Blagoev, B., Kratchmarova, I., Ong, S.-E., Nielsen, M., Foster, L. J. andMann, M. (2003). A proteomics strategy to elucidate functional protein-protein interac-tions applied to EGF signaling. Nat Biotechnol 21, 315–318.

168 Bibliography
[Blagoev et al., 2004] Blagoev, B., Ong, S.-E., Kratchmarova, I. and Mann, M. (2004). Tem-poral analysis of phosphotyrosine-dependent signaling networks by quantitative pro-teomics. Nat Biotechnol 22, 1139–1145.
[Blower et al., 2002] Blower, M. D., Sullivan, B. A. and Karpen, G. H. (2002). Conservedorganization of centromeric chromatin in flies and humans. Dev Cell 2, 319–330.
[Bogliolo et al., 2007] Bogliolo, M., Lyakhovich, A., Callen, E., Castella, M., Cappelli, E.,Ramirez, M. J., Creus, A., Marcos, R., Kalb, R., Neveling, K., Schindler, D. and Surralles,J. (2007). Histone H2AX and Fanconi anemia FANCD2 function in the same pathway tomaintain chromosome stability. EMBO J 26, 1340–1351.
[Bonaldi et al., 2004] Bonaldi, T., Imhof, A. and Regula, J. T. (2004). A combination of differ-ent mass spectroscopic techniques for the analysis of dynamic changes of histone modifi-cations. Proteomics 4, 1382–1396.
[Bonenfant et al., 2007] Bonenfant, D., Towbin, H., Coulot, M., Schindler, P., Mueller, D. R.and van Oostrum, J. (2007). Analysis of dynamic changes in post-translational modifica-tions of human histones during cell cycle by mass spectrometry. Mol Cell Proteomics 6,1917–1932.
[Bonnefoy et al., 2007] Bonnefoy, E., Orsi, G. A., Couble, P. and Loppin, B. (2007). The essen-tial role of Drosophila HIRA for de novo assembly of paternal chromatin at fertilization.PLoS Genet 3, 1991–2006.
[Bonner et al., 1980] Bonner, W. M., West, M. H. and Stedman, J. D. (1980). Two-dimensionalgel analysis of histones in acid extracts of nuclei, cells, and tissues. Eur J Biochem 109,17–23.
[Boschetti and Righetti, 2008a] Boschetti, E. and Righetti, P. G. (2008a). Hexapeptide com-binatorial ligand libraries: the march for the detection of the low-abundance proteomecontinues. Biotechniques 44, 663–665.
[Boschetti and Righetti, 2008b] Boschetti, E. and Righetti, P. G. (2008b). The ProteoMinerin the proteomic arena: a non-depleting tool for discovering low-abundance species. JProteomics 71, 255–264.
[Botuyan et al., 2006] Botuyan, M. V., Lee, J., Ward, I. M., Kim, J.-E., Thompson, J. R., Chen,J. and Mer, G. (2006). Structural basis for the methylation state-specific recognition ofhistone H4-K20 by 53BP1 and Crb2 in DNA repair. Cell 127, 1361–1373.
[Boyne et al., 2006] Boyne, M. T., Pesavento, J. J., Mizzen, C. A. and Kelleher, N. L. (2006).Precise characterization of human histones in the H2A gene family by top down massspectrometry. J Proteome Res 5, 248–253.
[Brasacchio et al., 2009] Brasacchio, D., Okabe, J., Tikellis, C., Balcerczyk, A., George, P.,Baker, E. K., Calkin, A. C., Brownlee, M., Cooper, M. E. and El-Osta, A. (2009). Hyper-glycemia induces a dynamic cooperativity of histone methylase and demethylase en-

169
zymes associated with gene-activating epigenetic marks that coexist on the lysine tail.Diabetes 58, 1229–1236.
[Brendel and Ruhland, 1984] Brendel, M. and Ruhland, A. (1984). Relationships betweenfunctionality and genetic toxicology of selected DNA-damaging agents. Mutat Res 133,51–85.
[Bridge et al., 2005] Bridge, W. L., Vandenberg, C. J., Franklin, R. J. and Hiom, K. (2005). TheBRIP1 helicase functions independently of BRCA1 in the Fanconi anemia pathway forDNA crosslink repair. Nat Genet 37, 953–957.
[Brown et al., 2001] Brown, C. E., Howe, L., Sousa, K., Alley, S. C., Carrozza, M. J., Tan, S.and Workman, J. L. (2001). Recruitment of HAT complexes by direct activator interactionswith the ATM-related Tra1 subunit. Science 292, 2333–2337.
[Brownell and Allis, 1995] Brownell, J. E. and Allis, C. D. (1995). An activity gel assay detectsa single, catalytically active histone acetyltransferase subunit in Tetrahymena macronu-clei. Proc Natl Acad Sci U S A 92, 6364–6368.
[Brownell et al., 1996] Brownell, J. E., Zhou, J., Ranalli, T., Kobayashi, R., Edmondson, D. G.,Roth, S. Y. and Allis, C. D. (1996). Tetrahymena histone acetyltransferase A: a homolog toyeast Gcn5p linking histone acetylation to gene activation. Cell 84, 843–851.
[Buschbeck et al., 2009] Buschbeck, M., Uribesalgo, I., Wibowo, I., Rue, P., Martin, D., Gutier-rez, A., Morey, L., Guigo, R., Lopez-Schier, H. and Croce, L. D. (2009). The histone variantmacroH2A is an epigenetic regulator of key developmental genes. Nat Struct Mol Biol 16,1074–1079.
[Caldecott, 2008] Caldecott, K. W. (2008). Single-strand break repair and genetic disease.Nat Rev Genet 9, 619–631.
[Camporeale et al., 2004] Camporeale, G., Shubert, E. E., Sarath, G., Cerny, R. and Zempleni,J. (2004). K8 and K12 are biotinylated in human histone H4. Eur J Biochem 271, 2257–2263.
[Capetillo et al., 2004] Capetillo, O. F., Allis, C. D. and Nussenzweig, A. (2004). Phosphory-lation of histone H2B at DNA double-strand breaks. J Exp Med 199, 1671–1677.
[Carey et al., 2006] Carey, M., Li, B. and Workman, J. L. (2006). RSC exploits histone acety-lation to abrogate the nucleosomal block to RNA polymerase II elongation. Mol Cell 24,481–487.
[Celeste et al., 2003] Celeste, A., Fernandez-Capetillo, O., Kruhlak, M. J., Pilch, D. R., Staudt,D. W., Lee, A., Bonner, R. F., Bonner, W. M. and Nussenzweig, A. (2003). Histone H2AXphosphorylation is dispensable for the initial recognition of DNA breaks. Nat Cell Biol 5,675–679.

170 Bibliography
[Celeste et al., 2002] Celeste, A., Petersen, S., Romanienko, P. J., Fernandez-Capetillo, O.,Chen, H. T., Sedelnikova, O. A., Reina-San-Martin, B., Coppola, V., Meffre, E., Difilip-pantonio, M. J., Redon, C., Pilch, D. R., Olaru, A., Eckhaus, M., Camerini-Otero, R. D., Tes-sarollo, L., Livak, F., Manova, K., Bonner, W. M., Nussenzweig, M. C. and Nussenzweig,A. (2002). Genomic instability in mice lacking histone H2AX. Science 296, 922–927.
[Ceol et al., 2011] Ceol, C. J., Houvras, Y., Jane-Valbuena, J., Bilodeau, S., Orlando, D. A.,Battisti, V., Fritsch, L., Lin, W. M., Hollmann, T. J., Ferrà c©, F., Bourque, C., Burke, C. J.,Turner, L., Uong, A., Johnson, L. A., Beroukhim, R., Mermel, C. H., Loda, M., Ait-Si-Ali, S.,Garraway, L. A., Young, R. A. and Zon, L. I. (2011). The histone methyltransferase SETDB1is recurrently amplified in melanoma and accelerates its onset. Nature 471, 513–517.
[Chadwick and Willard, 2001] Chadwick, B. P. and Willard, H. F. (2001). A novel chromatinprotein, distantly related to histone H2A, is largely excluded from the inactive X chromo-some. J Cell Biol 152, 375–384.
[Chait, 2006] Chait, B. T. (2006). Chemistry. Mass spectrometry: bottom-up or top-down?Science 314, 65–66.
[Chakalova et al., 2005] Chakalova, L., Debrand, E., Mitchell, J. A., Osborne, C. S. and Fraser,P. (2005). Replication and transcription: shaping the landscape of the genome. Nat RevGenet 6, 669–677.
[Chakravarthy et al., 2005] Chakravarthy, S., Park, Y.-J., Chodaparambil, J., Edayathuman-galam, R. S. and Luger, K. (2005). Structure and dynamic properties of nucleosome coreparticles. FEBS Lett 579, 895–898.
[Chalfie and Kain, 2005] Chalfie, M. and Kain, S. R. (2005). Green Fluorescent Protein: Prop-erties, Applications, and Protocols. John Wiley & Sons, Inc.
[Champagne and Kutateladze, 2009] Champagne, K. S. and Kutateladze, T. G. (2009). Struc-tural insight into histone recognition by the ING PHD fingers. Curr Drug Targets 10,432–441.
[Chang et al., 2007] Chang, B., Chen, Y., Zhao, Y. and Bruick, R. K. (2007). JMJD6 is a histonearginine demethylase. Science 318, 444–447.
[Chapman and Jackson, 2008] Chapman, J. R. and Jackson, S. P. (2008). Phospho-dependentinteractions between NBS1 and MDC1 mediate chromatin retention of the MRN complexat sites of DNA damage. EMBO Rep 9, 795–801.
[Cheadle and Sampson, 2007] Cheadle, J. P. and Sampson, J. R. (2007). MUTYH-associatedpolyposis–from defect in base excision repair to clinical genetic testing. DNA Repair(Amst) 6, 274–279.
[Chen et al., 2008] Chen, C.-C., Carson, J. J., Feser, J., Tamburini, B., Zabaronick, S., Linger,J. and Tyler, J. K. (2008). Acetylated lysine 56 on histone H3 drives chromatin assemblyafter repair and signals for the completion of repair. Cell 134, 231–243.
171
[Chen et al., 2007] Chen, Y., Sprung, R., Tang, Y., Ball, H., Sangras, B., Kim, S. C., Falck, J. R.,Peng, J., Gu, W. and Zhao, Y. (2007). Lysine propionylation and butyrylation are novelpost-translational modifications in histones. Mol Cell Proteomics 6, 812–819.
[Cheung, 2004] Cheung, P. (2004). Generation and characterization of antibodies directedagainst di-modified histones, and comments on antibody and epitope recognition. Meth-ods Enzymol 376, 221–234.
[Cheung et al., 2003] Cheung, W. L., Ajiro, K., Samejima, K., Kloc, M., Cheung, P., Mizzen,C. A., Beeser, A., Etkin, L. D., Chernoff, J., Earnshaw, W. C. and Allis, C. D. (2003). Apop-totic phosphorylation of histone H2B is mediated by mammalian sterile twenty kinase.Cell 113, 507–517.
[Cheung et al., 2005] Cheung, W. L., Turner, F. B., Krishnamoorthy, T., Wolner, B., Ahn, S.-H.,Foley, M., Dorsey, J. A., Peterson, C. L., Berger, S. L. and Allis, C. D. (2005). Phosphoryla-tion of histone H4 serine 1 during DNA damage requires casein kinase II in S. cerevisiae.Curr Biol 15, 656–660.
[Chi et al., 2007a] Chi, A., Bai, D. L., Geer, L. Y., Shabanowitz, J. and Hunt, D. F. (2007a).Analysis of intact proteins on a chromatographic time scale by electron transfer dissocia-tion tandem mass spectrometry. Int J Mass Spectrom 259, 197–203.
[Chi et al., 2007b] Chi, A., Huttenhower, C., Geer, L. Y., Coon, J. J., Syka, J. E. P., Bai, D. L.,Shabanowitz, J., Burke, D. J., Troyanskaya, O. G. and Hunt, D. F. (2007b). Analysis ofphosphorylation sites on proteins from Saccharomyces cerevisiae by electron transfer dis-sociation (ETD) mass spectrometry. Proc Natl Acad Sci U S A 104, 2193–2198.
[Chistiakov et al., 2008] Chistiakov, D. A., Voronova, N. V. and Chistiakov, P. A. (2008). Ge-netic variations in DNA repair genes, radiosensitivity to cancer and susceptibility to acutetissue reactions in radiotherapy-treated cancer patients. Acta Oncol 47, 809–824.
[Choudhary et al., 2009] Choudhary, C., Kumar, C., Gnad, F., Nielsen, M. L., Rehman, M.,Walther, T. C., Olsen, J. V. and Mann, M. (2009). Lysine acetylation targets protein com-plexes and co-regulates major cellular functions. Science 325, 834–840.
[Chowdhury et al., 2005] Chowdhury, D., Keogh, M.-C., Ishii, H., Peterson, C. L., Bura-towski, S. and Lieberman, J. (2005). gamma-H2AX dephosphorylation by protein phos-phatase 2A facilitates DNA double-strand break repair. Mol Cell 20, 801–809.
[Chowdhury et al., 2008] Chowdhury, D., Xu, X., Zhong, X., Ahmed, F., Zhong, J., Liao, J.,Dykxhoorn, D. M., Weinstock, D. M., Pfeifer, G. P. and Lieberman, J. (2008). A PP4-phosphatase complex dephosphorylates gamma-H2AX generated during DNA replica-tion. Mol Cell 31, 33–46.
[Chuikov et al., 2004] Chuikov, S., Kurash, J. K., Wilson, J. R., Xiao, B., Justin, N., Ivanov,G. S., McKinney, K., Tempst, P., Prives, C., Gamblin, S. J., Barlev, N. A. and Reinberg, D.(2004). Regulation of p53 activity through lysine methylation. Nature 432, 353–360.

172 Bibliography
[Clapier and Cairns, 2009] Clapier, C. R. and Cairns, B. R. (2009). The biology of chromatinremodeling complexes. Annu Rev Biochem 78, 273–304.
[Clarkson et al., 1999] Clarkson, M. J., Wells, J. R., Gibson, F., Saint, R. and Tremethick, D. J.(1999). Regions of variant histone His2AvD required for Drosophila development. Nature399, 694–697.
[Collins et al., 2005] Collins, R. E., Tachibana, M., Tamaru, H., Smith, K. M., Jia, D., Zhang,X., Selker, E. U., Shinkai, Y. and Cheng, X. (2005). In vitro and in vivo analyses of a Phe/Tyrswitch controlling product specificity of histone lysine methyltransferases. J Biol Chem280, 5563–5570.
[Contreras et al., 2003] Contreras, A., Hale, T. K., Stenoien, D. L., Rosen, J. M., Mancini, M. A.and Herrera, R. E. (2003). The dynamic mobility of histone H1 is regulated by cyclin/CDKphosphorylation. Mol Cell Biol 23, 8626–8636.
[Cook et al., 2009] Cook, P. J., Ju, B. G., Telese, F., Wang, X., Glass, C. K. and Rosenfeld, M. G.(2009). Tyrosine dephosphorylation of H2AX modulates apoptosis and survival decisions.Nature 458, 591–596.
[Coon et al., 2005] Coon, J. J., Ueberheide, B., Syka, J. E. P., Dryhurst, D. D., Ausio, J., Sha-banowitz, J. and Hunt, D. F. (2005). Protein identification using sequential ion/ion reac-tions and tandem mass spectrometry. Proc Natl Acad Sci U S A 102, 9463–9468.
[Copeland et al., 2009] Copeland, R. A., Solomon, M. E. and Richon, V. M. (2009). Proteinmethyltransferases as a target class for drug discovery. Nat Rev Drug Discov 8, 724–732.
[Cosgrove et al., 2004] Cosgrove, M. S., Boeke, J. D. and Wolberger, C. (2004). Regulatednucleosome mobility and the histone code. Nat Struct Mol Biol 11, 1037–1043.
[Couldrey et al., 1999] Couldrey, C., Carlton, M. B., Nolan, P. M., Colledge, W. H. and Evans,M. J. (1999). A retroviral gene trap insertion into the histone 3.3A gene causes partialneonatal lethality, stunted growth, neuromuscular deficits and male sub-fertility in trans-genic mice. Hum Mol Genet 8, 2489–2495.
[Cremer and Cremer, 2001] Cremer, T. and Cremer, C. (2001). Chromosome territories, nu-clear architecture and gene regulation in mammalian cells. Nat Rev Genet 2, 292–301.
[Crick, 1970] Crick, F. (1970). Central dogma of molecular biology. Nature 227, 561–563.
[Crick, 1984] Crick, F. (1984). Memory and molecular turnover. Nature 312, 101.
[Cuomo et al., 2011] Cuomo, A., Moretti, S., Minucci, S. and Bonaldi, T. (2011). SILAC-basedproteomic analysis to dissect the "histone modification signature" of human breast cancercells. Amino Acids 41, 387–399.
[Cuthbert et al., 2004] Cuthbert, G. L., Daujat, S., Snowden, A. W., Erdjument-Bromage, H.,Hagiwara, T., Yamada, M., Schneider, R., Gregory, P. D., Tempst, P., Bannister, A. J. andKouzarides, T. (2004). Histone deimination antagonizes arginine methylation. Cell 118,545–553.

173
[Dalgliesh et al., 2010] Dalgliesh, G. L., Furge, K., Greenman, C., Chen, L., Bignell, G., But-ler, A., Davies, H., Edkins, S., Hardy, C., Latimer, C., Teague, J., Andrews, J., Barthorpe,S., Beare, D., Buck, G., Campbell, P. J., Forbes, S., Jia, M., Jones, D., Knott, H., Kok, C. Y.,Lau, K. W., Leroy, C., Lin, M.-L., McBride, D. J., Maddison, M., Maguire, S., McLay, K.,Menzies, A., Mironenko, T., Mulderrig, L., Mudie, L., O’Meara, S., Pleasance, E., Rajasing-ham, A., Shepherd, R., Smith, R., Stebbings, L., Stephens, P., Tang, G., Tarpey, P. S., Turrell,K., Dykema, K. J., Khoo, S. K., Petillo, D., Wondergem, B., Anema, J., Kahnoski, R. J., Teh,B. T., Stratton, M. R. and Futreal, P. A. (2010). Systematic sequencing of renal carcinomareveals inactivation of histone modifying genes. Nature 463, 360–363.
[D’Andrea and Grompe, 2003] D’Andrea, A. D. and Grompe, M. (2003). The Fanconianaemia/BRCA pathway. Nat Rev Cancer 3, 23–34.
[Dardalhon et al., 2007] Dardalhon, M., Lin, W., Nicolas, A. and Averbeck, D. (2007). Specifictranscriptional responses induced by 8-methoxypsoralen and UVA in yeast. FEMS YeastRes 7, 866–878.
[Das et al., 2009] Das, C., Lucia, M. S., Hansen, K. C. and Tyler, J. K. (2009). CBP/p300-mediated acetylation of histone H3 on lysine 56. Nature 459, 113–117.
[Daujat et al., 2005] Daujat, S., Zeissler, U., Waldmann, T., Happel, N. and Schneider, R.(2005). HP1 binds specifically to Lys26-methylated histone H1.4, whereas simultaneousSer27 phosphorylation blocks HP1 binding. J Biol Chem 280, 38090–38095.
[de Ruijter et al., 2003] de Ruijter, A. J. M., van Gennip, A. H., Caron, H. N., Kemp, S. andvan Kuilenburg, A. B. P. (2003). Histone deacetylases (HDACs): characterization of theclassical HDAC family. Biochem J 370, 737–749.
[Delahunty and Yates, 2007] Delahunty, C. M. and Yates, J. R. (2007). MudPIT: multidimen-sional protein identification technology. Biotechniques 43, 563, 565, 567 passim.
[Dhillon and Kamakaka, 2000] Dhillon, N. and Kamakaka, R. T. (2000). A histone variant,Htz1p, and a Sir1p-like protein, Esc2p, mediate silencing at HMR. Mol Cell 6, 769–780.
[Doil et al., 2009] Doil, C., Mailand, N., Bekker-Jensen, S., Menard, P., Larsen, D. H., Pep-perkok, R., Ellenberg, J., Panier, S., Durocher, D., Bartek, J., Lukas, J. and Lukas, C. (2009).RNF168 binds and amplifies ubiquitin conjugates on damaged chromosomes to allow ac-cumulation of repair proteins. Cell 136, 435–446.
[Douglas et al., 2010] Douglas, P., Zhong, J., Ye, R., Moorhead, G. B. G., Xu, X. and Lees-Miller, S. P. (2010). Protein phosphatase 6 interacts with the DNA-dependent protein ki-nase catalytic subunit and dephosphorylates gamma-H2AX. Mol Cell Biol 30, 1368–1381.
[Dovey et al., 2010] Dovey, O. M., Foster, C. T. and Cowley, S. M. (2010). Histone deacetylase1 (HDAC1), but not HDAC2, controls embryonic stem cell differentiation. Proc Natl AcadSci U S A 107, 8242–8247.
[Downs et al., 2000] Downs, J. A., Lowndes, N. F. and Jackson, S. P. (2000). A role for Sac-charomyces cerevisiae histone H2A in DNA repair. Nature 408, 1001–1004.
174 Bibliography
[Drogaris et al., 2008] Drogaris, P., Wurtele, H., Masumoto, H., Verreault, A. and Thibault, P.(2008). Comprehensive profiling of histone modifications using a label-free approach andits applications in determining structure-function relationships. Anal Chem 80, 6698–6707.
[Dronkert and Kanaar, 2001] Dronkert, M. L. and Kanaar, R. (2001). Repair of DNA inter-strand cross-links. Mutat Res 486, 217–247.
[Duncan et al., 2008] Duncan, E. M., Muratore-Schroeder, T. L., Cook, R. G., Garcia, B. A.,Shabanowitz, J., Hunt, D. F. and Allis, C. D. (2008). Cathepsin L proteolytically processeshistone H3 during mouse embryonic stem cell differentiation. Cell 135, 284–294.
[Dunleavy et al., 2009] Dunleavy, E. M., Roche, D., Tagami, H., Lacoste, N., Ray-Gallet, D.,Nakamura, Y., Daigo, Y., Nakatani, Y. and Almouzni-Pettinotti, G. (2009). HJURP is a cell-cycle-dependent maintenance and deposition factor of CENP-A at centromeres. Cell 137,485–497.
[Dunn et al., 2006] Dunn, J., Potter, M., Rees, A. and Runger, T. M. (2006). Activation ofthe Fanconi anemia/BRCA pathway and recombination repair in the cellular response tosolar ultraviolet light. Cancer Res 66, 11140–11147.
[Eberl et al., 2011] Eberl, H. C., Mann, M. and Vermeulen, M. (2011). Quantitative pro-teomics for epigenetics. Chembiochem 12, 224–234.
[Ehrenhofer-Murray, 2004] Ehrenhofer-Murray, A. E. (2004). Chromatin dynamics at DNAreplication, transcription and repair. Eur J Biochem 271, 2335–2349.
[Eirin-Lopez et al., 2008] Eirin-Lopez, J. M., Ishibashi, T. and Ausio, J. (2008). H2A.Bbd: aquickly evolving hypervariable mammalian histone that destabilizes nucleosomes in anacetylation-independent way. FASEB J 22, 316–326.
[El-Mahdy et al., 2006] El-Mahdy, M. A., Zhu, Q., en Wang, Q., Wani, G., Praetorius-Ibba, M.and Wani, A. A. (2006). Cullin 4A-mediated proteolysis of DDB2 protein at DNA damagesites regulates in vivo lesion recognition by XPC. J Biol Chem 281, 13404–13411.
[El-Osta et al., 2008] El-Osta, A., Brasacchio, D., Yao, D., Pocai, A., Jones, P. L., Roeder, R. G.,Cooper, M. E. and Brownlee, M. (2008). Transient high glucose causes persistent epige-netic changes and altered gene expression during subsequent normoglycemia. J Exp Med205, 2409–2417.
[Elkon et al., 2005] Elkon, R., Rashi-Elkeles, S., Lerenthal, Y., Linhart, C., Tenne, T.,Amariglio, N., Rechavi, G., Shamir, R. and Shiloh, Y. (2005). Dissection of a DNA-damage-induced transcriptional network using a combination of microarrays, RNA interferenceand computational promoter analysis. Genome Biol 6, R43.
[Escargueil et al., 2008] Escargueil, A. E., Soares, D. G., Salvador, M., Larsen, A. K. and Hen-riques, J. A. P. (2008). What histone code for DNA repair? Mutat Res 658, 259–270.

175
[Esteve et al., 2006] Esteve, P.-O., Chin, H. G., Smallwood, A., Feehery, G. R., Gangisetty, O.,Karpf, A. R., Carey, M. F. and Pradhan, S. (2006). Direct interaction between DNMT1and G9a coordinates DNA and histone methylation during replication. Genes Dev 20,3089–3103.
[Faast et al., 2001] Faast, R., Thonglairoam, V., Schulz, T. C., Beall, J., Wells, J. R., Taylor, H.,Matthaei, K., Rathjen, P. D., Tremethick, D. J. and Lyons, I. (2001). Histone variant H2A.Zis required for early mammalian development. Curr Biol 11, 1183–1187.
[Fan et al., 2002] Fan, J. Y., Gordon, F., Luger, K., Hansen, J. C. and Tremethick, D. J. (2002).The essential histone variant H2A.Z regulates the equilibrium between different chro-matin conformational states. Nat Struct Biol 9, 172–176.
[Feng et al., 2002] Feng, Q., Wang, H., Ng, H. H., Erdjument-Bromage, H., Tempst, P., Struhl,K. and Zhang, Y. (2002). Methylation of H3-lysine 79 is mediated by a new family ofHMTases without a SET domain. Curr Biol 12, 1052–1058.
[Fenn et al., 1989] Fenn, J. B., Mann, M., Meng, C. K., Wong, S. F. and Whitehouse, C. M.(1989). Electrospray ionization for mass spectrometry of large biomolecules. Science 246,64–71.
[Fernandez-Suarez et al., 2008] Fernandez-Suarez, M., Chen, T. S. and Ting, A. Y. (2008).Protein-protein interaction detection in vitro and in cells by proximity biotinylation. JAm Chem Soc 130, 9251–9253.
[Finch and Klug, 1976] Finch, J. T. and Klug, A. (1976). Solenoidal model for superstructurein chromatin. Proc Natl Acad Sci U S A 73, 1897–1901.
[Fischle et al., 2005] Fischle, W., Tseng, B. S., Dormann, H. L., Ueberheide, B. M., Garcia,B. A., Shabanowitz, J., Hunt, D. F., Funabiki, H. and Allis, C. D. (2005). Regulation ofHP1-chromatin binding by histone H3 methylation and phosphorylation. Nature 438,1116–1122.
[Fischle et al., 2003] Fischle, W., Wang, Y. and Allis, C. D. (2003). Binary switches and modi-fication cassettes in histone biology and beyond. Nature 425, 475–479.
[Foltz et al., 2009] Foltz, D. R., Jansen, L. E. T., Bailey, A. O., Yates, J. R., Bassett, E. A., Wood,S., Black, B. E. and Cleveland, D. W. (2009). Centromere-specific assembly of CENP-anucleosomes is mediated by HJURP. Cell 137, 472–484.
[Foltz et al., 2006] Foltz, D. R., Jansen, L. E. T., Black, B. E., Bailey, A. O., Yates, 3rd, J. R.and Cleveland, D. W. (2006). The human CENP-A centromeric nucleosome-associatedcomplex. Nat Cell Biol 8, 458–469.
[Fraga et al., 2005] Fraga, M. F., Ballestar, E., Villar-Garea, A., Boix-Chornet, M., Espada, J.,Schotta, G., Bonaldi, T., Haydon, C., Ropero, S., Petrie, K., Iyer, N. G., PÃ c©rez-Rosado,A., Calvo, E., Lopez, J. A., Cano, A., Calasanz, M. J., Colomer, D., Piris, M. A., Ahn, N.,Imhof, A., Caldas, C., Jenuwein, T. and Esteller, M. (2005). Loss of acetylation at Lys16

176 Bibliography
and trimethylation at Lys20 of histone H4 is a common hallmark of human cancer. NatGenet 37, 391–400.
[Galvani et al., 2008] Galvani, A., Courbeyrette, R., Agez, M., Ochsenbein, F., Mann, C. andThuret, J.-Y. (2008). In vivo study of the nucleosome assembly functions of ASF1 histonechaperones in human cells. Mol Cell Biol 28, 3672–3685.
[Garcia et al., 2005] Garcia, B. A., Barber, C. M., Hake, S. B., Ptak, C., Turner, F. B., Busby,S. A., Shabanowitz, J., Moran, R. G., Allis, C. D. and Hunt, D. F. (2005). Modifications ofhuman histone H3 variants during mitosis. Biochemistry 44, 13202–13213.
[Garcia et al., 2004] Garcia, B. A., Busby, S. A., Barber, C. M., Shabanowitz, J., Allis, C. D. andHunt, D. F. (2004). Characterization of phosphorylation sites on histone H1 isoforms bytandem mass spectrometry. J Proteome Res 3, 1219–1227.
[Garcia et al., 2005] Garcia, B. A., Busby, S. A., Shabanowitz, J., Hunt, D. F. and Mishra, N.(2005). Resetting the epigenetic histone code in the MRL-lpr/lpr mouse model of lupusby histone deacetylase inhibition. J Proteome Res 4, 2032–2042.
[Garcia et al., 2007] Garcia, B. A., Hake, S. B., Diaz, R. L., Kauer, M., Morris, S. A., Recht, J.,Shabanowitz, J., Mishra, N., Strahl, B. D., Allis, C. D. and Hunt, D. F. (2007). Organismaldifferences in post-translational modifications in histones H3 and H4. J Biol Chem 282,7641–7655.
[Garcia et al., 2006] Garcia, B. A., Joshi, S., Thomas, C. E., Chitta, R. K., Diaz, R. L., Busby,S. A., Andrews, P. C., Loo, R. R. O., Shabanowitz, J., Kelleher, N. L., Mizzen, C. A., Allis,C. D. and Hunt, D. F. (2006). Comprehensive phosphoprotein analysis of linker histoneH1 from Tetrahymena thermophila. Mol Cell Proteomics 5, 1593–1609.
[Garcia et al., 2007a] Garcia, B. A., Mollah, S., Ueberheide, B. M., Busby, S. A., Muratore,T. L., Shabanowitz, J. and Hunt, D. F. (2007a). Chemical derivatization of histones forfacilitated analysis by mass spectrometry. Nat Protoc 2, 933–938.
[Garcia et al., 2007b] Garcia, B. A., Pesavento, J. J., Mizzen, C. A. and Kelleher, N. L. (2007b).Pervasive combinatorial modification of histone H3 in human cells. Nat Methods 4, 487–489.
[Gautier et al., 2004] Gautier, T., Abbott, D. W., Molla, A., Verdel, A., Ausio, J. and Dimitrov,S. (2004). Histone variant H2ABbd confers lower stability to the nucleosome. EMBO Rep5, 715–720.
[Geiger et al., 2010] Geiger, T., Cox, J., Ostasiewicz, P., Wisniewski, J. R. and Mann, M. (2010).Super-SILAC mix for quantitative proteomics of human tumor tissue. Nat Methods 7,383–385.
[Geiger et al., 2011] Geiger, T., Wisniewski, J. R., Cox, J., Zanivan, S., Kruger, M., Ishihama,Y. and Mann, M. (2011). Use of stable isotope labeling by amino acids in cell culture as aspike-in standard in quantitative proteomics. Nat Protoc 6, 147–157.

177
[Gerlich et al., 2003] Gerlich, D., Beaudouin, J., Kalbfuss, B., Daigle, N., Eils, R. and Ellen-berg, J. (2003). Global chromosome positions are transmitted through mitosis in mam-malian cells. Cell 112, 751–764.
[Gershey et al., 1968] Gershey, E. L., Vidali, G. and Allfrey, V. G. (1968). Chemical studiesof histone acetylation. The occurrence of epsilon-N-acetyllysine in the f2a1 histone. J BiolChem 243, 5018–5022.
[Giannasca et al., 1993] Giannasca, P. J., Horowitz, R. A. and Woodcock, C. L. (1993). Transi-tions between in situ and isolated chromatin. J Cell Sci 105 ( Pt 2), 551–561.
[Giannattasio et al., 2005] Giannattasio, M., Lazzaro, F., Plevani, P. and Muzi-Falconi, M.(2005). The DNA damage checkpoint response requires histone H2B ubiquitination byRad6-Bre1 and H3 methylation by Dot1. J Biol Chem 280, 9879–9886.
[Glonek and Solomon, 2004] Glonek, G. F. V. and Solomon, P. J. (2004). Factorial and timecourse designs for cDNA microarray experiments. Biostatistics 5, 89–111.
[Goldberg et al., 2010] Goldberg, A. D., Banaszynski, L. A., Noh, K.-M., Lewis, P. W., El-saesser, S. J., Stadler, S., Dewell, S., Law, M., Guo, X., Li, X., Wen, D., Chapgier, A.,DeKelver, R. C., Miller, J. C., Lee, Y.-L., Boydston, E. A., Holmes, M. C., Gregory, P. D.,Greally, J. M., Rafii, S., Yang, C., Scambler, P. J., Garrick, D., Gibbons, R. J., Higgs, D. R.,Cristea, I. M., Urnov, F. D., Zheng, D. and Allis, C. D. (2010). Distinct factors control his-tone variant H3.3 localization at specific genomic regions. Cell 140, 678–691.
[Gonzalez-Romero et al., 2008] Gonzalez-Romero, R., Mendez, J., Ausio, J. and Eirin-Lopez,J. M. (2008). Quickly evolving histones, nucleosome stability and chromatin folding: allabout histone H2A.Bbd. Gene 413, 1–7.
[Good et al., 2007] Good, D. M., Wirtala, M., McAlister, G. C. and Coon, J. J. (2007). Per-formance characteristics of electron transfer dissociation mass spectrometry. Mol CellProteomics 6, 1942–1951.
[Gorisch et al., 2005] Gorisch, S. M., Wachsmuth, M., Toth, K. F., Lichter, P. and Rippe, K.(2005). Histone acetylation increases chromatin accessibility. J Cell Sci 118, 5825–5834.
[Govin et al., 2005] Govin, J., Caron, C., Rousseaux, S. and Khochbin, S. (2005). Testis-specific histone H3 expression in somatic cells. Trends Biochem Sci 30, 357–359.
[Graumann et al., 2008] Graumann, J., Hubner, N. C., Kim, J. B., Ko, K., Moser, M., Kumar,C., Cox, J., Scholer, H. and Mann, M. (2008). Stable isotope labeling by amino acids in cellculture (SILAC) and proteome quantitation of mouse embryonic stem cells to a depth of5,111 proteins. Mol Cell Proteomics 7, 672–683.
[Green and Almouzni, 2003] Green, C. M. and Almouzni, G. (2003). Local action of the chro-matin assembly factor CAF-1 at sites of nucleotide excision repair in vivo. EMBO J 22,5163–5174.

178 Bibliography
[Gregoretti et al., 2004] Gregoretti, I. V., Lee, Y.-M. and Goodson, H. V. (2004). Molecularevolution of the histone deacetylase family: functional implications of phylogenetic anal-ysis. J Mol Biol 338, 17–31.
[Greil et al., 2006] Greil, F., Moorman, C. and van Steensel, B. (2006). DamID: mapping of invivo protein-genome interactions using tethered DNA adenine methyltransferase. Meth-ods Enzymol 410, 342–359.
[Groth et al., 2007] Groth, A., Rocha, W., Verreault, A. and Almouzni, G. (2007). Chromatinchallenges during DNA replication and repair. Cell 128, 721–733.
[Gruhler et al., 2005] Gruhler, A., Olsen, J. V., Mohammed, S., Mortensen, P., Faergeman,N. J., Mann, M. and Jensen, O. N. (2005). Quantitative phosphoproteomics applied tothe yeast pheromone signaling pathway. Mol Cell Proteomics 4, 310–327.
[Guccione et al., 2007] Guccione, E., Bassi, C., Casadio, F., Martinato, F., Cesaroni, M.,Schuchlautz, H., Luscher, B. and Amati, B. (2007). Methylation of histone H3R2 by PRMT6and H3K4 by an MLL complex are mutually exclusive. Nature 449, 933–937.
[Gupta et al., 2005] Gupta, A., Sharma, G. G., Young, C. S. H., Agarwal, M., Smith, E. R.,Paull, T. T., Lucchesi, J. C., Khanna, K. K., Ludwig, T. and Pandita, T. K. (2005). Involve-ment of human MOF in ATM function. Mol Cell Biol 25, 5292–5305.
[Gurley et al., 1991] Gurley, L. R., London, J. E. and Valdez, J. G. (1991). High-performancecapillary electrophoresis of histones. J Chromatogr 559, 431–443.
[Gygi et al., 1999] Gygi, S. P., Rist, B., Gerber, S. A., Turecek, F., Gelb, M. H. and Aebersold,R. (1999). Quantitative analysis of complex protein mixtures using isotope-coded affinitytags. Nat Biotechnol 17, 994–999.
[Haigis and Guarente, 2006] Haigis, M. C. and Guarente, L. P. (2006). Mammalian sirtuins–emerging roles in physiology, aging, and calorie restriction. Genes Dev 20, 2913–2921.
[Hake and Allis, 2006] Hake, S. B. and Allis, C. D. (2006). Histone H3 variants and theirpotential role in indexing mammalian genomes: the "H3 barcode hypothesis". Proc NatlAcad Sci U S A 103, 6428–6435.
[Hake et al., 2007] Hake, S. B., Xiao, A. and Allis, C. D. (2007). Linking the epigenetic ’lan-guage’ of covalent histone modifications to cancer. Br J Cancer 96 Suppl, R31–R39.
[Hale et al., 2006] Hale, T. K., Contreras, A., Morrison, A. J. and Herrera, R. E. (2006). Phos-phorylation of the linker histone H1 by CDK regulates its binding to HP1alpha. Mol Cell22, 693–699.
[Hall, 1992] Hall, B. (1992). Evolutionary Developmental Biology. Chapman & Hall; Lon-don.
[Hansen et al., 2008] Hansen, K. H., Bracken, A. P., Pasini, D., Dietrich, N., Gehani, S. S.,Monrad, A., Rappsilber, J., Lerdrup, M. and Helin, K. (2008). A model for transmission ofthe H3K27me3 epigenetic mark. Nat Cell Biol 10, 1291–1300.

179
[Hassan et al., 2002] Hassan, A. H., Prochasson, P., Neely, K. E., Galasinski, S. C., Chandy,M., Carrozza, M. J. and Workman, J. L. (2002). Function and selectivity of bromodomainsin anchoring chromatin-modifying complexes to promoter nucleosomes. Cell 111, 369–379.
[Hebbes et al., 1989] Hebbes, T. R., Turner, C. H., Thorne, A. W. and Crane-Robinson, C.(1989). A "minimal epitope" anti-protein antibody that recognises a single modified aminoacid. Mol Immunol 26, 865–873.
[Heck and Krijgsveld, 2004] Heck, A. J. R. and Krijgsveld, J. (2004). Mass spectrometry-based quantitative proteomics. Expert Rev Proteomics 1, 317–326.
[Heinloth et al., 2003a] Heinloth, A. N., Shackelford, R. E., Innes, C. L., Bennett, L., Li, L.,Amin, R. P., Sieber, S. O., Flores, K. G., Bushel, P. R. and Paules, R. S. (2003a). Identificationof distinct and common gene expression changes after oxidative stress and gamma andultraviolet radiation. Mol Carcinog 37, 65–82.
[Heinloth et al., 2003b] Heinloth, A. N., Shackelford, R. E., Innes, C. L., Bennett, L., Li, L.,Amin, R. P., Sieber, S. O., Flores, K. G., Bushel, P. R. and Paules, R. S. (2003b). ATM-dependent and -independent gene expression changes in response to oxidative stress,gamma irradiation, and UV irradiation. Radiat Res 160, 273–290.
[Heitz, 1928] Heitz, E. (1928). Das heterochromatin der moose. I Jahrb Wiss Botanik 69,762–818.
[Henikoff and Dalal, 2005] Henikoff, S. and Dalal, Y. (2005). Centromeric chromatin: whatmakes it unique? Curr Opin Genet Dev 15, 177–184.
[Hodawadekar and Marmorstein, 2007] Hodawadekar, S. C. and Marmorstein, R. (2007).Chemistry of acetyl transfer by histone modifying enzymes: structure, mechanism andimplications for effector design. Oncogene 26, 5528–5540.
[Hodl and Basler, 2009] Hodl, M. and Basler, K. (2009). Transcription in the absence of his-tone H3.3. Curr Biol 19, 1221–1226.
[Hoeijmakers, 2007] Hoeijmakers, J. H. J. (2007). Genome maintenance mechanisms are crit-ical for preventing cancer as well as other aging-associated diseases. Mech Ageing Dev128, 460–462.
[Hoeijmakers, 2009] Hoeijmakers, J. H. J. (2009). DNA damage, aging, and cancer. N Engl JMed 361, 1475–1485.
[Holliday, 1987] Holliday, R. (1987). The inheritance of epigenetic defects. Science 238,163–170.
[Holliday, 1990] Holliday, R. (1990). Mechanisms for the control of gene activity duringdevelopment. Biol Rev Camb Philos Soc 65, 431–471.
[Holliday, 1994] Holliday, R. (1994). Epigenetics: an overview. Dev Genet 15, 453–457.

180 Bibliography
[Hon et al., 2009] Hon, G. C., Hawkins, R. D. and Ren, B. (2009). Predictive chromatin sig-natures in the mammalian genome. Hum Mol Genet 18, R195–R201.
[Hopfield, 1974] Hopfield, J. J. (1974). Kinetic proofreading: a new mechanism for reducingerrors in biosynthetic processes requiring high specificity. Proc Natl Acad Sci U S A 71,4135–4139.
[Houlard et al., 2006] Houlard, M., Berlivet, S., Probst, A. V., Quivy, J.-P., Hery, P., Almouzni,G. and Gerard, M. (2006). CAF-1 is essential for heterochromatin organization in pluripo-tent embryonic cells. PLoS Genet 2, e181.
[Houston et al., 2008] Houston, S. I., McManus, K. J., Adams, M. M., Sims, J. K., Carpenter,P. B., Hendzel, M. J. and Rice, J. C. (2008). Catalytic function of the PR-Set7 histone H4lysine 20 monomethyltransferase is essential for mitotic entry and genomic stability. J BiolChem 283, 19478–19488.
[Howlett et al., 2002] Howlett, N. G., Taniguchi, T., Olson, S., Cox, B., Waisfisz, Q., Die-Smulders, C. D., Persky, N., Grompe, M., Joenje, H., Pals, G., Ikeda, H., Fox, E. A. andD’Andrea, A. D. (2002). Biallelic inactivation of BRCA2 in Fanconi anemia. Science 297,606–609.
[Howman et al., 2000] Howman, E. V., Fowler, K. J., Newson, A. J., Redward, S., MacDon-ald, A. C., Kalitsis, P. and Choo, K. H. (2000). Early disruption of centromeric chromatinorganization in centromere protein A (Cenpa) null mice. Proc Natl Acad Sci U S A 97,1148–1153.
[Huang et al., 2009a] Huang, D. W., Sherman, B. T. and Lempicki, R. A. (2009a). Bioinformat-ics enrichment tools: paths toward the comprehensive functional analysis of large genelists. Nucleic Acids Res 37, 1–13.
[Huang et al., 2009b] Huang, D. W., Sherman, B. T. and Lempicki, R. A. (2009b). Systematicand integrative analysis of large gene lists using DAVID bioinformatics resources. NatProtoc 4, 44–57.
[Huang et al., 2010] Huang, J., Dorsey, J., Chuikov, S., Perez-Burgos, L., Zhang, X., Jenuwein,T., Reinberg, D. and Berger, S. L. (2010). G9a and Glp methylate lysine 373 in the tumorsuppressor p53. J Biol Chem 285, 9636–9641.
[Huang et al., 2006] Huang, Y., Fang, J., Bedford, M. T., Zhang, Y. and Xu, R.-M. (2006).Recognition of histone H3 lysine-4 methylation by the double tudor domain of JMJD2A.Science 312, 748–751.
[Huen et al., 2007] Huen, M. S. Y., Grant, R., Manke, I., Minn, K., Yu, X., Yaffe, M. B. andChen, J. (2007). RNF8 transduces the DNA-damage signal via histone ubiquitylation andcheckpoint protein assembly. Cell 131, 901–914.
[Huyen et al., 2004] Huyen, Y., Zgheib, O., Ditullio, R. A., Gorgoulis, V. G., Zacharatos, P.,Petty, T. J., Sheston, E. A., Mellert, H. S., Stavridi, E. S. and Halazonetis, T. D. (2004).

181
Methylated lysine 79 of histone H3 targets 53BP1 to DNA double-strand breaks. Nature432, 406–411.
[ichi Tsukada et al., 2006] ichi Tsukada, Y., Fang, J., Erdjument-Bromage, H., Warren, M. E.,Borchers, C. H., Tempst, P. and Zhang, Y. (2006). Histone demethylation by a family ofJmjC domain-containing proteins. Nature 439, 811–816.
[Ikura and Ogryzko, 2003] Ikura, T. and Ogryzko, V. V. (2003). Chromatin dynamics andDNA repair. Front Biosci 8, s149–s155.
[Ikura et al., 2000] Ikura, T., Ogryzko, V. V., Grigoriev, M., Groisman, R., Wang, J., Horikoshi,M., Scully, R., Qin, J. and Nakatani, Y. (2000). Involvement of the TIP60 histone acetylasecomplex in DNA repair and apoptosis. Cell 102, 463–473.
[Ikura et al., 2007] Ikura, T., Tashiro, S., Kakino, A., Shima, H., Jacob, N., Amunugama, R.,Yoder, K., Izumi, S., Kuraoka, I., Tanaka, K., Kimura, H., Ikura, M., Nishikubo, S., Ito,T., Muto, A., Miyagawa, K., Takeda, S., Fishel, R., Igarashi, K. and Kamiya, K. (2007).DNA damage-dependent acetylation and ubiquitination of H2AX enhances chromatindynamics. Mol Cell Biol 27, 7028–7040.
[Ishihama et al., 2005] Ishihama, Y., Oda, Y., Tabata, T., Sato, T., Nagasu, T., Rappsilber, J.and Mann, M. (2005). Exponentially modified protein abundance index (emPAI) for esti-mation of absolute protein amount in proteomics by the number of sequenced peptidesper protein. Mol Cell Proteomics 4, 1265–1272.
[Jackson and Gorovsky, 2000] Jackson, J. D. and Gorovsky, M. A. (2000). Histone H2A.Zhas a conserved function that is distinct from that of the major H2A sequence variants.Nucleic Acids Res 28, 3811–3816.
[Jackson, 1988] Jackson, V. (1988). Deposition of newly synthesized histones: hybrid nucleo-somes are not tandemly arranged on daughter DNA strands. Biochemistry 27, 2109–2120.
[Janicki et al., 2004] Janicki, S. M., Tsukamoto, T., Salghetti, S. E., Tansey, W. P., Sachidanan-dam, R., Prasanth, K. V., Ried, T., Shav-Tal, Y., Bertrand, E., Singer, R. H. and Spector, D. L.(2004). From silencing to gene expression: real-time analysis in single cells. Cell 116,683–698.
[Jenuwein and Allis, 2001] Jenuwein, T. and Allis, C. D. (2001). Translating the histone code.Science 293, 1074–1080.
[Jeppesen and Turner, 1993] Jeppesen, P. and Turner, B. M. (1993). The inactive X chromo-some in female mammals is distinguished by a lack of histone H4 acetylation, a cytoge-netic marker for gene expression. Cell 74, 281–289.
[Jiang et al., 2007a] Jiang, L., Smith, J. N., Anderson, S. L., Ma, P., Mizzen, C. A. and Kelleher,N. L. (2007a). Global assessment of combinatorial post-translational modification of corehistones in yeast using contemporary mass spectrometry. LYS4 trimethylation correlateswith degree of acetylation on the same H3 tail. J Biol Chem 282, 27923–27934.

182 Bibliography
[Jiang et al., 2007b] Jiang, T., Zhou, X., Taghizadeh, K., Dong, M. and Dedon, P. C. (2007b).N-formylation of lysine in histone proteins as a secondary modification arising from ox-idative DNA damage. Proc Natl Acad Sci U S A 104, 60–65.
[Jin et al., 2009] Jin, C., Zang, C., Wei, G., Cui, K., Peng, W., Zhao, K. and Felsenfeld, G.(2009). H3.3/H2A.Z double variant-containing nucleosomes mark ’nucleosome-free re-gions’ of active promoters and other regulatory regions. Nat Genet 41, 941–945.
[Jiricny, 2006] Jiricny, J. (2006). The multifaceted mismatch-repair system. Nat Rev Mol CellBiol 7, 335–346.
[Johnson et al., 2004] Johnson, L., Mollah, S., Garcia, B. A., Muratore, T. L., Shabanowitz, J.,Hunt, D. F. and Jacobsen, S. E. (2004). Mass spectrometry analysis of Arabidopsis histoneH3 reveals distinct combinations of post-translational modifications. Nucleic Acids Res32, 6511–6518.
[Jones and Gelbart, 1993] Jones, R. S. and Gelbart, W. M. (1993). The Drosophila Polycomb-group gene Enhancer of zeste contains a region with sequence similarity to trithorax. MolCell Biol 13, 6357–6366.
[Jung et al., 2010] Jung, H. R., Pasini, D., Helin, K. and Jensen, O. N. (2010). Quantitativemass spectrometry of histones H3.2 and H3.3 in Suz12-deficient mouse embryonic stemcells reveals distinct, dynamic post-translational modifications at Lys-27 and Lys-36. MolCell Proteomics 9, 838–850.
[Kalocsay et al., 2009] Kalocsay, M., Hiller, N. J. and Jentsch, S. (2009). Chromosome-wideRad51 spreading and SUMO-H2A.Z-dependent chromosome fixation in response to apersistent DNA double-strand break. Mol Cell 33, 335–343.
[Kanaar et al., 2008] Kanaar, R., Wyman, C. and Rothstein, R. (2008). Quality control of DNAbreak metabolism: in the ’end’, it’s a good thing. EMBO J 27, 581–588.
[Kannouche and Lehmann, 2004] Kannouche, P. L. and Lehmann, A. R. (2004). Ubiquitina-tion of PCNA and the polymerase switch in human cells. Cell Cycle 3, 1011–1013.
[Karas and Hillenkamp, 1988] Karas, M. and Hillenkamp, F. (1988). Laser desorption ioniza-tion of proteins with molecular masses exceeding 10,000 daltons. Anal Chem 60, 2299–2301.
[Kennedy and D’Andrea, 2005] Kennedy, R. D. and D’Andrea, A. D. (2005). The FanconiAnemia/BRCA pathway: new faces in the crowd. Genes Dev 19, 2925–2940.
[Keogh et al., 2006] Keogh, M.-C., Kim, J.-A., Downey, M., Fillingham, J., Chowdhury, D.,Harrison, J. C., Onishi, M., Datta, N., Galicia, S., Emili, A., Lieberman, J., Shen, X., Bura-towski, S., Haber, J. E., Durocher, D., Greenblatt, J. F. and Krogan, N. J. (2006). A phos-phatase complex that dephosphorylates gammaH2AX regulates DNA damage check-point recovery. Nature 439, 497–501.

183
[Khorasanizadeh, 2004] Khorasanizadeh, S. (2004). The nucleosome: from genomic organi-zation to genomic regulation. Cell 116, 259–272.
[Kim et al., 2006] Kim, J., Daniel, J., Espejo, A., Lake, A., Krishna, M., Xia, L., Zhang, Y. andBedford, M. T. (2006). Tudor, MBT and chromo domains gauge the degree of lysine methy-lation. EMBO Rep 7, 397–403.
[Kim et al., 2009] Kim, J., Guermah, M., McGinty, R. K., Lee, J.-S., Tang, Z., Milne, T. A., Shi-latifard, A., Muir, T. W. and Roeder, R. G. (2009). RAD6-Mediated transcription-coupledH2B ubiquitylation directly stimulates H3K4 methylation in human cells. Cell 137, 459–471.
[Kimura and Horikoshi, 1998] Kimura, A. and Horikoshi, M. (1998). Tip60 acetylates sixlysines of a specific class in core histones in vitro. Genes Cells 3, 789–800.
[Kimura and Cook, 2001] Kimura, H. and Cook, P. R. (2001). Kinetics of core histones inliving human cells: little exchange of H3 and H4 and some rapid exchange of H2B. J CellBiol 153, 1341–1353.
[Kirmizis et al., 2007] Kirmizis, A., Santos-Rosa, H., Penkett, C. J., Singer, M. A., Vermeulen,M., Mann, M., Bahler, J., Green, R. D. and Kouzarides, T. (2007). Arginine methylation athistone H3R2 controls deposition of H3K4 trimethylation. Nature 449, 928–932.
[Kislinger et al., 2005] Kislinger, T., Gramolini, A. O., MacLennan, D. H. and Emili, A. (2005).Multidimensional protein identification technology (MudPIT): technical overview of aprofiling method optimized for the comprehensive proteomic investigation of normal anddiseased heart tissue. J Am Soc Mass Spectrom 16, 1207–1220.
[Kleff et al., 1995] Kleff, S., Andrulis, E. D., Anderson, C. W. and Sternglanz, R. (1995). Iden-tification of a gene encoding a yeast histone H4 acetyltransferase. J Biol Chem 270, 24674–24677.
[Klose and Zhang, 2007] Klose, R. J. and Zhang, Y. (2007). Regulation of histone methylationby demethylimination and demethylation. Nat Rev Mol Cell Biol 8, 307–318.
[Knapp et al., 2007] Knapp, A. R., Ren, C., Su, X., Lucas, D. M., Byrd, J. C., Freitas, M. A. andParthun, M. R. (2007). Quantitative profiling of histone post-translational modificationsby stable isotope labeling. Methods 41, 312–319.
[Kolas et al., 2007] Kolas, N. K., Chapman, J. R., Nakada, S., Ylanko, J., Chahwan, R.,Sweeney, F. D., Panier, S., Mendez, M., Wildenhain, J., Thomson, T. M., Pelletier, L., Jack-son, S. P. and Durocher, D. (2007). Orchestration of the DNA-damage response by theRNF8 ubiquitin ligase. Science 318, 1637–1640.
[Kornberg, 1974] Kornberg, R. D. (1974). Chromatin structure: a repeating unit of histonesand DNA. Science 184, 868–871.
[Kouzarides, 2007a] Kouzarides, T. (2007a). SnapShot: Histone-modifying enzymes. Cell131, 822.

184 Bibliography
[Kouzarides, 2007b] Kouzarides, T. (2007b). Chromatin modifications and their function.Cell 128, 693–705.
[Kraus, 2009] Kraus, W. L. (2009). New functions for an ancient domain. Nat Struct Mol Biol16, 904–907.
[Krishnan et al., 2009] Krishnan, N., Jeong, D. G., Jung, S.-K., Ryu, S. E., Xiao, A., Allis, C. D.,Kim, S. J. and Tonks, N. K. (2009). Dephosphorylation of the C-terminal tyrosyl residueof the DNA damage-related histone H2A.X is mediated by the protein phosphatase eyesabsent. J Biol Chem 284, 16066–16070.
[Kruger et al., 2008] Kruger, M., Moser, M., Ussar, S., Thievessen, I., Luber, C. A., Forner, F.,Schmidt, S., Zanivan, S., Fassler, R. and Mann, M. (2008). SILAC mouse for quantitativeproteomics uncovers kindlin-3 as an essential factor for red blood cell function. Cell 134,353–364.
[Kruhlak et al., 2006] Kruhlak, M. J., Celeste, A., Dellaire, G., Fernandez-Capetillo, O.,Muller, W. G., McNally, J. G., Bazett-Jones, D. P. and Nussenzweig, A. (2006). Changesin chromatin structure and mobility in living cells at sites of DNA double-strand breaks.J Cell Biol 172, 823–834.
[Kulis and Esteller, 2010] Kulis, M. and Esteller, M. (2010). DNA methylation and cancer.Adv Genet 70, 27–56.
[Kysela et al., 2005] Kysela, B., Chovanec, M. and Jeggo, P. A. (2005). Phosphorylationof linker histones by DNA-dependent protein kinase is required for DNA ligase IV-dependent ligation in the presence of histone H1. Proc Natl Acad Sci U S A 102, 1877–1882.
[Lachner et al., 2001] Lachner, M., O’Carroll, D., Rea, S., Mechtler, K. and Jenuwein, T.(2001). Methylation of histone H3 lysine 9 creates a binding site for HP1 proteins. Nature410, 116–120.
[Lamond and Earnshaw, 1998] Lamond, A. I. and Earnshaw, W. C. (1998). Structure andfunction in the nucleus. Science 280, 547–553.
[Lan and Shi, 2009] Lan, F. and Shi, Y. (2009). Epigenetic regulation: methylation of histoneand non-histone proteins. Sci China C Life Sci 52, 311–322.
[Lavelle and Prunell, 2007] Lavelle, C. and Prunell, A. (2007). Chromatin polymorphismand the nucleosome superfamily: a genealogy. Cell Cycle 6, 2113–2119.
[Leach et al., 2000] Leach, T. J., Mazzeo, M., Chotkowski, H. L., Madigan, J. P., Wotring, M. G.and Glaser, R. L. (2000). Histone H2A.Z is widely but nonrandomly distributed in chro-mosomes of Drosophila melanogaster. J Biol Chem 275, 23267–23272.
[Lee et al., 2010] Lee, H.-S., Park, J.-H., Kim, S.-J., Kwon, S.-J. and Kwon, J. (2010). A co-operative activation loop among SWI/SNF, gamma-H2AX and H3 acetylation for DNAdouble-strand break repair. EMBO J 29, 1434–1445.

185
[Lee et al., 2007] Lee, J.-S., Shukla, A., Schneider, J., Swanson, S. K., Washburn, M. P., Florens,L., Bhaumik, S. R. and Shilatifard, A. (2007). Histone crosstalk between H2B monoubiq-uitination and H3 methylation mediated by COMPASS. Cell 131, 1084–1096.
[Lee et al., 2005] Lee, M. G., Wynder, C., Cooch, N. and Shiekhattar, R. (2005). An essentialrole for CoREST in nucleosomal histone 3 lysine 4 demethylation. Nature 437, 432–435.
[Lee et al., 2008] Lee, S., Lee, J., Lee, S.-K. and Lee, J. W. (2008). Activating signalcointegrator-2 is an essential adaptor to recruit histone H3 lysine 4 methyltransferasesMLL3 and MLL4 to the liver X receptors. Mol Endocrinol 22, 1312–1319.
[Li et al., 2007] Li, B., Carey, M. and Workman, J. L. (2007). The role of chromatin duringtranscription. Cell 128, 707–719.
[Li et al., 2008] Li, Q., Zhou, H., Wurtele, H., Davies, B., Horazdovsky, B., Verreault, A. andZhang, Z. (2008). Acetylation of histone H3 lysine 56 regulates replication-coupled nucle-osome assembly. Cell 134, 244–255.
[Lindner et al., 1992] Lindner, H., Helliger, W., Dirschlmayer, A., Jaquemar, M. and Puschen-dorf, B. (1992). High-performance capillary electrophoresis of core histones and theiracetylated modified derivatives. Biochem J 283 ( Pt 2), 467–471.
[Lindner et al., 1996] Lindner, H., Sarg, B., Meraner, C. and Helliger, W. (1996). Separation ofacetylated core histones by hydrophilic-interaction liquid chromatography. J ChromatogrA 743, 137–144.
[Liu et al., 2004] Liu, H., Sadygov, R. G. and Yates, J. R. (2004). A model for random samplingand estimation of relative protein abundance in shotgun proteomics. Anal Chem 76,4193–4201.
[Liu et al., 1996] Liu, X., Bowen, J. and Gorovsky, M. A. (1996). Either of the major H2Agenes but not an evolutionarily conserved H2A.F/Z variant of Tetrahymena thermophilacan function as the sole H2A gene in the yeast Saccharomyces cerevisiae. Mol Cell Biol16, 2878–2887.
[Lobrich and Jeggo, 2007] Lobrich, M. and Jeggo, P. A. (2007). The impact of a negligentG2/M checkpoint on genomic instability and cancer induction. Nat Rev Cancer 7, 861–869.
[Loppin et al., 2005] Loppin, B., Bonnefoy, E., Anselme, C., Laurencon, A., Karr, T. L. andCouble, P. (2005). The histone H3.3 chaperone HIRA is essential for chromatin assemblyin the male pronucleus. Nature 437, 1386–1390.
[Loyola and Almouzni, 2007] Loyola, A. and Almouzni, G. (2007). Marking histone H3 vari-ants: how, when and why? Trends Biochem Sci 32, 425–433.
[Loyola et al., 2006] Loyola, A., Bonaldi, T., Roche, D., Imhof, A. and Almouzni, G. (2006).PTMs on H3 variants before chromatin assembly potentiate their final epigenetic state.Mol Cell 24, 309–316.

186 Bibliography
[Loyola et al., 2009] Loyola, A., Tagami, H., Bonaldi, T., Roche, D., Quivy, J. P., Imhof, A.,Nakatani, Y., Dent, S. Y. R. and Almouzni, G. (2009). The HP1alpha-CAF1-SetDB1-containing complex provides H3K9me1 for Suv39-mediated K9me3 in pericentric hete-rochromatin. EMBO Rep 10, 769–775.
[Lucio-Eterovic et al., 2008] Lucio-Eterovic, A. K. B., Cortez, M. A. A., Valera, E. T., Motta,F. J. N., Queiroz, R. G. P., Machado, H. R., Carlotti, C. G., Neder, L., Scrideli, C. A. andTone, L. G. (2008). Differential expression of 12 histone deacetylase (HDAC) genes inastrocytomas and normal brain tissue: class II and IV are hypoexpressed in glioblastomas.BMC Cancer 8, 243.
[Luger et al., 1997] Luger, K., Mader, A. W., Richmond, R. K., Sargent, D. F. and Richmond,T. J. (1997). Crystal structure of the nucleosome core particle at 2.8 A resolution. Nature389, 251–260.
[Luger and Richmond, 1998] Luger, K. and Richmond, T. J. (1998). DNA binding within thenucleosome core. Curr Opin Struct Biol 8, 33–40.
[Luijsterburg et al., 2009] Luijsterburg, M. S., Dinant, C., Lans, H., Stap, J., Wiernasz, E.,Lagerwerf, S., Warmerdam, D. O., Lindh, M., Brink, M. C., Dobrucki, J. W., Aten,J. A., Fousteri, M. I., Jansen, G., Dantuma, N. P., Vermeulen, W., Mullenders, L. H. F.,Houtsmuller, A. B., Verschure, P. J. and van Driel, R. (2009). Heterochromatin protein 1 isrecruited to various types of DNA damage. J Cell Biol 185, 577–586.
[Lundby and Olsen, 2011] Lundby, A. and Olsen, J. V. (2011). GeLCMS for in-depth proteincharacterization and advanced analysis of proteomes. Methods Mol Biol 753, 143–155.
[Mace et al., 2007] Mace, G., Briot, D., Guervilly, J.-H. and Rosselli, F. (2007). [Fanconi ane-mia: cellular and molecular features]. Pathol Biol (Paris) 55, 19–28.
[Macek et al., 2009] Macek, B., Mann, M. and Olsen, J. V. (2009). Global and site-specificquantitative phosphoproteomics: principles and applications. Annu Rev Pharmacol Tox-icol 49, 199–221.
[Macht, 2009] Macht, M. (2009). Mass spectrometric top-down analysis of proteins. Bioanal-ysis 1, 1131–1148.
[Macurek et al., 2010] Macurek, L., Lindqvist, A., Voets, O., Kool, J., Vos, H. R. and Medema,R. H. (2010). Wip1 phosphatase is associated with chromatin and dephosphorylatesgammaH2AX to promote checkpoint inhibition. Oncogene 29, 2281–2291.
[Mahadevaiah et al., 2001] Mahadevaiah, S. K., Turner, J. M., Baudat, F., Rogakou, E. P.,de Boer, P., Blanco-Rodriguez, J., Jasin, M., Keeney, S., Bonner, W. M. and Burgoyne, P. S.(2001). Recombinational DNA double-strand breaks in mice precede synapsis. Nat Genet27, 271–276.
[Malik and Henikoff, 2003] Malik, H. S. and Henikoff, S. (2003). Phylogenomics of the nu-cleosome. Nat Struct Biol 10, 882–891.

187
[Malik and Henikoff, 2009] Malik, H. S. and Henikoff, S. (2009). Major evolutionary transi-tions in centromere complexity. Cell 138, 1067–1082.
[Mann, 2006] Mann, M. (2006). Functional and quantitative proteomics using SILAC. NatRev Mol Cell Biol 7, 952–958.
[Mann and Jensen, 2003] Mann, M. and Jensen, O. N. (2003). Proteomic analysis of post-translational modifications. Nat Biotechnol 21, 255–261.
[Mannironi et al., 1989] Mannironi, C., Bonner, W. M. and Hatch, C. L. (1989). H2A.X. ahistone isoprotein with a conserved C-terminal sequence, is encoded by a novel mRNAwith both DNA replication type and polyA 3’ processing signals. Nucleic Acids Res 17,9113–9126.
[Margueron et al., 2009] Margueron, R., Justin, N., Ohno, K., Sharpe, M. L., Son, J., Drury,W. J., Voigt, P., Martin, S. R., Taylor, W. R., Marco, V. D., Pirrotta, V., Reinberg, D. andGamblin, S. J. (2009). Role of the polycomb protein EED in the propagation of repressivehistone marks. Nature 461, 762–767.
[Marino-Ramirez et al., 2006] Marino-Ramirez, L., Jordan, I. K. and Landsman, D. (2006).Multiple independent evolutionary solutions to core histone gene regulation. GenomeBiol 7, R122.
[Marteijn et al., 2009] Marteijn, J. A., Bekker-Jensen, S., Mailand, N., Lans, H., Schwertman,P., Gourdin, A. M., Dantuma, N. P., Lukas, J. and Vermeulen, W. (2009). Nucleotide exci-sion repair-induced H2A ubiquitination is dependent on MDC1 and RNF8 and reveals auniversal DNA damage response. J Cell Biol 186, 835–847.
[Martin and Zhang, 2005] Martin, C. and Zhang, Y. (2005). The diverse functions of histonelysine methylation. Nat Rev Mol Cell Biol 6, 838–849.
[Martin et al., 2006] Martin, D. G. E., Baetz, K., Shi, X., Walter, K. L., MacDonald, V. E., Wlo-darski, M. J., Gozani, O., Hieter, P. and Howe, L. (2006). The Yng1p plant homeodomainfinger is a methyl-histone binding module that recognizes lysine 4-methylated histoneH3. Mol Cell Biol 26, 7871–7879.
[Martinez et al., 2008] Martinez, A., Hinz, J. M., Gomez, L., Molina, B., Acuna, H., Jones,I. M., Frias, S. and Coleman, M. A. (2008). Differential expression of TP53 associatedgenes in Fanconi anemia cells after mitomycin C and hydroxyurea treatment. Mutat Res656, 1–7.
[Marzluff and Pandey, 1988] Marzluff, W. F. and Pandey, N. B. (1988). Multiple regulatorysteps control histone mRNA concentrations. Trends Biochem Sci 13, 49–52.
[Mateescu et al., 2004] Mateescu, B., England, P., Halgand, F., Yaniv, M. and Muchardt, C.(2004). Tethering of HP1 proteins to chromatin is relieved by phosphoacetylation of his-tone H3. EMBO Rep 5, 490–496.

188 Bibliography
[Mathew, 2006] Mathew, C. G. (2006). Fanconi anaemia genes and susceptibility to cancer.Oncogene 25, 5875–5884.
[Matsuoka et al., 2007] Matsuoka, S., Ballif, B. A., Smogorzewska, A., McDonald, E. R.,Hurov, K. E., Luo, J., Bakalarski, C. E., Zhao, Z., Solimini, N., Lerenthal, Y., Shiloh, Y.,Gygi, S. P. and Elledge, S. J. (2007). ATM and ATR substrate analysis reveals extensiveprotein networks responsive to DNA damage. Science 316, 1160–1166.
[Maurer-Stroh et al., 2003] Maurer-Stroh, S., Dickens, N. J., Hughes-Davies, L., Kouzarides,T., Eisenhaber, F. and Ponting, C. P. (2003). The Tudor domain ’Royal Family’: Tudor, plantAgenet, Chromo, PWWP and MBT domains. Trends Biochem Sci 28, 69–74.
[McKittrick et al., 2004] McKittrick, E., Gafken, P. R., Ahmad, K. and Henikoff, S. (2004). Hi-stone H3.3 is enriched in covalent modifications associated with active chromatin. ProcNatl Acad Sci U S A 101, 1525–1530.
[Medzihradszky et al., 2004] Medzihradszky, K. F., Zhang, X., Chalkley, R. J., Guan, S., Mc-Farland, M. A., Chalmers, M. J., Marshall, A. G., Diaz, R. L., Allis, C. D. and Burlingame,A. L. (2004). Characterization of Tetrahymena histone H2B variants and posttranslationalpopulations by electron capture dissociation (ECD) Fourier transform ion cyclotron massspectrometry (FT-ICR MS). Mol Cell Proteomics 3, 872–886.
[Melander et al., 2008] Melander, F., Bekker-Jensen, S., Falck, J., Bartek, J., Mailand, N. andLukas, J. (2008). Phosphorylation of SDT repeats in the MDC1 N terminus triggers reten-tion of NBS1 at the DNA damage-modified chromatin. J Cell Biol 181, 213–226.
[Mello et al., 2002] Mello, J. A., Sillje, H. H. W., Roche, D. M. J., Kirschner, D. B., Nigg, E. A.and Almouzni, G. (2002). Human Asf1 and CAF-1 interact and synergize in a repair-coupled nucleosome assembly pathway. EMBO Rep 3, 329–334.
[Mellone and Allshire, 2003] Mellone, B. G. and Allshire, R. C. (2003). Stretching it: puttingthe CEN(P-A) in centromere. Curr Opin Genet Dev 13, 191–198.
[Mendez-Acuna et al., 2010] Mendez-Acuna, L., Tomaso, M. V. D., Palitti, F. and Martinez-Lopez, W. (2010). Histone post-translational modifications in DNA damage response.Cytogenet Genome Res 128, 28–36.
[Mermoud et al., 1999] Mermoud, J. E., Costanzi, C., Pehrson, J. R. and Brockdorff, N. (1999).Histone macroH2A1.2 relocates to the inactive X chromosome after initiation and propa-gation of X-inactivation. J Cell Biol 147, 1399–1408.
[Metzger et al., 2005] Metzger, E., Wissmann, M., Yin, N., Muller, J. M., Schneider, R., Peters,A. H. F. M., Gunther, T., Buettner, R. and Schule, R. (2005). LSD1 demethylates repressivehistone marks to promote androgen-receptor-dependent transcription. Nature 437, 436–439.
[Miller et al., 2010] Miller, K. M., Tjeertes, J. V., Coates, J., Legube, G., Polo, S. E., Britton,S. and Jackson, S. P. (2010). Human HDAC1 and HDAC2 function in the DNA-damage

189
response to promote DNA nonhomologous end-joining. Nat Struct Mol Biol 17, 1144–1151.
[Mito et al., 2005] Mito, Y., Henikoff, J. G. and Henikoff, S. (2005). Genome-scale profiling ofhistone H3.3 replacement patterns. Nat Genet 37, 1090–1097.
[Mito et al., 2007] Mito, Y., Henikoff, J. G. and Henikoff, S. (2007). Histone replacementmarks the boundaries of cis-regulatory domains. Science 315, 1408–1411.
[Miyagi and Rao, 2007] Miyagi, M. and Rao, K. C. S. (2007). Proteolytic 18O-labeling strate-gies for quantitative proteomics. Mass Spectrom Rev 26, 121–136.
[Mizzen and McLachlan, 2000] Mizzen, C. A. and McLachlan, D. R. (2000). Capillary elec-trophoresis of histone H1 variants at neutral pH in dynamically modified fused- silicatubing. Electrophoresis 21, 2359–2367.
[Mizzen et al., 1996] Mizzen, C. A., Yang, X. J., Kokubo, T., Brownell, J. E., Bannister, A. J.,Owen-Hughes, T., Workman, J., Wang, L., Berger, S. L., Kouzarides, T., Nakatani, Y. andAllis, C. D. (1996). The TAF(II)250 subunit of TFIID has histone acetyltransferase activity.Cell 87, 1261–1270.
[Moldovan and D’Andrea, 2009] Moldovan, G.-L. and D’Andrea, A. D. (2009). How the fan-coni anemia pathway guards the genome. Annu Rev Genet 43, 223–249.
[Monetti et al., 2011] Monetti, M., Nagaraj, N., Sharma, K. and Mann, M. (2011). Large-scalephosphosite quantification in tissues by a spike-in SILAC method. Nat Methods 8, 655–658.
[Morillo-Huesca et al., 2010] Morillo-Huesca, M., Clemente-Ruiz, M., Andujar, E. andPrado, F. (2010). The SWR1 histone replacement complex causes genetic instability andgenome-wide transcription misregulation in the absence of H2A.Z. PLoS One 5, e12143.
[Morris et al., 2007] Morris, S. A., Rao, B., Garcia, B. A., Hake, S. B., Diaz, R. L., Shabanowitz,J., Hunt, D. F., Allis, C. D., Lieb, J. D. and Strahl, B. D. (2007). Identification of histone H3lysine 36 acetylation as a highly conserved histone modification. J Biol Chem 282, 7632–7640.
[Mosammaparast and Shi, 2010] Mosammaparast, N. and Shi, Y. (2010). Reversal of histonemethylation: biochemical and molecular mechanisms of histone demethylases. Annu RevBiochem 79, 155–179.
[Mujtaba et al., 2007] Mujtaba, S., Zeng, L. and Zhou, M.-M. (2007). Structure and acetyl-lysine recognition of the bromodomain. Oncogene 26, 5521–5527.
[Mukherjee et al., 2006] Mukherjee, B., Kessinger, C., Kobayashi, J., Chen, B. P. C., Chen,D. J., Chatterjee, A. and Burma, S. (2006). DNA-PK phosphorylates histone H2AX duringapoptotic DNA fragmentation in mammalian cells. DNA Repair (Amst) 5, 575–590.

190 Bibliography
[Munro et al., 2010] Munro, S., Khaire, N., Inche, A., Carr, S. and Thangue, N. B. L. (2010).Lysine methylation regulates the pRb tumour suppressor protein. Oncogene 29, 2357–2367.
[Murr et al., 2006] Murr, R., Loizou, J. I., Yang, Y.-G., Cuenin, C., Li, H., Wang, Z.-Q. andHerceg, Z. (2006). Histone acetylation by Trrap-Tip60 modulates loading of repair proteinsand repair of DNA double-strand breaks. Nat Cell Biol 8, 91–99.
[Nakayama et al., 2007] Nakayama, T., Nishioka, K., Dong, Y.-X., Shimojima, T. and Hirose,S. (2007). Drosophila GAGA factor directs histone H3.3 replacement that prevents theheterochromatin spreading. Genes Dev 21, 552–561.
[Navajas et al., 2011] Navajas, R., Paradela, A. and Albar, J. P. (2011). Immobilized metalaffinity chromatography/reversed-phase enrichment of phosphopeptides and analysis byCID/ETD tandem mass spectrometry. Methods Mol Biol 681, 337–348.
[NEELIN and CONNELL, 1959] NEELIN, J. M. and CONNELL, G. E. (1959). Zone elec-trophoresis of chicken-erythrocyte histone in starch gel. Biochim Biophys Acta 31, 539–541.
[NEELIN and NEELIN, 1960] NEELIN, J. M. and NEELIN, E. M. (1960). Zone electrophore-sis of calf thymus histone in starch gel. Can J Biochem Physiol 38, 355–363.
[Nelson et al., 2006] Nelson, C. J., Santos-Rosa, H. and Kouzarides, T. (2006). Proline iso-merization of histone H3 regulates lysine methylation and gene expression. Cell 126,905–916.
[Ng et al., 2002] Ng, H. H., Feng, Q., Wang, H., Erdjument-Bromage, H., Tempst, P., Zhang,Y. and Struhl, K. (2002). Lysine methylation within the globular domain of histone H3by Dot1 is important for telomeric silencing and Sir protein association. Genes Dev 16,1518–1527.
[Ng et al., 2009] Ng, S. S., Yue, W. W., Oppermann, U. and Klose, R. J. (2009). Dynamicprotein methylation in chromatin biology. Cell Mol Life Sci 66, 407–422.
[Nicklay et al., 2009] Nicklay, J. J., Shechter, D., Chitta, R. K., Garcia, B. A., Shabanowitz,J., Allis, C. D. and Hunt, D. F. (2009). Analysis of histones in Xenopus laevis. II. massspectrometry reveals an index of cell type-specific modifications on H3 and H4. J BiolChem 284, 1075–1085.
[Niedernhofer et al., 2005] Niedernhofer, L. J., Lalai, A. S. and Hoeijmakers, J. H. J. (2005).Fanconi anemia (cross)linked to DNA repair. Cell 123, 1191–1198.
[Niedzwiedz et al., 2004] Niedzwiedz, W., Mosedale, G., Johnson, M., Ong, C. Y., Pace, P.and Patel, K. J. (2004). The Fanconi anaemia gene FANCC promotes homologous recom-bination and error-prone DNA repair. Mol Cell 15, 607–620.
[Niida and Nakanishi, 2006] Niida, H. and Nakanishi, M. (2006). DNA damage checkpointsin mammals. Mutagenesis 21, 3–9.

191
[Nishioka et al., 2002a] Nishioka, K., Chuikov, S., Sarma, K., Erdjument-Bromage, H., Allis,C. D., Tempst, P. and Reinberg, D. (2002a). Set9, a novel histone H3 methyltransferase thatfacilitates transcription by precluding histone tail modifications required for heterochro-matin formation. Genes Dev 16, 479–489.
[Nishioka et al., 2002b] Nishioka, K., Rice, J. C., Sarma, K., Erdjument-Bromage, H., Werner,J., Wang, Y., Chuikov, S., Valenzuela, P., Tempst, P., Steward, R., Lis, J. T., Allis, C. D. andReinberg, D. (2002b). PR-Set7 is a nucleosome-specific methyltransferase that modifieslysine 20 of histone H4 and is associated with silent chromatin. Mol Cell 9, 1201–1213.
[Niu et al., 2010] Niu, N., Qin, Y., Fridley, B. L., Hou, J., Kalari, K. R., Zhu, M., Wu, T.-Y.,Jenkins, G. D., Batzler, A. and Wang, L. (2010). Radiation pharmacogenomics: a genome-wide association approach to identify radiation response biomarkers using human lym-phoblastoid cell lines. Genome Res 20, 1482–1492.
[Oda et al., 1999] Oda, Y., Huang, K., Cross, F. R., Cowburn, D. and Chait, B. T. (1999). Accu-rate quantitation of protein expression and site-specific phosphorylation. Proc Natl AcadSci U S A 96, 6591–6596.
[Ogryzko, 2001] Ogryzko, V. V. (2001). Mammalian histone acetyltransferases and theircomplexes. Cell Mol Life Sci 58, 683–692.
[Ogryzko, 2008] Ogryzko, V. V. (2008). Erwin Schroedinger, Francis Crick and epigeneticstability. Biol Direct 3, 15.
[Ogryzko et al., 1996] Ogryzko, V. V., Schiltz, R. L., Russanova, V., Howard, B. H. andNakatani, Y. (1996). The transcriptional coactivators p300 and CBP are histone acetyl-transferases. Cell 87, 953–959.
[Okuwaki et al., 2005] Okuwaki, M., Kato, K., Shimahara, H., ichi Tate, S. and Nagata, K.(2005). Assembly and disassembly of nucleosome core particles containing histone vari-ants by human nucleosome assembly protein I. Mol Cell Biol 25, 10639–10651.
[Olsen et al., 2006] Olsen, J. V., Blagoev, B., Gnad, F., Macek, B., Kumar, C., Mortensen, P. andMann, M. (2006). Global, in vivo, and site-specific phosphorylation dynamics in signalingnetworks. Cell 127, 635–648.
[Olsen et al., 2010] Olsen, J. V., Vermeulen, M., Santamaria, A., Kumar, C., Miller, M. L.,Jensen, L. J., Gnad, F., Cox, J., Jensen, T. S., Nigg, E. A., Brunak, S. and Mann, M. (2010).Quantitative phosphoproteomics reveals widespread full phosphorylation site occupancyduring mitosis. Sci Signal 3, ra3.
[Ong and Corces, 2009] Ong, C.-T. and Corces, V. G. (2009). Insulators as mediators of intra-and inter-chromosomal interactions: a common evolutionary theme. J Biol 8, 73.
[Ong et al., 2002] Ong, S.-E., Blagoev, B., Kratchmarova, I., Kristensen, D. B., Steen, H.,Pandey, A. and Mann, M. (2002). Stable isotope labeling by amino acids in cell culture,SILAC, as a simple and accurate approach to expression proteomics. Mol Cell Proteomics1, 376–386.

192 Bibliography
[Ong et al., 2003] Ong, S.-E., Kratchmarova, I. and Mann, M. (2003). Properties of 13C-substituted arginine in stable isotope labeling by amino acids in cell culture (SILAC). JProteome Res 2, 173–181.
[Ong and Mann, 2005] Ong, S.-E. and Mann, M. (2005). Mass spectrometry-based pro-teomics turns quantitative. Nat Chem Biol 1, 252–262.
[Ong and Mann, 2006] Ong, S.-E. and Mann, M. (2006). A practical recipe for stable isotopelabeling by amino acids in cell culture (SILAC). Nat Protoc 1, 2650–2660.
[Ong et al., 2004] Ong, S.-E., Mittler, G. and Mann, M. (2004). Identifying and quantifyingin vivo methylation sites by heavy methyl SILAC. Nat Methods 1, 119–126.
[Ooi et al., 2010] Ooi, S. L., Henikoff, J. G. and Henikoff, S. (2010). A native chromatin pu-rification system for epigenomic profiling in Caenorhabditis elegans. Nucleic Acids Res38, e26.
[Ooi et al., 2006] Ooi, S. L., Priess, J. R. and Henikoff, S. (2006). Histone H3.3 variant dynam-ics in the germline of Caenorhabditis elegans. PLoS Genet 2, e97.
[Ouararhni et al., 2006] Ouararhni, K., Hadj-Slimane, R., Ait-Si-Ali, S., Robin, P., Mietton,F., Harel-Bellan, A., Dimitrov, S. and Hamiche, A. (2006). The histone variant mH2A1.1interferes with transcription by down-regulating PARP-1 enzymatic activity. Genes Dev20, 3324–3336.
[Owen et al., 2000] Owen, D. J., Ornaghi, P., Yang, J. C., Lowe, N., Evans, P. R., Ballario, P.,Neuhaus, D., Filetici, P. and Travers, A. A. (2000). The structural basis for the recognitionof acetylated histone H4 by the bromodomain of histone acetyltransferase gcn5p. EMBOJ 19, 6141–6149.
[Ozdag et al., 2006] Ozdag, H., Teschendorff, A. E., Ahmed, A. A., Hyland, S. J., Blenkiron,C., Bobrow, L., Veerakumarasivam, A., Burtt, G., Subkhankulova, T., Arends, M. J., Collins,V. P., Bowtell, D., Kouzarides, T., Brenton, J. D. and Caldas, C. (2006). Differential expres-sion of selected histone modifier genes in human solid cancers. BMC Genomics 7, 90.
[Palmer et al., 1991] Palmer, D. K., O’Day, K., Trong, H. L., Charbonneau, H. and Margolis,R. L. (1991). Purification of the centromere-specific protein CENP-A and demonstrationthat it is a distinctive histone. Proc Natl Acad Sci U S A 88, 3734–3738.
[Park et al., 2006a] Park, J.-H., Park, E.-J., Lee, H.-S., Kim, S. J., Hur, S.-K., Imbalzano, A. N.and Kwon, J. (2006a). Mammalian SWI/SNF complexes facilitate DNA double-strandbreak repair by promoting gamma-H2AX induction. EMBO J 25, 3986–3997.
[Park et al., 2006b] Park, K.-S., Mohapatra, D. P., Misonou, H. and Trimmer, J. S. (2006b).Graded regulation of the Kv2.1 potassium channel by variable phosphorylation. Science313, 976–979.

193
[Park et al., 2004] Park, Y.-J., Dyer, P. N., Tremethick, D. J. and Luger, K. (2004). A new fluo-rescence resonance energy transfer approach demonstrates that the histone variant H2AZstabilizes the histone octamer within the nucleosome. J Biol Chem 279, 24274–24282.
[Parks et al., 2007] Parks, B. A., Jiang, L., Thomas, P. M., Wenger, C. D., Roth, M. J., Boyne,M. T., Burke, P. V., Kwast, K. E. and Kelleher, N. L. (2007). Top-down proteomics on a chro-matographic time scale using linear ion trap fourier transform hybrid mass spectrometers.Anal Chem 79, 7984–7991.
[Parthun, 2007] Parthun, M. R. (2007). Hat1: the emerging cellular roles of a type B histoneacetyltransferase. Oncogene 26, 5319–5328.
[Paull et al., 2000] Paull, T. T., Rogakou, E. P., Yamazaki, V., Kirchgessner, C. U., Gellert, M.and Bonner, W. M. (2000). A critical role for histone H2AX in recruitment of repair factorsto nuclear foci after DNA damage. Curr Biol 10, 886–895.
[Pawson et al., 2001] Pawson, T., Gish, G. D. and Nash, P. (2001). SH2 domains, interactionmodules and cellular wiring. Trends Cell Biol 11, 504–511.
[Pehrson et al., 1997] Pehrson, J. R., Costanzi, C. and Dharia, C. (1997). Developmental andtissue expression patterns of histone macroH2A1 subtypes. J Cell Biochem 65, 107–113.
[Pehrson and Fuji, 1998] Pehrson, J. R. and Fuji, R. N. (1998). Evolutionary conservation ofhistone macroH2A subtypes and domains. Nucleic Acids Res 26, 2837–2842.
[Perkel, 2009] Perkel, J. M. (2009). iTRAQ gets put to the test. J Proteome Res 8, 4885.
[Perpelescu and Fukagawa, 2011] Perpelescu, M. and Fukagawa, T. (2011). The ABCs ofCENPs. Chromosoma 412.
[Pesavento et al., 2008] Pesavento, J. J., Bullock, C. R., LeDuc, R. D., Mizzen, C. A. and Kelle-her, N. L. (2008). Combinatorial modification of human histone H4 quantitated by two-dimensional liquid chromatography coupled with top down mass spectrometry. J BiolChem 283, 14927–14937.
[Pesavento et al., 2007] Pesavento, J. J., Garcia, B. A., Streeky, J. A., Kelleher, N. L. andMizzen, C. A. (2007). Mild performic acid oxidation enhances chromatographic and topdown mass spectrometric analyses of histones. Mol Cell Proteomics 6, 1510–1526.
[Pesavento et al., 2004] Pesavento, J. J., Kim, Y.-B., Taylor, G. K. and Kelleher, N. L. (2004).Shotgun annotation of histone modifications: a new approach for streamlined characteri-zation of proteins by top down mass spectrometry. J Am Chem Soc 126, 3386–3387.
[Pesavento et al., 2006] Pesavento, J. J., Mizzen, C. A. and Kelleher, N. L. (2006). Quantitativeanalysis of modified proteins and their positional isomers by tandem mass spectrometry:human histone H4. Anal Chem 78, 4271–4280.
[Pesavento et al., 2008] Pesavento, J. J., Yang, H., Kelleher, N. L. and Mizzen, C. A. (2008).Certain and progressive methylation of histone H4 at lysine 20 during the cell cycle. MolCell Biol 28, 468–486.

194 Bibliography
[Peters et al., 2003] Peters, A. H. F. M., Kubicek, S., Mechtler, K., O’Sullivan, R. J., Derijck, A.A. H. A., Perez-Burgos, L., Kohlmaier, A., Opravil, S., Tachibana, M., Shinkai, Y., Martens,J. H. A. and Jenuwein, T. (2003). Partitioning and plasticity of repressive histone methyla-tion states in mammalian chromatin. Mol Cell 12, 1577–1589.
[Petersen et al., 2001] Petersen, S., Casellas, R., Reina-San-Martin, B., Chen, H. T., Difilippan-tonio, M. J., Wilson, P. C., Hanitsch, L., Celeste, A., Muramatsu, M., Pilch, D. R., Redon,C., Ried, T., Bonner, W. M., Honjo, T., Nussenzweig, M. C. and Nussenzweig, A. (2001).AID is required to initiate Nbs1/gamma-H2AX focus formation and mutations at sites ofclass switching. Nature 414, 660–665.
[Petrie et al., 2003] Petrie, K., Guidez, F., Howell, L., Healy, L., Waxman, S., Greaves, M. andZelent, A. (2003). The histone deacetylase 9 gene encodes multiple protein isoforms. J BiolChem 278, 16059–16072.
[Phanstiel et al., 2008] Phanstiel, D., Brumbaugh, J., Berggren, W. T., Conard, K., Feng, X.,Levenstein, M. E., McAlister, G. C., Thomson, J. A. and Coon, J. J. (2008). Mass spec-trometry identifies and quantifies 74 unique histone H4 isoforms in differentiating humanembryonic stem cells. Proc Natl Acad Sci U S A 105, 4093–4098.
[PHILLIPS, 1963] PHILLIPS, D. M. (1963). The presence of acetyl groups of histones.Biochem J 87, 258–263.
[Pina and Suau, 1987] Pina, B. and Suau, P. (1987). Changes in histones H2A and H3 variantcomposition in differentiating and mature rat brain cortical neurons. Dev Biol 123, 51–58.
[Plans et al., 2006] Plans, V., Scheper, J., Soler, M., Loukili, N., Okano, Y. and Thomson, T. M.(2006). The RING finger protein RNF8 recruits UBC13 for lysine 63-based self polyubiq-uitylation. J Cell Biochem 97, 572–582.
[Plazas-Mayorca et al., 2009] Plazas-Mayorca, M. D., Zee, B. M., Young, N. L., Fingerman,I. M., LeRoy, G., Briggs, S. D. and Garcia, B. A. (2009). One-pot shotgun quantitative massspectrometry characterization of histones. J Proteome Res 8, 5367–5374.
[Polo et al., 2006] Polo, S. E., Roche, D. and Almouzni, G. (2006). New histone incorporationmarks sites of UV repair in human cells. Cell 127, 481–493.
[Popanda et al., 2009] Popanda, O., Marquardt, J. U., Chang-Claude, J. and Schmezer, P.(2009). Genetic variation in normal tissue toxicity induced by ionizing radiation. Mu-tat Res 667, 58–69.
[Prakash et al., 2005] Prakash, S., Johnson, R. E. and Prakash, L. (2005). Eukaryotic transle-sion synthesis DNA polymerases: specificity of structure and function. Annu RevBiochem 74, 317–353.
[Prokhorova et al., 2009] Prokhorova, T. A., Rigbolt, K. T. G., Johansen, P. T., Henningsen, J.,Kratchmarova, I., Kassem, M. and Blagoev, B. (2009). Stable isotope labeling by aminoacids in cell culture (SILAC) and quantitative comparison of the membrane proteomes of

195
self-renewing and differentiating human embryonic stem cells. Mol Cell Proteomics 8,959–970.
[Pugh et al., 2009] Pugh, T. J., Keyes, M., Barclay, L., Delaney, A., Krzywinski, M., Thomas,D., Novik, K., Yang, C., Agranovich, A., McKenzie, M., Morris, W. J., Olive, P. L., Marra,M. A. and Moore, R. A. (2009). Sequence variant discovery in DNA repair genes fromradiosensitive and radiotolerant prostate brachytherapy patients. Clin Cancer Res 15,5008–5016.
[Ramos-Fernandez et al., 2007] Ramos-Fernandez, A., Lopez-Ferrer, D. and Vazquez, J.(2007). Improved method for differential expression proteomics using trypsin-catalyzed18O labeling with a correction for labeling efficiency. Mol Cell Proteomics 6, 1274–1286.
[Ramus et al., 2006] Ramus, C., de Peredo, A. G., Dahout, C., Gallagher, M. and Garin, J.(2006). An optimized strategy for ICAT quantification of membrane proteins. Mol CellProteomics 5, 68–78.
[Rangasamy et al., 2003] Rangasamy, D., Berven, L., Ridgway, P. and Tremethick, D. J. (2003).Pericentric heterochromatin becomes enriched with H2A.Z during early mammalian de-velopment. EMBO J 22, 1599–1607.
[Ransom et al., 2010] Ransom, M., Dennehey, B. K. and Tyler, J. K. (2010). Chaperoning his-tones during DNA replication and repair. Cell 140, 183–195.
[Raschle et al., 2008] Raschle, M., Knipscheer, P., Enoiu, M., Angelov, T., Sun, J., Griffith, J. D.,Ellenberger, T. E., Scharer, O. D. and Walter, J. C. (2008). Mechanism of replication-coupledDNA interstrand crosslink repair. Cell 134, 969–980.
[Rashi-Elkeles et al., 2011] Rashi-Elkeles, S., Elkon, R., Shavit, S., Lerenthal, Y., Linhart, C.,Kupershtein, A., Amariglio, N., Rechavi, G., Shamir, R. and Shiloh, Y. (2011). Transcrip-tional modulation induced by ionizing radiation: p53 remains a central player. Mol Oncol5.
[Rea et al., 2000] Rea, S., Eisenhaber, F., O’Carroll, D., Strahl, B. D., Sun, Z. W., Schmid, M.,Opravil, S., Mechtler, K., Ponting, C. P., Allis, C. D. and Jenuwein, T. (2000). Regulation ofchromatin structure by site-specific histone H3 methyltransferases. Nature 406, 593–599.
[Redon et al., 2002] Redon, C., Pilch, D., Rogakou, E., Sedelnikova, O., Newrock, K. and Bon-ner, W. (2002). Histone H2A variants H2AX and H2AZ. Curr Opin Genet Dev 12, 162–169.
[Reese et al., 2003] Reese, B. E., Bachman, K. E., Baylin, S. B. and Rountree, M. R. (2003). Themethyl-CpG binding protein MBD1 interacts with the p150 subunit of chromatin assem-bly factor 1. Mol Cell Biol 23, 3226–3236.
[Reitsema et al., 2005] Reitsema, T., Klokov, D., Banath, J. P. and Olive, P. L. (2005). DNA-PKis responsible for enhanced phosphorylation of histone H2AX under hypertonic condi-tions. DNA Repair (Amst) 4, 1172–1181.

196 Bibliography
[Ren and Gorovsky, 2001] Ren, Q. and Gorovsky, M. A. (2001). Histone H2A.Z acetylationmodulates an essential charge patch. Mol Cell 7, 1329–1335.
[Ren and Gorovsky, 2003] Ren, Q. and Gorovsky, M. A. (2003). The nonessential H2A N-terminal tail can function as an essential charge patch on the H2A.Z variant N-terminaltail. Mol Cell Biol 23, 2778–2789.
[Reynolds et al., 2002] Reynolds, K. J., Yao, X. and Fenselau, C. (2002). Proteolytic 18O label-ing for comparative proteomics: evaluation of endoprotease Glu-C as the catalytic agent.J Proteome Res 1, 27–33.
[Ridgway et al., 2004] Ridgway, P., Brown, K. D., Rangasamy, D., Svensson, U. and Treme-thick, D. J. (2004). Unique residues on the H2A.Z containing nucleosome surface are im-portant for Xenopus laevis development. J Biol Chem 279, 43815–43820.
[Rigbolt et al., 2011] Rigbolt, K. T. G., Prokhorova, T. A., Akimov, V., Henningsen, J., Jo-hansen, P. T., Kratchmarova, I., Kassem, M., Mann, M., Olsen, J. V. and Blagoev, B. (2011).System-wide temporal characterization of the proteome and phosphoproteome of humanembryonic stem cell differentiation. Sci Signal 4, rs3.
[Robinson et al., 2006] Robinson, P. J. J., Fairall, L., Huynh, V. A. T. and Rhodes, D. (2006).EM measurements define the dimensions of the "30-nm" chromatin fiber: evidence for acompact, interdigitated structure. Proc Natl Acad Sci U S A 103, 6506–6511.
[Robinson and Rhodes, 2006] Robinson, P. J. J. and Rhodes, D. (2006). Structure of the ’30nm’ chromatin fibre: a key role for the linker histone. Curr Opin Struct Biol 16, 336–343.
[Rogakou et al., 1998] Rogakou, E. P., Pilch, D. R., Orr, A. H., Ivanova, V. S. and Bonner,W. M. (1998). DNA double-stranded breaks induce histone H2AX phosphorylation onserine 139. J Biol Chem 273, 5858–5868.
[Rose et al., 1983] Rose, K., Simona, M. G., Offord, R. E., Prior, C. P., Otto, B. and Thatcher,D. R. (1983). A new mass-spectrometric C-terminal sequencing technique finds a simi-larity between gamma-interferon and alpha 2-interferon and identifies a proteolyticallyclipped gamma-interferon that retains full antiviral activity. Biochem J 215, 273–277.
[Ross et al., 2004] Ross, P. L., Huang, Y. N., Marchese, J. N., Williamson, B., Parker, K., Hat-tan, S., Khainovski, N., Pillai, S., Dey, S., Daniels, S., Purkayastha, S., Juhasz, P., Martin,S., Bartlet-Jones, M., He, F., Jacobson, A. and Pappin, D. J. (2004). Multiplexed proteinquantitation in Saccharomyces cerevisiae using amine-reactive isobaric tagging reagents.Mol Cell Proteomics 3, 1154–1169.
[Rosselli et al., 2003] Rosselli, F., Briot, D. and Pichierri, P. (2003). The Fanconi anemia path-way and the DNA interstrand cross-links repair. Biochimie 85, 1175–1184.
[Ryan et al., 1998] Ryan, M. P., Jones, R. and Morse, R. H. (1998). SWI-SNF complex partic-ipation in transcriptional activation at a step subsequent to activator binding. Mol CellBiol 18, 1774–1782.

197
[Sakai et al., 2009] Sakai, A., Schwartz, B. E., Goldstein, S. and Ahmad, K. (2009). Transcrip-tional and developmental functions of the H3.3 histone variant in Drosophila. Curr Biol19, 1816–1820.
[Santaguida and Musacchio, 2009] Santaguida, S. and Musacchio, A. (2009). The life andmiracles of kinetochores. EMBO J 28, 2511–2531.
[Santisteban et al., 2000] Santisteban, M. S., Kalashnikova, T. and Smith, M. M. (2000). His-tone H2A.Z regulats transcription and is partially redundant with nucleosome remodel-ing complexes. Cell 103, 411–422.
[Santos-Rosa et al., 2009] Santos-Rosa, H., Kirmizis, A., Nelson, C., Bartke, T., Saksouk, N.,Cote, J. and Kouzarides, T. (2009). Histone H3 tail clipping regulates gene expression. NatStruct Mol Biol 16, 17–22.
[Santos-Rosa et al., 2002] Santos-Rosa, H., Schneider, R., Bannister, A. J., Sherriff, J., Bern-stein, B. E., Emre, N. C. T., Schreiber, S. L., Mellor, J. and Kouzarides, T. (2002). Activegenes are tri-methylated at K4 of histone H3. Nature 419, 407–411.
[Sarg et al., 2006] Sarg, B., Helliger, W., Talasz, H., Förg, B. and Lindner, H. H. (2006). Hi-stone H1 phosphorylation occurs site-specifically during interphase and mitosis: identifi-cation of a novel phosphorylation site on histone H1. J Biol Chem 281, 6573–6580.
[Sarg et al., 2004] Sarg, B., Helliger, W., Talasz, H., Koutzamani, E. and Lindner, H. H. (2004).Histone H4 hyperacetylation precludes histone H4 lysine 20 trimethylation. J Biol Chem279, 53458–53464.
[Sarg et al., 2002] Sarg, B., Koutzamani, E., Helliger, W., Rundquist, I. and Lindner, H. H.(2002). Postsynthetic trimethylation of histone H4 at lysine 20 in mammalian tissues isassociated with aging. J Biol Chem 277, 39195–39201.
[Sarraf and Stancheva, 2004] Sarraf, S. A. and Stancheva, I. (2004). Methyl-CpG binding pro-tein MBD1 couples histone H3 methylation at lysine 9 by SETDB1 to DNA replication andchromatin assembly. Mol Cell 15, 595–605.
[Savic et al., 2009] Savic, V., Yin, B., Maas, N. L., Bredemeyer, A. L., Carpenter, A. C.,Helmink, B. A., Yang-Iott, K. S., Sleckman, B. P. and Bassing, C. H. (2009). Formationof dynamic gamma-H2AX domains along broken DNA strands is distinctly regulated byATM and MDC1 and dependent upon H2AX densities in chromatin. Mol Cell 34, 298–310.
[Schalch et al., 2005] Schalch, T., Duda, S., Sargent, D. F. and Richmond, T. J. (2005). X-raystructure of a tetranucleosome and its implications for the chromatin fibre. Nature 436,138–141.
[Scharer, 2005] Scharer, O. D. (2005). DNA interstrand crosslinks: natural and drug-inducedDNA adducts that induce unique cellular responses. Chembiochem 6, 27–32.

198 Bibliography
[Schmidt et al., 2005] Schmidt, A., Kellermann, J. and Lottspeich, F. (2005). A novel strategyfor quantitative proteomics using isotope-coded protein labels. Proteomics 5, 4–15.
[Schneider et al., 2004a] Schneider, R., Bannister, A. J., Myers, F. A., Thorne, A. W., Crane-Robinson, C. and Kouzarides, T. (2004a). Histone H3 lysine 4 methylation patterns inhigher eukaryotic genes. Nat Cell Biol 6, 73–77.
[Schneider et al., 2004b] Schneider, R., Bannister, A. J., Weise, C. and Kouzarides, T. (2004b).Direct binding of INHAT to H3 tails disrupted by modifications. J Biol Chem 279, 23859–23862.
[Scott et al., 1976] Scott, B. R., Pathak, M. A. and Mohn, G. R. (1976). Molecular and geneticbasis of furocoumarin reactions. Mutat Res 39, 29–74.
[Seligson et al., 2009] Seligson, D. B., Horvath, S., McBrian, M. A., Mah, V., Yu, H., Tze, S.,Wang, Q., Chia, D., Goodglick, L. and Kurdistani, S. K. (2009). Global levels of histonemodifications predict prognosis in different cancers. Am J Pathol 174, 1619–1628.
[Seligson et al., 2005] Seligson, D. B., Horvath, S., Shi, T., Yu, H., Tze, S., Grunstein, M. andKurdistani, S. K. (2005). Global histone modification patterns predict risk of prostate can-cer recurrence. Nature 435, 1262–1266.
[Shevchenko et al., 1996] Shevchenko, A., Wilm, M., Vorm, O. and Mann, M. (1996). Massspectrometric sequencing of proteins silver-stained polyacrylamide gels. Anal Chem 68,850–858.
[Shi et al., 2006] Shi, X., Hong, T., Walter, K. L., Ewalt, M., Michishita, E., Hung, T., Carney,D., Pena, P., Lan, F., Kaadige, M. R., Lacoste, N., Cayrou, C., Davrazou, F., Saha, A., Cairns,B. R., Ayer, D. E., Kutateladze, T. G., Shi, Y., Jacques Cote, J., Chua, K. F. and Gozani, O.(2006). ING2 PHD domain links histone H3 lysine 4 methylation to active gene repression.Nature 442, 96–99.
[Shi et al., 2004] Shi, Y., Lan, F., Matson, C., Mulligan, P., Whetstine, J. R., Cole, P. A., Casero,R. A. and Shi, Y. (2004). Histone demethylation mediated by the nuclear amine oxidasehomolog LSD1. Cell 119, 941–953.
[Shibahara and Stillman, 1999] Shibahara, K. and Stillman, B. (1999). Replication-dependentmarking of DNA by PCNA facilitates CAF-1-coupled inheritance of chromatin. Cell 96,575–585.
[Shiio and Aebersold, 2006] Shiio, Y. and Aebersold, R. (2006). Quantitative proteome anal-ysis using isotope-coded affinity tags and mass spectrometry. Nat Protoc 1, 139–145.
[Shim et al., 2007] Shim, E. Y., Hong, S. J., Oum, J.-H., Yanez, Y., Zhang, Y. and Lee, S. E.(2007). RSC mobilizes nucleosomes to improve accessibility of repair machinery to thedamaged chromatin. Mol Cell Biol 27, 1602–1613.

199
[Shogren-Knaak et al., 2006] Shogren-Knaak, M., Ishii, H., Sun, J.-M., Pazin, M. J., Davie,J. R. and Peterson, C. L. (2006). Histone H4-K16 acetylation controls chromatin structureand protein interactions. Science 311, 844–847.
[Shroff et al., 2004] Shroff, R., Arbel-Eden, A., Pilch, D., Ira, G., Bonner, W. M., Petrini, J. H.,Haber, J. E. and Lichten, M. (2004). Distribution and dynamics of chromatin modificationinduced by a defined DNA double-strand break. Curr Biol 14, 1703–1711.
[Shuaib et al., 2010] Shuaib, M., Ouararhni, K., Dimitrov, S. and Hamiche, A. (2010). HJURPbinds CENP-A via a highly conserved N-terminal domain and mediates its deposition atcentromeres. Proc Natl Acad Sci U S A 107, 1349–1354.
[Shukla and Futrell, 2000] Shukla and Futrell (2000). Tandem mass spectrometry: dissocia-tion of ions by collisional activation. J Mass Spectrom 35, 1069–1090.
[Sims et al., 2005] Sims, R. J., Chen, C.-F., Santos-Rosa, H., Kouzarides, T., Patel, S. S. andReinberg, D. (2005). Human but not yeast CHD1 binds directly and selectively to histoneH3 methylated at lysine 4 via its tandem chromodomains. J Biol Chem 280, 41789–41792.
[Siuti and Kelleher, 2010] Siuti, N. and Kelleher, N. L. (2010). Efficient readout of posttrans-lational codes on the 50-residue tail of histone H3 by high-resolution MS/MS. AnalBiochem 396, 180–187.
[Siuti et al., 2006] Siuti, N., Roth, M. J., Mizzen, C. A., Kelleher, N. L. and Pesavento, J. J.(2006). Gene-specific characterization of human histone H2B by electron capture dissoci-ation. J Proteome Res 5, 233–239.
[Sivolob and Prunell, 2003] Sivolob, A. and Prunell, A. (2003). Linker histone-dependentorganization and dynamics of nucleosome entry/exit DNAs. J Mol Biol 331, 1025–1040.
[Smith and Denu, 2009] Smith, B. C. and Denu, J. M. (2009). Chemical mechanisms of his-tone lysine and arginine modifications. Biochim Biophys Acta 1789, 45–57.
[Smith et al., 2003] Smith, C. M., Gafken, P. R., Zhang, Z., Gottschling, D. E., Smith, J. B. andSmith, D. L. (2003). Mass spectrometric quantification of acetylation at specific lysineswithin the amino-terminal tail of histone H4. Anal Biochem 316, 23–33.
[Smith et al., 2002] Smith, C. M., Haimberger, Z. W., Johnson, C. O., Wolf, A. J., Gafken, P. R.,Zhang, Z., Parthun, M. R. and Gottschling, D. E. (2002). Heritable chromatin structure:mapping "memory" in histones H3 and H4. Proc Natl Acad Sci U S A 99 Suppl 4, 16454–16461.
[Smogorzewska et al., 2007] Smogorzewska, A., Matsuoka, S., Vinciguerra, P., McDonald,E. R., Hurov, K. E., Luo, J., Ballif, B. A., Gygi, S. P., Hofmann, K., D’Andrea, A. D. andElledge, S. J. (2007). Identification of the FANCI protein, a monoubiquitinated FANCD2paralog required for DNA repair. Cell 129, 289–301.

200 Bibliography
[Sobel et al., 1994] Sobel, R. E., Cook, R. G. and Allis, C. D. (1994). Non-random acetylationof histone H4 by a cytoplasmic histone acetyltransferase as determined by novel method-ology. J Biol Chem 269, 18576–18582.
[Soulas-Sprauel et al., 2007] Soulas-Sprauel, P., Rivera-Munoz, P., Malivert, L., Le Guyader,G., Abramowski, V., Revy, P. and de Villartay, J.-P. (2007). V(D)J and immunoglobulin classswitch recombinations: a paradigm to study the regulation of DNA end-joining. Onco-gene 26, 7780–7791.
[Spector, 2001] Spector, D. L. (2001). Nuclear domains. J Cell Sci 114, 2891–2893.
[Spycher et al., 2008] Spycher, C., Miller, E. S., Townsend, K., Pavic, L., Morrice, N. A., Jan-scak, P., Stewart, G. S. and Stucki, M. (2008). Constitutive phosphorylation of MDC1 phys-ically links the MRE11-RAD50-NBS1 complex to damaged chromatin. J Cell Biol 181,227–240.
[Staller, 2010] Staller, P. (2010). Genetic heterogeneity and chromatin modifiers in renal clearcell carcinoma. Future Oncol 6, 897–900.
[Stargell et al., 1993] Stargell, L. A., Bowen, J., Dadd, C. A., Dedon, P. C., Davis, M., Cook,R. G., Allis, C. D. and Gorovsky, M. A. (1993). Temporal and spatial association of histoneH2A variant hv1 with transcriptionally competent chromatin during nuclear develop-ment in Tetrahymena thermophila. Genes Dev 7, 2641–2651.
[Stassen et al., 1995] Stassen, M. J., Bailey, D., Nelson, S., Chinwalla, V. and Harte, P. J. (1995).The Drosophila trithorax proteins contain a novel variant of the nuclear receptor typeDNA binding domain and an ancient conserved motif found in other chromosomal pro-teins. Mech Dev 52, 209–223.
[Steward et al., 2006] Steward, M. M., Lee, J.-S., O’Donovan, A., Wyatt, M., Bernstein, B. E.and Shilatifard, A. (2006). Molecular regulation of H3K4 trimethylation by ASH2L, ashared subunit of MLL complexes. Nat Struct Mol Biol 13, 852–854.
[Stewart et al., 2009] Stewart, G. S., Panier, S., Townsend, K., Al-Hakim, A. K., Kolas, N. K.,Miller, E. S., Nakada, S., Ylanko, J., Olivarius, S., Mendez, M., Oldreive, C., Wildenhain, J.,Tagliaferro, A., Pelletier, L., Taubenheim, N., Durandy, A., Byrd, P. J., Stankovic, T., Taylor,A. M. R. and Durocher, D. (2009). The RIDDLE syndrome protein mediates a ubiquitin-dependent signaling cascade at sites of DNA damage. Cell 136, 420–434.
[Stiff et al., 2004] Stiff, T., O’Driscoll, M., Rief, N., Iwabuchi, K., Lobrich, M. and Jeggo, P. A.(2004). ATM and DNA-PK function redundantly to phosphorylate H2AX after exposureto ionizing radiation. Cancer Res 64, 2390–2396.
[Strahl and Allis, 2000] Strahl, B. D. and Allis, C. D. (2000). The language of covalent histonemodifications. Nature 403, 41–45.

201
[Strahl et al., 2001] Strahl, B. D., Briggs, S. D., Brame, C. J., Caldwell, J. A., Koh, S. S., Ma, H.,Cook, R. G., Shabanowitz, J., Hunt, D. F., Stallcup, M. R. and Allis, C. D. (2001). Methy-lation of histone H4 at arginine 3 occurs in vivo and is mediated by the nuclear receptorcoactivator PRMT1. Curr Biol 11, 996–1000.
[Stucki et al., 2005] Stucki, M., Clapperton, J. A., Mohammad, D., Yaffe, M. B., Smerdon, S. J.and Jackson, S. P. (2005). MDC1 directly binds phosphorylated histone H2AX to regulatecellular responses to DNA double-strand breaks. Cell 123, 1213–1226.
[Su et al., 2009] Su, X., Jacob, N. K., Amunugama, R., Hsu, P.-H., Fishel, R. and Fre-itas, M. A. (2009). Enrichment and characterization of histones by two-dimensionalhydroxyapatite/reversed-phase liquid chromatography-mass spectrometry. AnalBiochem 388, 47–55.
[Su et al., 2007a] Su, X., Jacob, N. K., Amunugama, R., Lucas, D. M., Knapp, A. R., Ren, C.,Davis, M. E., Marcucci, G., Parthun, M. R., Byrd, J. C., Fishel, R. and Freitas, M. A. (2007a).Liquid chromatography mass spectrometry profiling of histones. J Chromatogr B AnalytTechnol Biomed Life Sci 850, 440–454.
[Su et al., 2007b] Su, X., Zhang, L., Lucas, D. M., Davis, M. E., Knapp, A. R., Green-Church,K. B., Marcucci, G., Parthun, M. R., Byrd, J. C. and Freitas, M. A. (2007b). Histone H4acetylation dynamics determined by stable isotope labeling with amino acids in cell cul-ture and mass spectrometry. Anal Biochem 363, 22–34.
[Subramanian et al., 2008] Subramanian, K., Jia, D., Kapoor-Vazirani, P., Powell, D. R.,Collins, R. E., Sharma, D., Peng, J., Cheng, X. and Vertino, P. M. (2008). Regulation ofestrogen receptor alpha by the SET7 lysine methyltransferase. Mol Cell 30, 336–347.
[Sugasawa et al., 2005] Sugasawa, K., Okuda, Y., Saijo, M., Nishi, R., Matsuda, N., Chu, G.,Mori, T., Iwai, S., Tanaka, K., Tanaka, K. and Hanaoka, F. (2005). UV-induced ubiquityla-tion of XPC protein mediated by UV-DDB-ubiquitin ligase complex. Cell 121, 387–400.
[Sullivan, 2002] Sullivan, B. A. (2002). Centromere round-up at the heterochromatin corral.Trends Biotechnol 20, 89–92.
[Sullivan and Karpen, 2004] Sullivan, B. A. and Karpen, G. H. (2004). Centromeric chro-matin exhibits a histone modification pattern that is distinct from both euchromatin andheterochromatin. Nat Struct Mol Biol 11, 1076–1083.
[Sung and Klein, 2006] Sung, P. and Klein, H. (2006). Mechanism of homologous recombi-nation: mediators and helicases take on regulatory functions. Nat Rev Mol Cell Biol 7,739–750.
[Sury et al., 2010] Sury, M. D., Chen, J.-X. and Selbach, M. (2010). The SILAC fly allows foraccurate protein quantification in vivo. Mol Cell Proteomics 9, 2173–2183.
[Suto et al., 2000] Suto, R. K., Clarkson, M. J., Tremethick, D. J. and Luger, K. (2000). Crystalstructure of a nucleosome core particle containing the variant histone H2A.Z. Nat StructBiol 7, 1121–1124.

202 Bibliography
[Svotelis et al., 2009] Svotelis, A., Gevry, N. and Gaudreau, L. (2009). Regulation of geneexpression and cellular proliferation by histone H2A.Z. Biochem Cell Biol 87, 179–188.
[Syka et al., 2004a] Syka, J. E. P., Coon, J. J., Schroeder, M. J., Shabanowitz, J. and Hunt, D. F.(2004a). Peptide and protein sequence analysis by electron transfer dissociation massspectrometry. Proc Natl Acad Sci U S A 101, 9528–9533.
[Syka et al., 2004b] Syka, J. E. P., Marto, J. A., Bai, D. L., Horning, S., Senko, M. W., Schwartz,J. C., Ueberheide, B., Garcia, B., Busby, S., Muratore, T., Shabanowitz, J. and Hunt, D. F.(2004b). Novel linear quadrupole ion trap/FT mass spectrometer: performance character-ization and use in the comparative analysis of histone H3 post-translational modifications.J Proteome Res 3, 621–626.
[Tagami et al., 2004] Tagami, H., Ray-Gallet, D., Almouzni, G. and Nakatani, Y. (2004). Hi-stone H3.1 and H3.3 complexes mediate nucleosome assembly pathways dependent orindependent of DNA synthesis. Cell 116, 51–61.
[Talbert and Henikoff, 2010] Talbert, P. B. and Henikoff, S. (2010). Histone variants–ancientwrap artists of the epigenome. Nat Rev Mol Cell Biol 11, 264–275.
[Tamaru et al., 2003] Tamaru, H., Zhang, X., McMillen, D., Singh, P. B., ichi Nakayama, J.,Grewal, S. I., Allis, C. D., Cheng, X. and Selker, E. U. (2003). Trimethylated lysine 9 ofhistone H3 is a mark for DNA methylation in Neurospora crassa. Nat Genet 34, 75–79.
[Tamburini and Tyler, 2005] Tamburini, B. A. and Tyler, J. K. (2005). Localized histone acety-lation and deacetylation triggered by the homologous recombination pathway of double-strand DNA repair. Mol Cell Biol 25, 4903–4913.
[Tamura et al., 2009] Tamura, T., Smith, M., Kanno, T., Dasenbrock, H., Nishiyama, A. andOzato, K. (2009). Inducible deposition of the histone variant H3.3 in interferon-stimulatedgenes. J Biol Chem 284, 12217–12225.
[Taniguchi et al., 2002] Taniguchi, T., Garcia-Higuera, I., Andreassen, P. R., Gregory, R. C.,Grompe, M. and D’Andrea, A. D. (2002). S-phase-specific interaction of the Fanconi ane-mia protein, FANCD2, with BRCA1 and RAD51. Blood 100, 2414–2420.
[Taunton et al., 1996] Taunton, J., Hassig, C. A. and Schreiber, S. L. (1996). A mammalianhistone deacetylase related to the yeast transcriptional regulator Rpd3p. Science 272,408–411.
[Taverna et al., 2006] Taverna, S. D., Ilin, S., Rogers, R. S., Tanny, J. C., Lavender, H., Li, H.,Baker, L., Boyle, J., Blair, L. P., Chait, B. T., Patel, D. J., Aitchison, J. D., Tackett, A. J. andAllis, C. D. (2006). Yng1 PHD finger binding to H3 trimethylated at K4 promotes NuA3HAT activity at K14 of H3 and transcription at a subset of targeted ORFs. Mol Cell 24,785–796.
[Taverna et al., 2007] Taverna, S. D., Ueberheide, B. M., Liu, Y., Tackett, A. J., Diaz, R. L., Sha-banowitz, J., Chait, B. T., Hunt, D. F. and Allis, C. D. (2007). Long-distance combinatorial

203
linkage between methylation and acetylation on histone H3 N termini. Proc Natl AcadSci U S A 104, 2086–2091.
[Thomas et al., 2006] Thomas, C. E., Kelleher, N. L. and Mizzen, C. A. (2006). Mass spec-trometric characterization of human histone H3: a bird’s eye view. J Proteome Res 5,240–247.
[Thompson et al., 2003] Thompson, A., SchÃfer, J., Kuhn, K., Kienle, S., Schwarz, J., Schmidt,G., Neumann, T., Johnstone, R., Mohammed, A. K. A. and Hamon, C. (2003). Tandem masstags: a novel quantification strategy for comparative analysis of complex protein mixturesby MS/MS. Anal Chem 75, 1895–1904.
[Thompson and Hinz, 2009] Thompson, L. H. and Hinz, J. M. (2009). Cellular and molecularconsequences of defective Fanconi anemia proteins in replication-coupled DNA repair:mechanistic insights. Mutat Res 668, 54–72.
[Thompson and Schild, 2002] Thompson, L. H. and Schild, D. (2002). Recombinational DNArepair and human disease. Mutat Res 509, 49–78.
[Thoms et al., 2007] Thoms, K.-M., Kuschal, C. and Emmert, S. (2007). Lessons learned fromDNA repair defective syndromes. Exp Dermatol 16, 532–544.
[Tian et al., 2011] Tian, R., Wang, S., Elisma, F., Li, L., Zhou, H., Wang, L. and Figeys, D.(2011). Rare cell proteomic reactor applied to stable isotope labeling by amino acids incell culture (SILAC)-based quantitative proteomics study of human embryonic stem celldifferentiation. Mol Cell Proteomics 10, M110.000679.
[Tjeertes et al., 2009] Tjeertes, J. V., Miller, K. M. and Jackson, S. P. (2009). Screen for DNA-damage-responsive histone modifications identifies H3K9Ac and H3K56Ac in humancells. EMBO J 28, 1878–1889.
[Torres-Padilla et al., 2006] Torres-Padilla, M.-E., Bannister, A. J., Hurd, P. J., Kouzarides, T.and Zernicka-Goetz, M. (2006). Dynamic distribution of the replacement histone variantH3.3 in the mouse oocyte and preimplantation embryos. Int J Dev Biol 50, 455–461.
[Tripputi et al., 1986] Tripputi, P., Emanuel, B. S., Croce, C. M., Green, L. G., Stein, G. S. andStein, J. L. (1986). Human histone genes map to multiple chromosomes. Proc Natl AcadSci U S A 83, 3185–3188.
[Trojer and Reinberg, 2007] Trojer, P. and Reinberg, D. (2007). Facultative heterochromatin:is there a distinctive molecular signature? Mol Cell 28, 1–13.
[Truglio et al., 2006] Truglio, J. J., Croteau, D. L., Houten, B. V. and Kisker, C. (2006). Prokary-otic nucleotide excision repair: the UvrABC system. Chem Rev 106, 233–252.
[Tschiersch et al., 1994] Tschiersch, B., Hofmann, A., Krauss, V., Dorn, R., Korge, G. andReuter, G. (1994). The protein encoded by the Drosophila position-effect variegation sup-pressor gene Su(var)3-9 combines domains of antagonistic regulators of homeotic genecomplexes. EMBO J 13, 3822–3831.

204 Bibliography
[Turner, 2000] Turner, B. M. (2000). Histone acetylation and an epigenetic code. Bioessays22, 836–845.
[Turner, 2002] Turner, B. M. (2002). Cellular memory and the histone code. Cell 111, 285–291.
[Turner et al., 1992] Turner, B. M., Birley, A. J. and Lavender, J. (1992). Histone H4 isoformsacetylated at specific lysine residues define individual chromosomes and chromatin do-mains in Drosophila polytene nuclei. Cell 69, 375–384.
[Unal et al., 2004] Unal, E., Arbel-Eden, A., Sattler, U., Shroff, R., Lichten, M., Haber, J. E.and Koshland, D. (2004). DNA damage response pathway uses histone modification toassemble a double-strand break-specific cohesin domain. Mol Cell 16, 991–1002.
[Urban and Zweidler, 1983] Urban, M. K. and Zweidler, A. (1983). Changes in nucleosomalcore histone variants during chicken development and maturation. Dev Biol 95, 421–428.
[Utley et al., 2005] Utley, R. T., Lacoste, N., Jobin-Robitaille, O., Allard, S. and Cote, J. (2005).Regulation of NuA4 histone acetyltransferase activity in transcription and DNA repair byphosphorylation of histone H4. Mol Cell Biol 25, 8179–8190.
[van Attikum and Gasser, 2005] van Attikum, H. and Gasser, S. M. (2005). ATP-dependentchromatin remodeling and DNA double-strand break repair. Cell Cycle 4, 1011–1014.
[van Attikum and Gasser, 2009] van Attikum, H. and Gasser, S. M. (2009). Crosstalk be-tween histone modifications during the DNA damage response. Trends Cell Biol 19,207–217.
[Van Hooser et al., 2001] Van Hooser, A. A., Ouspenski, I. I., Gregson, H. C., Starr, D. A.,Yen, T. J., Goldberg, M. L., Yokomori, K., Earnshaw, W. C., Sullivan, K. F. and Brinkley,B. R. (2001). Specification of kinetochore-forming chromatin by the histone H3 variantCENP-A. J Cell Sci 114, 3529–3542.
[van Leeuwen et al., 2002] van Leeuwen, F., Gafken, P. R. and Gottschling, D. E. (2002).Dot1p modulates silencing in yeast by methylation of the nucleosome core. Cell 109,745–756.
[van Steensel and Henikoff, 2000] van Steensel, B. and Henikoff, S. (2000). Identification ofin vivo DNA targets of chromatin proteins using tethered dam methyltransferase. NatBiotechnol 18, 424–428.
[Vasen et al., 2007] Vasen, H. F. A., Möslein, G., Alonso, A., Bernstein, I., Bertario, L.,Blanco, I., Burn, J., Capella, G., Engel, C., Frayling, I., Friedl, W., Hes, F. J., Hodgson, S.,Mecklin, J.-P., Møller, P., Nagengast, F., Parc, Y., Renkonen-Sinisalo, L., Sampson, J. R.,Stormorken, A. and Wijnen, J. (2007). Guidelines for the clinical management of Lynchsyndrome (hereditary non-polyposis cancer). J Med Genet 44, 353–362.

205
[Vaz et al., 2010] Vaz, F., Hanenberg, H., Schuster, B., Barker, K., Wiek, C., Erven, V., Nevel-ing, K., Endt, D., Kesterton, I., Autore, F., Fraternali, F., Freund, M., Hartmann, L.,Grimwade, D., Roberts, R. G., Schaal, H., Mohammed, S., Rahman, N., Schindler, D. andMathew, C. G. (2010). Mutation of the RAD51C gene in a Fanconi anemia-like disorder.Nat Genet 42, 406–409.
[Vermeulen et al., 2010] Vermeulen, M., Eberl, H. C., Matarese, F., Marks, H., Denissov, S.,Butter, F., Lee, K. K., Olsen, J. V., Hyman, A. A., Stunnenberg, H. G. and Mann, M.(2010). Quantitative interaction proteomics and genome-wide profiling of epigenetic his-tone marks and their readers. Cell 142, 967–980.
[Vermeulen and Selbach, 2009] Vermeulen, M. and Selbach, M. (2009). Quantitative pro-teomics: a tool to assess cell differentiation. Curr Opin Cell Biol 21, 761–766.
[Vidali et al., 1968] Vidali, G., Gershey, E. L. and Allfrey, V. G. (1968). Chemical studies ofhistone acetylation. The distribution of epsilon-N-acetyllysine in calf thymus histones. JBiol Chem 243, 6361–6366.
[Viens et al., 2006] Viens, A., Mechold, U., Brouillard, F., Gilbert, C., Leclerc, P. and Ogryzko,V. (2006). Analysis of human histone H2AZ deposition in vivo argues against its directrole in epigenetic templating mechanisms. Mol Cell Biol 26, 5325–5335.
[Viens et al., 2004] Viens, A., Mechold, U., Lehrmann, H., Harel-Bellan, A. and Ogryzko, V.(2004). Use of protein biotinylation in vivo for chromatin immunoprecipitation. AnalBiochem 325, 68–76.
[Vire et al., 2006] Vire, E., Brenner, C., Deplus, R., Blanchon, L., Fraga, M., Didelot, C., Morey,L., Eynde, A. V., Bernard, D., Vanderwinden, J.-M., Bollen, M., Esteller, M., Croce, L. D.,de Launoit, Y. and Fuks, F. (2006). The Polycomb group protein EZH2 directly controlsDNA methylation. Nature 439, 871–874.
[Waddington, 1942] Waddington, C. (1942). The epigenotype. Endeavour 1, 18–20.
[Waddington, 1957] Waddington, C. H. (1957). The Strategy of the Genes. Geo Allen &Unwin, London.
[Walsh, 2005] Walsh, C. (2005). Posttranslational Modifications of Proteins. Roberts andCompany Publishers.
[Walther and Mann, 2010] Walther, T. C. and Mann, M. (2010). Mass spectrometry-basedproteomics in cell biology. J Cell Biol 190, 491–500.
[Wang and Elledge, 2007] Wang, B. and Elledge, S. J. (2007). Ubc13/Rnf8 ubiquitin ligasescontrol foci formation of the Rap80/Abraxas/Brca1/Brcc36 complex in response to DNAdamage. Proc Natl Acad Sci U S A 104, 20759–20763.
[Wang et al., 2011] Wang, D., Hincapie, M., Rejtar, T. and Karger, B. L. (2011). Ultra-sensitive characterization of site-specific glycosylation of affinity-purified haptoglobin

206 Bibliography
from lung cancer patient plasma using 10 Î14m i.d. porous layer open tubular liquidchromatography-linear ion trap collision-induced dissociation/electron transfer dissocia-tion mass spectrometry. Anal Chem 83, 2029–2037.
[Wang et al., 2007] Wang, G. G., Allis, C. D. and Chi, P. (2007). Chromatin remodeling andcancer, Part II: ATP-dependent chromatin remodeling. Trends Mol Med 13, 373–380.
[Wang et al., 2006] Wang, H., Zhai, L., Xu, J., Joo, H.-Y., Jackson, S., Erdjument-Bromage, H.,Tempst, P., Xiong, Y. and Zhang, Y. (2006). Histone H3 and H4 ubiquitylation by theCUL4-DDB-ROC1 ubiquitin ligase facilitates cellular response to DNA damage. Mol Cell22, 383–394.
[Wang et al., 2010] Wang, Q., Zhang, Y., Yang, C., Xiong, H., Lin, Y., Yao, J., Li, H., Xie, L.,Zhao, W., Yao, Y., Ning, Z.-B., Zeng, R., Xiong, Y., Guan, K.-L., Zhao, S. and Zhao, G.-P. (2010). Acetylation of metabolic enzymes coordinates carbon source utilization andmetabolic flux. Science 327, 1004–1007.
[Wang, 2008] Wang, W. (2008). A major switch for the Fanconi anemia DNA damage-response pathway. Nat Struct Mol Biol 15, 1128–1130.
[Wang et al., 2004a] Wang, X., Andreassen, P. R. and D’Andrea, A. D. (2004a). Functionalinteraction of monoubiquitinated FANCD2 and BRCA2/FANCD1 in chromatin. Mol CellBiol 24, 5850–5862.
[Wang et al., 2004b] Wang, Y., Wysocka, J., Sayegh, J., Lee, Y.-H., Perlin, J. R., Leonelli, L.,Sonbuchner, L. S., McDonald, C. H., Cook, R. G., Dou, Y., Roeder, R. G., Clarke, S., Stallcup,M. R., Allis, C. D. and Coonrod, S. A. (2004b). Human PAD4 regulates histone argininemethylation levels via demethylimination. Science 306, 279–283.
[Wang et al., 2009] Wang, Z., Zang, C., Cui, K., Schones, D. E., Barski, A., Peng, W. and Zhao,K. (2009). Genome-wide mapping of HATs and HDACs reveals distinct functions in activeand inactive genes. Cell 138, 1019–1031.
[Ward and Chen, 2001] Ward, I. M. and Chen, J. (2001). Histone H2AX is phosphorylated inan ATR-dependent manner in response to replicational stress. J Biol Chem 276, 47759–47762.
[Waterborg, 1993] Waterborg, J. H. (1993). Histone synthesis and turnover in alfalfa. Fastloss of highly acetylated replacement histone variant H3.2. J Biol Chem 268, 4912–4917.
[Waterborg and Matthews, 1983] Waterborg, J. H. and Matthews, H. R. (1983). Patterns ofhistone acetylation in the cell cycle of Physarum polycephalum. Biochemistry 22, 1489–1496.
[Watson, 2003] Watson, J. D. (2003). Celebrating the genetic jubilee: a conversation withJames D. Watson. Interviewed by John Rennie. Sci Am 288, 66–69.

207
[Wei et al., 1998] Wei, Y., Mizzen, C. A., Cook, R. G., Gorovsky, M. A. and Allis, C. D. (1998).Phosphorylation of histone H3 at serine 10 is correlated with chromosome condensationduring mitosis and meiosis in Tetrahymena. Proc Natl Acad Sci U S A 95, 7480–7484.
[Whetstine et al., 2006] Whetstine, J. R., Nottke, A., Lan, F., Huarte, M., Smolikov, S., Chen,Z., Spooner, E., Li, E., Zhang, G., Colaiacovo, M. and Shi, Y. (2006). Reversal of histonelysine trimethylation by the JMJD2 family of histone demethylases. Cell 125, 467–481.
[Widom, 1992] Widom, J. (1992). A relationship between the helical twist of DNA and theordered positioning of nucleosomes in all eukaryotic cells. Proc Natl Acad Sci U S A 89,1095–1099.
[Williams et al., 1986] Williams, S. P., Athey, B. D., Muglia, L. J., Schappe, R. S., Gough, A. H.and Langmore, J. P. (1986). Chromatin fibers are left-handed double helices with diameterand mass per unit length that depend on linker length. Biophys J 49, 233–248.
[Wilson and Bohr, 2007] Wilson, D. M. and Bohr, V. A. (2007). The mechanics of base excisionrepair, and its relationship to aging and disease. DNA Repair (Amst) 6, 544–559.
[Wolf, 2009] Wolf, S. S. (2009). The protein arginine methyltransferase family: an updateabout function, new perspectives and the physiological role in humans. Cell Mol Life Sci66, 2109–2121.
[Wolffe, 1992] Wolffe, A. P. (1992). New insights into chromatin function in transcriptionalcontrol. FASEB J 6, 3354–3361.
[Wong et al., 2010] Wong, L. H., McGhie, J. D., Sim, M., Anderson, M. A., Ahn, S., Hannan,R. D., George, A. J., Morgan, K. A., Mann, J. R. and Choo, K. H. A. (2010). ATRX inter-acts with H3.3 in maintaining telomere structural integrity in pluripotent embryonic stemcells. Genome Res 20, 351–360.
[Woodcock et al., 1993] Woodcock, C. L., Grigoryev, S. A., Horowitz, R. A. and Whitaker, N.(1993). A chromatin folding model that incorporates linker variability generates fibersresembling the native structures. Proc Natl Acad Sci U S A 90, 9021–9025.
[Wu et al., 2009] Wu, J., Huen, M. S. Y., Lu, L.-Y., Ye, L., Dou, Y., Ljungman, M., Chen, J. andYu, X. (2009). Histone ubiquitination associates with BRCA1-dependent DNA damageresponse. Mol Cell Biol 29, 849–860.
[Wysocki et al., 2005] Wysocki, R., Javaheri, A., Allard, S., Sha, F., Cote, J. and Kron, S. J.(2005). Role of Dot1-dependent histone H3 methylation in G1 and S phase DNA damagecheckpoint functions of Rad9. Mol Cell Biol 25, 8430–8443.
[Xhemalce and Kouzarides, 2010] Xhemalce, B. and Kouzarides, T. (2010). A chromodomainswitch mediated by histone H3 Lys 4 acetylation regulates heterochromatin assembly.Genes Dev 24, 647–652.

208 Bibliography
[Xiao et al., 2009] Xiao, A., Li, H., Shechter, D., Ahn, S. H., Fabrizio, L. A., Erdjument-Bromage, H., Ishibe-Murakami, S., Wang, B., Tempst, P., Hofmann, K., Patel, D. J., Elledge,S. J. and Allis, C. D. (2009). WSTF regulates the H2A.X DNA damage response via a noveltyrosine kinase activity. Nature 457, 57–62.
[Xiao et al., 2003] Xiao, B., Jing, C., Wilson, J. R., Walker, P. A., Vasisht, N., Kelly, G., How-ell, S., Taylor, I. A., Blackburn, G. M. and Gamblin, S. J. (2003). Structure and catalyticmechanism of the human histone methyltransferase SET7/9. Nature 421, 652–656.
[Yan et al., 2009] Yan, Q., Dutt, S., Xu, R., Graves, K., Juszczynski, P., Manis, J. P. and Shipp,M. A. (2009). BBAP monoubiquitylates histone H4 at lysine 91 and selectively modulatesthe DNA damage response. Mol Cell 36, 110–120.
[Yang et al., 1996a] Yang, W. M., Inouye, C., Zeng, Y., Bearss, D. and Seto, E. (1996a). Tran-scriptional repression by YY1 is mediated by interaction with a mammalian homolog ofthe yeast global regulator RPD3. Proc Natl Acad Sci U S A 93, 12845–12850.
[Yang et al., 1996b] Yang, X. J., Ogryzko, V. V., Nishikawa, J., Howard, B. H. and Nakatani,Y. (1996b). A p300/CBP-associated factor that competes with the adenoviral oncoproteinE1A. Nature 382, 319–324.
[Yang and Seto, 2007] Yang, X.-J. and Seto, E. (2007). HATs and HDACs: from structure,function and regulation to novel strategies for therapy and prevention. Oncogene 26,5310–5318.
[Yang and Seto, 2008] Yang, X.-J. and Seto, E. (2008). The Rpd3/Hda1 family of lysinedeacetylases: from bacteria and yeast to mice and men. Nat Rev Mol Cell Biol 9, 206–218.
[Yang and Speed, 2002] Yang, Y. H. and Speed, T. (2002). Design issues for cDNA microarrayexperiments. Nat Rev Genet 3, 579–588.
[Yao et al., 2001] Yao, X., Freas, A., Ramirez, J., Demirev, P. A. and Fenselau, C. (2001). Pro-teolytic 18O labeling for comparative proteomics: model studies with two serotypes ofadenovirus. Anal Chem 73, 2836–2842.
[Ye et al., 2005] Ye, J., Ai, X., Eugeni, E. E., Zhang, L., Carpenter, L. R., Jelinek, M. A., Fre-itas, M. A. and Parthun, M. R. (2005). Histone H4 lysine 91 acetylation a core domainmodification associated with chromatin assembly. Mol Cell 18, 123–130.
[Ye et al., 2009] Ye, X., Luke, B., Andresson, T. and Blonder, J. (2009). 18O stable isotopelabeling in MS-based proteomics. Brief Funct Genomic Proteomic 8, 136–144.
[Young et al., 2009] Young, N. L., DiMaggio, P. A., Plazas-Mayorca, M. D., Baliban, R. C.,Floudas, C. A. and Garcia, B. A. (2009). High throughput characterization of combinatorialhistone codes. Mol Cell Proteomics 8, 2266–2284.

209
[Zabrouskov and Whitelegge, 2007] Zabrouskov, V. and Whitelegge, J. P. (2007). Increasedcoverage in the transmembrane domain with activated-ion electron capture dissociationfor top-down Fourier-transform mass spectrometry of integral membrane proteins. J Pro-teome Res 6, 2205–2210.
[Zanier et al., 2004] Zanier, R., Briot, D., du Villard, J.-A. D., Sarasin, A. and Rosselli, F.(2004). Fanconi anemia C gene product regulates expression of genes involved in dif-ferentiation and inflammation. Oncogene 23, 5004–5013.
[Zegerman et al., 2002] Zegerman, P., Canas, B., Pappin, D. and Kouzarides, T. (2002). His-tone H3 lysine 4 methylation disrupts binding of nucleosome remodeling and deacetylase(NuRD) repressor complex. J Biol Chem 277, 11621–11624.
[Zeng et al., 2010] Zeng, L., Zhang, Q., Li, S., Plotnikov, A. N., Walsh, M. J. and Zhou, M.-M. (2010). Mechanism and regulation of acetylated histone binding by the tandem PHDfinger of DPF3b. Nature 466, 258–262.
[Zhang et al., 2009] Zhang, K., Chen, Y., Zhang, Z. and Zhao, Y. (2009). Identification andverification of lysine propionylation and butyrylation in yeast core histones using PTMapsoftware. J Proteome Res 8, 900–906.
[Zhang et al., 2004] Zhang, K., Siino, J. S., Jones, P. R., Yau, P. M. and Bradbury, E. M. (2004).A mass spectrometric "Western blot" to evaluate the correlations between histone methy-lation and histone acetylation. Proteomics 4, 3765–3775.
[Zhang and Tang, 2003] Zhang, K. and Tang, H. (2003). Analysis of core histones by liq-uid chromatography-mass spectrometry and peptide mapping. J Chromatogr B AnalytTechnol Biomed Life Sci 783, 173–179.
[Zhang et al., 2002a] Zhang, K., Tang, H., Huang, L., Blankenship, J. W., Jones, P. R., Xiang,F., Yau, P. M. and Burlingame, A. L. (2002a). Identification of acetylation and methylationsites of histone H3 from chicken erythrocytes by high-accuracy matrix-assisted laser des-orption ionization-time-of-flight, matrix-assisted laser desorption ionization-postsourcedecay, and nanoelectrospray ionization tandem mass spectrometry. Anal Biochem 306,259–269.
[Zhang et al., 2002b] Zhang, K., Williams, K. E., Huang, L., Yau, P., Siino, J. S., Bradbury,E. M., Jones, P. R., Minch, M. J. and Burlingame, A. L. (2002b). Histone acetylation anddeacetylation: identification of acetylation and methylation sites of HeLa histone H4 bymass spectrometry. Mol Cell Proteomics 1, 500–508.
[Zhang and Freitas, 2004] Zhang, L. and Freitas, M, A. (2004). Comparison of peptide massmapping and electron capture dissociation as assays for histone posttranslational modifi-cations. Int J Mass Spectr 234(1â3), 213â225.
[Zhang et al., 2007] Zhang, L., Su, X., Liu, S., Knapp, A. R., Parthun, M. R., Marcucci, G. andFreitas, M. A. (2007). Histone H4 N-terminal acetylation in Kasumi-1 cells treated with

210 Bibliography
depsipeptide determined by acetic acid-urea polyacrylamide gel electrophoresis, aminoacid coded mass tagging, and mass spectrometry. J Proteome Res 6, 81–88.
[Zhang et al., 2003] Zhang, X., Yang, Z., Khan, S. I., Horton, J. R., Tamaru, H., Selker, E. U.and Cheng, X. (2003). Structural basis for the product specificity of histone lysine methyl-transferases. Mol Cell 12, 177–185.
[Zhao et al., 2007] Zhao, G. Y., Sonoda, E., Barber, L. J., Oka, H., Murakawa, Y., Yamada, K.,Ikura, T., Wang, X., Kobayashi, M., Yamamoto, K., Boulton, S. J. and Takeda, S. (2007). Acritical role for the ubiquitin-conjugating enzyme Ubc13 in initiating homologous recom-bination. Mol Cell 25, 663–675.
[Zhao et al., 2010] Zhao, S., Xu, W., Jiang, W., Yu, W., Lin, Y., Zhang, T., Yao, J., Zhou, L.,Zeng, Y., Li, H., Li, Y., Shi, J., An, W., Hancock, S. M., He, F., Qin, L., Chin, J., Yang, P.,Chen, X., Lei, Q., Xiong, Y. and Guan, K.-L. (2010). Regulation of cellular metabolism byprotein lysine acetylation. Science 327, 1000–1004.
[Zheng et al., 2006] Zheng, H., Wang, X., Legerski, R. J., Glazer, P. M. and Li, L. (2006).Repair of DNA interstrand cross-links: interactions between homology-dependent andhomology-independent pathways. DNA Repair (Amst) 5, 566–574.
[Zhou et al., 2010] Zhou, B., Xu, W., Herndon, D., Tompkins, R., Davis, R., Xiao, W., Wong,W. H., Inflammation, to Injury Program, H. R., Toner, M., Warren, H. S., Schoenfeld, D. A.,Rahme, L., McDonald-Smith, G. P., Hayden, D., Mason, P., Fagan, S., Yu, Y.-M., Cobb, J. P.,Remick, D. G., Mannick, J. A., Lederer, J. A., Gamelli, R. L., Silver, G. M., West, M. A.,Shapiro, M. B., Smith, R., Camp, D. G., Qian, W., Storey, J., Mindrinos, M., Tibshirani,R., Lowry, S., Calvano, S., Chaudry, I., West, M. A., Cohen, M., Moore, E. E., Johnson, J.,Moldawer, L. L., Baker, H. V., Efron, P. A., Balis, U. G. J., Billiar, T. R., Ochoa, J. B., Sperry,J. L., Miller-Graziano, C. L., De, A. K., Bankey, P. E., Finnerty, C. C., Jeschke, M. G., Minei,J. P., Arnoldo, B. D., Hunt, J. L., Horton, J., Cobb, J. P., Brownstein, B., Freeman, B., Maier,R. V., Nathens, A. B., Cuschieri, J., Gibran, N., Klein, M. and O’Keefe, G. (2010). Analysisof factorial time-course microarrays with application to a clinical study of burn injury.Proc Natl Acad Sci U S A 107, 9923–9928.
[Zhou et al., 2007] Zhou, J., Fan, J. Y., Rangasamy, D. and Tremethick, D. J. (2007). The nu-cleosome surface regulates chromatin compaction and couples it with transcriptional re-pression. Nat Struct Mol Biol 14, 1070–1076.
[Zhu and Wani, 2010] Zhu, Q. and Wani, A. A. (2010). Histone modifications: crucial ele-ments for damage response and chromatin restoration. J Cell Physiol 223, 283–288.
[Zhu et al., 2009] Zhu, Q., Wani, G., Arab, H. H., El-Mahdy, M. A., Ray, A. and Wani, A. A.(2009). Chromatin restoration following nucleotide excision repair involves the incorpo-ration of ubiquitinated H2A at damaged genomic sites. DNA Repair (Amst) 8, 262–273.
[Zippo et al., 2009] Zippo, A., Serafini, R., Rocchigiani, M., Pennacchini, S., Krepelova, A.and Oliviero, S. (2009). Histone crosstalk between H3S10ph and H4K16ac generates ahistone code that mediates transcription elongation. Cell 138, 1122–1136.

211
[Zlatanova et al., 2009] Zlatanova, J., Bishop, T. C., Victor, J.-M., Jackson, V. and van Holde,K. (2009). The nucleosome family: dynamic and growing. Structure 17, 160–171.
[Zubarev, 2006] Zubarev, R. (2006). Protein primary structure using orthogonal fragmenta-tion techniques in Fourier transform mass spectrometry. Expert Rev Proteomics 3, 251–261.
[Zubarev et al., 2000] Zubarev, R. A., Horn, D. M., Fridriksson, E. K., Kelleher, N. L., Kruger,N. A., Lewis, M. A., Carpenter, B. K. and McLafferty, F. W. (2000). Electron capture dis-sociation for structural characterization of multiply charged protein cations. Anal Chem72, 563–573.

7Annex - I
The representative MS/MS spectra of various modified and unmodified histone peptidesalong with the lists of theoretical masses of fragment peptides, corresponding to varioushistone H3 and H4 modifications described in [Chapter 2], are presented here.
213

214 Chapter 7. Annex - I
Figure 7.1: MS2 spectrum of Histone H3 residues 9-17 (K14ac)

215
Figure 7.2: MS2 spectrum of Histone H3 residues 9-17 (K9UM + 14UM)

216 Chapter 7. Annex - I
Figure 7.3: MS2 spectrum of Histone H3 residues 9-17 (K9me + K14UM)

217
Figure 7.4: MS2 spectrum of Histone H3 residues 54-63 (K56UM)

218 Chapter 7. Annex - I
Figure 7.5: MS2 spectrum of Histone H3 residues 54-63 (K56me)

219
Figure 7.6: MS2 spectrum of Histone H3 residues 73-83 (K79UM)

220 Chapter 7. Annex - I
Figure 7.7: MS2 spectrum of Histone H3 residues 73-83 (K79me)

221
Figure 7.8: MS2 spectrum of Histone H4 residues 68-78 (K77UM)

222 Chapter 7. Annex - I
Figure 7.9: MS2 spectrum of Histone H4 residues 68-78 (K77me)

223
Figure 7.10: MS2 spectrum of Histone H4 residues 24-35 (K31UM)

224 Chapter 7. Annex - I
Figure 7.11: MS2 spectrum of Histone H4 residues 24-35 (K31me)

225
Figure 7.12: MS2 spectrum of Histone H4 residues 4-17 (4ac)

226 Chapter 7. Annex - I
Figure 7.13: MS2 spectrum of Histone H4 residues 4-17 (3ac)

227
Figure 7.14: MS2 spectrum of Histone H4 residues 4-17 (2ac)

228 Chapter 7. Annex - I
Figure 7.15: MS2 spectrum of Histone H4 residues 4-17 (1ac)

229
Figure 7.16: MS2 spectrum of Histone H4 residues 4-17 (K5, 8, 12, 16 UM)

8Annex - II
PUB-MS - A Mass-Spectrometry-based Method to Monitor Protein-Protein Proximity In-Vivo. (2011)
Arman Kulyyassov 1,2 , Muhammad Shoaib 1 , Andrey Pichugin 1 , Patricia Kannouche 1 ,Erlan Ramankulov 1,2 , Marc Lipinski 1 and Vasily Ogryzko 1
I CNRS UMR-8126, Université Paris-Sud 11, Institut de Cancérologie Gustave Roussy,39, rue Camille Desmoulins, 94805, Villejuif, France.
II National Center for Biotechnology of the Republic of Kazakhstan, 43 Valikhanova Str.,010000, Astana, Republic of Kazakhstan.
J Proteome Res. Sep 2 [Epub ahead of print]
231


rXXXX American Chemical Society A dx.doi.org/10.1021/pr200189p | J. Proteome Res. XXXX, XXX, 000–000
ARTICLE
pubs.acs.org/jpr
PUB-MS: A Mass Spectrometry-based Method to MonitorProtein�Protein Proximity in vivoArman Kulyyassov,†,‡ Muhammad Shoaib,† Andrei Pichugin,† Patricia Kannouche,† Erlan Ramanculov,‡
Marc Lipinski,† and Vasily Ogryzko*,†
†Institut Gustave Roussy, 39 Rue Camilles Desmoulin, 94805, Villejuif, France‡National Center of Biotechnology, Valihanova 43, 01000, Astana, Kazakhstan
bS Supporting Information
’ INTRODUCTION
One of the ultimate goals of molecular biology is reconstruc-tion of the spatiotemporal structure of a living cell at the mole-cular level. This task includes determination (and cataloguing) ofproximities between different molecular components in the celland monitoring their time- and physiological state-dependentchanges. In many cases, proximity betweenmacromolecules arisesdue to their interactions (either direct or else via intermediates);however, the contribution of dynamic self-organization in gen-eration of spatiotemporal order is emerging as another viable pos-sibility.1,2 Specifically, in proteomics, this implies that the detec-tion of protein�protein proximity is a more general task thangaining information about physical interactions between proteins,as it could detail aspects of spatial order in vivo that are chal-lenging (at the very least) to reconstitute in binding experimentsin vitro.
In recent years, several approaches have been developed tomonitor protein�protein interactions inside living mammaliancells, and thus to provide the physiologically relevant informationabout the spatial organization of cell. They include fluorescenceresonance energy transfer (FRET) with fluorescent proteins,3,4
bioluminescence resonance energy transfer (BRET),5,6 proteincomplementation assays (PCA),7,8 and various two-hybrid systems.9,10
However, they suffer from several limitations that we aimed to
overcome in our work. For example, only relatively close proximitycan be studied with these methods (for example, FRET providesintra- or intermolecular distance data in the range 1�10 nm).Second, although the study of protein�protein interactions fallswithin the scope of proteomics, the FRET/BRET and PCAmethods require access to instrumentation (e.g., confocal micro-scope) that usually do not match the capabilities and the expertiseof a standard proteomics laboratory.
Given that a mass spectrometer is the working horse of a coreproteomics facility, it is desirable to develop a mass-spectrometry-oriented approach to monitor protein�protein interactions (and,more generally, their proximity) in vivo. Since accurate massmeasurement is the main principle of this methodology, such anapproach could be based on the proximity-dependent introduc-tion of a modification in the tested protein, which can be furtherdetected in a quantitative manner with the help of mass spectro-metry. One potential advantage of mass spectrometry, as com-pared to othermethods (such as FRET, BRET, PCA, two-hybrid),is the high resolution of mass spectrometer, that is, its ability toreliably distinguish between thousands of ions with differentm/zratios. This opens a possibility of multiplexing, that is, monitoringof several interactions in a single experiment.
Received: February 28, 2011
ABSTRACT: The common techniques to study protein�protein proximityin vivo are not well adapted to the capabilities and the expertise of a standardproteomics laboratory, typically based on the use of mass spectrometry. With theaim of closing this gap, we have developed PUB-MS (for proximity utilizingbiotinylation and mass spectrometry), an approach to monitor protein�proteinproximity, based on biotinylation of a protein fused to a biotin-acceptor peptide(BAP) by a biotin-ligase, BirA, fused to its interaction partner. The biotinylationstatus of the BAP can be further detected by either Western analysis or massspectrometry. The BAP sequence was redesigned for easy monitoring of thebiotinylation status by LC�MS/MS. In several experimental models, we demon-strate that the biotinylation in vivo is specifically enhanced when the BAP- andBirA-fused proteins are in proximity to each other. The advantage of massspectrometry is demonstrated by using BAPs with different sequences in a singleexperiment (allowingmultiplex analysis) and by the use of stable isotopes. Finally, we show that ourmethodology can be also used tostudy a specific subfraction of a protein of interest that was in proximity with another protein at a predefined time before the analysis.
KEYWORDS: protein�protein interactions, biotinylation, proximity, multiplexing, pulse-chase, SILAC

B dx.doi.org/10.1021/pr200189p |J. Proteome Res. XXXX, XXX, 000–000
Journal of Proteome Research ARTICLE
Previously, we and others have developed a method forefficient biotinylation of proteins in vivo,11,12 based on thecoexpression within the same cell, of the biotin ligase BirA andthe protein of interest fused to a short biotin acceptor peptide(BAP). Such in vivo biotinylated proteins have been used forprotein complex purification,11,13,14 chromatin immunoprecipi-tation,12,13,15,16 immunoelectron microscopy17 and other purposes.In this work, we have adapted our system to the task of moni-toring protein�protein proximity in vivo, with the use of massspectrometry. For this purpose, the BirA was fused to one of theinteraction partners, whereas the BAP was modified to make thedetection of its biotinylation possible by mass spectrometry.Using several experimental systems, we show that the biotinyla-tion of BAP is interaction (and/or proximity) dependent. Inaddition, we demonstrate that BAP domains with differentprimary amino acid structures and thus with different molecularweights can be used in the same experiment, providing thepossibility of multiplexing. Alternatively to the changes in primaryamino acid structure, the stable isotope format can also be used,providing another way to perform multiplexing experiments.
An additional advantage of this technology resides in the factthat it is not limited to detection of short-range proximities, asFRET and PCA are. In particular, we demonstrate that sharingthe same intracellular compartment can also give a signal abovethe background. Thus, with appropriate controls, our approachcan provide a new kind of information, complementary to theshort-range proximity data obtained by the FRET and PCAmethodologies.
Finally, we also demonstrate that our system can help toovercome another limitation of current methodologies to detectprotein�protein proximity. Given an introduction of a covalentmark in the protein of interest, one can ask questions that areimpossible to address with FRET/BRET or PCA. For example,one can follow the state of a protein of interest at a defined timeafter its interaction with another protein has occurred. Thisapplication should be particularly useful for studying multistepintracellular processes, where the proximities between proteins(e.g., interaction partners) and protein properties typically changein a sequential manner. Thus, in addition to helping to recon-struct the cell topology in space, this approach has a promise toadd the temporal dimension to such studies.
’EXPERIMENTAL PROCEDURES
Recombinant DNAFor the pCMV enhancer vectors, the pCDNA3.1 (Invitrogen)
backbone was used. For the MoMuLV enhancer vectors, thepOZ vector was used.18 The BirA ORF was PCR amplified fromthe vector pBBHN.12 The BAP domain fragments were preparedby designing oligonucleotides and sequential PCR, followed byrestriction digest and insertion into the pCDNA3.1 vector. Theinsert sequences were confirmed by sequencing. The vectorsgenerated were used to clone the ORFs of H2AZ, HP1γ,TAP54α, KAP1-HP1BD, Rad18, GFP, H2ABBD, macroH2Aand H3.3.
Cell Culture and Cell LinesHEK293T cells were grown in Dulbecco’s modified Eagle’s
medium with high glucose (PAA) and 10% fetal bovine serum(FCS, PAA). For transient transfection and Western analysis, astandard calcium phosphate precipitation method was used, andthe cells were analyzed one or two days after transfection, as
indicated. For the biotin labeling in vivo, cells were grown forseveral days before transfection in the DMEM supplied withdialyzed FCS, and for the specified time of labeling, biotin(Sigma) was added to a final concentration of 5 μg/mL, whilethe pHwas stabilized by addition of 50 mMHEPES (pH 7.35) tothe medium. For SILAC experiments, the cells were grown inDMEM with 12C6 L-lysine or 13C6 L-lysine (Thermo Scientific,cat # 89983) for at least 5 divisions before transfection, and keptin the samemedium until harvest. For theWestern analysis, 3� 105
of cells (corresponding to one well in a 6-well plate) were usedfor transfection. For the mass-spectrometry analysis, 3 � 106 ofcells were transfected per data point.
Biochemistry and Western Blot AnalysisExcept where indicated otherwise, cell nuclei were used for
analysis. They were prepared by cell disruption in CSK buffer(100 mM NaCl, 300 mM Sucrose, 10 mM Tris pH 7.5, 3 mMMgCl2, 1 mM EGTA, 1.2 mM PMSF, 0.5% Triton X-100) andcentrifugation for 5 min at 4000 rpm. For the analysis ofchromatin-associated histones (chromatin fraction), the nucleiwere first incubated in CSK buffer containing 450 mM NaCl by30min rotation at 4 �C, then spun at 4000 rpm, and the supernatantcontaining soluble histones was discarded. For Western analysis,1� NuPAGE LDS Sample buffer (Invitrogen) with DTT(10 mM) was added, and the nuclei were sonicated, boiled for5 min at 96 �C and loaded on 4�12% gradient Novex Tris-Glycine precast gels. After separation, the proteins were transferredto nitrocellulose membranes and probed with HRP-conjugatedstreptavidin (Sigma, # S5512) or HRP conjugated α-PentaHisantibody (QiaGen, # 34460) according to the manufacturer’sprotocol, except that for the detection of biotinylated proteins bythe HRP-conjugated streptavidin, 500 mM NaCl was added tothe washing buffer (PBS + 0.1% Tween). For protein visualiza-tion, the gels were stained with PageBlue (Fermentas, # R0579).For the densitometric analysis of Western blots, the programImageJ 1.42q (freely available online) was used. To compare thebiotinylation levels between different samples, the value of thestreptavidin-HRP signal was normalized by taking a ratio with thevalue ofα-His signal, which reflects the amount of the transfectedprotein regardless of its biotinylation status. Every Western analysiswas performed three times, with a representative figure shown.
For Ni2+NTA purification of 6� His tagged proteins, thenuclei were solubilized in buffer A (10% glycerol, 250 mMNaCl,6 MGuanidine-HCl, 20 mMTrisHCl (pH 8.0), 0.1% Tween) byrotation for 30min at 4 �C.One-tenth of the volume ofNi2+NTAagarose, prewashed in the same buffer, was added to the lysate,followed by rotation at 4 �C for 3 h. The beads with boundproteins were washed twice with buffer A and then twice withbuffer B (10% glycerol, 250 mMNaCl, 20 mMTrisHCl (pH 8.0),0.1% Tween, 0.2 mM PMSF and protease inhibitor cocktailcomplete (Roche)). The bound proteins were eluted by incubat-ing the beads in 4 volumes of buffer C (10% glycerol, 250 mMNaCl, 20 mM Tris HCl (pH 8.0), 0.1% Tween, 0.2 mM PMSF,300 mM Imidazole, 50 mM EDTA) and concentrating thesample by ultrafiltration with Microcon YM-10 (Millipore). Alter-natively to elution, the beads were washed twice with 25 mMammonium bicarbonate and direct on-beads digestion wasperformed.
Mass Spectrometry AnalysisThe protein bands were excised from the gel and processed
as in.19 The gel slices were dehydrated with 300 μL of 50%acetonitrile followed by 300 μL of 100% acetonitrile, then

C dx.doi.org/10.1021/pr200189p |J. Proteome Res. XXXX, XXX, 000–000
Journal of Proteome Research ARTICLE
rehydrated with 300 μL of 50 mM ammonium bicarbonate. Afinal dehydration was performed with 2 washes of 300 μL of 50%acetonitrile, followed by 2 washes of 300 μL of 100% acetonitrile.Each wash was carried out for 10 min at 25 �C with shaking at1400 rpm. The gel slices were dried in a SpeedVac at 35 �C for10 min. For trypsin digestion, the gel slices were preincubatedwith 7 mL of 15 ng/mL trypsin (Promega # V5280) at roomtemperature for 10 min. Afterward, 25 μL of 50 mM ammoniumbicarbonate was added, and the gel slices were incubated at 37 �Cfor 16 h. The peptide-containing supernatants were dried at56 �C by SpeedVac for 30 min, then resuspended in 20 μL ofsolution containing 0.05% formic acid and 3% acetonitrile formass spectrometry experiments. Alternatively, for the on-beadsdigestion, ammonium bicarbonate was added to the beads at afinal concentration of 25 mM, trypsin digestion was performedovernight (12.5 ng/mL), and the peptide mixture was furtherpurified on a Zip tip (Millipore # ZTC18S096). The resultingpeptides were analyzed with a nano-HPLC (Agilent Technolo-gies 1200) directly coupled to an ion-trap mass spectrometer(Bruker 6300 series) equipped with a nanoelectrospray source.The separation gradient was 7 min from 5 to 90% acetonitrile.The fragmentation voltage was 1.3 V. The analysis of the spectrawas performed with the DataAnalysis for the 6300 Series IonTrap LC�MS Version 3.4 software package. The samples wererun in two different modes. For peptide identification, the iontrap acquired successive sets of 4 scan modes consisting of: fullscan MS over the ranges of 200�2000 m/z, followed by 3 data-dependent MS/MS scans on the 3 most abundant ions in the fullscan. Alternatively, for the confirmation and quantification of thepresence of a particular peptide in the sample, the ion trap was setin MRM mode. The sample was separated using the samenanoLC gradient, and the ion trap was set to isolate, fragment,and MS/MS scan 5 parental ions having predetermined M/Zratios. The relative quantity of each peptide in the differentfractions was estimated by comparison between the peak areas inthe Total Ion Chromatograms (TIC) for this peptide obtainedfrom MRM analysis of these fractions.
MicroscopyMRC-5 fetal lung fibroblasts were grown on coverslips in
6-well plates in DMEM high glucose containing dialyzed FBS.Cells were cotransfected with the plasmid constructs BirA-Rad18(1 μg) and BAP-H2AZ (1 μg) using TurboFect (Cat. #R0531,Fermentas). Forth-eight hours after transfection, cells weretreated with UVC (20 J/m2, Philips TUV 15W/G 15 TB lamp).After 6 h of irradiation, the DMEM containing dialyzed FBS wasremoved and the cells were pulse-labeled for 5 min with biotin(5 μg/mL final concentration). The biotin-containing mediumwas then removed, and cells were fixed either immediately(pulse) or 2 h after the pulse (chase). For staining, cells werewashed once with cold PBS and treated with CSK buffer(100 mM NACl, 300 mM Sucrose, 3 mM MgCl2, 10 mM Tris-HCl pH 7.5, 1 mM EGTA, Triton 0.2%) for 5 min with lightagitation. Cells were then washed twice with cold PBS. Fixationwas done in 4% formaldehyde for 20 min at room temperature(RT). After fixation, cells were rinsed with ice-cold methanol at�20 �C for 10 s. Cells were then washed 3 times for 5 min withPBS (1�) at RT. Blocking was done for 30 min using 3% BSAand 0.5% Tween20 in PBS. Cells were then incubated with eithermouse monoclonal anti-PCNA antibody (Santa Cruz; PC10; sc-56) for 1 h (1/500 in blocking solution) or mouse monoclonalanti-Rad18 antibody (Abcam; ab57447) followed by 3 washes in
PBS (1�) at RT. Cells were then incubated with goat anti-mouse secondary antibody conjugated with Alexa-488 (Invitrogen# A11017) for 1 h (1/1000). Streptavidin-Cy3 conjugate (Sigma;# S-6402) was also added to the same incubation mix (1/500).After 3 washes in PBS (1�) at RT, coverslips were mounted onglass slides using VectaShield mounting medium (Vector La-boratories; # H-1000). The cells were observed under a ZeissLSM 510 Meta confocal microscope, using a Plan-Apochromat63� 1.4 oil immersion objective. Imaging was performed withsequential multitrack scanning using the 488 and 543 nmwavelengths lasers separately. The colocalization analysis wasperformed with LSM Examiner software. Pearson’s correlationcoefficient was calculated with setting the threshold signalcommon for all images compared.
’RESULTS
1. Design and Features of the SystemThe principle of the method is presented in Figure 1A. Two
proteins to be tested for their proximity in vivo are coexpressed inthe cells of interest, the first protein being expressed as a BirAfusion and the second one as a fusion to the Biotin AcceptorPeptide (BAP). More efficient biotinylation of the BAP isexpected when the two proteins are in proximity to each other,for example, when interaction occurs (Figure 1A, bottom), ascompared to the background biotinylation arising from randomcollisions between noninteracting proteins (Figure 1A, top). Thebiotinylation status of the BAP fusion can be further monitoredby Western blot or mass spectrometry.
To implement this principle, we constructed two types ofvectors: for expression of the BirA fusion and for expression ofthe BAP fusion, correspondingly (Figure 1B, top).We constructedeach vector in two forms, with the protein expression regulatedeither by a strong CMV or a weaker MoMuLV enhancer. In thiswork, we used the MoMuLV enhancer for the expression of BirAfusions, while the BAP fusions were expressed from the vectorswith the stronger (CMV) promoter. This setting typically allowedus to achieve an excess of the BAP fusion (biotinylation target)over the BirA fusion (biotinylating enzyme), which is essential forthe further quantitative analysis.
In addition, we significantly modified the sequence of the BAP,by introducing two flanking arginines that yield a peptide of an“MS/MS-friendly” size after trypsin digestion of the BAP sequence.We also included a 7XHis tag in theBAP-domain, to have the optionof purifying or/and monitoring the amounts of the target proteinregardless of its biotinylation status (Figure 1B, bottom).
To test if the newly designed BAP could be biotinylated by BirA,we cotransfected 293T cells with BirA-GFP and BAP-GFP. Regard-less of the fact that GFP can form dimers at high concentrations,20
the main aim of this experiment was not to detect the GFP-GFPinteraction but rather to test the BAP biotinylation, as even back-ground biotinylation due to random collisions between noninter-acting proteins could be sufficient to give detectable signal. As seenin Figure 1C, the biotinylation was indeed observed; moreover,as expected, the level of biotinylated BAP-GFP linearly increasedwith the time of incubation of the cells with biotin. Notably, inparallel contrasfections, the GFP carrying a different BAP sequence(MAGLNDIFEAQKIEWHE), used previously,12 was biotinylatedwith significantly faster kinetics (the timeof half-saturationwas15min,contrasting with 680 min for the newly designed BAP). Becausesaturation in the BAP biotinylation levels obscures differences inbiotinylation efficiency, the slower kinetics of biotinylation of the

D dx.doi.org/10.1021/pr200189p |J. Proteome Res. XXXX, XXX, 000–000
Journal of Proteome Research ARTICLE
new BAP was welcome, given our ultimate goal to correlate BAPbiotinylation with protein�protein proximity.
2. Biotinylation Levels Are Interaction and/or ProximityDependent
To confirm that our method can detect specific protein�proteinproximities, we used several experimental systems described below.a. Protein Oligomerization (TAP54α vs HP1γ). TAP54α
(RuvB-like 1) was shown to exist as oligomers, composed ofseveral copies together with the closely related TAP54β (RuvB-like 2).21,22 The heterochromatin proteins HP1 (α, β, γ) are alsoknown to oligomerize through their chromoshadow domains,23,24
and we typically detected various HP1 forms in our affinity pull-downs using epitope-tagged HP1 proteins (VO, in preparation).On the other hand, no interactions between theHP1 and the RuvB-like proteins had been reported; thus, the heterologous cotrasfec-tion with these two proteins (e.g., BirA-HP1γ and BAP-TAP54α) is
expected to give close to background levels of biotinylation.Figure 2A (top) shows the biotinylation status of the BAP-TAP54α and BAP-HP1γ, when these proteins were coexpressedwith either the BirA-TAP54α or BirA-HP1γ fusions. Whereasthe total levels of the BAP fusions are not affected, as judged byWestern blotting with the anti-6XHis antibody (Figure 2A, topleft), the BAP-TAP54α is appreciably biotinylated when coex-pressed with the homologous construct BirA-TAP54α. On theother hand, BAP-HP1γ is significantly more strongly biotiny-lated when coexpressed with the BirA-HP1γ, as compared to thecontrol cotransfectionwith heterologous BirA-TAP54α (Figure 2A,top right). In analogous experiments, the related proteins TAP54βand HP1α behaved similarly to the TAP54α and HP1γ, corre-spondingly (not shown).In the previous experiment, we could not measure the levels of
the BirA-TAP54α and BirA-HP1γ proteins. To rule out the
Figure 1. Design and features of the system. (A) Principle. Two candidate interaction proteins X and Y are coexpressed in the cells of interest, the firstprotein being expressed as a BirA fusion, and the second one as a fusion to the Biotin Acceptor Peptide (BAP). The cells are pulse-labeled with biotin.Where there is interaction (top), the BAP-X fusion should bemore efficiently biotinylated. (B) Vector design. Top, the positions of the CMV/MoMuLVenhancers, and of the BAP and BirA sequences, relative to the cloned ORF, are indicated. Bottom, nucleotide and amino acid sequences encoding thenewly designed His-BAP are shown. (C) New BAP is biotinylated with slower kinetics as compared to the old BAP. Left, Western analysis ofbiotinylation of the new BAP-GFP (ILEAQKIVR, left) versus previously used efficient old BAP-GFP (MAGLNDIFEAQKIEWHE, right) in thepresence of BirA-GFP fusion. Top, α-6XHis-HRP signal; bottom, streptavidin-HRP signal. Right, quantification of the kinetics of biotinylation of thetwo BAPs. The streptavidin signal was first normalized by taking a ratio with the respective α-6XHis signal. For every individual experiment, thenormalized value of the biotinylation level for each time point was divided by the respective value for the 24 h time point from the same experiment,which was taken as 100%. Plotted are averaged results from three independent experiments.

E dx.doi.org/10.1021/pr200189p |J. Proteome Res. XXXX, XXX, 000–000
Journal of Proteome Research ARTICLE
remaining possibility that the observed differences in biotinyla-tion are due to variations in the amounts of these proteins betweendifferent transfection samples, both BAP-TAP54α and BAP-HP1γ
fusions were now coexpressed in the same cells, along with eitherthe BirA-TAP54α or BirA-HP1γ fusions (Figure 2A, bottom).Despite the presence of comparable amounts of the BAP-TAP54α
Figure 2. Biotinylation levels are interaction/proximity dependent. (A) HP1γ versus TAP54α oligomerization. Top, 4 combinations of BirA and BAPfusions were transfected separately into cells: 1,5, BirA-TAP54α + BAP-TAP54α; 2,6, BirA-HP1γ + BAP-TAP54α; 3,7, BirA-TAP54α + BAP-HP1γ;4,8, BirA-HP1γ + BAP-HP1γ; 1�4, α-His-HRP Western; 5�8, streptavidin-HRP Western. The positions of the BAP-fusions and nonspecific signal(NS) are indicated by lines, and the biotinylated proteins are indicated by black triangles. Bottom, Biotinylation of BAP-HP1γ and BAP-TAP54α,cotransfected into the same cells, by either BirA-HP1γ or BirA-TAP54α. 1,4, untransfected cells; 2,5, BirA-TAP54α + BAP-TAP54α + BAP-HP1γ; 3,6,BirA-HP1γ + BAP-TAP54α + BAP-HP1γ. Left, α-His-HRP Western, Right, streptavidin-HRP Western. The positions of the BAP-fusions (triangles)and nonspecific signal (NS) are indicated. Importantly, the nonspecific signal (NS) is also detected in untransfected cells, thus it corresponds to cellularproteins that bind to theα-His antibodies or streptavidin, and do not represent nonspecific biotinylation by BirA-fusions. (B) Binary interaction betweenHP1γ and KAP1. Top, BirA-KAP1BD biotinylating BAP-HP1γ. 1,5, BirA-KAP1BDwt + BAP-HP1γ ; 2,6, BirA-KAP1BDmut + BAP-HP1γ; 3,7, BirA-KAP1BDwt + BAP-GFP; 4,8, BirA-KAP1Bdmut + BAP-GFP. Left, α-His-HRPWestern. Right, Streptavidin-HRP Western. The positions of the BAP-fusions and nonspecific signal (NS) are indicated. Bottom, BirA-HP1γ biotinylating BAP-KAP1BD. 1,3,5,7, BirA-HP1γ + BAP-KAP1BDwt; 2,4,6,8,BirA-HP1γ + BAP-KAP1Bdmut. 1,2, No biotin was added to cells; 5,6, 10-fold excess of a plasmid expressing untagged KAP1BDwt was added; 7,8, thesame as 5,6 but KAP1BDmut used. Top, α-His-HRPWestern. Bottom, streptavidin-HRPWestern. (C) Colocalization in the nucleus (PCNA+H3.1 vsPCNA+CenpA). Left, Western analysis of the biotinylation efficiency of BAP-H3.1 (lanes 1,3) as compared to BAP-CenpA (2,4) by BirA-PCNA fusion(3,4). BirA-GFP biotinylation (1,2) was used to control for the differences in biotinylability of BAP-peptide in context of H3.1 and CenpA fusion. Top,αHis. Bottom, Streptavidin signals. Middle, Quantification of the relative biotinylation efficiency. The signal intensities were first measured bydensitometry, then the streptavidin signal for every BAP-fusion was normalized by dividing it by the α-His signal. Relative efficiency of biotinylation of arespective BAP-fusion by the BirA-PCNA as compared to BirA-GFPwas obtained by dividing the normalized values of biotinylation for the lanes 3 and 1for H3.1, and for lanes 4 and 2 for CenpA, respectively. Shown are results of calculations for two independent experiments. The lower biotinylation signalin the case of BirA-PCNA transfection is due to a significantly lower levels of BirA-PCNA expression levels as compared to BirA-GFP (not shown). Right,Replication-like foci of biotinylated BAP-H3.1 after cotransfection with BirA-PCNA. Confocal microscopy of cells cotransfected with “BAP-H3.1 +BirA-PCNA” (top) or “BAP-CenpA + BirA-PCNA” (bottom), labeled with biotin 48 h after transfection, and stained with straptavidin-Cy3 (left) oranalyzed by Differential Interference Contrast (DIC, right).

F dx.doi.org/10.1021/pr200189p |J. Proteome Res. XXXX, XXX, 000–000
Journal of Proteome Research ARTICLE
and BAP-HP1γ fusions in each sample (Figure 2A, bottom left),each protein was more strongly biotinylated in the sample with thehomologous BirA fusion (Figure 2A, bottom right).b. Binary Protein�Protein Interaction (KAP1 and HP1).
HP1 strongly interacts with the KAP1 protein, and the domain ofKAP1 responsible for the interaction, including a crucial residue,has been identified.25,26 We chose the HP1-binding domain ofKAP1 (called here KAP1BDwt) together with the point mutantabrogating the interaction (KAP1BDmut) to test if our systemcan detect specific binary protein�protein interactions (Figure 2B).First, we coexpressed either the wild type or the mutant version ofBirA-KAP1BD with BAP-HP1γ. BAP-GFP was used as negativecontrol (Figure 2B, top). Strong biotinylation of BAP-HP1γ wasobserved only when it was coexpressed with BirA-KAP1BDwt(lane 5). The BirA-KAP1Bdmut construct yielded levels of bio-tinylation (lane 6) comparable to that of BAP-GFP (lanes 7, 8),most likely reflecting the background levels of labeling.We also performed a reciprocal experiment, by expressing
BAP-KAPBD1wt or BAP-KAP1BDmut, together with the BirA-HP1γ fusion (Figure 2B, bottom). Judging by the anti-6XHisWestern, the expression levels of the mutant and wild type frag-ments of KAP1 were identical (Figure 2B, bottom, top). How-ever, the BAP-KAPBD1wt was biotinylated to a significantlygreater extent than the mutant protein (Figure 2, bottom, lane 3versus 4). Notably, the coexpression of the competitor KAPBDwt(which contains no BAP or His-tag) suppressed this biotinylation(lane 5), whereas themutant competitor KAPBDmut did not havean effect (lane 7).c. Colocalization in the Nucleus (“PCNA + H3.1” vs
“PCNA + CenpA”). Two proteins might not stably interact witheach other and yet be colocalized in the cell, which could alsoincrease the biotinylation efficiency. Replication processivity factorPCNA binds directly to p150, the largest subunit of CAF-1, andthe two proteins colocalize at sites of DNA replication in cells.27
CAF-1 is a histone chaperone, which assists in chromatin assemblyon replicating DNA, binding directly to the H4/H3 histonedimer.28 No direct interaction between PCNA and histones hasbeen reported. On the other hand, a specialized H3 histonevariant CenpA is deposited on centromeres, in DNA replicationindependent manner, and thus it is not expected to be present atreplication sites.29 Therefore, despite the absence of direct inter-action, one would expect to observe higher proximity betweenPCNA and canonical H3.1 histone, as compared to PCNA andCenpA. Consistent with these expectations, BAP-H3.1 was bio-tinylated more efficiently by BirA-PCNA fusion, as compared toBAP-CenpA (Figure 2C). Using fluorescent microscopy, we havealso observed that in some cells transfected with “BAP-H3 + BirA-PCNA”, BAP.H3.1 is biotinylated in pattern of bright foci, closelyresembling the pattern of replication foci. No such pattern wasobserved in the “BAP-CenpA + BirA-PCNA” transfected cells,which is consistent with the notion that increased biotinylation ofBAP-H3.1 by BirA-PCNA is due to their colocalization at replica-tion sites in nuclei.d.Different SubnuclearDomains (macroH2AvsH2ABBD).
As another model example of protein proximity due to similarlocalization in the cell, we used replacement variant histones. Thereplacement variant histoneH2ABBDhas been shown tomark activechromatin (i.e., to be excluded from heterochromatin, such as Barrbodies),30 whereas the variant macroH2A has been shown toassociate with repressed chromatin.31,32 One should expect that, onaverage, different molecules of the histone of the same variant typewould be closer to each other in the nucleus as compared to the
molecules of different histone type. The BirA- and BAP- fusions ofthese two proteins were generated and cotransfected in differentcombinations. Both total nuclear lysate and the chromatin fractionwere analyzed by Western blot. In both cases, the coexpression witha homologous BirA fusion significantly increased the efficiency ofbiotinylation of the BAP-histone fusion (Figure S1, left, and forquantification, Figure S1, right, Supporting Information), furthersupporting the notion that, regardless of physical interaction,similar localization could also be detected with proximity-medi-ated biotinylation.e. Intracellular Compartmentalization (GFP and HP1).
Biotinylation efficiency could also depend on compartmentaliza-tion, as sharing common compartment will increase the effectiveconcentration of the BirA fusion near the BAP-target and promotethe reaction, even when driven by random collisions betweennoninteracting proteins. Accordingly, we compared biotinylationof BAP-GFP and BAP-HP1γ when coexpressed with BirA-GFPor BirA-TAP54α fusions. Although TAP54α and HP1γ have notbeen reported to interact, they both are nuclear proteins, whereasGFP is found in both nucleus and cytoplasm (Figure S2C,Supporting Information). Thus, we expected that BAP-GFP willbe less efficiently biotinylated by the BirA-TAP54α, as comparedto BAP-HP1γ as a target. Indeed, despite the comparable totallevels of BAP-GFP and BAP-HP1γ in the cell, (as α-6XHisWesternshows, Figure S2A, top, lane 2, Supporting Information), BAP-HP1γwas consistently biotinylated with higher efficiency than BAP-GFP,when these two proteins were coexpressed together with BirA-TAP54α (Figure S2A, bottom, lane 2, Supporting Information). Incontrol experiment with BirA-GFP fusion, BAP-GFP was biotiny-lated with higher efficiency than BAP-HP1γ (Figure S2A, bottom,lane 1, Supporting Information), consistent with the notion that thefraction of BirA-GFP excluded from the nucleus was not available forthe BAP-HP1γ biotinylation, but could biotinylate the respectiveBAP-GFP fraction.
3. MS/MS Detection and MultiplexingWe next tested whether the biotinylated and nonbiotinylated
forms of the BAP peptide could be detected by mass spectro-metry instead of Western blot. We used propionylation to pro-tect the nonbiotinylated BAP peptide from tryptic cleavage onthe target lysine. This method has been widely used elsewhere—for example, in the analysis of histone modifications.33,34 Such anapproach allows one to obtain modified and nonmodified pep-tides of comparable sizes, facilitating the interpretation of results.
As seen on the Figure 3A, we can detect both the biotinylatedand the propionylated (i.e., nonbiotinylated) versions of BAP byLC�MS/MS, as verified from the comparison between thedetected mass spectra and the theoretically predicted spectra.Thus, as expected, in addition to the Western analysis, LC�MS/MS can also be used to monitor the biotinylation of the targetproteins.
In the context of our approach, an important advantage ofmass spectrometry is the ability to distinguish between versionsof the same peptide that differ in amino acid sequence. One canuse this feature by slightly modifying the sequence of the BAPpeptide, in order to design a “multiplexing” approach that wouldallow one to test and compare the biotinylation levels of differentproteins in the same experiment. To test this possibility, wegenerated two new versions of the BAP peptide, replacing Valwith Phe or Tyr, which have different masses (Figure 3B). TheORF of H2AZ was cloned into these vectors, and the resultingplasmids were cotransfected with BirA-H2A in 293T cells.

G dx.doi.org/10.1021/pr200189p |J. Proteome Res. XXXX, XXX, 000–000
Journal of Proteome Research ARTICLE
Afterward, the transfected cells were mixed, and the 6XHis-tagged histones were purified from the guanidine HCl lysate ofthe cells by immobilization on Ni-NTA beads. The proteins weredigested by trypsin directly on the beads, after which the MRManalysis was used to detect, in the same sample, the biotinylatedand propionylated forms of all three peptides (Figure 3C).
An aliquot of the Ni-NTA beads was used to elute the threeBAP-H2AZ fusions. As can be seen from the comparison betweenthe LC-MS/MS (Figure 3F) and Western (Figure 3D) analyses,whereas Western blotting fails to distinguish between thedifferent biotinylated proteins because they contribute to thesame signal on the autoradiograph, all biotinylated and non-biotinylated forms of the corresponding BAP peptides can bedetected separately and distinguished from each other by massspectrometry (see Supplementary Figures S3 and S4 for theMS/MSspectra of the corresponding ions, Supporting Information).Thus, it should be possible to use this approach to simultaneouslydetect and compare the interactions of different proteins (e.g.,
different point mutation variants of the same protein), carryingdifferent versions of BAP, with a single BirA fused protein in thesame cells.
Alterations in amino acid sequence can change affinity of aBAP to BirA and thus can affect their biotinylation efficiencyregardless of protein�protein proximity. Accordingly, we com-pared biotinylation levels of different BAPs in the context of thesame protein pair “BAP-H2AZ +BirA-GFP”. As one can see fromthe Figure S5 (Supporting Information), the biotinylation effi-ciencies do vary for different BAP peptides. The resulting problemswith interpretation could be controlled by swapping different BAPsbetween the tested proteins in reciprocal experiments.
4. Stable IsotopesAn alternative approach tomultiplexing, free of the problem of
variation in biotinylation efficiency between peptides with dif-ferent sequence, is the use of stable isotopes, a strategy commonin quantitative proteomics.35,36 To test if the stable isotope
Figure 3. Multiplexing. (A) MS/MS detection of BAP. Shown are the MS/MS fragmentation spectra of the propionylated (top) and biotinylated(bottom) forms of BAP, with the detected y-series and b-series ions indicated. (B) NewBAPs. Shown are the nucleotide and amino acid sequences of thenew BAPs (BAP1118 and BAP1135). The site of the amino acid change, as compared to the original BAP1070, is indicated by a box. (C) Scheme of themultiplexing experiment. Cells were transfected with BirA.H2A and with a vector expressing different BAP fusions of H2AZ. After 4 h labeling, they wereharvested, mixed, and the BAP-H2AZ proteins purified on Ni2+-NTA agarose. (D) Ni2+-NTA purification of the BAP-H2AZ fusions. M, Marker; In,input; FT, flowthrough; E, eluate. Left, Coomassie Brilliant Blue stain; right, streptavidin-HRP Western. The positions of BAP-H2AZ and theubiquitinated BAP-H2AZ are indicated. (E) MRM detection of different BAPs. Shown are extracted ions chromatograms for the most intensivefragmentation ions present in theMS/MS spectra of the respective peptides. Note that the BAP1135 is propionylated on both K and Y, which affects theM/Z of the respective ions.

H dx.doi.org/10.1021/pr200189p |J. Proteome Res. XXXX, XXX, 000–000
Journal of Proteome Research ARTICLE
labeling scheme is also applicable to our system, we repeated theexperiment with TAP54α and HP1γ (Figure 4A). This time,however, the BirA-TAP54α�containing combination was grownin medium containing 12C6 lysine, whereas the BirA-HP1γ wasgrown in medium containing 13C6 lysine. After labeling withbiotin, the cells were harvested and the two suspensions combined.All further procedures, including SDS-PAGE separation, gel bandexcision and trypsin digestion were performed with the mixture.The degree of BAP-HP1γ biotinylation by BirA-HP1γ and BirA-TAP54α was estimated by calculating the ratios between the
biotinylated versus propionylated versions of the heavy (BirA-HP1γ) or light (BirA-TAP54α) peptides (See Figure 4B for theMS/MS data). As seen on the Figure 4C, a significant difference(about 17-fold) in biotinylation of BAP-HP1γ by the two BirAfusions was observed; the reciprocal difference was seen for theBAP-TAP54α (not shown).
The quantitative measurement of biotinylation should benefitfrom determining the molar amounts of biotin label on the BAPpeptide, which is challenging to estimate with Western analysis,as the signal intensity can depend dramatically on the antibody
Figure 4. Stable isotopes. (A) Experimental scheme 1. Cells were grown inmedium containing K12C6 or K13C6 and transfected, respectively, with BirA-
TAP54α or with BirA-HP1γ, along with a mixture of BAP-TAP54α and BAP-HP1γ. After 4 h labeling, the cells were harvested and mixed, the proteinsfrom the nuclei were fractionated on SDS-PAGE, and the gel bands containing the HP1γ and TAP54α were processed for MRM analysis on LC�MS/MS. (B) MS/MS spectra of heavy BAP1070. Shown are the MS/MS fragmentation spectra of the propionylated (top) and biotinylated (bottom) formsof K13C6-labeled BAP1070, with the detected y-series and b-series ions indicated. (C) MRM analysis of a SILAC experiment. Shown are extracted ionschromatograms (EIC) for the most intensive fragmentation ions present in the MS/MS spectra of the BAP1070. PL, propionylated light; PH,propionylated heavy; BL, biotinylated light; BH, biotinylated heavy. The areas of every peak (A) are indicated on the left of the correspondingchromatogram. PL and BL correspond to transfection with the BirA-TAP54α fusion, whereas PH and BH correspond to transfection with the BirA-HP1γ fusion; accordingly, the BAP1070 peptide is 17 times better biotinylated in the BirA-HP1γ�fusion-containing sample. (D) Experimental scheme2. Cells were grown in medium with K12C6 or K
13C6 and transfected with BirA-HP1γ and BAP-HP1γ. The K12C6 grown cells were labeled overnightwith biotin before being harvested and mixed, in equal amounts, with the K13C6 cells grown in absence of biotin. (E) MRM quantification of differentforms of BAP1070. Shown are extracted ion chromatograms for the different forms of BAP1070 from the above experiment. The positions of the peaks(labeled as in the legend to Figure 4c) are indicated by arrows. Control, the K12C6 grown cells were not labeled with biotin. Biotin, the K
12C6 grown cellswere labeled with biotin. (F) Determination of the coefficient of relative ionization of the propionylated and biotinylated forms of BAP1070. Shown arethe histograms representing the areas of the peaks from the control experiment (as in E) and two independent biotinylation experiments (Biotin 1 andBiotin 2), and the relative ionization coefficient k between the biotinylated and propionylated BAP peptides for each experiment, estimated ask = (HP � LP)/(LB � HB), where the areas of the peaks are labeled as in the legend to C.

I dx.doi.org/10.1021/pr200189p |J. Proteome Res. XXXX, XXX, 000–000
Journal of Proteome Research ARTICLE
used. A comparison between the TIC signal of the biotinylatedand propionylated BAP in LC�MS/MS also cannot be useddirectly, as the ionization efficiency generally depends on chemi-cal structure and will thus be affected by the change from apropionyl to a biotin residue. The use of stable isotopes helped usto estimate relative ionization intensities between these twoforms of BAP. Cells grown on 12C6 lysine were cotransfectedwith BAP-HP1γ and BirA-HP1γ and then labeled overnight withbiotin. In parallel, cells were grown on 13C6 lysine medium andtransfected with the same plasmids, but not labeled with biotin.The labeled cells were harvested and mixed, in equal amounts,with the corresponding sample of the heavy-isotope�grown cells(Figure 4D). The BAP-HP1γ protein, prepared from the cellmixture by Ni2+-NTA pulldown and SDS-PAGE separation, waspropionylated, digested by trypsin, and analyzed by LC�MS/MS(Figure 4E). The relative ionization coefficient k between thebiotinylated and propionylated BAP peptides was estimated ask = (HP � LP)/(LB � HB), where HP corresponds to the areaof TIC of heavy propionylated, LP of light propionylated, LB oflight biotinylated, and HB of heavy biotinylated BAP. K werecalculated for two independent experiments, giving an averagevalue 11.9 ( 1.6 (Figure 4F).
5. Monitoring the Protein at a Defined Time after theInteraction Has Occurred
The distinctive feature of our method is in leaving one of thetested proteins (BAP-fusion) with a permanent molecular mark,which can persist after the proximity between the two proteinshas been lost. One can take advantage of this property to addkinetic dimension to the study of protein�protein proximity.
As one such possibility, we tested if a pulse-chase labeling withbiotin can be used to trace the fate of a BAP-fused protein ofinterest that was interacting at the moment of labeling withits BirA-fused proximity partner. This approach is particularlyinteresting if one wishes to study multistep intracellular pro-cesses, where the interaction partners and protein properties(such as its localization and post-translational modifications)change. Thus, in addition to purifying and studying the proper-ties of a protein of interest at the moment of its interaction/proximity with another protein, our method will enable one alsoto study the same cellular fraction of the protein at defined timesafter the interaction has occurred.
As a “proof of principle” model to explore this opportunity, weused the Rad18 protein, known to form characteristic foci in cellnuclei (these foci are believed to correspond to specialized compart-ments containing replication proteins, including PCNA). MRCfibroblasts were cotransfected with the BirA-Rad18 fusion togetherwith BAP-H2A, a histone that is homogenously distributed over thenucleus, but, in our system, is expected to be biotinylated only in theneighborhood of the BirA-Rad18 containing foci. Two days aftertransfection, the cells were pulse-labeled with biotin (Figure 5A).The cells were either fixed immediately after the biotin pulse (pulsesample), or else intensively washed to eliminate biotin and then leftin fresh medium for 2 h before fixation (chase sample). As demo-nstrated by Western analysis (Figure 5B), only the BAP-H2Ahistone is biotinylated under these conditions, hence immunofluor-escent microscopy detection of the biotin signal should reveal alocalization of the BirA-Rad18 in proximity to BAP-H2A at themoment of pulse-labeling.
Consistent with such expectation, staining of the pulse-labeledcells with streptavidin-Cy3 revealed foci of labeled BAP-H2Awhich colocalized with Rad18 (Figure 5C top) as well as with
PCNA (Supplementary Figure S6, Supporting Information),detected by specific antibodies. However, the analysis of thechase sample revealed a different pattern of staining (Figure 5Cmiddle, and Supplementary Figure S6, Supporting Information).Whereas both Rad18 and PCNA formed foci, the biotin signalappeared more diffuse, and we generally observed a smallernumber of foci per cell, whereas the colocalization of the remain-ing biotinylated foci with the PCNA or Rad18 foci was consider-ably less pronounced (see Figure 5C bottom for an example).
We conclude that, as was expected, BAP-H2Awas biotinylatedin the proximity of BirA-Rad18 at the moment of the biotin pulselabeling, and that, with time, the Rad18 partially changed itslocation inside the nucleus and started to associate with differentparts of chromatin, as could be seen by the loss of colocalizationof the Rad18 (and PCNA) foci with the biotinylated histones.Regardless of its precise interpretation, this observation clearlydemonstrates the possibility tomonitor the protein of interest (inthis case, BAP-H2A), which was proximity-biotinylated by theBirA fusion of another protein, at later times, that is, after theproximity between these two proteins could have been lost.
’DISCUSSION
FRET/BRET, PCA and two-hybrid methods—the predomi-nant approaches for studying protein�protein interactionsin vivo—frequently lie outside the sphere of expertise of a typicalproteomics laboratory. The development of more mass-spectro-metry and biochemistry-oriented protocols would be a welcomeaddition to the application portfolio of a standard mass-spectro-metry facility.
Also, the FRET/BRET and PCA data are usually interpretedin terms of protein�protein interactions. However, as far asin vivo data are concerned, the interpretation in terms ofproximity between two proteins appears to be more adequatethan that of “physical interaction”. First, unlike the in vitrobinding studies, where the environment (ion composition,cofactors, etc) can be controlled at will, the intracellular micro-environment is far more challenging to control (to say the least),and the contribution of local intracellular context in stabilizing aninteraction can never be ruled out. Second, two proteins couldinteract via an intermediate, for example, be near each other incell due to their binding to two closely located sites on DNA.Finally, the role of dynamic self-organization1,2 in bringing mol-ecules together, without their physical interaction, also cannot beruled out. Thus, in the in vivo context, the notion of protein�protein proximity (and, accordingly, “PPP-networks”), as opposedto protein�protein interactions (PPI-networks), appears to be amore adequate term—as, in addition to the direct physical inter-actions, it can also cover interactions via intermediates, as well asthe aspects of intracellular order arisen via dynamic self-organiza-tion. Regardless of physical interactions, any information about theprotein proximity in vivo has a value in itself, as it could be useful inthe ultimate task of reconstructing the spatial order in the cell.
In these terms, one shortcoming of the FRET/BRET, PCAand two hybrid approaches is that they measure short-rangeproximity only. The methodologies that could probe the proteinproximities on larger scales could serve as a complement to theseestablished methods, providing additional information aboutintracellular order. Given that it is sensitive to intracellularcompartmentalization, the scope of proximity utilizing biotinyla-tion approach is apparently not limited to the short-rangeproximities between proteins. We have to admit, however, that

J dx.doi.org/10.1021/pr200189p |J. Proteome Res. XXXX, XXX, 000–000
Journal of Proteome Research ARTICLE
the exact distance range in which the proximity can still be detec-ted could depend on the pair of proteins studied and thusmerits afurther study. In particular, the distance range can depend on themutual orientation and the mobility of proximity partners. As anillustration (Figure S7, Supporting Information), first considertwo proteins (A1 and A2) that are close to each other, but theirmovement is strongly constrained (e.g., by being tethered to arigid scaffold). In this case, the BirA and BAPmoieties have a lowprobability to directly encounter each other. In the second case,the average distance between proteins (B1 and B2) is larger, butthey move more freely. This will lead to higher chance of bio-tinylation, which, as a permanent modification, will accumulateon the BAP-tagged protein. This illustration, together with theeffects of compartmentalization, also suggests that due to themany factors that can contribute to the differences in observedbiotinylation levels, the correct interpretation of data requirescareful choice of proper controls. For example, when testingproximity between nuclear proteins, one cannot use BAP-GFP asa negative control, as its extranuclear fraction will be inaccessiblefor BirA fused to a nuclear protein and thus contribute to an
artificially low background biotinylation levels (and any pair ofnuclear proteins will give a higher biotinylation signal). Theproper negative control should be BAP-GFP with a nuclearlocalization signal. On the other hand, protein�protein interac-tions or proximities are often studied not for their own sake, butrather to access the network of causal relations in the cell. Fromthis perspective, the increased ability of two PUB proteins to bio-tinylate one another (above the rate expected from the modelingof biotinylation rates based on random protein�protein colli-sions in a homogeneous solution) has direct relevance, regardlessof the exact interpretation of what had caused the biotinylationincrease.
To demonstrate the utility of our approach, we have chosenseveral examples of protein pairs that represent different instancesof protein proximity. (a) Many proteins can form homooligo-mers, and we demonstrated, using the examples of TAP54α andHP1γ self-association, that such interactions can be detected withour method. (b) To show that this methodology is not limited toprotein self-association, we also demonstrated that it can detectinteraction between two different proteins (e.g., KAP1 and HP1γ).
Figure 5. Pulse-chase experiment. (A) Experimental scheme. MRC fibroblasts are cotransfected by the BirA-Rad18 fusion together with BAP-H2A.Two days after transfection, the cells are pulse-labeled with biotin 6 h later. The cells are either fixed immediately after the biotin pulse (pulse sample), orelse washed extensively to remove biotin, then left for 2 h before fixation (chase sample). (B) Specificity of biotinylation. Western blot analysis withstreptavidin-HRP, showing that a specific signal appears only after BirA-Rad18 and BAP-H2A are coexpressed. One, control untransfected sample; 2,BirA-Rad18; 3, BirA-Rad18 + BAP-H2A; 4, BAP-H2A. The two forms of H2A (nonubiquitinated and ubiquitinated), both biotinylated in thisexperiment, are indicated by asterisks. (C) Colocalization analysis. Left Top, pulse sample. Middle, chase sample. Bottom, zoomed area from the chasesample showing an example of biotinylated foci that do not colocalize with the Rad18 foci and vice versa (indicated by asterisk).

K dx.doi.org/10.1021/pr200189p |J. Proteome Res. XXXX, XXX, 000–000
Journal of Proteome Research ARTICLE
(c) Two proteins do not have to interact directly, but can be inproximity in common locus (e.g., PCNA and histoneH3.1, or thealternative histones H2ABB and macroH2A, enriched in activechromatin and repressed chromatin in the nucleus, respectively).(d) Finally, sharing common intracellular compartment willincrease the effective concentration of the BirA-fusion near theBAP-target and promote the reaction, as we demonstrated usingGFP and HP1 as examples of compartmentalization differences.
Another type of additional information that could be providedby PUB is based on the fact that biotinylation leaves one of theproteins with a permanent modification, which persist after theprotein�protein proximity could have been lost. We presented away to take advantage of this feature that adds kinetic dimensionto the studies of the protein�protein proximity. Using BAP-fused histone H2A and BirA-Rad18 as a model, we demonstratedthat one can use a pulse-chase labeling with biotin to trace the fateof a BAP-fused protein of interest that was interacting with agiven BirA-fused protein at the moment of labeling. Among themany potential applications of such type of analysis are the studyof protein transport (e.g., by using a fusion of BirA with a com-ponent of the membrane pore complex and labeling a proteintransported to the nucleus by BAP), measurement of the stabilityand consequent modifications of a particular fraction of proteinthat has been a part of a complex with a specific protein partner,etc. Thus, in addition to helping to reconstruct the cell structurein space, our approach has a potential to add temporal dimensionto such reconstruction studies.
We also need to mention a difference of PUB approach fromthe other biochemistry-friendly approaches to study protein�protein interactions, such as coimmunoprecipitation and TAP(tandem-affinity purification). Our method is intended formonitoring interactions/proximities between two given proteins,not for identification of new interaction partners of a givenprotein. One can easily envision many instances when such atask might be needed. A case in point is structure�functionalanalysis of a protein (deletion and/or site-specific mutagenesis)with the aim to map interaction domains (as we illustrated on theexample of the KAP1 wild type andmutant interacting withHP1).This limitation notwithstanding, our method has the followingappealing difference from TAP and related approaches to studyprotein�protein interactions. These methods work satisfactorilyonly for the sufficiently strong interactions that can withstand theprocedures of solubilization and affinity purification. For exam-ple, the study of membrane complexes or the interactionsbetweenmatrix proteins is challenging with these methods, giventhe severe limitations on the extraction and purification condi-tions compatible with the stable protein�protein interactions.On the contrary, in the proposed approach, the generation of apermanent covalent mark on one of the proteins studied willallow one to bypass the limitations imposed by the extraction andpurification procedures. Thus, the method should prove usefulfor the study of interactions that are otherwise difficult to detectby the Co-IP and TAP methods.
In some cases, for example, when comparing interactions oftwo proteins between different cell lines with uncontrolled levelsof their endogenous counterparts, a potential problem withinterpretation could arise due to the competition of the endo-genous proteins for the interaction. As seen in Figure 2B, wecould efficiently decrease the biotinylation of BAP-KAP1 byoverexpressing untagged KAP1. This problem should be takeninto account when concluding from results obtained using thismethod. Notably, however, this valid concern equally applies to
other methods to study protein�protein interactions in homo-logous systems in vivo, such as FRET, BRET and two hybrid(e.g., mammalian two hybrid used to study mammalian interac-tion partners).
As far as future development of this system is concerned, thevectors utilized in our work require “classic” cloning to be per-formed for each pair of proteins tested, which greatly increases theamount of work required per experiment, effectively preventinglarge-scale study. Making our vectors Gateway compatible willfacilitate the molecular biology manipulations and benefit fromlarge ORF collection compatible with this tagging system.
Finally, while this project was in progress, we learnt that asomewhat similar approach to detect protein�protein interac-tions in vivo has been developed by another group.37 However,we wish to emphasize the crucial and distinguishing feature of oursystem: its mass-spectrometry-oriented format. In this respect,the sequence of the BAP domain used in ref 37 is not expected toyield a tryptic peptide that would be efficiently detected by massspectrometry, thus precluding its use in techniques such asmultiplexing with varying amino acid sequences or stable isotopelabeling and quantification, which constitute one of the mainadvantages of the technique we describe here.
’ASSOCIATED CONTENT
bS Supporting InformationSupplementary tables and figures. This material is available
free of charge via the Internet at http://pubs.acs.org.
’AUTHOR INFORMATION
Corresponding Author*E-mail: [email protected]. Phone: 33-1 42 11 65 25. Fax:33-1 42 11 65 25.
’ACKNOWLEDGMENT
We thank Dr. M. Lechner (Drexel University, Philadelphia)for the KAP1-HP1BDwt and KAP1-HP1BDwt plasmids, Drs H.Willard and M. Chadwick (Case Western Reserve University,Cleveland) for the ORFs of the H2A.BBD and macroH2A, andDr. L. L. Pritchard for critical reading of the manuscript. We alsothank Chlo�e Robin for the Figure 2C. This work was supportedby grants from “La Ligue Contre le Cancer” (9ADO1217/1B1-BIOCE), the “Institut National du Cancer” (247343/1B1-BIOCE)and Centre National de la Recherche Scientifique [CNRS-INCA-MSHE Franco-Pologne #3037987) to VO, by NCB Kazakhstan(0103_00404) to AK and by a travel grant to A.K. from the Coo-p�eration Universitaire et Scientifique Department of the FrenchEmbassy in Astana, Kazakhstan.
’ABBREVIATIONS:
BAP, biotin acceptor peptide; LC�MS/MS, liquid chromatog-raphy coupled with tandem mass-spectrometry; TIC, total ioncurrent
’REFERENCES
(1) Karsenti, E. Self-organization in cell biology: a brief history. Nat.Rev. Mol. Cell. Biol. 2008, 9, 255–262.
(2) Misteli, T. The concept of self-organization in cellular architec-ture. J. Cell Biol. 2001, 155, 181–185.

L dx.doi.org/10.1021/pr200189p |J. Proteome Res. XXXX, XXX, 000–000
Journal of Proteome Research ARTICLE
(3) Day, R. N.; Periasamy, A.; Schaufele, F. Fluorescence resonanceenergy transfer microscopy of localized protein interactions in the livingcell nucleus. Methods 2001, 25, 4–18.(4) Pollok, B. A.; Heim, R. Using GFP in FRET-based applications.
Trends Cell Biol. 1999, 9, 57–60.(5) Boute, N.; Jockers, R.; Issad, T. The use of resonance energy
transfer in high-throughput screening: BRET versus FRET. TrendsPharmacol. Sci. 2002, 23, 351–354.(6) Pfleger, K. D.; Eidne, K. A. Illuminating insights into protein-
protein interactions using bioluminescence resonance energy transfer(BRET). Nat. Methods 2006, 3, 165–174.(7) Remy, I.; Michnick, S. W. Clonal selection and in vivo quantita-
tion of protein interactions with protein-fragment complementationassays. Proc. Natl. Acad. Sci. U.S.A. 1999, 96, 5394–5399.(8) Remy, I; Michnick, S. W. Mapping biochemical networks with
protein-fragment complementation assays. Methods Mol. Biol. 2004,261, 411–426.(9) Fields, S.; Song, O. A novel genetic system to detect protein-
protein interactions. Nature 1989, 340, 245–246.(10) Lievens, S.; Lemmens, I.; Tavernier, J. Mammalian two-hybrids
come of age. Trends Biochem. Sci. 2009, 34, 579–588.(11) de Boer, E.; Rodriguez, P.; Bonte, E.; Krijgsveld, J.; Katsantoni,
E.; Heck, A.; Grosveld, F.; Strouboulis, J. Efficient biotinylation andsingle-step purification of tagged transcription factors in mammaliancells and transgenic mice. Proc. Natl. Acad. Sci. U.S.A. 2003, 100, 7480–7485.(12) Viens, A.; Mechold, U.; Lehrmann, H.; Harel-Bellan, A.;
Ogryzko, V. Use of protein biotinylation in vivo for chromatin immuno-precipitation. Anal. Biochem. 2004, 325, 68–76.(13) Kim, J.; Cantor, A. B.; Orkin, S. H.; Wang, J. Use of in vivo
biotinylation to study protein-protein and protein-DNA interactions inmouse embryonic stem cells. Nat. Protoc. 2009, 4, 506–517.(14) Rodriguez, P.; Braun, H.; Kolodziej, K. E.; de Boer, E.; Campbell,
J.; Bonte, E.; Grosveld, F.; Philipsen, S.; Strouboulis, J. Isolation oftranscription factor complexes by in vivo biotinylation tagging and directbinding to streptavidin beads. Methods Mol. Biol. 2006, 338, 305–323.(15) Ooi, S. L.; Henikoff, J. G.; Henikoff, S. A native chromatin
purification system for epigenomic profiling in Caenorhabditis elegans.Nucleic Acids Res. 2010, 38 (4), e26.(16) van Werven, F. J.; Timmers, H. T. The use of biotin tagging in
Saccharomyces cerevisiae improves the sensitivity of chromatin immuno-precipitation. Nucleic Acids Res. 2006, 34, e33.(17) Viens, A.; Harper, F.; Pichard, E.; Comisso, M.; Pierron, G.;
Ogryzko, V. Use of protein biotinylation in vivo for immunoelectronmicroscopic localization of a specific protein isoform. J. Histochem.Cytochem. 2008, 56, 911–919.(18) Viens, A.; Mechold, U.; Brouillard, F.; Gilbert, C.; Leclerc, P.;
Ogryzko, V. Analysis of human histone H2AZ deposition in vivo arguesagainst its direct role in epigenetic templating mechanisms. Mol. Cell.Biol. 2006, 26, 5325–5335.(19) Shevchenko, A.; Wilm, M.; Vorm, O.; Mann, M. Mass spectro-
metric sequencing of proteins silver-stained polyacrylamide gels. Anal.Chem. 1996, 68, 850–858.(20) Chalfie, M.; Kain, S. R. Green Fluorescent Protein: Properties,
Applications, and Protocols; Wiley-Liss: New York, 1998.(21) Ikura, T.; Ogryzko, V. V.; Grigoriev, M.; Groisman, R.; Wang,
J.; Horikoshi, M.; Scully, R.; Qin, J.; Nakatani, Y. Involvement of theTIP60 histone acetylase complex in DNA repair and apoptosis. Cell2000, 102, 463–473.(22) Puri, T.; Wendler, P.; Sigala, B.; Saibil, H.; Tsaneva, I. R. Dode-
cameric structure and ATPase activity of the human TIP48/TIP49 com-plex. J. Mol. Biol. 2007, 366, 179–192.(23) Eissenberg, J. C.; Elgin, S. C. The HP1 protein family: getting a
grip on chromatin. Curr. Opin. Genet. Dev. 2000, 10, 204–210.(24) Lomberk, G.; Wallrath, L.; Urrutia, R. The Heterochromatin
Protein 1 family. Genome Biol. 2006, 7, 228.(25) Lechner, M. S.; Begg, G. E.; Speicher, D. W.; Rauscher, F. J., 3rd
Molecular determinants for targeting heterochromatin protein 1-mediated
gene silencing: direct chromoshadow domain-KAP-1 corepressor interac-tion is essential. Mol. Cell. Biol. 2000, 20, 6449–6465.
(26) Ryan, R. F.; Schultz, D. C.; Ayyanathan, K; Singh, P. B.;Friedman, J. R.; Fredericks, W. J.; Rauscher, F. J., 3rd KAP-1 corepressorprotein interacts and colocalizes with heterochromatic and euchromaticHP1 proteins: a potential role for Kruppel-associated box-zinc fingerproteins in heterochromatin-mediated gene silencing. Mol. Cell. Biol.1999, 19, 4366–4378.
(27) Shibahara, K.; Stillman, B. Replication-dependent marking ofDNA by PCNA facilitates CAF-1-coupled inheritance of chromatin. Cell1999, 96, 575–585.
(28) Mello, J. A.; Almouzni, G. The ins and outs of nucleosomeassembly. Curr. Opin. Genet. De. 2001, 11, 136–141.
(29) Furuyama, T.; Dalal, Y.; Henikoff, S. Chaperone-mediatedassembly of centromeric chromatin in vitro. Proc. Natl. Acad. Sci. U.S.A.2006, 103, 6172–6177.
(30) Chadwick, B. P.; Willard, H. F. A novel chromatin protein,distantly related to histone H2A, is largely excluded from the inactive Xchromosome. J. Cell Biol. 2001, 152, 375–384.
(31) Chadwick, B. P.; Valley, C. M.; Willard, H. F. Histone variantmacroH2A contains two distinct macrochromatin domains capable ofdirecting macroH2A to the inactive X chromosome. Nucleic Acids Res.2001, 29, 2699–2705.
(32) Chadwick, B. P.; Willard, H. F. Histone H2A variants and theinactive X chromosome: identification of a second macroH2A variant.Hum. Mol. Genet. 2001, 10, 1101–1113.
(33) Peters, A. H.; Kubicek, S.; Mechtler, K.; O’Sullivan, R. J.; Derijck,A. A.; Perez-Burgos, L.; Kohlmaier, A.; Opravil, S.; Tachibana,M.; Shinkai,Y.; et al. Partitioning and plasticity of repressive histonemethylation statesin mammalian chromatin. Mol. Cell 2003, 12, 1577–1589.
(34) Villar-Garea, A.; Imhof, A. The analysis of histone modifica-tions. Biochim. Biophys. Acta 2006, 1764, 1932–1939.
(35) Gygi, S. P.; Rist, B.; Gerber, S. A.; Turecek, F.; Gelb, M. H.;Aebersold, R. Quantitative analysis of complex protein mixtures usingisotope-coded affinity tags. Nat. Biotechnol. 1999, 17, 994–999.
(36) Ong, S. E.; Blagoev, B.; Kratchmarova, I.; Kristensen, D. B.;Steen, H.; Pandey, A.; Mann, M. Stable isotope labeling by amino acidsin cell culture, SILAC, as a simple and accurate approach to expressionproteomics. Mol. Cell. Proteomics 2002, 1, 376–386.
(37) Fernandez-Suarez, M.; Chen, T. S.; Ting, A. Y. Protein-proteininteraction detection in vitro and in cells by proximity biotinylation.J. Am. Chem. Soc. 2008, 130, 9251–9253.

α-His-HRP
Streptavidin-HRP
0,84 0,89
2,43
1,73
0
1
2
3
1 2G H
0,490,59
0
0,2
0,5
0,8
G/H-1 G/H-2
BAP-H2ABBD
BAP-macroH2A
Tot Chr
1 2 3 4 5
BAP-H2ABBD
BAP-macroH2A
NS
BirA-H2ABBDBirA-macroH2ABAP-H2ABBDBAP-macroH2A
- - + - +- + - + -- + + + +- + + + +
UT
BA
P: m
acro
H2A
/H2A
BB
D
Het
erol
ogou
s/ho
mol
ogou
s
Bir
A-H
2AB
BD
Bir
A-H
2AB
BD
Bir
A-m
acro
H2A
Bir
A-m
acro
H2A
Nuclei Chromatin

3,72
0
1
2
3
G/T
SCK
supe
rnat
ant
CSK
pal
let
BAP-GFP
BAP-HP1γ
BirA-TAP54α
A B C
Bir
A-G
FP
Bir
A-T
AP5
4α
BAP-GFP
BAP-HP1γ
BAP-GFP
BAP-HP1γ
α-His-HRP
Streptavidin-HRP
1 2
1 2
0,42
1,56
0
0.5
1
1.5
G T
BA
P: H
P1/G
FP
Bir
A-G
FP
Bir
A-T
AP5
4
Bir
A: G
FP/T
AP5
4


Streptavidin-HRP
30200.783
26129.972
30578.391
Area
31500.923
10888.052
22526.271
Area
1 2 3
H2Az-BAP
H2Az-BAP
Penta-His-HRP
1 – BAP1118 (RILEAQKIFRGGLE) 2 – BAP1070 (RILEAQKIVRGGLE) 3 – BAP1135 (RILEAQKIYRGGLE)
Intensities ratios for normalisation
1/2=1.17
3/2=1.16
Normalized intensities on Streptavidin andcorrected ratios
27155.963
10888.052
19253.201
Area 1/2 = 1.77÷0.12
3/2 = 2.49÷0.311 2 3


∆A ∆B∆A < ∆B
A1 A2 B1 B2No biotinylation,
due to the non‐overlappingdi ib i f d
Biotinylation proportionaldistributions of A1 and A2 to the overlap between
the distributions of B1 and B2

Figure S1. macroH2A vs H2ABBD.
Left: 2 combinations of BirA and BAP fusions were transfected separately into cells: 1 –
Untransfected cells; 2,4 – BirA-macroH2A + BAP-macroH2A + BAP-H2ABBD; 3,5 – BirA-
H2ABBD + BAP-macroH2A + BAP-H2ABBD. 2,3 – total nuclear lysate (Tot), 4,5 –
Chromatin associated histones (Chr). Top – α-His-HRP Western, Bottom – streptavidin-HRP
Western. The positions of the BAP-fusions and nonspecific signal (NS) are indicated.
Right: Quantification of the biotinylation efficiencies. The signal intensities were first
measured by densitometry, then the streptavidin signal for every BAP-fusion was normalized
by dividing it to the α-His signal. G – the ratio between biotinylation of BAP-macroH2A and
BAP-H2ABBD in the presence of BirA-H2ABBD; H – the ratio between biotinylation of
BAP-macroH2A and BAP-H2ABBD in the presence of BirA-macroH2A. 1 – total nuclei, 2 –
chromatin fraction. Far right – Ratio between the efficiencies of heterologous (H2ABBD vs
macroH2A) and homologous (H2ABBD vs H2ABBD and macroH2A vs macroH2A)
biotinylation. Shown are average values of G/H calculated for three experiments, for total
nuclei (1) and chromatin fraction (2)
Figure S2. Detection of differences in compartmentalization
A. BAP-GFP and BAP-HP1γ where coexpressed either with BirA-GFP (left) or BirA-
TAP54α (right) fusions. Top – α-His-HRP Western, Bottom – streptavidin-HRP Western.
The positions of the BAP-fusions are indicated.
B. Quantification of biotinylation differences. The value of the streptavidin-HRP signal was
normalized by taking a ratio with the value of α-His-HRP signal, which reflects the amount of
the transfected protein regardless of its biotinylation status. Left: The ratios between the
normalized signals of biotinylated BAP-HP1 and BAP-GFP was calculated for both BirA-
GFP (G) and BirA-TAP54α (T) cotransfections. Right – the average ratio and standard
deviation between the G and T values from 3 independent experiments.
C. Intracellular localization of the ectopically expressed HP1, GFP and TAP54. After
cotransfection with BAP-GFP, BAP-HP1γ and BirA-TAP54α, the 293T cells were disrupted
in CSK buffer, and nuclei pellets (right) were separated from supernatant (left). The volumes
of both fractions corresponding to equal numbers of cells were loaded on SDS-PAGE gel, the
proteins separated and the presence of BAP- and BirA fusions detected by α-His-HRP
Western. Due to the lower expression levels of TAP54 protein (weak retroviral MoMuLV
enhancer), significantly longer times of exposure were required to detect the respective signal.
Figure S3. MS/MS spectra of the biotinylated and propionylated BAP1118 (V→F).
Shown are the MS/MS fragmentation spectra of the propionylated (top) and biotinylated
(bottom) forms of BAP, with the detected y-series and b-series ions indicated.
Figure S4. MS/MS spectra of the biotinylated and propionylated BAP1135 (V→Y).
Shown are the MS/MS fragmentation spectra of the propionylated (top) and biotinylated
(bottom) forms of BAP, with the detected y-series and b-series ions indicated. Note that, in
this peptide, both Lysine (K) and thyrosine (Y) are propionylated, which affects the masses of
the parental and daughter ions.

Figure S5. Relative biotinylation efficiencies of 3 BAP peptides.
Western analysis of biotinylation levels of three BAP-H2AZ fusions, cotransfected separately
with BirA-GFP. Shown is one example of the analysis. Top – α−His signal, used for
normalization. Bottom – Streptavidin signal. The intensities of the signals were measured by
densitometry (left tables, top and bottom). First, the values of streptavidin signals were
normalized by taking into account different α−His signal intensities (right table). Afterwards,
the relative intensities were calculated by dividing the normalized values for BAP1118 or
BAP1135 (1,3) by the normalized value for BAP1070 (2). The average values from three
different experiments and standard deviations are shown on the right side.
Figure S6. Colocalization analysis of PCNA and Biotin label after pulse and 2 hr chase.
Top - pulse sample. Bottom - chase sample.
Figure S7. Partner mobility can contribute to the biotinylation efficiency
Left - The average positions of the BAP and BirA fusions (A1 and A2, respectively) are close
to each other, but their motion is so constrained that they practically have no chance to
encounter each other (as depicted by the absence of an overlap between the distributions of
their positions).
Right - The average distance between two proteins (B1 and B2) is larger than that for the A
pair, but their positions fluctuate more significantly, leading to the larger overlap in their
positions and thus to accumulation of biotinylated BAD species.


9Annex - III
Use of In Vivo Biotinylation for Chromatin Immunoprecipitation (2011)
Arman Kulyyassov 1,2 , Muhammad Shoaib 1 and Vasily Ogryzko 1
I CNRS UMR-8126, Université Paris-Sud 11, Institut de Cancérologie Gustave Roussy,39, rue Camille Desmoulins, 94805, Villejuif, France.
II National Center for Biotechnology of the Republic of Kazakhstan, 43 Valikhanova Str.,010000, Astana, Republic of Kazakhstan.
Curr Protoc Cell Biol. 2011 Jun; Chapter 17: Unit17.12
233


UNIT 17.12Use of In Vivo Biotinylation forChromatin Immunoprecipitation
Arman Kulyyassov,1,2 Muhammad Shoaib,1 and Vasily Ogryzko1
1CNRS, Universite Paris, Villejuif, France2National Center for Biotechnology of the Republic of Kazakhstan, Astana, Republic ofKazakhstan
ABSTRACT
This unit describes a system for expression of biotinylated proteins in mammalian cellsin vivo, and its application to chromatin immunoprecipitation (ChIP). The system is basedon co-expression of the target protein fused to a short biotin acceptor domain, togetherwith the biotinylating enzyme BirA from Escherichia coli. The superior strength ofthe biotin-avidin interaction in the modified ChIP protocol presented here allows oneto employ more stringent washing conditions, resulting in a better signal/noise ratio.Methods for interpreting the data obtained from ChIP samples analyzed by qPCR, andmethods for testing the efficiency of biotinylation using a streptavidin gel-shift are alsopresented. In addition, a complementary method, based on isothermal multiple stranddisplacement amplification (IMDA) of circular concatemers generated from the DNAfragments obtained after ChIP, is described. This method helps to decrease bias in DNAamplification and is useful for the analysis of complex mixtures of DNA fragmentstypically generated in miniscale ChIP experiments. Curr. Protoc. Cell Biol. 51:17.12.1-17.12.22. C© 2011 by John Wiley & Sons, Inc.
Keywords: chromatin immunoprecipitation � biotinylation in vivo � BirA � IMDA �
amplification bias
INTRODUCTION
Chromatin immunoprecipitation (ChIP) is a method for analyzing protein-DNA interac-tions directly in cells. The principle of this procedure is illustrated in Figure 17.12.1A.Given that the in vivo binding between DNA and proteins is labile (with the exception ofcore histones, the typical rate of dissociation of proteins bound to DNA in vivo is only afew minutes; Phair and Misteli, 2000; Hager et al., 2002), intact cells are first subjectedto cross-linking (typically by formaldehyde), in order to fix the chromatin proteins onthe DNA. Cellular lysates are prepared from the cross-linked cells, which are then soni-cated to shear chromatin into fragments of the size that allow accurate determination ofthe protein position, without compromising the efficiency of DNA detection afterwards.The chromatin fragments containing the protein of interest are purified from the cellularlysates by affinity chromatography.
In the original ChIP procedure, a specific antibody against the protein of interest wasused for such purification. The method described in Basic Protocol 1 employs proteinsbiotinylated in vivo, which permits the use of immobilized streptavidin (avidin) insteadof antibodies, allowing for use of more stringent washing conditions and resulting in abetter signal/noise ratio. After reversal of the cross-links, the selectively enriched DNAis further analyzed, usually by PCR, DNA array methodology (Negre et al., 2006),or high-throughput sequencing (Park, 2009). Support Protocol 1 provides methods forinterpreting the data obtained from ChIP samples analyzed by quantitative real-timePCR (qPCR), while Support Protocol 2 describes a procedure for testing the efficiency
Current Protocols in Cell Biology 17.12.1-17.12.22, June 2011Published online June 2011 in Wiley Online Library (wileyonlinelibrary.com).DOI: 10.1002/0471143030.cb1712s51Copyright C© 2011 John Wiley & Sons, Inc.
MacromolecularInteractions inCells
17.12.1
Supplement 51

Use of In VivoBiotinylation
for ChromatinImmuno-
precipitation
17.12.2
Supplement 51 Current Protocols in Cell Biology
A B
+cross-linking
fragmentationof chromatin
precipitationwith specificantibody
reversecrosslinking
detection
PCRmicroarraycloningsequencing
BAP-X
b-BAP-X
biotin , ATPM A G L D I F E A Q K I E W H E
BirA
Figure 17.12.1 General principles of chromatin immunoprecipitation (ChIP) and in vivo biotiny-lation. (A) General scheme of ChIP. The proteins are cross-linked to DNA in vivo, the chromatinis fragmented, and the chromatin fragments with the protein of interest are affinity-purified. Thecross-links are reversed, and the DNA is usually analyzed by PCR, DNA arrays, or high-throughputsequencing. (B) Epitope tagging by in vivo biotinylation. Two recombinant constructs are co-expressed in the cells: BAP-X, comprising the protein of interest X fused to a minimal biotinacceptor peptide (BAP, sequence shown), and bacterial biotin ligase BirA, specifically transferringthe biotin moiety on the lysine residue of BAP. The reaction requires the presence of ATP andbiotin in the cells.
of biotinylation using a streptavidin gel-shift. In addition, a complementary method,which helps to decrease bias in DNA amplification, is presented in Basic Protocol 2. Itis based on isothermal multiple strand displacement amplification (IMDA) of circularconcatemers generated from the DNA fragments obtained after ChIP. This method isuseful for the analysis of complex mixtures of DNA fragments typically generated inminiscale ChIP experiments.
STRATEGIC PLANNING
Choice of Expression System
The principle of in vivo biotinylation is based on co-expression of the protein of interestfused to a biotin acceptor domain (BAD), or a shorter biotin acceptor peptide (BAP),together with the bacterial biotin ligase BirA. These two proteins can be expressedfrom different plasmids (see trans design in Fig. 17.12.2; de Boer et al., 2003; Kimet al., 2009), although this method is somewhat cumbersome. It can also decrease thebiotinylation efficiency due to promoter competition and the need for the molecules ofsubstrate and enzyme to meet in the confines of a large mammalian cell, in order forthe biotinylation event to occur. Alternatively, a single bicistronic vector that expressesone mRNA encoding both BirA and the target BAP-fused protein can be used (seecis design in Fig 17.12.2). Such bicistronic design increases the local concentration ofthe enzyme in the vicinity of the target, leading to more efficient biotinylation (Vienset al., 2004). Although such design has been shown to work well for protein detectionby immunoblotting or microscopy (electron or fluorescence; Viens et al., 2008), in ourexperience, the expression levels of the biotinylated proteins can sometimes be low.Therefore the choice of system depends on the protein of interest—its abundance and

MacromolecularInteractions inCells
17.12.3
Current Protocols in Cell Biology Supplement 51
UT – +cis trans
shiftedGFP
GFP
NS
1 2 3 4 5 6
W.B α-GFP
UT – +
Figure 17.12.2 Streptavidin gel-shift. Immunoblot analysis with anti-GFP antibody of extractsfrom the HEK 293 cells expressing N-terminal BAP fusion of GFP. Streptavidin was added beforeSDS-PAGE in lanes 3 and 6 (+). Left panel: both BAP-GFP and BirA were expressed from thesame mRNA (cis-biotinylation). Right panel: BAP-GFP and BirA were expressed from two differentplasmids that were cotransfected into HEK 293 cells (trans-biotinylation). The positions of GFPand its streptavidin-shifted version are indicated by arrows. Abbreviations: GFP, green-fluorescentprotein; NS, nonspecific signal corresponding to endogenously biotinylated proteins; UT, extractfrom untransfected or untransduced cells.
other characteristics. If expression from two separate plasmids is chosen, the use ofhuman-optimized BirA helps to achieve a more efficient biotinylation of the targetprotein (Mechold et al., 2005).
Transient Transfection Versus Stable Cell Lines
Generation of cell lines that express the biotinylated protein of interest is time consumingand can become a limiting factor, especially if the two genes must be introduced separatelyinto the cell line. Transient transfection typically yields less material; however, the useof unbiased DNA amplification after ChIP makes it a viable alternative. Accordingly,we provide a method for amplifying, without bias, DNA obtained in ChIP experiments(Basic Protocol 2).
Testing Biotinylation Efficiency with the Streptavidin Gel-Shift
If the antibodies against the protein of interest are available, two useful tests combinedin one preliminary experiment can be performed. Their aims are (1) comparison of thelevels of expression of the BAP-tagged protein and those of its endogenous counterpart,and (2) testing the efficiency of biotinylation of the BAP-fused protein. Both aims can beaccomplished by using a streptavidin gel-shift (Viens et al., 2004; van Werven and Tim-mers, 2006; see Support Protocol 2 and Fig. 17.12.2). Given that the interaction betweenstreptavidin and biotin is sufficiently strong to survive the conditions of SDS-PAGEseparation, the addition of streptavidin to the sample before loading leads to an easilydetectable decrease in the mobility of the biotinylated protein (∼50 kDa). Comparing theintensities of the immunoblot signals corresponding to the shifted (streptavidin-bound)and nonshifted (unbound, and hence, unbiotinylated) forms of the protein provides anestimate of what percent of the total BAP-fusion protein was biotinylated. If the antibod-ies against native protein are not available, or if knowledge about the relative expressionlevels of the BAP-fusion and the endogenous protein are not essential for the experiment,antibodies for an additional tag, usually present in the expression vector (e.g., 6×His,Viens et al., 2004; FLAG, Kim et al., 2009) can be used for the immunoblot analysis.

Use of In VivoBiotinylation
for ChromatinImmuno-
precipitation
17.12.4
Supplement 51 Current Protocols in Cell Biology
formaldehyde biotin
treatment duration (min)
biotinylated BSA
streptavidin peroxidase detection
A
?
?
O
HN
HN
SO
CH H
OOH
0 10 20 30 40 50 60NT
B
Figure 17.12.3 Use of biotinylated proteins is compatible with cross-linking by formaldehyde.Since biotin possesses two amino groups, it can react with formaldehyde, thus losing its affinityto streptavidin. To test whether formaldehyde treatment impairs the biotin-streptavidin interaction,biotinylated bovine serum albumin (BSA) was incubated in cell culture medium and treated with 1%formaldehyde for 10 to 60 min. The effect of the treatment on the ability of streptavidin to recognizebiotinylated BSA was monitored by immunoblotting using streptavidin-conjugated peroxidase asa detection reagent. No effect of the formaldehyde treatment on the biotin-streptavidin interactionwas observed, based on the intensity of the chemiluminescent signal, even for long incubations.Thus, the biotin tag is compatible with formaldehyde cross-linking. Abbreviation: NT, not treated.
Choice of Cross-Linking Method
The methods used to covalently link protein to DNA in vivo include ultraviolet (UV)(Gilmour and Lis, 1984; Pashev et al., 1991) and chemical cross-linking, most commonlyby formaldehyde. Formaldehyde produces both protein-nucleic acid and protein-proteincross-links in vivo. A key feature of formaldehyde-induced cross-links is their reversibil-ity, which allows one to purify the DNA for subsequent analyses (Orlando, 2000). Asa result, formaldehyde has been the reagent of choice for cross-linking in ChIP appli-cations. While it is possible that the use of formaldehyde can negatively affect epitoperecognition. (e.g., biotin’s nitrogen atoms could participate in a nucleophilic reactionwith formaldehyde), we have shown that for the typical reaction times of formaldehydetreatment used in a ChIP protocol, the biotin-streptavidin affinity is not significantlyaffected (Fig. 17.12.3).
Another potential problem with formaldehyde is that it cross-links macromoleculeswithin ∼2
◦A of each other; thus, it becomes less efficient when examining proteins
that indirectly associate with DNA. To improve detection of such proteins, longer-rangebifunctional cross-linkers have been used in addition to formaldehyde (Zeng et al., 2006).However, before using such a cross-linker in the biotin-ChIP protocol, we recommendfirst testing how the particular reagent affects the biotin moiety.
Finally, in contrast to cross-link ChIP (XChIP), native ChIP (NChIP) omits cross-linking(O’Neill and Turner, 2003). It is well suited for the analysis of histones because oftheir strong binding to DNA. Compared to biotin-ChIP, NChIP does not take advantageof stringent washing conditions (e.g., 2% SDS) because of the potential to disrupt thehistone-DNA interactions. Nonetheless, biotin-NChIP has been used for histones (Ooiet al., 2010), as the high biotin-streptavidin affinity allows one to use smaller amountsof affinity resin. As a result, using regular washing conditions, one can achieve lessnonspecific background compared to regular XChIP.

MacromolecularInteractions inCells
17.12.5
Current Protocols in Cell Biology Supplement 51
Choice of Chromatin Fragmentation Method
Two methods of fragmentation have been used for ChIP: (1) enzymatic fragmentationwith micrococcal nuclease and (2) sonication. Enzymatic digestion is more acceptable forNChIP (Ooi et al., 2010), being more gentle and also providing information about nucle-osome positioning. When cross-linked, chromatin becomes less accessible to nuclease,and DNA shearing by sonication becomes the method of choice.
The optimal size of chromatin fragments depends on the downstream analysis. Generally,it should be ∼400 to 500 bp. This size covers two to three nucleosomes. Longer frag-ments will diminish resolution and increase nonspecific signal; therefore, they are notrecommended for high-throughput analysis (microarray analysis or sequencing). Veryshort fragments are generally not good for PCR detection, as it becomes challenging tofind suitable primers for amplification.
Choice of Reference Sample and Controls
Reference sampleThe binding of the protein of interest to its target site is determined by the relativeenrichment of ChIP signal over an unenriched reference sample. The choice of referencesample is a subtle issue. In most ChIP protocols, a mock ChIP sample (e.g., produced fromthe cells not expressing biotinylated protein, or expressing BirA alone or biotinylatedGFP; Kim et al., 2009), or the input chromatin (i.e., the sample before the affinitypull-down; Dahl and Collas, 2008), is used as a reference.
However, one should be aware of certain caveats. In the case of an ideal mock purification,the sample is expected to contain very little DNA, complicating accurate measurementof amounts of different sequences in it. On the other hand, the use of input chromatinmight be also problematic. During ChIP, some chromatin fragments could be particularlyprone to aggregation and nonspecific binding, due to sequence, protein content, or higher-level structure. This introduces an artificial bias in the representation of different DNAsequences after ChIP, which cannot be accounted for when the input chromatin is usedas a reference.
The use of cells expressing biotinylated histones is another attractive choice for a refer-ence sample, as histones should be uniformly distributed over the genome. However, thehistone density is lower in the chromatin with actively transcribed genes (Wolffe, 1999).One should be aware of this problem before deciding on what reference sample is bestsuited for a particular application. In this unit, we use input chromatin as a reference.
ControlsAt least one positive control is recommended for quality control of ChIP. It should be aprotein known to colocalize with an identified locus in the cell type examined.
We also recommend the use of two types of negative controls: (1) one with a tagged,irrelevant protein, known to have no interaction with the interrogated locus (GFP is agood choice, as the same sample can also serve to control the transfection efficiency),and (2) one with an irrelevant locus, a DNA sequence not expected to interact with theprotein under question, for analysis of the same ChIP sample.
Note that keeping constant cell numbers between batches is important, as the cell num-ber affects the precipitation efficiency. Triplicate ChIPs should be performed to assessvariation between replicates.

Use of In VivoBiotinylation
for ChromatinImmuno-
precipitation
17.12.6
Supplement 51 Current Protocols in Cell Biology
BASICPROTOCOL 1
EXPRESSION OF BIOTINYLATED PROTEINS IN MAMMALIAN CELLS INVIVO AND ITS APPLICATION TO CHROMATIN IMMUNOPRECIPITATION(ChIP)
To take advantage of the strong interaction between biotin and streptavidin (Kd of 10-15
M; Lindqvist and Schneider, 1996) and commercial availability of many reagents forpurification and detection of biotinylated macromolecules, we (Viens et al., 2004) andothers (de Boer et al., 2003) have developed a variant of epitope tagging, based on proteinbiotinylation in vivo. Protein biotinylation in vivo has been used to study protein-proteininteractions (de Boer et al., 2003) and electron microscopic localization of proteins ofinterest (Viens et al., 2008). In this protocol, the applications of these methods to ChIPare described, where the main advantage is the ability to use more stringent washingconditions to reduce background noise, as well as more efficient (i.e., more quantitative)recovery of the protein-DNA complexes (Fig. 17.12.4). Such an approach, in its variousforms, has been applied to a broad variety of experimental systems, including mammaliancells, yeast, insects, and worms (van Werven and Timmers 2006; Kim et al., 2009;Kolodziej et al., 2009; Lausen et al., 2010; Ooi et al., 2010).
silver stain
A
norm
al
2% S
DSGFP H2A.Z
S/N ratio: 6.04
S/N ratio: 53.8
GFP H2A.Z
460
H2A.Zinputs
GFP
12 24 36Cycle
460
Rel
ativ
e flu
ores
cenc
e
00040812162024
H2A.Zinputs
GFPblank
12 24 36Cycle
normal
2% SDS
B
Rel
ativ
e flu
ores
cenc
e
00040812162024
Figure 17.12.4 Use of stringent washing conditions in ChIP experiments significantly improvesspecificity (signal-to-noise ratio). (A) Silver stain of biotinylated protein expressed in HEK 293 cells,separated by SDS-PAGE and washed with either standard buffer or 2% SDS. (B) Interaction ofhistone H2A.Z with the total genome of NIH3T3 cells. NIH3T3 cells were transiently transfected withbiotinylated H2A.Z- or eGFP-expressing plasmids, and biotin ChIP was performed. QuantitativePCR analysis was performed using genomic DNA present in the immunoprecipitates from thecells. Primers B1 5′: gcc ggg tgt ggt ggc gca cac ctt t and B1 3′: gag aca ggg ttt ctc tgt gtagcc ct were used to amplify short, abundant (∼106 copies per genome), randomly distributed,repetitive B1 sequences, allowing for very sensitive detection of mouse genomic DNA in thesample. Shown are results representative of four completely separate experiments. A comparisonof the ratio between amounts of DNA pulled down from an H2A.Z-transfected sample and aneGFP-transfected sample (nonspecific background) shows that with the more stringent washingconditions possible with the biotin-ChIP method, the signal-to-noise ratio is significantly increasedand the specificity of interaction detection is improved.

MacromolecularInteractions inCells
17.12.7
Current Protocols in Cell Biology Supplement 51
Materials
Human embryonic kidney (HEK) 293 cells (ATCC)Dulbecco’s modified Eagle’s medium (APPENDIX 2A)/10% (v/v) fetal bovine serum
(DMEM-10)2 M CaCl2 (store up to 6 months At –20◦C)Plasmid DNA with expression system for target protein (see Strategic Planning)
and controls (plasmid expressing BAP-GFP; Viens et al., 2004), checked forbiotinylation efficiency (Support Protocol 2)
2×HeBS (APPENDIX 2A)Biotin (Sigma cat. no. B4639)37% (v/v) formaldehyde stock solution (Electron Microscopy Services)1.25 M glycine stock (store up to 3 months at room temperature)Phosphate-buffered saline (PBS, APPENDIX 2A), ice-cold25× protease inhibitor stock (see recipe)PBS + protease inhibitors, ice cold: dilute 25× protease inhibitor stock (see recipe)
1:1000 with PBS just before use1% (w/v) agarose gel (see Voytas, 2001)ChIP Buffer (see recipe)70% (v/v) ethanol5 M and 300 mM NaCl10 mg/ml RNase A (e.g., Invitrogen)Streptavidin-coupled magnetic beads (Dynabeads M-280 Streptavidin; Invitrogen)Washing buffer 1: 2% (w/v) SDS; store up to 2 months at room temperatureWashing buffer 2: 10 mM Tris·Cl, pH 8 (see APPENDIX 2A)/1 mM EDTA (see
APPENDIX 2A)/0.25 mM LiCl/1% (w/v) Nonidet P-40/1% (v/v)/sodiumdeoxycholic acid; store up to several months at 4◦C
Washing buffer 3: 20 mM Tris·Cl, pH 7.6 (see APPENDIX 2A)/50 mM NaCl/1 mMEDTA (see APPENDIX 2A); store up to 2 months at room temperature
20 mg/ml proteinase K (Roche Applied Science) in 10 mM Tris·Cl, pH 7.5 (seeAPPENDIX 2A)/20 mM calcium chloride/5% (v/v) glycerol
5× proteinase K buffer: 50 mM Tris·Cl, pH 7.5 (see APPENDIX 2A)/25 mM EDTA(see APPENDIX 2A)/1.25% (w/v) SDS
3 M sodium acetate (NaOAc), pH 5 to 5.2DNA purification kit for PCR (e.g., Qiagen): includes MiniElute columns, PBI
buffer, PE buffer, and EB buffer
1.5-ml microcentrifuge tubes14-ml round-bottom tube (Falcon 2059, or equivalent).15-ml conical polystyrene tubes (Falcon)Sonicator, with appropriate tube holder and accessories (e.g., Diagenode)Magnetic separator for 1.5-ml tubes (e.g., Dynal MPC, Invitrogen)Test-tube rotators, at room temperature and in a cold room1.5-ml screw-cap tubes (VWR)67◦C heating block or thermal cycler
Additional reagents and equipment for culturing mammalian cells (UNIT 1.1)performing agarose gel electrophoresis (Voytas, 2001)
Transfect cells to generate biotinylated protein1. Plate HEK 293 cells at the density of 6 × 10⁶ per 100-mm tissue culture dish in
10 ml of DMEM-10, and grow overnight at 5% CO2, 37◦C (e.g., see UNIT 1.1).
Transient transfection procedures (reagents, DNA amounts) depend on the cell line used.Here we describe transfection of HEK 293 with calcium phosphate.

Use of In VivoBiotinylation
for ChromatinImmuno-
precipitation
17.12.8
Supplement 51 Current Protocols in Cell Biology
2. Dilute 24.8 μl of 2 M CaCl2 with water to a total volume of 200 μl in a 1.5-mlmicrocentrifuge tube, and add 5 μg of the plasmid DNA to be transfected.
3. Place 200 μl of 2× HeBS in a 14-ml round-bottom tube. Add the DNA/calciummixture (from step 2) into the 2× HeBS dropwise, mixing after each addition.
The pH of the HeBS buffer is crucial. The precipitate should be barely visible undermicroscope.
For control of transfection efficiency, we recommend transfecting a separate cell well withBAP-GFP (Viens et al., 2004) or any other fluorescent protein. This sample can also belater used as a negative control in ChIP.
4. Add the transfection mixture from step 3 dropwise to the packaging cells in the dish(from step 1), stirring well after each addition, and incubate for 12 hr at 5% CO2,37◦C.
5. Replace the medium with fresh DMEM-10 with 1 mg/ml biotin added. Incubateovernight.
Perform formaldehyde cross-linking6. In a fume hood, add 270 μl of 37% formaldehyde stock to a final concentration of
1% (v/v) directly to the culture plate without changing the medium.
Make sure that the reagent is mixed well with the medium.
7. Keep the plate at room temperature for 10 min, shaking occasionally.
Time of cross-linking may vary, depending on the cells and the protein to be immunopre-cipitated. For optimization, several samples with different cross-linking times should betested. In most cases, 8 to 10 min for cross-linking is sufficient for ChIP with mammaliancells.
8. Add 1 ml of 1.25 M glycine stock (125 mM final concentration) to the culture plateto quench the formaldehyde, mix well, and incubate for 5 min at room temperature.
9. Remove the culture medium completely by aspiration, and rinse the cells with5 ml ice-cold PBS + protease inhibitors. Remove the PBS + protease inhibitors byaspiration. Avoid drying the plates.
10. Scrape the adherent cells from the culture dish into a 15-ml conical polystyrene tube.Rinse the culture dish with 5 ml PBS + protease inhibitors, add the rinse to the same15-ml tube, and mix.
Trypsin can be used to detach the cells from the culture plate; however we have foundthat for cross-linked HEK 293 cells, a scraper works well.
11. Gently pipet up and down to break up cell aggregates. Centrifuge 5 min at 2,400 ×g, 4◦C.
To prevent cell lysis during pipetting of cells, use a 1000- or 200-ml pipet tip cut off toincrease the diameter of the opening.
12. Remove the supernatant by careful aspiration to avoid losing the cell pellet.
13. Add 10 ml cold PBS + protease inhibitors, wash the cells by gently pipetting, andcentrifuge 5 min at 2,400 × g, 4◦C.
14. Remove the supernatant by careful aspiration to avoid losing the cell pellet. Repeatsteps 12 and 13.
15. Without adding any more solution, centrifuge the tube one more time at 5 min at2,400 × g, 4◦C.

MacromolecularInteractions inCells
17.12.9
Current Protocols in Cell Biology Supplement 51
16. Remove all of the supernatant by careful pipetting.
The sample medium contains biotin, which can compete for the binding to streptavidinwith the biotinylated chromatin in the downstream pull-down step. Thorough washing ofthe medium from the cells is therefore critical.
The sample pellet can be snap frozen in liquid nitrogen and stored indefinitely in liquidnitrogen, or up to several months at −80◦C.
Lyse cells and shear chromatinTypically (Weinmann and Farnham, 2002), nuclei are prepared from the cross-linkedcells before chromatin shearing. We found that, due to the strong affinity between biotinand streptavidin and our stringent washing conditions, this step is not necessary in ourprotocol.
17. Resuspend the pellet (kept cold on ice) in 500 μl of ice-cold ChIP buffer.
Applying more ChIP buffer helps to shear the chromatin; however, too much dilutionincreases the volume of the reaction, which may require increased volume of streptavidinbeads used for binding.
18. Sonicate the sample using a sonicator kept in cold room, as follows (for the Diagenodesonicator):
a. Transfer the samples to appropriate tubes for sonication.
The best choice is 15-ml polystyrene tubes.
b. Remove the tube holder, and check that water level is at the blue mark.
c. Use the appropriate tube holder and accessories for samples, and rinse with ethanolbefore use.
d. Balance the tubes in sonicator.
e. Input sonication settings of 5 pulses for 30 sec each (red needle), with 1-min restintervals between pulses (green needle). Set the LMH dial to high.
This results in chromatin fragments of 300 to 800 bp in length.
The pulse duration, intensity, and number will vary, depending on the extent of cross-linking and cell type. You must optimize conditions for your experiment. Ideally, the leastamount of input energy that gives satisfactory fragmentation should be used.
f. Rinse the used tube holder and accessories with water, and then with 70% ethanol.
Check sonication efficiency and fragment size19. Reverse the cross-link of a 10-μl aliquot, as follows:
a. Add 40 μl 300 nM NaCl to 10 μl sample.
b. Add 2 μl of 5 M NaCl (0.2 M NaCl final concentration).
c. Boil for 15 min.
d. Cool down to room temperature.
e. Add 1 μl of 10 mg/ml RNase A.
20. Electrophorese the sample on a 1% agarose gel and visualize by staining (e.g., seeVoytas, 2001).
The average size of the sheared DNA fragments should be in the range 0.2 to 0.5 kb(Fig. 17.12.5). If the average size of sheared DNA fragments is too large, continuesonication as in step 18, and repeat steps 19 and 20 to check the results.
Isolate chromatin samples21. Transfer the sonicated material to an ice-chilled, 1.5-ml microcentrifuge tube, and
centrifuge 10 min at 12,000 × g, 4◦C.
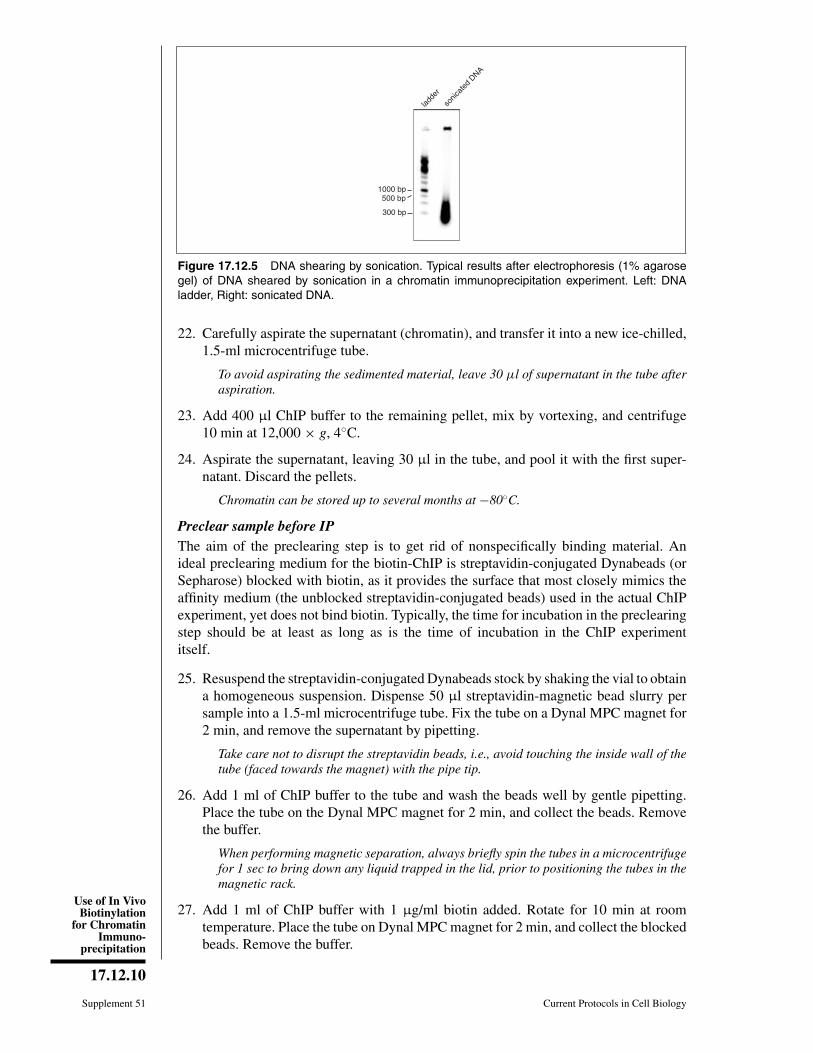
Use of In VivoBiotinylation
for ChromatinImmuno-
precipitation
17.12.10
Supplement 51 Current Protocols in Cell Biology
ladde
r
sonic
ated
DNA
1000 bp500 bp
300 bp
Figure 17.12.5 DNA shearing by sonication. Typical results after electrophoresis (1% agarosegel) of DNA sheared by sonication in a chromatin immunoprecipitation experiment. Left: DNAladder, Right: sonicated DNA.
22. Carefully aspirate the supernatant (chromatin), and transfer it into a new ice-chilled,1.5-ml microcentrifuge tube.
To avoid aspirating the sedimented material, leave 30 μl of supernatant in the tube afteraspiration.
23. Add 400 μl ChIP buffer to the remaining pellet, mix by vortexing, and centrifuge10 min at 12,000 × g, 4◦C.
24. Aspirate the supernatant, leaving 30 μl in the tube, and pool it with the first super-natant. Discard the pellets.
Chromatin can be stored up to several months at −80◦C.
Preclear sample before IPThe aim of the preclearing step is to get rid of nonspecifically binding material. Anideal preclearing medium for the biotin-ChIP is streptavidin-conjugated Dynabeads (orSepharose) blocked with biotin, as it provides the surface that most closely mimics theaffinity medium (the unblocked streptavidin-conjugated beads) used in the actual ChIPexperiment, yet does not bind biotin. Typically, the time for incubation in the preclearingstep should be at least as long as is the time of incubation in the ChIP experimentitself.
25. Resuspend the streptavidin-conjugated Dynabeads stock by shaking the vial to obtaina homogeneous suspension. Dispense 50 μl streptavidin-magnetic bead slurry persample into a 1.5-ml microcentrifuge tube. Fix the tube on a Dynal MPC magnet for2 min, and remove the supernatant by pipetting.
Take care not to disrupt the streptavidin beads, i.e., avoid touching the inside wall of thetube (faced towards the magnet) with the pipe tip.
26. Add 1 ml of ChIP buffer to the tube and wash the beads well by gentle pipetting.Place the tube on the Dynal MPC magnet for 2 min, and collect the beads. Removethe buffer.
When performing magnetic separation, always briefly spin the tubes in a microcentrifugefor 1 sec to bring down any liquid trapped in the lid, prior to positioning the tubes in themagnetic rack.
27. Add 1 ml of ChIP buffer with 1 μg/ml biotin added. Rotate for 10 min at roomtemperature. Place the tube on Dynal MPC magnet for 2 min, and collect the blockedbeads. Remove the buffer.

MacromolecularInteractions inCells
17.12.11
Current Protocols in Cell Biology Supplement 51
28. Repeat wash twice as in step 26. Then add 50 μl ChIP buffer per sample, plus a smalladditional volume for pipetting error.
For example, calculate the amount of buffer as (N + 0.5) × 50, where N is the number ofsamples.
29. Dispense in aliquots of 50 μl into prelabeled 1.5-ml microcentrifuge tubes. Collectthe beads using the magnetic separator, and remove the buffer from each tube.
Make sure the stock bead suspension is homogenous before pipetting.
30. Add the chromatin samples to the tubes, reserving an aliquot (at least 10 μl) as aninput chromatin sample. Rotate 3 hr at 4◦C.
31. Meanwhile, prepare the streptavidin-conjugated Dynabeads (affinity medium) forthe ChIP procedure by following the steps 25 to 29, skipping the biotin blocking instep 27.
32. Magnetically separate the blocked beads and precleared chromatin samples (step 30),and transfer the precleared chromatin to the prelabeled tubes containing the washedaffinity medium (unblocked streptavidin-conjugated beads; step 31).
Perform binding for immunoprecipitation33. Mix the chromatin sample and streptavidin beads carefully with gentle pipetting.
Incubate the tube on the test-tube rotator 3 hr at 4◦C.
A 3-hr incubation is the minimum time recommended for successful pull-down of biotiny-lated chromatin. Longer incubation times can also be used. In this case, the length ofincubation in the preclearing step (step 30) should be increased accordingly.
34. Briefly (1 to 2 sec) microcentrifuge the tube to collect the beads into the bottoms ofthe tubes.
35. Mix the sample and beads well by gently pipetting, and transfer the supernatant andthe beads to a fresh tube placed on the magnetic separator.
The tube surface is a source of unspecific binding of chromatin. Transferring the ChIPmaterial to a fresh tube enhances specificity of the ChIP procedure.
36. Wait for 2 min to collect beads to the side of the tube.
37. Remove the supernatant with a pipet, taking care not to disrupt the beads.
Wash beadsAll of the following washing steps are carried out at room temperature; each wash shouldbe performed quickly to prevent the beads from drying out.
38. Add 1 ml washing buffer 1 to the tube, gently resuspend beads by flicking the tube,and rotate the tube for 10 min at room temperature.
39. Collect the beads by magnet, and remove the washing buffer. Wash a second time byadding 1 ml washing buffer 1, resuspending and transferring the suspension to thenew tube, rotating for 10 min at room temperature, collecting the beads by magnet,and removing the washing buffer.
The advantage of biotin-ChIP protocol is that more stringent washing conditions can beused, in particular, 2% SDS. (Fig. 17.12.4).
40. Wash twice with 1 ml washing buffer 2, as described in steps 38 and 39, except forchanging the tube.
Changing the tube is not necessary at this point.

Use of In VivoBiotinylation
for ChromatinImmuno-
precipitation
17.12.12
Supplement 51 Current Protocols in Cell Biology
41. Wash twice with 1 ml washing buffer 3, as described in steps 38 and 39, except forchanging the tube between the washes. After the last wash, transfer the sample to a1.5-ml screw-cap tube.
Elute and de-cross-link samplesDue to strong affinity between streptavidin and biotin, the elution of the biotinylatedmolecule from streptavidin-coupled beads is not trivial. However, after de-cross-linking,DNA comes off the beads independently from the biotinylated protein. Accordingly, inour protocol, the elution and de-cross-linking steps are combined.
42. Add 60 μl of 300 mM NaCl to the beads contained in screw-cap tubes. Incubateovernight at 67◦C.
Using screw-cap tubes minimizes evaporation of elution buffer during overnight de-cross-linking. Alternatively, regular microcentrifuge tubes can be wrapped with Parafilm.
43. Briefly centrifuge, and add 3 μl of 20 mg/ml proteinase K and 15 μl of 5× proteinaseK buffer. Incubate 2 hr at 67◦C.
44. Meanwhile, prepare the input chromatin sample (reserved in step 30). To 10 μl ofinput chromatin samples, add 60 μl of ChIP buffer and 3 μl of 20 mg/ml proteinaseK, vortex, and incubate on a heating block for 2 hr at 67◦C.
From this time point, process the input samples and the ChIP samples in parallel.
45. Briefly centrifuge all of the incubated tubes, and place them in the Dynal MPCmagnet. Wait for 3 min for the beads to separate.
46. Transfer the supernatant by pipetting to a new tube, and discard the magnetic beads.
DNA purificationChIP protocols designed for PCR analysis do not include an RNase step, but it can beintroduced before step 47 of the DNA purification.
47. Add 500 μl PBI buffer to each sample, including the input sample.
48. Add 10 μl of 3 M NaOAc (pH 5 to 5.2), and lightly vortex.
This makes the solution less basic.
49. Transfer to a DNA purification column.
50. Centrifuge 1 min at 2000 × g, 4◦C, and discard the flow-through.
51. Place the column back into the catch tube and add 500 μl PE buffer to each tube.Centrifuge 1 min at 2000 × g, 4◦C and discard flow through.
52. Repeat step 51.
53. Reinsert the column into the catch tube, and centrifuge 30 min at maximum speed.Make sure that no liquid is left at the rim of the tube.
54. Label fresh 1.5-ml microcentrifuge tubes, and place each column into a new micro-centrifuge tube. Discard the catch tubes.
55. Add 30 μl EB buffer to the column membrane, and incubate 2 min at room temper-ature.
56. Microcentrifuge 1 min at maximum speed, room temperature, and discard thecolumn.
The DNA solution in the microcentrifuge tube can be stored up to several months at–80◦C, if necessary, before analysis (e.g., by qPCR; see Support Protocol 1).

MacromolecularInteractions inCells
17.12.13
Current Protocols in Cell Biology Supplement 51
SUPPORTPROTOCOL 1
ANALYSIS AND DATA INTERPRETATION BY qPCR
The DNA from the ChIP samples isolated in Basic Protocol 1 can be analyzed indifferent ways, e.g., by PCR, DNA arrays, or sequencing; thus, the setup of the samplesand interpretation of the results will vary accordingly. Here we discuss general principlesof the analysis of ChIP samples using quantitative real-time polymerase chain reaction(qPCR). We more specifically address the calculation of immunoprecipitation efficienciesfrom the data obtained by qPCR, and their interpretation. See UNIT 17.7 (particularly,Alternate Protocol 2) for more information about procedures used to carry out qPCR.
Make several dilutions of the reference sample (i.e., input chromatin from Basic Protocol1, step 30) in the elution buffer (EB from the Qiagen DNA purification kit). Analyze theChIP samples (obtained in Basic Protocol 1) and the reference sample with the same PCRprogram. Include DNA melting curve analysis to check the product specificity. TypicalqPCR protocols include melting curves, and most qPCR machines have this option, asa quality control to check for correct PCR-fragment amplification and quantificationduring the qPCR procedure.
Typically, you will have to quantify the immunoprecipitation efficiency for the followingcases:
P1 - presence of the gene of interest G1 in the ChIP of protein of interestP2 - presence of the control gene G2 in the ChIP of protein of interestC1 - presence of the gene of interest G1 in the mock ChIP (e.g., using Biotin-GFP
expressing cells)C2 - presence of the control gene G2 in the mock ChIP.
To determine the relative enrichment of a protein on a particular DNA site perform thefollowing calculations:
A BGFP DP1 GFP DP1 GFP DP1
6
4
2
0
2
1
0
2
1
0
Figure 17.12.6 Typical result from a biotin-chromatin immunoprecipitation (biotin-ChIP) experi-ment analyzed by qPCR. (A) Interaction of transcription factor DP1 with its cognate DHFR pro-moter. The cells were transiently transfected with pBBHN.DP1 vector. Shown is the ratio betweenamounts of DNA pulled down from BAP-DP1 transfected sample and BAP-eGFP transfectedsample, considered as a nonspecific background (mean of three experiments, standard devia-tions indicated by error bars). The sequences of primers for qPCR analysis are: DHFR 5′: gcg gagcct tag ctg cac aa, DHFR 3′: tac cag cct tca cgc tag ga. (B) DP1 interaction with irrelevant GAPDH(left) and β-actin (right) promoters. Immunoprecipitate from the same experiment as in (A) wastested with the GAPDH- and β-actin-specific primers. The sequences are: β-actin 5′: acc gag cgtggc tac agc tt, b-actin 3′: tgg ccg tca ggc agc tca ta, GAPDH 5′: cca atg tgt ccg tcg tgg atc t, andGAPDH 3′: gtt gaa gtc gca gga gac acc.

Use of In VivoBiotinylation
for ChromatinImmuno-
precipitation
17.12.14
Supplement 51 Current Protocols in Cell Biology
1. Calculate the immunoprecipitation efficiency (IE) for each sample (i.e., P1, P2, C1and C2) by dividing the signal obtained from immunoprecipitated material by thesignal obtained from the input chromatin. Ideally, the mean and SD of each ChIPare calculated from at least three independent experiments, and two independentamplifications.
2. For each DNA fragment analyzed, subtract the IE value obtained for the nonrelevantprotein (C1, C2) from the IE value obtained for the protein of interest (P1, P2),respectively. This subtraction removes background noise due to nonspecific bindingof chromatin to beads.
3. Take the ratio between these data for the gene of interest G1 and control gene G2by calculating the enrichment of a protein on a particular DNA site G1relative to aDNA site G2, according to the formula: (P1−C1)/(P2−C2). This formula gives usthe relative (x-fold) enrichment of a protein on a particular site as compared to anirrelevant DNA site.
Typical results from the biotin-ChIP procedure and qPCR analysis are shown inFigure 17.12.6. The high ratio between the ChIP samples in Figure 17.12.6A signifies aspecific interaction of the protein (DP1) with DNA (DHFR promoter).
SUPPORTPROTOCOL 2
TESTING THE EFFICIENCY OF BIOTINYLATION USING ASTREPTAVIDIN GEL-SHIFT
Due to the strong interaction between streptavidin and biotin, the addition of strep-tavidin to the biotinylated protein of interest before loading onto an SDS-PAGE gelleads to an easily detectable decrease in the mobility of the biotinylated protein(∼50 kDa). Comparing the intensities of the immunoblot signals corresponding to theshifted (streptavidin-bound) and nonshifted (unbound, and hence, unbiotinylated) formsof the protein provides an estimate of the percentage of the total BAP-fusion protein thatwas biotinylated.
The estimation of biotinylation efficiency with a streptavidin gel-shift can be done withamounts of material typically much smaller than required for ChIP. In addition, thecross-linking is not performed. Therefore, we recommend performing the streptavidingel-shift as a preliminary experiment with a small number of cells (transiently trans-fected or stable cell lines). Given that only nuclear proteins are concerned when ChIP isperformed, we recommend using nuclei instead of the total lysate, purifying nuclei fromspecific cell line according to your preferred method.
This protocol describes preparation of nuclei from HEK 293 cells and estimation of thebiotinylation efficiency of the BAP-fused protein. Typically, one well from a 6-well plateis sufficient for the experiment.
Materials
5 × 10⁶ HEK 293 cells expressing the biotinylated protein of interest (see BasicProtocol 1, steps 1 to 5) grown in one well of a 6-well tissue culture plate
Phosphate-buffered saline (PBS, APPENDIX 2A)CSK buffer (see recipe)1× NuPAGE LDS sample buffer (Invitrogen)5 mg/ml streptavidin (Sigma)4 to 12% gradient Novex Tris·glycine precast gels (Invitrogen)Antibody for detection of the protein of interest (e.g., anti-GFP)

MacromolecularInteractions inCells
17.12.15
Current Protocols in Cell Biology Supplement 51
1.5-ml microcentrifuge tubeSonicator (e.g., Diagenode), with appropriate tube holder and accessoriesHeating block set at 96◦C
Additional reagents and equipment for performing immunoblot analysis (UNIT 6.2)
Prepare chromatin samples1. Detach and collect ∼5 × 10⁵ cells expressing the biotinylated protein of interest, by
pipetting in 1 ml of PBS, and transfer to a 1.5-ml microcentrifuge tube.
HEK 293 cells can be easily detached by pipetting. However, most of the other cells lineswill require trypsinization.
2. Centrifuge 5 min at 1000 × g, room temperature.
3. Aspirate and discard the supernatant.
4. Lyse the cells by adding 100 μl of CSK buffer. Incubate for 5 min on ice.
5. Centrifuge 5 min at 2000 × g, room temperature.
6. Aspirate and remove the supernatant.
The pellet contains the nuclei. Store the nuclei up to 1 week at −20◦C.
7. Add 100 μl of 1× NuPAGE LDS sample buffer with 10 mM DTT added just beforeuse.
8. Heat the sample 5 min at 96◦C, and vortex intensively for 10 sec.
9. If the viscous pellet remains, homogenize the sample by sonication.
10. Dispense two 10-μl aliquots of the lysate into 1.5-ml microcentrifuge tubes, and add1 μl of 5 mg/ml streptavidin (5 μg) to one of the aliquots.
Carry out immunoblotting11. Incubate the samples for 5 min at room temperature.
12. Load the samples on a 4 to 12% gradient Novex Tris·glycine precast gel, separatethe proteins, and perform immunoblot analysis under the conditions of your choice(see UNIT 6.2).
If the antibodies against the protein are not available, use HRP-conjugated PentaHisantibody (Qiagen cat. no. 34460) according to the manufacturer’s protocol. The vectorwe use includes a 6×His tag.
13. Interpret results.
Typical results are presented in Figure 17.12.2. Biotinylated GFP is shown in the presenceand absence of streptavidin. Both a cis (both BirA and BAP-GFP expressed from onemRNA) and trans (expressed from two independent, cotransfected plasmids) biotinylationare shown.
The addition of streptavidin to the sample before loading leads to an easily detectable de-crease in the mobility of the biotinylated protein (∼50 kDa). Comparing the intensities ofthe immunoblot signals corresponding to the shifted (streptavidin-bound) and nonshifted(unbound, and hence, unbiotinylated) forms of the protein provides an estimate of whatpercent of the total BAP-fusion protein was biotinylated.
BASICPROTOCOL 2
UNBIASED AMPLIFICATION OF ChIP SAMPLE BY ISOTHERMALMULTIPLE STRAND DISPLACEMENT AMPLIFICATION (IMDA)
Most of the currently available techniques for amplifying small DNA fragments intro-duce sequence-dependent bias in the amplified mixture. We describe here a method,useful for the analysis of complex mixtures of DNA fragments, typically generated in

Use of In VivoBiotinylation
for ChromatinImmuno-
precipitation
17.12.16
Supplement 51 Current Protocols in Cell Biology
1 2
+
B1
2 3
4 5
A
Figure 17.12.7 Amplification of complex mixtures of DNA fragments by isothermal multiple strand displace-ment amplification (IMDA.) (A) The principle of concatemer-mediated multiple displacement amplification.(1) Religation of DNA fragments with T4 DNA ligase leads to two types of products: (2) linear concatemersand (3) circular concatemers. Annealing of random hexamer primers and addition of phi29-DNA polymeraseleads to concatemer-mediated multiple strand displacement amplification from (4) linear and (5) circular con-catemers respectively. (B) The principle of stuffer DNA. (1) In the case of much-diluted samples, religationpreferentially leads to self-circularization of fragments, which are then amplified as individual molecules. (2)The addition of stuffer DNA (derived from an evolutionarily distant source; indicated by heavy lines) to thesample DNA favors intermolecular ligation and leads to the formation of long concatemers, both linear andcircular. These long concatemers can then be reliably amplified using the IMDA technique. The resulting DNAcan be analyzed by PCR and DNA microarrays; however, high-throughput sequencing will produce mostlyirrelevant information due to the excess of foreign DNA in the amplified mixture.
the miniscale ChIP experiments (Shoaib et al., 2008). If the DNA concentration in thesample exceeds 10 ng/μl, the DNA is blunt-ended and treated with ligase to form largeconcatemers (circles or linear molecules), which are further amplified using �29-basedisothermal multiple-strand displacement amplification (IMDA). In these randomly com-posed concatemers, the differences in amplifiability between individual DNA fragments(due to their length, GC content, and secondary structure) are averaged out, helping todecrease the sequence-dependent bias in the amplified pool of DNA. If, however, theDNA concentration is less than 10 ng/μl, an evolutionarily distant “stuffer DNA” is addedto the sample to adjust the total DNA concentration to the value sufficient for concate-merization. This procedure requires generation of long concatemers from the fragmentspresent in the original ChIP samples, but the DNA concentration of <10 ng/μl will leadto self-circularization of the ChIP fragments, instead of concatemer formation (Shoaibet al., 2008). To prevent self-circularization, an irrelevant stuffer DNA should be addedto the sample before ligation (Fig. 17.12.7). Therefore, the DNA concentration shouldfirst be measured to determine if the stuffer DNA is necessary.
Materials
ChIP DNA sample (Basic Protocol 1)∼500-bp fragments of sonicated E. coli DNA, optional (see Basic Protocol 1, step
18)Takara Mighty Cloning Kit, blunt end (Takara), including
10× Blunting Kination BufferBlunting Kination Enzyme MixLigation Mighty Mix

MacromolecularInteractions inCells
17.12.17
Current Protocols in Cell Biology Supplement 51
25:24:1 (v/v/v) phenol/chloroform/isoamyl alcohol24:1 (v/v) chloroform/isoamyl alcohol3 M sodium acetate20 mg/ml glycogen70% (v/v) and 100% ethanol, coldTE (Tris/EDTA) buffer (APPENDIX 2A)5 U/μl Ø29-DNA polymerase: dilute 1000 U/μl Ø29-DNA polymerase (Epicentre
Biotechnologies) 1:200 with the supplied buffer and store up to 3 months at−20◦C
2× IMDA reaction buffer (see recipe)200 μM random hexamer primers (NEB)Mineral oil, biotechnology grade
NanoDrop spectrophotometer (NanoDrop)1.5-ml microcentrifuge tubes16◦C, 30◦C, 37◦C, 65◦C, and 70◦C cooling/heating blocks or thermal cycler
Prepare sample DNA1. Use 1 μl of each sample to measure the DNA concentration using a NanoDrop
spectrophotometer according to the manufacturer’s directions.
2. If the DNA concentration is lower than 10 ng/μl, add sonicated E.coli DNA (stufferDNA) to a final concentration of 15 ng/μl.
3. Using components of the Takara Mighty Cloning Kit, prepare the following 20-μlreaction mixture in a 1.5-ml microcentrifuge tube:
17 μl sample DNA2 μl of 10× Blunting Kination Buffer1 μl Blunting Kination Enzyme Mix.
Incubate 10 min at 37◦C.
4. Mix 80 μl of distilled water and 100 μl of phenol/chloroform/isoamyl alcohol.Centrifuge 5 min at 16,000 × g, room temperature, and transfer the upper layer to anew tube.
5. Add an equal amount of chloroform/isoamyl alcohol and mix. Centrifuge 5 min at16,000 × g, room temperature, and transfer the upper layer to new a tube.
6. Add 10 μl of 3 M sodium acetate, 2 μl of 20 mg/ml glycogen, and 250 μl of chilled100% ethanol, and mix. Incubate 20 min at −80◦C.
7. Centrifuge at 10 min at 16,000 × g, 4◦C.
8. Remove the supernatant. Wash the precipitate with chilled 70% ethanol. Centrifuge5 min at 16,000 × g, 4◦C.
9. Remove the supernatant, and dry the precipitate on the bench at room temperature(5 to 10 min).
10. Dissolve the precipitate in 10 μl TE buffer.
Perform ligation11. Add 10 μl Ligation Mighty Mix, and mix gently. Incubate 1 hr at 16◦C.
12. Inactivate the enzymes by heating 5 min at 65◦C.

Use of In VivoBiotinylation
for ChromatinImmuno-
precipitation
17.12.18
Supplement 51 Current Protocols in Cell Biology
Perform IMDA procedure13. Prepare the Ø29 reaction mix immediately before setting up the reactions. For a
10-μl of reaction mix, combine the following:
6.3 μl of 2× buffer1.2 μl of 5 units/μl Ø29-DNA polymerase (0.6 units/μl final concentration)2.5 μl of 200 μM random hexamer primers (50 μM final concentration).
The volume of the reaction mix may be adjusted as necessary, for the number of samples.
14. Combine 1 μl of DNA concatemers with 2 μl of Q29 reaction mix.
15. Overlay the sample with 10 μl of biotechnology grade mineral oil to prevent evap-oration, and briefly microcentrifuge to make sure that the aqueous phase forms asmall sphere at the bottom of the tube.
16. Incubate 6 hr at 30◦C, and then heat for 10 min at 70◦C to inactivate the enzyme.
17. Store the samples up to 3 months at −20◦C or up to 1 year at −80◦C, or useimmediately for further analysis.
REAGENTS AND SOLUTIONSUse deionized, distilled water in all recipes and protocol steps. For common stock solutions, seeAPPENDIX 2A; for suppliers, see SUPPLIERS APPENDIX.
ChIP buffer
0.3% (w/v) SDS1% (v/v) Triton X-1002 mM EDTA (APPENDIX 2A)30 mM Tris·Cl, pH 8 (APPENDIX 2A)150 mM NaClStore up to several months at 4◦C. Just before use add 25× protease inhibitor stock
(see recipe) to a final concentration of 1×.
CSK buffer
100 mM NaCl300 mM sucrose10 mM Tris·Cl, pH 7.5 (see APPENDIX 2A)3 mM MgCl21 mM EGTA1.2 mM phenymethylsulfonyl fluoride (PMSF, APPENDIX 2A)0.5% (v/v) Triton X-100Store up to several months at 4◦C. Just before use, add 1.2 mM (final concentration)
phenylmethylsulfonyl fluoride (PMSF, APPENDIX 2A) and 25× protease inhibitorstock (see recipe) to a final concentration of 1×.
IMDA reaction buffer, 2×Prepare 10× IMDA reaction buffer containing the following components:
370 mM Tris·Cl, pH 7.5 (see APPENDIX 2A)100 mM MgCl2500 mM KCl50 mM (NH4)2SO4
2% (v/v) Tween 20continued

MacromolecularInteractions inCells
17.12.19
Current Protocols in Cell Biology Supplement 51
1 μg/μl bovine serum albumin (BSA)Store up to 6 months at −20◦C.
Prepare 2× buffer from the 10× buffer, by adding 10 mM dNTP mix (Promega;2 mM final concentration), DTT (2 mM final concentration), and water.
Protease inhibitor stock, 25×Dissolve a 50-ml size of Complete Protease Cocktail Tablet (Roche) in 2 ml water,and dispense 100- to 200-μl aliquots into microcentrifuge tubes. Store up to 6months at −20◦C.
COMMENTARY
Background InformationAll genomic processes in eukaryotes—
transcription, replication, repair, andrecombination—occur in the context ofchromatin, the hierarchically organized anddynamic complex of DNA and histone andnonhistone proteins. The systematic study ofthe time-dependent association among thesecomponents of chromatin requires robust andeffective approaches to characterizing protein-DNA interactions. Methods such as the elec-trophoretic gel mobility shift assay (EMSA;Revzin 1989; Molloy, 2000), systematicevolution of ligands by exponential enrich-ment (SELEX; Gold et al., 1995), and others(Veenstra, 1999) have been developed tostudy binding of protein to DNA. However, inthese approaches, the interactions are studiedin vitro, out of the context of chromatinand the nuclear environment, and thus anindependent confirmation is required to assessthe relevance of the data obtained. Chromatinimmunoprecipitation (ChIP; Kuo and Allis1999; Orlando, 2000) has emerged in thelast decade as part of a standard toolboxfor analyzing protein-DNA interactions ina more physiological context, as it detectsthem directly in their native environments.In the past several years, it has been widelyused to study the in vivo association of aparticular DNA sequence with regulatoryproteins and various forms of histones (i.e.,their post-translationally modified forms andreplacement variants).
Despite its conceptual simplicity, the ChIPprotocol requires fine tuning for each individ-ual protein and cell type. Compared to affin-ity purifications from cellular and nuclear ex-tracts, the most common problem in ChIP ishigh nonspecific background, caused by theeasy aggregation of chromatin and its bind-ing to surfaces. Accordingly, the success ofChIP crucially depends on the quality of an-tibodies used. ChIP grade antibodies have to
tolerate stringent binding and washing condi-tions, and also recognize the parts of the pro-tein that are (1) not involved in the interactionunder question and (2) minimally affected bythe formaldehyde cross-linking.
Some of the limitations of the native anti-body approach are overcome by using epitope-tagging, i.e., by expression in the cells ofthe protein of interest fused to an epitopetag recognized by a well characterized anti-body (Jarvik and Telmer, 1998; Wang, 2009).Among the advantages of this method are stan-dardization and commercial availability of rel-atively inexpensive epitope-tagging systems.Unlike using antibody against a native protein,the epitope-tagging approach lends itself to aneasy and efficient negative control, where thenonspecific signal is detected by a parallel pu-rification from a sample that does not expressan epitope-tagged protein (i.e., mock purifica-tion). Epitope tagging is a preferred methodfor comparing closely related proteins whenthe antibodies for distinguishing between thedifferent protein forms are not readily avail-able (e.g., mutant or alternative splicing vari-ants of the same protein). Finally, the bind-ing of the tag to antibody usually does notcompete with the protein-DNA interaction un-der study, as compared to the native antibody.Nonetheless, given that epitope-tagging mightaffect the protein function, the use of severalversions of epitope tagged protein of interest,typically with their N- or C- termini modified,is recommended.
The interaction between biotin and strepta-vidin (Kd of 10−15 M) is one of the strongestknown noncovalent interactions (Lindqvistand Schneider, 1996). Many commerciallyavailable reagents for purification and detec-tion of biotinylated macromolecules have beendeveloped. Accordingly, to take advantage ofthis interaction, we (Viens et al., 2004) andothers (van Werven and Timmers, 2006; Ooiet al., 2010) have developed biotin-ChIP, a

Use of In VivoBiotinylation
for ChromatinImmuno-
precipitation
17.12.20
Supplement 51 Current Protocols in Cell Biology
variant of the epitope-tagging approach toChIP, based on protein biotinylation in vivo.Such an approach, in its various forms, hasbeen applied to a broad variety of experi-mental systems, including mammalian cells,yeast, insects, and worms (van Werven andTimmers, 2006; Kim et al., 2009; Kolodziejet al., 2009; Lausen et al., 2010; Ooi et al.,2010). The main advantage of this method forChIP is the more stringent washing conditions,as well as more efficient (i.e., more quantita-tive) recovery of the protein-DNA complexes(Figure 17.12.4). Note that the in vivo biotiny-lation of histones has been also used for na-tive ChIP (NChIP) format (i.e., without cross-linking, Ooi et al., 2010), which takes ad-vantage of the exceptionally strong and spe-cific binding between biotin and streptavidinand allows one to reduce the volume of affin-ity medium, and thus decrease nonspecificbackground. Moreover, although not testedyet, one would expect that in vivo biotinyla-tion can be equally useful for many modifica-tions of ChIP developed to date, e.g., 3C-5C(Vassetzky et al., 2009) and RNAChIP (Gilbertand Svejstrup, 2006; Percipalle and Obrdlik2009).
Critical Parameters
Transfection efficiency (Basic Protocol 1,steps 1 to 5)
When using calcium phosphate transfec-tion, the pH of the HeBS buffer is crucial.The precipitate should be barely visible undermicroscope. For control of transfection effi-ciency, we recommend transfecting a separatecell well with BAP-GFP (or any other fluo-rescent protein); this sample can also be laterused as a negative control in ChIP.
Cross-linking (Basic Protocol 1,steps 6 to 16)
Excessive cross-linking can negatively af-fect the efficiency of chromatin fragmentation.The empirically chosen dose of formaldehyde(1% final solution, 10 min) might require opti-mization, depending on the cell type and pro-tein used. Several samples with different cross-linking times should be tested. In most cases,8 to 10 min for cross-linking is sufficient forChIP with mammalian cells.
Fragmentation (Basic Protocol 1,steps 17 to 20)
The desired size of chromatin fragments de-pends on the downstream analysis. Generally,it should be ∼400 to 500 bp. Longer frag-ments will diminish resolution and increase
nonspecific signal; therefore, they are not rec-ommended for high-throughput analysis (mi-croarray analysis or sequencing). Fragmentsthat are too short are generally not good forPCR detection, as it becomes challenging tofind suitable primers for amplification.
The sonication parameters (pulse duration,intensity, and number) vary, depending on theextent of cross-linking and cell type; thus, theymust be optimized for each experiment. Ide-ally, the least amount of input energy that givessatisfactory fragmentation should be used.
Affinity purification (Basic Protocol 1, 33 to41)
After cell lysis (steps 9 to 16), the sam-ple will contain biotin, which will competewith the biotinylated chromatin for binding tostreptavidin in the downstream pull-down step.Thorough washing of medium from the cellsbefore cell lysis is therefore critical.
The affinity between biotinylated BAP andstreptavidin (steps 33 to 41) can be weakenedby steric hindrance, depending on whether thetagged part of the protein (e.g., its N or C ter-minus) is well exposed or buried. Accordingly,the incubation times and washing stringencycould be adjusted. Typically, a 3-hr incuba-tion is sufficient for successful pull-down ofbiotinylated chromatin. If longer incubationtimes are used, the length of the preclearingincubation step (step 30) should be increasedaccordingly.
IMDA (Basic Protocol 2)A DNA concentration of <10 ng/μl will
lead to self-circularization of the fragmentsobtained in ChIP, instead of the formation ofconcatemers. As the result, the fragments willbe amplified individually, and their sequenceand size-dependent bias in amplification effi-ciency will not be averaged out. Therefore, thefirst step in applying ligation-IMDA is measur-ing DNA concentration, which will determineif the stuffer DNA is necessary.
Troubleshooting
Insufficient fragmentation of DNA aftersonication
When monitoring the size of sheared DNAafter sonication, one can observe insufficientfragmentation. There could be several causesfor this problem: (a) material is overcross-linked (Basic Protocol 1, steps 6 to 16),(b) cells are insufficiently lysed (step 17),or (c) sonication is inefficient (steps 18 to20). Accordingly, take the following step:(a) Cross-linking time could be reduced.

MacromolecularInteractions inCells
17.12.21
Current Protocols in Cell Biology Supplement 51
(b) If there are reasons to suspect that too manycells in a small volume of ChIP buffer wereused for lysis, additional ChIP buffer should beadded. Alternatively, cells can be snap-frozenin liquid nitrogen and thawed. The success oflysis can be estimated visually by inspectingthe sample under the microscope. (c) In thecase of insufficient sonication, the duration,energy, and/or number of rounds of sonicationshould be increased.
Low or absent PCR signal after ChIPLow or no PCR signal after ChIP could
have several causes: (a) insufficient amountof chromatin for immunoprecipitation (BasicProtocol 1, steps 33 to 37), (b) failure of im-munoprecipitation, or (c) failure of PCR. Ac-cordingly, (a) the amount of cells or chro-matin should be increased. Note that it may bedifficult to extract all chromatin from certainprimary cell types. (b) The biotinylation effi-ciency of the target protein should be tested,as well as the quality of streptavidin-beads. Inaddition, one should make sure that the cellswere washed thoroughly before lysis, as biotinin the medium will compete with the biotiny-lated protein for binding (step 16). (c) Oneshould set up a control qPCR with the sameprimers on genomic DNA, and optimize PCRconditions.
Elevated background signalInstead of low PCR signal, one may ob-
serve an elevated background signal. This canbe caused by (a) nonspecific immunoprecipi-tation or (b) insufficient washes. Accordingly,one should (a) reduce duration of incubationof streptavidin-beads with chromatin (step 33)and ensure the tube-switch step (steps 35 and39) is performed and (b) increase the numberand/or stringency of the washes after IP (steps38 to 41).
Anticipated ResultsWe usually obtain ∼15 to 20 ng/μl of final
ChIP DNA from biotin-ChIP (total 30 μl). Intotal, 5% of biotin-ChIP material is used inPCR to test the quality of the sample. In mostof the cases, we observe enrichment of 5 to100-fold from the target loci.
The use of DNA amplification (e.g., IMDA)should allow the analysis of more genomicsites and of the whole genome.
Time ConsiderationsFor the biotin-ChIP protocol, transient
transfection takes 2 days before cell harvest.The cell lysis, preclearing, binding, and wash-ing procedures take 1 full day, with the DNA
eluted from beads and ready for PCR analysisthe next day. If necessary, the preclearing andbinding to streptavidin beads can take longerthan 3 hr, e.g., overnight for both steps. Withpractice, ∼10 samples can be processed in par-allel.
The IMDA procedure takes 1 day, start-ing from DNA measurement and ligation. Thelongest part is amplification, which can takea minimum of 6 hr, but can also be extendedovernight.
The streptavidin gel-shift experiment typ-ically takes 1 day, as it includes SDS-PAGEseparation, transfer to PVDF (or nitrocellu-lose) membrane, blocking, incubation withprimary and secondary antibodies, and en-hanced chemiluminescence (ECL) detection.
Literature CitedDahl, J.A. and Collas, P. 2008. A rapid micro chro-
matin immunoprecipitation assay (microChIP).Nat. Protoc. 3:1032-1045.
de Boer, E., Rodriguez, P., Bonte, E., Krijgsveld,J., Katsantoni, E., Heck, A., Grosveld, F., andStrouboulis, J. 2003. Efficient biotinylation andsingle-step purification of tagged transcriptionfactors in mammalian cells and transgenic mice.Proc. Natl. Acad. Sci. U.S.A. 100:7480-7485.
Gilbert, C. and Svejstrup, J.Q. 2006. RNA immuno-precipitation for determining RNA-protein as-sociations in vivo. Curr. Protoc. Mol. Biol.75:27.4.1-27.4.11.
Gilmour, D.S. and Lis, J.T. 1984. Detecting protein-DNA interactions in vivo: Distribution of RNApolymerase on specific bacterial genes. Proc.Natl. Acad. Sci. U.S.A. 81:4275-4279.
Gold, L., Polisky, B., Uhlenbeck, O., and Yarus,M. 1995. Diversity of oligonucleotide functions.Annu. Rev. Biochem. 64:763-797.
Hager, G.L., Elbi, C., and Becker, M. 2002. Pro-tein dynamics in the nuclear compartment. Curr.Opin. Genet. Dev. 12:137-141.
Jarvik, J.W. and Telmer, C.A. 1998. Epitope tag-ging. Annu. Rev. Genet. 32:601-618.
Kim, J., Cantor, A.B., Orkin, S.H., and Wang,J. 2009. Use of in vivo biotinylation to studyprotein-protein and protein-DNA interactions inmouse embryonic stem cells. Nat. Protoc. 4:506-517.
Kolodziej, K.E., Pourfarzad, F., de Boer, E.,Krpic, S., Grosveld, F., and Strouboulis, J. 2009.Optimal use of tandem biotin and V5 tags inChIP assays. BMC Mol. Biol. 10:6.
Kuo, M.H. and Allis, C.D. 1999. In vivo cross-linking and immunoprecipitation for studyingdynamic Protein:DNA associations in a chro-matin environment. Methods 19:425-433.
Lausen, J., Pless, O., Leonard, F., Kuvardina, O.N.,Koch, B., and Leutz, A. 2010. Targets of the Tal1transcription factor in erythrocytes: E2 ubiqui-tin conjugase regulation by Tal1. J. Biol. Chem.285:5338-5346.

Use of In VivoBiotinylation
for ChromatinImmuno-
precipitation
17.12.22
Supplement 51 Current Protocols in Cell Biology
Lindqvist, Y. and Schneider, G. 1996. Protein-biotininteractions. Curr. Opin. Struct. Biol. 6:798-803.
Mechold, U., Gilbert, C., and Ogryzko, V. 2005.Codon optimization of the BirA enzyme geneleads to higher expression and an improved effi-ciency of biotinylation of target proteins in mam-malian cells. J. Biotechnol. 116:245-249.
Molloy, P.L. 2000. Electrophoretic mobility shiftassays. Methods Mol. Biol. 130:235-246.
Negre, N., Lavrov, S., Hennetin, J., Bellis, M., andCavalli, G. 2006. Mapping the distribution ofchromatin proteins by ChIP on chip. MethodsEnzymol. 410:316-341.
O’Neill, L.P. and Turner, B.M. 2003. Immunopre-cipitation of native chromatin: NChIP. Methods31:76-82.
Ooi, S.L., Henikoff, J.G., and Henikoff, S. 2010. Anative chromatin purification system for epige-nomic profiling in Caenorhabditis elegans. Nu-cleic Acids Res. 38:e26.
Orlando, V. 2000. Mapping chromosomal proteinsin vivo by formaldehyde-crosslinked-chromatinimmunoprecipitation. Trends Biochem. Sci.25:99-104.
Park, P.J. 2009. ChIP-seq: Advantages and chal-lenges of a maturing technology. Nat. Rev.Genet. 10:669-680.
Pashev, I.G., Dimitrov, S.I., and Angelov, D. 1991.Crosslinking proteins to nucleic acids by ul-traviolet laser irradiation. Trends Biochem. Sci.16:323-326.
Percipalle, P. and Obrdlik, A. 2009. Analy-sis of nascent RNA transcripts by chromatinRNA immunoprecipitation. Methods Mol. Biol.567:215-235.
Phair, R.D. and Misteli, T. 2000. High mobility ofproteins in the mammalian cell nucleus. Nature404:604-609.
Revzin, A. 1989. Gel electrophoresis assays forDNA-protein interactions. Biotechniques 7:346-355.
Shoaib, M., Baconnais, S., Mechold, U., Le Cam,E., Lipinski, M., and Ogryzko, V. 2008. Mul-
tiple displacement amplification for complexmixtures of DNA fragments. BMC Genomics9:415.
van Werven, F.J. and Timmers, H.T. 2006.The use of biotin tagging in Saccharomycescerevisiae improves the sensitivity of chro-matin immunoprecipitation. Nucleic Acids Res.34:e33.
Vassetzky, Y., Gavrilov, A., Eivazova, E.,Priozhkova, I., Lipinski, M., and Razin, S. 2009.Chromosome conformation capture (from 3C to5C) and its ChIP-based modification. MethodsMol. Biol. 567:171-188.
Veenstra, T.D. 1999. Electrospray ionization massspectrometry: A promising new technique in thestudy of protein/DNA noncovalent complexes.Biochem. Biophys. Res. Commun. 257:1-5.
Viens, A., Mechold, U., Lehrmann, H., Harel-Bellan, A., and Ogryzko, V. 2004. Use of proteinbiotinylation in vivo for chromatin immunopre-cipitation. Anal. Biochem. 325:68-76.
Viens, A., Harper, F., Pichard, E., Comisso, M.,Pierron, G., and Ogryzko, V. 2008. Use ofprotein biotinylation in vivo for immunoelec-tron microscopic localization of a specific pro-tein isoform. J. Histochem. Cytochem. 56:911-919.
Voytas, D. 2001. Agarose gel electrophoresis. Curr.Protoc. Mol. Biol. 51:2.5A.1-2.5A.9.
Wang, Z. 2009. Epitope tagging of endogenous pro-teins for genome-wide chromatin immunopre-cipitation analysis. Methods Mol. Biol. 567:87-98.
Weinmann, A.S. and Farnham, P.J. 2002. Identifi-cation of unknown target genes of human tran-scription factors using chromatin immunopre-cipitation. Methods 26:37-47.
Wolffe, A. 1999. Chromatin: Structure and Func-tion. Academic Press, London.
Zeng, P.Y., Vakoc, C.R., Chen, Z.C., Blobel, G.A.,and Berger, S.L. 2006. In vivo dual cross-linking for identification of indirect DNA-associated proteins by chromatin immunopre-cipitation. Biotechniques 41:694-698.

10Annex - IV
PUB-NChIP "In Vivo Biotinylation" Approach to Study Chromatin in Proximity of a Pro-tein of Interest (2011)
Muhammad Shoaib 1 , Arman Kulyyassov 1,2 , Chloé Robin 1 , Kinga Winczura 1 , PatriciaKannouche 1 , Erlan Ramankulov 1,2 , Marc Lipinski 1 and Vasily Ogryzko 1
I CNRS UMR-8126, Université Paris-Sud 11, Institut de Cancérologie Gustave Roussy,39, rue Camille Desmoulins, 94805, Villejuif, France.
II National Center for Biotechnology of the Republic of Kazakhstan, 43 Valikhanova Str.,010000, Astana, Republic of Kazakhstan.
In preparation
235


PUB-NChIP – “in vivo biotinylation” approach to study chromatin in
proximity to a protein of interest.
Muhammad Shoaib1, Arman Kulyyassov1,3, Chloé Robin1, Kinga Winczura1, Patricia
Kannouche2, Erlan Ramanculov3, Marc Lipinski1 and Vasily Ogryzko1
1 - UMR8126, Univ. Paris-Sud 11, CNRS, Institut de cancérologie Gustave Roussy, 94805
Villejuif, France
2 - UMR8200, Univ. Paris-Sud 11, CNRS, Institut de cancérologie Gustave Roussy, 94805
Villejuif, France
3 - National Center of Biotechnology, Valihanova 43, 01000, Astana, Kazakhstan

Abstract
Chromatin ImmunoPrecipitation (ChIP) does not allow direct analysis of histone post-
translational modifications in the vicinity of the chromatin protein of interest. This information
has to be indirectly inferred from separate ChIP experiments using antibodies against the
protein and specific histone PTMs. We have developed an alternative approach named PUB-
NChIP (Proximity Utlilizing Biotinylation with Native ChIP) allowing one to circumvent this
problem. It is based on coexpression of a) a protein of interest, fused with the bacterial biotin
ligase BirA together with b) a histone fused to BAP biotin acceptor peptide, which is
specifically biotinylated by BirA. We demonstrate that BAP-fused histones are labeled by
biotin specifically in the locations of a model protein, Rad18. The biotinylated chromatin can
be purified and the PTMs analyzed by western blot and/or mass spectrometry. Moreover, using
BAP fusions with alternative histone variants, instead of canonical histones, one can analyze
chromatin in the context of a particular functional state, marked by this histone. Finally, biotin
pulse-chase experiments allowed us to analyze the histone PTMs at a determined time after
they were in the proximity with the protein of interest.
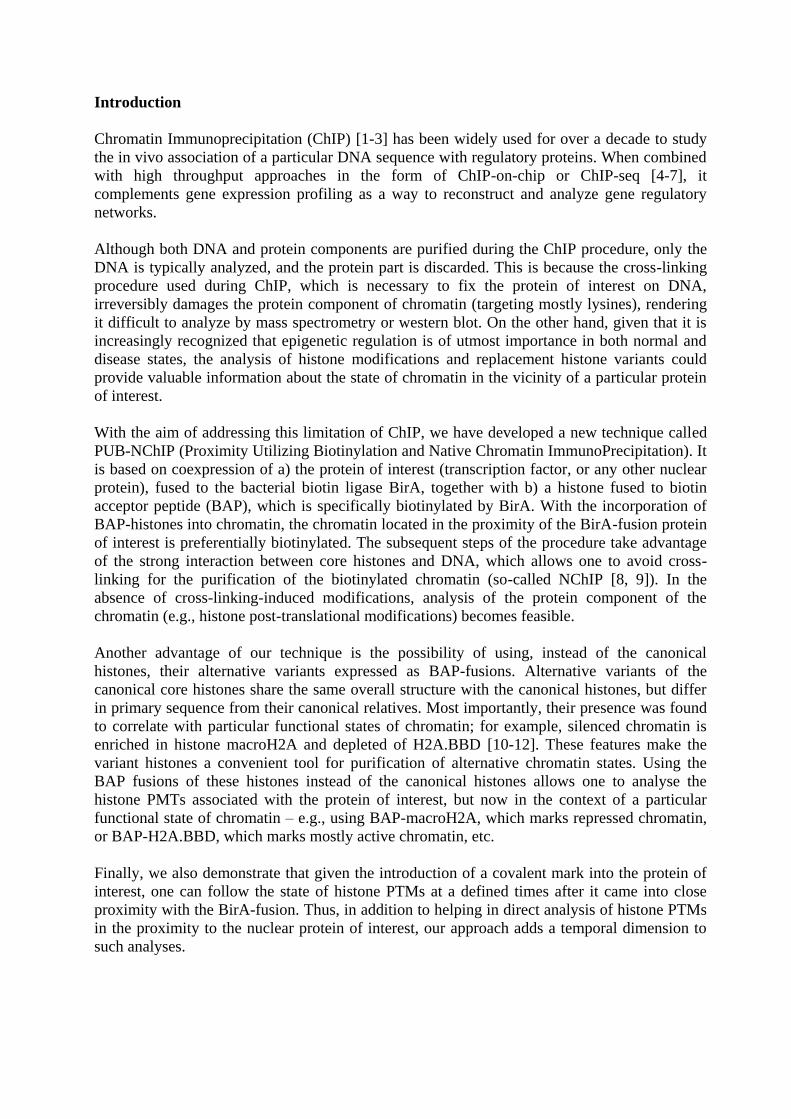
Introduction
Chromatin Immunoprecipitation (ChIP) [1-3] has been widely used for over a decade to study
the in vivo association of a particular DNA sequence with regulatory proteins. When combined
with high throughput approaches in the form of ChIP-on-chip or ChIP-seq [4-7], it
complements gene expression profiling as a way to reconstruct and analyze gene regulatory
networks.
Although both DNA and protein components are purified during the ChIP procedure, only the
DNA is typically analyzed, and the protein part is discarded. This is because the cross-linking
procedure used during ChIP, which is necessary to fix the protein of interest on DNA,
irreversibly damages the protein component of chromatin (targeting mostly lysines), rendering
it difficult to analyze by mass spectrometry or western blot. On the other hand, given that it is
increasingly recognized that epigenetic regulation is of utmost importance in both normal and
disease states, the analysis of histone modifications and replacement histone variants could
provide valuable information about the state of chromatin in the vicinity of a particular protein
of interest.
With the aim of addressing this limitation of ChIP, we have developed a new technique called
PUB-NChIP (Proximity Utilizing Biotinylation and Native Chromatin ImmunoPrecipitation). It
is based on coexpression of a) the protein of interest (transcription factor, or any other nuclear
protein), fused to the bacterial biotin ligase BirA, together with b) a histone fused to biotin
acceptor peptide (BAP), which is specifically biotinylated by BirA. With the incorporation of
BAP-histones into chromatin, the chromatin located in the proximity of the BirA-fusion protein
of interest is preferentially biotinylated. The subsequent steps of the procedure take advantage
of the strong interaction between core histones and DNA, which allows one to avoid cross-
linking for the purification of the biotinylated chromatin (so-called NChIP [8, 9]). In the
absence of cross-linking-induced modifications, analysis of the protein component of the
chromatin (e.g., histone post-translational modifications) becomes feasible.
Another advantage of our technique is the possibility of using, instead of the canonical
histones, their alternative variants expressed as BAP-fusions. Alternative variants of the
canonical core histones share the same overall structure with the canonical histones, but differ
in primary sequence from their canonical relatives. Most importantly, their presence was found
to correlate with particular functional states of chromatin; for example, silenced chromatin is
enriched in histone macroH2A and depleted of H2A.BBD [10-12]. These features make the
variant histones a convenient tool for purification of alternative chromatin states. Using the
BAP fusions of these histones instead of the canonical histones allows one to analyse the
histone PMTs associated with the protein of interest, but now in the context of a particular
functional state of chromatin – e.g., using BAP-macroH2A, which marks repressed chromatin,
or BAP-H2A.BBD, which marks mostly active chromatin, etc.
Finally, we also demonstrate that given the introduction of a covalent mark into the protein of
interest, one can follow the state of histone PTMs at a defined times after it came into close
proximity with the BirA-fusion. Thus, in addition to helping in direct analysis of histone PTMs
in the proximity to the nuclear protein of interest, our approach adds a temporal dimension to
such analyses.

Materials and Methods
Recombinant DNA
The vectors for expression of BAP- and BirA- fusions, as well as BirA-GFP, BirA-Rad18,
BAP-H2A, BAP-macroH2A2 and BAP-H2ABBD expression vectors have been described
elsewhere [13]. The H2AZ and H3.1 ORFs were subcloned from pOZ.FHH vectors [14],
whereas the PolH ORFs (wild type and mutant) were amplified by PCR and inserted to the
BirA- fusion vector using XhoI and NotI restriction sites.
Cell culture
HEK 293T cells were grown in Dulbecco's modified Eagle's medium with high glucose (PAA)
and 10% fetal bovine serum (FCS, PAA). For transient transfection and Western analysis, a
standard calcium phosphate precipitation method was used, and the cells were analyzed one or
two days after transfection, as indicated. For the biotin labeling in vivo, cells were grown for
several days before transfection in the DMEM supplemented with dialyzed FCS, and for the
specified time of labeling, biotin (Sigma) was added to a final concentration of 5 g/ml, while
the pH was stabilized by addition of 50 mM HEPES (pH 7.35) to the medium. For SILAC
experiments, the cells were grown in DMEM with 12
C6 L-lysine and 12
C6 14
N4 L-arginine or 13
C6 L-lysine 13
C6 15
N4 L-arginine (Thermo Scientific, cat # 89983) for at least 5 divisions
before transfection, and kept in the same medium until harvest. For the Western analysis, 3•105
cells (corresponding to one well in a 6-well plate) were used for transfection. For the mass-
spectrometry analysis, 3•106 cells were transfected per data point. DNA damage was induced
with UVC (20 J/m2) or Ionizing radiation (10 Gy). The time of incubation after various
treatments is indicated in the results section.
Biochemistry and Western analysis
Except where indicated otherwise, cell nuclei were used for analysis. They were prepared by
cell disruption in CSK buffer (100 mM NaCl, 300 mM Sucrose, 10 mM Tris pH 7.5, 3 mM
MgCl2, 1 mM EGTA, 1.2 mM PMSF, 0.5% Triton X-100), and centrifugation for 5 min at
4000 rpm. For the analysis of chromatin-associated histones (chromatin fraction), the nuclei
were first incubated in CSK buffer containing 450 mM NaCl by 30 min rotation at 4°C, then
spun at 4000 rpm, and the supernatant containing soluble histones was discarded. For Western
analysis, 1x NuPAGE LDS Sample buffer (Invitrogen, NP0007) with DTT (10 mM) was
added, the nuclei were sonicated, boiled for 5 min at 96° C and loaded on 4-12% gradient
Novex Tris-Glycine precast gels (Invitrogen, NP0315). After separation, the proteins were
transferred to nitrocellulose membranes and probed with HRP-conjugated streptavidin (Sigma,
# S5512) or HRP conjugated -PentaHis antibody (QiaGen, # 34460) according to the
manufacturer‟s protocol, except that for the detection of biotinylated proteins by the HRP-
conjugated streptavidin, 500 mM NaCl was added to the washing buffer (PBS + 0.1% Tween).
For protein visualization, the gels were stained with PageBlue (Fermentas, # R0579). For the
densitometric analysis of Western blots, the program ImageJ 1.42q (freely available online)
was used. To compare the biotinylation levels between different samples, the value of the
streptavidin-HRP signal was normalized to the value of the -PentaHis signal, which reflects
the amount of the transfected protein regardless of its biotinylation status. Every Western
analysis was performed three times; a representative figure is shown in each case.

For Ni2+
NTA purification of 6XHis tagged proteins, the nuclei were solubilized in buffer A
(10% glycerol, 250 mM NaCl, 6 M Guanidine-HCl, 20 mM TrisHCl (pH 8.0), 0.1% Tween)
by rotation for 30 min at 4° C. 1/10 of the volume of Ni2+
NTA agarose, prewashed in the same
buffer, was added to the lysate, followed by rotation at 4° C for 3 h. The beads with bound
proteins were washed twice with buffer A, then twice with buffer B (10% glycerol, 250 mM
NaCl, 20 mM TrisHCl (pH 8.0), 0.1% Tween, 0.2 mM PMSF and cOmplete protease inhibitor
cocktail (Roche)). The bound proteins were eluted by incubating the beads in 4 volumes of
buffer C (10% glycerol, 250 mM NaCl, 20 mM Tris HCl (pH 8.0), 0.1% Tween, 0.2 mM
PMSF, 300 mM imidazole, 50 mM EDTA) and concentrating the sample by ultrafiltration with
Microcon YM-10 (Millipore).
NChIP
Cells were washed with PBS and lysed in 1 mL of CSK buffer (with protease inhibitor cocktail
(Roche; 1697498), 10 mM Na-Butyrate, 2 mM PMSF, 5 mM nicotinamide (Sigma; N5535), 5
mM Na-orthovanadate (Sigma; S6508)) for 5 min at RT. Nuclei were centrifuged at 4000 rpm
for 10 min and kept at 4°C or else at –20°C if not used immediately. For micrococcal digestion,
the nuclei were resuspended in 500 L of TM2 buffer (10 mM Tris-HCl, 2 mM MgCl2, 0.1%
Triton, inhibitors), and 2.5 L of 0.5 M CaCl2 and 3 L of micrococcal nuclease (MNase) (1
U/L) (Sigma; N3755) were added before incubation at 37°C for 10 min. The reaction was
stopped by adding 15 L of 0.1 M EGTA. Nuclei were collected by spinning at 400 g (2000
rpm in Eppendorf tabletop centrifuge) for 10 min at 4°C. After MNase digestion, the nuclei
pellet was resuspended in 500 L of pre-chilled 0.4 M salt extraction buffer (385 mM NaCl, 10
mM Tris-HCl pH 7.4, 2 mM MgCl2, 2 mM EGTA, 0.1% Triton X-100 with inhibitors). The
tubes were rotated at 4°C for 30 min. Supernatant containing digested chromatin was separated
from the remaining material by spinning at 400 g (2000 rpm in Eppendorf tabletop centrifuge)
for 10 min at 4°C. An equal volume of TM2 buffer was added to the extracted chromatin to
arrive at a 0.2 M final salt concentration. The sample was centrifuged at maximum speed
(13,000 g, i.e., 16,000 rpm) in an Eppendorf centrifuge) for 5 min at 4°C. 200 L of
suspension of Sepharose-streptavidin beads (GE Healthcare; 17-5113-01) were washed 3 times
with 0.2 M salt extraction buffer containing Triton and finally resuspended in 100 L of the
same buffer. The bead suspension was combined with chromatin and rotated for 3 h at 4°C.
Afterwards, the beads were washed twice in 500 L of 0.4 M salt extraction buffer containing
Triton for 5‟ at 4°C. The biotinylated chromatin was eluted from the beads by adding 100 L of
1X LDS sample buffer (with reducing agent + 2% SDS), heating at 99°C for 10 min, and
separating the beads by a quick spin in the tabletop centrifuge for 10 sec. Elution was repeated
a second time, and the two eluates were combined.
Mass spectrometry
The protein bands were excised from the gel and were chemically derivatized using propionic
anhydride[15]. Briefly, 100 μL of freshly prepared 75% propionic anhydride in methanol was
added to each tube and immediately supplemented by 40 μL of 50 mM Ammonium
Bicarbonate. After 30 min at 37°C, the solution was discarded and propionic anhydride
derivatization was repeated again. The peptides were digested by trypsin as in [16]. The gel
slices were dehydrated with 300 µl of 50% acetonitrile followed by 300 µl of 100%
acetonitrile, then re-hydrated with 300 µl of 50 mM ammonium bicarbonate. A final
dehydration was performed with 2 washes of 300 µl of 50% acetonitrile, followed by 2 washes
of 300 µl of 100% acetonitrile. Each wash was carried out for 10 min at 25° C with shaking at
1400 rpm. The gel slices were dried in a SpeedVac at 35° C for 10 min. For trypsin digestion,

the gel slices were pre-incubated with 7 ml of 15 ng/ml trypsin (Promega # V5280) at room
temperature for 10 min. Afterwards, 25 µl of 50 mM ammonium bicarbonate was added, and
the gel slices were incubated at 37° C for 16 h. The peptide-containing supernatants were dried
at 56° C by SpeedVac for 30 min, then resuspended in 20 µl of solution containing 0.05%
formic acid and 3% acetonitrile for mass spectrometry experiments. The resulting peptides
were analyzed with a nano-HPLC (Agilent Technologies 1200) directly coupled to an ion-trap
mass spectrometer (Bruker 6300 series) equipped with a nano-electrospray source. The
separation gradient was 7 min from 5% to 90% acetonitrile. The fragmentation voltage was
1.3V. For quantification of the presence of a particular peptide in the sample, the ion trap was
set in MRM mode, i.e., it was set to isolate, fragment and MS/MS scan several parental ions
having predetermined M/Z ratios. The relative quantity of each peptide in the different fractions
was estimated by comparison between the sum of peak areas in the Extracted Ion
Chromatograms (EIC) for several most intensive daughter ions of this peptide obtained from
MRM analysis of these fractions.
Immunofluorescent Microscopy
HEK 293T cells were washed two times with cold PBS and fixed by immersion in –20°C
methanol for 5 min. These fixed cells were washed with cold PBS and then permeabilized with
0.2% Triton X-100 in PBS for 10 min at 4°C and submitted to additional fixation in 4%
formaldehyde for 20 min at RT. Cells were then washed twice with PBS at room (RT).
Blocking was done with 3% BSA for 30 min under mild agitation. Cells were then incubated
with mouse monoclonal anti-Rad18 antibody (Abcam; ab57447) followed by 3 washes in PBS
(1X) at RT. Cells were then incubated with goat anti-mouse secondary antibody conjugated
with Alexa-488 (Invitrogen; A11017) for 1 h (1/1000). Streptavidin-Cy3 conjugate (Sigma; S-
6402) and ToPro (Invitrogen) was also added (1/500 and 1/1000 respectively) to the same
incubation mix. After 3 washes in PBS (1X) at RT, cover slips were mounted on glass slides
using VectaShield mounting medium (Vector Laboratories; H-1000). Cells were visualized
with a Zeiss LSM 510 Meta confocal scanning microscope, using a Plan-Apochromat 63x 1.4
oil immersion objective. Imaging was performed with sequential multitrack scanning using the
488 and 543 nm laser wavelengths separately. The colocalization analysis was performed with
LSM Examiner software. Pearson‟s correlation coefficient (Figure 3A) was calculated with
setting the threshold signal common for all images compared (15 cells for both experiment and
control samples). For histones H2A and H3 staining, cells were incubated with -H2A
antibody (Cell Signaling; 2572) or -H2AX (Cell signaling; 2577S) and -H3 antibody
(Abcam; ab1791), respectively.

Results
1. Analysis of post-translational modifications of a specific protein fraction using
Proximity Utilizing Biotinylation (PUB).
PUB-MS (Proximity Utilising Biotinylation) has been developed in our laboratory, originally
as a new method to study protein-protein proximity (PPP-networks) in vivo using mass
spectrometry (the vectors are described elsewhere, [[13]], Figure 1). A similar method,
although not designed for mass-spectrometry analysis, was also developed in the laboratory of
Dr. A.Y. Ting [17]. The general principle of the approach is based on coexpression of two
proteins of interest fused to a biotin acceptor domain (BAP) in one case and a biotin ligase
enzyme (BirA), in the other [13]. The BAP domain was modified to weaken its affinity to BirA
and thus to decrease the background biotinylation levels. Proximity between the two proteins
(e.g., due to their interaction) leads to a more efficient biotinylation of the BAP domain, which
can be either detected by western blotting, or else quantified using proteomics approaches, such
as combination of multiple reaction monitoring (MRM) analysis and stable isotope labeling in
vivo (SILAC) [18].
The same protein can exist in several complexes in the cell, and its properties can vary
depending on the proximity partners (PP). Given that PUB allows a PP-dependent labeling of a
fraction of the BAP-fusion of the protein of interest, one can expand the scope of the PUB
approach beyond the mere study of protein-protein proximity. Namely, one can purify a
particular PP-dependent subfraction of a BAP-fused protein biochemically, and then study its
properties, e.g., its post-translational modifications (PTMs).
To test this possibility experimentally, we have analyzed the ubiquitination status of the subset
of replication processivity factor PCNA [19] that is located in proximity to the translesion
polymerase PolH after UV irradiation of cells [20, 21]. Ubiquitination is a convenient model to
study PTMs, because it is easy to detect as a shift in protein mobility on SDS-PAGE. UVC
irradiation induces ubiquitination of PCNA, which then recruits PolH to the sites of DNA
damage [22, 23]. The PolH has PCNA-binding and ubiquitin binding domains (PIP and UBZ,
respectively), both believed to be involved in the interaction.
To analyze the ubiquitination status of PCNA located in proximity to PolH in vivo, the cells
were transfected with plasmids expressing BAP-PCNA and BirA-PolH. Two days later, UV
damage was induced; and 6 h after that, the cells were pulse-labeled with biotin. These cells
were harvested, and the biotinylated BAP-PCNA was separated from the non-biotinylated
BAP-PCNA using streptavidin-sepharose pulldown. The ubiquitinylation status of the two
fractions was analyzed by western blotting with PCNA antibodies. As one can see from the
Figure 1B (lane 5), a significant part of the biotinylated BAP-PCNA is present in a
ubiquitinated form, whereas this form is absent from the non-biotinylated BAP-PCNA fraction
remaining in the flowthrough (lane 3). A control experiment, performed in parallel with a BirA-
GFP fusion, showed no such enrichment in the biotinylated BAP-PCNA fraction (lanes 2 and
4).
To confirm that the ubiquitinated fraction of BAP-PCNA is preferentially biotinylated due to
its specific interaction with PolH, we used mutations in PolH lacking the PIP or/and UBZ
domains in our next experiments. This time, the ubiquitinilation status of the biotinylated BAP-
PCNA was analyzed directly in nuclear lysates by western blotting with streptavidin-HRP. As
one can see in Figure 1C (middle), the higher-molecular-weight form of biotinylated PCNA

(lane 1) was decreased when we used the BirA-PolHPIP and BirA-PolHUBZ, and it practically
disappeared when the double mutant BirA-PolH was used (lanes 4, 5 and 3, respectively).
Consistent with the notion that the higher-molecular-weight fraction of BAP-PCNA
corresponds to ubiquitinated BAP-PCNA, a BAP-PCNA carrying a mutation in the
ubiquitination site showed no such fraction when cotransfected with BirA-PolH in a parallel
experiment.
We conclude from these experiments that purification of the biotinylated fraction of a BAP-
fusion of a protein of interest allowed us to study PTMs specific for the particular fraction of
this protein that is located in proximity to another protein of interest, fused to BirA. Whereas in
the case of ubiquitination, the PTM analysis could be accomplished by western blot analysis of
cellular extracts with streptavidin-HRP, in most other cases it will require biochemical
purification of the biotinylated fraction of the protein.
2. PUB-NChIP reveals a specific pattern of H4 acetylation in the Rad18-proximal
chromatin.
Next, we applied the same principle for the analysis of chromatin in close proximity to a
protein of interest fused to BirA. For this purpose, we fused the BAP domain to the core
histone proteins H3.1 and H2A. After their incorporation into chromatin, the biotinylation of
the BAP-histone fusions by a protein of interest fused to BirA is expected to lead to specific
labeling of chromatin located in the proximity of the BirA-fusion protein. Purification and
analysis of such biotinylated chromatin is the principle behind the PUB-NChIP approach.
To verify that mainly the BAP-histones that are located in proximity to a BirA fusion are
biotinylated under such conditions, we used repair-related Rad18 protein as a convenient
model. This protein is known to form characteristic foci in the nuclei, clearly seen after UV
treatment of cells (these foci are believed to correspond to specialized compartments in the
nuclei, containing repair and replication proteins, including PCNA). HEK 293T cells were
cotransfected with the BirA-Rad18 fusion together with BAP-H2A. Two days after
transfection, the cells were irradiated with UVC and pulse-labeled with biotin 6 h later, i.e., at
the time when Rad18 forms distinct foci in the nuclei. The cells were fixed immediately after
the biotin pulse. Staining of the pulse-labeled cells with streptavidin-Cy3 revealed foci of
biotinylation signal, which colocalized with Rad18 (Figure 2A, top), detected by specific
antibodies. Importantly, staining with H2A antibodies that detect H2A regardless of its
biotinylation status, gave a very different pattern, consistent with the known homogeneous
distribution of H2A histone throughout the nucleus (Figure 2A, bottom). Cotransfection of
BAP-H2A with control BirA-GFP construct also produced a homogeneous biotinylation pattern
(Figure S1A). Western blot analysis (Figure 2B, bottom left) shows that only the BAP-H2A
histone is biotinylated in cells under these conditions, hence the Cy3 signal that we observe in
microscopy should reflect the localization of biotinylated BAP-H2A. On the other hand,
labeling with biotin for different lengths of time shows that during the 15 min of exposure to
biotin, only a small portion of the BAP-H2A is biotinylated (Figure 2B, left). Overall, these
data clearly demonstrate that mainly the subfraction of BAP-H2A containing chromatin located
in proximity to Rad18 was biotinylated in our experiments. Similar results were obtained when
we used BAP-H3.1 fusion instead of BAP-H2A (Figure 2B, supplementary figure Figure S1B).
The biotinylated chromatin was purified on streptavidin sepharose without prior crosslinking
(See Materials and Methods, NChIP). Judging by the DNA content of the input, flow-
through and eluate samples, only a small fraction of total chromatin was purified in this

experiment (Figure 2C, top); however, western blot analysis of the same fractions with
streptavidin-HRP (Figure 2C, middle), shows that all of the biotinylated BAP-H2A was in fact
purified. As one can see from Figure 2C (bottom, lane 7), the composition of the purified
histone octamers is consistent with the presence of a single BAP-tagged H2A/H2B protein.
Whereas, in both input and flowthrough samples (lanes 5,6), all core histones are present in
stoichiometric amounts, there is approximately twofold less H2A in the eluate. Confirming that
not every BAP-H2A molecule is biotinylated in our experiment, the flowthrough also contains
a BAP-H2A band stained by Coomassie (Figure 2B, bottom, lane 6). Note that after elution
from streptavidin beads by boiling with Laemmli buffer, significant amounts of streptavidin
appear in the sample, overlapping with the H4 histone band (Figure 2C, bottom, lane 7).
Next we wished to verify that PUB-NChIP purified chromatin is enriched in the expected post-
translational modifications of histones. As a well-characterized histone PTM, we have chosen
-H2AX, which forms foci in the nucleus after ionizing irradiation. It was previously shown
that Rad18 colocalizes with -H2AX under these conditions [24, 25], and we too observed that
the chromatin that is proximity biotinylated by BirA-Rad18 often colocalizes with -H2AX
after ionizing irradiation in 293T cells (Figure S2A, top). The control protein, HP1, did not
show any histone biotinylation that was colocalized with the -H2AX foci (bottom). Western
blot analyses of histones prepared by PUB-NChIP have shown that, consistent with the
observed colocalization between Rad18-induced biotinylation signal and -H2AX, the Rad18
proximal chromatin is indeed enriched in -H2AX (Figure S2B, bottom).
Next we returned to our principal experimental system, i.e., 293T cells transfected with “BirA-
Rad18 + BAP-H2A” and irradiated with UVC. We set out to analyze the acetylation status of
the N-terminus of histone H4 in the Rad18-proximal chromatin by mass spectrometry and to
compare it with control BirA-GFP biotinylated chromatin. We used SILAC (Stable Isotope
Labeling with Aminoacids in Culture [18]) in order to quantitatively compare the presence of
specific modifications in the chromatin in proximity to Rad18, as compared to that seen with
the GFP-BirA fusion. The cells were grown in medium containing either a light version of
lysine and arginine aminoacids or their heavy counterparts (i.e., labeled with C13
and N15
). The
cells were cotransfected with BAP-H2A and either BirA-RAD18 (heavy labeled cells) or BirA-
GFP (light labeled cells). Two days after transfection, the cells were UV irradiated, and 6 h
later they were pulse-labeled with biotin for 15 min. Then the cells were harvested and mixed,
and biotinylated chromatin was purified as described above. The bands corresponding to
histone H4 were excised and treated with trypsin; then MRM analysis was performed to
quantitatively detect the presence of different acetylated forms of H4 peptide (4-17), comparing
the results obtained with experimental (Rad18) and control (GFP) samples.
Figure 2D shows that the H4 histone in close proximity to BirA-Rad18 has a different pattern
of acetylation of its N-terminal tail (aa 4-17) as compared to the H4 histone contained in BirA-
GFP biotinylated chromatin. Notably, the di- and tetra- acetylated forms are over-represented,
as compared to H4 from the control chromatin biotinylated by the GFP-BirA-fusion.
Intriguingly, we have also observed under-representation of the tri-acetylated form of H4 in the
Rad18 proximal chromatin.
3. The Rad18-specific pattern of H4 acetylation changes after the proximity to Rad18
has been diminished.
The distinctive feature of the PUB-NChIP method is that chromatin in proximity to the BirA-
fusion is left with a permanent molecular mark (i.e. biotin), which can persist after the
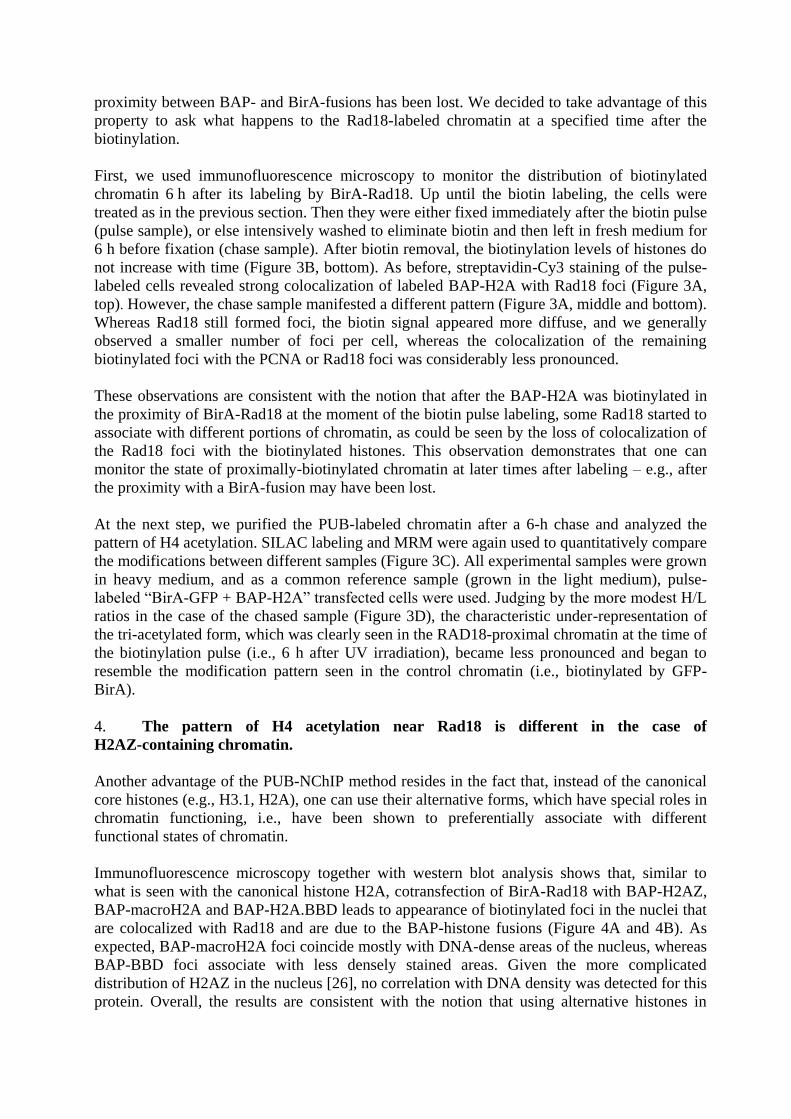
proximity between BAP- and BirA-fusions has been lost. We decided to take advantage of this
property to ask what happens to the Rad18-labeled chromatin at a specified time after the
biotinylation.
First, we used immunofluorescence microscopy to monitor the distribution of biotinylated
chromatin 6 h after its labeling by BirA-Rad18. Up until the biotin labeling, the cells were
treated as in the previous section. Then they were either fixed immediately after the biotin pulse
(pulse sample), or else intensively washed to eliminate biotin and then left in fresh medium for
6 h before fixation (chase sample). After biotin removal, the biotinylation levels of histones do
not increase with time (Figure 3B, bottom). As before, streptavidin-Cy3 staining of the pulse-
labeled cells revealed strong colocalization of labeled BAP-H2A with Rad18 foci (Figure 3A,
top). However, the chase sample manifested a different pattern (Figure 3A, middle and bottom).
Whereas Rad18 still formed foci, the biotin signal appeared more diffuse, and we generally
observed a smaller number of foci per cell, whereas the colocalization of the remaining
biotinylated foci with the PCNA or Rad18 foci was considerably less pronounced.
These observations are consistent with the notion that after the BAP-H2A was biotinylated in
the proximity of BirA-Rad18 at the moment of the biotin pulse labeling, some Rad18 started to
associate with different portions of chromatin, as could be seen by the loss of colocalization of
the Rad18 foci with the biotinylated histones. This observation demonstrates that one can
monitor the state of proximally-biotinylated chromatin at later times after labeling – e.g., after
the proximity with a BirA-fusion may have been lost.
At the next step, we purified the PUB-labeled chromatin after a 6-h chase and analyzed the
pattern of H4 acetylation. SILAC labeling and MRM were again used to quantitatively compare
the modifications between different samples (Figure 3C). All experimental samples were grown
in heavy medium, and as a common reference sample (grown in the light medium), pulse-
labeled “BirA-GFP + BAP-H2A” transfected cells were used. Judging by the more modest H/L
ratios in the case of the chased sample (Figure 3D), the characteristic under-representation of
the tri-acetylated form, which was clearly seen in the RAD18-proximal chromatin at the time of
the biotinylation pulse (i.e., 6 h after UV irradiation), became less pronounced and began to
resemble the modification pattern seen in the control chromatin (i.e., biotinylated by GFP-
BirA).
4. The pattern of H4 acetylation near Rad18 is different in the case of
H2AZ-containing chromatin.
Another advantage of the PUB-NChIP method resides in the fact that, instead of the canonical
core histones (e.g., H3.1, H2A), one can use their alternative forms, which have special roles in
chromatin functioning, i.e., have been shown to preferentially associate with different
functional states of chromatin.
Immunofluorescence microscopy together with western blot analysis shows that, similar to
what is seen with the canonical histone H2A, cotransfection of BirA-Rad18 with BAP-H2AZ,
BAP-macroH2A and BAP-H2A.BBD leads to appearance of biotinylated foci in the nuclei that
are colocalized with Rad18 and are due to the BAP-histone fusions (Figure 4A and 4B). As
expected, BAP-macroH2A foci coincide mostly with DNA-dense areas of the nucleus, whereas
BAP-BBD foci associate with less densely stained areas. Given the more complicated
distribution of H2AZ in the nucleus [26], no correlation with DNA density was detected for this
protein. Overall, the results are consistent with the notion that using alternative histones in

PUB-NChIP should lead to labeling of functional chromatin states associated with these histone
variants.
To test the possibility of simultaneously studying histone PTMs both in the vicinity of a protein
of interest and in the context of a particular alternative histone, we performed SILAC
experiments with the alternative histone H2AZ, which is implicated in many cellular functions,
including the cellular response to DNA damage [27-29].
As before, all experimental samples were labeled in heavy medium, and as a reference (light)
sample, pulse-labeled “BirA-GFP + BAP-H2A” transfected cells were used. The relative
abundance of heavy versus light peptides was analyzed by MRM. As Figure 4C shows, when
BAP-H2A is replaced by BAP-H2AZ, levels of the di-acetylated forms of H4 clearly increase
in the Rad18-proximal chromatin. The same modification also appears to increase in the control
GFP-BirA labeled chromatin containing BAP-H2AZ. The most parsimonious interpretation of
this observation is that the two factors (Rad18-proximity vs GFP, and presence of H2AZ vs
H2A) affect the di-acetylated form of H4 independently, resulting in an additive effect in the
case of „Rad18 + H2AZ‟ combination.
Strikingly, however, we have observed a non-additive response to the two factors in the case of
the tri- and tetra- acetylated forms of H4. Unlike in the case of „Rad18 + H2A‟, there was no
decrease in the tri-acetylated form in the case of the „Rad18 + H2AZ‟ combination. On the
other hand, the tetra-acetylated form was under-represented in the case of „Rad18 + H2AZ‟, as
compared to „Rad18 + H2A‟.
These results show that the patterns of post-translational histone modifications in proximity to
Rad18 protein, as compared to the control GFP protein, depend on the histone composition.

Discussion
We describe here a new methodology to study chromatin in close proximity to a protein of
interest in vivo. The well-established approach for such analysis is chromatin
immunoprecipitation (ChIP) [1-3]. However, it suffers from the following limitation. Due to
the cross-linking of DNA to histones, only the DNA portion of chromatin purified by ChIP can
be used, and the protein part is discarded, being irreversibly damaged by the cross-linking
procedure. On the other hand, the analysis of histone modifications and replacement histone
variants could provide valuable information about the state of chromatin around the particular
protein of interest. Until now, the correlations between a protein and histone PTMs could be
inferred only indirectly, after comparison of the results of parallel ChIP experiments that use
antibodies against the protein and antibodies against particular PTMs. Here, a more direct
method to access the chromatin state is proposed.
The principle of PUB-NChIP is somewhat similar to the DamID approach, an alternative to
ChIP way to map the DNA binding sites of nuclear proteins [30, 31]. This methodology is
based on expression of a fusion of bacterial Dam-methylase to a protein of interest that leads to
labeling the protein‟s genomic binding site by adenine methylation. The label on DNA can be
detected by various methods. Our approach is conceptually similar, but instead of Dam-
methylase, we fuse the biotin-ligase BirA to the protein of interest and, instead of DNA, we
label the histone part of the chromatin. The scopes of these approaches are also different, as
PUB-NChIP is mostly aimed at analyzing the histone PTMs. However, we cannot exclude that
PUB-NChIP could be used for DNA analysis as well. Although we have not explored this
possibility in the present work, one can point to several potential advantages of PUB-NChIP in
this respect. There are a wide variety of commercially available resources for detection and/or
purification of biotinylated macromolecules, and NChIP with biotinylated chromatin has been
shown to work [9]. In addition, by substituting the canonical core histone by its replacement
variants, the analysis can be made dependent on the context of particular functional states of
chromatin.
As far as the histone PTM analysis is concerned, we present here a proof of principle that it can
indeed be done with the PUB-NChIP purified chromatin, focusing mostly on the acetylation
status of H4 N-termini. Our approach to analyzing histone PTMs is based on SILAC, which
allows us to quantitatively analyze the histone modifications in the Rad18-proximal chromatin,
their dynamics after labeling, and their dependence on histone variants. This particular
approach is well suited for the type of mass spectrometer (ion-trap) we used. However, because
it requires trypsin digestion, the information about correlations between different histone
modifications on individual histone molecules is not accessible. On the other hand, the mass-
spectrometry instruments with higher resolution (such as FTICR and Orbitrap) can be used in
the so called top-down approach that targets histones without tryptic digestion [32, 33]. Using
these instruments for downstream analysis of the PUB-NChIP prepared chromatin, one will be
able to detect correlations between PTMs on individual histone molecules. It should be noted
that such correlation analysis is impossible with the traditional ChIP technique.
In addition to histones, some other proteins associate with DNA sufficiently strongly and thus
are expected to be purified in PUB-NChIP [34, 35]. Thus, instead of the histone component of
chromatin, one can also use PUB-NChIP for analysis of the non-histone fraction of chromatin
as well, which is complicated in the case of regular ChIP due to the cross-linking.

In respect to the biological significance of our findings, their simplest interpretation is that the
chromatin in the vicinity of Rad18 is locally destabilized to facilitate the access to DNA
of the damage repair machinery. This is consistent with the notion that acetylation of the
N- terminal tails of H 4 loosens up histone-DNA interactions and hence creates a
relaxed nucleosome. Our observation of a less-pronounced pattern of histone
modifications 6 h after labeling with biotin (pulse-chase experiment) is consistent with
the notion that, after the repair is completed, the chromatin returns to its original state.
The acetylation pattern of the H2AZ-containing chromatin in proximity to Rad18 is more
challenging to interpret. It is possible that the chromatin containing H2AZ histone in proximity
to Rad18 corresponds to a specific stage of DNA-lesion processing, which could be reflected in
the different histone PTM signature. Regardless of the specific mechanistic interpretation of
these observations, our data strongly demonstrate that one can analyze how changes in specific
histone modifications in the proximity of a nuclear protein of interest depends on the particular
chromatin type, here represented by a specific histone variant.
Acknowledgments
We thank Dr. L.L. Pritchard for the critical reading of the manuscript. This work was supported
by grants from “La Ligue Contre le Cancer” (9ADO1217/1B1-BIOCE), the “Institut National
du Cancer” (247343/1B1-BIOCE) and the Centre National de la Recherche Scientifique
[CNRS-INCA-MSHE Franco-Pologne #3037987) to VO, and by NCB Kazakhstan
(0103_00404) to AK. AK thanks Mr. Guillaume Giraudet for his help in organizing a visit from
NCB to IGR.

Figure legends:
Figure 1. Analysis of post-translational modifications of a specific protein fraction using
Proximity Utilizing Biotinylation (PUB).
A. Experimental scheme. 293T cells are transfected with the plasmids expressing BAP-PCNA
and BirA-PolH. Two days later, the cells are treated with UVC (20 J/m2), and 6 h afterwards,
the cells are pulse-labeled (5 min) with biotin. The cells are then harvested, and the biotinylated
BAP-PCNA is separated from the non-biotinylated BAP-PCNA using streptavidin-sepharose
pulldown.
B. Ubiquitination status of PolH-proximal PCNA. Western blot with -PCNA antibodies.
(1) untrasfected cells. (2, 4) BAP-PCNA cotransfected with BirA-GFP fusion. (3, 5) BAP-
PCNA cotransfected with Bir-PolH fusion. (2, 3) Flowthrough fraction. (4, 5) Eluate. Note that
the BAP-PCNA from the flowthrough fraction was further purified via Ni-NTA
chromatography, in order to decrease the signal from endogenous PCNA. The endogenous
PCNA, the BAP-PCNA fusion and the ubiquitinated BAP-PCNA are indicated by arrows.
C. Ub-BAP-PCNA is preferentially biotinylated due to its specific interaction with PolH.
Western blot analysis of nuclear extracts from transfected 293T cells. Middle – strepatividin-
HRP, detecting two forms of biotinylated BAP-PCNA in the presence of different Bir-PolH
fusions, treated or untreated with UV. Top left: Expression of different forms of BirA-PolH,
detected by -His western blot. Bottom left: PCNA in the transfected 293 cells, showing that
BAP-PCNA constitutes an undetectable fraction of the total PCNA in transfected cells.
Figure 2. PUB-NChIP reveals a specific pattern of H4 acetylation in the Rad18-proximal
chromatin.
A. Chromatin is biotinylated at the sites of RAD18 foci. Confocal microscopy analysis of
colocalization of (top) Rad18 and biotinylated chromatin or (bottom) H2A histone and
biotinylated chromatin.
B. Biotinylation signal is due to BAP-H2A in proximity to Rad18-BirA.
Left: Western blot analysis with streptavidin-HRP, showing that a specific signal appears only
after BirA-Rad18 and BAP-H2A are cotransfected. (1) control untransfected sample. (2) BirA-
Rad18. (3) BirA-Rad18 + BAP-H2A. (4) BAP-H2A. The 2 forms of H2A (non-ubiquitinated
and ubiquitinated), both biotinylated in this experiment, are indicated by asterisks. Top, His
antibodies; bottom, streptavidin-HRP.
Right: Western blot analysis of the biotinylation status of BAP-H2A after different times of
biotin-labeling. Top, His antibodies; bottom, streptavidin-HRP.
C. Purification of biotinylated chromatin. Bottom: SDS-PAGE gel stained with Coomassie
blue, with the identities of the histones indicated. The H4 band in the elution also contains
streptavidin, and thus is thicker than the other histone bands. Middle: Western blot analysis of
the same samples with Streptavidin-HRP, showing that all biotinylated BAP-H2A was pulled
down with immobilized streptavidin. Top: Agarose gel electrophoresis and ethidium bromide
staining for the same samples, showing that mainly the mononucleosome fractions were
purified.

D. Relative acetylation status of H4 N-terminal tails (aa 4-17). The presence of a particular
peptide was monitored by MRM. For the mono-, di- and tri- acetylated peptides, it was difficult
to distinguish between modifications at different positions, hence we present results without
reference to the position. Due to the variations in ratio between the heavy and light isotope
labeled chromatin in each experiment, the H/L ratio for every peptide has been normalized by
dividing it by the H/Lum ratio for the unmodified peptide (UM). The graph present the average
normalized H/M ratios and standard deviations for all modified peptides from 2 independent
experiments. The standard deviation for the unmodified peptide (UM) represents the standard
deviation for the H/L value for this peptide (as H/Lum) in two different experiments.
Figure 3. The Rad18-specific pattern changes after the proximity with Rad18 has been
diminished.
A. Decrease in colocalisation between Rad18 and biotinylated chromatin after a 6-h chase.
Top, confocal microscopy showing strong colocalization between Rad18 and biotinylated
chromatin in the nucleus of 293T cells immediately after pulse labeling. Middle, confocal
microscopy showing different localization of Rad18 and biotinylated chromatin 6 h after pulse
labeling. Bottom, zoomed area from the chase sample showing an example of biotinylated foci
that do not colocalize with the Rad18 foci, and vice versa (indicated by arrows). Right,
scatterplot with the coefficient of correlation (top left corner) between the intensities of the red
and green signals for every pixel (above a background threshold), showing stronger
colocalization of the biotin and Rad18 signals in the pulse sample.
B. No increase in biotinylation signal after chase. Western analysis showing that the level of
biotinylation of BAP-H3 and BAP-H2A is not increased 6 h after the cells have been washed
free of biotin. Top, -His antibody. Bottom, strepavidin-HRP. P, pulse sample; Ch, chase
sample.
C. Scheme of the pulse-chase experiment. Cells grown in light SILAC medium are
transfected by BirA-GFP and BAP-H2A (reference sample). Cells grown in heavy SILAC
medium are transfected with BirA-Rad18 (or BirA-GFP) and BAP-H2A. The heavy labeled
cells are either harvested immediately after biotin labeling or washed to remove biotin and left
for 6 h before harvest. The heavy and light labeled cells are then mixed, and chromatin is
prepared as in Fig.2C.
D. Acetylation status of H4 N-terminal tails. The analysis was performed, and is presented,
as described in the legend to Figure 2D.
Figure 4. The pattern of H4 acetylation near Rad18 is different in the case of
H2AZ-containing chromatin.
A. Alternative histones are biotinylated at the locations of Rad18. Confocal microscopy of
293T cells cotransfected by BirA-Rad18 and BAP-H2ABBD (Top), BAP-macroH2A (Middle),
and BAP-H2AZ (Bottom). Shown are staining with Topro-3 (left), Rad18 (middle) and
streptavidin (right).
BAP-histone fusions. Top, Middle: Western blot analysis showing that a specific biotinylation
signal appears only after BirA-Rad18 and BAP-macroH2A or BAP-H2ABBD fusions are
cotransfected. (1, 4) BAP-histone + BirA-Rad18; (2, 5) BAP-histone; (3, 6) control
untransfected samples. Top, His antibodies; Middle, streptavidin. Bottom: Western blot

analysis for the BAP-H2AZ fusion. The 2 forms of H2AZ (non-ubiquitinated and
ubiquitinated), both biotinylated in this experiment, are indicated by arrows.
C. Acetylation status of H4 N-terminal tails. The analysis was performed, and is presented,
as described in the legend to Figure 2D.

Figure 1.

Figure 2


Figure 4

References
1. Orlando V: Mapping chromosomal proteins in vivo by formaldehyde-crosslinked-
chromatin immunoprecipitation. Trends Biochem Sci 2000, 25:99-104.
2. Ren B, Dynlacht BD: Use of chromatin immunoprecipitation assays in genome-
wide location analysis of mammalian transcription factors. Methods Enzymol 2004,
376:304-315.
3. Weinmann AS, Farnham PJ: Identification of unknown target genes of human
transcription factors using chromatin immunoprecipitation. Methods 2002, 26:37-
47.
4. Buck MJ, Lieb JD: ChIP-chip: considerations for the design, analysis, and
application of genome-wide chromatin immunoprecipitation experiments.
Genomics 2004, 83:349-360.
5. Negre N, Lavrov S, Hennetin J, Bellis M, Cavalli G: Mapping the distribution of
chromatin proteins by ChIP on chip. Methods Enzymol 2006, 410:316-341.
6. Park PJ: ChIP-seq: advantages and challenges of a maturing technology. Nat Rev
Genet 2009, 10:669-680.
7. Robertson G, Hirst M, Bainbridge M, Bilenky M, Zhao Y, Zeng T, Euskirchen G,
Bernier B, Varhol R, Delaney A, et al: Genome-wide profiles of STAT1 DNA
association using chromatin immunoprecipitation and massively parallel
sequencing. Nat Methods 2007, 4:651-657.
8. O'Neill LP, Turner BM: Immunoprecipitation of native chromatin: NChIP.
Methods 2003, 31:76-82.
9. Ooi SL, Henikoff JG, Henikoff S: A native chromatin purification system for
epigenomic profiling in Caenorhabditis elegans. Nucleic Acids Res 2010, 38:e26.
10. Chadwick BP, Willard HF: Histone H2A variants and the inactive X chromosome:
identification of a second macroH2A variant. Hum Mol Genet 2001, 10:1101-1113.
11. Chadwick BP, Willard HF: A novel chromatin protein, distantly related to histone
H2A, is largely excluded from the inactive X chromosome. J Cell Biol 2001,
152:375-384.
12. Costanzi C, Pehrson JR: Histone macroH2A1 is concentrated in the inactive X
chromosome of female mammals. Nature 1998, 393:599-601.
13. Kulyyassov A, Shoaib M, Pichugin A, Kannouche P, Ramanculov E, Lipinski M,
Ogryzko V: PUB-MS – a mass-spectrometry–based method to monitor protein-
protein proximity in vivo. Journal of Proteome Research 2011, in press.
14. Saade E, Mechold U, Kulyyassov A, Vertut D, Lipinski M, Ogryzko V: Analysis of
interaction partners of H4 histone by a new proteomics approach. Proteomics
2009, 9:4934-4943.
15. Garcia BA, Mollah S, Ueberheide BM, Busby SA, Muratore TL, Shabanowitz J,
Hunt DF: Chemical derivatization of histones for facilitated analysis by mass
spectrometry. Nat Protoc 2007, 2:933-938.
16. Shevchenko A, Wilm M, Vorm O, Mann M: Mass spectrometric sequencing of
proteins silver-stained polyacrylamide gels. Anal Chem 1996, 68:850-858.
17. Fernandez-Suarez M, Chen TS, Ting AY: Protein-protein interaction detection in
vitro and in cells by proximity biotinylation. J Am Chem Soc 2008, 130:9251-9253.
18. Ong SE, Blagoev B, Kratchmarova I, Kristensen DB, Steen H, Pandey A, Mann
M: Stable isotope labeling by amino acids in cell culture, SILAC, as a simple and
accurate approach to expression proteomics. Mol Cell Proteomics 2002, 1:376-386.

19. Moldovan GL, Pfander B, Jentsch S: PCNA, the maestro of the replication fork.
Cell 2007, 129:665-679.
20. Haracska L, Johnson RE, Unk I, Phillips B, Hurwitz J, Prakash L, Prakash S:
Physical and functional interactions of human DNA polymerase eta with PCNA.
Mol Cell Biol 2001, 21:7199-7206.
21. Haracska L, Johnson RE, Unk I, Phillips BB, Hurwitz J, Prakash L, Prakash S:
Targeting of human DNA polymerase iota to the replication machinery via
interaction with PCNA. Proc Natl Acad Sci U S A 2001, 98:14256-14261.
22. Kannouche PL, Wing J, Lehmann AR: Interaction of human DNA polymerase eta
with monoubiquitinated PCNA: a possible mechanism for the polymerase switch
in response to DNA damage. Mol Cell 2004, 14:491-500.
23. Prakash S, Johnson RE, Prakash L: Eukaryotic translesion synthesis DNA
polymerases: specificity of structure and function. Annu Rev Biochem 2005,
74:317-353.
24. Huang J, Huen MS, Kim H, Leung CC, Glover JN, Yu X, Chen J: RAD18
transmits DNA damage signalling to elicit homologous recombination repair. Nat
Cell Biol 2009, 11:592-603.
25. Watanabe K, Iwabuchi K, Sun J, Tsuji Y, Tani T, Tokunaga K, Date T,
Hashimoto M, Yamaizumi M, Tateishi S: RAD18 promotes DNA double-strand
break repair during G1 phase through chromatin retention of 53BP1. Nucleic
Acids Res 2009, 37:2176-2193.
26. Viens A, Mechold U, Brouillard F, Gilbert C, Leclerc P, Ogryzko V: Analysis of
human histone H2AZ deposition in vivo argues against its direct role in epigenetic
templating mechanisms. Mol Cell Biol 2006, 26:5325-5335.
27. Ahmed S, Dul B, Qiu X, Walworth NC: Msc1 acts through histone H2A.Z to
promote chromosome stability in Schizosaccharomyces pombe. Genetics 2007,
177:1487-1497.
28. Kalocsay M, Hiller NJ, Jentsch S: Chromosome-wide Rad51 spreading and
SUMO-H2A.Z-dependent chromosome fixation in response to a persistent DNA
double-strand break. Mol Cell 2009, 33:335-343.
29. Morillo-Huesca M, Clemente-Ruiz M, Andujar E, Prado F: The SWR1 histone
replacement complex causes genetic instability and genome-wide transcription
misregulation in the absence of H2A.Z. PLoS One, 5:e12143.
30. Greil F, Moorman C, van Steensel B: DamID: mapping of in vivo protein-genome
interactions using tethered DNA adenine methyltransferase. Methods Enzymol
2006, 410:342-359.
31. van Steensel B, Henikoff S: Identification of in vivo DNA targets of chromatin
proteins using tethered dam methyltransferase. Nat Biotechnol 2000, 18:424-428.
32. Pesavento JJ, Kim YB, Taylor GK, Kelleher NL: Shotgun annotation of histone
modifications: a new approach for streamlined characterization of proteins by top
down mass spectrometry. J Am Chem Soc 2004, 126:3386-3387.
33. Zhang L, Freitas MA, Wickham J, Parthun MR, Klisovic MI, Marcucci G, Byrd
JC: Differential expression of histone post-translational modifications in acute
myeloid and chronic lymphocytic leukemia determined by high-pressure liquid
chromatography and mass spectrometry. J Am Soc Mass Spectrom 2004, 15:77-86.
34. Lambert JP, Mitchell L, Rudner A, Baetz K, Figeys D: A novel proteomics
approach for the discovery of chromatin-associated protein networks. Mol Cell
Proteomics 2009, 8:870-882.

35. Shen Z, Sathyan KM, Geng Y, Zheng R, Chakraborty A, Freeman B, Wang F,
Prasanth KV, Prasanth SG: A WD-repeat protein stabilizes ORC binding to
chromatin. Mol Cell 2010, 40:99-111.

Supplementary Figures
Legends to supplementary figures
Supplementary Figure S1.
A. BirA-GFP cotransfected with BAP-H2A produces homogeneous Biotinylation
throughout the nucleus. Confocal microscopy analysis of the localization of GFP (left) and
biotinylated chromatin (right).
B. BAP-H3.1 is biotinylated at the sites of RAD18 foci. Confocal microscopy analysis of
colocalization of Rad18 (left) and biotinylated chromatin (right) after cotransfection of 293T
cells with “BirA-Rad18 + BAP-H3.1” followed by UVC irradiation.
Supplementary Figure S2. Rad18 proximal chromatin is enriched in -H2AX after IR.
A. Colocalization of -H2AX and chromatin biotinylated in proximity to BirA-Rad-18.
Confocal microscopy analysis of the colocalization (right) of -H2AX (left) and biotinylated
chromatin (center) after cotransfection of 293T cells with “BirA-Rad18 + BAP-H2A” (top) or
control “BirA-HP1 + BAP-H2A” (bottom), ionizing irradiation 48 h later, and biotin pulse
labeling 3 h after irradiation.
B. Western blot analysis of biotinylated chromatin.
The 293T cells were transfected with “BirA-Rad18 + BAP-H2A” (left) or control “BirA-HP1
+ BAP-H2A” cells (right), treated with ionizing irradiation 48 h afterwards, and pulse labeled
with biotin 3 h after that. After NChIP purification, the amounts of biotinylated chromatin were
normalized by western blot with -H3 antibodies (top). The normalized amounts were analyzed
by Western with -H2AX antibodies.
Supplementary Figure S3(a-e). MS spectra.
Shown are MS spectra of peptides corresponding to the light and heavy versions of non- (a),
mono- (b), di- (c), tri- (d) and tetra- (e) acetylated H4 N-terminal tail peptide (aa 4-17). The
ions that match the predicted y- and b-series ions are indicated.

Figure S1
Figure S2

Figure S3a
Figure S3b

Figure S3c
Figure S3d

Figure S3e


Development of New Approaches to Study the Role of Chromatin in DNA Damage Response
Abstract In eukaryotic cells, the genome is packed into chromatin, a hierarchically organized complex composed of DNA and histone and non-histone proteins. In this thesis we have addressed the role of chromatin in cellular response to DNA damage (DDR) using various methodologies encompassing functional genomics and proteomics. First, we analyzed histone post-translational modifications (PTM) in the context of specific kind of DNA lesions (ICL-Interstrand Crosslinks) in Fanconi anemia using quantitative proteomics methodology, SILAC (Stable Isotope Labeling of Amino acids during Cell Culture). Using mass spectrometry (MS), we have successfully identified and quantified a number of histone PTM marks in histone H3 and H4, mainly acetylations and methylations, which have shown dependence upon functional FA-pathway. As a next step, we applied a functional genomics approach to study DDR in FA cells. In this analysis we first monitored the expression profile of histone modifying enzymes related to histone acetylations and methylations. Our results suggest some correlations between histone PTMs and gene expression of histone modifying enzymes, although conclusive evidence warrants further investigations. Next, we analyzed the total transcriptome after DNA damage induction in FA mutant and wild type cells. We also included in this analysis IR irradiation, in an attempt to dissociate more generic DDR from more specific changes that are associated with the role of FA pathway to the DNA ICLs. By performing a factorial interaction analysis, we were able to isolate the part of transcriptional response to DNA damage that was requiring functional FA pathway, as well as the genes that were sensitized to DNA damage by the inactivation of FA pathway. In the final part of the thesis, we attempted to solve one of the limitations that we encountered in the histone PTM analysis. The current approaches used to study histone PTMs from particular loci involves classical chromatin immunoprecipitation, which due to involvement of formaldehyde crosslinking render the protein part mostly unavailable for MS-based proteomics. We have proposed a novel methodology, which is based upon the biotin tagging of histones proximal to a protein of interest and subsequent purification of nucleosomes carrying the tagged histone. This methodology does not involve any crosslinking, enabling us to purify histones from specific loci, and subject them to large scale MS-based histone PTM analysis. A time dimension can also be added to our approach, as we can follow the modification status of particular fraction of histones once they get biotinylated. Another advantage is the use of alternate variant histones, which allows us to study the PTM profile of different functional states of chromatin. This methodology certainly has an edge on current techniques to study histone PTMs pattern associated with a particular protein of interest or with particular chromatin state. KEYWORDS: chromatin, histone PTM, DNA damage response, transcriptome analysis, SILAC, biotinylation, native chromatin immunoprecipitation.
Développement de Nouvelles Approches pour Etudier le Rôle de la Chromatine en Réponse aux Dommages de l'ADN
Résumé Le génôme des cellules eucaryotes est condensé au sein d'une structure complexe hiérarchiquement organisée : la chromatine. La chromatine est composée d'ADN, de protéines histone et non-histone. Cette thèse a pour but d'étudier le rôle de la chromatine dans la réponse cellulaire aux dommages de l'ADN (DDR) par les méthodologies de génomique fonctionnelle et de protéomique. Nous avons tout d'abord analysé les modifications post-traductionnelles (PTM) des histones dans le cadre des pontages inter-brins (ou "Interstrand Crosslinks", ICL), type particulier de lésions de l'ADN, en choisissant le modèle de l'Anémie de Fanconi (FA). Ceci a été réalisé grâce aux techniques de protéomique quantitative SILAC (Stable Isotope Labeling of Amino acid during Cell culture) et de spectrométrie de masse (MS). Nous avons ainsi réussi à identifier et à quantifier de nombreuses PTMs dans les histones H3 et H4, et à démontrer que certaines de ces PTM sont dépendantes d'une voie fonctionnelle de la signalisation de FA. Nous avons également approfondi l'étude des DDR dans les cellules de FA par une approche de génomique fonctionnelle. Pour cela, nous avons analysé le profil d'expression d'enzymes associées à l'acétylation et à la méthylation des histones. Nos résultats suggèrent l'existence de corrélations entre le profil d'expression de ces enzymes et les PTMs des histones. Des études complémentaires sont nécessaires en vue de confirmer ces corrélations. Nous avons également comparé le transcriptome de deux lignées cellulaires de FA (mutée en FANCC et corrigée en FANCC) après induction de dommages à l'ADN. Afin de différencier les changements spécifiquement associés à la voie de signalisation de FA en réponse aux ICL de l'ADN des réponses plus générales aux dommages de l'ADN, nous avons inclus des cellules traitées par rayonnement ionisant. En réalisant une analyse d'interactions factorielles, nous avons pu identifier une réponse transcriptionnelle aux dommages de l'ADN nécessitant une voie fonctionnelle de la signalisation de FA. Nous avons également tenté de pallier aux limitations rencontrées dans l'analyse des PTMs des histones. En effet, les PTMs des histones que nous avons identifiées représentent l'ensemble des modifications, c'est-à-dire les PTMs concernant les histones se trouvant immédiatement à proximité du site du dommage et en relation directe avec celui-ci, et les PTMs se trouvant à distance du dommage et pouvant ne pas être en relation directe avec celui-ci. Les approches courantes pour identifier les PTMs se trouvant à des loci particuliers sont basées sur l'immunoprécipitation classique de la chromatine où l'utilisation de formaldéhyde altère les protéines, ce qui en rend impossible l'analyse par MS. Nous avons proposé une nouvelle méthodologie basée sur la biotinylation expérimentale d'histones situées à proximité d'une protéine particulière, suivie de la purification des nucléosomes contenant ces histones biotinylées. Contrairement à l'immunoprécipiatation classique de la chromatine, cette méthode n'induit pas d'altération des protéines, permettant ainsi de purifier les histones à partir d'un locus spécifique et d'analyser à grande échelle leurs PTMs par MS. Cette approche permet aussi de suivre dans le temps les PTMs d'une fraction des histones juste après leur biotinylation. Enfin, elle présente l'avantage de pouvoir étudier le profil des PTMs de différents états fonctionnels de la chromatine grâce à l'utilisation de variants d'histones.
MOTS CLÉS : chromatine, modification post-traductionnelle des histones (PTM), réponse aux dommages de l’ADN (DDR), analyse du transcriptome, SILAC, biotinylation, immunoprécipitation de chromatine native.
CNRS UMR8126, Molecular Interactions and Cancer Institut Gustave Roussy, PR1, 114 rue Edouard Vaillant, 94805, Villejuif, France
Frais de reprographie pris en charge par la taxe d’apprentissage collectée par l’IGR.
Copyright © 2022 FDOKUMEN