Development of interferometric temperature measurement procedures for microfluid flow
15
This article was downloaded by: [University of Limerick] On: 08 November 2012, At: 01:53 Publisher: Taylor & Francis Informa Ltd Registered in England and Wales Registered Number: 1072954 Registered office: Mortimer House, 37-41 Mortimer Street, London W1T 3JH, UK Microscale Thermophysical Engineering Publication details, including instructions for authors and subscription information: http://www.tandfonline.com/loi/umte19 DEVELOPMENT OF INTERFEROMETRIC TEMPERATURE MEASUREMENT PROCEDURES FOR MICROFLUID FLOW D. Newport a , J. Garvey b , T. Dalton c , V. Egan d & M. Whelan e a Stokes Research Institute, University of Limerick, Limerick, Ireland b Stokes Research Institute, University of Limerick, Limerick, Ireland c Stokes Research Institute, University of Limerick, Limerick, Ireland d Stokes Research Institute, University of Limerick, Limerick, Ireland e Institute for Health and Consumer Protection, Joint Research Centre, European Commission, Italy Version of record first published: 24 Jun 2010. To cite this article: D. Newport, J. Garvey, T. Dalton, V. Egan & M. Whelan (2004): DEVELOPMENT OF INTERFEROMETRIC TEMPERATURE MEASUREMENT PROCEDURES FOR MICROFLUID FLOW, Microscale Thermophysical Engineering, 8:2, 141-154 To link to this article: http://dx.doi.org/10.1080/10893950490445612 PLEASE SCROLL DOWN FOR ARTICLE Full terms and conditions of use: http://www.tandfonline.com/page/terms-and-conditions This article may be used for research, teaching, and private study purposes. Any substantial or systematic reproduction, redistribution, reselling, loan, sub-licensing, systematic supply, or distribution in any form to anyone is expressly forbidden. The publisher does not give any warranty express or implied or make any representation that the contents will be complete or accurate or up to date. The accuracy of any instructions, formulae, and drug doses should be independently verified with primary sources. The publisher shall not be liable for any loss, actions, claims, proceedings, demand, or costs or damages whatsoever or howsoever caused arising directly or indirectly in connection with or arising out of the use of this material.
-
Upload
independent -
Category
Documents
-
view
6 -
download
0
Transcript of Development of interferometric temperature measurement procedures for microfluid flow
This article was downloaded by: [University of Limerick]On: 08 November 2012, At: 01:53Publisher: Taylor & FrancisInforma Ltd Registered in England and Wales Registered Number: 1072954 Registered office: Mortimer House,37-41 Mortimer Street, London W1T 3JH, UK
Microscale Thermophysical EngineeringPublication details, including instructions for authors and subscription information:http://www.tandfonline.com/loi/umte19
DEVELOPMENT OF INTERFEROMETRIC TEMPERATUREMEASUREMENT PROCEDURES FOR MICROFLUID FLOWD. Newport a , J. Garvey b , T. Dalton c , V. Egan d & M. Whelan ea Stokes Research Institute, University of Limerick, Limerick, Irelandb Stokes Research Institute, University of Limerick, Limerick, Irelandc Stokes Research Institute, University of Limerick, Limerick, Irelandd Stokes Research Institute, University of Limerick, Limerick, Irelande Institute for Health and Consumer Protection, Joint Research Centre, EuropeanCommission, ItalyVersion of record first published: 24 Jun 2010.
To cite this article: D. Newport, J. Garvey, T. Dalton, V. Egan & M. Whelan (2004): DEVELOPMENT OF INTERFEROMETRICTEMPERATURE MEASUREMENT PROCEDURES FOR MICROFLUID FLOW, Microscale Thermophysical Engineering, 8:2, 141-154
To link to this article: http://dx.doi.org/10.1080/10893950490445612
PLEASE SCROLL DOWN FOR ARTICLE
Full terms and conditions of use: http://www.tandfonline.com/page/terms-and-conditions
This article may be used for research, teaching, and private study purposes. Any substantial or systematicreproduction, redistribution, reselling, loan, sub-licensing, systematic supply, or distribution in any form toanyone is expressly forbidden.
The publisher does not give any warranty express or implied or make any representation that the contentswill be complete or accurate or up to date. The accuracy of any instructions, formulae, and drug doses shouldbe independently verified with primary sources. The publisher shall not be liable for any loss, actions, claims,proceedings, demand, or costs or damages whatsoever or howsoever caused arising directly or indirectly inconnection with or arising out of the use of this material.
MTE 8(2) #17459
Microscale Thermophysical Engineering, 8:141–154, 2004Copyright © Taylor & Francis Inc.ISSN: 1089-3954 print/1091-7640 onlineDOI: 10.1080/10893950490445612
DEVELOPMENT OF INTERFEROMETRIC TEMPERATUREMEASUREMENT PROCEDURES FOR MICROFLUID FLOW
D. Newport, J. Garvey, T. Dalton, and V. EganStokes Research Institute, University of Limerick, Limerick, Ireland
M. WhelanInstitute for Health and Consumer Protection, Joint Research Centre, EuropeanCommission, Italy
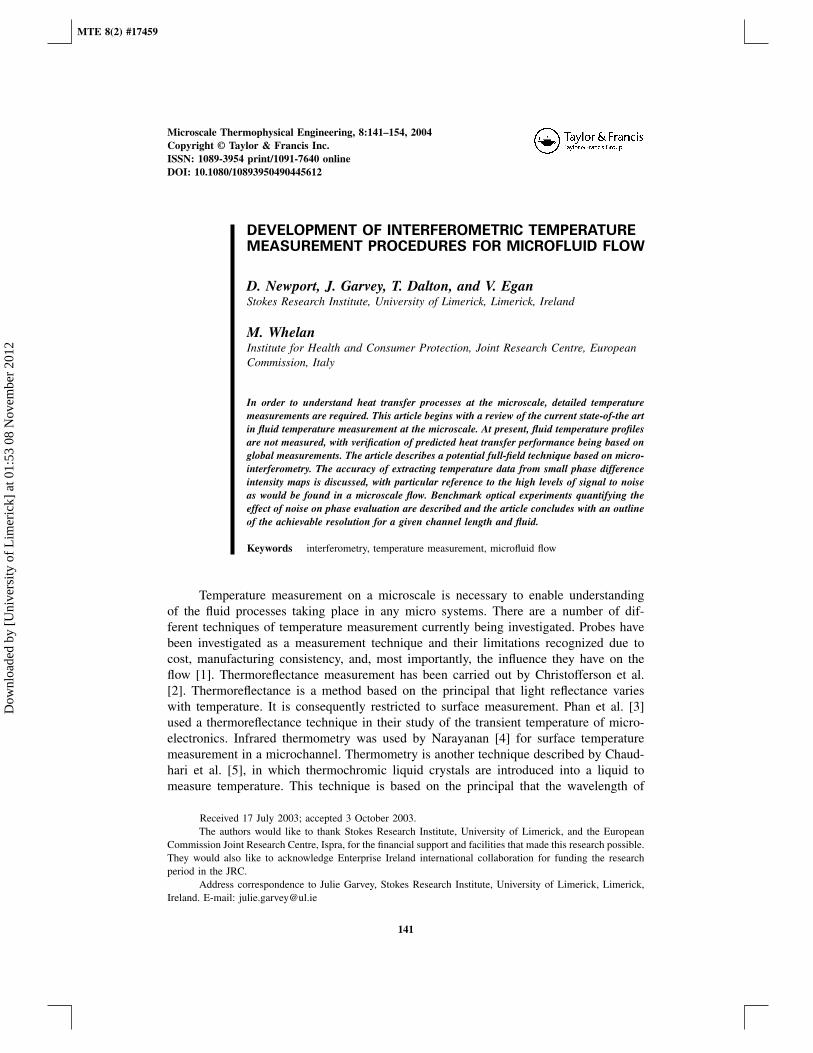
In order to understand heat transfer processes at the microscale, detailed temperaturemeasurements are required. This article begins with a review of the current state-of-the artin fluid temperature measurement at the microscale. At present, fluid temperature profilesare not measured, with verification of predicted heat transfer performance being based onglobal measurements. The article describes a potential full-field technique based on micro-interferometry. The accuracy of extracting temperature data from small phase differenceintensity maps is discussed, with particular reference to the high levels of signal to noiseas would be found in a microscale flow. Benchmark optical experiments quantifying theeffect of noise on phase evaluation are described and the article concludes with an outlineof the achievable resolution for a given channel length and fluid.
Keywords interferometry, temperature measurement, microfluid flow
Temperature measurement on a microscale is necessary to enable understandingof the fluid processes taking place in any micro systems. There are a number of dif-ferent techniques of temperature measurement currently being investigated. Probes havebeen investigated as a measurement technique and their limitations recognized due tocost, manufacturing consistency, and, most importantly, the influence they have on theflow [1]. Thermoreflectance measurement has been carried out by Christofferson et al.[2]. Thermoreflectance is a method based on the principal that light reflectance varieswith temperature. It is consequently restricted to surface measurement. Phan et al. [3]used a thermoreflectance technique in their study of the transient temperature of micro-electronics. Infrared thermometry was used by Narayanan [4] for surface temperaturemeasurement in a microchannel. Thermometry is another technique described by Chaud-hari et al. [5], in which thermochromic liquid crystals are introduced into a liquid tomeasure temperature. This technique is based on the principal that the wavelength of
Received 17 July 2003; accepted 3 October 2003.The authors would like to thank Stokes Research Institute, University of Limerick, and the European
Commission Joint Research Centre, Ispra, for the financial support and facilities that made this research possible.They would also like to acknowledge Enterprise Ireland international collaboration for funding the researchperiod in the JRC.
Address correspondence to Julie Garvey, Stokes Research Institute, University of Limerick, Limerick,Ireland. E-mail: [email protected]
141
Dow
nloa
ded
by [
Uni
vers
ity o
f L
imer
ick]
at 0
1:53
08
Nov
embe
r 20
12
142 D. NEWPORT ET AL.
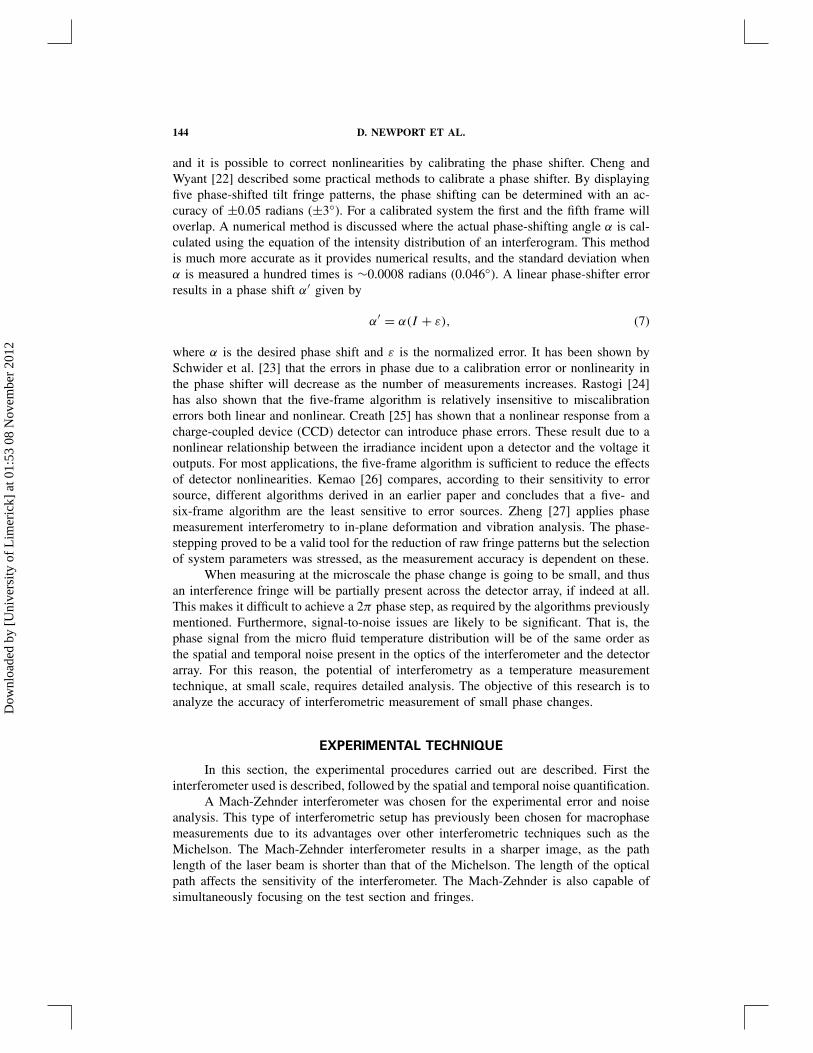
NOMENCLATURE
I Intensityk Gladstone Dale constant, m3/kgL Length, mn Refractive indexp Pressure, N/m2
R Gas constant, J/kgKT Temperature, K
α Phase shift, radiansβ Thermal expansion coefficient, K−1
δ Phase change, radiansλ Wavelength, mρ Density, Kg/m3
dn/dT Thermo-optic coefficient, K−1
maximum reflectivity decreases with increasing temperature. By coating the surface withthe crystals this technique can measure the surface temperature. Chanteloup and Bolcs[6] also used this technique for surface temperature measurement. Alternatively, the crys-tals can be used within a liquid to measure temperature gradients. Sato et al. [7] usedfluorescence imaging in conjunction with PIV to investigate the temperature distribu-tion and mass diffusion in a microchannel. Kearney et al. [8] used fluorescence in theplanar laser-induced fluorescence (PLIF) thermometry. In this technique both particleimage velocimetry and PLIF were carried out simultaneously. Kim et al. [9] used laser-induced fluorescence for temperature measurement and Lutjen et al. [10] used liquidcrystal scanning thermography to measure 3D temperature fields. Nalyor [11] reviewedsome of the recent techniques for heat transfer measurement, at the macroscale, includinginterferometry and also analysed a beam averaging technique.
Often fluid temperature profiles are not measured, and verification of predictedheat transfer performance is based on global measurements, such as Peng et al. [12], inwhich the boiling within a microchanneled plate was investigated. Li et al. [13] examinedthe heat transfer of gases in microchannels using an analytical approach. A review andanalysis of the heat transfer of microchannels by Sobhan and Garimella [14] showeda shortage of temperature measurement and little agreement between analyses carriedout to date. Palm [15] analyzed the progression to date and the phenomena involved inmicroscale heat transfer. It was concluded that future analysis was necessary to gain agreater understanding of the fluid flow at this scale. There is thus a need for a techniqueto measure local fluid temperature distributions at the microscale.
This article considers division of amplitude interferometry as a means to extracttemperature information from micro systems. Initially the phase shifting error is analyzed,followed by measurement of the spatial and temporal noise within an interferometricsystem. Finally, the resolution limitations for microphase measurement are summarized.
INTERFEROMETRY AND DIGITAL PHASE MEASUREMENT
A division of amplitude interferometer essentially comprises a coherent light beam,which is split into two or more beams and then recombined. Changes in the optical pathalong a beam cause a change in phase and result in the formation of an interference patternin the recombined beam. The change in optical path can be related to numerous physicalquantities such as temperature. An extensive review and discussion of interferometry haspreviously been carried out by Tolansky [16], Goldstein [17], Cloud [18], and Naylor [11].
Dow
nloa
ded
by [
Uni
vers
ity o
f L
imer
ick]
at 0
1:53
08
Nov
embe
r 20
12
INTERFEROMETRIC TEMPERATURE MEASUREMENT FOR MICROFLUID FLOW 143
The phase change within an interferometer, which is related to the change in re-fractive index between the test arm and the reference arm of the system, is given by
δ = 2πL
λ0(n − n0) (1)
where (n − n0) is the refractive index change between the reference arm, n0 and thetest arm, n. This phase change is also dependent on the wavelength of the light beam inthe interferometer, λ0. The phase change can be related to temperature depending on thematerials in which the phase change occurs. For gases, the Gladstone-Dale equation andthe perfect gas law are used to equate the change in phase to a change in temperature as
n − 1 = kρ (2)
p = ρRT (3)
Values for k are wavelength dependent and can be found in relevant tables.For the situation in which the change occurs in a solid, the change in phase is
related to the thermo-optic coefficient of the glass. This is due to the change in therefractive index of the glass with a change in temperature and is given by:
δ = 2πL
λ0(n − n0) (4)
n − n0 = dn
dT�T (5)
where dn/dT is the thermo-optic coefficient of the particular solid material.The phase change in liquids is derived from the Lorentz-Lorentz equation and the
value for dn/dT may be calculated to within an accuracy of 2% by Equation (6). Thisallows the calculation of the change of refractive index with temperature for substanceson which there is limited property information [19].
dn
dT= −3
2
[n(n2 − 1)
2n2 + 1
]β (6)
where β is the thermal expansion coefficient of the liquid.In the past two decades there has been extensive research into digitally processing
interferograms. The use of phase measurement interferometry has become widespread,as the direct measurement of phase has many advantages over the raw fringe patternanalysis methods that have been used. These advantages include high measurement ac-curacy, rapid measurement, and phase obtained at a fixed grid of data points. As withany measurement technique, there are a number of errors to be considered. According toCreath [20], the errors will vary according to the application and algorithm used. Har-iharan et al. [21] developed a technique that uses π/2 (90◦) phase shifts. It is now themost popular technique used and was implemented in the experiments for this article.This algorithm uses five frames of intensity with relative phase shifts of −π , −π/2, 0,π/2, π and is popular due its insensitivity to the common systematic errors present inphase measurement interferometry. Phase-shifter errors are due to a miscalibration of thesystem and to nonlinearities in the phase shift. Linear phase shifters can be purchased
Dow
nloa
ded
by [
Uni
vers
ity o
f L
imer
ick]
at 0
1:53
08
Nov
embe
r 20
12
144 D. NEWPORT ET AL.
and it is possible to correct nonlinearities by calibrating the phase shifter. Cheng andWyant [22] described some practical methods to calibrate a phase shifter. By displayingfive phase-shifted tilt fringe patterns, the phase shifting can be determined with an ac-curacy of ±0.05 radians (±3◦). For a calibrated system the first and the fifth frame willoverlap. A numerical method is discussed where the actual phase-shifting angle α is cal-culated using the equation of the intensity distribution of an interferogram. This methodis much more accurate as it provides numerical results, and the standard deviation whenα is measured a hundred times is ∼0.0008 radians (0.046◦). A linear phase-shifter errorresults in a phase shift α′ given by
α′ = α(I + ε), (7)
where α is the desired phase shift and ε is the normalized error. It has been shown bySchwider et al. [23] that the errors in phase due to a calibration error or nonlinearity inthe phase shifter will decrease as the number of measurements increases. Rastogi [24]has also shown that the five-frame algorithm is relatively insensitive to miscalibrationerrors both linear and nonlinear. Creath [25] has shown that a nonlinear response from acharge-coupled device (CCD) detector can introduce phase errors. These result due to anonlinear relationship between the irradiance incident upon a detector and the voltage itoutputs. For most applications, the five-frame algorithm is sufficient to reduce the effectsof detector nonlinearities. Kemao [26] compares, according to their sensitivity to errorsource, different algorithms derived in an earlier paper and concludes that a five- andsix-frame algorithm are the least sensitive to error sources. Zheng [27] applies phasemeasurement interferometry to in-plane deformation and vibration analysis. The phase-stepping proved to be a valid tool for the reduction of raw fringe patterns but the selectionof system parameters was stressed, as the measurement accuracy is dependent on these.
When measuring at the microscale the phase change is going to be small, and thusan interference fringe will be partially present across the detector array, if indeed at all.This makes it difficult to achieve a 2π phase step, as required by the algorithms previouslymentioned. Furthermore, signal-to-noise issues are likely to be significant. That is, thephase signal from the micro fluid temperature distribution will be of the same order asthe spatial and temporal noise present in the optics of the interferometer and the detectorarray. For this reason, the potential of interferometry as a temperature measurementtechnique, at small scale, requires detailed analysis. The objective of this research is toanalyze the accuracy of interferometric measurement of small phase changes.
EXPERIMENTAL TECHNIQUE
In this section, the experimental procedures carried out are described. First theinterferometer used is described, followed by the spatial and temporal noise quantification.
A Mach-Zehnder interferometer was chosen for the experimental error and noiseanalysis. This type of interferometric setup has previously been chosen for macrophasemeasurements due to its advantages over other interferometric techniques such as theMichelson. The Mach-Zehnder interferometer results in a sharper image, as the pathlength of the laser beam is shorter than that of the Michelson. The length of the opticalpath affects the sensitivity of the interferometer. The Mach-Zehnder is also capable ofsimultaneously focusing on the test section and fringes.
Dow
nloa
ded
by [
Uni
vers
ity o
f L
imer
ick]
at 0
1:53
08
Nov
embe
r 20
12
INTERFEROMETRIC TEMPERATURE MEASUREMENT FOR MICROFLUID FLOW 145
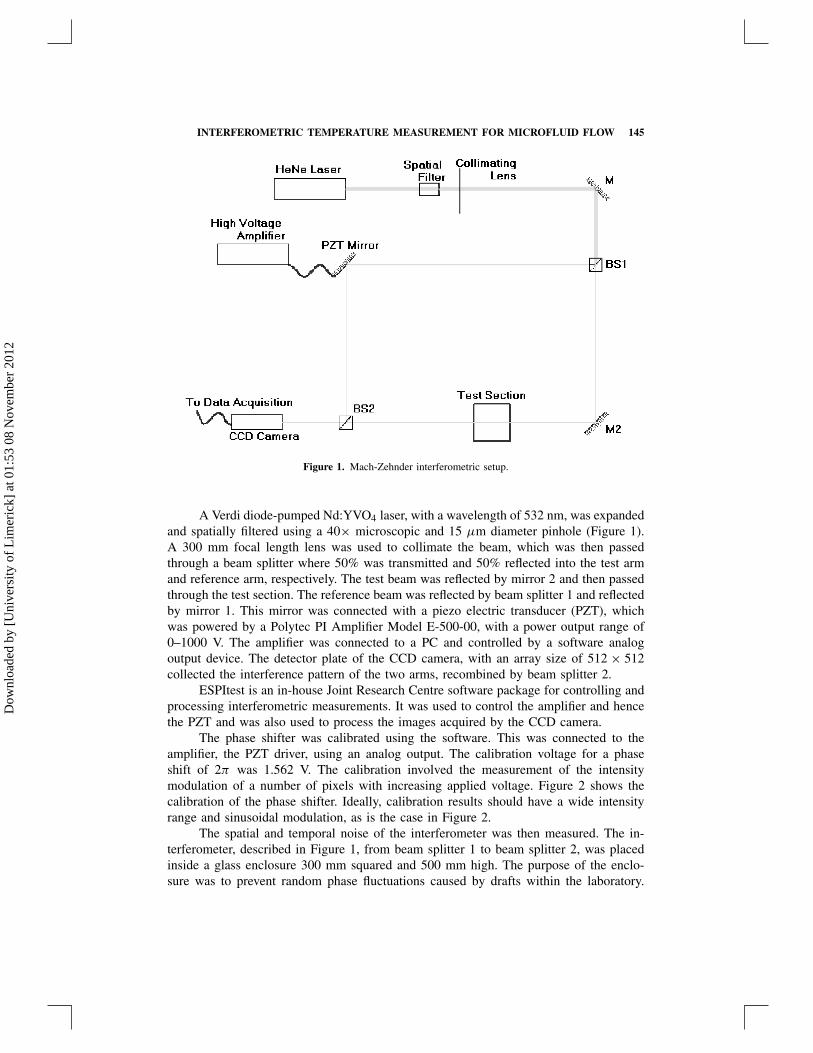
Figure 1. Mach-Zehnder interferometric setup.
A Verdi diode-pumped Nd:YVO4 laser, with a wavelength of 532 nm, was expandedand spatially filtered using a 40× microscopic and 15 µm diameter pinhole (Figure 1).A 300 mm focal length lens was used to collimate the beam, which was then passedthrough a beam splitter where 50% was transmitted and 50% reflected into the test armand reference arm, respectively. The test beam was reflected by mirror 2 and then passedthrough the test section. The reference beam was reflected by beam splitter 1 and reflectedby mirror 1. This mirror was connected with a piezo electric transducer (PZT), whichwas powered by a Polytec PI Amplifier Model E-500-00, with a power output range of0–1000 V. The amplifier was connected to a PC and controlled by a software analogoutput device. The detector plate of the CCD camera, with an array size of 512 × 512collected the interference pattern of the two arms, recombined by beam splitter 2.
ESPItest is an in-house Joint Research Centre software package for controlling andprocessing interferometric measurements. It was used to control the amplifier and hencethe PZT and was also used to process the images acquired by the CCD camera.
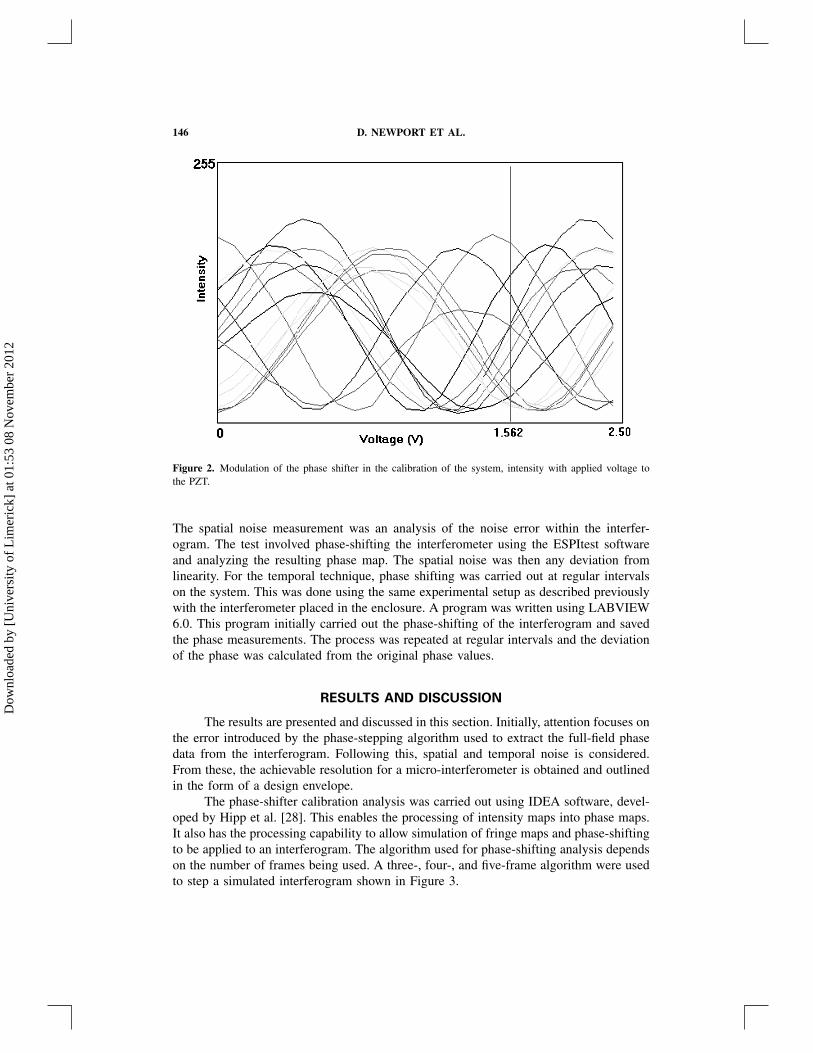
The phase shifter was calibrated using the software. This was connected to theamplifier, the PZT driver, using an analog output. The calibration voltage for a phaseshift of 2π was 1.562 V. The calibration involved the measurement of the intensitymodulation of a number of pixels with increasing applied voltage. Figure 2 shows thecalibration of the phase shifter. Ideally, calibration results should have a wide intensityrange and sinusoidal modulation, as is the case in Figure 2.
The spatial and temporal noise of the interferometer was then measured. The in-terferometer, described in Figure 1, from beam splitter 1 to beam splitter 2, was placedinside a glass enclosure 300 mm squared and 500 mm high. The purpose of the enclo-sure was to prevent random phase fluctuations caused by drafts within the laboratory.
Dow
nloa
ded
by [
Uni
vers
ity o
f L
imer
ick]
at 0
1:53
08
Nov
embe
r 20
12
146 D. NEWPORT ET AL.
Figure 2. Modulation of the phase shifter in the calibration of the system, intensity with applied voltage tothe PZT.
The spatial noise measurement was an analysis of the noise error within the interfer-ogram. The test involved phase-shifting the interferometer using the ESPItest softwareand analyzing the resulting phase map. The spatial noise was then any deviation fromlinearity. For the temporal technique, phase shifting was carried out at regular intervalson the system. This was done using the same experimental setup as described previouslywith the interferometer placed in the enclosure. A program was written using LABVIEW6.0. This program initially carried out the phase-shifting of the interferogram and savedthe phase measurements. The process was repeated at regular intervals and the deviationof the phase was calculated from the original phase values.
RESULTS AND DISCUSSION
The results are presented and discussed in this section. Initially, attention focuses onthe error introduced by the phase-stepping algorithm used to extract the full-field phasedata from the interferogram. Following this, spatial and temporal noise is considered.From these, the achievable resolution for a micro-interferometer is obtained and outlinedin the form of a design envelope.
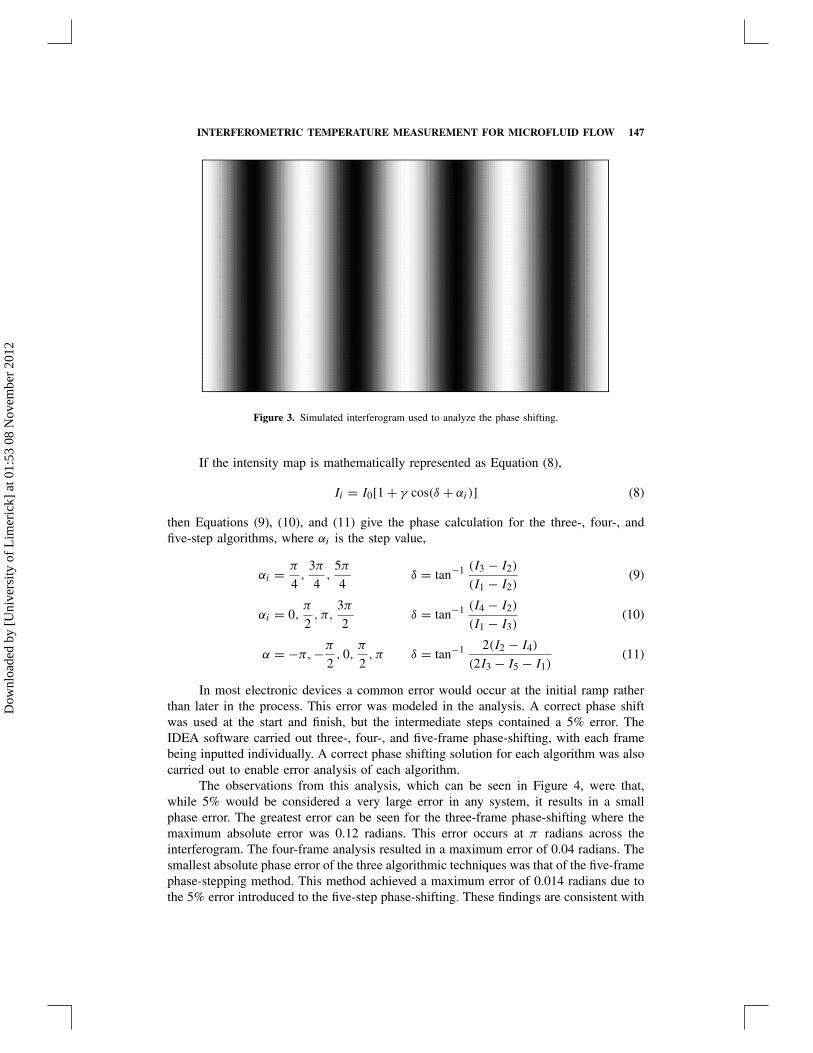
The phase-shifter calibration analysis was carried out using IDEA software, devel-oped by Hipp et al. [28]. This enables the processing of intensity maps into phase maps.It also has the processing capability to allow simulation of fringe maps and phase-shiftingto be applied to an interferogram. The algorithm used for phase-shifting analysis dependson the number of frames being used. A three-, four-, and five-frame algorithm were usedto step a simulated interferogram shown in Figure 3.
Dow
nloa
ded
by [
Uni
vers
ity o
f L
imer
ick]
at 0
1:53
08
Nov
embe
r 20
12
INTERFEROMETRIC TEMPERATURE MEASUREMENT FOR MICROFLUID FLOW 147
Figure 3. Simulated interferogram used to analyze the phase shifting.
If the intensity map is mathematically represented as Equation (8),
Ii = I0[1 + γ cos(δ + αi)] (8)
then Equations (9), (10), and (11) give the phase calculation for the three-, four-, andfive-step algorithms, where αi is the step value,
αi = π
4,
3π
4,
5π
4δ = tan−1 (I3 − I2)
(I1 − I2)(9)
αi = 0,π
2, π,
3π
2δ = tan−1 (I4 − I2)
(I1 − I3)(10)
α = −π, −π
2, 0,
π
2, π δ = tan−1 2(I2 − I4)
(2I3 − I5 − I1)(11)
In most electronic devices a common error would occur at the initial ramp ratherthan later in the process. This error was modeled in the analysis. A correct phase shiftwas used at the start and finish, but the intermediate steps contained a 5% error. TheIDEA software carried out three-, four-, and five-frame phase-shifting, with each framebeing inputted individually. A correct phase shifting solution for each algorithm was alsocarried out to enable error analysis of each algorithm.
The observations from this analysis, which can be seen in Figure 4, were that,while 5% would be considered a very large error in any system, it results in a smallphase error. The greatest error can be seen for the three-frame phase-shifting where themaximum absolute error was 0.12 radians. This error occurs at π radians across theinterferogram. The four-frame analysis resulted in a maximum error of 0.04 radians. Thesmallest absolute phase error of the three algorithmic techniques was that of the five-framephase-stepping method. This method achieved a maximum error of 0.014 radians due tothe 5% error introduced to the five-step phase-shifting. These findings are consistent with
Dow
nloa
ded
by [
Uni
vers
ity o
f L
imer
ick]
at 0
1:53
08
Nov
embe
r 20
12

148 D. NEWPORT ET AL.
Figure 4. Phase shift analysis with a 5% error.
the extensive analysis carried out on phase shifting error by Cheng and Wyant [22] andCreath [20], discussed earlier in the article.
Spatial noise refers to noise within the interference pattern. A linear profile is theideal for a spatial phase measurement and any deviation from this linearity is due toeither noise or error within the system. Figure 5 shows the deviation of the interferogramfrom linearity in terms of intensity and Figure 6 shows a line profile of this noise mapconverted into phase. The intensity map contained a number of pixel points with veryhigh noise/error values; these errors were due to processing rather than spatial noise andhence should not be taken into account in the noise analysis. These intensity values wereeliminated from the analysis by a filtering technique; the resulting intensity map can beseen in Figure 5. For this analysis the residual fringes, or residual phase, were subtractedfrom the final phase-shifted phase map. This subtraction was carried out to eliminateresidual phase difference, which does not influence the phase measurement of the finalexperimental results. The 2D intensity map of Figure 5 was converted to phase and aline profile was taken, which can be seen in Figure 6. This line plot shows a maximumspatial noise value of ±0.22 radians. However, a spatial noise deviation of ±0.35 radiansis the maximum obtained from the 2D phase map. Error measured within the spatialtesting is due to error within the interferometric setup. These errors are due to the opticalcomponents used in the interferometric methods. Reduction of error within the systemmay be achieved by the use of optical components with increased resolution, such asbetter quality mirrors, beam splitters, and the CCD camera.
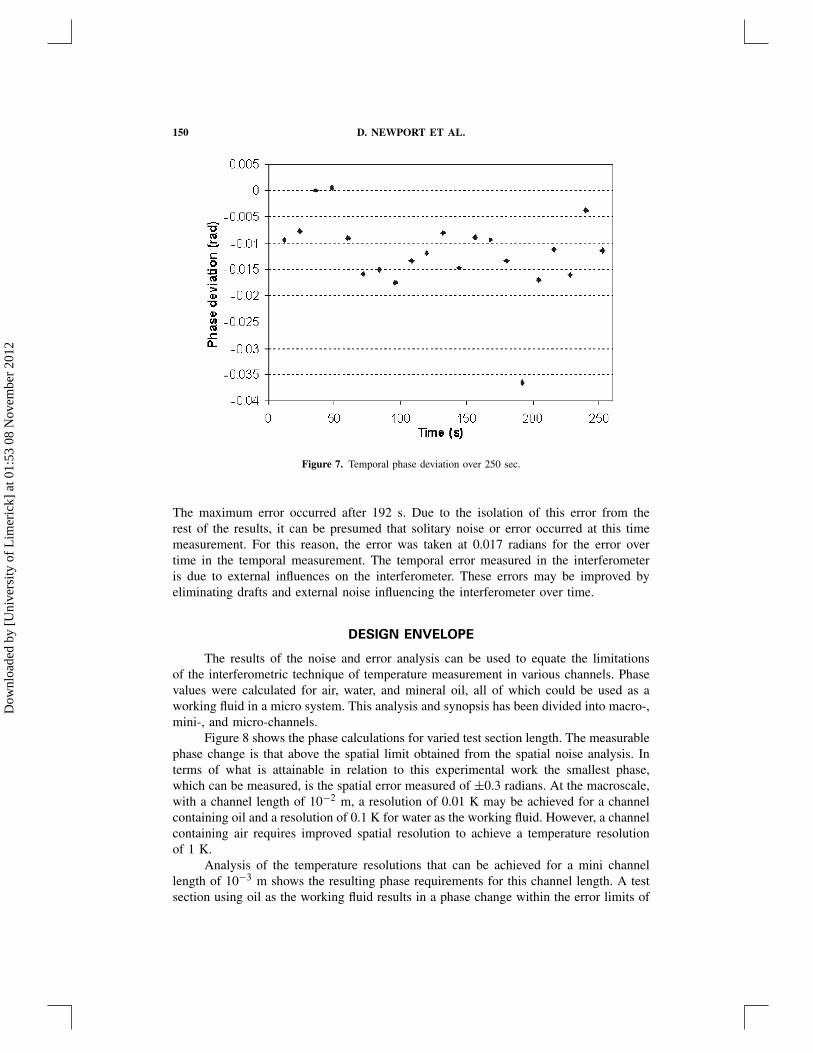
Temporal noise is variation in the phase of the system over time. This is an analysisof the error of the interferogram over time. Figure 7 shows the deviation of the phase in theinterferogram over time. Each deviation point is the mean deviation of a line of 200 pixelstaken across the interferogram. The deviation has a maximum value of 0.0365 radians.
Dow
nloa
ded
by [
Uni
vers
ity o
f L
imer
ick]
at 0
1:53
08
Nov
embe
r 20
12

INTERFEROMETRIC TEMPERATURE MEASUREMENT FOR MICROFLUID FLOW 149
Figure 5. 2D intensity plot of the spatial noise of interferogram.
Figure 6. A line profile of the spatial noise at row 200 of the 2D intensity map.
Dow
nloa
ded
by [
Uni
vers
ity o
f L
imer
ick]
at 0
1:53
08
Nov
embe
r 20
12
150 D. NEWPORT ET AL.
Figure 7. Temporal phase deviation over 250 sec.
The maximum error occurred after 192 s. Due to the isolation of this error from therest of the results, it can be presumed that solitary noise or error occurred at this timemeasurement. For this reason, the error was taken at 0.017 radians for the error overtime in the temporal measurement. The temporal error measured in the interferometeris due to external influences on the interferometer. These errors may be improved byeliminating drafts and external noise influencing the interferometer over time.
DESIGN ENVELOPE
The results of the noise and error analysis can be used to equate the limitationsof the interferometric technique of temperature measurement in various channels. Phasevalues were calculated for air, water, and mineral oil, all of which could be used as aworking fluid in a micro system. This analysis and synopsis has been divided into macro-,mini-, and micro-channels.
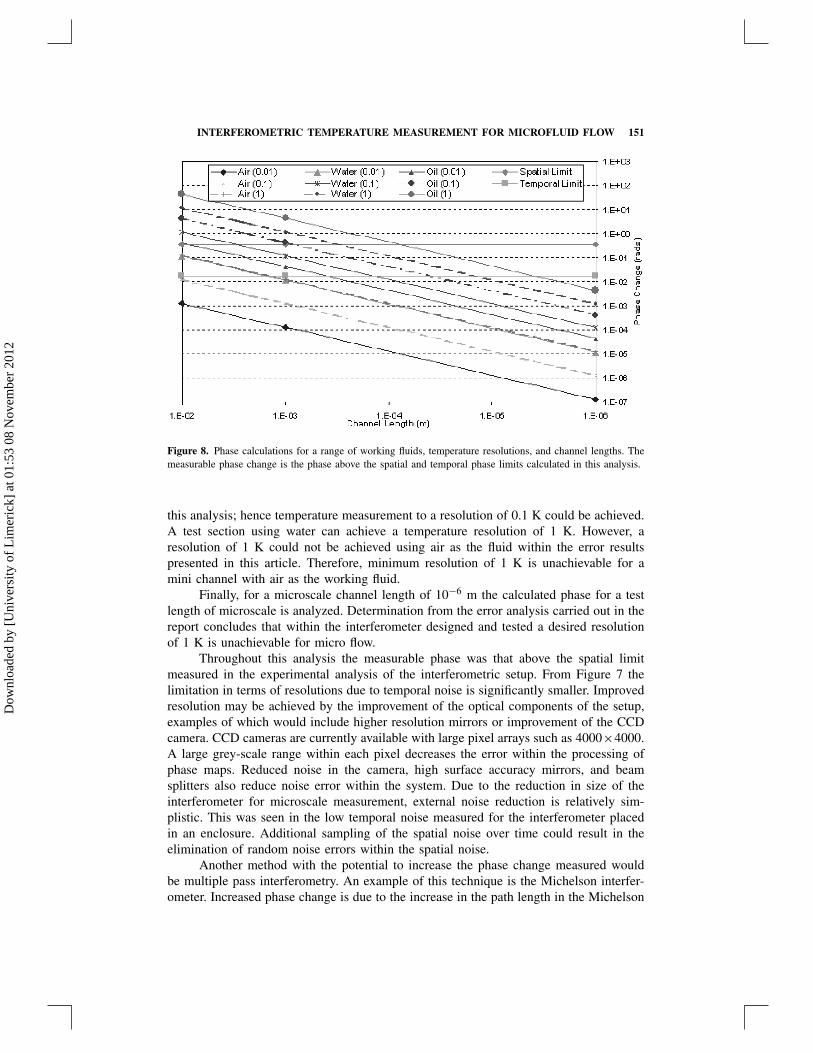
Figure 8 shows the phase calculations for varied test section length. The measurablephase change is that above the spatial limit obtained from the spatial noise analysis. Interms of what is attainable in relation to this experimental work the smallest phase,which can be measured, is the spatial error measured of ±0.3 radians. At the macroscale,with a channel length of 10−2 m, a resolution of 0.01 K may be achieved for a channelcontaining oil and a resolution of 0.1 K for water as the working fluid. However, a channelcontaining air requires improved spatial resolution to achieve a temperature resolutionof 1 K.
Analysis of the temperature resolutions that can be achieved for a mini channellength of 10−3 m shows the resulting phase requirements for this channel length. A testsection using oil as the working fluid results in a phase change within the error limits of
Dow
nloa
ded
by [
Uni
vers
ity o
f L
imer
ick]
at 0
1:53
08
Nov
embe
r 20
12
INTERFEROMETRIC TEMPERATURE MEASUREMENT FOR MICROFLUID FLOW 151
Figure 8. Phase calculations for a range of working fluids, temperature resolutions, and channel lengths. Themeasurable phase change is the phase above the spatial and temporal phase limits calculated in this analysis.
this analysis; hence temperature measurement to a resolution of 0.1 K could be achieved.A test section using water can achieve a temperature resolution of 1 K. However, aresolution of 1 K could not be achieved using air as the fluid within the error resultspresented in this article. Therefore, minimum resolution of 1 K is unachievable for amini channel with air as the working fluid.
Finally, for a microscale channel length of 10−6 m the calculated phase for a testlength of microscale is analyzed. Determination from the error analysis carried out in thereport concludes that within the interferometer designed and tested a desired resolutionof 1 K is unachievable for micro flow.
Throughout this analysis the measurable phase was that above the spatial limitmeasured in the experimental analysis of the interferometric setup. From Figure 7 thelimitation in terms of resolutions due to temporal noise is significantly smaller. Improvedresolution may be achieved by the improvement of the optical components of the setup,examples of which would include higher resolution mirrors or improvement of the CCDcamera. CCD cameras are currently available with large pixel arrays such as 4000×4000.A large grey-scale range within each pixel decreases the error within the processing ofphase maps. Reduced noise in the camera, high surface accuracy mirrors, and beamsplitters also reduce noise error within the system. Due to the reduction in size of theinterferometer for microscale measurement, external noise reduction is relatively sim-plistic. This was seen in the low temporal noise measured for the interferometer placedin an enclosure. Additional sampling of the spatial noise over time could result in theelimination of random noise errors within the spatial noise.
Another method with the potential to increase the phase change measured wouldbe multiple pass interferometry. An example of this technique is the Michelson interfer-ometer. Increased phase change is due to the increase in the path length in the Michelson
Dow
nloa
ded
by [
Uni
vers
ity o
f L
imer
ick]
at 0
1:53
08
Nov
embe
r 20
12
152 D. NEWPORT ET AL.
interferometer. This increase in path length is due to the test beam passing through the testsection twice. This doubles the test length along which the phase change occurred, hencedoubling the phase change measured. As already discussed, the Michelson interferometerhas the disadvantage of its inability to focus on the fringes and test section simultane-ously. However, for microscale measurement the size of the interferometer is significantlyreduced. This reduction should result in the depth of focus being large enough to focuson both the fringes and test section with enough clarity, hence eliminating this problem.This idea may be implemented into an interferometric technique to enable multipass test-ing. This technique could allow the beam to pass through the test section, hence furtherincreasing the phase change measured by a multiple of the number of passes.
CONCLUSIONS
Interferometry is a non-intrusive temperature technique, which holds advantages inthe measurement of temperature at microscale. However, the limits of the technique aredue to the desired resolution as well as the size and materials used in the test section.The design of the interferometer may be analyzed prior to testing to access the opticalrequirements necessary to achieve the desired measurement resolution. The resolutionmay be improved through the use of high-resolution optics, tested within a low noiseenvironment.
REFERENCES
1. L. Shi and A. Majumdar, Recent Developments in Micro and Nanoscale Thermometry, Micro-scale Thermophysical Engineering, vol. 5, pp. 251–265, 2001.
2. J. Christofferson, D. Vashaee, A. Shakouri, P. Melese, X. Fan, G. Zeng, C. Labounty, J. E.Bowers, and E. T. Croke III, Thermoreflectance Imaging of Superlattice Micro Refrigerators,Proc. Symp. SEMITHERM XVII, vol. 1, pp. 58–62, 2001.
3. T. Phan, S. Dilhaire, V. Quintard, W. Claeys, and J. C. Batsale, Thermoreflectance Measure-ments of Transient Temperature upon Integrated Circuits: Application to Thermal ConductivityIdentification, Microelectronics Journal, vol. 29, pp. 181–190, 1998.
4. V. Narayanan, Temperature Measurements and Surface Visualization in Microchannel FlowsUsing Infrared Thermography, Proc. of ASME 1st International Conference on Microchannelsand Minichannels, New York, vol. 1, pp. 879–886, 2003.
5. A. M. Chaudhari, T. M. Woudenberg, M. Albin, and K. E. Goodson, Transient Liquid CrystalThermometry of Microfabricated PCR Vessel Arrays, IEEE/ASME Journal of MicroElectroMe-chanical Systems, vol. 7, no. 4, pp. 345–355, 1998.
6. D. Chanteloup and A. Bolcs, Experimental Investigation of Heat Transfer in Two-Pass CoolantPassages with Ribs and Film Cooling Hole Ejection, Proc. ASME Design Engineering Tech-nical Conference, vol. 1, pp. 305–316, 2002.
7. Y. Sato, G. Irisawa, M. Ishizuka, K. Hishida, and M. Maeda, Visualization of ConvectiveMixing in Microchannel by Fluorescence Imaging, Measurement Science and Technology,vol. 14, pp. 114–121, 2003.
8. S. P. Kearney, T. W. Grasser, and C. P. Bourdon, A Combined PLIF/PIV System for Si-multaneous Gas-Phase Temperature/Velocity Imaging, Proc. ASME International MechanicalEngineering Congress & Exposition, vol. 1, 2002.
9. H. J. Kim, K. D. Kihm, and J. S. Allen, Examination of Ratiometric Laser Induced FluorescenceThermometry for Microscale Spatial Measurement Resolution, International Journal of Heatand Mass Transfer, vol. 46, pp. 3967–3974, 2003.
Dow
nloa
ded
by [
Uni
vers
ity o
f L
imer
ick]
at 0
1:53
08
Nov
embe
r 20
12

INTERFEROMETRIC TEMPERATURE MEASUREMENT FOR MICROFLUID FLOW 153
10. P. M. Lutjen, D. Mishra, and V. Prasad, Three-Dimensional Visualisation and Measurement ofTemperature Field Using Liquid Crystal Scanning Thermography, Journal of Heat Transfer,vol. 123, pp. 1006–1014, 2001.
11. D. Naylor, Recent Developments in the Measurement of Convective Heat Transfer Rates byLaser Interferometry, International Journal of Heat and Fluid Flow, vol. 24, pp. 345–355,2003.
12. X. F. Peng, G. P. Peterson, and B. X. Wang, Flow Boiling of Binary Mixtures in MicrochanneledPlates, International Journal of Heat and Mass Transfer, vol. 39, no. 6, pp. 1257–1264, 1996.
13. J. Li, B. Wang, and X. Peng, Wall-Adjacent Layer Analysis for Developed-Flow Laminar HeatTransfer of Gases in Microchannels, International Journal of Heat and Mass Transfer, vol. 43,pp. 839–847, 2000.
14. C. B. Sobhan and S. V. Garimella, A Comparative Analysis of Studies on Heat Transfer andFluid Flow in Microchannels, Microscale Thermophysical Engineering, vol. 5, pp. 293–311,2001.
15. B. Palm, Heat Transfer in Microchannels, Microscale Thermophysical Engineering, vol. 5,pp. 155–175, 2001.
16. S. Tolansky, An Introduction to Interferometry, Second Edition, Harlow: Longman, 1973.17. R. J. Goldstein, Fluid Mechanics Measurements, Hemisphere, Washington, D.C., 1983.18. G. L. Cloud, Optical Methods of Engineering Analysis, First Edition, Cambridge University
Press, Cambridge, U.K., 1995.19. C. G. Murphy and S. S. Alpert, Dependence of Refractive Index Temperature Coefficient
on the Thermal Expansivity of Liquids, American Journal of Physics, vol. 39, pp. 834–836,1976.
20. K. Creath, Phase-Measurement Interferometry: Beware These Errors, Proc SPIE Laser Inter-ferometry VI: Computer-Aided Interferometry, vol. 1553, pp. 213–220, 1991.
21. P. Hariharan, B. F. Oreb, and T. Eiju, Digital Phase-Shifting Interferometry: A Simple Error-Compensating Phase Calculation Algorithm, Applied Optics, vol. 26. no. 3, pp. 2504–2505,1987.
22. Y. Cheng and J. C. Wyant, Phase Shifter Calibration in Phase-Shifting Interferometry, AppliedOptics, vol. 24, no. 18, pp. 3049–3052, 1985.
23. J. Schwider, R. Burow, J. Elssner, J. Grzanna, R. Spolaczyk, and K. Merkel, Digital WavefrontMeasurement Interferometry: Some Systematic Error Sources, Applied Optics, vol. 22, no. 21,pp. 3421–3432, 1983.
24. P. K. Rastogi, Holographic Interferometry: Principles and Methods, Springer-Verlag, Berlin,1994.
25. K. Creath, Phase-Measurement Interferometry Techniques, Progress in Optics XXVI, E. Wolf(ed.), Elsevier Science, Chapter 5, 1988.
26. Q. Kemao, Comparison of Some Phase Shifting Algorithms with a Phase Step of π/2, Proc.SPIE Advanced Photonic Sensors and Applications II, vol. 4596, pp. 310–313, 2001.
27. W. Zheng, Phase-Stepping DSPI and Its Applications, Proc. SPIE Industrial Applications ofOptical Inspection Metrology and Sensing, vol. 1821, pp. 46–53, 1992.
28. M. Hipp, P. Reiterer, J. Woisetschlager, H. Philipp, G. Pretzler, W. Fliesser, and T. Neger,Application of Interferometric Fringe Evaluation Software at Technical University Graz, Proc.SPIE Interferometry ’99, Applications, vol. 3745, pp. 281–292, 1999
RESPONSE TO REVIEWER’S COMMENTS
The literary review within the introduction section was updated in the article toinclude some more recent analyses, which have taken place since the submission of thisarticle.
Dow
nloa
ded
by [
Uni
vers
ity o
f L
imer
ick]
at 0
1:53
08
Nov
embe
r 20
12
154 D. NEWPORT ET AL.
Major Points
1. As mentioned in the article, it is not clear as to how the Mach-Zehnder interfer-ometer setup is better than the Michelson setup for the experimental evaluationand noise analysis. In fact, as mentioned in the later part of the article theMichelson method will be more sensitive than the Mach-Zehnder method, as itgives a high signal.
The Mach-Zehnder interferometer was chosen for analysis due to its useas a temperature measurement technique at the macroscale. The Mach-Zehnderinterferometer results in a sharper image, as the path length of the laser beam isshorter than that of the Michelson; the Mach-Zehnder is also capable of simulta-neously focusing on the test section and fringes. However, within the discussion,and following the analysis, the variation between macro and micro measurementwas discussed. This previous disadvantage of the Michelson interferometer maybe overcome due to the reduced size of the interferometer at the microscale, andits increased phase measurement may render it a more appropriate measurementtechnique.
ACTION: The discussion in the experimental technique and discussionsections were altered to clarify this point.
2. The method used to evaluate and analyze the spatial noise is not clear. Perhapsa figure or an illustration of the method would be useful. Second, a 2D profileshould give a better estimate of this noise when compared to a line profile.
ACTION: The description of this procedure was improved to clarify thetechnique used for the noise measurement. A 2D profile has been included inthe article.
3. Is there a difference in the evaluated phase error when using a different interfer-ogram from the one shown in Figure 3? This error needs to be evaluated fromdifferent cases (at least 3) before assigning a number to the phase error.
There is no difference because the error is simply repeated throughout theinterferogram. Extensive analysis has been carried out by Cheng and Wyant [22]on phase shifting error.
ACTION: The previous error analyses carried out were highlighted inthe text.
Minor Points
1. In Equation (1), the nomenclature is a little bit confusing. It looks like λ0 is thewavelength in the medium with the refractive index of n0, which is not the case.
ACTION: Equation (1) has been explained in more detail in the text.2. In Figure 7 there is a data line missing. There are 8 lines in the plot and 9 in
the legend.There are 2 data lines of the same magnitude and so difficult to see on
the graph. Water at a temperature resolution of 0.01 K has phase values of1.18 × 10−1 rads, 1.18 × 10⁻² rads, and 1.18 × 10⁻⁵ rads; air for a resolutionof 1 K has values of 1.25 × 10⁻¹ rads, 1.25 × 10⁻² rads, and 1.25 × 10⁻⁵ rads.
ACTION: The format of these two data lines was changed in an effort,and the size of the graph increased, to make them more distinguishable.
Dow
nloa
ded
by [
Uni
vers
ity o
f L
imer
ick]
at 0
1:53
08
Nov
embe
r 20
12