Development of Indicators for Sustainable Rice Farming in Bangladesh: A Case Study with...
11
World Applied Sciences Journal 22 (5): 672-682, 2013 ISSN 1818-4952 © IDOSI Publications, 2013 DOI: 10.5829/idosi.wasj.2013.22.05.2890 Corresponding Author: Ranjan Roy, School of Humanities, Universiti Sains Malaysia (USM), 11800 USM Pulau Pinang, Malaysia. Tel: +60164503180. 672 Development of Indicators for Sustainable Rice Farming in Bangladesh: A Case Study with Participative Multi-Stakeholder Involvement Ranjan Roy, Ngai Weng Chan and Ruslan Rainis 1,2 2 2 Department of Agricultural Extension and Information System, 1 Sher-e-Bangla Agricultural University, Bangladesh Department of Geography, School of Humanities, Universiti Sains Malaysia, Penang, Malaysia 2 Abstract: Indicators are increasingly recognized as an important decision aid tool to translate sustainability issue from theory into practice. However, indicator development for sustainable community development is rather successful than the agricultural sector due to methodological lacuna. The aim of this study is to develop a methodological framework for indicator development and an essential set of indicators of sustainable rice farming in Bangladesh by adopting participatory multi-stakeholders involvement approach. The study adopted informal discussion with academicians, literature review, online experts’ survey and focus group discussion with the farmers of three sub-districts that represent irrigated, rainfed lowland and upland rice growing ecosystems. These exercises yielded a set of indicators of three dimensions: economics (6), society (10) and environment (5), as well as a process of deriving indicator system with requisite information. The paper concludes that by employing a true participatory approach indicator development collectively decisive to extract an essential and representative set of indicators. Moreover, the study indicates the more significance of social indicators in promoting rice farming sustainability is Bangladesh. We highlight sustainability indicator development is a fairly demanding and challenging process. However, a blend with stakeholder’s knowledge and local experience enhances the questions of indicator’s applicability and practicability. Key words: Methodology Delphi technique Participatory Sustainable development Bangladesh INTRODUCTION unique process to translate sustainability from theory into It is assumed that indicator has been used for make the farming sustainability concept into operational. centuries. However, indicator achieved its utmost It is now unequivocal that agricultural sector is a significance as an integral part of sustainability issue after significant source of environmental harm. Despite agrarian publishing the historic document the Brundtland report production has been increased substantially over the “Our Common Future”. In many countries, indicators are last four decades, present production system faces now increasingly used to steer sustainable development enormous challenges [5]. Similarly, the rice production in (SD). Research has also been shown that indicator not Bangladesh has increased from about 17 million tons in only appropriate for assessing sustainability but also a 1970 to about 48 million tons in 2009 [6]. However, several holistic tool for monitoring, management and achieving studies have reported that current rice production is SD. Despite the term, “indicator” is often vague and not environmentally sounded and socially responsible heterogeneous; several researchers described the [7, 8, 9]. Considering the perpetual pressure of the significance of indicator. For example, indicators: increasing population rice farming sustainability is a vital provide core information on the social, economic and issue, as it provides annual 95% of the total food grain’s environmental state of the system [1], are key levers in production and consumption, production employs about diagnosing problems and understand their underlying 65% of the country’s entire labor force and contributes to causes [2], can apply as tools for monitoring progress 10% GDP [10]. Plausibly, sustainable rice farming has towards SD [3] and supply proper justification for attracted considerable attention of academicians, decisive planning and policy-making [4]. Consensus from researchers, NGOs workers and policy makers. It is likely these studies reveals that an indicator system is a fairly that developing and diagnosing essential indicators practice and an effective, efficient and systematic way to
Transcript of Development of Indicators for Sustainable Rice Farming in Bangladesh: A Case Study with...

World Applied Sciences Journal 22 (5): 672-682, 2013ISSN 1818-4952© IDOSI Publications, 2013DOI: 10.5829/idosi.wasj.2013.22.05.2890
Corresponding Author: Ranjan Roy, School of Humanities, Universiti Sains Malaysia (USM), 11800 USM Pulau Pinang, Malaysia. Tel: +60164503180.
672
Development of Indicators for Sustainable Rice Farming in Bangladesh:A Case Study with Participative Multi-Stakeholder Involvement
Ranjan Roy, Ngai Weng Chan and Ruslan Rainis1,2 2 2
Department of Agricultural Extension and Information System,1
Sher-e-Bangla Agricultural University, BangladeshDepartment of Geography, School of Humanities, Universiti Sains Malaysia, Penang, Malaysia2
Abstract: Indicators are increasingly recognized as an important decision aid tool to translate sustainabilityissue from theory into practice. However, indicator development for sustainable community development israther successful than the agricultural sector due to methodological lacuna. The aim of this study is to developa methodological framework for indicator development and an essential set of indicators of sustainable ricefarming in Bangladesh by adopting participatory multi-stakeholders involvement approach. The study adoptedinformal discussion with academicians, literature review, online experts’ survey and focus group discussionwith the farmers of three sub-districts that represent irrigated, rainfed lowland and upland rice growingecosystems. These exercises yielded a set of indicators of three dimensions: economics (6), society (10) andenvironment (5), as well as a process of deriving indicator system with requisite information. The paperconcludes that by employing a true participatory approach indicator development collectively decisive toextract an essential and representative set of indicators. Moreover, the study indicates the more significanceof social indicators in promoting rice farming sustainability is Bangladesh. We highlight sustainability indicatordevelopment is a fairly demanding and challenging process. However, a blend with stakeholder’s knowledgeand local experience enhances the questions of indicator’s applicability and practicability.
Key words: Methodology Delphi technique Participatory Sustainable development Bangladesh
INTRODUCTION unique process to translate sustainability from theory into
It is assumed that indicator has been used for make the farming sustainability concept into operational.centuries. However, indicator achieved its utmost It is now unequivocal that agricultural sector is asignificance as an integral part of sustainability issue after significant source of environmental harm. Despite agrarianpublishing the historic document the Brundtland report production has been increased substantially over the“Our Common Future”. In many countries, indicators are last four decades, present production system facesnow increasingly used to steer sustainable development enormous challenges [5]. Similarly, the rice production in(SD). Research has also been shown that indicator not Bangladesh has increased from about 17 million tons inonly appropriate for assessing sustainability but also a 1970 to about 48 million tons in 2009 [6]. However, severalholistic tool for monitoring, management and achieving studies have reported that current rice production isSD. Despite the term, “indicator” is often vague and not environmentally sounded and socially responsibleheterogeneous; several researchers described the [7, 8, 9]. Considering the perpetual pressure of thesignificance of indicator. For example, indicators: increasing population rice farming sustainability is a vitalprovide core information on the social, economic and issue, as it provides annual 95% of the total food grain’senvironmental state of the system [1], are key levers in production and consumption, production employs aboutdiagnosing problems and understand their underlying 65% of the country’s entire labor force and contributes tocauses [2], can apply as tools for monitoring progress 10% GDP [10]. Plausibly, sustainable rice farming hastowards SD [3] and supply proper justification for attracted considerable attention of academicians,decisive planning and policy-making [4]. Consensus from researchers, NGOs workers and policy makers. It is likelythese studies reveals that an indicator system is a fairly that developing and diagnosing essential indicators
practice and an effective, efficient and systematic way to
World Appl. Sci. J., 22 (5): 672-682, 2013
673
would be a starting point to curb the unsustainable are an inconsistency and difficulty in implementing thecondition of farming system. Accordingly, these results. Usually, the top-down process misses casualindicators will assist to assess the sustainability, observation and the bottom-up approach provides a moremonitoring, management of the system and culminating to contextual understanding of local context [16].play a central role in evidence-based policy making and In this context, it would be more accurate to apply astrategy formulation. consolidated approach of expert’s judgment blended with
Many researchers and organizations have been the local people’s experience for indicator generation.involved in the generation of indicators since the early Several researchers [17] have stressed that an integration1990s. However, many literatures reported that indicators between top-down and bottom-up approaches in thatwere not providing actual benefits for which it develops situation. Freebairn and King have figured out a vision for[11]. Moldan and Dahl reviewed the state of the art in indicator generation illustrating relationships among theindicator development for sustainability and key-players [18]. Bauler et al. acknowledges thatdemonstrated that several conceptual challenges remain involvement of major stakeholders and users is awith indicators, methods need further improvement and prerequisite of SD indicators by mentioning 3 reasons:more efforts are needed to generate integrated sets of integrating local knowledge with technical and scientificindicators to support self-regulating sustainability [12]. expertise, improving decision-making processes and usingMoreover, Pintér et al. said that the recent economic and stakeholders as a counterbalance to the influence offood crises explicitly expressed the weakness of current experts’ and widening the ownership of assessmentindicator systems, which fails to provide necessary instruments [19]. Moreover, Roy and Chan proposedwarning and take adequate preventive action [13]. expert-led indicator development with active participationResearch observations indicate that partly the problem of stakeholders, since; they are customarily well knownlies with methodological gaps. Realizing the significance about their own situations and conditions [1].of rice farming sustainability issue and shortcomings of Furthermore, researchers reported a combination of localindicator development method in agriculture, we inspired and scientific knowledge is more well-fitted and precise into conduct this study setting two objectives: (i) to monitoring and managing environmental change [20].develop a methodological framework for indicator UN Agenda 21 suggested for inclusion ninedevelopment and (ii) to develop an essential set of categories of key stakeholders and civil society groups inindicators for sustainable rice farming in Bangladesh, by the indicator development process, including grower’sadopting participative multi-stakeholders involvement involvement for local indicators is indispensable. In fact,approach. with a view to develop a holistic set of indicators, it is
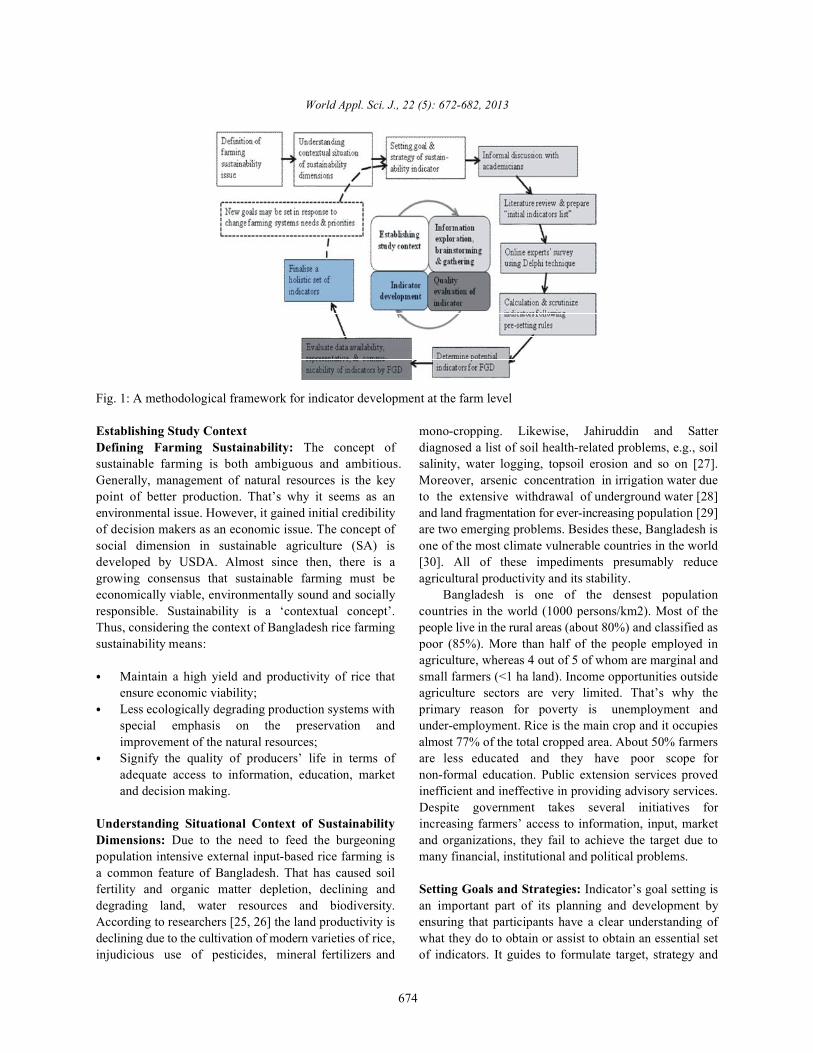
Indicator Development by a Participative Approach: a disciplines, experience and concern on multidimensionalMethodological Framework: It is a daunting challenge to attributes- environmental, economic and social. Likewise,determine the appropriate method for indicator indicator development through the participation processdevelopment. Empirical research shows a considerable (generally involving major stakeholders) achieved adebate regarding the suitable methods of indicator broadening consensus by the numerous researchersgeneration that suit local context, i.e., the dichotomy [18, 21, 22, 23, 17, 3, 24]. Consensus from these studiesbetween expert-led (top-down) and community-driven suggests so far that (i) most of the studies fairly(bottom-up) approaches. Despite both approaches have developed indicators at the community level, (ii) severalstrength and weakness, researchers developed numerous studies lack of true sense of multi-stakeholdersindicators by applying these approaches and (academicians, researchers, extension personnel, policymanages, monitors and gauges SD issues. There is a makers, civil society members, NGO workers, managerswell-established literature points out that “authors and farmers) participation, e.g., [23], (iii) there are fewappraisal” or “expert judgments” are commonly used studies conducted in agriculture or crop productionindicator development methods [14]. Indicator developed sectors. Thus, it needs a consolidated approach ofby the experts is also often shown accurate so far [15]. modern science blended with expert knowledge and activeSimultaneously, it is recognized that indicator participation of multi-stakeholders in the development ofdevelopment by applying a top-down approach poorly farm-level sustainability indicators. In conceptualizationreflects the situational context which creates a problem in the multi-stakeholders and multidisciplinary approach, weresult and policy implementation. In fact, where there is a proposed a methodological framework for indicatorless stakeholder involvement in project activities, there development (Figure 1).
highly pertinent to consider knowledge on diverse
World Appl. Sci. J., 22 (5): 672-682, 2013
674
Fig. 1: A methodological framework for indicator development at the farm level
Establishing Study Context mono-cropping. Likewise, Jahiruddin and SatterDefining Farming Sustainability: The concept of diagnosed a list of soil health-related problems, e.g., soilsustainable farming is both ambiguous and ambitious. salinity, water logging, topsoil erosion and so on [27].Generally, management of natural resources is the key Moreover, arsenic concentration in irrigation water duepoint of better production. That’s why it seems as an to the extensive withdrawal of underground water [28]environmental issue. However, it gained initial credibility and land fragmentation for ever-increasing population [29]of decision makers as an economic issue. The concept of are two emerging problems. Besides these, Bangladesh issocial dimension in sustainable agriculture (SA) is one of the most climate vulnerable countries in the worlddeveloped by USDA. Almost since then, there is a [30]. All of these impediments presumably reducegrowing consensus that sustainable farming must be agricultural productivity and its stability.economically viable, environmentally sound and socially Bangladesh is one of the densest populationresponsible. Sustainability is a ‘contextual concept’. countries in the world (1000 persons/km2). Most of theThus, considering the context of Bangladesh rice farming people live in the rural areas (about 80%) and classified assustainability means: poor (85%). More than half of the people employed in
Maintain a high yield and productivity of rice that small farmers (<1 ha land). Income opportunities outsideensure economic viability; agriculture sectors are very limited. That’s why theLess ecologically degrading production systems with primary reason for poverty is unemployment andspecial emphasis on the preservation and under-employment. Rice is the main crop and it occupiesimprovement of the natural resources; almost 77% of the total cropped area. About 50% farmersSignify the quality of producers’ life in terms of are less educated and they have poor scope foradequate access to information, education, market non-formal education. Public extension services provedand decision making. inefficient and ineffective in providing advisory services.
Understanding Situational Context of Sustainability increasing farmers’ access to information, input, marketDimensions: Due to the need to feed the burgeoning and organizations, they fail to achieve the target due topopulation intensive external input-based rice farming is many financial, institutional and political problems.a common feature of Bangladesh. That has caused soilfertility and organic matter depletion, declining and Setting Goals and Strategies: Indicator’s goal setting isdegrading land, water resources and biodiversity. an important part of its planning and development byAccording to researchers [25, 26] the land productivity is ensuring that participants have a clear understanding ofdeclining due to the cultivation of modern varieties of rice, what they do to obtain or assist to obtain an essential setinjudicious use of pesticides, mineral fertilizers and of indicators. It guides to formulate target, strategy and
agriculture, whereas 4 out of 5 of whom are marginal and
Despite government takes several initiatives for

World Appl. Sci. J., 22 (5): 672-682, 2013
675
policy actions. Typically, goal setting involves In the literature, one of the contentious issues ofestablishing specific, measureable, attainable, realistic and Delphi method is the number of participants in the survey,time-targeted objectives. Our short-term goals are: where researchers are very much diverse in adopting theincreasing rice production and reducing poverty, size of participants. The number of participants is for apreserving and improving the natural resource base and Delphi study is variable and still, it has no consensus.evidence-based policy making and the long-term goals is Several studies [34, 35] used the participant number ofto achieve sustainable agricultural development. seven or below seven. Using these as guidelines, weStrategies are a careful plan of actions designed to selected seven experts fulfilling the predeterminedachieve pre-determined goals. Based on these goals our conditions, i.e., having at least 20 years of professionalstrategies are: improving growers’ access to information, experience on particular issue and willingness tonon-formal education, technology and market; participate and contribute up to reach consensus. Allinstitutional (especially agricultural extension experts were familiar with agricultural sustainability issueorganization) and financial (agricultural credit and and accordingly selected having long experiences asmicro-credit) capacity building; and providing appropriate academician, researcher, extension officer, policy maker,policy actions and environment. NGO worker, business leader and civil society member.
MATERIALS AND METHODS indicator scores yielded by the Delphi survey [34]
Study Area: This study comprises 2 stages datacollection; one is expert online survey and another is Survey Instrument Preparation and Data Collection:focus group discussion (FGD) with the farmers. We Literature review [1, 36, 27, 37, 38, 39, 40, 41, 42, 43, 44, 26,selected expert at Dhaka-based different organizations 45, 46, 47, 48, 49, 50, 51, 52] was the basis of our surveyfor the survey and conducted FGD with the rice growers instrument. Simultaneously, authors conducted informalof 3 sub-districts, namely Pirganj, Natore Sadar and discussions with 24 academicians in the field ofDinajpur Sadar of Bangladesh that represents irrigated, agronomy, economics, environmental science, agriculturalrainfed lowland and upland rice growing ecosystems extension and social science. The subject matters of therespectively. Brief information of rice, bio-physical and discussion were the key drivers of better production,socio-economic aspects of the sub-districts are presented negative ecological consequences, farmer’s wellbeing andin the Table 1. necessary measures of sustainable socio-economic
Delphi Technique in Indicator Development: Since Delphi agricultural sustainability issue, as well as guided totechnique development in the early 1950s, it has been review right literatures. However, the main objective ofused for numerous cases, for example, program planning, informal discussion was to identify appropriate expert forneed assessment, quality control, etc. It is a widely used online survey. According to this we consulted journaltool as expert consensus building by using a series of articles, books, project and annual reports of governmentquestionnaires in the diverse field where knowledge is organizations, NGOs, development organizations andlimited [31]. Brill et al. illustrated that Delphi technique is research centres and as a result an “initial list” of 21a popular tool for deriving consensus among experts from indicators was drawn up.the wider geographical locations with minimizing financial The first-round survey questionnaire comprised twoand temporal hindrances [32]. Typically, Delphi method types of questions like, close and open-ended. Expertsdoes not act as a decision-making tool; rather purvey were requested to assign a degree of importance on adefinite information for decision by analysis, which five-point Likert scale (most important to least important)involves expert participants, repeated rounds, opportunity as well as allowed freedom to propose new indicator andfor participants to revaluate their answers, anonymity of rate them following the same way. Before sending surveythe participants and finally uses a range of statistical instrument authors communicated with the experts forcalculations to measure the degree of convergence of their kind consent as well as a reminder was sent after oneexpert opinion. Application of this method in constructing month. Moreover, experts were well informed about theindicator is also recognised [33, 34, 35]. However, several survey objectives, definition of farming sustainability,challenges lie in its application, specifically, expert ultimate goal of our investigation. At the end of the firstselection, getting necessary feedback and achieving round indicators mean, median and the quartile deviationconsensus. was calculated.
We adopted Chu and Hwang rules for analysing the
(Table 2).
development. This effort provided an inclusive picture of

World Appl. Sci. J., 22 (5): 672-682, 2013
676
Table 1: Characteristics of the three sub-districtsStudy area Pirganj, Thakurgoan Dinajpur Sadar Natore SadarLocation and area (ha) 25.85°N-88.37°E, 25.63°N-88.65°E, 24.41°N88.93°E,
35341 35488 40129 Major rice variety BRRI Dhan 28, 29 BR20, BR21 BR3, BR11Rice yield (Mt/ha) Boro- 4.2-4.6 Boro- 4.0-4.2 Boro- 4.0-4.2
Aman- 2.0-2.5 Aman-2.0-2.4 Aman- 2.0-2.6 Aus- No data Aus- 2.0-2.2 Aus- 1.0-1.5
Area based on soil type (ha) Sandy- 102 Sandy- 175 Sandy- 125 Sandy loam- 8540 Sandy loam- 15853 Sandy loam- 11240 LoamyLoamy soil- 12230 Loamy soil- 19255 soil- 21787Clay - 196 Clay - 205 Clay - 6975
Major crop Rice (Boro, Aman) Rice (Aman, Boro, Aus,) Rice (Aman, Boro) wheat,Wheat, Jute, Maize Wheat, Maize, Jute, jute, pulse, potato,
Vegetables vegetablesFarmers type (%) Landless- 13 Landless- 52 Landless- 35
Marginal- 24 Marginal- 28 Marginal- 31Small-38 Small- 9 Small- 20Medium- 21 Medium- 9 Medium- 11Large- 4 Large- 2 Large- 3
Main economic activity Agriculture Agriculture, commercial Agriculture, rice mill andvegetable and fruits production, small industries, small industries commercial production
Source: Concerned Agricultural Office.BRRI= Bangladesh Rice Research Institute, BR= Bangladesh Rice Dhan means rice, Aus: Direct seeded or transplanted rice in pre monsoon season, Aman: Transplanted rice in monsoon season, Boro: Irrigated rice in dry season.
Table 2: Rules for analysing the scores from the experts using the Delphi approachRound 1 Round 2Mean score Indicator If Mean score Indicator I 3.5, Q 0.5 and Score variance I 3.5 < 15%, Then Indicator I is accepted Mean score Indicator If Mean score Indicator I < 3.5, Q 0.5 and Score variance I < 3.5 15% then Indicator I is rejected.Note: Mean score is the average scores for Indicator I, Score variance means the ratio of experts who change their scores for Indicator I between two successiverounds, Q means the inter-quartile range
The results of 1 round survey were presented to the bio-physical and socio-economic condition of localst
experts of the second round with a view to overcome the farming system, (iii) communicability- implies how farpotential biases. They were again requested to rate the indicators are understood and dealt effectively theindicators like the first round. After the completion of the purpose and meaning of the target audiences. FGD is asecond round, once more mean, quartile deviation and the useful technique for obtaining individuals’ impressionsscore variances were calculated. According to Chu and and concerns about certain issues. However, it needsHwang the minimum requirement to reach a consensus on careful plans and strategies.a particular aspect during the 2 round or later is set to Initially, with the assistance of Sub-Assistantnd
75% [34]. Agricultural Officer (SAAO) and leader farmers we
Focus Group Discussions (FGD): By conducting FGD, present concerns of farming, their needs and demands,we planned to generate locally supported and role of extension organization and government initiativescontext-specific indicators based on growers farming in terms of promoting sustainable rice farming. Anotherknowledge and experience. Moreover, to evaluate the 2 questions were used for evaluation. We adoptedthree qualities of expert determined indicators: (i) data snowball sampling for selection of small groups ofavailability- means the extent to which data are available 7 participants with the help of SAAO and familiar farmers.and accessible within the budget limit, (ii) representative- At the beginning of the discussion facilitator role isrefers the extent to which indicators represent the crucial to create a thoughtful, permissive atmosphere and
determined 4 questions for discussion on growers’
2

World Appl. Sci. J., 22 (5): 672-682, 2013
677
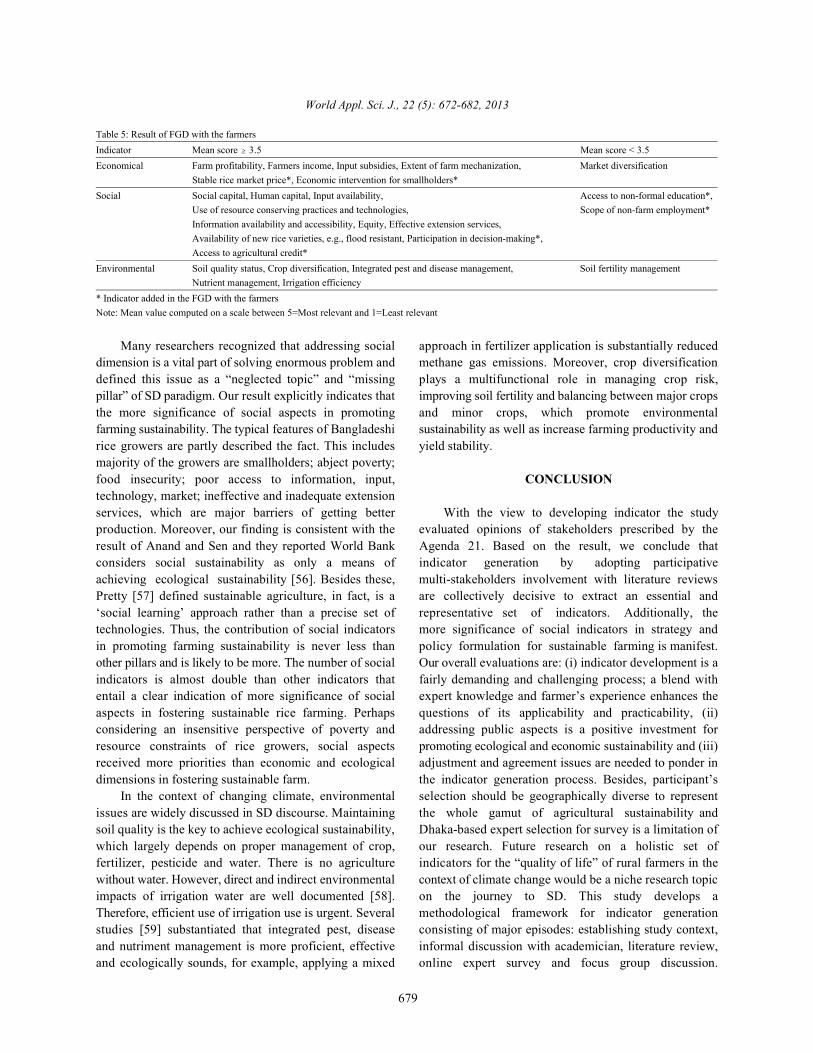
set a friendly tone of the discussion. Hence, we As a result of pre-determined rules, at the end of 2 roundconducted discussion by following the 4 steps: welcome, survey we received 19 indicators for FGD. In the FGD,overview of the topic, necessary rules and questions [53]. 6 new indicators were developed by the growers,In that way facilitator carried out FGDs and requested however, only 4 indicators were obtained 3.5 or aboveparticipants to make a list of potential indicators. mean score, our cutoff point. Moreover, 2 indicatorsThen they rated the indicators using 5 points rating scale. developed by the expert were failed to fulfill their qualitySimilarly, they rated the pre-determined indicators to evaluation in FGD (Table 5). Finally, we obtained 21assess their qualities. However, before going to second indicators for promoting sustainable rice farming. Overall,part of evaluation facilitator made a thorough discussion 77% of the indicators come from past literatures andabout the indicators for clear understandings of the public participation contributes to indicator developmentparticipants’. We conducted 10 FGDs and most of the by 33%. In the indicator generation process, farmers werediscussions were taken a period of 55 to 70 minutes. FGDs more aware on their economical issue, like credit whereas,were held at the grower’s workplaces and school expert concern was on the strategies of modern farmingpremises. Finally, calculated the mean value of indicators such as agricultural mechanization, technology use, etc.and identified statistically stronger indicators using thecutoff point of 3.5 and above. For more details instruction DISCUSSIONSof FGD, the book of Bloor et al. can be consulted [54].Overall, indicator development is a matter of concessions Profitability is a fundamental indicator of anand compromise and by conducting survey and FGD we economically viable farm. Similarly, Gafsi and Favreaure-established this meaning. opined that first a farm should be profitable without taking
RESULTS directly or indirectly present a link to the way to achieve
Initially, the survey instrument contained an “initial production risks and vulnerability; hence, financiallist” of 21 indicators and at the end of 1 round experts interventions surely spur them to continue a productivest
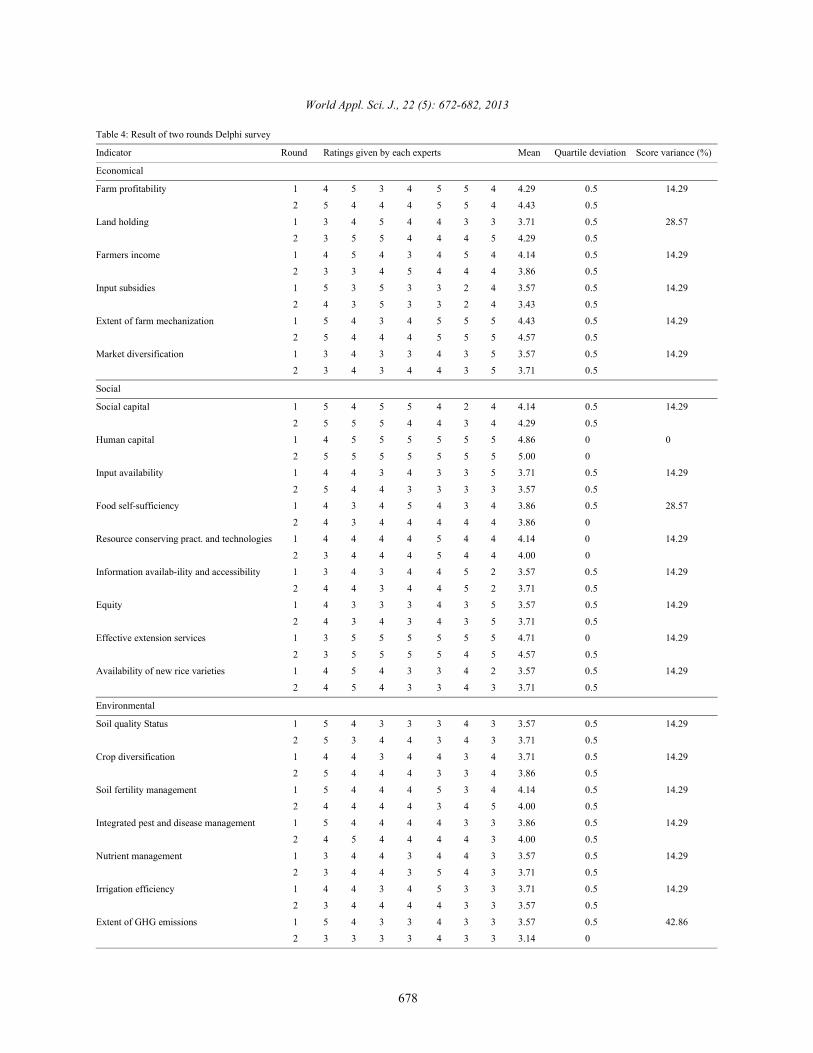
derived 10 new indicators; namely, extent of farm and cost effective farm. Moreover, farm mechanization hasmechanization, cropping pattern and so on (Table 3). a direct link with improved productivity, commercializationAmong them only 6 indicators were eligible to enter and value addition in agriculture that increase farm returnsfurther investigation. In fact, all indicators of the initial and compensate the impact of a rise in the labour wageround contribute to promote sustainability and we which will synergistically enhance economic viability ofconsidered indicators those were statistically robust farms. Government provides a subsidy on chemicalbased on pre-setting rules (Table 2). Table 4 presents the fertilizers and irrigation. However, studies reported thatdetailed results of 2 rounds survey consisting rating these subsidies were not so beneficial for small andscore, mean value, quartile deviation and score variance. marginal farmers. Hence, an appropriate input subsidy notIt includes expert’s selected 16 indicators from the only helps the targeted farmers but also assists to reduceinitial list and added 6 new indicators in the 1 round. negative environmental impacts of farming.st
nd
economic risk to make it sustainable [55]. Other indicators
grower’s economic support, like smallholder faces several
Table 3: Result of the first round Delphi survey
Indicator Mean score 3.5 Mean score < 3.5
Economical Farm profitability, Land holding, Farmers income, Input subsidies, Land productivityExtent of farm mechanization*, Market diversification*
Social Social capital, Human capital, Input availability, Food self-sufficiency, Availability of labour force, Cropping pattern*,Use of resource conserving practices and technologies*, Agricultural health hazards*,Information availability and accessibility, Equity, Effective extension services, Rural infrastructureAvailability of new rice varieties, e.g., flood resistant*
Environmental Soil quality status, Crop diversification, Soil fertility management*, Agrobiodiversity*,Integrated pest and disease management, Nutrient management, Water pollution*,Irrigation efficiency, 27.Extent of GHG emissions* Disaster management,
Soil erosion
* Indicator added in the 1 roundst
Note: Mean value computed on a scale between 5=Most important and 1=Least important
World Appl. Sci. J., 22 (5): 672-682, 2013
678
Table 4: Result of two rounds Delphi survey
Indicator Round Ratings given by each experts Mean Quartile deviation Score variance (%)
Economical
Farm profitability 1 4 5 3 4 5 5 4 4.29 0.5 14.29
2 5 4 4 4 5 5 4 4.43 0.5
Land holding 1 3 4 5 4 4 3 3 3.71 0.5 28.57
2 3 5 5 4 4 4 5 4.29 0.5
Farmers income 1 4 5 4 3 4 5 4 4.14 0.5 14.29
2 3 3 4 5 4 4 4 3.86 0.5
Input subsidies 1 5 3 5 3 3 2 4 3.57 0.5 14.29
2 4 3 5 3 3 2 4 3.43 0.5
Extent of farm mechanization 1 5 4 3 4 5 5 5 4.43 0.5 14.29
2 5 4 4 4 5 5 5 4.57 0.5
Market diversification 1 3 4 3 3 4 3 5 3.57 0.5 14.29
2 3 4 3 4 4 3 5 3.71 0.5
Social
Social capital 1 5 4 5 5 4 2 4 4.14 0.5 14.29
2 5 5 5 4 4 3 4 4.29 0.5
Human capital 1 4 5 5 5 5 5 5 4.86 0 0
2 5 5 5 5 5 5 5 5.00 0
Input availability 1 4 4 3 4 3 3 5 3.71 0.5 14.29
2 5 4 4 3 3 3 3 3.57 0.5
Food self-sufficiency 1 4 3 4 5 4 3 4 3.86 0.5 28.57
2 4 3 4 4 4 4 4 3.86 0
Resource conserving pract. and technologies 1 4 4 4 4 5 4 4 4.14 0 14.29
2 3 4 4 4 5 4 4 4.00 0
Information availab-ility and accessibility 1 3 4 3 4 4 5 2 3.57 0.5 14.29
2 4 4 3 4 4 5 2 3.71 0.5
Equity 1 4 3 3 3 4 3 5 3.57 0.5 14.29
2 4 3 4 3 4 3 5 3.71 0.5
Effective extension services 1 3 5 5 5 5 5 5 4.71 0 14.29
2 3 5 5 5 5 4 5 4.57 0.5
Availability of new rice varieties 1 4 5 4 3 3 4 2 3.57 0.5 14.29
2 4 5 4 3 3 4 3 3.71 0.5
Environmental
Soil quality Status 1 5 4 3 3 3 4 3 3.57 0.5 14.29
2 5 3 4 4 3 4 3 3.71 0.5
Crop diversification 1 4 4 3 4 4 3 4 3.71 0.5 14.29
2 5 4 4 4 3 3 4 3.86 0.5
Soil fertility management 1 5 4 4 4 5 3 4 4.14 0.5 14.29
2 4 4 4 4 3 4 5 4.00 0.5
Integrated pest and disease management 1 5 4 4 4 4 3 3 3.86 0.5 14.29
2 4 5 4 4 4 4 3 4.00 0.5
Nutrient management 1 3 4 4 3 4 4 3 3.57 0.5 14.29
2 3 4 4 3 5 4 3 3.71 0.5
Irrigation efficiency 1 4 4 3 4 5 3 3 3.71 0.5 14.29
2 3 4 4 4 4 3 3 3.57 0.5
Extent of GHG emissions 1 5 4 3 3 4 3 3 3.57 0.5 42.86
2 3 3 3 3 4 3 3 3.14 0
World Appl. Sci. J., 22 (5): 672-682, 2013
679
Table 5: Result of FGD with the farmersIndicator Mean score 3.5 Mean score < 3.5Economical Farm profitability, Farmers income, Input subsidies, Extent of farm mechanization, Market diversification
Stable rice market price*, Economic intervention for smallholders*Social Social capital, Human capital, Input availability, Access to non-formal education*,
Use of resource conserving practices and technologies, Scope of non-farm employment* Information availability and accessibility, Equity, Effective extension services,Availability of new rice varieties, e.g., flood resistant, Participation in decision-making*,Access to agricultural credit*
Environmental Soil quality status, Crop diversification, Integrated pest and disease management, Soil fertility management Nutrient management, Irrigation efficiency
* Indicator added in the FGD with the farmersNote: Mean value computed on a scale between 5=Most relevant and 1=Least relevant
Many researchers recognized that addressing social approach in fertilizer application is substantially reduceddimension is a vital part of solving enormous problem and methane gas emissions. Moreover, crop diversificationdefined this issue as a “neglected topic” and “missing plays a multifunctional role in managing crop risk,pillar” of SD paradigm. Our result explicitly indicates that improving soil fertility and balancing between major cropsthe more significance of social aspects in promoting and minor crops, which promote environmentalfarming sustainability. The typical features of Bangladeshi sustainability as well as increase farming productivity andrice growers are partly described the fact. This includes yield stability.majority of the growers are smallholders; abject poverty;food insecurity; poor access to information, input, CONCLUSIONtechnology, market; ineffective and inadequate extensionservices, which are major barriers of getting better With the view to developing indicator the studyproduction. Moreover, our finding is consistent with the evaluated opinions of stakeholders prescribed by theresult of Anand and Sen and they reported World Bank Agenda 21. Based on the result, we conclude thatconsiders social sustainability as only a means of indicator generation by adopting participativeachieving ecological sustainability [56]. Besides these, multi-stakeholders involvement with literature reviewsPretty [57] defined sustainable agriculture, in fact, is a are collectively decisive to extract an essential and‘social learning’ approach rather than a precise set of representative set of indicators. Additionally, thetechnologies. Thus, the contribution of social indicators more significance of social indicators in strategy andin promoting farming sustainability is never less than policy formulation for sustainable farming is manifest.other pillars and is likely to be more. The number of social Our overall evaluations are: (i) indicator development is aindicators is almost double than other indicators that fairly demanding and challenging process; a blend withentail a clear indication of more significance of social expert knowledge and farmer’s experience enhances theaspects in fostering sustainable rice farming. Perhaps questions of its applicability and practicability, (ii)considering an insensitive perspective of poverty and addressing public aspects is a positive investment forresource constraints of rice growers, social aspects promoting ecological and economic sustainability and (iii)received more priorities than economic and ecological adjustment and agreement issues are needed to ponder indimensions in fostering sustainable farm. the indicator generation process. Besides, participant’s
In the context of changing climate, environmental selection should be geographically diverse to representissues are widely discussed in SD discourse. Maintaining the whole gamut of agricultural sustainability andsoil quality is the key to achieve ecological sustainability, Dhaka-based expert selection for survey is a limitation ofwhich largely depends on proper management of crop, our research. Future research on a holistic set offertilizer, pesticide and water. There is no agriculture indicators for the “quality of life” of rural farmers in thewithout water. However, direct and indirect environmental context of climate change would be a niche research topicimpacts of irrigation water are well documented [58]. on the journey to SD. This study develops aTherefore, efficient use of irrigation use is urgent. Several methodological framework for indicator generationstudies [59] substantiated that integrated pest, disease consisting of major episodes: establishing study context,and nutriment management is more proficient, effective informal discussion with academician, literature review,and ecologically sounds, for example, applying a mixed online expert survey and focus group discussion.
World Appl. Sci. J., 22 (5): 672-682, 2013
680
Moreover, we present elaborate and sufficient information 10. BARC (Bangladesh Agricultural Research Council),in order to make the methodology replicable for the futureresearch. Overall, the research finding provides asignificant input for assessment, monitoring andmanagement of sustainable rice farming, as well as clearcut recipes for evidence-based policy and strategyformulation.
ACKNOWLEDGEMENTS
We would like to extend our sincere gratitude to theall respondents of survey for their valuable time andinput. Financial support from Universiti Sains Malaysia,Penang, Malaysia is gratefully acknowledged.
REFERENCES
1. Roy, R. and N.W. Chan, 2012. An assessment ofagricultural sustainability indicators in Bangladesh:review and synthesis. Environmentalist, 32(1): 99-110.
2. Pintér, L., L. Bizikova, K. Kutics and A. Vari 2008.Developing a system of sustainability indicatorsfor the Lake Balaton Region. Tájökólogiai Lapok,6: 271-293.
3. Boyd, H. and A. Charles, 2006. Creating community-based indicators to monitor sustainability of localfisheries. Ocean & Coastal Management, 49: 237-258.
4. Capello, R. and P. Nijkamp, 2002. In search forsustainable human settlements. Ecol. Econ.,40: 151-159.
5. The Royal Society, 2009. Reaping the Benefits:Science and the Sustainable Intensification of GlobalAgriculture. London, UK.
6. BBS (Bangladesh Bureau of Statistics), 2009.Statistical Yearbook of Bangladesh. BangladeshBureau of Statistics, Dhaka, Bangladesh.
7. Heikens, A., 2006. Arsenic contamination of irrigationwater, soil and crops in Bangladesh: risk implicationfor sustainable agriculture and food safety in Asia.FAO Regional Office for Asia and the Pacific,Bangkok.
8. Shahid, S. and H. Behrawan, 2008. Drought riskassessment in the western part of Bangladesh,natural hazards. Journal of the International Societyfor the Prevention and Mitigation of Natural Hazards,46: 391-413.
9. Alauddin, M. and J. Quiggin, 2008. Agriculturalintensification, irrigation and the environment inSouth Asia: issues and policy options. Ecol Econ.,65(1): 111-124.
2011. Research priorities in Bangladesh agriculture,Final Draft. (eds) Hussain, G. and Iqbal, A. Farmgate,Dhaka, Bangladesh.
11. Carruthers, G. and G. Tinning, 2003. Where and how,do monitoring and sustainability indicators fit intoenvironmental management systems? Australian J.Experim. Agric., 43: 307-323.
12. Moldan, B. and A.L. Dahl, 2007. Challenges tosustainability indicators. In: Sustainability indicators-a scientific assessment (eds. T .Hák, B. Moldan andA.L. Dahl) Island Press, Washington.
13. Pintér, L., P. Hardi, A. Martinuzzi and J. Hall, 2012.Bellagio STAMP: principles for sustainabilityassessment and measurement. Ecological Indicators,17: 20-28.
14. Walter, C., 2005. Sustainability Assessment of LandUse Systems. PhD Dissertation. Institute ofVegetable and Fruit Science, Natural Sciences,University of Hanover, Germany.
15. Dougill, A.J., M. S. Reed, E.D.G. Fraser, K. Hubacek,C. Prell, S.T. Stagl, L.C. Stringer and J. Holden, 2006.Learning from doing participatory rural research:Lessons from the Peak District National Park. J.Agric. Econ., 57: 259-275.
16. Reed, M.S., E.D.G. Fraser, A.J. Dougill, 2006. Anadaptive learning process for developing andapplying sustainability indicators with localcommunities. Ecol Econ., 59: 406-418.
17. Fraser, E.D.G., A.J. Dougill, W. Mabee, M.S. Reedand P. Mc Alpine, 2006. Bottom up and top down:analysis of participatory processes for sustainabilityindicator identification as a pathway to communityempowerment and sustainable environmentalmanagement. J. Environ. Manage., 78: 114-127.
18. Freebairn, D.M. and C.A. King, 2003. Reflectionson collectively working toward sustainability:indicators for indicators! Australian J. Experim.Agric., 43: 223-238.
19. Bauler, T., I. Douglas, P. Daniels, V. Demkine,N. Eisenmenger, J. Grosskurth, T. Hák, L.Knippenberg, J. Martin, P. Mederly, R. Prescott-Allen, R. Scholes and J. Van Woerden 2007.Identifying methodological challenges. In:Sustainability indicators- a scientific assessment(eds. Hák, T., Moldan, B. and Dahl, A. L.). IslandPress, Washington
20. Folke, C., S. Carpenter, T. Elmqvist, L. Gunderson,C.S. Holling and B.H. Walker, 2002. Resilience andsustainable development: building adaptive capacityin a world of transformations. Ambio, 31: 437-440.

World Appl. Sci. J., 22 (5): 672-682, 2013
681
21. Yuan, W., P. James, K. Hodgson, S.M. Hutchinson 33. Hsu, C.C. and B.A. Sandford, 2007. The Delphiand S. Shi, 2003. Development of sustainability technique: making sense of consensus. Practicalindicators by communities in China: a case study of Assessment, Research and Evaluation, 12: 1-8.Chongming County. Shanghai. J. Environ Manage., 34. Chu, H.C. and G.J. Hwang, 2008. A Delphi-based68: 253-261. approach to developing expert systems with the
22. Bell, S. and S. Morse, 2004. Experiences with cooperation of multiple experts. Expert Systems withsustainability indicators and stakeholder Applications, 34: 2826-2840.participation: a case study relating to a ‘Blue Plan’ 35. Hugé, J., H.L.Trinh, P. H. Hai, J. Kuilman and L. Hens,project in Malta. Sustain. Dev., 12: 1-14. 2011. Sustainability indicators for clean development
23. Choi, H.S.C. and E. Sirakaya, 2006. Sustainability mechanism projects in Vietnam. Environ. Dev.indicators for managing community tourism, Tourism Sustain, 12: 561-571.Manage., 27: 1274-1289. 37. Parveen, S., 2010. Rice farmers’ knowledge about the
24. Reed, M.S., A.J. Dougill and T.R. Baker, 2008. effects of pesticides on environmental pollution inParticipatory indicator development: what can Bangladesh Bangladesh Res. Publ. J., 3: 1214-1227.ecologists and local communities learn from each 38. Sarkar, M.S.K., M.R. Hasan, M.A. Feardous,other? Ecol Appli., 18: 1253-1269. M.M.H. Shuhel and M. Moniruzzaman, 2010.
25. Robbani, M., S.U. Siddiquee, S. Zaman and Comparative economic analysis of borrower andH. Nakamura, 2007. Agriculture in Bangladesh- recent non-borrower Boro rice farmers in some selected sitestrend and agro environment towards sustainability. of Mymensingh district. Bangladesh J. Agric. Res.,Journal of the faculty of Agriculture Shishu 35: 65-76.University, 43(1-2): 17-25. 39. World Bank, 2010. Bangladesh: priorities for
26. Chowdhury, M.T., 2009. Sustainability of accelerated agriculture and rural development. Washington DC,rice production in Bangladesh: technological issues USA. Available at://go.worldbank.org/770VR4DIU0.and the environment. Bangladesh J. Agric. Res., 40. Asaduzzaman, M., 2009. Getting agriculture moving34(3): 523-529. once again: strategic options for post-HYV
27. Jahiruddin, M. and S.A. Satter, 2010. agriculture in Bangladesh, UK Department forAgricultural research priority: Vision-2030 and International Development, Dhaka.beyond, sub-sector: land and soil resource 41. Ahmed, M.I., M.I. Chowdhury and N.A.M. Raju,management, final report, BARC. Farmgate, Dhaka. 2009. Agriculture subsidies: Govt. pledges vs. IFIs’
28. Meharg, A.A. and M.M. Rahman, 2003. Arsenic aversion, Bangladesh Working Group oncontamination of Bangladesh paddy field soils: International Financial Institutions and Tradeimplications for rice contribution to arsenic Organisations. IFI Watch Bangladesh and Unnayanconsumption. Environ. Sci. Techno., 37: 229-34. Onneshan, 1: 1-4.
29. Rahman, S. and M. Rahman 2008. Impact of land 42. Rashid, M.H. and M.S. Islam, 2009. Strategicfragmentation and resource ownership on approach to the improvement of agriculturalproductivity and efficiency: the case of rice productivity towards food security in Bangladesh,producers in Bangladesh. Land Use Policy, Country report: Bangladesh, 4 session of the26: 95-103. Technical Committee of APCAEM 10-12 February,
30. Action Aid, 2011. On the brink: who’s best Chiang Rai, Thailand.prepared for a climate and hunger crisis? 43. Rahman, S., 2009a. Whether crop diversification is aJohannesburg, South Africa. Available at: desired strategy for agricultural growth inwww.actionaid.org. Bangladesh. Food Policy, 34: 340-339.
31. Hauck, Y., R.G. Kelly and J. Fenwick, 2007. 44. Rahman, S., 2009b. Resource use efficiency underResearch priorities for parenting and child health: self-selectivity: the case of Bangladesh ricea Delphi Study. Journal of Advanced Nursing, producers. Australian J. Agric. Resour Econ.,59: 129-139. 55: 273-290.
32. Brill, J., M. Bishop and A. Walker, 2006. The 45. Hassanullah, M. (eds Stigter, K.), 2008. Rescuingcompetencies and characteristics required of an endangered agriculture: the case of Bangladesh,effective project manager: a web-based Delphi study. paper was presented at the Asian Pacific NetworkEducational Technology Research and Development, (APN) Review and Planning Workshop in Dhaka,54(2): 115-40. Bangladesh.
th

World Appl. Sci. J., 22 (5): 672-682, 2013
682
46. Robinson, E.J.Z., S.R. Das and T.B.C. Chancellor, 52. Rasul, G. and G.B. Thapa, 2004. Sustainability of2007. Motivations behind farmers’ pesticide use in ecological and conventional agricultural systems inBangladesh rice farming. Agric. Human Values, Bangladesh: an assessment based on environmental,24: 323-332. economic and social perspectives. Agric. Syst.,
47. MoA (Ministry of Agriculture), 2006. Transformation 79: 327-351.of agriculture for sustainable development and 53. Krueger, A.R., 2002. Designing and conducting focuspoverty alleviation in Bangladesh: actionable policies group interviews. University of Minnesota, USA.and programmes, MoA, GoB. Dhaka. 54. Bloor, M., J. Frankland, M. Thomas and K. Robson,
48. Dasgupta, S., C. Meisner and M. Huq, 2005. 2001. Focus groups in social research (1 Edi).Health effects and pesticide perception as SAGE Publications, London.determinants of pesticide use: evidence from 55. Gafsi, M. and J.L. Favreau 2010. Appropriate methodBangladesh, World Bank Policy Research Working to assess the sustainability of organic farmingPaper 3776, Development Research Group, World Systems. 9 European IFSA Symposium, 4-7 July,Bank. Vienna, Austria.
49. Hassan, A.S.M.R. and K. Bakshi, 2005. Pest 56. Anand, S. and A. Sen, 2000. Human developmentmanagement, productivity and environment: a and economic sustainability. World Development,comparative study of IPM and conventional farmers 28(12): 2029-2049.of Northern Districts of Bangladesh. Pakistan J. Soc. 57. Pretty, J., 2009. Can ecological agriculture feed nineSci., 3: 1007-1014. billion people? Monthly Review, November.
50. Dasgupta, S.C. Meisner and D. Wheeler, 2004. 58. Khan, S., R. Tariq, C. Yuanlai, J. Blackwell, 2006.Is Environmentally-friendly agriculture less profitable Can irrigation be sustainable? Agric Water Manage.,for farmers? Evidence on integrated pest management 80(1-3): 87-99.in Bangladesh, World Bank Policy Research Working 59. FAO, 2010. “Climate-smart” agriculture: policies,Paper 3417. Development Research Group, World practices and financing for food security, adaptationBank and mitigation. FAO, Rome, Italy, pp: 1-49.
51. ADB, 2004. Country environmental analysisBangladesh, 3 Draft, pp: 1-79.rd
st
th