
T2.2. Stakeholder Requirements - TwinERGY
120
Stakeholders analysis: KPIs, Scenarios and Use Case definition D2.2 June 2021 Ref. Ares(2021)4519184 - 12/07/2021
-
Upload
khangminh22 -
Category
Documents
-
view
1 -
download
0
Transcript of T2.2. Stakeholder Requirements - TwinERGY

Stakeholders analysis:
KPIs, Scenarios and Use
Case definition
D2.2
June 2021
Ref. Ares(2021)4519184 - 12/07/2021

1
Deliverable
PROJECT ACRONYM GRANT AGREEMENT # PROJECT TITLE
TWINERGY 957736 Intelligent interconnection of prosumers in
positive energy communities with twins of
things for digital energy markets
DELIVERABLE REFERENCE NUMBER AND TITLE
D2.2
Stakeholders analysis: KPIs, Scenarios and Use Case
definition
Revision: <v1.0>
AUTHORS
Diego Costa Pinto Frederico Cruz-Jesus Tiago Oliveira
UNL UNL UNL
Funded by the Horizon 2020 programme of the European Union
Grant Agreement No 957736
DISSEMINATION LEVEL
✔ P Public
C Confidential, only for members of the consortium and the Commission Services

2
Version History
REVISION DATE AUTHOR ORG… DESCRIPTION
v0.1 25.01.2021 UNL Team UNL First Draft of Report
v0.2 31.03.2021 UNL Team, with the
help of ETRA
UNL/
ETRA
Detailed Revision of the Use Cases, following
Task 4.4 requirements
v0.3 30.04.2021 UNL Team UNL Inclusion of Interviews
v0.4 07.05.2021 UNL Team UNL Revision of Use Cases
v0.5 14.05.2021 UNL Team UNL Final draft for the revision of WP Leader and
Consortium Team
v0.6 14.06.2021 UNL Team UNL/
ETRA
Final revision of Use Cases
v0.7 15.06.2021 UNL Team UNL/
WEC/ED
Consolidated version after revision from WP
Leader and Assigned Reviewers at Consortium
Team (WEC/ED)

3
v0.8 18.06.2021 UNL Team UNL Copy-editor revision
v0.9 21.06.2021 UNL Team UNL/
UoP
Final revision from UoP
v0.10 29.06.2021 UNL Team UNL Final version submitted to the consortium
leader for the European Commission
v1.0 30.06.2021 UNL Team UNL Draft submitted to EC by the PC
Statement of Originality
This deliverable contains original, unpublished work except where clearly
indicated otherwise. Acknowledgment of previously published material and of the
work of others has been made through appropriate citation, quotation, or both.

4
Legal Disclaimer The information in this document is provided “as is”, and no guarantee or warranty is given
that the information is fit for any particular purpose. The above referenced authors shall have
no liability for damages of any kind including without limitation direct, special, indirect, or
consequential damages that may result from the use of these materials subject to any liability
which is mandatory due to applicable law. The sole responsibility for the content of this
publication lies with the authors. It does not necessarily reflect the opinion of the European
Union. Neither the INEA nor the European Commission is responsible for any use that may be
made of the information contained therein.
© 2021 by TwinERGY Consortium

5
Executive Summary The purpose of this document is to provide an overview of the stakeholders' requirements
analysis of TwinERGY, a project funded by the HORIZON 2020 Programme of the European
Commission under the Grant Agreement No. 957736. This report comprises the requirements
and KPIs of stakeholders in diverse environments of the TwinERGY project and presents a
strategy for the implementation of best practices to ensure the maximization of consumer
engagement in a revamped energy market. Use Cases (UCs) and scenarios have been
developed as part of this task, translating high-level policy goals of the EU into tangible and
measurable impacts to stakeholders. Thereby, this report acts as a foundation for the whole
project, and especially the pilot studies in WP9, ensuring that stakeholders' needs, and
requirements are taken into account and drive decisions for the TwinERGY Project.
A fundamental project objective is to examine new ideas and explore model scenarios in real-
time, so as to improve demand response without affecting physical processes or interrupting
the daily schedules and operations of consumers. The stakeholders need to be involved in
every step of the process, and that is why it is paramount to first determine who they are, and
what key performance indicators (KPIs) are to be analyzed and measured.
Task objective
The scope of the task T2.2 – “Stakeholders Requirements” is to identify the requirements of
stakeholders in diverse environments and develop a strategy on how to implement different
best practices according to the special characteristics of the areas of interest in order to achieve
the maximization of consumer engagement in an energy market with high penetration of
Renewable Energy Systems (RES), Demand Response programs, energy storage and electric
vehicles (EVs). This task involves the Use Cases (UCs) and scenario development as well as the
methodical decomposition of high-level requirements to specific Tasks, in order to identify
and analyze underlying risks. The results derived from this analysis will form the foundation
upon which the pilot demonstrations will be implemented in WP9. In order to evaluate the
results of the solutions proposed and implemented within TwinERGY, it is necessary to quantify
the tangible and measurable impacts which contribute to specific EU policy goals. To this end,
meaningful, understandable, and quantifiable KPIs will be established and followed according
to the identified needs of the UCs.

6
Approach
The stakeholder requirements analysis is based on a thorough literature review of related
studies, as well as insights from stakeholders through a focus group whereby Use Cases and
scenarios were developed. The respective Use Cases and scenarios were reviewed in interviews
with support partners, experts, and consumers. Based on this qualitative research approach,
the high-level policy goals were transformed into more easily understandable and quantifiable
KPIs, which directly contribute to the EU policy related to the TwinERGY project. The following
Figure 1 illustrates an overview of all steps covered within this task (see section 1.2 for
methods):
Figure 1: Stakeholders Requirements Analysis in D2.2
The specific methods applied in all these points are discussed in section 1.2.

7
List of abbreviations ARERA Italian Regulatory Authority for Energy, Networks, And Environment
DERs Distributed Energy Resources
DNO Distribution Network Operator
DSM Demand-Side Management
DSOs Distribution System Operators
ESCOs Energy Service Companies
EVs Electric Vehicles
HARB Hypergraph-Based Adaptive Consortium Blockchain Framework
ISO Independent System Operator
JRC European Commission's Joint Research Center
KPIs Key Performance Indicators
LECs Local Energy Communities
LEM Local Energy Market
LV Low-Voltage
MV Medium-Voltage
Ofgem Office Of Gas and Electricity Markets
PPB Private Permissioned Blockchain
PUCs Primary Use Cases
RAE Regulatory Authority for Energy
RES Renewable Energy Systems
SUCs Secondary Use Cases
TE Transactive Energy
TEM Transactive Energy Module
TSOs Transmission System Operators
UCs Use Cases
V2G Vehicle-To-Grid
VPP Virtual Power Plant Operator

8
Index Version History ......................................................................................................................... 2
Legal Disclaimer ....................................................................................................................... 4
Executive Summary .................................................................................................................. 5
Task objective ........................................................................................................................................................ 5
Approach ................................................................................................................................................................. 6
List of abbreviations ................................................................................................................ 7
Index .......................................................................................................................................... 8
List of Tables ........................................................................................................................... 13
List of Figures .......................................................................................................................... 14
1/ Stakeholder Analysis ......................................................................................................... 15
1.1 Background ................................................................................................................... 15
1.2 Method .......................................................................................................................... 15
1.2.1 IDENTIFICATION AND CLASSIFICATION OF STAKEHOLDERS .......................................... 16
1.2.2 ANALYSIS OF STAKEHOLDERS ...................................................................................................... 16
1.2.3 STAKEHOLDER REQUIREMENTS (KPI ORGANIZATION) ...................................................... 18
1.2.4 STAKEHOLDER – KPI MATRIX ........................................................................................................ 18
1.2.5 STAKEHOLDER MAPPING ............................................................................................................... 19
2/ TwinERGY Stakeholders Identification ............................................................................ 21
2.1 End Users ................................................................................................................... 22
2.1.1 RESIDENTIAL CONSUMERS ............................................................................................................ 22
2.1.2 COMMERCIAL USERS ....................................................................................................................... 23
2.1.3 INDUSTRIAL CONSUMERS ............................................................................................................. 23
2.1.4 DISTRIBUTED ENERGY RESOURCES (DERs) .............................................................................. 24
2.1.5 RELEVANT KPIs FOR END USERS ................................................................................................. 25

9
2.2 Energy System Operators ............................................................................................ 25
2.2.1 TRANSMISSION SYSTEM OPERATORS (TSOs) ........................................................................ 25
2.2.2 DISTRIBUTION SYSTEM OPERATORS (DSOs) .......................................................................... 25
2.2.3 RELEVANT KPIs FOR ENERGY SYSTEM OPERATORS ............................................................ 26
2.3 Authorities ..................................................................................................................... 26
2.3.1 POLICY-MAKERS ................................................................................................................................. 26
2.3.2 REGULATORS ....................................................................................................................................... 27
2.3.3 RELEVANT KPIS FOR AUTHORITIES ............................................................................................. 28
2.4 Retail and Energy Services ........................................................................................... 28
2.4.1 AGGREGATORS (RETAILERS AND LOCAL ENERGY COMMUNITIES (LECs)) ................. 28
2.4.2 ENERGY SERVICE COMPANIES (ESCOs) .................................................................................... 29
2.4.3 RELEVANT KPIs FOR RETAIL AND ENERGY SERVICES .......................................................... 29
2.5 Benefits and barriers of energy-saving programs adoption by stakeholder ......... 30
3/ Key Performance Indicator (KPI) Organization .............................................................. 32
3.1 Main KPIs ................................................................................................................... 32
4/ Description of Use Cases ................................................................................................... 34
4.1 Use Case 1 ...................................................................................................................... 34
Scope and Objectives .................................................................................................................................. 34
Narrative of the Use Case .......................................................................................................................... 36
4.2 Use Case 2 ...................................................................................................................... 37
Scope and Objectives .................................................................................................................................. 38
Narrative of the Use Case .......................................................................................................................... 38
4.3 Use Case 3 ...................................................................................................................... 39
Scope and Objectives .................................................................................................................................. 40
Narrative of the Use Case .......................................................................................................................... 41

10
4.4 Use Case 4 ...................................................................................................................... 43
Scope and Objectives .................................................................................................................................. 43
Narrative of the Use Case .......................................................................................................................... 46
4.5 Use Case 5 ...................................................................................................................... 48
Scope and Objectives .................................................................................................................................. 48
Narrative of the Use Case .......................................................................................................................... 52
4.6 Use Case 6 ...................................................................................................................... 54
Scope and Objectives .................................................................................................................................. 55
Narrative of the Use Case .......................................................................................................................... 56
4.7 Use Case 7 ...................................................................................................................... 57
Scope and Objectives .................................................................................................................................. 57
Narrative of the Use Case .......................................................................................................................... 59
4.8 Use Case 8 ...................................................................................................................... 60
Scope and Objectives .................................................................................................................................. 60
Narrative of the Use Case .......................................................................................................................... 62
4.9 Use Case 9 ...................................................................................................................... 63
Scope and Objectives .................................................................................................................................. 63
Narrative of the Use Case .......................................................................................................................... 64
5/ KPIs of Use Cases ............................................................................................................... 65
UC01 – Home Energy Management ...................................................................................................... 66
UC02 – RES Generation in domestic and tertiary buildings ......................................................... 66
UC03 – Grid capacity enhancement utilizing e-mobility ............................................................... 66
UC04 – Prosumers empowerment in local energy trading markets ......................................... 67
UC05 – Enhance grid flexibility through DER Management ......................................................... 67

11
UC06 – Consumers engagement in Demand Side Management Programs utilizing
feedback mechanisms ................................................................................................................................. 67
UC07 – Consumer's engagement in demand response programs utilizing a socio-
economic context ......................................................................................................................................... 68
UC08 – Consumer's engagement in demand response programs utilizing personalized
comfort/health-oriented services ........................................................................................................... 68
UC09 – Consumer's engagement in demand response programs utilizing digital twins'
prediction capabilities for dynamic VVPs ............................................................................................ 68
5.1 KPIs of Pilot Studies ................................................................................................. 69
Pilot Demonstration in Bristol, UK .......................................................................................................... 69
Pilot Demonstration in Hagedorn in Hagedorn Village, Steinheim, North Rhine-
Westphalia, Germany .................................................................................................................................. 69
Pilot Demonstration in Benetutti Smart Community, Italy............................................................ 70
Pilot Demonstration in Athens, Greece ................................................................................................ 70
5.2 KPI Summary ............................................................................................................. 71
5.3 KPI – Stakeholder Matrix ......................................................................................... 75
6/ Stakeholder Mapping ........................................................................................................ 78
7/ Interviews ........................................................................................................................... 80
7.1 Interviews with stakeholders ....................................................................................... 80
Research Procedures ................................................................................................................................... 80
Consumer engagement: motivations .................................................................................................... 81
Barriers to achieve higher usage of renewable energy .................................................................. 83
Generating renewable energy: The prosumer, drivers, and motivations................................. 84
7.2 Interviews with consumers .......................................................................................... 87
Research Procedures ................................................................................................................................... 87
Energy Consumption Monitoring ........................................................................................................... 88

12
Motivations to reduce energy consumption ...................................................................................... 91
Barriers to reducing energy consumption .......................................................................................... 93
Achieving sustainable energy use and generating energy at home: Attitudes to become a
prosumer .......................................................................................................................................................... 95
Motivations to buying green energy..................................................................................................... 99
Barriers to buy green energy .................................................................................................................. 102
The future of green electricity in Europe and the Planet............................................................. 104
Increasing consumer engagement in demand response programs ....................................... 107
7.3 Concluding Remarks .................................................................................................. 110
References ............................................................................................................................ 113

13
List of Tables Table 1: Literature review of Mapping dimensions .................................................................................. 17
Table 2: National regulatory authorities ....................................................................................................... 28
Table 3: Benefits and Barriers of energy-saving programs adoption by stakeholders ............... 30
Table 4: Main KPIs ................................................................................................................................................. 32
Table 5: Use Cases ................................................................................................................................................ 65
Table 6: KPIs of Use Cases and Pilot studies ............................................................................................... 72
Table 7: KPI Summary .......................................................................................................................................... 76
Table 8: Stakeholders' interviews details ...................................................................................................... 81
Table 9 Consumers’ characterization ............................................................................................................. 87

14
List of Figures Figure 1: Stakeholders Requirements Analysis in D2.2 .............................................................................. 6
Figure 2: The Five-step Approach ................................................................................................................... 15
Figure 3: Stakeholder Involvement matrix ................................................................................................... 18
Figure 4: Power - Interest - Attitude Venn diagram ................................................................................ 19
Figure 5: Stakeholder identification ............................................................................................................... 22
Figure 6: Co-occurrence network with keywords plus ............................................................................ 78
Figure 7: Main information about the dataset ........................................................................................... 79

15
1/ Stakeholder Analysis
1.1 Background
The term "stakeholder" was most prominently defined by Freeman (1984) as "those who affect
or are affected by a decision or action" in the context of project management. Literature on
project management thereby recognises that stakeholders are important for the success of
any project because of their 1) possible contributions, 2) assessment of project success, 3)
possible resistance causing risks and hinder project success, and 4) positive and negative
effects on it (Eskerod, Huemann & Savage, 2015). Due to the importance of considering
stakeholders throughout the project, a thorough stakeholder analysis must first be conducted.
This analysis serves to determine who is affected by the innovations of the TwinERGY project
or could influence the outcomes of the project one way or another. Stakeholders can be
individuals or organizations, and the goal behind a stakeholders' analysis is mainly to uncover
their interests and intentions and define what will impact the project's implementation
(Varvasovszky, 2000). Moreover, the analysis aims to create synergies among different
stakeholders and take proactive measures to resolve potential friction and ensure the project's
success.
1.2 Method
The following graphic (Figure 2) illustrates the five-step approach that the current analysis will
follow to identify the TwinERGY project's requirements. This approach was developed based
on reviews of stakeholder analysis recorded in the literature, which was adapted to match the
deliveries of this work package.
Figure 2: The Five-step Approach

16
The specific methods adopted throughout these five steps will be presented in the subsequent
sections. Moreover, as displayed in Figure 2, the interviews that were conducted delivered
insights to the majority of the steps to enrich the research of literature and past projects with
insights from primary sources.
It should be noted that this task 2.2 – “Stakeholder Requirements” is focused on the first,
descriptive part of the stakeholder analysis. However, the TwinERGY project will go beyond
these descriptive methods adapting a normative approach by actively involving stakeholders
at later stages of the project (namely in; T4.2, T5.4, T6.1, and throughout WP9).
1.2.1 IDENTIFICATION AND CLASSIFICATION OF STAKEHOLDERS
First, a preliminary list of stakeholders involved in the TwinERGY project was identified to
understand the current situation. Reed et al. (2009) noted that while this is often done on an
ad-hoc basis, the stakeholder identification should be developed through a systematic process
to avoid disregarding any potentially important stakeholder and ensure that the selected
group provides statistically unbiased analysis. Therefore, initially, a thorough review of
secondary sources such as published documents, reports, and policy statements referring to
the different stakeholders within the energy sector and similar projects was conducted.
The classification of stakeholders was structured into four broad groups of stakeholders,
namely: End Users, System Operators, Authorities, and Retail & Energy Services. These categories
were defined based on an analysis of previous reports and projects regarding the energy sector
that fall under the Horizon 2020 umbrella.
1.2.2 ANALYSIS OF STAKEHOLDERS
In order to get a thorough analysis of the positions and behavior of the different stakeholders
towards the TwinERGY implementation, the four stakeholder groups and relevant distinct sub-
groups were analyzed based on prior literature on the energy sector and outcomes of similar
projects. As a result of this analysis, an introduction of the broad stakeholder groups is
provided. Moreover, past research on similar initiatives and projects was reviewed to identify
stakeholder groups benefits and barriers associated with implementing the TwinERGY Project.
Afterwards, these findings were enriched through a collection of information from primary
sources through semi-structured interviews and focus groups with representatives of
stakeholder groups, in which were included stakeholders from various regions, nominated by
project partners. These qualitative methods provided first-hand in-depth insights to better
understand the various and distinctive requirements of the diverse stakeholder groups.

17
Moreover, the interviews and focus groups and the stakeholder types were analyzed based on
different mapping dimensions. Table 1 summarizes the most used dimensions recommended
for stakeholder analyzes in prior literature.
Table 1: Literature review of Mapping dimensions
Mapping Dimensions Authors
Power/Influence dominance – Legitimacy – Responsibility Fassin (2009)
Value Hierarchies & Key Performance Areas Fletcher et al. (2003)
Power – Interest Mendelow (1991), Kamann (2007)
Power – Legitimacy – Urgency Mitchell et al. (1997)
Power – Interest – Attitude Murray-Webster & Simon (2006)
Potential Threat vs. Potential Cooperation Savage et al. (1991)
Based on this literature analysis, as well as a thorough review of similar projects, these mapping
dimensions were compared to one-another, so as to choose the best fit for the TwinERGY
project. In order to get a complete inquiry of the stakeholders, a three-dimensional
stakeholder mapping strategy was favoured. Out of these, Mitchell et al., (1997) and Murray-
Webster & Simon (2006) strategies, were the most commonly adapted in past projects.
However, while Mitchell et al., (1997) are more focused on organizational stakeholders,
Murray-Webster & Simon (2006) mapping was developed specifically for the management of
projects with change initiatives. Due to this fact and the corresponding nature of the TwinERGY
project of initiating change in the energy market, Murray-Webster and Simon's (2006)
proposed stakeholder analyzes framework along the dimensions of Power – Interest – Attitude
grid was chosen. The three-dimensional framework for stakeholder mapping is based on the
following dimensions:
1. Power – this dimension represents the stakeholders’ capability to influence the
TwinERGY project outcomes. This influence may be impacted by their positional or
resource power in the energy industry or their expertise and credibility in the subject
matter. This dimension is measured qualitatively, being either present/powerful or
absent/ insignificant.
2. Interest – this dimension is related to the implementation of the TwinERGY project. It
measures the stakeholders' involvement in the project, either active or passive (Murray-
Webster & Simon, 2006). Also, their motivation, needs, and strategies concerning the
project are considered. Interest is qualitatively assessed and can only be yes/active or
no/passive. It must be noted that interest is not the same as support; it may also be
defined as adverse interest. Thus, the attitude dimension is necessary to assess the
stakeholders' about the project.

18
3. Attitude – this dimension focuses on the effects that the implementation of it may
have on their existing business model or the nature of the stakeholder. It is measured
by the extent to which they "back" (support) or "block" (resist) the project (Murray-
Webster & Simon, 2006)
It should be noted that the assessment of all these dimensions is subjective and thus
dependent on the person scoring them. Moreover, they are all assessed qualitatively, and
scores might evolve over time.
1.2.3 STAKEHOLDER REQUIREMENTS (KPI ORGANIZATION)
One of the main targets of this task is to develop meaningful, understandable and quantifiable
Key Performance Indicators (KPIs). To achieve this objective, first, the TwinERGY proposal was
thoroughly analyzed in order to attain the most relevant KPIs for stakeholders, Use Cases (UCs),
and the pilot demonstrations. The analysis resulted in a comprehensive list of KPIs and sub-
KPIs. The conduction of interviews with focus groups aimed to verify these findings by utilizing
inputs from primary sources.
1.2.4 STAKEHOLDER – KPI MATRIX
As an overview of the relevance of each stakeholder group for the success of all of the KPIs, a
Stakeholder – KPI Matrix was developed taking into account the preceding summary of KPIs.
The involvement of each stakeholder group, for each of the sub-KPIs, was scored based on the
following matrix (Figure 3), which had been adapted based on the work of Newcombe (2003).
Figure 3: Stakeholder Involvement matrix
This two-dimensional matrix allows the stakeholders categorization based on their Power and
Attention to each specific KPI. According to the resulting classification, their involvement in the
success of that KPI is analyzed.

19
1.2.5 STAKEHOLDER MAPPING
Based on the preceding analysis of the stakeholders throughout the three dimensions (Power-
Interest-Attitude) different combinations of scores, so-called typologies arose. In this section,
the stakeholders typologies are presented on Figure 4 “Power – Interest – Attitude Venn
diagram”. This provides important insights on the importance of the stakeholders for a
successful implementation of the TwinERGY project. Thus, these findings should be used on
the future as a reference when engaging stakeholders.
Figure 4: Power - Interest - Attitude Venn diagram
1. High Power Stakeholders – powerful, passive, blocking. This is a significant
group of stakeholders that must be understood and considered in order not to hinder
the project implementation.
2. High Interest Stakeholders – insignificant, active, blocking. These should be
considered and engaged and then can be marginalized.
3. Positive Attitude Stakeholders – insignificant, passive, backing. This
stakeholder group should be kept informed about the project and communicated with,
but they are not a priority.
4. High Power & High Interest Stakeholders – significant, active, blocking. Need
to be engaged to disengage; the TwinERGY project team should be aware of their
actions since they might be dangerous.
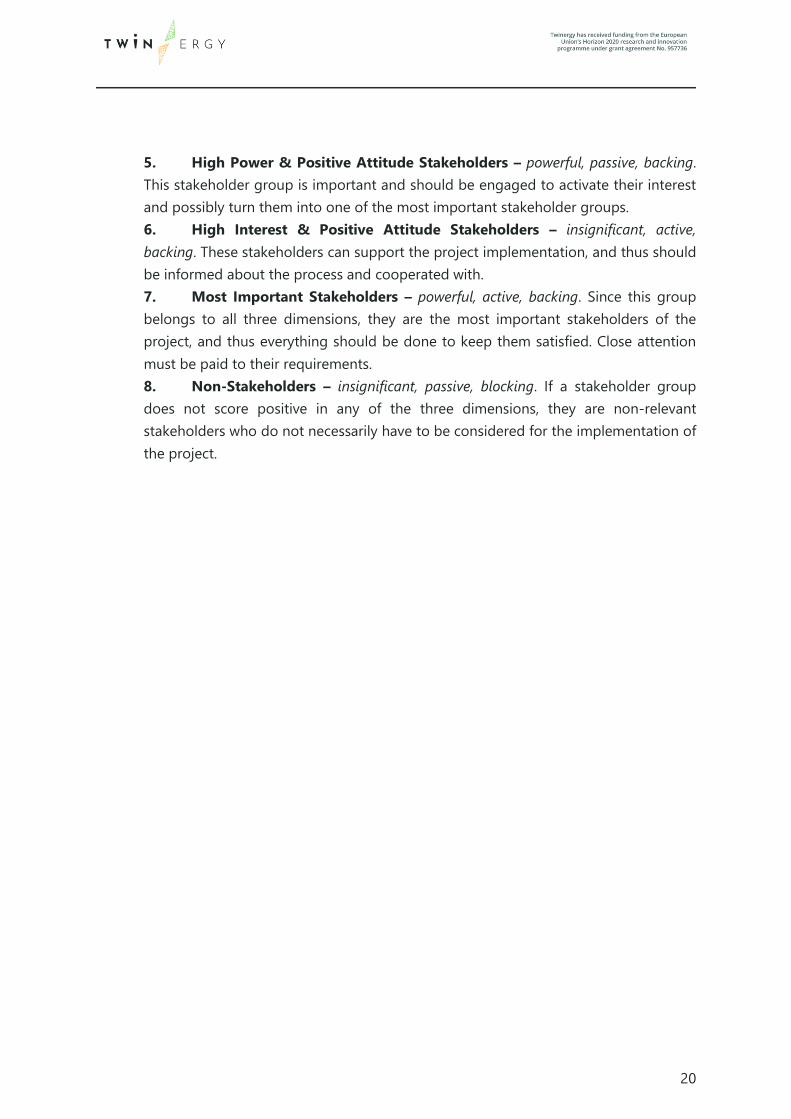
20
5. High Power & Positive Attitude Stakeholders – powerful, passive, backing.
This stakeholder group is important and should be engaged to activate their interest
and possibly turn them into one of the most important stakeholder groups.
6. High Interest & Positive Attitude Stakeholders – insignificant, active,
backing. These stakeholders can support the project implementation, and thus should
be informed about the process and cooperated with.
7. Most Important Stakeholders – powerful, active, backing. Since this group
belongs to all three dimensions, they are the most important stakeholders of the
project, and thus everything should be done to keep them satisfied. Close attention
must be paid to their requirements.
8. Non-Stakeholders – insignificant, passive, blocking. If a stakeholder group
does not score positive in any of the three dimensions, they are non-relevant
stakeholders who do not necessarily have to be considered for the implementation of
the project.

21
2/ TwinERGY Stakeholders
Identification In this project, four broad groups of stakeholders of the TwinERGY project are considered
(Figure 5), namely:
1. End Users
• Residential consumers (prosumers)
• Commercial users
• Industrial users
• Distributed energy resources (DERs)
2. System Operators
• Distribution system operators (DSOs)
• Transmission system operators (TSOs)
3. Authorities
• Policy-makers
• Regulators
4. Retail and Energy Services
• Aggregators (retailers and local energy communities (LECs))
• Energy service companies (ESCOs) (not-for-profit and for-profit)

22
Figure 5: Stakeholder identification
Each of these stakeholder groups is introduced in the following pages, and their KPIs
concerning the TwinERGY project are presented.
2.1 End Users
2.1.1 RESIDENTIAL CONSUMERS
Residential consumers play a significant role in total power consumption, with a demand
profile that dramatically relies on climatic conditions (Patel, Srinivasan, & Srinivasan, 2016).
Residential buildings comprise a considerable source of flexible energy demand and storage,
potentially providing distribution and transmission system operators with the needed services
to balance demand and supply and manage power quality.
The term prosumer is used for those who both produce and consume electricity. Prosumers
can sell any surplus generated by DERs back to the main grid, thus increasing their share of
renewable generation (EPRS, 2020). In the present report, the term "prosumer" is used mainly
to refer to residential consumers. As stated in the proposal, "TwinERGY will define new business
models, respective rules, standardized contracts and technological tools to enable energy
retailers and local energy communities to undertake the aggregator role and bid the huge

23
flexibility potential of their prosumers/members (mainly residential prosumers) in energy
markets".
When DERs connect to the electricity grid, the relationship between the customer and the
energy market changes as it becomes more interactive. A study by CE Delft (2016) estimates
that 83 % of EU households could become prosumers by 2050. Demand-side management
(DSM) schemes can motivate prosumers to refine their energy behaviors by offering them
various incentives.
Neves et al. (2020) distinguished consumers and prosumers in their research and developed
energy demand profiles that are considered representative profiles of a relevant diversity of
family typology, economic and power purchase types of clients within the Portuguese context.
The consumer types include working couples without children, working couples with two small
children, and working couples with young/adult children.
2.1.2 COMMERCIAL USERS
Within the commercial sector, office buildings and retail structures represent the biggest
consumers of energy (Pérez-Lombard, Ortiz & Pout, 2008). Schleich (2009) predicted that
commercial buildings have the highest relative potential for energy-savings of 30% through
measures such as energy management systems or financing packages that help overcome the
barriers to energy efficiency. Recent studies show that commercial users account for half of
the peak energy demand (Crosbie, 2016). The International Energy Agency states that "by
2050, the global inventory of flexible assets in the residential, commercial and industrial sectors
needs to be ten times higher than it is today" (IEA, 2020).
2.1.3 INDUSTRIAL CONSUMERS
With about 54% of the world's total energy consumption, the industrial sector represents the
biggest consumer of energy (EIA, 2016). However, between 2005 and 2017, the European rate
of industrial consumption annually dropped at an average rate of 1,3, to 25% of the total
energy consumption in 2017 (EEA, 2020). This downward trend has been attributed to the shift
towards less-energy-intensive manufacturing industries and the continuing transition to a
more service-oriented European economy. However, since 2016, the continuous growth of the
EU economy has offset the previous energy-savings, and the final energy use of the industrial
sector increased again. Moreover, EU policies such as the Emission Trading System between
the industrial and energy production sector have helped drive emissions reduction cost-
effectively, with covered emissions decreasing by about 35% between 2005 and 2019 (EU ETS,
2020).

24
When it comes to the business models within the industrial segment, one can differentiate
between frontrunners which are large companies, where the cost of electricity represents a
large share of their production cost and laggards which are smaller companies to whom their
consumption of energy plays a relatively minor role. In the past, frontrunners have already
adapted to innovations in the energy industry to minimize their energy costs. Laggards,
however, see a greater risk related to investments into efficiency gains due to their relatively
small energy costs, limited investment budget, and lack of expertise in the matter. The
diverging approaches between these two main segments create a vicious dynamic and gap
between them, which may lead to the perception that laggards are disregarded in the energy
market advancements (InteGrid, 2020).
2.1.4 DISTRIBUTED ENERGY RESOURCES (DERs)
Distributed energy resources (DERs) are small assets with technologies that produce, store and
manage energy. Examples include solar panels, small wind turbines, electric vehicles, and
microgrids. Greater use of DERs could improve resource efficiency, increase energy system
resilience, and give individuals and communities a stronger role in decarbonization. As such,
it appears to fit well with the European Green Deal and EU plans for secure, affordable, and
clean energy. However, the growth of DERs will disrupt traditional electricity markets and,
without proper regulation, their benefits may not be felt equally across society (EPRS, 2020).
Natale and colleagues (2020) developed a methodology to estimate the market potential of
DERs connected to a distribution network. The proposed approach can be summarized in the
following steps:
1. Limit the area of interest that can be one distribution network only, or a group
of networks operated by the same DSO, or even an entire territory or region (e.g., a
region or a market zone);
2. Consider or estimate the expected profiles of demand and production at
the PCC at the TSO/DSO interfaces for the area of interest. The expected profiles can
arise from historical data or can be forecasted. The consumption curves of passive
customers not involved in the service market are also considered. From this
perspective, the TSO sees each distribution system at the interface similar to a
generator with a four-quadrant capability curve that may import or export energy
(reversal flow) from/to the bulk grid;
3. For the DERs involved in offering flexible products, hypothesize participation
profiles in terms of pairs of price/quantity;
4. Model the distribution network in terms of topology, lines, conductors.
This step is not necessary for the simulation of the first phase of the extended
centralized dispatching model that does not consider the distribution network

25
operation. This task can be performed according to the procedure described by the
researchers Pisano et al. (2019);
5. Assess the quantity that can be offered in the three market models by
calculating the effective four-quadrants capability curve of the equivalent generator
modeled at step 2.
DERs have given rise to collaborative communities that manage their energy production and
consumption load through Peer-to-Peer Decentralised Energy Trading (P2P DET). Karumba
and colleagues (2020) propose a Hypergraph-based Adaptive consortium Blockchain
framework (HARB), which coordinates DERs through high-order relationships rather than P2P
pairwise relationships. HARB is presented in three-layered network architecture to address
challenges such as distributed trust in collaborative communities.
2.1.5 RELEVANT KPIs FOR END USERS
• Average energy-savings achieved through Demand Response: 20-25%
• Average Cost Savings through DR: 25-27%
• Reduction of peak demand at levels above 50%
• Regulated comfort and health in built environments at levels above 85%
• End-User acceptance of TwinERGY interventions above 95%
• Prosumer monetary benefits from day one of TwinERGY solution deployment,
estimated at €60-80 annually for a typical household, in the form of new revenues.
2.2 Energy System Operators
2.2.1 TRANSMISSION SYSTEM OPERATORS (TSOs)
TSOs are responsible for energy transportation on a national or regional level and as such are
a crucial part of the European energy system. The safety and reliability of the power
transmission are a priority and thus any imbalances in generation and consumption are a
critical concern. They also run the Real-Time Balancing Markets. To effectively balance their
systems, they procure flexibility services from neighboring transmission grids or distribution
grids (Hadush & Meeus, 2018), although they are not directly involved in the implementation
of TwinERGY.
2.2.2 DISTRIBUTION SYSTEM OPERATORS (DSOs)
Traditionally the DSOs are responsible for the maintenance and operation of the distribution
grid. However, the massive penetration of DERs at the edge of the grid is changing the nature

26
and role of the DSOs. Their roles are expanding to include connection and disconnection of
DER, planning, maintenance, and management of the distribution grid and management of
the flexible markets and platforms for local energy markets. As managers of local energy
markets, their responsibilities are growing to include actively managing congestion and peak
load, moving away from the conventional fit and forget approach (IRENA, 2019; Anaya &
Pollitt, 2017).
Currently, solely the TSOs are responsible for the assurance of security of the energy supply;
however, once DSOs start developing flexible markets, TSOs will face less certainty on the
conditions of future grids (InteGrid, 2020), assuming the proper coordination between the two
organizations is put in place. Therefore, for the success of the TwinERGY project and an
effective European energy system, close cooperation between the two different types of
network operators is required. For this matter, the SmartNet project of the European
Commission analyzed and presented potential DSO-TSO coordination methods.
2.2.3 RELEVANT KPIs FOR ENERGY SYSTEM OPERATORS
• Average Cost Savings through DR;
• Reduction of peak demand at levels above 50%;
• Contribution to the avoidance of 217 TWh of RES curtailment in 2050
(according to EU targets);
• Contribution to the achievement of €50B deferred investment for peak
generation capacity & transmission and distribution grid reinforcements by 2050;
• Contribution to 1bn tons annual CO2 emissions reduction by 2050 due to
renewables integration.
2.3 Authorities
2.3.1 POLICY-MAKERS
If not managed correctly, DERs may increase the cost of electricity, foster inequality between
resource owners and non-owners and increase the uncertainty of managing the grid. Policy-
makers have a key role in developing the right regulatory regimes for transitioning the energy
system to a decarbonized renewable-based system (EPRS, 2020). Individual policies and policy
packages were set in the EU to overcome barriers that obstruct energy efficiency and energy
conservation. According to Economidou and colleagues (2020), these policies are sectioned as
follows: regulatory, financial and fiscal, information and awareness, qualification, training and
quality assurance, market-based, voluntary action, infrastructure investments, and other
measures as innovation programs and demonstration projects.

27
According to Kestner (1991), the "SAVE" directive was the first major policy within the European
Union on energy efficiency and conservation. However, since the implementation was not as
fast and fruitful as expected, other action plans rose. Geller and colleagues (2006), the 2000
Action Plan was set up to reinforce and accelerate the SAVE directives. Afterward, the 2006
Action Plan set by the European Commission had as a goal to save 20% of the annual energy
consumption by 2020 (Backlund, Thollander, Palm, and Ottosson, 2012).
2.3.2 REGULATORS
Previous studies concerning Demand Response have shown that law and regulation drive
market changes and accelerate technology advancements (Shen et al., 2014). According to the
European Environment Agency, the national regulatory authorities in the energy area for the
pilot countries are as follows (Table 2):

28
Table 2: National regulatory authorities
Country National Regulatory Authority
Germany
The role of the Bundesnetzagentur is to guarantee compliance in the energy
sector; low-priced, consumer-friendly, and sustainable electricity supply is ensured.
In addition, it acts as a regulatory authority that can impose graded sanctions.
www.bundesnetzagentur.de
Greece
The Regulatory Authority for Energy (RAE) is an authority that is financially and
administratively independent. RAE ensures the confidential collection and
processing of information within the energy sector, as well as the approval of retail
electricity tariffs.
www.rae.gr
Italy
The Italian Regulatory Authority for Energy, Networks, and Environment (ARERA)
is the independent regulatory body of the energy markets that aim to achieve
environmental protection in balancing energy operators' financial objectives with
the general public's objectives.
www.autorita.energia.it
United
Kingdom
The Ofgem (Office of Gas and Electricity Markets) is an independent regulatory
authority that works with all stakeholders in the energy sector to ensure fair
treatment for all consumers.
www.ofgem.gov.uk
2.3.3 RELEVANT KPIS FOR AUTHORITIES
• New business models for Local Energy Communities and Retailers: 2 business
models (Retailer as an aggregator, LEC as an aggregator)
• Local Energy Communities/ Retailers Acceptance and Satisfaction out of their
new business functions (~100%)
2.4 Retail and Energy Services
2.4.1 AGGREGATORS (RETAILERS AND LOCAL ENERGY COMMUNITIES (LECs))
Aggregators have to be able to extract enough value (flexibility) from a pool of resources, to
maximize benefits for consumers (and persuade them to hand over control). Firstly,
aggregators can optimize energy management (in the case of implicit demand response).
Secondly, demand aggregation tackles the market capacity restrictions that cannot be
addressed by individual consumers (with a limited nominal power and flexibility capacity).

29
The European Commission's Joint Research Center (JRC) recently published a report stating
that an energy community is “a new form of social movement that allows for more participative
and democratic energy processes”. Until recently, energy community lacked a clear status in
EU and national legislation, taking different forms of legal arrangements (Caramizaru &
Uihlein, 2020, p.7). Local energy communities already exist in some European countries, such
as Poland, where it balances energy demand and supply at the local level. Local energy
management may help decrease costs locally; it can still increase system costs (Caramizaru &
Uihlein, 2020, p.34).
The goal of local energy communities is to combine new innovative technologies with locally
available natural resources and to raise awareness of energy efficiency and renewable energy
usage. The approach is based on the model of the local cycle economy (Local Energy
Communities, 2020). However, there have been many barriers identified regarding community
energy, which are listed in section 3.5.
2.4.2 ENERGY SERVICE COMPANIES (ESCOs)
According to the European Commission's Joint Research Center (JRC), an energy service
company is "a company that offers energy services which may include implementing energy-
efficiency projects (and also renewable energy projects) and in many cases on a turn-key
basis." ESCOs are supposed to facilitate the financing of operations and ensure lower costs.
A study about the ESCO markets in Europe shows that these entities are seen as "private-sector
delivery mechanisms for energy efficiency" (Bertoldi & Boza-Kiss, 2017). The latter authors also
provide a barriers/drivers analysis of ESCOs, listed in section 3.5.
2.4.3 RELEVANT KPIs FOR RETAIL AND ENERGY SERVICES
• Two new business models for Local Energy Communities and Aggregators;
• Flexibility trading between energy consumers and aggregators through the
delivery of an innovative, open, and transparent Transactive Energy Market
infrastructure, based on blockchain infrastructure;
• Local Energy Communities/ Retailers Acceptance and Satisfaction out of their
new business functions (~100%).

30
2.5 Benefits and barriers of energy-saving
programs adoption by stakeholder
The benefits and barriers of energy-saving programs adoption by stakeholder are presented
in a tabular form in Table 3.
Table 3: Benefits and Barriers of energy-saving programs adoption by stakeholders
Stake-
holder
Benefits Barriers
End users • Energy consumption reduction
• Avoided production costs
• Power losses savings
• Reduce electricity bill
• Consumers are not very price
sensitive
• Difficulty in understanding
electricity markets
• Mistrust in electricity companies
• Resistance to change
• Unclear incentives for the
market to reach energy targets
• Lack of knowledge/interest in
energy-related topics
System
operators
• High volumes of data, enabling
the prediction decisions in real-time
• Improved data management and
collection
• Alleviation of high transaction
costs
• Reduction of grid impact of new
charging infrastructure through
demand management
• Possibility to use EVs as dynamic
distributed storage devices
• New streams of revenue through
the provision of ancillary services (for
congestion and voltage management)
• Avoidance of critical investments
towards network enhancements due
to the wide deployment of TwinERGY
solutions
• Technical accounting rules not
in line with the life spans of the
products
• Weak or lack of feedback
structures
• Research & development only
at company levels constrain
progress
• Vague or non-existing
incentives for distributed energy
production
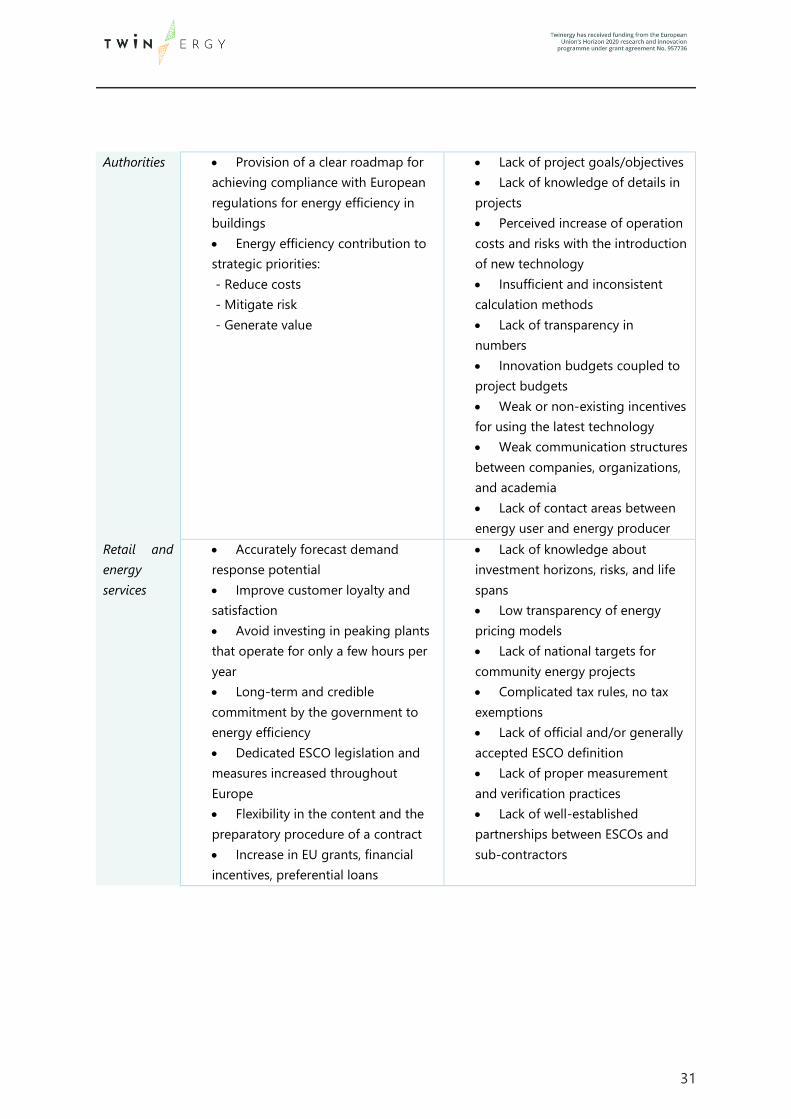
31
Authorities • Provision of a clear roadmap for
achieving compliance with European
regulations for energy efficiency in
buildings
• Energy efficiency contribution to
strategic priorities:
- Reduce costs
- Mitigate risk
- Generate value
• Lack of project goals/objectives
• Lack of knowledge of details in
projects
• Perceived increase of operation
costs and risks with the introduction
of new technology
• Insufficient and inconsistent
calculation methods
• Lack of transparency in
numbers
• Innovation budgets coupled to
project budgets
• Weak or non-existing incentives
for using the latest technology
• Weak communication structures
between companies, organizations,
and academia
• Lack of contact areas between
energy user and energy producer
Retail and
energy
services
• Accurately forecast demand
response potential
• Improve customer loyalty and
satisfaction
• Avoid investing in peaking plants
that operate for only a few hours per
year
• Long-term and credible
commitment by the government to
energy efficiency
• Dedicated ESCO legislation and
measures increased throughout
Europe
• Flexibility in the content and the
preparatory procedure of a contract
• Increase in EU grants, financial
incentives, preferential loans
• Lack of knowledge about
investment horizons, risks, and life
spans
• Low transparency of energy
pricing models
• Lack of national targets for
community energy projects
• Complicated tax rules, no tax
exemptions
• Lack of official and/or generally
accepted ESCO definition
• Lack of proper measurement
and verification practices
• Lack of well-established
partnerships between ESCOs and
sub-contractors

32
3/ Key Performance Indicator (KPI)
Organization In this section, the KPIs included in the TwinERGY proposal are carefully reviewed, discussed,
and dissected into more specific KPIs. Therefore, first, the main KPIs discussed in the proposal
are explained, then the KPIs relevant to the nine Use Cases and Pilot studies are presented,
and lastly, all of these are summarized in section 5.2 (KPI Summary).
3.1 Main KPIs
Table 4 presents the KPIs included in the TwinERGY proposal as well as a brief description of
each one.
Table 4: Main KPIs
Key Performance
Indicators
Description
RES share in energy
consumption
Measures the RES share: the total energy delivered to end-users as
well as DSO's and TSO's losses for electricity and heat. It should be
noted that exports/imports of electricity are not considered renewable
energy (Eurostat, 2020).
Reduction of peak loads Measures the reduction of the largest daily power consumption
value.
Self-consumption ratio Measures the amount of energy produced and consumed locally
relative to the total production that is locally available from on-site
generation units (most of the time the self-generated energy comes
from PV). It is calculated as the ratio of self-consumption divided by
the self-generated energy.
Penetration of dynamic
energy tariffs
Measures the increase of residential consumers exposed to dynamic
electricity tariff schemes (any such tariff, e.g., ToU, RTP, etc.) in
TwinERGY pilot sites, hence quantifying the improvement in the
penetration of DR mechanisms among these end-use consumers.
Active participation rate
through user engagement
and acceptance
Measures the sum of the number of users actively participating in
the pilots in relation to the total that accepted participation.

33
Customer responsiveness Measures how many customers have responded to a DR program
following a DR signal sent to them, like a price change, as the total
number of signals sent back by the customers as an absolute
number or a percentage.
Total energy reduction
against discomfort level
constraint
Measures the reduction of energy consumption without exceeding a
specific discomfort level/threshold. i.e., Given a Discomfort level X.
Customer satisfaction Measures the user's satisfaction of overall participation in the pilot and
the services that have been tested.
Demand flexibility Measures the increase of the amount of load capacity participating in
demand-side management at each pilot.

34
4/ Description of Use Cases
4.1 Use Case 1
Name of UC:
UC01 Home Energy Management
Responsible for UC:
STAM, German Pilot, Greek Pilot, Italian Pilot, UK Pilot
Scope and Objectives
Scope:
The scope of this UC is energy management in residential consumer premises to monitor the
energy flows, maximize self-consumption and self-sufficiency.
The first step is to obtain a greater facilities' observability; the amount of static and dynamic
monitored data will be gathered and then processed and analyzed.
Data gathering is crucial in the energy efficiency process and energy management; different
actions will be taken depending on the data available, and eventually, the monitoring system
will be improved.
The static parameters regard many aspects of the facility, such as:
• Typology (apartment/household/public building)
• Footprint area
• Number of floors
• Numbers of occupants
• Nominal Power supply
• Photovoltaic plant peak power
• Energy Tariffs timing and costs

35
The dynamic parameters refer to:
• Energy consumption
• Photovoltaic production
• Indoor parameters (temperature and humidity)
• Weather conditions
The data will be achieved and made available through an online graphical interface to
improve the users' awareness about their energy profile in accordance with the UC8.
The main electrical appliances inventory and their weekly usage habits will deliver the optimal
loads distribution during the week.
Through the GUI, the users can fulfil the typical usage habit of their main electrical appliances
during the week. The usage routines could be updated and overwritten by the user whenever
needed.
In relation to the energy monitoring and costs information, these data can be used to find and
shape the optimal load profile, reduce costs in the energy bill, and maximize self-consumption.
Features under study
• Smart and remote monitoring in the GUI
• PV generation
• Potential of self-consumption
• Load shifting optimization
• Peak shaving
• Electricity cost minimization
• Bills checking
• Power consumption anomaly detection
Networks/Markets under Study
• MV Network
• LV Network
• Energy markets

36
Objective:
This Use Case is focused on the energy management of residential consumer premises and
their ability to monitor and control loads, PV generation and energy storage in order to
maximize self-consumption and self-sufficiency.
• Employment of load management provided by smart plugs' on/off control, considering
dynamic tariffs to minimize energy cost to the end-user.
• Employment of load management logics to improve self-consumption from PV; A
Demand Response module, aiming to find the optimal electrical loads distribution
within the day in the week taking into account energy cost, peak shaving, and users'
comfort.
• Flexibility modelling so the consumers can actively participate in demand response
programs.
• Checking of requested power versus nominal power of buildings' main loads.
Narrative of the Use Case
Actors&Roles, Names and Types:
☒ DSO
☐ TSO
☒ End Customers (MV/LV)
☐ DER Customers
☐ Regulator
☐ Municipality/Local Authority
☒ Aggregator/Flexibility Operator
☒ Service Provider
☐ Other:
Specific Roles (if applicable)
☐ System Optimiser

37
☐ Data Manager
☐ Smart Grid Operator
☐ Neutral Market Enabler
☐ Contraints Market Operator
☐ Customer Relationship Manager
☐ Other 3rd Parties Relationship Manager
☐ System Security Manager
☐ Other:
Short Description :
In this Use Case the energy management of residential consumer premises is focused on
through:
1. Monitoring main electrical appliances and power lines
2. Shaping the energy users typical routines
3. Controlling loads with a smart plug
4. Generating PV energy
5. Storing the generated energy
6. Usage loads optimization minimizing costs and power peak demand
4.2 Use Case 2
Name of UC:
UC02 RES Generation in domestic and tertiary buildings
Responsible for UC:
IES, Bristol Pilot, German Pilot, Italian Pilot

38
Scope and Objectives
Scope:
This use case has the goal to create further renewable sources and infrastructure to increase
the RES share in public and private buildings. The use case is being applied to three of the pilot
sites for the TwinERGY project, with different aims for each specific to the location in question:
1. Bristol: Community investment in local energy infrastructure, focusing on local RES
(both present and future potential) both from an energy production point of view and
also taking into account how they would operate in any future local energy
market/community grid framework etc.
2. Hagedorn Village: Increased uptake of locally produced renewable energy, enabling
increased flexibility of the local microgrid and increased social engagement in the use
of RES.
3. Benetutti Smart Community: Increased integration of RES in the community grid,
which will enable optimisation of building energy consumption through DR and
participate in a new local energy trading platform.
Each of the pilot site objectives are quite similar in the context of this use case, but the plan
will be still to be as flexible as possible to allow for any specific requirements of one location
so that the optimal solution can be found for local RES in the community.
Objective:
This use case is aimed at maximising both the present and future RES generation and usage
in public and private buildings across three of the four pilot sites. In line with this overall
goal, the objectives of the use case are as follows:
• Minisimising energy costs for the end user through optimal use of the local
renewable energy production
• Minimising the overall carbon emissions produced by the community
• Maximising the use of the local RES through supporting infrastructure, such as
battery storage and demand response algorithms.
Narrative of the Use Case
Actors & Roles, Names and Types:

39
• Aggregator
• Retailer
• Building/asset owner
• End users
Short Description :
UC02 can be divided into these Primary Use Cases (PUCs):
• PUC02.01 Dispatch of existing RES in domestic and tertiary buildings to minimise cost
• PUC02.02 Dispatch of existing RES in domestic and tertiary buildings to minimise
carbon emissions
• PUC02.03 Optimal future energy storage to maximise RES production
• PUC02.04 Maximum future RES capacity according to the physical constraints (e.g.
roof space, cable sizes) of the pilot site
• PUC02.05 Maximum future RES capacity determined by present/future V2G capacity
as determined by the TwinEV module
• PUC02.06 Optimal CHP solution specific to the pilot site in terms of capital costs and
network capacity
• PUC02.07 Optimal scenario of future energy storage and RES to minimise energy costs
for the end user
• PUC02.08 Optimal scenario of future energy storage and RES to minimise carbon
emissions
• PUC02.09 Optimal domestic and tertiary demand response, based on RES, to minimise
cost
• PUC02.10 Optimal domestic and tertiary demand response, based on RES, to minimise
carbon emissions
There are no Secondary Use Cases (SUCs) related to UC03.
4.3 Use Case 3
Name of UC:
UC03 Grid capacity enhancement utilizing e-mobility

40
Responsible for UC:
ETRA I+D, Mytilineos (Greek Pilot Site), TH OWL (German Pilot Site)
Scope and Objectives
Scope:
Electrical Vehicles (EVs) have a dual nature. In the first place, they act as a transport mean
when they are on the move. In the second place, they can also be a grid-connected battery
when they are parked and plugged. Taking advantage of their second nature, EVs are able to
transform the stress on the electric grid into the opportunity to act as a flexible asset. Smart
Charging through an external control system, accompanied by Vehicle-to-Grid connexion
would lead the EV owners to participate in specific markets that could generate relevant
benefits for the energy sector, not only in terms of grid management but also in environmental
terms since the transport sector in Europe is responsible for over 25% of greenhouse gas
emissions. The adoption of EVs as a distributed storage asset lead to a more decarbonized
infrastructure. Furthermore, managing the charging process through time schedule and power
profiles will open new opportunities to not only EV owners but also to flexibility markets: smart
EV charging can integrate a large share of Renewable Energy Sources (RES) throughout the
modification of the power demand curve, reducing the system costs and supporting as well the
decarbonization of neighborhoods as well. Consequently, EV will enable improved system
management in terms of voltage control and grid congestions.
Through the application and study of this Use Case in two of the TwinERGY project pilot sites
(Athens in Greece and Hagedorn Village in Germany), EVs will be analyzed as a distributed
storage asset for grid purposes. In collaboration with Vehicle-to-Grid connection, EV smart
charging would allow the grid to stabilize through the integration of RES and the possibility to
participate in energy flexible markets. Additionally, Smart Charging would benefit EV users in
terms of economic performance by reducing energy costs when charging, through the
scheduling of their charging sessions. EVs as a distributed storage asset could also have an
influence in the performance of Distributed System Operators (DSOs). Batteries could help
these entities in the congestion and the voltage management, taking advantage of the
flexibility that batteries can provide when they are connected through V2G connectors in
charging points. In addition, the use of Smart Charging in EV would lead to more decarbonized
neighborhoods, throughout the integration of RES from the energy mix or renewable surpluses
detected in the charging processes.

41
Features under study
• Smart Charging
• Vehicle-to-Grid (V2G) Capability
• Participation in Demand Response campaigns
• Participation in Energy Markets
• Participation in Local flexibility markets
• Voltage Control and Grid Congestions through DSO
• Integration of RES and surpluses
• Reduction of CO2 emissions
Networks/Markets under Study
• MV Network
• LV Network
• Energy markets
• Local Flexibility Markets
Objective:
This Use Case is focused on analyzing the potential implementation of electromobility to use
EVs as distributed assets for the benefit of the grid performance. Electromobility would be
analyzed through this UC to carry out this purpose by:
• Use of EV batteries as a distributed asset to offer ancillary services to the DSO
(Congestion and Voltage Management) through the integration by V2G connexion.
• Smart charging scheme development for EV owners from which EV charging could
focus on the use of green energy (both from the Renewable sources in the energy mix
and the energy surpluses from renewable generating assets) as well as on the charging
sessions costs minimization.
• The use of EV batteries for participation in flexible energy markets using demand
response campaigns.
• Using smart charging profiles to generate EVs charging efficiency via the integration
of RES, helping the decarbonization of neighborhoods.
Narrative of the Use Case
Actors & Roles, Names and Types:

42
• Aggregator
• Retailer
• Distributed System Operator (DSO)
• End consumers (MV/LV)/Prosumers
• EV user
• EVSE Operator
• Public Authorities
• VPP operator
Short Description:
UC03 "Grid capacity enhancement utilizing e-mobility" can be further depicted into these
different basic-level actions:
Primary Use Cases (PUC):
• Management of Charging Stations
• Smart Charging calculation
• Searching for the most suitable station
• Interaction with the energy infrastructure
• Ancillary and Congestion management (DSO operations)
Secondary Use Cases (SUC):
• Data collection from EVSE
• Data collection from EVs
• User's authentication
• Get free charging stations
• Calculation of the route
• Evaluation of a station
• EV flexibility estimation
• EV Load forecasting
• Charging session schedule
• Charging reschedule to follow grid requests
• Charging reschedule to maximize RES integration (green electricity)
• Charging reschedule to minimize charging costs
• Payment process for charging session

43
4.4 Use Case 4
Name of UC:
UC04 Prosumers empowerment in local energy trading markets
Responsible for UC:
WEC, University of Patras, ETRA, University of Bristol (Pilot site), Benetutti (Pilot site)
Scope and Objectives
Scope:
The scope of this use case is to provide solutions to transactive energy uses cases and enables
grid decentralization and democratization by connecting the micro-grid operators to the DER
managers and their customers. It aims for an integrated energy business model through
energy service expansion, customer engagement and financial inclusion. It allows them to
balance the grid and provide solutions to a number of grid problems, such as grid power
quality and reliability. The core of this use case is a transactional platform that offers its
participants to sell their flexible energy loads and excess capacity on an open market to the
(micro) grid operators or to each other. Microgrid operators provide balancing and grid services
at a local and micro-grid level. A micro-grid could be a collection of a) IoT devices, b) buildings,
c) neighborhoods/substations, and d) regions that operate at a regional level to balance
multiple neighborhoods, districts and/or substations. It could potentially include the high
voltage grid. Each component of the system (e.g., device, building, neighborhood, distribution
grid and transmission grid) is a self-contained ecosystem, replicated and nested within the
next layer of the system, like in a fractal configuration. All components operate with identical
information and control models and each have operational decision-making capabilities. This
platform offers a path to grid decentralization, energy democratization, and a way to
effectively leverage and monetize the emerging DER infrastructure.
The Transactive Energy Module (TEM), based on Hybrid Blockchain technologies will be
developed to solve current intractable optimization problems and create a premiere
Transactive Energy (TE) protocol layer settlement process, marketplace, and governance
framework to allow energy-related Apps to be written and interoperate with each other.

44
Through the application and study of this Use Case in two of the TwinERGY project pilot sites
(Bristol in the United Kingdom and Benetutti in Italy), grid infrastructures would be analyzed
to implement state-of-the-art equipment that can monitor and track energy consumption and
distribution.
Pilot sites, consisting of apartment buildings and individual houses will be equipped with smart
meters, EV charging points, local and public storage facilities and IOT devices such as smart
plugs. These are integrated with the Transactive Energy Module giving prosumers a powerful
insight of their power consumption and redistribution to the local energy market (LEM).
The TEM will allow for prosumers to buy and sell energy from the LEM. It will also allow TE
participants to transact in a P2P configuration outside an organized LEM/DSO or an ISO/TSO
market. These transactions are stored as an immutable record on the blockchain specifying
the actors participating in the transaction and the origin of the energy.
To further support the LEM, the TEM will process and broadcast price forecasting of the DNO
and LEM. Other Twinergy modules will be able to listen to the broadcast and make energy
consumption or discharge decisions on behalf of the prosumer.
For non-ISO/TSO and non LEM/DSO organized energy market transactions one pricing option
could be to use a double-sided market in which TE participants pay a unique price based on
their preferences and local supply and demand conditions (analogous to the stock market).
Another option could be to use a proxy market price using a reference market price of the LEM
organized market or the ISO/TSO market, (e.g., the 5-minute real-time auction price.
Features under study
• Granular monitoring of energy consumption behind the meter
• Use of private and public storage facilities within a concealed grid infrastructure
• Technical limitations of tracing electrons (units of energy)
• LEM Price calculation and forecasting
• Social incentivisation for delivering energy to the LEM
Networks/Markets under Study
• Regulatory limitations of peer-to-peer transacting of energy
• Regulatory limitations of financial transactions for energy without involvement of a
DNO or DSO
Summary of Benetutti pilot site

45
• The Benetutti pilot site consists of a neighborhood of 120 buildings of which 20
participate. Two of the participants are public places being a primary school and a
nursery.
• Every participating house will have a PV installation. The KwH output of each
installation is different.
• One participating house has a battery.
• Every participating house will be installed with a shelly cloud smart meter
• Every participating house will be provisioned with smart plugs
Summary Bristol pilot site
• The Bristol pilot site consists of 1 campus building and 10 residential homes.
Participants are yet to be selected.
• Every home will be provisioned with a smart submeter.
• There will be a few houses with a PV installation.
• There will be 1 or 2 houses that will receive a Tesla battery.
• All participants will receive smart plugs.
• There will be no public storage facility.
Objective:
This Use Case is focused on analyzing the potential implementation of Transactive Energy
in the benefit of the grid performance. Also, to empower prosumers by allowing them to trade
the energy they produce. The use case is also focused on creating a Local Energy Market (LEM)
and calculate dynamic energy pricing for the same. To carry out this purpose, Transactive
Energy would be analyzed through this UC by:
Implementation
• Participating houses and appartment buildings on the pilot sites are / or will be
equiped with smart meters. Behind the meter a combination of IOT devices are
available such as smart sockets, HVAC systems and so forth. This also includes PV
systems, home turbines, electric vehicles and other appliances that can generate or
discharge energy. These are connected to the TwinERGY data modules
• The data generated by the aforementioned devices can be used by other modules in
order to make decisions on the behavior of applicances. This includes the decision to
distribute energy back into the grid, move the energy to public storage facility or to
provide the energy to another prosumer in the TwinERGY ecosystem.

46
• All energy transactions are recorded on a private permissioned blockchain (PPB).
Narrative of the Use Case
Actors & Roles, Names and Types:
• Aggregator
• Distributed System Operator (DSO)
• Consumers / Prosumers
• Prosumer Consortium
• Virtual Power Plant Operator (VPP)
Short Description:
UC04 Prosumer's empowerment in local energy trading markets can be further depicted into
these level actions.
Primary Use Cases (PUC):
• Management of energy distribution behind the meter
• Data collection from smart appliances, PV systems and batteries
• Recording transactions of energy distributed back into the grid or to a private or public
storage facility
• Calculation and broadcasting of LEM pricing compared to DNO/DSO pricing
• Optimal scheduling of LEM Assets (e.g., flexible loads, EVs etc.)
Secondary Use Cases (SUC):
• Recording transactions of energy between prosumers
• Recording transactions of energy between prosumer consortia
• Recording metering and sub-metering (e.g. HVAC, electric water heater etc) time series
• Forecasting generation and load data
• Processing the energy mix (solar, wind, bio, gas, nuclear, coal, etc.) to make informed
decisions on peak energy consumption
Use Case Function description
"Create account"
• Prosumer joins TwinERGY project

47
• Receive signal from other TwinERGY module to create prosumer account
• TEM confirms account created
"Register Device"
• New device joins TwinERGY ecosystem
• Receive Signal from other TwinERGY module to register a device (PV, HVAC etc.)
• Signal includes owner and TEM creates relation between prosumer and device
• TEM confirms device is registered and relation created
• (2) Function to remove devices
"Register Consortium"
• New prosumer consortium is formed
• Receive Signal from other TwinERGY module to register a consortium
• Signal includes participants and devices creates consortium relations
• (2) Function to add and remove prosumers and devices
"Calculate and broadcast LEM and DSO/DNO Pricing"
• TEM receives input data from other Twinergy modules
• TEM receives input data from DSO/DNO
• TEM calculates LEM pricing
• TEM broadcasts LEM/DSO/DNO pricing on set interval
• TEM records pricing on the blockchain
"Process energy transaction"
• TEM receives request from other Twinergy module or device to process a transaction
• Data input includes prosumer, device, units and destination
• TEM processes and settles the transaction
• TEM records transaction on the blockchain with reference to price hash
"Communicate an account balance"
• TEM receives request from another Twinergy module to communicate the balance an
account
• Data input includes the ID of a Prosumer, Prosumer Consortium or Device
• TEM communicates balance
"Communicate transaction history"

48
• TEM receives request from another Twinergy module to communicate the transaction
history of an account
• Data input includes the ID and date range of a Prosumer, Prosumer Consortium or
Device
• TEM communicates an array of transaction
"Load and generation forecast"
• TEM receives input data from DSO/DNO
• TEM receives input data from TwinERGY digital twin
• TEM calculates day ahead load and generation forecast
• TEM broadcasts load and generation forecast
4.5 Use Case 5
Name of UC:
UC05 Enhance grid flexibility through DER Management
• PUC05.01 – Grid status calculation and bottleneck detection
• PUC05.02 – Prediction of energy consumption and RES production
• PUC05.03 – Utilizing the Virtual-Power-Plant
Responsible for UC:
Benetutti (Italian Pilot Site), TH OWL (German Pilot Site), STAM, IES
Scope and Objectives
Scope:

49
The generation of renewable energy sources (RES) can, in most cases, is not controlled and it
is therefore crucial to find ways to harvest these types of energy when they are available. Thus,
it is necessary to utilize methods that make the energy accessible for longer periods of time
and be able to make accurate forecasts about the estimated energy generation so the energy
consumption and distribution can be planned accordingly.
Currently, there is a big imbalance between the production and the consumption of RES,
especially in regions that generate large amounts of RES power. Over the course of a day there
may be periods where wind turbines or PV-systems generate more energy than is needed or
can be consumed at the time. In order to keep the power grid stable, these energy sources
have to be temporarily shut down, leading to an unused RES-potential of several TWh per year
(e.g., 6,3 TWh in 2019 in Germany).
It is therefore essential to find intelligent ways of making the power demand more flexible and
store the excess of produced energy, so that potential RES power is not wasted and the energy
production sector in Europe can profit from further decarbonization. Another potential
advantage of such intelligent energy storages is their very fast response time that can help
stabilizing the power grid by reacting to temporary energy shortages in a timely manner.
Features under study:
• Real-time grid status calculation
• Real-time grid bottleneck detection
• Real-time consumption level prediction.
• Real-time RES production level prediction.
• Real-time testing and evaluation of changes to grid switching behavior.
• Electric battery storage
• Home energy management system
Networks/Markets under Study:
• Low-Voltage (LV) Network
• Medium-Voltage (MV) Network
PUC05.01 is related to grid stability and grid monitoring. While most of the current electricity
grid was built upon default values solely defined by the energy demand, the penetration of the
grid with renewable energy sources, electric charging infrastructure and electrical driven HVAC
modifies the energy flow. Novel smart meter infrastructures, different sensors and

50
computational functions provide the ability to control and protect the grid infrastructure in
real-time by analyzing loads at specific nodes and deploying countermeasures if necessary.
Features under study:
• Real-time grid status calculation
• Real-time grid bottleneck detection
Networks/Markets under Study:
• Low-Voltage (LV) Network
• Medium-Voltage (MV) Network
PUC05.02 is related to predicting the consumption loads and RES production when applying
DER management. To enable flexibility enhancements within the power grid, it is necessary to
accurately predict future consumption load levels as well as production quantities of RES. This
information allows DSOs to proactively apply changes to the switching behavior in the grid
and distribute energy flows as well as energy reserves in battery stores more efficiently. Based
on various information sources such as weather forecasts and user-behavior analysis, accurate
predictions can be made, and their effects simulated. Unwanted feedback-loops caused by
changes to the grid are identified beforehand and taken into consideration.
Features under study:
• Real-time consumption level prediction.
• Real-time RES production level prediction.
• Real-time testing and evaluation of changes to grid switching behavior.
Networks/Markets under Study:
• Low-Voltage (LV) Network
• Medium-Voltage (MV) Network
PUC05.03 describes the integration and utilization of a virtual power plant in the community.
The objective is to maximize the production of renewable energy as well as acting as a grid
stabilizing component. Therefore, reliable and precise control and coordination of the VPP
components is necessary.
While sun or wind powered energy producers can be part of the VPP by shutting down
production in times of low energy demand, the scope is narrowed down to batteries. Since the
overall objective of the project is to maximize the usage of renewables, shutting off these

51
producers would be counterproductive to these goals and should only be considered as an
ultima-ratio.
Features under study:
• Real-time grid status calculation
• Real-time grid bottleneck detection
• Electric battery storage
• Home energy management system
Networks/Markets under Study:
• Low-Voltage (LV) Network
• Medium-Voltage (MV) Network
Objective:
In this Use Case congestion management is operated and tested. Specifically, different
forecasts for loads and RES production are tested to measure combined network data and
calculate the network status in real time. This includes testing the feedback- and switching-
behavior as well as reactions of the HEMS towards changes of the network state.
• Improving grid flexibility and stability by utilizing demand response mechanisms and
energy storage capabilities.
• Increasing local RES share by increasing their usage in times of higher production, thus
avoiding temporary shutdowns of RES facilities.
• Optimizing VPP through services offered to DSOs.
PUC05.01 is focused on the grid status calculation and bottleneck detection. Based on this
objective, grid loads at specific points can be determined which allows the deployment of
various optimisation approaches to improve the grid stability and quality of service.
PUC05.02 objectives are:
• Use information about weather forecasts to predict RES energy production.
• Use the information gained from consumer behavior analysis and historic data to
predict consumption levels for individual households or quarters for specific time
periods.
52
• Simulate changes to the grid switches using the forecast information and find an
optimal configuration with highest efficiency and no feedback loops.
PUC05.03 objectives are:
• Use the battery to store excess renewable energy.
• Use charged batteries in times of high demand and low RES production.
Narrative of the Use Case
Actors & Roles, Names and Types:
• Aggregator/Flexibility Operator
• Distribution System Operator (DSO) – PUC05.01 to PUC05.03
• End-users/consumers – for PUC05.02 and PUC05.03
• Main battery storage operator in Hagedorn – for PUC05.03
Short Description:
UC05 "Enhance grid flexibility through DER Management" can be further depicted into these
Primary Use Cases (PUCs):
• PUC05.01. Grid status calculation and bottleneck detection
• PUC05.02. Prediction of energy consumption and RES production
• PUC05.03. Utilizing the Virtual-Power-Plant
There are no Secondary Use Cases (SUCs) related to UC05.
PUC05.01 starts when the last calculation ends or in an appropriate task runtime. It is a
monitoring process.
The process in this use case is the following:
1. The DSO collects all relevant data from smart meters and grid-integrated sensors at
various specified nodes. This includes voltage-levels, currents, power, power factor and
overload conditions.

53
2. The DSO estimates the grid state of all other nodes that were not directly measured by
interpolating the existing measured data and using the available specification
information of individual hardware components within the grid (network model).
3. The DSO examines the measurements and calculated data for all nodes and checks
whether they are within their specified thresholds or if certain nodes are experiencing
bottlenecking.
If there are bottlenecks detected, the DSO starts the local countermeasure procedure. The
countermeasure procedure depends on the availability of controllable loads, it could be
interlinking two grids, the control of battery storage for auxiliary services or the control of
public charging infrastructure.
PUC05.02 starts at 00:00 o' clock on any day. The process below is regularly repeated in
specified time intervals throughout the day. This can be every 3 hours or more frequently.
1. Information about the upcoming local weather conditions is retrieved, with a special
focus on wind speeds and hours of sunshine.
2. All available RES in the local area for which the forecasted weather conditions apply
are checked, and their level of energy production is predicted.
a. This includes considering individual RES equipment and their estimated energy
production based on their specifications. This requires all RES specs to be
readily available.
b. Additionally, the data can be supplemented with historical data of weather and
production levels to accommodate for deviations from the specifications, such
as in the case of wear.
3. Based on previous analysis of consumer behavior in the local area, supplemented by
historical measurement data, the consumption levels of individual households or
quarters are predicted based on the current time of day, weekday and weather
conditions (with a focus on temperature and sunshine).
4. All gathered forecasts are used by the DSO to optimally reroute energy flows within
the grid by adapting the grid switching behavior in a simulated environment to
maximize RES consumption and grid stability.
a. This includes decision making processes to decide where to charge or discharge
battery storages.

54
b. Negative effects such as feedback loops shall be detected this way before they
actually appear.
5. The previously tested changes to the power grid are deployed in real life and effects
are monitored in real-time.
a. Any unwanted effects such as unexpected feedback loops that were not
identified beforehand shall be mitigated by corresponding additional changes
to the grid switches.
The process is repeated at a later point in time.
PUC05.03 begins on a sunny day.
1. While it is still early just before dawn, the PV-systems in Hagedorn have not yet begun
any production. Still, some people have already woken up and are preparing
themselves for work. At this time, the first rooms are lit and appliances such as coffee
machines are started for breakfast. Because it is still dark, the PV systems on the roofs
cannot contribute to the energy production, yet. However, during the past day and with
the help of wind turbines, they were able to charge the energy storages in the village,
which can now be used to power the households.
2. As the sun rises, the production of solar energy is also increasing until there is a balance
between the demand and the production of energy. Any excess energy produced from
this point on, is used to charge the battery storages at the pilot site, since they were
used up to some extent in the morning and during the night.
3. When the sun begins to set, the storages are sufficiently charged to support the
households with enough power throughout the upcoming evening and night. This is
supplemented with additional power reserves coming from wind power, which is not
dependent on sunlight.
4. The whole process is repeated on the next day.
4.6 Use Case 6
Name of UC:
55
UC06 Consumers engagement in Demand Side Management Programs utilizing feedback
mechanisms
Responsible for UC:
ED, Greece Pilot, Italy Pilot
Scope and Objectives
Scope:
The scope of this UC is limited to feedback-based demand-side intervention strategies applied
at the residential level. This UC will explore manners that DSO and/or Retailers may apply as
a matter of increasing residential awareness resulting in the essential engagement of
residential end-user into demand-side management programs. Demand response relies on the
basic principle of exploiting certain flexibility that power consumption has (i.e., type of
numerous end-user which are managed by a retailer/aggregator), and its implementation
implies technical infrastructures and a scheme that is adopted by the market. In regard to
technical infrastructures, this UC will particularly explore automated interfaces that can steer
the customer to participate in demand-side management schemes in a streamlined manner.
From the market design, this UC will exploit demand-side management that either relies on
the participation of end-user due to responding to market price signals or incentives (i.e., price-
based or incentive-based schemes) thus changing normal electricity consumption patterns.
Features under study
• DSO and/or Retailer's feedback mechanism
• Residential awareness
• Residential engagement
• Residential demand flexibility
• Residential energy use
Networks/Markets under Study
• LV Network
• MV Network

56
Objective:
The objective of this UC is to encourage the residential consumers' participation in the
developed demand response programs, utilizing user-friendly interfaces for acquiring feedback
regarding energy-related actions. This UC targets engaging local consumers in implicit
demand response programs that are realized through the combination of dynamic pricing
schemes, feedback mechanisms, and human-centric features that allow consumers to alter
their energy consumption patterns and provide flexibility to the electricity retailer without
compromising their comfort and wellbeing. Such feedback mechanisms are meant to be
achieved under this UC with the consideration of:
• metering and sub-metering data from the local client of Retailers, IoT and sensing data
from consumer premises
• demographic information
• EV charging information
• Weather via aggregation and disaggregation.
Responsible retailers may leverage the above data along with incurred advanced analytic at
their premises as a matter of determining the consumer's spatio-temporal flexibility profiles
and their potential capacities to participate in demand-side integration programs. The
management of the connected clients by the retailers may explore the adoption of techniques
on clustering the flexibility profiles given the spatial (i.e., neighboring) and temporal traits. The
goal will be to establish optimal Virtual Power Plant (VPP) composition to deliver added value
services to the electricity retailer.
Narrative of the Use Case
Actors & Roles, Names and Types:
• Aggregator/Flexibility Operator
• Distributed System Operator (DSO)
• End consumers (MV/LV)/Prosumers

57
Short Description :
Deploy and scale up a user-friendly building energy management system that supports
consumers managing self-consumption, and maximizes self-sustainability, increases
residential awareness and engagement to demand-side management programs, and reduces
reluctance and fear of participation in demand response programs.
Primary Use Cases (PUC)
• Spatio-temporal clustering of flexibility profiles
• Management of VPP (clustered end-users)
Secondary Use Cases (SUC)
• Data-collection from smart-meters
• Data-collection from sub-metered IoT devices
• Aggregation weather data
4.7 Use Case 7
Name of UC:
UC07 Consumer's engagement in demand response programs utilizing a socio-economic
context
Responsible for UC:
ED, Italy pilot, Germany pilot, the British pilot
Scope and Objectives
Scope:
This UC entails enabling a set of social context drivers for energy-related behavior changes by
exploiting social interaction and cultural values. The aim is to influence efficient energy
exchanges between households relying on consumer attitudes towards benefit and comfort.

58
The latter is foreseen to take place based on qualitative and quantitative techniques, which
have embedded prosumers' contexts.
Features under study
• Socio-economic variables
• Cultural dimensions (individual- and community-level)
• Behavioral data (e.g., adoption intention, engagement, energy exchanges between
households, consumer attitudes (benefit in conjunction with comfort)
Networks/Markets under Study
• LV Network
• MV Network
Objective:
Enable Social context drivers for energy-related behavior changes, by utilization of social
interactions and cultural values to influence energy exchanges between households, and
consumer attitudes towards benefit and comfort. Within this UC the following aspects will be
taken under consideration:
• Socio-economic variables
• Cultural aspects, at the individual- and community-level (e.g., Hofstede cultural
dimension or Schwartz Human Values Theory)
• All of these will be independent variables of attitude and actual users' behavior (e.g.,
measuring adoption intention, speed-up engagement, energy exchanges between
households, among others)
The main objective of this UC will be to leverage the inputs above by conducting behavioral
analysis, as a matter of employing community-based social marketing to engage participants
through continuing conversation, active debates and organize Living Labs. From the
individuals' perspective, certain recommendations will be provided by the social network as a
matter of improving their consumption profiles and habits. The latter aims to consider a
disaggregation algorithm that will allow determining appliance-specific consumption, using
merely the aggregate power signal of a household as input. Each appliance relates to a unique
energy consumption pattern, characterizing and differentiating appliance's operations from
the aggregate signal. At the community level, competition among neighboring end-users will
take place via the utilization of social network modules that will be performed based on

59
gamification functionalities. The competition, in turn will be relying on specific KPIs such as
energy efficiency, participation in the local community, utilization of shared assets etc, as a
matter of providing the corresponding rewards.
Narrative of the Use Case
Actors & Roles, Names and Types:
• End consumers (MV/LV)/Prosumers
Short Description :
This task will also focus on the barriers consumers face when adopting Demand Response, be
it cultural barriers, knowledge, or social limitations like energy vulnerable customers. To gather
this customer perspective, smartEn will work together with consumer organizations. The
outcome will be a reasoned analysis of all kinds of barriers customers and service providers
face and how they can limit the implementation of TwinERGY business models.
Primary Use Cases (PUC)
• Behavioral analysis of end-users
• Social marketing to engage customers via competition
• End-users' engagement on utilization of shared DERs
• Enable co-creation for end consumers, service providers and public authorities
Secondary Use Cases (SUC)
• Collection and analysis of socio-economic variables
• Collection and analysis of cultural dimensions (individual- and community-level)
• Collection and analysis of behavioral data
• Collection of forecasts from Digital Twin Platform
• User's profile creation
• Collection of consumption profile
• Data collection regarding shared DER infrastructures
• Evaluation of end-user's profile based on certain KPIs
• Calculation of rewards
• Social networking functionalities
60
4.8 Use Case 8
Name of UC:
UC08 Consumer's engagement in demand response programs utilizing personalized
comfort/health-oriented services
Responsible for UC:
STAM, Greece pilot, Italy pilot, Germany pilot
Scope and Objectives
Scope:
The scope of this UC is to demonstrate innovative approaches to obtain consumers' realistic
comfort/wellbeing level with minimum intervention.
Innovation often faces matters related to distrust and misunderstanding.
To improve the people participation in DR programs, one of the main tasks to tackle is
increasing their awareness of the topic to reduce their fear of comfort losses.
The main idea is to make the users aware of their current energy usage routines.
• Are they healthy?
• Are they fine compared to the average of similar facilities?
• Does some unidentified energy consumption pattern exist?
Through a user-friendly Graphic Unit Interface, the energy monitoring information can be
shown together with target and good practice threshold of facilities with similar characteristics.
Moreover, it is going to suggest to the users, the optimal electrical appliances distribution
during the week and the benefits, in terms of costs and energy consumption reduction.
Starting from that, it is already possible to drive the users into autonomous behavioral change
and toward more efficient and healthier energy routines.

61
The next step is the real user's comfort analysis.
Comfort is a parameter specific for each person; even married couples can have completely
different energy consumption or indoor environment preferences.
Because of that, a close-loop with the users is an interesting analysis target.
Depending on the availability of the users, this use case aims to gather comfort feedback
through the GUI and the physiological data through wearable devices.
In relation to the indoor and energy monitoring system data, the comfort analysis will enter
into the optimal energy solution for DR.
Features under study
• Sensing data from consumer premises,
• Energy price information,
• Demographic information,
• EV charging information,
• Weather data
• Comfort data
Networks/Markets under Study
• LV Network
• MV Network
Objective:
Show that the utilization of low-cost wearable devices through which specific physiological
data can be unobtrusively obtained and advance unsupervised classification techniques
comprise an appropriate combination to accurately depict consumers' comfort/well-being
level.
• Increase the users' awareness about their energy patterns
• Shown the average targets expected and a threshold logic
• Gather the physiological comfort parameters and their feedback
• Shape the best practice based on the users' specs

62
Narrative of the Use Case
Actors & Roles, Names and Types:
☐ DSO
☐ TSO
☒ End Customers (MV/LV)
☐ DER Customers
☐ Regulator
☐ Municipality/Local Authority
☐ Aggregator/Flexibility Operator
☐ Service Provider
☐ Other:
Charging Point Operators
Specific Roles (if applicable)
☐ System Optimiser
☐ Data Manager
☐ Smart Grid Operator
☐ Neutral Market Enabler
☐ Contraints Market Operator
☐ Customer Relationship Manager
☐ Other 3rd Parties Relationship Manager
☐ System Security Manager
☐ Other:

63
Short Description:
The TwinERGY services will analyze and promote non-intrusiveness, comfort and well-being
preservation, respect of prosumer daily schedules as well as maximization of benefits through
transparent and open participation in markets. It will also guarantee easy switching between
DR service providers, vendor lock-in avoidance, customized DR service contracts and objective
settlement and remuneration, thus establishing an energy democracy context and
empowerment of prosumers to become active energy market players.
4.9 Use Case 9
Name of UC:
UC09 Consumer Engagement in Demand Response Programs Utilizing Digital Twin Prediction
Capabilities for Dynamic VPPs
Responsible for UC:
IES, Bristol Pilot, German Pilot, Italian Pilot, Greek pilot
Scope and Objectives
Scope:
The main focus of consumer engagement in the demand response programs that utilise the
digital twins of the TwinERGY pilot sites will be a human-machine interface in the form of an
online interactive dashboards. Bespoke dashboards will be created for each of the pilot sites,
the design of which will be informed by their specific requirements. Dashboards will be created
for both the consumer and community digital twins, with specific users able to interact with
and evaluate relevant information about their home/building/community.
In terms of the quality of data that is displayed and the accuracy of the demand response
programs, it is very important that the required information and data is provided by each of
the pilot site. The quality of performance of this use case is directly proportional to the input
data, and so the data collection exercise is a vital pre-requisite to this use case.
64
Objective:
The community Digital Twin will be the amalgamation of the individual consumers' Digital
Twins and, as such, will be able to represent the main assets of the VVP.
Narrative of the Use Case
Actors & Roles, Names and Types:
• Building owners
• Aggregators
• Pilot leaders
• DER Management Module project partner
Short Description:
UC09 can be further divided into these Primary Use Cases (PUCs):
• PUC09.01 Explicit Demand Response Automation and display at a consumer and
community level.
• PUC09.02 Implicit Demand Response Calculation and Communication to the end-user
at both a community and consumer level.
• PUC09.03 Implicit & Explicit DR actions summarised and displayed at a community
level to the relevant user
• PUC09.04 Calculation of community-level flexibility which is made available to the
DER management module for local network power flow optimisation, as well as any
other project modules that require the information
• PUC09.05 Collation of consumer DT forecasts as inputs to the community DT for
seemless integration of the two levels.
There are no Secondary Use Cases (SUCs) related to UC09.

65
5/ KPIs of Use Cases In this section the nine TwinERGY Use Cases are reviewed (Table 5), and the KPIs which are
most relevant to them are introduced. These findings are the basis for the resulting KPI table
contained in section 5.3.
Table 5: Use Cases
Use
Cases Description
City of
Athens -
Greece
Benetutti
Smart
Communi
ty - Italy
Hagedorn
Village -
Germany
Bristol
City -UK
Support
Partner
Involved
UC01
Home Energy
Management
X X X X STAM
UC02
RES Generation in
domestic and tertiary
buildings
X X X STAM
UC03
Grid capacity
enhancement utilizing
e-mobility
X X ETRA
UC04
Prosumers
empowerment in local
energy trading
markets
X X KWMC
and
UNIVBRIS
UC05
Enhance grid's
flexibility through DER
management
X X TH OWL
UC06
Consumers
engagement in
Demand Side
Management
Programs utilizing
feedback mechanisms
X X Suite 5
and
Mytilinaios
UC07
Consumer's
engagement in
demand response
utilizing a socio-
economic context
X X X IFC
UC08
Consumer's
engagement in
X X X UoP

66
demand response
programs utilizing
personalized
comfort/health-
oriented services
UC09
Consumer's
engagement in
demand response
programs utilizing
digital twins prediction
capabilities for
dynamic VVPs
X X X X Suite5 and
ETRA
UC01 – Home Energy Management
This UC focuses on the energy management of residential consumer premises and their ability
to monitor and control loads and generate and store PV in order to maximize self-
consumption and self-sufficiency.
Relevant KPIs:
• Minimize energy cost for the end-user
• Improve self-consumption from PV
• Consumer participation in demand response programs
UC02 – RES Generation in domestic and tertiary buildings
This UC aims to create additional renewable sources (e.g., PV systems and CHP) and
infrastructure (e.g., electric-l storage capacities and thermal storages), as well as to integrate
existing renewable energy systems to increase the RES share in public and private buildings.
Relevant KPIs:
• Increase RES share in energy consumption of domestic and tertiary buildings
UC03 – Grid capacity enhancement utilizing e-mobility
This UC tests how EVs can be used as a distributed storage asset, able to stabilize the grid and
lead to more decarbonized neighborhoods. Thereby advanced EV charging management
features are required to unleash the full potential of e-mobility vehicles.

67
Relevant KPIs:
• Reduce congestion through ancillary services offered to DSOs
• Reduce energy costs for end-users of e-mobility (due to smart-charging)
• Reduce CO2 emissions (through smart charging of electronic vehicles)
UC04 – Prosumers empowerment in local energy trading markets
Build a decentralized transactional platform offering participants to sell their excess loads or
capacity on an open market. Connecting micro-grid operators to DER managers and their
customers to provide a solution for transactive energy and enable grid decentralization and
democratization.
Relevant KPIs:
• Launch decentralized energy transaction platform
• Establishment of micro-grids
• Balance the grid
• Improve grid quality and reliability
UC05 – Enhance grid flexibility through DER Management
In this UC, congestion management is operated and tested. Specifically, different forecasts for
loads and RES production are tested to measure combined network data and calculate the
network status in real-time. This includes testing the feedback- and switching- behavior as well
as reactions of the HEMS towards a change of network state.
Relevant KPIs:
• Improve grid flexibility and stability
• Increase RES share
• Optimize VPP through services offered to DSOs
UC06 – Consumers engagement in Demand Side Management Programs utilizing feedback mechanisms
This UC applies feedback-based-demand-side-intervention strategies from DSO and/or
Retailers at the residential level to increase residential awareness and engagement to demand-
side management programs.

68
Relevant KPIs:
• Increase residential demand flexibility
• Decrease residential energy use
• Increase awareness and engagement of residential customers in demand-side
management programs
UC07 – Consumer's engagement in demand response programs utilizing a socio-economic context
This UC deploys qualitative and quantitative behavioral analysis to determine the of social
interactions and cultural values to the energy exchanges between households, and consumer
attitudes towards benefit and comfort.
Relevant KPIs:
• Employment of community-based social marketing
• Increase engagement in demand response programs
UC08 – Consumer's engagement in demand response programs utilizing personalized comfort/health-oriented services
This UC demonstrates innovative approaches to obtain consumers' realistic comfort/wellbeing
level with minimum intervention. Utilization of wearable devices which obtain specific
physiological data to accurately measures consumers' level of comfort and wellbeing.
Relevant KPIs:
• Obtain consumers' realistic comfort/wellbeing level
• Provide consumers with pertinent personalized feedback notifications
UC09 – Consumer's engagement in demand response programs utilizing digital twins' prediction capabilities for dynamic VVPs
This UC deploys Digital Twins with a human-machine interface to offer an interactive
experience to consumers and communities. This will allow for automated explicit demand
response processes integrated with platforms of relevant stakeholders (e.g., DSOs and
aggregators).
Relevant KPIs:

69
• Automation of explicit demand response processes
• Optimize demand flexibility considering weather and energy system constraints
Engage members of Digital Twin communities to use interactive dashboard (to explore
the model and information it contains)
5.1 KPIs of Pilot Studies
In this section, the four Pilot demonstrations of the TwinERGY project are reviewed. These
findings are the basis for the complete KPI table in section 5.3. It should be noted that these
are just summaries of the pilot demonstration and the related KPIs, therefore, not all details
and specific KPIs are discussed.
Pilot Demonstration in Bristol, UK
Bristol's One City Plan aspires to connect all its citizens with services and transport that are
efficient, sustainable, and inclusive. Thereby TwinERGY will enable them to make energy more
affordable through intelligent grid DNR control processes and management. The Digital Twin
technologies will be explored to increase citizen engagement, improve energy efficiency and
promote sustainable behavior change.
Relevant KPIs:
• Minimize energy cost for the end-user
• Increased citizen engagement
• Improved energy efficiency
• Increase investments of prosumers in the energy system, data generation, and
contribution to community schemes
Pilot Demonstration in Hagedorn in Hagedorn Village, Steinheim, North Rhine-Westphalia, Germany
Through the participation in the TwinERGY project and pilot study, the city administration of
Hagedorn village wants to increase renewable energy use among the citizenry and inspire
them to increase their interest in energy-related issues. Specifically, the low-voltage
infrastructure will be improved and expanded through advanced measurement technology,
electrical circuit technology, communication technology, and electrical storage. The goal is to
make the whole neighborhood Smart Grid compatible.
Relevant KPIs:
70
• Achieve efficient energy use
• Higher RES share in energy consumption
• Significant increase in consumer interest (in energy-related measures)
• Increase the flexibility of micro-grid
• A larger share of self-produced solar power locally
• Increase customer satisfaction and social benefits
• Increase end-user participation by 50%
Pilot Demonstration in Benetutti Smart Community, Italy
The regions' currently poor connection with the national power grid and the non-existent
connection to the natural gas network forces Sardinia towards electrification of their own
energy system. Through the pilot study demonstration, the municipality aims to solve power
fluctuation problems by developing a flexible and sustainable energy grid. Moreover, its
citizens will be engaged in DR programs through economic incentives and user-friendly
interfaces. The forecasting capabilities will create a knowledge base and system that can
monitor and manage the energy exchange based on smart contracts and blockchain
technology on a community level.
Relevant KPIs:
• Increase RES share
• Increasing consumer participation
• Balance the grid (reduce consumption during peak hours, increase it during low
energy cost periods)
• Optimize energy consumption (through participation in demand response
programs)
• Increase engagement of residential customers in demand-side management
programs
• Provide consumers with personalized feedback notifications
• Maximization of the effectiveness of RES
• Minimize energy costs for the end-user
• Improve demand flexibility and stability
Pilot Demonstration in Athens, Greece
This pilot will focus on engaging local consumers in implicit demand response programs
through a combination of dynamic pricing schemes, feedback mechanisms, and patronizable
human-centric features. Specifically, metering and sensing data from local consumers will be
analyzed to follow behavior profiling and forecasting for individual consumers. These will then

71
be classified and segmented based on their actual, locally estimated flexibility. This analysis
will act as a baseline for the realization of consumer-centric demand response programs.
Relevant KPIs:
• Increase engagement of residential customers in demand-side management
programs
• Provide consumers with personalized feedback notifications
• Deliver clusters of flexibility profiles of consumers (against varying electricity
prices)
• Minimize energy costs for the end-user
• Preserve comfort of consumers
• Balance the grid / Reduction of peak loads
• Automation of explicit demand response processes
• Comply with Energy Efficiency obligations by EC
5.2 KPI Summary
Table 6 illustrates the previously presented KPIs of Use Cases and Pilot studies in a summarized
and structured format.

72
Table 6: KPIs of Use Cases and Pilot studies
KPIs Literature Use Cases Pilot Demonstration
1. RES share in energy
consumption
UC02, UC05 Athens, Hagedorn,
Benetutti
1.1 Increase RES share Olkkonen et al.
(2018). DOI:
10.1016/j.energy.20
18.08.210
UC05 Hagedorn, Benetutti
1.2 Increase RES share in
energy consumption of
domestic and tertiary buildings
Frangou et al.
(2018). DOI:
10.1016/j.renene.20
18.03.001
UC02 Athens, Benetutti
2. Reduction of peak loads UC03, UC04,
UC05
Athens, Benetutti,
Hagedorn
2.1 Reduced congestion Ghazvini et al.
(2019). DOI:
10.1016/j.segan.201
8.100185
UC03 Athens
2.2 Balance the grid - UC04 Athens, Benetutti
2.3 Improve grid quality and
reliability
Ourahou, Ayrir, El
Hassouni, & Haddi
(2020). DOI:
10.1016/j.matcom.2
018.11.009
UC04 Benetutti, Hagedorn
2.4 Optimize VPP through
services offered to DSOs
Park & Son (2020).
DOI:
10.1016/j.apenergy.
2020.115222
UC05 Athens
3. Self-consumption ratio UC01, UC04 Hagedorn
3.1 Improve self-consumption
from PV
Gomez-Gonzalez,
Hernandez, Vera &
Jurado (2020). DOI:
10.1016/j.energy.20
19.116554
UC01 Hagedorn
3.2 Establishment of
microgrids
An, Lee, Yeom, &
Hong (2020). DOI:
10.1016/j.apenergy.
2019.114335
UC04 Hagedorn
4. Penetration of dynamic
energy tariffs
UC04 Bristol, Hagedorn

73
4.1 Prosumer engagement in
local energy trading markets
Cramer et al. (2019).
DOI: 10.34890/555
UC04 Hagedorn
4.2 Increase investments of
prosumers in energy system,
data generation and
contribution to community
schemes
Inês et al. (2020).
DOI:
10.1016/j.enpol.201
9.111212
Bristol
5. Active participation rate
through user
engagement and
acceptance
UC06, UC07,
UC08, UC09
Athens, Benetutti
Bristol, Hagedorn
5.1 Increase awareness of
residential customers in
demand-side management
programs
Boogen, Datta, &
Filippini (2017). DOI:
10.1016/j.eneco.201
7.04.006
UC06 Hagedorn
5.2 Increase engagement of
residential customers in
demand side management
programs
Parrish, Heptonstall,
Gross, & Sovacool
(2020). DOI:
10.1016/j.enpol.201
9.111221
UC06, UC07, UC08 Athens, Benetutti,
Bristol.
5.3 Employment of
community-based social
marketing
Gordon, Waitt,
Cooper, & Butler
(2018). DOI:
10.1016/j.jenvman.2
018.02.046
UC07 Benetutti
5.4 Engage members of Digital
Twin communities to use
interactive dashboards
- UC09 Bristol
6. Customer
Responsiveness
UC01, UC08,
UC09
Athens, Benetutti,
Hagedorn
6.1 Increase consumer
participation in demand
response programs
Alasseri, Rao, &
Sreekanth (2020).
DOI:
10.1016/j.rser.2019.
109490
UC01 Hagedorn, Benetutti
6.2 Provide consumers with
personalized feedback
notifications
Khosrowpour, Xie,
Taylor, & Hong
(2016). DOI:
10.1016/j.apenergy.
2016.10.036
UC08 Benetutti, Athens

74
6.3 Automation of explicit
demand response processes
Samad, Koch, &
Stluka (2016). DOI:
10.1109/JPROC.201
6.2520639
UC09 Athens
7. Total energy reduction
against discomfort level
constraint
UC03, UC06 Athens
7.1 Reduce CO2 emissions - UC03 Athens
7.2 Decrease residential energy
use
Chatzigeorgiou &
Andreou (2021).
DOI:
10.1016/j.rser.2020.
110187
UC06 Athens
7.3 Preserve comfort of
consumers
Vázquez-Canteli &
Nagy (2019). DOI:
10.1016/j.apenergy.
2018.11.002
Athens
7.4 Comply to Energy
Efficiency obligations by EC
Fawcett, Rosenow,
& Bertoldi (2019).
DOI:
10.1007/s12053-
018-9657-1
Athens
8. Customer satisfaction UC01, UC03,
UC08
Athens, Benetutti,
Bristol, Hagedorn
8.1 Minimize energy costs for
the end user
Orlov, Sidorova, &
Samoilov (2020).
DOI:
10.1109/ICIEAM484
68.2020.9111964.
UC01, UC03 Bristol, Benetutti
8.2 Obtain consumers' realistic
comfort/well-being level
Ornetzeder, Wicher,
& Suschek-Berger
(2016). DOI:
10.1016/j.enbuild.20
16.02.036
UC08 Athens
8.3 Increase satisfaction and
social benefits
Shin & Managi
(2017). DOI:
10.1016/j.enpol.201
7.07.048
Hagedorn
9. Demand Flexibility UC04, UC05,
UC06, UC09
Athens, Benetutti,
Hagedorn

75
9.1 Launch decentralized
energy transaction platform
Han, Zhang, Ping, &
Yan (2020). DOI:
10.1016/j.energy.20
20.117417
UC04 Benetutti
9.2 Improve demand flexibility
and stability
Chae & Rae (2016).
DOI:
10.1016/j.apenergy.
2016.07.021
UC05 Hagedorn, Benetutti
9.3 Increase residential
demand flexibility
Stavrakas & Flamos
(2020). DOI:
10.1016/j.enconman
.2019.112339
UC06 Athens
9.4 Optimize demand flexibility
considering weather and
energy system constraints
Yongbao et al.
(2018). DOI:
10.1016/j.enbuild.20
18.08.003
UC09 Athens
9.5 Deliver clusters of flexibility
profiles of consumers
- Athens
5.3 KPI – Stakeholder Matrix
The KPI-Stakeholder Matrix presented in the following two pages visualizes the KPIs identified
in the KPI Summary Table 7 and the involvement of the Stakeholder groups, thereby acting as
a roadmap to assist stakeholders to be involved, satisfied, and informed in the pursuit of the
applicable KPIs.

76
Table 7: KPI Summary
Key Performance Indicators (KPIs)
1. RES share in
energy
consumption
2. Reduction of peak
loads
3. Self-
consumption
ratio
4. Penetration of
dynamic energy
tariffs
5. Active participation through
user engagement and acceptance
Stakeholder 1.1 1.2 2.1 2.2 2.3 2.4 3.1 3.2 4.1 4.2 5.1 5.2 5.3 5.4
Residential users B C B B B A D B D D D D C D
Commercial users B C B B B A D B B B - - C -
Industrial users C B B B B A D B B B - - C -
DERs D D B B B B D B B B - B C -
DSOs C C D D B D B B B B - B A -
TSOs C C D D B C B B B B - B A -
Policy-makers A A D A D A A D D A D
Regulators A A D A D A A D D A D
Aggregators D D C C C D D D B C D -
ESCOs C C C C B C B B B C A -

77
Key Performance Indicators (KPIs)
6.Customer
responsiveness
7. Total energy
reduction against
discomfort level
constraint
8. Customer
satisfaction 9. Demand flexibility
Stakeholder 6.1 6.2 6.3 7.1 7.2 8.1 8.2 9.1 9.2 9.3 9.4
Residential users D C B D D C C C C C B
Commercial users D C B D - C C C C - B
Industrial users D C B D - C C C C - B
DERs A A B A A - - - - - -
DSOs A A B A A B A D D D D
TSOs A A B A A B A D D D D
Policy-makers A A D A A D A A A A A
Regulators A A D A B A A A A A A
Aggregators C D D A D D D C D D D
ESCOs C C D A D D B B B B B

78
6/ Stakeholder Mapping As one of the largest abstracts and citation databases of literature, Scopus was used for data
retrieval for this analysis. The exported information encompasses citation information
(Author(s), Author(s) ID, Document title, Year, Source title, volume, issue, pages, Citation count,
Source & document type, Publication Stage, DOI, Open Access), and abstract and keywords
(Abstract, Author keywords, Index keywords). The period used is from 2005 to 2021.
The following figures were retrieved using bibliometrix and biblioshiny R packages on
RStudio, used to conduct bibliometric analysis and visualization. More than 200 articles were
retrieved from Scopus using the following keywords: demand response, prosumers, TSO, DSO,
aggregators, regulators, saving, stakeholder. In order to narrow down the voluminous results,
the subject area was set to "energy".
The keywords plus "offers more descriptive trends than the author's assigned keywords" (Nasir
et al., 2020). For this reason, the following co-occurrence network figure was retrieved using
keywords plus. Figure 6 represents a co-occurrence network with keywords plus. It is a
visualization of how frequently those keywords appeared together. The clustering algorithm
used is "Louvain" and the normalization used is "association". Figure 7 represents the main
information about the collection; the descriptive characteristics of the dataset.
Figure 6: Co-occurrence network with keywords plus

79
Figure 7: Main information about the dataset
80
7/ Interviews
7.1 Interviews with stakeholders
Semi-structured in-depth interviews were developed with energy field stakeholders and
consumers to gain insights on Stakeholders' requirements and Use Case scenarios. The
interviews had the following objectives: (1) to understand participants' attitudes regarding
green energy engagement and (2) to clarify the barriers and drivers for energy-saving and
green energy production.
Research Procedures
In total, 57 semi-structured interviews and workshops lasting 30-60 minutes were developed
with energy field stakeholders (n = 7) and consumers (n = 50). Following participants' informed
consent, interviews were recorded and transcribed, respecting TwinERGY's Ethical Guidelines
and GDPR procedures. Table 8 provides further detail regarding the stakeholders.
The data analysis technique chosen is the technique of content analysis. Franco (2008) argues
that content analysis is a research procedure where the starting point is the message, which
expresses a meaning from oral or written, gestural, figurative, or documentary methods. For
Bardin (2004), this method of analysis has the objectives of overcoming the uncertainty of the
information and generating the enrichment reading, as content that confirms the subscribed
message is discovered, generating a greater understanding of the content obtained.
Thus, the analysis of the interviews consisted of message comparison and classification
operations. Categorization is the crucial step in this type of analysis, as it is defined as the
process of classification of messages. In the case of this research, the categories were obtained
following a posteriori method in both stakeholder and consumer interviews (Bardin, 2004).
Stakeholders' interviews analysis followed three a posteriori categories, that were created to
capture stakeholder's knowledge regarding the generation of renewable energy by prosumers.
Those are: (1) Consumer engagement: motivations; (2) Barriers to achieving renewable energy;
(3) Generating renewable energy: The prosumer, drivers, and motivations.

81
Table 8: Stakeholders' interviews details
Participant name Country Occupation
Stakeholder 1 (S1) UK City Councillor
Stakeholder 2 (S2) UK Energy Entrepreneur and Consultant
Stakeholder 3 (S3) UK Analyst at an energy company
Stakeholder 4 (S4) Germany Employee at an energy company
Stakeholder 5 (S5) Italy President at an energy company
Stakeholder 6 (S6) Spain Project Manager in Energy
Stakeholder 7 (S7) UK Technical manager at Energy Systems
Note: Any personal information (name, age, etc.) was removed from the report to assure the
following of GDPR guidelines and informed consent from TwinERGY participants.
Consumer engagement: motivations
The engagement and attitudes of consumers towards renewable energy are not
homogeneous. Consumer groups and niches are built by different motivations and barriers. In
general, stakeholders separate these groups into two: the first one is a niche built by early
adopters, those motivated either by their passion for technology, government incentives,
sustainability beliefs (referred by one of our experts as the "Tesla-people"), and or the second
one, those that seek control of their energy expenditures ("energy savers", "budget-conscious
consumers").
One important driver is environmental awareness. However, stakeholders consider this factor
as not being isolated; that is, many drivers such as fiscal incentives need to be considered to
reduce the gap between attitudes and real behavior. Thus, Stakeholder 2 (UK) mentioned:
"I think there is a large group of people that have now accepted that climate change
is an important issue, and they feel early powerless to do much about it. It's a huge
problem and they count too much and I think there's a very big attraction in demand

82
response it's something they can do they can sign up for the service like this and feel
they're doing something good for the environment so that can be a driver people care
about their local community of nothing confident in many ways is reinforced that local
resilience neighborhood doing something that supports local generation where I can
point at a micro hydro scheme or a community wind farm" (Stakeholder 2, UK)
Besides green values being a strong driver for this consumer niche, stakeholders argue that it
is not the only one as self-completion and fiscal reward motivations are relevant. Stakeholder
3 (UK) complements that:
"historically there were a lot of environmental motivations the early adopters it was
based on environmental motivations but nowadays it's fiscal".
Competition and self-completion were also mentioned as key consumer drivers. In this way, a
niche of consumers is motivated to demonstrate that they are doing something more
significant, representing a self-completion by doing a good action for the planet or even as a
competition between the local community. In this line, Stakeholder 2 (UK) posited that "there
are people that for various reasons will care about competing with their neighbors showing that
they agree no engaged moral getting the badge for being the best in their neighborhood or the
best in there play group".
The second group is mentioned by the stakeholders as the end consumer sees energy as
something practical, that is, he just wants to pay a fair price, and, whether or not he has control
over his energy or sustainable energy. In this way, this group is considered by the stakeholders
as the majority. Guided by the functionality of the energy, individuals from this group consider
energy as something that must be practical and functional, convenient, and with fair prices.
Stakeholder 2 (UK) reinforces consumers´ low involvement and convenience necessity by
mentioning: "I think for a lot of people they just want something they can sign up for and forget
about it and they got plenty do with their-lives.".
Thus, consumers seek little involvement and fair cost, and others who are more involved and
seek energy control or even the production of their own energy. For instance, Stakeholder 2
(UK) explains that dynamic tariffs are a route to achieving renewable energy because it is a
flexible way. However, it is not equally attractive to all consumers, considering their different
limitations and motivations, as per the quote below.
Early adopters like to be the part of lightness thing, like to be in control of their energy,
people engage to dynamic tariffs. This is one group. Large group that just want energy
to work, feels that is expensive. Different people want different things so dynamic
tariffs will work for some people helps to reduce the charge of them but having some

83
sort of tec is attractive. Equally achieve that giving the control completely to the energy
company with a fair tariff. Two different routes to achieve that. More people easily and
simplicity and a certain group would preferer more dynamic tariffs. By engaging in
those tariffs those people can reduce and help to create a case for future generations."
(Stakeholder 2, UK)
Barriers to achieve higher usage of renewable energy
The financial barrier is the most cited among all stakeholders. Stakeholder 1 (UK) argues that
public policies and companies need to "Reward consumers to see the value of this. For people
that already can afford this, it will be even cheaper with government support." Thus, the cost of
these technologies require new business models to achieve mainstream acceptance:
"…risks of exacerbating financially constrained consumers, how do we find business
models that allow all consumers to benefit from this technology, not the consumer
who already has an EV and solar panels etc." (Stakeholder 1, UK)
One way to overcome the financial burden would be to reward consumers, that is, using a
direct reciprocity system. Thus, stakeholders explain that individuals will adopt it if they gain
something back, especially savings. Thus, a big challenge for the future of renewable energy
for the mainstream is "How do we find the business model to bring the technology to those who
cannot afford to it? (…) these services are offered in a niche place, not found in day-to-day
services, energy services in the UK are not offering that as their core offers." (Stakeholder 1, UK).
Thus, all stakeholders agree that without financial motivation, the mainstream consumers
cannot see the advantages of payback for engaging in renewable energy.
Another relevant mentioned barrier is the lack of knowledge for the mainstream market.
Stakeholder 1 highlights that those services are usually targeted for a niche market, but opens
the possibility to spread for the big energy suppliers: "What is already happening in the
marketplace? The barrier is that those services are offered in a niche place but are not generally
available. People don't hear about this. Big energy suppliers could offer this." Further,
stakeholders complement that, more than education, consumers need convenience and to
clearly see the advantages, as explained by S3 and S1 (UK).
"I don't really see a circumstance where you would need to educate a customer on
grid capacity without that being a reason as in. I'm going to give you her manager
management system to reduce grid capacity but you wouldn't just go to an end
customer here's all you need to know about your local DSO grid capacity stricken
streets. Yeah, they don't, even most customers don't even know who their DSOs are.
They just sort distribution system operators." (Stakeholder 3, UK)

84
Besides the convenience of distribution, as being offered by big energy suppliers, our data
also show that convenience to use is a challenge for achieving higher consumer engagement.
Stakeholder 2 (UK) posits that "it's still very early days does this not very wide adoption of home
energy management concerning the UK and so it people still developing their propositions I think
again a lot of it will be about convenience". Interviewed 1 adds by mentioning the difficulty of
many technologies: "the process of implementing smart meters in consumers' houses (a lot of
boxes and wires); people would care about keeping switched on a box that is linked to everything
(heating, Wi-Fi,…), it should not be a secondary box"
Considering this, stakeholders argue for the necessity of users' convenience, as informed by
Stakeholder 2 (UK):
"Like I've got my car my heating system my hot water tank various white goods. If
anything, that simplifies and gives me one place to sign up for service and then
coordinate all that has to be attractive. I think there is a value driver in the sense that
managing the home as an integrated portfolio can create more value than managing
individual clients"
Thus, a big challenge for the future of renewable energy is "How do we find a business model
to bring the technology to those who cannot afford to it?". Consumers can be differently
motivated to engage in renewable energy. According to Stakeholder 1 (UK), co-designing with
companies and community engagement creates more legacy. That is, the co-creation of
companies with the local community is necessary in order to empower communities to take a
league.
Further, bringing the overall investment down is another important factor that can increase
consumers' engagement in renewable energy. For the first interviewee, only a niche can afford,
and Stakeholder 3 (UK) complements for a higher engagement and involvement, consumers
need to realize which are the advantages for it.
"It would need something bigger like public policy or governmental incentives for
people to adopt you. You look at the market development in Europe and the countries
are doing better have the best fiscal policies you'll pay back time for a lot of batteries
at the moment is still 10 years which is a long time yeah that" (Stakeholder 3, UK)
Generating renewable energy: The prosumer, drivers, and
motivations
Rising shares of fluctuating renewables increase the need for flexibility in the power market.
At the same time, the emergence of the prosumer has created new opportunities for the co-

85
creation of distributed flexibility. Prosumer is a new term coined to refer to the consumer that
both produces and consumes the energy:
"For a lot of people, 'am I a prosumer or not' is not something they think about. People
care about convenience. Being a prosumer is not the end goal for most people, they
become a prosumer because it gets them somewhere." (Stakeholder 4, GE).
Energy is mainly accomplished through rooftop solar panels, heat pumps, and electric vehicles.
Stakeholder 3 (UK) argued that:
"Ideally during sometimes you will buy energy from the from the network and another
times where there are more demands he could actually sell by the same time that uses
his own energy. In this moment, it's called a flexibility market where the consumer
becomes a prosumer".
The importance of consumer flexibility in order to build an energy network is reinforced by
stakeholder 4 (GE):
"For our company is very important in the future use flexibility of the consumer so if
a consumer hasn't strike system, so, if he can use his own energy that he gets from the
roof, the future consumer will be a prosumer."
Thus, much effort needs to be made to a consumer who has a lot of flexibility and technologies
to become a real prosumer. In this sense, stakeholders point to the challenges that the market
is facing to boost the prosumer activity are: to produce and offer products like electric vehicles
capable of doing that, achieve regulation flexibility adaption, and create engagement between
consumers and the network and diminish financial barriers.
Furthermore, one challenge pointed by the stakeholders is the difficulty to become a prosumer
in the city, compared to consumers who have a land of a house.
"We have a lot of prosumers and wind energy in Germany. The big problem, the main
for the future is getting renewable energy in the big cities. I mean, in a land you can
have a house. But the main problem is to rent small house or flat, you don't have the
possibility to become a prosumer or producer of energy. People who rent a house they
don't need to be a prosumer because they don't have advantage to do it. (Stakeholder
5, IT)"
Stakeholder 4 (GE) reinforces the challenge to be a prosumer in big cities:

86
"In big cities you don't have the flexibility for being a prosumer. But the industry is a
very big part, the industry is also producing energy. Aware of different targets, types
of building to increase flexibility."
In a general way, stakeholders are optimistic regarding prosumer activity but mentioned that
much effort from industry, policymakers, and the local community needs to be done.
Regarding the financial reward, Stakeholder 4 explains that "the regulations are tough to
become a real flexible consumer or producer, but it's on the way I think in about 5 or 10 years
the real consumer can be a producer or prosumer".
Further, stakeholders acknowledge the lack of technology made available for the final
consumer to be a prosumer, as stakeholder 5 explains:
"I don't think the big problem is that people don't want mobility. People would want
to buy electric car and want to use it as energy storage for the own house, so they
don't need to put energy storage to the house. Need for partners to storage station to
load the car with energy and they are all in the development, this is the big problem,
we don't know how expensive this could be. Only some cars have this possibility as
Nissan, Mitsubishi and Honda, which can load and produce energy." (Stakeholder 5,
IT)
The regulation of prosumers to enter the market, promoting guarantees are fundamental
factors to be explored by the energy industry, as explained by stakeholder 5:
"A prosumer is somebody that produces energy and consumes it. But in, I would say,
with a small percentage, with a small amount, and what we think it would be useful
for consumers to have them enter in the market of energy exchange, of let me say, of
asking and building of energy so what is called the energy market the daily energy
market to help them become real player. But normally, when you have somebody who
is selling energy to somebody else, might be a community, the neighbor, or even the
market you often need guarantees" (Stakeholder 5, IT).
Finally, stakeholders argue regarding the importance of prosumers recognition as players of
sustainability promotion to engage the local community and promulgate the activity for new
consumers:
"I believe sustainability should be recognized for that, what would mean, for example,
to be getting rewarded for green energy, for the energy they produce from new
sources, and give it to the community to the neighbor or to the provider so the driver

87
(for energy sustainability) could be the fact of being recognized as an active player."
(Stakeholder 5, IT).
In this sense, our data shows that green self-identity plays an essential driver for prosumer
activity. However, it is not the only driver, as the players need to improve regulations flexibility
adaptation where rewarding and flexibility could contribute to this sustainable activity.
7.2 Interviews with consumers
Research Procedures
Consumers were requested to answer different in-depth, open-ended questions in which they
reported their drivers and barriers regarding their energy reduction, purchase of green energy,
motivation to produce energy, and, finally, their attitudes regarding the future of sustainable
energy. Participants were recruited online, and in-depth responses from the different target
groups of the project were obtained. A total of 50 consumers from the United Kingdom (UK),
Italy (IT), Greece (GR), Portugal (PT), and Germany (GE) participated. Please see Table 9 for
further detail on the consumers’ characterization.
Table 9 Consumers’ characterization
Country Number of
Participants
Average Age Average people living in
the household
Germany 10 47 2.8
Greece 10 49 3.8
Italy 10 47 3.2
Portugal 10 44 2.9
United Kingdom 10 48 3.0
Gender Number of
Participants
Average Age Average people living in
the household
Female 20 48 3.1
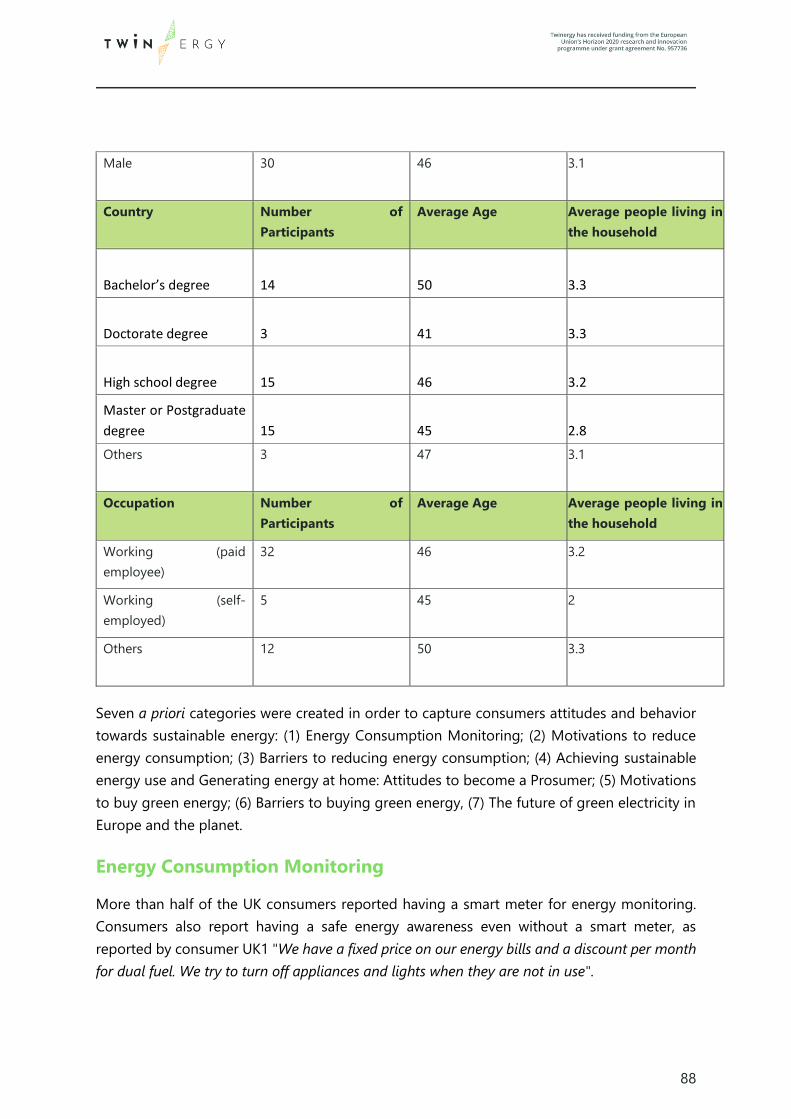
88
Male 30 46 3.1
Country Number of
Participants
Average Age Average people living in
the household
Bachelor’s degree 14 50 3.3
Doctorate degree 3 41 3.3
High school degree 15 46 3.2
Master or Postgraduate
degree 15 45 2.8
Others 3 47 3.1
Occupation Number of
Participants
Average Age Average people living in
the household
Working (paid
employee)
32 46 3.2
Working (self-
employed)
5 45 2
Others 12 50 3.3
Seven a priori categories were created in order to capture consumers attitudes and behavior
towards sustainable energy: (1) Energy Consumption Monitoring; (2) Motivations to reduce
energy consumption; (3) Barriers to reducing energy consumption; (4) Achieving sustainable
energy use and Generating energy at home: Attitudes to become a Prosumer; (5) Motivations
to buy green energy; (6) Barriers to buying green energy, (7) The future of green electricity in
Europe and the planet.
Energy Consumption Monitoring
More than half of the UK consumers reported having a smart meter for energy monitoring.
Consumers also report having a safe energy awareness even without a smart meter, as
reported by consumer UK1 "We have a fixed price on our energy bills and a discount per month
for dual fuel. We try to turn off appliances and lights when they are not in use".

89
In Italy, Greece, and Portugal, consumers reported monitoring less energy, having no access
to electronic meters. Instead, consumer PT2 informs that save energy by controlling energy
consumption: "I have nothing to control the energy, I have to avoid unnecessary energy
expenditures, use low-energy light bulbs".
German participants also reported controlling energy by comparing energy bills, controlling
the energy consumption of not using devices, LED lamps, and low energy-consuming devices
(AAA). Also, some German consumers reported having solar panels and a smart home system
for energy management:
“We have solar panels on the rooftop and get a yearly payment of
around 1,000 Euros/year, so if this would be considered, we do even
make a profit regarding electricity, but I consider this a business.
Monitor: only check arbitrary gauges measuring the consumption. After
living six years in the house, I know the system well and to be stable. I
use some high energy consuming devices (dish washer, washing
machine) to a high extend only when I deplete energy from my solar
panels (for free). LED light, low energy consuming devices installed in
the house (A++ etc.). Some potential where I am not consequent such
as chargers for the cell phones plugged all day but otherwise highly
trimmed to save energy”. (GE5)
Our data showed a clear difference between Germany and the UK's energy consumption
monitoring behavior compared with Italy, Greece, and Portugal. The first group, especially the
UK, reported a higher level of consumption monitoring.
Consumer response Country
We have a smart meter with a monitor. We regularly check this and I keep an eye on the
values using an excel spreadsheet. UK1
We have a fixed price on our energy bills and a discount per month for dual fuel. We try
to turn off appliances and lights when they are not in use.UK8
Yes, we have a smart display which was provided by our energy supplier. The display is
placed in our living room for easy display, but we don't feel the need to constantly monitor
it by app or anything. UK2
United
Kingdom

90
I replaced the old light bulbs with led lamps. I turn off the light every time I leave a room.
IT6
No, no control, I try to turn off possible things when I don't use them. IT4
Italy
I'm trying to keep the energy consumption down by trying to use night charge (cheaper)
as much as I can and I'm also trying to not have appliances and/or lights turned on if
there is no use. Electricity in Greece is very expensive due to having extra charges (state tv
channels + taxes + connectivity of mainland electrical network to islands and other) also
keep an eye on the electricity meter to not surpass a certain amount of kwh because the
cost scales with consumption. GR5
I check the electricity meter from time to time. Ιn addition I try to do my energy-intensive
work during the zone of cheapest electricity consumption. GR7
No external control. I try to be reasonable and use resources in a rational manner (e.g.,
turn off the light when I leave a room, do not use half full dishwasher etc). GR8
Greece
We use the power meter and check it every 3-4 months. GE 4
I manually control every month how high our energy consumption was. GE 3
We have solar panels on the rooftop and get a yearly payment of around about 1,000
Euros/year, so if this would be considered, we do even make a profit regarding electricity,
but I consider this a business. Monitor: only check arbitrary gauges measuring the
consumption. After living six years in the house, I know the system well and to be stable. I
use some high energy consuming devices (dish washer, washing machine) to a high extend
only when I deplete energy from my solar panels (for free). LED light, low energy
consuming devices installed inhouse (A++ etc.). Some potential where I am not
consequent such as chargers for the cell phones plugged all day but otherwise highly
trimmed to save energy. GE 5
Yes, I do have. I only have energy-saving led light bulbs I have a smart home system using
a fritz router. I have connected an AVM FRITZ!DECT 301 temperature control device to the
Fritz router. I have a weekly and daily plan in the router that controls the temperature in
the radiator. I have four smart plugs that measure the energy consumption of my
computer and my tv, and other devices. The devices can be turned on and of by Amazon
Alexa and mir Fire home devices. From time to time, I control the total energy consumption
on the electric meter in the cellar. GE 2
Germany

91
Just by analyzing the bill and the counter PT1
I have nothing to control the energy, I have to avoid unnecessary energy expenditures, use
low-energy light bulbs and buy class A household appliances. PT3
Portugal
Motivations to reduce energy consumption
In general, consumers' primary motivation to reduce energy consumption is in the first place
to save money. Consumers reported that energy is currently very expensive and have this
control in order to reduce the month's expenses.
“Saving money is the primary target. Secondary conserving environment
but mainly because my energy is already green electricity (for heating
my consumption cannot be influenced to a high extend house is
constructed in 2014 and matching all German laws regarding heat
preservation”. (GE4)
“Reduce the cost as it is too expensive”. (UK3)
“To save money. To reduce the costs of energy bills. Also, to put less of a
strain on the environment by consuming as little energy as possible that
is produced by fossil fuels like coal and others”. (GE5)
“Saving money, and maybe also an environmental related reason too”.
(IT3)
The second motivation to save energy is environmental awareness. Most of the consumers
appear to be conscious that energy-saving is associated with sustainable actions and that this
is a way to help with climate change and global warming. This notion of self-efficacy is
important and can be further developed by policymakers to increase consumer engagement
with energy-saving:
“It will be for environmental reasons. As I have mentioned earlier, we
don't have any problem with income and have more than enough
disposable income. So, there is no need for us to be strict with our
spending”. (UK2)
“Doing my bit to reduce energy consumption and fight against global
warming/ climate change. keeping the earth as a safe inhabitable planet
for future generations”. (GR1)

92
“Decrease in Co2 emissions”. (PT2)
Consumer response Country
It will be for environmental reasons. As I have mentioned earlier, we don't have any
problem with income and have more than enough disposable income. So, there is no need
for us to be strict with our spending. UK2
Reduce the cost as it is too expensive. UK3
United
Kingdom
Saving money, and maybe also an environmental related reason too. IT3
High cost of energy. IT7
Efficiency, save money, environment. IT10
Italy
Doing my bit to reduce energy consumption and fight against global warming/ climate
change. Keeping the earth as a safe inhabitable planet for future generations. GR1
Participate in some alternative community with people who actually reflect on their
choices and energy consumption; 2. Know that my behavior would actually bring about
change on a small-scale level; 3. Monetary incentives. GR4
The main motivation would be to pay less. GR2
Environmental reasons, moral reasons, monetary reasons. GR3
Greece
Saving money is the primary target. Secondary conserving environment but mainly
because my energy is already green electricity (for heating my consumption cannot be
influenced to a high extend house is constructed in 2014 and matching all German laws
regarding heat preservation. Refurbishment makes no sense. GE4
To save money. To reduce the costs of energy bills. Also, to put less of a strain on the
environment by consuming as little energy as possible that is produced by fossil fuels like
coal and other. GE5
Germany

93
To be frank, I want to save my money. I hate to waste it - but you can't separate this
"mundane" motivation from other aims - because at the same time it is good for the
environment. GE8
Saving money is the primary target. Secondary conserving environment but mainly
because my energy is already green electricity (for heating my consumption can not be
influenced to a high extend house is constructed in 2014 and matching all German laws
regarding heat preservation. GE10
Energy provider should help customers to obtain clean energy as solar panels or home
wind turbines free of cost. PT2
Firstly, monetary and sustainability conscience PT3
Decrease in co2 emissions PT2
Portugal
Barriers to reducing energy consumption
The barriers mentioned by consumers are entirely associated with the barriers considered by
the interviewed stakeholders. For instance, the most significant barrier pointed out is the
investment cost, as mentioned by consumers:
“if I had much money, I would buy solar panels, a little bit of laziness in
the beginning (smart home is not funny in the beginning), lack of smart
home technical providers, relatively high prices for smart home devices,
lack of alternatives since it is not my house”. (GR4)
“The effort to reach the next improvement level requires high investment
(i.e., battery for solar energy to be more independent to external
delivery). Lowering heat energy with three little kids would imply loss of
comfort/living quality”. (GE3)
Further, consumers also reported the lack of time for monitoring and the technology usability,
as, for instance, the limited choice when individuals need to rely on landlord rules.
“Family and work-life take too much of our mental resources. I don't
think I will have the energy to constantly monitor the behavior of all
family members to save energy. The reward scheme is nonexistent, for
instance, if we manage to save, we should have been rewarded not only
by cheaper energy, perhaps also by giving us some kind of green points”.
(UK3)

94
“The cost for changing energy production systems (like the switch to
solar power system)”. (IT3)
“Limited choice as a home renter. Working from home and being home
most of the time”. (UK3)
For Italians, Portuguese and Greek consumers, the most mentioned barrier is the cost to buy
new devices and the lack of motivation for it. For instance, consumers mentioned the lack of
involvement with energy-saving:
“Comfort, the laziness of not saving energy as a barrier”. (PT3)
“I don't care too much, I don't have the time to think about it”. (IT7)
Participants also reported that the considered barriers are the effort to reach an energy
consumption improvement, lack of convenience, and the effort required considering other
priorities. Data protection from energy monitoring was also pointed as a barrier, as mentioned
by consumer GR10: "Convenience, Data protection."
Consumer response Country
1. Cost. 2. Time 3. Landlord restrictions. UK1
Limited choice as a home renter. Working from home and being home most of the time.
UK2
We are somewhat limited as we do not own our house we rent it, so we cannot make the
required modifications that we would like to such as fitting solar panels etc. UK7
Replacing electrics. UK5
Family and work-life take too much of our mental resources, I don't think I will have the
energy to constantly monitor the behavior of all family members to save energy. The
reward scheme is nonexistent, for instance, if we manage to save, we should have been
rewarded not only by cheaper energy, perhaps also by giving us some kind of green points.
UK3
If we were to be given grants to help with the cost from the government or if our landlord
would fit solar panels on the roof. UK10
United
Kingdom

95
The cost for changing energy production systems (like the switch to solar power system).
IT3
I don't care too much, I don't have the time to think about it. IT7
Italy
Convenience, Data protection. GR10
Maintain a certain quality of life, a lack of possibilities to save more energy. GR1
if I had much money, I would buy solar panels, a little bit of laziness in the beginning
(smart home is not funny in the beginning), lack of smart home technical providers,
relatively high prices for smart home devices, lack of alternatives since it is not my house.
GR4
Greece
The effort to reach the next improvement level requires high investment (i.e., battery for
solar energy to be more independent to external delivery), lowering heat energy with three
little kids would imply loss of comfort/living quality. GE3
No smart home to help manage energy consumption. High desire for energy consumption
for entertainment purposes like TVs or music or similar. Forgetting to turn off unneeded
devices or lights. GE2
Germany
Confort, laziness PT3
high consumption devices PT1
Portugal
Achieving sustainable energy use and generating energy at home:
Attitudes to become a prosumer
The majority of UK consumers indicated solar panels as the way to achieve sustainable energy
use. However, some barriers were pointed to as government regulations, lack of information
and communication from energy players, cost, and renting. Further, consumers from the UK
reported the difficulty of putting the production in practice as it involves a high initial cost.
However, most participants explain that overcoming some barriers is possible.
“Generating sustainable energy at home would be great, e,g. using a
solar panel or the latest technology (boiler heating something, land
based heating?). However, I need to know the cost and the chance of
failure and also the longevity of the technology involved. If this kind of

96
programme is supported by government (and guaranteed in some way),
then I will be more convinced to take it up. Obstacles would be cost and
also regulation of the provider that would help me implement it. There
are a lot of "rogue" traders or companies, and they need to be regulated
properly”. (UK2)
“If we were to be given grants to help with the cost from the government
or if our landlord would fit solar panels on the roof”. (UK1)
The same goes for German consumers, which reported a positive attitude to engage in energy
generation, like hydropower, wind energy, solar energy, affirming that it is not uncomfortable
and possible. However, most believe that regarding the cost to engage, there is common
laziness to remain in a "well-established situation". Further, consumers face the barrier of not
being feasible to generate energy due to their renting house conditions, as mentioned by
consumer GE3:
“Hydro power, wind energy, solar energy - if I had my own house where
I could do what I really want, I certainly would use solar energy. No, I
don't think it is uncomfortable - it is more a kind of common laziness
not to be willing to think over an already "well established situation" and
to change it”. (GE3)
Italians and Portuguese consumers mentioned that to achieve sustainability in energy use,
they would need more information from the government and the energy providers.
Consumers also reported having positive attitudes to prosumer activities, especially regarding
the adoption of solar panels. However, the cost is still high for the engagement of end users
as prosumers.
“I would love community-based energy production, I have considered
producing my own electricity but it is not affordable for me at the
moment”. (IT5)
“Government should give us new eco-friendly home appliances for free,
and in this way, we could save money and energy for the planet and for
our wallet”. (IT3)
“Is fundamental that generating sustainable energy at home become
more accessible to everyone. living in an apartment is a big obstacle for
implementing it and the price is still too high”. (PT8)

97
Greece consumers report being more skeptical about the prosumer activity, stating that they
do not have much needed information, problems with the initial cost, and need for
governmental help.
“(...) You can use a bike instead of a car, for instance, but everything you
buy comes from a big supermarket in the other part of the world, I do
not think you make a substantial change.
Things are perhaps worse in Greece as the public is not educated,
respectively and people are insensitive towards sustainability issues. The
lack or problematic function of respective services e.g., recycling or public
transport, makes things even worse. That is (moving to your second
question) in Greece, relative to north European countries, it is definitely
harder to engage in sustainable energy behaviors”. (GR1)
Consumer response Country
It is in practice feasible to have sufficient space to put in solar panels or a small windmill.
However, as mentioned, the intel cost is prohibitive, with the cost being £8000-10000 with
a long payback on the equipment. UK8
Would love to... I can't afford a high initial investment. UK4
I think initially implementing your home to be more energy efficient is really quite costly
and as the house is not ours we are somewhat against spending so much money on a
property that isn't ours so its a bit of a catch 22. UK7
Generating sustainable energy at home would be great, e,g. using solar panel or latest
technology (boiler heating something, land based heating?). However, I need to know the
cost and the chance of failure and also the longevity of the technology involved. If this
kind of programme is supported by government (and guaranteed in some way), then I will
be more convinced to take it up. Obstacles would be cost and also regulation of the
provider that would help me implement it. There are a lot of "rogue" traders or companies,
and they need to be regulated properly. UK2
I would like solar panels but energy usage is too low to qualify.
Should not be uncomfortable. UK1
United
Kingdom

98
I don't think it's uncomfortable but it's often not easy to retrofit into an older property. Our
house is not ideally situated for solar panels and we have little space for the equipment
needed for solar-voltaic. We cannot afford a ground source heat pump. UK6
If we were to be given grants to help with the cost from the government or if our landlord
would fit solar panels on the roof. UK3
I would love to! But the starting setup costs are not affordable for me at the moment. IT7
I would try to use solar cells for fueling desk lamps or something similar. I'm unable to
think of other opportunities. They are not so common and still quite expensive here. IT2
I never thought of producing energy for others. I know solar panels, I know that they are
very expensive but I haven't really known that I could produce energy for others. IT8
I would love community-based energy production, I have considered producing my own
electricity but it is not affordable for me at the moment. IT5
Government should give us new eco-friendly home appliances for free, and in this way we
could save money and energy for the planet and for our wallet. IT3
I think that in our country, the matter of sustainable energy is not enough publicized. IT1
Italy
No, is not uncomfortable to engage but the state isn't helpful at all to achieve
sustainability. Greece is bathed with sun and quite windy, so it's quite easy to create
electricity from those sources but there is no (or too little) will from the state to give reasons
for this to grow. GR10
I could install photovoltaic panels if I did not have financial difficulty in it.
I think it would be relatively inconvenient at first until the new mindset is changed and
installed. GR7
That is to have a lifestyle that is sustainable in a broader way, a more independent lifestyle
in a rural area, where I consume mainly things I produce, alone, or even better as a part
of a group with which we share similar views and values. Currently, I try to reduce
consumption and be highly skeptical on what I buy, what I eat what I throw etc. But
everything is intertwined, I think. You can use a bike instead of a car, for instance, but
everything you buy comes from a big supermarket from the other part of the world, I do
not think you make a substantial change.Things are perhaps worse in Greece as the public
is not educated respectively and people are insensitive towards sustainability issues. The
lack or problematic function of respective services e.g., recycling or public transport, makes
Greece

99
things even worse. That is (moving to your second question) in Greece, relative to north
European countries, it is definitely harder to engage in sustainable energy behaviors. GR1
Not at all, if you are willing to pay a little. I receive my electricity from a certified
sustainable energy provider (Greenpeace Energy). For heating, it is more problematic as it
is used for the whole house (not only for my flat) and powered by gas. GE1
Hydro power, wind energy, solar energy, - if I had my own house where I could do what I
really want I certainly would use solar energy. No, I don't think it is uncomfortable - it is
more a kind of common laziness not to be willing to think over an already "well established
situation" and to change it. GE4
No it's not uncomfortable. Installing solar panels on the roof for one would be a step in
the right direction. But it's not cheap. Also signing up for a new energy contract with an
energy producing company with at least 100% eco produced energy. But also not cheap.
Installing or converting your home into a smart home is also a step in the right direction.
A smart home can manage and save energy. GE2
Germany
Our electrical supply uses more than 60% of sustainable energy but living in an apartment,
it is not suitable to have solar panels PT1
Not it all, our government should support it and energy bills should be cheaper for all PT3
Have energy production on site with free and renewable sources like wind and solar power.
The downside is the regulations that restrict what can be done and also the investments
needed to implement such things for the average citizen PT6
Is fundamental that generating sustainable energy at home become more accessible to
everyone. living in an apartment is a big obstacle for implementing it and the price is still
too high PT8
We could, but for solar panels we'd loose much space in the balcony, plus it might be
difficult to know where to store all the electrical appliances for that. PT10
Portugal
Motivations to buying green energy
Regarding consumers' motivations toward green energy adherence, participants mainly
reported to be motivated by financial savings and that they would engage in green energy If
they could afford it. For instance, some participants mentioned the importance of
governmental support in order to cover the implementation costs:

100
“The benefit should outweigh the current approach. The benefit could
cover cost, implementation cost, reliability as well as other incentives
given by the government to do so. I have never had any conversation
about buying green electricity, but more of green technology to generate
heating for the house”. (UK2)
Consumers in Italy and Greece are motivated in order to save energy and money. However, it
is necessary to increase their perception of reliability in green energy, the infrastructure, energy
policies, and more diversity of players in the energy market:
“I might be motivated by the lower cost of energy.” (IT1)
“The presence of adequate infrastructures”. (IT6)
“Green energy should not be developed at the expense of household
finances, so any financial support would help a lot. Νο, I haven't had any
conversation about buying green electricity”. (GR10)
“I have had conversations about buying green electricity, but I don't
believe it is real green”. (IT7)
Portuguese consumers appear to have low involvement with green energy production. Few
participants reported being motivated in engaging with a low cost, as mentioned by consumer
PT3; however, the prosumer activity in Portugal is still not known by consumers: “I would be
open to it, if I could afford it. Never had any serious conversation about that”. PT3
The United Kingdom and German consumers reported to be already familiar with buying green
energy. However, some argue that the implementation cost, and the type of house, like a
rented house, are important barriers.
“I am already buying green electricity. If the price difference to
conventional energy would be lower (e.g., through subventions), maybe
more customers would change to green electricity”. (GE2)
Consumer response Country
If it was offered by a reliable supplier UK10
We already do buy green electricity UK5
United
Kingdom

101
The house needs to be equipped with more energy efficient appliances and better
insulation in the loft etc but this is not something that the landlord is willing to do. Owning
our own home would definitely motivate us as we would see it as more of an investment
into our future than into someone else's future UK3
The benefit should outweigh the current approach. The benefit could cover the cost,
implementation cost, reliability as well as other incentives given by the government to do
so. I have never had any conversation about buying green electricity, but more of green
technology to generate heating for the house. UK2
I am already interested, I have never talked about it with my family. UK1
Saving a lot of money would be a great motivation towards using green electricity, but
there are few providers in my country. I was never contacted or I never contacted any of
them so far. IT3
I might be motivated by the lower cost of energy IT1
The presence of adequate infrastructures IT6
In Italy there aren't companies selling green electricity. IT2
I have had conversations about buying green electricity, but I don't believe it is really green.
IT7
Italy
It's all about cost. I wouldn't give 1 cent more to buy green electricity. I have never had
this conversation because I don't think the cost allows me to consider it. GR2
Green energy should not be developed at the expense of household finances, so any
financial support would help a lot. Νο, I haven't had any conversation about buying green
electricity. GR10
To actually believe that green electricity is actually "green". One can not exclude the
economic interests related to the modernization of energy policies, especially in corrupted
countries. In Greece for instance, the last two governments have decided to implement
policies towards green electricity production by initiating wind parks all over Greece. That
is 25300 wind turbines imported from foreign multinational companies to be put all over
Greece destroying many sensitive ecosystems and disorganizing completely local
economies. This, without taking into consideration the resistance of local communities
towards such ideas, the lack of planning and the very rapid, obscure and disorganized way
of making public auctions and allocating such enterprises to foreign companies that are
mainly interested in profit. Even more, all this happens while the same governments have,
at the same time, authorized major petroleum companies to extract oil and gas from the
Greece

102
sea, again in areas that have been characterized natura2000. Such controversies do hurt
the belief that green policies are actually pro environmental. Thus, to answer personally,
reasons like the aforementioned result in my reservation to buy green electricity. GR1
What would motivate me would be a cost reduction in the price. Like a certain discount in
signing up for a green energy contract. In other words I would buy green energy but for a
cheaper price then other energy producing sources GE3
I am already buying green electricity. If the price difference to conventional energy would
be lower (e.g., through subventions), maybe more customers would change to green
electricity. GE2
Germany
I would be open to it, if I could afford it. I never had any serious conversation about that.
PT3
I've never had conversations about it but if the price is the same as the other energy
sources, then it would be a good motivation. PT10
If I didn't have the money barrier, there would be no problem PT4
Portugal
Barriers to buy green energy
The majority of the consumers mentioned the cost of green energy compared with
conventional one as the bigger barrier. In general, the cost and the lack of information are the
biggest barriers, especially for Italians, Germans, and Greek consumers. Thus, as mentioned in
the last section, the majority of consumers consider green energy production as being costly.
Consumers need to perceive economic advantages in order to engage in the prosumer
activity.
“The only barrier is if it's much more expensive than normal electricity. I
have never been approached to buy green electricity”. (UK2)
“In most cases, it is more expensive than conventional electricity. Nobody
encouraged me in regards to that yet”. (GE1)
“Apart from the price, I see no other barriers”. (PT5)
Further, consumers reported the need for more variability and reliable providers, financial
barriers, lack of knowledge. The lack of information is also important as few consumers
mentioned not being aware of government and private programs towards green energy.

103
“Reliability of technology and cost. I have an impression that everything
that is green will be more costly than as is. if we were given something
to offset this, then perhaps going green would make more sense. I have
never discussed this, so no one has encouraged or opposed the idea.
However, the analogy of green electricity is an electric-based car. Which
again, I am hesitating to buy due to the cost and reliability of the
technology itself (charging facility, limitation of range, etc.)”. (UK7)
Other barriers mentioned are bureaucracy and the difficulty to reach an agreement between
stakeholders. As reported by the consumers:
“The initial cost of installation and the impossibility of reaching an
agreement with all the people involved”. (IT6)
“Cost of implementation and bureaucratic difficulty from the state. I had
the idea opposed by a relative that bought and implemented such
technology and had little gains”. (GR2)
Consumer response Country
More green energy providers would be great.... I haven't heard anybody opposed to this
idea UK9
Reliability of technology and cost. I have an impression that everything that is green will
be more costly than as is. If we were given something to offset this, then perhaps going
green would make more sense. I have never discussed this, so no one has encouraged or
opposed the idea. However, the analogy of green electricity is electric based car. Which
again, I am hesitating to buy due to the cost and reliability of technology itself (charging
facility, limitation of range, etc.) UK7
The only barrier is if it's much more expensive than normal electricity. I have never been
approached to buy green electricity. UK2
United
Kingdom
For me, the barrier is the cost compared to traditional electricity. I can't afford an increase
in the expenses for the household at the moment. I had a discussion with family and friends
about this topic and some are pro-green electricity and some believe that it is pointless
IT3
The initial cost of installation, the impossibility of reaching an agreement with all the
people involved IT6
Italy

104
There is insufficient information on the possibilities and necessary steps for the green
energy market. At least I have not been informed. GR7
Cost of implementation and bureaucratic difficulty from the state. I had the idea opposed
by a relative that bought and implemented such technology and had little gains. GR2
Greece
In most cases, it is more expensive than conventional electricity. Nobody encouraged me
in regards to that yet. GE1
I got some promotions from the Deutsche Bundesbahn and other offers. I would have got
extra points for my railway card as "motivation" and a bonus. My father has "green"
electricity since this town has a hydro power plant that gives as far as I know power for
the whole city - and they are even quite cheap. GE2
Germany
I don't have much knowledge about green energy and never talked with anyone about it
PT3
Apart from the price I see no other barriers. PT5
Portugal
The future of green electricity in Europe and the Planet
When asked about the future of green electricity and if they can be part of it, the majority of
the consumers provided a favorable response. Positive attitudes and the given importance of
green electricity as a way to achieve sustainability were also highlighted.
Our data also show that consumers are motivated and be part of a green future, as reported
by the following consumers. More than that, some consumers also reported a sense of
responsibility regarding the environment.
“I think everyone can be part of it, whether that be by reducing their own
carbon footprint or something as simple as switching lights off in a room
when they leave it. I think it's everyone's responsibility”. (UK10)
“I believe that green energy is a necessary measure to deal with the
destruction of our planet. Europe has taken initial steps mainly in terms
of the use of electric cars, but I do not know if this is the use of green
energy ... More and more drastic measures need to be taken with the
mandatory participation of all European citizens”. (GR5)

105
Consumers are motivated to engage in green energy, pointing out some changes that would
be necessary to achieve this goal, for instance, by changing governmental incentives and
providing affordable green energy.
“Government could provide some incentives to increase private
investment in this area... I am optimistic that more and more people
would demand the government to take action in the next decade”. (UK8)
“I believe that green energy is a necessary measure to deal with the
destruction of our planet. Europe has taken initial steps mainly in terms
of the use of electric cars, but I do not know if this is the use of green
energy ...More and more drastic measures need to be taken with the
mandatory participation of all European citizens”. (GR5)
“I see green electricity as the future of power in the UK. I would love for
micro-generation to be more affordable”. (UK2)
In general, consumers from the United Kingdom and Germany believe that the future of
sustainability has already arrived in their countries, as wind and solar production is growing.
For instance, consumer UK5 reported that: "It will only increase. The UK has a lot of wind farms
and many houses have solar panels. If they can offer subsidies based on something other than
your perceived income, I would certainly contribute but simply cannot afford to be any more
proactive." (UK5).
Consumer response Country
I see green electricity as the future of power in the UK. I would love for micro-generation
to be more affordable UK2
It will only increase. The UK has a lot of wind farms and many houses have solar panels.
If they can offer subsidies based on something other than your perceived income, I would
certainly contribute but simply cannot afford to be any more proactive. UK5
I think everyone can be part of it, whether that be by reducing their own carbon footprint
or something as simple as switching lights off in a room when they leave it. I think it's
everyone's responsibility UK10
I think this will still be a long way. Although eventually, we will get there. When cost is
offset and enough incentives are given to go for green electricity then it will happen. It just
United
Kingdom

106
needs enough mass to make it more affordable. Yes, I can see myself being part of it once
it becomes more or less the norm and the technology is proven. UK7
Government could provide some incentives to increase private investment in this area..... I
am optimistic that more and more people would demand the government to take action
in the next decade UK8
I feel like Northern Europe is much more ready for green electricity. I would like to be part
of it, perhaps starting from some small appliances, to begin with. IT1
Sure I can but governments must help it. Electric cars, eco-friendly homes: everything is
possible but the single 'small' private person can't make big things: why don't governments
help us with bonuses at zero cost? IT2
I was slowly getting closer to using more and more. I hope they invent ways of changing
things in general – the change has to be general and not personal IT10
It's the future.!!!! If we don't change the electricity to green electricity the atmosphere will
get much worse than it is now. I definitely want to be part of it, but I am afraid that I can't
afford it. IT11
Italy
It's a one way road. Sooner or later, green electricity will be the main productive force of
electricity. I want to be a part of it but only if it greatly benefits my wallet. (I know the
impact to the environment is huge by using fossils and a major issue for the environment
but if you cannot afford something then you cannot have it) GR4
If there is no independent authority both in Europe and globally regarding the issue, I think
it's really hard to implement actual policies that promote green electricity without having
a negative consequence on another environmental factor. The issue requires extended and
transparent public discourse where all stakeholders can participate, taking into
consideration many factors both social and environmental, under such circumstances I
could be part of it. How.... by contributing both with ideas as well as with ky daily practices
and engagement GR7
I believe that green energy is a necessary measure to deal with the destruction of our
planet. Europe has taken initial steps mainly in terms of the use of electric cars, but I do
not know if this is the use of green energy ...More and more drastic measures need to be
taken with the mandatory participation of all European citizens. GR5
Greece

107
Many European countries are moving to more green electricity, the problem is to convince
poorer countries to act. Cooperation's between richer and poorer countries are needed. I
can be part of it by giving a good example. GE1
We are part of it in Germany. In a very short time there will be no more nuclear power
plants. There is more and more wind and solar energy. I am very optimistic. I can save
energy - that is what I do. Maybe I will change to "green" electricity if somebody convinces
me that this is not a fake and something "virtual" only on my bill from my electricity
supplier - without any control. GE2
I can be part of it in future but it depends on the costs. Energy companies should see to it
that they reduce the average costs of electricity for consumers. Green electricity in Europe
has a long way to go, in my opinion. Most energy companies in Europe are still using fossil
fuels like coal and delay modern electricity production for as long as possible unless they
raise prices for consumers out of greed. Similar to oil producing companies. Green
electricity is a good thing for the world and I still have hope for the future. It is very much
possible to have only green energy around the globe. But it will take a long time since
certain greedy companies are delaying it as much as possible GE4
It is 'luckily' still considering the future in Germany. My country's electricity supply is still
becoming greener every year. The main thing one can do to facilitate it is to vote for parties
that support more ambitious climate targets. GE10
Germany
I see Europe more and more aware of sustainable energy sources. I have no idea how I can
be a part of it. PT3
I feel I'm not in a position to do something really meaningful.
Probably green electricity Will be the future but only when the economic powers decide
so. PT5
Portugal
Increasing consumer engagement in demand response programs
Consumers, in general, believe that government and public actors need to provide more
relevant and targeted information to motivate and engage the local community. As reported
by consumer one from UK:
“To become more mainstream, less of a niche reliability and clear cost-
benefit. heavily regulated process to avoid "conning" people due to
unfamiliarity of technology. A lot of incentives are given to take up the
technology”. (UK1)

108
Further, in their opinion, energy policies should be transformed to attend to the mainstream
public's interests. For instance, the participants argue that governments could subside green
energy, reducing its price.
“I think Governments should invest in lowering the costs of the
technology for the self- production of electricity make it more affordable
so more families can be self-sufficient”. (IT5)
Overall, our data show that participants are optimistic regarding the future of green energy:
“I am very optimistic about this issue. However, this is a slow process
that involves all countries on the planet in order to converge in the
production of clean and self-sustainable energies. It involves social,
economic and environmental and other issues”. (PT3)
However, few consumers reported being pessimistic mainly due to the major change needed
in energy policies and other government efforts, such as informed by consumer IT7: "I am not
optimistic about because this requires a 180° change in energy policies and geopolitics."
Consumer response Country
To become more mainstream, less of a niche reliability and clear cost benefit. heavily
regulated process to avoid "conning" people due to unfamiliarity of technology. A lot of
incentives given to take up the technology. (UK, 1)
Price, help from government, easy access. (UK, 4)
Again just more information available to the general public which would create greater
motivation (UK,6)
More encouragement to implement retrofitted solutions. MUCH more efficient government
grants/help. At present they are a pain for the householder and often lead to exploitation
by shady contractors - and less participation by honest and efficient contractors. They
actually do little other than push the price up (UK, 10)
Yes, there are a lot of it, I guess. Over reliance in gas-based energy source as well as the
unclarity of government programs when it comes to green electricity (such as solar panel
installation). the program only lasts a few years, and I read in the news that the
programme has ceased now. Also, some bad news about people being conned about solar
panel installation. (UK, 7)
United
Kingdom

109
A greater public awareness campaign.(IT, 1)
I think Governments should invest in lowering the costs of the technology for the self-
production of electricity to make it more affordable so more families can be self-sufficient.
(IT, 5)
I am not optimistic because this requires a 180° change in energy policies and geopolitics.
(IT, 7)
Italy
The optimistic scenario is that green energy will become very cheap, even free for everyone
to use without cost. However, the pessimistic scenario is that cheap energy will be abused
with a negative impact on the environment (a quick thought is the abusive use of a/c or
heating and the impact on the climate). (GR, 2)
Optimistic, that the government's educate citizens to make informed decisions. It is not
simply nudging them with a benevolent paternalism towards, apparently, right attitudes
and behaviors. Of course, this requires that governments are independent of certain
economic and political think tanks, which I think is rather difficult to happen. (GR, 3)
Pessimistic, things continue as they go until some really crucial point, where again bad
decisions are made due to a lack not of resourcefulness but of actual willingness to face
the problem and the contributing factors with a bold eye. (GR, 5)
I believe that countries must subside the use of green energy and help people to change.
They must also obligate large companies to change their electricity to green or to pay
more taxes. The car industry must also manufacture more electric cars. Children must
learn the advantages of green electricity at school and get used to it. (GR, 6)
Education. Connection with the problem in a personal manner and not with abstract ideas.
Perhaps, personal engagement and motivation with monetary and social incentives as a
short-term way of dealing with it until the long-term solutions can be more effective. (GR,
7)
Greece
I think it largely depends on political decisions and on how much people will understand
the impact of climate change. I am somewhat optimistic that change might be possible,
at least in Germany. (GE, 4)
Install more wind turbines and solar panels where possible. The state should force this with
subventions and raise taxes on non-green energy. Generally, I am slightly more optimistic
than pessimistic here. (GE, 5)
Germany

110
It is simply what we are already doing in Germany - wind energy - solar energy. But there
should be done much more. But hydrogen is also a very good, underestimated power
source for instance for cars. There should be a much greater national and international
effort. The Corona crisis has shown that there is endless money available if we just want
to. With a fraction of the money we all spent against we could have fulfilled many dreams
of climate activists. This might be the optimistic view. But maybe it is simply already too
late - since Europe and Germany cannot save the world if there is not a common worldwide
effort even in the "rising" countries in the so called third. From a technical point of view, I
am optimistic. From the "social" point of view, I think we will fail. (GE, 7)
We need more local networks and more long-distance exchange concepts. I think the old
"wires" will need high investment to compensate for future fluctuations. But manageable.
It will come, latest when globally nuclear power plants become less attractive. They are
still maybe a necessary stable backbone (if you do not want to rely on coal, natural gas
for backup) (GE, 9)
The people should be more informed from politics etc. how important this topic is for the
future. (GE, 10)
The solutions are spreading in the big industry. I think that is less spread at-home
production. (PT, 6)
I'm a pessimist. The solutions, in my opinion, would make major changes in our society.
And major changes would mean major losses to some powerful entities. That is the main
barrier to the so needed changes. (PT, 2)
I am very optimistic about this issue, however, this is a slow process that involves all
countries on the planet in order to converge in the production of clean and self-sustainable
energies. It involves social, economic and environmental and other issues. (PT, 3)
Portugal
7.3 Concluding Remarks
The qualitative interviews have achieved the main goals of (1) understanding participants'
attitudes regarding green energy engagement and (2) clarifying which are the barriers and
drivers for energy-saving and green energy production. Our data showed that, although we
follow a semi-open method of collecting interviews, there is an essential alignment in the
information provided by both stakeholders and consumers.
This alignment reflects the importance of our data as a reflection of the green energy industry.
For example, most stakeholders reported that they currently consider two consumer audiences

111
to be reached through different strategies, when it comes to engaging in green energy. The
first group is considered a niche market that, depending on the country, is becoming
mainstream. This massive consumer market is overall concerned with the environment and its
consequences on the planet. It prefers an engagement with energy-savings and is often in the
role of prosumer producing energy for their home and the local community. The majority of
this group has greater financial power and has overcome the barriers mentioned above related
to the costs of implementation, type of property and lack of government incentives. Moreover,
this group is usually connected with technology and has the motivation to be green energy
pioneers in the control of energy expenditures or in the production of clean energy.
The second consumer group is considered the mainstream by stakeholders. As seen in
consumer interviews, they would be motivated to have a higher engagement with green
energy if it could be cheaper and provide higher benefits when compared with conventional
energy.
In this way, some motivations pointed by consumers and stakeholders are essential in order
to understand how the industry and policymakers could reduce the gap between attitudes and
real behavior. That is, the engagement with sustainable energy would be higher If financial
costs could be diminished, mainly through the increase of government investments in clean
energy, diminishing costs of adherence, and making it more practical to consumers. Further,
consumers also reported their necessity to perceive reliability in clean energy and energy
providers, the necessity to receive more information regarding green energy benefits, and the
reduction of bureaucracy. As also mentioned by the stakeholders, the difficulty in adhering to
green energy also occurs through the type of housing. In other words, consumers who are in
the countryside have more ease of adoption, as well as house owners. The interviews also
illustrate that the minority of consumers interviewed are guided purely by sustainable reasons.
Most consumers reported being led for financial purposes, both in terms of energy-savings
and engagement with clean energy production.
Regarding participant's attitudes toward the future of energy, it can be inferred that most
consumers and stakeholders see green energy as the future of the industry. The reduction of
the environmental consequences caused by conventional energies by increasing the
production and consumption of green energy, is seen mainly as the responsibility of the
government. However, consumers assume that they would like to be part of it. If the cost
barrier could be mitigated and effectively addressed. In other words, our data shows that all
consumers are predisposed to engage in energy-saving and green energy production.
However, our data show that the gap between attitudes and real behavior must still be
bridged; that is, if the costs are less than the benefits, consumers would be motivated to
engage in green energy pursuits.

112
Besides the financial cost barrier, policymakers and stakeholders could motivate consumers to
engage in green energy by educating and creating environmental awareness. Thus,
communication needs to be developed by creating reliability and connection between green
energy providers and consumers, increasing local community involvement, and decreasing the
effort to adhere.
In conclusion, the results of the interviews highlighted the importance of education and
provided rich content of information about some specific KPIs, that were mainly mentioned by
consumers and stakeholders. Those are prosumer empowerment, prosumer engagement in
local energy trading markets, active participation rate through user engagement and
acceptance, minimization of energy costs for the end-user, increased satisfaction and social
benefits, and customer responsiveness.

113
References Alasseri, R., Rao, T. J., & Sreekanth, K. J. (2020). Institution of incentive-based demand response
programs and prospective policy assessments for a subsidized electricity market.
Renewable and Sustainable Energy Reviews, 117, 109490.
https://doi.org/10.1016/j.rser.2019.109490
An, J., Lee, M., Yeom, S., & Hong, T. (2020). Determining the Peer-to-Peer electricity trading
price and strategy for energy prosumers and consumers within a microgrid. Applied
Energy, 261, 114335. https://doi.org/10.1016/j.apenergy.2019.114335
Bardin, L. (2004). Content analysis. 3rd. Lisboa: Edições, 70, 221.
Backlund, S., Thollander, P., Palm, J., & Ottosson, M. (2012). Extending the energy efficiency
gap. Energy Policy, 51, 392-396.
Bertoldi, P., & Boza-Kiss, B. (2017). Analysis of barriers and drivers for the development of the
ESCO markets in Europe. Energy Policy, 107, 345–355.
https://doi.org/10.1016/j.enpol.2017.04.023
Boogen, N., Datta, S., & Filippini, M. (2017). Demand-side management by electric utilities in
Switzerland: Analyzing its impact on residential electricity demand. Energy Economics,
64, 402–414. https://doi.org/10.1016/j.eneco.2017.04.006
Caramizaru, A., Uihlein, A., European Commission. Joint Research Centre, & Europäische
Kommission Gemeinsame Forschungsstelle. (2020). Energy Communities. Stuttgart,
Germany: UTB.
CE Delft. (2016, September). The potential of energy citizens in the European Union. Retrieved
from
https://www.cedelft.eu/publicatie/the_potential_of_energy_citizens_in_the_european_
union/1845
Chatzigeorgiou, I. M., & Andreou, G. T. (2021). A systematic review on feedback research for
residential energy behavior change through mobile and web interfaces. Renewable and
Sustainable Energy Reviews, 135, 110187. https://doi.org/10.1016/j.rser.2020.110187
Chae, K.-J., & Ren, X. (2016). Flexible and stable heat energy recovery from municipal
wastewater treatment plants using a fixed-inverter hybrid heat pump system. Applied
Energy, 179, 565–574. https://doi.org/10.1016/j.apenergy.2016.07.021

114
Chen, Y., Xu, P., Gu, J., Schmidt, F., & Li, W. (2018). Measures to improve energy demand
flexibility in buildings for demand response (DR): A review. Energy and Buildings, 177,
125–139. https://doi.org/10.1016/j.enbuild.2018.08.003
Cramer, W., Vasconcelos, M., Schmitt, C., Armstorfer, A., Beg, N., & Heringer, F. (2019).
Engaging Prosumers in Local Energy Market Business Models.
Crosbie, T. (2016). Demand response in blocks of buildings D2. 1 Market and Stakeholders
Analysis. DOI: 10.13140/RG.2.1.4009.6242
Deelstra, Y., Nooteboom, S. G., Kohlmann, H. R., Van den Berg, J., & Innanen, S. (2003). Using
knowledge for decision-making purposes in the context of large projects in The
Netherlands. Environmental Impact Assessment Review, 23(5), 517-541.
Economidou, M., Todeschi, V., Bertoldi, P., D'Agostino, D., Zangheri, P., & Castellazzi, L. (2020).
Review of 50 years of EU energy efficiency policies for buildings. Energy and Buildings,
225, 110322. https://doi.org/10.1016/j.enbuild.2020.110322
Energy Service Companies (ESCos). (2020). Retrieved from
https://e3p.jrc.ec.europa.eu/node/190
Eskerod, P., Huemann, M., & Savage, G. (2015). Project stakeholder management—Past and
present. Project Management Journal, 46(6), 6-14.
EU Emissions Trading System (EU ETS) - Climate Action - European Commission. (2020).
Retrieved from https://ec.europa.eu/clima/policies/ets_en
European Parliamentary Research Service (EPRS). (2020, July). Will distributed energy resources
(DERs)change how we get our energy? Retrieved from
https://www.europarl.europa.eu/RegData/etudes/ATAG/2020/651944/EPRS_ATA(202
0)651944_EN.pdf
Fassin, Y. (2009). The stakeholder model refined. Journal of business ethics, 84(1), 113-135.
Fawcett, T., Rosenow, J., & Bertoldi, P. (2018). Energy efficiency obligation schemes: their future
in the EU. Energy Efficiency, 12(1), 57–71. https://doi.org/10.1007/s12053-018-9657-1
Fletcher, A., Guthrie, J., Steane, P., Roos, G., & Pike, S. (2003). Mapping stakeholder perceptions
for a third sector organization. Journal of Intellectual Capital.
Fotouhi Ghazvini, M. A., Lipari, G., Pau, M., Ponci, F., Monti, A., Soares, J., … Vale, Z. (2019).
Congestion management in active distribution networks through demand response

115
implementation. Sustainable Energy, Grids and Networks, 17, 100185.
https://doi.org/10.1016/j.segan.2018.100185
Frangou, M., Aryblia, M., Tournaki, S., & Tsoutsos, T. (2018). Renewable energy performance
contracting in the tertiary sector Standardization to overcome barriers in Greece.
Renewable Energy, 125, 829–839. https://doi.org/10.1016/j.renene.2018.03.001
Freeman, R. (1984). E.(1984), Strategic management: A stakeholder approach. Boston:
Pitman, 46.
Geller, H., Harrington, P., Rosenfeld, A. H., Tanishima, S., & Unander, F. (2006). Polices for
increasing energy efficiency: Thirty years of experience in OECD countries. Energy
policy, 34(5), 556-573.
Gomez-Gonzalez, M., Hernandez, J. C., Vera, D., & Jurado, F. (2020). Optimal sizing and power
schedule in PV household-prosumers for improving PV self-consumption and
providing frequency containment reserve. Energy, 191, 116554.
https://doi.org/10.1016/j.energy.2019.116554
Gordon, R., Waitt, G., Cooper, P., & Butler, K. (2018). Storying energy consumption: Collective
video storytelling in energy efficiency social marketing. Journal of Environmental
Management, 213, 1–10. https://doi.org/10.1016/j.jenvman.2018.02.046
Hadush, S. Y., & Meeus, L. (2018). DSO-TSO cooperation issues and solutions for distribution
grid congestion management. Energy policy, 120, 610-621.
Han, D., Zhang, C., Ping, J., & Yan, Z. (2020). Smart contract architecture for decentralized
energy trading and management based on blockchains. Energy, 199, 117417.
https://doi.org/10.1016/j.energy.2020.117417
IEA (2020), Demand Response, IEA, Paris https://www.iea.org/reports/demand-response
Industrial sector energy consumption. (2020). Retrieved from
https://www.eia.gov/outlooks/ieo/pdf/industrial.pdf
Inês, C., Guilherme, P. L., Esther, M.-G., Swantje, G., Stephen, H., & Lars, H. (2020). Regulatory
challenges and opportunities for collective renewable energy prosumers in the EU.
Energy Policy, 138, 111212. https://doi.org/10.1016/j.enpol.2019.111212
InteGrid. (2020). Retrieved from https://integrid-
h2020.eu/uploads/public_deliverables/D7.6_Stakeholder%20consultation.pdf

116
IRENA (2019), Innovation landscape brief: Future role of distribution system operators,
International Renewable Energy Agency, Abu Dhabi. Retrieved from
https://www.irena.org/-
/media/Files/IRENA/Agency/Publication/2019/Feb/IRENA_Landscape_Future_DSOs_2
019.PDF?la=en&hash=EDEBEDD537DE4ED1D716F4342F2D55D890EA5B9A
IRENA. (2019). Solution VI: Aggregating distributed energy resources for grid services.
Retrieved from https://www.irena.org/innovation/Solutions-for-a-Renewable-
Powered-Future/Solution-VI-Distributed-energy-resources-providing-services-to-
the-grid
Kamann, D. J. F. (2007). Organizational design in public procurement: A stakeholder
approach. Journal of Purchasing and Supply Management, 13(2), 127-136.
Karumba, S., Kanhere, S. S., Jurdak, R., & Sethuvenkatraman, S. (2020). HARB: A Hypergraph-
based Adaptive Consortium Blockchain for Decentralised Energy Trading. IEEE Internet
of Things Journal, 1. https://doi.org/10.1109/jiot.2020.3022045
Kestner, M. (1991). First energy efficiency directives under SAVE programme. Energy in Europe,
1(7), 25.
Khosrowpour, A., Xie, Y., Taylor, J. E., & Hong, Y. (2016). One size does not fit all: Establishing
the need for targeted eco-feedback. Applied Energy, 184, 523–530.
https://doi.org/10.1016/j.apenergy.2016.10.036
Local Energy Communities. (2020). Local Energy Communities | Sustainability Through
Renewable Energy. Retrieved from https://localenergycommunities.net/
Martirano, L., Parise, G., Greco, G., Manganelli, M., Massarella, F., Cianfrini, M., … Habib, E.
(2019). Aggregation of Users in a Residential/Commercial Building Managed by a
Building Energy Management System (BEMS). IEEE Transactions on Industry
Applications, 55(1), 26–34. https://doi.org/10.1109/tia.2018.2866155
Mendelow, A. (1991). 'Stakeholder Mapping', Proceedings of the 2nd International Conference
on Information Systems. Cambridge, MA, 5(2), 61.
Mitchell, R. K., Agle, B. R., & Wood, D. J. (1997). Toward a theory of stakeholder identification
and salience: Defining the principle of who and what really counts. Academy of
management review, 22(4), 853-886.

117
Murray-Webster, R., & Simon, P. (2006). Making sense of stakeholder mapping. PM World
today, 8(11), 1-5.
Nasir, A., Shaukat, K., Hameed, I. A., Luo, S., Alam, T. M., & Iqbal, F. (2020). A Bibliometric
Analysis of Corona Pandemic in Social Sciences: A Review of Influential Aspects and
Conceptual Structure. IEEE Access, 8, 133377–133402.
https://doi.org/10.1109/access.2020.3008733
Natale, N., Pilo, F., Pisano, G., & Soma, G. G. (2020). Market Participation of Distributed Energy
Resources for offering Flexibility Services. 2020 17th International Conference on the
European Energy Market (EEM). https://doi.org/10.1109/eem49802.2020.9221926
Neves, D., Scott, I., & Silva, C. A. (2020). Peer-to-peer energy trading potential: An assessment
for the residential sector under different technology and tariff availabilities. Energy, 205,
118023. https://doi.org/10.1016/j.energy.2020.118023
Newcombe, R. (2003). From client to project stakeholders: a stakeholder mapping
approach. Construction management and economics, 21(8), 841-848.
Olkkonen, V., Ekström, J., Hast, A., & Syri, S. (2018). Utilising demand response in the future
Finnish energy system with increased shares of baseload nuclear power and variable
renewable energy. Energy, 164, 204–217. https://doi.org/10.1016/j.energy.2018.08.210
Orlov, A. I., Sidorova, V. T., & Samoilov, K. A. (2020). Energy Storage Control Algorithms to
Reduce the Cost of Electric Energy to Consumers. 2020 International Conference on
Industrial Engineering, Applications and Manufacturing (ICIEAM).
https://doi.org/10.1109/icieam48468.2020.9111964
Ornetzeder, M., Wicher, M., & Suschek-Berger, J. (2016). User satisfaction and well-being in
energy efficient office buildings: Evidence from cutting-edge projects in Austria. Energy
and Buildings, 118, 18–26. https://doi.org/10.1016/j.enbuild.2016.02.036
Ourahou, M., Ayrir, W., EL Hassouni, B., & Haddi, A. (2020). Review on smart grid control and
reliability in presence of renewable energies: Challenges and prospects. Mathematics
and Computers in Simulation, 167, 19–31.
https://doi.org/10.1016/j.matcom.2018.11.009
Park, S.-W., & Son, S.-Y. (2020). Interaction-based virtual power plant operation methodology
for distribution system operator's voltage management. Applied Energy, 271, 115222.
https://doi.org/10.1016/j.apenergy.2020.115222

118
Parrish, B., Heptonstall, P., Gross, R., & Sovacool, B. K. (2020). A systematic review of
motivations, enablers and barriers for consumer engagement with residential demand
response. Energy Policy, 138, 111221. https://doi.org/10.1016/j.enpol.2019.111221
Patel, N., Srinivasan, B., & Srinivasan, R. (2016). Non-intrusive Appliance Load Monitoring for
Electrical Energy Systems Simulation and Analysis – A case study in India. Computer
Aided Chemical Engineering, 2061–2066. https://doi.org/10.1016/b978-0-444-63428-
3.50348-9
Pérez-Lombard, L., Ortiz, J., & Pout, C. (2008). A review on buildings energy consumption
information. Energy and buildings, 40(3), 394-398.
Pisano, G., Chowdhury, N., Coppo, M., Natale, N., Petretto, G., Soma, G. G., ... & Pilo, F. (2019).
Synthetic Models of Distribution Networks Based on Open Data and Georeferenced
Information. Energies, 12(23), 4500. https://doi.org/10.3390/en12234500
Samad, T., Koch, E., & Stluka, P. (2016). Automated Demand Response for Smart Buildings and
Microgrids: The State of the Practice and Research Challenges. Proceedings of the IEEE,
104(4), 726–744. https://doi.org/10.1109/jproc.2016.2520639
Savage, G. T., Nix, T. W., Whitehead, C. J., & Blair, J. D. (1991). Strategies for assessing and
managing organizational stakeholders. Academy of management perspectives, 5(2), 61-
75.
Schleich, J. (2009). Barriers to energy efficiency: A comparison across the German commercial
and services sector. Ecological Economics, 68(7), 2150-2159.
Shen, B., Ghatikar, G., Lei, Z., Li, J., Wikler, G., & Martin, P. (2014). The role of regulatory reforms,
market changes, and technology development to make demand response a viable
resource in meeting energy challenges. Applied Energy, 130, 814-823.
Shin, K. J., & Managi, S. (2017). Liberalization of a retail electricity market: Consumer
satisfaction and household switching behavior in Japan. Energy Policy, 110, 675–685.
https://doi.org/10.1016/j.enpol.2017.07.048
Stakeholder. (2020). Retrieved from https://www.merriam-
webster.com/dictionary/stakeholder
Stavrakas, V., & Flamos, A. (2020). A modular high-resolution demand-side management
model to quantify benefits of demand-flexibility in the residential sector. Energy

119
Conversion and Management, 205, 112339.
https://doi.org/10.1016/j.enconman.2019.112339
Varvasovszky, Z. (2000). A stakeholder analysis. Health Policy and Planning, 15(3), 338–345.
https://doi.org/10.1093/heapol/15.3.338
Varvasovszky, Z., & Brugha, R. (2000). A stakeholder analysis. Health policy and planning, 15(3),
338-345.
Vázquez-Canteli, J. R., & Nagy, Z. (2019). Reinforcement learning for demand response: A
review of algorithms and modeling techniques. Applied Energy, 235, 1072–1089.
https://doi.org/10.1016/j.apenergy.2018.11.002
Venizelou, V., Makrides, G., Efthymiou, V., & Georghiou, G. E. (2020). Methodology for
deploying cost-optimum price-based demand side management for residential
prosumers. Renewable Energy, 153, 228-240.
https://doi.org/10.1016/j.renene.2020.02.025