Development of in situ ion selective sensors for dissolution
11
Analytica Chimica Acta 581 (2007) 181–191 Development of in situ ion selective sensors for dissolution Hugo Bohets a , Koen Vanhoutte b , Roy De Maesschalck b , Paul Cockaerts b , Bert Vissers a , Luc J. Nagels a,∗ a Antwerp University, Chemistry Department, Groenenborgerlaan 171, B-2020 Antwerpen, Belgium b Johnson & Johnson Pharmaceutical Research and Development, Turnhoutseweg 30, B-2340 Beerse, Belgium Received 12 May 2006; received in revised form 27 July 2006; accepted 28 July 2006 Available online 5 August 2006 Abstract The dissolution of formulations of the drugs dapoxetine, paliperidone, cinnarizine, tetrazepam, mebeverine, loperamide, galantamine and ibuprofen was studied by an in-line potentiometric measurement system. The transpose of a Nikolskii-Eisenman type function performed the conversion of potential to percentage of dissolution. A novel gradient membrane electrode was developed especially for dissolution, varying continuously in composition from an ionically conducting rubber phase to an electronically conducting solid state PVC/graphite composite. The gradient part had a thickness of 200 m. The electrodes life span exceeded 6 months. An ion exchange procedure was used to prepare them for one specific drug. This enabled us to use one universal electrode built to measure a wide array of drugs. The system parameters such as accuracy, reproducibility and linearity were presented with the data obtained for the drug dapoxetine. In dissolution, accurate measurements were possible from 10 −9 to 10 −3 M concentrations, for high log P drugs. The effect of t 90 response times on the measurement error was estimated. The t 90 response times of the electrodes were concentration dependent, and varied between 50 and 10 s for, respectively, 10 −6 and 10 −3 M concentrations. Potential drift was studied in detail. The measurements performed with these electrodes showed an accuracy of 1%, and inter- and intra electrode variabilities of 0.6 and 1.7%, respectively. The electrodes were successfully applied in colloidal media containing suspended matter, typically formed during dissolution of tablets. The advantages and pitfalls of potentiometry over the presently used techniques for dissolution testing are discussed. © 2006 Elsevier B.V. All rights reserved. Keywords: Drugs; Potentiometry; In-line; Dissolution; Detection; Sensor 1. Introduction Dissolution testing is one of the most important analyti- cal techniques used in the pharmaceutical industry for testing drug delivery systems such as tablets and capsules [1]. The drug release rate is an important indicator of the manufacturing process, and a tool for the development of new drug deliv- ery systems. The determination of the drug concentration in the dissolution samples is at present mostly performed with UV spectroscopy or HPLC–UV. The latest developments in the automation of dissolution systems are made in the field of in- line UV fiber optics [2–7]. Numerous problems are experienced with the presently used UV spectroscopic technique, as well with classical spectroscopic methods as with the more recent in-line fiber optic technology. The problems are related to the ∗ Corresponding author. Tel.: +32 32653385; fax: +32 32653233. E-mail address: [email protected] (L.J. Nagels). suspensions and colloids which are formed during drug disso- lution, creating turbidity which is problematic for spectroscopy. An extra interfering factor, the presence of air bubbles in the light path, leads to large artefacts in the dissolution profiles which can not be corrected using mathematical algorithms [3]. Another disadvantage is the limited linear range of UV spec- troscopic systems, necessitating modification of the length of the light path. For this purpose, usually a different probe or probe tip has to be applied. Dissolution experiments analyzed by both on- and off-line HPLC–UV systems result in discon- tinuous profiles. These methods require expensive setup and generate additional analysis time. Potentiometric sensors can form an interesting alternative to fiber optics, on- and off-line UV–HPLC, and replace them in the many cases where these methods are problematic. They are less prone to be disturbed by colloidal systems and suspensions, and it will be shown that they can be used in a concentration range spanning up to five orders of magnitude if an appropriate transformation from signal to percentage of dissolution is used. Many potentiometric elec- 0003-2670/$ – see front matter © 2006 Elsevier B.V. All rights reserved. doi:10.1016/j.aca.2006.07.079
-
Upload
independent -
Category
Documents
-
view
4 -
download
0
Transcript of Development of in situ ion selective sensors for dissolution

A
iccgorftdod©
K
1
cddpetUalwwi
0d
Analytica Chimica Acta 581 (2007) 181–191
Development of in situ ion selective sensors for dissolution
Hugo Bohets a, Koen Vanhoutte b, Roy De Maesschalck b,Paul Cockaerts b, Bert Vissers a, Luc J. Nagels a,∗
a Antwerp University, Chemistry Department, Groenenborgerlaan 171, B-2020 Antwerpen, Belgiumb Johnson & Johnson Pharmaceutical Research and Development, Turnhoutseweg 30, B-2340 Beerse, Belgium
Received 12 May 2006; received in revised form 27 July 2006; accepted 28 July 2006Available online 5 August 2006
bstract
The dissolution of formulations of the drugs dapoxetine, paliperidone, cinnarizine, tetrazepam, mebeverine, loperamide, galantamine andbuprofen was studied by an in-line potentiometric measurement system. The transpose of a Nikolskii-Eisenman type function performed theonversion of potential to percentage of dissolution. A novel gradient membrane electrode was developed especially for dissolution, varyingontinuously in composition from an ionically conducting rubber phase to an electronically conducting solid state PVC/graphite composite. Theradient part had a thickness of 200 �m. The electrodes life span exceeded 6 months. An ion exchange procedure was used to prepare them forne specific drug. This enabled us to use one universal electrode built to measure a wide array of drugs. The system parameters such as accuracy,eproducibility and linearity were presented with the data obtained for the drug dapoxetine. In dissolution, accurate measurements were possiblerom 10−9 to 10−3 M concentrations, for high log P drugs. The effect of t90 response times on the measurement error was estimated. The t90 responseimes of the electrodes were concentration dependent, and varied between 50 and 10 s for, respectively, 10−6 and 10−3 M concentrations. Potential
rift was studied in detail. The measurements performed with these electrodes showed an accuracy of 1%, and inter- and intra electrode variabilitiesf 0.6 and 1.7%, respectively. The electrodes were successfully applied in colloidal media containing suspended matter, typically formed duringissolution of tablets. The advantages and pitfalls of potentiometry over the presently used techniques for dissolution testing are discussed.2006 Elsevier B.V. All rights reserved.
slAlwAttpbtg
eywords: Drugs; Potentiometry; In-line; Dissolution; Detection; Sensor
. Introduction
Dissolution testing is one of the most important analyti-al techniques used in the pharmaceutical industry for testingrug delivery systems such as tablets and capsules [1]. Therug release rate is an important indicator of the manufacturingrocess, and a tool for the development of new drug deliv-ry systems. The determination of the drug concentration inhe dissolution samples is at present mostly performed withV spectroscopy or HPLC–UV. The latest developments in the
utomation of dissolution systems are made in the field of in-ine UV fiber optics [2–7]. Numerous problems are experienced
ith the presently used UV spectroscopic technique, as wellith classical spectroscopic methods as with the more recentn-line fiber optic technology. The problems are related to the
∗ Corresponding author. Tel.: +32 32653385; fax: +32 32653233.E-mail address: [email protected] (L.J. Nagels).
fUmbtot
003-2670/$ – see front matter © 2006 Elsevier B.V. All rights reserved.oi:10.1016/j.aca.2006.07.079
uspensions and colloids which are formed during drug disso-ution, creating turbidity which is problematic for spectroscopy.n extra interfering factor, the presence of air bubbles in the
ight path, leads to large artefacts in the dissolution profileshich can not be corrected using mathematical algorithms [3].nother disadvantage is the limited linear range of UV spec-
roscopic systems, necessitating modification of the length ofhe light path. For this purpose, usually a different probe orrobe tip has to be applied. Dissolution experiments analyzedy both on- and off-line HPLC–UV systems result in discon-inuous profiles. These methods require expensive setup andenerate additional analysis time. Potentiometric sensors canorm an interesting alternative to fiber optics, on- and off-lineV–HPLC, and replace them in the many cases where theseethods are problematic. They are less prone to be disturbed
y colloidal systems and suspensions, and it will be shown thathey can be used in a concentration range spanning up to fiverders of magnitude if an appropriate transformation from signalo percentage of dissolution is used. Many potentiometric elec-

1 himic
tblslnpaprppc
ua(wntchd
2
2
aescT
2
l
utgimtt
itvramsi
atohcrtim
letHs
2
TP
D
CLDMPIT
C
G
82 H. Bohets et al. / Analytica C
rodes have been described in the literature which are claimed toe selective for a specific drug. New publications appear regu-arly [8–20], and older work was summarized [21–23]. We havehown recently that the selectivity of these electrodes is heavilyinked to log P (octanol/water partition) [24]. As far as we know,o wide systematic study of in-line drug dissolution profiles wasublished in the literature using in-line potentiometric sensors,lthough some papers dealt with the subject [22,25–28]. In theseapers, no specific calibration methods that allow accurate andeproducible in-line measurements (as good as or better thanresent methods) were proposed. No potentiometric analysis isublished of the difficult (from a potentiometric point of view)ontrolled release formulations.
We will show in the present article how potentiometry can besed reliably for the recording of dissolution curves for ioniz-ble/ionic drugs. This will be done with a single electrode typeone for cations and one for anions) which is applicable to aide variety of drugs. This makes this technique available toon-electrode builders. They can make the electrode suitableo their purposes by simple conditioning with the drug of theirhoice. Conditioning was applied in previous studies [29,30],owever it was never used for this goal or for a wide variety ofrugs (n = 9) in a systematic and uniform manner.
. Experimental
.1. Dissolution apparatus
The dissolution test was performed using a USP 2 (paddle)pparatus. The dissolution instrument was a VanKel VK 7000quipped with standard USP paddles. The apparatus consists ofix vessels containing 900 mL dissolution medium thermostati-ally set at 37 ± 0.5 ◦C, in which a dosage form was introduced.he medium was agitated using a rotation rate of 50 rpm.
.2. Dissolution parameters
For this study we mostly focused on HCl as an acid disso-ution medium, since this is a straightforward medium which is
(Af
able 1roperties of the formulations, dissolution parameters and calculated log P’s of the in
rug log P Label claim (mg)
innarizine 5.78 75operamide 5.58 2apoxetine 4.42 30ebeverine 4.33 135
aliperidone 3.77 4buprofen 3.54 800etrazepam 3.34 50
lozapine 2.24 –
alantamine 1.79 8
a Acta 581 (2007) 181–191
sed extensively. Dapoxetine was measured in 0.1 M HCl, sus-ained release paliperidone was dissolved in 0.001 M HCl andalantamine was dissolved in 0.01, 0.001 and 0.0001 M HCl andn 0.005 and 0.05 M phosphate buffer (pH 7.2). All the above
easurements were performed in standard USP type 2 dissolu-ion apparatus at 37 ◦C. A calibration was applied at the end ofhe dissolution.
Measurements on sustained release ibuprofen, orally dis-ntegrating loperamide tablets, cinnarizine, mebeverine andetrazepam were done in a qualitative fashion in standardolumetric glassware. The qualitative dissolution curves wereecorded at room temperature with the exception of cinnarizinend ibuprofen which were recorded at 37 ◦C. Cinnarizine andebeverine were dissolved in 0.1 M HCl; a 0.01 M HCl dis-
olution medium was applied for loperamide and tetrazepam;buprofen was placed in a 0.05 M phosphate buffer pH 7.2.
For these compounds, dissolution curves were obtained byssuming an end concentration equivalent to 100% dissolu-ion. The endpoint of the dissolution was assumed by formationf a stable plateau in the curve, that lasted at least severalours. At least five measurements were done for these non-alibrated experiments, to check the reproducibility, the mVange observed during the dissolution, and the drift. As a rule ofhumb, an electrode that registers a dissolution curve with a min-mum of 120 mV and low drift (<3 mV/24 h) in a reproducible
anner, will yield good quantitative measurements.Clozapine (log P = 2.24). served as a model for drugs with
og P ≈ 2.5 in quantitative determinations (including calibrationxperiments) at 37 ◦C in standard laboratory glassware appara-us. For these experiments, media containing 0.010 and 0.1 MCl were used. Dissolution parameters and drug properties are
ummarized in Table 1.
.3. Potentiometric electrode
The indicator electrode is made of a PVC cylinder3 mm × 5 mm) with a central cylindrical hole of 1 mm diameter.
copper rod was glued in one side of the hole with Loctite 406®
rom Henkel. The other side of the cylindrical hole is filled with
vestigated drugs
USP 2 Dissolution medium/temperature (◦C)
No 0.1 M HCl/20No 0.01 M HCl/20Yes 0.1 M HCl/37No 0.1 M HCl/20Yes 0.001 M HCl/37No 0.05 M phosphate buffer pH 7.2/37No 0.01 M HCl/20
No0.01 M HCl/370.001 M HCl/37
Yes
0.1 M HCl/370.01 M HCl/370.001 M HCl/370.05 M phosphate buffer pH 7.2/370.005 M phosphate buffer pH 7.2/37

himic
aPdpPstlcdcTr
ficpttllm
wbdfi
adca
tbs
2
ccHJpso
2
(ttpw
hes
sM
3
3
badsFctttwvwatdbmbtdvttroda2sitlcgtr2ta
d
H. Bohets et al. / Analytica C
suspension of 60% graphite and 40% high molecular weightVC in THF (1 vol. of graphite/PVC per 3 vol. of THF). Afterrying, the graphite/PVC composite surface is smoothed andolished with Carbimet grid 600 from Buehler Ltd. (USA). TheVC cylinder is glued in a glass rod with Loctite 406® glue. Ailicon tube is positioned over the glass/PVC joint, preventinghe glue to contact the dissolution medium. One hundred mil-igrams of an electrode mixture composed of 65% DOS, 33%arboxylated PVC and 2% TCPB is dissolved in 1 mL THF. Onerop membrane mixture (25 �L) is deposited on top of the PVCylinder (step 1). The membrane is formed by evaporation ofHF at room temperature (±5 min) (step 2). Steps 1 and 2 are
epeated for at least three times.At this stage we obtain a universal electrode that is not specific
or a drug. By soaking the electrode for 24–48 h (drug dependent)n a solution containing the drug (usually the 100% release con-entration in dissolution medium) we produce a drug–TCPB ionair. This ion pair formation prevents ion exchange phenomenao be active during dissolution, which results in less poten-ial drift. It also makes the electrode insensitive towards lowerog P drugs. This procedure was applied for the dapoxetine,operamide, paliperidone, galantamine, tetrazepam, clozapine,
ebeverine, and cinnarizine electrodes.The electrode built for anionic drugs such as ibuprofen
as similar, with two obvious differences: TCPB was replacedy methyltridodecylammonium chloride (MTDACl), and non-erivatized high molecular weight PVC was used. These modi-cations were performed in order to obtain anionic selectivity.
Electrodes produced in this manner are mechanically stablend show low drifts (≈1 mV/24 h). This is due to a large gra-ient that is formed between the sensing layer and the graphiteomposite (±200 �m). The thick layer reduces electrode driftnd improves mechanical robustness [28].
UV measurements were done with a Unicam sp1800 spec-rometer. The uptake of drug by the membrane was determinedy measuring the disappearance of drug from the conditioningolvent.
.4. Chemicals
Dioctylsebacate (DOS), carboxylated PVC, methyltridode-ylammonium chloride (MTDACl) and potassium tetrakis(4-hlorophenyl)borate (TCPB) were purchased from Fluka.ydrochloric acid and Tween 20® were obtained from Acros.
ohnson & Johnson Pharmaceutical Research & Developmentrovided us with pharmaceutical formulations and referencetandards of dapoxetine, paliperidone and galantamine. Thether drugs were purchased at local pharmacies.
.5. Electronics and data station
Each vessel contained a Ag/AgCl reference electrodeSPO2N, Consort, Belgium) and an indicator electrode (poten-
iometric electrode). Knick amplifiers (one per indicator elec-rode) were applied as high impedance buffer amplifier. Theotential between indicator electrode and reference electrodeas monitored. All measurements were done on a six channelmfiw
a Acta 581 (2007) 181–191 183
ome made data station composed of a P4 windows 2000 PCquipped with a 6013 NI DA converter and LabVIEW 7 basedoftware.
For the calculation of log P values of the drugs the internetite http://www.logp.com/ from ChemSilico LLC (Tewksbury,A, USA) was used.
. Results and discussion
.1. Electrodes and their conditioning
Rubber phase type electrodes described in literature for, e.g.,asic drug determinations contain a large immobile lipophilicnion, while the mobile counter cation is usually the cationicrug. Such ion-pair electrodes are mostly used with an innerolution, and, to a smaller extent, in a coated wire configuration.or dissolution measurements, as well inner solution systems asoated wire type electrodes were experienced by us as lackinghe necessary robustness [28]. In the present work, we use elec-rodes which have a 200 �m rubber phase region, with gradualransition to a solid state composite electronic conductor [28]. Itas possible to use these electrodes in the K+ form, and to con-ert them first to the drug+ form via equilibration (ion exchange)ith a solution containing the drug. This allowed us to start with
n universal electrode type, which was converted to an elec-rode, dedicated to the determination of one specific drug. Forrugs in their anionic form a similar modus operandi is possi-le. The electrode will contain a large lipophilic cation with aobile anion (Cl−). The anion will be exchanged with the drug
y simple conditioning. We observed that an electrode condi-ioned with a high log P drug was insensitive towards low log Prugs, e.g., a dapoxetine conditioned electrode is insensitive toariations in galantamine concentrations. This selectivity is dueo the difference in log P of the drugs [24]. In order to understandhe conditioning phenomena, and to estimate the conditioningates, we performed UV measurements. We recorded the uptakef the drug in the electrode by recording the disappearance ofrug in the conditioning medium by means of the UV absorbancet a fixed wavelength. These measurements showed that after–8 h there was no more detectable uptake of the drug from theolution. However, the UV spectrum of the membrane still var-ed after a few days indicating that there were rearrangements inhe membrane itself. From our potentiometric measurements weearned that the behavior of the conditioned electrode was suffi-iently reproducible after 8–12 h conditioning in order to allowood dissolution experiments for immediate release formula-ions (no significant drift during 1 h). However, for controlledelease measurements there should be no significant drift during4 h. In order to obtain this low drift we advise a conditioningime of 24–48 h. The drift phenomena and their influence on theccuracy will be discussed in detail in Section 3.4.
Using the dissolution setup with potentiometric detectionescribed in the experimental part, it was possible to record
V versus time curves during the dissolution process. In whatollows, we will first describe a method to convert these record-ngs to percentage of dissolution versus time curves. Then, weill check how accurate and reproducible the electrodes and

184 H. Bohets et al. / Analytica Chimic
Fs
ttrt
3d
ta(
mmse
ert
ttcidoto6itmH
fetTbeEtmstF(dhTctht
ig. 1. Dissolution of a 30 mg dapoxetine tablet. Trace a: the potentiometricignal in mV; trace b: the concentration, expressed as percentage of dissolution.
he conversion algorithm work. Special attention will be paid tohe effects of electrode potential drift phenomena and electrodeesponse times. General guidelines for potentiometric dissolu-ion measurements will be discussed.
.2. Conversion of mV versus time curves to percentage ofissolution versus time curves
Dapoxetine was taken as an example for “Immediate release”ablets. Fig. 1 shows the recorded mV versus time curve (curve), and the calculated percentage of dissolution versus time curvecurve b, see below for the conversion procedure).
The data which are needed to perform the conversion from theV/time curve to the percentage of dissolution/time curve areeasured mV versus concentration data (“calibration curves”),
hown in Fig. 2. These calibration curves were recorded for sixlectrodes.
For dapoxetine, the calibration curves have a strictly lin-ar relation between the logarithm of the concentration and theesponse of the electrode in the concentration range of 3 × 10⁻⁶
o 3 × 10⁻³ M: calculated R2 values were 0.9999 for each of
Fig. 2. The response curves of six conditioned dapoxetine electrodes.
iccdrcdpcs(
C
EtItodccm
a Acta 581 (2007) 181–191
he six electrodes. At concentrations higher than 3 × 10⁻³ M,he slopes deviate significantly from linearity. These high con-entrations are normally not encountered in dissolution exper-ments since only one dose is entered in each vessel. Forapoxetine, a concentration of 3 × 10⁻³ M represents about 1 gf drug which is much more than used in typical formula-ions (30–60 mg). For the linear area of the response curvesf Fig. 2 (3 × 10⁻³ to 3 × 10⁻⁶ M) we determined a slope of0.16 ± 0.38 mV decade−1 (n = 6) at 37 ◦C. Even in the highonic strength of the dissolution medium (0.1 M HCl solution),he electrode exhibits a good linear range over three orders of
agnitude. This indicates a high selectivity of dapoxetine over+, which is due to the high log P value of the drug (4.42) [24].For the curves shown in Fig. 2 (from top to bottom), the
ollowing E0 values were calculated, respectively, for the sixlectrodes: 626, 625, 561, 577, 541 and 508 mV. These varia-ions are mainly due to small differences in production process.he slopes, S, of the set of electrodes are completely compara-le (60.16 ± 0.38 mV decade−1, n = 6), the E0 values show interlectrode variations of more than 100 mV. The absolute value of0 is not so important in dissolution testing. Usually, the dissolu-
ion signal is recorded and stored electronically, and the potentialeasured at the start of the dissolution (canalyte = 0), can be off-
et to 0 mV. This can also be done for the curves in Fig. 2, i.e.o offset the potential at dissolution start (c = 0) to a zero value.or dapoxetine, a percentage of dissolution versus time curveFig. 1) can be calculated almost entirely on the basis of the log cependent part of the calibration function (Fig. 2). Indeed, theighest concentration (at 100% dissolution) was 1.0 × 10⁻⁴ M.his means that even at 1% dissolution, we have a 10−6 M con-entration, which is only slightly out of the strictly linear part ofhe calibration function (Fig. 2). Drugs with lower log P valuesowever will generally show a shift of the non-linear part ofhe calibration curve towards higher concentrations [24]. Also,t may be needed to measure dissolution curves for lower con-entrations of drug, again involving the non-linear part of thealibration curve. In principle, a good dissolution curve shouldescribe the whole range of concentrations encountered accu-ately, and the curve should start at zero concentration. At zerooncentration, the mV to concentration conversion cannot beone using the Nernst equation, which is only valid in the linearart of the calibration graph. Including the non-linear part of thealibration curve at low concentrations will be necessary in dis-olution testing. This is possible, but requires a transformationEq. (1)) which is described in Ref. [31]:
st.(10E/S − 1) = canalyte (1)
q. (1) allows us to convert the measured potential (E) to concen-ration (canalyte) values using a constant (Cst.) and the slope (S).t transforms the whole Nikolskii-Eisenman type signals (mV)o concentrations (canalyte). The measured potential, E, should beffset to zero at ci = 0. This requires zeroing of the baseline in the
issolution recording before the insertion of the capsule. Thisan be done in the data station after recording the dissolutionurve. Eq. (1) can be applied over the whole concentration rangeeasured. This means that the dissolution curve can be con-
H. Bohets et al. / Analytica Chimic
F(
vrsf6
(
C
nvp
w1d
cdoetcTwKc
ptdss
tcTmwtapcr
3
3.3.1. Quantitative dissolution curves
ig. 3. Dissolution curves of a loperamide tablet (2 mg) (a), and a tetrazepam50 mg) tablet (b) for oral administration.
erted from mV to concentration over a very broad concentrationange, i.e. from the lowest concentration which still yields a mea-urable signal, 10−9 M for dapoxetine, to 10−3 M. Typical valuesor the slope and constant for the dapoxetine electrodes are:0.4 ± 0.2 mV decade−1 (S) and 4.03 ± 0.07 × 10⁻⁷ M (Cst.).
Eq. (1) can even be reduced to a very practical form, see Eq.2):
analyte ≈ 10E/S − 1 (2)
A plot of 10E/S − 1 versus time will yield a curve which only
eeds multiplication by Cst. to obtain a percentage of dissolutionersus time curve. Estimation of Cst. can be done using veryractical and accurate methods (see further).fiq
Fig. 4. Dissolution curves of cinnarizine (75 mg) (a), mebeverine (135 mg) (b), su
a Acta 581 (2007) 181–191 185
Some examples of recorded curves (mV versus time) whichere converted to concentration versus time curves using the0E/S − 1 transform are shown in Figs. 3 and 4. They are fullyiscussed in Section 3.3.
As shown in Eq. (1), the value of Cst. would be needed toonvert mV values to concentration values (or to percentage ofissolution values, as given in Figs. 3 and 4). This value can bebtained in a simple manner by a one point calibration of thelectrode in a known concentration of the drug. This is done athe end of the dissolution with an exactly known concentrationorresponding to 90–120% dissolution (in dissolution medium).he slope is known from the potentiometric calibration curvehich has been measured prior to the dissolution experiment.nowing S, and E for a specified concentration, allows us to
alculate the value of Cst. using Eq. (1).This procedure corrects for drift phenomena at the endpoint
otential. The recovery can be determined very accurately. Ifhe drift was continuous in time (see Section 3.4), the recordedissolution curve will show good accuracy over the whole timepan. The above method was applied for the dissolution mea-urements of dapoxetine, galantamine and paliperidone.
Eq. (2) is useful to obtain qualitative dissolution curves. Onlyhe slope has to be known or estimated to obtain a qualitativeurve which is of the same form as the real dissolution curve.his is a good procedure for a dissolution preview during theeasurement prior to the endpoint calibration. This equationas applied to the dissolution profiles of loperamide (Fig. 3a),
etrazepam (Fig. 3b), cinnarizine (Fig. 4a), mebeverine (Fig. 4b)nd ibuprofen (Fig. 4d). In these cases we assumed that thelateau value, reached at the end of the dissolution recording,orresponds to 100% dissolution. The qualitative curve wasescaled so that this 100% value was attained at the plateau.
.3. Dissolution curves
Curves measured with endpoint calibration will be discussedrst. The dissolution of dapoxetine (Fig. 1, curve b) follows auasi linear release profile, starting at 1.5 min after insertion
stained release paliperidone (4 mg) (c) and sustained release ibuprofen (d).
1 himica Acta 581 (2007) 181–191
o(bt9ggd3Maofcrs
3
eaastocr
3
co
3
ptaootetdAo
adcdmolmt
Fte
iabplwndmcdtpEr
sslbest estimate of what can be expected from a normal functioninggradient electrode which has been well equilibrated and storedas described in the experimental part. Without calibration of theelectrode at the end of the dapoxetine dissolution, the mean devi-
86 H. Bohets et al. / Analytica C
f the tablet, and reaching a plateau value at 100% dissolution1.0 × 10−4 M final concentration, measured via endpoint cali-ration) 15 min later. The release profile of paliperidone (Fig. 4,race c) is linear from 6 to 20 h, and a plateau is reached at6% dissolution. This endpoint value is within the error mar-in of the composition of this formulation. The dissolution ofalantamine resulted in a erroneous end concentration of 120%issolution. This large error was reproducible with a R.S.D. of% (n = 6). We attributed this large error to the interference ofg2+ which was present in the formulation. Galantamine haslog P value of 1.79 which makes it vulnerable to interferencef substances like Mg2+. This interference would be negligibleor compounds having log P values higher than three. Low log Pompounds such as galantamine cannot yet be determined accu-ately, and electrodes which are suitable for their measurementhould be developed.
.3.2. Qualitative dissolution curvesQualitative dissolution curves (no recovery calculated via
ndpoint calibration) are shown in Fig. 3 for loperamide (trace) and tetrazepam (trace b). They reach their plateau after 8nd 38 min, respectively. A qualitative curve of cinnarizine ishown in Fig. 4a. The first part of this curve is linear and bendsowards a stable plateau which is reached after 4.5 h. The curvef mebeverine (Fig. 4b) is more curved than the one obtained forinnarizine, reaching its plateau after 4.2 h. Ibuprofen (Fig. 4d)eaches its plateau after 10 h.
.4. Electrode characteristics
In this paragraph we will use the quantitative data of a typicalase, i.e. dapoxetine electrodes, to describe the characteristicsf the sensors.
.4.1. Potential drift, and effect on measurement errorIt is known that the drift of the electrode limits the accuracy of
otentiometric determinations. An uncorrectable drift of 1 mV athe endpoint of a dissolution recording (see Fig. 1) can generaten error of ±3% on the calculated concentration (or percentagef dissolution) value, if no calibration is performed at the endf the recording. Therefore knowing, controlling and reducinghe drift is very important for dissolution measurements, andspecially for controlled release formulations. We monitoredhe drift of several electrodes repeatedly at the endpoint of theissolution (30 mg dapoxetine/900 mL 0.1 M HCl) for 6 days.
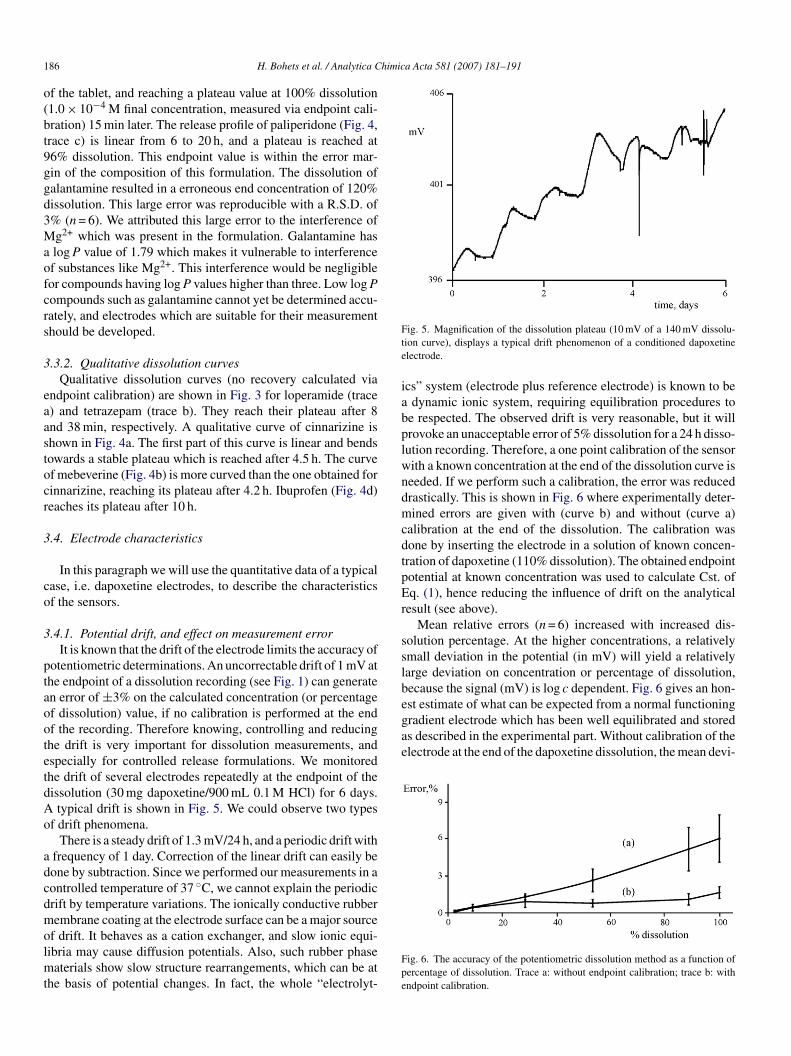
typical drift is shown in Fig. 5. We could observe two typesf drift phenomena.
There is a steady drift of 1.3 mV/24 h, and a periodic drift withfrequency of 1 day. Correction of the linear drift can easily beone by subtraction. Since we performed our measurements in aontrolled temperature of 37 ◦C, we cannot explain the periodicrift by temperature variations. The ionically conductive rubberembrane coating at the electrode surface can be a major source
f drift. It behaves as a cation exchanger, and slow ionic equi-ibria may cause diffusion potentials. Also, such rubber phase
aterials show slow structure rearrangements, which can be athe basis of potential changes. In fact, the whole “electrolyt-
Fpe
ig. 5. Magnification of the dissolution plateau (10 mV of a 140 mV dissolu-ion curve), displays a typical drift phenomenon of a conditioned dapoxetinelectrode.
cs” system (electrode plus reference electrode) is known to bedynamic ionic system, requiring equilibration procedures to
e respected. The observed drift is very reasonable, but it willrovoke an unacceptable error of 5% dissolution for a 24 h disso-ution recording. Therefore, a one point calibration of the sensorith a known concentration at the end of the dissolution curve iseeded. If we perform such a calibration, the error was reducedrastically. This is shown in Fig. 6 where experimentally deter-ined errors are given with (curve b) and without (curve a)
alibration at the end of the dissolution. The calibration wasone by inserting the electrode in a solution of known concen-ration of dapoxetine (110% dissolution). The obtained endpointotential at known concentration was used to calculate Cst. ofq. (1), hence reducing the influence of drift on the analytical
esult (see above).Mean relative errors (n = 6) increased with increased dis-
olution percentage. At the higher concentrations, a relativelymall deviation in the potential (in mV) will yield a relativelyarge deviation on concentration or percentage of dissolution,ecause the signal (mV) is log c dependent. Fig. 6 gives an hon-
ig. 6. The accuracy of the potentiometric dissolution method as a function ofercentage of dissolution. Trace a: without endpoint calibration; trace b: withndpoint calibration.
himic
aCttpaiydtcaomcc
3
cltLstGwrl1reswtirt
c
It(daitb
c
Tdatgs
cstt
3i
viTtlotd4
tesnag
detsot
ebtaasub-mV potential decrease. Fig. 8 shows the mean deviationof the potential of four electrodes as a function of the pH, atthe endpoint of the dissolution of dapoxetine (conditions as inFig. 1).
H. Bohets et al. / Analytica C
tion (six measurements with six different electrodes) was 6%.alibration of the electrodes at the plateau value of the dissolu-
ion curve reduced this error to 1.4%. Further improvement ofhe accuracy (estimation of the percentage of dissolution at thelateau of the dissolution curve) would require a one point checkt the plateau value with a highly accurate but more time consum-ng technique. The whole dissolution curve is then recalculated,ielding highly accurate values over the whole time period ofissolution. For dissolution experiments that take place in 1 h,he drift during dissolution is small (<1 mV), and the endpointalibration yields an accurate calculation of the entire curve. Fordissolution experiment that spans 24 h, drifts up to 4 mV canccur, which are corrected also by endpoint calibration. Only forore complex controlled release dissolution curves (e.g., high
oncentration near the start) intermediate one point calibrationould be necessary.
.4.2. Response times, and their effect on dissolution curvesResponse times t90 were measured in hydrodynamic (FIA)
onditions, as in dissolution conditions, the time of mixingargely exceeds the electrode response time. Therefore, the elec-rode was placed in a flow-cell described elsewhere [32]. AC pump was used to provide a flow-rate of 1 mL min−1, andquare concentration pulses were injected [33]. We transformedhe obtained signal to a concentration dependent signal via aran transformation [31]. The measured t90 values thereforeere measured on concentration related recordings. The t90
esponse times revealed to be dependent on concentration, theowest concentration giving the highest response time: 49 s for a0−6 M, 19 s for a 10−4 M, and 10 s for a 10−3 M concentration,espectively. A computer simulation was performed in Excel, tostimate the error induced by the electrode response time. Dis-olutions where the concentrations increased linearly in timeere considered as a test case. Dissolution was approached as
he addition of small concentration increments (minimum 100ncrements per dissolution curve) as a function of time. Theesponse function to the small concentration increments was ofhe type given by Eq. (1):
(t) after a small concentration increment = cmax − cmax e−kt(3)
t was based on curves measured in real experiments. c(t) is theime dependent signal which reflects the molar concentrationor percentage of dissolution) of the drug after increasing therug concentration with a small increment. cmax is the signalt high values of t (the time after the start of the concentrationncrement), where the plateau value is reached. The obtainedotal signal was taken equal to the sum of all the signals causedy the small concentration increments:
total(t) =∑
c(t) (4)
he t90 response time was taken to be 30 s (k = 4.60 min−1). Theifference between real and measured value became constant
fter a lag period of 0.5 min following the dissolution onset. Inhe case of the dapoxetine recording of Fig. 1, the simulationave a constant retardation of the recorded versus the true dis-olution profile of 5.6 s, from 0.5 min after dissolution onset toa Acta 581 (2007) 181–191 187
omplete dissolution. This is a negligible distortion of the dis-olution profile. For controlled release dissolution (dissolutionime several hours), the effect of a 30 s t90 time constant will beotally negligible.
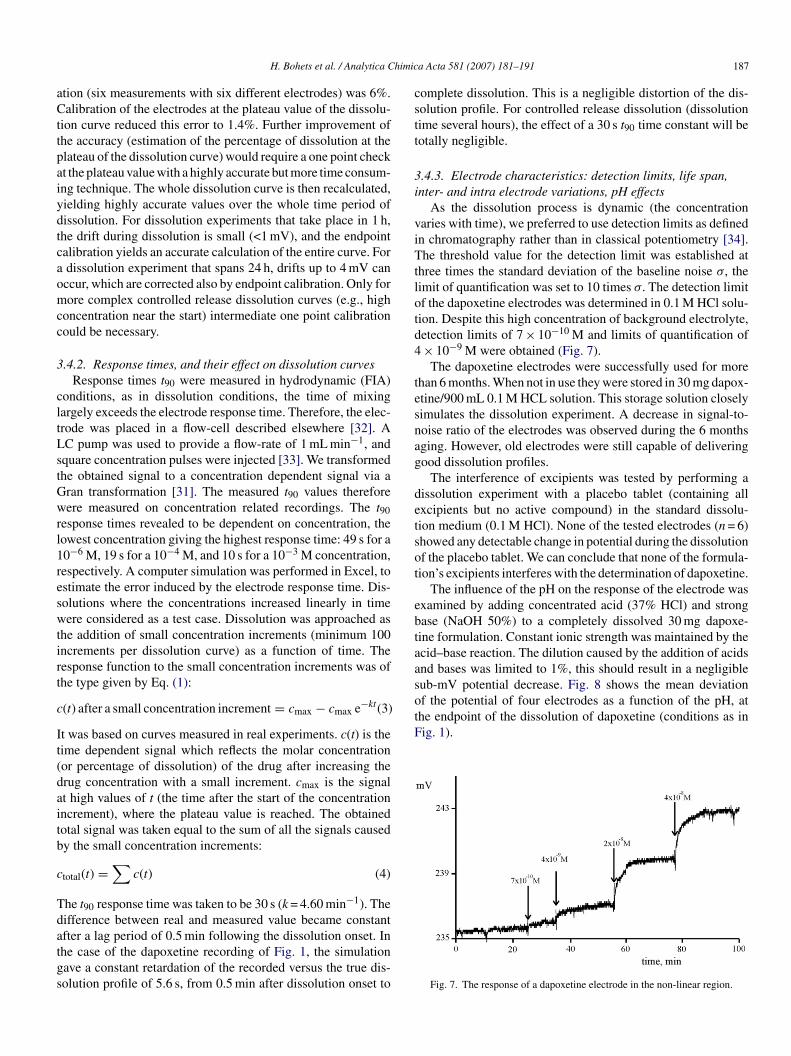
.4.3. Electrode characteristics: detection limits, life span,nter- and intra electrode variations, pH effects
As the dissolution process is dynamic (the concentrationaries with time), we preferred to use detection limits as definedn chromatography rather than in classical potentiometry [34].he threshold value for the detection limit was established at
hree times the standard deviation of the baseline noise σ, theimit of quantification was set to 10 times σ. The detection limitf the dapoxetine electrodes was determined in 0.1 M HCl solu-ion. Despite this high concentration of background electrolyte,etection limits of 7 × 10⁻¹⁰ M and limits of quantification of× 10−9 M were obtained (Fig. 7).
The dapoxetine electrodes were successfully used for morehan 6 months. When not in use they were stored in 30 mg dapox-tine/900 mL 0.1 M HCL solution. This storage solution closelyimulates the dissolution experiment. A decrease in signal-to-oise ratio of the electrodes was observed during the 6 monthsging. However, old electrodes were still capable of deliveringood dissolution profiles.
The interference of excipients was tested by performing aissolution experiment with a placebo tablet (containing allxcipients but no active compound) in the standard dissolu-ion medium (0.1 M HCl). None of the tested electrodes (n = 6)howed any detectable change in potential during the dissolutionf the placebo tablet. We can conclude that none of the formula-ion’s excipients interferes with the determination of dapoxetine.
The influence of the pH on the response of the electrode wasxamined by adding concentrated acid (37% HCl) and strongase (NaOH 50%) to a completely dissolved 30 mg dapoxe-ine formulation. Constant ionic strength was maintained by thecid–base reaction. The dilution caused by the addition of acidsnd bases was limited to 1%, this should result in a negligible
Fig. 7. The response of a dapoxetine electrode in the non-linear region.

188 H. Bohets et al. / Analytica Chimic
Fo
cisat
i
edese0TemEddn
ibcssfa
c
TW
M
WDI
TT
DDDD
A
TT
DDDD
V
ig. 8. The influence of the pH on the electrode potential expressed as variationf the endpoint potential. Mean and standard deviation of four electrodes.
At pH 1.2, a 1% variation in the molar concentration of HClauses a 0.18 mV signal variation. At other pH values often usedn dissolution media, e.g., pH 2 and 3, this potential variation istill less significant. At pH values above 7, the potential changes
bruptly, as dapoxetine precipitation starts to occur, due to depro-onation.Reproducibility, inter- and intra electrode variability aremportant parameters for the analytical applicability of these
tidr
able 2ithin day, day to day, and inter electrode variation of the dissolution of dapoxetine,
easurement/day/electrode 1 2 3 4
ithin-day variation 97.3 95.9 96.2 9ay to day variation 97.2 98.3 94.4 9
nter electrode variation 102.3 102.4 101.4 10
able 3he slopes (A) and intercepts B (Y = A × X + B)a for the least squares fitting of the me
Electrode 1 Electrode 2 Electrode 3
A B A B A B
ay 1 1.013 6 × 10⁻⁶ 1.013 6 × 10⁻⁵ 1.004 1 × 10⁻⁴
ay 2 1.013 6 × 10⁻⁶ 0.994 2 × 10⁻⁴ 1.011 6 × 10⁻⁵
ay 3 1.008 2 × 10⁻⁴ 1.009 5 × 10⁻⁵ 1.009 1 × 10⁻⁴
ay 4 1.004 9 × 10⁻⁵ 1.000 3 × 10⁻⁵ 1.031 2 × 10⁻⁴
is dimensionless, B is expressed as mg mL−1.a For this set of linear fittings the mean correlation coefficient (R2) equals 0.9996 ±
able 4he maximum and average deviation of the measured concentration from the known
Electrode 1 Electrode 2 Electrode 3
Maximum Average Maximum Average Maximum Average
ay 1 1.7 0.6 1.9 0.6 1.1 0.6ay 2 1.5 0.6 2.6 1.2 1.5 0.7ay 3 3.0 1.0 0.9 0.5 1.9 0.6ay 4 0.7 0.5 1.3 0.4 3.4 1.1
alues are expressed as percentage of dissolution (%wt./wt.).
a Acta 581 (2007) 181–191
lectrodes. Hence we closely examined these parameters forapoxetine in more than 300 calibration and/or dissolutionxperiments. A representative sample of these experiments ishown in Tables 2–5. The within day, day to day, and interlectrode variation shown in Table 2 amounts to 1.4, 1.7 and.6% dissolution, respectively (measured at 100% dissolution).hese values are rather low in view of the variation we canxpect between different tablets (>5%). For all these measure-ents (6 days) only one initial calibration curve was applied.ach measurement was finished with a one point calibration forrift correction. We can conclude that the electrodes are able toeliver reproducible results for prolonged periods without theeed for intensive calibration.
The accuracy of the electrodes was determined by measur-ng known drug concentrations. The concentration determinedy the electrode was plotted as a function of the known con-entration. For an ideal electrode this plot should be linear withlope equal to 1 and intercept equal to 0. The results in Table 3how that the measured intercept and slope differs only slightlyrom the ideal values. The correlation coefficient is more thancceptable.
Point to point comparison of the known and determined con-entrations for the whole curve were performed. The results of
his comparison are summarized in Table 4. The mean deviations usually not higher than 1% whereas the mean of the maximumeviation is 1.8%. Hence we can conclude that our potentiomet-ic determinations are not only reproducible but also accurate.values are expressed as percentage of dissolution (%wt./wt.)
5 6 Average Standard deviation
9.5 98.8 97.7 97.6 1.44.7 96.2 98.3 96.5 1.71.8 100.9 101.8 101.8 0.6
asured concentration as a function of the known concentration
Electrode 4 Electrode 5 Electrode 6
A B A B A B
1.016 8 × 10⁻⁶ 1.007 2 × 10⁻⁴ 1.032 3 × 10⁻⁴
1.008 7 × 10⁻⁶ 1.005 5 × 10⁻⁵ 1.021 2 × 10⁻⁴
1.025 9 × 10⁻⁵ 1.008 9 × 10⁻⁵ 0.999 3 × 10⁻⁴
1.019 9 × 10⁻⁵ 0.995 1 × 10⁻⁴ 1.014 2 × 10⁻⁴
0.0004.
concentration
Electrode 4 Electrode 5 Electrode 6
Maximum Average Maximum Average Maximum Average
1.8 0.7 1.4 0.7 3.8 1.61.0 0.5 0.8 0.5 2.5 1.22.7 1.2 1.7 0.8 2.3 1.21.8 0.8 1.1 0.6 1.8 0.9
H. Bohets et al. / Analytica Chimica Acta 581 (2007) 181–191 189
Table 5The slopes (mV decade−1), intercepts (mV) and correlation coefficients for six (1–6) electrodes in the linear range of 10−3 to 10−6 M dapoxetine
Electrode 1 2 3 4 5 6 Average Standard deviation
Slope 60.21 60.42 59.56 60.21 60.64 59.92 60.16 0.38I 540.9C 1.000
radboasAttaotltwlia
3
oiTfitswhbeltecctolssTspi
scanfHctae
wid(i
dw
tpeUlooorleEipActet(aift
ntercept 624.6 625.9 508.8orrelation coefficient 1.000 1.000 1.000
A good analytical application needs not only an accurate andeproducible electrode, it also needs a low inter electrode vari-bility. This inter electrode variability was also examined inetail for a set of six electrodes of different age and productionatch. The slopes obtained for the different electrodes differsnly 1 mV (max–min) as shown in Table 5. The intercepts havelarge variability, however this has no practical implications
ince baseline zeroing eliminates these differences (see above).s can be seen in Fig. 2, the linear range (potential/log c) is
he same for all six electrodes. The pH dependency of the elec-rodes is similar (Fig. 8), as is the reproducibility (Table 2) andccuracy (Tables 3 and 4). The main differences in behaviorf the electrodes can be found in the lower non-linear (poten-ial/log c) region. From electrode to electrode the 3σ detectionimit (see above) can differ more than two orders of magni-ude. For most applications 99% of the dissolution curve dealsith the linear range, hence the electrode variability in the non-
inear range is of minor importance. The electrode variabilityn the linear range is negligible with respect to the analyticalpplication.
.5. General guidelines
We performed experiments on studies on a wide varietyf drugs: paliperidone, galantamine, clozapine, tetrazepam,buprofen, loperamide, mebeverine, cinnarizine and dapoxetine.hese drugs cover a wide scope of log P’s (see Table 1), ranging
rom 2 to 6 and were dissolved in a wide variety of media (rang-ng from 0.1 M HCl to 0.001 M phosphate buffer pH 7.2). Fromhese experiments we derived some basic guidelines for dis-olution measurements with our conditioned electrode. Drugsith high log P values (>4.5) can be measured in media withigh ionic strength such as 0.1 M HCl and 0.05 M phosphateuffer. Ion pair formation (conditioning), sensitivity and influ-nce of excipients does not yield any problem. For drugs with aog P of about 3–2.5 there are some limitations on the dissolu-ion media: media with a 0.1 M cation concentration reduce thelectrode signal dramatically. Media of 0.01 M ionic strengthan be applied without significant signal reduction. This con-entration limitation still allows good measurements in most ofhe standard dissolution media. For these drugs, the influencef excipients usually does not yield any problem. Drugs withog P smaller or equal to two can only be measured in low ionictrength media (e.g., 0.001 M HCl). Due to this limitation, notandard dissolution media can be applied for such compounds.
hese electrodes are also sensitive towards common excipientsuch as Mg2+. Independent of the log P value of the drug, theH of the media should be such that the drug is predominantlyn the ionic form.tcmd
577.4 561.8 – –1.000 1.000
Many dissolution media contain tensioactive compoundsuch as sodium laurylsulfate and Tween 20®. These tensioactiveompounds tend to accumulate in the sensing membrane [35–37]nd consequently cause the electrode to drift and exhibit erro-eous potentials. Despite these problems we were able to per-orm acceptable in-line dissolution experiments in these media.owever, the reproducibility of the electrode production pro-
ess is still a problem for these systems. We are confident thathis problem will be solved in the near future (in study), sinceccurate and reproducible measurements were done with somelectrodes.
Although in this study media containing HCl were dominant,e noticed that our sensors acted similarly in media contain-
ng phosphate buffers. The sensitivity of the sensor is primarilyetermined by the ionic strength of the medium and by its pHin relation to the pKa of the drug). The influence of the type ofnorganic buffer on the sensitivity is minor.
Measuring formulations containing two or more ionizablerugs is not possible at present, unless they differ in log P valuesith a factor of at least 2.There are a number of reasons why dissolution and poten-
iometry form a good combination. It is common knowledge thatotentiometric electrodes are insensitive towards most excipi-nts and to the presence of suspensions, colloidal systems andV absorbing compounds [23]. We observed that only when a
arge part of the sensor is shielded from the media by depositionf suspended material or air bubbles, there were repercussionsn the accuracy and reproducibility of the sensor. This onlyccurred in extreme and very exceptional circumstances. Thisobustness gives potentiometry an advantage over UV in in-ine measurements. The extensive linear range of potentiometriclectrodes gives very accurate data at the start of the dissolution.ven very low concentrations can be determined without dimin-
shing the accuracy at 100% dissolution. This sensitivity makes itossible to determine the lag time of dissolution very accurately.nother advantage is the ease with which potentiometric sensors
an be miniaturized. Small electrodes do not disturb the flow inhe dissolution vessel as opposed to UV probes which need thexpensive hollow shaft technology to avoid disturbance. Cer-ain disadvantages of potentiometry such as slow response time>10 s), solvent dependent sensitivity (ionic strength), lowerccuracy at higher concentrations, pH dependency and sensitiv-ty to fouling by lipophilic compounds, are in general irrelevantor dissolution measurements. The dissolution and diffusion ofhe drug is a relatively slow process (t > 15 s). Hence response
imes of electrodes are of little or no influence on the dissolutionurves. The variation of the ionic strength of the dissolutionedia during the dissolution experiment is limited and pre-ictable. The electrodes will suffer little or no influence of these

1 himic
ltwitamcnpmDcet
3
3
oaophlysita
3
dddmm
3
carcFh
4
miToe
Tbmdtitaiiai8
A
t0o
R
[
[[[
[
[
[[[
[[
[[[
[
90 H. Bohets et al. / Analytica C
imited variations. Due to the predictable nature of the varia-ion, correction mechanisms can be applied in the rare caseshere this is necessary. Dependency of the potential on the pH
s less relevant for dissolution experiments since most dissolu-ion media are buffered (0.1 M HCl, 0.05 M phosphate buffer)nd no large variations in pH can occur. Dissolution experi-ents are performed in clean media where all of the involved
ompounds are known, hence the presence of fouling compo-ents is not common (part of the formulation or medium) andredictable. New methods are successfully explored that alloweasurements in fouling media such as polysorbate Tween 20®.ue to the nature of the dissolution experiments, the highest con-
entration occurs at the endpoint of dissolution. At this point therror on the determination should be the largest. However dueo the endpoint calibration we can accurately reduce this error.
.6. Advantages, limitations and future work
.6.1. AdvantagesPotentiometry can be used reliably for the in-line recording
f continuous dissolution curves and this with similar accuracynd reproducibility as the in-line UV methods. Turbidity, lackf chromophores and suspended solid analyte does not yield anyroblem as opposed to the in-line UV. Furthermore, the sensorsave usually a larger linear range and better sensitivity than in-ine UV. Off-line and on-line techniques such as HPLC–UV willield discontinuous profiles, require sample redrawal and oftenample preparation (e.g., filtration). None of these techniquess required for the potentiometric system. Furthermore, poten-iometry is rather inexpensive as compared to in-line UV andutomated HPLC.
.6.2. LimitationsThe main limitation of the sensor is the requirement that the
rug should be in the charged form during dissolution. Not allissolution media are applicable, especially media containingetergents (e.g., Tween®) are problematic. Accurate measure-ents are not possible for drugs with low log P (<2). Also,easurement of multi drug formulations is not evident.
.6.3. Future workOptimization of the electrodes for low log P drugs and media
ontaining detergents will be done. In order to make this systemcceptable to the pharmaceutical industry, validation studies andobustness evaluation has to be done. Miniaturization of the indi-ator electrode and the reference electrode should be carried out.urthermore, the production process of the indicator electrodeas to be optimized.
. Conclusions
It is possible to record precise dissolution curves for phar-aceutical drugs using in-line potentiometry. This technique
s reproducible (R.S.D. 1.7%) and accurate (1% dissolution).hese values are similar to the ones obtained for UV fiberptics [2,3,5,6]. Two variants (anionic and cationic) of the samelectrode allow the measurements of a wide variety of drugs.
[[[[
a Acta 581 (2007) 181–191
hese universal electrodes are converted to selective electrodesy simple conditioning in the dissolution medium. Dissolutioneasurements of dapoxetine, galantamine, loperamide, paliperi-
one, tetrazepam, cinnarizine, mebeverine and ibuprofen provehat the potentiometric concept can be generally applied for ion-zable drugs. The quality of the measurements is proportional tohe log P of the drug: values higher than 4.5 result in easy andccurate measurements, low values (<2) result in difficult andnaccurate determinations. The examples of paliperidone andbuprofen show that also controlled release formulations can benalyzed with this technique. The examples of loperamide andbuprofen show that a wide range of formulations from 2 to00 mg can be analyzed by potentiometry.
cknowledgments
The authors thank IWT (Institute for the Promotion of Innova-ion by Science and Technology in Flanders) for financial (grant40399), AIC (Antwerps Innovatie Centrum) for financial andrganizational, and Consort for technological support.
eferences
[1] A. Sood, R. Panchagnula, Stp Pharm. Sci. 9 (1999) 157.[2] G.W. Inman, Dissolution Technol. 10 (2003) 26.[3] X. Lu, R. Lozano, P. Shah, Dissolution Technol. 10 (2003) 6.[4] C.A. Martin, Dissolution Technol. 10 (2003) 37.[5] J. Johansson, M. Cauchi, M. Sundgren, J. Pharm. Biomed. Anal. 29 (2002)
469.[6] I. Nir, J. Johnson, B.D. Johansson, C. Schatz, Pharm. Technol. 25 (2001)
33.[7] M. Wunderlich, T. Way, J.B. Dressman, Dissolution Technol. 10 (2003) 17.[8] A.M. Othman, N.M.H. Rizk, M.S. El-Shahawi, Anal. Chim. Acta 515
(2004) 303.[9] H. Ibrahim, Y.M. Issa, H.M. Abu-Shawish, J. Pharm. Biomed. Anal. 36
(2005) 1035.10] H. Ibrahim, Y.M. Issa, H.M. Abu-Shawish, Anal. Chim. Acta 532 (2005)
79.11] S. Khalil, A. Kelzieh, J. Pharm. Biomed. Anal. 31 (2003) 601.12] M. Shamsipur, F. Jalali, S. Ershad, J. Pharm. Biomed. Anal. 37 (2005) 943.13] S.S.M. Hassan, W.H. Mahmoud, M.A.F. Elmosallamy, M.H. Almarzooqi,
Anal. Sci. 19 (2003) 675.14] K.I. Ozoemena, R.I. Stefan, J.F. van Staden, H.Y. Aboul-Enein, Sens. Actu-
ators B 105 (2005) 425.15] A. Bouklouze, M. Elbouzekraoui, Y. Cherrah, M. Hassar, J.M. Kauffmann,
Electroanalysis 14 (2002) 1369.16] X.X. Sun, H.Y. Aboul-Enein, Talanta 58 (2002) 387.17] J. Lenik, B. Marczewska, C. Wardak, Desalination 163 (2004) 77.18] A.M. Othman, N.M.H. Rizk, M.S. EL-Shahawi, Anal. Chim. Acta 515
(2004) 303.19] S.S. Badawy, A.F. Youssef, A.A. Mutair, Anal. Chim. Acta 511 (2004) 207.20] S.S. Badawy, Y.M. Issa, A.A. Mutair, J. Pharm. Biomed. Anal. 39 (2005)
117.21] K. Vytras, J. Pharm. Biomed. Anal. 7 (1989) 789.22] V.V. Cosofret, R.P. Buck, Crit. Rev. Anal. Chem. 24 (1993) 1.23] R.I. Stefan, G.E. Baiulescu, H.Y. Aboul-Enein, Crit. Rev. Anal. Chem. 27
(1997) 307.24] B. Vissers, H. Bohets, J. Everaert, P. Cool, E.F. Vansant, F. Du Prez, J.M.
Kauffmann, L.J. Nagels, Electrochim. Acta 51 (2006) 5062.
25] R.I. Stefan, H.Y. Aboul-Enein, Anal. Lett. 29 (1996) 2333.26] R.I. Stefan, G.E. Baiulescu, H.Y. Aboul-Enein, Talanta 43 (1996) 1171.27] H.Y. Aboul-Enein, R.I. Stefan, Inst. Sci. Technol. 27 (1999) 89.28] L. Nagels, H. Bohets, J. Mohamedilias, Patent Application, WO20005/103664 A2 (2005).

himic
[
[
[
[
[
[
H. Bohets et al. / Analytica C
29] J. Bobacka, T. Alaviuhkola, V. Hietapelto, H. Koskinen, A. Lewenstam, M.Lamsa, J. Pursiainen, A. Ivaska, Talanta 58 (2002) 341.
30] S.S.M. Hassan, W.H. Mahmould, M.A.F. Elmosallamy, M.S. Abdel-Samad, Mikrochim. Acta 131 (1999) 199.
31] J. Sekula, J. Everaert, H. Bohets, B. Vissers, M. Pietraszkiewicz, O.Pietraszkiewicz, F. Du Prez, K. Vanhoutte, P. Prus, L.J. Nagels, Anal. Chem.78 (2006) 3772.
32] L.J. Nagels, J.M. Kauffmann, C. Dewale, F. Parmentier, Anal. Chim. Acta234 (1990) 75.
[
[
[
a Acta 581 (2007) 181–191 191
33] B.L. De Backer, L.J. Nagels, F.C. Alderweireldt, P.P. Van Bogaert, Anal.Chim. Acta 273 (1993) 449.
34] J. Inczedy, T. Lengyel, A.M. Ure, Compendium of Analytical Nomencla-ture, 3rd ed., Blackwell Science, Oxford, UK, 1998.
35] E. Malinowska, A. Manzoni, M.E. Meyerhoff, Anal. Chim. Acta 382 (1999)265.
36] C. Espadas-Torre, E. Bakker, S. Barker, M.E. Meyerhoff, Anal. Chem. 68(1996) 1623.
37] E. Malinowska, M.E. Meyerhoff, Anal. Chem. 70 (1998) 1477.