Development of an Indicator to Monitor Mediterranean Wetlands
19
RESEARCH ARTICLE Development of an Indicator to Monitor Mediterranean Wetlands Antonio Sanchez 1 , Dania Abdul Malak 1 *, Anis Guelmami 2 , Christian Perennou 2 1 European Topic Centre, University of Málaga, Málaga, Spain, 2 Tour du Valat Research Centre for the Conservation of Mediterranean Wetlands, Arles, France * [email protected] Abstract Wetlands are sensitive ecosystems that are increasingly subjected to threats from anthro- pogenic factors. In the last decades, coastal Mediterranean wetlands have been suffering considerable pressures from land use change, intensification of urban growth, increasing tourism infrastructure and intensification of agricultural practices. Remote sensing (RS) and Geographic Information Systems (GIS) techniques are efficient tools that can support moni- toring Mediterranean coastal wetlands on large scales and over long periods of time. The study aims at developing a wetland indicator to support monitoring Mediterranean coastal wetlands using these techniques. The indicator makes use of multi-temporal Landsat im- ages, land use reference layers, a 50m numerical model of the territory (NMT) and Corine Land Cover (CLC) for the identification and mapping of wetlands. The approach combines supervised image classification techniques making use of vegetation indices and decision tree analysis to identify the surface covered by wetlands at a given date. A validation pro- cess is put in place to compare outcomes with existing local wetland inventories to check the results reliability. The indicator´s results demonstrate an improvement in the level of pre- cision of change detection methods achieved by traditional tools providing reliability up to 95% in main wetland areas. The results confirm that the use of RS techniques improves the precision of wetland detection compared to the use of CLC for wetland monitoring and stress the strong relation between the level of wetland detection and the nature of the wet- land areas and the monitoring scale considered. Introduction In the context of freshwater management, resource mapping and inventorying are key to iden- tify the location, biological productivity, potential multiple uses and biodiversity profiles of wetland ecosystems [1]. Traditional methods for mapping and inventorying resources at re- gional or national scales, mainly through fieldwork, are expensive and time-consuming [2] and frequently suffer spatial incompleteness, scalar inconsistencies and temporal uncertainties [3] [4]. The Ramsar convention highlights the importance of filling the gaps in baseline inventory, PLOS ONE | DOI:10.1371/journal.pone.0122694 March 31, 2015 1 / 19 a11111 OPEN ACCESS Citation: Sanchez A, Abdul Malak D, Guelmami A, Perennou C (2015) Development of an Indicator to Monitor Mediterranean Wetlands. PLoS ONE 10(3): e0122694. doi:10.1371/journal.pone.0122694 Academic Editor: Jian Liu, Shandong University, CHINA Received: October 16, 2014 Accepted: February 15, 2015 Published: March 31, 2015 Copyright: © 2015 Sanchez et al. This is an open access article distributed under the terms of the Creative Commons Attribution License, which permits unrestricted use, distribution, and reproduction in any medium, provided the original author and source are credited. Data Availability Statement: Data have been deposited to the Harvard Dataverse (http://dx.doi.org/ 10.7910/DVN/29218). Funding: The authors have no support or funding to report. Competing Interests: The authors have declared that no competing interests exist.
Transcript of Development of an Indicator to Monitor Mediterranean Wetlands

RESEARCH ARTICLE
Development of an Indicator to MonitorMediterranean WetlandsAntonio Sanchez1, Dania Abdul Malak1*, Anis Guelmami2, Christian Perennou2
1 European Topic Centre, University of Málaga, Málaga, Spain, 2 Tour du Valat Research Centre for theConservation of MediterraneanWetlands, Arles, France
AbstractWetlands are sensitive ecosystems that are increasingly subjected to threats from anthro-
pogenic factors. In the last decades, coastal Mediterranean wetlands have been suffering
considerable pressures from land use change, intensification of urban growth, increasing
tourism infrastructure and intensification of agricultural practices. Remote sensing (RS) and
Geographic Information Systems (GIS) techniques are efficient tools that can support moni-
toring Mediterranean coastal wetlands on large scales and over long periods of time. The
study aims at developing a wetland indicator to support monitoring Mediterranean coastal
wetlands using these techniques. The indicator makes use of multi-temporal Landsat im-
ages, land use reference layers, a 50m numerical model of the territory (NMT) and Corine
Land Cover (CLC) for the identification and mapping of wetlands. The approach combines
supervised image classification techniques making use of vegetation indices and decision
tree analysis to identify the surface covered by wetlands at a given date. A validation pro-
cess is put in place to compare outcomes with existing local wetland inventories to check
the results reliability. The indicator´s results demonstrate an improvement in the level of pre-
cision of change detection methods achieved by traditional tools providing reliability up to
95% in main wetland areas. The results confirm that the use of RS techniques improves the
precision of wetland detection compared to the use of CLC for wetland monitoring and
stress the strong relation between the level of wetland detection and the nature of the wet-
land areas and the monitoring scale considered.
IntroductionIn the context of freshwater management, resource mapping and inventorying are key to iden-tify the location, biological productivity, potential multiple uses and biodiversity profiles ofwetland ecosystems [1]. Traditional methods for mapping and inventorying resources at re-gional or national scales, mainly through fieldwork, are expensive and time-consuming [2] andfrequently suffer spatial incompleteness, scalar inconsistencies and temporal uncertainties [3][4]. The Ramsar convention highlights the importance of filling the gaps in baseline inventory,
PLOSONE | DOI:10.1371/journal.pone.0122694 March 31, 2015 1 / 19
a11111
OPEN ACCESS
Citation: Sanchez A, Abdul Malak D, Guelmami A,Perennou C (2015) Development of an Indicator toMonitor Mediterranean Wetlands. PLoS ONE 10(3):e0122694. doi:10.1371/journal.pone.0122694
Academic Editor: Jian Liu, Shandong University,CHINA
Received: October 16, 2014
Accepted: February 15, 2015
Published: March 31, 2015
Copyright: © 2015 Sanchez et al. This is an openaccess article distributed under the terms of theCreative Commons Attribution License, which permitsunrestricted use, distribution, and reproduction in anymedium, provided the original author and source arecredited.
Data Availability Statement: Data have beendeposited to the Harvard Dataverse (http://dx.doi.org/10.7910/DVN/29218).
Funding: The authors have no support or funding toreport.
Competing Interests: The authors have declaredthat no competing interests exist.

and stresses the need of developing techniques that can fill these gaps by using new technolo-gies namely RS and GIS applications [3] [5].
Over large spatial and temporal scales, these powerful techniques are used as cost effectivetools to improve knowledge on the types and conditions of wetlands [5] [6] in the context ofstandardizing wetland monitoring mechanisms, and for managing extensive wetlands in thecontext of the Ramsar Convention [7].
Accurate spatial information proved to assess efficiently natural and anthropogenic wet-lands [8] and temporal imagery proved to be effective in analyzing wetland dynamics in spaceand time [9], making satellite imagery and RS techniques valid tools to be used by wetlandmanagers and scientific researchers for monitoring and analyzing changes in wetlands.
In this context, this research supported the RhoMeo program (Rhone Mediterranean Obser-vatory, http://rhomeo.espaces-naturels.fr), led by the Rhone Basin Water Authority in south-east France, in the development and testing of methods to improve the analysis of wetlandsusing RS techniques.
It is to note that, though very useful, RS techniques have some limitations as well. For somepurposes, such as mapping and inventorying, RS can serve as a foundation or core technology,but in others, such as monitoring, hydrological modeling or generation of historical time seriesinformation, its use is normally limited to a support technology to complement ground-basedprograms [7].
The goal of this study is to develop an indicator to detect the extension of Mediterraneanwetlands at local level based on RS techniques. In addition, the use of the indicator can supportdetecting changes in wetlands to improve their monitoring and assessment potentials atlocal scale.
Study AreaThe spatial framework of the study is the region Provence-Alpes-Côte d'Azur (PACA region),in southeastern France, including five of its six departments due to the availability of data(Fig 1): Dep. 04 (Alpes-de-Haute-Provence), 05 (Hautes-Alpes), 13 (Bouches-du-Rhône), 83(Var) and 84 (Vaucluse).
The PACA region has a total surface of around 3 million ha of which around 156,000 ha areinventoried as wetlands. Around 67% of the wetland surface is located in Dep. 13 (Table 1)dominated by large wetland areas having a mean surface of 1185 ha. The Camargue NaturalRegional Park (PNRC) is a wetland of international importance (under Ramsar), and is locatedin Department 13. The PNRC covers 82,000 ha of which 52,000 ha are wetlands. Rice fields inthe PACA region are limited to this department covering a surface ranging between 10,000–15,000 ha, depending on the study year. They are included under the category “wetlands”, fol-lowing the Ramsar definition used throughout this study.
The size of wetlands and water bodies is highly variable, ranging between 0.05 and 12,500ha according to the inventories. The wetlands are diverse, especially in the PNRC area wherethere is a mixture of natural and semi-natural wetlands: large brackish lagoons, marshes,ponds, salinas, rushes, reeds, salt meadows, rice fields, etc. Due to the region´s topography, dif-ferent types exist in the study area where wetlands of the northern (Alpine) departments arecomposed mostly of rivers and their annexes (wet meadows, riparian woodlands) which to-gether with lakes and dams account for a large part of the wetland surface, e.g. in departments04 and 05, being about 24% of wetlands in the PACA.
Another aspect is the difference in the distribution and shape of wetlands throughout the re-gion (Fig 2). While in the southern, coastal areas the wetlands are large and well defined, the
An Indicator to Monitor MediterraneanWetlands
PLOS ONE | DOI:10.1371/journal.pone.0122694 March 31, 2015 2 / 19

alpine areas show a very homogeneous appearance, with wetlands mostly poorly defined orwith small size and linear features, that hinders their detection by RS techniques.
Material and Methods
Datasets and spatial informationSatellite imagery. The images used in this study were Landsat satellite series (NASA,
USGS) having the longest temporal record of space-based earth observations [10] and havingtheir historical data archives freely available for research purposes. The images used have a res-olution of 30 m and cover the year 1984 (Landsat 5 TM), and 2001 (7 ETM+ imagery). Between4 and 6 images were collected for each department covering different months of both years(Table 2). We attempted to collect images on similar dates (months), paying special attentionto the hydrologic cycle and the seasonality of the wetlands in the PACA region, in order to
Fig 1. Study area. PACA region: location and departments.
doi:10.1371/journal.pone.0122694.g001
Table 1. Percentage of total wetlands in the PACA region by department.
Dep 05 Dep 04 Dep 84 Dep 13 Dep 83 Dep 6
10.8% 13.2% 5.3% 66.8% 3.9% -
Currently there is not data on the surface of wetlands for Dep. 6.
doi:10.1371/journal.pone.0122694.t001
An Indicator to Monitor MediterraneanWetlands
PLOS ONE | DOI:10.1371/journal.pone.0122694 March 31, 2015 3 / 19

cover all seasons of the year and the different flooding stages of wetlands in the region. Due tothe high presence of clouds in the images of the spring of 1984, we chose pictures of 1985.
Tasseled Cap (TC) transformation [12] was applied to the Landsat imagery. The TC is in-spired by the method of principal component analysis combined with a generalization fromempirical observations. It transforms the Landsat bands in six principal components: the firstthree represent important information of the image while the others provide residual informa-tion. The TC variables used in this study were the Greenness (G) and Wetness (W) indices to
Fig 2. Topographic map of the PACA region and samples of satellite images (false color) of Dep. 13 (littoral) and Dep. 05 (mountainous).
doi:10.1371/journal.pone.0122694.g002
Table 2. Summary of dates and properties of the satellite imagery used in the study.
Period Satellite Number of Bands Bands used Resolution Image Date
1984 Landsat 5 TM 7 Bands 1 to 5, and 7 30 m Jul—Aug 1984 Sep—Oct 1984 Nov—Dec 1984 Mar 1985
2001 Landsat 7 ETM+ 7 Bands + 1 Panchromatic 1 to 5, and 7 30 m Jan—Mar 2001 Apr—May 2001 Jul—Aug 2001 Oct 2001
According to the department, dates may change due to the presence of clouds in the images.
doi:10.1371/journal.pone.0122694.t002
An Indicator to Monitor MediterraneanWetlands
PLOS ONE | DOI:10.1371/journal.pone.0122694 March 31, 2015 4 / 19

separate wetland areas and water bodies from the rest of the areas. These variables have valuesbetween -1 as minimum and 1 as maximum. G is correlated with the vegetation vigor (vegetat-ed areas are greater than zero) and W related to vegetation and soil moisture (wet areas aregreater than zero).
Spatial data. Four layers of land reference data available for the PACA region were used forthis study: the wetland inventories of the PACA Region (Fig 2), the land use/land cover (LULC)layers of the PNRC, the CLC maps of the region, and a numerical model of the territory (NMT).
The first one, the wetland inventory, displays the surface covered by water bodies and wet-lands in the study area. These inventories were developed by local authorities and experts andhave been validated through field-checking (except for Dep. 06, which has none). The invento-ries were developed between 2001 and 2012, then aggregated and they provide a reliable over-view of regional wetlands for the decade 2001–2010. Inventories of Dep. 05 and 84 were nottotally completed at the time of the analysis (Fig 3), and the analysis only covered theirinventoried parts.
In the case of Dep. 13, a land use layer was available for the PNRC region that was used inthis study, providing more comprehensiveness because the inventory for this department didnot map at all the rice fields in the region. The LULC layer contains accurate and detailed infor-mation about the land use classes in the PNRC: types of agriculture, water bodies, forests,urban areas, etc. This layer was updated every 5 years by the PNRC authorities since 1991, in-cluding methodological improvements over time that however hinders diachronic compari-sons. In this study we used the 2001 map.
Due to the lack of an accurate LULC layer that covers the whole PACA region, CLC layersfor the years 1990 and 2000 were used whenever a deeper analysis of land uses was required.
Fig 3. Study area: Departments of the PACA region, their relative wetland surfaces, and% covered by wetland.
doi:10.1371/journal.pone.0122694.g003
An Indicator to Monitor MediterraneanWetlands
PLOS ONE | DOI:10.1371/journal.pone.0122694 March 31, 2015 5 / 19

Classes under Agricultural and Urban areas, wetlands and water bodies (excluding Sea andocean) were extracted due to the relevance to the analysis.
Monitoring the mountainous part of the PACA region presents topographical and climaticlimitations due to the alpine influence in the North increasing the appearance of shadows,clouds and snow in the satellite images analyzed. This hinders the correct image analysis as itgenerates certain confusions in the classification process [13]. A numerical model of the terri-tory (NMT) of 50 m resolution produced by the National Institute of Geography of France wasused as ancillary data to correct these topographic effects.
Description of the indicatorThe wetland indicator aims at identifying the total surface of wetlands at a given date includingwetlands, water bodies, and rice fields. In addition, it detects the wet part of the meadows cate-gory that are not categorized as such in the CLC and rather included within one meadow cate-gory without differentiation of wet and dry meadows. The analyses of this study covered theperiod between 1984 and 2001.
The methodology combines different classification techniques according to land coverageand uses some masking layers to exclude regions not related to the analysis. The study area wasdivided into three categories in order to improve the detection mechanism being water bodies,land and overlaying vegetation, and rice fields.
Therefore, the indicator is basically the sum of three layers obtained with three differentmethods of classification (Fig 4).
Fig 4. Diagram of the classification process developed for the wetland indicator.
doi:10.1371/journal.pone.0122694.g004
An Indicator to Monitor MediterraneanWetlands
PLOS ONE | DOI:10.1371/journal.pone.0122694 March 31, 2015 6 / 19

Water bodies are detected using a decision tree based on the Greenness andWetness indicesof the TC transformation. Land and overlaying vegetation associated to water (wet areas) aredetected through a supervised classification of Landsat imagery using the maximum likelihoodalgorithm. Rice fields are detected using a seasonal image change analysis based on vegetationdynamics provided by the Greenness and Wetness indices.
Each of these techniques is used with different parameters according to the properties ofeach image and the criteria of the researcher.
Binary masks. Binary masks are developed based on the spatial datasets defined earlier.These masks contain two types of information: presence of data, represented as 1, or absence ofdata, represented as 0. This selection is used to exclude areas that are not contributing to theanalysis of the satellite reducing unnecessary processing and reducing the amount of errors.The following masks are used:
Inventory mask: a mask created for each department using the spatial information from thewetland inventories of the PACA region limiting the extension of certain analysis to theinventoried areas.
Slope mask: Based on the NMT data, a slope layer was developed presenting slopes lower orequal to 15%. The assumption was based on the presence of wetlands in areas presenting lowslopes [14]. This layer is used in order to reduce errors in the classification process in moun-tainous regions within the PACA.
CLC masks: this mask was created by two supervised classifications of the Landsat imagery,one targeting the agricultural areas and another for urban areas. The extension of agricultureand urban areas of CLC 1990 and 2000 were used as a mask to cover the Landsat images. Theresulting layers contain finer information on agriculture and urban areas as regions that CLCmay overestimate the extension of these regions due to its coarse resolution or internal errors.Namely, in the case of the PNRC, CLC overestimates rice fields including areas that do not sup-port this cultivation [15].
Due to their higher resolution (30 m), these new layers are a more accurate reference for ag-ricultural and urban areas that are used to contrast the changes of wetlands. These layers alsosupport in reducing some classifications errors when analyzing wetland areas, namely the er-rors in classifications between natural vegetation and crops or river beds and urban areas.
Water bodies: decision tree and flow accumulation lines. Greenness (G) andWetness(W) are used in a decision tree (Fig 5) to distinguish between water areas, having a greennessless than zero and a wetness greater than zero (G< 0; W> 0), and no water areas, with green-ness values higher than zero and wetness below zero (G> 0; W< 0). In order to avoid errone-ous classifications, different thresholds are chosen based on the data of each satellite image aswater presents different spectral responses according to the time of year (water depth, particlesin suspension, etc.).
The NMT is used to calculate the parameters of flow direction and flow accumulation lines.These parameters account the number of pixels that naturally drain into an outlet (pixel) mark-ing the water flow. Once contrasted with the satellite information, this parameter proves to bea valid tool in identifying narrow linear features (channels and streams) that are not always de-tected by satellite images (Fig 6). An appropriate threshold is set, based on a visual analysis, foreach image to reduce the amount of information reducing the error rates as there are a substan-tial number of small streams that may be omitted due to their low contribution to the majorwater flows. Thresholds range between 200–700 mm/year and the resulting information onwater courses is added to the decision tree layer obtaining a full layer on water bodies.
Wetland vegetation: supervised classification. The supervised classification supports theprocess of separating soils and vegetation related to water bodies or wetlands from other landcovers. The slope masks were used in the classification of the satellite images to minimize the
An Indicator to Monitor MediterraneanWetlands
PLOS ONE | DOI:10.1371/journal.pone.0122694 March 31, 2015 7 / 19
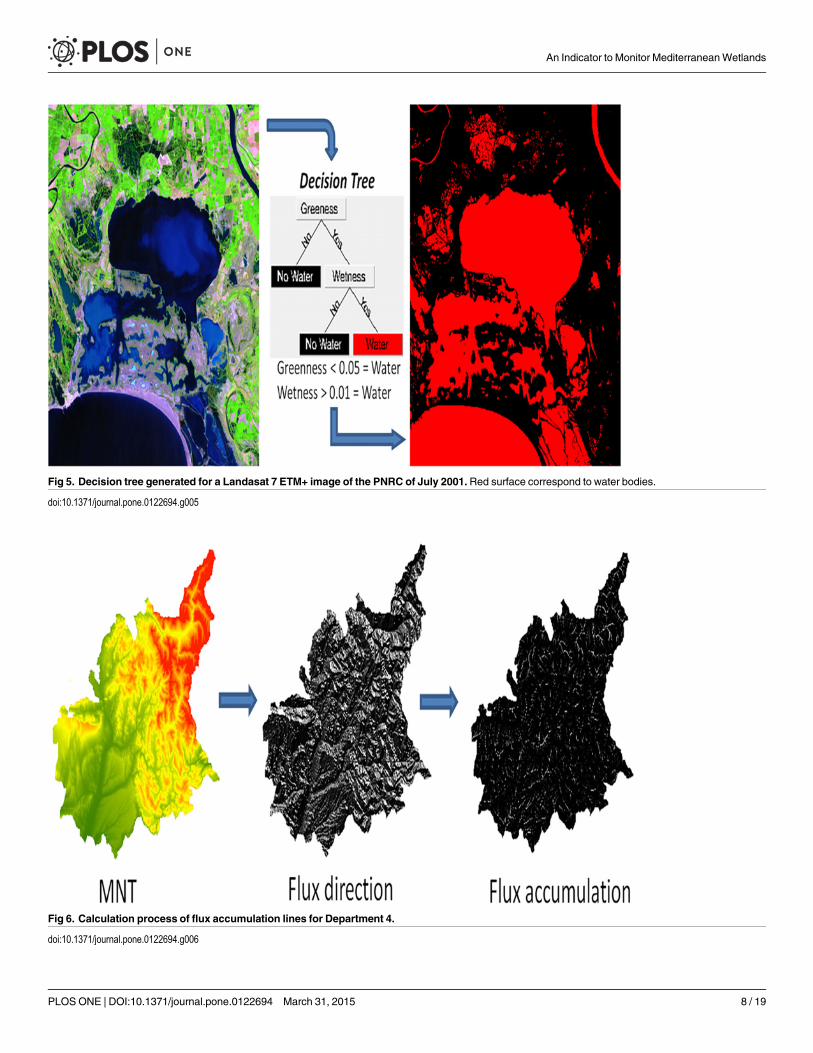
Fig 5. Decision tree generated for a Landasat 7 ETM+ image of the PNRC of July 2001.Red surface correspond to water bodies.
doi:10.1371/journal.pone.0122694.g005
Fig 6. Calculation process of flux accumulation lines for Department 4.
doi:10.1371/journal.pone.0122694.g006
An Indicator to Monitor MediterraneanWetlands
PLOS ONE | DOI:10.1371/journal.pone.0122694 March 31, 2015 8 / 19

effect of the mountains, as this process covers a larger number of land covers and is quite sensi-tive to the effects of the hill shades (i.e. shadows, bare rocks). Through this process we extracteddifferent classes of wetland namely riparian forest, floodplains and river beds. This step in-cludes two processes with different approaches depending on the analyzed area:
Areas inside the inventories are classified using the inventory masks, a supervised classifica-tion is performed only for the areas that are included in the wetlands inventories or in the wet-land classes of the PNRC LULC layers. That way, it is possible to focus on representingwetlands. Lower thresholds can be used for the different classes making the classification moresensitive for wetland detection.
The second classification process is used to represent the areas outside the inventories (notinventoried as wetlands). In order to reduce the errors, the thresholds used for the classes arelower than the previous ones (less sensitive classification). The urban and agriculture mask de-rived from CLC was used in order to generate less classification confusions. Mask based onCLC 1990 was used for images from 1984 and mask of CLC 2000 for those from 2001.
Rice fields: image change. Rice fields were analyzed comparing Greenness values betweensummer and autumn months. According to rice crops annual cycle [11], rice plants have theirmaximum height (growth) between July and August, while the harvest begins in late Septem-ber. Therefore, the highest differences in this variable are observed during summer and earlyautumn periods. A change threshold is applied to differentiate and exclude other types of vege-tation as they experience a much lower change in the G and W indices (Fig 7). The resultinglayer represents the surface strictly covered by rice fields.
Fig 7. Image change process for rice fields detection in the PNRC between July and October, 2001.White areas correspond to a high change ongreenness values representing rice fields.
doi:10.1371/journal.pone.0122694.g007
An Indicator to Monitor MediterraneanWetlands
PLOS ONE | DOI:10.1371/journal.pone.0122694 March 31, 2015 9 / 19

Surface of wetlands: union of layers. The resulting three layers on water bodies, wet areasand rice fields are combined to form the wetland indicator layer. The monthly images of eachdepartment are aggregated into one to get the total surface covered by wetlands in a completeannual cycle (Fig 8). The layer is the union of all the pixels detected as wetland by the indicator.
Evaluation of results. A ground truth process is applied to the final layer of the indicator.The results obtained for the years 1984 and 2001 are compared to the wetlands inventories inorder to assess the reliability of the indicator. The classification results are validated using theavailable wetlands reference (inventories) where two types of errors (errors A and B) are calcu-lated (Fig 9):
Error A is the percentage of land that is erroneously classified as wetland. This error is un-derstood as the surface detected by the indicator that is outside the reference layers (not consid-ered as wetland in the inventory). It would be the overestimation of wetlands compared withthe inventories.
Error B corresponds to the percentage of real wetlands (present in the inventories) that arenot detected by the indicator. In other words, this would be the surface of the references that isnot classified as wetland (omission).
Due to the temporal gap between inventories (2000–2001) and images used for the indicatordevelopment, as comparisons are made, error A observed in 1984 may correspond to actualwetlands of that date that have been lost in the year 2000 so they are not included in invento-ries. Similarly, a portion of error B can be caused by new wetland areas generated between 1984and 2001, and therefore they are not detected in the images of 1984.
Fig 8. Example of the layer union process for Dep. 13.Water bodies, wetland vegetation and rice fields are combined to obtain the wetland indicator layer.
doi:10.1371/journal.pone.0122694.g008
An Indicator to Monitor MediterraneanWetlands
PLOS ONE | DOI:10.1371/journal.pone.0122694 March 31, 2015 10 / 19

Results and Discussion
Wetland indicator resultsWetland detection showed to exceed 80% of the inventoried surfaces in most of the studied de-partments for the years 1984 and 2001, although Dep. 84 showed a lower detection rate, around70–76%.
Fig 10 shows the results of the level of detection of the indicator per department. Interannu-al differences exist, such as in the case of Dep. 04 or 83, where the detection varies by as muchas 20%. Several reasons could explain this, such as changes in wetland areas (land use change),the quality of the images used in the classifications, or inaccuracies in the inventories. Consid-ering the whole study area (the 5 departments.), the total wetland surface detected correspondswell with the inventories, with only a slight over-estimation: +4.6% in 1984, +0.6% in 2001.
Fig 9. Illustrative example of error A and error B calculated from the layers of the indicator and the inventories of wetlands.
doi:10.1371/journal.pone.0122694.g009
An Indicator to Monitor MediterraneanWetlands
PLOS ONE | DOI:10.1371/journal.pone.0122694 March 31, 2015 11 / 19

Two types of errors have been calculated in the areas detected by the indicator. Fig 11 showsthe percentage of errors varying between 6–73%. Dep. 13 shows the least percentage of errors,rounding 6% for both errors in year 2001; 20% for error A and 10% for error B in 1984. This isexpected as remote sensing has proven to be a very efficient tool in areas with flat topographywhere the wetlands are large and well defined [16]. Wetlands in this area have good flood con-ditions throughout the year, being mainly large lagoons, marshes, salines and rice fields receiv-ing the majority of the water contributions of the basin. Therefore, as results showed, it is anideal area for wetland detection through RS techniques. The results in this department are real-ly good, in line with, and improving in some cases, those obtained by other wetland indicators[2, 16, 17]. In fact it has achieved similar results to those achieved with SPOT-5 imagery in thePNRC region [18, 19]
Results for Dep. 13 contrast with those obtained for the alpine areas, especially in Dep. 05and 04 whose error rates are much higher being around 30–50% for both errors A and B (suc-cess of 50–70%). These results are below the expected accuracy but are acceptable consideringthe topography of the area [20] but it does not reach the accuracy that other authors have suc-ceeded in other areas of research [21, 22].
Dep. 84 shows big differences between error A and B, unlike the previous ones which werequite similar although slightly higher in error B, about 5%. Dep. 84 presents better numbers foroverestimated areas (error A), 21% and 31% for years 2001 and 1984 respectively, being about
Fig 10. Indicator results in hectares. Years 1984 and 2001 are compared with the wetland inventories.Different scales are used in order to show inmore detail the differences in surface detected by RS in each department.
doi:10.1371/journal.pone.0122694.g010
An Indicator to Monitor MediterraneanWetlands
PLOS ONE | DOI:10.1371/journal.pone.0122694 March 31, 2015 12 / 19

20% higher for B error, 40% in 2001 and 54% in 1984. Wetlands areas located in the Alpine re-gion of the PACA are based mainly on rivers and streams, most of short length and width, withfew areas of flooding. These are difficult to detect visually because of the resolution of the Land-sat imagery. This would explain the higher percentage obtained for error B, since a large part ofthe surface inventoried in the field was not detected due to the limitations of the Landsat 30 mresolution imagery [23, 24]. Most wetlands that are easily detectable correspond to large waterbodies, i.e. lakes or dams identified through the main channels. Satellite images of higher reso-lution have been shown to improve the accuracy of remote sensing studies on different topics[25, 26]. Therefore, it is expected that advances in the technology of satellites and the availabili-ty of higher quality images will bring improvements in the study of these departments.
Dep. 83 alto presents important percentages for errors A and B, being higher than 55%. De-spite being a coastal department, it has a pronounced relief in the northern part presenting wetareas of small size which are difficult to detect. It is therefore another case limited by the topog-raphy and the small size of wetlands
Fig 11. Results of Error A and B (%) obtained in the analysis of the wetland indicator in years 1984 and 2001.
doi:10.1371/journal.pone.0122694.g011
An Indicator to Monitor MediterraneanWetlands
PLOS ONE | DOI:10.1371/journal.pone.0122694 March 31, 2015 13 / 19

Department 06 does not have an inventory of wetlands so far to perform the validation ofthe indicator. However, being a region very similar to Dep. 83 in terms of topography, probablyerror rates would be quite similar, being also the accuracy quite low compared to Dep. 13
The errors A and B calculated for the whole region (5 departments) are respectively 27%and 24% for the year 1984, and 17% and 18% for 2001 accounting for the differences in the spa-tial overlap between the inventories and the wetland indicator layers (Fig 9). Therefore, it ispossible to say that the overall results are good and are in line with the studies consulted duringthis research.
As discussed above, the indicator shows more accurate results in large, well defined wet-lands, especially in regions with minor slopes. Errors A & B range between 6–20% in Dept. 13,but between 20–73% in Depts. with complex topography, mainly due to shadow effects, the na-ture of the wetlands in these regions (i.e. mainly small or linear wetlands), and also the limita-tions on image resolution.
Fig 12 compares wetlands mapped from inventories with the surface detected by the satel-lite-derived indicator. The maps show that the regional distribution of wetlands matches withreasonable accuracy from a visual standpoint; the satellite-based indicator seems to detect ahigher amount of isolated wetlands in mountainous regions. But facing a regional mapping,the result can be considered quite acceptable.
It is also remarkable that despite the ranges of errors A (7%– 73%) and B (7%– 60%)(Fig 11) at department scale, the overall wetland surfaces detected at PACA scale in both yearsfit within 5% the surface inventoried (Fig 10). Both types of errors largely compensate each
Fig 12. Map of wetlands of the PACA region. To the left, surface detected by the wetland indicator; to the right, inventory of wetlands.
doi:10.1371/journal.pone.0122694.g012
An Indicator to Monitor MediterraneanWetlands
PLOS ONE | DOI:10.1371/journal.pone.0122694 March 31, 2015 14 / 19

other, and when combined over a broad scale lead to an overall good approximation of wetlandareas at the regional level.
Another positive aspect of the results is that the indicator reaches its highest accuracy inPRNC area where most wetlands are concentrated (67% of the PACA region) and where thesehave greater ecological, environmental and socioeconomic importance [27, 28]. The alpineareas (Dep. 05, 04 and 84) represent about 30% of the total wetland surface in the region, beinga significant percentage. Given the nature of wetlands in the area, there are additional methodsthat could support the monitoring of wetlands such as streamflow and hydrometric monitoringsystems [29].
Evolution of wetlands between 1984 and 2001Table 3 shows variations between 1984 and 2001 of surfaces and error rates obtained for thewetland indicator. Positive values correspond to increase in surface detected or error rates. De-creases are negative numbers, being in the case of error A and B improvements in the precisionof detection.
The total surface of wetlands detected by the indicator for the PACA region declined by c.4% between 1984 and 2001, resulting in a loss of 6,302 hectares of wetlands in the region. ErrorA variation between these dates is -10.4%, accounting for the loss of wetlands. These areas arenot reflected in the inventories of the year 2000s and the indicator can support in providing anindication on where major reduction in wetland areas have occurred. Furthermore, this declineis not likely to be caused by the decrease in rice fields as the rice fields area has doubled overallin France between 1984 (9,400 ha) and 2001 (20,200 ha) (Centre Français du Riz, pers. comm.),with the Camargue accounting for the major part of the national total area.
At department level, the wetland surfaces detected within Dep. 04, 05 and 84 apparently in-creased, which is unlikely to have happened in reality given the overall pressure facing wetlandsin SE France [11]. In Dep. 05, the increase is +5.1% whereas both error rates remain very simi-lar. There is scientific evidence that classification products of Landsats 5 and 7 are very similar[30], so it is not something derived from the use of two different satellites. Therefore, thesesmall variations probably are caused by differences in the classification parameters (thresh-olds), which depend on the researcher and visual characteristics of the image. The mountain-ous areas generate more classification errors, so it is logical to think there is a greater sensitivityon the thresholds and these could generate significant differences in results [17, 20]. Further re-search will be needed to better understand the effects that slight changes in the thresholdscould have on the surface of wetland detected by the indicator.
In contrast, departments 04 and 84 present significant improvements in both error rates,but higher for Error B (i.e. less omission). This differential rate of improvement between ErrorsA and B may thus account for the increased wetland surface, through a better detection ofexistent wetlands.
Table 3. Variations in the wetland surface detected and in Error A and B between years 1984 and 2001.
Dep 05 Dep 04 Dep 84 Dep 83 Dep 13 Total PACA Dep. Mean
Surf. Detected +5.1 +22.8 +7.0 -19.8 -12.5 -4.0 -
Error A +1.3 -7.7 -10.1 -17.9 -13.5 -10.4 -9.6
Error B -0.2 -17.9 -14.6 +4.6 -3.5 -5.3 -6.3
Positive values correspond to increases in error rates; negative numbers are improvements in the degree of detection.
doi:10.1371/journal.pone.0122694.t003
An Indicator to Monitor MediterraneanWetlands
PLOS ONE | DOI:10.1371/journal.pone.0122694 March 31, 2015 15 / 19

An important aspect to consider is that we used the 2001 wetland mask to analyse the 1984images, which means that when calculating the error A some wetland areas could be omitted.Therefore, a fraction of the error A obtained in 1984 is caused by true wetlands. This would ex-plain a significant portion of the declines in the overestimation. Furthermore, results in bothdepartments may be influenced by the classification parameters set by the researcher as in thecase of Dep. 05.
Fig 13. Cases of wetland classifications between 1984 and 2001.
doi:10.1371/journal.pone.0122694.g013
An Indicator to Monitor MediterraneanWetlands
PLOS ONE | DOI:10.1371/journal.pone.0122694 March 31, 2015 16 / 19

In 2001, Dep. 13 shows a 12.5% decrease in the wetland surface detected compared to year1984. Error A was reduced by 13.5%, but Error B only to a lesser extent (3.5%). In short, over-estimations were reduced significantly between 1984 and 2001, whereas omissions barelychanged. So the apparent reduction of wetland surface between the 2 dates may be partly dueto a methodological improvement (i.e. a reduction of the wetland overestimation, between1984 and 2001), but possibly too to a true wetland loss.
In Dep. 83, apparent wetland losses were higher (–19.8%), the reduction in overestimationswere higher still than in Dep. 13 (Error A: -17.9%) but the omissions (Error B) increased(+4.6%). Here again, the different evolution of Errors A/ B could therefore account for the ap-parent wetland loss—which could potentially include a real reduction component too.
Fig 13 shows specific cases of apparent wetland losses between the years 1984 and 2001 (im-ages 1 to 3), cases of stability or no change (image 4), as well as overestimations caused by clas-sification errors (images 5), and cases of wetlands detected by the indicators that were notinventoried (image 6) or generation of new ones (image 8).
The main limitation of the wetland indicator is related to the classification process, whereconfusions between wetlands and dry salinas and river banks might occur depending on thedate of the satellite images used. Using NMT data helped overcome the limitations imposed bythe topography (clouds, shadows, snow, and linear wetlands), but in the case of small wetlands,the indicator seems to reach its limits increasing the error of detection whenever the wetlandsare smaller.
Another important methodological aspect is the use of wetlands inventories masks from2001 and the absence of a previous inventory (80s or 90s), as this makes impossible an effectivecomparison of the results in both studied years as well as the correct analysis of changes in thesurface of wetlands between 1984 and 2001.
For subsequent years (or previous) there will likely be no new wetland inventories available,only those used for this study. Wetlands outside the inventory should be detected by the satel-lite image as long as they have typical elements of a wetland that can be analysed (presence ofwater, vegetation changes, etc.). However, the surface detected will be corrupted by the realoverestimation (classification errors). Therefore, this should be a limitation in the future as themethod can identify wetland areas outside the current inventory but it is difficult to analysehow much of the error A is due to classification confusions or true wetlands. The layers ob-tained for areas outside the inventory should have a special treatment for a deeper analysis ofthe distribution of surface overestimated. On the other hand, if any area of the current invento-ry were no longer a wetland, it would not be detected in the new classifications (another landcover class would be detected instead).
ConclusionsThis research provides an overview of the benefits and limitations of one spatial indicatorusing satellite imagery and remote sensing techniques for identifying, inventorying and moni-toring wetlands, as applied to a practical case study, i.e. wetlands of the PACA region.
Landsat imagery of 30 m resolution proved to support efficiently the identification of wet-lands and therefore the calculation of total wetland area, although with different efficiency de-pending on areas. The application of this indicator with higher quality images could improvesignificantly the detection of wetlands in the region.
The approach works best for permanent wetlands in flat areas, but less so in areas with acomplex topography, where shadows in mountainous areas and the presence of snow increaseerrors in the process of image classification. But despite this, at the regional scale, both the totalsurface detected (Fig 10) and the wetland spatial distribution (Fig 12) largely correspond with
An Indicator to Monitor MediterraneanWetlands
PLOS ONE | DOI:10.1371/journal.pone.0122694 March 31, 2015 17 / 19

existing inventories, and demonstrate that a compensation exists between the two main typesof errors studied. Therefore, the general results from our approach seem appropriate for esti-mating the surface area of wetlands at a regional scale, in an inventory perspective, and alsohave a similar accuracy to wetland indicators developed by other authors.
However, for monitoring purposes, i.e. detecting and interpreting wetland changes in time,further methodological improvements are needed. We were not yet able to separate unambigu-ously the potential impact of a change in error rates (A & B) from a real change in wetland sur-face area, e.g. in Depts. 13 and 83. Improving the protocol may require using less coarse fieldreferences for tests and validation, e.g. true field-checking. Here we used a single reference (i.e.a set of wetland inventories from the 2000’s) for ground-truthing our satellite-based results for2 dates (1984 and 2001). This may be relatively valid for 2001, but less so for 1984, for whichthe “Errors” A & B may have been over- or underestimated, in case the wetland extent actuallychanged in the field between 1984 and the inventory date. Moreover, an inventory cannot betaken as representing with 100% accuracy the field reality in the year it is done, as some ran-dom field checks (not reported here) demonstrated.
This constitutes presently the main area to be further investigated before our approach canbe applied for routine monitoring, together with the improvements required for regions with amarked topography and more linear, smaller wetlands, such as Alpine areas.
AcknowledgmentsThanks are due to Ph. Isenman (PNRC), L. Quelin and H. Vanderpert (CEN-PACA) for pro-viding inventory or LULC original data.
Author ContributionsConceived and designed the experiments: AS DAM. Performed the experiments: AS. Analyzedthe data: AS. Contributed reagents/materials/analysis tools: AS DAM. Wrote the paper: ASDAM AG CP.
References1. Taylor ARD, Howard GW, Begg GW. Developing wetland inventories in Southern Africa: A review.
Vegetatio. 1995; 118: 57–79.
2. Rebelo LM, Finlayson CM, Nagabhatla N. Remote sensing and GIS for wetland inventory, mappingand change analysis. Journal of environmental management. 2009; 90: 44–53.
3. Finlayson CM, Davidson NC, Spiers AG, Stevenson NJ. Global wetland inventory—status and futurepriorities. Marine and fresh water research. 1999; 5: 717–727.
4. Lehner B, Doll P. Development and validation of a global database of lakes, reservoirs and wetlands.Journal of Hydrology. 2004; 296: 1–22.
5. Davidson NC, Finlayson CM. Earth Observation for wetland inventory, assessment and monitoring.Aquatic Conservation: Marine and Freshwater Ecosystems. 2007; 17: 219–228.
6. Ramsey E.W. Radar remote sensing of wetlands. In: Lunetta RS, Elvidge CD editors. Remote sensingchange detection: environmental monitoring methods and applications. Ann Arbor Press, Michigan,US; 1998. pp 211–243.
7. MacKay H, Finlayson CM, Fernández-Prieto D, Davidson N, Pritchard D, Rebelo LM. The role of EarthObservation (EO) technologies in supporting implementation of the Ramsar Convention on Wetlands.Journal of environmental management. 2009; 90: 2234–42. doi: 10.1016/j.jenvman.2008.01.019PMID: 18462862
8. Xie Z, Xu X, Yan L. Analyzing qualitative and quantitative changes in coastal wetland associated to theeffects of natural and anthropogenic factors in a part of Tianjin, China. Estuarine, Coastal and Shelf Sci-ence. 2010; 86: 379–386.
9. Toyra J, Pietroniro A. Towards operational monitoring of a northern wetland using geomatics-basedtechniques. Remote Sensing of Environment. 2005; 97: 174–191.
An Indicator to Monitor MediterraneanWetlands
PLOS ONE | DOI:10.1371/journal.pone.0122694 March 31, 2015 18 / 19
10. Ju J, Roy DP. The availability of cloud-free Landsat ETM+ data over the conterminous United Statesand globally. Remote Sensing of Environment. 2008; Vol. 112(3): 1196–1211.
11. Tourenq C, Bennetts RE, Kowalski H, Vialet E, Lucchesi JL, Kayser Y, et al. Are ricefields a good alter-native to natural marshes for waterbird communites in the Camargue, southern France?. BiologicalConservation. 2001; 100: 335–343.
12. Kauth RJ, Thomas GS. The tasseled Cap—A Graphic Description of the Spectral-Temporal Develop-ment of Agricultural Crops as Seen by LANDSAT. Proceedings of the Symposium on Machine Pro-cessing of Remotely Sensed Data. Purdue University of West Lafayette, Indiana; 1976. pp.4B41–4B51.
13. Giles PT. Remote sensing and cast shadows in mountainous terrain. Photogrammetric engineeringand remote sensing. 2001; July: 833–839.
14. Rodhe A, Seibert J. Wetland occurrence in relation to topography: a test of topographic indices as mois-ture indicators. Agricultural and Forest Meteorology. 1999; 98–99: 325–340.
15. Perennou C, Beltrame C, Guelmami A, Tomas Vives P, Caessteker P. Existing areas and past changesof wetland extent in the Mediterranean Region: and overview. Ecologia Mediterranea. 2012; Vol. 38(2):53–66.
16. Sl Ozesmi, Bauer ME. Satellite remote sensing of wetlands. Wetlands Ecology and Management.2002; 10: 381–402.
17. Zhang Y, Lu D, Yang B, Sun C, Sun M. Coastal wetland vegetation classification with a Landsat The-matic Mapper image. International Journal of Remote Sensing. 2011; Vol. 32(2): 545–561. doi: 10.1080/01431160903475241
18. Davranche A, Poulin B, Lefebvre G. Mapping flooding regimes in Camargue wetlands using seasonalmultispectral data. Remote Sensing of Environment. 2013; Vol. 138: 165–171. doi: 10.1016/j.rse.2013.07.015
19. Davranche A, Lefebvre G, Poulin B. Wetland monitoring using classification trees and SPOT-5 season-al time series. Remote Sensing of Environment. 2010; Vol. 114(3): 552–562. doi: 10.1016/j.rse.2009.10.009
20. Weiss DJ, Walsh SJ. Remote Sensing of Mountain Environments. Geography Compass. 2009; Vol. 3(1): 1–21.
21. Wimmer A, Schardt M, Ziegler M, Ruppert G, Granica K, Schmitt U et al. International Archives of Pho-togrammetry and Remote Sensing. 2000; Vol. 33, B7.
22. Liu YS, Hu YC, Peng LY. Accurate Quantification of Grassland Cover Density in an Alpine Meadow SoilBased on Remote Sensing and GPS. Pedosphere. 2005; 15(6): 778–783.
23. Wijedasa LS, Sloan S, Michelakis DG, Clements GR. Overcoming Limitations with Landsat Imagery forMapping of Peat Swamp Forests in Sundaland. Remote Sensing. 2012; 4: 2595–2618. doi: 10.3390/rs4092595
24. Avitabilea V, Baccinib A, Friedlc MA, Schmulliusa C. Capabilities and limitations of Landsat and landcover data for aboveground woody biomass estimation of Uganda. Remote Sensing of Environment.2012; Vol. 117: 366–380. doi: 10.1016/j.rse.2011.10.012
25. Camathias L, Bergamini A, Küchler M, Stofer S, Baltensweiler A. High-resolution remote sensing dataimproves models of species richness. Applied Vegetation Science. 2013; Vol. 16(4): 539–551. doi: 10.1111/avsc.12028
26. Mahavir D. High (spatial) resolution vs. Low resolution images: a planner’s view point. International Ar-chives of Photogrammetry and Remote Sensing. 2000; Vol. 33, B7.
27. Aznar JC, Dervieux A, Grillas P. Association between aquatic vegetation and landscape indicators ofhuman pressure. Wetlands. 2003; Vol. 23(1): 149–160. doi: 10.1672/0277-5212(2003)023
28. Dervieux A. La difficile gestion globale de l'eau en Camargue (France): le Contrat de delta. Vertigo.2005; Vol. 6(3). doi: 10.4000/vertigo.2411
29. Halverson M, Fleming S. Complex networks, streamflow, and hydrometric monitoring system design.Hydrology and Earth System Sciences. 2014; 11: 13663–13710. doi: 10.5194/hessd-11-13663-2014,2014
30. Vogelmann JE, Helder D, Morfitt R, Choate MJ, Merchant JW, Bulley H. Effects of Landsat 5 ThematicMapper and Landsat 7 Enhanced Thematic Mapper Plus radiometric and geometric calibrations andcorrections on landscape characterization. Remote Sensing of Environment. 2001; 78: 55–70.
An Indicator to Monitor MediterraneanWetlands
PLOS ONE | DOI:10.1371/journal.pone.0122694 March 31, 2015 19 / 19