Development of an Electrochemical Immunosensor for Fumonisins Detection in Foods
24
Accepted Manuscript Title: Development of an Electrochemical Immunosensor for Aflatoxin M 1 in Milk with Focus on Matrix Interference Authors: Charlie O. Parker, Ibtisam E. Tothill PII: S0956-5663(08)00662-3 DOI: doi:10.1016/j.bios.2008.12.021 Reference: BIOS 3097 To appear in: Biosensors and Bioelectronics Received date: 10-9-2008 Revised date: 15-12-2008 Accepted date: 16-12-2008 Please cite this article as: Parker, C.O., Tothill, I.E., Development of an Electrochemical Immunosensor for Aflatoxin M 1 in Milk with Focus on Matrix Interference, Biosensors and Bioelectronics (2008), doi:10.1016/j.bios.2008.12.021 This is a PDF file of an unedited manuscript that has been accepted for publication. As a service to our customers we are providing this early version of the manuscript. The manuscript will undergo copyediting, typesetting, and review of the resulting proof before it is published in its final form. Please note that during the production process errors may be discovered which could affect the content, and all legal disclaimers that apply to the journal pertain.
Transcript of Development of an Electrochemical Immunosensor for Fumonisins Detection in Foods

Accepted Manuscript
Title: Development of an Electrochemical Immunosensor forAflatoxin M1 in Milk with Focus on Matrix Interference
Authors: Charlie O. Parker, Ibtisam E. Tothill
PII: S0956-5663(08)00662-3DOI: doi:10.1016/j.bios.2008.12.021Reference: BIOS 3097
To appear in: Biosensors and Bioelectronics
Received date: 10-9-2008Revised date: 15-12-2008Accepted date: 16-12-2008
Please cite this article as: Parker, C.O., Tothill, I.E., Development of an ElectrochemicalImmunosensor for Aflatoxin M1 in Milk with Focus on Matrix Interference, Biosensorsand Bioelectronics (2008), doi:10.1016/j.bios.2008.12.021
This is a PDF file of an unedited manuscript that has been accepted for publication.As a service to our customers we are providing this early version of the manuscript.The manuscript will undergo copyediting, typesetting, and review of the resulting proofbefore it is published in its final form. Please note that during the production processerrors may be discovered which could affect the content, and all legal disclaimers thatapply to the journal pertain.
LI2106
Text Box
Biosensors and Bioelectronics, Volume 24, Issue 8, 15 April 2009, Pages 2452-2457

Page 1 of 23
Accep
ted
Man
uscr
ipt
1
Development of an Electrochemical Immunosensor for Aflatoxin M1
in Milk with Focus on Matrix Interference
Charlie O. Parker, Ibtisam E. Tothill*
Cranfield Health, Cranfield University, Cranfield, Bedfordshire,
MK43 0AL, England, UK.
---------------------------------------------
Corresponding author: Tel.: +44 (0) 7500 766487
Manuscript

Page 2 of 23
Accep
ted
Man
uscr
ipt
2
Abstract
A simple sensor method was developed for aflatoxin M1 analysis to be applied
directly with milk by using antibody modified screen-printed carbon working
electrode with carbon counter and silver-silver chloride pseudo-reference electrode. A
competitive ELISA assay format was constructed on the surface of the working
electrode using 3,3,5’,5’-tetramethylbenzidine dihyrochloride (TMB) /H2O2
electrochemical detection scheme with horseradish peroxidase (HRP) as the enzyme
label. The performance of the assay and the sensor was optimised and characterised in
pure buffer conditions before applying to milk samples. Extensive interference to the
electroanalytical signal was observed upon the analysis of milk. Through a series of
chemical fractionations of the milk, and testing the electrochemical properties of the
fractions, the interference was attributed to whey proteins with focus towards -
lactalbumin. A simple pre-treatment technique of incorporating 18 mM calcium
chloride, in the form of Dulbucco’s PBS, in a 1:1 ratio to the milk sample or standards
and also to the washing buffer stabilised the whey proteins in solution and eliminate
the interfering signal. The resulting immunosensor was interference free and achieved
a limit of detection of 39 ng l-1 with a linear dynamic detection range up to 1000 ng l-
1. The developed immunosensor method was compared to a commercial ELISA kit
and an in-house HPLC method. The immunsensor was comparable, in term of
sensitivity, but vastly superior in term of portability and cost therefore a key
instrument for the detection of aflatoxin M1 at the source of the contamination.
Keywords: Immunosensor, Aflatoxin M1, Mycotoxins, Milk
Page 3 of 23
Accep
ted
Man
uscr
ipt
3
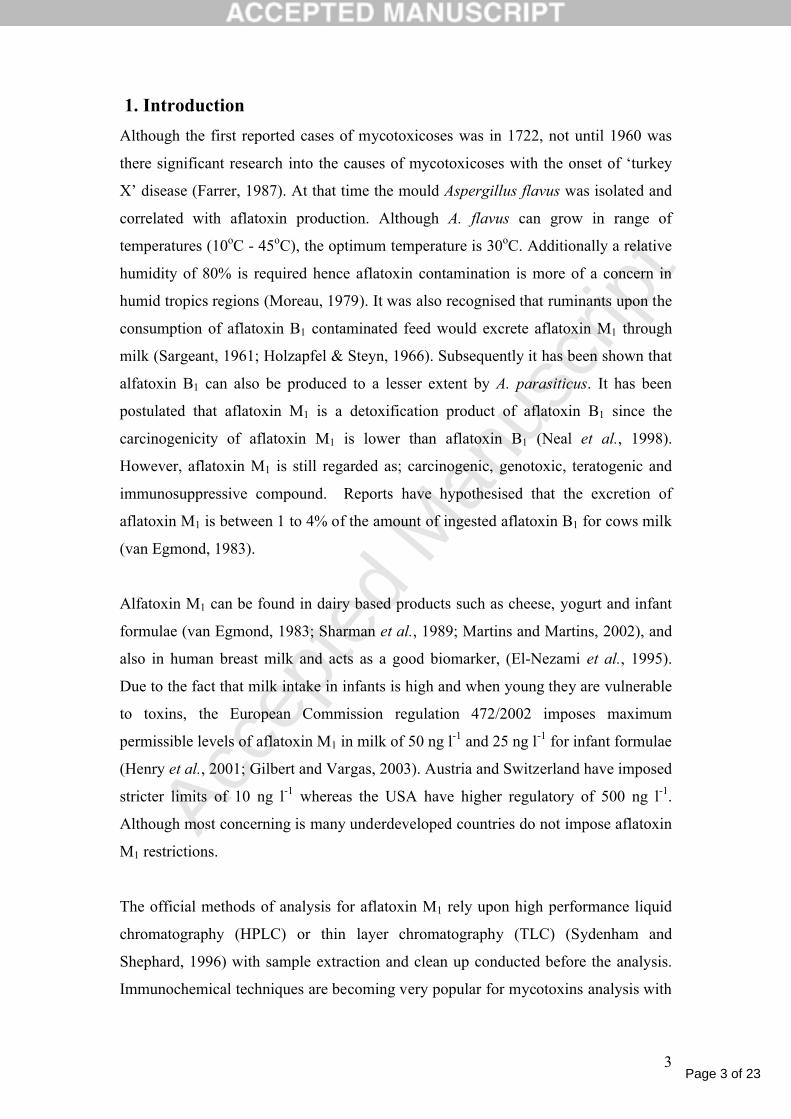
1. Introduction
Although the first reported cases of mycotoxicoses was in 1722, not until 1960 was
there significant research into the causes of mycotoxicoses with the onset of ‘turkey
X’ disease (Farrer, 1987). At that time the mould Aspergillus flavus was isolated and
correlated with aflatoxin production. Although A. flavus can grow in range of
temperatures (10oC - 45oC), the optimum temperature is 30oC. Additionally a relative
humidity of 80% is required hence aflatoxin contamination is more of a concern in
humid tropics regions (Moreau, 1979). It was also recognised that ruminants upon the
consumption of aflatoxin B1 contaminated feed would excrete aflatoxin M1 through
milk (Sargeant, 1961; Holzapfel & Steyn, 1966). Subsequently it has been shown that
alfatoxin B1 can also be produced to a lesser extent by A. parasiticus. It has been
postulated that aflatoxin M1 is a detoxification product of aflatoxin B1 since the
carcinogenicity of aflatoxin M1 is lower than aflatoxin B1 (Neal et al., 1998).
However, aflatoxin M1 is still regarded as; carcinogenic, genotoxic, teratogenic and
immunosuppressive compound. Reports have hypothesised that the excretion of
aflatoxin M1 is between 1 to 4% of the amount of ingested aflatoxin B1 for cows milk
(van Egmond, 1983).
Alfatoxin M1 can be found in dairy based products such as cheese, yogurt and infant
formulae (van Egmond, 1983; Sharman et al., 1989; Martins and Martins, 2002), and
also in human breast milk and acts as a good biomarker, (El-Nezami et al., 1995).
Due to the fact that milk intake in infants is high and when young they are vulnerable
to toxins, the European Commission regulation 472/2002 imposes maximum
permissible levels of aflatoxin M1 in milk of 50 ng l-1 and 25 ng l-1 for infant formulae
(Henry et al., 2001; Gilbert and Vargas, 2003). Austria and Switzerland have imposed
stricter limits of 10 ng l-1 whereas the USA have higher regulatory of 500 ng l-1.
Although most concerning is many underdeveloped countries do not impose aflatoxin
M1 restrictions.
The official methods of analysis for aflatoxin M1 rely upon high performance liquid
chromatography (HPLC) or thin layer chromatography (TLC) (Sydenham and
Shephard, 1996) with sample extraction and clean up conducted before the analysis.
Immunochemical techniques are becoming very popular for mycotoxins analysis with
Page 4 of 23
Accep
ted
Man
uscr
ipt
4
many literature reporting the use of either a commercially developed enzyme linked
immunosorbant assay (ELISA) or self developed immunoassays (El-Nezami, 1995;
Thirumala-Devi, 2002; Lopez et al., 2003; Rodriguez Velasco et al., 2003; Rastogi et
al., 2004; Sarimehmetoglu et al., 2004; Logrieco et al., 2004). Additionally liquid
chromatography- mass spectrometry (LC-MS) (Sørensen and Elbæk, 2005) has also
been employed. All of these methods are slow and most are performed in laboratory
settings and by qualified personnel. Unfortunately the regions of the world which are
most affected by aflatoxin contamination tends to be poorer areas with minimal
laboratory facilities. In India, for example, a recent survey found that 87.3% of the
milk based samples analysed were contaminated, of these 99% were outside European
limits. This is a major concern considering that India is the largest producer of milk
in the world (Rastogi et al., 2004). Therefore as stipulated by the united nations ‘there
is an urgent need for simple, robust, low-cost analysis methods, for the major
mycotoxins, which can be used in developing countries laboratories’ (Proctor, 1994).
Furthermore the United Nations are quoted saying that ‘the systematic and complete
monitoring of aflatoxin is a major challenge for the future, as food production
increases (Stroka and Anklam, 2002).
In this paper we present a cost effective, disposable immunosensor for the detection of
aflatoxin M1 which can be preformed in the field to meet the detection requirements
set out by the European Union and fulfilling the requirements quoted by the United
Nations. Primarily, the two main enzyme substrates used for immunosensors are
alkaline phosphatase and horseradish peroxidase. Volpe et al. (1998) has reported that
using 3,3’,5,5’- tetramethylbenzidine, (TMB) as an enzyme substrate for horseradish
peroxidase yield greater sensitivity than substrates for alkaline phosphatase.
Furthermore with the designed immunosensor to be used in raw milk, naturally
present alkaline phosphatase potentially may cause interference. Using TMB as a
substrate is re-enforced by Fanjul Bolado et al. (2005) who reported that TMB out
performs 2,2’-azino-bis-(3-ethyl-benzthiazoline-6-sulfonic acid) (ABTS) and o-
phenylenediamine (OPD), furthermore OPD and ABTS have shown to be mutagenic
and carcinogenic (Voogd et al., 1980).
The oxidation of TMB is a two step reaction. Firstly the addition of hydrogen
peroxide to heme group containing HRP enzyme, reduces the HRP to form an

Page 5 of 23
Accep
ted
Man
uscr
ipt
5
intermediate (compound 1), involving a 2 electron process, by changing the heme
(Fe3+) group into a ferryl oxo iron (Fe4+=O) and a porphyrin (P) cation radical. Upon
the addition of TMB, 2 molecules of TMB are oxidised by compound 1 to form a blue
coloured electrochemical product. Upon the release of H2O the peroxidase returns to
the native state via a further intermediate, leaving the TMB in an oxidized state.
Commonly sulphuric acid is added to the oxidised TMB to develop a stable yellow
diiamine product that is measured at 450 nm and can be measured by differential
pulsed voltammetry (Josephy et al., 1982; Ruzgas et al., 1996; Frey et al., 2000;
Tanaka et al., 2003).
In this work we report the development of a screen- printed electrode immunosensor,
based on a competitive reaction between the free aflatoxin M1 in the sample and an
aflatoxin M1 – horseradish peroxidase conjugate, for an immobilised monoclonal
antibody for aflatoxin M1. Using chronoamperometry, the signal generated by the use
of TMB / H2O2 was monitored to ascertain the concentration of HRP on the sensor
and consequently the concentration of aflatoxin M1 in the sample. The immunosensor
was optimised with regard interferences from the milk matrix. The simple method of
milk sample pre-treatment which was developed in this work and combined with the
optimised sensor is novel and being reported for the first time in this application.
2. Material and methods
2.1 Reagents and solutions
Aflatoxin M1 was purchased from Axxora UK Limited (Nottingham, UK), Anti-
aflatoxin M1 antibody (raised from rat) from Abcam Limited, (Cambridge UK),
Aflatoxin M1-HRP conjugate from a RIDASCREEN kit from R-Biopharm
(Glasgow, UK) as well as Alfaprep M immunoaffinity columns. 3,3’,5,5’-
Tetramethylbenzidine dihydrochloride, hydrogen peroxide, fish skin gelatine,
polyvinyl alcohol, polyvinylpyrrolidone and Tween 20 purchased from Sigma-
Aldrich (Poole, UK). Anti-Rat immunopure antibody (raised in goat with affinity for
the Fc fragment only) was from Perbio Science (Cramlington, UK). Milinex sheets
from Cadillac plastics (Swindon, UK), Electrodag 423-SS graphite ink, Electrodag
6038-SS Ag/AgCl from Acheson industries (Plymouth, UK), Blue epoxy insulating

Page 6 of 23
Accep
ted
Man
uscr
ipt
6
ink 242-SB, from ESL electroscience products (Reading, UK), Milk and dried milk
samples were obtained from the local supermarket.
2.2 Electrodes Fabrication
Screen- printed electrodes (SPEs) were fabricated in house by a multistage deposition
process using a DEK 248-screen printer and stencils (DEK, Weymouth, UK) (Kadara
and Tothill, 2004). The electrodes were printed using 250 μm thick polyester Melinex
sheets. The print parameters were set so that the squeegee pressure was 4 psi, a
carriage speed of 50 mm sec-1 and a print gap of 2.5 mm. For the fabrication, the basal
tracks for the three-electrode system were printed first using Electrodag 423-SS
graphite ink. The reference electrode was printed on one of the basal tracks using
Electrodag 6038-SS silver-sliver chloride ink and left to dry. The two other tracks
(graphite-carbon working electrode with a 5 mm diameter giving a 19.6 mm2 planar
area and a graphite carbon counter electrode (1.3 mm2 planar area). The blue epoxy
insulating layer was printed last using 242-SB protective polymer. Between each layer
the sheets were allowed to dry for 2 hours at 60oC and then after the insulating layer
the sheets were cured at 120oC for two hours. The different inks used and the
polyester sheet used in the sensor fabrications are stable at this temperature.
2.3 Procedures
Electrochemical measurements
For the electrochemical procedures a computer controlled four channel Autolab
electrochemical analyser multipotentiostat (Eco Chemie, Utrecht, The Netherlands)
was used throughout which allows the simultaneous detection of four sensors. Data
capture was through the supplied GPES version 4.9 software installed onto a PC. The
screen-printed electrodes were connected to the Autolab, using an in house fabricated
connector from a PCB edged IDC socket, aluminum instrument box, ribbon cable and
4 mm cable sockets. The individual components were purchased from Maplin
Electronics (Milton Keynes, UK). For the C.V. scans a 100 l of sample drop was
placed onto the electrode and was disposed of after each scan. The scanning range
was from -1 to +1 V at a rate of 99.78 mV/s with steps of 2.74 mV. Studies into the
suppression effects of milk used samples of milk with different pre-treatments mixed
with 5 mM potassium hexacyanoferrate (III) in 0.1 M KCl.
Page 7 of 23
Accep
ted
Man
uscr
ipt
7
Immunoassay developments
For the sensor construction, 8 l of 0.12 mg ml-1 anti-primary antibody in 0.1 M
carbonate buffer pH 9.6 was placed onto the working graphite electrode, placed into a
humid environment (stored overnight at 4oC), to allow passive adsorption of the
antibody onto the carbon surface. The sensor was then washed with 0.05 % Tween 20
in 10 mM PBS buffer and 18.0 MΩ water. The electrodes were then shaken to remove
most of the surplus water and anti-aflatoxin M1 monoclonal antibody at 0.04 mg ml-1
(8 l) in 10 mM PBS buffer was added and incubated for 2 h at 37oC, in a humid
environment. The surface of the sensor was then blocked by immersed in 1 % PVA in
PBS to cover the working, reference and auxiliary electrodes for 2 h at 37oC. The
sensor was then washed and stored at 4 oC until used.
Aflatoxin M1 standards were prepared by dissolving the aflatoxin M1 powder in
methanol at a concentration of 10 mg ml-1 to prepare a stock solution and then stored
at –18 oC. Working standard solutions (between 5 and 1000 ng l-1) were prepared by
diluting the stock with 1% methanol in 20 mM Dulbecco’s PBS (CaCl2 concentration
of 18 mM) pH 7.4, into twice the desired concentration and then mixing 500 µl of
standard with 500µl of commercial milk. Milk samples were also pre-treated by
adding 25 ml of 20 mM Dulbecco’s PBS (CaCl2 concentration of 18 mM) pH 7.4, in
1% methanol to 25 ml of milk sample and mixing. This was carried out using a vortex
mixer.
For the competitive reaction a 4 l of aflatoxin M1 standard or sample was diluted in
PBS buffer with 1% methanol, and placed onto the working electrode with 4 l of
1:10 dilution of the aflatoxin M1-HRP conjugate from the RIDASCREEN kit diluted
using 1% PVA in PBS. No specific sampling protocols were implemented for milk
sampling since milk is considered homogeneous (van Egmond, 1983).
The competitive reaction between the free aflatoxin M1 and the aflatoxin M1 – HRP
was performed at 37oC for 2 hours. The sensor was again washed, shaken to almost
dryness, then 100 l of 5 mM 3,3′,5,5′-Tetramethylbenzidine (TMB) and 1 mM
hydrogen peroxide in citrate buffer containing 0.1 M KCl, was added to the sensor

Page 8 of 23
Accep
ted
Man
uscr
ipt
8
ensuring all three electrodes were covered. The Autolab running in
chronoamperometry mode was started and the data collected for 20 minutes. For the
chronoamperometry data points were collected every 2 seconds at a potential of either
-100 mV or +100 mV. For electrode preconditioning a conditioning potential of +200
mV was applied for 20 seconds followed by an equilibrium time of 5 seconds before
data was collected at +100 mV.
Step amperometry was performed by adding 10 units of horseradish peroxidase, to a
solution of 5 mM TMB and 1 mM hydrogen peroxide in 0.1M KCl citrate buffer, then
incubating for 30 minutes before measurement. A blank signal was obtained without
the addition of peroxidase. The Autolab was set for steps of 100 mV from 0 mV to
either -900 or +900 mV and current measurement for 100 seconds.
For the fractionation of the casein and whey proteins of milk, a similar method to that
described by Vernozy-Rozand et al., (2004) was implemented. Firstly a commercial
whole fat milk sample was initially centrifuged at 9600 x g to remove the cream and
fatty layers. The supernatant was decanted and adjusted to pH 4.6 with the use of 4 M
hydrochloric acid, stirred for 30 minutes and then centrifuged again to obtain casein
free liquor. For the removal of whey proteins the supernatant was treated with 5 M
trichloroacetic acid and stirred for 30 minutes before centrifugation. The remaining
liquor was free from proteins.
Calculations of limits of detection for the immunosensor was determined as described
by Ammidia et al., (2004) and Draisci et al., (2001) as the amount of aflatoxin M1
required to reduce the signal change by 25%.
2.4 HPLC Analysis
The in-house HPLC determination was performed using a Waters 600E System
Controller, a Waters 712 WISP Autosampler and a Waters 470 Scanning
Fluorescence Detector set at an excitation wavelength of 360 nm and an emission
wavelength of 430 nm. The Waters modules were computer controlled using
Kromasystem 2000 software. A Phenomenex Luna 5u C18 analytical column was
used throughout with a security guard TM guard column. Aflatoxin M1 standards
were made up with 1% methanol, 49% of 20 mM, pH 7.4, PBS buffer and 50% milk

Page 9 of 23
Accep
ted
Man
uscr
ipt
9
sample. The toxin was then extracted from the milk samples using Alfaprep
immunoaffinity columns as denoted by the manufactures R-Biopharm. Briefly 50 ml
of spiked milk was centrifuged at 3,000 RPM to isolate the fat and then passed
through the immunoaffinity column at a rate of 1-2 drops per second. The column was
washed with 2 aliquots of 10 ml H2O and eluted into a eppendorf tube with 1.25 ml of
2:3 methanol:acetonitrile followed by 1.25 ml of H2O. After mixing by vortex, the
sample was divided into three and placed into HPLC vials for triplicate analysis.
2.5 Safety awareness
All laboratory glassware and consumables which had been contaminated with
aflatoxin M1 was stored overnight in 5% sodium hypochlorite followed by the
addition of acetone to make the solution 5% acetone by volume. The decontamination
solution was allowed a minimum of 30 minutes before disposal.
3. Results and Discussions
3.1 Optimisation of the immunosensor
For the immunosensor developments TMB was chosen as the mediator for the
enzyme label, horseradish peroxidase (HRP) activity determination. Previous work at
Cranfield has been preformed using hydroquinone and o-phenylenediamine (OPD) as
the mediators for hydrogen peroxide (Baskeyfield, 2001). The application for the
sensor is for point of source monitoring in field work, therefore the use of
carcinogenic compounds is not preferable. Furthermore TMB has superior detection
properties than other systems (Fanjul-Bolado et al., 2005, Volpe et al., 1998) .The
initial protocol for the immunosensor development was adopted from Micheli et al.
(2005). However, it was noticed that there are discrepancies in the literature into the
optimum potential for the electrochemical detection of TMB using carbon electrodes.
Micheli et al., (2005) reported the detection of TMB at -100mV versus Ag/AgCl,
whereas Butler et al., (2006), Fanjul-Bolado et al., (2005) and Volpe et al., (1998)
suggest a voltage at +100mV versus Ag/AgCl. Since no previous literature reports
could be found where the preferential potential had been discussed, step amerometry
was performed to elucidate the correct potential for the developed immunosensor.

Page 10 of 23
Accep
ted
Man
uscr
ipt
10
Therefore a range of potentials from -900 mV to +900 mV were investigated using
the developed screen-printed electrode. Figure 1, show that the best potential for
monitoring the reduction was -100 mV and for the oxidation +100 mV. This is
harmonious with the previous reported observations.
Figure 1
The step amperometry suggested that +100 mV would yield stronger signal to blank
ratio than -100 mV. An additional experiment was preformed to validate this
observation. Figure 2a, show that although the reduction signal gave a greater signal
than the oxidation signal, it incurred a high blank signal, hence for the development of
the sensor the oxidation signal was monitored. The use of electrochemical
preconditioning of the electrode for immunosensor development has been reported
recently (Conneely et al., 2007; Lu et al., 2006). Therefore, to maximize the signal,
the use of electrode pre-conditioning was investigated in this work. To precondition
the electrode a conditioning potential of +200 mV was applied for 20 seconds before
detection of TMB at +100 mV. Figure 2b shows that although there is little advantage
with respect to the background levels, there is significant gain in signal by pre-
conditioning the sensor before data collection. Further electrode treatment was
investigated to depolarise the electrode surface before antibody immobilization
(Grennan et al., 2000; Espinosa et al., 1999; Wang et al., 1996). Summarising the
literature, the use of a potential of 2.0 V from 30 seconds to 10 minutes was applied to
increase protein immobilization capacity and electron-transfer rates of the working
electrode, in turn increasing the signal and reproducibility. The same treatment was
performed for our electrodes to deem if this treatment would increase or produce a
more reproducible signal. As shown in Figure 2c, although the depolarisation did
produce a greater signal, the difference is marginal. Additionally the cleaning resulted
in a high standard deviation therefore considering the additional time incurred from
depolarisation the electrodes it was deemed that this step was not fundamental to
increasing the sensors performance. However, further testing may prove beneficial to
elucidate this point in future work. The use of different blocking buffers with
different chemistries was also investigated (Figure 2d). Using the screen- printed
electrode, PVA wasfound to be the optimal blocker. PVPP (Polyvinyl pyrrolidone)

Page 11 of 23
Accep
ted
Man
uscr
ipt
11
was also tested but yielded a high standard deviation and therefore was not used in
this experiment (data not shown).
Figure 2
With the signal ameliorated a calibration curve was performed in pure buffer
undertaking the factors from the optimisation experiments (Figure 3). The dynamic
range from 1 to 10,000 ng l-1 possessed a linear r2 value of 0.95.
Figure 3
Upon performing the calibration in a full fat milk sample with no pre-treatment the
correlation between concentration of aflatoxin M1 and current was lost. Previous
reports from Pemberton et al. (1999) stated that electro-active species can interfere
with the detection of progesterone in milk. Mayer et al. (1996) have reported that milk
can cause electrode fouling without pre-treatment, but, upon dialysis with 12000-
19000 molecular size cut off membranes then the matrix effects are removed. A cyclic
voltamogram of TMB, with and without the addition of commercial full fat milk, was
carried out (data not shown) and the milk suppressed the signal. To establish the cause
of the interference several chemical clean up strategies were employed, and tested by
monitoring the electrochemical quenching effect. To ascertain the effects of fats to the
system a commercial milk sample (pH adjusted to 8.6) was incubated at 37oC for 24
hours to activate the natural lipases and thus breaking down the fats into fatty acids
(Hui, 1993) was used with a second non-fat milk sample (Sigma – Aldrich). Both
samples quenched the electrochemical signal from potassium hexacyanoferrate,
suggesting that fats are not the cause of the interference (Figure 4a).
Figure 4
Mayer et al. (1996), reported that lactose was an interfering compound for their milk
based biosensor. Furthermore the electro active nature of lactose is taken advantage of
as a method of detection using ion chromatography (Hanko and Rohrer, 2000). To
determine the electrochemical effects of lactose, potassium hexacyanoferrate was
spiked with 4.6% lactose to replicate the natural concentration in milk (Schrimshaw,

Page 12 of 23
Accep
ted
Man
uscr
ipt
12
1988). Figure 4b, shows that lactose has no quenching effect, this is to be expected
since lactose is below the molecular weight which Mayer et al. (1996) reported as
being responsible for electrode fouling. Milk was then fractionated into a casein free
sample (Hui, 1993; Walstra, 1984), and a casein and whey protein fraction (Vernozy-
Rozand et al., 2004) as reported in the methods. By isolating the casein proteins,
significant quenching still occurs, however, upon the removal of whey proteins, the
signal was not affected (Figure 4c). To confirm this a milk sample was saturated with
ammonium sulphate and stored at 4oC for 48 hours, then centrifuged. The pre-
treatment with ammonium sulphate removed all traces of the interference (the induced
pH shift from ammonium acetate is the cause of the sharper peaks) confirming that
the electrochemical interference from milk is due to a proteinaceous compound
(Figure 4d). Whey proteins otherwise known as ‘milk serum’ proteins are a group
containing; β-lactoglobulin (18,363 daltons), α-lactalbumin (14,176 Daltons) and
bovine serum albumin (66,267 Daltons), additionally the groups also contains
immunoglobins and small molecular weight peptides (Walstra 1984). The molecular
weight of β-lactoglobulin, bovine serum albumin and α-lactalbumin correlates with
the reports of Mayer et al., (1996) that the electrode fouling was eradicated by the use
of dialysis membranes at 12,000 – 19,000 daltons. Furthermore Diaz et al. (1993)
advocates the use of dialysis membranes at 8,000 to 15,000 Daltons for the clean-up
of milk for aflatoxin M1 determination using TLC. Cosman et al., (2005) reinforces
this observation.
Cosman et al. (2005), reported that whey proteins spontaneously adsorbs onto metal
surfaces through a variety of different chemistries. It was suspected that α-lactalbumin
immobilization was due to the loss of calcium causing significant disruption to the
protein structure and thus denaturation. From this observation an excess of calcium
chloride (18mM) was added to the milk sample and also washing buffer during
immunosensor analysis. The resultant effect was losing of the suppression and a
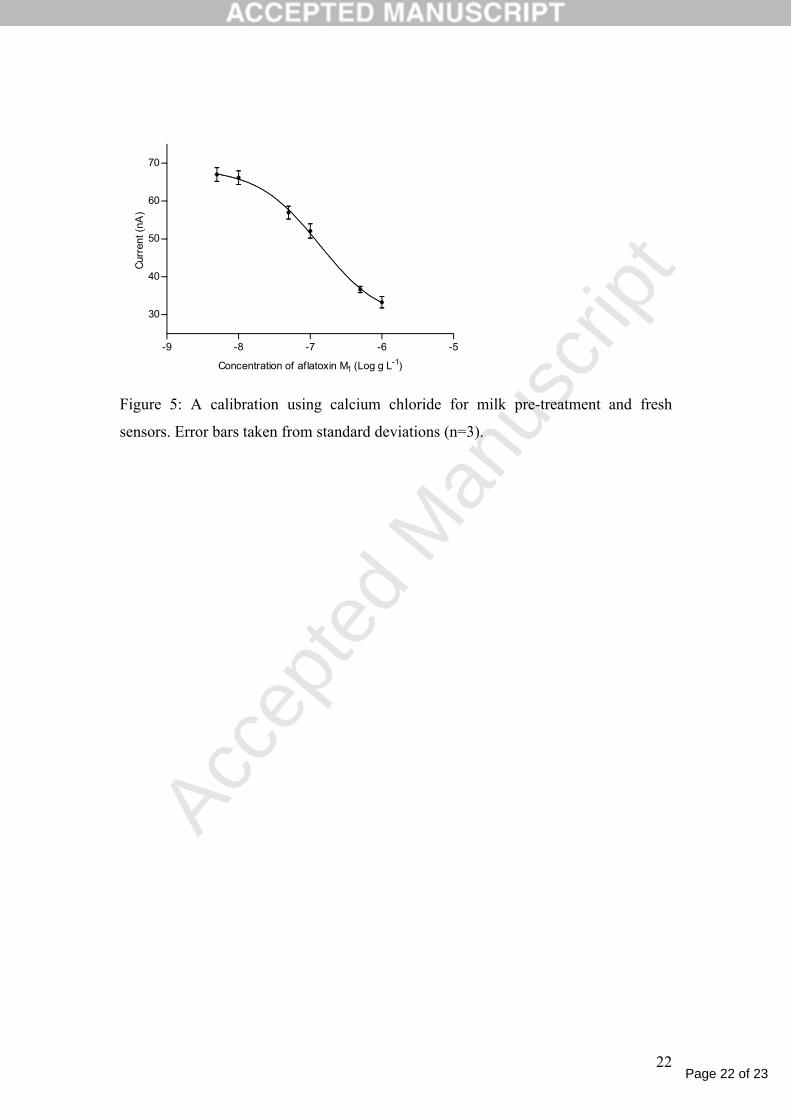
detection limit of 39 ng l-1 was achieved in milk samples (Figure 5). The
concentration of 18mM CaCl2 was chosen to mimic that suggested by Dulbecco et al.
(1954) upon the work with the isolation of viruses. The recipe later became known as
Dulbeccos PBS and is a standard buffer used for maintaining the structure of
mammalian cells. This CaCl2 concentration has been shown to have no effect on the
antibodies activity.

Page 13 of 23
Accep
ted
Man
uscr
ipt
13
Figure 5
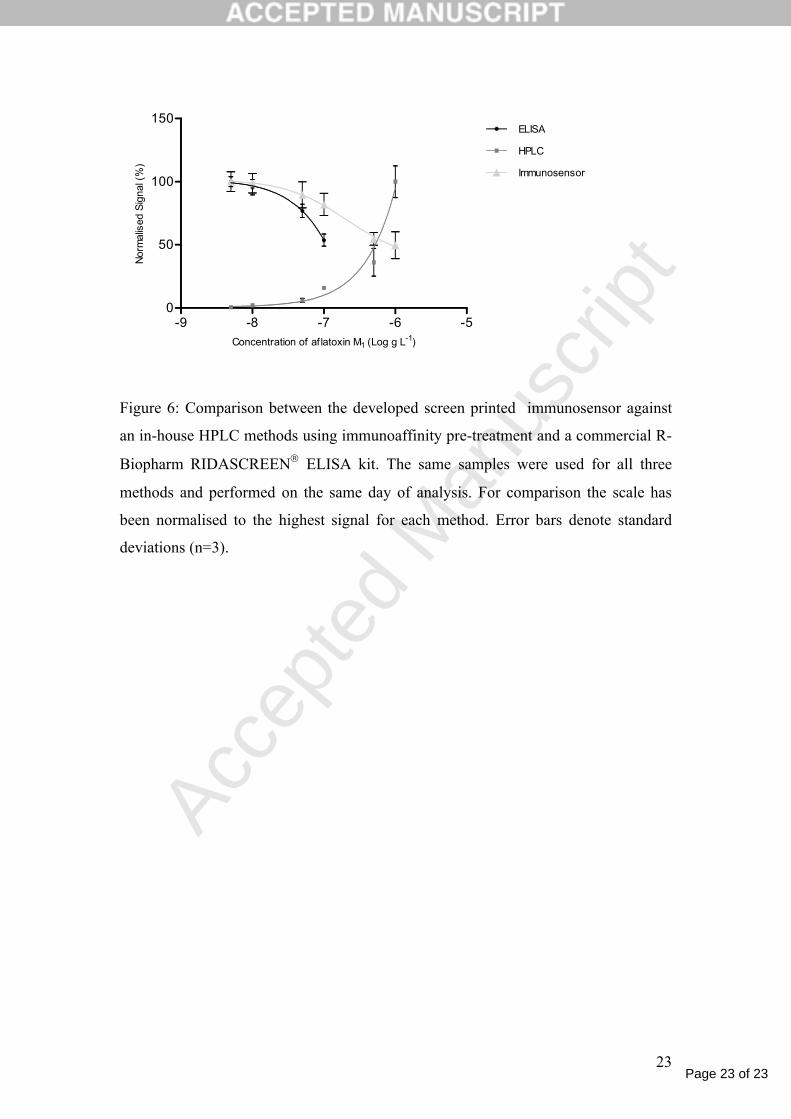
The developed immunosensor method was compared to an in-house HPLC method
developed for aflatoxin M1 and a commercial ELISA kit for aflatoxin M1 (R-
Biopharm). Milk samples were prepared using the calcium chloride pre-treatment
method developed in this work and the same sample was then analysed by all three
methods. For HPLC analysis, the sample was then extracted using an immunoaffinity
column. Figure 6, shows the calibration graphs for all three methods.
Figure 6
The plots in Figure 6 show the success of the immunosensor developed method.
Compared to the ELISA procedure, the immunosensor has similar limits of detection
and comparable repeatability although the working range of the immunosensor is far
greater than the ELISA method. In comparison the HPLC was more sensitive than the
immunosensor with a limit of detection of 10 ng l-1 for the HPLC verses 39 ng l-1 for
the immunosensor based on a 3 times signal to noise ratio, but, with similar dynamic
range from 10 to 1000 ng l-1 (r2 value of 0.9944). However, the sample used for the
HPLC analysis had to be first extracted and purified using an immunoaffinity column
which makes the method more complex and expensive. Also the analysis has to be
conducted under laboratory conditions, while the sensor is portable, simple and cost
effective and can be used on site.
.
4. Conclusions
In this work the development of an electrochemical immunosensor for aflatoxin M1
analysis was developed using a disposable screen-printed electrode. After
immobilising the immuno-components to the electrode surface and optimising the
assay format, the effects of milk on the sensor was assessed. It was discovered that the
milk matrix causes significant interference, and through chemical fractionation, it was
noted that the interference was chiefly resulting from whey proteins. When an excess

Page 14 of 23
Accep
ted
Man
uscr
ipt
14
of calcium chloride (18mM) was added to the milk sample, and to the washing buffer,
the effect was suppressed and a working calibration down to 39 ng l-1 was obtained
with linear detection range up to 1 µg l-1. Therefore the use of calcium chloride to
stabilise milk samples on metal electrodes is advised for future immunosensor
developments.
The immunosensor is not solely suitable for milk, but initial investigations have
shown that it could be employed for aflatoxin M1 determination in urine also to
monitor human aflatoxin M1 consumption. Upon comparing the immunosensor to the
established technologies of HPLC and ELISA, the immunosensor was unique in
offering good sensitivity as well as total portability.
Acknowledgements
The authors thank the European Commission for supporting this work (Project FP6-
IST1 – 508774 – IP “ GOODFOOD: Food safety and quality with microsystems
technology”).
References
Ammida, N.H.S., Micheli, L., Palleschi, G., 2004. Analytica Chimica Acta, 520, 159-164.
Baskeyfield, D., 2001, Developmemt of a disposable amperometric immunosensor for isoproturon herbicide detecton in water and soil extracts. (Supervisor I.E.Tothill) PhD thesis, Cranfield University, UK.
Butler, D., Pravda, M., Guilbault, G.G., 2006. Analytica Chimica Acta, 556, 333-339.
Conneely, G., Aherne, M., Lu, H., Guilbault, G.G., 2007. Analytica Chimica Acta, 583, 153-160.
Cosman, N.P., Fatih, K., Roscoe, S.G., 2005. Journal of Electroanalytical Chemistry, 574, 261-271.
Diaz, S., Domingues, L., Prieta, J., Blanco, J.L., Moreno, M.A., 1995. Journal of Agriculture and Food Chemistry, 43, 2678-2680.

Page 15 of 23
Accep
ted
Man
uscr
ipt
15
Draisci, R., Duadri, F., Achene, L., Volpe, G., Palleschi, L., Palleschi, G., 2001.Analyst, 126, 1942-1946.
van Egmond, H.P., 1983. Food chemistry, 11, 289-307.
El-Nezami, H.S., Nicoletti, G., Neal, G.E., Donohue, D.C., Ahokas, J.T., 1995. FoodChemistry and Toxicology, 33, 173-179.
Espinosa, M., Atanasov, P., Wilkins, E., 1999. Electroanalysis, 11, 1055-1062.
Fanjul-Bolado, P., González-García, M.B., Costa-Garcia, A., 2005. Analytical and Bioanalytical chemistry, 382, 297-302.
Farrer, K.T.H., 1987. A guide to food additives and contaminants. Carnforth:
Parthenon, ISBN 1-85070-127-X.
Frey, A., Meckelein, B., Externest, D., Schmidt, M.A., 2000. Journal of immunological methods, 233. 47-56.
Gilbert, J., Vargas, E.A., 2003. Journal of toxicology, 22, 381-422.
Grennan, K., Killard, A.J., Smyth, M.R., 2001. Electroanalysis, 13, 745-750.
Hanko, V.P., Rohrer, J.S., 2000. Analytical biochemistry, 283, 192-199.
Henry, S.H., Whitaker, T., Rabbani, I., Bowers, J., Park, D., Price, W., Bosch, F.X., Pennington, J., Verger, P., Yoshizawa, T., van Egmond, H., Jonker, M.A., Coker, R., 2001, Report 1012, Aflatoxin M1 (WHO Additives, series 47.) Joint Expert Committee on Food Additives (JECFA).
Holzapfel, C.W., Steyn P.S., 1966. Tetrahedron Letters, 25, 2799-2803.
Hui, Y.H., 1992, Dairy science and technology handbook. Volume 1: Princples and
properties. VCH publishers. ISBN 1-56081-078-5.
Josephy P.D., Eling, T., Mason, R.P., 1982. The journal of biological chemistry, 257, 3669-3675.
Kadara, O. R. and Tothill, I.E. , 2004. Analytical and Bioanalytical chemistry, 378, 770-775.
Logrieco, A., Arrigan, D. W. M. , Brengel-Pesce, K., Siciliano P. and Tothill, I.E.

Page 16 of 23
Accep
ted
Man
uscr
ipt
16
2005, Food Additives and Contaminants, 22,335-344.
Lopez, C.E., Ramos, L.L., Ramadán, S.S., Bulacio, L.C., 2003. Food Control, 14, 31-34.
Lu, H., Conneely, G., Pravda, M., Guilbault, G.G., 2006. Steroids, 71, 760-767.
Martins, M.L., Martins, H.M., 2004. Aflatoxin M1 in yoghurts in Portugal.International Journal of Food Microbiology, 91, 315-317.
Mayer, M., Genrich, M., Künnecke, W., Bilitewski, U., 1996. Analytica Chimica Acta, 324, 37-45.
Micheli, L., Grecco, R., Badea, M., Moscone, D., Palleschi, G., 2005. Biosensors and Bioelectronics, 21, 588-596.
Moreau, C., 1979. Moulds, Toxins and foods. John Wiley and Sons, ISBN
0471996815.
Neal, G.E., Eaton, D.L., Judah, D.J., Verma, A., 1998. Toxicology and Applied Pharmacology, 151, 152-158.
Pemberton, R.M., Hart, J.P., Stoddard, P., Foulkes, J.A., 1999. Biosensors and Bioelectronics, 14, 495-503.
Proctor, D.L., 1994. Food and Agriculture Organisation of the United Nations, ISBN
92-5-103456-7
Rastogi, S., Dwivedi, P.D., Khanna, S.K., Das, M., 2004. Food Control, 15, 287-290.
Rodriguez Velasco, M.L., Calonge Delso, M.M., Ordonez Escudero, D., 2003. Food Additives and Contaminants, 20, 276-280.
Ruzgas, T., Csöregi, E., Emuéus, J., Gorton, L., Marko-Varga, G., 1996. Analytica chimica acta, 330, 123-138.
Sargeant, K., Sheridan, A., O’Kelly, J., 1961. Nature, 192, 1096-1097.
Sarimehmetoglu, B., Kuplulu, O., Celik, T.H., 2004. Food Control, 15, 45-49.
Schrimshaw, N.S., 1988. American Society for Clinical Nutrition, 48, 1083-1159.

Page 17 of 23
Accep
ted
Man
uscr
ipt
17
Sharman, M., Patey, A.L., Gilbert, J., 1989. Journal of chromatography, 474, 457-461.
Stroka, J., Anklam, E., 2002. Trends in Analytical Chemistry, 21, 90-95.
Sørensen, L.K., Elbæk, T.H., 2005. Journal of Chromatography B, 820, 183-196.
Sydenham, E.W. and Dhephard, G.S., 1996. In: Gilbert, J. (Ed.), Progress in Food Contamination Analysis. Blackie Accademic and Professional, London, UK.
Tanaka, M., Matsuura, K., Yoshioka, S., Takahashi, S., Ishimori, K., Hori, H., Morishima, I., 2003. Biophysical journal, 84, 1998-2004.
Thirumala-Devi, K., Mayo, M.A., Hall, A.J., Craufurd, P.Q., Wheeler, T.R., Waliyar, F., Subrahmanyam, A., Reddy, D.V.P., 2002. Journal of Agricultural and Food Chemistry, 50, 933-937.
Volpe, G., Draisci, R., Palleschi. G., Compagnone. D., 1998. Analyst. 1303-1307.
Walstra, P., Jenness, R., Badings, H.T., 1984. Dairy Chemistry and Physics, John
Wiley & Sons, ISBN 0471097799.
Wang, J., Pedrero, M., Sakslund, H., Hammerich, O., Pingarron, J., 1996. Analyst, 121, 345-350.

Page 18 of 23
Accep
ted
Man
uscr
ipt
18
-2
0
2
4
6
8
10
12
-1 -0.5 0 0.5 1
Potential (V)
Rati
o (
Sig
nal to
Bla
nk)
Figure 1: The ratio of the signal current to background current using step
amperometry of 5 mM TMB/1 mM H2O2 with and without the addition of peroxidase
in pH 5.2 citrate buffer, 0.1 M KCl. The data is a result from an average of 4
electrodes.

Page 19 of 23
Accep
ted
Man
uscr
ipt
19
Figure 2: (a) Comparison of different sensing potentials. the blank comprised of the
complete sensor system without the addition of aflatoxin M1 – HRP conjugate. (b)
Effect of electrode preconditioning, (the blank similar as above). Preconditioning was
performed by applying a potential of +200 mV for 20 seconds followed by a five
second equilibration stage before the data collection at an applied potential of +100
mV. (c) Electrodes were pre-cleaned with water, ethanol and then applying a potential
of 0.8 V for 30 minutes with the electrode covered with PBS before the application of
the anti-primary antibody. (d) Different blocking reagents (1% in PBS buffer),
allowed to adsorb for 30 minutes at room temperature. Figure shows the ratio of the
signal current and blank current where the blank signal was obtained using the
complete sensor without the addition of aflatoxin M1 – HRP. For all graphs error bars
indicate the standard deviation (n=4).
0
50
100
150
200
-100 blank -100 signal +100 blank +100 signal
Curr
ent (n
A)
01020
3040506070
Normal blank Normalsignal
Pre-conditioned
blank
Pre-conditioned
signal
Cu
rren
t (n
A)
a b
0
0.5
1
1.5
2
2.5
3
3.5
Lysine BSA PVA Gelatine
Rat
io (
%)
d
0
50
100
150
200
250
blank notcleaned
blankcleaned
signal notcleaned
signalcleaned
Cur
rent
Cha
nge
(nA
) c

Page 20 of 23
Accep
ted
Man
uscr
ipt
20
-9 -8 -7 -6 -5 -420
40
60
80
100
120
Concentration of af latoxin M1 (Log g L-1)
Cur
rent
(nA
)
Figure. 3: Standard curve for the detection of aflatoxin M1 using the electrochemical
sensor. Signal was obtained using electrochemical preconditioning and data collection
at a potential of +100 mV for 10 minutes. Error bars indicate the standard deviation
(n=4). The dynamic range from 1 to 10,000 ng l-1 possessed a linear r2 value of 0.95.

Page 21 of 23
Accep
ted
Man
uscr
ipt
21
Figure 4: Cyclic voltammogram of potassium hexacyanoferrate (III) with and without
the presence of (a) non-fat milk or milk subjected to natural activated lipases. (b)
4.6% lactose. (c) milk liquor subjected to deproteination with HCl and HCl/TCA. (d)
deproteinated milk saturated with ammonium acetate.
-50
-30
-10
10
30
50
-1.5 -0.5 0.5 1.5Potential (V)
Cur
rent
(m
A)
Non fat milkLipase treated milkPotassium hexacyanoferrate in buffer
-15
-10
-5
0
5
-1.5 -0.5 0.5 1.5
Potential (V)
Cu
rre
nt (
mA
)
Lactose aloneLactose and potassium hexacyanoferrate
-50
-40
-30
-20
-10
0
10
20
30
40
50
-1.5 -1 -0.5 0 0.5 1 1.5
Potential (V)
Cu
rren
t (m
A)
HCl and TCA deproteinationHCl deproteinationPotassium hexacyanoferrate
-30
-20
-10
0
10
20
30
-1.5 -1.0 -0.5 0.0 0.5 1.0 1.5Potential (V)
Cur
rent
(m
A)
Ammonium sulphatePotassium hexacyanoferrate
a b
c d
Page 22 of 23
Accep
ted
Man
uscr
ipt
22
-9 -8 -7 -6 -5
30
40
50
60
70
Concentration of aflatoxin M1 (Log g L-1)
Cur
rent
(nA
)
Figure 5: A calibration using calcium chloride for milk pre-treatment and fresh
sensors. Error bars taken from standard deviations (n=3).
Page 23 of 23
Accep
ted
Man
uscr
ipt
23
-9 -8 -7 -6 -50
50
100
150ELISA
HPLC
Immunosensor
Concentration of af latoxin M1 (Log g L-1)
Nor
mal
ised
Sig
nal (
%)
Figure 6: Comparison between the developed screen printed immunosensor against
an in-house HPLC methods using immunoaffinity pre-treatment and a commercial R-
Biopharm RIDASCREEN ELISA kit. The same samples were used for all three
methods and performed on the same day of analysis. For comparison the scale has
been normalised to the highest signal for each method. Error bars denote standard
deviations (n=3).