Annual Report - Fauji Foods Limited
118
-
Upload
khangminh22 -
Category
Documents
-
view
4 -
download
0
Transcript of Annual Report - Fauji Foods Limited


04

05

06

07

08
09

10

11
12

13
14

15
rdNotice is hereby given that the 53 Annual General Meeting of the shareholders of Fauji Foods Limited will be held at 11:00 a.m. on Thursday, April 02, 2020 at Hotel Royal Swiss, Opposite Cargo Complex, Allama Iqbal International Airport, Lahore to transact the following business:
ORDINARY BUSINESS:
nd1. To confirm the minutes of 52 Annual General Meeting held on March 27, 2019.
2. To receive, consider and adopt the audited accounts for the year ended December 31, 2019 and the reports of the
Directors and Auditors thereon.
3. To appoint auditors for ensuing period till next AGM and to fix their remuneration.
SPECIAL BUSINESS:
To consider and if deemed appropriate, to pass with or without modification, alteration or any amendment the following resolutions as Special Resolutions:
“RESOLVED THAT:
i. the authorized share capital of the Company be increased from Rs.7,000,000,000 (Rupees seven billion) divided into 700,000,000 (seven hundred million) Ordinary Shares of Rs.10/- (Rupees ten) each to Rs.10,000,000,000 (Rupees ten billion) divided into 1,000,000,000 (one billion) Ordinary Shares of Rs.10/- (Rupees ten) each.
ii) the figures and words “Rs.7,000,000,000 (Rupees seven billion) divided into 700,000,000 (seven hundred million) Ordinary Shares of Rs.10/- each” appearing in Clause V of the Memorandum of Association of the Company be substituted by the figures and words “Rs.10,000,000,000 (Rupees ten billion) divided into 1,000,000,000 (one billion) Ordinary Shares of Rs.10/- each.”
FURTHER RESOLVED THAT subject to (i) amendments to the Sponsor Support Agreement dated 12 April 2019 between the Company and Fauji Fertilizer Bin Qasim Limited (“FFBL”) (the “Existing Sponsor Support Agreement”); (ii) increase in the authorized share capital of the Company; (iii) approval of the Securities and Exchange Commission of Pakistan under Section 83(1)(b) of the Companies Act, 2017 (the “2017 Act”) and compliance with all applicable legal requirements; and (iv) FFBL exercising its right to convert its loan to the Company into equity, the allotment and issuance of 274,886,371 Ordinary shares of the Company, representing 52.02 percent of the existing paid-up capital of the Company, at the rate of PKR 10/- per share, i.e., at par value, to FFBL, without a rights issue, corresponding to the value of the subordinated shareholder loan of PKR 2,630,000,000 (two billion six hundred and thirty million) together with mark-up of PKR 118,863,714 (one hundred eighteen million eight hundred sixty three thousand seven hundred and fourteen), as at December 31, 2019 (the “Subordinated Shareholder Loan”), which was granted by FFBL to the Company, be and is hereby approved (the “Debt to Equity Conversion”). The Subordinated Shareholder Loan was availed by the Company to meet its operational and cash flow requirements and has helped the Company to grow, for the benefit of all members. The Debt to Equity Conversion will ensure that FFBL's investment remains in the Company which will help improve the financial position of the Company.
FURTHER RESOLVED THAT the price per share (i.e., PKR 10/- per share) at which shares will be issued to FFBL, which is equal to the par value of the shares of the Company, is hereby approved and is justified on the basis that given the limited cash resources of the Company a decision has been taken by FFBL to retain its investment in the Company by converting its debt of PKR 2,630,000,000 (two billion six hundred and thirty million) plus mark-up of PKR 118,863,714 (one hundred eighteen million eight hundred sixty three thousand seven hundred and fourteen) as at December 31, 2019, into Ordinary shares of the corresponding value of FFL, to be issued at par value, i.e., PKR 10/- per share. The shares will be issued without a rights issue under Section 83(1)(b) of the Companies Act, 2017 because the purpose of the issue is to convert FFBL's Subordinated Shareholder Loan into equity and, therefore, these shares will not be offered to the other shareholders of the Company.
FURTHER RESOLVED THAT subject to (i) amendment to the existing Sponsor Support Agreement; (ii) increase in the authorized share capital of the Company; and (iii) FFBL exercising its right to convert its loan to the Company into equity, the Company is authorized to submit an application, under Section 83(1)(b) of the 2017 Act, to the Securities and Exchange Commission of Pakistan for the allotment of issuance of shares at par value to FFBL, without a rights issue, pursuant to the Debt to Equity Conversion.
NOTICE OF ANNUAL GENERAL MEETING
16

FURTHER RESOLVED THAT the Chief Executive & Managing Director, Chief Financial Officer and the Company Secretary be and are hereby jointly and severally authorized to take any and all necessary steps and actions for implementing the above resolutions, including, without limitation, to seek any and all consents and approvals, to execute and (where required) file all necessary applications (including the application under Section 83(1)(b) of the 2017 Act), documents, statutory returns, declarations and undertakings and to appear and make representations before any regulatory or other authority, as may be necessary or conducive for and in connection with any of the foregoing matters and to sign, issue and dispatch all such documents and notices and do all such acts as may be necessary for carrying out the aforesaid purposes and giving full effect to the above resolutions.
OTHER BUSINESS:
4. To transact any other business with the permission of the Chair.
CLOSURE OF SHARE TRANSFER BOOKS:-
Share transfer books of the Company will remain closed from March 27, 2020 to April 02, 2020 (both days inclusive) for the
purpose of holding the Annual General Meeting.
By Order of the Board
Lahore. Brig Zahid Nawaz Mann (Retd)January 27, 2020 Company Secretary
NOTES:-
1. A member of the Company entitled to attend and vote at the General Meeting may appoint a person/representative as
proxy to attend and vote in place of member at the meeting. Proxies in order to be effective must be received at
Company's registered office duly stamped and signed not later than 48 hours before the time of holding meeting. A
member cannot appoint more than one proxy. Attested copy of shareholder's CNIC must be attached with the proxy
form.
2. The CDC/sub account holders are required to follow the under mentioned guidelines as laid down by Securities and
Exchange Commission of Pakistan:-
(a) For attending the meeting
i) In case of individuals, the account holder or sub-account holder shall authenticate his/her identity by showing
his / her original national identity card or original passport at the time of attending the meeting.
ii) In case of corporate entity, the Board of Directors' resolution / power of attorney with specimen signature of the
nominee shall be produced at the time of meeting.
(b) For appointing proxies
i. In case of individuals, the account holder or sub-account holder shall submit the proxy form as per the above
requirement.
ii) The proxy form shall be witnessed by the two persons whose names, addresses and CNIC numbers shall be
mentioned on the form.
iii) Attested copies of CNIC or the passport of the beneficial owners and the proxy shall be furnished with the proxy
form.17

iv) The proxy shall produce his/her original CNIC or original passport at the time of the meeting.
v) In case of corporate entity, the Board of Directors' resolution/power of attorney with specimen signature shall be
submitted to the Company along with proxy form.
3. Members, having physical shares, are advised to intimate any change in their registered address to the Share Registrar of the Company, i.e., M/s Corplink (Pvt.) Limited, Wings Arcade, 1-K, Commercial, Model Town, Lahore.
4. Shareholders who wish to receive annual reports and notice of the General Meeting through e-mail are requested to provide, through a letter duly signed by them, their particulars, i.e. Name, Folio/ CDC A/C No., E-mail Address, Contact Number, CNIC Number (attach copy). Shareholders are also requested to notify immediately any change in their e-mail address to the Share Registrar of the Company i.e., M/s Corplink (Pvt.) Limited, Wings Arcade, 1-K, Commercial, Model Town, Lahore.
Consent for Video Conference Facility
Members can also avail video conference facility in Karachi and Islamabad. In this regard please fill the following and submit to registerred address of the Company 10 days before holding the general meeting.
If the Company receives consent from members holding in aggregate 10% or more shareholding residing at geographical location, to participate in the meeting through video conference at least 10 days prior to the date of meeting, the Company will arrange video conference facility in that city subject to availability of such facility in that city.
The Company will intimate members regarding venue of video conference facility at least 5 days before the date of general meeting alongwith complete information necessary to enable them to access such facility.
I/We,_________________________________________ of ________________________, being a member of Fauji Foods Limited, holder of ____________________ Ordinary Share(s) as per Register Folio / CDC Account No __________________ hereby opt for video conference facility at __________________.
___________________________Signature of member
5. E-Voting
Members can exercise their right to demand a poll subject to meeting requirements of Section 143 -145 of Companies Act, 2017 and applicable clauses of Companies (Postal Ballot) Regulations 2018.
Statement Pursuant to Section 134(3) of the Companies Act, 2017
Pursuant to Section 134(3) of the Companies Act, 2017, this statement sets forth the material facts concerning the special business listed hereinabove, to be transacted at the Annual General Meeting of Fauji Foods Limited to be held on April 02, 2020.
Increase in Authorised Share Capital
i. The authorized share capital of the Company is being increased so that the Company can issue shares to its parent company, Fauji Fertilizer Bin Qasim Limited (“FFBL”), if FFBL exercises its right to convert its debt of PKR 2,630,000,000 (two billion six hundred and thirty million) plus mark-up of PKR 118,863,714 (one hundred eighteen million eight hundred sixty three thousand seven hundred and fourteen), as at December 31, 2019, into shares of the corresponding value.
ii. Authorised Share Capital of the Company is PKR 7,000,000,000 (Rupees seven billion) divided into 700,000,000 (seven hundred million) Ordinary Shares having face value of Rs.10/- per share; and
iii. Authorised Share Capital of the Company is proposed to be increased PKR 10,000,000,000 (Rupees ten billion only) divided into 1,000,000,000 (one billion) Ordinary shares of Rs.10/- per share each.
18
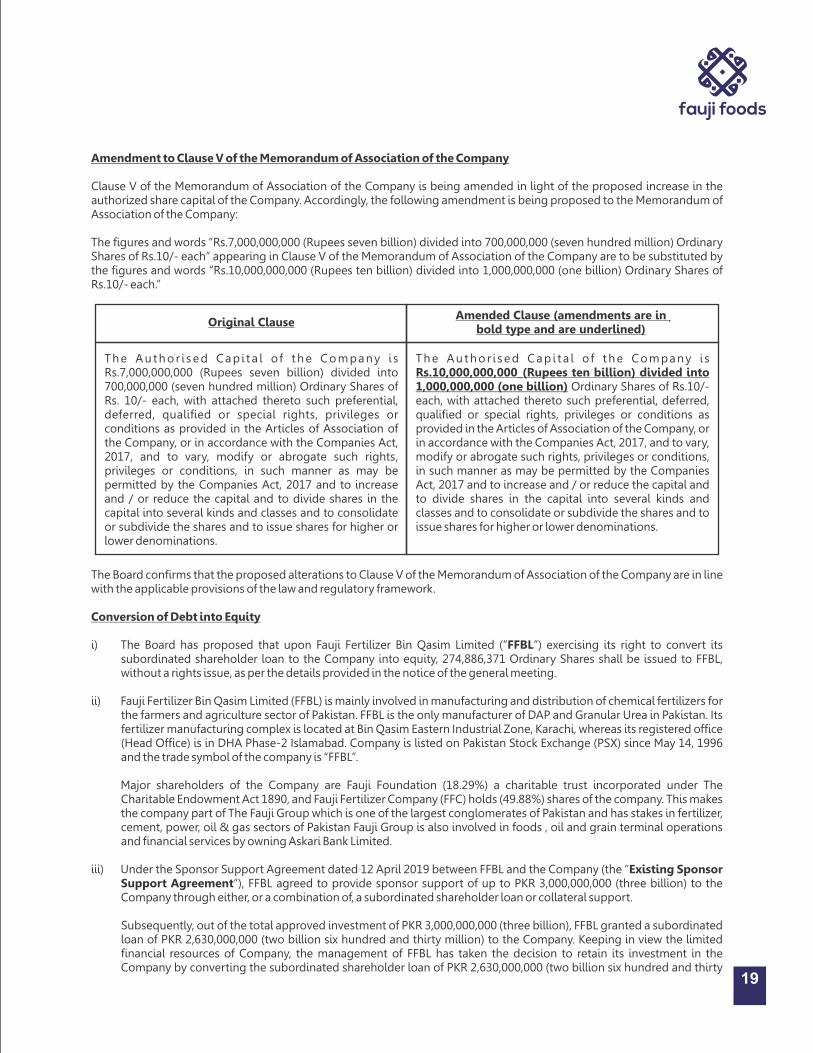
The Au thor i sed Cap i t a l o f the Company i s Rs.7,000,000,000 (Rupees seven billion) divided into 700,000,000 (seven hundred million) Ordinary Shares of Rs. 10/- each, with attached thereto such preferential, deferred, qualified or special rights, privileges or conditions as provided in the Articles of Association of the Company, or in accordance with the Companies Act, 2017, and to vary, modify or abrogate such rights, privileges or conditions, in such manner as may be permitted by the Companies Act, 2017 and to increase and / or reduce the capital and to divide shares in the capital into several kinds and classes and to consolidate or subdivide the shares and to issue shares for higher or lower denominations.
The Au thor i sed Cap i t a l o f the Company i s Rs.10,000,000,000_(Rupees ten billion) divided into 1,000,000,000 (one billion) Ordinary Shares of Rs.10/- each, with attached thereto such preferential, deferred, qualified or special rights, privileges or conditions as provided in the Articles of Association of the Company, or in accordance with the Companies Act, 2017, and to vary, modify or abrogate such rights, privileges or conditions, in such manner as may be permitted by the Companies Act, 2017 and to increase and / or reduce the capital and to divide shares in the capital into several kinds and classes and to consolidate or subdivide the shares and to issue shares for higher or lower denominations.
Original ClauseAmended Clause (amendments are in
bold type and are underlined)
The Board confirms that the proposed alterations to Clause V of the Memorandum of Association of the Company are in line with the applicable provisions of the law and regulatory framework.
Conversion of Debt into Equity
i) The Board has proposed that upon Fauji Fertilizer Bin Qasim Limited (“FFBL”) exercising its right to convert its subordinated shareholder loan to the Company into equity, 274,886,371 Ordinary Shares shall be issued to FFBL, without a rights issue, as per the details provided in the notice of the general meeting.
ii) Fauji Fertilizer Bin Qasim Limited (FFBL) is mainly involved in manufacturing and distribution of chemical fertilizers for the farmers and agriculture sector of Pakistan. FFBL is the only manufacturer of DAP and Granular Urea in Pakistan. Its fertilizer manufacturing complex is located at Bin Qasim Eastern Industrial Zone, Karachi, whereas its registered office (Head Office) is in DHA Phase-2 Islamabad. Company is listed on Pakistan Stock Exchange (PSX) since May 14, 1996 and the trade symbol of the company is “FFBL”.
Major shareholders of the Company are Fauji Foundation (18.29%) a charitable trust incorporated under The Charitable Endowment Act 1890, and Fauji Fertilizer Company (FFC) holds (49.88%) shares of the company. This makes the company part of The Fauji Group which is one of the largest conglomerates of Pakistan and has stakes in fertilizer, cement, power, oil & gas sectors of Pakistan Fauji Group is also involved in foods , oil and grain terminal operations and financial services by owning Askari Bank Limited.
iii) Under the Sponsor Support Agreement dated 12 April 2019 between FFBL and the Company (the “Existing Sponsor Support Agreement”), FFBL agreed to provide sponsor support of up to PKR 3,000,000,000 (three billion) to the Company through either, or a combination of, a subordinated shareholder loan or collateral support.
Subsequently, out of the total approved investment of PKR 3,000,000,000 (three billion), FFBL granted a subordinated loan of PKR 2,630,000,000 (two billion six hundred and thirty million) to the Company. Keeping in view the limited financial resources of Company, the management of FFBL has taken the decision to retain its investment in the Company by converting the subordinated shareholder loan of PKR 2,630,000,000 (two billion six hundred and thirty
19
Amendment to Clause V of the Memorandum of Association of the Company
Clause V of the Memorandum of Association of the Company is being amended in light of the proposed increase in the authorized share capital of the Company. Accordingly, the following amendment is being proposed to the Memorandum of Association of the Company:
The figures and words “Rs.7,000,000,000 (Rupees seven billion) divided into 700,000,000 (seven hundred million) Ordinary Shares of Rs.10/- each” appearing in Clause V of the Memorandum of Association of the Company are to be substituted by the figures and words “Rs.10,000,000,000 (Rupees ten billion) divided into 1,000,000,000 (one billion) Ordinary Shares of Rs.10/- each.”
20
million) together with mark-up of PKR 118,863,714 (one hundred eighteen million eight hundred sixty three thousand seven hundred and fourteen), as at December 31, 2019 (the “Subordinated Shareholder Loan”) into Ordniary shares of the corresponding value of the Company (the “Debt to Equity Conversion”). The shares will, subject to the approval of the SECP, be issued without a rights issue under Section 83(1)(b) of the Companies Act, 2017 because the purpose of the issue is to convert FFBL's Subordinated Shareholder Loan into equity (so as to allow FFBL to retain its investment in the Company) and, therefore, these shares will not be offered to the other shareholders of the Company.
It is expected that the proposed conversion of debt of PKR 2,630,000,000 (two billion six hundred and thirty million) together with mark-up of PKR 118,863,714 (one hundred eighteen million eight hundred sixty three thousand seven hundred and fourteen) and will help improve the financial condition of the Company.
iv) As stated in paragraph (iii) above, the shares are being issued without a rights issue because FFBL intends to convert its outstanding debt to equity and, therefore, the shares issued by the Company cannot be offered to the other shareholders.
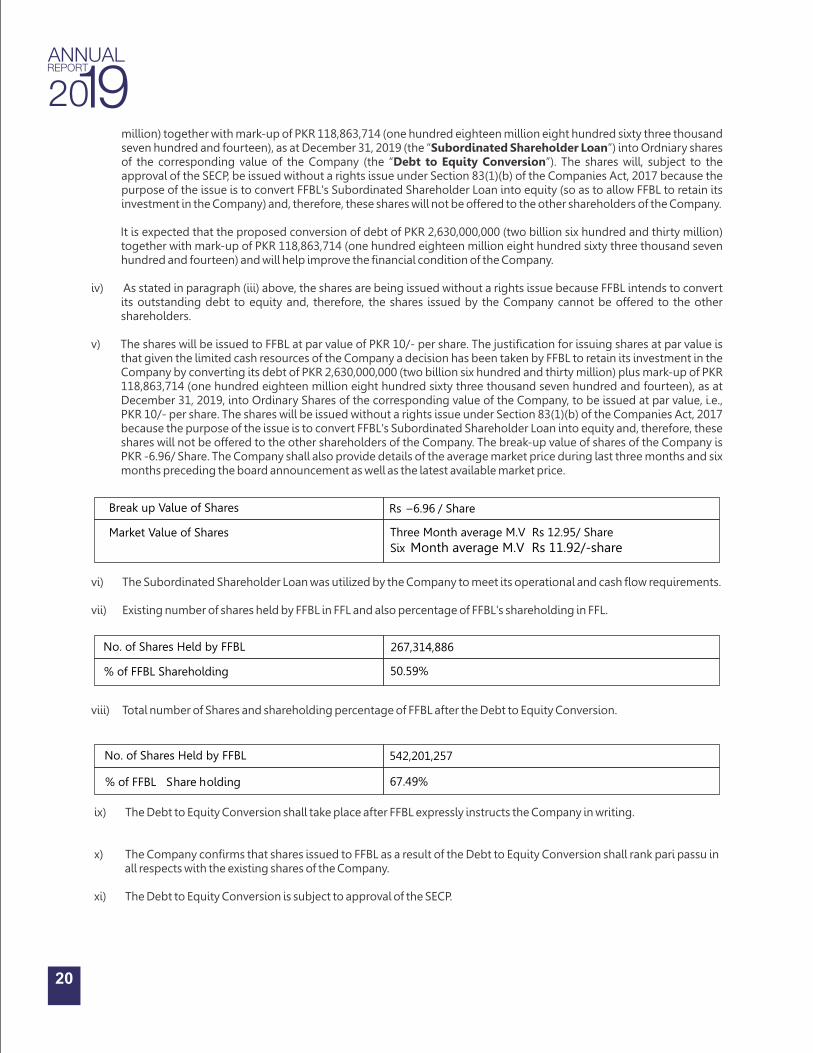
v) The shares will be issued to FFBL at par value of PKR 10/- per share. The justification for issuing shares at par value is that given the limited cash resources of the Company a decision has been taken by FFBL to retain its investment in the Company by converting its debt of PKR 2,630,000,000 (two billion six hundred and thirty million) plus mark-up of PKR 118,863,714 (one hundred eighteen million eight hundred sixty three thousand seven hundred and fourteen), as at December 31, 2019, into Ordinary Shares of the corresponding value of the Company, to be issued at par value, i.e., PKR 10/- per share. The shares will be issued without a rights issue under Section 83(1)(b) of the Companies Act, 2017 because the purpose of the issue is to convert FFBL's Subordinated Shareholder Loan into equity and, therefore, these shares will not be offered to the other shareholders of the Company. The break-up value of shares of the Company is PKR -6.96/ Share. The Company shall also provide details of the average market price during last three months and six months preceding the board announcement as well as the latest available market price.
vi) The Subordinated Shareholder Loan was utilized by the Company to meet its operational and cash flow requirements.
vii) Existing number of shares held by FFBL in FFL and also percentage of FFBL's shareholding in FFL.
Break up Value of Shares
Market Value of Shares Six
Three Month average M.V Rs 12.95/ Share
Month average M.V Rs 11.92/-share
Rs –6.96 / Share
No. of Shares Held by FFBL
50.59% % of FFBL Shareholding
267,314,886
viii) Total number of Shares and shareholding percentage of FFBL after the Debt to Equity Conversion.
542,201,257
67.49%
No. of Shares Held by FFBL
% of FFBL Share holding
ix) The Debt to Equity Conversion shall take place after FFBL expressly instructs the Company in writing.
x) The Company confirms that shares issued to FFBL as a result of the Debt to Equity Conversion shall rank pari passu in all respects with the existing shares of the Company.
xi) The Debt to Equity Conversion is subject to approval of the SECP.

21
The Board of Directors of Fauji Foods Limited is pleased to present the Directors' Report along with the audited financial statements for the year ended December 31, 2019.
Principal activities:
Fauji Foods Limited, a majority owned Company of Fauji Fertilizer Bin Qasim Limited (50.59% shareholding) and Fauji Foundation (12.75% shareholding) is engaged in processing and marketing of dairy products, juices and jams. The Company's brand 'Nurpur' is one of the oldest and highly recognizable brand in Pakistan.
Year in Review:
Dairy sector in Pakistan is still recovering from the high input costs caused by abolition of zero rating tax regime in year 2016 on dairy products coupled with gradual enhancement of custom duty on imported skim milk powder.
The year under review did not bring any respite to the dairy industry problems and its growth remained in check, mainly because of the following key external regulatory measures taken by the Government of Pakistan to redress the macroeconomic challenges:
- Increase in policy rate from single to double digit to check inflation;- Unprecedented currency devaluation to make export attractive;- Restriction or tightening of import regulations and payments to reduce current account deficit;- Documentation of Economy at retail level to improve revenue collection;
Further, following Dairy sector specific revenue generating measures taken by the Government, made the dairy product more expensive:
- Imposition of reduced rate of 10% sales tax on Tea Whitener.- Imposition of 5% additional Custom Duty on Skim Milk powder import.
Where all such measures were targeted to help stabilize the economy, instead they contributed in cost push inflation in the country, diluting the purchasing power of consumer and further escalating the input costs of the business as a whole.
Internationally, the prices of imported skim milk touched its new highs during the last quarter thus adding to the industry input costs. The impact was also seen on the local milk prices where an unprecedented price increase was witnessed in second half of the year.
Forced by the external economic factors, the Company in January initiated a price adjustment in tea whitener category to absorb some of the escalated input costs. But with industry as a whole remaining indifferent to the price adjustment, Company was left with no option but to retreat from its price adjustment initiative that caused volume losses and incurred additional sales support to maintain its market position.
However with the imposition of sales tax on tea whitener in finance bill 2019-20, the Industry took price increase to the extent of sales tax adjustment in the latter half of the year.
Dairy industry is paying attention to hygienic and clean milk marketing. Dairy companies seek to ensure the production of hygienic milk by providing farmer education and grants for the establishment of organised dairy farms and cold chain systems. Government is trying to improve legislation and enhance enforcement measures for existing informal and formal sectors. More investment in low-cost technologies for the production of safe yet affordable products, such as pasteurized milk is required by the formal sector. Consumer preference for fresh milk, fragmented and subsistence dairy farming, and the exorbitant capital investments required for cooling infrastructure also hampering the growth of dairy companies.
Acquisition intent by Inner Mongolia Yili Industrial Group Company Limited
The Chinese Company withdrew its offer on April 29, 2019 due to inability of both the parties to reach an agreement on the transaction within the prescribed time period.
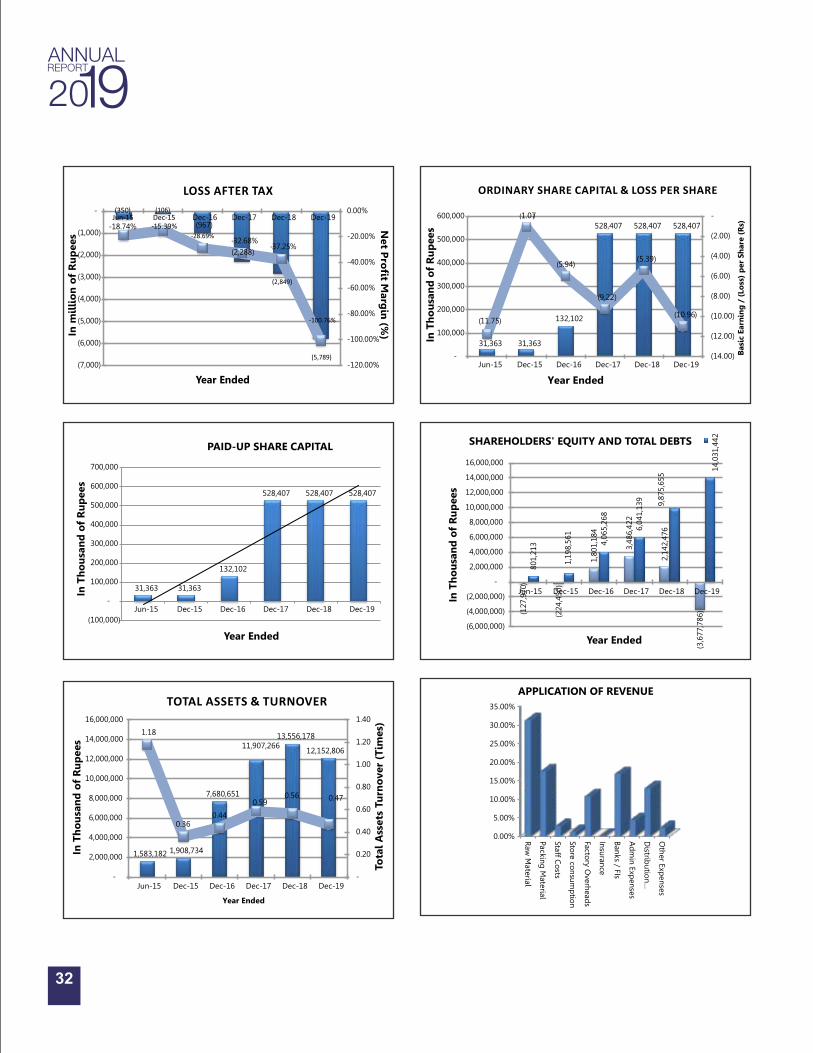
Financial performance:
The Company achieved turnover of Rs. 5,745 million compared to Rs. 7,649 million in the comparative year. Loss after taxation in the reported year is Rs. 5,789 million as compared to Rs. 2,849 million in the comparative year. The Loss per Share thereby is Rs. 10.96 as compared with Rs. 5.39 in the comparative year.
DIRECTORS' REPORT TO THE SHAREHOLDERS

22
Lower than expected sales and capacity losses are attributable to the sluggish business activity due to market apprehension and resistance to government revenue generating measures at retail level, High input and financing costs and additional sales support to counter loss of market share due to price increase initiative in first half.
Future outlook:
Pakistan's economy is in stabilization phase with key economic indicators starting to show sign of improvement and the decision by State Bank of Pakistan not to change interest rates during the last two monetary policies supports easing out of inflationary pressure. The current macroeconomic challenges are tough likely to affect business profitability in the short term.
The Board is confident about the future growth of the Company to deliver quality products while keeping a strong focus on innovation and operational excellence. To sustain and grow during this period, Management has initiated cost controlling measures that has started to show results through significant reduction in distribution cost in later half of the year. The Company has also made an investment to enhance Cheese and butter processing capacities to accrue better profit margins that will help further establish the Company as a complete and a key market player of the dairy industry.
The Company is resilient to maintain its focus on improving shareholders' value through innovation, optimization in product portfolio and processes, effective cost controls and will continue to grow its market share In Sha ALLAH.
Principle risks and uncertainties facing company:
Risks faced by the Company are not significantly different from risks posed to other companies working in the dairy sector. The recent and sudden devaluation of currency along with changes in Regulatory and Revenue Regimes by the Government, has exposed the Company to Foreign Exchange Risk and Regulatory Risks. The Management and Board are well aware of the associated Risks and have taken steps to mitigate the same. Apart from the above Risks, there are no significant risks and uncertainties posed to the business and operations of the Company, except as disclosed in the Contingencies and Commitment notes to the financial statements.
Transaction with related parties:
The Company carries out transactions with related parties and amounts, due from and to, related parties as shown under respective heads are carried out at arms' length. Except as disclosed in financial statements, no other transactions were executed with related parties.
Corporate and financial reporting framework:
- The financial statements, prepared by the Management of the Company, present fairly its state of affairs, the result of its operations, cash flow and changes in equity.
- Proper books of accounts of the Company have been maintained.
- Appropriate accounting policies have been consistently applied in preparation of the financial statements and accounting estimates are based on reasonable and prudent judgment except for those as disclosed in the financial statements.
- International Financial Reporting Standards, as applicable in Pakistan, have been followed in preparation of the financial statements.
- The system of internal controls is sound in design and has been effectively implemented and monitored.
- There are no significant doubts upon the Company's ability to continue as a 'going concern'.
- There are no statutory payments on account of taxes, duties, levies and charges which are outstanding as on December 31, 2019 except for those disclosed in the financial statements.
- The value of investments of staff provident fund, based on un-audited accounts, was Rs 199 million as at December 31, 2019.
- The Board has approved the remuneration policy of non-executive directors including independent directors.
23
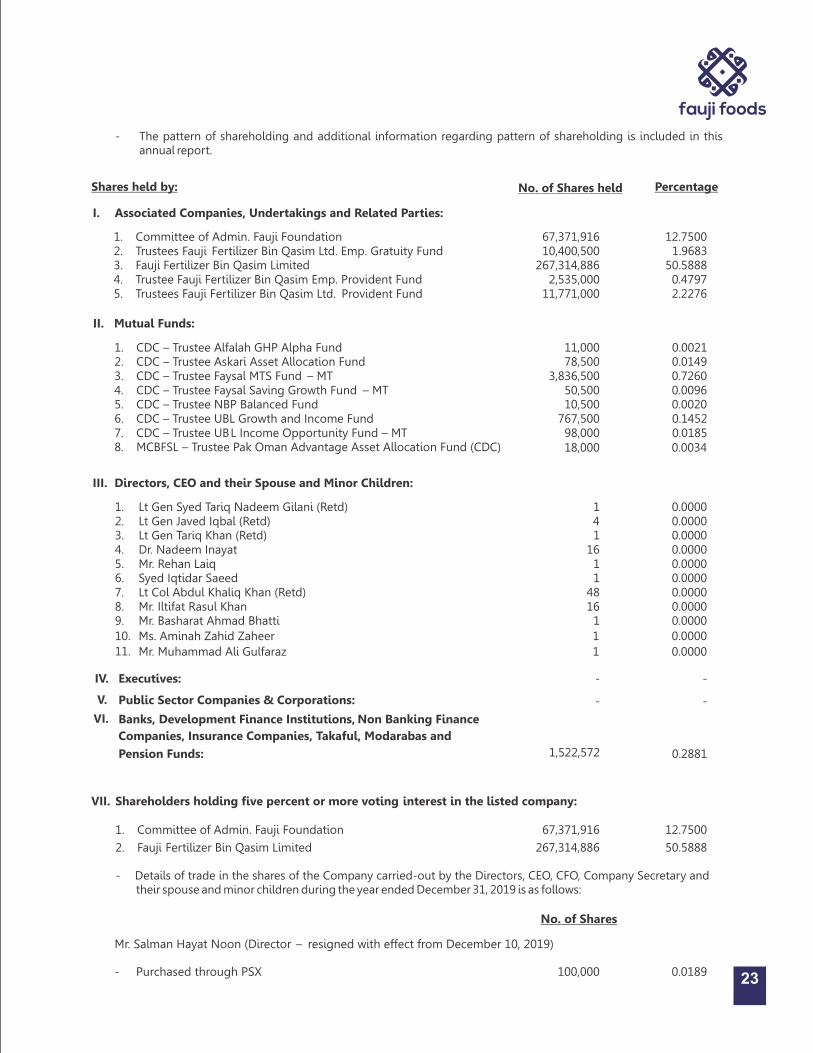
- Details of trade in the shares of the Company carried-out by the Directors, CEO, CFO, Company Secretary and their spouse and minor children during the year ended December 31, 2019 is as follows:
No. of Shares
–
Mr. Salman Hayat Noon (Director resigned with effect from December 10, 2019)
- Purchased through PSX
100,000 0.0189
0.0000
0.0000
0.0000
0.0000
0.0000
0.0000
0.0000
0.0000
0.0000
0.0000
1
4 1
16
1
1
48
16
1
1
1
0.0000
18,000 0.0034
11,000
0.0021
78,500 0.0149 3,836,500 0.7260 50,500 0.0096 10,500 0.0020 767,500 0.1452
98,000 0.0185
-
0.2881
-
-
-
1,522,572
67,371,916
12.7500
267,314,886
50.5888
VII. Shareholders holding five percent or more voting interest in the listed company:
1.
Committee of Admin. Fauji Foundation
2.
Fauji Fertilizer Bin Qasim Limited
No. of Shares held
Percentage
67,371,916 10,400,500
267,314,886 2,535,000
11,771,000
12.75001.9683
50.58880.47972.2276
Trustee Pak Oman Advantage Asset Allocation Fund (CDC)
1.
Lt Gen Syed Tariq Nadeem Gilani (Retd)
2.
Lt Gen Javed Iqbal (Retd) 3.
Lt Gen Tariq Khan (Retd)
4.
Dr. Nadeem Inayat 5.
Mr. Rehan Laiq
6.
Syed Iqtidar Saeed 7.
Lt Col Abdul Khaliq Khan (Retd)
8.
Mr. Iltifat Rasul Khan
9.
Mr. Basharat Ahmad Bhatti
10.
11.
Ms. Aminah Zahid Zaheer
Mr. Muhammad Ali Gulfaraz
III. Directors, CEO and their Spouse and Minor Children:
1.
CDC –
Trustee Alfalah GHP Alpha Fund
2. CDC – Trustee Askari Asset Allocation Fund
3. CDC – Trustee Faysal MTS Fund – MT
4. CDC – Trustee Faysal Saving Growth Fund – MT
5. CDC – Trustee NBP Balanced Fund 6. CDC – Trustee UBL Growth and Income Fund 7. CDC – Trustee UBL Income Opportunity Fund – MT 8. MCBFSL –
II. Mutual Funds:
Companies, Insurance Companies, Takaful, Modarabas and
Pension Funds:
Executives:
Public Sector Companies & Corporations:
Banks, Development Finance Institutions, Non Banking Finance
IV.
V.
VI.
I. Associated Companies, Undertakings and Related Parties:
Shares held by:
1.
Committee of Admin. Fauji Foundation
2.
Trustees Fauji Fertilizer Bin Qasim Ltd. Emp. Gratuity Fund
3.
Fauji Fertilizer Bin Qasim Limited
4.
Trustee Fauji Fertilizer Bin Qasim Emp. Provident Fund
5.
Trustees Fauji Fertilizer Bin Qasim Ltd. Provident Fund
- The pattern of shareholding and additional information regarding pattern of shareholding is included in this annual report.

24
Six meetings of the Business Review Committee were held. Attendance by each director was as follow:
Mr. Par Soderlund
Dr. Nadeem Inayat
Mr. Rehan Laiq
Ms. Aminah Zahid Zaheer
Mr. Basharat Ahmad Bhatti
Name of Directors
6 5
6 6
2
No. of Meeting(s) Attended
54235
No. of Meeting(s) Attended
Ms. Aminah Zahid Zaheer
Brig Raashid Wali Janjua (Retd)Syed Iqtidar SaeedMr. Rehan Laiq
Dr. Nadeem Inayat
Name of Directors
Five meetings of the HR & R Committee were held. Attendance by each director was as follow:
2355
No. of Meeting(s) Attended
Brig Raashid Wali Janjua (Retd)Syed Iqtidar SaeedLt Col Abdul Khaliq Khan (Retd)Mr. Basharat Ahmad Bhatti
Name of Directors
Five meetings of the Technical Committee were held. Attendance by each director was as follow:
Board of Directors / Committees meetings during the year 2019:
Six meetings of the Board of Directors were held. Attendance by each director was as follow:
- elected on November 26, 2018 - elected on November 26, 2018- elected on November 26, 2018
- re-elected on November 26, 2018- elected on November 26, 2018
- resigned w.e.f December 10, 2019
- resigned w.e.f May 01, 2019
- appointed w.e.f May 01, 2019
- re-elected on November 26, 2018
- re-elected on November 26, 2018
- resigned w.e.f December 19, 2019- elected on November 26, 2018- elected on November 26, 2018- appointed on December 27, 2019
No. of Meeting(s) Attended
6
6
566
3
2
4
54
6650
Name of Directors
Lt Gen Syed Tariq Nadeem Gilani (Retd)
Lt Gen Javed Iqbal (Retd)
Lt Gen Tariq Khan (Retd)
Dr.
Nadeem Inayat
Mr. Rehan Laiq
Mr. Salman Hayat Noon
Brig Raashid Wali Janjua (Retd)
Syed Iqtidar Saeed
Lt Col Abdul Khaliq Khan (Retd)
Mr.
Iltifat Rasul Khan
Mr. Par Soderlund Mr. Basharat Ahmad Bhatti Ms. Aminah Zahid ZaheerMr. Muhammad Ali Gulfaraz
Six meetings of the Audit Committee were held. Attendance by each director was as follow:
Mr Iltifat Rasul KhanDr Nadeem Inayat Mr Rehan Laiq Lt Col Abdul Khaliq Khan (Retd)
5356
Name of Directors No. of Meeting(s) Attended

25
Auditors:
The Audit Committee reviewed consents of six audit firms, including retiring auditors, to provide independent external audit services to the Company. The comparative rates statement was presented to the Committee for consideration. The Audit Committee has recommended the appointment of EY Ford Rhodes, Chartered Accountants, being the lowest bidder, as statutory auditors of the Company for the ensuing year. The Board has endorsed the recommendation.
Compliance with the Code of Corporate Governance:
The requirements of the Listed Companies (Code of Corporate Governance) Regulations 2019, relevant for the year ended December 31, 2019, have been duly complied with. A statement to this effect is annexed with the report.
FFL follows a policy framework conducive to more environmentally benign practices and proper waste management practices have been adopted for solid and liquid waste, air emission, soil pollution and noise.
Company's objective towards corporate social responsibility is to prioritize social good alongside the traditional corporate goal of generating profits.
Directors are under fiduciary responsibility to operate business under a system of governance and controls, which reinforces stakeholders' trust and confidence in the Company.
The remuneration to the Non-executive Directors (including Independent Directors) is paid according to the remuneration policy approved by the Board.
Dividend:
The Board has not recommended any dividend due to loss to the Company during the year.
Annual General Meeting:
rdThe 53 Annual General Meeting will be held on April 02, 2020 at 1100 hours at Lahore to approve annual financial statements of the Company for the year ended December 31, 2019.
Acknowledgement:
The Board is thankful to the valuable shareholders and financial institutions for their trust, patience and continued support to the Company. The Board would also like to place on record its appreciation to all employees of the Company for their dedication, diligence and hard work.
Lt Gen Javed Iqbal HI(M), (Retd) Chief Executive and Managing Director
For and on behalf of the Board
Lt Gen Syed Tariq Nadeem Gilani HI(M), (Retd) Chairman
Dated: January 27, 2020

Statement of Compliance with Listed Companies (Code of Corporate Governance) Regulations, 2019
26
Moreover, one independent director Mr. Par Soderlund has resigned w.e.f 19 December 2019 and casual vacancy will be filled in due course.
3. The directors have confirmed that none of them is serving as a director on more than seven listed companies, including this Company.
4. The Company has prepared a Code of Conduct and has ensured that appropriate steps have been taken to disseminate it throughout the Company along with its supporting policies and procedures.
5. The Board has developed a vision/mission statement, overall corporate strategy and significant policies of the Company. The Board has ensured a complete record of particulars of significant policies along with their date of approval or updating is maintained by the Company.
6. All the powers of the Board have been duly exercised and decisions on relevant matters have been taken by the Board/shareholders as empowered by the relevant provisions of the Act and these Regulations.
7. The meetings of the Board were presided over by the Chairman and, in his absence, by a director elected by the Board for this purpose. The Board has complied with the requirements of the Act and the Regulations with respect to frequency, recording and circulating minutes of meeting of the Board
8. The Board of Directors have a formal policy and transparent procedures for remuneration of directors in accordance with the Act and these Regulations which has been approved by BOD.
Name of Company: Fauji Foods Limited Year ended: December 31, 2019
The Company has complied with the requirements of the Regulations in the following manner:
1. The total number of directors are 12 as per the following:
a. Male: 10b. Female: 1c. Casual Vacancy 1
2. The composition of Board is as follows:
Independent Directors Mr Iltifat Rasul Khan
Mr Basharat Ahmad Bhatti
Ms Aminah Zahid Zaheer
Executive Director Lt Gen Javed Iqbal (Retd)
Non-Executive Directors Lt Gen Syed Tariq Nadeem Gilani (Retd)
Lt Gen Tariq Khan (Retd)
Mr Rehan LaiqDr Nadeem InayatSyed Iqtidar SaeedMr Muhammad Ali GulfarazLt Col Abdul Khaliq Khan (Retd)
Female Director Ms Aminah Zahid Zaheer
Category Names

Lt Gen Syed Tariq Nadeem Gilani (Retd) (Director/Chairman)
Lt Gen Javed Iqbal (Retd) (Director/ CE & MD)
Lt Gen Tariq Khan (Retd) (Director)
Dr Nadeem Inayat (Director)
Mr Rehan Laiq (Director)
Lt Col Abdul Khaliq Khan (Retd) (Director)
Ms Aminah Zahid Zaheer (Director)
AUDIT COMMITTEE
Mr Iltifat Rasul Khan (Chairman)
Dr Nadeem Inayat (Member)
Mr Rehan Laiq (Member)
Lt Col Abdul Khaliq Khan (Retd) (Member)
HR & REMUNERATION COMMITTEE
Ms Aminah Zahid Zaheer (Chairperson)
Dr Nadeem Inayat (Member)
Syed Iqtidar Saeed (Member)
Mr Rehan Laiq (Member)
TECHNICAL COMMITTEE
Syed Iqtidar Saeed (Chairman)
Lt Col Abdul Khaliq Khan (Retd) (Member)
Mr Basharat Ahmad Bhatti (Member)
BUSINESS REVIEW COMMITTEE
Mr Muhammad Ali Gulfaraz (Chairman)
Dr Nadeem Inayat (Member)
Mr Rehan Laiq (Member)
Ms Aminah Zahid Zaheer (Member)
Mr Basharat Ahmad Bhatti (Member)
9. The Board has arranged Directors' Training program for the following:
27
10. During the year the Board has approved appointment of CFO including his remuneration and terms and conditions of employment and complied with relevant requirements of the Regulations while there is no change in the Company Secretary and Head of Internal Audit.
11. CEO and CFO duly endorsed the financial statements before approval of the Board.
12. The Board has formed committees comprising of members given below:
13. The terms of reference of the audit committee, human resource committee, technical committee and business review committee have been formed, documented and advised to the committee for compliance.

(a) Audit Committee: 6 Quarterly
(b) HR and Remuneration Committee: 5 Quarterly
(c) Technical Committee: 5 Quarterly
(d) Business Review Committee: 6 Quarterly
No. Frequency
28
15. The Board has set up an effective internal audit function staffed with persons who are suitably qualified and experienced for the purpose and are well conversant with the policies and procedures of the Company.
16. The statutory auditors of the Company have confirmed that they have been given a satisfactory rating under the
quality control review program of the ICAP and registered with Audit Oversight Board of Pakistan, that they or any of
the partners of the firm, their spouses and minor children do not hold shares of the Company and that the firm and all
its partners are in compliance with International Federation of Accountants (IFAC) guidelines on code of ethics as
adopted by the ICAP and that they and the partners of the firm involved in the audit are not a close relative (spouse,
parent, dependent and non-dependent children) of the chief executive officer, chief financial officer, head of internal
audit, company secretary or director of the company.
17. The statutory auditors or the persons associated with them have not been appointed to provide other services except
in accordance with the Act, these regulations or any other regulatory requirement and the auditors have confirmed
that they have observed IFAC guidelines in this regard.
18. We confirm that all requirements of regulations 3, 6, 7, 8, 27, 32, 33 and 36 of the Regulations have been complied
with.
19. We confirm that all other requirements of the Regulations have been complied with.
14. The frequency of meetings of the committees were as per following:
Lt Gen Javed Iqbal HI(M), (Retd)
Chief Executive and Managing Director
Lt Gen Syed Tariq Nadeem Gilani HI(M), (Retd)
Chairman
Dated: January 27, 2020
For and on behalf of the Board

Six Month Annual
December
2019
December
2018
December
2017
December
2016
December
2015
June
2015
Annual
%
%
%
%
%
%
Times
Times
Rs. (000)
Times
Days
Rs. (000)
Times
Days
Rs. (000)
Rs. (000)
Times
Days
Days
%
Production
Liquid Production - litres
Non - Liquid Products - Kgs
Financial Performance - Profitability
Gross profit margin
EBITDA margin to sales
Pre tax margin
Net profit margin
Return on equity
Return on capital employed
Operating Performance / Liquidity
Total assets turnover
Fixed assets turnover
Trade Debtors
Debtors turnover
Debtors turnover
Inventory
Inventory turnover
Inventory turnover
Purchases
Accounts Payables
Creditors turnover
Creditors turnover
Operating cycle
Return on assets
Current ratio
Quick / Acid test ratio
Rs.
Rs.
Rs.
Rs.
Rs. (000)
Rs. (000)
Rs.
Rs.
%
Capital Market / Capital Structure Analysis
Market value per share
- Year end
- High during the year
- Low during the year
Breakup value - (Net assets / share)
- excluding revaluation surplus
- including revaluation surplus
Earning per share (pre tax)
Earning per share (after tax)
Earnings growth
Price earning ratio
Market price to breakup value
Debt : Equity
Interest cover
60,873,948
1,651,307
(11.82)
(32.70)
(74.03)
(100.77)
157.40
908.41
0.47
0.71
181,171
38
10
1,443,223
5
80
5,053,129
777,093
6
61
29
(47.63)
0.31
0.18
14.47
35.40
8.87
(9.44)
(4,987,204)
(3,677,786)
(8.05)
(10.96)
-103.17%
(1.32)
(1.53)
(3.82)
(1.43)
90,295,898
1,778,587
(3.84)
(24.08)
(43.30)
(37.25)
(132.99)
(42.47)
0.56
0.96
124,573
60
6
1,380,401
7
55
6,437,178
898,415
10
38
23
(21.02)
0.58
0.36
30.28
41.98
15.61
1.36
718,098
2,142,476
(6.27)
(5.39)
41.50%
(5.62)
22.28
4.61
(3.79)
86,699,115
725,221
2.79
(29.67)
(43.08)
(32.68)
(46.27)
(28.46)
0.59
1.03
129,705
67
5
1,021,156
8
46
5,403,562
438,319
7
49
2
(19.22)
1.70
1.22
16.46
124.4
14.75
6.60
3,486,422
4,945,390
(12.15)
(9.22)
-5.33%
(1.79)
2.49
1.73
(6.45)
37,252,653
5,415,745
3.13
(34.82)
(45.04)
(28.69)
(43.14)
(50.07)
0.44
0.68
77,969
58
6
684,806
8
48
2,717,812
1,008,155
4
89
(34)
(12.59)
0.40
0.25
88.67
314.00
71.51
13.63
1,801,184
2,241,540
(13.74)
(8.75)
-718.22%
(10.13)
6.50
2.26
(9.06)
8,737,421
245,568
(0.18)
(14.04)
(25.68)
(15.39)
(45.49)
64.43
0.36
0.54
37,730
18
10
174,626
4
44
546,844
310,130
2
102
(47)
(5.56)
0.34
0.21
242.21
366.62
71.84
(7.16)
(224,450)
233,165
(1.78)
(1.07)
90.90%
(226.48)
(33.84)
(5.34)
(3.34)
20,458,745
992,377
8.23
(14.67)
(22.54)
(18.74)
(104.31)
279.42
1.18
17.98
38,626
14
25
158,126
16
23
1,403,509
293,433
4
95
(46)
(22.09)
0.44
0.35
79.99
87.99
27.19
(40.80)
(127,970)
335,309
(14.13)
(11.75)
-15.26%
(6.81)
(1.96)
(6.26)
(4.03)
FINANCIAL PERFORMANCE
29

Statement of affairs
Share capital
Reserves
Share holder's fund / Equity
Revaluation surplus
Long term borrowings
Capital employed
Deferred liabilities/(assets)
Property, plant & equipment
Long term assets
Net current assets / Working capital
Liquid funds - net
Financial Performance
Sales - net
Gross profit
Operating Loss
Loss before tax
Loss after tax
EBITDA
Summary of Cash Flows
Net cash flow from operating activities
Net cash flow from investing activities
Net cash flow from financing activities
Changes in cash & cash equivalents
Cash & cash equivalents - Year end
Rs. (000)
Rs. (000)
Rs. (000)
Rs. (000)
Rs. (000)
Rs. (000)
Rs. (000)
Rs. (000)
Rs. (000)
Rs. (000)
Rs. (000)
Rs. (000)
Rs. (000)
Rs. (000)
Rs. (000)
Rs. (000)
Rs. (000)
Rs. (000)
Rs. (000)
Rs. (000)
Rs. (000)
Rs. (000)
5,284,072
(10,271,276)
(4,987,204)
1,309,418
2,963,889
(637,262)
-
8,106,036
8,152,036
(8,789,298)
114,134
5,744,872
(678,827)
(2,434,379)
(4,253,029)
(5,788,937)
(1,878,474)
(1,960,936)
(739,335)
2,215,323
(484,949)
(5,027,812)
5,284,072
(4,565,974)
718,098
1,424,378
4,480,940
6,709,583
(1,571,537)
7,953,144
9,584,783
(2,875,200)
98,221
7,649,287
(293,641)
(2,555,185)
(3,312,388)
(2,849,239)
(1,841,925)
(2,539,892)
(1,456,341)
(292,430)
(4,288,663)
(4,542,863)
5,284,072
(1,797,650)
3,486,422
1,458,968
4,553,055
8,039,476
(1,061,248)
6,822,274
7,901,844
1,652,214
1,195,302
7,000,955
195,125
(2,570,226)
(3,016,286)
(2,288,262)
(2,077,150)
(3,597,667)
(1,050,585)
6,159,323
1,511,072
(254,200)
1,321,017
480,166
1,801,184
440,356
129,919
1,931,103
(628,542)
4,937,751
5,571,678
(3,167,397)
333,540
3,370,507
105,506
(1,367,004)
(1,517,940)
(966,920)
(1,173,689)
(1,573,454)
(3,862,420)
4,205,063
(1,230,810)
(1,765,272)
313,632
(538,082)
(224,450)
457,615
59,828
(164,622)
(76,385)
1,277,998
1,356,031
(1,052,409)
52,960
689,044
(1,259)
(136,121)
(176,931)
(106,073)
(96,723)
(185,336)
(281,007)
292,139
(174,204)
(534,461)
31,363
(159,333)
(127,970)
463,279
2,796
(125,174)
(1,598)
1,037,778
1,041,410
(703,304)
141,057
1,866,019
153,529
(336,916)
(420,600)
(349,763)
(273,733)
(201,730)
(9,486)
134,148
(77,067)
141,057
Six Month Annual
December
2019
December
2018
December
2017
December
2016
December
2015
June
2015
Annual
30
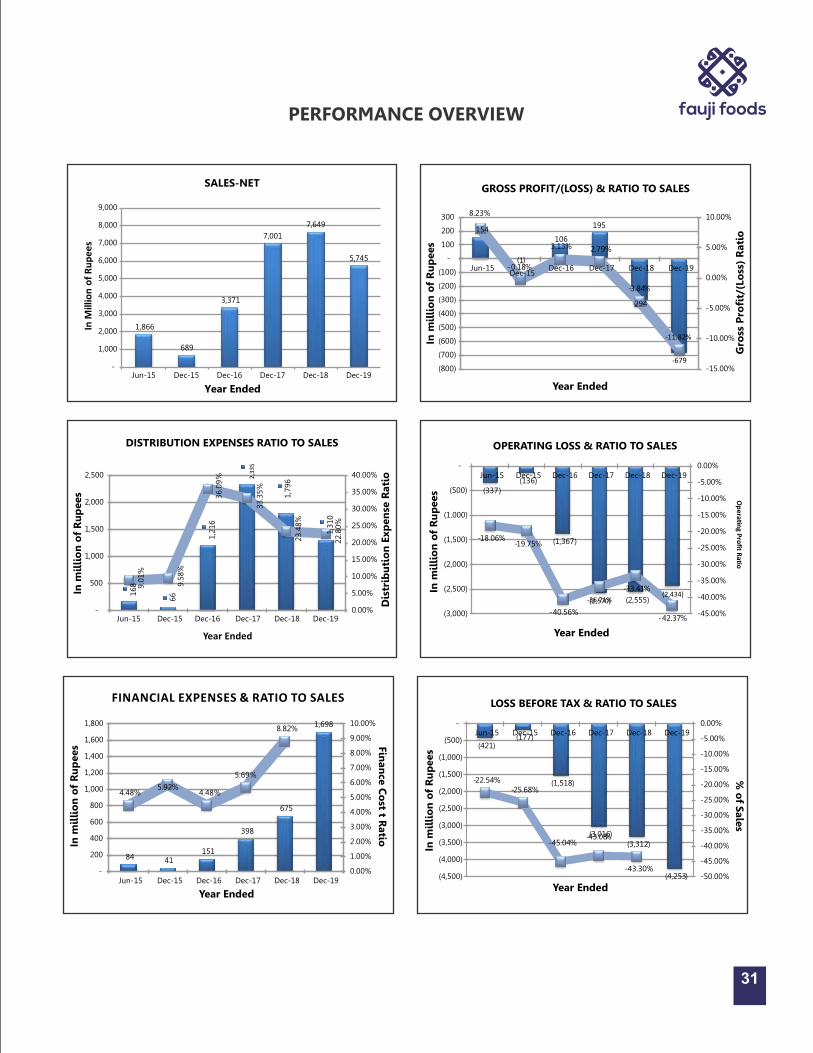
154
(1)
106
195
-294
‐679
8.23%
-0.18%
3.13% 2.79%
-3.84%
‐11.82%
-15.00%
-10.00%
-5.00%
0.00%
5.00%
10.00%
(800)
(700)
(600)
(500)
(400)
(300)
(200)
(100)
-
100
200
300
Jun-15Dec-15
Dec-16 Dec-17 Dec-18 Dec-19
Gro
ss P
rofi
t/(L
oss
) R
ati
o
In m
illi
on
of
Ru
pees
Year Ended
GROSS PROFIT/(LOSS) & RATIO TO SALES
168
66
1,2
16
2,3
35
1,7
96
1,3
10
9.0
1%
9.5
8%
36.0
9%
33.3
5%
23.4
8%
22.8
0%
0.00%
5.00%
10.00%
15.00%
20.00%
25.00%
30.00%
35.00%
40.00%
-
500
1,000
1,500
2,000
2,500
Jun-15 Dec-15 Dec-16 Dec-17 Dec-18 Dec-19
Dis
trib
uti
on
Exp
en
se R
ati
o
In m
illi
on
of
Ru
pees
Year Ended
DISTRIBUTION EXPENSES RATIO TO SALES
(337)(136)
(1,367)
(2,570)(2,434)
-18.06%-19.75%
-40.56%
‐36.71% (2,555)
-33.41%
-42.37%-45.00%
-40.00%
-35.00%
-30.00%
-25.00%
-20.00%
-15.00%
-10.00%
-5.00%
0.00%
(3,000)
(2,500)
(2,000)
(1,500)
(1,000)
(500)
-Jun-15 Dec-15 Dec-16 Dec-17 Dec-18 Dec-19
Op
era�
ng P
rofi
t Ra�
o
In m
illi
on
of
Ru
pees
Year Ended
OPERATING LOSS & RATIO TO SALES
1,866
689
3,371
7,001
7,649
5,745
-
1,000
2,000
3,000
4,000
5,000
6,000
7,000
8,000
9,000
Jun-15 Dec-15 Dec-16 Dec-17 Dec-18 Dec-19
In M
illio
n o
f R
up
ee
s
Year Ended
SALES-NET
84 41 151
398
675
1,698
4.48%5.92%
4.48%
5.69%
8.82%
0.00%
1.00%
2.00%
3.00%
4.00%
5.00%
6.00%
7.00%
8.00%
9.00%
10.00%
-
200
400
600
800
1,000
1,200
1,400
1,600
1,800
Jun-15 Dec-15 Dec-16 Dec-17 Dec-18 Dec-19
Fin
an
ce C
ost t R
atio
In m
illi
on
of
Ru
pees
Year Ended
FINANCIAL EXPENSES & RATIO TO SALES
(421)(177)
(1,518)
(3,016)
(3,312)
(4,253)
-22.54%-25.68%
-45.04%-43.08%
-43.30%-50.00%
-45.00%
-40.00%
-35.00%
-30.00%
-25.00%
-20.00%
-15.00%
-10.00%
-5.00%
0.00%
(4,500)
(4,000)
(3,500)
(3,000)
(2,500)
(2,000)
(1,500)
(1,000)
(500)
-Jun-15 Dec-15 Dec-16 Dec-17 Dec-18 Dec-19
% o
f Sale
s
In m
illi
on
of
Ru
pees
Year Ended
LOSS BEFORE TAX & RATIO TO SALES
PERFORMANCE OVERVIEW
31
0.00%
5.00%
10.00%
15.00%
20.00%
25.00%
30.00%
35.00%
Raw
Mate
rial
Packin
g M
ate
rial
Staff C
osts
Store
con
sum
ptio
n
Facto
ry Ove
rhead
s
Insu
ran
ce
Ban
ks / FIs
Ad
min
Exp
en
ses
Distrib
utio
n…
Oth
er E
xpen
ses
APPLICATION OF REVENUE
31,363 31,363
132,102
528,407 528,407 528,407
(100,000)
-
100,000
200,000
300,000
400,000
500,000
600,000
700,000
Jun-15 Dec-15 Dec-16 Dec-17 Dec-18 Dec-19
In T
ho
usa
nd
of
Ru
pees
Year Ended
PAID-UP SHARE CAPITAL
1,583,182 1,908,734
7,680,651
11,907,266 13,556,178
12,152,806
1.18
0.36 0.44
0.59 0.56 0.47
-
0.20
0.40
0.60
0.80
1.00
1.20
1.40
-
2,000,000
4,000,000
6,000,000
8,000,000
10,000,000
12,000,000
14,000,000
16,000,000
Jun-15 Dec-15 Dec-16 Dec-17 Dec-18 Dec-19
Tota
l A
ssets
Tu
rno
ver
(Tim
es)
In T
ho
usa
nd
of
Ru
pees
Year Ended
TOTAL ASSETS & TURNOVER
31,363 31,363
132,102
528,407 528,407 528,407
(11.75)
(1.07)
(5.94)
(9.22)
(5.39)
(10.96)
(14.00)
(12.00)
(10.00)
(8.00)
(6.00)
(4.00)
(2.00)
-
-
100,000
200,000
300,000
400,000
500,000
600,000
Jun-15 Dec-15 Dec-16 Dec-17 Dec-18 Dec-19
Basi
c Earn
ing
/ (
Lo
ss)
per
Sh
are
(R
s)
In T
ho
usa
nd
of
Ru
pees
Year Ended
ORDINARY SHARE CAPITAL & LOSS PER SHARE
(127,9
70)
(224,4
50)
1,8
01,1
84
3,4
86,4
22
2,1
42,4
76
(3,6
77,7
86)
801,2
13
1,1
98,5
61
4,0
65,2
68
6,0
41,1
39
9,8
75,6
55 1
4,0
31,4
42
(6,000,000)
(4,000,000)
(2,000,000)
-
2,000,000
4,000,000
6,000,000
8,000,000
10,000,000
12,000,000
14,000,000
16,000,000
Jun-15 Dec-15 Dec-16 Dec-17 Dec-18 Dec-19
In T
ho
usa
nd
of
Ru
pees
Year Ended
SHAREHOLDERS' EQUITY AND TOTAL DEBTS
(350) (106)
(967)
(2,288)
(2,849)
(5,789)
-18.74% ‐15.39%‐28.69%
-32.68%-37.25%
‐100.76%
-120.00%
-100.00%
-80.00%
-60.00%
-40.00%
-20.00%
0.00%
(7,000)
(6,000)
(5,000)
(4,000)
(3,000)
(2,000)
(1,000)
-Jun‐15 Dec‐15 Dec-16 Dec-17 Dec-18 Dec-19
Net P
rofi
t Marg
in (%
)In m
illi
on
of
Ru
pees
Year Ended
LOSS AFTER TAX
32

FORM 34THE COMPANIES ACT, 2017
(Section 227(2)(f))
PATTERN OF SHAREHOLDING
1.1 Name of the Company FAUJI FOODS LIMITED
2.1. Pattern of holding of the shares held by the shareholders as at 31-12-2019
851 1 100 43,263
1339 101 500 610,286
1537 501 1,000 1,494,891
3366 1,001 5,000 10,059,931
1167 5,001 10,000 9,492,255
418 10,001 15,000 5,449,710
311 15,001 20,000 5,809,454
214 20,001 25,000 5,057,308
139 25,001 30,000 3,986,296
81 30,001 35,000 2,690,292
81 35,001 40,000 3,153,066
35 40,001 45,000 1,511,501
105 45,001 50,000 5,187,264
30 50,001 55,000 1,590,959
29 55,001 60,000 1,713,224
26 60,001 65,000 1,651,048
14 65,001 70,000 952,503
33 70,001 75,000 2,436,850
27 75,001 80,000 2,127,075
5 80,001 85,000 417,000
14 85,001 90,000 1,244,302
5 90,001 95,000 467,500
50 95,001 100,000 4,989,000
6 100,001 105,000 618,500
9 105,001 110,000 978,500
4 110,001 115,000 451,500
2 115,001 120,000 235,168
7 120,001 125,000 870,500
4 125,001 130,000 512,500
6 130,001 135,000 799,000
5 135,001 140,000 692,000
6 140,001 145,000 861,000
11 145,001 150,000 1,646,500
5 150,001 155,000 770,101
5 155,001 160,000 800,000
2 160,001 165,000 326,500
2 165,001 170,000 338,400
Shareholdings2.2 No. of Shareholders
From ToTotal Shares Held
33
Incorporation No. 0002355

3
3
1
1
1
15
4
3
2
4
1
5
10
1
3
1
2
1
1
1
7
1
3
2
1
1
2
3
1
1
1
4
1
1
1
2
1
1
2
1
1
1
1
1
1
170,001
175,001
180,001
185,001
190,001
195,001
200,001
205,001
215,001
220,001
230,001
235,001
245,001
250,001
255,001
260,001
265,001
270,001
280,001
290,001
295,001
300,001
305,001
310,001
315,001
320,001
340,001
345,001
365,001
380,001
390,001
395,001
420,001
430,001
440,001
455,001
465,001
485,001
505,001
515,001
520,001
525,001
535,001
550,001
555,001
175,000
180,000
185,000
190,000
195,000
200,000
205,000
210,000
220,000
225,000
235,000
240,000
250,000
255,000
260,000
265,000
270,000
275,000
285,000
295,000
300,000
305,000
310,000
315,000
320,000
325,000
345,000
350,000
370,000
385,000
395,000
400,000
425,000
435,000
445,000
460,000
470,000
490,000
510,000
520,000
525,000
530,000
540,000
555,000
560,000
524,000
535,500
184,740
185,500
192,072
2,996,800
816,500
628,000
440,000
895,500
232,000
1,186,500
2,499,500
252,500
774,500
265,000
537,056
275,000
284,500
294,500
2,096,000
303,500
920,666
628,000
320,000
320,500
686,500
1,050,000
367,500
384,000
393,500
1,599,000
420,500
435,000
444,000
917,684
469,000
488,500
1,020,000
519,000
524,000
527,500
540,000
552,468
555,500
Shareholdings2.2 No. of Shareholders
From ToTotal Shares Held
34

2.3 Categories of Shareholders Share held Percentage
91 0.0000%
359,393,302 68.0145%
10,249 0.0019%
1,136,000 0.2150%
2.3.1 Directors, Chief Executive Officers,
and their spouse and minor children
2.3.2 Associated Companies,
undertakings and related
parties. (Parent Company)
2.3.3 NIT and ICP
2.3.4 Banks Development
Financial Institutions, Non
Banking Financial Institutions.
2
1
1
1
2
1
1
1
1
1
1
1
1
1
1
1
1
1
1
1
1
1
1
1
1
1
580,001
615,001
620,001
670,001
745,001
765,001
790,001
795,001
935,001
990,001
1,100,001
1,150,001
1,225,001
1,250,001
1,375,001
2,140,001
2,195,001
2,530,001
3,835,001
6,060,001
6,875,001
10,400,001
11,770,001
20,400,001
67,370,001
267,310,001
585,000
620,000
625,000
675,000
750,000
770,000
795,000
800,000
940,000
995,000
1,105,000
1,155,000
1,230,000
1,255,000
1,380,000
2,145,000
2,200,000
2,535,000
3,840,000
6,065,000
6,880,000
10,405,000
11,775,000
20,405,000
67,375,000
267,315,000
1,165,500
618,000
621,000
674,000
1,496,000
767,500
791,000
800,000
936,000
992,000
1,105,000
1,150,500
1,227,400
1,254,000
1,377,000
2,142,500
2,200,000
2,535,000
3,836,500
6,064,857
6,880,000
10,400,500
11,771,000
20,401,000
67,371,916
267,311,886
10,084 528,407,192
Shareholdings2.2 No. of Shareholders
From ToTotal Shares Held
35

2.3.5 Insurance Companies 126,572 0.0240%
2.3.6 Modarabas and Mutual 5,130,500 0.9709%
Funds
2.3.7 Shareholders holding 10% 334,686,802 63.3388%
or more
2.3.8 General Public
a. Local 136,188,778 25.7735%
b. Foreign 43,000 0.0081%
2.3.9 Others (to be specified)
24,032,187 4.5480%
1,327,400 0.2512%
1- Joint Stock Companies
2- Foreign Companies
3- Other Companies 1,019,113 0.1929%
Share held Percentage
3. Signature of Company Secretary
4. Name of Signatory
5. Designation
6. CNIC Number
7. Date
Brig Zahid Nawaz Mann (Retd)
Company Secretary
35402-1897498-9
December 31, 2019
36

We have reviewed the enclosed Statement of Compliance with the Listed Companies (Code of Corporate Governance) Regulations, 2019 (the Regulations) prepared by the Board of Directors of Fauji Foods Limited (“the Company”) for the year ended 31 December 2019 in accordance with the requirements of regulation 36 of the Regulations.
The responsibility for compliance with the Regulations is that of the Board of Directors of the Company. Our responsibility is to review whether the Statement of Compliance reflects the status of the Company's compliance with the provisions of the Regulations and report if it does not and to highlight any non-compliance with the requirements of the Regulations. A review is limited primarily to inquiries of the Company's personnel and review of various documents prepared by the Company to comply with the Regulations.
As part of our audit of financial statements we are required to obtain an understanding of the accounting and internal control systems sufficient to plan the audit and develop an effective audit approach. We are not required to consider whether the Board of Directors' statement on internal control covers all risks and controls or to form an opinion on the effectiveness of such internal controls, the Company's corporate governance procedures and risks.
The Regulations require the Company to place before the Audit Committee, and upon recommendation of the Audit Committee, place before the Board of Directors for their and approval, of its related party review transactions and also ensure compliance with the requirements of section 208 of the Companies Act, 2017. We are only required and have ensured compliance of this requirement to the extent of the approval of the related party transactions by the Board of Directors upon recommendation of the Audit Committee. We have not carried out procedures to determine whether the related party transactions were undertaken at arm's length price or not.
Based on our review, nothing has come to our attention which causes us to believe that the Statement of Compliance does not appropriately reflect the Company's compliance, in all material respects, with the requirements contained in the Regulations as applicable to the Company for the year ended 31 December 2019.
Lahore Date: January 31, 2020
KPMG Taseer Hadi & Co.
Chartered Accountants
Independent Auditor’s Review ReportTo the members of Fauji Foods Limited
Review report on the Statement of Compliance contained in Listed Companies
(Code of Corporate Governance) Regulations, 2019
37
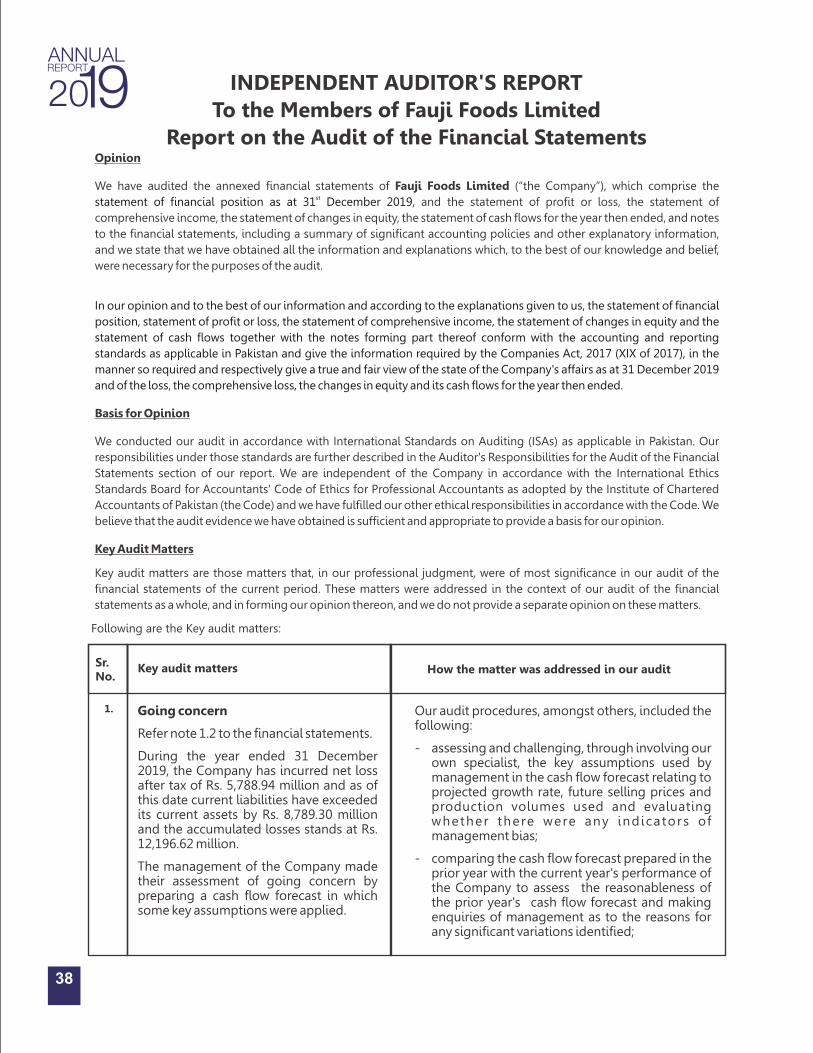
Opinion
We have audited the annexed financial statements of Fauji Foods Limited (“the Company”), which comprise the ststatement of financial position as at 31 December 2019, and the statement of profit or loss, the statement of
comprehensive income, the statement of changes in equity, the statement of cash flows for the year then ended, and notes
to the financial statements, including a summary of significant accounting policies and other explanatory information,
and we state that we have obtained all the information and explanations which, to the best of our knowledge and belief,
were necessary for the purposes of the audit.
In our opinion and to the best of our information and according to the explanations given to us, the statement of financial
position, statement of profit or loss, the statement of comprehensive income, the statement of changes in equity and the
statement of cash flows together with the notes forming part thereof conform with the accounting and reporting
standards as applicable in Pakistan and give the information required by the Companies Act, 2017 (XIX of 2017), in the
manner so required and respectively give a true and fair view of the state of the Company's affairs as at 31 December 2019
and of the loss, the comprehensive loss, the changes in equity and its cash flows for the year then ended.
Basis for Opinion
We conducted our audit in accordance with International Standards on Auditing (ISAs) as applicable in Pakistan. Our
responsibilities under those standards are further described in the Auditor's Responsibilities for the Audit of the Financial
Statements section of our report. We are independent of the Company in accordance with the International Ethics
Standards Board for Accountants' Code of Ethics for Professional Accountants as adopted by the Institute of Chartered
Accountants of Pakistan (the Code) and we have fulfilled our other ethical responsibilities in accordance with the Code. We
believe that the audit evidence we have obtained is sufficient and appropriate to provide a basis for our opinion.
Key Audit Matters
Key audit matters are those matters that, in our professional judgment, were of most significance in our audit of the
financial statements of the current period. These matters were addressed in the context of our audit of the financial
statements as a whole, and in forming our opinion thereon, and we do not provide a separate opinion on these matters.
INDEPENDENT AUDITOR'S REPORT
To the Members of Fauji Foods Limited
Report on the Audit of the Financial Statements
38
Sr. No.
Key audit matters How the matter was addressed in our audit
1.
Going concern
Refer note 1.2 to the financial statements.
During the year ended 31 December 2019, the Company has incurred net loss after tax of Rs. 5,788.94 million and as of this date current liabilities have exceeded its current assets by Rs. 8,789.30 million and the accumulated losses stands at Rs. 12,196.62 million.
The management of the Company made their assessment of going concern by preparing a cash flow forecast in which some key assumptions were applied.
Our audit procedures, amongst others, included the following:
- assessing and challenging, through involving our own specialist, the key assumptions used by management in the cash flow forecast relating to projected growth rate, future selling prices and production volumes used and evaluating whether there were any indicators of management bias;
- comparing the cash flow forecast prepared in the prior year with the current year's performance of the Company to assess the reasonableness of the prior year's cash flow forecast and making enquiries of management as to the reasons for any significant variations identified;
Following are the Key audit matters:

Sr. No.
Key audit matters How the matter was addressed in our audit
These key assumptions included forecasts of sales volumes, average selling prices, raw material costs and necessary capital expenditure for products and the availability of banking and other financing facilities including financial support from the Parent Company.
We identified the going concern
assessment as a key audit matter
b e c a u s e t h e re a re e ve n t s o r
conditions that may cast significant
doubt on Company's ability to
continue as a going concern. A
significant degree of management
judgement is involved in making this
assessment and in forecasting the
future cash flows of the Company
which are inherently uncertain.
- assessing the availability of banking and other financing facilities including support from Parent Company during the forecast period by inspecting contracts or agreements signed with banks and other financial facilities up-to the date of approval of financial statements and assessing their adequacy to meet the Company's needs in the context of cash flow forecast; and
- assessing the adequacy of disclosure made in the financial statements in accordance with the requirements of the applicable accounting and reporting standards.
2. Sales
Refer to note 4.17 and 27 to the financial statements.
The Company recognized revenue of Rs. 5,744.87 million from sale of goods to customers during the year ended 31 December 2019.
We identified recognition of revenue
as a key audit matter because revenue
is one of the key performance
indicators of the Company and gives
rise to a risk that revenue is
recognized with transferring of
control.
Our audit procedures, amongst others, included the following:
- obtaining an understanding of the process relating to recording of sales and testing the design, implementation and operating effectiveness of relevant key internal controls;
- assessing the appropriateness of the Company's accounting policy for recording of sales and compliance of the policy with applicable accounting and reporting standards;
- comparing a sample of sale transactions recorded during the year with sales orders, sales invoices, delivery challans and other relevant underlying documents;
- comparing a sample of sale transactions recorded near the year end with the sales, orders, sales invoices, delivery challans and other relevant underlying documentation to assess if the sale was recorded in the appropriate accounting period;
- inspecting on a sample basis, credit notes issued near to and subsequent to year end to evaluate whether the adjustments to sales had been accurately recorded in the appropriate accounting period; and
- scanning for any manual journal entries relating to sales recorded during the year end which were considered to be material or met other specific risk based criteria for inspecting underlying documentation.
39

Key audit matters How the matter was addressed in our audit
Capitalization of property, plant and equipment
Refer notes 4.10 and 17 to the financial statements.
The Company has made significant capital expenditure on expansion of manufacturing facilities.
We identified capitalization of
property, plant and equipment as a
key audit matter because there is a risk
that amounts being capitalized may
not meet the capitalization criteria
w i th re l a ted im p l i c a t ions on
depreciation charge for the year.
4. Valuation of stock in trade
Refer notes 4.13 and 21 to the financial statements.
As at 31 December 2019, the Company's gross carrying amount of stock-in trade amounts to Rs. 1,530.51 million against which net realizable value adjustment of Rs. 32 million has been recorded.
We identified valuation of stock in
trade as a key audit matter as it
involves significant management
judgment in determining the carrying
value of stock in trade.
Our audit procedures, amongst others, included the following:
- assessing the appropriateness of Company's accounting policy for valuation of stock in trade and compliance of the policy with applicable accounting and reporting standards;
- obtaining an understanding of internal controls over valuation of stock in trade and testing, on a sample basis, their design, implementation and operating effectiveness;
- obtaining an understanding and assessing reasonableness of the management's determination of net realizable value (NRV) and the key estimates adopted, including future selling prices, future costs to complete work-in-progress and costs necessary to make the sales and their basis; and
- comparing the NRV, on a sample basis, to the cost of stock in trade to assess whether any adjustments are required to the value of stock in trade in accordance with the accounting policy.
Sr. No.
3. Our audit procedures, amongst others, included the following:
- obtaining an understanding of and testing the design, implementation and operating effectiveness of management's key internal control over capital expenditure;
- testing, on sample basis, the costs incurred on projects with supporting documentation and contracts;
- assessing the nature of costs incurred for the capital projects through testing, on a sample basis, of amounts recorded and considering whether the expenditure meets the criteria for capitalization as per the applicable accounting and reporting standards; and
- inspecting supporting documents for the date of capitalization when project assets were ready for its intended use to assess that depreciation commenced and further capitalization of costs ceased from that date and assessing the useful life assigned by management including testing the calculation of related depreciation.
40
Information Other than the Financial Statements and Auditor's Report Thereon
Management is responsible for the other information. Other information comprises the information included in the annual report for the year ended 31 December 2019, but does not include the financial statements and our auditor's report thereon.
Our opinion on the financial statements does not cover the other information and we do not express any form of assurance conclusion thereon.
In connection with our audit of the financial statements, our responsibility is to read the other information and, in doing so, consider whether the other information is materially inconsistent with the financial statements or our knowledge

41
obtained in the audit or otherwise appears to be materially misstated. If, based on the work we have performed, we conclude that there is a material misstatement of this other information, we are required to report that fact. We have nothing to report in this regard.
Responsibilities of Management and Board of Directors for the Financial Statements
Management is responsible for the preparation and fair presentation of the financial statements in accordance with the accounting and reporting standards as applicable in Pakistan and the requirements of Companies Act, 2017(XIX of 2017) and for such internal control as management determines is necessary to enable the preparation of the financial statements that are free from material misstatement, whether due to fraud or error.
In preparing the financial statements, management is responsible for assessing the Company's ability to continue as a going concern, disclosing, as applicable, matters related to going concern and using the going concern basis of accounting unless management either intends to liquidate the Company or to cease operations, or has no realistic alternative but to do so.
Board of directors are responsible for overseeing the Company's financial reporting process.
Auditor's Responsibilities for the Audit of the Financial Statements
Our objectives are to obtain reasonable assurance about whether the financial statements as a whole are free from material misstatement, whether due to fraud or error and to issue an auditor's report that includes our opinion. Reasonable assurance is a high level of assurance, but is not a guarantee that an audit conducted in accordance with ISAs as applicable in Pakistan will always detect a material misstatement when it exists. Misstatements can arise from fraud or error and are considered material if, individually or in the aggregate, they could reasonably be expected to influence the economic decisions of users taken on the basis of these financial statements.
As part of an audit in accordance with ISAs as applicable in Pakistan, we exercise professional judgment and maintain professional skepticism throughout the audit. We also:
- Identify and assess the risks of material misstatement of the financial statements, whether due to fraud or error, design and perform audit procedures responsive to those risks, and obtain audit evidence that is sufficient and appropriate to provide a basis for our opinion. The risk of not detecting a material misstatement resulting from fraud is higher than for one resulting from error, as fraud may involve collusion, forgery, intentional omissions, misrepresentations, or the override of internal control.
- Obtain an understanding of internal control relevant to the audit in order to design audit procedures that are appropriate in the circumstances, but not for the purpose of expressing an opinion on the effectiveness of the Company's internal control.
- Evaluate the appropriateness of accounting policies used and the reasonableness of accounting estimates and related disclosures made by management.
- Conclude on the appropriateness of management's use of the going concern basis of accounting and, based on the audit evidence obtained, whether a material uncertainty exists related to events or conditions that may cast significant doubt on the Company's ability to continue as a going concern.
If we conclude that a material uncertainty exists, we are required to draw attention in our auditor's report to the related disclosures in the financial statements or, if such disclosures are inadequate, to modify our opinion. Our conclusions are based on the audit evidence obtained up to the date of our auditor's report. However, future events or conditions may cause the Company to cease to continue as a going concern.
- Evaluate the overall presentation, structure and content of the financial statements, including the disclosures, and whether the financial statements represent the underlying transactions and events in a manner that achieves fair presentation.
We communicate with the board of directors regarding, among other matters, the planned scope and timing of the audit and significant audit findings, including any significant deficiencies in internal control that we identify during our audit.

Lahore
Date: January 31, 2020
KPMG Taseer Hadi & Co.Chartered Accountants
42
We also provide the board of directors with a statement that we have complied with relevant ethical requirements regarding independence, and to communicate with them all relationships and other matters that may reasonably be thought to bear on our independence, and where applicable, related safeguards.
From the matters communicated with the board of directors, we determine those matters that were of most significance in the audit of the financial statements of the current period and are therefore the key audit matters. We describe these matters in our auditor's report unless law or regulation precludes public disclosure about the matter or when, in extremely rare circumstances, we determine that a matter should not be communicated in our report because the adverse consequences of doing so would reasonably be expected to outweigh the public interest benefits of such communication.
Report on Other Legal and Regulatory Requirements
Based on our audit, we further report that in our opinion:
a) proper books of account have been kept by the Company as required by the Companies Act, 2017(XIX of 2017);
b) the statement of financial position, the statement of profit or loss, the statement of comprehensive income, the statement of changes in equity and the statement of cash flows together with the notes thereon have been drawn up in conformity with the Companies Act, 2017 (XIX of 2017) and are in agreement with the books of account and returns;
c) investments made, expenditure incurred and guarantees extended during the year were for the purpose of the Company's business; and
d) no zakat was deductible at source under the Zakat and Ushr Ordinance, 1980 (XVlII of 1980).
The engagement partner on the audit resulting in this independent auditor's report is Mr. Bilal Ali.

43
Financial Statements

Note
5
5
6
7
8
9
10
11
12
13
14
15
16
2019 2018
Rupees Rupees
7,000,000,000
7,000,000,000
5,284,071,920
5,284,071,920
1,925,340,907 1,925,340,907
(12,196,616,692)
(6,491,314,836)
1,309,417,781
1,424,377,761
(3,677,786,084)
2,142,475,752
2,708,333,333
4,191,666,667 255,555,628 289,272,895
76,634,948
86,167,817
3,040,523,909
4,567,107,379
1,745,608,877
403,631,987
6,691,944,126
4,991,083,521
2,630,000,000 -
1,166,742,071
1,255,264,861
965,752 965,752
554,807,673 195,648,668
12,790,068,499 6,846,594,789
EQUITY AND LIABILITIES
Share capital and reserves
Authorized capital
Issued, subscribed and paid up capital
Share premium
Accumulated loss
Surplus on revaluation of property,
plant and equipment - net of tax
Non-current liabilities
Long term finances - secured
Lease liabilities
Employee retirement benefits
Current liabilities
Current portion of long term liabilities
Short term borrowings - secured
Loan from Parent Company - unsecured
Trade and other payables
Unclaimed dividend
Accrued finance cost
Contingencies and commitments
12,152,806,324 13,556,177,920
Statement of Financial PositionAs at 31 December 2019
4044
The annexed notes 1 to 45 form an integral part of these financial statements.
Lahore

Lahore
2019 2018
Note Rupees Rupees
17 7,953,143,603
18 59,158,143
944,306
19
1,571,537,380
9,584,783,432
ASSETS
Non-current assets
12,152,806,324 13,556,177,920
20 142,132,460
21 1,380,400,512
22 124,573,265
23 61,527,093
24 733,787,593
25 308,895
440,797,114
989,646,258
Property, plant and equipment
Intangible assets
Security deposits
Deferred taxation - net
Current assets
Stores, spares and loose tools
Stock-in-trade
Trade debts - considered good
Loans and advances - considered good
Deposits, prepayments and other receivables
Due from associated companies
Sales tax refundable - net
Income tax - net
Cash and bank balances 26 98,221,298
8,106,036,190
39,393,564
6,606,122
-
8,152,035,876
237,545,924
1,443,222,934
181,171,112
64,645,851
233,956,743
39,247
563,303,259
1,162,750,979
114,134,399
4,000,770,448 3,971,394,488
Statement of Financial PositionAs at 31 December 2019
45

Lahore
For the year ended 31 December 2019
Statement of Profit or Loss
The annexed notes 1 to 45 form an integral part of these financial statements.
2019 2018
Note Rupees Rupees
27 7,649,286,569
28 (7,942,927,853)
(293,641,284)
29
(1,795,894,148)
30
(465,649,383)
22.1
-
(2,555,184,815)
31
17,812,359
32
(100,219,314)
33
(674,796,714)
(3,312,388,484)
34
463,149,882
(2,849,238,602)
Sales - net
Cost of sales
Gross loss
Marketing and distribution expenses
Administrative expenses
Loss allowance on trade debts
Loss from operations
Other income
Other expenses
Finance cost
Loss before taxation
Taxation
Loss after taxation
Loss per share - basic and diluted 35 (5.39)
5,744,872,328
(6,423,699,048)
(678,826,720)
(1,309,604,707)
(438,268,935)
(7,678,704)
(2,434,379,066)
98,311,925
(218,794,869)
(1,698,166,696)
(4,253,028,706)
(1,535,908,768)
(5,788,937,474)
(10.96)
46

Lahore
Statement of Comprehensive IncomeFor the year ended 31 December 2019
2019 2018
Rupees Rupees
(5,788,937,474)
(2,849,238,602)
4,304,250
(815,892)
Loss after taxation for the year
Other comprehensive income / (loss)
Items that will not be reclassified to profit or loss:
- Remeasurement of defined benefit obligation
Total comprehensive loss for the year (5,784,633,224)
(2,850,054,494)
The annexed notes 1 to 45 form an integral part of these financial statements.
47

Lahore
Total comprehensive loss for the year
Loss after taxation
Other comprehensive loss for the year
Remeasurement of defined benefit obligation
Total comprehensive loss
-
-
-
-
-
-
-
-
-
(2,849,238,602)
(815,892)
(2,850,054,494)
(2,849,238,602)
(815,892)
(2,850,054,494)
Surplus transferred to accumulated losses
Incremental depreciation relating to surplus
on revaluation - net of tax
- -
(81,730,197)
81,730,197 -
Effect of change in tax rate on account of surplus
on property, plant and equipment
Balance as at 31 December 2018
-
5,284,071,920
-
1,925,340,907
47,139,906
1,424,377,761
-
(6,491,314,836)
47,139,906
2,142,475,752
The annexed notes 1 to 45 form an integral part of these financial statements.
Total comprehensive loss for the year
Loss after taxation
Other comprehensive loss for the year
Remeasurement of defined benefit obligation
Total comprehensive loss
Surplus transferred to accumulated losses
Incremental depreciation relating to surplus
on revaluation - net of tax
Effect of change in tax rate on account of surplus
on property, plant and equipment
Balance as at 31 December 2019
Disposal of plant and machinery - net of tax
-
-
-
-
-
-
5,284,071,920
-
-
-
-
-
-
1,925,340,907
-
-
-
(5,774,191)
(73,557,177)
(35,628,612)
1,309,417,781
(5,788,937,474)
4,304,250
(5,784,633,224)
5,774,191
73,557,177
-
(12,196,616,692)
(5,788,937,474)
4,304,250
(5,784,633,224)
-
-
(35,628,612)
(3,677,786,084)
As at 01 January 2018 5,284,071,920 1,925,340,907 1,458,968,052 (3,722,990,539) 4,945,390,340
------------------------------- Rupees -------------------------------
Revenue reserves
Share
premium
Surplus on
revaluation of
property, plant and
equipment- net of tax
Accumulated
loss
Issued, subscribed
and paid-up
capital
Capital Reserve
Total
Statement of Changes In EquityFor the year ended 31 December 2019
48

Cash flow from investing activities
(879,577,317)
84,043,558
56,198,286
(739,335,473)
Acquisition of property, plant and equipment
Sale proceeds from disposal of property, plant and equipment
Income on bank deposits received
Net cash used in investing activities
Cash flow from financing activities
(1,467,858,414)
3,203,291
8,314,319
(1,456,340,804)
(133,333,333)
1,199,998,552
(142,335,001)
(1,339,007,691)
2,630,000,000
-
42 2,215,322,527
Repayment of long term finances
Short term borrowings - net
Lease rentals paid
Finance cost paid
Loan received from Parent Company
Dividends paid
Net cash generated from / (used in) financing activities
-
349,999,476
(89,904,038)
(552,521,110)
-
(4,427)
(292,430,099)
(484,948,952)
(4,542,862,747)
36 (5,027,811,699)
Net decrease in cash and cash equivalents
Cash and cash equivalents - at beginning of the year
Cash and cash equivalents - at end of the year
The annexed notes 1 to 45 form an integral part of these financial statements.
(4,288,663,069)
(254,199,678)
(4,542,862,747)
2019
Note Rupees
(4,253,028,706)
17.1.6 774,183,096
18.1.1 21,483,463
31 (32,666,185)
22.1 7,678,704
20 5,256,700
21 55,283,299
31 (56,198,286)
32 247,343
20,988,466
32 4,258,184
33 1,698,166,696
(1,754,347,226)
(100,670,164)
(118,105,721)
(64,276,551)
(3,118,758)
499,830,850
269,648
(122,506,145)
(88,770,134)
(2,653,025)
(1,751,694,201)
Cash flows from operating activities
Loss before taxation
Adjustments for non-cash items:
- Depreciation on property, plant and equipment
- Amortization of intangible assets
- Gain on disposal of property, plant and equipment
- Loss allowance on trade debts
- Provision for obsolete stores and spares
- Provision for obsolete stocks
- Profit on bank deposits
- Unrealized foreign exchange loss
- Provision for employee retirement benefits
- Fair value adjustment of interest free security deposit
- Finance cost
Loss before working capital changes
Effect on cash flow due to working capital changes
(Increase) / decrease in current assets:
- Stores, spares and loose tools
- Stock-in-trade
- Trade debts
- Loans and advances
- Deposits, prepayments and other receivables
- Due from associated companies
- Sales tax refundable
(Decrease) / increase in current liabilities:
- Trade and other payables
Cash used in operations
(173,104,721)
(26,217,084)
(9,920,000)
(1,960,936,006)
Income tax paid
Employee benefits paid
Security deposits - net
Net cash used in operating activities
2018
Rupees
(3,312,388,484)
673,735,318
2,652,249
(1,544,277)
-
3,356,101
7,831,398
(8,314,319)
9,108,549
32,072,757
-
674,796,714
(1,918,693,994)
(38,354,356)
(367,075,944)
5,131,493
14,416,275
(243,909,929)
784,691
43,546,267
455,375,201
(130,086,302)
(2,048,780,296) (488,778,426)
(2,333,444)
-
(2,539,892,166)
Statement of Cash FlowsFor the year ended 31 December 2019
49Lahore

1 The Company and its operations
1.1 Fauji Foods Limited ("the Company") was incorporated in Pakistan on 26 September 1966 as a Public Company and its shares are quoted on Pakistan Stock Exchange. It is principally engaged in processing and sale of toned milk, milk powder, fruit juices, allied dairy and food products. The registered office of the Company is situated at Fauji Foods Limited, 42 CCA, Ex Park View, DHA Phase-VIII, Lahore (formerly at FFBL Complex, 103 A/B, Shahrah-e-Quaid-e-Azam, Lahore) and the manufacturing facility is located at Bhalwal, District Sargodha. The Company is a subsidiary of Fauji Fertilizer Bin Qasim Limited, the Parent Company.
1.2 Consequent to acquisition of the Company by Fauji Group in year 2015, the management has taken various operational measures towards transformation of the Company that includes curtailment of higher input costs, increasing production scales to optimum levels by BMR - balancing, modernization and replacement of production facility amounting to Rs. 7,260.44 million (during the last four years), strengthening of milk collection and sales and distribution structures. The management has also taken various financial initiatives towards improvement of liquidity that included raising of equity finance of Rs. 6,896 million to date through right issue to support working capital and capital expenditure requirements. The Company has also arranged long term finances of Rs. 4,450 million to finance capital expenditure. Further fresh working capital lines of Rs. 2,000 million, in addition to existing lines of Rs. 5,300 million, were arranged from new and existing lenders during the year to meet operational liquidity requirements. The Parent Company has provided financial support of Rs. 2,630 million during the year for meeting the working capital requirements and contractual obligations of the Company.
Despite of the above measures, during the year ended 31 December 2019, the Company has incurred a loss after
tax of Rs. 5,788.94 million (2018: Rs. 2,849.24 million) and as of this date its current liabilities exceeds its current assets by Rs. 8,789.30 million (2018: Rs. 2,875.20 million), equity has eroded and stands at negative Rs. 3,677.79 million. Due to continuous operational losses for the last few years, the operations have been financed through sponsor support/equity injection and high level of borrowings and as at 31 December 2019, the total debt amounts to Rs. 13,638.61 million.
The Board of the Directors (“BOD”) of the Company have approved the business plan for financial year 2020 that shows improvements in cash generation. The cash flow forecasts for financial year 2020 includes financial support of Rs. 2,500 million from the Parent Company primarily for meeting the contractual obligations of the Company. The BOD has approved conversion of financial support for financial year 2019 of Rs. 2,630 million along with accrued markup into equity after approval of the shareholders and other requisite regulatory approvals. The Company is also considering renegotiating the terms of the loans with the lenders. Further the Parent Company has committed to provide all necessary financial and technical support to the Company as and when needed.
The management believes that the measures as explained above will generate sufficient financial resources from operations and alongwith financial support from the Parent Company, the Company is expected to generate sufficient cashflows in the next year. Accordingly, these financial statements have been prepared on a going concern basis.
2 Basis of accounting
2.1 Statement of compliance
These financial statements have been prepared in accordance with the accounting and reporting standards as applicable in Pakistan. The accounting and reporting standards applicable in Pakistan comprise of:
- International Financial Reporting Standards (IFRS Standards) issued by the International Accounting Standards Board (IASB) as notified under the Companies Act, 2017;
- Provisions of and directives issued under the Companies Act, 2017; and
- Islamic Financial Accounting Standards (IFAS) issued by the Institute of Chartered Accountants of Pakistan as notified under the Companies Act, 2017.
Where provisions of and directives issued under the Companies Act, 2017 differ from the IFRS Standards, the provisions of and directives issued under the Companies Act, 2017 have been followed.
Notes to the Financial StatementsFor the year ended 31 December 2019
50

2.2 Standards, amendments and interpretations and forth coming requirements
2.2.1 Standards, amendments or interpretations which became effective during the year
During the year certain amendments to standards or new interpretations became effective. However, the amendments or interpretations did not have any material effect on the financial statements of the Company.
2.2.1.2 New and revised accounting standards, amendments to published accounting standards, and interpretations that are not yet effective.
The following International Financial Reporting Standards (IFRS Standards) as notified under the Compranies Act, 2017 and the amendments and interpretations thereto will be effective for accounting periods beginning on or after 01 January 2020:
- Amendment to IFRS 3 ‘Business Combinations’ - Definition of a Business (effective for business combinations for which the acquisition date is on or after the beginning of annual period beginning on or after 1 January 2020). The IASB has issued amendments aiming to resolve the difficulties that arise when an entity determines whether it has acquired a business or a group of assets. The amendments clarify that to be considered a business, an acquired set of activities and assets must include, at a minimum, an input and a substantive process that together significantly contribute to the ability to create outputs. The amendments include an election to use a concentration test. The standard is effective for transactions in the future and therefore would not have an impact on past financial statements.
- Amendments to IAS 1 Presentation of Financial Statements and IAS 8 Accounting Policies, Changes in Accounting Estimates and Errors (effective for annual periods beginning on or after 1 January 2020). The amendments are intended to make the definition of material in IAS 1 easier to understand and are not intended to alter the underlying concept of materiality in IFRS Standards. In addition, the IASB has also issued guidance on how to make materiality judgments when preparing their general purpose financial statements in accordance with IFRS Standards.
- On 29 March 2018, the International Accounting Standards Board (the IASB) has issued a revised Conceptual Framework for Financial Reporting which is applicable immediately contains changes that will set a new direction for IFRS in the future. The Conceptual Framework primarily serves as a tool for the IASB to develop standards and to assist the IFRS Interpretations Committee in interpreting them. It does not override the requirements of individual IFRSs and any inconsistencies with the revised Framework will be subject to the usual due process – this means that the overall impact on standard setting may take some time to crystallize. The companies may use the Framework as a reference for selecting their accounting policies in the absence of specific IFRS requirements. In these cases, companies should review those policies and apply the new guidance retrospectively as of 1 January 2020, unless the new guidance contains specific scope outs.
- Interest Rate Benchmark Reform which amended IFRS 9, IAS 39 and IFRS 7 is applicable for annual financial periods beginning on or after 01 January 2020. The G20 asked the financial stability board (FSB) to undertake a fundamental review of major interest rate benchmarks. Following the review, the FSB published a report setting out its recommended reforms of some major interest rate benchmarks such as IBORs. Public authorities in many jurisdiction have since taken steps to implement those recommendations. This has in turn led to uncertainty about the long term viability of some interest rate benchmarks.in these amendments, the term 'interest rate Benchmark reform' refers to the market-wide reform of an interest rate benchmark including its replacement with an alternative benchmark rate ,such as that resulting from the FSB'S recommendation set out in its July 2014 report 'Reforming Major Interest Rate Benchmarks'(the reform). The amendments made provide relief from the potential effects of the uncertainty caused by the reform. A company shall apply the exceptions to all hedging relationships directly affected by interest rate benchmark reform. The amendments are not likely to affect the financial statements of the company.
- FRS 14 Regulatory Deferral Accounts- (effective for annual periods beginning on or after 01 July 2019) provides interim guidance on accounting for regulatory deferral accounts balances while IASB considers more comprehensive guidance on accounting for the effects of rate regulations. In order to apply the interim standard, an entity has to be rate regulated _i.e. the establishment of prices that can be changed to its customers for goods or services is subject to oversight and /or approved by an authorized body. The term 'regulatory deferral account balance ' has been chosen as a neutral descriptor for expense (income) or variance account that is included or is expected to be included by the rate regulator in establishing the rate(s) that can be charged to customers and would not otherwise be recognized as an asset or liability under other IFRSs. The standard is not likely to have any effect on company's financial statements.
51

52
The above amendments are effective from annual period beginning on or after 01 July 2019 and are not likely to have an impact on Company’s financial statements.
2.3 Accounting convention
These financial statements have been prepared under the historical cost convention except for the measurement of certain items of property, plant and equipment as referred to in note 7 at revalued amounts, recognition of lease liability and employee retirement benefits as referred to in note 9 and 10 at present value respectively.
2.4 Functional and presentation currency
These financial statements are presented in Pakistan Rupees which is the Company's functional currency and all financial information presented has been rounded off to the nearest rupees, except otherwise stated.
3 Use of estimates and judgements
The preparation of these financial statements in conformity with approved accounting standards requires management to make judgments, estimates and assumptions that affect the application of policies and reported amounts of assets, liabilities, income and expenses. The estimates and associated assumptions are based on historical experience and various other factors that are believed to be reasonable under circumstances, and the results of which form the basis for making judgment about carrying value of assets and liabilities that are not readily apparent from other sources. Actual results may differ from these estimates. The estimates and underlying assumptions are reviewed on an ongoing basis. Revisions to accounting estimates are recognized in the period in which estimates are revised if the revision affects only that period, or in the period of the revision and future periods if the revision affects both current and future periods.
The areas where assumptions and estimates are significant to the Company's financial statements or where judgment was exercised in application of accounting policies are as follows:
Property, plant and equipment
The management of the Company reassesses useful lives and residual value for each item of property, plant and equipment annually by considering expected pattern of economic benefits that the Company expects to derive from that item and the maximum period up to which such benefits are expected to be available. Any change in the estimates in future years might affect the carrying amounts of respective items of property, plant and equipment with a corresponding effect on the depreciation charge and impairment. Effect of change in useful life estimate of computer and IT equipments is explained in note 17.1.5.
Revaluation of property, plant and equipment
Revaluation of property, plant and equipment is carried out by independent professional valuers. Revalued amounts of non-depreciable items are determined by reference to local market values and that of depreciable items are determined by reference to present depreciated replacement values.
The frequency of revaluations depends upon the changes in fair values of the items of property, plant and equipment being revalued. When the fair value of a revalued asset differs materially from its carrying amount, a further revaluation is required. It may be necessary to revalue the item only every three to five years.
Stores and spare parts
The Company reviews the stores and spare parts for possible impairment on an annual basis. Any change in estimates in future years might affect the carrying amounts of respective items of stores and spares with a corresponding effect on provision.
Stock in trade
The Company reviews the carrying amount of stock-in-trade for possible impairment on a regular basis. Carrying amount of stock-in-trade is adjusted where the net realizable value is below the cost. Net realizable value signifies the estimated selling price in the ordinary course of business less estimated cost of completion and the estimated cost necessary to be incurred to make the sale.

53
Expected credit loss (ECL) / Loss allowance against trade debts, deposits, advances and other receivables
ECLs are based on the difference between the contractual cash flows due in accordance with the contract and all the cash flows that the Company expects to receive. The shortfall is then discounted at an approximation to the assets’ original effective interest rate.
The Company has elected to measure loss allowances for trade debts using IFRS 9 simplified approach and has calculated ECLs based on lifetime ECLs. The Company has established a provision matrix that is based on the Company's historical credit loss experience, adjusted for forward-looking factors specific to the debtors and the economic environment. When determining whether the credit risk of a financial asset has increased significantly since initial recognition and when estimating ECLs, the Company considers reasonable and supportable information that is relevant and available without undue cost or effort. This includes both quantitative and qualitative information and analysis, based on the Company's historical experience and informed credit assessment including forward-looking information.
The Company reviews the recoverability of its trade debts, deposits, advances and other receivables to assess amount of loss allowance required on an annual basis.
Impairment
The management of the Company reviews carrying amounts of its assets including cash generating units for possible impairment and makes formal estimates of recoverable amount if there is any such indication.
Provisions and Contingencies
The Company reviews the status of all pending litigations and claims against the Company (based on current legal and constructive obligations). Based on its judgment and the advice of the legal advisors for the estimated financial outcome, appropriate disclosure or provision is made. The actual outcome of these litigations and claims can have an effect on the carrying amounts of the liabilities recognized at the reporting date.
Taxation
The Company takes into account the current income tax law and decisions taken by the taxation authorities. Instances where the Company's views differ from the views taken by the income tax department at the assessment stage and where the Company considers that its view on items of material nature is in accordance with law, the amounts are shown as contingent liabilities.
Staff retirement benefits
The Company operates an accumulated compensated absences and unfunded defined benefit gratuity plan as explained in note 4.4.2 and 4.4.3 to these financial statements. The calculation of the benefit requires assumptions to be made of future outcomes, the principal ones being in respect of increase in remuneration and the discount rate used to convert future cash flows to current values. The assumptions used for the plan are determined by independent actuary.
Cost primarily represents actuarial present value of the obligation for benefits earned on employee service during the year and employee service in previous years. Calculations are sensitive to changes in the underlying assumptions.
4 Summary of significant accounting policies
The significant accounting policies set out below have been consistently applied to all periods presented in these financial statements, except as disclosed in note 4.1.
4.1 Changes in accounting policies
The Company has adopted IFRS 15 'Revenue from Contracts with Customers', IFRS 9 'Financial Instruments' and IFRS 16 'Leases' from 01 January 2019 which is effective from the annual periods beginning on or after 01 July 2018, periods ending on or after 30 June 2019 and periods beginning on or after 01 January 2019 respectively. Due to the transition methods chosen by the Company in applying these standards, comparative information throughout these financial statements has not been restated to reflect the requirements of the new standards. The details of new significant accounting policies adopted and the nature and effect of the changes from previous accounting policies are set out below:
54
4.1.1 IFRS 15 'Revenue from Contracts with Customers’
IFRS 15 establishes a comprehensive framework for determining whether, how much and when revenue is recognized. It replaced IAS 18 Revenue, IAS 11 Construction Contracts and related interpretations. Under IFRS 15, revenue is recognized when a customer obtains control of the goods or services. Determining the timing of the transfer of control at a point in time or over time requires judgment. The Company is engaged in processing and sale of toned milk, milk powder, fruit juices, allied dairy and food products. The contracts with customers for the sale of goods generally includes single performance obligation. Management has concluded that revenue from sale of goods be recognized at the point in time when control of the asset is transferred to the customer. The above is generally consistent with the timing and amounts of revenue the Company recognized in accordance with the previous standard, IAS 18. Therefore, the adoption of IFRS 15 which has replaced IAS 18 Revenue, IAS 11 Construction Contracts and related interpretations at 01 January 2019, did not have a material impact on the amounts of revenue recognized in the financial statements except for reclassification of the variable trade discount which is now to be set off against the sales. The corresponding figures have been represented to reflect this change on adoption of IFRS 15. Accordingly, selling and distribution expense of Rs. 376.62 million (31 December 2018: Rs. 444.84 million) has been reclassified to sales. This reclassification has no impact on the reported Loss per Share (LPS) of the corresponding year.
Upon adoption of IFRS 15 amounts received for future sale of goods were reclassified to 'contract liabilities'. Previously, these amounts were classified as "advances from customers”
Impact on financial statements
As at 01 January 2019, contract liabilities were increased by Rs. 89.00 million and advance from customers decreased by the same amount.
4.1.2 IFRS 9 Financial Instruments
IFRS 9 replaced the provisions of IAS 39 ' Financial Instruments: Recognition and Measurement' that relates to the recognition, classification and measurement of financial assets and financial liabilities, derecognition of financial instruments, impairment of financial assets and hedge accounting. The details of new significant accounting policies adopted and the nature and the effect of the changes to the previous accounting policies are set out below:
4.1.2.1 Classification and measurement of financial assets and financial liabilities
IFRS 9 largely retains the existing requirements in IAS 39 for the classification and measurement of financial liabilities. However, it eliminates the previous IAS 39 categories for the financial assets of held to maturity, loans and receivables and available for sale. Under IFRS 9, on initial recognition, the Company classifies its financial assets in the following measurement categories:
- Those to be measured subsequently at fair value either through Other Comprehensive Income ("FVOCI") or through statement of profit or loss ("FVTPL"); and
- Those to be measured at amortized cost.
The classification depends upon entity's business model for managing the financial assets and the contractual terms of the cash flows.
A financial asset is measured at amortized cost if it meets both of the following conditions and is not designated as at fair value through statement of profit or loss:
- It is held within the business model whose objective is to hold assets to collect contractual cash flows; and
- Its contractual terms give rise on specified dates to cash flows that are solely payments of principal and interest on principal amount outstanding.
Financial assets at amortized cost are subsequently measured using the effective interest rate method. Interest income, foreign exchange gains and losses and impairment are recognised in the statement of profit or loss. Any gain or loss on derecognition is recognised in the statement of profit or loss.
For assets measured at fair value, gains and losses will either be recorded in the statement of profit or loss or other comprehensive income. For investments in equity instruments that are not held for trading, this will depend on
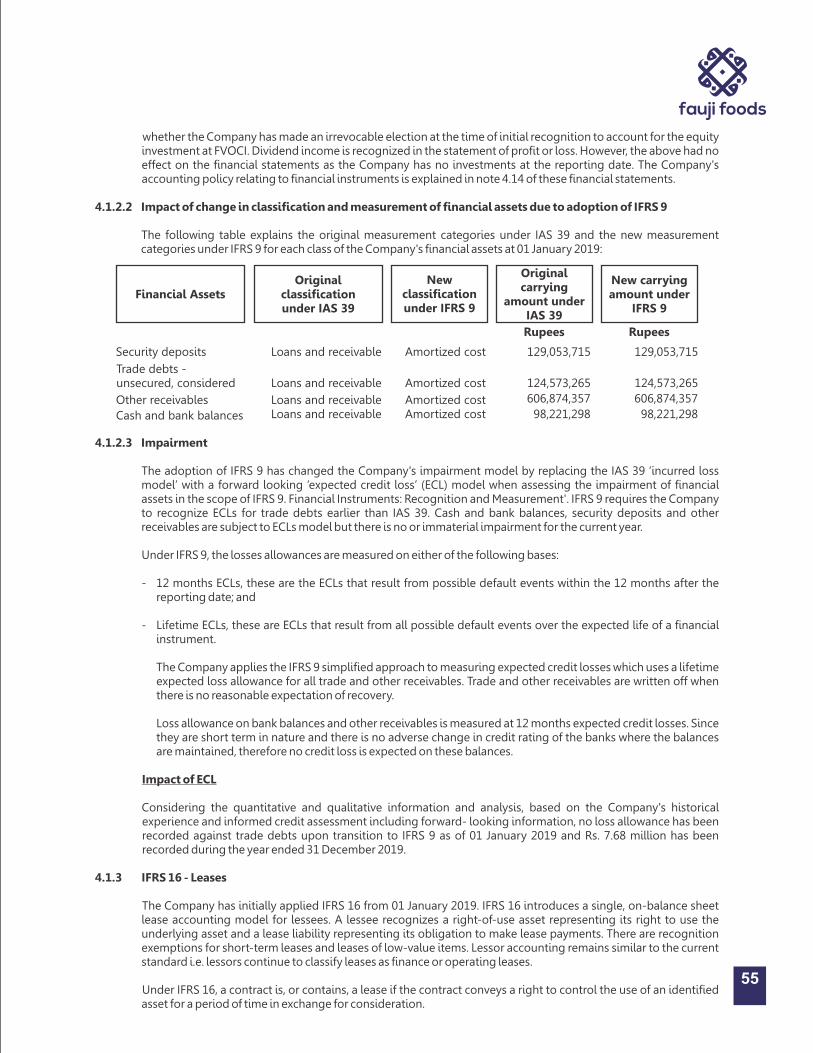
55
whether the Company has made an irrevocable election at the time of initial recognition to account for the equity investment at FVOCI. Dividend income is recognized in the statement of profit or loss. However, the above had no effect on the financial statements as the Company has no investments at the reporting date. The Company's accounting policy relating to financial instruments is explained in note 4.14 of these financial statements.
4.1.2.2 Impact of change in classification and measurement of financial assets due to adoption of IFRS 9
The following table explains the original measurement categories under IAS 39 and the new measurement categories under IFRS 9 for each class of the Company's financial assets at 01 January 2019:
Rupees Rupees
Security deposits Loans and receivable Amortized cost 129,053,715 129,053,715
Trade debts - unsecured, considered Loans and receivable Amortized cost 124,573,265 124,573,265
Other receivables Loans and receivable Amortized cost 606,874,357 606,874,357
Cash and bank balances Loans and receivable Amortized cost 98,221,298 98,221,298
Financial AssetsOriginal
classification under IAS 39
New classification under IFRS 9
Original carrying
amount under IAS 39
New carrying amount under
IFRS 9
4.1.2.3 Impairment
The adoption of IFRS 9 has changed the Company's impairment model by replacing the IAS 39 ‘incurred loss model’ with a forward looking ‘expected credit loss’ (ECL) model when assessing the impairment of financial assets in the scope of IFRS 9. Financial Instruments: Recognition and Measurement'. IFRS 9 requires the Company to recognize ECLs for trade debts earlier than IAS 39. Cash and bank balances, security deposits and other receivables are subject to ECLs model but there is no or immaterial impairment for the current year.
Under IFRS 9, the losses allowances are measured on either of the following bases:
- 12 months ECLs, these are the ECLs that result from possible default events within the 12 months after the reporting date; and
- Lifetime ECLs, these are ECLs that result from all possible default events over the expected life of a financial instrument.
The Company applies the IFRS 9 simplified approach to measuring expected credit losses which uses a lifetime expected loss allowance for all trade and other receivables. Trade and other receivables are written off when there is no reasonable expectation of recovery.
Loss allowance on bank balances and other receivables is measured at 12 months expected credit losses. Since they are short term in nature and there is no adverse change in credit rating of the banks where the balances are maintained, therefore no credit loss is expected on these balances.
Impact of ECL
Considering the quantitative and qualitative information and analysis, based on the Company's historical experience and informed credit assessment including forward- looking information, no loss allowance has been recorded against trade debts upon transition to IFRS 9 as of 01 January 2019 and Rs. 7.68 million has been recorded during the year ended 31 December 2019.
4.1.3 IFRS 16 - Leases
The Company has initially applied IFRS 16 from 01 January 2019. IFRS 16 introduces a single, on-balance sheet lease accounting model for lessees. A lessee recognizes a right-of-use asset representing its right to use the underlying asset and a lease liability representing its obligation to make lease payments. There are recognition exemptions for short-term leases and leases of low-value items. Lessor accounting remains similar to the current standard i.e. lessors continue to classify leases as finance or operating leases.
Under IFRS 16, a contract is, or contains, a lease if the contract conveys a right to control the use of an identified asset for a period of time in exchange for consideration.

56
On transition to IFRS 16, the Company elected to apply practical expedient to grandfather the assessment of which transactions are leases. The Company applied IFRS 16 only to contracts that were previously identified as leases. Contracts that were not identified as leases under IAS 17 and IFRIC 4 were not reassessed for whether there is a lease under IFRS 16. Therefore, the definition of a lease under IFRS 16 was applied only to contracts entered into or changed on or after 01 January 2019.
As a lessee
As a lessee, the Company previously classified leases as operating or finance leases based on its assessment of whether the lease transferred substantially all of the risks and rewards of ownership. Under IFRS 16, the Company recognizes right of use assets and lease liabilities for material leases i.e. these leases are on balance sheet.
The Company presents right-of-use assets in ‘property, plant and equipment’, the same line item as it presents underlying assets of the same nature that it owns.
The Company has presented non-current and current portion of related lease liabilities in the statement of financial position considering their due dates for payment.
At commencement or on modification of a contract that contains a lease component, the Company allocates the consideration in the contract to each lease component on the basis of its relative value. The Company has elected not to recognize right of use assets and liabilities for some leases of low value assets (milk collection centers/sales offices). The Company recognizes the lease payments associated with these leases as an expense on a straight line basis over the lease term. The Company's accounting policy relating to leases is explained in note 4.3 of these financial statements.
Transition
The Company used the following practical expedients when applying IFRS 16 to leases previously classified as operating leases under IAS 17.
- did not recognize right-of-use assets and liabilities for leases for which the lease term ends within 12 months of the date of initial application;
- did not recognize right-of-use assets and liabilities for leases of low value items;
- Excluded initial direct costs from measuring the right-of-use asset at the date of initial application; and
- Used hindsight when determining the lease term.
The Company leases a number of vehicles and machinery. These leases were classified as finance leases under IAS 17. For these finance leases, the carrying amount of the right of use asset and the lease liability at 01 January 2019 were determined at the carrying of the lease asset and lease liability under IAS 17 immediately before that date.
Impact of financial statements
The Company has applied IFRS 16 using the modified retrospective approach. However none of the leases prior to 01 January 2019 have been considered as significant for the purpose of application of IFRS 16 and accordingly the application of IFRS 16 has no impact on the opening retained earnings as at 01 January 2019. The comparative information presented for 2018 is not restated i.e. it is presented as previously reported under IAS 17 and related interpretations.
The Company has entered into a new lease agreement for office with effect from 01 June 2019. Accordingly, right of use asset of Rs. 133.69 million and lease liability of Rs. 131.37 million has been recognized as at 01 June 2019 at an incremental borrowing rate of 13.59% per annum.
Also in relation to those leases under IFRS 16, the Company has recognized depreciation and interest costs, instead of operating lease expense. During the year ended 31 December 2019, the Company recognized Rs. 15.6 million of depreciation charges and Rs. 8.31 million of interest costs from this lease.
4.2 Taxation
Current
Provision for current tax is based on the taxable income for the year determined in accordance with the prevailing law for taxation of income. The charge for current tax is calculated using prevailing tax rates or tax rates expected to apply

57
to the profit for the year if enacted, after taking into account tax credits, rebates and exemptions, if any. The charge for current tax also includes adjustments, where considered necessary, to provision for tax made in previous years arising from assessments framed during the year for such years.
Deferred
Deferred tax is accounted for using the balance sheet method in respect of all temporary differences arising from differences between the carrying amount of assets and liabilities in the financial statements and the corresponding tax bases used in the computation of the taxable profit. However, deferred tax is not accounted for if it arises from initial recognition of an asset or liability in a transaction other than a business combination that at the time of transaction neither affects accounting nor taxable profit or loss. Deferred tax liabilities are generally recognized for all taxable temporary differences and deferred tax assets are recognized to the extent that it is probable that taxable profits will be available against which the deductible temporary differences, unused tax losses and tax credits can be utilized. The carrying amount of all deferred tax assets is reviewed at each reporting date and reduced to the extent that it is no longer probable that sufficient taxable profits will be available to allow all or part of the deferred tax assets to be utilized.
Deferred tax is calculated at the rates that are expected to apply to the period when the differences reverse based on tax rates (and tax laws) that have been enacted or substantively enacted at the reporting date. Deferred tax is charged or credited in the statement of profit or loss, except in the case of items credited or charged to other comprehensive income or equity in which case it is included in other comprehensive income or equity.
4.3 Leases
At the inception of a contract, the Company assesses whether a contract is or contains lease. A contract is, or contains, a lease if the contract conveys a right to control the use of an identified asset for a period of time in exchange for consideration. To assess whether a contract conveys the right to control the use of an identified asset, the Company uses the definition of a lease in IFRS 16.
The Company recognizes a right of use asset and a lease liability at the lease commencement date. The right of use asset is initially measured at cost which comprises the initial amount of the lease liability adjusted for any lease payments made at or before the commencement date plus any initial direct cost incurred less any lease incentive received. The right of use asset is subsequently measured at cost less accumulated depreciation and impairment losses, and adjusted for certain re-measurements of the lease liability, if any. The right of use assets is depreciated using the straight line method from the commencement date to the end of the lease term, unless the lease transfers ownership of the underlying asset to the Company by the end of the lease term or cost of the right of use asset reflects that the Company will exercise a purchase option. In that case the right of use asset will be depreciated over the useful life of the underlying asset, which is determined on the same basis as those of property, plant and equipment. Right of use asset is disclosed in the property, plant and equipment as referred to note 17.1 of the financial statements.
The lease liability is initially measured at the present value of the lease payments that are not paid at the commencement date, discounted using the interest rate implicit in the lease or if that rate cannot be readily determined, the Company’s incremental borrowing rate. The Company has used it incremental borrowing rate as the discount rate for leases where rate is not readily available. The lease liability is subsequently increased by the interest cost on the lease liability and decreased by lease payment made.
The lease liability is measured at amortized cost using the effective interest method. It is re-measured when there is a change in future lease payments arising from a change in rate or a change in the terms of the lease arrangement, if there is change in the Company’s estimate of the amount expected to be payable under a residual value guarantee, if the Company changes its assessment of whether it will exercise a purchase, extension or termination option or if there is a revised in-substance fixed lease payment. When the lease liability is re-measured in this way, a corresponding adjustment is made to the carrying amount of the right of use asset, or is recorded in statement of profit or loss if the carrying amount of the right of use asset has been reduced to zero. Refer note 9 to these financial statements for disclosure of lease liability.
Short term leases and leases of low value assets
The Company has elected not to recognize right of use assets and liabilities for some leases of low value assets (milk collection centers/sales offices). The Company recognizes the lease payments associated with these leases as an expense on a straight line basis over the lease term.

58
4.4 Employees' retirement benefits
4.4.1 Defined contribution plan Provident fund
The Company is operating an approved provident fund scheme for all its employees since 01 May 1986. Equal monthly contributions are made by the employer and the employee to the fund in accordance with the fund rules at the rate of 10% of basic salary.
4.4.2 Other long term benefits - accumulated compensated absences
The Company provides for compensated absences for all eligible employees in accordance with the rules of the Company. The Company accounts for these benefits in the year in which the absences are earned. Retired army officers and other employees are entitled to earned leaves of 30 days and 20 days per annum respectively.
The unutilized leaves of ex-servicemen and other employees are accumulated subject to a maximum of 120 days and 60 days respectively. The unutilized accumulated leaves can be enchased at the time the employee leaves Company service. The accumulated leave balance in excess of 120 days and 60 days for ex-servicemen and other employees respectively is ignored while determining benefit obligations.
The Company uses the actuarial valuations carried out using the projected unit credit method for valuation of its accumulated compensating absences. The latest valuation was carried out on 31 December 2019. Provisions are made annually to cover the obligation for accumulating compensated absences based on actuarial valuation and are charged to the statement of profit or loss. The amount recognized in the statement of financial position represents the present value of the defined benefit obligations. Actuarial gains and losses are charged to the statement of profit or loss immediately in the period when these occur.
4.4.3 Defined benefit plan
The Company operates an unfunded defined benefit gratuity plan for all permanent employees, having a service period of more than three years for retired army officers and more than five years for other employees. The Company recognizes expense in accordance with IAS 19 "Employee Benefits".
The Company's net obligation in respect of defined benefit plans is calculated by estimating the amount of future benefit that employees have earned in the current and prior periods and discounting that amount. The calculation of defined benefit obligations is performed by a qualified actuary using the projected unit credit method. The latest valuation was carried out on 31 December 2019.
Remeasurements of the net defined benefit liability, which comprise actuarial gains and losses, are recognized immediately in other comprehensive income. The Company determines the net interest expense on the net defined benefit liability for the period by applying the discount rate used to measure the defined benefit obligation at the beginning of the annual period to the then net defined benefit liability, taking into account any changes in the net defined benefit liability during the period as a result of contributions and benefit payments. Net interest expense and other expenses related to defined benefit plan are recognized in the statement of profit or loss. Past service costs are immediately recognized in statement of profit or loss.
4.5 Trade and other payables
Trade and other payables are obligations to pay for goods and services that have been acquired in the ordinary course of business from suppliers. Account balances are classified as current liabilities if payment is due within one year or less (or in the normal operating cycles of business if longer). If not, they are classified as non-current liabilities.
Trade and other payables are recognized initially at fair value and subsequently measured at amortized cost using the effective interest method. Exchange gains and losses arising on translation in respect of liabilities in foreign currency are added to the carrying amount of the respective liabilities.
4.6 Provisions
Provisions are recognized when the Company has a present legal or constructive obligation as a result of past events, it is probable, will result in an outflow of resources embodying economic benefits, to settle the obligation
59
and a reliable estimate of the amount can be made. Provisions are reviewed at each reporting date and adjusted to reflect the current best estimate.
4.7 Contingent liabilities
A contingent liability is disclosed when:
- there is a possible obligation that arises from past events and whose existence will be confirmed only by the occurrence or non-occurrence of one or more uncertain future events not wholly within the control of the Company; or
- there is present obligation that arises from past events but it is not probable that an outflow of resources embodying economic benefits will be required to settle the obligation or the amount of the obligation cannot be measured with sufficient reliability.
4.8 Borrowings
Loans and borrowings are classified as financial liabilities at amortized cost. Borrowings are recognized initially at fair value, net of transaction costs incurred and are subsequently measured at amortized cost using the effective interest rate method. Borrowings are classified as current liabilities unless the Company has an unconditional / contractual right to defer settlement of the liability for at least twelve months after the reporting date. Finance cost are accounted for on an accrual basis and are included in accrued finance cost to the extent of the remaining amount unpaid.
4.9 Borrowing costs
General and specific borrowing costs directly attributable to the acquisition, construction or production of qualifying assets, which are assets that necessarily take a substantial period of time to get ready for their intended use or sale, are added to the cost of those assets, until such time as the assets are substantially ready for their intended use or sale. All other borrowing costs are recognized in statement of profit or loss in the period in which they are incurred.
4.10 Property, plant and equipment
Property, plant and equipment except for freehold land, buildings on freehold land, plant and machinery, electric and gas installations, milk churns and other work equipment are stated at cost less accumulated depreciation and identified impairment loss. Freehold land is stated at revalued amount carried out by independent valuers by reference to its current market price less any identified impairment loss. Buildings on freehold land, plant and machinery, electric and gas installations, milk churns and other work equipment are stated at revalued amount carried out by independent valuers by reference to current market price less accumulated depreciation and any identified impairment loss. Cost in relation to property, plant and equipment comprises acquisition and other directly attributable costs.
Surplus on revaluation is booked by restating gross carrying amounts of respective assets being revalued, proportionately to the change in their carrying amounts due to revaluation. The accumulated depreciation at the date of revaluation is also adjusted to equal difference between gross carrying amounts and the carrying amounts of the assets after taking into account accumulated impairment losses.
Increase in the carrying amount arising on revaluation of property, plant and equipment is recognized in other comprehensive income and accumulated in equity under the heading of revaluation surplus. Each year the difference between depreciation based on the revalued carrying amount of the asset charged to the statement of profit or loss, and depreciation based on the asset’s original cost is transferred to retained earnings. Upon disposal, any revaluation reserve relating to the particular assets being sold is transferred to retained earnings. All transfers to / from surplus on revaluation of property, plant and equipment are net of applicable deferred tax.
Depreciation on all property, plant and equipment, except freehold land, is charged to statement of profit or loss on the reducing balance method so as to write-off the depreciable amount of an asset over its remaining estimated useful life after taking into account the impact of their residual value, if considered significant. The assets' residual values and useful lives are reviewed at each financial year-end and adjusted if impact on depreciation is significant.

60
Useful lives are determined by the management based on expected usage of assets, expected physical wear and tear, technical and commercial obsolescence, legal and similar limits on the use of the assets and other similar factors.
Depreciation on additions to property, plant and equipment is charged from the month in which an asset is acquired or capitalized while no depreciation is charged for the month in which the asset is disposed-off.
Subsequent costs are included in the asset's carrying amount or recognized as a separate asset, as appropriate, only when it is probable that future economic benefits associated with the item will flow to the Company and the cost of the item can be measured reliably. All other repairs and maintenance are charged to statement of profit or loss during the year in which these are incurred.
The gain or loss on disposal or retirement of an asset represented by the difference between the sale proceeds and the carrying amount of the asset is recognized as an income or expense.
The Company assesses at each reporting date whether there is any indication that property, plant and equipment may be impaired. If such indication exists, the carrying amount of such assets are reviewed to assess whether they are recorded in excess of their recoverable amount. Where carrying values exceed the respective recoverable amount, assets are written down to their recoverable amounts and the resulting impairment is recognized in statement of profit or loss. The recoverable amount is the higher of an asset's fair value less cost to sell and value in use. Where an impairment loss is recognized, the depreciation charge is adjusted in the future periods to allocate the asset's revised carrying amount over its estimated useful life.
Capital work-in-progress
Capital work-in-progress is stated at cost less identified impairment loss, if any. It consists of all expenditures and advances connected with specific assets incurred and made during installations and construction period. These are transferred to relevant property, plant and equipment as and when assets are available for use.
4.11 Intangible assets
Expenditure incurred on intangible asset is capitalized and stated at cost less accumulated amortization and any identified impairment loss. Intangible assets with finite useful life are amortized using the straight-line method over the estimated useful life of three years. Amortization of intangible assets is commenced from the date an asset is capitalized.
4.12 Stores, spares and loose tools
Usable stores, spares and loose tools are valued principally at moving average cost, while items considered obsolete are impaired. Items in transit are stated at cost comprising invoice value plus other charges paid thereon up to the reporting date. The Company reviews the carrying amount of stores, spares and loose tools on a regular basis and provision is made for obsolescence, if there is any change in usage pattern and physical form of related stores.
4.13 Stock-in-trade
Stock of raw and packing materials, work-in-process and finished goods, except for those in transit, are valued principally at the lower of average cost and net realizable value. Cost in relation to raw and packing materials is measured at moving average cost. Work-in-process and finished goods are measured at weighted average cost and cost comprises direct materials, labour and appropriate proportion of manufacturing overheads.
Stock in transit is stated at invoice value plus other charges incurred thereon up to the reporting date. Net realizable value signifies the estimated selling price in the ordinary course of business less estimated cost of completion and the estimated cost necessary to be incurred to make the sale.
4.14 Financial instruments
4.14.1 Recognition and initial measurement
All financial assets and financial liabilities are initially recognized when the Company becomes a party to the contractual provisions of the instruments.
A financial asset (unless it is a trade receivable without a significant financing component) or financial liability is initially measured at fair value plus, for an item not at FVTPL, transaction costs that are directly attributable to its acquisition or issue. A trade receivable without a significant financing component is initially measured at the transaction price.
61
4.14.2 Classification and subsequent measurement
Financial assets
On initial recognition, a financial asset is classified as measured at amortized cost, fair value through other comprehensive income (FVOCI), fair value through statement of profit or loss (FVTPL) and in case of an equity instrument it is classified as FVOCI or FVTPL.
Financial assets are not reclassified subsequent to their initial recognition unless the Company changes its business model for managing financial assets in which case all affected financial assets are reclassified on the first day of the first reporting period following the change in the business model.
Amortized cost
A financial asset is measured at amortized cost if it meets both of the following conditions and is not designated as at FVTPL:
- it is held within a business model whose objective is to hold assets to collect contractual cash flows; and
- its contractual terms give rise on specified dates to cash flows that are solely payments of principal and interest on the principal amount outstanding.
These assets are subsequently measured at amortized cost using the effective interest method. The amortized cost is reduced by impairment losses. Interest income, foreign exchange gains and losses and impairment are recognized in statement of profit or loss. Any gain or loss on derecognition is recognized in statement of profit or loss.
Financial assets measured at amortized cost comprise of cash and bank balances, deposits, trade debts and other receivables.
Debt Instrument - FVOCI
A debt investment is measured at FVOCI if it meets both of the following conditions and is not designated as at FVTPL:
- it is held within a business model whose objective is achieved by both collecting contractual cash flows and selling financial assets; and
- its contractual terms give rise on specified dates to cash flows that are solely payments of principal and interest on the principal amount outstanding.
These assets are subsequently measured at fair value. Interest income calculated using the effective interest method, foreign exchange gains and losses and impairment are recognized in statement of profit or loss. Other net gains and losses are recognized in OCI. On derecognition, gains and losses accumulated in OCI are reclassified to statement of profit or loss. However, the Company has no such instrument at the reporting date.
Equity Instrument - FVOCI
On initial recognition of an equity investment that is not held for trading, the Company may irrevocably elect to present subsequent changes in the investment’s fair value in OCI. This election is made on an investment-by-investment basis.
These assets are subsequently measured at fair value. Dividends are recognized as income in statement of profit or loss unless the dividend clearly represents a recovery of part of the cost of the investment. Other net gains and losses are recognized in OCI and these investments are never reclassified to statement of profit or loss. However, the Company has no such instrument at the reporting date.
Fair value through statement of profit or loss (FVTPL)
All financial assets not classified as measured at amortized cost or FVOCI as described above are measured at FVTPL.
On initial recognition, the Company may irrevocably designate a financial asset that otherwise meets the requirements to be measured at amortized cost or at FVOCI as at FVTPL if doing so eliminates or significantly reduces an accounting mismatch that would otherwise arise.
These assets are subsequently measured at fair value. Net gains and losses, including any interest or dividend income, are recognized in statement of profit or loss. The Company has no such investments at the reporting date.

62
Financial assets – Business model assessment
For the purposes of the assessment, ‘principal’ is defined as the fair value of the financial asset on initial recognition. ‘Interest’ is defined as consideration for the time value of money and for the credit risk associated with the principal amount outstanding during a particular period of time and for other basic lending risks and costs (e.g. liquidity risk and administrative costs), as well as a profit margin.
In assessing whether the contractual cash flows are solely payments of principal and interest, the Company considers the contractual terms of the instrument. This includes assessing whether the financial asset contains a contractual term that could change the timing or amount of contractual cash flows such that it would not meet this condition. In making this assessment, the Company considers:
- contingent events that would change the amount or timing of cash flows;
- terms that may adjust the contractual coupon rate, including variable-rate features;
- prepayment and extension features; and
- terms that limit the Company’s claim to cash flows from specified assets (e.g. non-recourse features).
Financial liabilities
Financial liabilities are classified as measured at amortized cost or FVTPL. A financial liability is classified as at FVTPL if it is classified as held-for-trading, it is a derivative or it is designated as such on initial recognition. Financial liabilities at FVTPL are measured at fair value and net gains and losses, including any interest expense, are recognized in statement of profit or loss. Other financial liabilities are subsequently measured at amortized cost using the effective interest method, while the interest expense and foreign exchange gains and losses are recognized in statement of profit or loss. Any gain or loss on derecognition is also recognized in statement of profit or loss.
The Company's financial liabilities comprise trade and other payables, long and short term borrowings, loan from the Parent Company, accrued markup and dividend payable.
4.14.3 Derecognition
Financial assets
The Company derecognizes a financial asset when the contractual rights to the cash flows from the financial asset expire, or it transfers the rights to receive the contractual cash flows in a transaction in which substantially all of the risks and rewards of ownership of the financial asset are transferred or in which the Company neither transfers nor retains substantially all of the risks and rewards of ownership and it does not retain control of the financial asset.
The Company might enter into transactions whereby it transfers assets recognized in its statement of financial position, but retains either all or substantially all of the risks and rewards of the transferred assets. In these cases, the transferred assets are not derecognized.
Financial liabilities
The Company derecognizes a financial liability when its contractual obligations are discharged or cancelled, or expire. The Company also derecognizes a financial liability when its terms are modified and the cash flows of the modified liability are substantially different, in which case a new financial liability based on the modified terms is recognized at fair value. On derecognition of a financial liability, the difference between the carrying amount extinguished and the consideration paid (including any non-cash assets transferred or liabilities assumed) is recognized in statement of profit or loss.
4.14.4 Offsetting of financial instruments
Financial assets and financial liabilities are offset and the net amount is reported in the statement of financial position only when the Company has a legally enforceable right to set off the recognized amounts and intends to either settle on a net basis or realize the asset and settle the liability simultaneously.

63
4.14.5 Impairment
Financial assets
The Company recognizes loss allowances for ECLs on:
- financial assets measured at amortized cost;
- debt investments measured at FVOCI; and
- contract assets.The Company measures loss allowances at an amount equal to lifetime ECLs, except for the following, which are measured at 12-month ECLs:
- debt securities that are determined to have low credit risk at the reporting date; and
- other debt securities, bank balances and other receivables for which credit risk (i.e. the risk of default occurring over the expected life of the financial instrument) has not increased significantly since initial recognition.
12-month ECLs are the portion of ECLs that result from default events that are possible within the 12 months after the reporting date (or a shorter period if the expected life of the instrument is less than 12 months).
When determining whether the credit risk of a financial asset has increased significantly since initial recognition and when estimating ECL, the Company considers reasonable and supportable information that is relevant and available without undue cost or effort. This includes both quantitative and qualitative information and analysis, based on the Company’s historical experience and informed credit assessment and including forward-looking information.
The Company assumes that the credit risk on a financial asset has increased significantly if it is more than past due for a reasonable period of time. Loss allowances for trade receivables and contract assets are always measured at an amount equal to lifetime ECLs. Lifetime ECLs are the ECLs that result from all possible default events over the expected life of a financial instrument. 12-month ECLs are the portion of ECLs that result from default events that are possible within the 12 months after the reporting date (or a shorter period if the expected life of the instrument is less than 12 months). The maximum period considered when estimating ECLs is the maximum contractual period over which the Company is exposed to credit risk.
Loss allowances for financial assets measured at amortized cost are deducted from the gross carrying amount of the assets.
The gross carrying amount of a financial asset is written off when the Company has no reasonable expectations of recovering of a financial asset in its entirety or a portion thereof. The Company individually makes an assessment with respect to the timing and amount of write-off based on whether there is a reasonable expectation of recovery. The Company expects no significant recovery from the amount written off. However, financial assets that are written off could still be subject to enforcement activities in order to comply with the Company's procedures for recovery of amounts due.
Non - Financial assets
The carrying amount of the Company’s non-financial assets, other than inventories and deferred tax assets are reviewed at each reporting date to determine whether there is any indication of impairment. If any such indication exists, then the asset’s recoverable amount is estimated. The recoverable amount of an asset or cash generating unit is the greater of its value in use and its fair value less cost to sell. In assessing value in use, the estimated future cash flows are discounted to their present values using a pre-tax discount rate that reflects current market assessments of the time value of money and the risks specific to the asset or cash generating unit.
An impairment loss is recognized if the carrying amount of the assets or its cash generating unit exceeds its estimated recoverable amount. Impairment losses are recognized in statement of profit or loss. Impairment losses recognized in respect of cash generating units are allocated to reduce the carrying amounts of the assets in a unit on a pro rata basis. Impairment losses recognized in prior periods are assessed at each reporting date for any indications that the loss has decreased or no longer exists. An impairment loss is reversed if there has been a change in the estimates used to determine the recoverable amount.
64
An impairment loss is reversed only to that extent that the asset’s carrying amount after the reversal does not exceed the carrying amount that would have been determined, net of depreciation and amortization, if no impairment loss had been recognized.
4.15 Cash and cash equivalents
Cash and cash equivalents are carried in the statement of financial position at cost. For the purpose of cash flow statement, cash and cash equivalents comprise of cash in hand, balances at banks and outstanding balance of short term running finances.
4.16 Foreign currency transactions and translation
All monetary assets and liabilities in foreign currencies are translated into Pak Rupees using the exchange rate at the reporting date. Exchange gains and losses resulting from the settlement of such transactions and from the translations at the year end exchange rates of monetary assets and liabilities denominated in foreign currencies are taken to statement of profit or loss. Non-monetary assets and liabilities denominated in foreign currency that are measured in terms of historical cost are translated using the exchange rates as at the dates of the initial transactions. Non-monetary assets and liabilities denominated in foreign currency that are measured at fair value are translated using the exchange rates at the date when the fair value was determined.
4.17 Revenue recognition
Revenue represents the fair value of consideration received or receivable for sale of goods, net of sales tax, sales returns and related discounts and commissions. Revenue is recognized when or as performance obligation is satisfied by transferring control of promised goods or services to a customer and control either transfers overtime or point in time.
Return on bank deposits is accrued on a time proportion basis by reference to the principal outstanding and the applicable rate of return.
4.18 Contract liabilities
A contract liability is the obligation of the Company to transfer goods or services to a customer for which the Company has received consideration (or an amount of consideration is due) from the customer. If a customer pays consideration before the Company transfers goods or services to the customer, a contract liability is recognized when the payment is made or the payment is due (whichever is earlier). Contract liabilities are recognized as revenue when the Company performs under the contract. It also includes refund liabilities arising out of customers‘ right to claim amounts from the Company on account of contractual delays in delivery of performance obligations and incentive on target achievements.
4.19 Segment reporting
Operating segments are reported in a manner consistent with the internal reporting provided to the chief operating decision maker. The chief operating decision maker, who is responsible for allocating resources and assessing performance of the operating segments, has been identified as the Board of Directors of the Company that makes strategic decisions. On the basis of its internal reporting structure, the Company considers itself to be a single reportable segment. All non-current assets of the Company are located in Pakistan and 100% of the revenue is derived from sale of dairy and allied products.
4.20 Dividends and appropriations to reserves
Dividends and appropriations to reserves are recognized in the financial statements in the period in which these are approved.
4.21 Share capital
Ordinary shares are classified as equity. Incremental costs directly attributable to the issue of ordinary shares are recognized as a deduction from equity, net of any tax effects.

65
2019 2018
5.3 Ordinary shares of the Company held by associated undertakings and directors at year end are as follows:
2018
Rupees Rupees
20195 Share capital
5.1 Authorized capital
- - (Number of shares) - -
7,000,000,000700,000,000 7,000,000,000Shares of Rs. 10 each 700,000,000
5.2 Issued, subscribed and paid up capital
2019 20182019 2018
267,314,886
67,371,916
21,368,165
8,560,700
21,606,000
6,421,500
392,643,167
267,314,886
67,371,916
91
-
14,306,000
10,400,500
359,393,393
5.4 The holders of voting ordinary shares are entitled to receive dividends as declared (if any), and are entitled to one vote per share at meetings of the Company.
Ordinary share capital - - - - Percentage held - - - - - - - - Number of shares - - - -
Fauji Fertilizer Bin Qasim Limited
- voting ordinary shares 50.59% 50.59%
Fauji Foundation
- voting ordinary shares 12.75% 12.75%
Directors, Chief Executive, officers and
their spouse and minor children
- voting ordinary shares 0.00% 4.04%
Employees' provident fund
- voting ordinary shares 0.00% 1.62%
FFBL provident fund
- voting ordinary shares 2.71% 4.09%
FFBL' gratuity fund
- voting ordinary shares 1.97% 1.22%
5,039,341,660
26,392,000
146,338,260
72,000,000
503,934,166
2,639,200
14,633,826
7,200,000
528,407,192
5,039,341,660
26,392,000
146,338,260
72,000,000
5,284,071,920
Ordinary share capital
503,934,166
2,639,200
14,633,826
7,200,000
528,407,192 5,284,071,920
Ordinary shares of Rs 10 each
issued as fully paid bonus shares
Ordinary shares of Rs 10 each
issued as fully paid on
conversion of loans
Voting ordinary shares of Rs.10
each issued on conversion of
12% cumulative convertible
preference shares
Ordinary shares of Rs.10 each
fully paid in cash

66
6 Share premium
This reserve can only be utilized by the Company for the purpose specified in Section 81(2) of the Companies Act, 2017.
7.1 The Company revalued its freehold land, buildings on freehold land, plant and machinery, electric and gas installations and other works equipment during the financial years 1999, 2011, 2015 and 2017. The latest revaluation was conducted by K.G Traders (independent valuers and consultants). Freehold land was revalued on the basis of current market value whereas other assets were revalued on the basis of depreciated market values. The most significant input into this valuation approach is price per acre for land, price per square foot for buildings and present operational condition and age of plant and machinery and other assets.
7 Surplus on revaluation of property, plant and
equipment - net of tax
Revaluation surplus as at 01 January
Surplus transferred to accumulated losses on account of:
- disposal of plant and machinery - net of deferred tax
-
Related deferred tax liability
- disposal of plant and machinery
- incremental depreciation charged during the year
Revaluation surplus as at 31 December
Less: Related deferred tax liability on revaluation
surplus at 01 January
Reduction in deferred tax liability due to:
- disposal of plant and machinery
- incremental depreciation charged during the year
- tax rate adjustment
Deferred tax liability on revaluation surplus as at 31 December
incremental depreciation charged during the year - net
of deferred tax
Revaluation surplus as at 31 December - net of tax
2019 2018
Rupees Rupees
1,689,193,958
1,804,306,912
(5,774,191)
-
(73,557,177) (81,730,197)
(2,358,473)
-
(30,044,482) (33,382,757)
(111,734,323)
(115,112,954)
1,577,459,635
1,689,193,958
264,816,197
345,338,860
(2,358,473) -
(30,044,482) (33,382,757)
35,628,612
(47,139,906)
3,225,657 (80,522,663)
268,041,854 264,816,197
1,309,417,781 1,424,377,761
8 Long term finances - secured
Long term loans
Current maturity presented under current liabilities
2019 2018
Note Rupees Rupees
8.1
11
4,316,666,667
(1,608,333,334)
2,708,333,333
4,450,000,000
(258,333,333)
4,191,666,667
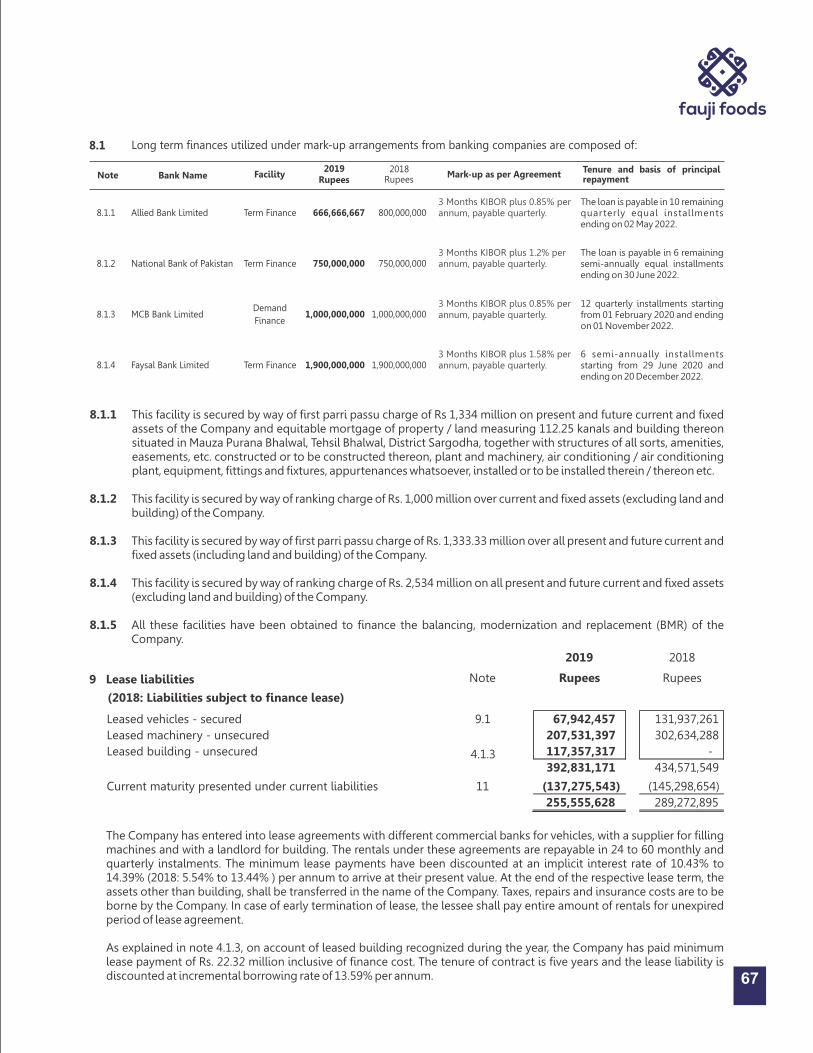
8.1 Long term finances utilized under mark-up arrangements from banking companies are composed of:
Facility2019
Rupees2018
RupeesBank Name Mark-up as per AgreementNote
8.1.1
8.1.2
8.1.3
8.1.4
Allied Bank Limited
National Bank of Pakistan
MCB Bank Limited
Faysal Bank Limited
Term Finance
Term Finance
Demand
Finance
Term Finance
666,666,667
750,000,000
1,000,000,000
1,900,000,000
800,000,000
750,000,000
1,000,000,000
1,900,000,000
Tenure and basis of principalrepayment
The loan is payable in 10 remaining quarterly equal installments ending on 02 May 2022.
The loan is payable in 6 remaining semi-annually equal installments ending on 30 June 2022.
12 quarterly installments starting from 01 February 2020 and ending on 01 November 2022.
6 semi-annually installments starting from 29 June 2020 and ending on 20 December 2022.
9 Lease liabilities
(2018: Liabilities subject to finance lease)
Leased vehicles - secured
Leased machinery - unsecured
Leased building - unsecured
Current maturity presented under current liabilities
2019 2018
Note Rupees Rupees
9.1 67,942,457 131,937,261
207,531,397 302,634,288
117,357,317 -
392,831,171 434,571,549
11
4.1.3
(137,275,543) (145,298,654)
255,555,628 289,272,895
67
8.1.1 This facility is secured by way of first parri passu charge of Rs 1,334 million on present and future current and fixed assets of the Company and equitable mortgage of property / land measuring 112.25 kanals and building thereon situated in Mauza Purana Bhalwal, Tehsil Bhalwal, District Sargodha, together with structures of all sorts, amenities, easements, etc. constructed or to be constructed thereon, plant and machinery, air conditioning / air conditioning plant, equipment, fittings and fixtures, appurtenances whatsoever, installed or to be installed therein / thereon etc.
8.1.2 This facility is secured by way of ranking charge of Rs. 1,000 million over current and fixed assets (excluding land and building) of the Company.
8.1.3 This facility is secured by way of first parri passu charge of Rs. 1,333.33 million over all present and future current and fixed assets (including land and building) of the Company.
8.1.4 This facility is secured by way of ranking charge of Rs. 2,534 million on all present and future current and fixed assets (excluding land and building) of the Company.
8.1.5 All these facilities have been obtained to finance the balancing, modernization and replacement (BMR) of the Company.
The Company has entered into lease agreements with different commercial banks for vehicles, with a supplier for filling machines and with a landlord for building. The rentals under these agreements are repayable in 24 to 60 monthly and quarterly instalments. The minimum lease payments have been discounted at an implicit interest rate of 10.43% to 14.39% (2018: 5.54% to 13.44% ) per annum to arrive at their present value. At the end of the respective lease term, the assets other than building, shall be transferred in the name of the Company. Taxes, repairs and insurance costs are to be borne by the Company. In case of early termination of lease, the lessee shall pay entire amount of rentals for unexpired period of lease agreement.
As explained in note 4.1.3, on account of leased building recognized during the year, the Company has paid minimum lease payment of Rs. 22.32 million inclusive of finance cost. The tenure of contract is five years and the lease liability is discounted at incremental borrowing rate of 13.59% per annum.

10.1.1
10.1 Movement in accumulated compensated absences
Balance as at 01 January
Charge to statement of profit or loss
Benefits paid during the year
Balance as at 31 December
10.1.1 Charge to the statement of profit or loss
31,608,489
15,683,893
(20,532,000)
26,760,382
23,243,262
10,698,671
(2,333,444)
31,608,489
Current service cost
Interest on defined benefit liability
Remeasurement loss
3,865,074
15,683,893
9,453,429
883,062
362,180
10,698,671
10,404,879
1,413,940
68
a) Leased vehicles - secured
Note ---------------Rupees-------------- ---------------Rupees--------------
Up to
one year
From one to five
years Total
2019
Up to
one year
From one to five
years Total
2018
57,584,327
50,587,998
39,089,162
37,538,309
96,673,489
88,126,307
61,292,013
50,195,761
115,595,094
107,883,200
176,887,107
158,078,961
(5,330,650) (14,853,200) (20,183,850) (6,904,148) (19,237,552) (26,141,700)
96,719,511 168,789,779 265,509,290 134,614,763 265,509,289
9.1 45,257,348 22,685,109 67,942,457 43,291,613 88,645,648 131,937,261
(6,996,329) (1,550,853) (8,547,182) (11,096,252) (7,711,894) (18,808,146)
400,124,052
(21,541,075) (36,436,818) (57,977,893) (39,511,870) (57,977,894) (97,489,764)
75,178,436
132,352,961
207,531,397
95,102,893 207,531,395
Particulars
Minimum lease payments
Less: Finance costs allocated to future periods
Less: Security deposits adjustable on expiry of lease terms
Present value of minimum lease payments
b) Leased machinery - unsecured
Particulars
Minimum lease payments
Less: Finance costs allocated to future periods
c) Leased building - unsecured
Particulars
302,634,288
10 Employee retirement benefits
Accumulated compensated absences
Defined benefit plan
2019 2018
Note Rupees Rupees
10.1 26,760,382 31,608,489
10.2 49,874,566 54,559,328
76,634,948 86,167,817
31,992,000 127,375,776 159,367,776 - -
Minimum lease payments
Less: Finance costs allocated to future periods
-
(15,152,240) (26,858,219) (42,010,459) - - -
16,839,760 100,517,557 117,357,317 - - -
9.1 This includes amount of Rs. 34.58 (2018: Rs. 54.93 million) payable to Askari Bank Limited, a related party.

10.2 Present value of defined benefit obligation
Balance as at 01 January
Charge to statement of profit or loss
Benefits paid during the year
Charge to other comprehensive income
Balance as at 31 December
2018
Rupees
32,369,350
21,374,086
-
815,892
54,559,328
2019
Note Rupees
54,559,328
10.2.1 5,304,572
(5,685,084)
10.2.2 (4,304,250)
49,874,566
10.2.1 Charge to the statement of profit or loss
Current service cost
Gain on settlements
Interest on defined benefit liability
18,784,538
2,589,548
21,374,086
15,372,476
(16,920,378)
6,852,474
5,304,572
10.2.2 Charge to other comprehensive income
Actuarial (gain)/loss on present value
- Experience adjustments
815,892(4,304,250)
Discount rate 100 bps
Salary increase 100 bps
- - - - - - - - - - - Rupees - - - - - - - - - -
30,693,457 36,402,623 23,468,198
30,665,621 23,441,209
27,614,326
36,356,702 27,581,879
10.1.3.1 Present value of liability at the year end;
10.1.2 The principal actuarial assumptions at the reporting date were as follows:
Discount rate
Expected per annum growth rate in salaries
Expected mortality rate
2019 2018
12.50% 13.25%
12.50% 13.25%
SLIC (2001-2005) SLIC (2001-2005)
69
As at 31 December 2019, average accumulation of leaves is 16 days per annum (2018: 16 days per annum), subject to a maximum accumulation of 60 days for civilians and 120 days for ex-servicemen (2018: 60 days for civilians and 120 days for ex-servicemen).
10.1.3 Sensitivity analysis
If the significant actuarial assumptions used to estimate the present value of liability at the reporting date, had fluctuated by 100 bps with all other variables held constant, the present value of the liability as at 31 December 2019 would have been as follows:
10.2.3 The estimated expense to be charged to the statement of profit or loss in next year on account of current service cost and interest cost amounting to Rs. 16.21 million and Rs. 5.61 million respectively.
2019 2018
Due to increase in assumptions

70
10.2.4 The principal actuarial assumptions at the reporting date were as follows:
Expected mortality rate
Discount rate
Expected per annum growth rate in salaries
SLIC (2001-2005) SLIC (2001-2005)
2019 2018
12.50% 13.25%
12.50% 13.25%
As at 31 December 2019, the weighted average duration of the defined benefit obligation was 8 years (2018: 9 years).
10.2.5 Sensitivity analysis
If the significant actuarial assumptions used to estimate the defined benefit obligation at the reporting date, had fluctuated by 100 bps with all other variables held constant, the present value of the defined benefit obligation as at 31 December would have been as follows:
Discount rate 100 bps
Salary increase 100 bps
43,692,623 57,360,104 47,869,516 62,365,742
57,287,568 43,642,252 62,292,010 47,814,401
10.2.5.1 Present value of defined benefit obligation at year end
11 Current portion of long term liabilities
Long term finances - secured
Lease liabilities
Note
8
9
2019 2018
Rupees Rupees
1,608,333,334 258,333,333
137,275,543 145,298,654
1,745,608,877 403,631,987
12 Short term borrowings - secured
Short term running finance
Islamic mode of financing
12.1 & 12.4
12.2
5,141,946,098 4,641,084,045
1,549,998,028 349,999,476
6,691,944,126
4,991,083,521
12.1 Short term running finance
This represents utilized amount of short term running finance facilities ("facilities") under mark-up arrangements available from various commercial banks aggregating to Rs 5,681.50 million (31 December 2018: Rs 4,650.94 million). These facilities are secured against charge over all current assets and fixed assets (excluding land and building) of the Company and carry mark-up ranging from 1 to 3 months KIBOR plus spread of 0.50% to 6.65% per annum (2018: 1 to 3 months KIBOR plus spread of 0.30% to 1.15%) per annum, payable monthly, quarterly and semi-annually in arrears. These facilities are expiring on various dates (Latest by December 2019 and maximum by June 2020).
- - - - - - - - - - - Rupees - - - - - - - - - -
2019 2018
Due to increase in assumptions
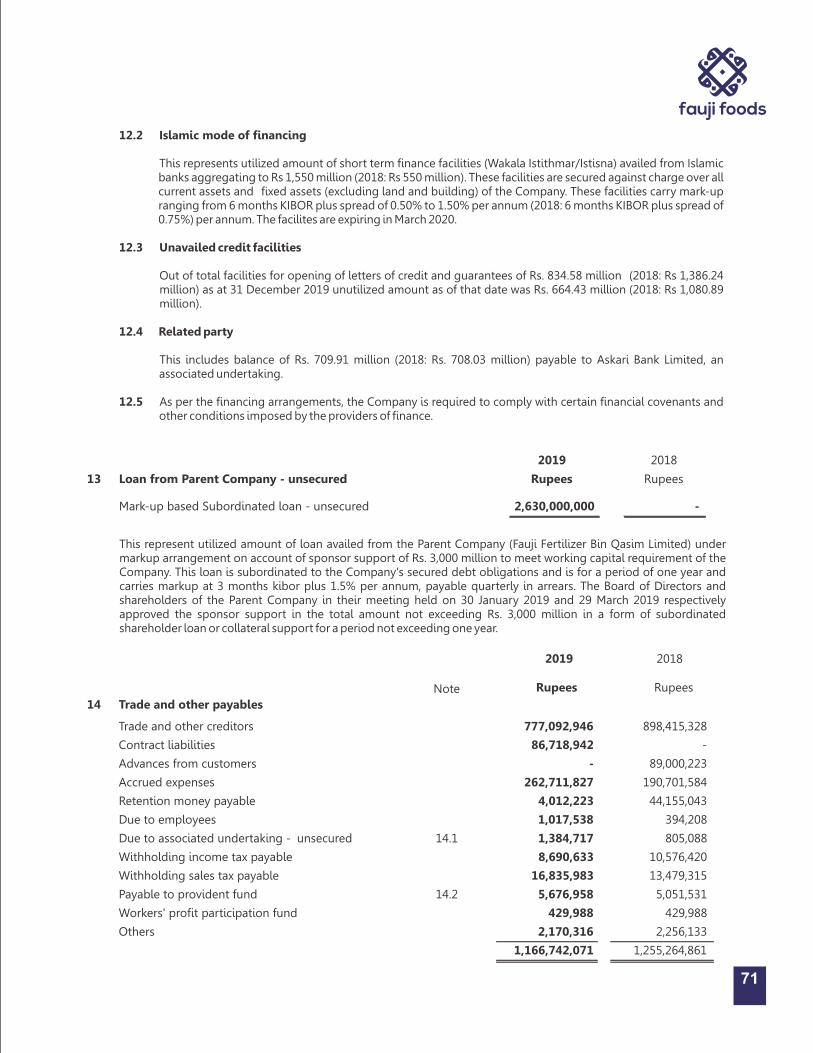
71
14 Trade and other payables
Trade and other creditors
Contract liabilities
Advances from customers
Accrued expenses
Retention money payable
Due to employees
Due to associated undertaking - unsecured
Withholding income tax payable
Withholding sales tax payable
Payable to provident fund
Workers' profit participation fund
Others
Note
14.1
14.2
777,092,946
86,718,942
-
262,711,827
4,012,223
1,017,538
1,384,717
8,690,633
16,835,983
5,676,958
429,988
2,170,316
1,166,742,071
898,415,328
-
89,000,223
190,701,584
44,155,043
394,208
805,088
10,576,420
13,479,315
5,051,531
429,988
2,256,133
1,255,264,861
2019 2018
Rupees Rupees
12.2 Islamic mode of financing
This represents utilized amount of short term finance facilities (Wakala Istithmar/Istisna) availed from Islamic banks aggregating to Rs 1,550 million (2018: Rs 550 million). These facilities are secured against charge over all current assets and fixed assets (excluding land and building) of the Company. These facilities carry mark-up ranging from 6 months KIBOR plus spread of 0.50% to 1.50% per annum (2018: 6 months KIBOR plus spread of 0.75%) per annum. The facilites are expiring in March 2020.
12.3 Unavailed credit facilities
Out of total facilities for opening of letters of credit and guarantees of Rs. 834.58 million (2018: Rs 1,386.24 million) as at 31 December 2019 unutilized amount as of that date was Rs. 664.43 million (2018: Rs 1,080.89 million).
12.4 Related party
This includes balance of Rs. 709.91 million (2018: Rs. 708.03 million) payable to Askari Bank Limited, an associated undertaking.
12.5 As per the financing arrangements, the Company is required to comply with certain financial covenants and other conditions imposed by the providers of finance.
13 Loan from Parent Company - unsecured
Mark-up based Subordinated loan - unsecured
2018
Rupees
-
2019
Rupees
2,630,000,000
This represent utilized amount of loan availed from the Parent Company (Fauji Fertilizer Bin Qasim Limited) under markup arrangement on account of sponsor support of Rs. 3,000 million to meet working capital requirement of the Company. This loan is subordinated to the Company's secured debt obligations and is for a period of one year and carries markup at 3 months kibor plus 1.5% per annum, payable quarterly in arrears. The Board of Directors and shareholders of the Parent Company in their meeting held on 30 January 2019 and 29 March 2019 respectively approved the sponsor support in the total amount not exceeding Rs. 3,000 million in a form of subordinated shareholder loan or collateral support for a period not exceeding one year.
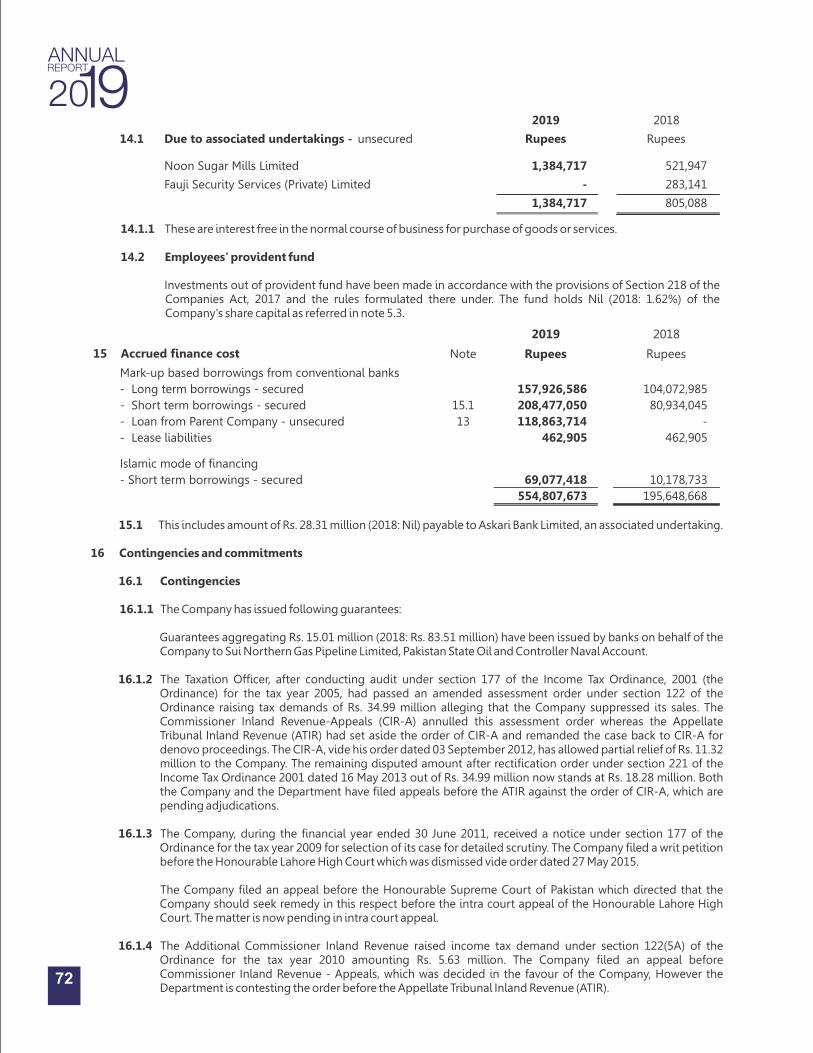
72
Note
15.1
13
15 Accrued finance cost
Mark-up based borrowings from conventional banks
- Long term borrowings - secured
- Short term borrowings - secured
- Loan from Parent Company - unsecured
- Lease liabilities
Islamic mode of financing
- Short term borrowings - secured
157,926,586
208,477,050
118,863,714 462,905
69,077,418
554,807,673
104,072,985
80,934,045
-
462,905
10,178,733
195,648,668
2019 2018
Rupees Rupees
14.1 Due to associated undertakings - unsecured
Noon Sugar Mills Limited
Fauji Security Services (Private) Limited
2019
Rupees
1,384,717
-
1,384,717
2018
Rupees
521,947
283,141
805,088
14.1.1 These are interest free in the normal course of business for purchase of goods or services.
14.2 Employees' provident fund
Investments out of provident fund have been made in accordance with the provisions of Section 218 of the Companies Act, 2017 and the rules formulated there under. The fund holds Nil (2018: 1.62%) of the Company's share capital as referred in note 5.3.
15.1 This includes amount of Rs. 28.31 million (2018: Nil) payable to Askari Bank Limited, an associated undertaking.
16 Contingencies and commitments
16.1 Contingencies
16.1.1 The Company has issued following guarantees:
Guarantees aggregating Rs. 15.01 million (2018: Rs. 83.51 million) have been issued by banks on behalf of the Company to Sui Northern Gas Pipeline Limited, Pakistan State Oil and Controller Naval Account.
16.1.2 The Taxation Officer, after conducting audit under section 177 of the Income Tax Ordinance, 2001 (the Ordinance) for the tax year 2005, had passed an amended assessment order under section 122 of the Ordinance raising tax demands of Rs. 34.99 million alleging that the Company suppressed its sales. The Commissioner Inland Revenue-Appeals (CIR-A) annulled this assessment order whereas the Appellate Tribunal Inland Revenue (ATIR) had set aside the order of CIR-A and remanded the case back to CIR-A for denovo proceedings. The CIR-A, vide his order dated 03 September 2012, has allowed partial relief of Rs. 11.32 million to the Company. The remaining disputed amount after rectification order under section 221 of the Income Tax Ordinance 2001 dated 16 May 2013 out of Rs. 34.99 million now stands at Rs. 18.28 million. Both the Company and the Department have filed appeals before the ATIR against the order of CIR-A, which are pending adjudications.
16.1.3 The Company, during the financial year ended 30 June 2011, received a notice under section 177 of the Ordinance for the tax year 2009 for selection of its case for detailed scrutiny. The Company filed a writ petition before the Honourable Lahore High Court which was dismissed vide order dated 27 May 2015.
The Company filed an appeal before the Honourable Supreme Court of Pakistan which directed that the Company should seek remedy in this respect before the intra court appeal of the Honourable Lahore High Court. The matter is now pending in intra court appeal.
16.1.4 The Additional Commissioner Inland Revenue raised income tax demand under section 122(5A) of the Ordinance for the tax year 2010 amounting Rs. 5.63 million. The Company filed an appeal before Commissioner Inland Revenue - Appeals, which was decided in the favour of the Company, However the Department is contesting the order before the Appellate Tribunal Inland Revenue (ATIR).

73
16.1.5 The Additional Commissioner Inland Revenue raised income tax demand under section 122(5A) of the Ordinance for the tax year 2011 amounting Rs 21.8 million. The Company, through its external legal counsel, filed an appeal before Commissioner Inland Revenue - Appeals (CIR-A) which was decided in favour of the Company with the exception of Rs. 2.97 million addition by CIR-A. The Company has subsequently filed an appeal before the ATIR against confirmation of the said addition and the Department is contesting the relief allowed by CIR-A. Further, second amendment order has also been framed under section 122(5A) determining additional tax demand at Rs. 14.57 million. The Company filed an appeal before CIR-A against the second amendment order. The CIR-A set aside the order with directions to revisit the evidence and explanation and pass a judcious order.
16.1.6 In the year 2015, the Company received a notice under section 177 of the Ordinance in respect of tax year 2012 for selection of its case for tax audit by the Commissioner Inland Revenue (CIR). The Company filed a writ petition before the Honourable Lahore High Court against the selection of case by CIR under the aforementioned section. During the financial year 2018, the writ petition was decided against the Company and consequently audit proceedings were initiated wherein a demand of Rs. 30 Million was raised by Additional Commissioner Inland Revenue under section 122(1) of the Income Tax Ordinance, 2001. The Company, through its external council, filed an appeal against the order before the Commissioner Inland Revenue - Appeals (CIR - A) which is pending adjudication.
16.1.7 During the year, the Additional Commissioner Inland Revenue amended the taxable loss under section 122(5A) of the Income Tax Ordinance, 2001 for the tax year 2013 on account of un-reconciled sales, exchange loss and tax credit. The Company, through its external council, filed an appeal against the order before the Commissioner Inland Revenue - Appeals (CIR - A) which is pending adjudication.
16.1.8 During the year ended 31 December 2016, the Additional Commissioner Inland Revenue raised income tax demand under section 122(5A) of the Income Tax Ordinance, 2001 for the tax year 2014 amounting to Rs 32.63 million by treating differences in sales tax returns as compared to audited accounts. The proceedings are in progress.
Further, the Company has been selected for audit in respect of tax year 2014 under section 214C of the Income Tax Ordinance, 2001. Proceedings in this respect are still to be initiated.
16.1.9 During the year ended 31 December 2019, the Assistant Commissioner Inland Revenue issued a show cause notice under section 161 of the Income Tax Ordinance, 2001 for the tax year 2017 against non-deduction of withholding tax on payments against milk procurement, contractual services and air ticketing amounting to Rs 60.62 million. The proceedings are in progress.
16.1.10 During the year ended 31 December 2016, Assistant Commissioner Inland Revenue (ACIR) raised sales tax demand of Rs. 4.84 million under section 11(2) and 11(3) of the Sales Tax Act 1990 against inadmissible refund claim and non-realization of sales tax on sale of scrap during the period from December 2012 to March 2013. The Company filed an appeal before Commissioner Inland Revenue - Appeals (CIR - A) which was decided against the Company. The Company being aggrieved filed an appeal before Appellate Tribunal Inland Revenue (ATIR). The ATIR decided the case in favour of the Company and waived off the whole tax demand against which the Department filed reference before the Honourable Lahore High Court which is pending adjudication.
16.1.11 During the year ended 31 December 2017, Assistant Commissioner Inland Revenue (ACIR) raised sales tax demand of Rs. 102 million under section 10 and 11(2) of the Sales Tax Act 1990 against inadmissible input tax adjustment and non-deduction of withholding sales tax during the period from July 2015 to June 2016. The Company filed an appeal before Commissioner Inland Revenue - Appeals (CIR - A) which was decided against the Company. The Company being aggrieved filed an appeal before Appellate Tribunal Inland Revenue (ATIR). The ATIR decided the case in favour of the Company and waived off the whole tax demand against which the Department filed reference before the Honourable Lahore High Court which is pending adjudication.
16.1.12 During the year ended 31 December 2017, Assistant Commissioner Inland Revenue (ACIR) issued sales tax order, dated 26 May 2017 for payment of Rs. 974 million for sales tax along with 100% default surcharge and penalty of Rs. 225 million due to alleged non-payment of sales tax on sales of “Chai Mix, Dairy Rozana and for the tax period July 2011 to December 2016. The order is based on the grounds that exemption is available to the Company only to the extent of dairy products and tea whitener is not milk / dairy product. The Company being aggrieved filed appeal initially before Commissioner Inland Revenue - Appeals (CIR-A) and then to the Appellate Tribunal Inland Revenue (ATIR) where the matter was heard and decided in favour of the Company on jurisdictional grounds. The Department and the Company have filed appeals before the Honourable High Court which are pending adjudication.

74
Further during the year ended 31 December 2018, the Assistant Commissioner Inland Revenue (ACIR) issued a show cause notice, dated 10 October 2018 for payment of Rs. 974 million for sales tax along with 100% default surcharge and penalty of Rs. 129 million due to alleged non-payment of sales tax on sales of "Dostea Chai Mix (tea whitener)” for the tax period January to December 2017. The order was based on the same grounds on which the order dated 26 May 2017 as explained above was issued . The Company filed a writ petition against this show cause notice before the High Court on jurisdictional and technical grounds which is pending adjudication.
Meanwhile, the matter was forwarded by the Regional Tax Officer Sargodha to Model Custom Collectorate of Appraisement (East), Customs House, Karachi for determination of appropriate classification of tea whitener. During the year, the matter has been resolved by the classification committee through its order C-72/KAPE/DC/PCT/2017 dated 11 Feburary 2019 and addressed to Deputy Commissioner Inland Revenue (Large Taxpayer Unit) for onwards pursual. Through the above order the classification of tea whitner continues to be under the same PCT code as was determined earlier by the Appraisment Committe through its order of 05 May 2011. Consequent to the decision of the classification committee, the management is hopeful that the above writ petitions will be decided in the favour of the Company.
16.1.13 During the year ended 31 December 2018, Assistant Commissioner Inland Revenue (ACIR) through its order dated 23 October 2018, raised a sales tax demand for the period from July 2016 to June 2017, under section 11(2) and 11(3) of Sales Tax Act, 1990, amounting to Rs. 145.57 million along with penalty of Rs. 7.28 million against inadmissible adjustment of input tax on goods not related to taxable supplies, non-realization of sales tax on disposal of fixed assets and non-withholding of sales tax from payment made against advertisement. The Company filed an appeal before Commissioner Inland Revenue - Appeals (CIR-A) which is remanded back to ACIR for re-evaluation.
16.1.14 During the year ended 31 December 2018, Assistant Commissioner Inland Revenue (ACIR) issued a show cause notice, dated 09 November 2018, against inadmissible adjustment of input tax on goods not related to taxable supplies and non-withholding of sales tax from payment made against advertisement amounting to Rs. 399.60 million. Against the show cause notice, the ACIR raised a sales tax demand of Rs. 135.34 million alongwith default surcharge and penalty. The Company is in process of filing an appeal against the order.
16.1.15 During the year, Additional Commissioner Inland Revenue (ACIR) raised sales tax demand for the period from January 2016 to December 2016 under section 11(2) of the Sales Tax Act, 1990 against non realization of sales tax amounting to Rs. 1.94 million on sale of scrap. The Company filed an appeal before Commissioner Inland Revenue (Appeals), which was decided in the favour of the Department. The Company being aggrieved filed an appeal before the Appellate Tribunal Inland Revenue (ATIR) which is pending adjudication. The ATIR decided the case in favour of the Company and waived off the whole tax demand against which the Department filed reference before the Honourable Lahore High Court which is pending adjudication.
Based on the opinion of the legal and tax advisors handling the above litigations, the management believes that the Company has strong legal grounds against each case and that no financial liability is expected to accrue. Accordingly, no provision has been made in these financial statements.
16.2 Commitments
16.2.1 The Company has issued postdated cheques of Rs. 18.82 million (2018: Rs. 25.24 million) in favour of custom authorities for import of plant and machinery vide Serial No. 6, 8th Schedule of Sales Tax Act, 1990.
16.2.2 Commitments, for capital expenditure, against irrevocable letters of credit outstanding at the year end were for Rs. 3.82 million (2018: Rs. 56.98 million).
16.2.3 Commitments, for purchase of raw / packing material, outstanding at the year end were for Rs. 7.29 million (2018: Rs. 312.14 million).
2018
Note Rupees
2019
Rupees17 Property, plant and equipment
Operating fixed assets
Capital work-in-progress
17.1 6,885,161,167
17.2 1,067,982,436
7,953,143,603
7,864,982,570
241,053,620
8,106,036,190

75
726,5
43,3
75
-
726,5
43,3
75
-
-
-
72
6,5
43
,37
5
944,9
56,3
42
219,5
08,6
23
1,1
64,4
64,9
65
165,4
15,9
06
93,6
37,8
28
259,0
53,7
34
90
5,4
11
,23
1
6,2
81,8
39,9
56
1,2
52,7
12,3
86
7,5
03,5
02,5
71
1,5
39,1
71,7
80
547,9
55,6
88
2,0
79,9
80,4
11
5,4
23
,52
2,1
60
(31,0
49,7
71)
(7,1
47,0
57)
22,5
53,1
12
1,2
65,0
40
23,8
18,1
52
11,6
42,3
98
1,8
07,7
40
13,4
50,1
38
10
,36
8,0
14
24,7
00,9
09
114,7
38,6
05
139,4
39,5
14
7,1
68,7
36
9,1
28,7
59
16,2
97,4
95
12
3,1
42
,01
9
35,4
33,5
62
-
35,4
33,5
62
14,5
82,9
32
8,5
27,5
89
23,1
10,5
21
12
,32
3,0
41
91,2
57,8
99
33,3
85,5
80
124,6
43,4
79
28,7
41,6
57
9,6
50,1
94
38,3
91,8
51
86
,25
1,6
28
36,8
63,8
27
11,3
58,8
41
48,2
22,6
68
13,8
52,5
61
2,4
44,7
61
16,2
97,3
22
31
,92
5,3
46
55,3
81,7
79
4,3
64,5
38
52,2
79,5
39
29,1
84,9
41
4,7
27,9
65
28,8
02,8
27
23
,47
6,7
12
(7,4
66,7
78)
(5,1
10,0
79)
8
,21
9,5
30
,76
11
,63
7,3
33
,61
3
9,8
18
,34
7,8
25
1,8
09
,76
0,9
11
67
7,8
80
,52
4
2,4
75
,38
4,2
99
7,3
42
,96
3,5
26
(38
,51
6,5
49
)
(12
,25
7,1
36
)
-
1
33,6
86,2
54
133,6
86,2
54
-
15,5
96,7
30
15,5
96,7
30
11
8,0
89
,52
4
357,3
69,4
94
-
357,3
69,4
94
6,1
71,2
72
35,4
39,1
41
41,6
10,4
13
31
5,7
59
,08
1
248,5
45,5
43
34,3
62,0
04
215,4
53,9
12
124,3
52,4
48
45,2
66,7
01
127,2
83,4
73
88
,17
0,4
39
- 10
10
10
10
33.3
3
10 &
33.3
3
10
20
20
10
33.3
3
(
67,4
53,6
35)
(42,3
35,6
76)
60
5,9
15
,03
7
16
8,0
48
,25
8
70
6,5
09
,66
01
30
,52
3,7
20
96
,30
2,5
72
1
84
,49
0,6
16
52
2,0
19
,04
4
(67
,45
3,6
35
)(4
2,3
35
,67
6)
17
.1O
pera
tin
g fi
xed
ass
ets
Ow
ned
ass
ets
Fre
eh
old
lan
d
Bu
ild
ing
s o
n f
reeh
old
lan
d
Ele
ctri
c an
d g
as
inst
all
ati
on
Oth
er
wo
rks
eq
uip
men
t
Pall
ets
Offi
ce a
nd
IT
Eq
uip
men
t
Fu
rnit
ure
an
d fi
xtu
re
V
eh
icle
s
Pla
nt
an
d m
ach
inery
Rig
ht
of
use
ass
ets
Bu
ild
ing
- n
ote
4.1
3
Pla
nt
an
d M
ach
inery
Veh
icle
s
31
Dece
mb
er
20
19
8,8
25
,44
5,7
98
1,8
05
,38
1,8
71
10
,52
4,8
57
,48
51
,94
0,2
84
,63
17
74
,18
3,0
96
2,6
59
,87
4,9
15
7,8
64
,98
2,5
70
(10
5,9
70
,18
4)
(54
,59
2,8
12
)
revalu
ed
dep
reci
ati
on
Dep
reci
ati
on
dep
reci
ati
on
Bo
ok
valu
e
am
ou
nt
Ad
dit
ion
s /
am
ou
nt
as
at
charg
e /
as
at
as
at
01
Jan
uary
(dele
tio
ns)
01
Jan
uary
(dele
tio
ns)
/3
1 D
ece
mb
er
31
Dece
mb
er
20
19
Co
st /
revalu
ed
31
Dece
mb
er
20
19
20
19
for
the y
ear
20
19
20
19
Rate
of
dep
reci
ati
on
%
----
----
----
----
----
----
----
----
----
----
----
----
----
----
----
----
----
----
- R
up
ees
----
----
----
----
----
----
----
----
----
----
----
----
----
----
----
----
----
----
----
-
20
19
Co
st/
Acc
um
ula
ted
A
ccu
mu
late
d

76
Acc
um
ula
ted
d
ep
reci
ati
on
as
at
01 J
an
uary
2018
Co
st/r
eva
lued
am
ou
nt
31 D
ece
mb
er
2018
Rate
of
dep
reci
ati
on
%
Bo
ok
valu
e
as
at
31 D
ece
mb
er
2018
Acc
um
ula
ted
d
ep
reci
ati
on
as
at
31 D
ece
mb
er
2018
Ad
dit
ion
s /
(dele
tio
ns)
Dep
reci
ati
on
charg
e /
(dele
tio
ns)
/
for
the y
ear
----
----
----
----
----
----
----
----
----
----
----
----
----
----
----
----
----
----
- R
up
ees
----
----
----
----
----
----
----
----
----
----
----
----
----
----
----
----
----
----
----
-
20
18
reva
lued
am
ou
nt
01 J
an
uary
2018
Co
st/
721,7
79,0
00
4,7
64,3
75
726,5
43,3
75
-
-
-
726,5
43,3
75
931,1
42,2
09
13,8
14,1
33
944,9
56,3
42
77,9
46,6
81
87,4
69,2
25
165,4
15,9
06
779,5
40,4
36
5,8
12,3
41,0
81
469,4
98,8
75
6,2
81,8
39,9
56
1,0
41,4
88,2
53
497,6
83,5
27
1,5
39,1
71,7
80
4,7
42,6
68,1
76
22,5
53,1
12
-
22,5
53,1
12
10,4
30,0
96
1,2
12,3
02
11,6
42,3
98
10,9
10,7
14
15,9
06,1
88
8,7
94,7
21
24,7
00,9
09
5,8
42,0
10
1,3
26,7
26
7,1
68,7
36
17,5
32,1
73
21,6
10,0
12
13,8
23,5
50
35,4
33,5
62
6,8
09,6
62
7,7
73,2
70
14,5
82,9
32
20,8
50,6
30
81,2
43,1
22
10,0
14,7
77
91,2
57,8
99
22,1
48,9
84
6,5
92,6
73
28,7
41,6
57
62,5
16,2
42
32,1
37,1
58
4,7
26,6
69
36,8
63,8
27
11,7
01,8
75
2,1
50,6
86
13,8
52,5
61
23,0
11,2
66
45,4
96,3
68
14,7
84,7
81
55,3
81,7
79
28,9
28,0
58
4,4
40,9
17
29,1
84,9
41
26,1
96,8
38
(4,8
99,3
70)
(4,1
84,0
34)
7,6
84,2
08,2
50
540,2
21,8
81
8,2
19,5
30,7
61
1,2
05,2
95,6
19
608,6
49,3
26
1,8
09,7
60,9
11
6,4
09,7
69,8
50
(4,8
99,3
70)
(4,1
84,0
34)
-
3
57,3
69,4
94
357,3
69,4
94
-6,1
71,2
72
6,1
71,2
72
351,1
98,2
22
224,8
64,2
10
25,4
68,3
33
248,5
45,5
43
66,2
81,0
50
58,9
14,7
20
124,3
52,4
48
124,1
93,0
95
- 10
10
10
10
33.3
3
10 &
33.3
3
10
20
10
33.3
3
(
1,7
87,0
00)
(843,3
22)
224,8
64,2
10
3
82,8
37,8
27
605,9
15,0
37
66,2
81,0
50
6
5,0
85,9
92
130,5
23,7
20
475,3
91,3
17
(
1,7
87,0
00)
(843,3
22)
Ow
ned
ass
ets
Fre
eh
old
lan
d
Bu
ild
ing
s o
n f
reeh
old
lan
d
Pla
nt
an
d m
ach
inery
Ele
ctri
c an
d g
as
inst
all
ati
on
Oth
er
wo
rks
eq
uip
men
t
Pall
ets
Offi
ce a
nd
IT
Eq
uip
men
t
Fu
rnit
ure
an
d fi
xtu
re
Veh
icle
s
Lease
d
ass
ets
Pla
nt
an
d m
ach
inery
Veh
icle
s
31
Dece
mb
er
20
18
7,9
09,0
72,4
60
923,0
59,7
08
8,8
25,4
45,7
98
1,2
71,5
76,6
69
673,7
35,3
18
1,9
40,2
84,6
31
6,8
85,1
61,1
67
(6,6
86,3
70)
(5,0
27,3
56)

77
17.1.2 Had these revaluations not been carried out, the carrying amount of freehold land, buildings on freehold land, plant and machinery, electric and gas installations and other work equipment would have been as follows:
2019 2018
Rupees Rupees
73,365,999 73,365,999
828,752,465
694,364,030
4,578,579,521
3,794,806,728
8,366,673
8,687,002
Freehold land
Buildings on freehold land
Plant and machinery including milk churns
Electric and gas Installations
Other works equipment 122,462,504
16,777,157
5,611,527,162 4,588,000,916
Particulars of assets
17.1.1 Disposal of operating assets
CostRelationship
with CompanyParticulars of purchaser
Sale proceeds
Gain / (loss)
on disposal
Mode of
disposalNet book
value
17.1.3 The manufacturing facility of the Company is located at Sargodha Road, Bhalwal, District Sargodha. Total owned area is 120 kanals and 5 marlas and covered area of building is 172,550 square feet.
Plant and Machinery
Ecolean EL-1 Packing Machine
Vehicles
1,097,286
Negotiation Third party sale31,049,771 23,902,714
25,000,000Ecolean Pakistan (Private)
Limited
Toyota Corolla Gli
Honda City
Honda Civic
Honda Civic
Honda Civic
Toyota Corolla Altis
Toyota Corolla Altis
Toyota Corolla Altis
Toyota Corolla Altis
Toyota Corolla Xli
Toyota Corolla Xli
Toyota Corolla Xli
Toyota Corolla Altis
Toyota Corolla Xli
Toyota Corolla Xli
Toyota Corolla Altis
Toyota Corolla Altis
Toyota Corolla Altis
Toyota Corolla Xli
Toyota Corolla Xli
Toyota Corolla Xli
Honda Civic
Suzuki Mehran VXR
2019 105,970,184 51,377,372 84,043,557 32,666,185
2018 6,686,370 1,659,014 3,203,291 1,544,277
407,549
733,905
1,546,008
1,730,723
1,337,666
936,681
1,318,686
1,457,483
1,439,889
986,566
932,924
1,031,639
949
4,307
3,788
508
890
2,486
3,136
37,004
897
1,225,541
-
Auction
- do -
- do -
- do -
- do -
- do -
- do -
- do -
- do -
- do -
- do -
- do -
Company Policy
- do -
- do -
- do -
- do -
- do -
- do -
- do -
- do -
Insurance Claim
Lucky Draw
Third party sale
Third party sale
Third party sale
Ex-employee
Third party sale
Third party sale
Third party sale
Third party sale
Third party sale
Third party sale
Third party sale
Third party sale
Ex-employee
Employee
Ex-employee
Ex-employee
Ex-employee
Ex-employee
Employee
Employee
Employee
Third party sale
Third party sale
1,492,472
1,000,000
2,637,000
2,637,000
2,637,000
1,997,500
1,990,500
1,990,500
1,990,500
1,662,000
1,660,500
1,660,500
1,990,500
1,662,000
1,662,000
2,015,500
1,990,500
1,990,500
1,660,500
1,660,500
1,642,500
2,606,520
840,000
31,843,922
927,451
541,095
1,028,992
1,144,277
1,367,334
808,319
681,314
667,517
695,111
603,434
517,076
568,361
811,611
660,493
661,012
909,504
795,310
793,714
661,064
825,546
656,103
1,274,459
714,000
9,161,558
1,335,000
1,275,000
2,575,000
2,875,000
2,705,000
1,745,000
2,000,000
2,125,000
2,135,000
1,590,000
1,450,000
1,600,000
812,560
664,800
664,800
910,012
796,200
796,200
664,200
862,550
657,000
2,500,000
714,000
25,591,235 16,429,677
Abdul Hameed
Sarwat Altaf
Abubakar Zahid
Brig. Salman Akbar
Umar Rashid
Malik Naeem Sarwar
Umar Rashid
M Bilal Malik
Umar Rashid
Syed Riaz Ahmed
Mian Shehzad Aslam
Sarwat Altaf
Farrukh Sheikh
Syed Abdul Majid Shah
Iftikhar Ahmed
Shaista Hassan
Abdur Razzak
Muhammad Imran Khattak
Muhammad Ali
Saqib Anwer
Imran Mirza
EFU General Insurance
Khushion ka khazana scheme
Various assets having net book
value up to Rs 500,000 each
- - - - - - - - - - - - - - - Rupees - - - - - - - - - - - - - - -
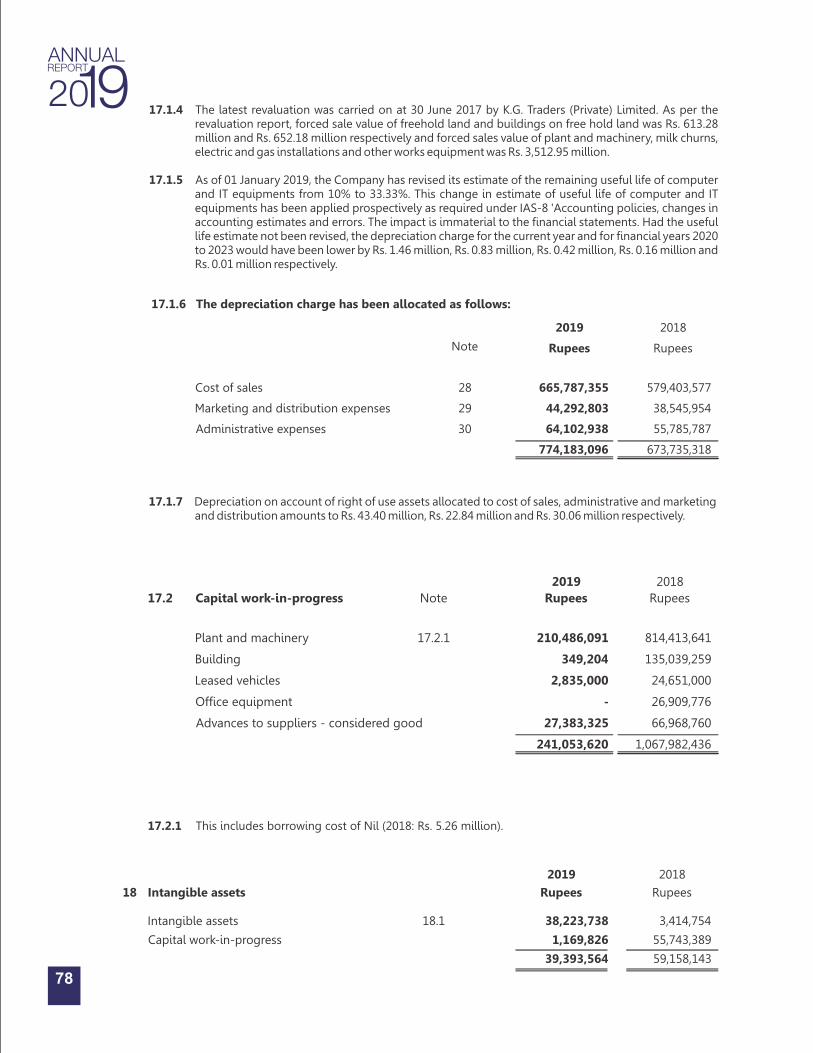
17.2.1 This includes borrowing cost of Nil (2018: Rs. 5.26 million).
Intangible assets
Intangible assets
Capital work-in-progress
2019
Rupees
18.1 38,223,738
18
1,169,826
39,393,564
2018
Rupees
3,414,754
55,743,389
59,158,143
17.1.6 The depreciation charge has been allocated as follows:
Cost of sales
Marketing and distribution expenses
Administrative expenses
Note
28
29
30
2019 2018
Rupees Rupees
665,787,355
579,403,577
44,292,803 38,545,954
64,102,938 55,785,787
774,183,096 673,735,318
17.1.7 Depreciation on account of right of use assets allocated to cost of sales, administrative and marketing and distribution amounts to Rs. 43.40 million, Rs. 22.84 million and Rs. 30.06 million respectively.
78
17.1.4 The latest revaluation was carried on at 30 June 2017 by K.G. Traders (Private) Limited. As per the revaluation report, forced sale value of freehold land and buildings on free hold land was Rs. 613.28 million and Rs. 652.18 million respectively and forced sales value of plant and machinery, milk churns, electric and gas installations and other works equipment was Rs. 3,512.95 million.
17.1.5 As of 01 January 2019, the Company has revised its estimate of the remaining useful life of computer and IT equipments from 10% to 33.33%. This change in estimate of useful life of computer and IT equipments has been applied prospectively as required under IAS-8 'Accounting policies, changes in accounting estimates and errors. The impact is immaterial to the financial statements. Had the useful life estimate not been revised, the depreciation charge for the current year and for financial years 2020 to 2023 would have been lower by Rs. 1.46 million, Rs. 0.83 million, Rs. 0.42 million, Rs. 0.16 million and Rs. 0.01 million respectively.
Note
17.2.1
17.2 Capital work-in-progress
Plant and machinery
Building
Leased vehicles
Office equipment
Advances to suppliers - considered good
2019 2018
Rupees Rupees
210,486,091
349,204
2,835,000
-
27,383,325
241,053,620
814,413,641
135,039,259
24,651,000
26,909,776
66,968,760
1,067,982,436

2019 2018
Rupees Rupees
2,572,617 1,998,972
18,910,846 653,277
21,483,463 2,652,249
Note18.1.1 The amortization charge has been allocated as follows:
Marketing and distribution expenses
Administrative expenses
29
30
19.1 Deferred tax asset on unused tax losses available for carry forward have been recognized to the extent that the
realization of related tax benefits through future taxable profits is probable. The Company has not recognized deferred tax asset of Rs. 3,490.21 million on tax losses of Rs. 12,035.22 million as sufficient taxable profits may not be available to set these off in the foreseeable future. Tax losses (business) aggregating to Rs. 11,282.75 million will expire by tax year 2021 to 2026 in accordance with the provisions of Income Tax Ordinance, 2001.
834,573,351
2,069,440,000
23,474,943
159,425,493
47,266,219
32,518,433
905,314,513
2,261,383,926
637,272,659
425,030,348
268,041,854 264,816,198
905,314,513 689,846,546
- 1,571,537,380
19.1
19 Deferred taxation - net
The deferred tax asset comprises of the following
Deductible temporary differences:
- unused tax losses
- unused tax credit
- provisions
Less: Taxable temporary differences:
- accelerated tax depreciation allowances net of lease liability
- surplus on revaluation of property, plant and equipment
Deferred taxation - net 19.2
18.2 SAP (ERP) software has been capitalized effective on 01 January 2019.
79
1,983,860 - 1,983,860
1,983,860
-
1,983,860 -
432,032 - 432,032 432,032 - 432,032 -
5,996,916 - 5,996,916 1,998,972 1,998,972 3,997,944 1,998,972 33.33
Secondary sale system
Anti-virus
Secondary sale system (Tally)
SAP - HCM Module 300,000 1,810,726 2,110,726 41,667 653,277 694,944 1,415,782 33.33
8,712,808 1,810,726 10,523,534 4,456,531 2,652,249 7,108,780 3,414,754
2018
-------------------------------------------------------------------- Rupees ----------------------------------------------------------------------
Accumulated
amortization
01 January
2018
Rate of
amortization
%
Amortization
charge
for the year
Cost as at
01 January
2018
Additions
Cost as at
31 December
2018
Accumulated
amortization
31 December
2018
Book value
as at
31 December
2018
2019
1,983,860 - 1,983,860 1,983,860 - 1,983,860 -
432,032 - 432,032 432,032 - 432,032 -
5,996,916
18.1 Intangible assets
-
5,996,916 3,997,944 1,998,972 5,996,916 - 33.33
2,110,726 -
2,110,726 694,944 703,575 1,398,519 712,207 33.33
-
56,292,447
56,292,447 - 18,780,916 18,780,916 37,511,531 33.33
10,523,534 56,292,447
66,815,981
7,108,780
21,483,463
28,592,243 38,223,738
Secondary sale system
Anti-virus
Secondary sale system (Tally)
SAP - HCM Module
SAP - ERP
-------------------------------------------------------------------- Rupees ----------------------------------------------------------------------
Accumulated
amortization
01 January
2019
Rate of
amortization
%
Amortization
charge
for the year
Cost as at
01 January
2019
Additions
Cost as at
31 December
2019
Accumulated
amortization
31 December
2019
Book value
as at
31 December
2019
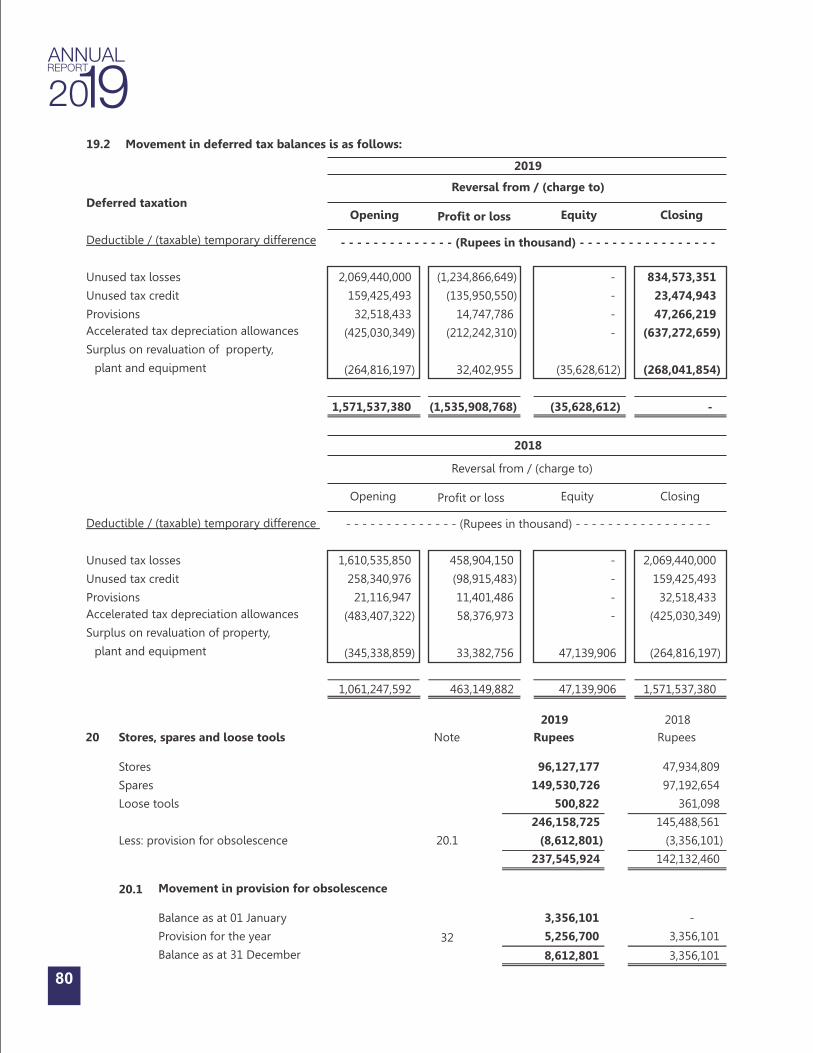
80
Note
20.1
32
20 Stores, spares and loose tools
Stores
Spares
Loose tools
Less: provision for obsolescence
20.1 Movement in provision for obsolescence
Balance as at 01 January
Provision for the year
Balance as at 31 December
19.2 Movement in deferred tax balances is as follows:
Deductible / (taxable) temporary difference
Unused tax losses
Unused tax credit
Provisions
Accelerated tax depreciation allowances
Surplus on revaluation of property,
plant and equipment
1,610,535,850
258,340,976
21,116,947
(483,407,322)
(345,338,859)
463,149,882
458,904,150
(98,915,483)
11,401,486
58,376,973
33,382,756
-
-
-
-
47,139,906
47,139,906
2,069,440,000
159,425,493
32,518,433
(425,030,349)
(264,816,197)
1,571,537,380
Reversal from / (charge to)
Opening Profit or loss Equity Closing
2018
- - - - - - - - - - - - - - (Rupees in thousand) - - - - - - - - - - - - - - - - -
1,061,247,592
Deferred taxation
Deductible / (taxable) temporary difference
Unused tax losses
Unused tax credit
Provisions
Accelerated tax depreciation allowances
Surplus on revaluation of property,
plant and equipment
Reversal from / (charge to)
Opening Profit or loss Equity Closing
2019
- - - - - - - - - - - - - - (Rupees in thousand) - - - - - - - - - - - - - - - - -
-
-
-
-
(35,628,612)
(35,628,612)
834,573,351
23,474,943
47,266,219
(637,272,659)
(268,041,854)
2019
Rupees
96,127,177
149,530,726
500,822
246,158,725
(8,612,801)
237,545,924
3,356,101
5,256,700
8,612,801
2018
Rupees
47,934,809
97,192,654
361,098
145,488,561
(3,356,101)
142,132,460
-
3,356,101
3,356,101
-
(1,234,866,649)
(135,950,550)
14,747,786
(212,242,310)
32,402,955
(1,535,908,768)
2,069,440,000
159,425,493
32,518,433
(425,030,349)
(264,816,197)
1,571,537,380
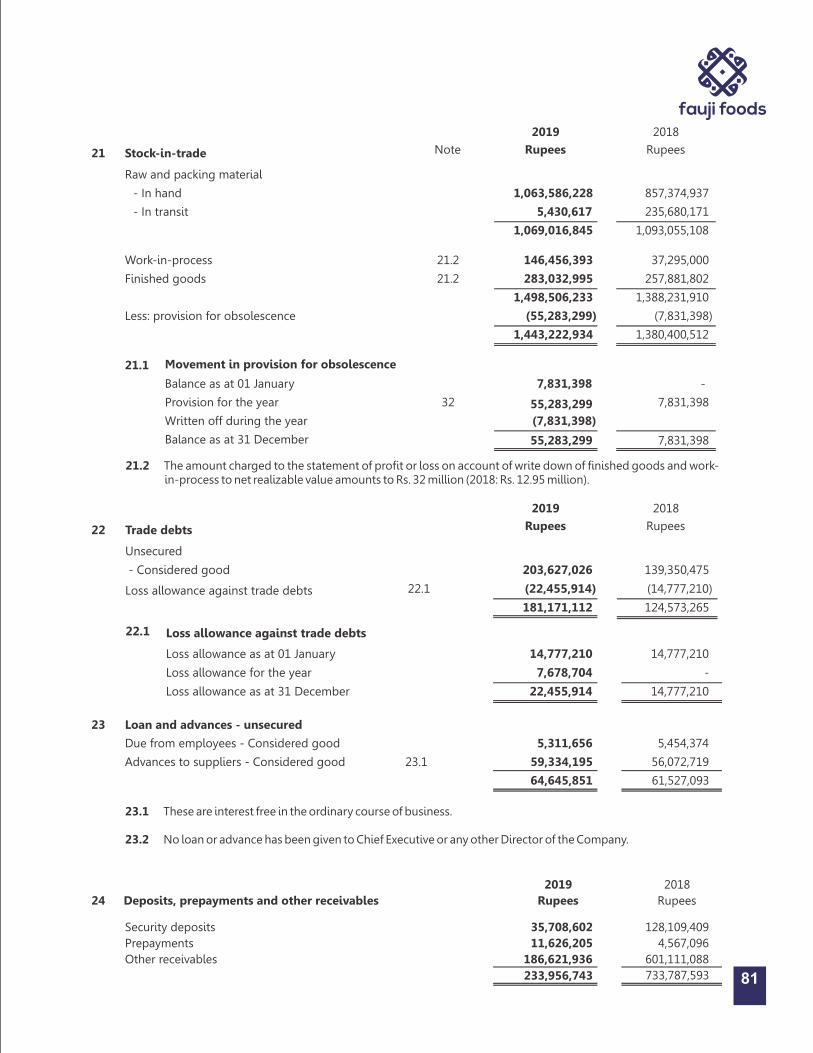
1,063,586,228 857,374,937
5,430,617 235,680,171
1,069,016,845
1,093,055,108
21.2 146,456,393
37,295,000
21.2 283,032,995
257,881,802
1,498,506,233
1,388,231,910
(55,283,299)
(7,831,398)
1,443,222,934
1,380,400,512
Note
2019
Rupees
2018
Rupees
21 Stock-in-trade
Raw and packing material
- In hand
- In transit
Work-in-process
Finished goods
Less: provision for obsolescence
21.1 Movement in provision for obsolescence
7,831,398
-
32 55,283,299
7,831,398
(7,831,398)
55,283,299 7,831,398
Balance as at 01 January
Provision for the year
Written off during the year
Balance as at 31 December
21.2 The amount charged to the statement of profit or loss on account of write down of finished goods and work-in-process to net realizable value amounts to Rs. 32 million (2018: Rs. 12.95 million).
81
23 Loan and advances - unsecured
Due from employees - Considered good
Advances to suppliers - Considered good 23.1
5,311,656 5,454,374
59,334,195 56,072,719
64,645,851 61,527,093
22.1 Loss allowance against trade debts
Loss allowance as at 01 January
Loss allowance for the year
Loss allowance as at 31 December
22 Trade debts
Unsecured
- Considered good
Loss allowance against trade debts 22.1
14,777,210
7,678,704
22,455,914
203,627,026
(22,455,914)
181,171,112
14,777,210
-
14,777,210
139,350,475
(14,777,210)
124,573,265
23.1 These are interest free in the ordinary course of business.
23.2 No loan or advance has been given to Chief Executive or any other Director of the Company.
2019 2018
24 Deposits, prepayments and other receivables Rupees Rupees
35,708,602 128,109,409
11,626,205 4,567,096
Security deposits
Prepayments
Other receivables
233,956,743
601,111,088
733,787,593
2019
Rupees
2018
Rupees
186,621,936

82
27
Sales tax
Sales - net
Gross sales
Less:
Trade discounts
2019
Rupees
6,537,109,723
(255,005,789)
(537,231,606)
(792,237,395)
5,744,872,328
2018
Rupees
8,306,734,551
(77,759,771)
(579,688,211)
(657,447,982)
7,649,286,569
25.2 Due from associate - Noon International (Private) Limited amounting to Rs. 39,247 is outstanding for more than six months.
25.3 These are interest free in the normal course of business on account of purchase of goods or services.
26.1 This carries profit at the rates ranging from 5% to 9.5% (2018: 3.75% to 5%) per annum.
26.2 This includes amount of Rs. Nil (2018: Rs. 32.73 million) at Askari Bank Limited, a related party.
Note
26.1
26 Cash and bank balances
Cash-in-hand
Cash at banks on:
- Current accounts
- Saving accounts
- Dividend accounts
26.2
2019
Rupees
44,425
110,343,730
3,524,754
221,490
114,089,974
114,134,399
2018
Rupees
737,941
6,196,620
91,065,247
221,490
97,483,357
98,221,298
2019Rupees
2018Rupees
In themonth of
In themonth of
Askari Bank Limited Oct-18
Noon International
(Private) Limited
-
Dec-19 Dec-18
- 269,648
39,247 39,247
25.1 Maximum outstanding balance with reference to month end balances:
25 Due from associated undertakings - unsecured
39,247 39,247
- 269,648
39,247 308,895
Noon International (Private) Limited
Askari Bank Limited
27.1 Revenue from contracts with customers relates to local (Pakistan) market and represents sale of dairy and allied products. Timing of revenue recognition is at point of time.
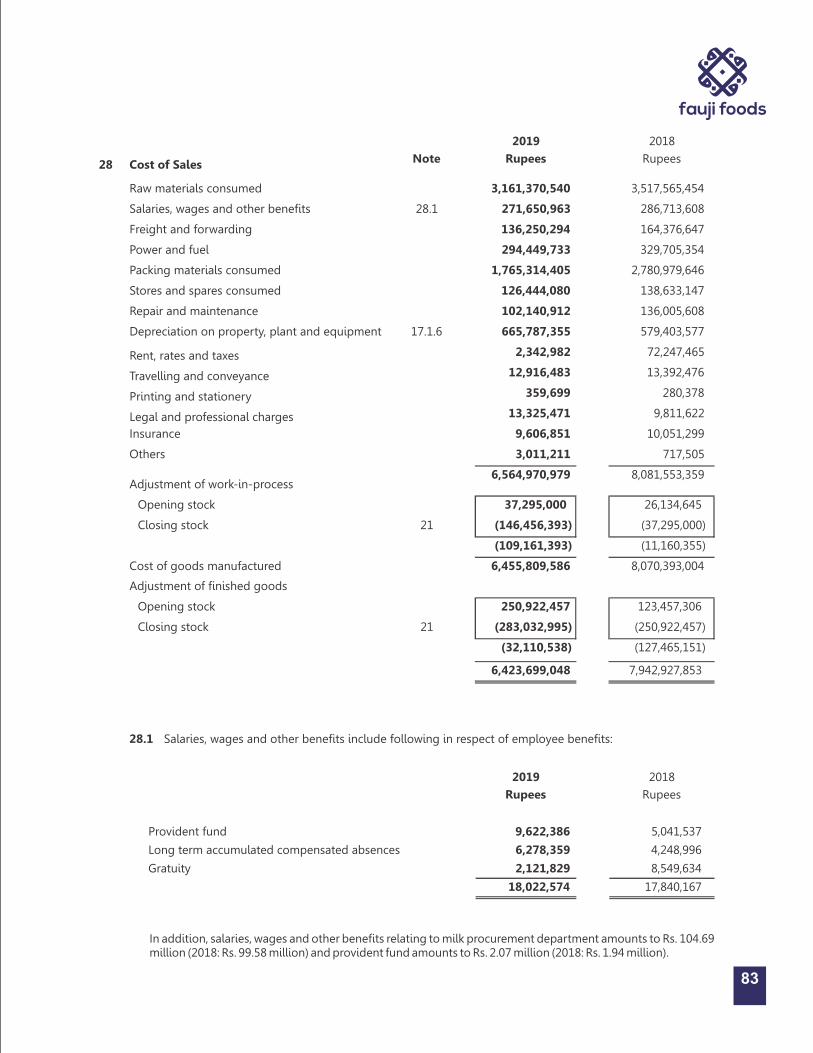
28.1 Salaries, wages and other benefits include following in respect of employee benefits:
3,161,370,540 3,517,565,454
28.1 271,650,963 286,713,608
136,250,294 164,376,647
294,449,733 329,705,354
1,765,314,405 2,780,979,646
126,444,080 138,633,147
102,140,912 136,005,608
17.1.6 665,787,355 579,403,577
2,342,982 72,247,465
12,916,483 13,392,476
359,699 280,378
13,325,471 9,811,622
9,606,851 10,051,299
3,011,211 717,505
6,564,970,979 8,081,553,359
37,295,000 26,134,645
21 (146,456,393) (37,295,000)
(109,161,393) (11,160,355)
6,455,809,586 8,070,393,004
250,922,457 123,457,306
28 Cost of Sales
Raw materials consumed
Salaries, wages and other benefits
Freight and forwarding
Power and fuel
Packing materials consumed
Stores and spares consumed
Repair and maintenance
Depreciation on property, plant and equipment
Rent, rates and taxes
Travelling and conveyance
Printing and stationery
Legal and professional charges
Insurance
Others
Adjustment of work-in-process
Opening stock
Closing stock
Cost of goods manufactured
Adjustment of finished goods
Opening stock
Closing stock 21 (283,032,995) (250,922,457)
(32,110,538) (127,465,151)
6,423,699,048 7,942,927,853
83
Provident fund
Long term accumulated compensated absences
Gratuity
2019
Rupees
9,622,386
6,278,359
2,121,829
18,022,574
2018
Rupees
5,041,537
4,248,996
8,549,634
17,840,167
In addition, salaries, wages and other benefits relating to milk procurement department amounts to Rs. 104.69 million (2018: Rs. 99.58 million) and provident fund amounts to Rs. 2.07 million (2018: Rs. 1.94 million).
2019
RupeesNote
2018
Rupees

30.1 Salaries, wages and other benefits include following in respect of employee benefits:
30.1
37
30.2
17.1.6
18.1.1
30 Administrative expenses
Salaries, wages and other benefits
Travelling and conveyance
Directors' meeting fee
Rent, rates and taxes
Entertainment
Communication and establishment
Printing and stationery
Electricity, gas and water
Insurance
Repair and maintenance
Vehicles' running and maintenance
Subscription
Legal and professional charges
Learning and Development
Auditors' remuneration
Cash security charges
Depreciation on property, plant and equipment
Amortization of intangible assets
Others
211,748,181
12,442,001
10,202,520
27,045,042
2,877,284
8,727,582
3,110,105
12,856,999
1,000,846
18,334,428
13,252,504
2,271,998
17,656,797
793,450
1,365,000
5,626,608
64,102,938
18,910,846
5,943,806
438,268,935
237,138,781
18,737,858
3,909,669
49,739,607
2,969,989
8,059,529
6,820,205
10,862,828
364,440
11,688,184
16,551,750
3,128,477
30,581,919
17,497,568
1,335,000
5,697,909
55,785,787
653,277
12,592,480
465,649,383
29.1 Salaries, wages and other benefits include following in respect of employee benefits:
8,582,209 9,842,962
6,030,359 4,442,593
Provident fund
Long term accumulated compensated absences
Gratuity 1,721,829 8,549,634
16,334,397 22,835,189
2019 2018
Note Rupees Rupees
139,648,577 207,697,514
29.1 243,948,207 234,623,711
10,485,915 8,169,331
7,755,702 5,415,308
22,526,478 29,264,474
40,834,048
45,826,084
780,492,580
1,224,542,206
2,852,948
2,186,637
17.1.6 44,292,803
38,545,954
18.1.1 2,572,617
1,998,972
29 Marketing and distribution expenses
Freight and forwarding
Salaries, wages and other benefits
Repair and maintenance
Rent, rates and taxes
Travelling and conveyance
Vehicles' running and maintenance
Advertisement and sales promotion
Insurance
Depreciation on property, plant and equipment
Amortization of intangible assets
Communication, establishment and others 14,194,832
10,827,656
1,309,604,707
1,795,894,148
84

56,198,286 8,314,319
9,447,454 7,953,763
31 Other income
Income from financial assets
Profit on saving accounts
Income from non-financial assets
Sale of scrap
Gain on disposal of property, plant and equipment 32,666,185 1,544,277
98,311,925 17,812,359
26.1
17.1.1
82,824,900 87,051,591
68,119,660 -
60,539,999 3,356,101
- 9,811,622
7,310,310 -
218,794,869 100,219,314
32 Other expenses
Exchange loss
Consultancy fee
Provision for obsolete stocks and stores
Research and development
Others
20.1 & 21.1
150,369,539 27,038,289
586,629,613 354,212,096
740,791,333 258,941,891
156,279,932 -
58,604,433 10,347,191
33 Finance cost
Islamic mode of financing
- Short term borrowings
Interest / mark-up on interest / mark-up based loans
- Long term finance
- Short term borrowings
- Loan from Parent Company
- Lease liabilities
Bank charges and commission 5,491,846 24,257,247
1,698,166,696 674,796,714
Note
2019
Rupees
2018
Rupees
2019 2018
Rupees Rupees
5,860,473
2,247,885
Provident fund
Long term accumulated compensated absences
Gratuity 4,274,818
5,909,720
3,375,175
1,460,915
10,745,810 12,383,176
1,100,000 1,000,000
125,000 125,000
60,000 60,000
30.2 Legal and professional charges
The charges for professional services include the following
in respect of auditors' services for:
- Statutory audit fee
- Half yearly review
- Certification charges
- Out-of-pocket expenses 80,000 150,000
1,365,000 1,335,000
85
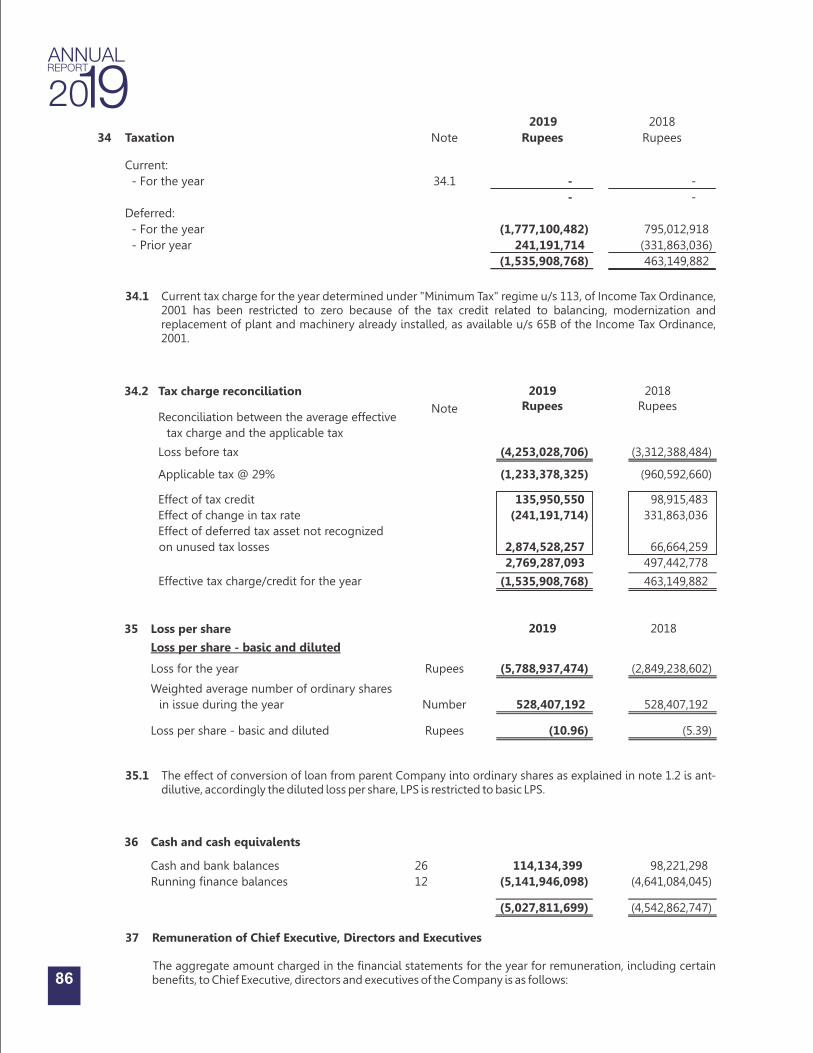
86
26
36 Cash and cash equivalents
Cash and bank balances
Running finance balances 12
98,221,298
(4,641,084,045)
(4,542,862,747)
114,134,399
(5,141,946,098)
(5,027,811,699)
Note
34.2 Tax charge reconciliation
Reconciliation between the average effective
tax charge and the applicable tax
Loss before tax
Applicable tax @ 29%
Effect of tax credit
Effect of change in tax rate
Effect of deferred tax asset not recognized
on unused tax losses
Effective tax charge/credit for the year
Rupees2018
Rupees
(4,253,028,706)
(1,233,378,325)
135,950,550
(241,191,714)
2,874,528,257
2,769,287,093
(1,535,908,768)
2019
(3,312,388,484)
(960,592,660)
98,915,483
331,863,036
66,664,259
497,442,778
463,149,882
Rupees
Number
Rupees
35 Loss per share
Loss per share - basic and diluted
Loss for the year
Weighted average number of ordinary shares
in issue during the year
Loss per share - basic and diluted
(5,788,937,474)
528,407,192
(10.96)
2019
(2,849,238,602)
528,407,192
(5.39)
2018
2019 2018
RupeesNote Rupees
34.1 - -
- -
(1,777,100,482) 795,012,918
34 Taxation
Current:
- For the year
Deferred:
- For the year
- Prior year 241,191,714 (331,863,036)
(1,535,908,768) 463,149,882
34.1 Current tax charge for the year determined under "Minimum Tax" regime u/s 113, of Income Tax Ordinance, 2001 has been restricted to zero because of the tax credit related to balancing, modernization and replacement of plant and machinery already installed, as available u/s 65B of the Income Tax Ordinance, 2001.
35.1 The effect of conversion of loan from parent Company into ordinary shares as explained in note 1.2 is ant-dilutive, accordingly the diluted loss per share, LPS is restricted to basic LPS.
37 Remuneration of Chief Executive, Directors and Executives
The aggregate amount charged in the financial statements for the year for remuneration, including certain benefits, to Chief Executive, directors and executives of the Company is as follows:

The actual production is according to market demand.
227,760,000
6,935,000
227,760,000
8,760,000
90,295,898
1,778,587
60,873,948
1,651,307
Production
2019 20182019 2018
Capacity
39 Capacity and production
Liquid products - liters
Non - Liquid products - Kgs
2019 2018
(Number of persons)
842 1,451
1,179 1,462
38 Number of employees
Total number of employees as at 31 December
Average number of employees during the year
---------------------------------Rupees-------------------------------------
Non Executive Directors
2019 2018 2019 2018
Executives
2019 2018
Chief Executive
77,538,555
-
-
7,343,975
69,784,700
7,753,856
1,800,858
4,772,717
168,994,661
Number of persons 1 1 13 11 41 46
Managerial remuneration
Meeting fee
Consultancy fee
Provident fund
House rent
Utilities
Relocation allowance
Others
- -
- -
- -
- -
- -
- -
- -
- -
- -
-
10,182,000
2,624,436
-
-
-
-
-
12,806,436
90,526,119
-
-
12,932,701
81,473,507
9,052,612
440,591
6,222,585
200,648,115
-
3,909,669
5,248,872
-
-
-
-
-
9,158,541
87
37.1 The Company also provides some of its executives with company maintained cars and other benefits in accordance with the Company's policy.
2019Rupees
Name of the Company Relationship Nature of transactions2018
Rupees
Associated Undertakings
Parent Company Salaries of seconded employees charged by related party - 2,521,764
(Shareholding and common directorship)
Salaries of seconded employees charged to related party 14,572,337 9,414,999
2,630,000,000
Fauji Fertilizer Bin Qasim Limited (FFBL)
Repair & maintenance and building rent expense charged by related party
Expense borne by the Company on behalf of related party
Purchase of fixed assets from related party
Loan receivedFinance cost charged by related party
Finance cost paid to related party
14,682,096 49,752,977
3,121,137 918,531
- 3,500,000
-
156,279,932 -
37,416,518 -
40 Related party transactions and balances
Related parties comprise of parent company, associated companies, directors, entities with common directorship, post employment plans and key management personnel. Balances are disclosed elsewhere in these financial statements. The Company in the normal course of business carries out transactions with related parties. Significant transactions with related parties are as follows:
Total employees

Associated Undertaking
(Common directorship)
1,741,498
Associated Undertaking(Common directorship)
Associated Undertaking
(Common directorship)
Associated Undertaking 21,224,500
(Common directorship)
Post employee benefit plan 53,657,404
Askari Bank Limited
Fauji Meat Limited
Fauji Security Services (Private) Limited
Noon Sugar Mills
Employee's Provident Fund Trust
Finance cost charged by related party
Interest income on saving accounts
Utilities expense paid on behalf of the related party
Expense borne by the Company on behalf of related party
Expenses paid against security services
Purchase of white sugar
Contribution for the year
88,157,616 27,733,006
23,796,966 6,167,619
2,298,055
- 459,266
3,183,592 2,897,782
-
60,963,473
Non-Executive Director 2,624,436
10,182,000
Mr. Salman Hayat Noon*
Directors
Key Management Personnel
Consultancy fee expense
Meeting fee
Remuneration and benefits 65,628,610
5,248,872
3,909,669
76,334,485
2019Rupees
Name of the Company Relationship Nature of transactions2018
Rupees
88
41 Financial risk management
41.1 Financial risk factors
The Company's activities expose it to a variety of financial risks: market risk (including interest rate risk, price risk and currency risk), credit risk and liquidity risk. The Company's overall risk management focuses on the unpredictability of financial markets and seeks to minimize potential adverse effects on the Company's financial performance.
The Board of Directors has overall responsibility for the establishment and oversight of the Company’s risk management framework. The Board is also responsible for developing and monitoring the Company’s risk management policies.
The Company’s risk management policies are established to identify and analyse the risks faced by the Company, to set appropriate risk limits and controls, and to monitor risks and adherence to limits. Risk management policies and systems are reviewed regularly to reflect changes in market conditions and the Company’s activities. The Company, through its training and management standards and procedures, aims to develop a disciplined and constructive control environment in which all employees understand their roles and obligations.
The Audit Committee oversees how management monitors compliance with the Company’s risk management policies and procedures, and reviews the adequacy of the risk management framework in relation to the risks faced by the Company. The Audit Committee is assisted in its oversight role by Internal Audit. Internal Audit undertakes both regular and ad hoc reviews of risk management controls and procedures, the results of which are reported to the Audit Committee.
The Company's exposure to financial risk, the way these risks affects the financial position and performance and the manner in which such risks are managed is as follows:
41.1.1 Market risk
Market risk is the risk that changes in market prices, such as foreign exchange rates, interest rates and equity prices will affect the Company's income or value of its holding of financial instruments. The objective of market risk management is to manage and control market risk exposures within acceptable parameters, while optimizing return.
*With effect from 10 December 2019, Mr. Salman Hayat Noon resigned as director of the Company.
40.1 Associated companies / related parties percentage of shareholding has been disclosed in note 5.3.

Foreign currency sensitivity analysis
At 31 December 2019, if the Rupee had weakened / strengthened by 10% against the Euro and US Dollar with all other variables held constant, loss before tax for the year would have been higher / lower as under, mainly as a result of foreign exchange gains / losses on translation of foreign exchange denominated financial instrument. The following table demonstrates the sensitivity to a reasonably possible change in the Euro exchange rate:
Bills payable - Euro
Net exposure - Euro
Bills payable - US Dollar
Net Exposure - US Dollar
The following significant exchange rates were applied during the year:
Rupees per Euro:
- Average rate
- Reporting date rate
Rupees per USD:
- Average rate
- Reporting date rate
2019 2018
48,250
504,335
48,250
504,335
-
145,200
-
145,200
2019 2018
142.57
158.73
120.61
174.02
174.05
150.21
155.35 138.89
89
41.1.1.1 Foreign exchange risk
Foreign exchange risk is the risk that value of a financial instrument will fluctuate due to changes in foreign exchange rates. Foreign exchange risk arises mainly where receivables and payables exist due to transactions with foreign buyers and suppliers.
The Company is exposed to exchange risk arising from currency exposures mainly with respect to the Euro and US Dollar on import of raw material, packing material and stores and spares. Currently, the Company's foreign exchange risk exposure is restricted to the amounts payable to the foreign entities. The Company's exposure to
31 December 2019 - Euro
31 December 2019 - US Dollar
31 December 2018 - Euro
31 December 2018 - US Dollar
Rupees%
Change in Exchange
rate
Effect on loss
before tax
10%
-10%
10%
-10%
10%
-10%
10%
-10%
(839,791)
839,791
-
-
(8,005,312)
8,005,312
(2,016,683)
2,016,683
41.1.1.2 Price risk
Price risk is the risk that the fair value or future cash flows of a financial instrument will fluctuate as a result of changes in market prices (other than those arising from interest rate risk or currency risk), whether those changes are caused by factors specific to the individual financial instruments or its issuer or factors affecting all similar financial instruments traded in the market. The Company is not exposed to any significant price risk.

RupeesRupees - - - - - Effective rate - - - - - -
90
41.1.1.3 Interest rate risk
Interest rate risk represents the risk that the fair value or future cash flows of a financial instrument will fluctuate because of change in market interest rates. Sensitivity to interest rate risk arises from mismatch of financial assets and liabilities that mature or reprice in a given period.
The Company's interest rate risk arises from long term finances, lease finances and short term finances. Borrowings obtained at variable rates exposes the Company to cash flow interest rate risk.
At the reporting date, the interest rate profile of the Company's interest bearing financial instruments is as follows:
Financial assets at amortized cost
Security deposits
Trade debts
Due from employees
Due from related parties
Other receivables
Bank balances
2019 2018
Rupees Rupees
42,314,724 129,053,715
181,171,112 124,573,265
5,311,656 5,454,374
39,247 308,895
186,621,936 601,111,088
114,089,974 97,483,357
529,548,649 957,984,694
Financial assets
Fixed rate instruments
Saving accounts
Financial liabilities
Variable rate instruments
Lease liabilities
Long term finances
Short term borrowings
Loan from Parent Company
Total exposure
91,065,247 3,524,754 4% to 9.5% 3.75% to 5%
434,571,549
4,450,000,000
4,991,083,521
-
9,875,655,070
392,831,171
4,316,666,667
6,691,944,126
2,630,000,000
14,031,441,964
10.24% to 14.39%
9.85% to 11.44%
11.05% to 15.51%
12.61% to 15.42%
5.54% to 13.44%
6.76% to 9.88%
6.46% to 11.71%
-
Fair value sensitivity analysis for fixed rate instruments
The Company does not account for any fixed rate financial assets and liabilities at fair value through profit or loss. Therefore, a change in interest rate at the reporting date would not affect profit or loss of the Company.
Cash flow sensitivity analysis for variable rate instruments
At 31 December 2019, if interest rate on variable rate financial liabilities has been 1% higher / lower with all other variables held constant, loss before tax for the year would have been Rs. 119.17 million (2018: Rs. 98.76 million) higher / lower, mainly as a result of higher / lower interest expense on variable rate financial liabilities.
41.1.2 Credit risk
Credit risk represents the risk of a financial loss if a customer or counter party to a financial instrument fails to discharge its contractual obligation. The Company's credit risk arises from security deposits, trade debts, other receivables, loans and advances, deposits and balances with banks. The Company has no significant concentration of credit risk as its exposure is spread over a large number of counter parties.
41.1.2.1 Exposure to credit risk
The carrying amount of financial assets represents the maximum credit exposure. The maximum exposure to credit risk at the reporting date was:
201820192019 2018

AA+ A1+ PACRA
A+ A1 PACRA
AAA A1+ PACRA
Soneri Bank Limited AA- A1+ PACRA
Security deposits
Askari Bank Limited
MCB Bank Limited
Bank Islami Pakistan
10,500,000
3,500,000
1,000,000
15,000,000
12,989,000
3,500,000
7,300,000
59,721,100
83,510,100
Long termRatingAgency
2019Rupees
2018Rupees
AAA
AAA
AA+
AA-
AA+
AAA
A1+
A1+
A1+
A1+
A1+
A1+
PACRA
JCR-VIS
PACRA
PACRA
PACRA
PACRA
Rating
Short Term
40,129,326
294,720
808,388
84,047
5,738
67,616,337
108,938,556
3,952,266
294,718
32,730,812
-
5,738
883,524
37,867,058
Bank balances
National Bank Of Pakistan
United Bank Limited
Askari Bank Limited
JS Bank
Bank Alfalah Limited
MCB Bank Limited
Institutions
91
41.1.2.2 Credit quality and impairment
Credit quality of financial assets is assessed by reference to external credit ratings, where available, or to historical information about counterparty default rates. All counterparties, with the exception of customers and utility Companies, have external credit ratings determined by various credit rating agencies. Credit quality of customers is assessed by reference to historical defaults rates and present ages.
Counter parties with external credit ratings - Bank balances
These include banking companies and financial institutions, which are counterparties to bank balances. Credit risk is considered minimal as these counterparties have reasonably high credit ratings as determined by various credit rating agencies. Due to long standing business relationships with these counterparties and considering their strong financial standing, management does not expect non-performance by these counterparties on their obligations to the Company. Following are the credit ratings of counterparties with external credit ratings:
Counter parties without external credit ratings - Trade debts
These mainly include customers which are counter parties to trade debts. As explained in note 4.1.2 and 4.14, the Company applies the IFRS 9 simplified approach to measure expected credit losses which uses a lifetime expected loss allowance for all trade receivables. Trade receivables are written off when there is no reasonable expectation of recovery. On adoption of IFRS 9, management uses an allowance matrix to base the calculation of ECL of trade receivables from individual customers. Loss rates are calculated using a 'role rate' method based on the probability of receivable progressing through successive stages of delinquency to write-off. The Company has used three years quarterly data in the calculation of historical loss rates along with the matching quarterly ageing brackets for the computation of roll rates. These rates are multiplied by scalar factors to reflect the effect of forward looking macro-economic factors. The analysis of ages of trade debts and loss allowance using the aforementioned approach as at 31 December 2019 (on adoption of IFRS 9) was determined as follows:
Rating
2018Rupees
2019Rupees
RatingAgency
Habib Bank Limited AAA A1+ JCR-VIS
Faysal Bank Limited AA A1+ PACRA
Bank Islami Pakistan A+ A1 PACRA
Bank Al-Habib Limited AA+ A1+ PACRA
Soneri Bank Limited AA- A1+ PACRA
Dubai Islamic Bank AA A1+ JCR-VIS
1,630,563
759,213
284,999
1,252,958
103,461
1,120,224
114,089,974
57,263,442
164,591
284,999
658,082
550
1,244,635
97,483,357
Long termShort TermInstitutions
-

The aging of trade debts at the reporting date was:
1 to 90 days
91 to 180 days
181 to 365 days
Above 365 days
Less: Loss allowance on trade debts
2019
Rupees
179,397,974
903,238
634,378
22,691,436
(22,455,914)
181,171,112
2018
Rupees
114,649,050
1,323,106
1,081,100
22,297,219
(14,777,210)
124,573,265
Deposits and other receivables are mostly due from utility companies, a major supplier and against rental contracts. Based on past experience the management believes that no impairment allowance is necessary in respect of these financial assets. There are reasonable grounds to believe that these amounts will be recovered in short course of time.
41.1.2.3 Concentration of credit risk
Concentration of credit risk exists when the changes in economic or industry factors similarly affect groups of counterparties whose aggregate credit exposure is significant in relation to the Company's total credit exposure. The Company's portfolio of financial instruments is broadly diversified and all other transactions are entered into with credit-worthy counterparties there-by mitigating any significant concentrations of credit risk.
41.1.3 Liquidity risk
Liquidity risk is the risk that the Company will encounter difficulty in meeting obligations associated with financial liabilities, that are settled by delivering cash or other financial asset as they fall due. The Company's approach is to ensure, as far as possible, to always have sufficient liquidity to meet its liabilities when due, under both normal and stressed conditions. Prudent liquidity risk management implies maintaining sufficient cash and marketable securities and ensuring the availability of adequate credit facilities. The Company finances its operations through equity, borrowings and working capital with a view to maintain an appropriate mix between various sources of finance to minimize risk. As explained in note 1.2, the Company has continously been supported by sponsors and providers for finance for efficient working capital management and for meeting its contractual obligations. The Company's finance department aims at maintaining flexibility in funding by keeping regular committed credit lines available.
The table below analyses the Company’s financial liabilities into relevant maturity groupings based on the remaining period at the reporting to the contractual maturity date. The amounts disclosed in the table are the contractual undiscounted cash flows.
92
392,831,171
4,316,666,667
1,048,389,567
554,807,673
6,691,944,126
2,630,000,000
15,634,639,204
501,366,705
5,032,162,384
1,048,389,567
554,807,673
6,691,944,126
2,630,000,000
16,458,670,455
186,295,838
1,981,561,379
- - - - - - - - - - - - - - - - - - - - - Rupees - - - - - - - - - - - - - - - - - - - - -
Carryingamount
Contractualcash flows
Less than
1 year
Between
1 to 5 years
1,048,389,567
554,807,673
6,691,944,126
2,630,000,000
13,092,998,583
315,070,867
3,050,601,005
-
-
-
-
3,365,671,872
At 31 December 2019
Non derivative financial liabilities
Lease liabilities
Long term finances
Trade and other payables
Accrued finance cost
Short term borrowings
Loan from Parent Company
At 31 December 2018
Non derivative financial liabilities
Lease liabilities
Long term finances
Trade and other payables
Accrued finance cost
Short term borrowings
434,571,549
4,450,000,000
1,136,809,987
195,648,668
4,991,083,521
11,208,113,725
550,869,459
5,438,427,333
1,136,809,987
195,648,668
4,991,083,521
12,312,838,968
195,906,776
688,964,274
1,136,809,987
195,648,668
4,991,083,521
7,208,413,226
354,962,683
4,749,463,059
-
-
-
5,104,425,742
- - - - - - - - - - - - - - - - - - - - - Rupees - - - - - - - - - - - - - - - - - - - - -
Carryingamount
Contractualcash flows
Less than
1 year
Between
1 to 5 years
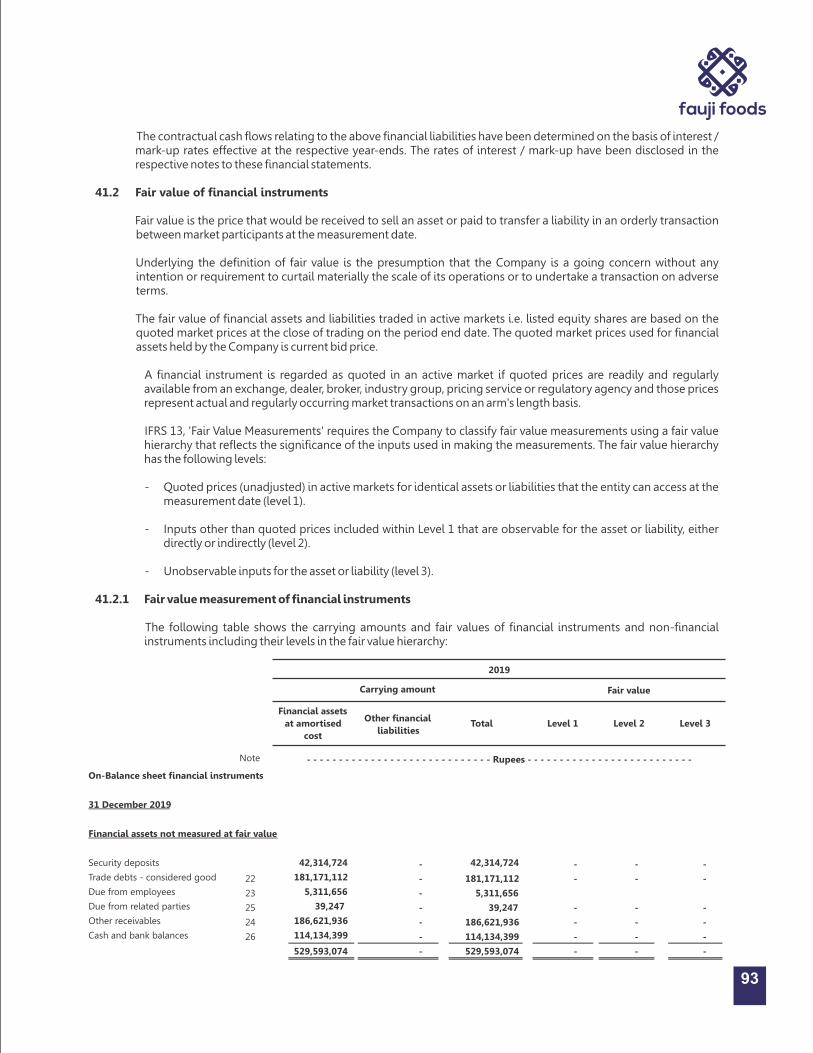
93
The contractual cash flows relating to the above financial liabilities have been determined on the basis of interest / mark-up rates effective at the respective year-ends. The rates of interest / mark-up have been disclosed in the respective notes to these financial statements.
41.2 Fair value of financial instruments
Fair value is the price that would be received to sell an asset or paid to transfer a liability in an orderly transaction between market participants at the measurement date.
Underlying the definition of fair value is the presumption that the Company is a going concern without any intention or requirement to curtail materially the scale of its operations or to undertake a transaction on adverse terms.
The fair value of financial assets and liabilities traded in active markets i.e. listed equity shares are based on the quoted market prices at the close of trading on the period end date. The quoted market prices used for financial assets held by the Company is current bid price.
A financial instrument is regarded as quoted in an active market if quoted prices are readily and regularly available from an exchange, dealer, broker, industry group, pricing service or regulatory agency and those prices represent actual and regularly occurring market transactions on an arm's length basis.
IFRS 13, 'Fair Value Measurements' requires the Company to classify fair value measurements using a fair value hierarchy that reflects the significance of the inputs used in making the measurements. The fair value hierarchy has the following levels:
- Quoted prices (unadjusted) in active markets for identical assets or liabilities that the entity can access at the measurement date (level 1).
- Inputs other than quoted prices included within Level 1 that are observable for the asset or liability, either directly or indirectly (level 2).
- Unobservable inputs for the asset or liability (level 3).
41.2.1 Fair value measurement of financial instruments
The following table shows the carrying amounts and fair values of financial instruments and non-financial instruments including their levels in the fair value hierarchy:
-
-
-
-
-
-
-
-
-
-
-
-
-
-
-
-
-
-
42,314,724 42,314,724-
22 181,171,112 - 181,171,112
23 5,311,656 - 5,311,656
25 39,247 - 39,247
24 186,621,936 - 186,621,936
26 114,134,399 - 114,134,399
529,593,074
Note
- 529,593,074
On-Balance sheet financial instruments
31 December 2019
Financial assets not measured at fair value
Security deposits
Trade debts - considered good
Due from employees
Due from related parties
Other receivables
Cash and bank balances
Level 1 Level 2 Level 3
Fair value
Other financial
liabilities
Financial assets
at amortised
cost
Total
2019
Carrying amount
- - - - - - - - - - - - - - - - - - - - - - - - - - - - - Rupees - - - - - - - - - - - - - - - - - - - - - - - - - -

94
-
-
-
-
-
-
-
-
-
-
-
-
-
-
-
-
-
-
9 - 392,831,171 392,831,171
8 4,316,666,667 4,316,666,667
14 - 1,048,389,567 1,048,389,567
12 - 6,691,944,126 6,691,944,126
13 - 2,630,000,000 2,630,000,000
15 - 554,807,673 554,807,673
- 15,634,639,204 15,634,639,204
Financial liabilities not measured at fair value
Lease liabilities
Long term finances
Trade and other payables
Short term borrowing
Loan from Parent Company
Accrued finance cost
Level 1 Level 2 Level 3
Fair value
Other financial
liabilities
Financial assets
at amortised
cost
Total
2019
Carrying amount
- - - - - - - - - - - - - - - - - - - - - - - - - - - - - Rupees - - - - - - - - - - - - - - - - - - - - - - - - - -
Note
- 11,208,113,725 11,208,113,725 - - -
434,571,549 434,571,549 9 - - - - Lease liabilities
- - - 8 - 4,450,000,000 4,450,000,000 Long term finances
14 - 1,136,809,987 1,136,809,987 - - - Trade and other payables
12 - 4,991,083,521 4,991,083,521 - - - Short term borrowing
15 - 195,648,668 195,648,668 - - - Accrued finance cost
Level 1 Level 2
Level 3
Fair value
Other financial
liabilities
Financial assets
at amortised
cost
Total
2018
Carrying amount
- - - - - - - - - - - - - - - - - - - - - - - - - - - - - Rupees - - - - - - - - - - - - - - - - - - - - - - - - - -Note
958,722,635 958,722,635- - - -
On-Balance sheet financial instruments
31 December 2018
Financial assets not measured at fair value
129,053,715 129,053,715- - - -Security deposits
22 124,573,265 124,573,265- - - -Trade debts
23 5,454,374 5,454,374- - - -Due from employees
25 308,895 308,895- - - -Due from related parties
24 601,111,088 601,111,088- - - -Other receivables
26 98,221,298 98,221,298- - - -Bank balances
Financial liabilities not measured at fair value
41.2.2 Fair value versus carrying amounts
The Company has not disclosed the fair values of these financial assets and liabilities as these are for short term or reprice over short term. Therefore, their carrying amounts are reasonable approximation of fair value.
41.3 Capital risk management
The Company's prime objective when managing capital is to safeguard its ability to continue as a going concern so that it can continue to provide returns for shareholders, benefits for other stakeholders and to maintain a strong capital base to support the sustained development of its business.

95
The Company manages its capital structure by monitoring return on net assets and makes adjustments to it in the light of changes in economic conditions. In order to maintain or adjust the capital structure, the Company may adjust the amount of dividend paid to shareholders and / or issue new shares.
There was no change to the Company’s approach to capital management during the year. The Company is not subject to externally imposed capital requirements. As at the reporting date, the Company has accumulated losses of Rs. 12,196.62 million. These indicators and other matters as explained in note 1.2 to the financial statements may cause changes in the Company's approach to capital management.
42 Reconciliation of movements of liabilities to cash flows arising from financing activities.
-
-
-
4,450,000,000
3,191,582,677
-
-
3,191,582,677
4,991,083,521
-
-
-
-
674,796,714
-
674,796,714
195,648,668
-
382,837,827
382,837,827
434,571,549
-
-
-
965,752
-
-
-
7,209,412,827
3,191,582,677
674,796,714
382,837,827
4,249,217,218
17,281,682,317
Equity
TotalLease
liabilitiesUnclaimed dividend
Share capital /
share premium
2018
Liabilities
- - - - - - - - - - - - - - - - - - - - - - - - - - - - - - - - - - - - - - Rupees - - - - - - - - - - - - - - - - - - - - - - - - - - - - - - - - - - - - - -
Accrued finance
cost
Loan from Parent
Company
Short term
borrowingsLong term
financesBalance as at 01 January 2018
Cash flows
Short term borrowings repaid net of receipts
Repayment of lease rentals
Finance cost paid
Dividends paid
Total changes from financing cash flows
Other changes including non-cash
Changes in running finance
Finance cost
Assets acquired on lease
Total liability related other changes
Closing as at 31 December 2018
4,450,000,000
-
-
-
-
-
-
1,449,501,368
349,999,476
-
-
-
349,999,471
-
-
-
-
-
-
-
73,373,064
-
-
(552,521,110)
-
(552,521,110)
-
141,637,760
-
(89,904,038)
-
-
(89,904,038)
-
970,179
-
-
-
(4,427)
(4,427)
-
7,209,412,827
-
-
-
-
-
-
13,324,895,198
349,999,476
(89,904,038)
(552,521,110)
(4,427)
(292,430,099)
Equity
TotalLease
liabilitiesUnclaimed dividend
Share capital /
share premium
2019
Liabilities
- - - - - - - - - - - - - - - - - - - - - - - - - - - - - - - - - - - - - - Rupees - - - - - - - - - - - - - - - - - - - - - - - - - - - - - - - - - - - - - -
Accrued finance
cost
Loan from Parent
Company
Short term
borrowingsLong term
finances
4,450,000,000
-
(133,333,333)
-
-
-
-
-
4,316,666,667
Balance as at 01 January 2019
Cash flows
Short term borrowings repaid net of receipts
Repayment of long term finances
Repayment of lease rentals
Finance cost paid
Dividends paid
Other changes including non-cash
Changes in running finance
Finance cost
Assets acquired on lease
Closing as at 31 December 2019
17,281,682,317
3,829,998,552
(133,333,333)
(142,335,001)
(1,339,007,691)
-
500,862,053
1,698,166,696
100,594,623
21,796,628,216
7,209,412,827
-
-
-
-
-
-
7,209,412,827
965,752
-
-
-
-
-
-
-
965,752
195,648,668
-
-
-
(1,339,007,691)
-
1,698,166,696
-
554,807,673
-
2,630,000,000
-
-
-
-
-
-
-
2,630,000,000
4,991,083,521
1,199,998,552
-
-
-
-
(133,333,333)Total changes from financing cash flows 2,215,322,527--(142,335,001)(1,339,007,691)2,630,000,0001,199,998,552
500,862,053
-
-
6,691,944,126
434,571,549
-
-
(142,335,001)
-
-
-
100,594,623
-Total liability related other changes 2,299,623,372--1,698,166,696-500,862,053 100,594,623
392,831,171

96
43 Date of authorization of issue
These financial statements have been authorized for issue by the Board of Directors of the Company on 27 January, 2020.
44 Events after the reporting date
There are no subsequent events occurring after reporting date.
45 Corresponding figures
Corresponding figures have been re-arranged and re-classified, wherever necessary, for the purpose of comparison and better presentation as per reporting framework. However, no significant reclassification has been made.
Lahore

97

98
FAUJI FOODS LIMITED
FORM OF PROXY
(also being a member of the Company) as my/ our proxy to attend, act and vote for me/ us and on my/ our behalf, rdat the 53 Annual General Meeting of the Company to be held at Hotel Royal Swiss, Opposite Cargo Complex,
Allama Iqbal International Airport, Lahore on Thursday, April 02, 2020 at 11:00 a.m. and at any adjournment
thereof.
Proxies, in order to be effective must reach the Company's Registered office not less than 48 hours before the time for holding the meeting and must be duly stamped, signed and witnessed. Proxies of the Members through CDC shall be accompanied with attested copies of their CNIC.
SECP's Circular No. 1 dated January 26th, 2000 is on the reverse side of the form.
Note:
Registered Folio No./ CDC Account No.
I/We
of
of
or failing him
of
(NAME)
(NAME)
(Address)
(NAME)
(Address)
being a member of FAUJI FOODS LIMITED , hereby appoint
Witness 1 Witness 2
Signature Signature
Name Name
Address Address
Signature of Shareholder / Appointer
RevenueStampRs. 5/-
CNIC # CNIC #
(Address)
99
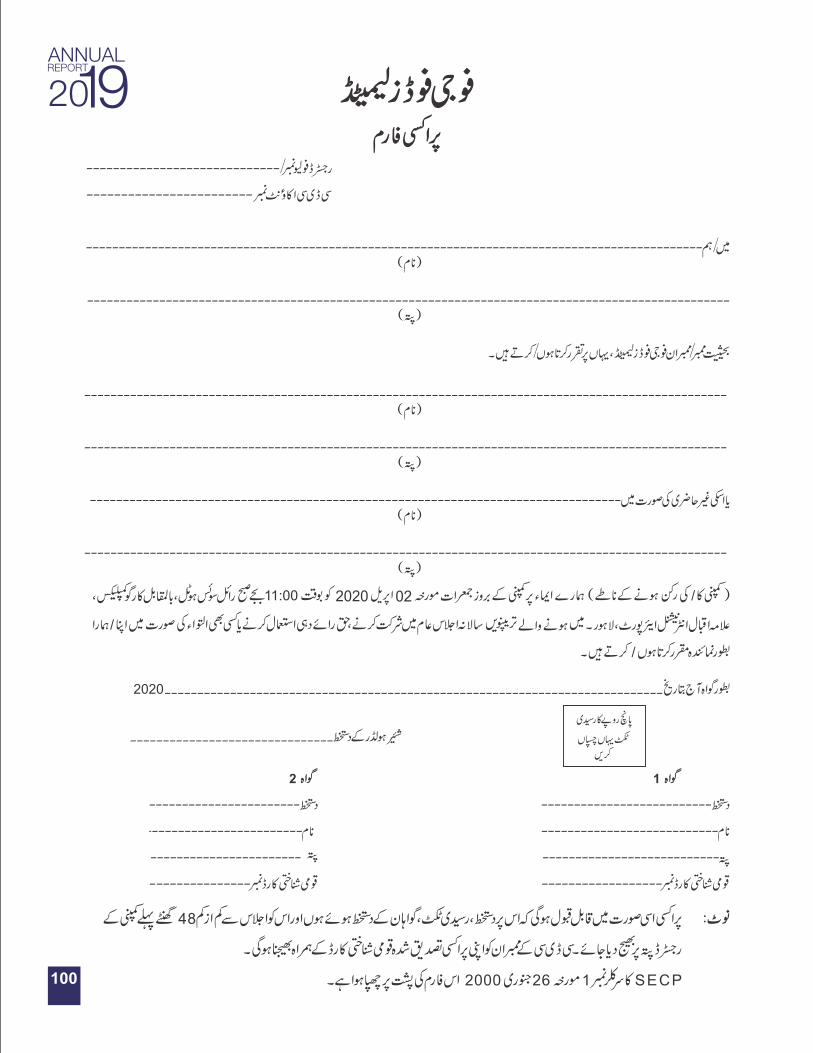
100
2020
2020 02

101

102

103
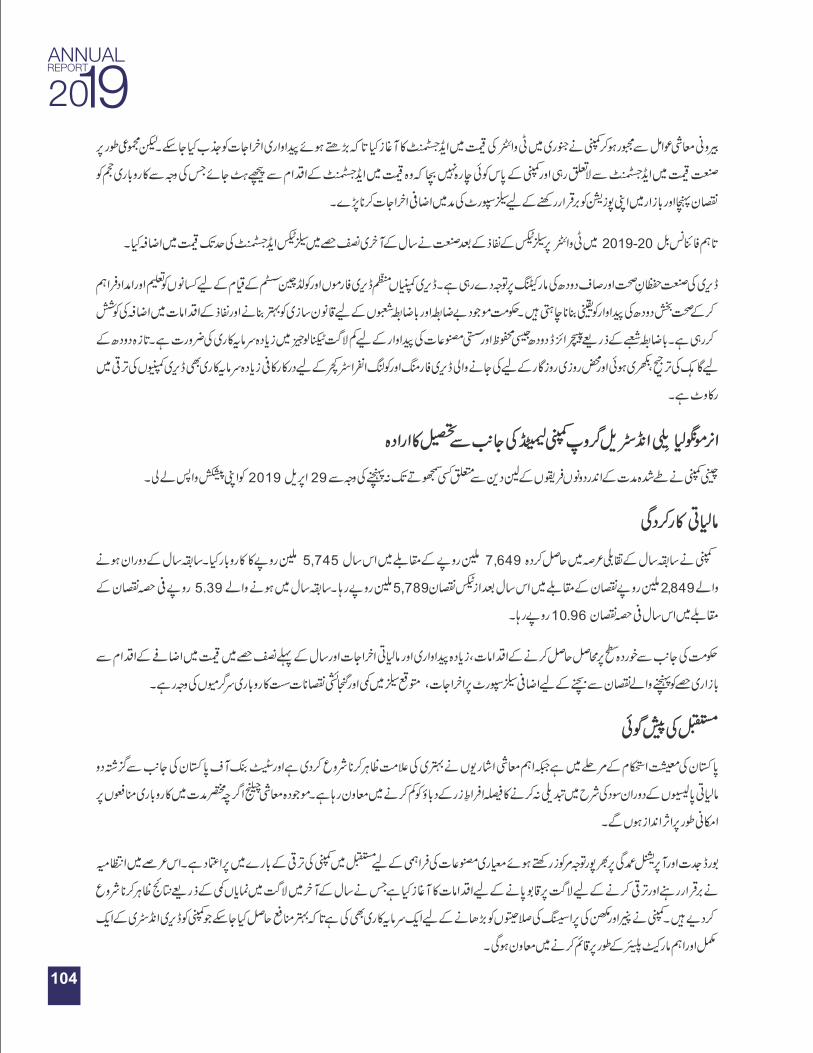
104
105

106
107
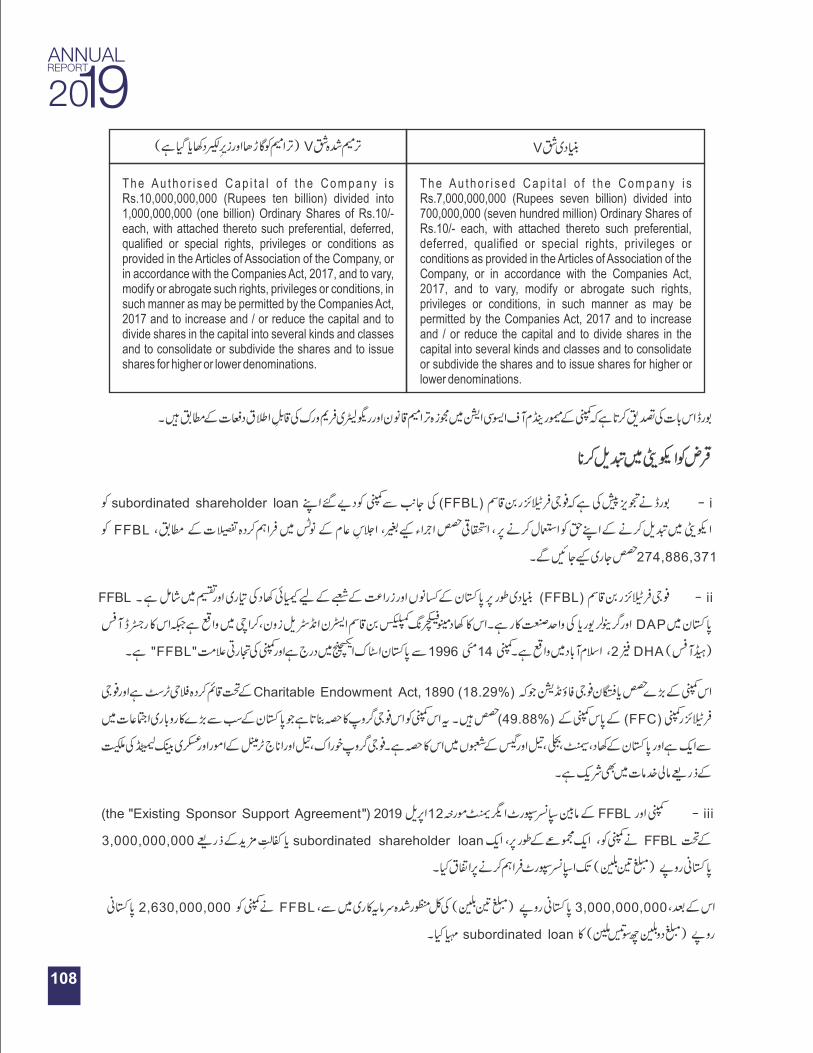
108
T h e A u t h o r i s e d C a p i t a l o f t h e C o m p a n y i s Rs.10,000,000,000 (Rupees ten billion) divided into 1,000,000,000 (one billion) Ordinary Shares of Rs.10/- each, with attached thereto such preferential, deferred, qualied or special rights, privileges or conditions as provided in the Articles of Association of the Company, or in accordance with the Companies Act, 2017, and to vary, modify or abrogate such rights, privileges or conditions, in such manner as may be permitted by the Companies Act, 2017 and to increase and / or reduce the capital and to divide shares in the capital into several kinds and classes and to consolidate or subdivide the shares and to issue shares for higher or lower denominations.
T h e A u t h o r i s e d C a p i t a l o f t h e C o m p a n y i s Rs.7,000,000,000 (Rupees seven billion) divided into 700,000,000 (seven hundred million) Ordinary Shares of Rs.10/- each, with attached thereto such preferential, deferred, qualied or special rights, privileges or conditions as provided in the Articles of Association of the Company, or in accordance with the Companies Act, 2017, and to vary, modify or abrogate such rights, privileges or conditions, in such manner as may be permitted by the Companies Act, 2017 and to increase and / or reduce the capital and to divide shares in the capital into several kinds and classes and to consolidate or subdivide the shares and to issue shares for higher or lower denominations.
109
110
42 CCA, DHA Phase-VIII, Ex Park View,

111

112