Annual Retail Foods Chile - Amazon S3
16
THIS REPORT CONTAINS ASSESSMENTS OF COMMODITY AND TRADE ISSUES MADE BY USDA STAFF AND NOT NECESSARILY STATEMENTS OF OFFICIAL U.S. GOVERNMENT POLICY Date: GAIN Report Number: Post: Approved By: Prepared By: Report Highlights: The Chilean supermarket industry is constantly looking for new products to satisfy upscale consumer demand. According to interviews with supermarkets and suppliers, among the best prospects are snack foods, including high energy nutritional snacks for sports, fruit juices, cat and dog food, sweeteners, diet or light snacks and candies and cereals. Santiago Richard Hartley, Agricultural Assistant Rachel Bickford, Agricultural Attaché Annual Retail Foods Chile CI1054 12/30/2011 Required Report - public distribution
-
Upload
khangminh22 -
Category
Documents
-
view
1 -
download
0
Transcript of Annual Retail Foods Chile - Amazon S3
THIS REPORT CONTAINS ASSESSMENTS OF COMMODITY AND TRADE ISSUES MADE BY
USDA STAFF AND NOT NECESSARILY STATEMENTS OF OFFICIAL U.S. GOVERNMENT
POLICY
Date:
GAIN Report Number:
Post:
Approved By:
Prepared By:
Report Highlights:
The Chilean supermarket industry is constantly looking for new products to satisfy upscale consumer
demand. According to interviews with supermarkets and suppliers, among the best prospects are snack
foods, including high energy nutritional snacks for sports, fruit juices, cat and dog food, sweeteners,
diet or light snacks and candies and cereals.
Santiago
Richard Hartley,
Agricultural Assistant
Rachel Bickford,
Agricultural Attaché
Annual
Retail Foods
Chile
CI1054
12/30/2011
Required Report - public distribution
Executive Summary: Section I. Market Summary
In 2010, retail sales remained stable representing 22% of Chile’s GDP. In total, retail sales
reached US$45.5 billion, with retail food caputuring 26.2% or US$ 13.5 billion. This is an 8.4%
growth from 2009.
Despite the 2010 recession, Chile’s GDP grew 5.2%. GDP is expected to grow between 4% and
6% in 2012. Higher consumer spending power, well developed physical infrastructure and a
business-friendly regulatory environment are key factors behind this forecasted growth.
Consumer spending per capita is set to increase from US$8,685 in 2009 to US$11,183 by 2014.
Chileans have a “Mediterranean diet”, with staple foods such as bread, rice, pasta, pork, chicken,
legumes, fruit and vegetables, seafood and dairy products.
3 main supermarket chains account for nearly 90% of sales.
There has been a 12.5% increase in the number of supermarkets in 2011 (one new store opening
every 3 days).
The market for consumer-ready food products and imports is concentrated in Santiago, where
higher incomes and the city’s population density command almost half of the country’s
consumer demand. Supermarkets serve about 60% of the grocery market.
Convenience stores, gas marts and kiosks sell limited quantities of imported candy and snack
foods. These stores do not generally import directly, but rather purchase from local
wholesalers/distributors.
In the last eight years, Chile has increased its agricultural exports by 149%. Chile’s unique and
diverse climate allow the country to produce a wide variety of agricultural products with a high
level of food purity, and Chile has become a very important player in certain agricultural
sectors:
Chile is the number 1 exporter in the southern hemisphere for apples, peaches,
nectarines, blueberries, raisins, nuts, prunes, and almonds.
Chile is the number 2 world exporter of plums.
Chile is the number 2 world exporter of kiwis and salmon.
Favorable credit conditions and the easy access to store credit cards have contributed to an
improved retail demand in recent years.
Chileans spend on average around 20% of their household income on food, drinks and tobacco.
In per capita terms, Chile is the second greatest consumer of bread in the world after Germany,

the third greatest consumer of tea, and an important consumer of pasta, rice, seafood, carbonated
beverages and beer.
Retail Food Sales
The supermarket industry represents 26% of the total sales of the retail market
The retail food sector reached US$ 13.5 billion in 2010
Retail Sales Distribution, 2010
Supermarket26%
Hardware Store21%
Other22%
Department Store14%
Traditional8%
Pharmacy6%
Local Consumption
3%
Source: AC Nielsen 2010
Food Sales per Sub-Sector, 2010
Traditional Stores; 18%
Supermarkets and
Hypermarkets;
61%
Convenience Stores & Gas Marts; 21%
Source: AC Nielsen 2010

10
11
12
13
14
15
16
17
2009 2010 2011* 2012* 2013* 2014* 2015*
Retail Food Sales, 2010 (US$ Billion)
Source: AC Nielsen 2010
Imports and Local Production
For the first quarter of 2009 Chile had imported US$ 1.2 billion of food, drink and tobacco. This
represents a 20% decrease compared to the same period of 2008.
For the same period Chile exported US$ 3.8 billion of food, drinks, and tobacco. This is a slight
decrease of 0.9% compared to the same period in 2008.
Chilean Food Production, 2010
Processed Food21%
Fresh Fruit24%
Wine13%
Salmon18%
Other Seafood11%
Meat7%
Other6%
Source: Chile Alimentos

Main Sub Sectors
Consumer Preference for Food Purchases
61 61 61 61 60 60
8 8 8 8 9 10
19 18 18 18 19 20
12 12 12 12 12 10
0%
10%
20%
30%
40%
50%
60%
70%
80%
90%
100%
2006 2007 2008 2009 2010 2011
Supermarkets Convenience Stores Traditional Stores Other
Source: AC Nielsen
Number and type of food and beverages retail outlets
Year 2010 2011
Supermarkets 1,102 1,157
Convenience Stores and Gas Marts 803 915
Traditional Stores, Liquor Stores and Kiosks 99,787 100,286
Restaurants and Bars 16,944 17,807
Total 118,636 120,165 Source: Corporate Profiles
Supermarkets & Hypermarkets
The number of supermarkets and hypermarkets increased 9.3% in 2011, totaling 1,157. In comparison,
traditional stores increased .05% and convenience stores grew by 14%. Supermarket sales have
increased 6.6% in the first half of 2011, and are expected to have a total increase of 7% by the end of the
year.
Supermarkets are clearly the most important channel representing 61% of retail food sales, despite only
representing 1% of sales outlets. Supermarket sales are strongest in the Santiago Metropolitan Region
reaching 43.3% of total supermarket sales in Chile. Valparaiso registered the next highest volume of
10.5%, and the Bio-Bio Region was third with 9.8%.
The supermarket industry is steadily growing, despite the economic downturn in 2010. The Chilean
Association of Supermarkets (ASACH) predicts a 4% growth for 2012. Supermarkets in Chile have
around a 65% level of market penetration compared to 85-90% for supermarkets in more developed
markets.
The most significant development over the last two years has been the kind of supermarket which has
been opening. The latest trend is to open small to medium-size supermarkets of between 400 m2 to
1,000 m2.
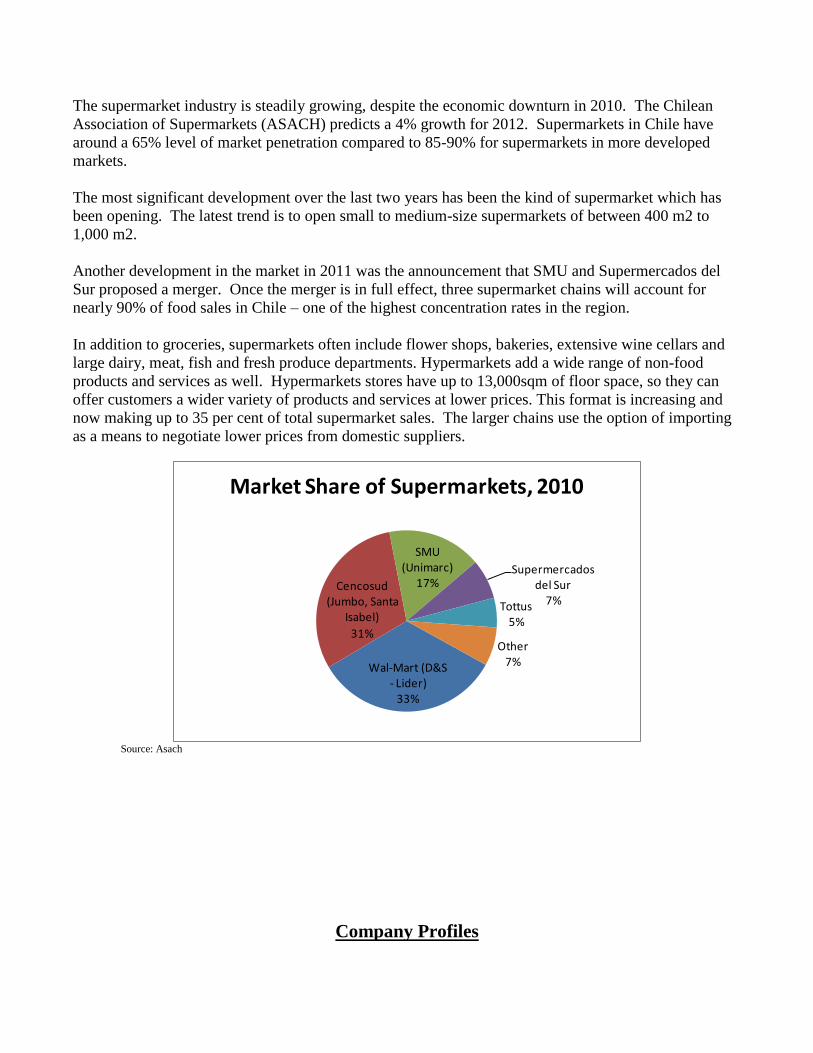
Another development in the market in 2011 was the announcement that SMU and Supermercados del
Sur proposed a merger. Once the merger is in full effect, three supermarket chains will account for
nearly 90% of food sales in Chile – one of the highest concentration rates in the region.
In addition to groceries, supermarkets often include flower shops, bakeries, extensive wine cellars and
large dairy, meat, fish and fresh produce departments. Hypermarkets add a wide range of non-food
products and services as well. Hypermarkets stores have up to 13,000sqm of floor space, so they can
offer customers a wider variety of products and services at lower prices. This format is increasing and
now making up to 35 per cent of total supermarket sales. The larger chains use the option of importing
as a means to negotiate lower prices from domestic suppliers.
Wal-Mart (D&S - Lider)
33%
Cencosud (Jumbo, Santa
Isabel)
31%
SMU (Unimarc)
17%Supermercados
del Sur7%Tottus
5%
Other7%
Market Share of Supermarkets, 2010
Source: Asach
Company Profiles

Retail Name Ownership Number of Outlets
Sales (US$ Million)
Locations
D&S / Walmart (Lider, Ekono)
U.S. 277 $ 4,636 Nationwide
Cenosud (Jumbo & Santa Isabel)
Local 170 $ 3,240 Nationwide
SMU (Unimarc, Supermercados del Sur)
Local 500+ $ 3,200 Nationwide
Tottus Local 40 $ 1,266 Santiago and Regions
II, V-VII
D&S/Wal Mart (www.dys.cl)
Chile’s largest supermarket chain has 33% of the market. To improve on the low profit margins offered
by most food and drink items, D&S is moving further into sales of non-food lines like household goods
and financial services.
Its alliance with the Chilean bank Banco del Estado offers clients a range of financial service products
across its store network. Its Presto credit card accounts for over 20% of total sales, and interest revenue
contributes to overall profits. This trend is in line with the rest of the retail industry in Latin America -
with financial services operations accounting for an increasing share of revenues.
Wal Mart acquired D&S stock in 2008. Since then, Wal-Mart has introduced several private label
brands which make the market highly price competitive.
Cencosud (www.cencosud.cl)
Cencosud is one of the most important Chilean retail holdings, and in fact, among the most important in
Latin America. They have hypermarkets, supermarkets, home improvement stores, shopping centers,
department stores, credit cards and insurance business. Cencosud has two supermarket/hypermarket
brands, Jumbo and Santa Isabel, which together account for 31% of the market share.
Jumbo, Chile’s third largest supermarket chain in number of locations (second in sales) has 28 stores in
Chile.
Jumbo’s strategy is focused on the quality of its products and services. It is the first supermarket
worldwide in implementing the international norms (BRC, IFS) and HACCP (Hazard Analysis and
Critical Control Points).
Cencosud is actively expanding into other South American countries including Brazil, Peru, Argentina,
and Colombia.
Santa Isabel has the second largest number of supermarkets in Chile (ranking third in sales), with 138
stores in the country, offering a wide variety of grocery products as well as its own private-label Cinco
Continentes brand. Santa Isabel’s strategy focuses on offering the lowest prices.
SMU / Unimarc (www.unimarc.cl)
In October 2011, Unimarc merged with Supermercados del Sur making SMU the third largest holder of
retail foods share in Chile. They currently have 17% of the market.
Tottus (www.falabella.cl)
This supermarket is owned by the Falabella Group, another dominant Chilean-owned retailing
conglomerate that ranks among the largest in Latin America, and has a 5% market share in Chile.
Tottus has been present in the supermarket sector since 2004, and has grown with Falabella’s purchase
of the San Francisco supermarket chain. Falabella is also expanding its operations to other Latin
American countries including Argentina, Peru, and Colombia.
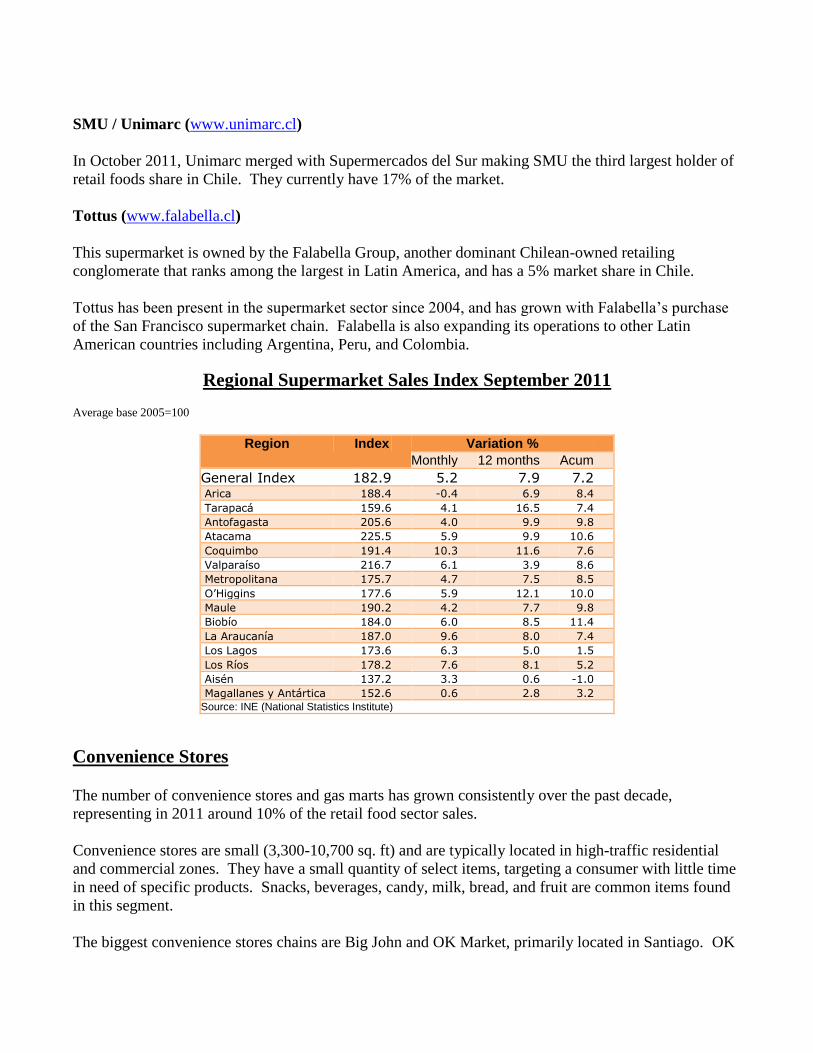
Regional Supermarket Sales Index September 2011 Average base 2005=100
Region Index Variation %
Monthly 12 months Acum
General Index 182.9 5.2 7.9 7.2 Arica 188.4 -0.4 6.9 8.4 Tarapacá 159.6 4.1 16.5 7.4 Antofagasta 205.6 4.0 9.9 9.8 Atacama 225.5 5.9 9.9 10.6 Coquimbo 191.4 10.3 11.6 7.6 Valparaíso 216.7 6.1 3.9 8.6 Metropolitana 175.7 4.7 7.5 8.5 O’Higgins 177.6 5.9 12.1 10.0 Maule 190.2 4.2 7.7 9.8 Biobío 184.0 6.0 8.5 11.4 La Araucanía 187.0 9.6 8.0 7.4 Los Lagos 173.6 6.3 5.0 1.5 Los Ríos 178.2 7.6 8.1 5.2 Aisén 137.2 3.3 0.6 -1.0 Magallanes y Antártica 152.6 0.6 2.8 3.2 Source: INE (National Statistics Institute)
Convenience Stores
The number of convenience stores and gas marts has grown consistently over the past decade,
representing in 2011 around 10% of the retail food sector sales.
Convenience stores are small (3,300-10,700 sq. ft) and are typically located in high-traffic residential
and commercial zones. They have a small quantity of select items, targeting a consumer with little time
in need of specific products. Snacks, beverages, candy, milk, bread, and fruit are common items found
in this segment.
The biggest convenience stores chains are Big John and OK Market, primarily located in Santiago. OK

Market is owned by Salcobrand. They have long hours and an important variety of products, like bread,
sodas, fruits, confectionaries, wine and liquors. Liquor sales represent 19% of total revenue.
In 2007, D&S entered the convenience store market with their own store chain, under the Ekono brand,
which has an average floor space of 3,700 sq. ft.
Gas Marts
The gas station convenience store concept is an ever growing market in Chile. At the end of 2011 there
were 551 minimarkets of this type -- this figure representing a 26% growth in the market in four years.
Copec is the market leader with 263 stores (48% of the market) followed by the Brazilian state-run
Petrobras with 115 (21%). Petrobras entered the market in 2008 by acquiring ExxonMobil’s stations in
Chile. Colombian company Terpel is the third largest with 97 stores (17%), and then Shell with 76
stores (14%). The most popular products in these gas marts are soft drinks, juices, and ice creams.
Effective May 31, 2011, Shell Group in Chile transferred their businesses to Quiñenco S.A., one of
Chile's largest business conglomerates. Quiñenco is the controlling entity of a number of leading
industrial and financial services companies in diverse sectors of the Chilean economy.
Number of Gas Mart Stores by Company
Traditional Markets
Although this category represents 98% of all retail food channel stores, its share of sales is less than
20%. These outlets tend to offer an array of items and profit from their convenient locations. Most of
these outlets have minimal imported food stock.
Trends in Distribution Channels
The market continues to consolidate through mergers, leaving a wide gap in size and capacity between
the leading food retailers and the smaller ones.
Artisanal production of bakery is popular in Chile; hence, 80% of total bakery sales are concentrated in
traditional bakeries. Of this 80%, approximately 43% is sold through bakery distribution companies
and 37% in stores. The other 20% is sold at supermarket chains.
With the trend over the last three years leaning towards offering as many products and services as
possible in the same location, there is an increase in strip malls and neighborhood commercial centers
located in strategic corners with ample parking and easy street access.
Convenience stores have experienced a transformation: previously they were based on the minimarket
concept, but now most of them are associated with important pharmacy chains to expand their target
group.
Other Trends
Santiago is the most valuable consumer target for high-end products because the majority of the
country’s population is there, as well as the higher incomes.
About 10-15% of products sold in supermarkets are imported, but this segment has grown by
85% over the last five years. The U.S.-Chile FTA prompted new interest in U.S. products and
opened new opportunities for previously prohibited products.
Obesity is a major concern in Chile, affecting 20% of the population. In order to fight obesity
the government is introducing measures to regulate the food industry. Such measures include:
o Maximum sugar levels
o Maximum levels of fats and salt
o Clear labeling
o Restricted advertising of certain products
Certain processed foods continue to see strong growth as more people join the work force and
eat out of home. Promising products include convenience and fast foods, out-of-home foods,
and healthy foods.
Spicy food is not popular in Chile, especially among the upper class.
Chilean consumers declare that the most valued benefits from specific items are health, quality,
convenience and security.
The organic food market has been steadily growing over the past several years. The market,
which was worth US$200,000 in 2003 and US$7.4 million in 2008, is expected to grow to

US$53 million by 2013. The high price of organic goods is the main obstacle preventing some
from consuming these alternative food products.
Warehouse outlets and wholesale clubs have not yet made an appearance.
Sector Strengths and Weaknesses
Advantages Challenges
Rising consumer spending and adoption of foreign
food types favor new types of inputs. Price sensitivity is becoming stronger because of the rise in
local prices in food and other products.
Chile has the highest GDP per capita in South
America. Domestic fresh fruit and vegetable markets are abundant.
The U.S.-Chile FTA, which went into force in 2004,
is making U.S. products more competitive. Quality of food ingredients from around the world has become
very similar, abiding by U.S. and European standards.
U.S. food inputs are known for their quality and low
health concerns, meeting respected FDA & USDA
standards.
The typical consumer is not immediately attracted to foreign
products, as local producers typically provide well priced
quality options.
The relatively weak dollar compared to the Chilean
peso will make imports from the U.S. more
competitive.
Artisanal products have a significant share of the market.
Chileans tend to prefer fresh foods, which are perceived as
higher quality.
The country’s population of 17.1 million is very
centralized, with over 40% living in the Santiago
Metropolitan Region.
Chile is a predominantly exporting nation, having abundant
agricultural resources; only 15-20% of products sold in
supermarkets are imported.
Chile has one of the highest percentages of non-
traditional store sales in Latin America, which
allows suppliers to target large retail chains for
larger volume sales.
Local consumers often have strong brand loyalty, making it
difficult for new U.S. companies to enter the market. Can be a
future benefit once the company gains popularity.
Foreign companies may conduct business in Chile
on the same basis as local companies and enjoy
guaranteed access to foreign exchange for
repatriation of capital and profits.
Prices for U.S. products may still be higher than local products
or imports from nearby countries, even after the FTA. FOB
prices for U.S. inputs tend to be at least 10% higher than local
prices for equivalent quality.
Section II. Road Map for Market Entry
Large corporations increasingly prefer to import directly from foreign suppliers, while smaller
retailers are often not able to purchase whole containers or prefer that a distributor manages
logistics and their inventory. Eventually, large sales volumes would justify establishing a local
subsidiary to guarantee customer service and quality levels.
All edible products must be approved by the Chilean health authorities and receive a registration
number and open sales permit before being put on the market.
Distribution trade is very receptive to U.S. products as they are a guarantee of quality and good
packaging. When possible, buyers try to avoid local middlemen and buy direct in order to keep
profit margins and remain competitive.
U.S. food products are respected for their high quality levels, but prices are generally
uncompetitive. To compete in Chile, U.S. producers need to consider lower profit margins.

Specialty, value-added products have a better chance of success than more basic products, which
are often sourced locally.
In order to enter the market, products must meet certain criteria:
Food must be labeled
Information must be in Spanish
Information must include country of origin, name, ingredients, additives, weight/volume,
packaging/manufacture date, expiration date, details of the person responsible for the
sale.
Livestock and vegetation require food certificates from the country of origin
Keys to Successfully Enter and Develop the Chilean Market
To be successful in the Chilean market, it is important to have a strong proactive attitude, long-term
commitment to the market, marketing and promotion programs, good customer service, flexibility with
minimum order quantities, and well crafted terms of payment. High U.S. market shares are linked
mainly to a product’s uniqueness (e.g. peanut butter and baked beans) or special characteristics (above-
average quality with respect to health, service and delivery capabilities).
Below are some recommendations to consider when entering the Chilean market:
Make an effort to develop and nurture strong relationships with good distributors and large
retailers in order to become a trusted business partner
In order to remain competitive, be aware of price sensitivity because of the rise in local prices in
food and other products
Good image and packaging of imported products is expected and will position the product in the
medium to high end of the market
For new and different products, consider in-store tastings as part of a launch plan to increase the
chances of market entry
Market Structure
Food sales generally go to supermarkets, followed by traditional retailers and to a small extent to
institutions (HRI food services). Institutional sales are often handled as a separate business by the food
companies.
Small neighborhood food stores continue to grow in number but nevertheless they struggle to compete
with the large supermarket chains which are constantly gaining a higher market share as smaller
independent stores cannot match the efficiencies and location advantages of market-leading
hypermarkets.
If sales volumes are not high, direct imports will generally not be of interest to Chilean buyers because
the costs and effort required to get an edible product approved are disproportionately high. In this case,

it is more reasonable to have a local representative/distributor handle the import process, health
approval, marketing, promotion, selling and stocking.
Distribution Channel Flow Diagram for Imported Foods & Beverages
Section III. Competition
Chile is one of the world’s top leaders in free trade having international trade agreements with 58
countries, representing 85 percent of the world’s GDP and 80 percent of the world’s population.
The U.S. - Chile FTA came into effect on January 1st, 2004. It immediately eliminated tariffs on almost
90% of U.S. products imported into Chile and more than 95% of Chilean exports to the United States.
Tariffs on all products will be eliminated by 2016. Bilateral trade in all goods grew by 33% that same
year, reaching nearly US$ 8 billion, while U.S. exports of consumer-oriented food products to Chile
grew by 54%.
Although the FTA allows immediate duty-free entry into Chile for the majority of U.S. goods, Chile’s
two free trade zones (Iquique and Punta Arenas) still offer some advantages. Modern facilities for
packaging, manufacturing, and exporting exist in each zone. Imports entering and remaining in the Free
Zones only pay value-added tax (VAT) when brought into Chile. The extreme locations of each zone
(north and south) diminish their effectiveness as a source of distribution to Santiago.
U.S. and Chile tariff schedules can be found at www.ustr.gov/new/fta/Chile/text/, “Section 3. National
Treatment and Market Access for Goods.”
Comparative Chilean Food and Agricultural Product Imports
Product Total Imports
2010 (US$) U.S. Imports 2010 (US$)
U.S. Imports % Change ’10/’09
U.S. % Market Share
Main Competitors (% of market share)
Beef $707,802,655 $5,573,821 361.97% 0.79% Paraguay (61%), Brazil (15%), Argentina (13%)
Dairy Products $43,497,682 $17,044,768 177.39% 39.19% U.S. (39%), Argentina (36%), New Zealand (5%)
Fish & Seafood $107,648,196 $664,884 -10.47% 0.62% Ecuador (36%), Thailand (16%), Colombia (15%)

Fresh Fruit $64,271,018 $6,826,168 273.72% 10.62% Ecuador (89%), U.S. (3%), Peru (3%)
Fresh Vegetables $7,921,179 $201,342 -9.04% 2.54% China (63%), Peru (25%), Argentina (9%)
Fruit & Vegetable Juices $29,174,868 $1,284,167 23.53% 4.40%
Argentina (38%), Brazil (36%), South Africa (8%)
Pet Food $67,749,514 $5,039,850 2.05% 7.44% Argentina (87%), U.S. (7%), Brazil (3%)
Pork $37,925,090 $10,022,477 272.3% 26.43% Canada (46%), U.S. (26%), Brazil (21%)
Poultry $105,825,639 $19,410,261 1700.4% 18.34% Argentina (60%), Brazil (21%), U.S. (18%)
Processed Fruits & Vegetables
$130,373,663 $14,727,675 47.73% 11.30% Argentina (19%), Belgium (12%), U.S. (11%)
Rice $63,993,287 $810,636 181.24% 1.27% Argentina (66%), Vietnam (14%), Uruguay (7%)
Snack Foods $96,445,795 $8,447,767 29.20% 8.76% Argentina (31%), Colombia (12%), U.S. (9%)
Tea $48,728,206 $384,150 94.32% 0.79% Sri Lanka (42%), Argentina (32%), Brazil (8%)
Wine & Beer $58,710,666 $11,619,076 209.94% 19.79% Argentina (31%), Mexico (31%), U.S. (20%)
Section IV. Best Product Prospects
Category A: Products Present in the Market That Have Good Sales Potential
Functional foods are showing good growth potential as increasingly health-conscious consumers seek
new products. The dairy sector is one of the most important players in this respect with pro-biotic
products becoming more popular.
Pork has become the country’s second preferred meat after chicken. Chicken consumption is over 25 kg
per capita annually, pork 20 kg, and beef 19.9 kg.
Major products in this category are:
Baby Formulas
Baking food and Mixes
Breads & Cookies
Candy (gummies, chewing gum, etc…)
Cereal
Dairy Products (cheese, yoghurt, milk varieties)
Fruit Juice
Healthy Food Products and Energy Supplements
Hot Dogs
Ice Cream
Olive Oil & Cooking Oil
Pastas
Pet Food
Pork, Turkey and Chicken
Rum, Vodka, Beer, and Whisky
Snacks
Soft Drinks, Energy Drinks

Sweeteners
Tomato Sauces
Tuna
Category B: Products Not Present in Significant Quantities
Products in this category are newly developed and recently introduced products with health certificates
being finalized. Also, there are products, like beef, that are being sought because of recent changes in
supply and demand. Major products in this category are:
Beef
Cocoa powder
Ethnic foods
Organic products
Processed meat products
Ready-to eat meals/prepared plates
Spices, sauces and mayonnaise
Category C: Products Not Present in the Market Because They Face Significant Barriers
There are very few products in this category. The U.S. and Chile are engaged in technical discussions
regarding several of the products below:
Honey and honey derived products (American Broth Disease)
Fresh pork (self-imposed barrier)
Genetically modified (GMO) products without registered events in Chile
All poultry except chicken and turkey (i.e. duck)
Section V. Post Contact and Further Information
American Embassy Santiago, Office of Agricultural Affairs Address: Office of Agricultural Affairs
3460 Santiago Place
Washington D.C., 20521-3460
Tel.: (56-2) 330-3704
Fax: (56-2) 330-3203

E-mail: [email protected]
Web Page: http://www.fas.usda.gov
For further information, check the "Food and Agriculture" home page on the U.S. Embassy Santiago
web site (www.usdachile.cl)
SEREMI de Salud (Chile's Food Sanitation Regulations)
Address: Avenida Bulnes 194, Santiago
Tel: (56-2) 399-2435
Web Page: www.seremisaludrm.cl
Chilean Supermarket Association (ASACH) Address: Av. Vitacura 2771, Las Condes, Santiago
Tel.: (56-2) 236-5150
Fax: (56-2) 236-5133
Web Page: www.asach.com
E-Mail: [email protected]