Annual Report 2016-2017 - EIH Limited
223
Annual Report 2016-2017
-
Upload
khangminh22 -
Category
Documents
-
view
1 -
download
0
Transcript of Annual Report 2016-2017 - EIH Limited
Annual Report 2016-2017
VOTED THE WORLD’S BEST HOTEL BRAND by the readers of Travel + Leisure, USA in the 2015 and 2016
World’s Best Awards
VOTED THE WORLD’S LEADING LUXURY HOTEL BRANDfrom 2012 to 2016 by World Travel Awards
Our endeavour is to create memories for our guest that last a lifetime. We are unrelenting in our quest for perfection in every thing we do – from hotel design and décor to creating an environment for our team that encourages them to provide our guests with warm and intuitive service.
Our commitment to excellence, attention to detail and personalised service has once again been appreciated and recognised by our guests. In 2016, Oberoi Hotels & Resorts was recognised as the World’s Leading Luxury Hotel Brand at the World Travel Awards, for the fifth consecutive year. Also in 2016, at the World’s Best Awards, readers of Travel + Leisure, USA voted Oberoi Hotels & Resorts the World’s Best Hotel Brand for the second consecutive year.
The recognition that we continue to receive is a testament to the vision of our founder, Rai Bahadur M. S. Oberoi. Taking his legacy forward, our Executive Chairman, Mr. P. R. S. Oberoi continues to inspire our employees to set global benchmarks in service excellence.
The images in the Annual Report showcase the attention to design detail and traditional and authentic craftsmanship that makes each Oberoi hotel special and unique.

CONTENTS
The Board of Directors 8
The Oberoi Dharma 10
The Oberoi Group Mission 11
Highlights 12
Chairman’s Review 14
Directors’ Report 16
Business Responsibility Report 27
Management Discussion and Analysis 57
Report on Corporate Governance 65
Secretarial Audit Report 85
Independent Auditor’s Report 89
Balance Sheet 98
Statement of Profit and Loss 99
Cash Flow Statement 100
Statement of Changes in Equity 102
Notes to Accounts 103
Consolidated Financial Statements 149

6

7
The Late Rai Bahadur M.S. Oberoi Founder of The Oberoi Group
1898-2002
BOARD OF DIRECTORS
Mr. P.R.S. OberoiExecutive Chairman
Mr. S.S. MukherjiExecutive Vice Chairman
Mr. Vikram OberoiManaging Director and Chief Executive Officer
Mr. Arjun OberoiManaging Director- Development
Mrs. Nita M. AmbaniDirector
Mrs. Renu Sud KarnadIndependent Director
Mr. Manoj Harjivandas ModiDirector
Mr. Rajeev GuptaIndependent Director
Mr. S.K. DasguptaIndependent Director
Mr. Anil K. NehruIndependent Director
Mr. Sudipto SarkarIndependent Director
Mr. L. Ganesh Independent Director
COMPANY SECRETARY & COMPLIANCE OFFICERMr. S. N. Sridhar
AUDITORSRay & Ray, Chartered Accountants Webel Bhavan, Ground Floor, Block EP & GP Sector V, Bidhan Nagar, Salt Lake Kolkata-700 091
REGISTERED OFFICE4, Mangoe Lane Kolkata 700 001
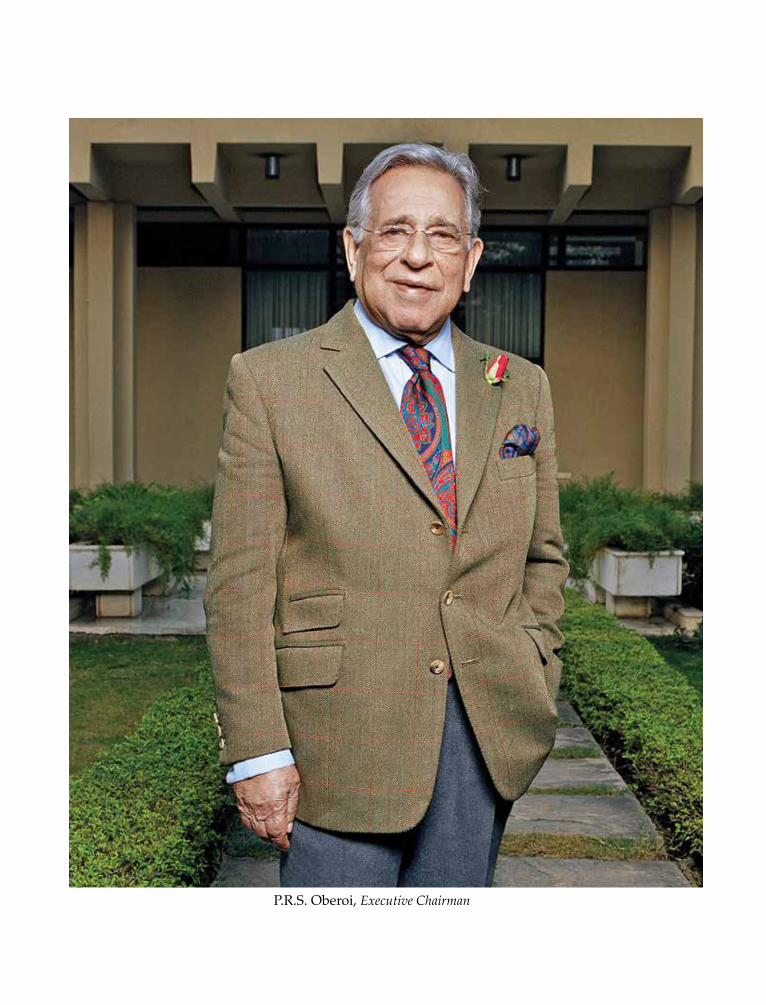
P.R.S. Oberoi, Executive Chairman
The Oberoi Dharma
We, as members of The Oberoi Group are committed to display through our behaviour and actions the following conduct, which applies to all aspects of our business :
• Conduct which is of the highest ethical standards - intellectual, financial and moral and reflects the highest levels of courtesy and consideration to others.
• Conduct which builds and maintains team work, with mutual trust as the basis of all working relationships.
• Conduct which puts the customer first, the Company second and the self last.
• Conduct which exemplifies care for the customer through anticipation of need, attention to detail, excellence, aesthetics and style and respect for privacy along with warmth and concern.
• Conduct which demonstrates two-way communication, accepting constructive debate and dissent whilst acting fearlessly with conviction.
• Conduct which demonstrates that people are our key asset, through respect for every employee, and leading from the front regarding performance achievement as well as individual development.
• Conduct which at all times safeguards the safety, security, health and environment of guests, employees and the assets of the company.
• Conduct which eschews the short-term quick-fix for the long-term establishment of healthy precedent.
The Oberoi Group Mission
Our GuestsWe are committed to meeting and exceeding the expectations of our guests through our unremitting dedication to every aspect of service.
Our PeopleWe are committed to the growth, development and welfare of our people upon whom we rely to make this happen.
Our DistinctivenessTogether, we shall continue the Oberoi tradition of pioneering in the hospitality industry, striving for unsurpassed excellence in high-potential locations all the way from the Middle East to the Asia-Pacific.
Our ShareholdersAs a result, we will create extraordinary value for our shareholders.
12
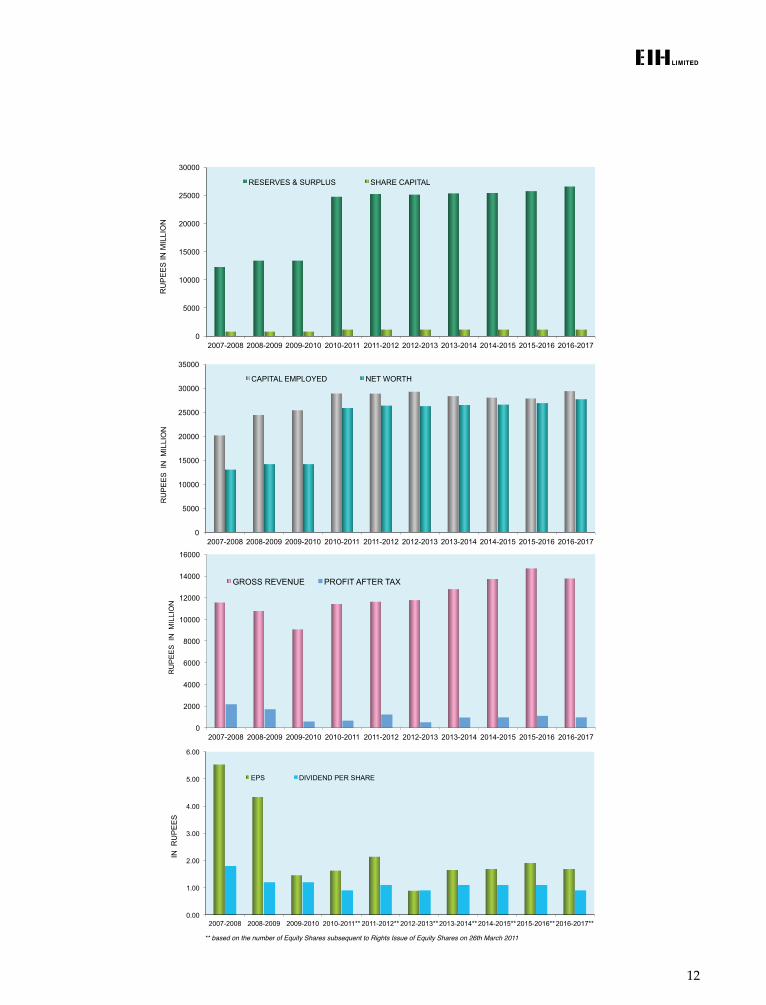
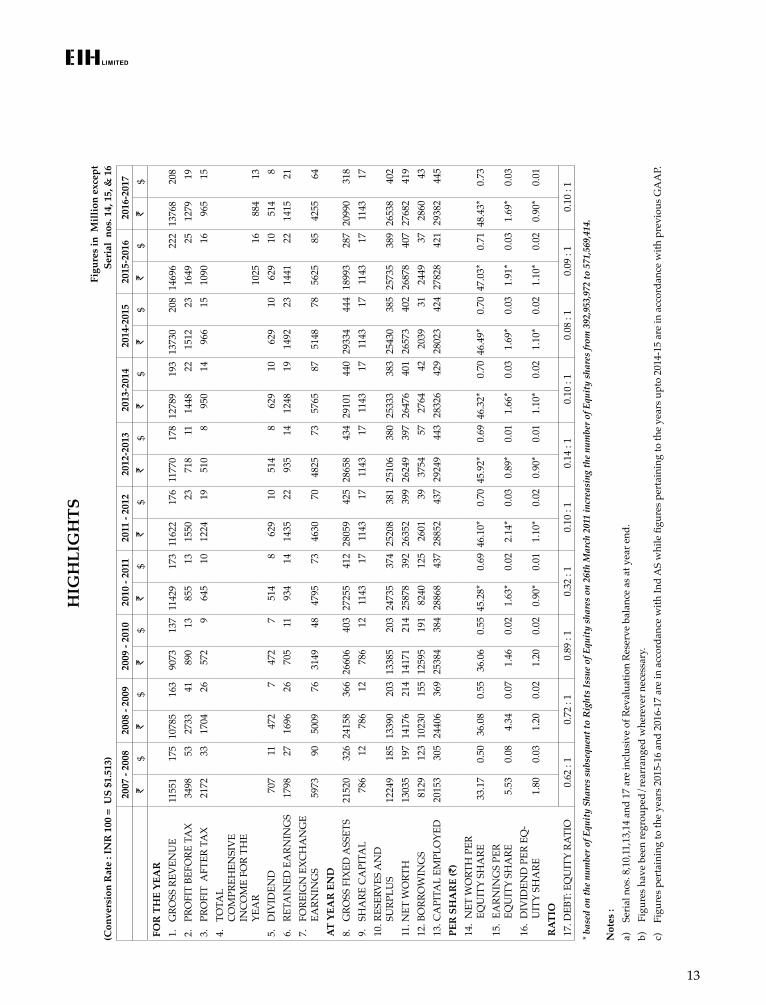
** based on the number of Equity Shares subsequent to Rights Issue of Equity Shares on 26th March 2011
0.00
1.00
2.00
3.00
4.00
5.00
6.00
2007-2008 2008-2009 2009-2010 2010-2011** 2011-2012** 2012-2013** 2013-2014** 2014-2015** 2015-2016** 2016-2017**
IN R
UP
EE
S
EPS DIVIDEND PER SHARE
0
2000
4000
6000
8000
10000
12000
14000
16000
2007-2008 2008-2009 2009-2010 2010-2011 2011-2012 2012-2013 2013-2014 2014-2015 2015-2016 2016-2017
RU
PE
ES
IN
MIL
LIO
N
GROSS REVENUE PROFIT AFTER TAX
0
5000
10000
15000
20000
25000
30000
2007-2008 2008-2009 2009-2010 2010-2011 2011-2012 2012-2013 2013-2014 2014-2015 2015-2016 2016-2017
RU
PE
ES
IN M
ILLI
ON
RESERVES & SURPLUS SHARE CAPITAL
0
5000
10000
15000
20000
25000
30000
35000
2007-2008 2008-2009 2009-2010 2010-2011 2011-2012 2012-2013 2013-2014 2014-2015 2015-2016 2016-2017
RU
PE
ES
IN
MIL
LIO
N
CAPITAL EMPLOYED NET WORTH
13
HIG
HLI
GH
TSFi
gure
s in
Mill
ion
exce
pt(C
onve
rsio
n R
ate
: IN
R 1
00 =
US
$1.5
13)
Seri
al n
os. 1
4, 1
5, &
16
2007
- 20
0820
08 -
2009
2009
- 20
1020
10 -
2011
2011
- 20
1220
12-2
013
2013
-201
420
14-2
015
2015
-201
620
16-2
017
`$
`$
`$
`$
`$
`$
`$
`$
`$
`$
FOR
TH
E YE
AR
1.
GRO
SS R
EVEN
UE
1155
117
510
785
163
9073
137
1142
917
311
622
176
1177
017
812
789
193
1373
020
814
696
222
1376
820
82.
PR
OFI
T BE
FORE
TA
X34
9853
2733
4189
013
855
1315
5023
718
1114
4822
1512
2316
4925
1279
193.
PR
OFI
T A
FTER
TA
X21
7233
1704
2657
29
645
1012
2419
510
895
014
966
1510
9016
965
154.
TO
TAL
C
OM
PREH
ENSI
VE
IN
CO
ME
FOR
THE
YEA
R10
2516
884
135.
D
IVID
END
707
1147
27
472
751
48
629
1051
48
629
1062
910
629
1051
48
6.
RETA
INED
EA
RNIN
GS
1798
2716
9626
705
1193
414
1435
2293
514
1248
1914
9223
1441
2214
1521
7.
FORE
IGN
EXC
HA
NG
E EA
RNIN
GS
5973
9050
0976
3149
4847
9573
4630
7048
2573
5765
8751
4878
5625
8542
5564
AT
YEA
R E
ND
8.
GRO
SS F
IXED
ASS
ETS
2152
032
624
158
366
2660
640
327
255
412
2805
942
528
658
434
2910
144
029
334
444
1899
328
720
990
318
9.
SHA
RE C
API
TAL
786
1278
612
786
1211
4317
1143
1711
4317
1143
1711
4317
1143
1711
4317
10. R
ESER
VES
AN
D
SURP
LUS
1224
918
513
390
203
1338
520
324
735
374
2520
838
125
106
380
2533
338
325
430
385
2573
538
926
538
402
11. N
ET W
ORT
H13
035
197
1417
621
414
171
214
2587
839
226
352
399
2624
939
726
476
401
2657
340
226
878
407
2768
241
912
. BO
RRO
WIN
GS
8129
123
1023
015
512
595
191
8240
125
2601
3937
5457
2764
4220
3931
2449
3728
6043
13. C
API
TAL
EMPL
OYE
D20
153
305
2440
636
925
384
384
2886
843
728
852
437
2924
944
328
326
429
2802
342
427
828
421
2938
244
5PE
R S
HA
RE
(`)
14.
NET
WO
RTH
PER
EQ
UIT
Y SH
ARE
33.1
7 0
.50
36.0
8 0
.55
36.0
6 0
.55
45
.28*
0
.69
46
.10*
0
.70
45.9
2* 0
.69
46.3
2*
0.7
0 46
.49*
0
.70
47.0
3*
0.7
1 48
.43*
0
.73
15.
EARN
ING
S PE
R
EQU
ITY
SHA
RE 5
.53
0.0
8 4
.34
0.0
7 1
.46
0.0
2 1
.63*
0
.02
2.1
4* 0
.03
0.8
9* 0
.01
1.6
6*
0.0
3 1
.69*
0
.03
1.9
1*
0.0
3 1
.69*
0
.03
16.
DIV
IDEN
D P
ER E
Q-
UIT
Y SH
ARE
1.80
0
.03
1.20
0
.02
1.20
0
.02
0.9
0*
0.0
1 1
.10*
0
.02
0.90
* 0
.01
1.10
* 0
.02
1.10
* 0
.02
1.10
* 0
.02
0.9
0*
0.0
1 R
ATI
O17
. DEB
T: E
QU
ITY
RATI
O 0
.62
: 10.
72 :
10.
89 :
10.
32 :
10.
10 :
10.
14 :
10.
10 :
10.
08 :
10.
09 :
10.
10 :
1
* ba
sed
on th
e nu
mbe
r of E
quit
y Sh
ares
sub
sequ
ent t
o R
ight
s Is
sue
of E
quit
y sh
ares
on
26th
Mar
ch 2
011
incr
easi
ng th
e nu
mbe
r of E
quit
y sh
ares
from
392
,953
,972
to 5
71,5
69,4
14.
Not
es :
a)
Seria
l nos
. 8,1
0,11
,13,
14 a
nd 1
7 ar
e in
clus
ive
of R
eval
uatio
n Re
serv
e ba
lanc
e as
at y
ear e
nd.
b)
Figu
res h
ave
been
regr
oupe
d/re
arra
nged
whe
reve
r nec
essa
ry.
c)
Figu
res p
erta
inin
g to
the
year
s 201
5-16
and
201
6-17
are
in a
ccor
danc
e w
ith In
d A
S w
hile
figu
res p
erta
inin
g to
the
year
s upt
o 20
14-1
5 ar
e in
acc
orda
nce
with
pre
viou
s GA
AP.
14
EXECUTIVE CHAIRMAN’S REVIEW
Ladies and Gentlemen,
Last year was an eventful year for the Travel and Tourism industry. The World Travel and Tourism Council’s (WTTC’s) Economic Impact 2017 Study shows that global tourism grew by 3.3% in 2016. This is a remarkable achievement despite significant challenges facing the global economy. Other serious challenges are terrorism, protectionist postures by several nations, geo-political uncertainties and currency fluctuations. Terrorist attacks are increasing due to misplaced ideologies. It is no longer the bane of traditionally turbulent parts of the globe but is now increasingly prevalent in the heart of the western world. Geo-political uncertainties such as Brexit may have destabilizing effect on the European Travel and Tourism industry.
Prime Minister Modi’s demonetisation scheme was a bold initiative. Demonetisation created unprecedented uncertainties and hardships for some people but the public at large appears to have taken the Prime Minister’s initiative positively. The strong showing of BJP in the last UP State elections was a referendum on Prime Minister Modi’s popularity.
The Real Estate Regulation Act (RERA) came into effect from 1st May 2017. The implementation of RERA will go a long way to rebuild confidence in the important real estate sector and encourage foreign investment in infrastructure projects such as housing etc. This policy bodes well for development of the country.
The Reserve Bank’s announcements encouraging public sector banks to increase provisioning on distressed loans, take haircuts and undertake sale of underlying assets will have a positive effect on the banking system and enable the banks to extend lending in the long run.
The introduction of the Good and Services Tax (GST) on 1st July 2017 will have an adverse impact on the Travel and Tourism industry. The announcement that hotels charging over ` 7,500 in room charges will attract 28% GST will be detrimental to tourism and employment in the hospitality industry.
We must do more to increase tourism from neighbouring Asian countries. Shorter flights, briefer holidays and unique experiences should increase visitors to India. Chinese nationals are travelling in vast numbers to Thailand, Singapore, Vietnam and other South Asian destinations. We must do more to attract visitors from China.
International travellers contribute over US$ 25 billion in foreign currency. As per WTTC, India is presently the 3rd largest domestic aviation market with 100 million domestic passengers. Due to increasing affluence of the Indian middle class, it is expected that air travel will increase exponentially. It is well known that India is
15
not getting its fair share of international travellers. Travel destinations such as Thailand, Singapore, Indonesia, Hong Kong, China and the United Arab Emirates have left us far behind in attracting foreign visitors. The Indian Travel and Tourism industry and the Government must do more to promote India as a unique travel destination.
The Travel and Tourism industry contributes approximately 33% of India’s foreign exchange earnings and has the highest employment potential as compared to other sectors. In the past year, Travel and Tourism employed more than 40 million people; thus contributing to 9.3% of total employment in the country which is expected to rise to 50 million jobs by the year 2027 (9.6% of total). The industry plays a very important role in not only employment but integrates society and drives development.
The Oberoi Group continues to excel as a prominent hotel company. In the year 2016, The Oberoi Brand was recognized as the World’s Best Hotel Brand by readers of the important Travel + Leisure magazine for the 2nd successive year. In November last year, we opened The Oberoi Sukhvilas Resort and Spa, which is a short distance from Chandigarh. In April this year, we opened The Oberoi Beach Resort, Al Zorah in the United Arab Emirates, which has been acclaimed by international travellers. Later this year we will open The Oberoi, Marrakech. This luxury resort is expected to be the best luxury hotel in the city of Marrakech. I am pleased to announce that The Oberoi, New Delhi, which was closed for renovation in April 2016, will reopen in the first quarter of 2018. The Oberoi, New Delhi is expected to retain its iconic position in the Capital which it has enjoyed since it opened in the year 1965.
I am optimistic about the future as I believe that India’s economy will grow from strength to strength.
In conclusion, I thank the Board of Directors, our employees and other stakeholders for their continued support.
Thank you.
P.R.S. OberoiExecutive Chairman
15th June 2017
16
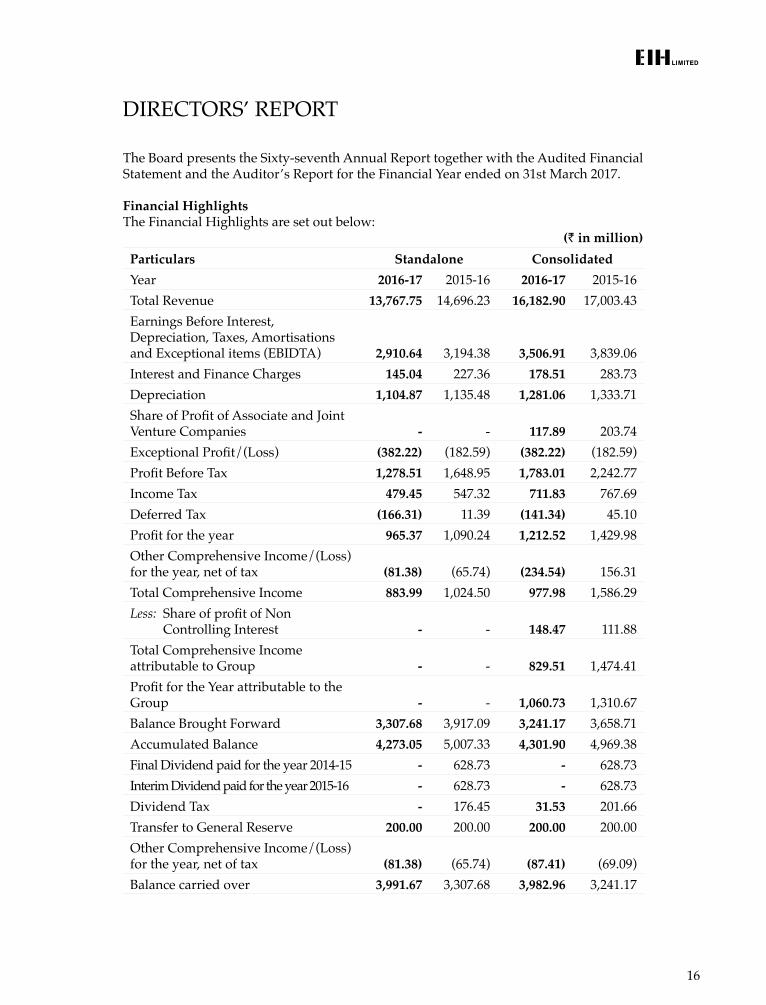
DIRECTORS’ REPORT
The Board presents the Sixty-seventh Annual Report together with the Audited Financial Statement and the Auditor’s Report for the Financial Year ended on 31st March 2017.
Financial HighlightsThe Financial Highlights are set out below: (` in million)
Particulars Standalone Consolidated Year 2016-17 2015-16 2016-17 2015-16Total Revenue 13,767.75 14,696.23 16,182.90 17,003.43Earnings Before Interest, Depreciation, Taxes, Amortisations and Exceptional items (EBIDTA) 2,910.64 3,194.38 3,506.91 3,839.06Interest and Finance Charges 145.04 227.36 178.51 283.73Depreciation 1,104.87 1,135.48 1,281.06 1,333.71Share of Profit of Associate and Joint Venture Companies - - 117.89 203.74Exceptional Profit/(Loss) (382.22) (182.59) (382.22) (182.59)Profit Before Tax 1,278.51 1,648.95 1,783.01 2,242.77Income Tax 479.45 547.32 711.83 767.69Deferred Tax (166.31) 11.39 (141.34) 45.10Profit for the year 965.37 1,090.24 1,212.52 1,429.98Other Comprehensive Income/(Loss) for the year, net of tax (81.38) (65.74) (234.54) 156.31Total Comprehensive Income 883.99 1,024.50 977.98 1,586.29Less: Share of profit of Non
Controlling Interest - - 148.47 111.88Total Comprehensive Income attributable to Group - - 829.51 1,474.41Profit for the Year attributable to the Group - - 1,060.73 1,310.67Balance Brought Forward 3,307.68 3,917.09 3,241.17 3,658.71Accumulated Balance 4,273.05 5,007.33 4,301.90 4,969.38Final Dividend paid for the year 2014-15 - 628.73 - 628.73Interim Dividend paid for the year 2015-16 - 628.73 - 628.73Dividend Tax - 176.45 31.53 201.66Transfer to General Reserve 200.00 200.00 200.00 200.00Other Comprehensive Income/(Loss) for the year, net of tax (81.38) (65.74) (87.41) (69.09)Balance carried over 3,991.67 3,307.68 3,982.96 3,241.17
17
Directors’ Responsibility StatementIn accordance with the provisions of Section 134 (5) of the Companies Act, 2013 (“the Act”) and, based upon representations from the Management, the Board states that:
a) in preparing the Annual Accounts, applicable accounting standards have been followed and there are no material departures;
b) the Directors have selected accounting policies, applied them consistently and made judgments and estimates that are reasonable and prudent to give a true and fair view of the state of affairs of the Company at the end of the financial year and of the profit of the Company for the year;
c) the Directors have taken proper and sufficient care in maintaining adequate accounting records in accordance with provisions of the Act for safeguarding the assets of the Company and for preventing and detecting fraud and other irregularities;
d) the Directors have prepared the Annual Accounts of the Company on a “going concern” basis;
e) the Directors have laid down internal financial controls to be followed by the Company. These internal financial controls are adequate and are operating effectively; and
f) the Directors have devised proper systems to ensure compliance with the provisions of all applicable laws. These systems are adequate and are operating effectively.
PerformanceThe annexed Management Discussion and Analysis forms a part of this report and covers, amongst other matters, the performance of the Company during the Financial Year 2016-17 as well as the future outlook.
Corporate Governance ReportIn accordance with Regulation 34(3) read with Schedule V(C) of the Listing Regulations, the report on Corporate Governance along with the Auditor’s Certificate is attached to this Report.
DividendThe Board recommends a Dividend of ` 0.90 per Equity Share of ` 2 each for the Financial Year 2016-17, for approval by the Shareholders at the forthcoming Annual General Meeting. The dividend, if declared at the Annual General Meeting, will be paid on 3rd August 2017 to those Shareholders whose name appear in the Register of Shareholders/Beneficial Owner as on 25th July 2017. As per the Income Tax Act, 1961, the tax on dividend will be borne by the Company.
Board MeetingsDuring the year, six Board Meetings were held on 26th May 2016, 2nd August 2016, 3rd November 2016, 12th December 2016, 23rd January 2017 and 28th March 2017 respectively.
18
DirectorsMr. Arjun Oberoi retires by rotation at the forthcoming Annual General Meeting and being eligible, offers himself for re-appointment. The Directors recommend re-appointment of Mr. Arjun Oberoi as a Director on the Board.
At the first meeting of the Board for the Financial Year 2016-17 held on 30th May 2017, the six Independent Directors have confirmed that they meet the criteria of independence required under sub-section (7) of Section 149 of the Act. The Board was also of the opinion that the six Independent Directors meet the criteria of independence under sub-section (6) of Section 149 of the Act.
Corporate Social ResponsibilityThe Company’s Corporate Social Responsibility Policy formulated in accordance with Section 135 of the Act read with the Companies (Corporate Social Responsibility Policy) Rules, 2014 is available on the Company’s website www.eihltd.com
The Annual Report on Corporate Social Responsibility activities for the Financial Year 2016-17 is given in Annexure 1 and forms a part of this Report. The Annexure also gives the composition of the CSR Committee.
In addition to the mandatory CSR spend in accordance with the Act, during the year, the Company’s Hotels and Service Units have also taken the following CSR initiatives:
a. The Oberoi Grand, Kolkata supports Sasha, an NGO which works with the local artisans for the upliftment and self-employment of women by purchasing hand-crafted products made by them;
b. The Oberoi, Udaivilas, Udaipur employees visited Mother Teresa Orphanage and Asha Dham Ashram for the poor, sick and mentally challenged old people and supported them by taking care of their needs. Furthermore, during the year the hotel team, with the pledge of contributing to the environment, removed 270 kg of plastic items from Lake Pichola.
c. The Oberoi and Trident Nariman Point, Mumbai organized Blood Donation Camps for Thalassemia patients. It also organised vocational training internships for 52 aspirants under the “Hunar se Rozgaar Tak” scheme. Furthermore, the hotel donated linen and clothes to hospitals treating cancer patients.
d. The Oberoi, Bengaluru nurtures physically challenged girls and economically challenged senior citizens in association with Cheshire Home Trust. The Hotel also celebrated the World Environment Week by planting tree saplings together with guests of the Hotel.
e. The Oberoi Vanyavilas, Ranthambore was involved in the welfare of local communities by providing life insurance and basic equipment to forest guards in Ranthambhore. The hotel also supports “Tiger Watch”, an NGO working for the conservation of tigers in Ranthambhore. The Hotel had promoted “Dhonk”, a socially responsible enterprise that aims at creating sustainable jobs for local villagers through art. The Hotel also supports “Yash Rehabilitation Centre” for handicapped children.
19
f. The Oberoi and Trident, Gurgaon took a number of initiatives in providing education, food and basic facilities to women and children from underprivileged backgrounds through a scheme known as “Harmony House” and “Ritanjali”. The hotels work with the Concern India Foundation to organise workshops for the underprivileged. In addition to this, the hotels work with Pallavanjali Institute, an NGO that supports education, training and therapy for young adults with special needs.
Business Responsibility ReportAs stipulated under the Regulation 34 of the SEBI (Listing Obligations and Disclosure Requirements) Regulations, 2015, the Business Responsibility Report describing the initiatives taken by the Company from environmental, social and governance perspective is attached as Annexure-2 and forms part of the Annual Report.
Audit CommitteeThe composition of the Audit Committee is as under:• Mr. Anil Nehru – Independent Director & Chairperson • Mr. L. Ganesh – Independent Director • Mr. S.K. Dasgupta – Independent Director • Mr. Rajeev Gupta – Independent Director • Mr. S.S. Mukherji – Executive Vice Chairman; and • Mr. Arjun Oberoi – Managing Director, Development
For other details relating to the Audit Committee, please refer to page nos. 66 & 67.
Company’s Policy on Directors’ Appointment and Remuneration and Senior Management Personnel Appointment and Remuneration.
In accordance with Section 178 of the Act read with Regulation 19 of the Listing Regulations, the policies on Directors’ Appointment and Remuneration and Senior Management Personnel Appointment and Remuneration which were formulated in the year 2015 are enclosed as Annexures 3 and 4 and form part of this Report. The policies can also be accessed on the Company’s website www.eihltd.com.
Energy Conservation Measures During the year, energy conservation measures taken by the Company include:• installation energy efficient cooling towers;• installation of energy efficient chilled water control valves; • replacement of chilled water piping system;• replacement of incandescent and fluorescent lamps with energy efficient LED lamps;• enhancement of Business Management Systems;• installation of variable frequency drives for exhaust fans;• use of recycled water for cooling tower application;• installation of occupancy sensors in the back of the house areas;• installation of aerators to reduce water consumption; and• replacement of old laundry machines with energy and water efficient laundry machines.
20
Besides these, hotel teams continued their efforts to reduce energy consumption by: • controlled use of lighting and other equipment;• regulating chilled water set points based on ambient temperature; and• providing high density insulation to avoid temperature losses.
Action planned for next year are:• installation of solar power generation systems on the rooftop;• replacement of old chillers with energy efficient chillers;• replacement of old treated fresh air units;• replacement of chilled water control valves with energy efficient chilled water control
valves;• upgrading building management systems;• replacement of fluorescent lamps with energy efficient LED lamps; and• replacement of old motors with energy efficient motors.
Energy Conservation Committees will continue to closely monitor and control energy consumption. A pilot project initiated for online monitoring for optimal use of energy has been implemented. If this pilot project is successful, it will be extended to other hotels and business units.
Foreign Exchange Earnings and OutgoDuring the Financial Year 2016-17, the foreign exchange earnings of the Company amounted to 4,255 million as against 5,625 million in the previous year. The expenditure in foreign exchange during the Financial Year was ` 1,160 million as compared to ` 591 million in the previous year.
AuditorsThe Auditors, M/s Ray & Ray (FRN 301072E), Chartered Accountants, Statutory Auditors of the Company retire at the conclusion of the 67th Annual General Meeting. They are not eligible for re-appointment as the period of 3 years available to them under third proviso to Section 139 (2) of the Act read with Rule 6 (1) of the Companies (Audit and Auditors) Rules, 2014 (“Rules”) will be exhausted at the conclusion of the Annual General Meeting to be held this August 2017.
The Board places on record its deep appreciation of the valuable contributions made by M/s Ray & Ray as Statutory Auditors of the Company for over six decades.
In accordance with the provisions of Section 139 (2) of the Act which provides for rotation of Auditors, the Audit Committee and the Board at their respective meetings held on 12th December 2016, have unanimously recommended to the Shareholders appointment of M/s. Deloitte, Haskins & Sells LLP, Chartered Accountants, (FRN 117366 W/W 100018) (“Deloitte”) as the Statutory Auditors of the Company to hold office for 5 (five) consecutive years from the conclusion of the Annual General Meeting scheduled to be held in August 2017 till the conclusion of the Annual General Meeting to be held in the year 2022. This is subject to ratification by Shareholders at every Annual General Meeting.
Deloitte has given a written consent to the Company for appointment as Auditors. Deloitte has also given a certificate that they satisfy the criteria prescribed in Section 141 of the Act and their appointment, if made, shall be in accordance with the conditions laid down under the Act and Rules.
21
Secretarial AuditorIn accordance with provisions of Section 204 of the Act, the Company had appointed M/s. JUS & Associates as Secretarial Auditors for the Financial Year ended 31st March 2017. The Secretarial Audit Report does not contain any qualification, reservation or adverse remarks. The Secretarial Auditor’s Report forms part of the Annual Report.
Related Party Transactions The Contracts, arrangements and transactions entered into by the Company during the Financial Year with related parties were in the ordinary course of business and are on an arm’s length basis. During the year, the Company has not entered into any contract, arrangement or transaction with Related Parties that could be considered material in accordance with the Related Party Transaction Policy of the Company. The Policy on Related Party Transactions approved by the Board can be accessed on the Company’s website www.eihltd.com.
The details of Related Party Transactions are set out in Note nos. 40 and 42 to the Standalone and Consolidated Financial Statements respectively.
Extract of Annual ReturnThe Extract of the Annual Return for the Financial Year ended on 31st March 2017 in Form MGT-9 is annexed as Annexure 5.
Loan, Guarantees or InvestmentsParticulars of loans given, investment made, guarantees given, if any, and the purpose for which the loan, guarantee and investment will be utilised are provided in the Standalone Financial Statement in Note nos. 6 & 8.
DepositsDuring the year, the Company did not accept any deposits from the public.
Vigil Mechanism/Whistleblower PolicyIn accordance with the Section 177(9) of the Act and rules framed thereunder read with Regulation 22 of the Listing Regulations, the Company has a Whistleblower Policy in place for its Directors and Employees to report concerns about unethical behaviour, actual or suspected fraud or violation of the Company’s Code of Conduct, “The Oberoi Dharma”. The Policy provides for protected disclosures for the whistle blower. Discolsures can be made through e-mail or letter to the Whistle Officer or to the Chairperson of the Audit Committee. The Whistleblower Policy is accessible on the Company’s website www.eihltd.com.
During the year ended on 31st March 2017, the Company did not receive any complaint under the scheme.
Subsidiaries, Associates and Joint VenturesThe Company has three Indian Subsidiaries which are also Joint Ventures, namely, Mumtaz Hotels Ltd, Mashobra Resort Ltd and Oberoi Kerala Hotels and Resorts Ltd. The Company’s overseas Subsidiaries are EIH Flight Services Ltd, Mauritius; EIH International Ltd, BVI; EIH Holdings Ltd, BVI; J&W Hongkong Ltd, Hongkong; EIH Investments NV, Netherlands; EIH Management Services BV, Netherlands; PT Widja Putra Karya, Indonesia; PT Waka
22
Oberoi Indonesia, Indonesia and PT Astina Graha Ubud, Indonesia.
The Company has an Associate Company, namely, EIH Associated Hotels Ltd. and Joint Venture Companies, Mercury Car Rentals Private Ltd and Oberoi Mauritius Limited. A Report on the performance and financial position of each of the Subsidiaries, Associate and Joint Venture Companies are provided in the Annexure to the Consolidated Financial Statement and hence are not repeated here for the sake of brevity. The policy on material subsidiaries as approved by the Board last year is given on the Company’s website www.eihltd.com.
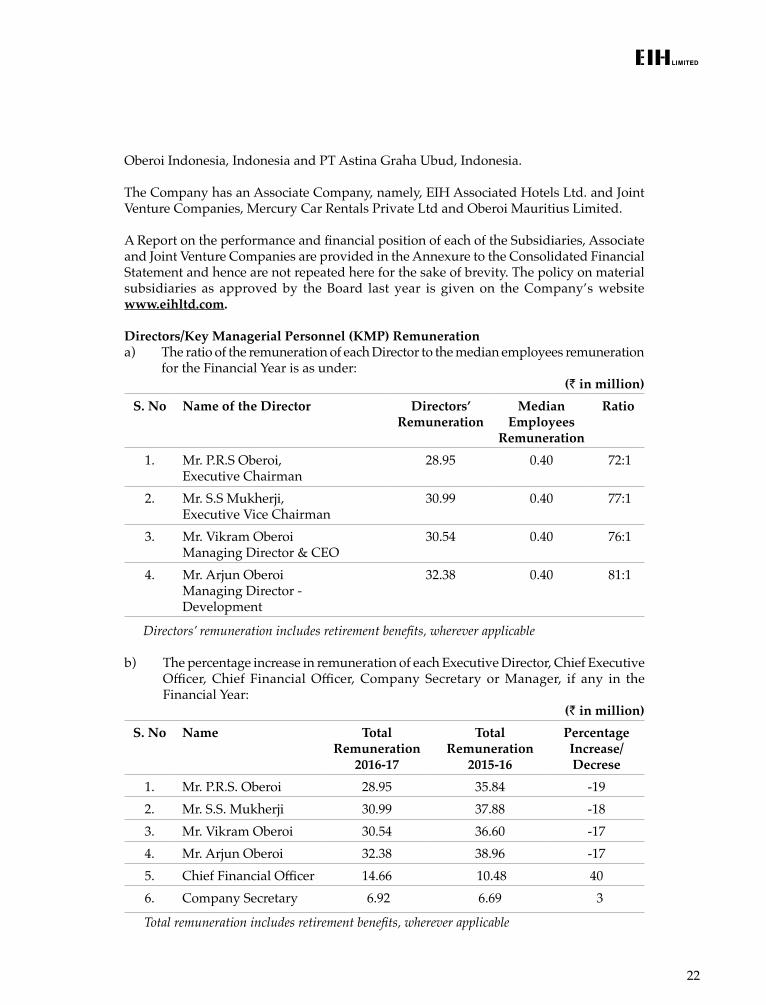
Directors/Key Managerial Personnel (KMP) Remunerationa) The ratio of the remuneration of each Director to the median employees remuneration
for the Financial Year is as under:(` in million)
S. No Name of the Director Directors’ Remuneration
Median Employees
Remuneration
Ratio
1. Mr. P.R.S Oberoi, Executive Chairman
28.95 0.40 72:1
2. Mr. S.S Mukherji,Executive Vice Chairman
30.99 0.40 77:1
3. Mr. Vikram OberoiManaging Director & CEO
30.54 0.40 76:1
4. Mr. Arjun OberoiManaging Director - Development
32.38 0.40 81:1
Directors’ remuneration includes retirement benefits, wherever applicable
b) The percentage increase in remuneration of each Executive Director, Chief Executive Officer, Chief Financial Officer, Company Secretary or Manager, if any in the Financial Year:
(` in million)S. No Name Total
Remuneration 2016-17
Total Remuneration
2015-16
Percentage Increase/Decrese
1. Mr. P.R.S. Oberoi 28.95 35.84 -192. Mr. S.S. Mukherji 30.99 37.88 -183. Mr. Vikram Oberoi 30.54 36.60 -174. Mr. Arjun Oberoi 32.38 38.96 -175. Chief Financial Officer 14.66 10.48 406. Company Secretary 6.92 6.69 3
Total remuneration includes retirement benefits, wherever applicable
23
c) The percentage increase in the median remuneration of employees in the Financial Year is 25%.
d) The number of permanent employees on the rolls of the Company at the end of the Financial Year is 3,758;
e) The average percentile increase already made in the salaries of employees of the Company other than the managerial personnel in the last Financial Year is 8.5%. Percentile increase in the managerial remuneration is Nil.
It is hereby affirmed that the remuneration of the Executive Directors and Key Managerial Personnel are as per the Remuneration Policy of the Company.
Internal Financial Control and Risk Management SystemsCompliance of the above is given in the Management Discussion & Analysis Report on page nos. 60 & 61.
Board EvaluationIn accordance with the provisions of the Act and Regulation 17(10) of the Listing Regulations, a Board Evaluation Policy has been put in place. A structured questionnaire covering various aspects of the Board’s functioning, Board culture, performance of specific duties by Directors and contribution to the Board proceedings was circulated to the members of the Board for the Financial Year 2016-17. Based on the responses received, the Board as a whole, the Committees, the Chairperson and individual Directors were separately evaluated in the meeting of the Independent Directors and at the meeting of the Board of Directors.
The process of review of Non-Independent Directors and the Board as a whole and also its Committees were undertaken in a separate meeting of Independent Directors held on 28th March 2017, without the attendance of Non-Independent Directors and members of the management. At the meeting, the performance of the Chairman of the Company was reviewed taking into account the views of the Executive Directors and Non-Executive Directors and Independent Directors. The meeting also assessed the quality, quantity and timeliness of information required for the Board to perform its duties properly.
The entire Board, excluding the Director being evaluated, evaluated the performance of each Independent Director.
The Directors have expressed their satisfaction with the evaluation process.
Based on the findings from the evaluation process, the Board will continue to review its procedures and effectiveness in the Financial Year 2017-18 with a view to practising the highest standards of Corporate Governance.
Significant and Material orders, if anyDuring the Financial Year, there were no significant or material orders passed by the regulators, courts or tribunals impacting the going concern status and the Company’s operation in future.
24
Sexual Harassment Four complaints were received during the Financial Year 2016-17. All complaints have been disposed off within the statutory period.
Particulars of EmployeesIn accordance with Section 197 of the Act read with Rule 5 of the Companies (Appointment and Remuneration) Rules, 2014 the following are annexed and forms part of this Report:
1) List of top ten employees of the Company in terms of Remuneration;
2) List of employees employed throughout the year who received remunerations for the year which in aggregate was not less than 10.2 million. List of employees who were employed for a part of the year and who received remunerations which in the aggregate, was not less than ` 0.85 million per month.
Cautionary StatementRisks, uncertainties or future actions could differ materially from those expressed in the Directors’ Report and the Management Discussion and Analysis. These statements are relevant on the date of this Report. We have no obligation to update or revise any statements, whether as a result of new information, future developments or otherwise. Therefore, undue reliance should not be placed on these statements.
AcknowledgementThe Board takes this opportunity to thank all employees for their commitment, dedication and co-operation.
For and on behalf of the Board
Gurugram VIKRAM OBEROI P.R.S. OBEROI30th May 2017 Managing Director & Chief Executive Officer Executive Chairman
25
Annexure -1ANNEXURE TO THE DIRECTORS’ REPORT
Annual Report on CSR Activities
1. A brief outline of the Company’s CSR Policy, including overview of projects or programs to be undertaken and a reference to the web-link to the CSR Policy and projects and programs.
The Board of Directors, on the recommendation of the CSR Committee, had formulated a Corporate Social Responsibility Policy (“CSR”). As per the Policy Statement, the Company’s CSR Policy will focus on addressing the critical social, economic and educational needs of marginalised under-privileged children of society and “caring for the elderly and addressing their health issues”. The Policy will also focus on cleanliness under the Swachh Bharat Abhiyan within 500 meters of each Hotel and Service Units of the Company.
The CSR Policy and the activities of the Company are available on the Company’s website www.eihltd.com.
The Board of Directors at the Board Meeting held on 16th November 2016, on the recommendation of the CSR Committee, approved a CSR spend of ` 26.3 million. This equates to 2% of the average Net Profit of the Company during the three preceding Financial Years and an unspent amount of ` 1.5 million for the Financial Year 2015-16.
2. Composition of the CSR Committee
CSR Committee comprises of the following Board Members:
i) Mr. S.S. Mukherji - Chairperson;
ii) Mr. Vikram Oberoi - Member;
iii) Mr. Arjun Oberoi - Member; and
iii) Mr. Rajeev Gupta - Independent Director and Member
3. Average Net Profit of the Company for the last three Financial Years ` 1,240.73 million.
4. Prescribed CSR Expenditure (two percent of the amount as in Item 3 above). ` 24.81 million.
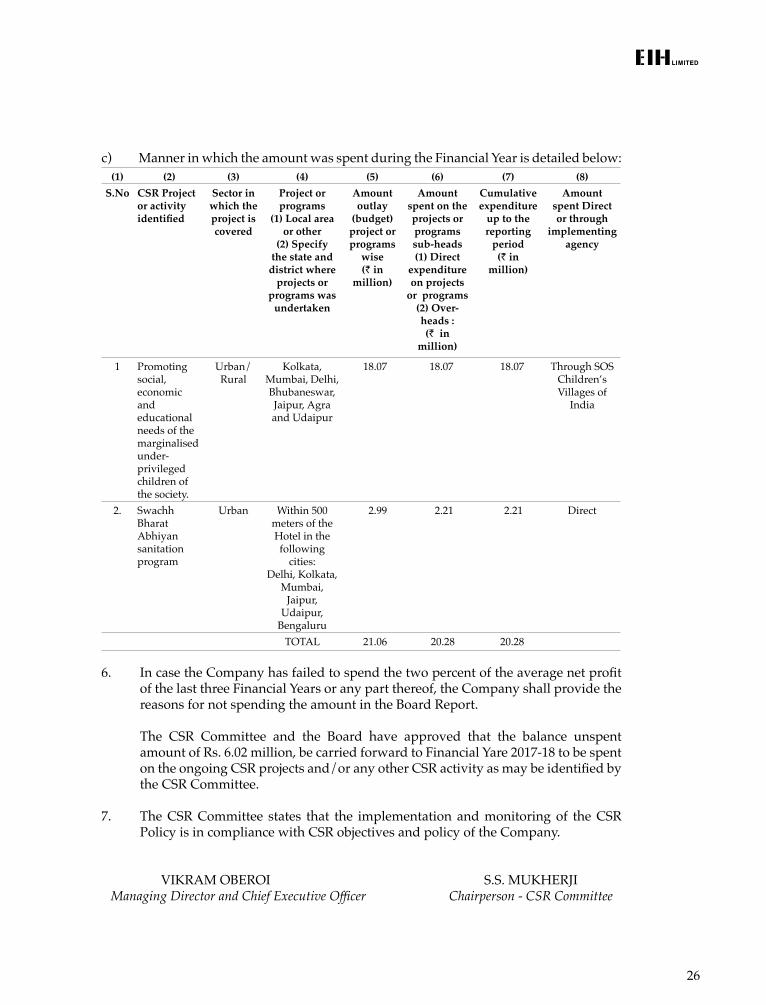
5. Details of CSR spent during the Financial Year
a) Total Amount to be spent for the Financial Year including previous year unspent amount : ` 26.3 million ;
b) Amount unspent, if any : ` 6.02 million
26
c) Manner in which the amount was spent during the Financial Year is detailed below:(1) (2) (3) (4) (5) (6) (7) (8)
S.No CSR Project or activity identified
Sector in which the project is covered
Project or programs
(1) Local area or other
(2) Specify the state and
district where projects or
programs was undertaken
Amount outlay
(budget) project or programs
wise(` in
million)
Amount spent on the projects or programs sub-heads (1) Direct
expenditure on projects
or programs (2) Over-heads :(` in
million)
Cumulative expenditure
up to the reporting
period(` in
million)
Amount spent Direct or through
implementing agency
1 Promoting social, economic and educational needs of the marginalised under-privileged children of the society.
Urban/ Rural
Kolkata, Mumbai, Delhi, Bhubaneswar, Jaipur, Agra and Udaipur
18.07 18.07 18.07 Through SOS Children’s Villages of
India
2. Swachh Bharat Abhiyan sanitation program
Urban Within 500 meters of the Hotel in the following
cities: Delhi, Kolkata,
Mumbai, Jaipur,
Udaipur, Bengaluru
2.99 2.21 2.21 Direct
TOTAL 21.06 20.28 20.28
6. In case the Company has failed to spend the two percent of the average net profit of the last three Financial Years or any part thereof, the Company shall provide the reasons for not spending the amount in the Board Report.
The CSR Committee and the Board have approved that the balance unspent amount of Rs. 6.02 million, be carried forward to Financial Yare 2017-18 to be spent on the ongoing CSR projects and/or any other CSR activity as may be identified by the CSR Committee.
7. The CSR Committee states that the implementation and monitoring of the CSR Policy is in compliance with CSR objectives and policy of the Company.
VIKRAM OBEROI S.S. MUKHERJI Managing Director and Chief Executive Officer Chairperson - CSR Committee
27
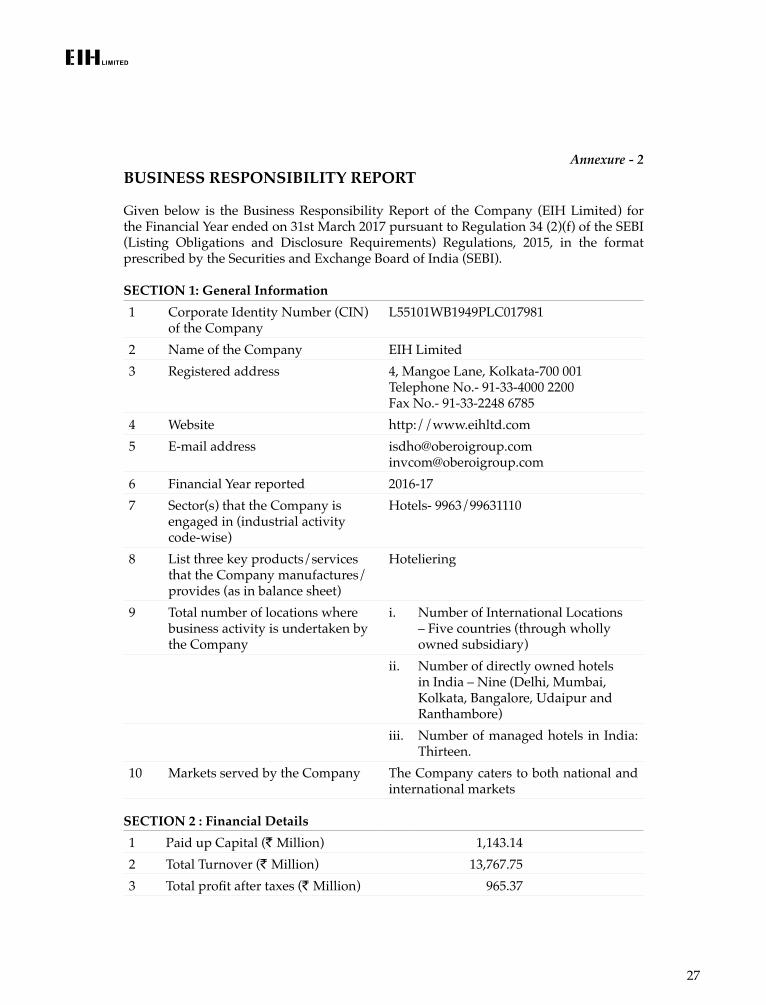
Annexure - 2BUSINESS RESPONSIBILITY REPORT
Given below is the Business Responsibility Report of the Company (EIH Limited) for the Financial Year ended on 31st March 2017 pursuant to Regulation 34 (2)(f) of the SEBI (Listing Obligations and Disclosure Requirements) Regulations, 2015, in the format prescribed by the Securities and Exchange Board of India (SEBI).
SECTION 1: General Information1 Corporate Identity Number (CIN)
of the CompanyL55101WB1949PLC017981
2 Name of the Company EIH Limited3 Registered address 4, Mangoe Lane, Kolkata-700 001
Telephone No.- 91-33-4000 2200Fax No.- 91-33-2248 6785
4 Website http://www.eihltd.com5 E-mail address [email protected]
[email protected] Financial Year reported 2016-177 Sector(s) that the Company is
engaged in (industrial activity code-wise)
Hotels- 9963/99631110
8 List three key products/services that the Company manufactures/provides (as in balance sheet)
Hoteliering
9 Total number of locations where business activity is undertaken by the Company
i. Number of International Locations – Five countries (through wholly owned subsidiary)
ii. Number of directly owned hotels in India – Nine (Delhi, Mumbai, Kolkata, Bangalore, Udaipur and Ranthambore)
iii. Number of managed hotels in India: Thirteen.
10 Markets served by the Company The Company caters to both national and international markets
SECTION 2 : Financial Details 1 Paid up Capital (` Million) 1,143.142 Total Turnover (` Million) 13,767.753 Total profit after taxes (` Million) 965.37
28
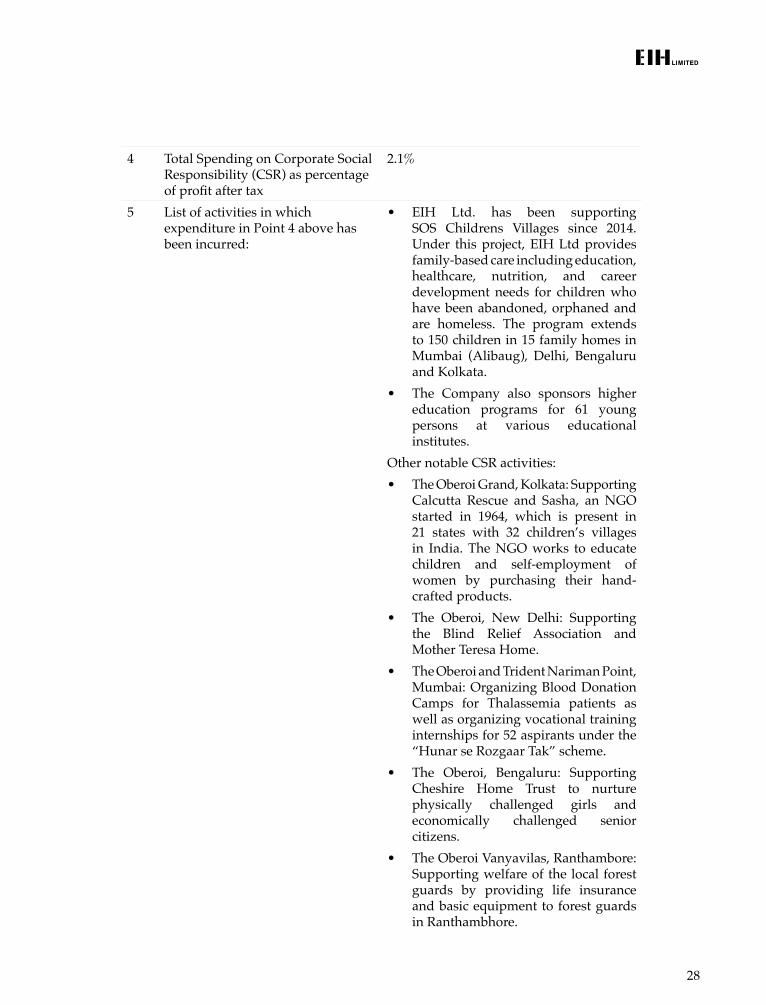
4 Total Spending on Corporate Social Responsibility (CSR) as percentage of profit after tax
2.1%
5 List of activities in which expenditure in Point 4 above has been incurred:
• EIH Ltd. has been supporting SOS Childrens Villages since 2014. Under this project, EIH Ltd provides family-based care including education, healthcare, nutrition, and career development needs for children who have been abandoned, orphaned and are homeless. The program extends to 150 children in 15 family homes in Mumbai (Alibaug), Delhi, Bengaluru and Kolkata.
• The Company also sponsors higher education programs for 61 young persons at various educational institutes.
Other notable CSR activities:• The Oberoi Grand, Kolkata: Supporting
Calcutta Rescue and Sasha, an NGO started in 1964, which is present in 21 states with 32 children’s villages in India. The NGO works to educate children and self-employment of women by purchasing their hand-crafted products.
• The Oberoi, New Delhi: Supporting the Blind Relief Association and Mother Teresa Home.
• The Oberoi and Trident Nariman Point, Mumbai: Organizing Blood Donation Camps for Thalassemia patients as well as organizing vocational training internships for 52 aspirants under the “Hunar se Rozgaar Tak” scheme.
• The Oberoi, Bengaluru: Supporting Cheshire Home Trust to nurture physically challenged girls and economically challenged senior citizens.
• The Oberoi Vanyavilas, Ranthambore: Supporting welfare of the local forest guards by providing life insurance and basic equipment to forest guards in Ranthambhore.
29
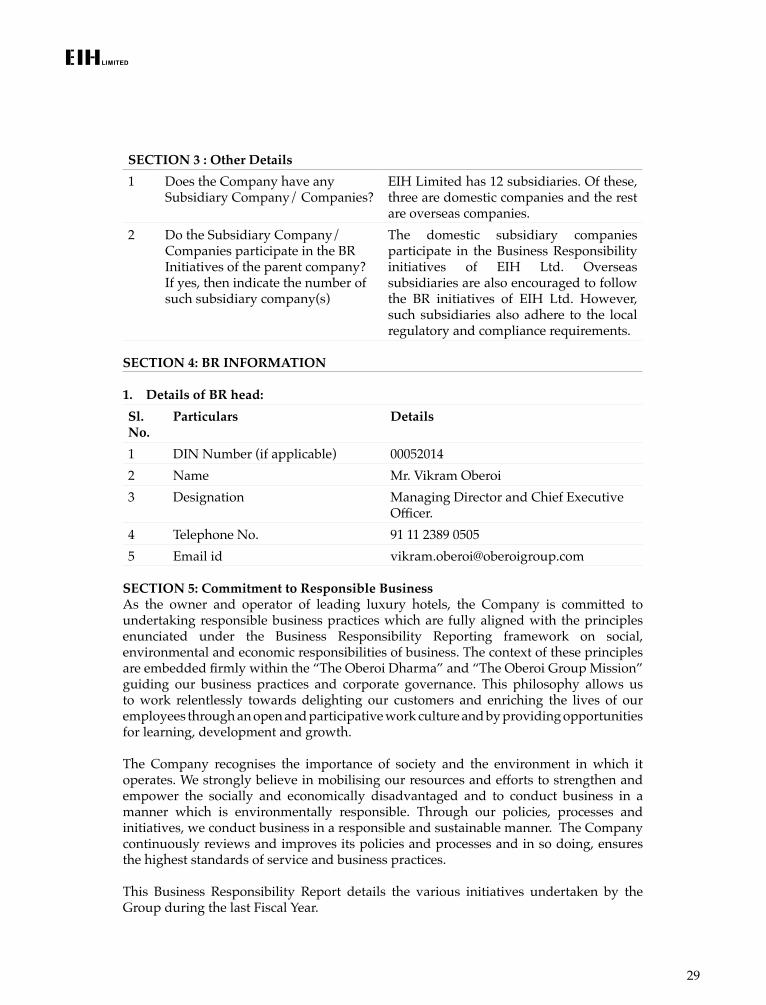
SECTION 3 : Other Details1 Does the Company have any
Subsidiary Company/ Companies?EIH Limited has 12 subsidiaries. Of these, three are domestic companies and the rest are overseas companies.
2 Do the Subsidiary Company/Companies participate in the BR Initiatives of the parent company? If yes, then indicate the number of such subsidiary company(s)
The domestic subsidiary companies participate in the Business Responsibility initiatives of EIH Ltd. Overseas subsidiaries are also encouraged to follow the BR initiatives of EIH Ltd. However, such subsidiaries also adhere to the local regulatory and compliance requirements.
SECTION 4: BR INFORMATION
1. Details of BR head: Sl. No.
Particulars Details
1 DIN Number (if applicable) 000520142 Name Mr. Vikram Oberoi3 Designation Managing Director and Chief Executive
Officer. 4 Telephone No. 91 11 2389 05055 Email id [email protected]
SECTION 5: Commitment to Responsible Business As the owner and operator of leading luxury hotels, the Company is committed to undertaking responsible business practices which are fully aligned with the principles enunciated under the Business Responsibility Reporting framework on social, environmental and economic responsibilities of business. The context of these principles are embedded firmly within the “The Oberoi Dharma” and “The Oberoi Group Mission” guiding our business practices and corporate governance. This philosophy allows us to work relentlessly towards delighting our customers and enriching the lives of our employees through an open and participative work culture and by providing opportunities for learning, development and growth.
The Company recognises the importance of society and the environment in which it operates. We strongly believe in mobilising our resources and efforts to strengthen and empower the socially and economically disadvantaged and to conduct business in a manner which is environmentally responsible. Through our policies, processes and initiatives, we conduct business in a responsible and sustainable manner. The Company continuously reviews and improves its policies and processes and in so doing, ensures the highest standards of service and business practices.
This Business Responsibility Report details the various initiatives undertaken by the Group during the last Fiscal Year.
30
PRINCIPLE 1: Businesses should conduct and govern themselves with Ethics, Transparency and Accountability
The Company’s guiding philosophy on ethics, transparency and accountability is articulated in the “The Oberoi Dharma” and specific details are provided in the Company’s “ Code of Conduct and Ethics Policy ”. The Oberoi Dharma extends to the entire Company and is central to all that we do, individually and as an organisation. It binds all employees to act with honesty, integrity and ethics at all times. Every year, Directors on the Board, Key Managerial Personnel and Senior Management Personnel of the Company, give a written affirmation of compliance to “The Oberoi Dharma”.
All employees are required to sign “The Code of Conduct and Ethics Undertaking” at the time of joining the Company. “The Code of Conduct and Ethics” espouses honest and ethical conduct, while also emboldening the Company to act strongly against:
• Theft, pilferage and fraud• Violence and abuse• Physical harm or assault• Sexual Harassment of women at workplace• Vandalism of Company property or assets
The Company also has a “Whistleblower Policy” which allows the Company to adhere to the highest standards of ethical, moral and legal conduct of business operations. The Policy provides a mechanism for the Directors and employees of the Company to raise concerns regarding any violations of legal or regulatory requirements, incorrect or misrepresentation of any financial statements, reports, fraud etc. The Policy applies to all employees of the hotels and business units of “The Oberoi Group” in India .
The Policy enables and facilitates an employee and other stakeholders to report instances of misconduct or any disclosure to the Whistle Officer , CEO or Chairperson of the Audit Committee.
The implementation of the Whistleblower Policy is anchored by the Executive Vice President, Human Resources who is the designated “Whistle Officer”, and is ultimately overseen by the MD & CEO of the Company.
PRINCIPLE 2: Businesses should provide goods and services that are safe and contribute to sustainability throughout their life cycle
The Company maintains the highest standards of safety and sustainability in accordance with the Oberoi Dharma and Vision which clearly states:
• “We see an organization which is committed to the environment, using natural products and recycling items, thus ensuring proper use of diminishing natural resources.”- Oberoi Vision
• “Conduct which at all times safeguards the safety, security, health and environment of customers, employees and the assets of the company.” – Oberoi Dharma
• “Conduct which eschews the short-term quick-fix for the long term establishment of healthy precedent.” – Oberoi Dharma.
31
The Company takes great care in ensuring sustainable practices. Measures implemented by the Company include the following:
• All laundry chemicals are bio-degradable
• Detergents used require less water to rinse out of the fabric and are therefore water efficient
• Cloth bags are used instead of plastic bags for collecting and delivering guest laundry, dry cleaning and pressing
• Bio-degradable garbage bags are used in most hotels
• Guests are encouraged to adopt environment conscious practices like optimized changing of bed linen and towels during their stay
• All stationery and shopping bags are made of recycled paper
• Some of the hotels have implemented efficient WC systems with dual water flow for saving water
• Garden irrigation is carried out through recycled water
• Compost pits have been created in hotels with large gardens
• Compost machines have been installed at a number of hotels to recycle waste
Water saving was estimated at 9% of total annual consumption in 2016-17.
Safety initiatives underpin the Company’s business and operational practices. These include physical structures resilient to intrusive and / or other damaging interventions to the extent feasible, fire-safety measures, focus on guest, employee safety, safety towards women in the workplace and overall operational safety across all functions. In addition, initiatives are taken to review safety / security situation as follows:• Conduct internal security audit reviews of each hotel twice a year• Following up on pending audit review points on a monthly tracking report• Investigate any incident which is followed by a detailed Incident Report• An exhaustive check list for risk assessment as a part of internal security audit• Issuance of high alerts / security advisories from time to time based on prevailing
security situations that arise in the city or country in which the hotel is located PRINCIPLE 3: Businesses should promote the wellbeing of all employees
The Oberoi Dharma is the Company’s central philosophy towards ensuring the wellbeing of its employees as follows:
• “Conduct which demonstrates that people are our key asset, through respect for every employee, and leading from the front regarding performance achievement as well as individual development”
The Company is committed to making the employee experience enriching. This is done by ensuring a work culture that is caring, open, respectful and provides opportunity for learning, development and growth. Through various policies which guide employee
32
engagement, we have fostered a culture that ensures guest centricity, high standards of personalised service and an enabling work environment. The Company strongly espouses gender equality, diversity and equal opportunity:
• For the Company, gender equality is a commitment. The team comprises employees of both genders with increasing emphasis on providing opportunities to women. We are constantly working to improve on the gender diversity ratio. In addition, to ensure we do not lose lady team members, we actively create an ecosystem that supports their personal commitments thereby ensuring the right conditions necessary for their career growth and progression.
• Our teams comprise a diverse mix from different cultures, religions and social backgrounds. The Company has expatriate employees, adding a flavour of diversity to the organisational culture.
• Given the varied age and interest demographics of team members, we design events on multi aspects such as entertainment, learning, environment, sports, health and pay back to society.
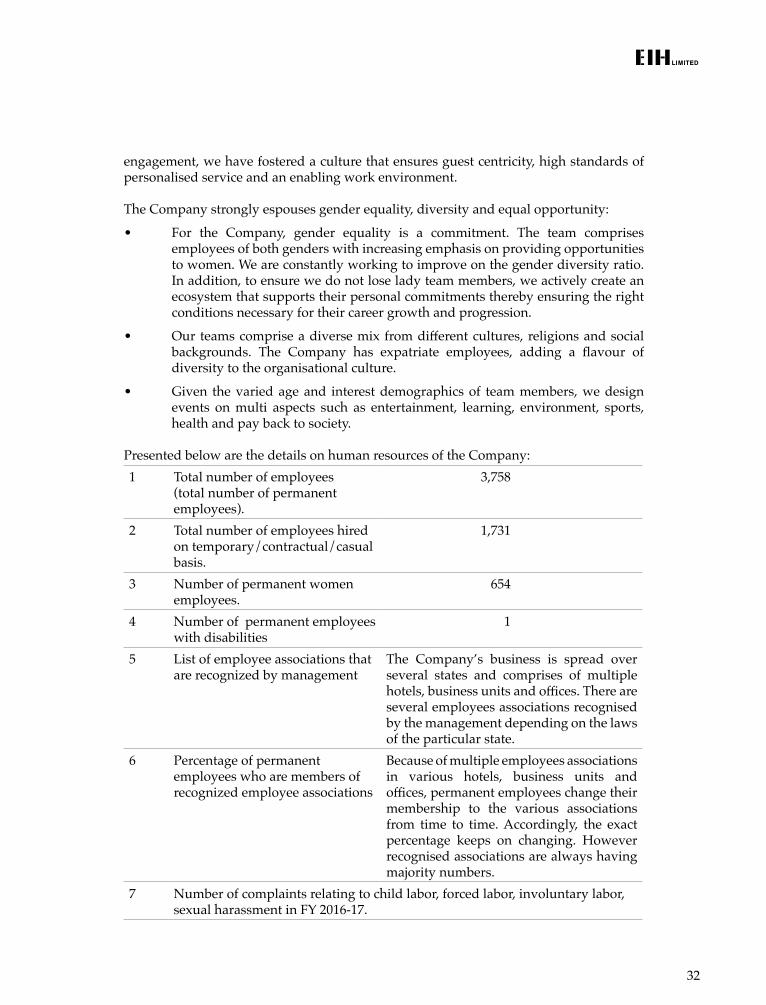
Presented below are the details on human resources of the Company:1 Total number of employees
(total number of permanent employees).
3,758
2 Total number of employees hired on temporary/contractual/casual basis.
1,731
3 Number of permanent women employees.
654
4 Number of permanent employees with disabilities
1
5 List of employee associations that are recognized by management
The Company’s business is spread over several states and comprises of multiple hotels, business units and offices. There are several employees associations recognised by the management depending on the laws of the particular state.
6 Percentage of permanent employees who are members of recognized employee associations
Because of multiple employees associations in various hotels, business units and offices, permanent employees change their membership to the various associations from time to time. Accordingly, the exact percentage keeps on changing. However recognised associations are always having majority numbers.
7 Number of complaints relating to child labor, forced labor, involuntary labor, sexual harassment in FY 2016-17.
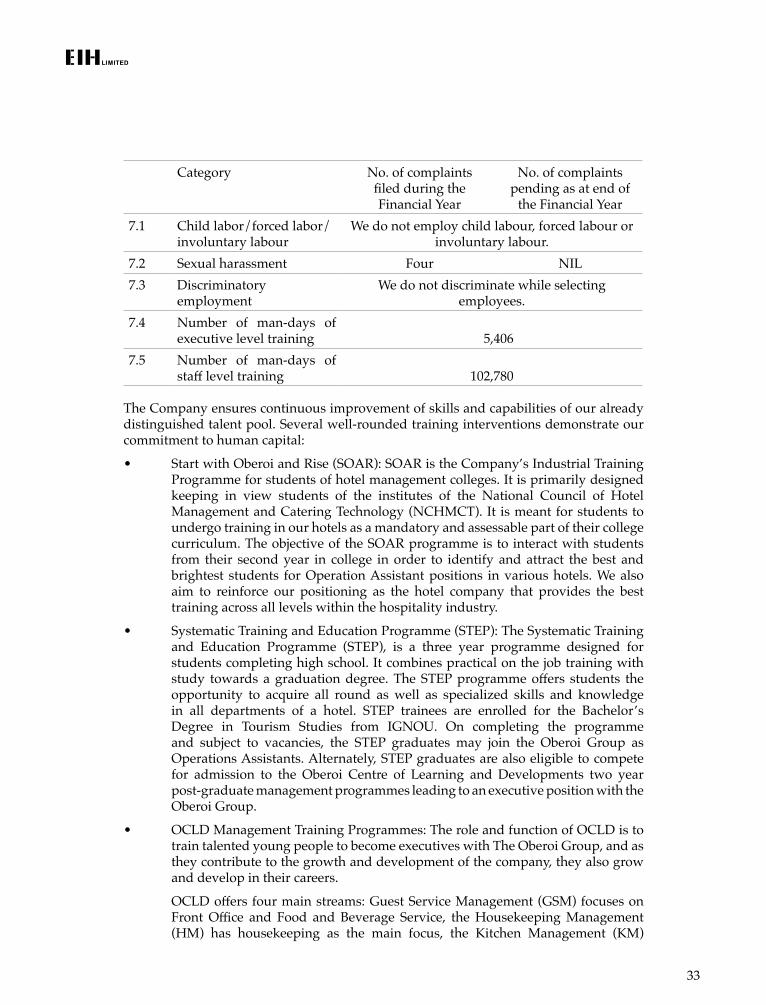
33
Category No. of complaints filed during the Financial Year
No. of complaints pending as at end of
the Financial Year7.1 Child labor/forced labor/
involuntary labourWe do not employ child labour, forced labour or
involuntary labour.7.2 Sexual harassment Four NIL7.3 Discriminatory
employmentWe do not discriminate while selecting
employees.7.4 Number of man-days of
executive level training 5,4067.5 Number of man-days of
staff level training 102,780 The Company ensures continuous improvement of skills and capabilities of our already distinguished talent pool. Several well-rounded training interventions demonstrate our commitment to human capital:
• Start with Oberoi and Rise (SOAR): SOAR is the Company’s Industrial Training Programme for students of hotel management colleges. It is primarily designed keeping in view students of the institutes of the National Council of Hotel Management and Catering Technology (NCHMCT). It is meant for students to undergo training in our hotels as a mandatory and assessable part of their college curriculum. The objective of the SOAR programme is to interact with students from their second year in college in order to identify and attract the best and brightest students for Operation Assistant positions in various hotels. We also aim to reinforce our positioning as the hotel company that provides the best training across all levels within the hospitality industry.
• Systematic Training and Education Programme (STEP): The Systematic Training and Education Programme (STEP), is a three year programme designed for students completing high school. It combines practical on the job training with study towards a graduation degree. The STEP programme offers students the opportunity to acquire all round as well as specialized skills and knowledge in all departments of a hotel. STEP trainees are enrolled for the Bachelor’s Degree in Tourism Studies from IGNOU. On completing the programme and subject to vacancies, the STEP graduates may join the Oberoi Group as Operations Assistants. Alternately, STEP graduates are also eligible to compete for admission to the Oberoi Centre of Learning and Developments two year post-graduate management programmes leading to an executive position with the Oberoi Group.
• OCLD Management Training Programmes: The role and function of OCLD is to train talented young people to become executives with The Oberoi Group, and as they contribute to the growth and development of the company, they also grow and develop in their careers.
OCLD offers four main streams: Guest Service Management (GSM) focuses on Front Office and Food and Beverage Service, the Housekeeping Management (HM) has housekeeping as the main focus, the Kitchen Management (KM)
34
develops talent in various sections of the kitchen and the Sales Management trains and develops individuals to work in hotel Sales. The Sales programme is for a duration of 18 months whereas all other programmes are of two years.
All four management programmes are highly structured with robust systems for the management, delivery and quality assurance of the programmes. Rigorous evaluations are carried out to ensure that they are consistent in status, standards, level and career trajectory.
• Supervisory Development Programme: The program is aimed at developing supervisory competences and creating a standard pool of talent across the company. The Supervisory Development Program is supported by Corporate Human Resources and The Oberoi Centre of Learning and Development.
• Executive Development Programme: The Executive Development Program (EDP) is designed for supervisors who have high potential and are recommended for promotion to the Executive level. The aim of this program is to provide learning opportunities to supervisors which will help them transition smoothly into their new roles and responsibilities as Executives of the Company. The Executive Development Program is supported by Corporate Human Resources and the Oberoi Centre of Learning and Development.
PRINCIPLE 4: Businesses should respect the interests of, and be responsive towards all stakeholders, especially those who are disadvantaged, vulnerable and marginalized
The Company acknowledges and believes that it has a strong role to play in giving back to the communities and stakeholders it works with. Guided by the Corporate Social Responsibility Policy, the Company reaches out to stakeholders who are socially disadvantaged, vulnerable and marginalized. The Company takes particular attention in ensuring that the initiatives are designed to provide adequate help and relief to the following:
• Underprivileged children, including orphans and homeless children• Elderly people• Local communities
The Company’s initiatives focus on providing critical social, economic and developmental support like education, necessary vocational training and welfare support to these stakeholders so that they lead better lives. (Refer to section 2(5) of this report).
Some notable initiatives are:
• The Company’s managed hotels The Oberoi and Trident, Gurgaon support Pallavanjali which offers education, training and therapy to young adults with special needs. In the last eight years, the hotels have fostered an environment which presents equal opportunities to young adults who do not function optimally in a traditional academic set up to get trained and learn hospitality skills. Students of Pallavanjali get trained at these two hotels, thrice a week, in the uniform room, laundry, flower room, bakery and finance department.
• The company has commenced training and employment of differently abled people and to work with young adults with speech and hearing impairment. This initiative will initially cover The Oberoi Cecil, Shimla, Wildflower Hall, Shimla and Trident, Chennai.
35
PRINCIPLE 5: Businesses should respect and promote human rights
The Company exercises utmost care in the promotion and protection of Human Rights. As already noted, the Oberoi Dharma sets in stone the Company’s central philosophy towards its employees and in its outlook regarding various stakeholders across its value chain. This approach is reiterated through the statement “conduct which demonstrates that people are our key asset, through respect for every employee, and leading from the front regarding performance achievement as well as individual development”.
The company strongly values and upholds issues related to gender equality, diversity and provision of equal opportunities for all. The employees are sensitised regarding all aspects of socially inclusive behaviour and the need to have a humanitarian approach to all actions. The Company’s HR policies espouse these principles and these are clearly demonstrated in the recruitment policy, where nobody is discriminated on the basis of gender, caste, religion or physical disability. Any incidence of misconduct or harassment is dealt with seriously within the organisation. This helps in building a healthy and lively work place strengthened through mutual trust and ethical behaviour.
PRINCIPLE 6: Business should respect, protect, and make efforts to restore the environment
The Company is committed to protecting the environment within which it operates. The Oberoi Group vision and dharma places utmost importance to sustainability while conducting business. Some of the environmental initiatives are:
• Energy efficient building architectural design: New construction emphasizes on energy efficient building design and materials. The roofs have high thermal resistance insulation, external walls are provided with a cavity and insulation to minimize energy loss. Building fenestration is incorporated with high performance insulated glass to reduce energy loss. Roof tops have reflective tiles or an albedo coating to minimize the impact of heat.
• Use of energy efficient designs and equipment: Care is taken to ensure that the system design and equipment deployed are energy efficient. Highly efficient chillers are used for air conditioning. Pumps, fans, compressors, blowers and other equipment are selected carefully considering their energy efficiency. Energy recovery systems and variable speed drives are used extensively to save energy. High efficiency boilers and heaters are used with energy recovery systems to recover waste heat. Energy efficient lighting with optimal use of natural light is practised. Building Management systems are used for monitoring and control.
• Sustainable landscape and water use:
• Sustainable landscaping and horticulture are essential features of every hotel.
• The design of new hotels ensure a high percentage of green area, trees and shrubs.
• Local plants species are extensively used to encourage biodiversity.
• While building hotels, natural contours of the site are maintained to limit disturbance to natural water flow and increase infiltration of storm water.
36
• Rain water harvesting systems are installed in the majority of hotels.
• Hotels have Sewage Treatment Plants (STPs). Treated water from STPs get recycled for use in horticulture and cooling towers. Thus water consumption is minimised.
• The use of natural fertilizers and bio-pesticides support sustainable practices.
• Use of sustainable building materials:
• Fly-ash, a waste product from power plants is used extensively in building structures
• Low embedded energy materials (material with recycled content, rapidly renewable wood/composite wood products) are extensively used in developing interiors
• FSC certified wood and composite products made from recycled wood scrap are used
• Priority is given on use of locally available materials like tiles, granite, marble etc. This reduces transportation and minimises carbon emissions.
• Waste Reduction, recycle and reuse:
• Wet garbage is treated in organic waste converters and recycled in several hotels. Alternatively, it is used as animal feed.
• Metal, plastic and other recyclable waste are segregated and sold as scrap for recycling.
• Electronic waste is disposed responsibly to authorized agencies as per regulations.
• Fresh leftover food is given to the needy.
• Printed stationary is reused.
• Old linen is recycled.
• Business kits and cards are made from recyclable paper.
• Biodegradable organic chemicals are used is washing machines.
• Bathroom amenities are made from natural botanical extracts and herbs.
• Use of plastics is discouraged and there is preference for renewable and organic products.
• Air quality and noise:
• Wet and dry scrubbers are installed to reduce emissions of gases and particulate matter.
• The refrigerants used have low global warming and low ozone depletion properties.
37
• Care is taken to keep noise levels low from equipment.
• Special attention is paid towards safety and detailed safety procedures are listed for operational guidance of hotels.
• Hotel designs ensure accessibility for differently abled guests.
In addition, the Company continues to ramp up its reliance on renewable energy, some of which is listed below:
• The Company has invested in a local wind generating company and 3.6 million units of electricity per year from wind energy have been contracted on a long term basis for The Oberoi, Bangalore.
• The Company and its Associate have invested in a local wind generating company and 1.5 million units of electricity per year from wind energy have been contracted on a long term basis for Oberoi Flight Services, Chennai besides 2.8 million units for the Trident, Chennai.
• Roof top solar panels have been installed at The Oberoi Gurgaon, Trident Gurgaon, Trident Udaipur, The Oberoi Udaivilas and The Trident Agra. The installation is in process at The Oberoi Amarvilas, The Oberoi Grand Kolkata, The Oberoi Mumbai, The Oberoi Rajvilās, The Oberoi Vanyavilas, Trident Bhubaneshwar, Trident Chennai, Trident Jaipur, Trident Hyderabad, Trident BKC, Maidens and The Oberoi Vanyavilas staff accommodation.
PRINCIPLE 7: Businesses, when engaged in influencing public and regulatory policy, should do so in a responsible manner
The Company takes up with responsibility and commitment matters concerning the hotel industry across the country through active participation in apex industry associations including the following:
• Hotel Association of India (HAI)• Federation of Hotels and Restaurant Association of India (FHRAI)• Federation of Associations in Indian Tourism & Hospitality (FAITH)• Tourism & Hospitality Skills Council (THSC)• Skills Council for People with Disability (SCPwD)
We would like to specifically highlight our active partnership with SCPwD constituted jointly by Ministry of Social Justice and Empowerment (MSJE) and National Skill Development Corporation (NSDC) under the aegis of Ministry of Skill Development & Entrepreneurship.
PRINCIPLE 8: Businesses should support inclusive growth and equitable development
The Company continues to regularly identify and engage with different sections of the communities. Please refer to Point 5 of Section 2 of this Business Responsibility Report for further details.
38
PRINCIPLE 9: Businesses should engage with and provide value to their customers and consumers in a responsible manner
The Company has an uncompromising and unrelenting commitment to delivering excellence and value to its guests through efficient, personalised and caring service. This is based on “The Oberoi Dharma”. Our commitment to excellence, attention to detail and personalized service continues to be acknowledged and appreciated globally. At the World’s Best Awards, 2016, readers of Travel + Leisure, USA, voted Oberoi Hotels & Resorts as the World’s Best Hotel Brand for the second consecutive year. The many accolades that our hotels receive is recognition of the commitment and dedication of employees at all levels to deliver exceptional guest experiences. The overall service and product classification of hotels in India is governed by The Ministry of Tourism via the Hotel and Restaurant Approval and Classification Committee (HRACC). HRACC has developed stringent guidelines for hotels to follow. Based on a detailed inspection, hotels are classified as 5 Star deluxe, 5 star and so on. All our hotels have been classified under 5 Star Deluxe, 5 star and Heritage hotels. This certificate is issued after a detailed inspection every five years.
The various channels that are used by the Company for marketing communication include:
• Direct & Foreign Tour Operator engagement• Meetings, Incentives, Conference & Exhibition (MICE) Focus• Multi resort use policy• Online Travel Agent growth• Customised itineraries to International Free Independent Traveller (FIT) – Exotic
Vacations• Enhancing sales force productivity & effectiveness• Enhance focus on Digital Marketing• Establishing a robust CRM approach and process• Aggressive re-marketing via the Oberoi Contact Centre• Targeting priority International Markets for FIT• Ongoing engagement through Trident Privilege
Internationally, the Company has leveraged several reputed magazines to reach out to its large base of international customers.
Within the hotels a variety of media is used to display information for guests to better understand the special offers and general information about the hotel. To ensure continuous improvement, the Company’s hotels rely on the “GQA – Guest Questionnaire” feedback process, which enables us to understand guest needs and experiences better.
The continuous endeavour of the Company is to maximize and increase satisfaction, loyalty and referrals from guests. This is based on the belief that loyal guests will actively promote and recommend our hotels. All customer complaints are immediately addressed to ensure that the guests continue to have a positive association and remain loyal to our hotels.
39
For the past two decades, the Company has consistently commissioned reputed independent third party agencies to conduct anonymous mystery audits at each of our hotels to ascertain the established quality of standards pertaining to both service and product.
All the operating standards applicable at Oberoi Hotels and Trident Hotels have been approved by the Company’s Executive Chairman. The MD and CEO of EIH Limited with support from management and staff ensure the highest operating standards across all hotels.
For and on behalf of the Board
Gurugram 30th May 2017
VIKRAM OBEROI Managing Director & Chief Executive Officer
P.R.S. OBEROI Executive Chairman
40
Annexure 3ANNEXURE TO THE DIRECTORS’ REPORT
Director Appointment and Remuneration Policy
This Director Appointment and Remuneration Policy (the “Policy”) applies to the Board of Directors (the “Board”) of EIH Limited (the “Company”).
1. Purpose The objective of this Policy is to provide a framework and set standards for the
appointment of high quality directors who have the capacity and ability to lead the Company towards achieving sustainable profitability and growth. The Company aims to achieve a balance of experience and skill amongst its directors. It also defines the role of the Nomination and Remuneration Committee.
2. Accountability
2.1 The Board is ultimately responsible for the appointment of Directors.
2.2 In terms of Section 178 of the Companies Act, 2013 and Regulation 19 of the Securities and Exchange Board of India (Listing Obligations and Disclosure Requirements) Regulations, 2015 (“Listing Regulations”), the Nomination and Remuneration Committee (“NRC”) assesses and selects candidates for Directors and recommends to the Board their appointment.
3. Role of the Nomination and Remuneration Committee
The NRC is responsible for:
3.1 Reviewing the structure, size and composition (including the skill, knowledge and experience) of the Board and making recommendations on any proposed changes to the Board with due regard to Board Diversity;
3.2 Identifying individuals suitably qualified to become Board Members, Key Managerial and Senior Management Personnel.
3.3 Making recommendations to the Board on the appointment, re-appointment or removal of Directors, Key Managerial and Senior Management Personnel.
3.4 Making recommendations for succession planning for Directors, Key Managerial and other Senior Management Personnel, including the Managing Director(s), Whole-time Director(s) and CEO.
3.5 Formulating criteria for evaluation the performance of every Director including Independent Directors and the Board;
3.6 Recommending remuneration payable to Senior and Key Management Personnel, Executive and Non-Executive Directors including Board sitting fees;
41
4. Appointment of Directors
4.1 Matching the needs of the Company and enhancing the competencies of the Board are the basis for the NRC to select a candidate for appointment to the Board. When recommending a candidate for appointment, the NRC will have regard to:
• assessing the individual against a range of criteria including but not limited to industry experience, background, and other qualities required to operate successfully in the position, with due regard to the benefits of diversity of the Board;
• the extent to which the individual is likely to contribute to the overall effectiveness of the Board and work constructively with existing directors;
• the skills and experience the individual brings to the role and how these will enhance the skillsets and experience of the Board as a whole;
• the nature of positions held by the individual including directorships or other relationships and the impact they may have on the appointee’s ability to exercise independent judgment;
• the time commitment required from a director to actively discharge his duties to the Company.
4.2 The recommended director would: • Possess a degree in a relevant discipline; • Have experience of management in a diverse organization; • Have excellent interpersonal, communication and representational skills; • Have leadership skills; • Possess high standards of ethics, personal integrity and probity; • Continuously refresh his professional knowledge and skills. For details of the personal specifications of a Director, please refer to
Attachment-1.
4.3 Every Director should ensure that he can give sufficient time and attention to the Company’s affairs and regularly attend Board Meetings and other committee meetings in which he is a member.
4.4 The Policy aims to engage Directors (including Non-Executive and Independent Non-Executive Directors) who are highly skilled, competent and experienced persons within one or more fields of business, finance, accounting law, management, sales, marketing, administration, corporate governance, technical operations or other disciplines related to the business of the Company and who shall be able to positively carry out their supervisory role over the policies of the management of the Company and the general affairs of the Company.
4.5 The Company is required to appoint at least one Independent Non-Executive Director who must have appropriate professional qualifications on accounting or related financial management expertise in accordance with Regulation 18 of the Listing Regulations.
42
4.6 In addition to those requirements specified in the clauses 4.2 and 4.3, Independent Non-Executive Directors shall also fulfill the requirements pursuant to Section 149 (6) of the Companies Act, 2013 and Regulation 16 (1)(b) of the Listing Regulations.
4.7 In assessing the independence of a Non-Executive Director, the following factors shall be taken into account:
Independent Director shall mean a Non-Executive Director, other than a Nominee Director of the Company:
a. who, in the opinion of the Board, is a person of integrity and possesses relevant expertise and experience.
b. (i) who is or was not a promoter of the company or its holding, subsidiary or associate company;
(ii) who is not related to the promoters or directors in the company, its holding, subsidiary or associate company;
c. apart from receiving director’s remuneration has or had no pecuniary relationship with the company, its holding, subsidiary or associate company, or their promoters, or directors, during the two immediately preceding financial years or during the current financial year;
d. none of whose relatives has or had pecuniary relationship or transaction with the company, its holding, subsidiary or associate company, or their promoters, or directors, amounting to two per cent or more of its gross turnover or total income or fifty lakh rupees or such higher amount as may be prescribed, whichever is lower, during the two immediately preceding financial years or during the current financial year.
e. Who, neither himself nor any of his relatives –
(i) holds or has held the position of a key managerial personnel or is or has been an employee of the company or its holding, subsidiary or associate company in any of the three financial years immediately preceding the financial year in which he is proposed to be appointed;
(ii) is or has been an employee or proprietor or a partner, in any of the three financial years immediately preceding the financial year in which he is proposed to be appointed, of –
(A) a firm of auditors or company secretaries in practice or cost auditors of the company or its holding, subsidiary or associate company; or
(B) any legal or a consulting firm that has or had any transaction with the company, its holding, subsidiary or associate company amounting to ten per cent or more of the gross turnover or such firm;
43
(iii) holds together with his relatives two per cent or more of the total voting power of the company; or
(iv) is a Chief Executive or Director, by whatever name called, of any non-profit organisation that receives twenty-five per cent or more of its receipts from the company, any of its promoters, directors or its holding, subsidiary or associate company or that holds two per cent or more of the total voting power of the company;
(v) is a material supplier, service provider or customer or a lessor or lessee of the company;
f. who is not less than 21 years of age.
Explanation
For the purposes of the sub-clause (1):
i. “Associate” shall mean a company which is an “associate” as defined in Accounting Standard (AS)23, “Accounting for Investments in Associates in Consolidated Financial Statements, issued by the Institute of Chartered Accountants of India;
ii. “Key Managerial Personnel” shall mean “Key Managerial Personnel” as defined in section 2(51) of the Companies Act, 2013;
iii. “Relative” shall mean “relative” as defined in section 2(77) of the Companies Act, 2013 and rules prescribed there under.
5. Letter of Appointment 5.1 Each director will be issued a Letter of Appointment signed by the Chairperson
of the Board.
6. Appointment Procedure 6.1 The NRC shall ensure that the appointment of directors will be in terms of the
Policy and recommendations made to the Board for appointment.
6.2 If required, an external database can be used and advice taken to access a wide base of potential directors as prescribed under the Companies Act, 2013.
7. Appointment and Remuneration of Managerial Personnel
7.1 The NRC shall ensure that the appointment and remuneration payable to the Managing Director(s), CEO, Whole-time Directors, Manager, if any, are in accordance with the provisions of Chapter XIII (Sections 196 to 203) read with Schedule V of the Companies Act, 2013 and Companies (Appointment and Remuneration of Managerial Personnel) Rules, 2014.
7.2 The NRC may recommend a suitable sitting fee, reimbursement of incidentals, travel and other expenses to Non-Executive Directors as may be prescribed under the Companies Act, 2013 read with the Companies (Appointment and Remuneration of Managerial Personnel) Rules, 2014.
44
8. Familiarization Program
The Management will familiarize the Independent Directors on the following:
a) The Oberoi Dharma;
b) Company’s History, Structure and the Business Model;
c) Memorandum & Articles of Association of the Company;
d) Past 3 (three) years accounts and any important factors in the accounts of the Company;
e) Interaction with other Directors on the Board and with the Senior Executives of the Company.
45
Attachment -1
PERSONAL SPECIFICATION FOR DIRECTORS
1. Qualifications
- Degree holder in relevant disciplines (e.g. management, accountancy, legal, sales, marketing, administration, finance, and Corporate Governance and hospitality industry related disciplines); or
- Recognised specialist.
2. Experience
- Experience of management in a diverse organization;
- Experience in accounting and finance, administration, corporate, legal and strategic planning;
- Ability to work effectively with other members of the Board.
3. Skills
- Excellent interpersonal, communication and representational skills;
- Leadership skills;
- Extensive team building and management skills;
- Strong influencing and negotiating skills;
- Continuous professional development to refresh knowledge and skills;
4. Abilities and Attributes
- Commitment to high standards of ethics, personal integrity and probity;
- Commitment to observe “The Oberoi Dharma” and the Code of Conduct.
46
Annexure 4
ANNEXURE TO THE DIRECTORS’ REPORT
Senior Management & Key Managerial Personnel (excluding Executive Directors) Appointment & Remuneration Policy
1. Statement of Purpose:
This Appointment & Remuneration Policy (Policy) of EIH Limited (Company) and its associated entities has been prepared to ensure the following:
1.1 This Policy is in compliance with Section 178 (1) of the Companies Act, 2013 read along with the applicable rules thereto and Regulation 19 of the Securities and Exchange Board of India (Listing Obligations and Disclosure Requirements) Regulations, 2015 (“ Listing Regulations”).
1.2 Appointment & Remuneration of the key managerial personnel and senior management is aligned to the interests of the Company and its shareholders within an appropriate governance framework.
1.3 The level and composition of remuneration is reasonable and sufficient to attract, retain and motivate key managerial personnel and senior management of the quality required to run the company successfully.
2. Scope of policy:
Applies to all key managerial personnel and senior management personnel.
2.1. The expression “key managerial personnel” means: • Company secretary; • Chief Financial Officer; and • such other executive as may be prescribed
2.2. The expression “Senior Management” means personnel of the Company who are members of its core management team excluding the Board of Directors, comprising all members of management one level below the Executive Directors, including functional heads.
3. Remuneration Philosophy for employees and new hires:
The company believes in paying its executives competitive remuneration. The remuneration philosophy aims at the following outcomes;
3.1 Remuneration is structured to align with the Company’s interests, taking account of the Company’s strategies and risks.
3.2 Drive Performance - Executive compensation is linked to individual and company performance, which, in turn, impacts the quantum of payout.
3.3 External Equity - Executive compensation is designed to be competitively benchmarked with the hospitality industry compensation or general industry compensation for applicable roles.
47
3.4 Internal Equity-Executives performing similar role or complexity of jobs are paid at similar compensation levels.
3.5 The Company complies with applicable legal requirements and appropriate standards of governance.
4. Remuneration guidelines:
4.1. The remuneration paid by the company is classified under following major heads:-
4.1.1 Total Fixed Cost: This includes base salary, other cash allowances, perquisites and retirement benefits.
4.1.2 Variable Cost: This includes variable pay linked to company and individual performance. Variable Pay for senior executives constitutes a significant portion of total remuneration.
4.1.3 The sum total of the Total Fixed Cost and Variable Cost is called the Cost to Company in the relevant executive’s remuneration package.
4.3 The Cost to Company being offered to a new hire for a replacement position or new position with reference to scope of this policy is governed by the remuneration philosophy as mentioned in clause no. 3. The endeavour is to ensure internal equity in compensation is maintained, however at the same time compensation is competitive to attract a new hire.
4.4 Remuneration is annually reviewed for all the executives who are eligible for compensation review in accordance with the remuneration philosophy.
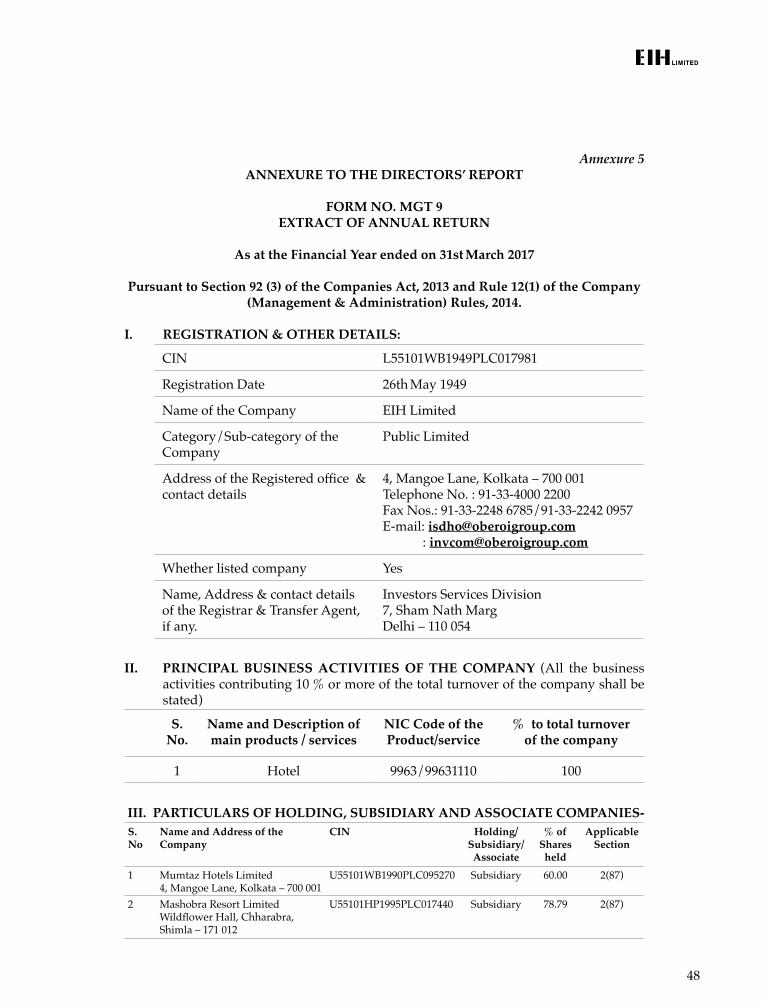
48
Annexure 5ANNEXURE TO THE DIRECTORS’ REPORT
FORM NO. MGT 9EXTRACT OF ANNUAL RETURN
As at the Financial Year ended on 31st March 2017
Pursuant to Section 92 (3) of the Companies Act, 2013 and Rule 12(1) of the Company (Management & Administration) Rules, 2014.
I. REGISTRATION & OTHER DETAILS:
CIN L55101WB1949PLC017981
Registration Date 26th May 1949
Name of the Company EIH Limited
Category/Sub-category of the Company
Public Limited
Address of the Registered office & contact details
4, Mangoe Lane, Kolkata – 700 001Telephone No. : 91-33-4000 2200Fax Nos.: 91-33-2248 6785/91-33-2242 0957E-mail: [email protected] : [email protected]
Whether listed company Yes
Name, Address & contact details of the Registrar & Transfer Agent, if any.
Investors Services Division7, Sham Nath MargDelhi – 110 054
II. PRINCIPAL BUSINESS ACTIVITIES OF THE COMPANY (All the business activities contributing 10 % or more of the total turnover of the company shall be stated)
S. No.
Name and Description of main products / services
NIC Code of the Product/service
% to total turnover of the company
1 Hotel 9963/99631110 100
III. PARTICULARS OF HOLDING, SUBSIDIARY AND ASSOCIATE COMPANIES- S. No
Name and Address of the Company
CIN Holding/Subsidiary/Associate
% of Shares held
Applicable Section
1 Mumtaz Hotels Limited4, Mangoe Lane, Kolkata – 700 001
U55101WB1990PLC095270 Subsidiary 60.00 2(87)
2 Mashobra Resort Limited Wildflower Hall, Chharabra, Shimla – 171 012
U55101HP1995PLC017440 Subsidiary 78.79 2(87)
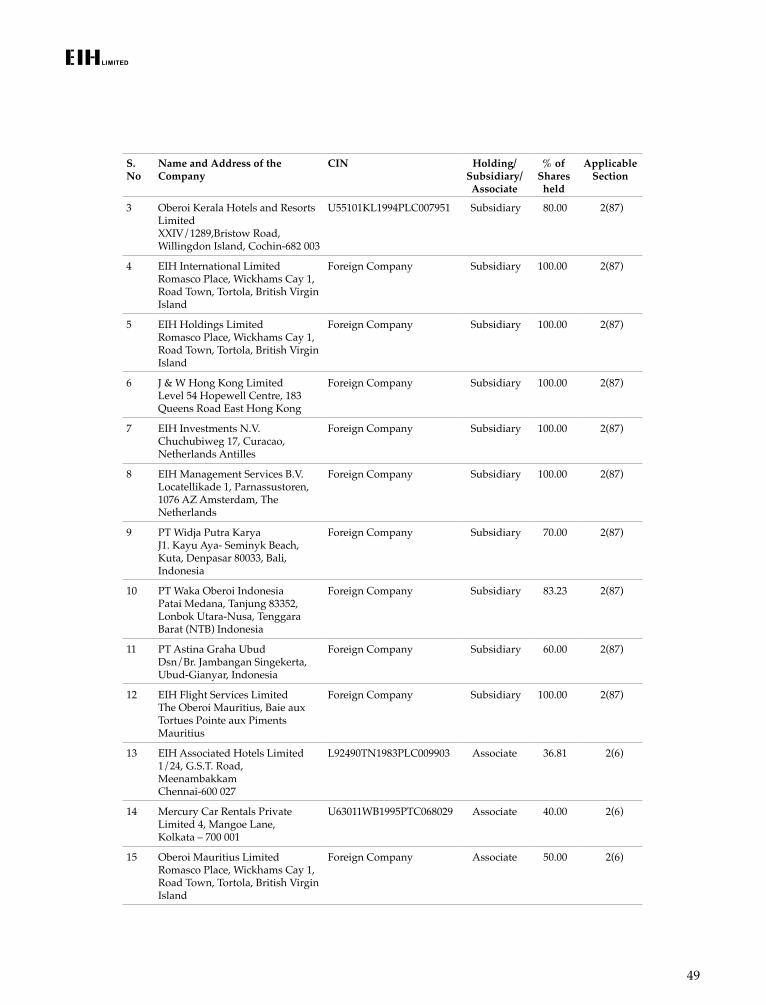
49
S. No
Name and Address of the Company
CIN Holding/Subsidiary/Associate
% of Shares held
Applicable Section
3 Oberoi Kerala Hotels and Resorts LimitedXXIV/1289,Bristow Road, Willingdon Island, Cochin-682 003
U55101KL1994PLC007951 Subsidiary 80.00 2(87)
4 EIH International LimitedRomasco Place, Wickhams Cay 1, Road Town, Tortola, British Virgin Island
Foreign Company Subsidiary 100.00 2(87)
5 EIH Holdings LimitedRomasco Place, Wickhams Cay 1, Road Town, Tortola, British Virgin Island
Foreign Company Subsidiary 100.00 2(87)
6 J & W Hong Kong LimitedLevel 54 Hopewell Centre, 183 Queens Road East Hong Kong
Foreign Company Subsidiary 100.00 2(87)
7 EIH Investments N.V.Chuchubiweg 17, Curacao, Netherlands Antilles
Foreign Company Subsidiary 100.00 2(87)
8 EIH Management Services B.V.Locatellikade 1, Parnassustoren, 1076 AZ Amsterdam, The Netherlands
Foreign Company Subsidiary 100.00 2(87)
9 PT Widja Putra KaryaJ1. Kayu Aya- Seminyk Beach, Kuta, Denpasar 80033, Bali, Indonesia
Foreign Company Subsidiary 70.00 2(87)
10 PT Waka Oberoi IndonesiaPatai Medana, Tanjung 83352, Lonbok Utara-Nusa, Tenggara Barat (NTB) Indonesia
Foreign Company Subsidiary 83.23 2(87)
11 PT Astina Graha UbudDsn/Br. Jambangan Singekerta, Ubud-Gianyar, Indonesia
Foreign Company Subsidiary 60.00 2(87)
12 EIH Flight Services LimitedThe Oberoi Mauritius, Baie aux Tortues Pointe aux Piments Mauritius
Foreign Company Subsidiary 100.00 2(87)
13 EIH Associated Hotels Limited1/24, G.S.T. Road, MeenambakkamChennai-600 027
L92490TN1983PLC009903 Associate 36.81 2(6)
14 Mercury Car Rentals Private Limited 4, Mangoe Lane, Kolkata – 700 001
U63011WB1995PTC068029 Associate 40.00 2(6)
15 Oberoi Mauritius LimitedRomasco Place, Wickhams Cay 1, Road Town, Tortola, British Virgin Island
Foreign Company Associate 50.00 2(6)
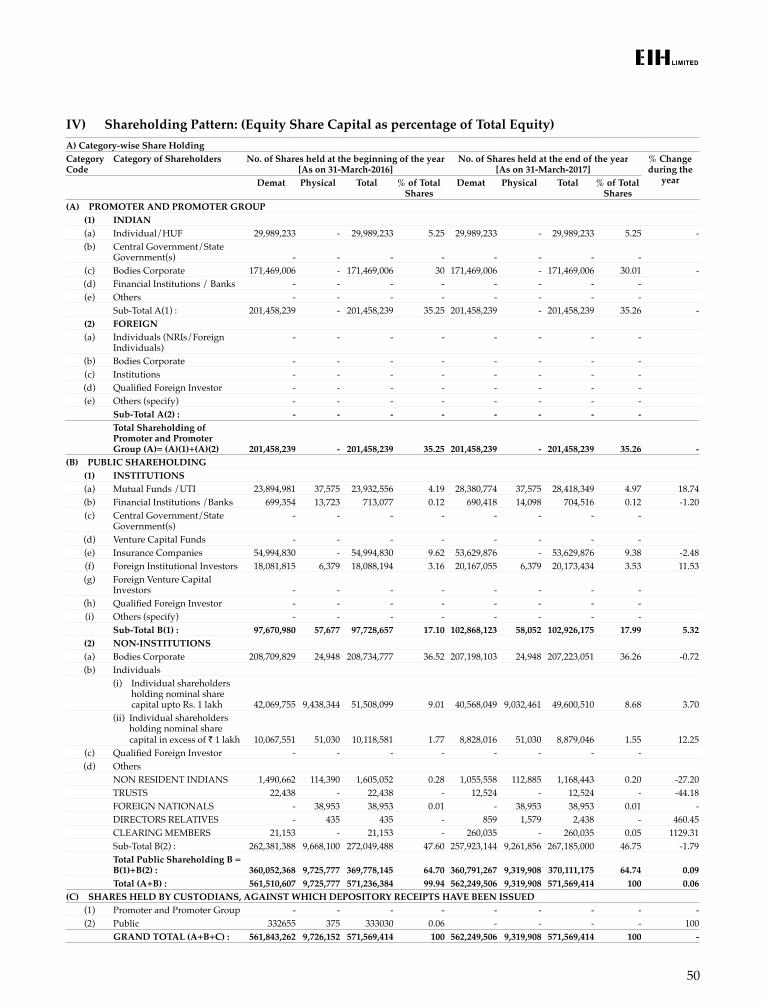
50
IV) Shareholding Pattern: (Equity Share Capital as percentage of Total Equity)A) Category-wise Share Holding Category Code
Category of Shareholders No. of Shares held at the beginning of the year [As on 31-March-2016]
No. of Shares held at the end of the year [As on 31-March-2017]
% Change during the
yearDemat Physical Total % of Total Shares
Demat Physical Total % of Total Shares
(A) PROMOTER AND PROMOTER GROUP(1) INDIAN(a) Individual/HUF 29,989,233 - 29,989,233 5.25 29,989,233 - 29,989,233 5.25 -(b) Central Government/State
Government(s) - - - - - - - -(c) Bodies Corporate 171,469,006 - 171,469,006 30 171,469,006 - 171,469,006 30.01 -(d) Financial Institutions / Banks - - - - - - - -(e) Others - - - - - - - -
Sub-Total A(1) : 201,458,239 - 201,458,239 35.25 201,458,239 - 201,458,239 35.26 -(2) FOREIGN(a) Individuals (NRIs/Foreign
Individuals)- - - - - - - -
(b) Bodies Corporate - - - - - - - -(c) Institutions - - - - - - - -(d) Qualified Foreign Investor - - - - - - - -(e) Others (specify) - - - - - - - -
Sub-Total A(2) : - - - - - - - -Total Shareholding of Promoter and Promoter Group (A)= (A)(1)+(A)(2) 201,458,239 - 201,458,239 35.25 201,458,239 - 201,458,239 35.26 -
(B) PUBLIC SHAREHOLDING(1) INSTITUTIONS(a) Mutual Funds /UTI 23,894,981 37,575 23,932,556 4.19 28,380,774 37,575 28,418,349 4.97 18.74(b) Financial Institutions /Banks 699,354 13,723 713,077 0.12 690,418 14,098 704,516 0.12 -1.20(c) Central Government/State
Government(s)- - - - - - - -
(d) Venture Capital Funds - - - - - - - -(e) Insurance Companies 54,994,830 - 54,994,830 9.62 53,629,876 - 53,629,876 9.38 -2.48(f) Foreign Institutional Investors 18,081,815 6,379 18,088,194 3.16 20,167,055 6,379 20,173,434 3.53 11.53(g) Foreign Venture Capital
Investors - - - - - - - -(h) Qualified Foreign Investor - - - - - - - -(i) Others (specify) - - - - - - - -
Sub-Total B(1) : 97,670,980 57,677 97,728,657 17.10 102,868,123 58,052 102,926,175 17.99 5.32(2) NON-INSTITUTIONS(a) Bodies Corporate 208,709,829 24,948 208,734,777 36.52 207,198,103 24,948 207,223,051 36.26 -0.72(b) Individuals
(i) Individual shareholders holding nominal share capital upto Rs. 1 lakh 42,069,755 9,438,344 51,508,099 9.01 40,568,049 9,032,461 49,600,510 8.68 3.70
(ii) Individual shareholders holding nominal share capital in excess of ` 1 lakh 10,067,551 51,030 10,118,581 1.77 8,828,016 51,030 8,879,046 1.55 12.25
(c) Qualified Foreign Investor - - - - - - - -(d) Others
NON RESIDENT INDIANS 1,490,662 114,390 1,605,052 0.28 1,055,558 112,885 1,168,443 0.20 -27.20TRUSTS 22,438 - 22,438 - 12,524 - 12,524 - -44.18FOREIGN NATIONALS - 38,953 38,953 0.01 - 38,953 38,953 0.01 -DIRECTORS RELATIVES - 435 435 - 859 1,579 2,438 - 460.45CLEARING MEMBERS 21,153 - 21,153 - 260,035 - 260,035 0.05 1129.31Sub-Total B(2) : 262,381,388 9,668,100 272,049,488 47.60 257,923,144 9,261,856 267,185,000 46.75 -1.79Total Public Shareholding B = B(1)+B(2) : 360,052,368 9,725,777 369,778,145 64.70 360,791,267 9,319,908 370,111,175 64.74 0.09Total (A+B) : 561,510,607 9,725,777 571,236,384 99.94 562,249,506 9,319,908 571,569,414 100 0.06
(C) SHARES HELD BY CUSTODIANS, AGAINST WHICH DEPOSITORY RECEIPTS HAVE BEEN ISSUED(1) Promoter and Promoter Group - - - - - - - - -(2) Public 332655 375 333030 0.06 - - - - 100
GRAND TOTAL (A+B+C) : 561,843,262 9,726,152 571,569,414 100 562,249,506 9,319,908 571,569,414 100 -
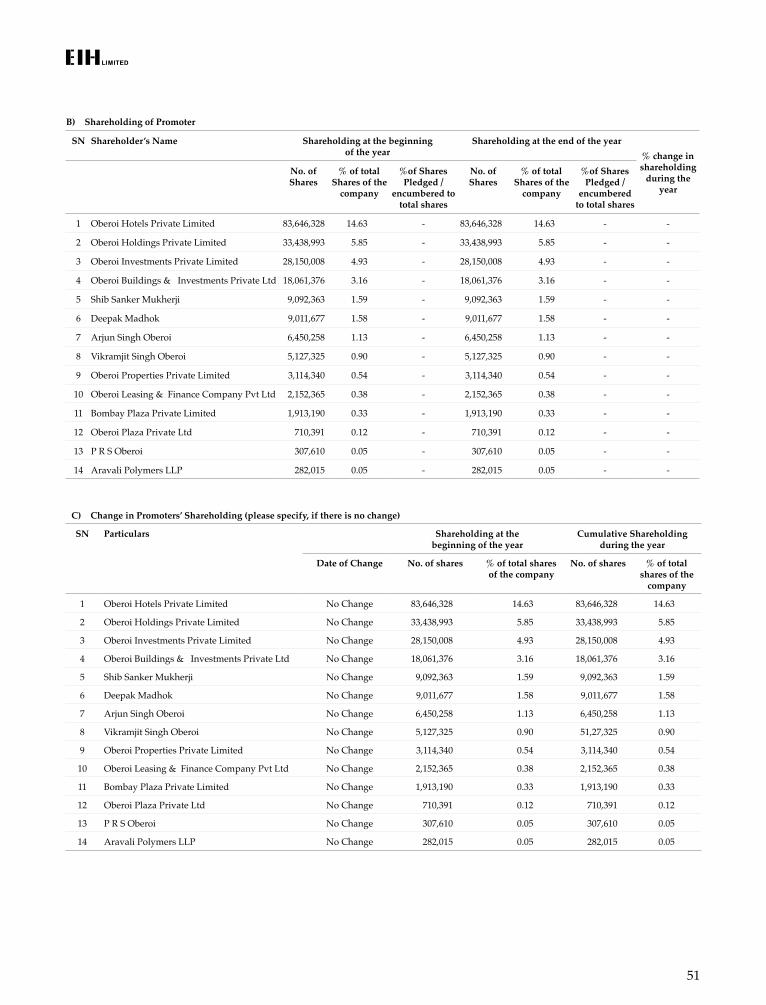
51
B) Shareholding of Promoter
SN Shareholder’s Name Shareholding at the beginning of the year
Shareholding at the end of the year% change in shareholding
during the year
No. of Shares
% of total Shares of the
company
%of Shares Pledged /
encumbered to total shares
No. of Shares
% of total Shares of the
company
%of Shares Pledged /
encumbered to total shares
1 Oberoi Hotels Private Limited 83,646,328 14.63 - 83,646,328 14.63 - -
2 Oberoi Holdings Private Limited 33,438,993 5.85 - 33,438,993 5.85 - -
3 Oberoi Investments Private Limited 28,150,008 4.93 - 28,150,008 4.93 - -
4 Oberoi Buildings & Investments Private Ltd 18,061,376 3.16 - 18,061,376 3.16 - -
5 Shib Sanker Mukherji 9,092,363 1.59 - 9,092,363 1.59 - -
6 Deepak Madhok 9,011,677 1.58 - 9,011,677 1.58 - -
7 Arjun Singh Oberoi 6,450,258 1.13 - 6,450,258 1.13 - -
8 Vikramjit Singh Oberoi 5,127,325 0.90 - 5,127,325 0.90 - -
9 Oberoi Properties Private Limited 3,114,340 0.54 - 3,114,340 0.54 - -
10 Oberoi Leasing & Finance Company Pvt Ltd 2,152,365 0.38 - 2,152,365 0.38 - -
11 Bombay Plaza Private Limited 1,913,190 0.33 - 1,913,190 0.33 - -
12 Oberoi Plaza Private Ltd 710,391 0.12 - 710,391 0.12 - -
13 P R S Oberoi 307,610 0.05 - 307,610 0.05 - -
14 Aravali Polymers LLP 282,015 0.05 - 282,015 0.05 - -
C) Change in Promoters’ Shareholding (please specify, if there is no change)
SN Particulars Shareholding at the beginning of the year
Cumulative Shareholding during the year
Date of Change No. of shares % of total shares of the company
No. of shares % of total shares of the
company
1 Oberoi Hotels Private Limited No Change 83,646,328 14.63 83,646,328 14.63
2 Oberoi Holdings Private Limited No Change 33,438,993 5.85 33,438,993 5.85
3 Oberoi Investments Private Limited No Change 28,150,008 4.93 28,150,008 4.93
4 Oberoi Buildings & Investments Private Ltd No Change 18,061,376 3.16 18,061,376 3.16
5 Shib Sanker Mukherji No Change 9,092,363 1.59 9,092,363 1.59
6 Deepak Madhok No Change 9,011,677 1.58 9,011,677 1.58
7 Arjun Singh Oberoi No Change 6,450,258 1.13 6,450,258 1.13
8 Vikramjit Singh Oberoi No Change 5,127,325 0.90 51,27,325 0.90
9 Oberoi Properties Private Limited No Change 3,114,340 0.54 3,114,340 0.54
10 Oberoi Leasing & Finance Company Pvt Ltd No Change 2,152,365 0.38 2,152,365 0.38
11 Bombay Plaza Private Limited No Change 1,913,190 0.33 1,913,190 0.33
12 Oberoi Plaza Private Ltd No Change 710,391 0.12 710,391 0.12
13 P R S Oberoi No Change 307,610 0.05 307,610 0.05
14 Aravali Polymers LLP No Change 282,015 0.05 282,015 0.05
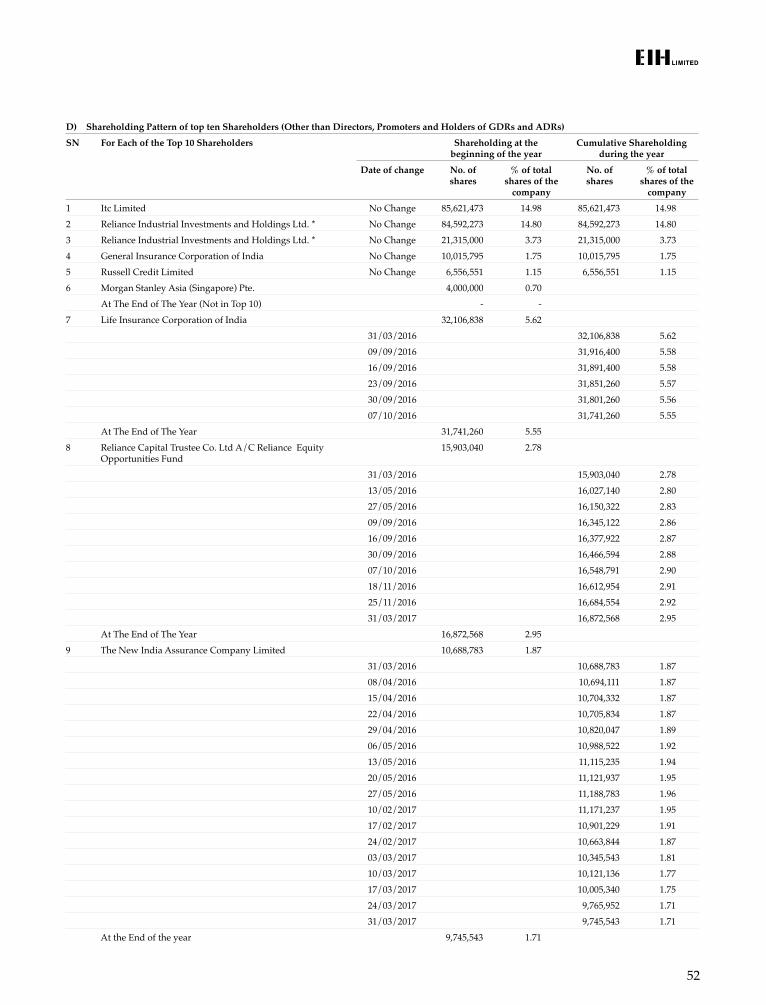
52
D) Shareholding Pattern of top ten Shareholders (Other than Directors, Promoters and Holders of GDRs and ADRs)
SN For Each of the Top 10 Shareholders Shareholding at the beginning of the year
Cumulative Shareholding during the year
Date of change No. of shares
% of total shares of the
company
No. of shares
% of total shares of the
company
1 Itc Limited No Change 85,621,473 14.98 85,621,473 14.982 Reliance Industrial Investments and Holdings Ltd. * No Change 84,592,273 14.80 84,592,273 14.803 Reliance Industrial Investments and Holdings Ltd. * No Change 21,315,000 3.73 21,315,000 3.734 General Insurance Corporation of India No Change 10,015,795 1.75 10,015,795 1.755 Russell Credit Limited No Change 6,556,551 1.15 6,556,551 1.156 Morgan Stanley Asia (Singapore) Pte. 4,000,000 0.70
At The End of The Year (Not in Top 10) - -7 Life Insurance Corporation of India 32,106,838 5.62
31/03/2016 32,106,838 5.6209/09/2016 31,916,400 5.5816/09/2016 31,891,400 5.5823/09/2016 31,851,260 5.5730/09/2016 31,801,260 5.5607/10/2016 31,741,260 5.55
At The End of The Year 31,741,260 5.558 Reliance Capital Trustee Co. Ltd A/C Reliance Equity
Opportunities Fund15,903,040 2.78
31/03/2016 15,903,040 2.7813/05/2016 16,027,140 2.80 27/05/2016 16,150,322 2.8309/09/2016 16,345,122 2.8616/09/2016 16,377,922 2.8730/09/2016 16,466,594 2.8807/10/2016 16,548,791 2.9018/11/2016 16,612,954 2.9125/11/2016 16,684,554 2.9231/03/2017 16,872,568 2.95
At The End of The Year 16,872,568 2.959 The New India Assurance Company Limited 10,688,783 1.87
31/03/2016 10,688,783 1.8708/04/2016 10,694,111 1.8715/04/2016 10,704,332 1.8722/04/2016 10,705,834 1.8729/04/2016 10,820,047 1.8906/05/2016 10,988,522 1.9213/05/2016 11,115,235 1.9420/05/2016 11,121,937 1.9527/05/2016 11,188,783 1.9610/02/2017 11,171,237 1.9517/02/2017 10,901,229 1.9124/02/2017 10,663,844 1.8703/03/2017 10,345,543 1.8110/03/2017 10,121,136 1.7717/03/2017 10,005,340 1.7524/03/2017 9,765,952 1.7131/03/2017 9,745,543 1.71
At the End of the year 9,745,543 1.71
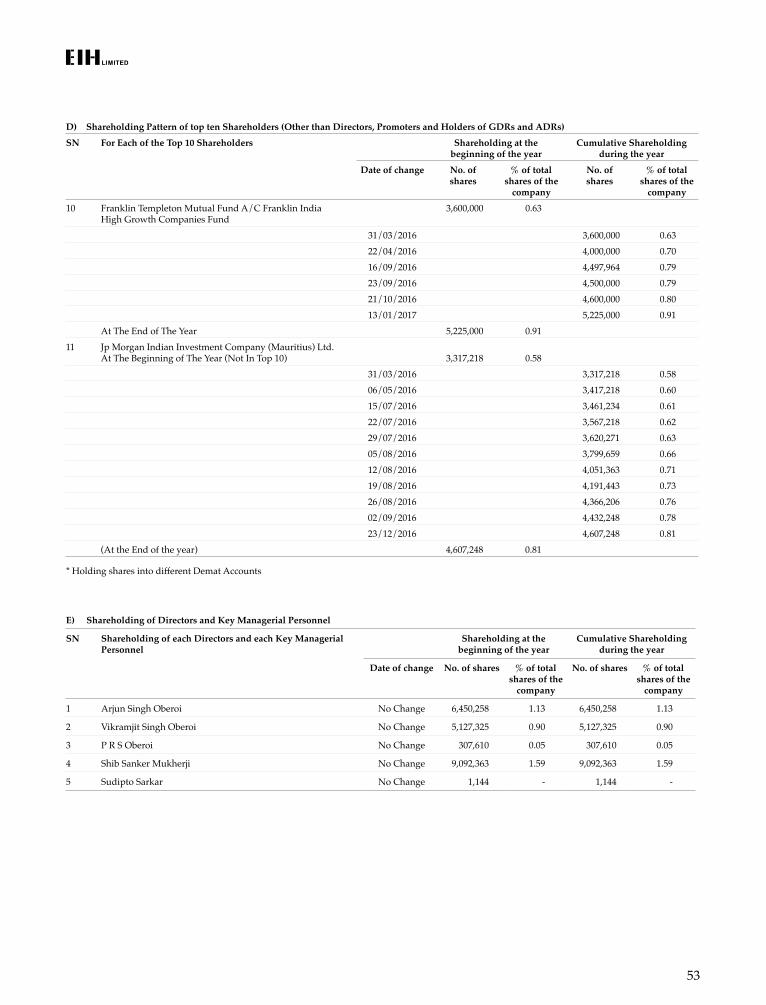
53
D) Shareholding Pattern of top ten Shareholders (Other than Directors, Promoters and Holders of GDRs and ADRs)
SN For Each of the Top 10 Shareholders Shareholding at the beginning of the year
Cumulative Shareholding during the year
Date of change No. of shares
% of total shares of the
company
No. of shares
% of total shares of the
company
10 Franklin Templeton Mutual Fund A/C Franklin India High Growth Companies Fund
3,600,000 0.63
31/03/2016 3,600,000 0.6322/04/2016 4,000,000 0.7016/09/2016 4,497,964 0.7923/09/2016 4,500,000 0.7921/10/2016 4,600,000 0.8013/01/2017 5,225,000 0.91
At The End of The Year 5,225,000 0.9111 Jp Morgan Indian Investment Company (Mauritius) Ltd.
At The Beginning of The Year (Not In Top 10) 3,317,218 0.5831/03/2016 3,317,218 0.5806/05/2016 3,417,218 0.6015/07/2016 3,461,234 0.6122/07/2016 3,567,218 0.6229/07/2016 3,620,271 0.6305/08/2016 3,799,659 0.6612/08/2016 4,051,363 0.7119/08/2016 4,191,443 0.7326/08/2016 4,366,206 0.7602/09/2016 4,432,248 0.7823/12/2016 4,607,248 0.81
(At the End of the year) 4,607,248 0.81
E) Shareholding of Directors and Key Managerial Personnel
SN Shareholding of each Directors and each Key Managerial Personnel
Shareholding at the beginning of the year
Cumulative Shareholding during the year
Date of change No. of shares % of total shares of the
company
No. of shares % of total shares of the
company
1 Arjun Singh Oberoi No Change 6,450,258 1.13 6,450,258 1.13
2 Vikramjit Singh Oberoi No Change 5,127,325 0.90 5,127,325 0.90
3 P R S Oberoi No Change 307,610 0.05 307,610 0.05
4 Shib Sanker Mukherji No Change 9,092,363 1.59 9,092,363 1.59
5 Sudipto Sarkar No Change 1,144 - 1,144 -
* Holding shares into different Demat Accounts
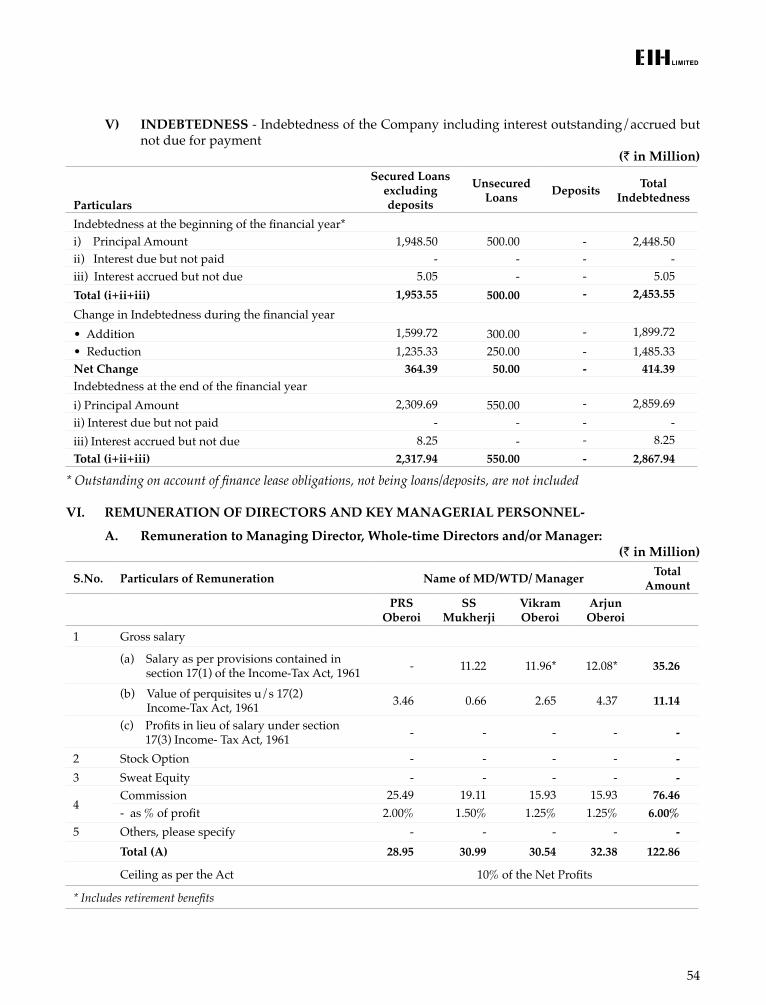
54
V) INDEBTEDNESS - Indebtedness of the Company including interest outstanding/accrued but not due for payment
(` in Million)
Particulars
Secured Loans excluding deposits
Unsecured Loans Deposits Total
Indebtedness
Indebtedness at the beginning of the financial year*i) Principal Amount 1,948.50 500.00 - 2,448.50ii) Interest due but not paid - - - -iii) Interest accrued but not due 5.05 - - 5.05Total (i+ii+iii) 1,953.55 500.00 - 2,453.55
Change in Indebtedness during the financial year• Addition 1,599.72 300.00 - 1,899.72• Reduction 1,235.33 250.00 - 1,485.33Net Change 364.39 50.00 - 414.39Indebtedness at the end of the financial yeari) Principal Amount 2,309.69 550.00 - 2,859.69ii) Interest due but not paid - - - -iii) Interest accrued but not due 8.25 - - 8.25Total (i+ii+iii) 2,317.94 550.00 - 2,867.94
* Outstanding on account of finance lease obligations, not being loans/deposits, are not included
VI. REMUNERATION OF DIRECTORS AND KEY MANAGERIAL PERSONNEL-
A. Remuneration to Managing Director, Whole-time Directors and/or Manager: (` in Million)
S.No. Particulars of Remuneration Name of MD/WTD/ Manager Total Amount
PRS Oberoi
SS Mukherji
Vikram Oberoi
Arjun Oberoi
1 Gross salary
(a) Salary as per provisions contained in section 17(1) of the Income-Tax Act, 1961 - 11.22 11.96* 12.08* 35.26
(b) Value of perquisites u/s 17(2) Income-Tax Act, 1961 3.46 0.66 2.65 4.37 11.14
(c) Profits in lieu of salary under section 17(3) Income- Tax Act, 1961 - - - - -
2 Stock Option - - - - -3 Sweat Equity - - - - -
4Commission 25.49 19.11 15.93 15.93 76.46- as % of profit 2.00% 1.50% 1.25% 1.25% 6.00%
5 Others, please specify - - - - -Total (A) 28.95 30.99 30.54 32.38 122.86
Ceiling as per the Act 10% of the Net Profits
* Includes retirement benefits
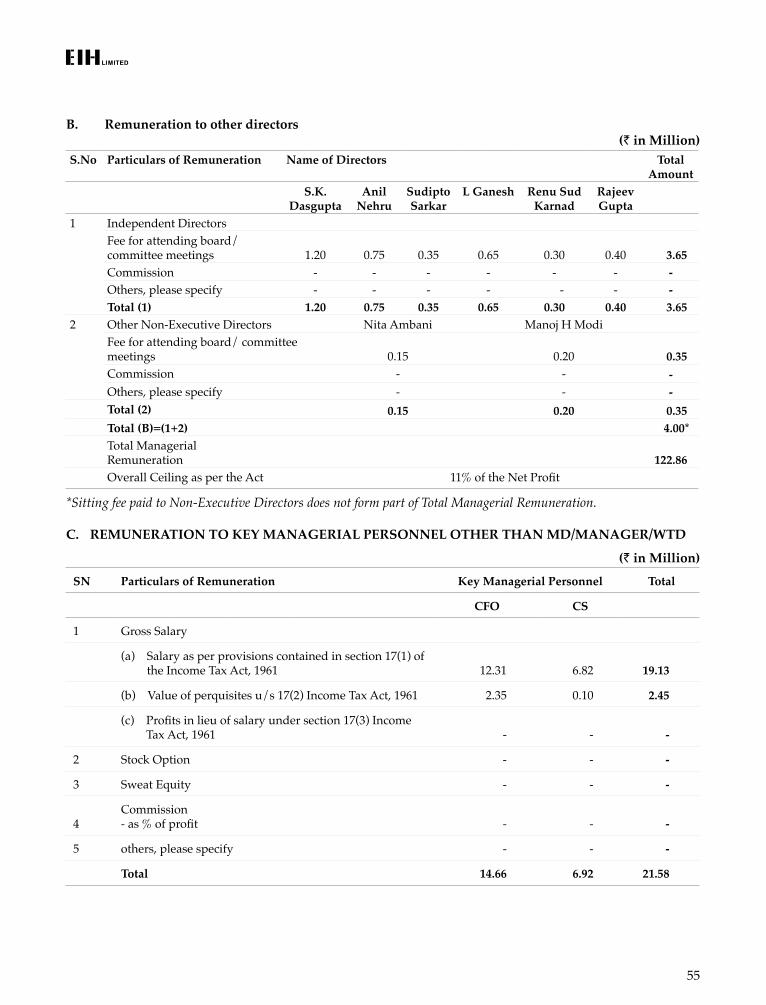
55
B. Remuneration to other directors(` in Million)
S.No Particulars of Remuneration Name of Directors Total Amount
S.K. Dasgupta
Anil Nehru
Sudipto Sarkar
L Ganesh Renu Sud Karnad
Rajeev Gupta
1 Independent DirectorsFee for attending board/ committee meetings 1.20 0.75 0.35 0.65 0.30 0.40 3.65Commission - - - - - - -Others, please specify - - - - - - -Total (1) 1.20 0.75 0.35 0.65 0.30 0.40 3.65
2 Other Non-Executive Directors Nita Ambani Manoj H ModiFee for attending board/ committee meetings 0.15 0.20 0.35Commission - - -Others, please specify - - -
Total (2) 0.15 0.20 0.35 Total (B)=(1+2) 4.00*
Total Managerial Remuneration 122.86
Overall Ceiling as per the Act 11% of the Net Profit
*Sitting fee paid to Non-Executive Directors does not form part of Total Managerial Remuneration.
C. REMUNERATION TO KEY MANAGERIAL PERSONNEL OTHER THAN MD/MANAGER/WTD
(` in Million)
SN Particulars of Remuneration Key Managerial Personnel Total
CFO CS
1 Gross Salary
(a) Salary as per provisions contained in section 17(1) of the Income Tax Act, 1961 12.31 6.82 19.13
(b) Value of perquisites u/s 17(2) Income Tax Act, 1961 2.35 0.10 2.45
(c) Profits in lieu of salary under section 17(3) Income Tax Act, 1961 - - -
2 Stock Option - - -
3 Sweat Equity - - -
4Commission- as % of profit - - -
5 others, please specify - - -
Total 14.66 6.92 21.58
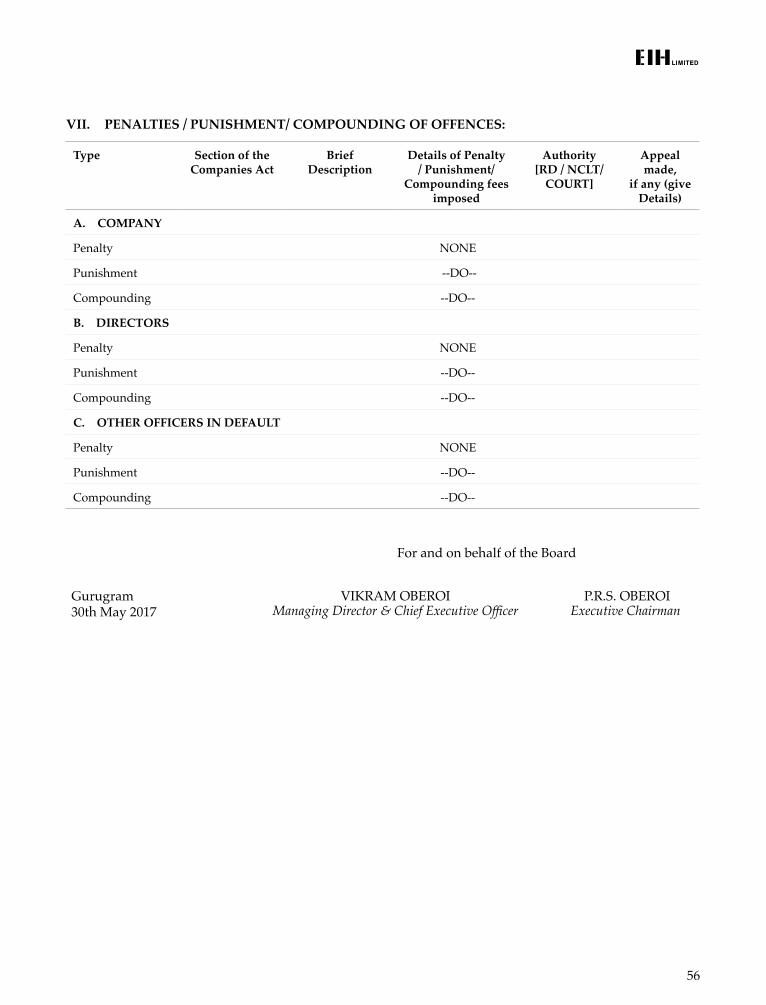
56
VII. PENALTIES / PUNISHMENT/ COMPOUNDING OF OFFENCES:
Type Section of the Companies Act
Brief Description
Details of Penalty / Punishment/
Compounding fees imposed
Authority [RD / NCLT/
COURT]
Appeal made,
if any (give Details)
A. COMPANY
Penalty NONE
Punishment --DO--
Compounding --DO--
B. DIRECTORS
Penalty NONE
Punishment --DO--
Compounding --DO--
C. OTHER OFFICERS IN DEFAULT
Penalty NONE
Punishment --DO--
Compounding --DO--
For and on behalf of the Board
Gurugram 30th May 2017
VIKRAM OBEROI Managing Director & Chief Executive Officer
P.R.S. OBEROI Executive Chairman
57
MANAGEMENT DISCUSSION AND ANALYSIS
Industry Structure, Developments and Outlook
The Global Economy – Performance & ProspectsGlobal GDP growth declined in 2016 at 3.1% however, growth projections are more encouraging in 2017 and 2018. Led by improved trade and manufacturing, as well as the strength of emerging and developing nation’s economies, Global GDP is projected to increase to 3.5% in 2017 and 3.6% in 2018. The increase in Global GDP will be positive for the travel and tourism sectors.
The United States (US), a major contributor to Global Travel and Tourism saw its economy grow at a modest 1.6% in 2016. The US economy is forecast to grow at 2.2% in 2017 and 2.1% in 2018. This is of significance as the United States is the second largest source market for hotels of the Company after India.
The slow-down in the global economy in 2016 had an impact on arrivals from the Western Hemisphere and in particular the United States. The total number of room nights produced by travelers from the US, UK and Western Europe for EIH Limited in 2015-16 and 2016-17, remained flat. As is evident from this lack of growth, the dependence of the hospitality industry on the Indian leisure and corporate traveler has increased. This trend will continue in the coming years.
The India EconomyAt the close of 2015 – 16, the Economic Survey of India estimated GDP growth of 7.6% for the country. The overall macroeconomic stability was the result of a reduction in the fiscal deficit, the current account deficit and inflation.
The Economist Intelligence Unit forecasts a GDP growth of 7.2% in 2017, and an average of 7.5% annually over the next five years.
The year 2016-17 also witnessed a major policy initiative that will positively impact the economy - the Constitutional Amendment leading to the implementation of the Goods & Services Tax (GST) from 1st July 2017.
The goal of the GST is to create a common Indian marketplace, improve tax compliance, governance and increase investments and growth.
The taxes applicable to the various stakeholders in travel and tourism have been announced. While it is commendable that GST rates applicable to travel, tours & transportation have been lowered, it is disappointing that a tax rate of up to 28% has been applied to hotels who charge in excess of ` 5000 per night. The application of the highest rate of 28% to a significant part of the Hospitality Industry will make the destination more expensive and will adversely affect its capability to generate revenue and employment. We hope that the tax rate of 28% will be reviewed and revised in the interest of the hospitality industry and the nation.
Travel and Tourism
Global ScenarioNotwithstanding a decline in Global GDP growth, the Travel and Tourism industry continued to show resilience in 2016. According to the World Travel and Tourism Council
58
(WTTC), Travel and Tourism, despite escalating political instability and unpredictable terrorist attacks, contributed 10.2% of global GDP and 292 million jobs in 2016 – this equates to 1 in 10 jobs in the global economy.
Travel and Tourism GDP growth is anticipated to accelerate to 3.8% in 2017, up from 3.1% in 2016. The industry is expected to continue to drive employment in the global economy, grow by 3.9% per annum over the next decade and represent 11.4% of GDP in 2027.
India The Indian Travel and Tourism Industry has been a strong contributor to the nation’s economic growth, emerging as a significant source of foreign exchange and a large generator of employment.
As per the WTTC’s Economic Impact 2017 - India Report, Travel and Tourism contributed 9.6% to the nation’s GDP equating to 14 trillion (US$ 209 billion). The contribution of this sector is forecast to double, reaching over ` 28 trillion (US$ 424 billion) and representing 10% of the nation’s GDP by 2027.
Travel and Tourism accounts for one third of India’s foreign exchange earnings, and has the highest employment when compared to other sectors. In 2016, the sector employed approximately 40 million people, contributing 9.3% to total employment in the country. This is expected to rise to 50 million jobs by 2027. The travel and tourism sectors ability to create employment is significant especially given the demographics of India’s population and the need of the India Economy and its people. It plays an important role in integrating society, driving development and employment in rural areas and creating employment for women.
Domestic tourism, driven by India’s expanding middle class and increasing disposable incomes, has emerged as a key driver for the growth of travel and tourism. As per the Ministry of Tourism, Domestic Tourist Visits (DTVs) to the States/Union Territories (UTs) grew by 15.5% annually to 1.65 billion during 2016.
Furthermore, Foreign Tourist Arrivals (FTAs) in 2016 grew by 10.7% over the previous year to reach nearly 9 million. The foreign tourist arrivals on e-visas more than doubled to 1 million as the e-visa facility was extended to 161 countries from 113 previously.
India is anticipated to rank among the top five business travel markets globally over the next ten years. Business travel spending in the country is expected to grow by 5.5% in 2017 to over ` 700 billion, and double to over ` 1.4 trillion by 2027.
Tourism & Hospitality - Trends and Opportunities for GrowthBranded supply grew at a CAGR of 11.1% over the past five years while demand outpaced supply growth at 13.0% for the same period. As a consequence, hotel occupancies in India exceeded 60% in 2016-17. However, in a number of primary and secondary cities, hotel room inventories increased substantially with new hotel openings. This was not offset with a corresponding increase in demand, putting pressure on both occupancy levels and room rates in these cities. With GDP forecast to grow annually at 7.5% over the next five years and limited hotels under construction, the industry will benefit with improved occupancy levels and higher room rates.
59
Financial and Operating PerformanceDuring the Financial Year 2016 – 17, the Company’s Revenue, EBIDTA, Profit before Tax and Profit after Tax were affected due to closure of The Oberoi, New Delhi for major renovations. The Oberoi, New Delhi is amongst the most profitable hotels of the Company. The Oberoi, New Delhi is scheduled to re-open in April 2018.
The Company’s Total Revenue was ` 13,768 million in 2016-17 as compared to ` 14,696 million in the previous year. The revenue growth of the Company for the year with reference to the other properties, after factoring the closure of The Oberoi, New Delhi, increased by over 8% as compared to the previous year.
The Profit before Exceptional Items and Tax was ` 1,661 million as compared to ` 1,831 million in the previous year.
Profit Before Tax was ` 1,279 million as compared to ` 1,649 million in the previous year.
The Net Profit for the year was 965 million as compared to 1,090 million in the previous year.
Total comprehensive income was 884 million as against 1,025 Million in the previous year.
Subject to the approval of the Shareholders, the Board has recommended a dividend of ` 0.90 per share of face value of ` 2.
The Company continues to be largely engaged in hospitality and related businesses.
Internal Control Mechanism and Adequacy The Company is committed to ensuring effective internal controls, operational efficiencies, prevention and detection of frauds and errors, security of organizational assets, and accurate and timely financial information.
Internal control mechanisms have been designed in a way to reflect the necessary concomitance to the principle of governance where the freedom of operations and management is exercised within a framework of appropriate checks and balances.
Internal Financial Controls (IFC)The Directors have devised a framework for Internal Financial Controls to be followed by the Company that conforms to the requirements of Section 134(5)(e) of the Companies Act, 2013 and incorporates measures that ensure adequate and continuing operating effectiveness of internal financial controls.
Furthermore, in accordance with Section 149(8), read with the Code for Independent Directors laid down under Schedule IV, Clause II (3) of the Companies Act, 2013, the Independent Directors have satisfied themselves on the integrity of financial information and have ensured that Financial Controls and systems of Risk Management are robust and secure.
In order to enable the Directors to meet these responsibilities, the Board has devised the necessary systems, frameworks and mechanisms within the Company. The Board has
60
empowered the Audit Committee to periodically review and confirm that the mechanism remains effective and fulfill the objectives for which they have been created.
In keeping with global best practices applicable to organizations of a similar size, nature and complexity, the Company’s Internal Control Framework has been designed through structured control risk assessments by way of Standard Operating Procedures (SOPs), Risk and Control Matrices (RACM), Information Technology (IT) Policies, ERP-based Information Systems including MIS and automated system controls inbuilt within the ERP and other IT Systems.
With increasing instances of information security breaches being reported from across the globe, the Company has initiated measures during the year to review its information technology security infrastructure. The Company’s practices have been benchmarked with the best in class and steps are being taken to scale up infrastructure wherever required. Furthermore, a multidisciplinary audit team is responsible for devising adequate monitoring mechanisms and procedures to ensure the prevention and detection of potential lack of controls. This team reports its observations and plans for mitigation with timelines to the Audit Committee of the Board of Directors every quarter.
Internal Audit Mechanism and Review Systems The Internal Audit Department is headed by the Chief Internal Auditor and comprises of a strong internal workforce of ERP-trained Chartered Accountants with specialised skills in the areas of Information Security, Financial, Business, Legal, Statutory, Projects and Process Audits.
The Department utilises Computer Assisted Audit Techniques (CAATs) and deploys online monitoring mechanisms across IT systems of all functions and units of the Company. Focus areas for specific audits are determined based on structured assessment of risk and the yearly Internal Audit Plan approved by the Audit Committee. All reported observations of audits are maintained in online databases ensuring comprehensiveness, ease of accessibility and structured follow-up. Senior Executives meet periodically along with the Managing Director and Chief Executive Officer to address and resolve pending audit issues. The Chief Internal Auditor is responsible to and presents findings to the Audit Committee every quarter. Risks are prioritised and presented based on their probability of occurrence, the pendency of issues in various units and status thereof.
The Audit Committee takes cognisance of the presentation and provides its directions and guidance for further action. The Chief Internal Auditor has also been entrusted with the responsibility to report to the Audit Committee on the adequacy of ‘Internal Financial Controls’ (IFC) in accordance with Section 177 (4) (vii) of the Companies Act, 2013.
During the Financial Year 2016-17, separate presentations on internal audit findings and internal financial controls were shared with the Audit Committee in its meetings on four occasions. The Audit Committee was satisfied with the adequacy of the internal control systems and procedures of the Company and the performance of the Internal Audit Department in respect of monitoring of these systems.
61
Risk Management SystemsDuring the year, the Risk Management Committee comprising of the Managing Director & Chief Executive Officer and Senior Executives of the Company presented to the Board of Directors, Risk Reports in November 2016 and in March 2017. The Risk Management Committee identified potential risks associated with the Company’s business and assigned responsibility to various Risk Owners who were responsible for monitoring and addressing the risks with commensurate mitigating plans. Based on data received from Risk Owners, the organizational criteria of Critical, Watch and Good were applied to each Risk.
The Board was apprised of the performance of the Company against each risk parameter and the measures taken to mitigate these risks. On the whole, the Board was satisfied with the Company’s performance against each identified risk parameter.
Business consolidation and expansionThe Oberoi, Marrakech, is in the final phase of completion. The luxury hotel, consisting of 84 rooms and suites with private swimming pools, is scheduled to open in the last quarter of 2017. The Oberoi branded villas for sale are planned within the development.
The Oberoi, Casablanca, located on a prime ocean front site close to the central business district, is presently under development. The project is undergoing a review by the Government of Morocco.
The Oberoi, Marrakech and The Oberoi, Casablanca will be managed by a wholly owned subsidiary of the Company.
Work has commenced on The Oberoi Rajgarh Palace located near Khajuraho in Madhya Pradesh. The hotel will offer luxury accommodation on a 62 acre site overlooking the Panna Forest Reserve. Construction of the Resort is in progress.
Planning consent for the Company’s 55 acre beach front site at Goa is awaited. Other Government and environmental approvals are in the process of being obtained.
Planning in respect of The Oberoi Hotel and luxury branded residences in Bengaluru has been held up due to changes in planning guidelines.
Construction of The Oberoi, Doha is currently underway. Located on a prime site in the central business district of the city, the hotel will consist of 244 rooms and 44 service apartments. The hotel is scheduled to open in the first quarter of 2019 and will be managed by an overseas subsidiary of the Company.
Planning and design of The Oberoi luxury service apartments in Lusail, Qatar is in progress. The iconic ocean front development will consist of 182 Luxury Apartments and is scheduled to open in the last quarter of 2019. The development will be managed by an overseas subsidiary of the Company.
The Oberoi Gir, a Luxury Jungle Resort spread over 50 acres, is located on the periphery of Gir National Park in Gujarat. Gir National Park is the sole home of the Asiatic Lion and also supports a variety of wildlife, flora and fauna. The Resort, scheduled to open in the last quarter of 2019 will be managed by the Company and shall consist of 22 Luxury Tents.
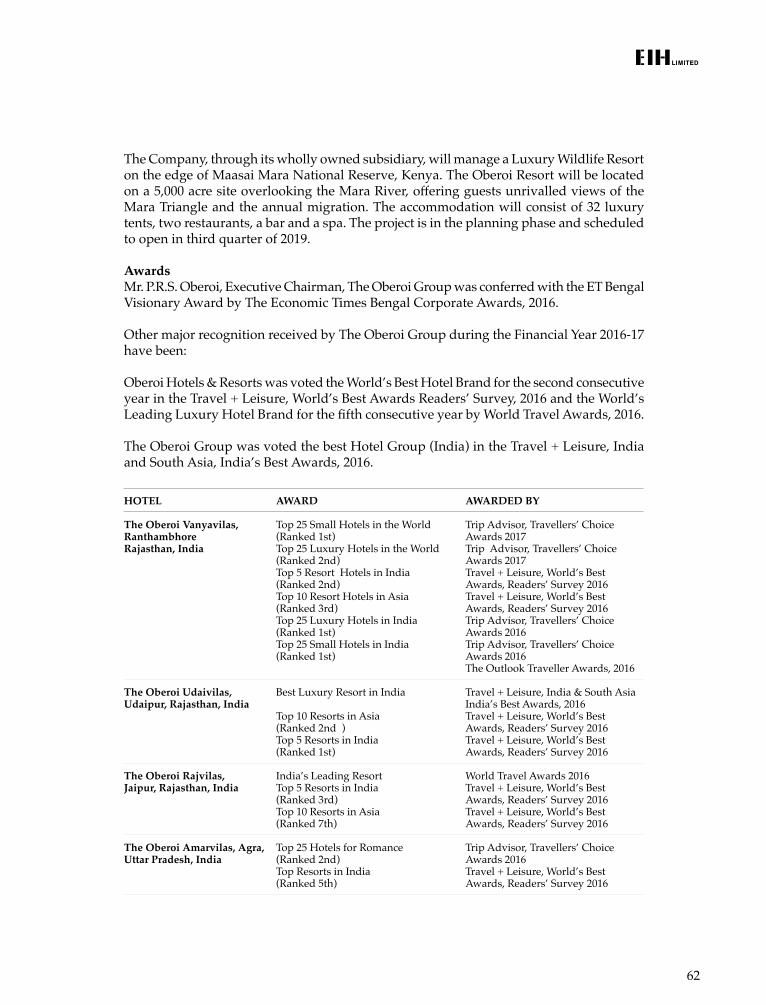
62
The Company, through its wholly owned subsidiary, will manage a Luxury Wildlife Resort on the edge of Maasai Mara National Reserve, Kenya. The Oberoi Resort will be located on a 5,000 acre site overlooking the Mara River, offering guests unrivalled views of the Mara Triangle and the annual migration. The accommodation will consist of 32 luxury tents, two restaurants, a bar and a spa. The project is in the planning phase and scheduled to open in third quarter of 2019.
AwardsMr. P.R.S. Oberoi, Executive Chairman, The Oberoi Group was conferred with the ET Bengal Visionary Award by The Economic Times Bengal Corporate Awards, 2016.
Other major recognition received by The Oberoi Group during the Financial Year 2016-17 have been:
Oberoi Hotels & Resorts was voted the World’s Best Hotel Brand for the second consecutive year in the Travel + Leisure, World’s Best Awards Readers’ Survey, 2016 and the World’s Leading Luxury Hotel Brand for the fifth consecutive year by World Travel Awards, 2016. The Oberoi Group was voted the best Hotel Group (India) in the Travel + Leisure, India and South Asia, India’s Best Awards, 2016.
HOTEL AWARD AWARDED BY
The Oberoi Vanyavilas, Ranthambhore Rajasthan, India
Top 25 Small Hotels in the World(Ranked 1st)Top 25 Luxury Hotels in the World (Ranked 2nd)Top 5 Resort Hotels in India (Ranked 2nd)Top 10 Resort Hotels in Asia(Ranked 3rd)Top 25 Luxury Hotels in India (Ranked 1st)Top 25 Small Hotels in India (Ranked 1st)
Trip Advisor, Travellers’ Choice Awards 2017Trip Advisor, Travellers’ Choice Awards 2017Travel + Leisure, World’s Best Awards, Readers’ Survey 2016Travel + Leisure, World’s Best Awards, Readers’ Survey 2016Trip Advisor, Travellers’ Choice Awards 2016Trip Advisor, Travellers’ Choice Awards 2016The Outlook Traveller Awards, 2016
The Oberoi Udaivilas, Udaipur, Rajasthan, India
Best Luxury Resort in India
Top 10 Resorts in Asia (Ranked 2nd ) Top 5 Resorts in India(Ranked 1st)
Travel + Leisure, India & South Asia India’s Best Awards, 2016Travel + Leisure, World’s Best Awards, Readers’ Survey 2016Travel + Leisure, World’s Best Awards, Readers’ Survey 2016
The Oberoi Rajvilas, Jaipur, Rajasthan, India
India’s Leading ResortTop 5 Resorts in India (Ranked 3rd)Top 10 Resorts in Asia (Ranked 7th)
World Travel Awards 2016Travel + Leisure, World’s Best Awards, Readers’ Survey 2016Travel + Leisure, World’s Best Awards, Readers’ Survey 2016
The Oberoi Amarvilas, Agra, Uttar Pradesh, India
Top 25 Hotels for Romance(Ranked 2nd)Top Resorts in India (Ranked 5th)
Trip Advisor, Travellers’ Choice Awards 2016Travel + Leisure, World’s Best Awards, Readers’ Survey 2016
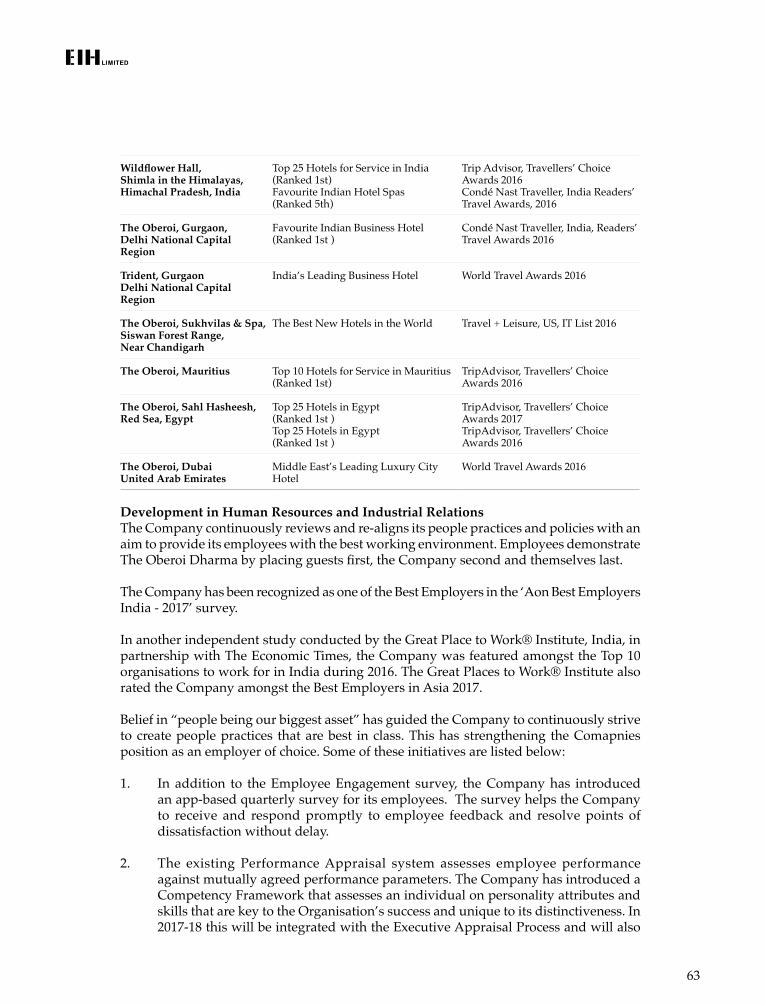
63
Wildflower Hall, Shimla in the Himalayas, Himachal Pradesh, India
Top 25 Hotels for Service in India(Ranked 1st)Favourite Indian Hotel Spas (Ranked 5th)
Trip Advisor, Travellers’ Choice Awards 2016Condé Nast Traveller, India Readers’ Travel Awards, 2016
The Oberoi, Gurgaon, Delhi National Capital Region
Favourite Indian Business Hotel(Ranked 1st )
Condé Nast Traveller, India, Readers’ Travel Awards 2016
Trident, Gurgaon Delhi National Capital Region
India’s Leading Business Hotel World Travel Awards 2016
The Oberoi, Sukhvilas & Spa, Siswan Forest Range, Near Chandigarh
The Best New Hotels in the World Travel + Leisure, US, IT List 2016
The Oberoi, Mauritius Top 10 Hotels for Service in Mauritius(Ranked 1st)
TripAdvisor, Travellers’ Choice Awards 2016
The Oberoi, Sahl Hasheesh, Red Sea, Egypt
Top 25 Hotels in Egypt(Ranked 1st )Top 25 Hotels in Egypt(Ranked 1st )
TripAdvisor, Travellers’ Choice Awards 2017TripAdvisor, Travellers’ Choice Awards 2016
The Oberoi, DubaiUnited Arab Emirates
Middle East’s Leading Luxury City Hotel
World Travel Awards 2016
Development in Human Resources and Industrial RelationsThe Company continuously reviews and re-aligns its people practices and policies with an aim to provide its employees with the best working environment. Employees demonstrate The Oberoi Dharma by placing guests first, the Company second and themselves last.
The Company has been recognized as one of the Best Employers in the ‘Aon Best Employers India - 2017’ survey.
In another independent study conducted by the Great Place to Work® Institute, India, in partnership with The Economic Times, the Company was featured amongst the Top 10 organisations to work for in India during 2016. The Great Places to Work® Institute also rated the Company amongst the Best Employers in Asia 2017.
Belief in “people being our biggest asset” has guided the Company to continuously strive to create people practices that are best in class. This has strengthening the Comapnies position as an employer of choice. Some of these initiatives are listed below:
1. In addition to the Employee Engagement survey, the Company has introduced an app-based quarterly survey for its employees. The survey helps the Company to receive and respond promptly to employee feedback and resolve points of dissatisfaction without delay.
2. The existing Performance Appraisal system assesses employee performance against mutually agreed performance parameters. The Company has introduced a Competency Framework that assesses an individual on personality attributes and skills that are key to the Organisation’s success and unique to its distinctiveness. In 2017-18 this will be integrated with the Executive Appraisal Process and will also
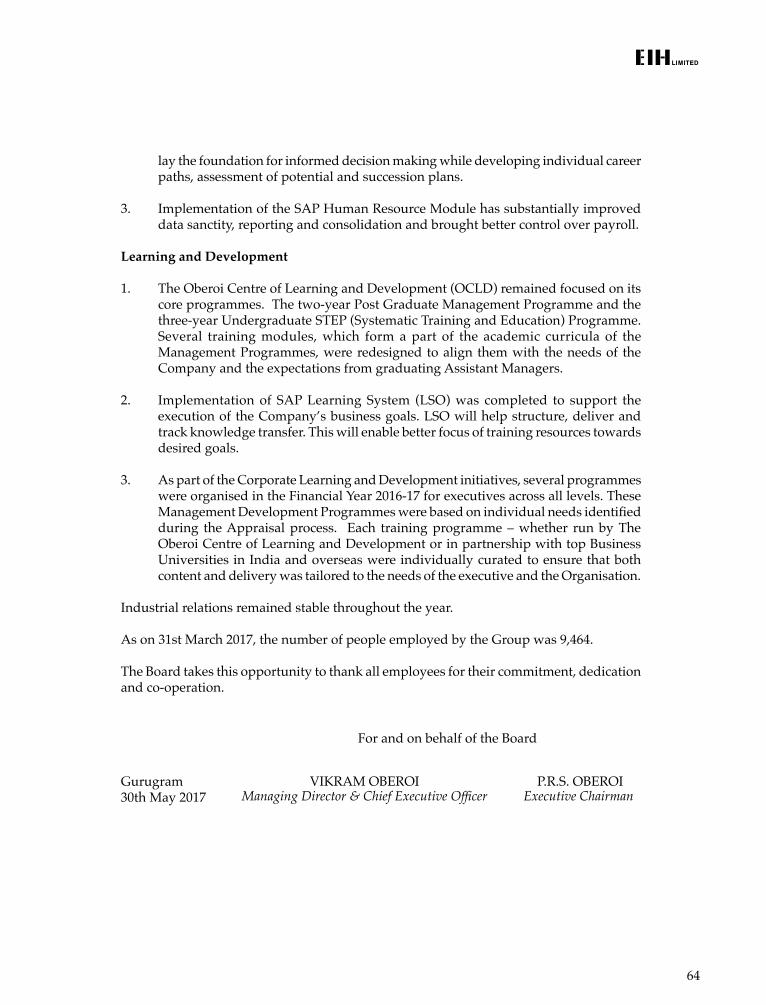
64
lay the foundation for informed decision making while developing individual career paths, assessment of potential and succession plans.
3. Implementation of the SAP Human Resource Module has substantially improved data sanctity, reporting and consolidation and brought better control over payroll.
Learning and Development
1. The Oberoi Centre of Learning and Development (OCLD) remained focused on its core programmes. The two-year Post Graduate Management Programme and the three-year Undergraduate STEP (Systematic Training and Education) Programme. Several training modules, which form a part of the academic curricula of the Management Programmes, were redesigned to align them with the needs of the Company and the expectations from graduating Assistant Managers.
2. Implementation of SAP Learning System (LSO) was completed to support the execution of the Company’s business goals. LSO will help structure, deliver and track knowledge transfer. This will enable better focus of training resources towards desired goals.
3. As part of the Corporate Learning and Development initiatives, several programmes were organised in the Financial Year 2016-17 for executives across all levels. These Management Development Programmes were based on individual needs identified during the Appraisal process. Each training programme – whether run by The Oberoi Centre of Learning and Development or in partnership with top Business Universities in India and overseas were individually curated to ensure that both content and delivery was tailored to the needs of the executive and the Organisation.
Industrial relations remained stable throughout the year.
As on 31st March 2017, the number of people employed by the Group was 9,464.
The Board takes this opportunity to thank all employees for their commitment, dedication and co-operation.
For and on behalf of the Board
Gurugram 30th May 2017
VIKRAM OBEROI Managing Director & Chief Executive Officer
P.R.S. OBEROI Executive Chairman
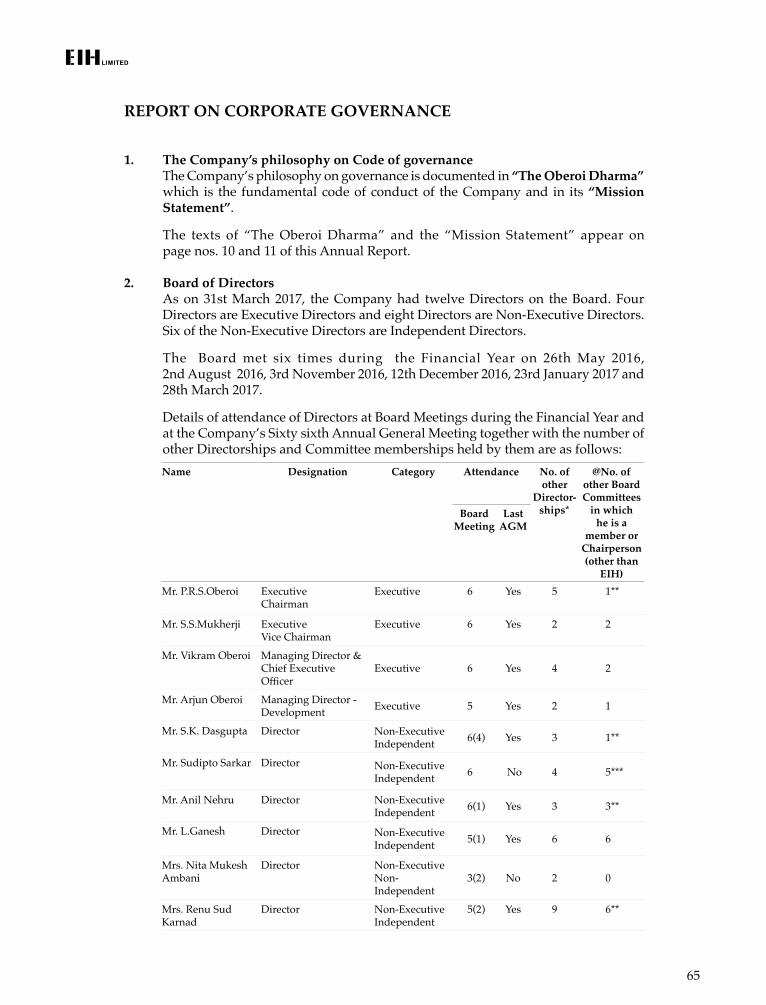
65
REPORT ON CORPORATE GOVERNANCE
1. The Company’s philosophy on Code of governance The Company’s philosophy on governance is documented in “The Oberoi Dharma”
which is the fundamental code of conduct of the Company and in its “Mission Statement”.
The texts of “The Oberoi Dharma” and the “Mission Statement” appear on page nos. 10 and 11 of this Annual Report.
2. Board of Directors As on 31st March 2017, the Company had twelve Directors on the Board. Four
Directors are Executive Directors and eight Directors are Non-Executive Directors. Six of the Non-Executive Directors are Independent Directors.
The Board met six times during the Financial Year on 26th May 2016, 2nd August 2016, 3rd November 2016, 12th December 2016, 23rd January 2017 and 28th March 2017.
Details of attendance of Directors at Board Meetings during the Financial Year and at the Company’s Sixty sixth Annual General Meeting together with the number of other Directorships and Committee memberships held by them are as follows:Name Designation Category Attendance No. of
other Director-
ships*
@No. of other Board Committees
in which he is a
member or Chairperson (other than
EIH)
Board Meeting
Last AGM
Mr. P.R.S.Oberoi Executive Chairman
Executive 6 Yes 5 1**
Mr. S.S.Mukherji Executive Vice Chairman
Executive 6 Yes 2 2
Mr. Vikram Oberoi Managing Director & Chief Executive Officer
Executive 6 Yes 4 2
Mr. Arjun Oberoi Managing Director - Development Executive 5 Yes 2 1
Mr. S.K. Dasgupta Director Non-Executive Independent 6(4) Yes 3 1**
Mr. Sudipto Sarkar Director Non-Executive Independent 6 No 4 5***
Mr. Anil Nehru Director Non-Executive Independent 6(1) Yes 3 3**
Mr. L.Ganesh Director Non-Executive Independent 5(1) Yes 6 6
Mrs. Nita Mukesh Ambani
Director Non-Executive Non-Independent
3(2) No 2 0
Mrs. Renu Sud Karnad
Director Non-Executive Independent
5(2) Yes 9 6**
66
Mr. Manoj Harjivandas Modi
Director Non-Executive Non-Independent
4(4) No 2 2
Mr. Rajeev Gupta Director Non-Executive Independent
4(1) No 7 5
* Excludes Directorship if any, in private companies /foreign companies and companies under Section 8 of the Companies Act, 2013
** Chairperson of one Committee *** Chairperson of two Committees ( ) The numbers in bracket represents meetings attended through video conference @ Only Audit Committee & Stakeholders Relationship Committee has been considered as per
Listing Regulations.
Note: Mr. P.R.S. Oberoi and Mr. Vikram Oberoi are related to each other being father and son. No other Directors are related to any other Director.
All Directors and members of Senior Management have, as on 31st March 2017, affirmed their compliance with:-
• The Oberoi Dharma, the fundamental code of conduct for The Oberoi Group; • The Company’s Code of Conduct for prevention of insider trading in its shares. • Disclosures relating to all material and financial transactions.
3. Audit Committee
Composition, Meetings and Attendance The Audit Committee comprises of six Board Members, namely, Mr. L. Ganesh,
Mr. S.K. Dasgupta, Mr. Anil Nehru, Mr. Rajeev Gupta, Mr. S.S. Mukherji and Mr. Arjun Oberoi. Mr. Anil Nehru is the Chairperson of the Audit Committee.
The members of the Audit Committee except Mr. Arjun Oberoi and Mr. S.S. Mukherji are Non-Executive Independent Directors. The quorum for an Audit Committee Meeting is two members.
Mr. Anil Nehru, Chairperson of the Audit Committee has studied Business Management from IIM, Ahmedabad, Harvard University and Columbia University. Mr. Rajeev Gupta is a Management Graduate from IIM, Ahmedabad and an Investment Banker, Mr. S.S. Mukherji is a Chartered Accountant, Mr. L. Ganesh is a Chartered Accountant and holds a Masters degree in Business Administration and Mr. S.K. Dasgupta is a Chartered Accountant and past President of the Institute of Chartered Accountants of India. Accordingly, Chairman and all members of the committee are financially literate within the meaning of explanation under regulation 18(1)(c) of SEBI (Listing Obligations and Disclosure Requirements) Regulations, 2015 (“Listing Regulations”).
The Audit Committee met five times during the Financial Year on 25th May 2016, 2nd August 2016, 3rd November 2016, 12th December 2016 and 23rd January 2017.
67
Attendance of the members of the Audit Committee during the Financial Year 2016-17 is given below:Name of the Member Number of Meetings attendedMr. Anil Kumar Nehru, Chairperson 5(1)Mr. S.K. Dasgupta 5(3)Mr. L. Ganesh 4(1)Mr. S.S. Mukherji* 4Mr. Arjun Singh Oberoi 4Mr. Rajeev Gupta# -
( ) The numbers in bracket represents meetings attended through video conference * Appointed as Member w.e.f 29th June 2016 # Appointed as Member w.e.f 23rd January 2017
Mr. Vikram Oberoi, Managing Director & Chief Executive Officer is an invitee to the Audit Committee Meetings. The Statutory Auditor and the Chief Internal Auditor also attend Audit Committee Meetings. The Company Secretary acts as the Secretary to the Committee.
Terms of Reference The Terms of reference of the Audit Ccommittee is in accordance with Regulation
18, part C of Schedule II to the listing regulations and Section 177 of the Companies Act, 2013.
4. Stakeholders Relationship Committee
Composition, Meetings & Attendance The Stakeholders Relationship Committee (“SRC”) comprises of five Board Members,
namely, Mr. S.K. Dasgupta, Mr. P.R.S. Oberoi, Mr. S.S. Mukherji, Mr. Vikram Oberoi and Mr. Arjun Oberoi. Mr. S.K. Dasgupta is the Chairperson of the SRC. Mr. S.N. Sridhar, Company Secretary, who is also the Compliance Officer of the Company, acts as Secretary to the Committee.
The quorum for a meeting of SRC is two members.
The SRC met nine times during the Financial Year on 19th April 2016, 25th May 2016, 8th July 2016, 1st August 2016, 26th September 2016, 26th October 2016, 16th November 2016, 23rd January 2017 and 20th February 2017.
Attendance of the members of the SRC during the Financial Year 2016-17 is given below:Name of the Member Number of Meetings attended
Mr. S.K. Dasgupta, Chairperson 9 (3)Mr. Prithviraj Singh Oberoi 2Mr. Shib Sanker Mukherji 7Mr. Vikramjit Singh Oberoi 6Mr. Arjun Singh Oberoi 5
( ) The numbers in bracket represents meetings attended through video conference
68
Terms of Reference The Terms of Reference of SRC are in accordance with Regulation 20 and part D of
Schedule II to the listing regulations and Section 178 of the Companies Act, 2013.The Committee monitors the Company’s response to investor complaints. It has also been authorised to approve the issue of duplicate share certificates in lieu of those lost or destroyed.
Pursuant to Regulation 40(2) of the listing regulations, the power to approve transfers, transmissions, etc. of shares in their physical form has been delegated to a Committee of Executives of the Company.
As on 31st March 2017, there were no pending demat and physical transfer requests.
18 complaints were received from investors during the Financial Year. These complaints mainly related to dividends and Annual Reports not received by Shareholders. All complaints were resolved. There were no complaints pending as at the end of the Financial Year.
5. Nomination and Remuneration Committee
Composition, Meetings & Attendance The Nomination and Remuneration Committee (“NRC”) comprises of five Board
Members, four Non-Executive Independent Directors, namely, Mr. Anil Nehru, Mr. L. Ganesh, Mr. S.K. Dasgupta, Mr. Rajeev Gupta and Mr. P.R.S. Oberoi, Executive Chairman.
Mr. Anil Nehru is the Chairperson of the NRC. The quorum for a meeting of the NRC is two members. The Company Secretary
acts as the Secretary to the Committee.
The NRC met three times during the Financial Year on 26th May 2016, 1st August 2016 and 27th March 2017.
Attendance of the members of the NRC during the Financial Year 2016-17 is given
below:
Name of the Member Number of Meetings attendedMr. Anil Kumar Nehru, Chairperson 3Mr. L Ganesh 3Mr. S.K. Dasgupta 3(2)Mr. Prithviraj Singh Oberoi 3Mr. Rajeev Gupta# 1(1)
( ) The numbers in bracket represents meetings attended through video conference # Appointed as Member w.e.f. 23rd January 2017
69
Terms of Reference The Terms of Reference of the NRC and its role are in accordance with regulation
19 and part D of Schedule II to the listing regulations and sub-section (2), (3) and (4) of Section 178 of the Companies Act, 2013.
The NRC has formulated the following policies in accordance with the aforesaid provisions:
i) Directors’ Appointment and Remuneration Policy;
ii) Senior Management Personnel (excluding Executive Directors’) Appointment and Remuneration Policy.
The aforesaid policies have been annexed with the Directors’ Report and are also available on the Company’s website www.eihltd.com
6. Corporate Social Responsibility Committee
Composition, Meetings and Attendance The Corporate Social Responsibility Committee (“CSR Committee”) comprises
of four Board Members, namely, Mr. Rajeev Gupta (Independent Director), Mr. S.S. Mukherji, Mr. Vikram Oberoi and Mr. Arjun Oberoi. Mr. S.S. Mukherji, Executive Vice Chairman is the Chairperson of the Committee.
The quorum for a meeting of the CSR Committee is two members. The Company Secretary acts as Secretary to the Committee.
The CSR Committee met two times during the Financial Year on 16th November 2016 and 27th March 2017.
Attendance of members of the CSR Committee during the Financial Year 2016-17 is given below:
Name of the member Number of Meetings attendedMr. S S Mukherji, Chairperson 2Mr. Vikramjit Singh Oberoi 2Mr. Arjun Singh Oberoi 2Mr. Rajeev Gupta 2 (2)
( ) The numbers in bracket represents meetings attended through video conference
Terms of Reference The Terms of Reference of the CSR Committee is to formulate the CSR Policy and
to take CSR initiatives in accordance with Section 135 read with Schedule VII of the Companies Act, 2013 and the Companies (Corporate Social Responsibility Policies) Rules, 2014.
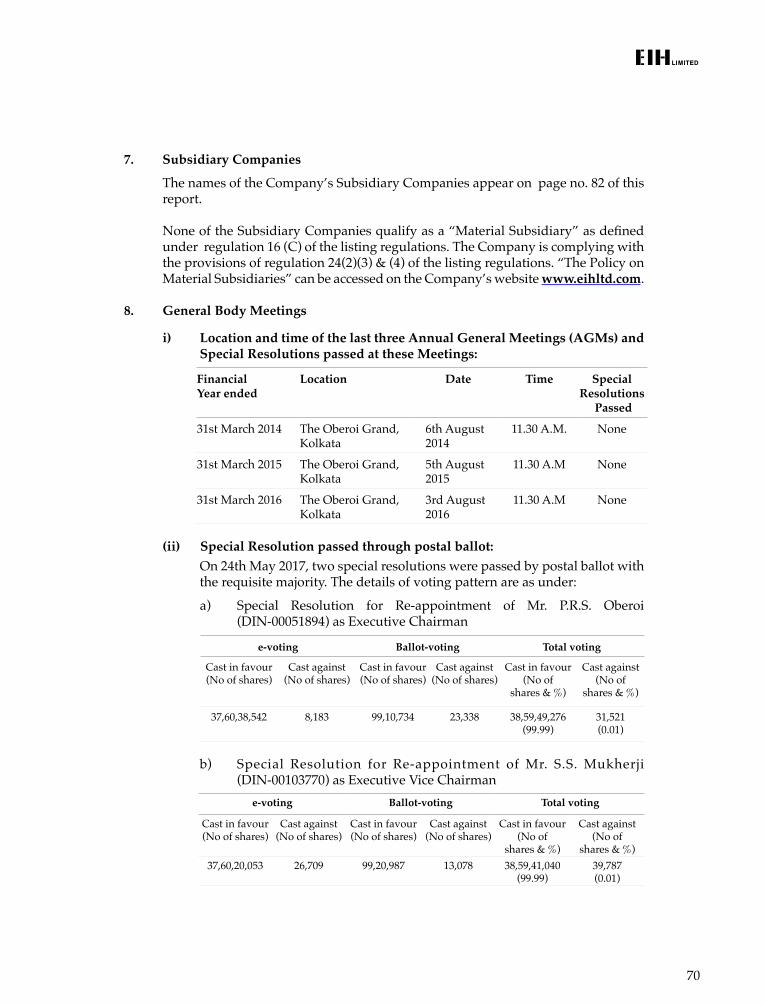
70
7. Subsidiary Companies
The names of the Company’s Subsidiary Companies appear on page no. 82 of this report.
None of the Subsidiary Companies qualify as a “Material Subsidiary” as defined under regulation 16 (C) of the listing regulations. The Company is complying with the provisions of regulation 24(2)(3) & (4) of the listing regulations. “The Policy on Material Subsidiaries” can be accessed on the Company’s website www.eihltd.com.
8. General Body Meetings
i) Location and time of the last three Annual General Meetings (AGMs) and Special Resolutions passed at these Meetings:
Financial Year ended
Location Date Time SpecialResolutions
Passed
31st March 2014 The Oberoi Grand, Kolkata
6th August 2014
11.30 A.M. None
31st March 2015 The Oberoi Grand, Kolkata
5th August 2015
11.30 A.M None
31st March 2016 The Oberoi Grand, Kolkata
3rd August 2016
11.30 A.M None
(ii) Special Resolution passed through postal ballot: On 24th May 2017, two special resolutions were passed by postal ballot with
the requisite majority. The details of voting pattern are as under:
a) Special Resolution for Re-appointment of Mr. P.R.S. Oberoi (DIN-00051894) as Executive Chairman
e-voting Ballot-voting Total voting
Cast in favour (No of shares)
Cast against (No of shares)
Cast in favour (No of shares)
Cast against (No of shares)
Cast in favour (No of
shares & %)
Cast against (No of
shares & %)
37,60,38,542 8,183 99,10,734 23,338 38,59,49,276(99.99)
31,521(0.01)
b) Special Resolution for Re-appointment of Mr. S.S. Mukherji (DIN-00103770) as Executive Vice Chairman
e-voting Ballot-voting Total voting
Cast in favour (No of shares)
Cast against (No of shares)
Cast in favour (No of shares)
Cast against (No of shares)
Cast in favour (No of
shares & %)
Cast against (No of
shares & %)37,60,20,053 26,709 99,20,987 13,078 38,59,41,040
(99.99)39,787(0.01)
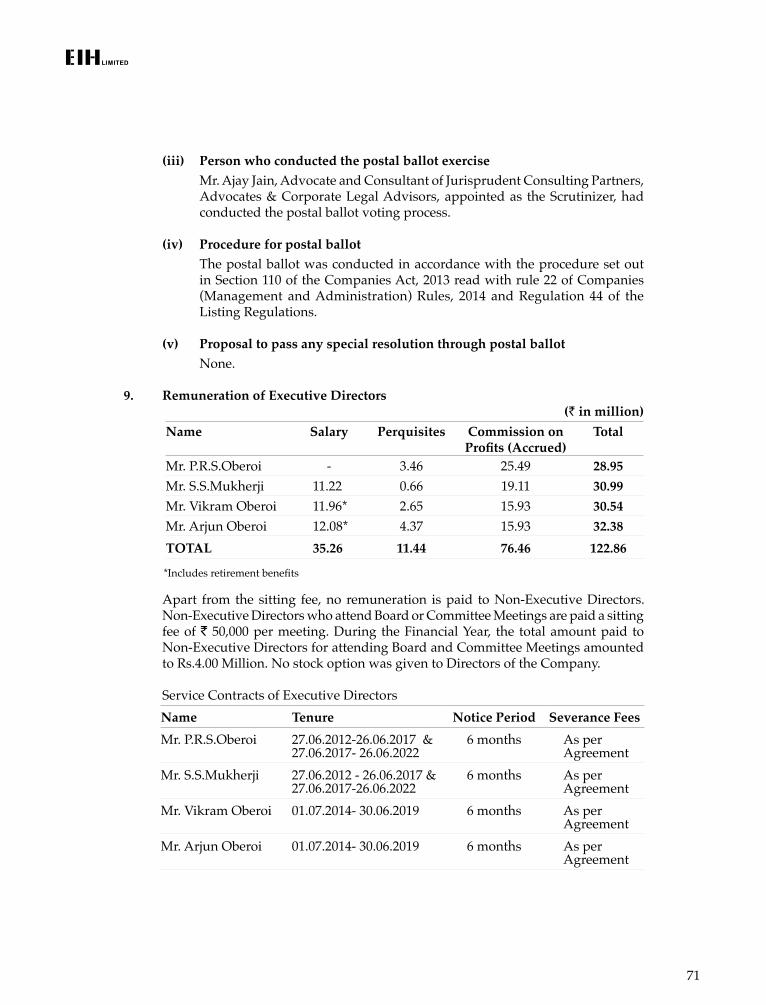
71
(iii) Person who conducted the postal ballot exercise Mr. Ajay Jain, Advocate and Consultant of Jurisprudent Consulting Partners,
Advocates & Corporate Legal Advisors, appointed as the Scrutinizer, had conducted the postal ballot voting process.
(iv) Procedure for postal ballot The postal ballot was conducted in accordance with the procedure set out
in Section 110 of the Companies Act, 2013 read with rule 22 of Companies (Management and Administration) Rules, 2014 and Regulation 44 of the Listing Regulations.
(v) Proposal to pass any special resolution through postal ballot None.
9. Remuneration of Executive Directors (` in million)
Name Salary Perquisites Commission on Profits (Accrued)
Total
Mr. P.R.S.Oberoi - 3.46 25.49 28.95Mr. S.S.Mukherji 11.22 0.66 19.11 30.99Mr. Vikram Oberoi 11.96* 2.65 15.93 30.54Mr. Arjun Oberoi 12.08* 4.37 15.93 32.38TOTAL 35.26 11.44 76.46 122.86
*Includes retirement benefits
Apart from the sitting fee, no remuneration is paid to Non-Executive Directors. Non-Executive Directors who attend Board or Committee Meetings are paid a sitting
fee of ` 50,000 per meeting. During the Financial Year, the total amount paid to Non-Executive Directors for attending Board and Committee Meetings amounted to Rs.4.00 Million. No stock option was given to Directors of the Company.
Service Contracts of Executive DirectorsName Tenure Notice Period Severance FeesMr. P.R.S.Oberoi 27.06.2012-26.06.2017 &
27.06.2017- 26.06.20226 months As per
AgreementMr. S.S.Mukherji 27.06.2012 - 26.06.2017 &
27.06.2017-26.06.20226 months As per
AgreementMr. Vikram Oberoi 01.07.2014- 30.06.2019 6 months As per
AgreementMr. Arjun Oberoi 01.07.2014- 30.06.2019 6 months As per
Agreement
72
10. General Disclosures (i) A summary of transactions with related parties, in the ordinary course of
business and at arm’s length is placed before the Audit Ccommittee; (ii) there were no material individual transactions with related parties that were
not in the ordinary course of business and at arm’s length during the Financial Year ended 31st March 2017;
(iii) there were no materially significant transactions during the Financial Year with related parties such as the Promoters, Directors, Key Managerial Personnel, Relatives or Subsidiaries that could have potential conflict of interest with the Company;
(iv) the mandatory disclosure of transactions with related parties, in compliance with the Indian Accounting Standard (IndAS-24), forms part of this annual report;
(v) none of the Non-Executive Directors hold any shares in the company except Mr. Sudipto Sarkar who holds 1,144 shares in the Company;
(vi) in preparing the Annual Accounts for the Financial Year ended 31st March 2017, no accounting treatment was different from that prescribed in the Indian Accounting Standards;
(vii) there were no instance of non-compliance on any matter relating to the capital markets during the past three years;
(viii) the Company has a Code of Conduct for Prevention of Insider Trading in the shares of the Company for Directors and other identified persons in accordance with the Securities and Exchange Board of India (Prohibition of Insider Trading) Regulations, 2015;
(ix) the Company has a Whistleblower Policy which can be accessed on the Company’s website www.eihltd.com. It is affirmed that no personnel has been denied access to the Chairman of the Audit Committee in terms of the policy. During the Financial Year, the company did not receive any complaint.
(x) the Company has a policy on Related Party Transactions. The policy can be accessed on the Company’s website www.eihltd.com.
(xi) the Company has a Policy on Distribution of Dividend to Shareholders. The Policy can be accessed on the Company’s website www.eihltd.com.
(xii) the Company has a policy on Determination and Disclosure of Material Events. The policy can be accessed on the Company’s website www.eihltd.com.
(xiii) the Company has a policy on Preservation and Archival of Documents. The policy can be accessed on the Company’s website www.eihltd.com.
(xiv) the familiarisation program for Independent Directors is provided as part of the Director’s Appointment and Remuneration policy. The policy and details of the familiarisation program is given on the Company’s website www.eihltd.com.
(xv) Independent Directors met on 28th March 2017 to review the performance of the Non-Independent Directors and the Board as a whole, performance of the Chairperson and quality, quantity and timeliness of information exchange between the Company Management and the Board.

73
(xvi) The Company has put in place a Board Evaluation process. A note on this is provided in the Directors’ Report.
(xvii) The Company has put in place adequate Internal Control Systems and Procedures including adequate financial controls with reference to the financial statement.
(xviii) The Company has put in place a Risk Management Committee comprising of Executive Directors and Senior Executives of the Company which identifies potential risks associated with the Company’s business and take steps to mitigate such risks. The Company is not required to constitute a Board Committee on Risk Management. The Risk Management Policy formulated by the Company is available on the Company’s website www.eihltd.com.
(xix) The Company is complying with the non-mandatory requirement of a separate post of Chairperson and Managing Director and Chief Executive Officer.
11. Means of Communication The Annual Report for each Financial Year is mailed to all Shareholders in the month
of July of each calendar year. Each report contains standalone and consolidated financial statement of the Company for the Financial Year along with the Directors’ and Auditor’s Reports and its annexures. Also included in each Annual Report is the notice convening the Annual General Meeting and the Corporate Governance Report.
The financial results or the extract of the financial results, as the case may be, of the company were officially released or will be released in accordance with the following schedule:
SL No
Nature of Communication
Media used for
Publication
Dates ofPublication
Forwarded/to be forwarded
to Stock Exchanges on
1 Quarterly unaudited financial statement (first quarter 2016-17)
Newspapers 04.08.2016 02.08.2016
2 Half-yearly unaudited financial statement (second quarter 2016-17)
Newspapers 04.11.2016 03.11.2016
3 Quarterly unaudited financial statement (third quarter 2016-17)
Newspapers 24.01.2017 23.01.2017
4 Annual audited financial statements 2016-2017
Newspapers On or before 02.06.2017
30.05.2017
The financial results are published in The Economic Times, The Times of India, The Financial Express, Business Standard, The Indian Express and Eai Samay (Bengali).
All corporate information filed by the Company with the stock exchanges are uploaded on www.connect2nse.com/LISTING/ (NSE) and www.listing.bseindia.com (BSE) and can be viewed on the website of stock exchanges i.e www.nseindia.com, www.bseindia.com and www.cse-india.com. The information is also available on the Company’s website www.eihltd.com.
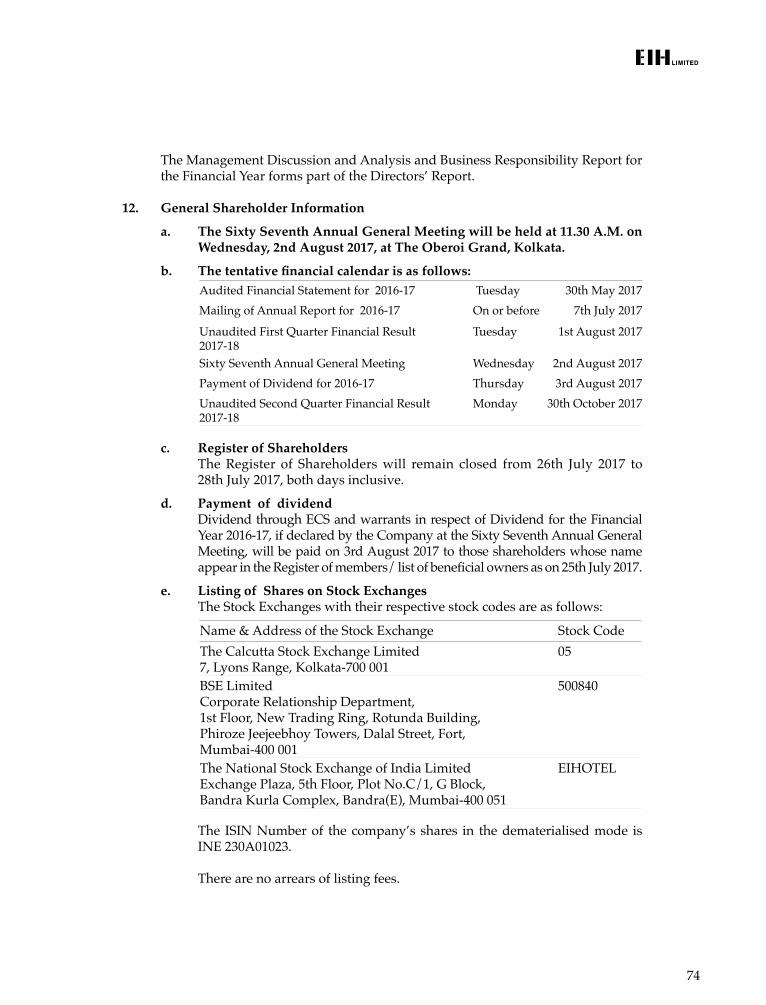
74
The Management Discussion and Analysis and Business Responsibility Report for the Financial Year forms part of the Directors’ Report.
12. General Shareholder Information
a. The Sixty Seventh Annual General Meeting will be held at 11.30 A.M. on Wednesday, 2nd August 2017, at The Oberoi Grand, Kolkata.
b. The tentative financial calendar is as follows: Audited Financial Statement for 2016-17 Tuesday 30th May 2017Mailing of Annual Report for 2016-17 On or before 7th July 2017
Unaudited First Quarter Financial Result 2017-18
Tuesday 1st August 2017
Sixty Seventh Annual General Meeting Wednesday 2nd August 2017Payment of Dividend for 2016-17 Thursday 3rd August 2017Unaudited Second Quarter Financial Result 2017-18
Monday 30th October 2017
c. Register of Shareholders The Register of Shareholders will remain closed from 26th July 2017 to
28th July 2017, both days inclusive.
d. Payment of dividend Dividend through ECS and warrants in respect of Dividend for the Financial
Year 2016-17, if declared by the Company at the Sixty Seventh Annual General Meeting, will be paid on 3rd August 2017 to those shareholders whose name appear in the Register of members/ list of beneficial owners as on 25th July 2017.
e. Listing of Shares on Stock Exchanges The Stock Exchanges with their respective stock codes are as follows:
Name & Address of the Stock Exchange Stock CodeThe Calcutta Stock Exchange Limited7, Lyons Range, Kolkata-700 001
05
BSE LimitedCorporate Relationship Department,1st Floor, New Trading Ring, Rotunda Building, Phiroze Jeejeebhoy Towers, Dalal Street, Fort, Mumbai-400 001
500840
The National Stock Exchange of India LimitedExchange Plaza, 5th Floor, Plot No.C/1, G Block, Bandra Kurla Complex, Bandra(E), Mumbai-400 051
EIHOTEL
The ISIN Number of the company’s shares in the dematerialised mode is INE 230A01023.
There are no arrears of listing fees.
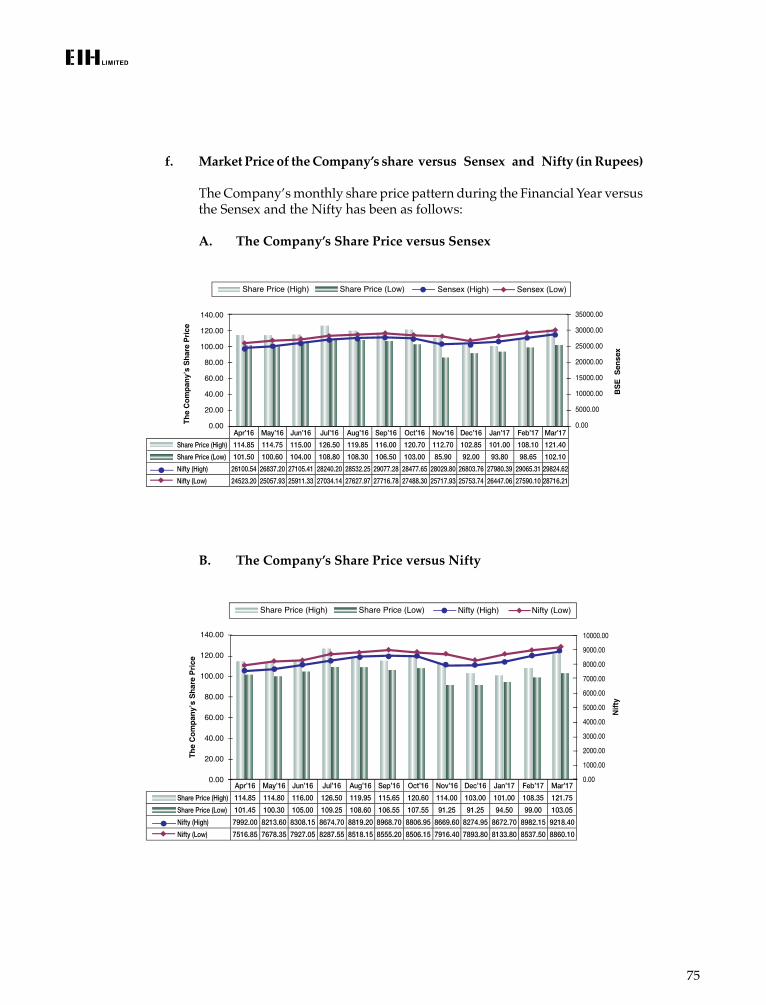
75
f. Market Price of the Company’s share versus Sensex and Nifty (in Rupees)
The Company’s monthly share price pattern during the Financial Year versus the Sensex and the Nifty has been as follows:
A. The Company’s Share Price versus Sensex
B. The Company’s Share Price versus Nifty
76
g. The Company has a demat account namely “EIH Ltd-Unclaimed Suspense A/c” with ICICI Bank Limited. The Shares remaining unclaimed as on 31st March 2017 in the said Suspense Account are as under:
Particulars No.of Shareholders
No. of Shares %of Shares capital
Aggregate number of Shareholders and outstanding shares as on 1st April, 2016
3,034 1,405,971 0.25
Number of Shareholders who had approached the Company and whose shares were transferred from the suspense account during the year
23 10,786 0.01
Aggregate number of Shareholders and outstanding shares lying as on 31st March 2017
3,011 1,395,185 0.24
h. In accordance with Section 20,101 and 136 of the Companies Act, 2013 and rules made there under, the Annual Report, Notices of the Annual General Meeting, Postal Ballot notice, circulars etc, are being sent by electronic means to those Shareholders whose e-mail addresses are made available to the Company by the Shareholders and the depository. Documents e-mailed to Shareholders are also available on the Company’s website www.eihltd.com to enable Shareholders to read and download a copy, if required. Physical copies of the documents are sent to those Shareholders who have made a specific request in writing for the same. For the Financial Year 2016-17, the Company will follow the same procedure.
13. Global Depository Receipts (GDR’s) During the Financial Year 2016-17, the Company has terminated its Depository
Agreement with the Depository, Bank of New York Mellon (BONY) and got its GDR’s delisted from the London Stock Exchange. All the GDR holders were given notice to either get their GDR’s converted into underlying shares in the Company or they would be paid sale proceeds of the underlying shares by the Depository. The Depository has taken appropriate action as required. At the close of the Financial Year there are no outstanding GDR’s.
14. Share Transfers The Company is a SEBI recognised Category-II Share Transfer Agent. Requests for
dematerialisation and re-materialisation should be sent to the Company’s Investors Services Division, (“ISD”), 7, Shamnath Marg, Delhi-110 054.
The Company’s Shares are traded on the Stock Exchanges in the compulsory dematerialised form. Shareholders are requested to ensure that their Depository Participants (“DPs”) promptly send physical documents, i.e. Dematerialization Request Form (“DRF”), Share Certificates, etc. to the ISD by providing the Dematerialization Request Number (“DRN”). Documents for transfer in the physical form, i.e., the Transfer Deeds, Share Certificates, etc., should similarly be sent to the ISD.
77
As on 31st March 2017, 562.25 million Shares of the Company (representing 98.37% of the total Shares issued) were held in the dematerialised form and 9.32 million Shares (representing 1.63% of the total shares) were held in the physical form. As on 31st March 2017, the total number of Shareholders were 67,078 out of which 52,336 (78.02%) were holding shares in a dematerialised form. The balance 14,742 (21.98%) Shareholders continued to hold shares in the physical form.
15. Distribution of Shareholding as on 31st March 2017Shareholding Range
No. of Shareholders
% of Shareholders
No. of shares % of Shareholding
Upto – 1000 53,758 80.14 13,263,195 2.32
1001 – 5000 11,597 17.29 23,779,380 4.16
5001 – 10000 1,088 1.62 7,520,548 1.32
10001 – 50000 505 0.75 9,543,810 1.67
50001 – 100000 45 0.07 3,082,668 0.54
100001 and above 85 0.13 514,379,813 89.99
Total 67,078 100.00 571,569,414 100.00 16. Pattern of Shareholding as on 31st March 2017
Category of Shareholders No of Shareholders
Total No. of Shares
Percentage
PROMOTER AND PROMOTER GROUP
INDIAN
Individual/HUF 5 29,989,233 5.25
Central Government/State Government(s) - - -
Bodies Corporate 9 171,469,006 30.00
Financial Institutions / Banks - - -
Others - - -
Sub-Total A(1) : 14 201,458,239 35.25
FOREIGN
Individuals (NRIs/Foreign Individuals) - - -
Bodies Corporate - - -
Institutions - - -
Qualified Foreign Investor - - -
Others (specify) - - -
Sub-Total A(2) : - - -
Total Shareholding of Promoter and Promoter Group (A)= (A)(1)+(A)(2) :
14 201,458,239 35.25
78
Category of Shareholders No of Shareholders
Total No. of Shares
Percentage
PUBLIC SHAREHOLDING
INSTITUTIONS
Mutual Funds /UTI 14 28,418,349 4.97
Financial Institutions /Banks 37 704,516 0.12
Central Government/State Government(s) - - -
Venture Capital Funds - - -
Insurance Companies 6 53,629,876 9.38
Foreign Institutional Investors 73 20,173,434 3.53
Foreign Venture Capital Investors - - -
Qualified Foreign Investor - - -
Others (specify) - - -
Sub-Total B(1) : 130 102,926,175 18.00
NON-INSTITUTIONS
Bodies Corporate 1,006 207,223,051 36.26
Individuals
(i) Individual shareholders holding nominal share capital upto ` 2 lakh
64,889 50,874,924 8.90
(ii) Individual shareholders holding nominal share capital in excess of ` 2 lakh
19 7,604,632 1.33
Qualified Foreign Investor - - -
Others
NON RESIDENT INDIANS 852 1,168,443 0.20
TRUSTS 7 12,524 0.00
FOREIGN NATIONALS 6 38,953 0.01
DIRECTORS RELATIVES 3 2,438 0.00
CLEARING MEMBERS 152 260,035 0.05
Sub-Total B(2) : 66,934 267,185,000 46.75
Total Public Shareholding B = B(1)+B(2) : 67,064 370,111,175 64.75
Total (A+B) : 67,078 571,569,414 100.00
Shares held by custodians, against which Depository Receipts have been issued
Promoter and Promoter Group - - -
Public - - -
GRAND TOTAL (A+B+C) : 67,078 571,569,414 100.00
79
17. Unclaimed Dividends All Unclaimed Dividends upto and including the Financial Year ended on
31st March 2009, have been transferred to the Investor Education and Protection Fund (“IEPF”) as mandated under law.
In accordance with Rule 5(8) of the Investor Education and Protection Fund Authority (Accounting, Audit, Transfer and Refund) Rules, 2016, (IEPF Rules), the Company has uploaded a Statement of Unclaimed Dividend amounts as on the date of the last Annual General Meeting in Form IEPF-2 on the website of Ministry of Corporate Affairs, www.mca.gov.in. This statement and details of Unclaimed Dividends have also been uploaded on the Company’s website, www.eihltd.com. The year wise Unclaimed Dividend position as on 31st March 2017 are 2010 - ` 4.18 Million, 2011 - ` 3.46 Million, 2012 - ` 4.41 Million, 2013 - ` 3.81 Million, 2014 - ` 3.41 Million, 2015 - ` 3.47 Million and 2016 - ` 3.09 Million.
Shareholders who have not encashed their Dividend Warrants relating to the subsequent Financial Years are reminded by the Investors Services Division (ISD) of the Company, from time to time, to claim their Dividends before transfer to the IEPF. Shareholders who have not encashed their Dividend Warrants relating to the Financial Year ended on 31st March 2010 and subsequent years are requested to contact the ISD.
18. Transfer of Shares held by Shareholders if their dividend remained unclaimed for seven consecutive years to Investor Education and Protection Fund Authority (IEPF)
In accordance with the provisions of Section 124(6) of the Act read with the Investor Education and Protection Fund Authority (Accounting, Audit, Transfer and Refund) Rules, 2016 (IEPF Rules)(as amended), the Company is required to statutorily transfer the shares held by the Shareholders whose Dividend has remained unclaimed for a consecutive period of seven years or more to IEPF. Company had sent Notices by Registered Post to all the Shareholders who have not claimed their Dividend for the past seven years or more to claim their Dividend. Notices were also published in the Newspapers on 18th November 2016 and 11th April 2017 respectively requesting Shareholders to claim their Dividend failing which their Shares will be transferred to IEPF. As per IEPF Rules, the Company is required to transfer the Shares relating to the Shareholders who have not claimed their Dividend to the IEPF on or before 30th June 2017. The list of Shareholders who have not claimed their Dividend for seven years or more is available on the Company’s website www.eihltd.com.
19. Location of Hotels A list of hotels and other business units owned as well as managed by the Company
appears as an Annexure to this Report.
80
20. Address for Correspondence The Company’s Registered Office is located at 4, Mangoe Lane, Kolkata-700 001.
Correspondence from Shareholders on all matters should be addressed to:
The Investors Services Division (ISD) EIH Limited 7, Shamnath Marg, Delhi-110 054
Telephone No. : 91-11-2389 0505 Fax Nos. : 91-11-2389 0605 e-mail : [email protected] e-mail for [email protected] Investors Grievances
21. Information as per Regulation 36(3) of the Listing Regulations Information pursuant to regulation 36(3) of the Listing Regulations pertaining to
particulars of Directors to be reappointed at the forthcoming Annual General Meeting is enclosed as an annexure to the notice convening the Annual General Meeting.
22. Compliance Certificate of the Auditors The Company has obtained a certificate from the Statutory Auditors regarding
compliance of conditions of Corporate Governance as stipulated in regulation 34(3) and schedule V (E) of the listing regulations. The certificate is annexed.
For and on behalf of the Board
Gurugram VIKRAM OBEROI 30th May 2017 Managing Director & Chief Executive Officer
81
Declaration by the Managing Director & Chief Executive Officer under Clause Regulation 34(3) and Schedule V (D) of Listing Regulation regarding adherence to the Code of conduct.
In accordance with regulation 34(3) and schedule V(D) of the listing regulations, I hereby confirm that all Directors and Senior Management Personnel of the Company have affirmed compliance with The Oberoi Dharma, the Code of Conduct, as applicable to them, for the Financial Year ended 31st March 2017.
Gurugram VIKRAM OBEROI30th May 2017 Managing Director & Chief Executive Officer
82
List of Subsidiary Companies
A. Companies Incorporated in India
(1) Mumtaz Hotels Limited
(2) Mashobra Resort Limited
(3) Oberoi Kerala Hotels and Resorts Limited
B. Companies Not Incorporated in India
(1) EIH Flight Services Ltd
(2) EIH International Ltd
(3) EIH Holdings Ltd
(4) J&W Hong Kong Ltd
(5) EIH Investments NV
(6) EIH Management Services BV
(7) PT Widja Putra Karya
(8) PT Waka Oberoi Indonesia
(9) PT Astina Graha Ubud
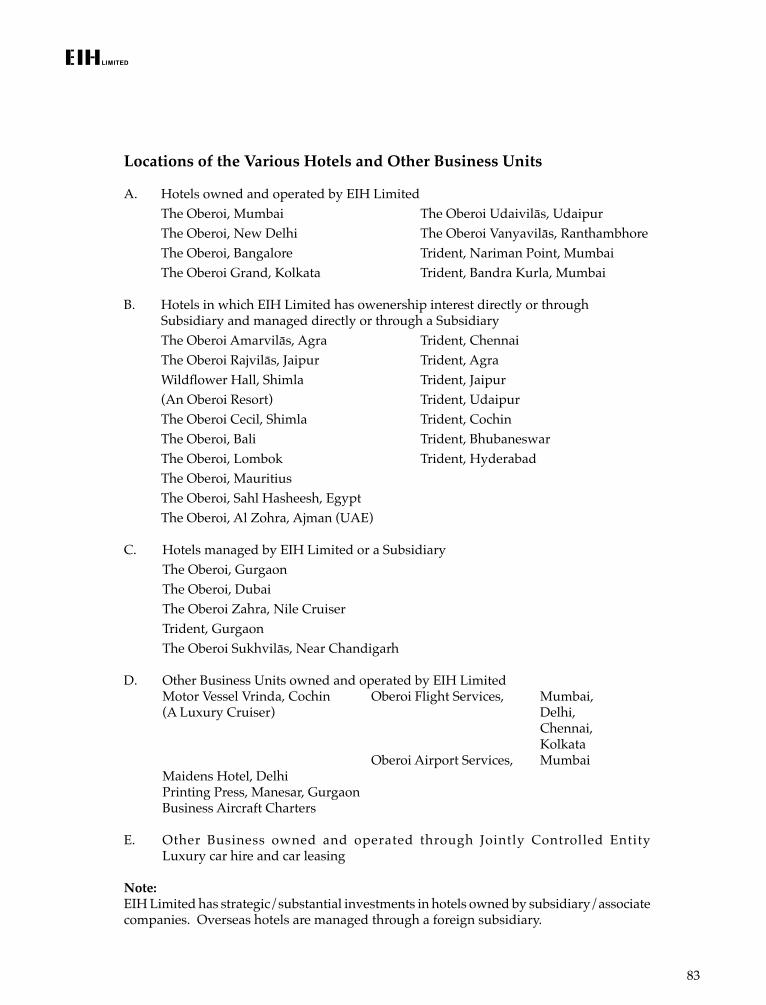
83
Locations of the Various Hotels and Other Business Units
A. Hotels owned and operated by EIH Limited The Oberoi, Mumbai The Oberoi Udaivilās, Udaipur The Oberoi, New Delhi The Oberoi Vanyavilās, Ranthambhore The Oberoi, Bangalore Trident, Nariman Point, Mumbai The Oberoi Grand, Kolkata Trident, Bandra Kurla, Mumbai B. Hotels in which EIH Limited has owenership interest directly or through
Subsidiary and managed directly or through a Subsidiary The Oberoi Amarvilās, Agra Trident, Chennai The Oberoi Rajvilās, Jaipur Trident, Agra Wildflower Hall, Shimla Trident, Jaipur (An Oberoi Resort) Trident, Udaipur The Oberoi Cecil, Shimla Trident, Cochin The Oberoi, Bali Trident, Bhubaneswar The Oberoi, Lombok Trident, Hyderabad The Oberoi, Mauritius The Oberoi, Sahl Hasheesh, Egypt The Oberoi, Al Zohra, Ajman (UAE)
C. Hotels managed by EIH Limited or a Subsidiary The Oberoi, Gurgaon The Oberoi, Dubai The Oberoi Zahra, Nile Cruiser Trident, Gurgaon The Oberoi Sukhvilās, Near Chandigarh
D. Other Business Units owned and operated by EIH Limited Motor Vessel Vrinda, Cochin Oberoi Flight Services, Mumbai, (A Luxury Cruiser) Delhi, Chennai, Kolkata Oberoi Airport Services, Mumbai Maidens Hotel, Delhi Printing Press, Manesar, Gurgaon Business Aircraft Charters
E. Other Business owned and operated through Jointly Controlled Entity Luxury car hire and car leasing
Note:EIH Limited has strategic/substantial investments in hotels owned by subsidiary/associate companies. Overseas hotels are managed through a foreign subsidiary.
84
AUDITOR’S CERTIFICATE ON CORPORATE GOVERNANCE
ToThe Members of EIH Limited
We have examined the compliance of conditions of Corporate Governance by EIH Limited (“the company”) for the year ended 31 March 2017, as per Regulations 17 to 27, clauses (b) to (i) of Regulation 46 (2) and paragraphs C,D and E of Schedule V of the Securities and Exchange Board of India (Listing Obligations and Disclosure Requirements) Regulations, 2015 (‘Listing Regulations’).
The compliance of conditions of Corporate Governance is the responsibility of the Management. Our examination was limited to a review of the procedures and implementation thereof, adopted by the Company for ensuring the compliance of the conditions of Corporate Governance. It is neither an audit nor an expression of opinion on the financial statements of the Company.
We conducted our examination in accordance with the Guidance Note on Reports or Certificates for Special Purposes (Revised 2016) issued by Institute of Chartered Accountants of India. The Guidance Note requires that we comply with the ethical requirements of the Code of Ethics issued by the Institute of Chartered Accountants of India. We have complied with the relevant applicable requirements of the Standard on Quality Control (SQC) 1, Quality Control for Firms that Perform Audits and Reviews of Historical Financial Information, and Other Assurance and Related Services Engagements.
In our opinion and to the best of our information and according to the explanations given to us, we certify that the Company has complied with the conditions of Corporate Governance as specified in Regulations 17 to 27, clauses (b) to (i) of sub-regulation (2) of Regulation 46 and paragraphs C,D and E of Schedule V of the Listing Regulations, as applicable.
We state that such compliance is neither an assurance as to the future viability of the Company nor as to the efficiency or effectiveness with which the Management has conducted the affairs of the Company.
Restrictions on useThis certificate is issued solely for the purpose of complying with the aforesaid Regulations and may not be suitable for any other purpose.
For RAY & RAYChartered Accountants
Firm’s Registration no. 301072E
R.N. ROYPlace: Gurugram PartnerDate: 30th May 2017 Membership no. 8608
85
SECRETARIAL AUDIT REPORT(for the financial year ended March 31, 2017)
[Pursuant to Section 204(1) of the Companies Act, 2013 and Rule 9 of the Companies (Appointment and Remuneration of Managerial Personnel) Rules, 2014]
ToThe MembersEIH Limited4, Mangoe LaneKolkata-700001
We have conducted the Secretarial Audit of the compliance of applicable statutory provisions and the adherence to good corporate practices by “EIH Limited” (hereinafter called the “Company”). Secretarial Audit was conducted in a manner that provided us a reasonable basis for evaluating the corporate conduct/statutory compliances and expressing our opinion thereon.
Based on our verification of the Company’s books, papers, minute books, forms and returns filed and other records maintained by the Company and also the information provided by the Company, its officers, agents and authorized representatives, during the conduct of Secretarial Audit, we hereby report that in our opinion, the Company has, during the audit period covering the financial year ended March 31, 2017, complied with the statutory provisions listed hereunder and also that the Company has proper Board processes and compliance mechanism in place, to the extent, in the manner and subject to the reporting made hereinafter.
We have examined the books, papers, minute books, forms and returns filed and other records maintained by the Company for the financial year ended March 31, 2017, according to the provisions of:
i) The Companies Act, 2013 (the Act) and the Rules made there under read with notifications, exemptions and clarifications thereto;
ii) The Securities Contracts (Regulation) Act, 1956 (SCRA) and the Rules made there under;
iii) The Depositories Act, 1996 and the Regulations and Bye-laws framed there under.
iv) Foreign Exchange Management Act, 1999 (FEMA) and the Rules and Regulations made there under, to the extent applicable to Foreign Direct Investment, Overseas Direct Investment and External Commercial Borrowings;
v) The following Regulations and Guidelines prescribed under the Securities and Exchange Board of India Act, 1992 (SEBI Act):
(a) The SEBI (Substantial Acquisition of Shares and Takeovers) Regulations, 2011, as amended from time to time.
(b) The Securities and Exchange Board of India (Prohibition of Insider Trading)
86
Regulations, 2015, as amended from time to time.
(c) The Securities and Exchange Board of India (Issue of Capital and Disclosure Requirements) Regulations, 2009, as amended from time to time. However, the regulations are not applicable to the Company during the audit period since the Company has not raised any money from the public.
(d) The Securities and Exchange Board of India (Share Based Employee Benefits) Regulations, 2014. However, the regulations are not applicable to the Company during the audit period since the Company does not have any such scheme in operation.
(e) The Securities and Exchange Board of India (Issue and Listing of Debt Securities) Regulations, 2008, as amended from time to time. However, the regulations are not applicable to the Company during the audit period since the Company has not raised any money through debt securities from the public.
(f) The Securities and Exchange Board of India (Registrars to an Issue and Share Transfer Agents) Regulations, 1993, as amended from time to time, since the Company has obtained registration with SEBI under these regulations.
(g) The Securities and Exchange Board of India (Delisting of Equity Shares) Regulations, 2009, as amended from time to time. However, the regulations are not applicable to the Company during the audit period since the Company has not got its securities delisted from stock exchanges in India.
(h) The Securities and Exchange Board of India (Buyback of Securities) Regulations, 1998, as amended from time to time However, the regulations are not applicable to the Company during the audit period since the Company has not bought back any of its securities.
vi) Other significant policies and regulations specifically applicable to the Company, including:
a) Tourism Policy of Government of India and Classification of Hotels.
b) Food Safety and Standards Act, 2006 and Rules made there under.
c) The Air (Prevention and Control of Pollution) Act, 1981 and Rules made there under.
d) The Water (Prevention and Control of Pollution) Act, 1974 and Rules made there under.
e) Hazardous Material (Management, Handling and Trans-boundary Movement) Rules, 2008.
f) Phonographic and Performance License.
g) Indian Explosives Act, 1884 and Rules made there under.
87
h) The Static and Mobile Pressure Vessels (Unfired) Rules,1981
i) The Apprentices Act, 1961 and Rules made there under.
We have also examined compliance with the applicable clauses of the following:
(i) Secretarial Standards issued by the Institute of Company Secretaries of India.
(ii) The Listing Agreements entered into by the Company with The National Stock Exchange of India, BSE Limited, Calcutta Stock Exchange Limited and London Stock Exchange, U.K.
(iii) The SEBI (Listing Obligations and Disclosure Requirements) Regulations, 2015
During the period under review, the Company has generally complied with the provisions of the Act, Rules, Regulations, Guidelines, etc. mentioned above.
We further report that:
1. The Board of Directors of the Company is duly constituted with proper balance of Executive Directors, Non-Executive Directors, Independent Directors and Woman Director in terms of Companies Act, 2013 and Regulation 17 of The Securities and Exchange Board of India (Listing Obligations and Disclosure Requirements) Regulations, 2015.
2. Adequate notice has been given to all directors to schedule the Board Meetings during the financial year under review; agenda and detailed notes on agenda were sent properly before the scheduled meeting; and a system exists for seeking and obtaining further information and clarifications on the agenda items before the meeting and for meaningful participation at the meeting.
3. All the decisions were carried out unanimously. None of the members of the Board have expressed dissenting views on any of the agenda items during the financial year under review.
4. The Company got its Global Depository Receipts de-listed from The London Stock Exchange with effect from February 28, 2017 after complying with requisite formalities.
5. The Board approved temporary closure of The Oberoi Hotel at New Delhi for the purpose of renovation. The Hotel will remain closed from April 1, 2016 and is expected to reopen on April 1, 2018.
We further report that there are adequate systems and processes in the Company commensurate with the size and operations of the company, to monitor and ensure compliance with applicable laws, rules, regulations and guidelines.
For the purpose of examining adequacy of compliances with other applicable laws including industry/sector specific laws, under both Central and State legislations, reliance has been
88
placed on the Compliance Certificate issued by the Company Secretary at each Board meeting, based on the report received by the Company from its hotels, resorts and service units etc. as part of the Company’s Compliance Management and Reporting System. Based on the aforesaid internal compliance certificates, we are of the opinion that the Company has generally complied with the following:
i) Deposit of Provident Fund, Employee State Insurance, Employee Deposit Linked Insurance and other employee related statutory dues.
ii) Applicable stipulations pertaining to the Payment of Wages Act, Minimum Wages Act, Contract Labour (Regulation and Abolition) Act and other related legislations.
iii) Deposit of taxes relating to Income Tax, Value Added Tax, Central Sales Tax, Luxury Tax, Expenditure Tax, Professional Tax and other applicable taxes including Tax deducted at source. However, cases of disputed tax liabilities of substantial amount are brought up at each Board meeting and appropriate action is taken and recorded in the minutes of meetings. Such cases form part of the contingent liabilities in the Notes to Accounts forming an integral part of the financial statement for the year under review and brief of the same has also been disclosed in the Independent Auditors’ Report.
iv) Applicable state and central laws pertaining to the operations of the Company, including those relating to Environment, Apprentices, Food Safety & Standards and Performance License. However, notices received from the statutory authorities, if any, are reported as part of Board process for compliance reporting and appropriate action is taken from time to time.
Place: New DelhiDate: 30th May 2017
For JUS & AssociatesCompany Secretaries
Jyoti Upmanyu
FCS- 7985 CP No.- 8987
89
INDEPENDENT AUDITOR’S REPORT
To The Members EIH Limited
Report on the Standalone Ind AS Financial StatementsWe have audited the accompanying standalone Ind AS financial statements of EIH Limited (“the Company”), which comprise the Balance Sheet as at 31st March, 2017, the Statement of Profit and Loss (including Other Comprehensive Income), the Statement of Cash Flows and the Statement of Changes in Equity for the year then ended, and a summary of the significant accounting policies and other explanatory information (herein after referred to as “standalone Ind AS financial statements”).
Management’s Responsibility for the Standalone Ind AS Financial StatementsThe Company’s Board of Directors is responsible for the matters stated in Section 134(5) of the Companies Act, 2013 (“the Act”) with respect to the preparation of these standalone Ind AS financial statements that give a true and fair view of the financial position, financial performance including other comprehensive income, cash flows and changes in equity of the Company in accordance with the accounting principles generally accepted in India, including the Indian Accounting Standards (Ind AS) specified under section 133 of the Act, read with Rule 7 of the Companies (Accounts) Rules, 2014. This responsibility also includes maintenance of adequate accounting records in accordance with the provisions of the Act for safeguarding the assets of the Company and for preventing and detecting frauds and other irregularities; selection and application of appropriate accounting policies; making judgments and estimates that are reasonable and prudent; and design, implementation and maintenance of adequate internal financial controls, that were operating effectively for ensuring the accuracy and completeness of the accounting records, relevant to the preparation and presentation of the standalone Ind AS financial statements that give a true and fair view and are free from material misstatement, whether due to fraud or error.
Auditor’s ResponsibilityOur responsibility is to express an opinion on these standalone Ind AS financial statements based on our audit. We have taken into account the provisions of the Act, the accounting and auditing standards and matters which are required to be included in the audit report under the provisions of the Act and the Rules made thereunder.
We conducted our audit of the standalone Ind AS financial statements in accordance with the Standards on Auditing specified under Section 143(10) of the Act. Those Standards require that we comply with ethical requirements and plan and perform the audit to obtain reasonable assurance about whether the standalone Ind AS financial statements are free from material misstatement.
An audit involves performing procedures to obtain audit evidence about the amounts and the disclosures in the standalone Ind AS financial statements. The procedures selected depend on the auditor’s judgment, including the assessment of the risks of material misstatement of the standalone Ind AS financial statements, whether due to fraud or error.
90
In making those risk assessments, the auditor considers internal financial control relevant to the Company’s preparation of the standalone Ind AS financial statements that give a true and fair view in order to design audit procedures that are appropriate in the circumstances. An audit also includes evaluating the appropriateness of the accounting policies used and the reasonableness of the accounting estimates made by the Company’s Directors, as well as evaluating the overall presentation of the standalone Ind AS financial statements.
We believe that the audit evidence we have obtained is sufficient and appropriate to provide a basis for our audit opinion on the standalone Ind AS financial statements.
OpinionIn our opinion and to the best of our information and according to the explanations given to us, the aforesaid standalone Ind AS financial statements give the information required by the Act in the manner so required and give a true and fair view in conformity with the accounting principles generally accepted in India including the Ind AS, of the financial position of the Company as at 31st March, 2017, and its financial performance including other comprehensive income, its cash flows and the changes in equity for the year ended on that date.
Emphasis of MatterWe draw attention to the following matters in the Notes to the standalone Ind AS financial statements:
a) Note No 6 and Note No 45 to the standalone Ind AS financial statements wherein the Company has stated that adjustments for impairment is not considered necessary in respect of investments of Rs. 1184.88 Million in EIH Flight Services Limited Mauritius in view of the business valuation made by the independent valuer even though the net worth of EIH Flight Services Limited Mauritius continues to be negative.
b) Note No 3(ii) to the standalone Ind AS financial statements regarding disclosure of advance towards equity shares in Mashobra Resort Limited and allotment of shares pending settlement of legal issues between Government of Himachal Pradesh and EIH Limited. The said note describes the uncertainty related to the outcome of the above legal matters and accordingly the impact, if any, on the standalone Ind AS financial statements has not been ascertained. As such the uncertainty of the allotment of shares still continues.
Our opinion is not modified in respect of these matters.
Other MatterThe comparative financial information of the Company for the year ended March 31, 2016 and the transition date opening balance sheet as at April 1, 2015 included in these standalone Ind AS financial statements, are based on the previously issued statutory financial statements prepared in accordance with the Companies (Accounting Standards) Rules, 2006, audited by us and on which we expressed an unmodified opinions in our reports for the year ended March 31, 2016 and March 31, 2015 dated May 26, 2016 and
91
May 30, 2015 respectively, as adjusted for the differences in accounting principles adopted by the Company on transition to the Ind AS which have been audited by us.
Our opinion is not qualified in respect of this matter.
Report on Other Legal and Regulatory Requirements1. As required by the Companies (Auditor’s Report) Order, 2016 (“the Order”) issued
by the Central Government of India in terms of Section 143(11) of the Act, we give in “Annexure A”, a statement on the matters specified in paragraphs 3 and 4 of the Order.
2. As required by Section 143(3) of the Act, we report that:
a) We have sought and obtained all the information and explanations which to the best of our knowledge and belief were necessary for the purpose of our audit;
b) In our opinion, proper books of account as required by law have been kept by the Company so far as it appears from our examination of those books;
c) The Balance Sheet, the Statement of Profit and Loss, the Statement of Cash Flows and Statement of Changes in Equity dealt with by this Report are in agreement with the books of account;
d) In our opinion, the aforesaid standalone Ind AS financial statements comply with the Indian Accounting Standards prescribed under section 133 of the Act, read with Rule 7 of the Companies (Accounts) Rules, 2014;
e) On the basis of the written representations received from the directors as on 31st March, 2017 taken on record by the Board of Directors, none of the directors is disqualified as on 31st March, 2017 from being appointed as a director in terms of Section 164(2) of the Act;
f) With respect to the adequacy of the internal financial controls over financial reporting of the Company and the operating effectiveness of such controls, refer to our separate report in “Annexure B” and
g) With respect to the other matters to be included in the Auditor’s Report in accordance with Rule 11 of the Companies (Audit and Auditors) Rules, 2014 read with the Companies (Audit and Auditors) Amendment Rules, 2017, in our opinion and to the best of our information and according to the explanations given to us:
i. The Company has disclosed the impact of pending litigations against the Company on its financial position in its standalone Ind AS financial statements in respect of claims and demands on the Company which are being contested as mentioned in Note 41 (a) and 3 (ii).
ii. The Company did not have any long-term contracts including derivative contracts for which there were any material foreseeable losses.
92
iii. There has been no delay in transferring amounts, required to be transferred, to the Investor Education and Protection Fund by the Company.
iv. The Company has provided requisite disclosures in the standalone Ind AS financial statements as to the holdings as well as dealings in Specified Bank Notes during the period from 8th November, 2016 to 30th December, 2016. Based on audit procedures and relying on the management representation we report that the disclosures are in accordance with books of account maintained by the Company and produced to us by the management. Refer Note 47 to the standalone Ind AS financial statements.
For RAY & RAY Chartered Accountants Firm’s Registration No. 301072E
R. N. ROY Place : Gurugram Partner Date : 30th May 2017 Membership No 8608
93
ANNEXURE –A TO INDEPENDENT AUDITOR’S REPORT(Referred to in paragraph 1 under the heading ‘Report on Other Legal and Regulatory Requirements’ of our report at even date)
i. (a) The Company has maintained proper records showing full particulars, including quantitative details and situation of its fixed assets.
(b) The fixed assets have been physically verified by the Management during the year in accordance with a regular programme of verification which, in our opinion, is reasonable having regard to the size of the Company and the nature of its assets. The discrepancies noticed on such verification which were not material have been properly dealt with in the books of account.
(c) According to the information and explanations given to us and on the basis of our examination of the records of the Company, the title deeds of immovable properties are held in the name of the Company.
ii. As explained to us, inventories have been physically verified by the Management during the year at reasonable intervals. In respect of stocks lying with third parties, certificates confirming stocks have been received for stocks held. The discrepancies noticed on verification between the physical stocks and the book records were not material and have been properly dealt with in the books of account.
iii. The Company has not granted any loans, secured or unsecured, to companies, firms, limited liability partnerships or other parties covered in the register maintained under Section 189 of the Companies Act, 2013. Therefore, clauses (iii) (a), (b) and (c) of the aforesaid Order are not applicable.
iv. In our opinion and according to the information and explanations given to us, the Company has not violated the provisions of Section 185 and 186 of the Companies Act, 2013 in respect of loans, investments, guarantees and security.
v. The Company has not accepted any deposits from the public. As such requirement of clause (v) of the aforesaid order is not applicable.
vi. The Central Government has not prescribed the maintenance of cost records under section 148 (1) of the Act for the Company.
vii (a) The Company is generally regular in depositing with appropriate authorities undisputed statutory dues including provident fund, employees’ state insurance, income tax, sales tax, service tax, custom duty, excise duty, value added tax, cess and any other statutory dues applicable to it.
According to information and explanations given to us, there are no undisputed amounts payable in respect of income tax, sales tax, service tax, customs duty, excise duty, value added tax, cess that were outstanding, as at 31st March, 2017 for a period of more than six months from the date they became payable.
(b) According to the information and explanations given to us, the following dues of income tax, sales tax/value added tax, customs duty, service tax and luxury tax have not been deposited by the Company on account of disputes:
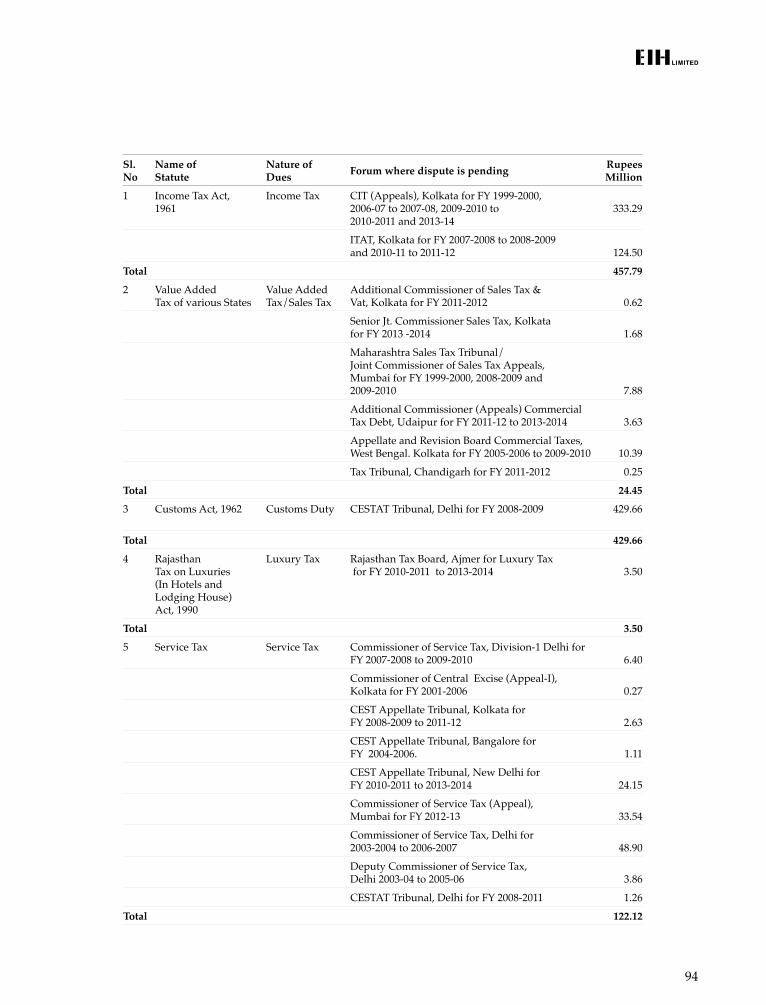
94
Sl. No
Name of Statute
Nature of Dues Forum where dispute is pending Rupees
Million
1 Income Tax Act, 1961
Income Tax CIT (Appeals), Kolkata for FY 1999-2000, 2006-07 to 2007-08, 2009-2010 to 2010-2011 and 2013-14
333.29
ITAT, Kolkata for FY 2007-2008 to 2008-2009 and 2010-11 to 2011-12
124.50
Total 457.79
2 Value Added Tax of various States
Value Added Tax/Sales Tax
Additional Commissioner of Sales Tax & Vat, Kolkata for FY 2011-2012
0.62
Senior Jt. Commissioner Sales Tax, Kolkata for FY 2013 -2014
1.68
Maharashtra Sales Tax Tribunal/ Joint Commissioner of Sales Tax Appeals, Mumbai for FY 1999-2000, 2008-2009 and 2009-2010
7.88
Additional Commissioner (Appeals) Commercial Tax Debt, Udaipur for FY 2011-12 to 2013-2014
3.63
Appellate and Revision Board Commercial Taxes, West Bengal. Kolkata for FY 2005-2006 to 2009-2010
10.39
Tax Tribunal, Chandigarh for FY 2011-2012 0.25
Total 24.45
3 Customs Act, 1962 Customs Duty CESTAT Tribunal, Delhi for FY 2008-2009 429.66
Total 429.66
4 Rajasthan Tax on Luxuries (In Hotels and Lodging House) Act, 1990
Luxury Tax Rajasthan Tax Board, Ajmer for Luxury Tax for FY 2010-2011 to 2013-2014
3.50
Total 3.50
5 Service Tax Service Tax Commissioner of Service Tax, Division-1 Delhi for FY 2007-2008 to 2009-2010
6.40
Commissioner of Central Excise (Appeal-I), Kolkata for FY 2001-2006
0.27
CEST Appellate Tribunal, Kolkata for FY 2008-2009 to 2011-12
2.63
CEST Appellate Tribunal, Bangalore for FY 2004-2006.
1.11
CEST Appellate Tribunal, New Delhi for FY 2010-2011 to 2013-2014
24.15
Commissioner of Service Tax (Appeal), Mumbai for FY 2012-13
33.54
Commissioner of Service Tax, Delhi for 2003-2004 to 2006-2007
48.90
Deputy Commissioner of Service Tax, Delhi 2003-04 to 2005-06
3.86
CESTAT Tribunal, Delhi for FY 2008-2011 1.26
Total 122.12
95
viii In our opinion and according to the information and explanations given to us, the Company has not defaulted in repayment of dues to banks and financial institutions. There are no debenture holders and loan from Government.
ix The Company has not raised moneys by way of initial public offer or further public offer (including debt instruments) during the year. In our opinion and according to the information and explanations given to us, the term loans taken by the Company have been applied for the purpose for which they were raised.
x According to the information and explanations given to us, no fraud by the Company or on the Company by its officers or employees has been noticed or reported during the course of our audit.
xi According to the information and explanations given to us and based on our examination of the records of the Company, the Company has paid/provided for managerial remuneration in accordance with the requisite approvals mandated by the provisions of Section 197 read with Schedule V to the Act.
xii In our opinion and according to the information and explanations given to us, the Company is not a nidhi company. Accordingly, paragraph 3(xii) of the Order is not applicable.
xiii. In our opinion and according to the information and explanations given to us, all transactions with the related parties are in compliance with section 177 and 188 of the Companies act, 2013 where applicable and the details of such transactions have been disclosed in the standalone Ind AS financial statements as required by the applicable standards.
xiv. According to the information and explanations given to us and based on our examination of the records of the Company, the Company has not made any preferential allotment or private placement of shares or fully or partly convertible debentures during the year.
xv. In our opinion and according to the information and explanations given to us, the Company has not entered into any non-cash transactions with directors or persons connected with him. Accordingly, paragraph 3(xv) of the Order is not applicable.
xvi. The Company is not required to be registered under section 45-IA of the Reserve Bank of India Act 1934.
For RAY & RAY Chartered Accountants (Firm’s Registration No.301072E)
R.N. ROY Place: Gurugram Partner Date: 30th May 2017 Membership No. 8608
96
ANNEXURE – B TO INDEPENDENT AUDITOR’S REPORT
Report on the Internal Financial Controls under Clause (i) of Sub-section 3 of Section 143 of the Companies Act, 2013 (“the Act”)
We have audited the internal financial controls over financial reporting of EIH Limited (“the Company”) as at 31st March, 2017 in conjunction with our audit of the standalone Ind AS financial statements of the Company for the year ended on that date.
Management’s Responsibility for Internal Financial ControlsThe Company’s management is responsible for establishing and maintaining internal financial controls based on the internal control over financial reporting criteria established by the Company considering the essential components of internal control stated in the Guidance Note on Audit of Internal Financial Controls over Financial Reporting issued by the Institute of Chartered Accountants of India (‘ICAI’). These responsibilities include the design, implementation and maintenance of adequate internal financial controls that were operating effectively for ensuring the orderly and efficient conduct of its business, including adherence to company’s policies, the safeguarding of its assets, the prevention and detection of frauds and errors, the accuracy and completeness of the accounting records, and the timely preparation of reliable financial information, as required under the Companies Act, 2013.
Auditors’ Responsibility Our responsibility is to express an opinion on the Company’s internal financial controls over financial reporting based on our audit. We conducted our audit in accordance with the Guidance Note on Audit of Internal Financial Controls over Financial Reporting (the “Guidance Note”) and the Standards on Auditing, issued by ICAI and deemed to be prescribed under section 143(10) of the Companies Act, 2013, to the extent applicable to an audit of internal financial controls, both applicable to an audit of Internal Financial Controls and, both issued by the Institute of Chartered Accountants of India. Those Standards and the Guidance Note require that we comply with ethical requirements and plan and perform the audit to obtain reasonable assurance about whether adequate internal financial controls over financial reporting was established and maintained and if such controls operated effectively in all material respects.
Our audit involves performing procedures to obtain audit evidence about the adequacy of the internal financial controls system over financial reporting and their operating effectiveness. Our audit of internal financial controls over financial reporting included obtaining an understanding of internal financial controls over financial reporting, assessing the risk that a material weakness exists, and testing and evaluating the design and operating effectiveness of internal control based on the assessed risk. The procedures selected depend on the auditor’s judgment, including the assessment of the risks of material misstatement of the standalone Ind AS financial statements, whether due to fraud or error.
We believe that the audit evidence we have obtained is sufficient and appropriate to provide a basis for our audit opinion on the Company’s internal financial controls system over financial reporting.
97
Meaning of Internal Financial Controls over Financial Reporting A company’s internal financial control over financial reporting is a process designed to provide reasonable assurance regarding the reliability of financial reporting and the preparation of standalone Ind AS financial statements for external purposes in accordance with generally accepted accounting principles. A company’s internal financial control over financial reporting includes those policies and procedures that (1) pertain to the maintenance of records that, in reasonable detail, accurately and fairly reflect the transactions and dispositions of the assets of the company; (2) provide reasonable assurance that transactions are recorded as necessary to permit preparation of standalone Ind AS financial statements in accordance with generally accepted accounting principles, and that receipts and expenditures of the company are being made only in accordance with authorizations of management and directors of the company; and (3) provide reasonable assurance regarding prevention or timely detection of unauthorised acquisition, use, or disposition of the company’s assets that could have a material effect on the standalone Ind AS financial statements.
Inherent Limitations of Internal Financial Controls Over Financial Reporting Because of the inherent limitations of internal financial controls over financial reporting, including the possibility of collusion or improper management override of controls, material misstatements due to error or fraud may occur and not be detected. Also, projections of any evaluation of the internal financial controls over financial reporting to future periods are subject to the risk that the internal financial control over financial reporting may become inadequate because of changes in conditions, or that the degree of compliance with the policies or procedures may deteriorate.
OpinionIn our opinion, the Company has, in all material respects, an adequate internal financial controls system over financial reporting and such internal financial controls over financial reporting were operating effectively as at 31 March 2017, based on the internal control over financial reporting criteria established by the Company considering the essential components of internal control stated in the Guidance Note on Audit of Internal Financial Controls Over Financial Reporting issued by the Institute of Chartered Accountants of India.
For RAY & RAY Chartered Accountants (Firm’s Registration No.301072E)
R.N. ROYPlace: Gurugram PartnerDate: 30th May 2017 Membership No. 8608
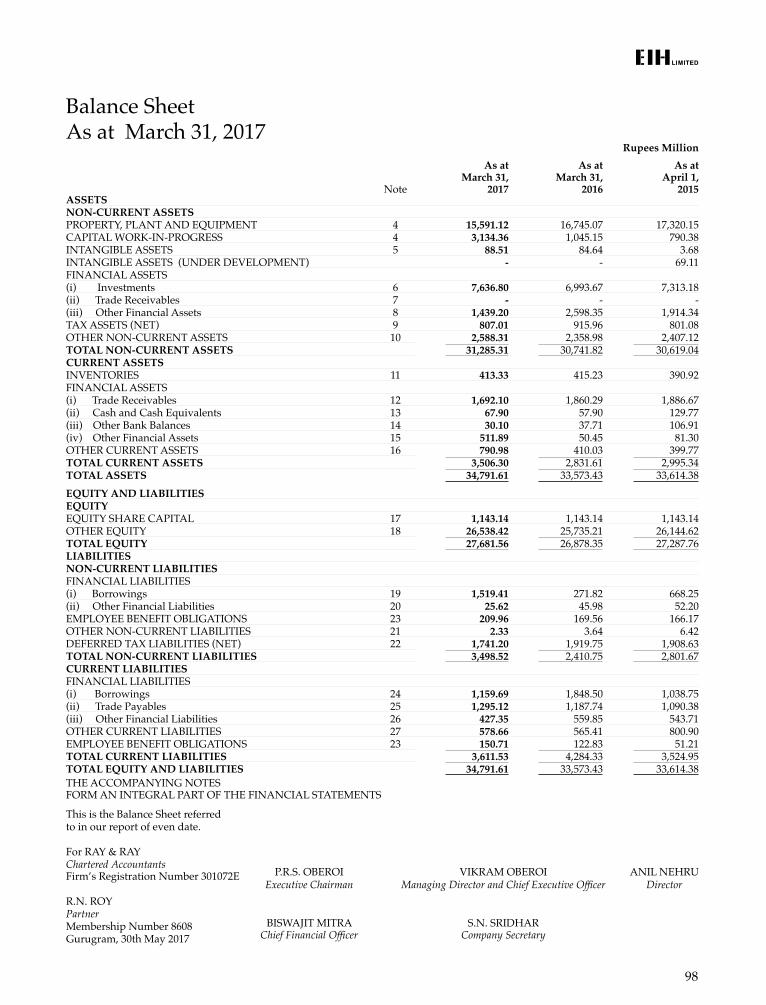
98
P.R.S. OBEROI VIKRAM OBEROI ANIL NEHRU Executive Chairman Managing Director and Chief Executive Officer Director
BISWAJIT MITRA S.N. SRIDHAR Chief Financial Officer Company Secretary
Balance Sheet As at March 31, 2017
Rupees Million
Note
As at March 31,
2017
As at March 31,
2016
As at April 1,
2015ASSETSNON-CURRENT ASSETSPROPERTY, PLANT AND EQUIPMENT 4 15,591.12 16,745.07 17,320.15 CAPITAL WORK-IN-PROGRESS 4 3,134.36 1,045.15 790.38 INTANGIBLE ASSETS 5 88.51 84.64 3.68 INTANGIBLE ASSETS (UNDER DEVELOPMENT) - - 69.11 FINANCIAL ASSETS(i) Investments 6 7,636.80 6,993.67 7,313.18 (ii) Trade Receivables 7 - - - (iii) Other Financial Assets 8 1,439.20 2,598.35 1,914.34 TAX ASSETS (NET) 9 807.01 915.96 801.08 OTHER NON-CURRENT ASSETS 10 2,588.31 2,358.98 2,407.12 TOTAL NON-CURRENT ASSETS 31,285.31 30,741.82 30,619.04 CURRENT ASSETSINVENTORIES 11 413.33 415.23 390.92 FINANCIAL ASSETS(i) Trade Receivables 12 1,692.10 1,860.29 1,886.67 (ii) Cash and Cash Equivalents 13 67.90 57.90 129.77 (iii) Other Bank Balances 14 30.10 37.71 106.91 (iv) Other Financial Assets 15 511.89 50.45 81.30 OTHER CURRENT ASSETS 16 790.98 410.03 399.77 TOTAL CURRENT ASSETS 3,506.30 2,831.61 2,995.34 TOTAL ASSETS 34,791.61 33,573.43 33,614.38 EQUITY AND LIABILITIESEQUITYEQUITY SHARE CAPITAL 17 1,143.14 1,143.14 1,143.14 OTHER EQUITY 18 26,538.42 25,735.21 26,144.62 TOTAL EQUITY 27,681.56 26,878.35 27,287.76 LIABILITIESNON-CURRENT LIABILITIESFINANCIAL LIABILITIES(i) Borrowings 19 1,519.41 271.82 668.25 (ii) Other Financial Liabilities 20 25.62 45.98 52.20 EMPLOYEE BENEFIT OBLIGATIONS 23 209.96 169.56 166.17 OTHER NON-CURRENT LIABILITIES 21 2.33 3.64 6.42 DEFERRED TAX LIABILITIES (NET) 22 1,741.20 1,919.75 1,908.63 TOTAL NON-CURRENT LIABILITIES 3,498.52 2,410.75 2,801.67 CURRENT LIABILITIESFINANCIAL LIABILITIES(i) Borrowings 24 1,159.69 1,848.50 1,038.75 (ii) Trade Payables 25 1,295.12 1,187.74 1,090.38 (iii) Other Financial Liabilities 26 427.35 559.85 543.71 OTHER CURRENT LIABILITIES 27 578.66 565.41 800.90 EMPLOYEE BENEFIT OBLIGATIONS 23 150.71 122.83 51.21 TOTAL CURRENT LIABILITIES 3,611.53 4,284.33 3,524.95 TOTAL EQUITY AND LIABILITIES 34,791.61 33,573.43 33,614.38 THE ACCOMPANYING NOTES FORM AN INTEGRAL PART OF THE FINANCIAL STATEMENTS
This is the Balance Sheet referredto in our report of even date.
For RAY & RAYChartered Accountants Firm’s Registration Number 301072E
R.N. ROYPartnerMembership Number 8608Gurugram, 30th May 2017
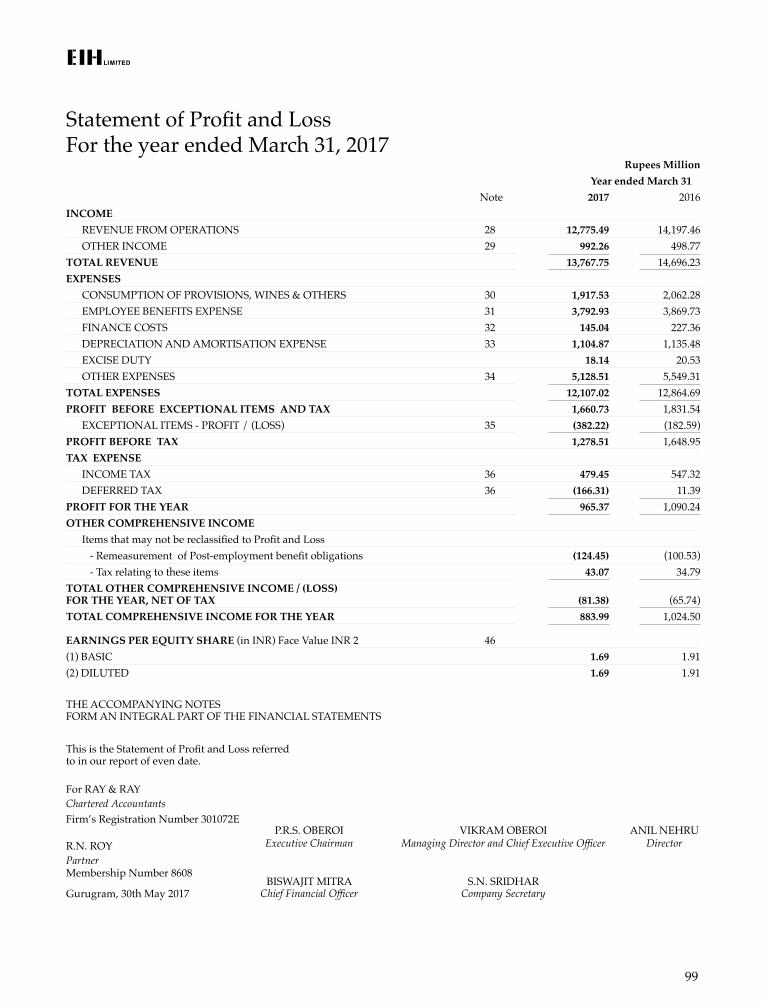
99
Statement of Profit and Loss For the year ended March 31, 2017
Rupees Million Year ended March 31
Note 2017 2016INCOME REVENUE FROM OPERATIONS 28 12,775.49 14,197.46 OTHER INCOME 29 992.26 498.77 TOTAL REVENUE 13,767.75 14,696.23 EXPENSES CONSUMPTION OF PROVISIONS, WINES & OTHERS 30 1,917.53 2,062.28 EMPLOYEE BENEFITS EXPENSE 31 3,792.93 3,869.73 FINANCE COSTS 32 145.04 227.36 DEPRECIATION AND AMORTISATION EXPENSE 33 1,104.87 1,135.48 EXCISE DUTY 18.14 20.53 OTHER EXPENSES 34 5,128.51 5,549.31 TOTAL EXPENSES 12,107.02 12,864.69 PROFIT BEFORE EXCEPTIONAL ITEMS AND TAX 1,660.73 1,831.54 EXCEPTIONAL ITEMS - PROFIT / (LOSS) 35 (382.22) (182.59)PROFIT BEFORE TAX 1,278.51 1,648.95 TAX EXPENSE INCOME TAX 36 479.45 547.32 DEFERRED TAX 36 (166.31) 11.39 PROFIT FOR THE YEAR 965.37 1,090.24 OTHER COMPREHENSIVE INCOME Items that may not be reclassified to Profit and Loss - Remeasurement of Post-employment benefit obligations (124.45) (100.53) - Tax relating to these items 43.07 34.79 TOTAL OTHER COMPREHENSIVE INCOME / (LOSS) FOR THE YEAR, NET OF TAX (81.38) (65.74)TOTAL COMPREHENSIVE INCOME FOR THE YEAR 883.99 1,024.50
EARNINGS PER EQUITY SHARE (in INR) Face Value INR 2 46(1) BASIC 1.69 1.91 (2) DILUTED 1.69 1.91
THE ACCOMPANYING NOTES FORM AN INTEGRAL PART OF THE FINANCIAL STATEMENTS
This is the Statement of Profit and Loss referred to in our report of even date.
For RAY & RAYChartered AccountantsFirm’s Registration Number 301072E
R.N. ROYPartnerMembership Number 8608
Gurugram, 30th May 2017
P.R.S. OBEROI VIKRAM OBEROI ANIL NEHRU Executive Chairman Managing Director and Chief Executive Officer Director
BISWAJIT MITRA S.N. SRIDHAR Chief Financial Officer Company Secretary
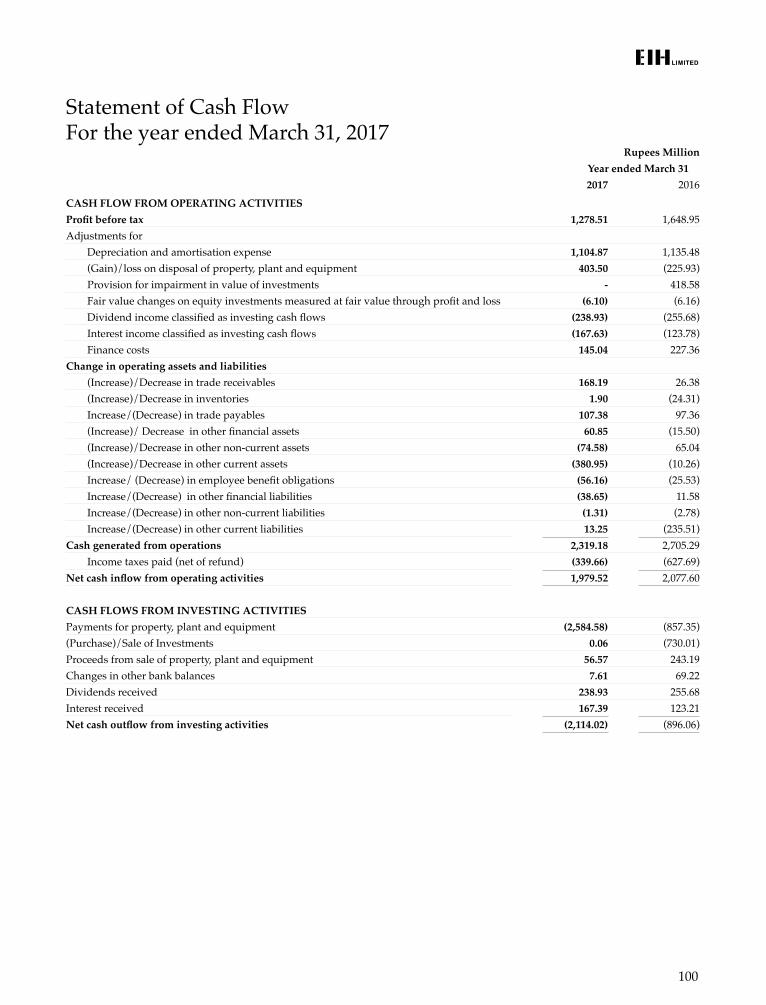
100
Statement of Cash Flow For the year ended March 31, 2017
Rupees Million Year ended March 31
2017 2016CASH FLOW FROM OPERATING ACTIVITIESProfit before tax 1,278.51 1,648.95 Adjustments for Depreciation and amortisation expense 1,104.87 1,135.48 (Gain)/loss on disposal of property, plant and equipment 403.50 (225.93) Provision for impairment in value of investments - 418.58 Fair value changes on equity investments measured at fair value through profit and loss (6.10) (6.16) Dividend income classified as investing cash flows (238.93) (255.68) Interest income classified as investing cash flows (167.63) (123.78) Finance costs 145.04 227.36 Change in operating assets and liabilities (Increase)/Decrease in trade receivables 168.19 26.38 (Increase)/Decrease in inventories 1.90 (24.31) Increase/(Decrease) in trade payables 107.38 97.36 (Increase)/ Decrease in other financial assets 60.85 (15.50) (Increase)/Decrease in other non-current assets (74.58) 65.04 (Increase)/Decrease in other current assets (380.95) (10.26) Increase/ (Decrease) in employee benefit obligations (56.16) (25.53) Increase/(Decrease) in other financial liabilities (38.65) 11.58 Increase/(Decrease) in other non-current liabilities (1.31) (2.78) Increase/(Decrease) in other current liabilities 13.25 (235.51)Cash generated from operations 2,319.18 2,705.29 Income taxes paid (net of refund) (339.66) (627.69)Net cash inflow from operating activities 1,979.52 2,077.60
CASH FLOWS FROM INVESTING ACTIVITIESPayments for property, plant and equipment (2,584.58) (857.35)(Purchase)/Sale of Investments 0.06 (730.01)Proceeds from sale of property, plant and equipment 56.57 243.19 Changes in other bank balances 7.61 69.22 Dividends received 238.93 255.68 Interest received 167.39 123.21 Net cash outflow from investing activities (2,114.02) (896.06)
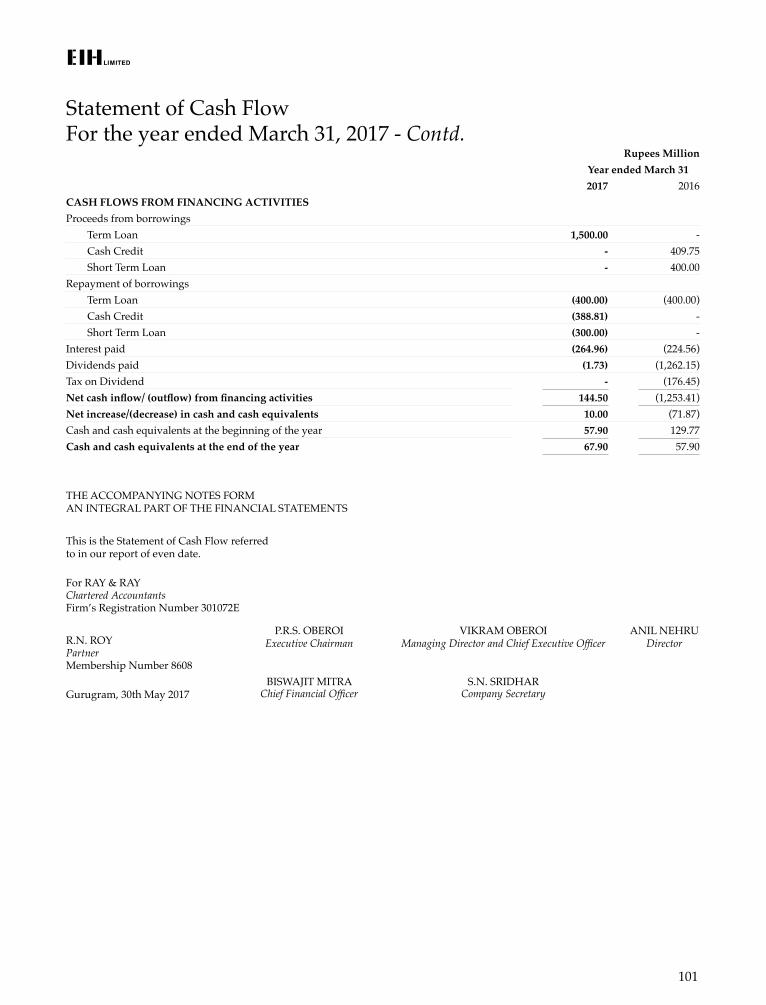
101
Statement of Cash Flow For the year ended March 31, 2017 - Contd.
Rupees Million Year ended March 31
2017 2016CASH FLOWS FROM FINANCING ACTIVITIESProceeds from borrowings Term Loan 1,500.00 - Cash Credit - 409.75 Short Term Loan - 400.00 Repayment of borrowings Term Loan (400.00) (400.00) Cash Credit (388.81) - Short Term Loan (300.00) - Interest paid (264.96) (224.56)Dividends paid (1.73) (1,262.15)Tax on Dividend - (176.45)Net cash inflow/ (outflow) from financing activities 144.50 (1,253.41)Net increase/(decrease) in cash and cash equivalents 10.00 (71.87)Cash and cash equivalents at the beginning of the year 57.90 129.77 Cash and cash equivalents at the end of the year 67.90 57.90
THE ACCOMPANYING NOTES FORM AN INTEGRAL PART OF THE FINANCIAL STATEMENTS
This is the Statement of Cash Flow referred to in our report of even date.
For RAY & RAYChartered AccountantsFirm’s Registration Number 301072E
R.N. ROYPartnerMembership Number 8608
Gurugram, 30th May 2017
P.R.S. OBEROI VIKRAM OBEROI ANIL NEHRU Executive Chairman Managing Director and Chief Executive Officer Director
BISWAJIT MITRA S.N. SRIDHAR Chief Financial Officer Company Secretary
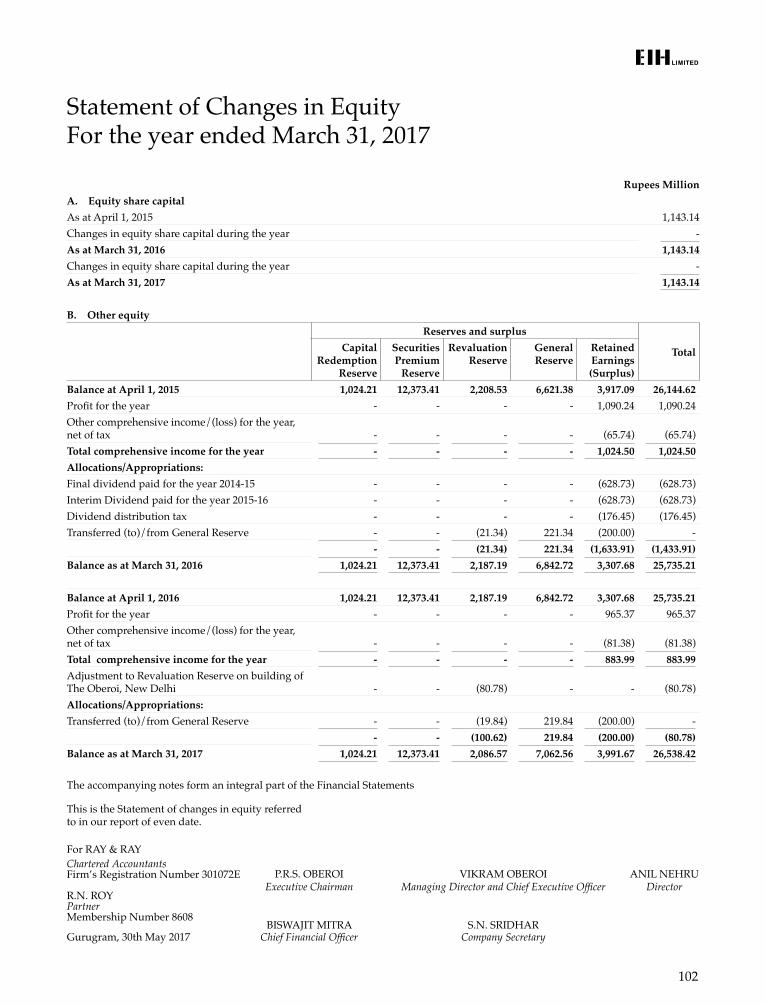
102
Statement of Changes in Equity For the year ended March 31, 2017
Rupees MillionA. Equity share capitalAs at April 1, 2015 1,143.14 Changes in equity share capital during the year - As at March 31, 2016 1,143.14 Changes in equity share capital during the year - As at March 31, 2017 1,143.14
B. Other equityReserves and surplus
TotalCapital Redemption
Reserve
Securities Premium
Reserve
Revaluation Reserve
General Reserve
Retained Earnings (Surplus)
Balance at April 1, 2015 1,024.21 12,373.41 2,208.53 6,621.38 3,917.09 26,144.62 Profit for the year - - - - 1,090.24 1,090.24 Other comprehensive income/(loss) for the year, net of tax - - - - (65.74) (65.74)Total comprehensive income for the year - - - - 1,024.50 1,024.50 Allocations/Appropriations:Final dividend paid for the year 2014-15 - - - - (628.73) (628.73)Interim Dividend paid for the year 2015-16 - - - - (628.73) (628.73)Dividend distribution tax - - - - (176.45) (176.45)Transferred (to)/from General Reserve - - (21.34) 221.34 (200.00) -
- - (21.34) 221.34 (1,633.91) (1,433.91)Balance as at March 31, 2016 1,024.21 12,373.41 2,187.19 6,842.72 3,307.68 25,735.21
Balance at April 1, 2016 1,024.21 12,373.41 2,187.19 6,842.72 3,307.68 25,735.21 Profit for the year - - - - 965.37 965.37 Other comprehensive income/(loss) for the year, net of tax - - - - (81.38) (81.38)Total comprehensive income for the year - - - - 883.99 883.99 Adjustment to Revaluation Reserve on building of The Oberoi, New Delhi - - (80.78) - - (80.78)Allocations/Appropriations:Transferred (to)/from General Reserve - - (19.84) 219.84 (200.00) -
- - (100.62) 219.84 (200.00) (80.78)Balance as at March 31, 2017 1,024.21 12,373.41 2,086.57 7,062.56 3,991.67 26,538.42
The accompanying notes form an integral part of the Financial Statements
This is the Statement of changes in equity referred to in our report of even date.
For RAY & RAYChartered AccountantsFirm’s Registration Number 301072E
R.N. ROYPartnerMembership Number 8608
Gurugram, 30th May 2017
P.R.S. OBEROI VIKRAM OBEROI ANIL NEHRU Executive Chairman Managing Director and Chief Executive Officer Director
BISWAJIT MITRA S.N. SRIDHAR Chief Financial Officer Company Secretary
103
Notes to Accounts
GENERAL INFORMATIONEIH Limited is a company limited by shares, incorporated and domiciled in India having its Registered Office at 4, Mangoe Lane, Kolkata-700 001. The company is primarily engaged in owning and managing premium luxury hotels and cruisers under the luxury ‘Oberoi’ and ‘Trident’ brands. The company is also engaged in flight catering, airport restaurants, project management and corporate air charters.
1 SIGNIFICANT ACCOUNTING POLICIES
This note provides a list of the significant accounting policies adopted in the preparation of these separate financial statements of EIH Limited. These policies have been consistently applied to all the periods presented, unless otherwise stated.
a) BASIS OF PREPARATION
(i) Compliance with Ind AS The separate financial statements have been prepared in accordance with the Companies (Indian Accounting Standard)
Rules, 2015 as a going concern on an accrual basis.
The financial statements up to year ended 31 March 2016 were prepared earlier in accordance with the accounting standards notified under the Companies (Accounting Standard) Rules, 2006 (as amended) and other relevant provisions of the Act.
These financial statements are the first financial statements of the company under Ind AS and the transition was carried out in accordance with Ind AS 101, “First time adoption of Indian Accounting Standards. Refer note 48 for an explanation of how the transition from previous GAAP to Ind AS has affected the company’s financial position, financial performance and cash flows.
(ii) Historical cost convention The financial statements have been prepared on a historical cost basis, except for the following: – equity investments in entities other than subsidiary, joint ventures and associate which are measured at fair value; – defined benefit plans – plan assets measured at fair value – customer loyalty programs
(iii) Use of estimates In preparing the financial statements in conformity with accounting principles, management is required to make estimates
and assumptions that may affect the reported amounts of assets and liabilities and the disclosure of contingent liabilities as at the date of financial statements and the amounts of revenue and expenses during the reported period. Actual results could differ from those estimates. Any revision to such estimates is recognised in the period the same is determined.
b) REVENUE RECOGNITION (i) Revenue is measured at the fair value of the consideration received or receivable. Amounts disclosed as revenue are
inclusive of excise duty and net of trade allowances, rebates, value added taxes and amounts collected on behalf of third parties.
(ii) Revenue from interest is recognized on accrual basis and determined by contractual rate of interest. (iii) Dividend income is stated at gross and is recognized when right to receive payment is established
The company recognizes revenue when the amount of revenue can be reliably measured, it is probable that future economic benefits will flow to the entity and specific criteria have been met for each of the company’s activities as described below. The company bases its estimates on historical results, taking into consideration the type of customer, the type of transaction and the specifics of each arrangement.
Timing of revenue recognition from major business activities
– Hospitality Services: Revenue from hospitality services is recognised when the services are rendered and the same becomes chargeable.
– Sale of printed material: Revenue from sale of printed and other materials is recognised on dispatch of materials. – Others: Revenue from Shop License Fee, Management and Marketing Fee included under “Other Services” is recognised
on accrual basis as per terms of the contract. – Revenue in respect of customer loyalty are recognized when loyalty points are redeemed by the customers.
104
Notes to Accounts — Contd.
c) FOREIGN CURRENCY TRANSLATION
(i) Presentation Currency These financial statements are presented in INR which is the Functional Currency of the Company.
(ii) Transactions and balances
Sales made in foreign currency are converted at the prevailing applicable exchange rate. Gain/Loss arising out of fluctuations in exchange rate is accounted for on realization or translation at the year end.
Payments made in foreign currency including for acquiring investments are converted at the applicable rate prevailing on the date of remittance. Liability on account of foreign currency is converted at the exchange rate prevailing at the end of the year. Monetary items denominated in foreign currency are converted at the exchange rate prevailing at the end of the year.
Revenue expenditure of all the overseas sales offices are converted at the average exchange rate for the year. Assets and liabilities other than Fixed Assets are converted at the exchange rate prevailing at the close of the accounting year and Fixed Assets are converted at the month-end exchange rate of the month of acquisition
Foreign currency loans covered by forward contracts are realigned at the forward contract rates, while those not covered by forward contracts are realigned at the rates ruling at the year end. The differences on realignment is accounted for in the Statement of Profit and Loss.
d) INCOME TAX
Current income tax is recognized based on the amount expected to be paid to the tax authorities, using tax rates and tax laws that have been enacted or substantially enacted on the date of balance sheet.
e) DEFERRED TAX
Deferred income tax is provided in full, using the liability method, on temporary differences arising between the tax bases of assets and liabilities and their carrying amounts in the separate financial statements.
Deferred tax assets are recognised for all deductible temporary differences and unused tax losses only if it is probable that future taxable amounts will be available to utilise those temporary differences and losses.
Deferred tax assets and liabilities are offset when there is a legally enforceable right to offset current tax assets and liabilities and when the deferred tax balances relate to the same taxation authority. Current tax assets and tax liabilities are offset where the entity has a legally enforceable right to offset and intends either to settle on a net basis, or to realise the asset and settle the liability simultaneously.
Current and deferred tax is recognised in profit or loss, except to the extent that it relates to items recognised in other comprehensive income or directly in equity. In this case, the tax is also recognised in other comprehensive income or directly in equity, respectively.
f) SEGMENT REPORTING
Operating segments are reported in a manner consistent with the internal reporting provided to the chief operating decision maker.
The board of directors of EIH Limited generally assesses the financial performance and position of the company, and makes strategic decisions. Refer note 44 for segment information.
g) LEASES
As a lessee : Leases of property, plant and equipment where the company, as lessee, has substantially all the risks and rewards of ownership
are classified as finance leases. Assets under finance lease are capitalized at the inception, at the fair value of the leased property or, if lower, the present value of the minimum lease payments. The corresponding rental obligations, net of finance charges, are included in borrowings or other financial liabilities as appropriate. Each lease payment is allocated between the liability and finance cost. The finance cost is charged to the profit or loss over the lease period so as to produce a constant periodic rate of interest on the remaining balance of the liability for each period.
Leases in which a significant portion of the risks and rewards of ownership are not transferred to the company as lessee are classified as operating leases. Payments made under operating leases (net of any incentives received from the lessor) are charged to profit or loss on a straight-line basis over the period of the lease unless the payments are structured to increase in line with expected general inflation to compensate for the lessor’s expected inflationary cost increases.
105
Notes to Accounts — Contd.
As a lessor : Lease income from operating leases where the company is a lessor is recognised as income on a straight-line basis over the lease
term unless the receipts are structured to increase in line with expected general inflation to compensate for the expected inflationary cost increases. The respective leased assets are included in the balance sheet based on their nature.
h) IMPAIRMENT OF ASSETS Assets are tested for impairment whenever events or changes in circumstances indicate that the carrying amount may not be
recoverable. An impairment loss is recognised for the amount by which the asset’s carrying amount exceeds its recoverable amount. Assets that suffered an impairment are reviewed for possible reversal of the impairment at the end of each reporting period. In case of such reversal, the carrying amount of the asset is increased so as not to exceed the carrying amount that would have been determined had there been no impairment loss.
i) CASH AND CASH EQUIVALENTS For the purpose of presentation in the statement of cash flows, cash and cash equivalents includes cash in hand, cash at bank and
other deposits held at call with financial institutions, other short-term, highly liquid investments with original maturities of three months or less that are readily convertible to known amounts of cash and which are subject to an insignificant risk of changes in value.
j) TRADE RECEIVABLES Trade receivables are recognised initially at fair value and subsequently measured at amortised cost using the effective interest
method, less provision for impairment.
k) INVENTORIES Inventories are valued at cost which is based on Cumulative Weighted Average method or net realisable value, whichever is
lower. Unserviceable/damaged/discarded stocks and shortages are charged to the statement of Profit or Loss.
l) INVESTMENTS AND OTHER FINANCIAL ASSETS
(i) Classification The company classifies its financial assets in the following measurement categories: – those to be measured subsequently at fair value (either through other comprehensive income, or through profit or loss) – those measured at amortised cost.
The classification depends on the entity’s business model for managing the financial assets and the contractual terms of the cash flows.
For assets measured at fair value, gains and losses will be recorded in profit or loss. For investments in debt instruments, this will depend on the business model in which the investment is held. For investments in equity instruments, this will depend on whether the company has made an irrevocable election at the time of initial recognition to account for the equity investment at fair value through other comprehensive income.
(ii) Measurement At initial recognition, the company measures a financial asset at its fair value plus, in the case of a financial asset not at
fair value through profit and loss, transaction costs that are directly attributable to the acquisition of the financial asset. Transaction costs of financial assets carried at fair value through profit or loss are expensed in profit or loss.
Debt instruments Subsequent measurement of debt instruments depends on the company’s business model for managing the asset and the
cash flow characteristics of the asset. There are three measurement categories into which the company classifies its debt instruments:
Amortised cost: Assets that are held for collection of contractual cash flows where those cash flows represent solely payments of principal and interest are measured at amortised cost.
Fair value through other comprehensive income (FVOCI): Assets that are held for collection of contractual cash flows and for selling the financial assets, where the assets’ cash flows represent solely payments of principal and interest, are measured at fair value through other comprehensive income (FVOCI). Movements in the carrying amount are taken through OCI, except for the recognition of impairment gains or losses, interest revenue and foreign exchange gains and losses which are recognised in profit and loss. When the financial asset is derecognised, the cumulative gain or loss previously recognised in OCI is reclassified from equity to profit or loss and recognised in other gains/ (losses). Interest income from these financial assets is included in other income using the effective interest rate method.
106
Notes to Accounts — Contd.
Fair value through profit or loss: Assets that do not meet the criteria for amortised cost or FVOCI are measured at fair value through profit and loss
Equity instruments The company subsequently measures all equity investments at fair value. Dividends from such investments are recognised
in profit or loss as other income when the company’s right to receive payments is established.
Changes in the fair value of financial assets at fair value through profit or loss are recognised in other gain/ (losses) in the statement of profit and loss.
(iii) Impairment of financial assets The company assesses on a forward looking basis the expected credit losses associated with its assets carried at amortised
cost. The impairment methodology applied depends on whether there has been a significant increase in credit risk. Note 38 details how the company determines whether there has been a significant increase in credit risk.
For trade receivables only, the company applies the simplified approach permitted by Ind AS 109 Financial Instruments, which requires expected lifetime losses to be recognised from initial recognition of the receivables.
(iv) Derecognition of financial assets A financial asset is derecognised only when – The company has transferred the rights to receive cash flows from the financial asset or – Retains the contractual rights to receive the cash flows of the financial asset, but assumes a contractual obligation
to pay the cash flows to one or more recipients.
Where the entity has transferred an asset, the company evaluates whether it has transferred substantially all risks and rewards of ownership of the financial asset. In such cases, the financial asset is derecognised. Where the entity has not transferred substantially all risks and rewards of ownership of the financial asset, the financial asset is not derecognised.
Where the entity has neither transferred a financial asset nor retains substantially all risks and rewards of ownership of the financial asset, the financial asset is derecognised if the company has not retained control of the financial asset. Where the company retains control of the financial asset, the asset is continued to be recognised to the extent of continuing involvement in the financial asset.
(v) Income recognition Interest income: Interest income from debt instruments is recognised using the effective interest rate method. The effective
interest rate is the rate that exactly discounts estimated future cash receipts through the expected life of the financial asset to the gross carrying amount of a financial asset. When calculating the effective interest rate, the company estimates the expected cash flows by considering all the contractual terms of the financial instrument (for example, prepayment, extension, call and similar options) but does not consider the expected credit losses
Dividend income: Dividends are recognised in profit or loss only when the right to receive payment is established, it is probable that the economic benefits associated with the dividend will flow to the company, and the amount of the dividend can be measured reliably.
m) PROPERTY, PLANT AND EQUIPMENT Freehold land is carried at historical cost. All other items of property, plant and equipment are stated at historical cost less
depreciation. Historical Cost represents direct expenses incurred on acquisition or construction of the assets and the share of indirect expenses relating to construction allocated in proportion to the direct cost involved.
Subsequent costs are included in the asset’s carrying amount or recognised as a separate asset, as appropriate, only when it is probable that future economic benefits associated with the item will flow to the company and the cost of the item can be measured reliably. The carrying amount of any component accounted for as a separate asset is derecognised when replaced. All other repairs and maintenance are charged to profit or loss during the reporting period in which they are incurred.
Capital work-in-progress comprises the cost of property, plant and equipment that are not yet ready for their intended use on the reporting date and materials at site.
Transition to Ind AS On transition to Ind AS, the company has elected to continue with the carrying value of all of its property, plant and equipment
recognised as at 1 April 2015 measured as per the previous GAAP and use that carrying value as the deemed cost of the property, plant and equipment.
107
Depreciation methods, estimated useful lives and residual value Depreciation on property, plant and equipment other than land, the hotel buildings, certain buildings on leasehold land and
leased vehicles and machinery is provided on ‘Straight Line Method’ based on useful life as prescribed under Schedule II of the Companies Act 2013. Leased vehicles, and building installed on leasehold land (other than perpetual lease) are depreciated over the lives of the respective asset or over the remaining lease period from the date of installation whichever is shorter.
Long term leasehold land (other than perpetual lease) is depreciated over the balance period of the lease, commencing from the date the land is put to use for commercial purposes.
The hotel buildings are depreciated equally over the balance useful life ascertained by independent technical expert, which ranges between 30 years and 60 years with effect from March 31, 2015 and are higher than those specified by Schedule II to the Companies Act; 2013. The management believes that the balance useful lives so assessed best represent the periods over which the hotel buildings are expected to be in use. The residual values are not more than 5% of the original cost of the asset. The assets’ residual values and useful lives are reviewed, and adjusted if appropriate, at the end of each reporting period.
Gains and losses on disposals are determined by comparing proceeds with carrying amount. These are included in profit or loss within other gains/(losses).
n) INTANGIBLE ASSETS Intangible assets are stated at cost less accumulated amortisation and net of impairments, if any. An intangible asset is recognised
if it is probable that the expected future economic benefits that are attributable to the asset will flow to the company and its cost can be measured reliably. Intangible assets are amortised on straight line basis over their estimated useful lives.
Transition to Ind AS On transition to Ind AS, the company has elected to continue with the carrying value of all of its intangible assets recognised as
at April 1, 2015 measured as per the previous GAAP and use that carrying value as the deemed cost of the intangible assets.
o) TRADE AND OTHER PAYABLES These amounts represent liabilities for goods and services provided to the company prior to the end of financial year which are
unpaid. The amounts are unsecured and are usually paid within 30 days of recognition. Trade and other payables are presented as current liabilities unless payment is not due within 12 months after the reporting period. They are recognised initially at their fair value and subsequently measured at amortised cost using the effective interest method.
p) BORROWING COSTS General and specific borrowing costs that are directly attributable to the acquisition, construction or production of a qualifying
asset are capitalised as part of the cost of respective assets during the period of time that is required to complete and prepare the asset for its intended use. Qualifying assets are assets that necessarily take a substantial period of time to get ready for their intended use or sale. Other borrowing costs are expensed in the period in which they are incurred.
q) PROVISIONS, CONTINGENT LIABILITIES AND CONTINGENT ASSETS Provisions are recognised when there is a present legal or statutory obligation or constructive obligation as a result of past events
and where it is probable that there will be outflow of resources to settle the obligation and when a reliable estimate of the amount of the obligation can be made.
Contingent liabilities are recognized only when there is a possible obligation arising from past events due to occurrence or non-occurrence of one or more uncertain future events not wholly within the control of the company or where any present obligation cannot be measured in terms of future outflow of resources or where a reliable estimate of the obligation cannot be made. Obligations are assessed on an ongoing basis and only those having a largely probable outflow of resources are provided for.
Contingent assets where it is probable that future economic benefits will flow to the company are not recognised but disclosed in the financial statements. However, when the realisation of income is virtually certain, then the related asset is no longer a contingent asset, but it is recognised as an asset.
r) EMPLOYEE BENEFITS
(i) Short-term obligations Liabilities for wages and salaries, including non-monetary benefits that are expected to be settled wholly within 12 months
after the end of the period in which the employees render the related service are recognised in respect of employees’ services up to the end of the reporting period and are measured at the amounts expected to be paid when the liabilities are settled. The liabilities are presented as current employee benefit obligations in the balance sheet.
Notes to Accounts — Contd.
108
(ii) Post-employment obligations The company operates the following post-employment schemes:
Gratuity obligations – Maintained as a defined benefit retirement plan and contribution is made to the Life Insurance Corporation of India.
The liability or asset recognised in the balance sheet in respect of defined benefit gratuity plans is the present value of the defined benefit obligation at the end of the reporting period less the fair value of plan assets. The defined benefit obligation is calculated annually by actuaries using the projected unit credit method.
The present value of the defined benefit obligation is determined by discounting the estimated future cash outflows by reference to market yields at the end of the reporting period on government bonds that have terms approximating to the terms of the related obligation.
The net interest cost is calculated by applying the discount rate to the net balance of the defined benefit obligation and the fair value of plan assets. This cost is included in employee benefit expense in the statement of profit and loss.
Re-measurement gains and losses arising from experience adjustments and changes in actuarial assumptions are recognised in the period in which they occur, directly in other comprehensive income. They are included in retained earnings in the statement of changes in equity and in the balance sheet.
Changes in the present value of the defined benefit obligation resulting from plan amendments or curtailments are recognised immediately in profit or loss as past service cost.
Leave encashment on termination of service – The liabilities for earned leave are expected to be settled after the retirement of employee. They are therefore measured
as the present value of expected future payments to be made in respect of services provided by employees up to the end of the reporting period using the projected unit credit method. The benefits are discounted using the market yields at the end of the reporting period that have terms approximating to the terms of the related obligation. Re-measurements as a result of experience adjustments and changes in actuarial assumptions are recognised in other comprehensive income.
The obligations are presented as current liabilities in the balance sheet if the entity does not have an unconditional right to defer settlement for at least twelve months after the reporting period, regardless of when the actual settlement is expected to occur.
Provident Fund – The company pays provident fund contributions to a fund administered by Government Provident Fund Authority.
The Company has no further payment obligations once the contributions have been paid. The contributions are accounted for as defined contribution plans and the contributions are recognised as employee benefit expense when they are due. Prepaid contributions are recognised as an asset to the extent that a cash refund or a reduction in the future payments is available.
s) DIVIDENDS Liability is created for the amount of any dividend declared, being appropriately authorised and no longer at the discretion of
the entity.
t) EARNINGS PER SHARE
(i) Basic earnings per share
Basic earnings per share is calculated by dividing: – the profit attributable to equity shareholders of the company – by the weighted average number of equity shares outstanding during the financial year,
(ii) Diluted earnings per share
Diluted earnings per share adjusts the number of equity shares used in the determination of basic earnings per share to take into account:
– the after income tax effect of interest and other financing costs associated with dilutive potential equity shares, and
– the weighted average number of equity shares including additional equity shares that would have been outstanding assuming the conversion of all dilutive potential equity shares happened.
Notes to Accounts — Contd.
109
u) GOVERNMENT GRANTS/INCENTIVES Government grants/ incentives that the Company is entitled to on fulfillment of certain conditions, but are available to the company
only on completion of some other conditions, are recognized as income at fair value on completion of such other conditions
Grants/incentives that the company is entitled to unconditionally on fulfillment of certain conditions, such grants/incentives are recognized at fair value as income when there is reasonable assurance that the grant/incentives will be received.
v) INVESTMENT IN SUBSIDIARIES, JOINT VENTURES AND ASSOCIATES
(i) Investment in Subsidiaries: A subsidiary is an entity controlled by the Company. Control exists when the Company has power over the entity, is exposed, or has rights to variable returns from its involvement with the entity and has the ability to affect those returns by using its power over entity.
Power is demonstrated through existing rights that give the ability to direct relevant activities, those which significantly affect the entity’s returns.
Investments in subsidiaries are carried at cost. The cost comprises price paid to acquire investment and directly attributable cost.
Transition to Ind AS
On transition to Ind AS, the company has elected to continue with the carrying value of all of its Investment in subsidiaries recognised as at 1 April 2015 measured as per the previous GAAP and use that carrying value as the deemed cost of the Investment in subsidiaries.
ii) Investment in joint ventures and associates: A joint venture is a type of joint arrangement whereby the parties that have joint control of the arrangement have rights to the net assets of the joint venture. Joint control is the contractually agreed sharing of control of an arrangement, which exists only when decisions about the relevant activities require unanimous consent of the parties sharing control.
The investment in joint ventures and associates are carried at cost. The cost comprises price paid to acquire investment and directly attributable cost.
Transition to Ind AS
On transition to Ind AS, the company has elected to continue with the carrying value of all of its Investment in joint ventures and associates recognised as at 1 April 2015 measured as per the previous GAAP and use that carrying value as the deemed cost of the Investment in joint ventures and associates.
w) ROUNDING OF AMOUNTS
All amounts disclosed in the financial statements and notes have been rounded off to the nearest million with two decimals as per the requirement of Schedule III, unless otherwise stated.
Notes to Accounts — Contd.
110
Notes to Accounts — Contd.
2 NEW STANDARDS/AMENDMENTS THAT ARE NOT YET EFFECTIVE AND HAVE NOT BEEN EARLY ADOPTED: As set out below, amendments to standards are effective for annual periods beginning on or after April 1, 2017, and have not
been applied in preparing these financial statements. None of these is expected to have a significant effect on the financial statements of the Company:
Amendments to Ind AS 102, Share-based Payment The amendment to Ind AS 102 clarifies the measurement basis for cash-settled share-based payments and the accounting for
modifications that change an award from cash-settled to equity-settled.
Since the Company does not have any share based plan outstanding at the reporting date, the abovementioned amendment will not have any impact on the financial statements of the Company. The amendment is effective for accounting periods beginning on or after April 1, 2017 and early adoption of the same is not permitted.
Amendments to Ind AS 7, Cash Flow Statements The amendment to Ind AS 7 introduces an additional disclosure that will enable users of financial statements to evaluate changes
in liabilities arising from financing activities.
The said amendment will not have any impact on the Company’s cash flow. The amendment is effective for accounting periods beginning on or after April 1, 2017 and early adoption of the same is not permitted.
3 SIGNIFICANT ESTIMATES AND JUDGEMENTS The preparation of financial statements requires the use of accounting estimates which, by definition, will seldom equal the
actual results. Management also needs to exercise judgement in applying the company’s accounting policies.
This note provides information about the areas that involved a higher degree of judgement or complexity, and of items which are more likely to be materially adjusted due to estimates and assumptions turning out to be different than those originally assessed.
Estimates and judgements are continually evaluated. They are based on historical experience and other factors, including expectations of future events that may have a financial impact on the company and that are believed to be reasonable under the circumstances.
i) Useful life of the Hotel Building The Company has adopted useful life of fixed assets as stipulated by Schedule II to the Companies Act, 2013 except
for the hotel buildings for computing depreciation. In the case of the hotel building of the Company, due to superior structural condition, management decided to assess the balance useful life by independent technical expert. As per the certificates of the technical expert, the balance useful life of the hotel buildings ranges between 30 years and 60 years with effect from 31st March, 2015 and are higher than those specified by Schedule II to the Companies Act, 2013. The carrying amount of the hotel building is being depreciated over its residual life.
ii) Advance towards Equity Shares In the case of Mashobra Resort Limited (“MRL”), several disputes with the Government of Himachal Pradesh, the
joint venture partner, were referred by the High Court of Himachal Pradesh on 17th December, 2003 to an arbitral tribunal consisting of a single arbitrator whose award has been challenged by both the Company and MRL, amongst others. The operation of the arbitration award was stayed pending substantive hearing of the applications by the High Court. Consequently, the status quo ante of the entire matter was restored to the position as on 17th December, 2003 and the hotel is being operated by MRL accordingly. The Company vide its letter dated 4th April, 2012 requested MRL to account for the entire amount of INR 1,361.93 Million provided to MRL upto 31st March, 2012 as ‘Advance Towards Equity’, including INR 130.00 Million being the opening balance of ‘Advance Towards Equity’. In view of the above, the Company has shown the said amount of INR 1,361.93 Million as ‘Advance Towards Equity’ in its books.
The High Court passed an order dated 25th February, 2016 which was made available to the Company in the month of May 2016. The Court has decided not to interfere with the order of the Arbitrator. The Company amongst others, preferred an appeal before the Division Bench of the High Court of Himachal Pradesh. By an order dated 27th June, 2016 the Division Bench stayed the Single Judge Order dated 25th February, 2016 and directed the parties to maintain status quo till the matter is finally heard and disposed off. Final hearing is yet to commence.
iii) Recognition of Revenue (customer loyalty programs) The company is running certain customer loyalty programs for which revenue is being deferred on the basis of total
loyalty points/complimentary nights outstanding. As required by Ind AS 18, while calculating fair value of the loyalty points/complimentary nights, expected lapses are also considered by the company (loyalty points/complimentary nights which will not be redeemed by the customers). On the basis of past trend, a significant portion of the loyalty points/ complimentary nights has been estimated to be lapsed. Estimated lapse ratio is periodically evaluated by the company and in case there is any change in the trend, the deferred revenue is adjusted accordingly. The fair value of loyalty points/ complimentary nights is calculated on the basis of relative benefit passed on to the customers.
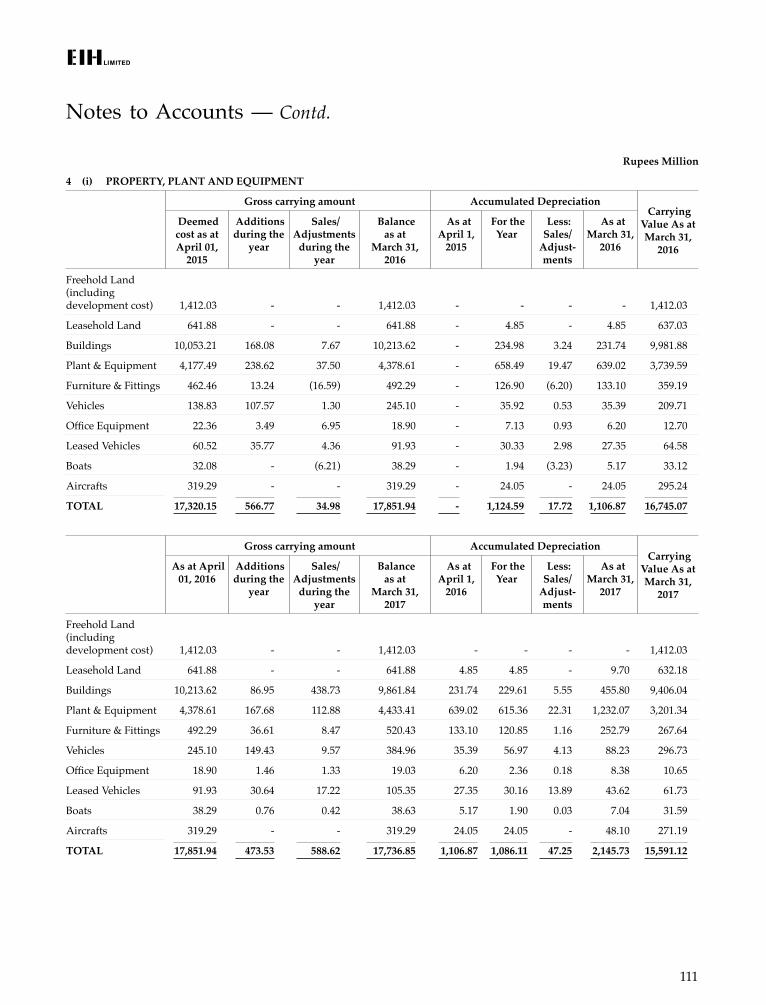
111
Notes to Accounts — Contd.
Rupees Million
4 (i) PROPERTY, PLANT AND EQUIPMENT
Gross carrying amount Accumulated Depreciation Carrying
Value As at March 31,
2016
Deemed cost as at April 01,
2015
Additions during the
year
Sales/ Adjustments
during the year
Balance as at
March 31, 2016
As at April 1,
2015
For the Year
Less: Sales/
Adjust-ments
As at March 31,
2016
Freehold Land (including development cost) 1,412.03 - - 1,412.03 - - - - 1,412.03
Leasehold Land 641.88 - - 641.88 - 4.85 - 4.85 637.03
Buildings 10,053.21 168.08 7.67 10,213.62 - 234.98 3.24 231.74 9,981.88
Plant & Equipment 4,177.49 238.62 37.50 4,378.61 - 658.49 19.47 639.02 3,739.59
Furniture & Fittings 462.46 13.24 (16.59) 492.29 - 126.90 (6.20) 133.10 359.19
Vehicles 138.83 107.57 1.30 245.10 - 35.92 0.53 35.39 209.71
Office Equipment 22.36 3.49 6.95 18.90 - 7.13 0.93 6.20 12.70
Leased Vehicles 60.52 35.77 4.36 91.93 - 30.33 2.98 27.35 64.58
Boats 32.08 - (6.21) 38.29 - 1.94 (3.23) 5.17 33.12
Aircrafts 319.29 - - 319.29 - 24.05 - 24.05 295.24
TOTAL 17,320.15 566.77 34.98 17,851.94 - 1,124.59 17.72 1,106.87 16,745.07
Gross carrying amount Accumulated Depreciation Carrying
Value As at March 31,
2017
As at April 01, 2016
Additions during the
year
Sales/ Adjustments
during the year
Balance as at
March 31, 2017
As at April 1,
2016
For the Year
Less: Sales/
Adjust-ments
As at March 31,
2017
Freehold Land (including development cost) 1,412.03 - - 1,412.03 - - - - 1,412.03
Leasehold Land 641.88 - - 641.88 4.85 4.85 - 9.70 632.18
Buildings 10,213.62 86.95 438.73 9,861.84 231.74 229.61 5.55 455.80 9,406.04
Plant & Equipment 4,378.61 167.68 112.88 4,433.41 639.02 615.36 22.31 1,232.07 3,201.34
Furniture & Fittings 492.29 36.61 8.47 520.43 133.10 120.85 1.16 252.79 267.64
Vehicles 245.10 149.43 9.57 384.96 35.39 56.97 4.13 88.23 296.73
Office Equipment 18.90 1.46 1.33 19.03 6.20 2.36 0.18 8.38 10.65
Leased Vehicles 91.93 30.64 17.22 105.35 27.35 30.16 13.89 43.62 61.73
Boats 38.29 0.76 0.42 38.63 5.17 1.90 0.03 7.04 31.59
Aircrafts 319.29 - - 319.29 24.05 24.05 - 48.10 271.19
TOTAL 17,851.94 473.53 588.62 17,736.85 1,106.87 1,086.11 47.25 2,145.73 15,591.12
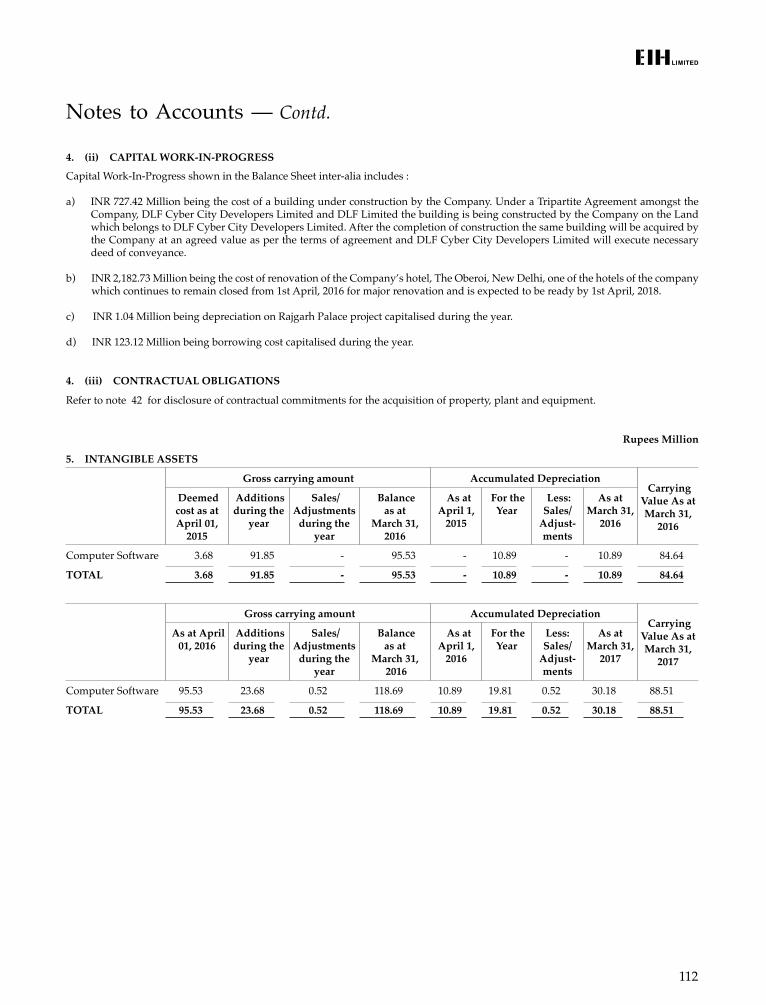
112
4. (ii) CAPITAL WORK-IN-PROGRESS
Capital Work-In-Progress shown in the Balance Sheet inter-alia includes :
a) INR 727.42 Million being the cost of a building under construction by the Company. Under a Tripartite Agreement amongst the Company, DLF Cyber City Developers Limited and DLF Limited the building is being constructed by the Company on the Land which belongs to DLF Cyber City Developers Limited. After the completion of construction the same building will be acquired by the Company at an agreed value as per the terms of agreement and DLF Cyber City Developers Limited will execute necessary deed of conveyance.
b) INR 2,182.73 Million being the cost of renovation of the Company’s hotel, The Oberoi, New Delhi, one of the hotels of the company which continues to remain closed from 1st April, 2016 for major renovation and is expected to be ready by 1st April, 2018.
c) INR 1.04 Million being depreciation on Rajgarh Palace project capitalised during the year.
d) INR 123.12 Million being borrowing cost capitalised during the year.
4. (iii) CONTRACTUAL OBLIGATIONS
Refer to note 42 for disclosure of contractual commitments for the acquisition of property, plant and equipment.
Rupees Million
5. INTANGIBLE ASSETS
Gross carrying amount Accumulated Depreciation Carrying
Value As at March 31,
2016
Deemed cost as at April 01,
2015
Additions during the
year
Sales/ Adjustments
during the year
Balance as at
March 31, 2016
As at April 1,
2015
For the Year
Less: Sales/
Adjust-ments
As at March 31,
2016
Computer Software 3.68 91.85 - 95.53 - 10.89 - 10.89 84.64
TOTAL 3.68 91.85 - 95.53 - 10.89 - 10.89 84.64
Gross carrying amount Accumulated Depreciation Carrying
Value As at March 31,
2017
As at April 01, 2016
Additions during the
year
Sales/ Adjustments
during the year
Balance as at
March 31, 2016
As at April 1,
2016
For the Year
Less: Sales/
Adjust-ments
As at March 31,
2017
Computer Software 95.53 23.68 0.52 118.69 10.89 19.81 0.52 30.18 88.51
TOTAL 95.53 23.68 0.52 118.69 10.89 19.81 0.52 30.18 88.51
Notes to Accounts — Contd.
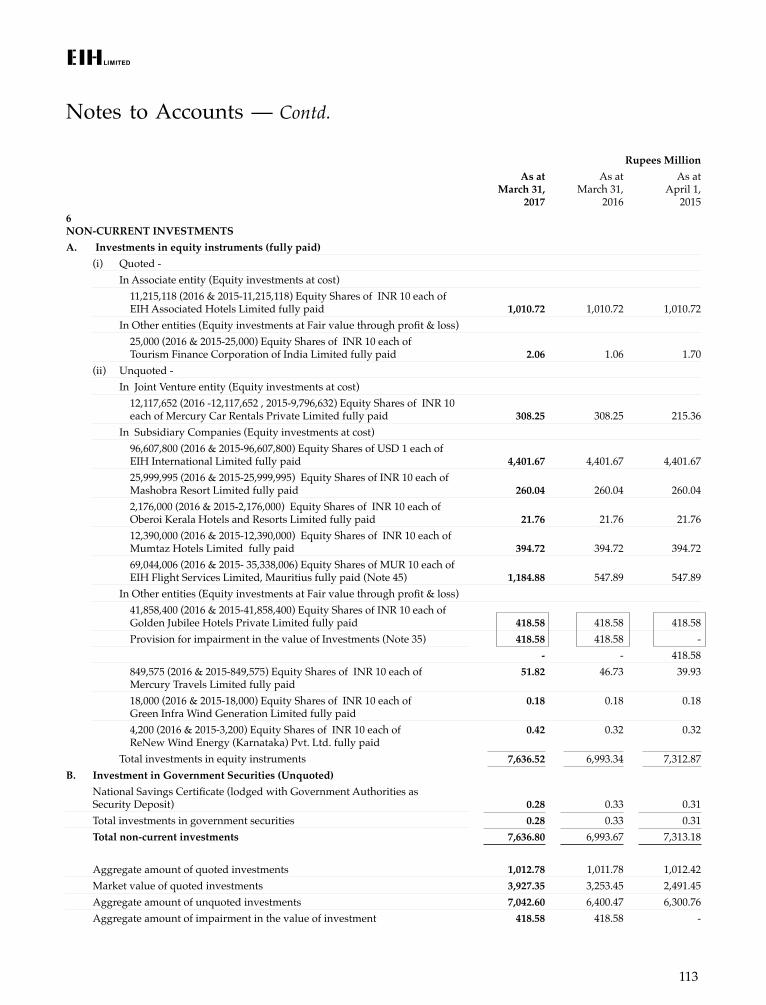
113
Rupees MillionAs at
March 31, 2017
As at March 31,
2016
As at April 1,
20156NON-CURRENT INVESTMENTSA. Investments in equity instruments (fully paid)
(i) Quoted -In Associate entity (Equity investments at cost) 11,215,118 (2016 & 2015-11,215,118) Equity Shares of INR 10 each of EIH Associated Hotels Limited fully paid 1,010.72 1,010.72 1,010.72 In Other entities (Equity investments at Fair value through profit & loss) 25,000 (2016 & 2015-25,000) Equity Shares of INR 10 each of Tourism Finance Corporation of India Limited fully paid 2.06 1.06 1.70
(ii) Unquoted -In Joint Venture entity (Equity investments at cost) 12,117,652 (2016 -12,117,652 , 2015-9,796,632) Equity Shares of INR 10
each of Mercury Car Rentals Private Limited fully paid 308.25 308.25 215.36 In Subsidiary Companies (Equity investments at cost) 96,607,800 (2016 & 2015-96,607,800) Equity Shares of USD 1 each of
EIH International Limited fully paid 4,401.67 4,401.67 4,401.67 25,999,995 (2016 & 2015-25,999,995) Equity Shares of INR 10 each of
Mashobra Resort Limited fully paid 260.04 260.04 260.04 2,176,000 (2016 & 2015-2,176,000) Equity Shares of INR 10 each of
Oberoi Kerala Hotels and Resorts Limited fully paid 21.76 21.76 21.76 12,390,000 (2016 & 2015-12,390,000) Equity Shares of INR 10 each of
Mumtaz Hotels Limited fully paid 394.72 394.72 394.72 69,044,006 (2016 & 2015- 35,338,006) Equity Shares of MUR 10 each of
EIH Flight Services Limited, Mauritius fully paid (Note 45) 1,184.88 547.89 547.89 In Other entities (Equity investments at Fair value through profit & loss) 41,858,400 (2016 & 2015-41,858,400) Equity Shares of INR 10 each of
Golden Jubilee Hotels Private Limited fully paid 418.58 418.58 418.58 Provision for impairment in the value of Investments (Note 35) 418.58 418.58 -
- - 418.58 849,575 (2016 & 2015-849,575) Equity Shares of INR 10 each of
Mercury Travels Limited fully paid 51.82 46.73 39.93
18,000 (2016 & 2015-18,000) Equity Shares of INR 10 each of Green Infra Wind Generation Limited fully paid
0.18 0.18 0.18
4,200 (2016 & 2015-3,200) Equity Shares of INR 10 each of ReNew Wind Energy (Karnataka) Pvt. Ltd. fully paid
0.42 0.32 0.32
Total investments in equity instruments 7,636.52 6,993.34 7,312.87 B. Investment in Government Securities (Unquoted)
National Savings Certificate (lodged with Government Authorities as Security Deposit) 0.28 0.33 0.31 Total investments in government securities 0.28 0.33 0.31 Total non-current investments 7,636.80 6,993.67 7,313.18
Aggregate amount of quoted investments 1,012.78 1,011.78 1,012.42 Market value of quoted investments 3,927.35 3,253.45 2,491.45 Aggregate amount of unquoted investments 7,042.60 6,400.47 6,300.76 Aggregate amount of impairment in the value of investment 418.58 418.58 -
Notes to Accounts — Contd.
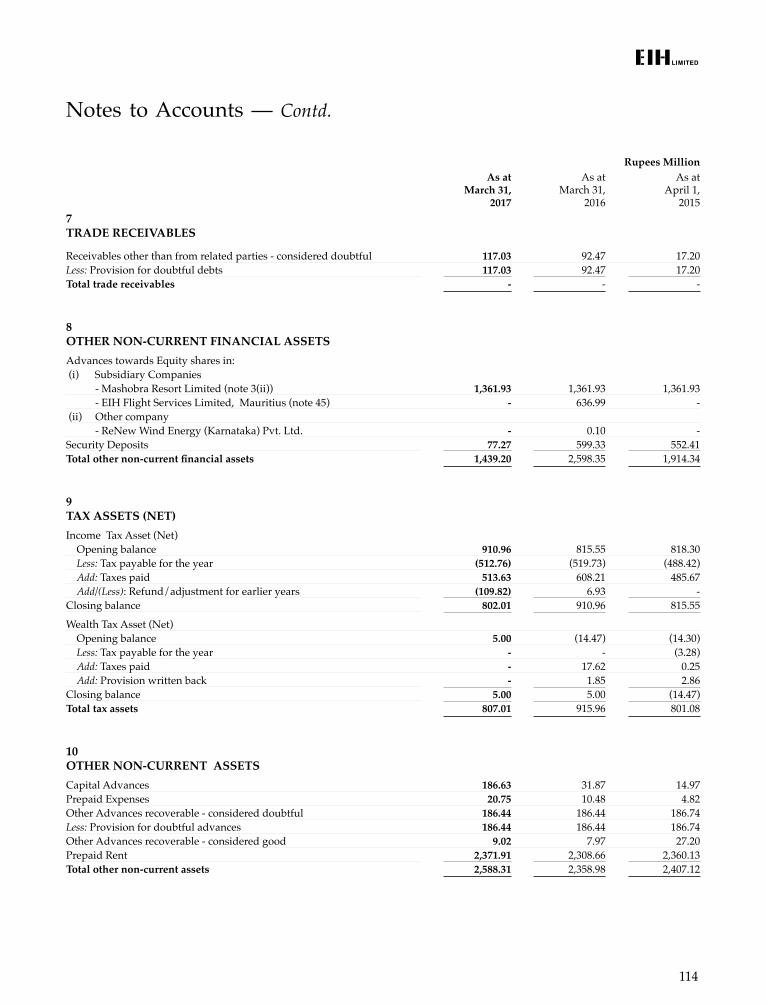
114
Notes to Accounts — Contd.
Rupees MillionAs at
March 31, 2017
As at March 31,
2016
As at April 1,
20157 TRADE RECEIVABLES
Receivables other than from related parties - considered doubtful 117.03 92.47 17.20 Less: Provision for doubtful debts 117.03 92.47 17.20 Total trade receivables - - -
8 OTHER NON-CURRENT FINANCIAL ASSETSAdvances towards Equity shares in: (i) Subsidiary Companies - Mashobra Resort Limited (note 3(ii)) 1,361.93 1,361.93 1,361.93 - EIH Flight Services Limited, Mauritius (note 45) - 636.99 - (ii) Other company - ReNew Wind Energy (Karnataka) Pvt. Ltd. - 0.10 - Security Deposits 77.27 599.33 552.41 Total other non-current financial assets 1,439.20 2,598.35 1,914.34
9 TAX ASSETS (NET)Income Tax Asset (Net) Opening balance 910.96 815.55 818.30 Less: Tax payable for the year (512.76) (519.73) (488.42) Add: Taxes paid 513.63 608.21 485.67 Add/(Less): Refund/adjustment for earlier years (109.82) 6.93 - Closing balance 802.01 910.96 815.55
Wealth Tax Asset (Net) Opening balance 5.00 (14.47) (14.30) Less: Tax payable for the year - - (3.28) Add: Taxes paid - 17.62 0.25 Add: Provision written back - 1.85 2.86 Closing balance 5.00 5.00 (14.47)Total tax assets 807.01 915.96 801.08
10 OTHER NON-CURRENT ASSETSCapital Advances 186.63 31.87 14.97 Prepaid Expenses 20.75 10.48 4.82 Other Advances recoverable - considered doubtful 186.44 186.44 186.74 Less: Provision for doubtful advances 186.44 186.44 186.74 Other Advances recoverable - considered good 9.02 7.97 27.20 Prepaid Rent 2,371.91 2,308.66 2,360.13 Total other non-current assets 2,588.31 2,358.98 2,407.12
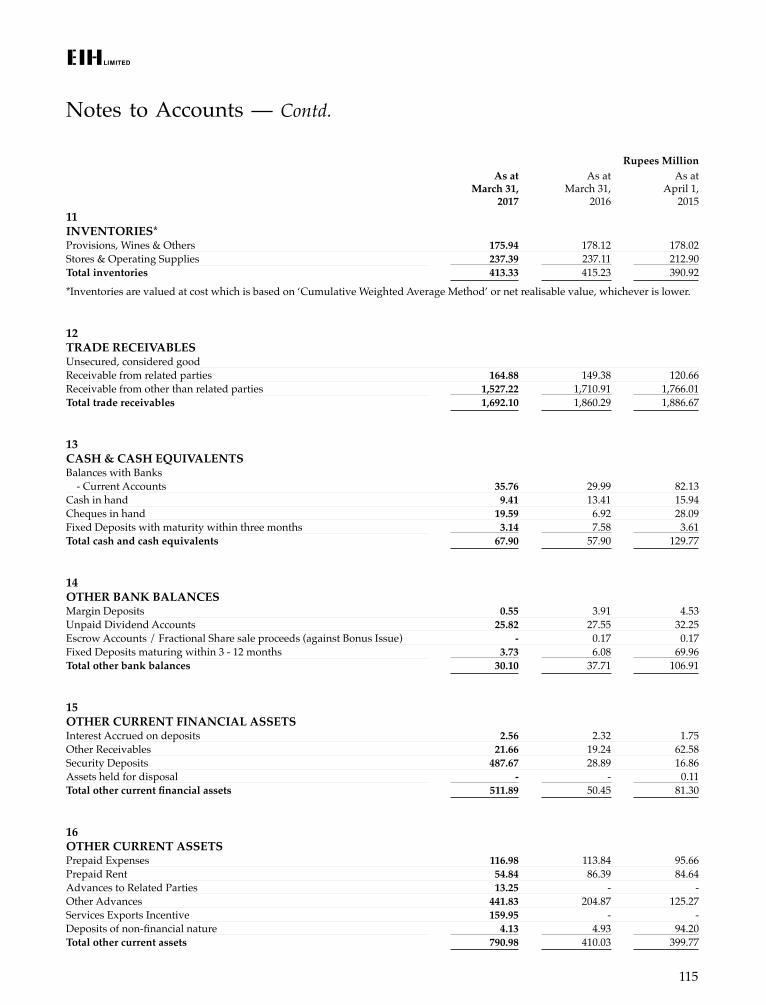
115
Notes to Accounts — Contd.
Rupees MillionAs at
March 31, 2017
As at March 31,
2016
As at April 1,
201511 INVENTORIES*Provisions, Wines & Others 175.94 178.12 178.02 Stores & Operating Supplies 237.39 237.11 212.90 Total inventories 413.33 415.23 390.92
*Inventories are valued at cost which is based on ‘Cumulative Weighted Average Method’ or net realisable value, whichever is lower.
12 TRADE RECEIVABLES Unsecured, considered goodReceivable from related parties 164.88 149.38 120.66 Receivable from other than related parties 1,527.22 1,710.91 1,766.01 Total trade receivables 1,692.10 1,860.29 1,886.67
13 CASH & CASH EQUIVALENTSBalances with Banks - Current Accounts 35.76 29.99 82.13 Cash in hand 9.41 13.41 15.94 Cheques in hand 19.59 6.92 28.09 Fixed Deposits with maturity within three months 3.14 7.58 3.61 Total cash and cash equivalents 67.90 57.90 129.77
14 OTHER BANK BALANCESMargin Deposits 0.55 3.91 4.53 Unpaid Dividend Accounts 25.82 27.55 32.25 Escrow Accounts / Fractional Share sale proceeds (against Bonus Issue) - 0.17 0.17 Fixed Deposits maturing within 3 - 12 months 3.73 6.08 69.96 Total other bank balances 30.10 37.71 106.91
15 OTHER CURRENT FINANCIAL ASSETSInterest Accrued on deposits 2.56 2.32 1.75 Other Receivables 21.66 19.24 62.58 Security Deposits 487.67 28.89 16.86 Assets held for disposal - - 0.11 Total other current financial assets 511.89 50.45 81.30
16 OTHER CURRENT ASSETSPrepaid Expenses 116.98 113.84 95.66 Prepaid Rent 54.84 86.39 84.64 Advances to Related Parties 13.25 - - Other Advances 441.83 204.87 125.27 Services Exports Incentive 159.95 - - Deposits of non-financial nature 4.13 4.93 94.20 Total other current assets 790.98 410.03 399.77
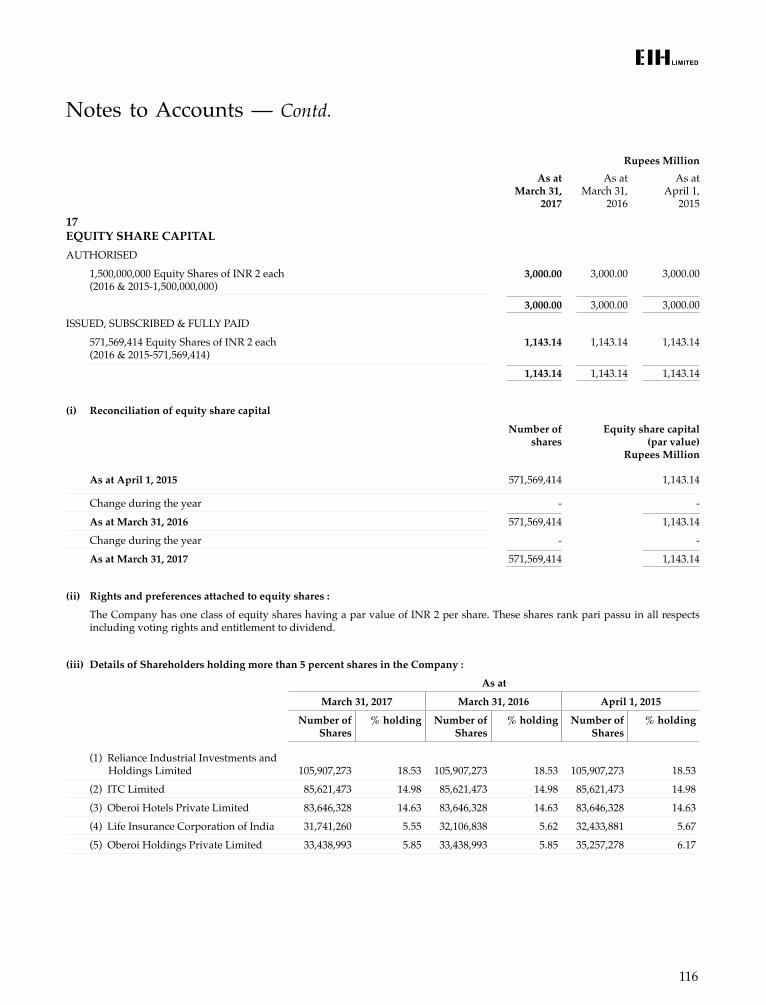
116
Rupees MillionAs at
March 31, 2017
As at March 31,
2016
As at April 1,
2015
17 EQUITY SHARE CAPITALAUTHORISED
1,500,000,000 Equity Shares of INR 2 each (2016 & 2015-1,500,000,000)
3,000.00 3,000.00 3,000.00
3,000.00 3,000.00 3,000.00
ISSUED, SUBSCRIBED & FULLY PAID
571,569,414 Equity Shares of INR 2 each (2016 & 2015-571,569,414)
1,143.14 1,143.14 1,143.14
1,143.14 1,143.14 1,143.14
(i) Reconciliation of equity share capital
Number of shares
Equity share capital (par value)
Rupees Million
As at April 1, 2015 571,569,414 1,143.14
Change during the year - -
As at March 31, 2016 571,569,414 1,143.14
Change during the year - -
As at March 31, 2017 571,569,414 1,143.14
(ii) Rights and preferences attached to equity shares :
The Company has one class of equity shares having a par value of INR 2 per share. These shares rank pari passu in all respects including voting rights and entitlement to dividend.
(iii) Details of Shareholders holding more than 5 percent shares in the Company :
As at
March 31, 2017 March 31, 2016 April 1, 2015
Number of Shares
% holding Number of Shares
% holding Number of Shares
% holding
(1) Reliance Industrial Investments and Holdings Limited 105,907,273 18.53 105,907,273 18.53 105,907,273 18.53
(2) ITC Limited 85,621,473 14.98 85,621,473 14.98 85,621,473 14.98
(3) Oberoi Hotels Private Limited 83,646,328 14.63 83,646,328 14.63 83,646,328 14.63
(4) Life Insurance Corporation of India 31,741,260 5.55 32,106,838 5.62 32,433,881 5.67
(5) Oberoi Holdings Private Limited 33,438,993 5.85 33,438,993 5.85 35,257,278 6.17
Notes to Accounts — Contd.
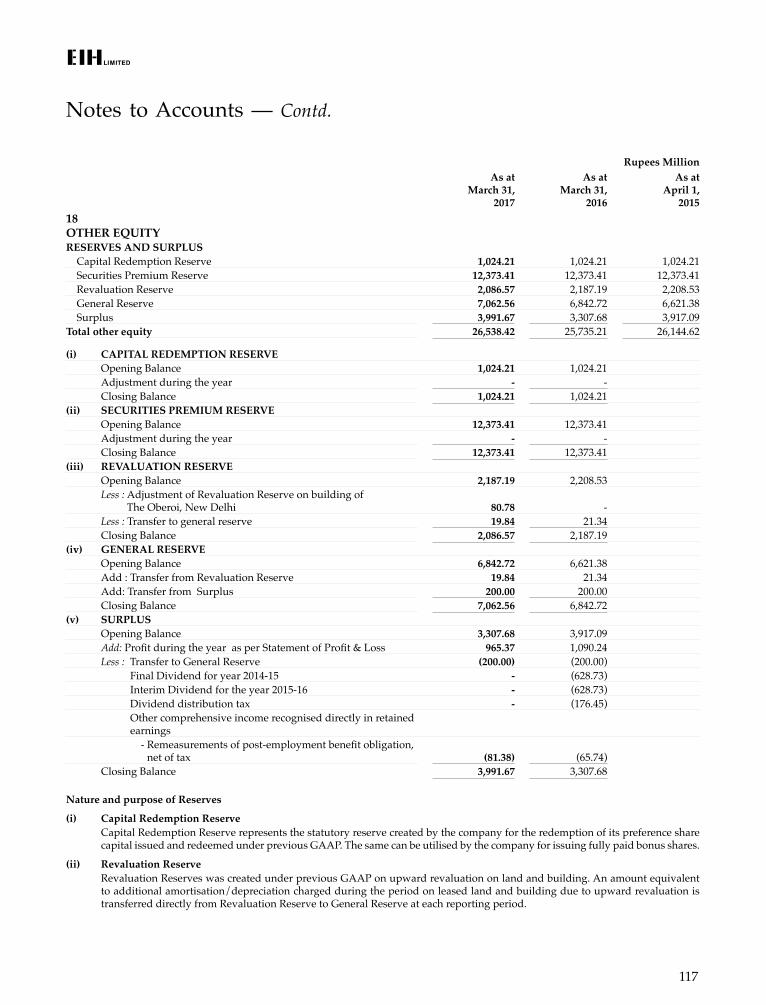
117
Rupees MillionAs at
March 31, 2017
As at March 31,
2016
As at April 1,
201518 OTHER EQUITYRESERVES AND SURPLUS Capital Redemption Reserve 1,024.21 1,024.21 1,024.21 Securities Premium Reserve 12,373.41 12,373.41 12,373.41 Revaluation Reserve 2,086.57 2,187.19 2,208.53 General Reserve 7,062.56 6,842.72 6,621.38 Surplus 3,991.67 3,307.68 3,917.09 Total other equity 26,538.42 25,735.21 26,144.62
(i) CAPITAL REDEMPTION RESERVEOpening Balance 1,024.21 1,024.21 Adjustment during the year - - Closing Balance 1,024.21 1,024.21
(ii) SECURITIES PREMIUM RESERVEOpening Balance 12,373.41 12,373.41 Adjustment during the year - - Closing Balance 12,373.41 12,373.41
(iii) REVALUATION RESERVE Opening Balance 2,187.19 2,208.53 Less : Adjustment of Revaluation Reserve on building of
The Oberoi, New Delhi 80.78 - Less : Transfer to general reserve 19.84 21.34 Closing Balance 2,086.57 2,187.19
(iv) GENERAL RESERVEOpening Balance 6,842.72 6,621.38 Add : Transfer from Revaluation Reserve 19.84 21.34 Add: Transfer from Surplus 200.00 200.00 Closing Balance 7,062.56 6,842.72
(v) SURPLUSOpening Balance 3,307.68 3,917.09 Add: Profit during the year as per Statement of Profit & Loss 965.37 1,090.24 Less : Transfer to General Reserve (200.00) (200.00) Final Dividend for year 2014-15 - (628.73) Interim Dividend for the year 2015-16 - (628.73) Dividend distribution tax - (176.45) Other comprehensive income recognised directly in retained
earnings - Remeasurements of post-employment benefit obligation,
net of tax (81.38) (65.74)Closing Balance 3,991.67 3,307.68
Nature and purpose of Reserves
(i) Capital Redemption ReserveCapital Redemption Reserve represents the statutory reserve created by the company for the redemption of its preference share capital issued and redeemed under previous GAAP. The same can be utilised by the company for issuing fully paid bonus shares.
(ii) Revaluation ReserveRevaluation Reserves was created under previous GAAP on upward revaluation on land and building. An amount equivalent to additional amortisation/depreciation charged during the period on leased land and building due to upward revaluation is transferred directly from Revaluation Reserve to General Reserve at each reporting period.
Notes to Accounts — Contd.
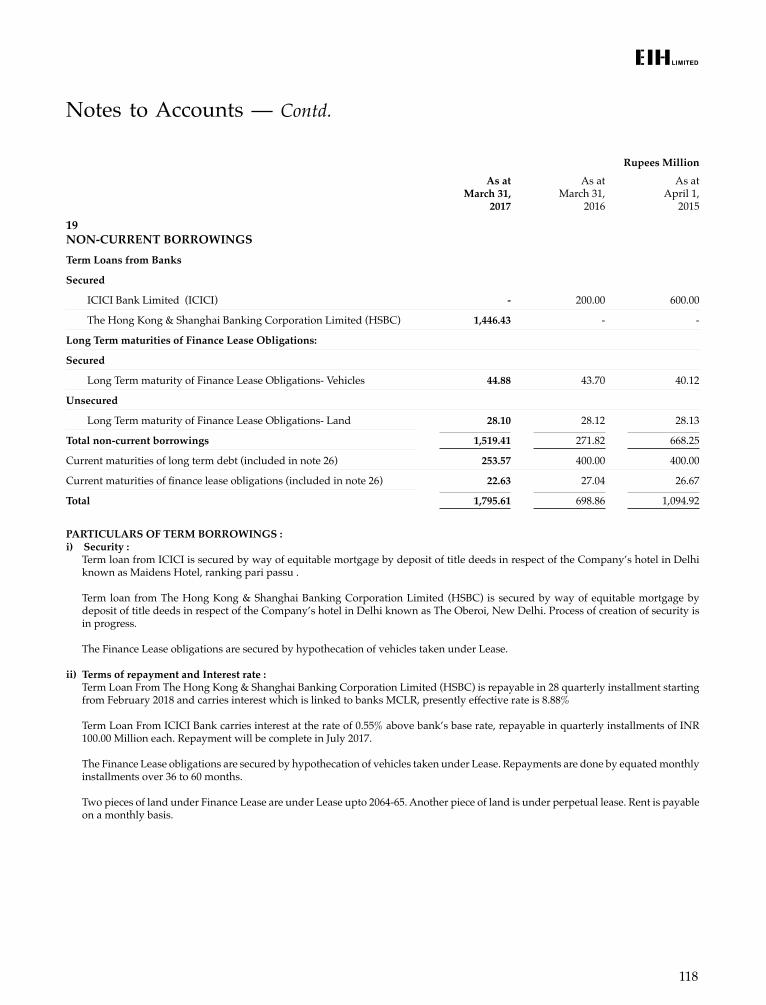
118
Rupees MillionAs at
March 31, 2017
As at March 31,
2016
As at April 1,
2015
19 NON-CURRENT BORROWINGS Term Loans from Banks
Secured
ICICI Bank Limited (ICICI) - 200.00 600.00
The Hong Kong & Shanghai Banking Corporation Limited (HSBC) 1,446.43 - -
Long Term maturities of Finance Lease Obligations:
Secured
Long Term maturity of Finance Lease Obligations- Vehicles 44.88 43.70 40.12
Unsecured
Long Term maturity of Finance Lease Obligations- Land 28.10 28.12 28.13
Total non-current borrowings 1,519.41 271.82 668.25
Current maturities of long term debt (included in note 26) 253.57 400.00 400.00
Current maturities of finance lease obligations (included in note 26) 22.63 27.04 26.67
Total 1,795.61 698.86 1,094.92
PARTICULARS OF TERM BORROWINGS :i) Security : Term loan from ICICI is secured by way of equitable mortgage by deposit of title deeds in respect of the Company’s hotel in Delhi
known as Maidens Hotel, ranking pari passu .
Term loan from The Hong Kong & Shanghai Banking Corporation Limited (HSBC) is secured by way of equitable mortgage by deposit of title deeds in respect of the Company’s hotel in Delhi known as The Oberoi, New Delhi. Process of creation of security is in progress.
The Finance Lease obligations are secured by hypothecation of vehicles taken under Lease.
ii) Terms of repayment and Interest rate : Term Loan From The Hong Kong & Shanghai Banking Corporation Limited (HSBC) is repayable in 28 quarterly installment starting
from February 2018 and carries interest which is linked to banks MCLR, presently effective rate is 8.88%
Term Loan From ICICI Bank carries interest at the rate of 0.55% above bank’s base rate, repayable in quarterly installments of INR 100.00 Million each. Repayment will be complete in July 2017.
The Finance Lease obligations are secured by hypothecation of vehicles taken under Lease. Repayments are done by equated monthly installments over 36 to 60 months.
Two pieces of land under Finance Lease are under Lease upto 2064-65. Another piece of land is under perpetual lease. Rent is payable on a monthly basis.
Notes to Accounts — Contd.
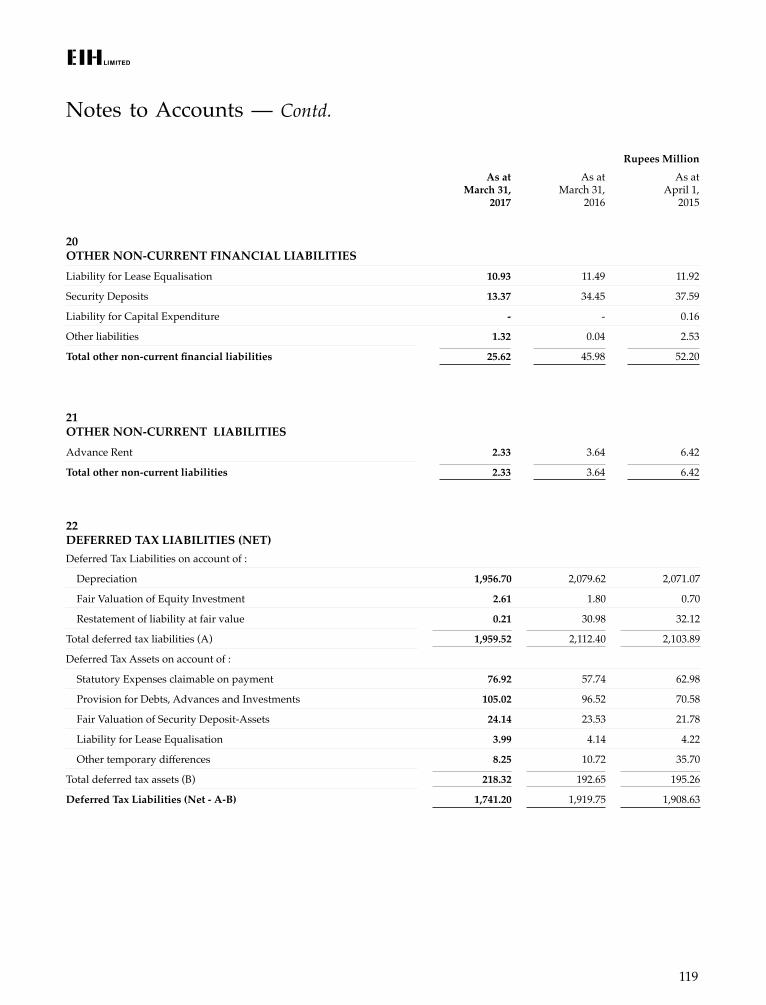
119
Notes to Accounts — Contd.
Rupees MillionAs at
March 31, 2017
As at March 31,
2016
As at April 1,
2015
20 OTHER NON-CURRENT FINANCIAL LIABILITIESLiability for Lease Equalisation 10.93 11.49 11.92
Security Deposits 13.37 34.45 37.59
Liability for Capital Expenditure - - 0.16
Other liabilities 1.32 0.04 2.53
Total other non-current financial liabilities 25.62 45.98 52.20
21 OTHER NON-CURRENT LIABILITIESAdvance Rent 2.33 3.64 6.42
Total other non-current liabilities 2.33 3.64 6.42
22 DEFERRED TAX LIABILITIES (NET) Deferred Tax Liabilities on account of :
Depreciation 1,956.70 2,079.62 2,071.07
Fair Valuation of Equity Investment 2.61 1.80 0.70
Restatement of liability at fair value 0.21 30.98 32.12
Total deferred tax liabilities (A) 1,959.52 2,112.40 2,103.89
Deferred Tax Assets on account of :
Statutory Expenses claimable on payment 76.92 57.74 62.98
Provision for Debts, Advances and Investments 105.02 96.52 70.58
Fair Valuation of Security Deposit-Assets 24.14 23.53 21.78
Liability for Lease Equalisation 3.99 4.14 4.22
Other temporary differences 8.25 10.72 35.70
Total deferred tax assets (B) 218.32 192.65 195.26
Deferred Tax Liabilities (Net - A-B) 1,741.20 1,919.75 1,908.63
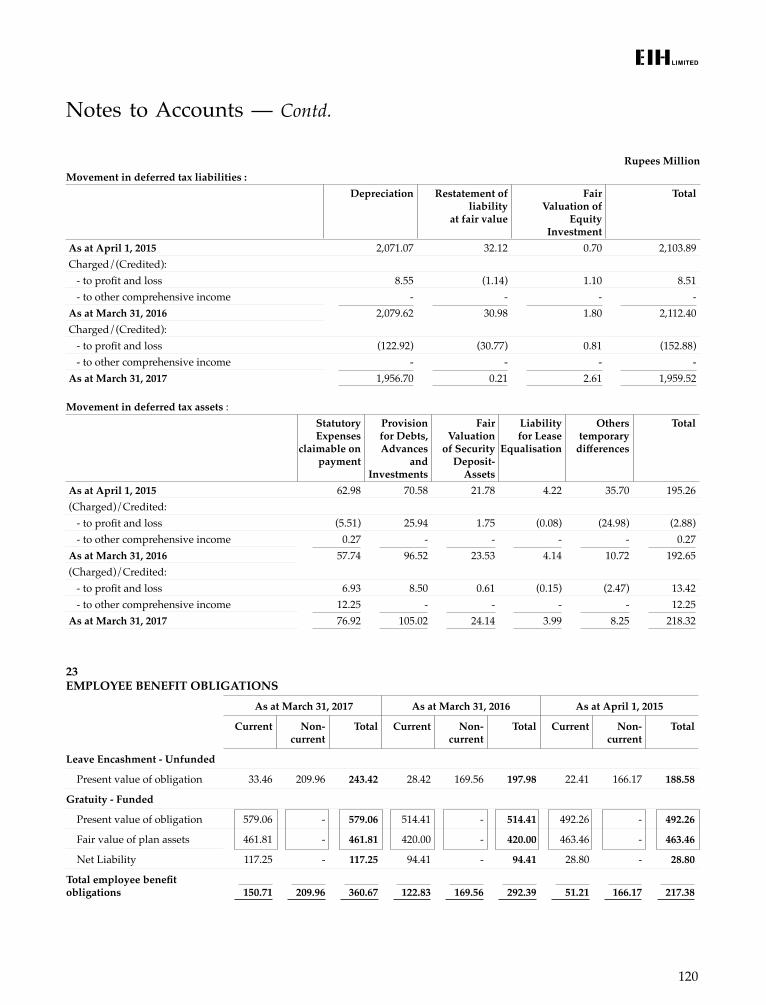
120
Notes to Accounts — Contd.
23 EMPLOYEE BENEFIT OBLIGATIONS
As at March 31, 2017 As at March 31, 2016 As at April 1, 2015
Current Non-current
Total Current Non- current
Total Current Non- current
Total
Leave Encashment - Unfunded
Present value of obligation 33.46 209.96 243.42 28.42 169.56 197.98 22.41 166.17 188.58
Gratuity - Funded
Present value of obligation 579.06 - 579.06 514.41 - 514.41 492.26 - 492.26
Fair value of plan assets 461.81 - 461.81 420.00 - 420.00 463.46 - 463.46
Net Liability 117.25 - 117.25 94.41 - 94.41 28.80 - 28.80
Total employee benefit obligations 150.71 209.96 360.67 122.83 169.56 292.39 51.21 166.17 217.38
Rupees MillionMovement in deferred tax liabilities :
Depreciation Restatement of liability
at fair value
Fair Valuation of
Equity Investment
Total
As at April 1, 2015 2,071.07 32.12 0.70 2,103.89 Charged/(Credited): - to profit and loss 8.55 (1.14) 1.10 8.51 - to other comprehensive income - - - - As at March 31, 2016 2,079.62 30.98 1.80 2,112.40 Charged/(Credited): - to profit and loss (122.92) (30.77) 0.81 (152.88) - to other comprehensive income - - - - As at March 31, 2017 1,956.70 0.21 2.61 1,959.52
Movement in deferred tax assets : Statutory Expenses
claimable on payment
Provision for Debts, Advances
and Investments
Fair Valuation
of Security Deposit-
Assets
Liability for Lease
Equalisation
Others temporary
differences
Total
As at April 1, 2015 62.98 70.58 21.78 4.22 35.70 195.26 (Charged)/Credited: - to profit and loss (5.51) 25.94 1.75 (0.08) (24.98) (2.88) - to other comprehensive income 0.27 - - - - 0.27 As at March 31, 2016 57.74 96.52 23.53 4.14 10.72 192.65 (Charged)/Credited: - to profit and loss 6.93 8.50 0.61 (0.15) (2.47) 13.42 - to other comprehensive income 12.25 - - - - 12.25 As at March 31, 2017 76.92 105.02 24.14 3.99 8.25 218.32
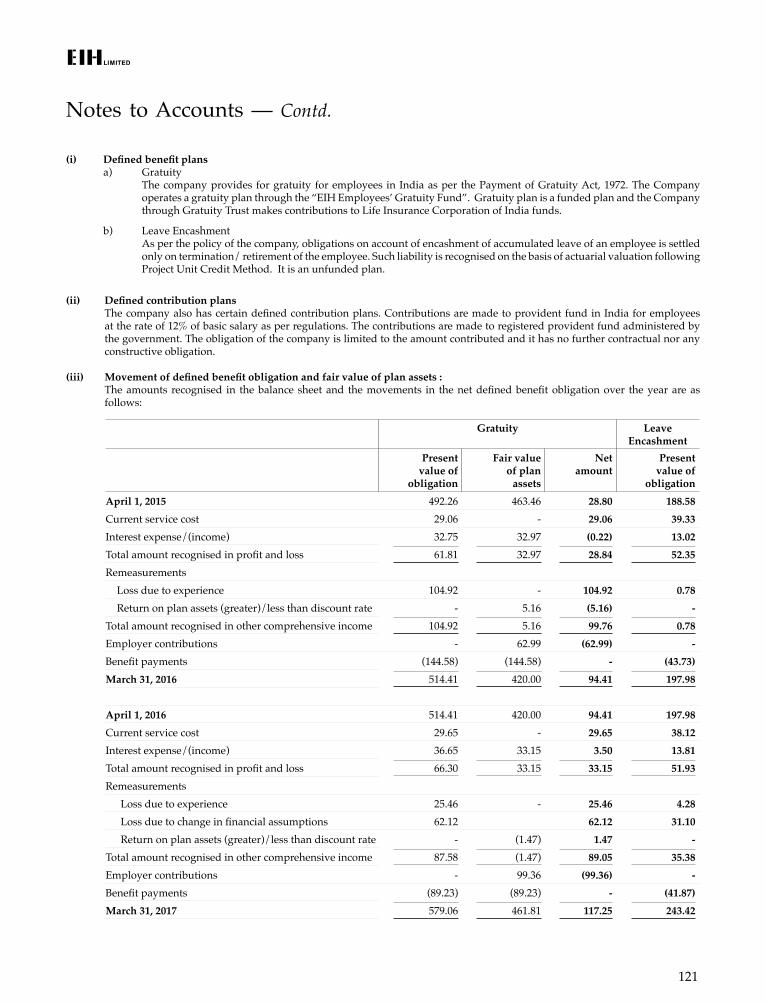
121
Notes to Accounts — Contd.
(i) Defined benefit plans a) Gratuity The company provides for gratuity for employees in India as per the Payment of Gratuity Act, 1972. The Company
operates a gratuity plan through the “EIH Employees’ Gratuity Fund”. Gratuity plan is a funded plan and the Company through Gratuity Trust makes contributions to Life Insurance Corporation of India funds.
b) Leave Encashment As per the policy of the company, obligations on account of encashment of accumulated leave of an employee is settled
only on termination/ retirement of the employee. Such liability is recognised on the basis of actuarial valuation following Project Unit Credit Method. It is an unfunded plan.
Gratuity Leave Encashment
Present value of
obligation
Fair value of plan
assets
Net amount
Present value of
obligation April 1, 2015 492.26 463.46 28.80 188.58 Current service cost 29.06 - 29.06 39.33 Interest expense/(income) 32.75 32.97 (0.22) 13.02 Total amount recognised in profit and loss 61.81 32.97 28.84 52.35 Remeasurements
Loss due to experience 104.92 - 104.92 0.78 Return on plan assets (greater)/less than discount rate - 5.16 (5.16) -
Total amount recognised in other comprehensive income 104.92 5.16 99.76 0.78 Employer contributions - 62.99 (62.99) - Benefit payments (144.58) (144.58) - (43.73)March 31, 2016 514.41 420.00 94.41 197.98
April 1, 2016 514.41 420.00 94.41 197.98 Current service cost 29.65 - 29.65 38.12 Interest expense/(income) 36.65 33.15 3.50 13.81 Total amount recognised in profit and loss 66.30 33.15 33.15 51.93 Remeasurements
Loss due to experience 25.46 - 25.46 4.28 Loss due to change in financial assumptions 62.12 62.12 31.10 Return on plan assets (greater)/less than discount rate - (1.47) 1.47 -
Total amount recognised in other comprehensive income 87.58 (1.47) 89.05 35.38 Employer contributions - 99.36 (99.36) - Benefit payments (89.23) (89.23) - (41.87)March 31, 2017 579.06 461.81 117.25 243.42
(ii) Defined contribution plans The company also has certain defined contribution plans. Contributions are made to provident fund in India for employees
at the rate of 12% of basic salary as per regulations. The contributions are made to registered provident fund administered by the government. The obligation of the company is limited to the amount contributed and it has no further contractual nor any constructive obligation.
(iii) Movement of defined benefit obligation and fair value of plan assets : The amounts recognised in the balance sheet and the movements in the net defined benefit obligation over the year are as
follows:
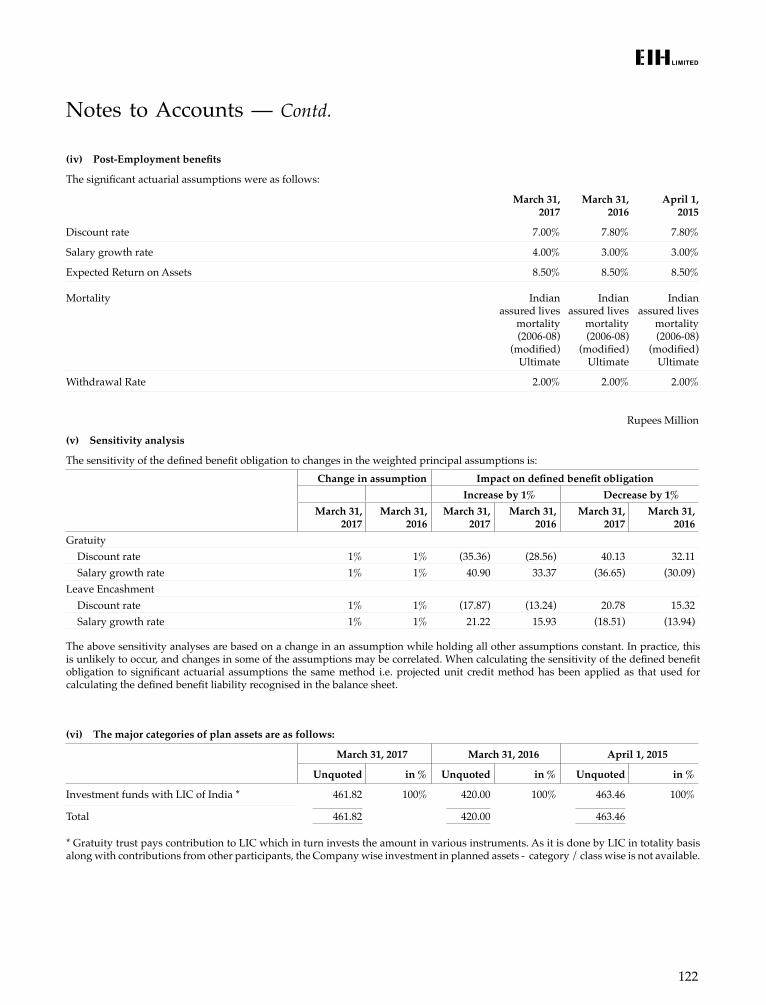
122
Notes to Accounts — Contd.
Rupees Million
(v) Sensitivity analysis
The sensitivity of the defined benefit obligation to changes in the weighted principal assumptions is: Change in assumption Impact on defined benefit obligation
Increase by 1% Decrease by 1% March 31,
2017 March 31,
2016 March 31,
2017 March 31,
2016 March 31,
2017March 31,
2016Gratuity
Discount rate 1% 1% (35.36) (28.56) 40.13 32.11 Salary growth rate 1% 1% 40.90 33.37 (36.65) (30.09)
Leave EncashmentDiscount rate 1% 1% (17.87) (13.24) 20.78 15.32 Salary growth rate 1% 1% 21.22 15.93 (18.51) (13.94)
The above sensitivity analyses are based on a change in an assumption while holding all other assumptions constant. In practice, this is unlikely to occur, and changes in some of the assumptions may be correlated. When calculating the sensitivity of the defined benefit obligation to significant actuarial assumptions the same method i.e. projected unit credit method has been applied as that used for calculating the defined benefit liability recognised in the balance sheet.
(iv) Post-Employment benefits
The significant actuarial assumptions were as follows:
March 31, 2017
March 31, 2016
April 1, 2015
Discount rate 7.00% 7.80% 7.80%
Salary growth rate 4.00% 3.00% 3.00%
Expected Return on Assets 8.50% 8.50% 8.50%
Mortality Indian assured lives
mortality (2006-08)
(modified) Ultimate
Indian assured lives
mortality (2006-08)
(modified) Ultimate
Indian assured lives
mortality (2006-08)
(modified) Ultimate
Withdrawal Rate 2.00% 2.00% 2.00%
(vi) The major categories of plan assets are as follows:
March 31, 2017 March 31, 2016 April 1, 2015
Unquoted in % Unquoted in % Unquoted in %
Investment funds with LIC of India * 461.82 100% 420.00 100% 463.46 100%
Total 461.82 420.00 463.46
* Gratuity trust pays contribution to LIC which in turn invests the amount in various instruments. As it is done by LIC in totality basis along with contributions from other participants, the Company wise investment in planned assets - category / class wise is not available.
123
Notes to Accounts — Contd.
Rupees Million Less than
a year Between 1-2 years
Between 2-3 years
Between 3-4 years
Between 4-5 years
Beyond 5 years
Total
March 31, 2017Defined benefit obligationGratuity 69.92 51.44 52.58 80.32 67.71 378.30 700.27 Leave encashment 34.61 19.75 22.59 33.32 31.88 186.16 328.31 Total 104.53 71.19 75.17 113.64 99.59 564.46 1,028.58
March 31, 2016Gratuity 61.86 60.07 55.66 53.10 79.11 345.11 654.91 Leave encashment 29.50 23.37 22.30 22.35 31.43 149.02 277.97 Total 91.36 83.44 77.96 75.45 110.54 494.13 932.88
April 1, 2015Gratuity 49.72 60.06 58.32 54.04 51.56 343.22 616.92 Leave encashment 23.27 28.65 22.69 21.65 21.70 145.99 263.95 Total 72.99 88.71 81.01 75.69 73.26 489.21 880.87
(viii) Defined benefit liability and employer contributions
Expected contribution to post employment benefit plan for the year ending March 31, 2018 is INR 117.25 Million.
The weighted average duration of the defined benefit obligation is 9 years in case of Gratuity and 11 years in case of Leave encashment in all the three years.
The expected maturity analysis of undiscounted gratuity and leave encashment is as follows:
(vii) Risk exposure
The defined benefit obligations have the undermentioned risk exposures :
Interest rate risk : The defined benefit obligation is calculated using a discount rate based on government bonds. If bond yields fall, the defined benefit obligation will tend to increase.
Salary Inflation risk : Higher than expected increases in salary will increase the defined benefit obligation.
Demographic risk : This is the risk of variability of results due to unsystematic nature of decrements that include mortality, withdrawal, disability and retirement. The effect of these decrements on the defined benefit obligation is not straight forward and depends upon the combination of salary increase, discount rate and vesting criteria.
124
Notes to Accounts — Contd.
Rupees MillionAs at
March 31, 2017
As at March 31,
2016
As at April 1,
201524 CURRENT BORROWINGSSECURED Short Term Loan From Bank The Hong Kong & Shanghai Banking Corporation Limited
(HSBC) - 350.00 450.00 Cash Credit From Banks United Bank Of India * 391.99 619.42 424.27 The Hong Kong & Shanghai Banking Corporation Limited
(HSBC) 151.70 60.23 164.48 ICICI Bank Limited (ICICI) 66.00 318.85 -
UNSECURED Short Term Loan From Banks The Hong Kong & Shanghai Banking Corporation Limited
(HSBC) 250.00 500.00 - Federal Bank Limited 300.00 - - Total current borrowings 1,159.69 1,848.50 1,038.75
* Net of current account balances.
PARTICULARS OF SHORT TERM BORROWINGS :
i) Security : Cash Credit facilities from banks and short term loan from HSBC are secured by way of hypothecation of all stock of inventories,
book debts and other current assets of the company, both present and future, ranking pari passu. Cash Credit with United Bank of India is additionally secured by way of second charge in respect of the Company’s hotel in Kolkata known as The Oberoi Grand.
ii) Terms of repayment and Interest rate : Cash Credit from United Bank Of India is repayable on demand and carries Interest at bank’s base rate + 0.80% Cash Credit from HSBC is repayable on demand and carries Interest at banks base rate + 2.90% Cash Credit from ICICI is repayable on demand and carries Interest at 6 months MCLR +1.15% Short term loan from HSBC is repayable on maturity and carries Interest @ 8.90%. Short term loan from Federal Bank Limited is repayable on maturity and carries Interest @ 8.70%.
125
Notes to Accounts — Contd.
Rupees Million
As at March 31, 2017
As at March 31, 2016
As at April 1, 2015
25 TRADE PAYABLESTrade Payables 1,219.86 1,131.46 1,044.91
Trade Payables to related parties 75.26 56.28 45.47
Total trade payables 1,295.12 1,187.74 1,090.38
Classification as required by MSME Act
Total Outstanding dues of Micro Enterprises and Small Enterprises* 5.18 4.43 3.62
Total Outstanding dues of Creditors other than Micro Enterprises and Small Enterprises 1,289.94 1,183.31 1,086.76
Total trade payables 1,295.12 1,187.74 1,090.38
* Details of dues to Micro Enterprises and Small Enterprises as defined under Micro, Small & Medium Enterprises Development Act, 2006 (MSME Act) are based on information made available to the Company. Neither was there any delay in payment nor is any interest due and remaining unpaid on the above.
26 OTHER CURRENT FINANCIAL LIABILITIESCurrent Maturities of Long Term Debt 253.57 400.00 400.00
Current Maturities of Finance Lease Obligations 22.63 27.04 26.67
Interest accrued but not due on borrowings 8.25 5.05 2.26
Unclaimed Dividend 25.82 27.55 32.25
Security Deposits 45.75 60.74 47.23
Others:
- Unclaimed Fractional Share sale proceeds (against Bonus Issue) - 0.17 0.17
- Liability for Capital Expenditure 70.74 38.84 34.85
- Liability for Lease Equalisation 0.59 0.46 0.28
Total current financial liabilities 427.35 559.85 543.71
27 OTHER CURRENT LIABILITIESAdvance from Customer 288.54 214.07 400.07
Statutory and other dues 229.18 271.64 304.09
Advance Rent 2.88 5.06 4.00
Deferred Revenue 58.06 74.64 92.74
Total other current liabilities 578.66 565.41 800.90
126
Notes to Accounts — Contd.
Rupees MillionYear ended
March 31, 2017Year ended
March 31, 201628 REVENUE FROM OPERATIONSRooms 5,055.95 5,585.14 Food and Beverage 5,252.84 5,975.80 Other Services 1,833.01 2,025.57 Sale of Printed Materials 633.69 610.95 Total revenue from operations 12,775.49 14,197.46
29 OTHER INCOMEInterest income from financial assets at amortised cost 64.29 117.79 Interest income on Income Tax refund 103.33 5.99 Dividend income from Subsidiary Companies 221.64 187.46 Dividend income from Associate and Joint Ventures Companies 17.27 67.29 Dividend income from equity investments measured at fair value through profit and loss 0.02 0.93 Income on account of Services Exports Incentive 484.24 - Other gains/(losses) :
Net foreign exchange gain 7.13 8.99 Fair value changes on equity investments measured at fair value through profit and loss 6.10 6.16
Provisions/ Liabilities Written Back 9.31 20.30 Miscellaneous Income 78.93 83.86 Total other income 992.26 498.77
30 CONSUMPTION OF PROVISIONS, WINES, & OTHERS Opening Stock 178.12 178.02 Add: Purchases 1,915.35 2,062.38
2,093.47 2,240.40 Less : Closing Stock 175.94 178.12 Total Consumption of provisions, wines & others 1,917.53 2,062.28
31 EMPLOYEE BENEFITS EXPENSESalaries & Wages 3,290.13 3,370.44 Contribution to Provident fund and Other Funds 166.26 156.51 Staff Welfare Expenses 336.54 342.78 Total employee benefits expense 3,792.93 3,869.73
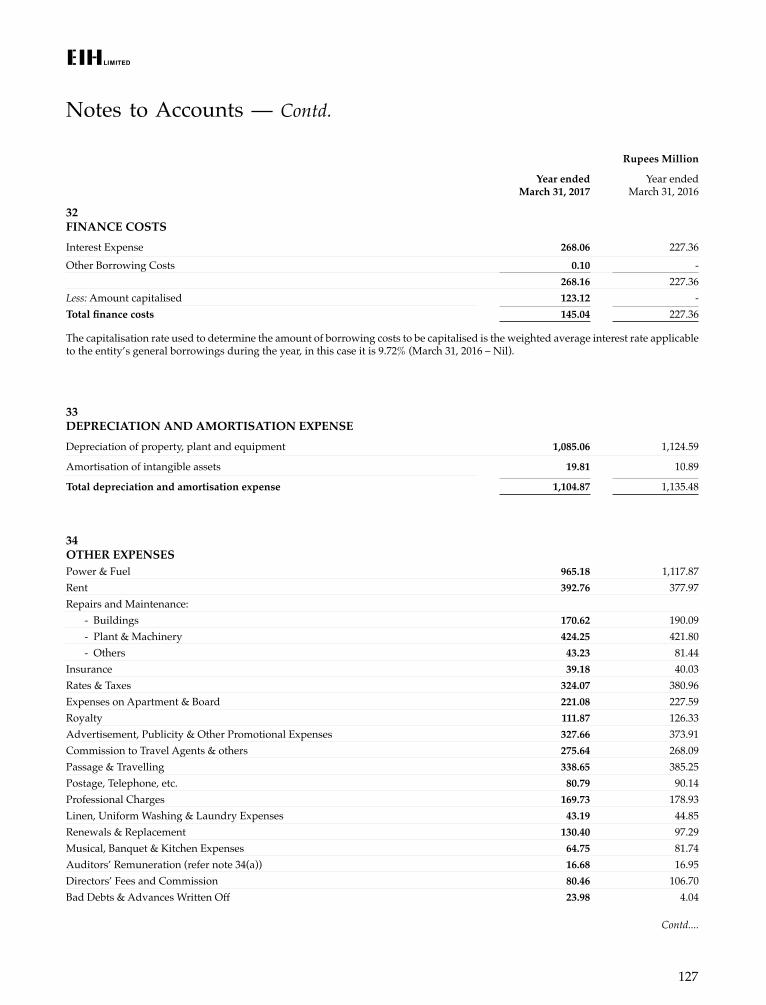
127
Notes to Accounts — Contd.
Rupees Million
Year ended March 31, 2017
Year ended March 31, 2016
32 FINANCE COSTS Interest Expense 268.06 227.36 Other Borrowing Costs 0.10 -
268.16 227.36 Less: Amount capitalised 123.12 - Total finance costs 145.04 227.36
The capitalisation rate used to determine the amount of borrowing costs to be capitalised is the weighted average interest rate applicable to the entity’s general borrowings during the year, in this case it is 9.72% (March 31, 2016 – Nil).
33 DEPRECIATION AND AMORTISATION EXPENSE Depreciation of property, plant and equipment 1,085.06 1,124.59
Amortisation of intangible assets 19.81 10.89
Total depreciation and amortisation expense 1,104.87 1,135.48
34 OTHER EXPENSES Power & Fuel 965.18 1,117.87 Rent 392.76 377.97 Repairs and Maintenance: - Buildings 170.62 190.09 - Plant & Machinery 424.25 421.80 - Others 43.23 81.44 Insurance 39.18 40.03 Rates & Taxes 324.07 380.96 Expenses on Apartment & Board 221.08 227.59 Royalty 111.87 126.33 Advertisement, Publicity & Other Promotional Expenses 327.66 373.91 Commission to Travel Agents & others 275.64 268.09 Passage & Travelling 338.65 385.25 Postage, Telephone, etc. 80.79 90.14 Professional Charges 169.73 178.93 Linen, Uniform Washing & Laundry Expenses 43.19 44.85 Renewals & Replacement 130.40 97.29 Musical, Banquet & Kitchen Expenses 64.75 81.74 Auditors’ Remuneration (refer note 34(a)) 16.68 16.95 Directors’ Fees and Commission 80.46 106.70 Bad Debts & Advances Written Off 23.98 4.04
Contd....
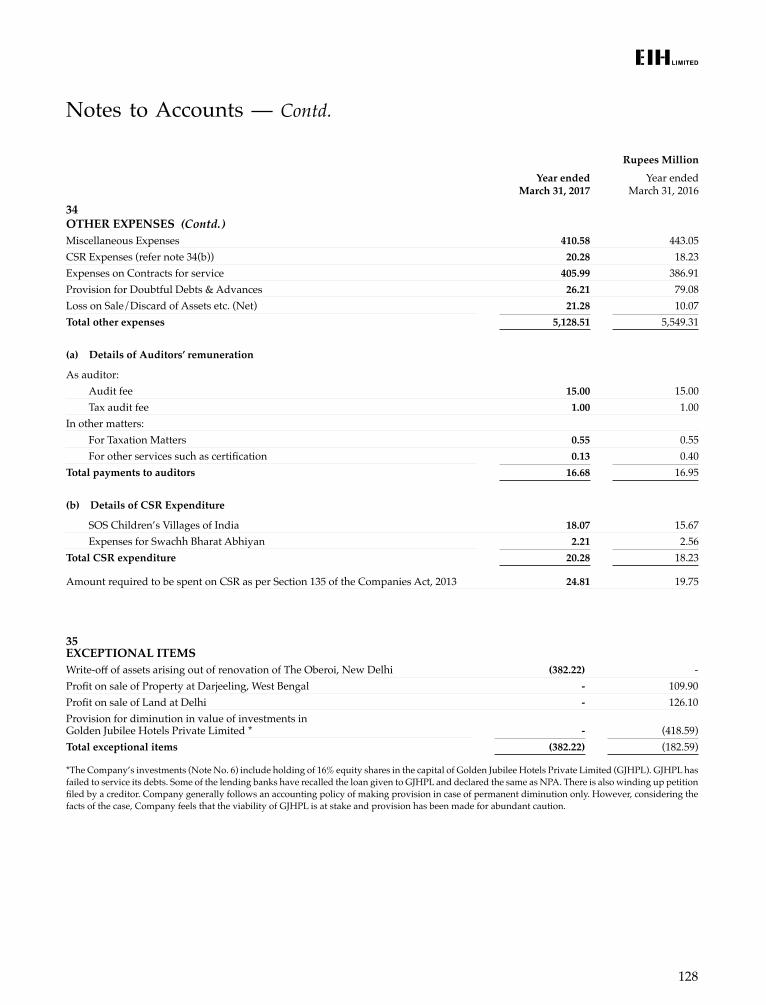
128
Notes to Accounts — Contd.
Rupees MillionYear ended
March 31, 2017Year ended
March 31, 2016
34 OTHER EXPENSES (Contd.)Miscellaneous Expenses 410.58 443.05 CSR Expenses (refer note 34(b)) 20.28 18.23 Expenses on Contracts for service 405.99 386.91 Provision for Doubtful Debts & Advances 26.21 79.08 Loss on Sale/Discard of Assets etc. (Net) 21.28 10.07 Total other expenses 5,128.51 5,549.31
(a) Details of Auditors’ remuneration
As auditor: Audit fee 15.00 15.00 Tax audit fee 1.00 1.00
In other matters:For Taxation Matters 0.55 0.55 For other services such as certification 0.13 0.40
Total payments to auditors 16.68 16.95
(b) Details of CSR Expenditure
SOS Children’s Villages of India 18.07 15.67 Expenses for Swachh Bharat Abhiyan 2.21 2.56
Total CSR expenditure 20.28 18.23
Amount required to be spent on CSR as per Section 135 of the Companies Act, 2013 24.81 19.75
35 EXCEPTIONAL ITEMSWrite-off of assets arising out of renovation of The Oberoi, New Delhi (382.22) - Profit on sale of Property at Darjeeling, West Bengal - 109.90 Profit on sale of Land at Delhi - 126.10 Provision for diminution in value of investments in Golden Jubilee Hotels Private Limited * - (418.59)Total exceptional items (382.22) (182.59)
*The Company’s investments (Note No. 6) include holding of 16% equity shares in the capital of Golden Jubilee Hotels Private Limited (GJHPL). GJHPL has failed to service its debts. Some of the lending banks have recalled the loan given to GJHPL and declared the same as NPA. There is also winding up petition filed by a creditor. Company generally follows an accounting policy of making provision in case of permanent diminution only. However, considering the facts of the case, Company feels that the viability of GJHPL is at stake and provision has been made for abundant caution.
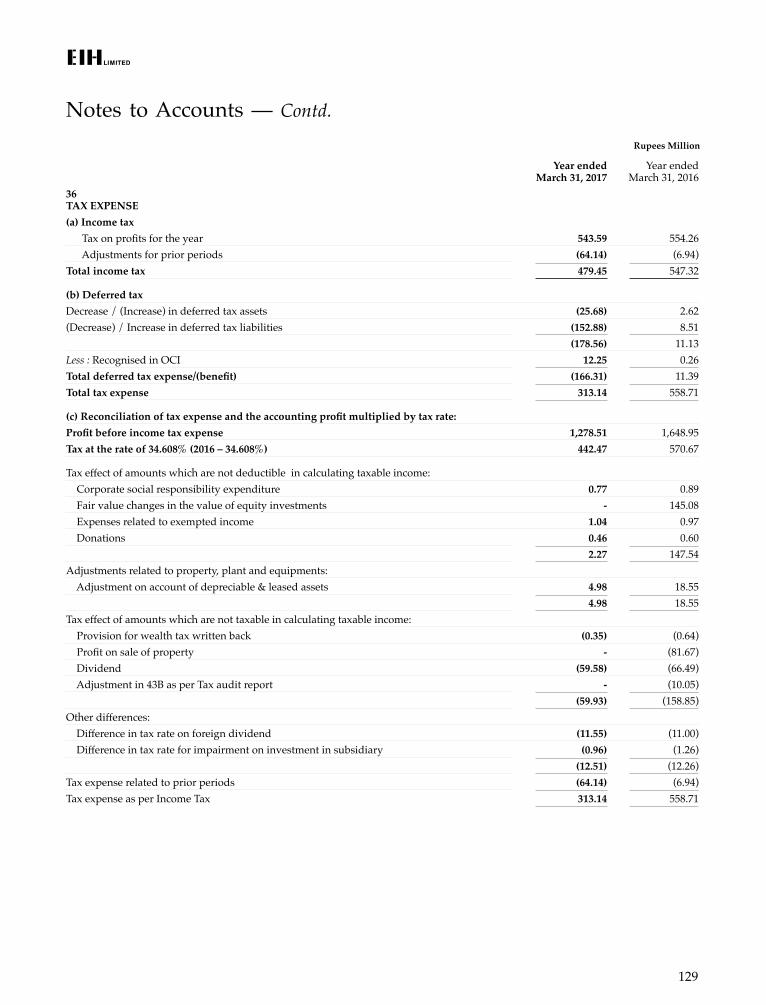
129
Notes to Accounts — Contd.Rupees Million
Year ended March 31, 2017
Year ended March 31, 2016
36 TAX EXPENSE(a) Income tax Tax on profits for the year 543.59 554.26 Adjustments for prior periods (64.14) (6.94)Total income tax 479.45 547.32
(b) Deferred taxDecrease / (Increase) in deferred tax assets (25.68) 2.62 (Decrease) / Increase in deferred tax liabilities (152.88) 8.51
(178.56) 11.13 Less : Recognised in OCI 12.25 0.26 Total deferred tax expense/(benefit) (166.31) 11.39 Total tax expense 313.14 558.71
(c) Reconciliation of tax expense and the accounting profit multiplied by tax rate: Profit before income tax expense 1,278.51 1,648.95 Tax at the rate of 34.608% (2016 – 34.608%) 442.47 570.67
Tax effect of amounts which are not deductible in calculating taxable income: Corporate social responsibility expenditure 0.77 0.89 Fair value changes in the value of equity investments - 145.08 Expenses related to exempted income 1.04 0.97 Donations 0.46 0.60
2.27 147.54 Adjustments related to property, plant and equipments: Adjustment on account of depreciable & leased assets 4.98 18.55
4.98 18.55 Tax effect of amounts which are not taxable in calculating taxable income: Provision for wealth tax written back (0.35) (0.64) Profit on sale of property - (81.67) Dividend (59.58) (66.49) Adjustment in 43B as per Tax audit report - (10.05)
(59.93) (158.85)Other differences: Difference in tax rate on foreign dividend (11.55) (11.00) Difference in tax rate for impairment on investment in subsidiary (0.96) (1.26)
(12.51) (12.26)Tax expense related to prior periods (64.14) (6.94)Tax expense as per Income Tax 313.14 558.71
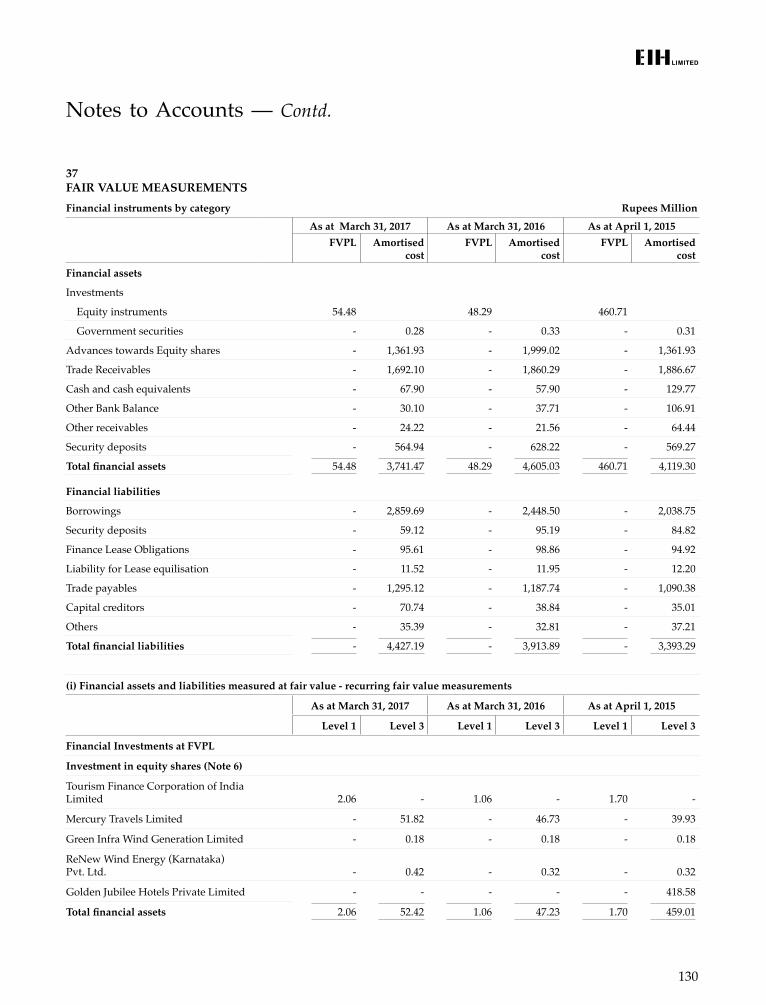
130
Notes to Accounts — Contd.
37 FAIR VALUE MEASUREMENTSFinancial instruments by category Rupees Million
As at March 31, 2017 As at March 31, 2016 As at April 1, 2015FVPL Amortised
cost FVPL Amortised
cost FVPL Amortised
cost Financial assets
Investments
Equity instruments 54.48 48.29 460.71
Government securities - 0.28 - 0.33 - 0.31
Advances towards Equity shares - 1,361.93 - 1,999.02 - 1,361.93
Trade Receivables - 1,692.10 - 1,860.29 - 1,886.67
Cash and cash equivalents - 67.90 - 57.90 - 129.77
Other Bank Balance - 30.10 - 37.71 - 106.91
Other receivables - 24.22 - 21.56 - 64.44
Security deposits - 564.94 - 628.22 - 569.27
Total financial assets 54.48 3,741.47 48.29 4,605.03 460.71 4,119.30
Financial liabilities
Borrowings - 2,859.69 - 2,448.50 - 2,038.75
Security deposits - 59.12 - 95.19 - 84.82
Finance Lease Obligations - 95.61 - 98.86 - 94.92
Liability for Lease equilisation - 11.52 - 11.95 - 12.20
Trade payables - 1,295.12 - 1,187.74 - 1,090.38
Capital creditors - 70.74 - 38.84 - 35.01
Others - 35.39 - 32.81 - 37.21
Total financial liabilities - 4,427.19 - 3,913.89 - 3,393.29
(i) Financial assets and liabilities measured at fair value - recurring fair value measurements
As at March 31, 2017 As at March 31, 2016 As at April 1, 2015
Level 1 Level 3 Level 1 Level 3 Level 1 Level 3
Financial Investments at FVPL
Investment in equity shares (Note 6)
Tourism Finance Corporation of India Limited 2.06 - 1.06 - 1.70 -
Mercury Travels Limited - 51.82 - 46.73 - 39.93
Green Infra Wind Generation Limited - 0.18 - 0.18 - 0.18
ReNew Wind Energy (Karnataka) Pvt. Ltd. - 0.42 - 0.32 - 0.32
Golden Jubilee Hotels Private Limited - - - - - 418.58
Total financial assets 2.06 52.42 1.06 47.23 1.70 459.01
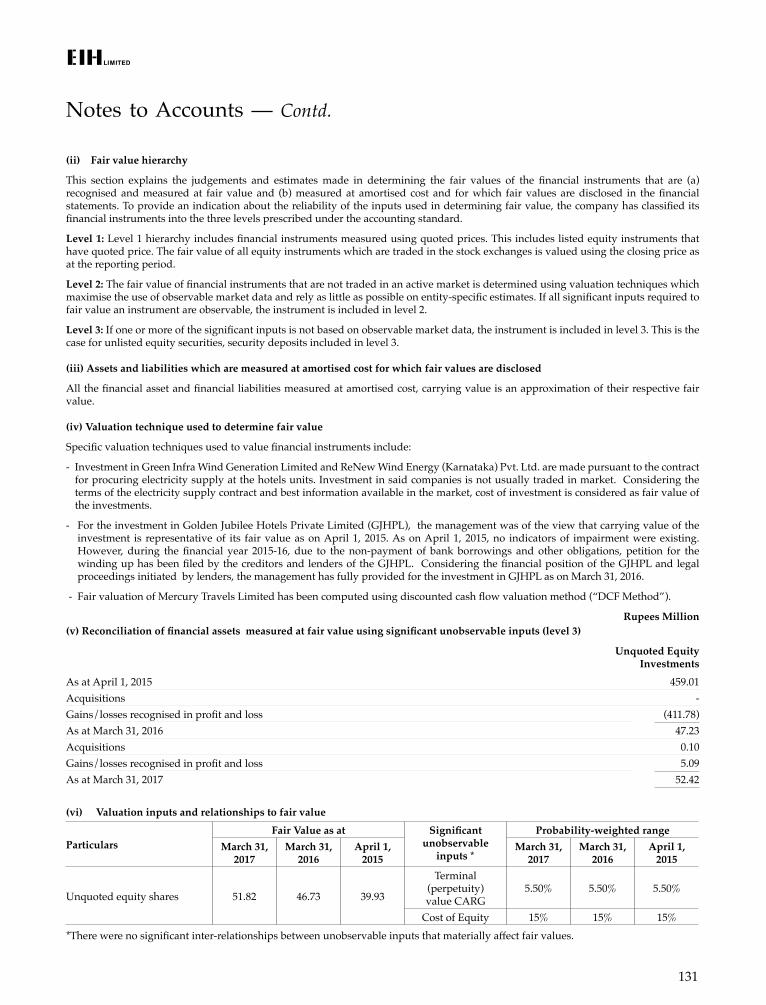
131
(ii) Fair value hierarchy
This section explains the judgements and estimates made in determining the fair values of the financial instruments that are (a) recognised and measured at fair value and (b) measured at amortised cost and for which fair values are disclosed in the financial statements. To provide an indication about the reliability of the inputs used in determining fair value, the company has classified its financial instruments into the three levels prescribed under the accounting standard.
Level 1: Level 1 hierarchy includes financial instruments measured using quoted prices. This includes listed equity instruments that have quoted price. The fair value of all equity instruments which are traded in the stock exchanges is valued using the closing price as at the reporting period.
Level 2: The fair value of financial instruments that are not traded in an active market is determined using valuation techniques which maximise the use of observable market data and rely as little as possible on entity-specific estimates. If all significant inputs required to fair value an instrument are observable, the instrument is included in level 2.
Level 3: If one or more of the significant inputs is not based on observable market data, the instrument is included in level 3. This is the case for unlisted equity securities, security deposits included in level 3.
(iii) Assets and liabilities which are measured at amortised cost for which fair values are disclosed
All the financial asset and financial liabilities measured at amortised cost, carrying value is an approximation of their respective fair value.
(iv) Valuation technique used to determine fair value
Specific valuation techniques used to value financial instruments include:
- Investment in Green Infra Wind Generation Limited and ReNew Wind Energy (Karnataka) Pvt. Ltd. are made pursuant to the contract for procuring electricity supply at the hotels units. Investment in said companies is not usually traded in market. Considering the terms of the electricity supply contract and best information available in the market, cost of investment is considered as fair value of the investments.
- For the investment in Golden Jubilee Hotels Private Limited (GJHPL), the management was of the view that carrying value of the investment is representative of its fair value as on April 1, 2015. As on April 1, 2015, no indicators of impairment were existing. However, during the financial year 2015-16, due to the non-payment of bank borrowings and other obligations, petition for the winding up has been filed by the creditors and lenders of the GJHPL. Considering the financial position of the GJHPL and legal proceedings initiated by lenders, the management has fully provided for the investment in GJHPL as on March 31, 2016.
- Fair valuation of Mercury Travels Limited has been computed using discounted cash flow valuation method (“DCF Method”).
Rupees Million(v) Reconciliation of financial assets measured at fair value using significant unobservable inputs (level 3)
Unquoted Equity Investments
As at April 1, 2015 459.01 Acquisitions - Gains/losses recognised in profit and loss (411.78)As at March 31, 2016 47.23 Acquisitions 0.10 Gains/losses recognised in profit and loss 5.09 As at March 31, 2017 52.42
Notes to Accounts — Contd.
(vi) Valuation inputs and relationships to fair value
ParticularsFair Value as at Significant
unobservable inputs *
Probability-weighted rangeMarch 31,
2017March 31,
2016April 1,
2015March 31,
2017March 31,
2016April 1,
2015
Unquoted equity shares 51.82 46.73 39.93
Terminal (perpetuity) value CARG
5.50% 5.50% 5.50%
Cost of Equity 15% 15% 15%*There were no significant inter-relationships between unobservable inputs that materially affect fair values.
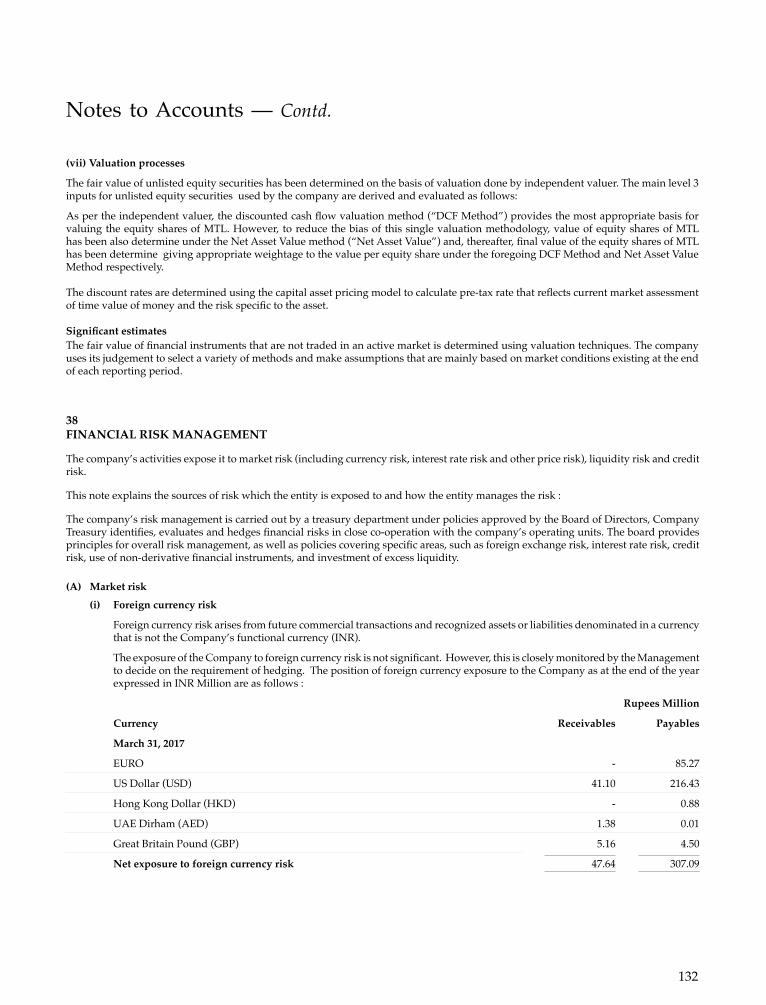
132
Notes to Accounts — Contd.
38 FINANCIAL RISK MANAGEMENT
The company’s activities expose it to market risk (including currency risk, interest rate risk and other price risk), liquidity risk and credit risk.
This note explains the sources of risk which the entity is exposed to and how the entity manages the risk :
The company’s risk management is carried out by a treasury department under policies approved by the Board of Directors, Company Treasury identifies, evaluates and hedges financial risks in close co-operation with the company’s operating units. The board provides principles for overall risk management, as well as policies covering specific areas, such as foreign exchange risk, interest rate risk, credit risk, use of non-derivative financial instruments, and investment of excess liquidity.
(A) Market risk(i) Foreign currency risk
Foreign currency risk arises from future commercial transactions and recognized assets or liabilities denominated in a currency that is not the Company’s functional currency (INR).
The exposure of the Company to foreign currency risk is not significant. However, this is closely monitored by the Management to decide on the requirement of hedging. The position of foreign currency exposure to the Company as at the end of the year expressed in INR Million are as follows :
Rupees Million
Currency Receivables Payables
March 31, 2017
EURO - 85.27
US Dollar (USD) 41.10 216.43
Hong Kong Dollar (HKD) - 0.88
UAE Dirham (AED) 1.38 0.01
Great Britain Pound (GBP) 5.16 4.50
Net exposure to foreign currency risk 47.64 307.09
(vii) Valuation processes
The fair value of unlisted equity securities has been determined on the basis of valuation done by independent valuer. The main level 3 inputs for unlisted equity securities used by the company are derived and evaluated as follows:
As per the independent valuer, the discounted cash flow valuation method (“DCF Method”) provides the most appropriate basis for valuing the equity shares of MTL. However, to reduce the bias of this single valuation methodology, value of equity shares of MTL has been also determine under the Net Asset Value method (“Net Asset Value”) and, thereafter, final value of the equity shares of MTL has been determine giving appropriate weightage to the value per equity share under the foregoing DCF Method and Net Asset Value Method respectively. The discount rates are determined using the capital asset pricing model to calculate pre-tax rate that reflects current market assessment of time value of money and the risk specific to the asset.
Significant estimatesThe fair value of financial instruments that are not traded in an active market is determined using valuation techniques. The company uses its judgement to select a variety of methods and make assumptions that are mainly based on market conditions existing at the end of each reporting period.
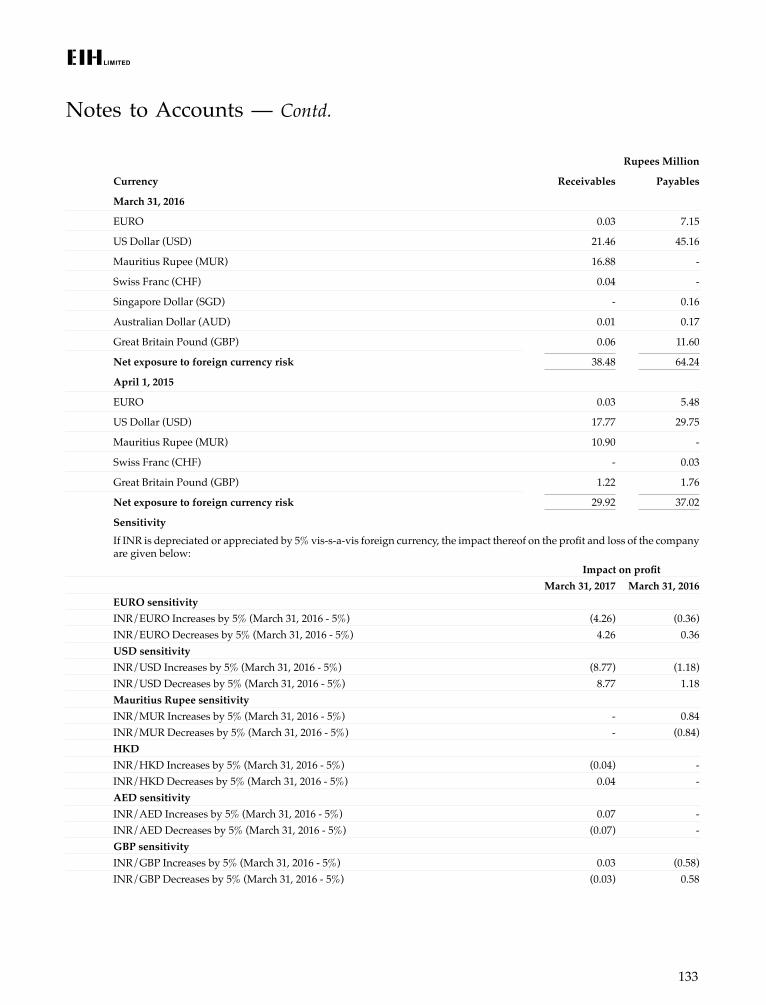
133
Notes to Accounts — Contd.
Rupees Million
Currency Receivables Payables
March 31, 2016
EURO 0.03 7.15
US Dollar (USD) 21.46 45.16
Mauritius Rupee (MUR) 16.88 -
Swiss Franc (CHF) 0.04 -
Singapore Dollar (SGD) - 0.16
Australian Dollar (AUD) 0.01 0.17
Great Britain Pound (GBP) 0.06 11.60
Net exposure to foreign currency risk 38.48 64.24
April 1, 2015
EURO 0.03 5.48
US Dollar (USD) 17.77 29.75
Mauritius Rupee (MUR) 10.90 -
Swiss Franc (CHF) - 0.03
Great Britain Pound (GBP) 1.22 1.76
Net exposure to foreign currency risk 29.92 37.02
SensitivityIf INR is depreciated or appreciated by 5% vis-s-a-vis foreign currency, the impact thereof on the profit and loss of the company are given below:
Impact on profitMarch 31, 2017 March 31, 2016
EURO sensitivityINR/EURO Increases by 5% (March 31, 2016 - 5%) (4.26) (0.36)INR/EURO Decreases by 5% (March 31, 2016 - 5%) 4.26 0.36 USD sensitivityINR/USD Increases by 5% (March 31, 2016 - 5%) (8.77) (1.18)INR/USD Decreases by 5% (March 31, 2016 - 5%) 8.77 1.18 Mauritius Rupee sensitivityINR/MUR Increases by 5% (March 31, 2016 - 5%) - 0.84 INR/MUR Decreases by 5% (March 31, 2016 - 5%) - (0.84)HKDINR/HKD Increases by 5% (March 31, 2016 - 5%) (0.04) - INR/HKD Decreases by 5% (March 31, 2016 - 5%) 0.04 - AED sensitivityINR/AED Increases by 5% (March 31, 2016 - 5%) 0.07 - INR/AED Decreases by 5% (March 31, 2016 - 5%) (0.07) - GBP sensitivityINR/GBP Increases by 5% (March 31, 2016 - 5%) 0.03 (0.58)INR/GBP Decreases by 5% (March 31, 2016 - 5%) (0.03) 0.58
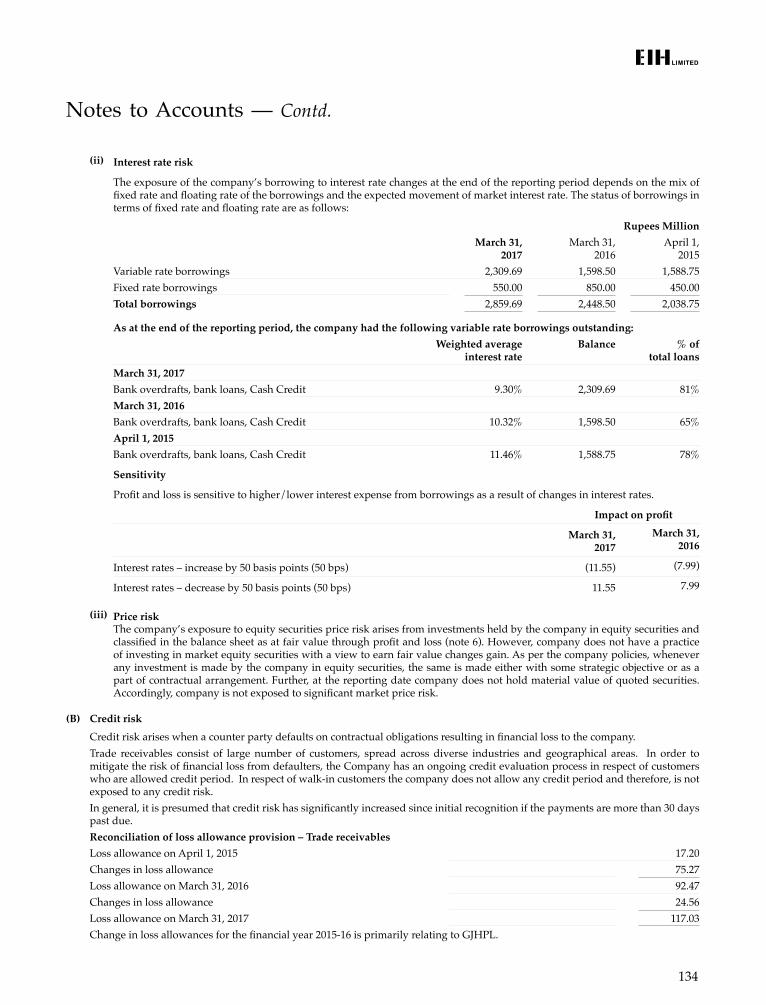
134
(ii) Interest rate risk
The exposure of the company’s borrowing to interest rate changes at the end of the reporting period depends on the mix of fixed rate and floating rate of the borrowings and the expected movement of market interest rate. The status of borrowings in terms of fixed rate and floating rate are as follows:
Rupees MillionMarch 31,
2017March 31,
2016April 1,
2015Variable rate borrowings 2,309.69 1,598.50 1,588.75 Fixed rate borrowings 550.00 850.00 450.00 Total borrowings 2,859.69 2,448.50 2,038.75
As at the end of the reporting period, the company had the following variable rate borrowings outstanding:Weighted average
interest rateBalance % of
total loansMarch 31, 2017Bank overdrafts, bank loans, Cash Credit 9.30% 2,309.69 81%March 31, 2016Bank overdrafts, bank loans, Cash Credit 10.32% 1,598.50 65%April 1, 2015Bank overdrafts, bank loans, Cash Credit 11.46% 1,588.75 78%
Sensitivity
Profit and loss is sensitive to higher/lower interest expense from borrowings as a result of changes in interest rates.
Impact on profit
March 31, 2017
March 31, 2016
Interest rates – increase by 50 basis points (50 bps) (11.55) (7.99)
Interest rates – decrease by 50 basis points (50 bps) 11.55 7.99
(iii) Price riskThe company’s exposure to equity securities price risk arises from investments held by the company in equity securities and classified in the balance sheet as at fair value through profit and loss (note 6). However, company does not have a practice of investing in market equity securities with a view to earn fair value changes gain. As per the company policies, whenever any investment is made by the company in equity securities, the same is made either with some strategic objective or as a part of contractual arrangement. Further, at the reporting date company does not hold material value of quoted securities. Accordingly, company is not exposed to significant market price risk.
(B) Credit riskCredit risk arises when a counter party defaults on contractual obligations resulting in financial loss to the company.Trade receivables consist of large number of customers, spread across diverse industries and geographical areas. In order to mitigate the risk of financial loss from defaulters, the Company has an ongoing credit evaluation process in respect of customers who are allowed credit period. In respect of walk-in customers the company does not allow any credit period and therefore, is not exposed to any credit risk.In general, it is presumed that credit risk has significantly increased since initial recognition if the payments are more than 30 days past due.Reconciliation of loss allowance provision – Trade receivablesLoss allowance on April 1, 2015 17.20 Changes in loss allowance 75.27 Loss allowance on March 31, 2016 92.47 Changes in loss allowance 24.56 Loss allowance on March 31, 2017 117.03 Change in loss allowances for the financial year 2015-16 is primarily relating to GJHPL.
Notes to Accounts — Contd.
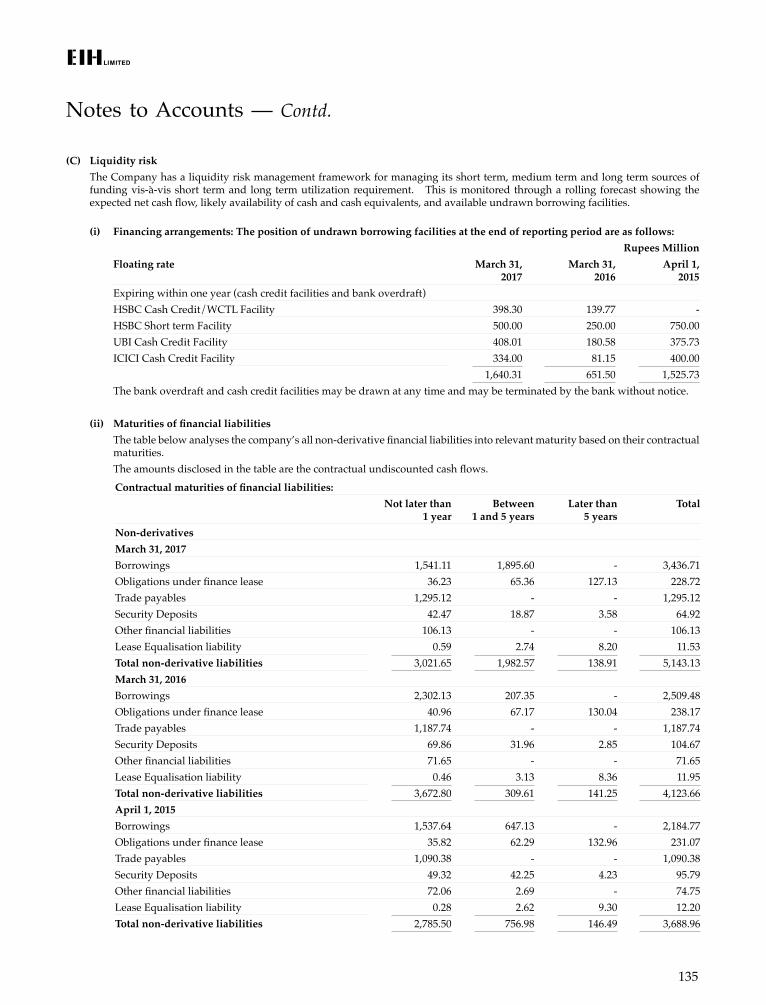
135
(C) Liquidity riskThe Company has a liquidity risk management framework for managing its short term, medium term and long term sources of funding vis-à-vis short term and long term utilization requirement. This is monitored through a rolling forecast showing the expected net cash flow, likely availability of cash and cash equivalents, and available undrawn borrowing facilities.
(i) Financing arrangements: The position of undrawn borrowing facilities at the end of reporting period are as follows:Rupees Million
Floating rate March 31, 2017
March 31, 2016
April 1, 2015
Expiring within one year (cash credit facilities and bank overdraft)HSBC Cash Credit/WCTL Facility 398.30 139.77 - HSBC Short term Facility 500.00 250.00 750.00 UBI Cash Credit Facility 408.01 180.58 375.73 ICICI Cash Credit Facility 334.00 81.15 400.00
1,640.31 651.50 1,525.73 The bank overdraft and cash credit facilities may be drawn at any time and may be terminated by the bank without notice.
(ii) Maturities of financial liabilitiesThe table below analyses the company’s all non-derivative financial liabilities into relevant maturity based on their contractual maturities.The amounts disclosed in the table are the contractual undiscounted cash flows.
Notes to Accounts — Contd.
Contractual maturities of financial liabilities:Not later than
1 yearBetween
1 and 5 yearsLater than
5 yearsTotal
Non-derivativesMarch 31, 2017Borrowings 1,541.11 1,895.60 - 3,436.71 Obligations under finance lease 36.23 65.36 127.13 228.72 Trade payables 1,295.12 - - 1,295.12 Security Deposits 42.47 18.87 3.58 64.92 Other financial liabilities 106.13 - - 106.13 Lease Equalisation liability 0.59 2.74 8.20 11.53 Total non-derivative liabilities 3,021.65 1,982.57 138.91 5,143.13 March 31, 2016Borrowings 2,302.13 207.35 - 2,509.48 Obligations under finance lease 40.96 67.17 130.04 238.17 Trade payables 1,187.74 - - 1,187.74 Security Deposits 69.86 31.96 2.85 104.67 Other financial liabilities 71.65 - - 71.65 Lease Equalisation liability 0.46 3.13 8.36 11.95 Total non-derivative liabilities 3,672.80 309.61 141.25 4,123.66 April 1, 2015Borrowings 1,537.64 647.13 - 2,184.77 Obligations under finance lease 35.82 62.29 132.96 231.07 Trade payables 1,090.38 - - 1,090.38 Security Deposits 49.32 42.25 4.23 95.79 Other financial liabilities 72.06 2.69 - 74.75 Lease Equalisation liability 0.28 2.62 9.30 12.20 Total non-derivative liabilities 2,785.50 756.98 146.49 3,688.96
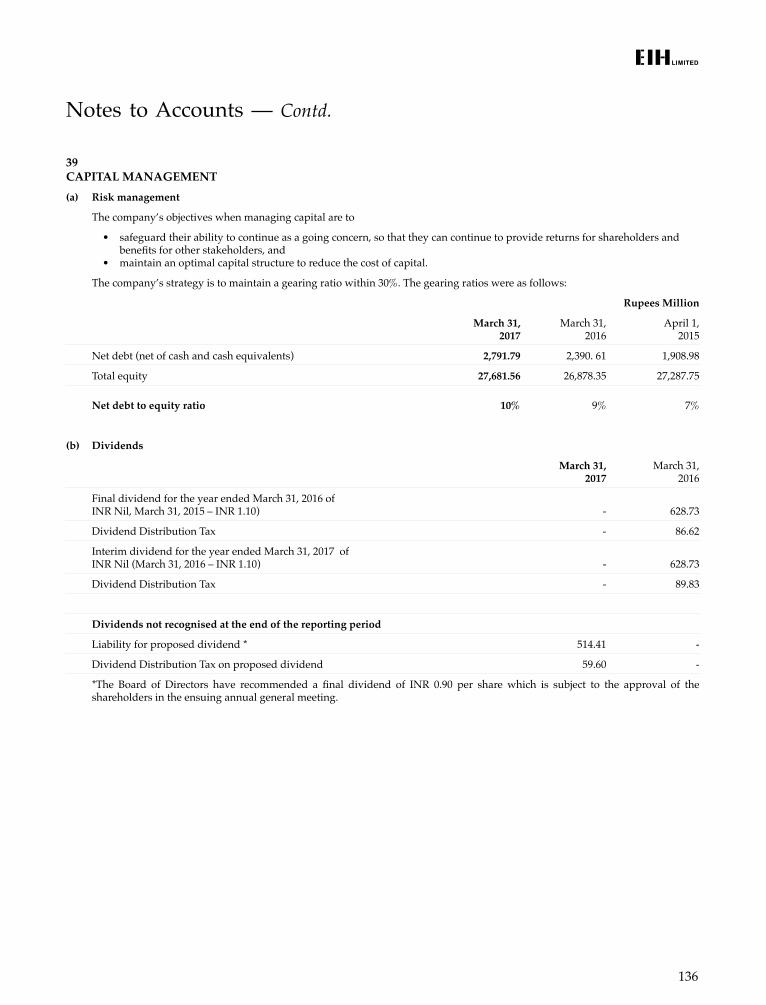
136
39 CAPITAL MANAGEMENT(a) Risk management
The company’s objectives when managing capital are to
• safeguard their ability to continue as a going concern, so that they can continue to provide returns for shareholders and benefits for other stakeholders, and
• maintain an optimal capital structure to reduce the cost of capital.
The company’s strategy is to maintain a gearing ratio within 30%. The gearing ratios were as follows:
Rupees Million
March 31, 2017
March 31, 2016
April 1, 2015
Net debt (net of cash and cash equivalents) 2,791.79 2,390. 61 1,908.98
Total equity 27,681.56 26,878.35 27,287.75
Net debt to equity ratio 10% 9% 7%
(b) Dividends
March 31, 2017
March 31, 2016
Final dividend for the year ended March 31, 2016 of INR Nil, March 31, 2015 – INR 1.10) - 628.73
Dividend Distribution Tax - 86.62
Interim dividend for the year ended March 31, 2017 of INR Nil (March 31, 2016 – INR 1.10) - 628.73
Dividend Distribution Tax - 89.83
Dividends not recognised at the end of the reporting period
Liability for proposed dividend * 514.41 -
Dividend Distribution Tax on proposed dividend 59.60 -
*The Board of Directors have recommended a final dividend of INR 0.90 per share which is subject to the approval of the shareholders in the ensuing annual general meeting.
Notes to Accounts — Contd.
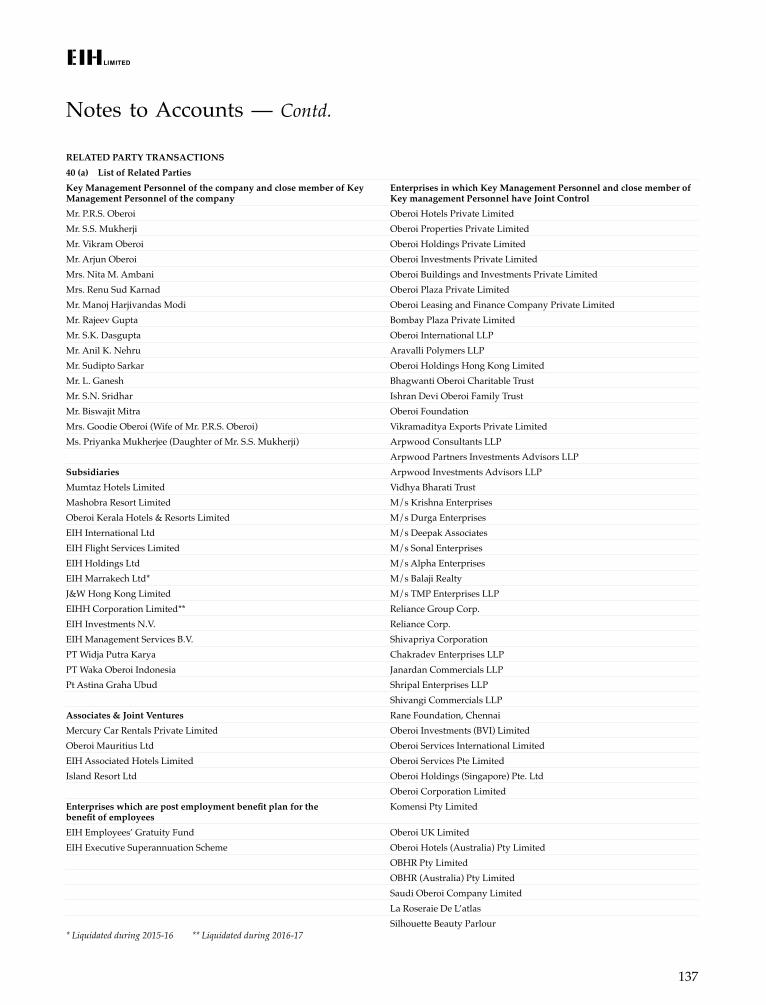
137
RELATED PARTY TRANSACTIONS40 (a) List of Related PartiesKey Management Personnel of the company and close member of Key Management Personnel of the company
Enterprises in which Key Management Personnel and close member of Key management Personnel have Joint Control
Mr. P.R.S. Oberoi Oberoi Hotels Private LimitedMr. S.S. Mukherji Oberoi Properties Private LimitedMr. Vikram Oberoi Oberoi Holdings Private LimitedMr. Arjun Oberoi Oberoi Investments Private LimitedMrs. Nita M. Ambani Oberoi Buildings and Investments Private LimitedMrs. Renu Sud Karnad Oberoi Plaza Private LimitedMr. Manoj Harjivandas Modi Oberoi Leasing and Finance Company Private LimitedMr. Rajeev Gupta Bombay Plaza Private LimitedMr. S.K. Dasgupta Oberoi International LLPMr. Anil K. Nehru Aravalli Polymers LLPMr. Sudipto Sarkar Oberoi Holdings Hong Kong LimitedMr. L. Ganesh Bhagwanti Oberoi Charitable TrustMr. S.N. Sridhar Ishran Devi Oberoi Family TrustMr. Biswajit Mitra Oberoi FoundationMrs. Goodie Oberoi (Wife of Mr. P.R.S. Oberoi) Vikramaditya Exports Private LimitedMs. Priyanka Mukherjee (Daughter of Mr. S.S. Mukherji) Arpwood Consultants LLP
Arpwood Partners Investments Advisors LLPSubsidiaries Arpwood Investments Advisors LLPMumtaz Hotels Limited Vidhya Bharati TrustMashobra Resort Limited M/s Krishna EnterprisesOberoi Kerala Hotels & Resorts Limited M/s Durga EnterprisesEIH International Ltd M/s Deepak AssociatesEIH Flight Services Limited M/s Sonal EnterprisesEIH Holdings Ltd M/s Alpha EnterprisesEIH Marrakech Ltd* M/s Balaji RealtyJ&W Hong Kong Limited M/s TMP Enterprises LLPEIHH Corporation Limited** Reliance Group Corp.EIH Investments N.V. Reliance Corp.EIH Management Services B.V. Shivapriya CorporationPT Widja Putra Karya Chakradev Enterprises LLPPT Waka Oberoi Indonesia Janardan Commercials LLPPt Astina Graha Ubud Shripal Enterprises LLP
Shivangi Commercials LLPAssociates & Joint Ventures Rane Foundation, ChennaiMercury Car Rentals Private Limited Oberoi Investments (BVI) LimitedOberoi Mauritius Ltd Oberoi Services International LimitedEIH Associated Hotels Limited Oberoi Services Pte LimitedIsland Resort Ltd Oberoi Holdings (Singapore) Pte. Ltd
Oberoi Corporation LimitedEnterprises which are post employment benefit plan for the benefit of employees
Komensi Pty Limited
EIH Employees’ Gratuity Fund Oberoi UK LimitedEIH Executive Superannuation Scheme Oberoi Hotels (Australia) Pty Limited
OBHR Pty LimitedOBHR (Australia) Pty LimitedSaudi Oberoi Company LimitedLa Roseraie De L’atlasSilhouette Beauty Parlour
Notes to Accounts — Contd.
* Liquidated during 2015-16 ** Liquidated during 2016-17
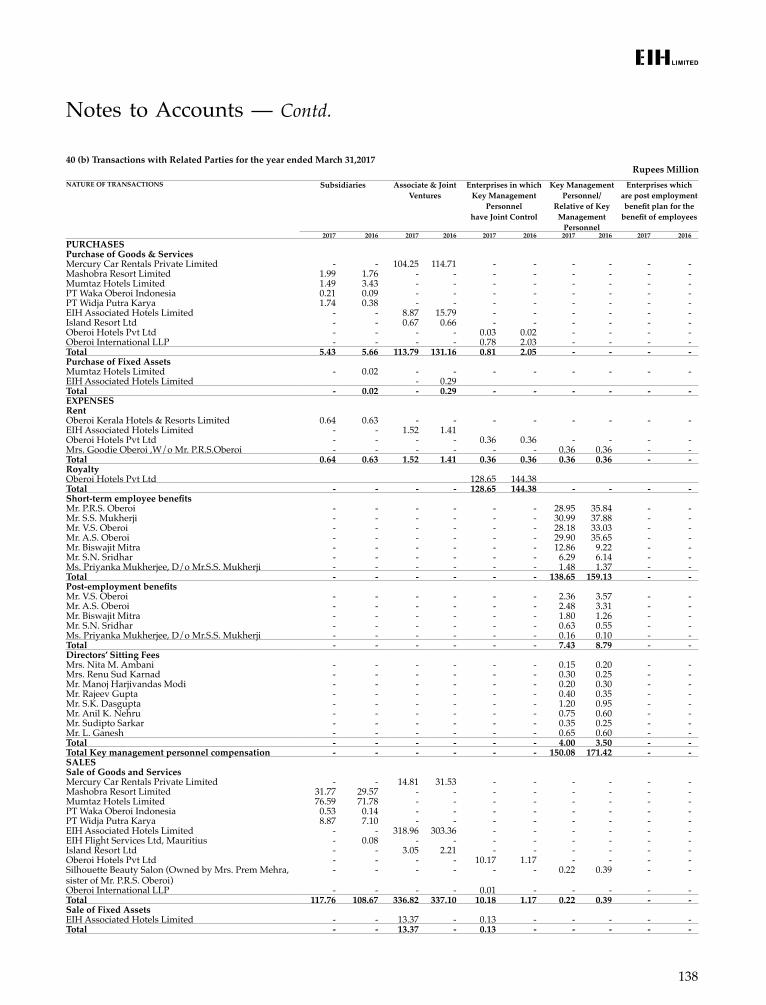
138
40 (b) Transactions with Related Parties for the year ended March 31,2017Rupees Million
NATURE OF TRANSACTIONS Subsidiaries Associate & Joint Ventures
Enterprises in which Key Management
Personnelhave Joint Control
Key Management Personnel/
Relative of Key Management
Personnel
Enterprises which are post employment benefit plan for the
benefit of employees
2017 2016 2017 2016 2017 2016 2017 2016 2017 2016PURCHASESPurchase of Goods & ServicesMercury Car Rentals Private Limited - - 104.25 114.71 - - - - - -Mashobra Resort Limited 1.99 1.76 - - - - - - - -Mumtaz Hotels Limited 1.49 3.43 - - - - - - - -PT Waka Oberoi Indonesia 0.21 0.09 - - - - - - - -PT Widja Putra Karya 1.74 0.38 - - - - - - - -EIH Associated Hotels Limited - - 8.87 15.79 - - - - - -Island Resort Ltd - - 0.67 0.66 - - - - - -Oberoi Hotels Pvt Ltd - - - - 0.03 0.02 - - - -Oberoi International LLP - - - - 0.78 2.03 - - - -Total 5.43 5.66 113.79 131.16 0.81 2.05 - - - - Purchase of Fixed AssetsMumtaz Hotels Limited - 0.02 - - - - - - - -EIH Associated Hotels Limited - 0.29 Total - 0.02 - 0.29 - - - - - - EXPENSESRentOberoi Kerala Hotels & Resorts Limited 0.64 0.63 - - - - - - - -EIH Associated Hotels Limited - - 1.52 1.41 Oberoi Hotels Pvt Ltd - - - - 0.36 0.36 - - - -Mrs. Goodie Oberoi ,W/o Mr. P.R.S.Oberoi - - - - - - 0.36 0.36 - -Total 0.64 0.63 1.52 1.41 0.36 0.36 0.36 0.36 - - RoyaltyOberoi Hotels Pvt Ltd 128.65 144.38 Total - - - - 128.65 144.38 - - - - Short-term employee benefitsMr. P.R.S. Oberoi - - - - - - 28.95 35.84 - -Mr. S.S. Mukherji - - - - - - 30.99 37.88 - -Mr. V.S. Oberoi - - - - - - 28.18 33.03 - -Mr. A.S. Oberoi - - - - - - 29.90 35.65 - -Mr. Biswajit Mitra - - - - - - 12.86 9.22 - -Mr. S.N. Sridhar - - - - - - 6.29 6.14 - -Ms. Priyanka Mukherjee, D/o Mr.S.S. Mukherji - - - - - - 1.48 1.37 - -Total - - - - - - 138.65 159.13 - - Post-employment benefitsMr. V.S. Oberoi - - - - - - 2.36 3.57 - -Mr. A.S. Oberoi - - - - - - 2.48 3.31 - -Mr. Biswajit Mitra - - - - - - 1.80 1.26 - -Mr. S.N. Sridhar - - - - - - 0.63 0.55 - -Ms. Priyanka Mukherjee, D/o Mr.S.S. Mukherji - - - - - - 0.16 0.10 - -Total - - - - - - 7.43 8.79 - -Directors’ Sitting FeesMrs. Nita M. Ambani - - - - - - 0.15 0.20 - -Mrs. Renu Sud Karnad - - - - - - 0.30 0.25 - -Mr. Manoj Harjivandas Modi - - - - - - 0.20 0.30 - -Mr. Rajeev Gupta - - - - - - 0.40 0.35 - -Mr. S.K. Dasgupta - - - - - - 1.20 0.95 - -Mr. Anil K. Nehru - - - - - - 0.75 0.60 - -Mr. Sudipto Sarkar - - - - - - 0.35 0.25 - -Mr. L. Ganesh - - - - - - 0.65 0.60 - -Total - - - - - - 4.00 3.50 - - Total Key management personnel compensation - - - - - - 150.08 171.42 - - SALESSale of Goods and ServicesMercury Car Rentals Private Limited - - 14.81 31.53 - - - - - -Mashobra Resort Limited 31.77 29.57 - - - - - - - -Mumtaz Hotels Limited 76.59 71.78 - - - - - - - -PT Waka Oberoi Indonesia 0.53 0.14 - - - - - - - -PT Widja Putra Karya 8.87 7.10 - - - - - - - -EIH Associated Hotels Limited - - 318.96 303.36 - - - - - -EIH Flight Services Ltd, Mauritius - 0.08 - - - - - - - -Island Resort Ltd - - 3.05 2.21 - - - - - -Oberoi Hotels Pvt Ltd - - - - 10.17 1.17 - - - -Silhouette Beauty Salon (Owned by Mrs. Prem Mehra, sister of Mr. P.R.S. Oberoi)
- - - - - - 0.22 0.39 - -
Oberoi International LLP - - - - 0.01 - - - - -Total 117.76 108.67 336.82 337.10 10.18 1.17 0.22 0.39 - - Sale of Fixed AssetsEIH Associated Hotels Limited - - 13.37 - 0.13 - - - - -Total - - 13.37 - 0.13 - - - - -
Notes to Accounts — Contd.
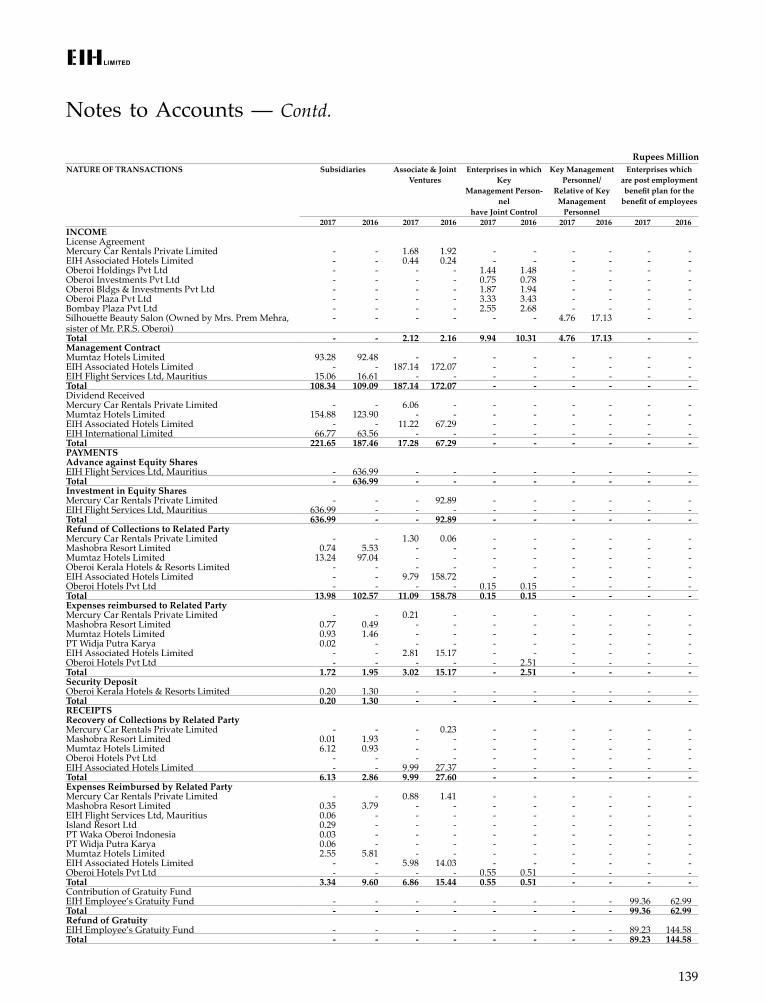
139
INCOMELicense AgreementMercury Car Rentals Private Limited - - 1.68 1.92 - - - - - -EIH Associated Hotels Limited - - 0.44 0.24 - - - - - -Oberoi Holdings Pvt Ltd - - - - 1.44 1.48 - - - -Oberoi Investments Pvt Ltd - - - - 0.75 0.78 - - - -Oberoi Bldgs & Investments Pvt Ltd - - - - 1.87 1.94 - - - -Oberoi Plaza Pvt Ltd - - - - 3.33 3.43 - - - -Bombay Plaza Pvt Ltd - - - - 2.55 2.68 - - - -Silhouette Beauty Salon (Owned by Mrs. Prem Mehra, sister of Mr. P.R.S. Oberoi)
- - - - - - 4.76 17.13 - -
Total - - 2.12 2.16 9.94 10.31 4.76 17.13 - - Management ContractMumtaz Hotels Limited 93.28 92.48 - - - - - - - -EIH Associated Hotels Limited - - 187.14 172.07 - - - - - -EIH Flight Services Ltd, Mauritius 15.06 16.61 - - - - - - - -Total 108.34 109.09 187.14 172.07 - - - - - - Dividend ReceivedMercury Car Rentals Private Limited - - 6.06 - - - - - - -Mumtaz Hotels Limited 154.88 123.90 - - - - - - - -EIH Associated Hotels Limited - - 11.22 67.29 - - - - - -EIH International Limited 66.77 63.56 - - - - - - - -Total 221.65 187.46 17.28 67.29 - - - - - - PAYMENTSAdvance against Equity SharesEIH Flight Services Ltd, Mauritius - 636.99 - - - - - - - -Total - 636.99 - - - - - - - - Investment in Equity SharesMercury Car Rentals Private Limited - - - 92.89 - - - - - -EIH Flight Services Ltd, Mauritius 636.99 - - - - - - - - -Total 636.99 - - 92.89 - - - - - - Refund of Collections to Related PartyMercury Car Rentals Private Limited - - 1.30 0.06 - - - - - -Mashobra Resort Limited 0.74 5.53 - - - - - - - -Mumtaz Hotels Limited 13.24 97.04 - - - - - - - -Oberoi Kerala Hotels & Resorts Limited - - - - - - - - - -EIH Associated Hotels Limited - - 9.79 158.72 - - - - - -Oberoi Hotels Pvt Ltd - - - - 0.15 0.15 - - - -Total 13.98 102.57 11.09 158.78 0.15 0.15 - - - - Expenses reimbursed to Related PartyMercury Car Rentals Private Limited - - 0.21 - - - - - - -Mashobra Resort Limited 0.77 0.49 - - - - - - - -Mumtaz Hotels Limited 0.93 1.46 - - - - - - - -PT Widja Putra Karya 0.02 - - - - - - - - -EIH Associated Hotels Limited - - 2.81 15.17 - - - - - -Oberoi Hotels Pvt Ltd - - - - - 2.51 - - - - Total 1.72 1.95 3.02 15.17 - 2.51 - - - - Security DepositOberoi Kerala Hotels & Resorts Limited 0.20 1.30 - - - - - - - -Total 0.20 1.30 - - - - - - - - RECEIPTSRecovery of Collections by Related PartyMercury Car Rentals Private Limited - - - 0.23 - - - - - -Mashobra Resort Limited 0.01 1.93 - - - - - - - -Mumtaz Hotels Limited 6.12 0.93 - - - - - - - -Oberoi Hotels Pvt Ltd - - - - - - - - - -EIH Associated Hotels Limited - - 9.99 27.37 - - - - - -Total 6.13 2.86 9.99 27.60 - - - - - - Expenses Reimbursed by Related PartyMercury Car Rentals Private Limited - - 0.88 1.41 - - - - - -Mashobra Resort Limited 0.35 3.79 - - - - - - - -EIH Flight Services Ltd, Mauritius 0.06 - - - - - - - - -Island Resort Ltd 0.29 - - - - - - - - -PT Waka Oberoi Indonesia 0.03 - - - - - - - - -PT Widja Putra Karya 0.06 - - - - - - - - -Mumtaz Hotels Limited 2.55 5.81 - - - - - - - -EIH Associated Hotels Limited - - 5.98 14.03 - - - - - -Oberoi Hotels Pvt Ltd - - - - 0.55 0.51 - - - -Total 3.34 9.60 6.86 15.44 0.55 0.51 - - - - Contribution of Gratuity FundEIH Employee’s Gratuity Fund - - - - - - - - 99.36 62.99 Total - - - - - - - - 99.36 62.99 Refund of Gratuity EIH Employee’s Gratuity Fund - - - - - - - - 89.23 144.58 Total - - - - - - - - 89.23 144.58
Rupees MillionNATURE OF TRANSACTIONS Subsidiaries Associate & Joint
VenturesEnterprises in which
Key Management Person-
nelhave Joint Control
Key Management Personnel/
Relative of Key Management
Personnel
Enterprises which are post employment benefit plan for the
benefit of employees
2017 2016 2017 2016 2017 2016 2017 2016 2017 2016
Notes to Accounts — Contd.
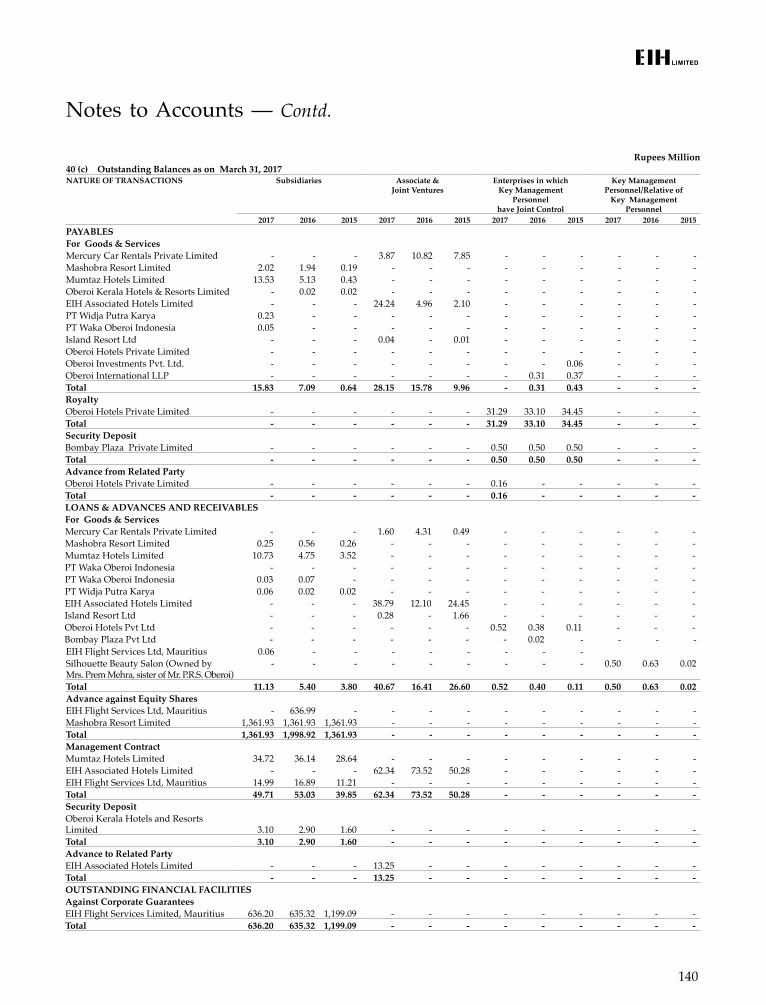
140
Rupees Million40 (c) Outstanding Balances as on March 31, 2017NATURE OF TRANSACTIONS Subsidiaries Associate &
Joint VenturesEnterprises in which
Key Management Personnel
have Joint Control
Key Management Personnel/Relative of
Key Management Personnel
2017 2016 2015 2017 2016 2015 2017 2016 2015 2017 2016 2015PAYABLESFor Goods & ServicesMercury Car Rentals Private Limited - - - 3.87 10.82 7.85 - - - - - -Mashobra Resort Limited 2.02 1.94 0.19 - - - - - - - - -Mumtaz Hotels Limited 13.53 5.13 0.43 - - - - - - - - -Oberoi Kerala Hotels & Resorts Limited - 0.02 0.02 - - - - - - - - -EIH Associated Hotels Limited - - - 24.24 4.96 2.10 - - - - - -PT Widja Putra Karya 0.23 - - - - - - - - - - -PT Waka Oberoi Indonesia 0.05 - - - - - - - - - - -Island Resort Ltd - - - 0.04 - 0.01 - - - - - -Oberoi Hotels Private Limited - - - - - - - - - - - -Oberoi Investments Pvt. Ltd. - - - - - - - - 0.06 - - -Oberoi International LLP - - - - - - - 0.31 0.37 - - -Total 15.83 7.09 0.64 28.15 15.78 9.96 - 0.31 0.43 - - - Royalty Oberoi Hotels Private Limited - - - - - - 31.29 33.10 34.45 - - -Total - - - - - - 31.29 33.10 34.45 - - - Security DepositBombay Plaza Private Limited - - - - - - 0.50 0.50 0.50 - - -Total - - - - - - 0.50 0.50 0.50 - - - Advance from Related PartyOberoi Hotels Private Limited - - - - - - 0.16 - - - - -Total - - - - - - 0.16 - - - - - LOANS & ADVANCES AND RECEIVABLESFor Goods & ServicesMercury Car Rentals Private Limited - - - 1.60 4.31 0.49 - - - - - -Mashobra Resort Limited 0.25 0.56 0.26 - - - - - - - - -Mumtaz Hotels Limited 10.73 4.75 3.52 - - - - - - - - -PT Waka Oberoi Indonesia - - - - - - - - - - - -PT Waka Oberoi Indonesia 0.03 0.07 - - - - - - - - - -PT Widja Putra Karya 0.06 0.02 0.02 - - - - - - - - -EIH Associated Hotels Limited - - - 38.79 12.10 24.45 - - - - - -Island Resort Ltd - - - 0.28 - 1.66 - - - - - -Oberoi Hotels Pvt Ltd - - - - - - 0.52 0.38 0.11 - - -Bombay Plaza Pvt Ltd - - - - - - - 0.02 - - - -EIH Flight Services Ltd, Mauritius 0.06 - - - - - - - -Silhouette Beauty Salon (Owned by Mrs. Prem Mehra, sister of Mr. P.R.S. Oberoi)
- - - - - - - - - 0.50 0.63 0.02
Total 11.13 5.40 3.80 40.67 16.41 26.60 0.52 0.40 0.11 0.50 0.63 0.02 Advance against Equity SharesEIH Flight Services Ltd, Mauritius - 636.99 - - - - - - - - - -Mashobra Resort Limited 1,361.93 1,361.93 1,361.93 - - - - - - - - -Total 1,361.93 1,998.92 1,361.93 - - - - - - - - - Management ContractMumtaz Hotels Limited 34.72 36.14 28.64 - - - - - - - - -EIH Associated Hotels Limited - - - 62.34 73.52 50.28 - - - - - -EIH Flight Services Ltd, Mauritius 14.99 16.89 11.21 - - - - - - - - -Total 49.71 53.03 39.85 62.34 73.52 50.28 - - - - - - Security DepositOberoi Kerala Hotels and Resorts Limited 3.10 2.90 1.60 - - - - - - - - -Total 3.10 2.90 1.60 - - - - - - - - - Advance to Related PartyEIH Associated Hotels Limited - - - 13.25 - - - - - - - -Total - - - 13.25 - - - - - - - - OUTSTANDING FINANCIAL FACILITIESAgainst Corporate GuaranteesEIH Flight Services Limited, Mauritius 636.20 635.32 1,199.09 - - - - - - - - -Total 636.20 635.32 1,199.09 - - - - - - - - -
Notes to Accounts — Contd.
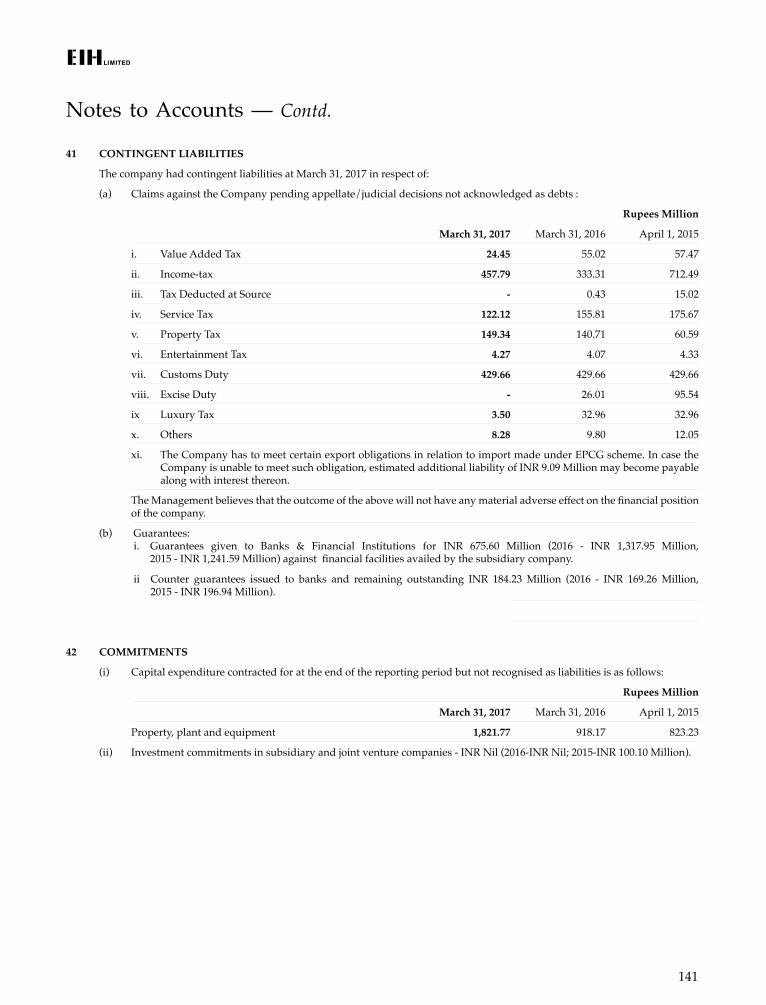
141
41 CONTINGENT LIABILITIES
The company had contingent liabilities at March 31, 2017 in respect of:
(a) Claims against the Company pending appellate/judicial decisions not acknowledged as debts :
Rupees Million
March 31, 2017 March 31, 2016 April 1, 2015
i. Value Added Tax 24.45 55.02 57.47
ii. Income-tax 457.79 333.31 712.49
iii. Tax Deducted at Source - 0.43 15.02
iv. Service Tax 122.12 155.81 175.67
v. Property Tax 149.34 140.71 60.59
vi. Entertainment Tax 4.27 4.07 4.33
vii. Customs Duty 429.66 429.66 429.66
viii. Excise Duty - 26.01 95.54
ix Luxury Tax 3.50 32.96 32.96
x. Others 8.28 9.80 12.05
xi. The Company has to meet certain export obligations in relation to import made under EPCG scheme. In case the Company is unable to meet such obligation, estimated additional liability of INR 9.09 Million may become payable along with interest thereon.
The Management believes that the outcome of the above will not have any material adverse effect on the financial position of the company.
(b) Guarantees: i. Guarantees given to Banks & Financial Institutions for INR 675.60 Million (2016 - INR 1,317.95 Million,
2015 - INR 1,241.59 Million) against financial facilities availed by the subsidiary company.
ii Counter guarantees issued to banks and remaining outstanding INR 184.23 Million (2016 - INR 169.26 Million, 2015 - INR 196.94 Million).
42 COMMITMENTS
(i) Capital expenditure contracted for at the end of the reporting period but not recognised as liabilities is as follows:
Rupees Million
March 31, 2017 March 31, 2016 April 1, 2015
Property, plant and equipment 1,821.77 918.17 823.23
(ii) Investment commitments in subsidiary and joint venture companies - INR Nil (2016-INR Nil; 2015-INR 100.10 Million).
Notes to Accounts — Contd.
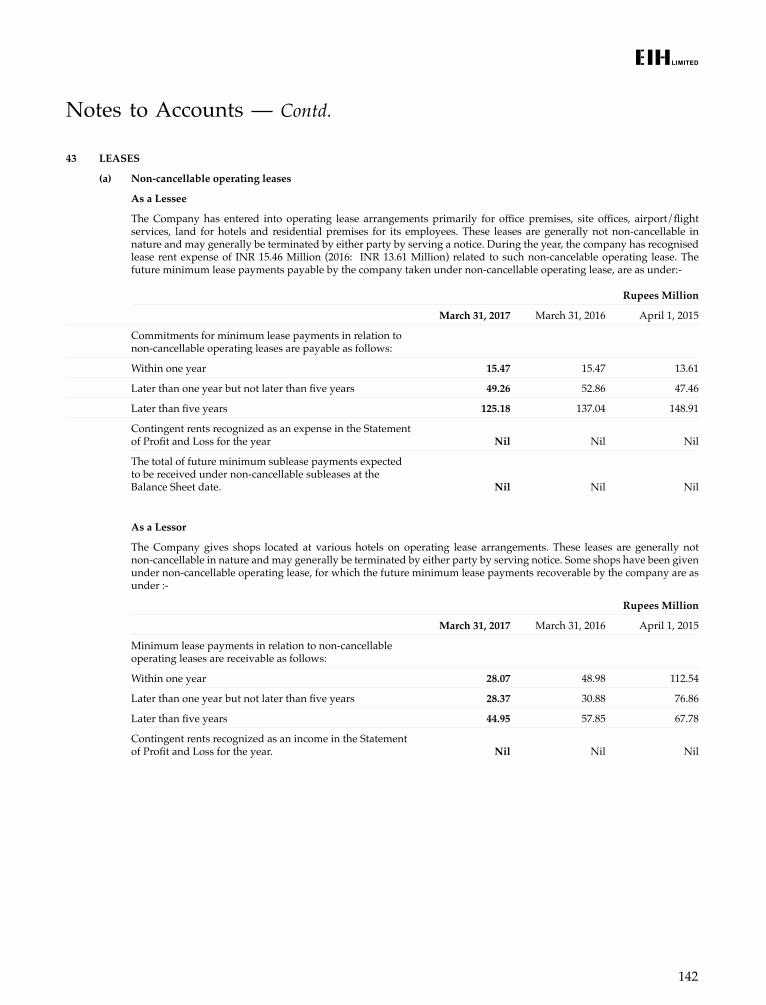
142
43 LEASES
(a) Non-cancellable operating leases
As a Lessee
The Company has entered into operating lease arrangements primarily for office premises, site offices, airport/flight services, land for hotels and residential premises for its employees. These leases are generally not non-cancellable in nature and may generally be terminated by either party by serving a notice. During the year, the company has recognised lease rent expense of INR 15.46 Million (2016: INR 13.61 Million) related to such non-cancelable operating lease. The future minimum lease payments payable by the company taken under non-cancellable operating lease, are as under:-
Rupees Million
March 31, 2017 March 31, 2016 April 1, 2015
Commitments for minimum lease payments in relation to non-cancellable operating leases are payable as follows:
Within one year 15.47 15.47 13.61
Later than one year but not later than five years 49.26 52.86 47.46
Later than five years 125.18 137.04 148.91
Contingent rents recognized as an expense in the Statement of Profit and Loss for the year Nil Nil Nil
The total of future minimum sublease payments expected to be received under non-cancellable subleases at the Balance Sheet date. Nil Nil Nil
As a Lessor
The Company gives shops located at various hotels on operating lease arrangements. These leases are generally not non-cancellable in nature and may generally be terminated by either party by serving notice. Some shops have been given under non-cancellable operating lease, for which the future minimum lease payments recoverable by the company are as under :-
Rupees Million
March 31, 2017 March 31, 2016 April 1, 2015
Minimum lease payments in relation to non-cancellable operating leases are receivable as follows:
Within one year 28.07 48.98 112.54
Later than one year but not later than five years 28.37 30.88 76.86
Later than five years 44.95 57.85 67.78
Contingent rents recognized as an income in the Statement of Profit and Loss for the year. Nil Nil Nil
Notes to Accounts — Contd.
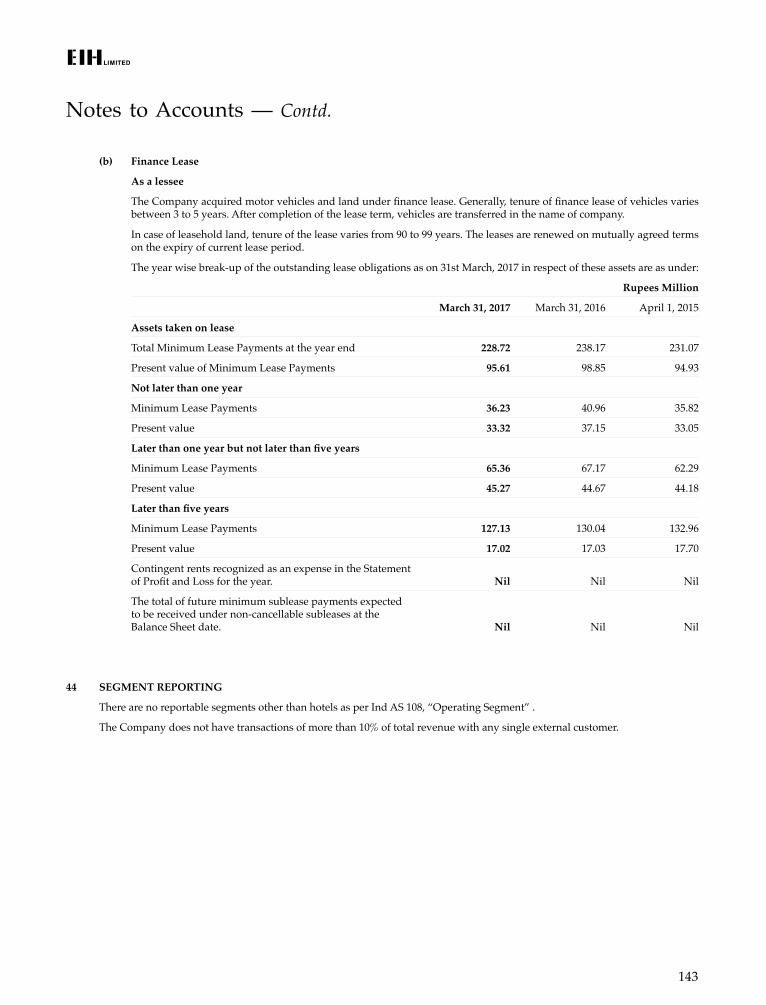
143
(b) Finance Lease
As a lessee
The Company acquired motor vehicles and land under finance lease. Generally, tenure of finance lease of vehicles varies between 3 to 5 years. After completion of the lease term, vehicles are transferred in the name of company.
In case of leasehold land, tenure of the lease varies from 90 to 99 years. The leases are renewed on mutually agreed terms on the expiry of current lease period.
The year wise break-up of the outstanding lease obligations as on 31st March, 2017 in respect of these assets are as under:
Rupees Million
March 31, 2017 March 31, 2016 April 1, 2015
Assets taken on lease
Total Minimum Lease Payments at the year end 228.72 238.17 231.07
Present value of Minimum Lease Payments 95.61 98.85 94.93
Not later than one year
Minimum Lease Payments 36.23 40.96 35.82
Present value 33.32 37.15 33.05
Later than one year but not later than five years
Minimum Lease Payments 65.36 67.17 62.29
Present value 45.27 44.67 44.18
Later than five years
Minimum Lease Payments 127.13 130.04 132.96
Present value 17.02 17.03 17.70
Contingent rents recognized as an expense in the Statement of Profit and Loss for the year. Nil Nil Nil
The total of future minimum sublease payments expected to be received under non-cancellable subleases at the Balance Sheet date. Nil Nil Nil
44 SEGMENT REPORTING
There are no reportable segments other than hotels as per Ind AS 108, “Operating Segment” .
The Company does not have transactions of more than 10% of total revenue with any single external customer.
Notes to Accounts — Contd.
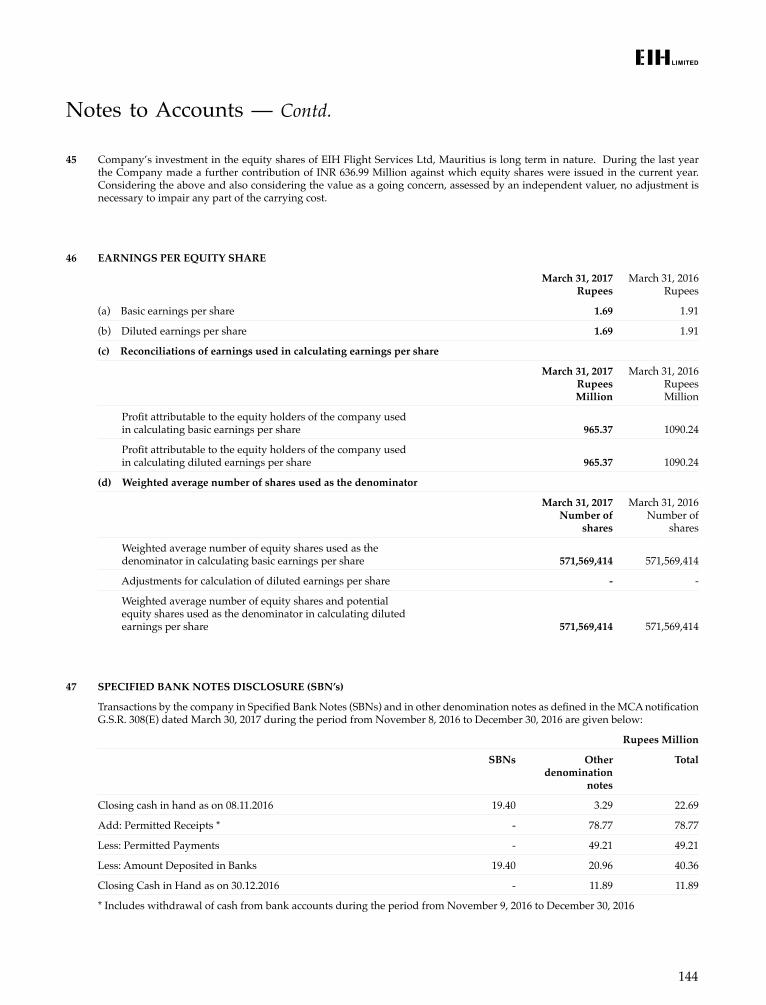
144
45 Company’s investment in the equity shares of EIH Flight Services Ltd, Mauritius is long term in nature. During the last year the Company made a further contribution of INR 636.99 Million against which equity shares were issued in the current year. Considering the above and also considering the value as a going concern, assessed by an independent valuer, no adjustment is necessary to impair any part of the carrying cost.
46 EARNINGS PER EQUITY SHARE
March 31, 2017 Rupees
March 31, 2016 Rupees
(a) Basic earnings per share 1.69 1.91
(b) Diluted earnings per share 1.69 1.91
(c) Reconciliations of earnings used in calculating earnings per share
March 31, 2017 Rupees Million
March 31, 2016 Rupees Million
Profit attributable to the equity holders of the company used in calculating basic earnings per share 965.37 1090.24
Profit attributable to the equity holders of the company used in calculating diluted earnings per share 965.37 1090.24
(d) Weighted average number of shares used as the denominator
March 31, 2017 Number of
shares
March 31, 2016 Number of
shares
Weighted average number of equity shares used as the denominator in calculating basic earnings per share 571,569,414 571,569,414
Adjustments for calculation of diluted earnings per share - -
Weighted average number of equity shares and potential equity shares used as the denominator in calculating diluted earnings per share 571,569,414 571,569,414
47 SPECIFIED BANK NOTES DISCLOSURE (SBN’s)
Transactions by the company in Specified Bank Notes (SBNs) and in other denomination notes as defined in the MCA notification G.S.R. 308(E) dated March 30, 2017 during the period from November 8, 2016 to December 30, 2016 are given below:
Rupees Million
SBNs Other denomination
notes
Total
Closing cash in hand as on 08.11.2016 19.40 3.29 22.69
Add: Permitted Receipts * - 78.77 78.77
Less: Permitted Payments - 49.21 49.21
Less: Amount Deposited in Banks 19.40 20.96 40.36
Closing Cash in Hand as on 30.12.2016 - 11.89 11.89
* Includes withdrawal of cash from bank accounts during the period from November 9, 2016 to December 30, 2016
Notes to Accounts — Contd.
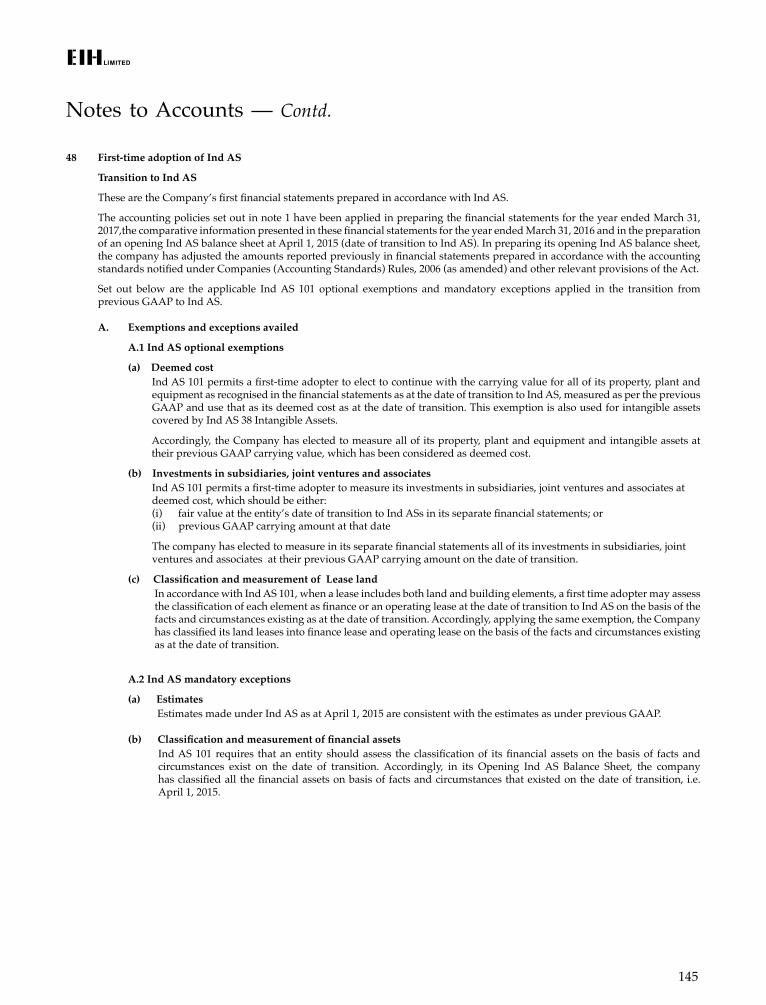
145
48 First-time adoption of Ind AS
Transition to Ind AS
These are the Company’s first financial statements prepared in accordance with Ind AS.
The accounting policies set out in note 1 have been applied in preparing the financial statements for the year ended March 31, 2017,the comparative information presented in these financial statements for the year ended March 31, 2016 and in the preparation of an opening Ind AS balance sheet at April 1, 2015 (date of transition to Ind AS). In preparing its opening Ind AS balance sheet, the company has adjusted the amounts reported previously in financial statements prepared in accordance with the accounting standards notified under Companies (Accounting Standards) Rules, 2006 (as amended) and other relevant provisions of the Act.
Set out below are the applicable Ind AS 101 optional exemptions and mandatory exceptions applied in the transition from previous GAAP to Ind AS.
A. Exemptions and exceptions availed
A.1 Ind AS optional exemptions
(a) Deemed cost Ind AS 101 permits a first-time adopter to elect to continue with the carrying value for all of its property, plant and
equipment as recognised in the financial statements as at the date of transition to Ind AS, measured as per the previous GAAP and use that as its deemed cost as at the date of transition. This exemption is also used for intangible assets covered by Ind AS 38 Intangible Assets.
Accordingly, the Company has elected to measure all of its property, plant and equipment and intangible assets at their previous GAAP carrying value, which has been considered as deemed cost.
(b) Investments in subsidiaries, joint ventures and associates Ind AS 101 permits a first-time adopter to measure its investments in subsidiaries, joint ventures and associates at
deemed cost, which should be either: (i) fair value at the entity’s date of transition to Ind ASs in its separate financial statements; or (ii) previous GAAP carrying amount at that date
The company has elected to measure in its separate financial statements all of its investments in subsidiaries, joint ventures and associates at their previous GAAP carrying amount on the date of transition.
(c) Classification and measurement of Lease land In accordance with Ind AS 101, when a lease includes both land and building elements, a first time adopter may assess
the classification of each element as finance or an operating lease at the date of transition to Ind AS on the basis of the facts and circumstances existing as at the date of transition. Accordingly, applying the same exemption, the Company has classified its land leases into finance lease and operating lease on the basis of the facts and circumstances existing as at the date of transition.
A.2 Ind AS mandatory exceptions
(a) Estimates Estimates made under Ind AS as at April 1, 2015 are consistent with the estimates as under previous GAAP.
(b) Classification and measurement of financial assetsInd AS 101 requires that an entity should assess the classification of its financial assets on the basis of facts and circumstances exist on the date of transition. Accordingly, in its Opening Ind AS Balance Sheet, the company has classified all the financial assets on basis of facts and circumstances that existed on the date of transition, i.e. April 1, 2015.
Notes to Accounts — Contd.
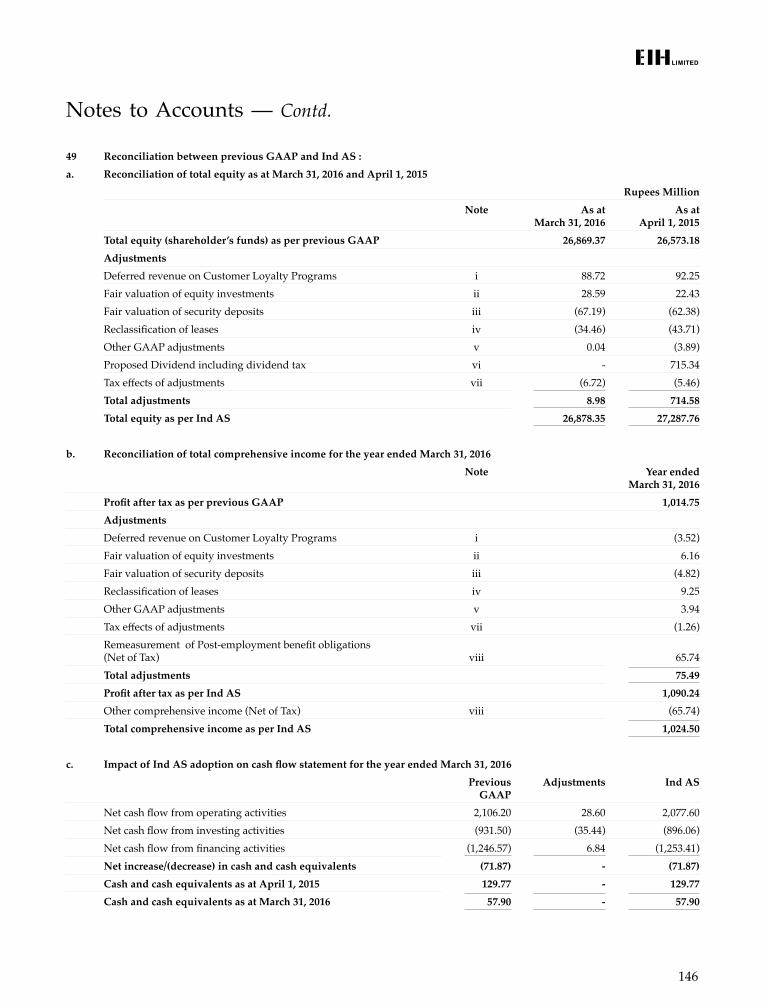
146
49 Reconciliation between previous GAAP and Ind AS :a. Reconciliation of total equity as at March 31, 2016 and April 1, 2015
Rupees MillionNote As at
March 31, 2016As at
April 1, 2015Total equity (shareholder’s funds) as per previous GAAP 26,869.37 26,573.18 AdjustmentsDeferred revenue on Customer Loyalty Programs i 88.72 92.25 Fair valuation of equity investments ii 28.59 22.43 Fair valuation of security deposits iii (67.19) (62.38)Reclassification of leases iv (34.46) (43.71)Other GAAP adjustments v 0.04 (3.89)Proposed Dividend including dividend tax vi - 715.34 Tax effects of adjustments vii (6.72) (5.46)Total adjustments 8.98 714.58 Total equity as per Ind AS 26,878.35 27,287.76
b. Reconciliation of total comprehensive income for the year ended March 31, 2016Note Year ended
March 31, 2016Profit after tax as per previous GAAP 1,014.75 AdjustmentsDeferred revenue on Customer Loyalty Programs i (3.52)Fair valuation of equity investments ii 6.16 Fair valuation of security deposits iii (4.82)Reclassification of leases iv 9.25 Other GAAP adjustments v 3.94 Tax effects of adjustments vii (1.26)Remeasurement of Post-employment benefit obligations (Net of Tax) viii 65.74 Total adjustments 75.49 Profit after tax as per Ind AS 1,090.24 Other comprehensive income (Net of Tax) viii (65.74)Total comprehensive income as per Ind AS 1,024.50
c. Impact of Ind AS adoption on cash flow statement for the year ended March 31, 2016Previous
GAAPAdjustments Ind AS
Net cash flow from operating activities 2,106.20 28.60 2,077.60 Net cash flow from investing activities (931.50) (35.44) (896.06)Net cash flow from financing activities (1,246.57) 6.84 (1,253.41)Net increase/(decrease) in cash and cash equivalents (71.87) - (71.87)Cash and cash equivalents as at April 1, 2015 129.77 - 129.77 Cash and cash equivalents as at March 31, 2016 57.90 - 57.90
Notes to Accounts — Contd.
147
Notes to Accounts — Contd.
i. Deferred revenue on Customer Loyalty Programs The company operates multiple customer reward points program under its hotel business. The programs allows customers to
accumulate points/complimentary room nights on hotel bookings. The points can be redeemed by the customers on future bookings and other services such as dinning, SPA, etc. Under the previous GAAP, the company was creating provision towards its liability under the programs on full value without considering the estimated lapses.
Under Ind AS, sales consideration received has been allocated between the hospitality services and the reward points/complimentary room nights issued. The consideration allocated to the customer reward points/complimentary room nights has been deferred and will be recognised as revenue when the reward points/complimentary room nights are redeemed or lapsed. The consideration to be allocated to the customer reward points/complimentary room nights has been determined considering the past estimated lapses on the basis of past trend. Accordingly, the company has recognised deferred revenue with corresponding adjustment to retained earnings. The provision created under previous GAAP has been reversed with a credit to retained earnings.
ii. Fair valuation of equity investments The company holds investment in Equity Shares of entities other than subsidiaries, associate and joint venture. Under previous
GAAP such investments were measured at cost less provision for other than temporary nature diminution in the value of investment.
Under Ind AS, these investments has been measured at fair value. The company has categorised these investments as fair value through profit and loss (FVTPL) and any changes in fair value of those investment has been recognised in the statement of profit and loss.
iii. Fair valuation of security deposits Under the previous GAAP, interest free lease security deposits assets (that are refundable in cash on completion of the contract
term) are recorded at their transaction value. Under Ind AS, all financial assets are required to be recognised at fair value at initial recognition and subsequently at amortised cost. Accordingly, The company has fair valued these security deposits under Ind AS. Difference between the fair value and transaction value of the security deposit has been recognised as prepaid rent.
Under the previous GAAP, interest free lease security deposits liability (that are refundable in cash on completion of the contract term) are recorded at their transaction value. Under Ind AS, these financial liabilities are required to be recognised at fair value at initial recognition and subsequently at amortised cost. Accordingly, The company has fair valued these security deposits under Ind AS. Difference between the fair value and transaction value of the security deposit has been recognised as advance rent.
iv. Reclassification of leases Under Previous GAAP due to no availability of guidance on how land leases should be classified, the company has capitalised the
leasehold land with the initial cost incurred to enter into the lease agreement along with the upfront payment of future lease rent. Annual lease rent payment were charged to the profit and loss on annual basis.
Under Ind AS, land lease has been classified into finance and operating leases. In cases where land leases has been classified as finance lease on the basis of factors such as renewal right with the company, etc., finance lease obligations has been recognised for the future lease rent payable over the primary period of lease with corresponding impact to the retained earnings as these lands were already revalued at there fair value under previous GAAP.
In cases where land leases has been classified as operating leases, carrying value of the respective leasehold land has been reclassified to prepaid rent from property, plant and equipments.
v. Other GAAP adjustments Other GAAP adjustments include adjustment related to remeasurnment and recognition of certain assets and liabilities in
accordance with Ind AS which are not material in nature.
vi. Proposed Dividend including dividend tax Under the previous GAAP, dividends proposed by the board of directors after the balance sheet date but before the approval of
the financial statements were considered as adjusting events. Accordingly, provision for proposed dividend was recognised as a liability. Under Ind AS, such dividends are recognised when the same is approved by the shareholders in the general meeting. Accordingly, the liability for proposed dividend included under provisions has been reversed with corresponding adjustment to retained earnings.
148
vii. Tax effects of adjustments Additional deferred tax asset/(liability) has been recognised corresponding to the adjustments to retained earnings/profit and
loss as a result of Ind AS Implementation.
viii. Remeasurement of Post-employment benefit obligations (Net of Tax) Under Ind AS, all items of income and expense recognised in a period should be included in profit and loss for the period, unless
a standard requires or permits otherwise. Items of income and expense that are not recognised in profit and loss but are shown in the statement of profit and loss as ‘other comprehensive income’ includes remeasurements of defined benefit plans. The concept of other comprehensive income did not exist under previous GAAP. Accordingly, loss on remeasurements of post-employment benefit obligation has been reclassified to the Other Comprehensive Income for the period.
50. The financial statements were authorised for issue by the Board of Directors on 30th May, 2017.
Notes to Accounts — Contd.
EIH Limited CONSOLIDATED FINANCIAL STATEMENTS

(CONSOLIDATED)
150
(CONSOLIDATED)
151
INDEPENDENT AUDITOR’S REPORT
To The Members of EIH Limited
Report on the Consolidated Ind AS Financial StatementsWe have audited the accompanying consolidated Ind AS financial statements of EIH Limited (hereinafter referred to as “the Holding Company”) and its subsidiaries (the Holding Company and its subsidiaries together referred to as “the Group”), its associates and joint ventures, comprising the consolidated balance sheet as at March 31, 2017, the consolidated statement of profit and loss (including other comprehensive income), the consolidated statement of cash flow and the consolidated statement of changes in equity for the year then ended, and a summary of the significant accounting policies and other explanatory information (hereinafter referred to as “the consolidated Ind AS financial statements”).
Management’s Responsibility for the Consolidated Ind AS Financial StatementsThe Holding Company’s Board of Directors is responsible for the preparation of these consolidated Ind AS financial statements in terms of the requirements of the Companies Act, 2013 (hereinafter referred to as “the Act”) that give a true and fair view of the consolidated financial position, consolidated financial performance (including other comprehensive income), consolidated cash flows and consolidated statement of changes in equity of the Group including its associates and joint ventures in accordance with accounting principles generally accepted in India including the Indian Accounting Standards (Ind AS) specified under section 133 of the Act, read with Rule 7 of the Companies (Accounts) Rules 2014. The respective Board of Directors of the companies included in the Group and of its associates and joint ventures are responsible for maintenance of adequate accounting records in accordance with the provisions of the Act for safeguarding the assets of the Group and its associates and joint ventures and for preventing and detecting frauds and other irregularities; the selection and application of appropriate accounting polices; making judgements and estimates that are reasonable and prudent; and the design, implementation and maintenance of adequate internal financial controls, that were operating effectively for ensuring the accuracy and completeness of the accounting records, relevant to the preparation and presentation of the financial statements that give a true and fair view and are free from material misstatement, whether due to fraud or error, which has been used for the purpose of preparation of the consolidated Ind AS financial statements by the Directors of the Holding Company, as aforesaid.
Auditor’s ResponsibilityOur responsibility is to express an opinion on these consolidated Ind AS financial statements based on our audit. We have taken into account the provisions of the Act, the accounting and auditing standards and matters which are required to be included in the audit report under the provision of the Act and the Rules made thereunder.
We conducted our audit of the consolidated Ind AS financial statements in accordance with the Standards on Auditing specified under Section 143 (10) of the Act. Those Standards require that we comply with ethical requirements and plan and perform the audit to obtain reasonable assurance about whether the consolidated Ind AS financial statements are free from material misstatement.
An audit involves performing procedures to obtain audit evidence about the amounts and disclosures in the consolidated Ind AS financial statements. The procedures selected depend on the auditor’s judgment, including the assessment of the risks of material misstatement of the consolidated Ind AS financial statements, whether due to fraud or
(CONSOLIDATED)
152
error. In making those risk assessments, the auditor considers internal financial control relevant to the Holding Company’s preparation of the consolidated Ind AS financial statements that give a true and fair view in order to design audit procedures that are appropriate in the circumstances. An audit also includes evaluating the appropriateness of the accounting policies used and the reasonableness of the accounting estimates made by the Holding Company’s Board of Directors, as well as evaluating the overall presentation of the consolidated Ind AS financial statements. We believe that the audit evidence obtained by us and the audit evidence obtained by the other auditors in terms of their reports referred to in the “Other Matters” paragraph below, is sufficient and appropriate to provide a basis for our audit opinion on the consolidated Ind AS financial statements.
OpinionIn our opinion and to the best of our information and according to the explanations given to us and based on the consideration of reports of other auditors on separate financial statements and on the other financial information of the subsidiaries, associates and joint ventures, the aforesaid consolidated Ind AS financial statements give the information required by the Act in the manner so required and give a true and fair view in conformity with the accounting principles generally accepted in India including the Ind AS, of the consolidated financial position of the Group and its associates and joint ventures as at March 31, 2017, and their consolidated profit/(loss) including other comprehensive income, their consolidated cash flows and consolidated statement of changes in equity for the year ended on that date.
Emphasis of MatterWe draw attention to the following matter in the Notes to the consolidated Ind AS financial statements:
Note 3(ii) to the consolidated Ind AS financial statements regarding disclosure of advance towards equity shares in Mashobra Resort Limited and allotment of shares pending settlement of legal issues between Government of Himachal Pradesh and EIH Limited. The said note describes the uncertainty related to the outcome of the above legal matters and accordingly the impact, if any, on the consolidated Ind AS financial statements has not been ascertained. As such the uncertainty of the allotment of shares still continues.Our opinion is not modified in respect of this matter.
Other Mattersi. We did not audit the financial statements of Ten subsidiaries, whose financial
statements reflect total assets of Rs. 7848.17 Million and net assets of Rs 6438.92 Million as at 31st March, 2017, total revenues of Rs. 2266.64 Million and net cash flows amounting to Rs. (297.25) Million for the year ended on that date, as considered in the consolidated Ind AS financial statements. The consolidated Ind AS financial statements also include the Group`s share of net profit Rs (70.67) Million and total comprehensive income of Rs (70.20) Million for the year ended 31st March, 2017, as considered in the consolidated Ind AS financial statements in respect of one joint venture, whose financial statements has not been audited by us. These financial statements have been audited by other auditors whose reports have been furnished to us by the Management and our opinion on the consolidated Ind AS financial statements, in so far as it relates to the amounts and disclosures included in respect of these subsidiaries and joint ventures, and our report in terms of sub-sections (3) of Section 143 of the Act, insofar as it relates to the aforesaid subsidiaries and joint venture, is based solely on the reports of the other auditors.
(CONSOLIDATED)
153
Certain of these subsidiaries and one joint venture are located outside India whose financial statements and other financial information have been prepared in accordance with accounting principles generally accepted in their respective countries and which have been audited by other auditors under generally accepted auditing standards applicable in their respective countries. The Company’s management has converted the financial statements of such subsidiaries and one joint venture located outside India from accounting principles generally accepted in their respective countries to accounting principles generally accepted in India. We have audited these conversion adjustments made by the Company’s management. Our opinion in so far as it relates to the balances and affairs of such subsidiaries and one joint venture located outside India is based on the report of other auditors and the conversion adjustments prepared by the management of the Company and audited by us.
Our opinion on the consolidated Ind AS financial statements, and our report on Other Legal and Regulatory Requirements below, are not modified in respect of the above matters with respect to our reliance on the work done and the reports of the other auditors.
ii. The comparative financial information of the Group, its associates and joint ventures for the year ended March 31, 2016 and the transition date opening balance sheet as at April 1, 2015 included in these consolidated Ind AS financial statements, are the consolidated figures of separate Ind AS financial statements of EIH Limited (holding company), its subsidiaries, its associates and joint ventures incorporated in India and outside India. Separate Ind AS financial statements of holding company, its subsidiaries, associates and its joint venture incorporated in India are audited by us except one subsidiary company whose separate Ind AS financial statements are audited by another auditor. Separate financial statements of nine subsidiaries and one joint venture which are incorporated outside India have been prepared in accordance with accounting principles generally accepted in their respective countries and which have been audited by other auditors under generally accepted auditing standards applicable in their respective countries. We have audited the conversion adjustments made by the Company’s management. Our opinion in so far as it relates to the balances and affairs of such subsidiaries and one joint venture located outside India is based on the report of other auditors and the conversion adjustments prepared by the management of the Company and audited by us.
Our opinion is not qualified in respect of these matters.
Report on Other Legal and Regulatory Requirements1. As required by Section 143 (3) of the Act, we report, to the extent applicable, that: (a) We have sought and obtained all the information and explanations which to
the best of our knowledge and belief were necessary for the purposes of our audit of the aforesaid consolidated Ind AS financial statements.
(b) In our opinion, proper books of account as required by law relating to preparation of the aforesaid consolidated Ind AS financial statements have been kept so far as it appears from our examination of those books and the reports of the other auditors.
(c) The consolidated balance Sheet, the consolidated statement of profit and loss, the consolidated statement of cash flow and consolidated statement of changes in equity, dealt with by this Report are in agreement with the relevant books of account maintained for the purpose of preparation of the consolidated Ind AS financial statements.
(CONSOLIDATED)
154
(d) In our opinion, the aforesaid consolidated Ind AS financial statements comply with the Accounting Standards specified under Section 133 of the Act, read with Rule 7 of the Companies (Accounts) Rules, 2014.
(e) On the basis of the written representations received from the directors of the Holding Company as on 31st March, 2017 taken on record by the Board of Directors of the Holding Company and the reports of the statutory auditors of its subsidiary companies, associate companies and joint ventures incorporated in India, none of the directors of the Group companies, its associate companies and joint ventures incorporated in India is disqualified as on 31st March, 2017 from being appointed as a director in terms of Section 164 (2) of the Act.
(f) With respect to the adequacy of the internal financial controls over financial reporting of the Holding Company, its subsidiaries companies, associate companies and joint ventures incorporated in India and the operating effectiveness of such controls, refer to our separate report in Annexure.
(g) With respect to the other matters to be included in the Auditor’s Report in accordance with Rule 11 of the Companies (Audit and Auditor’s) Rules, 2014 read with the Companies (Audit and Auditors) Amendment Rules, 2017, in our opinion and to the best of our information and according to the explanations given to us and based on the consideration of the report of the other auditors on separate financial statements as also the other financial information of the subsidiaries, associates and joint ventures as noted in the “Other Matters” paragraph:
i. The consolidated Ind AS financial statements disclose the impact of pending litigation on the consolidated financial position in its consolidated Ind AS financial statements in respect of claims and demands of the Group, its associates and joint ventures which are being contested as mentioned in Note 43 (a) and 3 (ii).
ii. The Group, its associates and joint ventures did not have any long-term contracts including derivative contracts for which there were any material foreseeable losses.
iii. There has been no delay in transferring amounts, required to be transferred, to the Investor Education and Protection Fund by the Holding Company and its subsidiary companies, associate companies and joint ventures incorporated in India during the year ended 31.03.2017.
iv. The Group has provided requisite disclosures in the consolidated Ind AS financial statements as to the holdings as well as dealings in Specified Bank Notes during the period from 8th November, 2016 to 30th December, 2016 of the holding company and its subsidiaries, which are incorporated in India. Based on the separate financial statements of holding company and the reports of the statutory auditors of subsidiary companies, we report that the disclosures are in accordance with books of account maintained by the Group and its subsidiaries incorporated in India. Refer Note 53 to the consolidated Ind AS financial statements.
For RAY & RAYChartered Accountants
(Firm’s Registration No.301072E)
(R.N. Roy) Place: Gurugram Partner Date: 30th May, 2017 Membership No. 8608
(CONSOLIDATED)
155
ANNEXURE TO THE INDEPENDENT AUDITOR’S REPORT OF EVEN DATE ON THECONSOLIDATED IND AS FINANCIAL STATEMENTS OF EIH LIMITED
Report on the Internal Financial Controls under Clause (i) of Sub-section 3 of Section 143 of the Companies Act, 2013 (“the Act”)In conjunction with our audit of the consolidated Ind AS financial statements of the Company for the year ended March 31, 2017, we have audited the internal financial controls over financial reporting of EIH Limited (hereinafter referred to as “the Holding Company”) and its subsidiary companies, its associate companies and joint ventures incorporated in India, as of that date, except one of its subsidiary company, Mumtaz Hotels Ltd which is not audited by us.
Management’s Responsibility for Internal Financial ControlsThe respective Board of Directors of the Holding Company, its subsidiary companies, its associate companies and joint ventures, which are companies incorporated in India, are responsible for establishing and maintaining internal financial controls based on the internal control over financial reporting criteria established by the Company considering the essential components of internal control stated in the Guidance Note on Audit of Internal Financial Controls over Financial Reporting issued by the Institute of Chartered Accountants of India(‘ICAI’). These responsibilities include the design, implementation and maintenance of adequate internal financial controls that were operating effectively for ensuring the orderly and efficient conduct of its business, including adherence to the respective company’s policies, the safeguarding of its assets, the prevention and detection of frauds and errors, the accuracy and completeness of the accounting records, and the timely preparation of reliable financial information, as required under the Companies Act, 2013.
Auditor’s ResponsibilityOur responsibility is to express an opinion on the Company’s internal financial controls over financial reporting based on our audit. We conducted our audit in accordance with the Guidance Note on Audit of Internal Financial Controls Over Financial Reporting (the “Guidance Note”) issued by the ICAI and the Standards on Auditing, issued by ICAI and deemed to be prescribed under section 143(10) of the Companies Act, 2013, to the extent applicable to an audit of internal financial controls, both issued by the Institute of Chartered Accountants of India. Those Standards and the Guidance Note require that we comply with ethical requirements and plan and perform the audit to obtain reasonable assurance about whether adequate internal financial controls over financial reporting was established and maintained and if such controls operated effectively in all material respects.
Our audit involves performing procedures to obtain audit evidence about the adequacy of the internal financial controls system over financial reporting and their operating effectiveness. Our audit of internal financial controls over financial reporting included obtaining an understanding of internal financial controls over financial reporting, assessing the risk that a material weakness exists, and testing and evaluating the design and operating effectiveness of internal control based on the assessed risk. The procedures selected depend on the auditors’ judgment, including the assessment of the risks of material misstatement of the consolidated Ind AS financial statements, whether due to fraud or error.
(CONSOLIDATED)
156
We believe that the audit evidence we have obtained and the audit evidence obtained by the other auditors in terms of their reports referred to in the “Other Matters” paragraph below, is sufficient and appropriate to provide a basis for our audit opinion on the Company’s internal financial controls system over financial reporting.
Meaning of Internal Financial Controls Over Financial ReportingA company’s internal financial control over financial reporting is a process designed to provide reasonable assurance regarding the reliability of financial reporting and the preparation of consolidated Ind AS financial statements for external purposes in accordance with generally accepted accounting principles. A company’s internal financial control over financial reporting includes those policies and procedures that (1) pertain to the maintenance of records that, in reasonable detail, accurately and fairly reflect the transactions and dispositions of the assets of the company; (2) provide reasonable assurance that transactions are recorded as necessary to permit preparation of consolidated Ind AS financial statements in accordance with generally accepted accounting principles, and that receipts and expenditures of the company are being made only in accordance with authorisations of management and directors of the company; and (3) provide reasonable assurance regarding prevention or timely detection of unauthorised acquisition, use, or disposition of the company’s assets that could have a material effect on the consolidated Ind AS financial statements.
Inherent Limitations of Internal Financial Controls Over Financial ReportingBecause of the inherent limitations of internal financial controls over financial reporting, including the possibility of collusion or improper management override of controls, material misstatements due to error or fraud may occur and not be detected. Also, projections of any evaluation of the internal financial controls over financial reporting to future periods are subject to the risk that the internal financial control over financial reporting may become inadequate because of changes in conditions, or that the degree of compliance with the policies or procedures may deteriorate.
OpinionIn our opinion, the Holding Company, its subsidiary companies, its associate companies and joint ventures, which are incorporated in India, have, in all material respects, an adequate internal financial controls system over financial reporting and such internal financial controls over financial reporting were operating effectively as at March 31,2017, based on the internal control over financial reporting criteria established by the companies considering the essential components of internal control stated in the Guidance Note on Audit of Internal Financial Controls Over Financial Reporting issued by the Institute of Chartered Accountants of India.
Other MattersOur aforesaid reports under Section 143(3)(i) of the Act on the adequacy and operating effectiveness of the internal financial controls over financial reporting in so far as it relates to Mumtaz Hotels Limited, whose separate Ind AS financial statements reflect total assets of Rs. 1168.49 Million and net assets of Rs 902.66 Million as at 31st March, 2017, total revenues of Rs. 1014.99 Million, Net profit Rs 293.56 Million (total comprehensive income
(CONSOLIDATED)
157
Rs 292.89 Million) and net cash flows amounting to Rs. (238.67) Million for the year ended on that date, as considered in the consolidated Ind AS financial statements and which is a company incorporated in India, is based on the corresponding report of the auditor of Mumtaz Hotels Ltd.
Reporting on Internal Financial Controls over financial reporting is not applicable to subsidiaries and joint ventures incorporated outside India.
For RAY & RAYChartered Accountants
(Firm’s Registration No.301072E)
(R.N. Roy) Place: Gurugram Partner Date: 30th May, 2017 Membership No. 8608
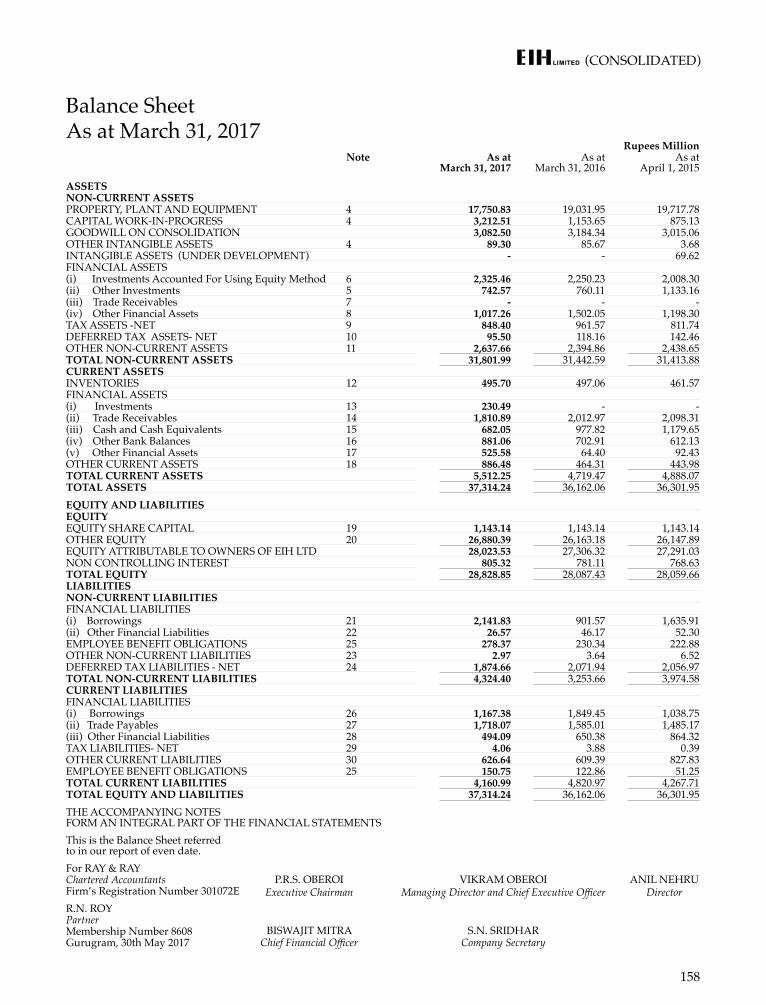
(CONSOLIDATED)
158
Balance Sheet As at March 31, 2017
Rupees MillionNote As at
March 31, 2017 As at
March 31, 2016 As at
April 1, 2015 ASSETSNON-CURRENT ASSETSPROPERTY, PLANT AND EQUIPMENT 4 17,750.83 19,031.95 19,717.78 CAPITAL WORK-IN-PROGRESS 4 3,212.51 1,153.65 875.13 GOODWILL ON CONSOLIDATION 3,082.50 3,184.34 3,015.06 OTHER INTANGIBLE ASSETS 4 89.30 85.67 3.68 INTANGIBLE ASSETS (UNDER DEVELOPMENT) - - 69.62 FINANCIAL ASSETS(i) Investments Accounted For Using Equity Method 6 2,325.46 2,250.23 2,008.30 (ii) Other Investments 5 742.57 760.11 1,133.16 (iii) Trade Receivables 7 - - - (iv) Other Financial Assets 8 1,017.26 1,502.05 1,198.30 TAX ASSETS -NET 9 848.40 961.57 811.74 DEFERRED TAX ASSETS- NET 10 95.50 118.16 142.46 OTHER NON-CURRENT ASSETS 11 2,637.66 2,394.86 2,438.65 TOTAL NON-CURRENT ASSETS 31,801.99 31,442.59 31,413.88 CURRENT ASSETSINVENTORIES 12 495.70 497.06 461.57 FINANCIAL ASSETS(i) Investments 13 230.49 - - (ii) Trade Receivables 14 1,810.89 2,012.97 2,098.31 (iii) Cash and Cash Equivalents 15 682.05 977.82 1,179.65 (iv) Other Bank Balances 16 881.06 702.91 612.13 (v) Other Financial Assets 17 525.58 64.40 92.43 OTHER CURRENT ASSETS 18 886.48 464.31 443.98 TOTAL CURRENT ASSETS 5,512.25 4,719.47 4,888.07 TOTAL ASSETS 37,314.24 36,162.06 36,301.95 EQUITY AND LIABILITIESEQUITYEQUITY SHARE CAPITAL 19 1,143.14 1,143.14 1,143.14 OTHER EQUITY 20 26,880.39 26,163.18 26,147.89 EQUITY ATTRIBUTABLE TO OWNERS OF EIH LTD 28,023.53 27,306.32 27,291.03 NON CONTROLLING INTEREST 805.32 781.11 768.63 TOTAL EQUITY 28,828.85 28,087.43 28,059.66 LIABILITIESNON-CURRENT LIABILITIESFINANCIAL LIABILITIES(i) Borrowings 21 2,141.83 901.57 1,635.91 (ii) Other Financial Liabilities 22 26.57 46.17 52.30 EMPLOYEE BENEFIT OBLIGATIONS 25 278.37 230.34 222.88 OTHER NON-CURRENT LIABILITIES 23 2.97 3.64 6.52 DEFERRED TAX LIABILITIES - NET 24 1,874.66 2,071.94 2,056.97 TOTAL NON-CURRENT LIABILITIES 4,324.40 3,253.66 3,974.58 CURRENT LIABILITIESFINANCIAL LIABILITIES(i) Borrowings 26 1,167.38 1,849.45 1,038.75 (ii) Trade Payables 27 1,718.07 1,585.01 1,485.17 (iii) Other Financial Liabilities 28 494.09 650.38 864.32 TAX LIABILITIES- NET 29 4.06 3.88 0.39 OTHER CURRENT LIABILITIES 30 626.64 609.39 827.83 EMPLOYEE BENEFIT OBLIGATIONS 25 150.75 122.86 51.25 TOTAL CURRENT LIABILITIES 4,160.99 4,820.97 4,267.71 TOTAL EQUITY AND LIABILITIES 37,314.24 36,162.06 36,301.95 THE ACCOMPANYING NOTES FORM AN INTEGRAL PART OF THE FINANCIAL STATEMENTSThis is the Balance Sheet referred to in our report of even date.For RAY & RAYChartered AccountantsFirm’s Registration Number 301072ER.N. ROY PartnerMembership Number 8608Gurugram, 30th May 2017
P.R.S. OBEROI VIKRAM OBEROI ANIL NEHRU Executive Chairman Managing Director and Chief Executive Officer Director
BISWAJIT MITRA S.N. SRIDHAR Chief Financial Officer Company Secretary
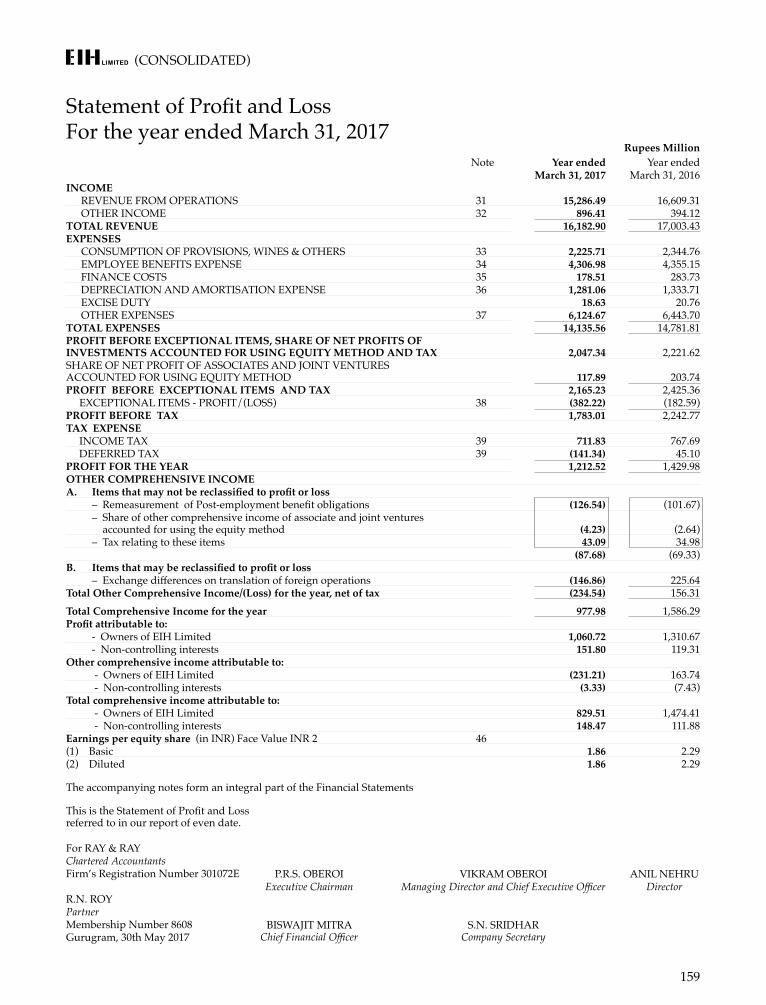
(CONSOLIDATED)
159
Statement of Profit and Loss For the year ended March 31, 2017
Rupees Million Note Year ended
March 31, 2017 Year ended
March 31, 2016INCOME
REVENUE FROM OPERATIONS 31 15,286.49 16,609.31 OTHER INCOME 32 896.41 394.12
TOTAL REVENUE 16,182.90 17,003.43 EXPENSES
CONSUMPTION OF PROVISIONS, WINES & OTHERS 33 2,225.71 2,344.76 EMPLOYEE BENEFITS EXPENSE 34 4,306.98 4,355.15 FINANCE COSTS 35 178.51 283.73 DEPRECIATION AND AMORTISATION EXPENSE 36 1,281.06 1,333.71 EXCISE DUTY 18.63 20.76 OTHER EXPENSES 37 6,124.67 6,443.70
TOTAL EXPENSES 14,135.56 14,781.81 PROFIT BEFORE EXCEPTIONAL ITEMS, SHARE OF NET PROFITS OF INVESTMENTS ACCOUNTED FOR USING EQUITY METHOD AND TAX 2,047.34 2,221.62 SHARE OF NET PROFIT OF ASSOCIATES AND JOINT VENTURES ACCOUNTED FOR USING EQUITY METHOD 117.89 203.74 PROFIT BEFORE EXCEPTIONAL ITEMS AND TAX 2,165.23 2,425.36 EXCEPTIONAL ITEMS - PROFIT/(LOSS) 38 (382.22) (182.59)PROFIT BEFORE TAX 1,783.01 2,242.77 TAX EXPENSE INCOME TAX 39 711.83 767.69 DEFERRED TAX 39 (141.34) 45.10 PROFIT FOR THE YEAR 1,212.52 1,429.98 OTHER COMPREHENSIVE INCOMEA. Items that may not be reclassified to profit or loss
– Remeasurement of Post-employment benefit obligations (126.54) (101.67)– Share of other comprehensive income of associate and joint ventures
accounted for using the equity method (4.23) (2.64)– Tax relating to these items 43.09 34.98
(87.68) (69.33)B. Items that may be reclassified to profit or loss
– Exchange differences on translation of foreign operations (146.86) 225.64 Total Other Comprehensive Income/(Loss) for the year, net of tax (234.54) 156.31 Total Comprehensive Income for the year 977.98 1,586.29 Profit attributable to:
- Owners of EIH Limited 1,060.72 1,310.67 - Non-controlling interests 151.80 119.31
Other comprehensive income attributable to: - Owners of EIH Limited (231.21) 163.74 - Non-controlling interests (3.33) (7.43)
Total comprehensive income attributable to: - Owners of EIH Limited 829.51 1,474.41 - Non-controlling interests 148.47 111.88
Earnings per equity share (in INR) Face Value INR 2 46(1) Basic 1.86 2.29 (2) Diluted 1.86 2.29
The accompanying notes form an integral part of the Financial Statements
This is the Statement of Profit and Loss referred to in our report of even date.
For RAY & RAYChartered AccountantsFirm’s Registration Number 301072E
R.N. ROYPartnerMembership Number 8608Gurugram, 30th May 2017
P.R.S. OBEROI VIKRAM OBEROI ANIL NEHRU Executive Chairman Managing Director and Chief Executive Officer Director
BISWAJIT MITRA S.N. SRIDHAR Chief Financial Officer Company Secretary
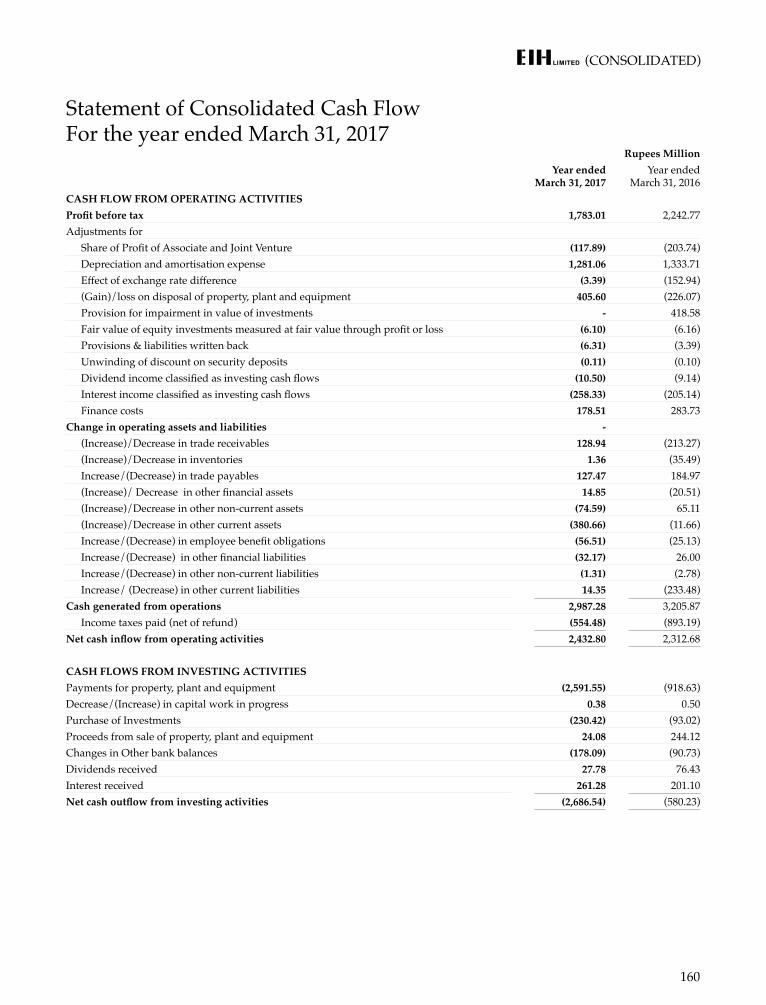
(CONSOLIDATED)
160
Statement of Consolidated Cash Flow For the year ended March 31, 2017
Rupees MillionYear ended
March 31, 2017Year ended
March 31, 2016CASH FLOW FROM OPERATING ACTIVITIESProfit before tax 1,783.01 2,242.77 Adjustments for
Share of Profit of Associate and Joint Venture (117.89) (203.74)Depreciation and amortisation expense 1,281.06 1,333.71 Effect of exchange rate difference (3.39) (152.94)(Gain)/loss on disposal of property, plant and equipment 405.60 (226.07)Provision for impairment in value of investments - 418.58 Fair value of equity investments measured at fair value through profit or loss (6.10) (6.16)Provisions & liabilities written back (6.31) (3.39)Unwinding of discount on security deposits (0.11) (0.10)Dividend income classified as investing cash flows (10.50) (9.14)Interest income classified as investing cash flows (258.33) (205.14)Finance costs 178.51 283.73
Change in operating assets and liabilities - (Increase)/Decrease in trade receivables 128.94 (213.27)(Increase)/Decrease in inventories 1.36 (35.49)Increase/(Decrease) in trade payables 127.47 184.97 (Increase)/ Decrease in other financial assets 14.85 (20.51)(Increase)/Decrease in other non-current assets (74.59) 65.11 (Increase)/Decrease in other current assets (380.66) (11.66)Increase/(Decrease) in employee benefit obligations (56.51) (25.13)Increase/(Decrease) in other financial liabilities (32.17) 26.00 Increase/(Decrease) in other non-current liabilities (1.31) (2.78)Increase/ (Decrease) in other current liabilities 14.35 (233.48)
Cash generated from operations 2,987.28 3,205.87 Income taxes paid (net of refund) (554.48) (893.19)
Net cash inflow from operating activities 2,432.80 2,312.68
CASH FLOWS FROM INVESTING ACTIVITIESPayments for property, plant and equipment (2,591.55) (918.63)Decrease/(Increase) in capital work in progress 0.38 0.50 Purchase of Investments (230.42) (93.02)Proceeds from sale of property, plant and equipment 24.08 244.12 Changes in Other bank balances (178.09) (90.73)Dividends received 27.78 76.43 Interest received 261.28 201.10 Net cash outflow from investing activities (2,686.54) (580.23)
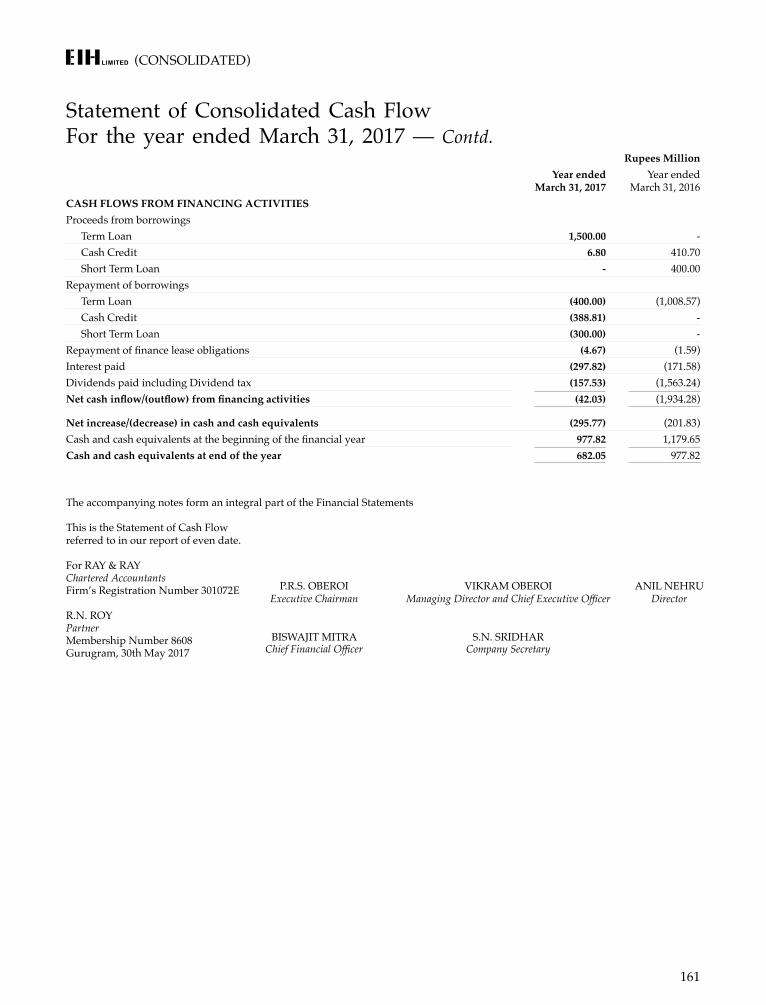
(CONSOLIDATED)
161
Statement of Consolidated Cash Flow For the year ended March 31, 2017 — Contd.
Rupees MillionYear ended
March 31, 2017Year ended
March 31, 2016CASH FLOWS FROM FINANCING ACTIVITIESProceeds from borrowings
Term Loan 1,500.00 - Cash Credit 6.80 410.70 Short Term Loan - 400.00
Repayment of borrowingsTerm Loan (400.00) (1,008.57)Cash Credit (388.81) - Short Term Loan (300.00) -
Repayment of finance lease obligations (4.67) (1.59)Interest paid (297.82) (171.58)Dividends paid including Dividend tax (157.53) (1,563.24)Net cash inflow/(outflow) from financing activities (42.03) (1,934.28)
Net increase/(decrease) in cash and cash equivalents (295.77) (201.83)Cash and cash equivalents at the beginning of the financial year 977.82 1,179.65 Cash and cash equivalents at end of the year 682.05 977.82
The accompanying notes form an integral part of the Financial Statements
This is the Statement of Cash Flow referred to in our report of even date.
For RAY & RAYChartered AccountantsFirm’s Registration Number 301072E
R.N. ROYPartnerMembership Number 8608Gurugram, 30th May 2017
P.R.S. OBEROI VIKRAM OBEROI ANIL NEHRU Executive Chairman Managing Director and Chief Executive Officer Director
BISWAJIT MITRA S.N. SRIDHAR Chief Financial Officer Company Secretary
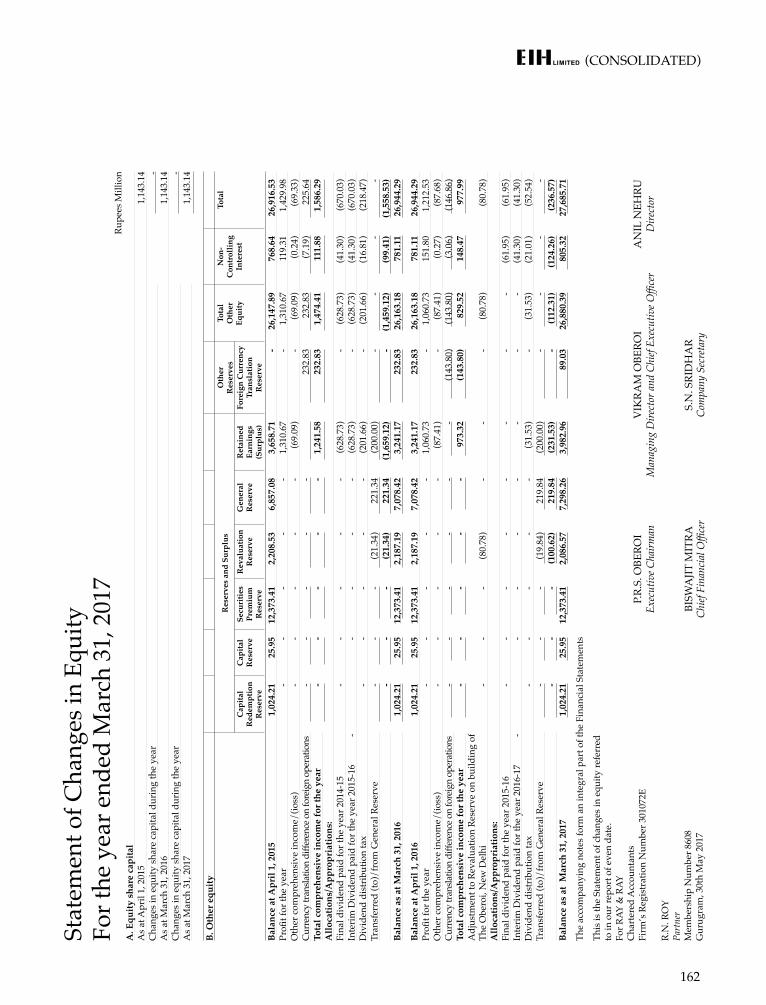
(CONSOLIDATED)
162
Stat
emen
t of C
hang
es in
Equ
ity
For t
he y
ear e
nded
Mar
ch 3
1, 2
017
Rupe
es M
illio
nA
. Equ
ity s
hare
cap
ital
As a
t Apr
il 1,
201
5 1
,143
.14
Cha
nges
in e
quity
shar
e ca
pita
l dur
ing
the
year
- A
s at M
arch
31,
201
6 1
,143
.14
Cha
nges
in e
quity
shar
e ca
pita
l dur
ing
the
year
- A
s at M
arch
31,
201
7 1
,143
.14
B. O
ther
equ
ityR
eser
ves
and
Surp
lus
Oth
er
Res
erve
sTo
tal
Oth
er
Equi
ty
Non
- C
ontr
ollin
g In
tere
st
Tota
l
Cap
ital
Red
empt
ion
Res
erve
Cap
ital
Res
erve
Secu
ritie
s Pr
emiu
m
Res
erve
Rev
alua
tion
Res
erve
Gen
eral
R
eser
veR
etai
ned
Earn
ings
(S
urpl
us)
Fore
ign
Cur
renc
y Tr
ansl
atio
n
Res
erve
Bala
nce
at A
pril
1, 2
015
1,0
24.2
1 2
5.95
1
2,37
3.41
2
,208
.53
6,8
57.0
8 3
,658
.71
- 2
6,14
7.89
7
68.6
4 2
6,91
6.53
Pr
ofit f
or th
e ye
ar-
--
--
1,3
10.6
7 -
1,3
10.6
7 1
19.3
1 1
,429
.98
Oth
er co
mpr
ehen
sive
inco
me/
(ioss
) -
--
--
(69.
09)
- (6
9.09
) (0
.24)
(69.
33)
Curr
ency
tran
slatio
n di
ffere
nce o
n fo
reig
n op
erat
ions
--
--
- 2
32.8
3 2
32.8
3 (7
.19)
225
.64
Tota
l com
preh
ensi
ve in
com
e fo
r the
yea
r -
- -
- -
1,2
41.5
8 2
32.8
3 1
,474
.41
111
.88
1,5
86.2
9 A
lloca
tions
/App
ropr
iatio
ns:
Fina
l div
iden
d pa
id fo
r the
yea
r 201
4-15
--
--
- (6
28.7
3)-
(628
.73)
(41.
30)
(670
.03)
Inte
rim D
ivid
end
paid
for t
he y
ear 2
015-
16
--
--
- (6
28.7
3)-
(628
.73)
(41.
30)
(670
.03)
Div
iden
d di
strib
utio
n ta
x-
--
--
(201
.66)
- (2
01.6
6) (1
6.81
) (2
18.4
7)Tr
ansf
erre
d (to
)/fr
om G
ener
al R
eser
ve-
--
(21.
34)
221
.34
(200
.00)
- -
- -
- -
- (2
1.34
) 2
21.3
4 (1
,659
.12)
- (1
,459
.12)
(99.
41)
(1,5
58.5
3)Ba
lanc
e as
at M
arch
31,
201
6 1
,024
.21
25.
95
12,
373.
41
2,1
87.1
9 7
,078
.42
3,2
41.1
7 2
32.8
3 2
6,16
3.18
7
81.1
1 2
6,94
4.29
Bala
nce
at A
pril
1, 2
016
1,0
24.2
1 2
5.95
1
2,37
3.41
2
,187
.19
7,0
78.4
2 3
,241
.17
232
.83
26,
163.
18
781
.11
26,
944.
29
Profi
t for
the
year
--
--
- 1
,060
.73
- 1
,060
.73
151
.80
1,2
12.5
3 O
ther
com
preh
ensi
ve in
com
e/(io
ss)
--
--
- (8
7.41
)-
(87.
41)
(0.2
7) (8
7.68
)Cu
rren
cy tr
ansla
tion
diffe
renc
e on
fore
ign
oper
atio
ns-
--
--
- (1
43.8
0) (1
43.8
0) (3
.06)
(146
.86)
Tota
l com
preh
ensi
ve in
com
e fo
r the
yea
r -
- -
- -
973
.32
(143
.80)
829
.52
148
.47
977
.99
Adj
ustm
ent t
o Re
valu
atio
n Re
serv
e on
bui
ldin
g of
Th
e O
bero
i, N
ew D
elhi
--
- (8
0.78
)-
--
(80.
78)
(80.
78)
Allo
catio
ns/A
ppro
pria
tions
:Fi
nal d
ivid
end
paid
for t
he y
ear 2
015-
16-
--
--
- -
- (6
1.95
) (6
1.95
)In
terim
Div
iden
d pa
id fo
r the
yea
r 201
6-17
-
--
--
- -
- (4
1.30
) (4
1.30
)D
ivid
end
dist
ribut
ion
tax
--
--
- (3
1.53
)-
(31.
53)
(21.
01)
(52.
54)
Tran
sfer
red
(to)/
from
Gen
eral
Res
erve
--
- (1
9.84
) 2
19.8
4 (2
00.0
0)-
- -
- -
- -
(100
.62)
219
.84
(231
.53)
- (1
12.3
1) (1
24.2
6) (2
36.5
7)Ba
lanc
e as
at
Mar
ch 3
1, 2
017
1,0
24.2
1 2
5.95
1
2,37
3.41
2
,086
.57
7,2
98.2
6 3
,982
.96
89.
03
26,
880.
39
805
.32
27,
685.
71
The
acco
mpa
nyin
g no
tes f
orm
an
inte
gral
par
t of t
he F
inan
cial
Sta
tem
ents
This
is th
e St
atem
ent o
f cha
nges
in e
quity
refe
rred
to
in o
ur re
port
of e
ven
date
.Fo
r RAY
& R
AYC
hart
ered
Acc
ount
ants
Firm
’s R
egis
trat
ion
Num
ber 3
0107
2E
R.N
. RO
YPa
rtne
rM
embe
rshi
p N
umbe
r 860
8G
urug
ram
, 30t
h M
ay 2
017
P.
R.S.
OBE
ROI
VIK
RAM
OBE
ROI
AN
IL N
EHRU
Ex
ecut
ive C
hairm
an
Man
agin
g D
irect
or a
nd C
hief
Exec
utiv
e Offi
cer
Dire
ctor
BI
SWA
JIT M
ITRA
S.
N. S
RID
HA
R C
hief
Fina
ncia
l Offi
cer
Com
pany
Sec
reta
ry
(CONSOLIDATED)
163
Notes to Accounts
GENERAL INFORMATION
EIH Limited is a company limited by shares, incorporated and domiciled in India having its Registered Office at 4, Mangoe Lane, Kolkata – 700 001. The Group is primarily engaged in owning and managing premium luxury hotels and cruisers under the luxury ‘Oberoi’ and ‘Trident’ brands. The Group is also engaged in flight catering, airport restaurants, project management and corporate air charters.
The Consolidated financial statements relate to EIH Limited (‘the Group’), its subsidiary companies, jointly controlled entities and associates as referred in Note 50 (collectively referred as “the Group”).
Note 1: Significant accounting policies
This note provides a list of the significant accounting policies adopted in the preparation of these consolidated financial statements of EIH Limited. These policies have been consistently applied to all the periods presented, unless otherwise stated.
a) Basis of preparation
(i) Compliance with Ind AS
These consolidated financial statements have been prepared in accordance with the Companies (Indian Accounting Standard) Rules, 2015 and Companies (Indian Accounting Standards) Amendment Rules, 2016 as a going concern on accrual basis.
The consolidated financial statements up to year ended 31 March 2016 were prepared earlier in accordance with the accounting standards notified under the Companies (Accounting Standard) Rules, 2006 (as amended) and other relevant provisions of the Act.
These consolidated financial statements are the first financial statements of the Group under Ind AS and the transition was carried out in accordance with Ind AS 101, “First time adoption of Indian Accounting Standards. Refer note 48 for an explanation of how the transition from previous GAAP to Ind AS has affected the Group’s financial position, financial performance and cash flows.
(ii) Historical cost convention The financial statements have been prepared on a historical cost basis, except for the following: – equity investments in entities other than subsidiary, joint ventures and associate which are measured at fair value; – defined benefit plans – plan assets measured at fair value – customer loyalty programs
(iii) Use of estimates In preparing the Financial Statements in conformity with accounting principles generally accepted in India, Management is
required to make estimates and assumptions that affect the reported amounts of assets and liabilities and the disclosure of contingent liabilities as at the date of Financial Statements and the amounts of revenue and expenses during the reported period. Actual results could differ from those estimates. Any revision to such estimates is recognised in the period the same is determined.
b) Principles of consolidation and equity accounting
(i) Subsidiaries Subsidiaries are all entities over which the group has control. The group controls an entity when the group is exposed to,
or has rights to, variable returns from its involvement with the entity and has the ability to affect those returns through its power to direct the relevant activities of the entity. Subsidiaries are fully consolidated from the date on which control is transferred to the group. They are deconsolidated from the date that control ceases.
The acquisition method of accounting is used to account for business combinations by the group.
The group combines the financial statements of the parent and its subsidiaries line by line adding together like items of assets, liabilities, equity, income and expenses. InterGroup transactions, balances and unrealised gains on transactions between group companies are eliminated. Unrealised losses are also eliminated unless the transaction provides evidence of an impairment of the transferred asset. Accounting policies of subsidiaries have been changed where necessary to ensure consistency with the policies adopted by the group.
Non-controlling interests in the results and equity of subsidiaries are shown separately in the consolidated statement of profit and loss, consolidated statement of changes in equity and balance sheet respectively.
(ii) Associates Associates are all entities over which the group has significant influence but not control or joint control.
This is generally the case where the group holds between 20% and 50% of the voting rights. Investments in associates are accounted for using the equity method of accounting, after initially being recognised at cost.
(CONSOLIDATED)
164
Notes to Accounts — Contd.
(iii) Joint arrangements Under Ind AS in Joint Arrangements, investments in joint arrangements are classified as either joint operations or joint
ventures. The classification depends on the contractual rights and obligations of each investor, rather than the legal structure of the joint arrangement. The Group has joint ventures.
Joint ventures Interests in joint ventures are accounted for using the equity method (see (iv) below), after initially being recognised at
cost in the consolidated balance sheet.
(iv) Equity method Under the equity method of accounting, the investments are initially recognised at cost and adjusted thereafter to recognise
the group’s share of the post-acquisition profits or losses of the investee in profit and loss, and the group’s share of other comprehensive income of the investee in other comprehensive income. Dividends received or receivable from associates and joint ventures are recognised as a reduction in the carrying amount of the investment.
When the group’s share of losses in an equity-accounted investment equals or exceeds its interest in the entity, including any other unsecured long-term receivables, the group does not recognise further losses, unless it has incurred obligations or made payments on behalf of the other entity.
Unrealised gains on transactions between the group and its associates and joint ventures are eliminated to the extent of the group’s interest in these entities. Unrealised losses are also eliminated unless the transaction provides evidence of an impairment of the asset transferred. Accounting policies of equity accounted investees have been changed where necessary to ensure consistency with the policies adopted by the group.
The carrying amount of equity accounted investments are tested for impairment in accordance with the policy described in note 6.
(v) Changes in ownership interests
The group treats transactions with non-controlling interests that do not result in a loss of control as transactions with equity owners of the group. A change in ownership interest results in an adjustment between the carrying amounts of the controlling and non-controlling interests to reflect their relative interests in the subsidiary. Any difference between the amount of the adjustment to non-controlling interests and any consideration paid or received is recognised within equity.
When the group ceases to consolidate or equity account for an investment because of a loss of control, joint control or significant influence, any retained interest in the entity is remeasured to its fair value with the change in carrying amount recognised in profit or loss. This fair value becomes the initial carrying amount for the purposes of subsequently accounting for the retained interest as an associate, joint venture or financial asset. In addition, any amounts previously recognised in other comprehensive income in respect of that entity are accounted for as if the group had directly disposed of the related assets or liabilities. This may mean that amounts previously recognised in other comprehensive income are reclassified to profit or loss.
If the ownership interest in a joint venture or an associate is reduced but joint control or significant influence is retained, only a proportionate share of the amounts previously recognised in other comprehensive income are reclassified to profit or loss where appropriate.
c) Revenue recognition Revenue is measured at the fair value of the consideration received or receivable. Amounts disclosed as revenue are
inclusive of excise duty and net of trade allowances, rebates, value added taxes and amounts collected on behalf of third parties.
The CGroup recognizes revenue when the amount of revenue can be reliably measured, it is probable that future economic benefits will flow to the entity and specific criteria have been met for each of the CGroup’s activities as described below. The CGroup bases its estimates on historical results, taking into consideration the type of customer, the type of transaction and the specifics of each arrangement.
Timing of revenue recognition from major business activities – Hospitality Services: Revenue from hospitality services is recognised when the services are rendered and the same
becomes chargeable. – Sale of printed material: Revenue from sale of printed and other materials is recognised on dispatch of materials. – Others: Revenue from Shop License Fee, Management and Marketing Fee included under “Other Services” is recognised
on accrual basis as per terms of the contract. – Revenue in respect of customer loyalty are recognized when loyalty points are redeemed by the customers.
(CONSOLIDATED)
165
Notes to Accounts — Contd.
d) Foreign currency translation (i) Presentation Currency This Financial Statement is presented in INR which is the Functional Currency of the Group.
(ii) Transactions and balances Sales made in foreign currency are converted at the prevailing applicable exchange rate. Gain/Loss arising out of
fluctuations in exchange rate is accounted for on realisation.
Payments made in foreign currency including for acquiring investments are converted at the applicable rate prevailing on the date of remittance. Liability on account of foreign currency is converted at the exchange rate prevailing at the end of the year. Monetary items denominated in foreign currency are converted at the exchange rate prevailing at the end of the year.
Revenue expenditure of all the overseas sales offices are converted at the average exchange rate for the year. Assets and liabilities other than non-monetary assets are converted at the exchange rate prevailing at the close of the accounting year and Fixed Assets are converted at the month-end exchange rate of the month of acquisition.
Foreign currency loans covered by forward contracts are realigned at the forward contract rates, while those not covered by forward contracts are realigned at the rates ruling at the year end. The differences on realignment is accounted for in the Statement of Profit and Loss.
iii) Group Companies The results and financial position of foreign operations (none of which has the currency of a hyperinflationary economy)
that have a functional currency different from the presentation currency are translated into the presentation currency as follows:
– assets and liabilities are translated at the closing rate at the date of that balance sheet – income and expenses are translated at average exchange rates (unless this is not a reasonable approximation of the
cumulative effect of the rates prevailing on the transaction dates, in which case income and expenses are translated at the dates of the transactions), and
– all resulting exchange differences are recognised in other comprehensive income.
On consolidation, exchange differences arising from the translation of any net investment in foreign entities, and of borrowings and other financial instruments designated as hedges of such investments, are recognised in other comprehensive income. When a foreign operation is sold, the associated exchange differences are reclassified to profit or loss, as part of the gain or loss on sale.
Goodwill and fair value adjustments arising on the acquisition of a foreign operation are treated as assets and liabilities of the foreign operation and translated at the dosing rate.
e) Income tax Current income tax is recognized based on the amount expected to be paid to the tax authorities, using tax rates and tax laws
that have been enacted or substantially enacted on the date of balance sheet.
f) Deferred Tax Deferred income tax is provided in full, using the liability method, on temporary differences arising between the tax bases of
assets and liabilities and their carrying amounts in the separate financial statements.
Deferred tax assets are recognised for all deductible temporary differences and unused tax losses only if it is probable that future taxable amounts will be available to utilise those temporary differences and losses.
Deferred tax assets and liabilities are offset when there is a legally enforceable right to offset current tax assets and liabilities and when the deferred tax balances relate to the same taxation authority. Current tax assets and tax liabilities are offset where the entity has a legally enforceable right to offset and intends either to settle on a net basis, or to realise the asset and settle the liability simultaneously.
Current and deferred tax is recognised in profit or loss, except to the extent that it relates to items recognised in other comprehensive income or directly in equity. In this case, the tax is also recognised in other comprehensive income or directly in equity, respectively.
(CONSOLIDATED)
166
Notes to Accounts — Contd.
g) Segment reporting Operating segments are reported in a manner consistent with the internal reporting provided to the chief operating decision
maker. The board of directors of EIH Limited generally assesses the financial performance and position of the company, and makes
strategic decisions. Refer note 45 for segment information.
h) Leases
As a lessee : Leases of property, plant and equipment where the Group, as lessee, has substantially all the risks and rewards of ownership
are classified as finance leases. Assets under finance lease are capitalized at the inception, at the fair value of the leased property or, if lower, the present value of the minimum lease payments. The corresponding rental obligations, net of finance charges, are included in borrowings or other financial liabilities as appropriate. Each lease payment is allocated between the liability and finance cost. The finance cost is charged to the profit or loss over the lease period so as to produce a constant periodic rate of interest on the remaining balance of the liability for each period.
Leases in which a significant portion of the risks and rewards of ownership are not transferred to the Group as lessee are classified as operating leases. Payments made under operating leases (net of any incentives received from the lessor) are charged to profit or loss on a straight-line basis over the period of the lease unless the payments are structured to increase in line with expected general inflation to compensate for the lessor’s expected inflationary cost increases.
As a lessor :
Lease income from operating leases where the Group is a lessor is recognised as income on a straight-line basis over the lease term unless the receipts are structured to increase in line with expected general inflation to compensate for the expected inflationary cost increases. The respective leased assets are included in the balance sheet based on their nature.
i) Impairment of assets Goodwill is tested annually for impairment, or more frequently if events or changes in circumstances indicate that they might
be impaired. Other Assets are tested for impairment whenever events or changes in circumstances indicate that the carrying amount may not be recoverable. An impairment loss is recognised for the amount by which the asset’s carrying amount exceeds its recoverable amount. Assets that suffered an impairment are reviewed for possible reversal of the impairment at the end of each reporting period. In case of such reversal, the carrying amount of the asset is increased so as not to exceed the carrying amount that would have been determined had there been no impairment loss.
j) Cash and cash equivalents For the purpose of presentation in the statement of cash flows, cash and cash equivalents includes cash in hand, cash at bank
and other deposits held at call with financial institutions, other short-term, highly liquid investments with original maturities of three months or less that are readily convertible to known amounts of cash and which are subject to an insignificant risk of changes in value.
k) Trade receivables Trade receivables are recognised initially at fair value and subsequently measured at amortised cost using the effective interest
method, less provision for impairment.
l) Inventories Inventories are valued at cost which is based on Cumulative Weighted Average method or net realisable value, whichever is
lower. Unserviceable/damaged/discarded stocks and shortages are charged to the statement of Profit or Loss.
m) Investmentsandotherfinancialassets
(i) Classification The Group classifies its financial assets in the following measurement categories: – those to be measured subsequently at fair value (either through other comprehensive income, or through profit or
loss) – those measured at amortised cost.
The classification depends on the entity’s business model for managing the financial assets and the contractual terms of the cash flows.
(CONSOLIDATED)
167
Notes to Accounts — Contd.
For assets measured at fair value, gains and losses will be recorded in profit or loss. For investments in debt instruments, this will depend on the business model in which the investment is held. For investments in equity instruments, this will depend on whether the Group has made an irrevocable election at the time of initial recognition to account for the equity investment at fair value through other comprehensive income.
(ii) Measurement At initial recognition, the Group measures a financial asset at its fair value plus, in the case of a financial asset not at
fair value through profit and loss, transaction costs that are directly attributable to the acquisition of the financial asset. Transaction costs of financial assets carried at fair value through profit or loss are expensed in profit or loss.
Debt instruments Subsequent measurement of debt instruments depends on the Group’s business model for managing the asset and the
cash flow characteristics of the asset. There are three measurement categories into which the Group classifies its debt instruments:
Amortised cost: Assets that are held for collection of contractual cash flows where those cash flows represent solely payments of principal and interest are measured at amortised cost.
Fair value through other comprehensive income (FVOCI): Assets that are held for collection of contractual cash flows and for selling the financial assets, where the assets’ cash flows represent solely payments of principal and interest, are measured at fair value through other comprehensive income (FVOCI). Movements in the carrying amount are taken through OCI, except for the recognition of impairment gains or losses, interest revenue and foreign exchange gains and losses which are recognised in profit and loss. When the financial asset is derecognised, the cumulative gain or loss previously recognised in OCI is reclassified from equity to profit or loss and recognised in other gains/ (losses). Interest income from these financial assets is included in other income using the effective interest rate method
Fair value through profit or loss: Assets that do not meet the criteria for amortised cost or FVOCI are measured at fair value through profit and loss
Equity instruments The Group subsequently measures all equity investments at fair value. Dividends from such investments are recognised
in profit or loss as other income when the Group’s right to receive payments is established.
Changes in the fair value of financial assets at fair value through profit or loss are recognised in other gain/ (losses) in the statement of profit and loss.
(iii) Impairment of financial assets The Group assesses on a forward looking basis the expected credit losses associated with its assets carried at amortised
cost. The impairment methodology applied depends on whether there has been a significant increase in credit risk. Note 41 details how the Group determines whether there has been a significant increase in credit risk.
For trade receivables only, the Group applies the simplified approach permitted by Ind AS 109 Financial Instruments, which requires expected lifetime losses to be recognised from initial recognition of the receivables.
(iv) Derecognition of financial assets A financial asset is derecognised only when – The Group has transferred the rights to receive cash flows from the financial asset or – Retains the contractual rights to receive the cash flows of the financial asset, but assumes a contractual obligation to
pay the cash flows to one or more recipients.
Where the entity has transferred an asset, the Group evaluates whether it has transferred substantially all risks and rewards of ownership of the financial asset. In such cases, the financial asset is derecognised. Where the entity has not transferred substantially all risks and rewards of ownership of the financial asset, the financial asset is not derecognised.
Where the entity has neither transferred a financial asset nor retains substantially all risks and rewards of ownership of the financial asset, the financial asset is derecognised if the Group has not retained control of the financial asset. Where the Group retains control of the financial asset, the asset is continued to be recognised to the extent of continuing involvement in the financial asset.
(v) Income recognition Interest income: Interest income from debt instruments is recognised using the effective interest rate method. The effective
interest rate is the rate that exactly discounts estimated future cash receipts through the expected life of the financial asset to the gross carrying amount of a financial asset. When calculating the effective interest rate, the Group estimates the expected cash flows by considering all the contractual terms of the financial instrument (for example, prepayment, extension, call and similar options) but does not consider the expected credit losses
(CONSOLIDATED)
168
Notes to Accounts — Contd.
Dividend income: Dividends are recognised in profit or loss only when the right to receive payment is established, it is probable that the economic benefits associated with the dividend will flow to the Group, and the amount of the dividend can be measured reliably.
n) Property, plant and equipment Freehold land is carried at historical cost. All other items of property, plant and equipment are stated at historical cost less
depreciation. Historical Cost represents direct expenses incurred on acquisition or construction of the assets and the share of indirect expenses relating to construction allocated in proportion to the direct cost involved.
Subsequent costs are included in the asset’s carrying amount or recognised as a separate asset, as appropriate, only when it is probable that future economic benefits associated with the item will flow to the Group and the cost of the item can be measured reliably. The carrying amount of any component accounted for as a separate asset is derecognised when replaced. All other repairs and maintenance are charged to profit or loss during the reporting period in which they are incurred.
Capital work-in-progress comprises the cost of property, plant and equipment that are not yet ready for their intended use on the reporting date and materials at site.
Transition to Ind AS On transition to Ind AS, the Group has elected to continue with the carrying value of all of its property, plant and equipment
recognised as at 1 April 2015 measured as per the previous GAAP and use that carrying value as the deemed cost of the property, plant and equipment.
Depreciation methods, estimated useful lives and residual value Depreciation on property, plant and equipment other than land, the hotel buildings, certain buildings on leasehold land and
leased vehicles and machinery is provided on ‘Straight Line Method’ based on useful life as prescribed under Schedule II of the Companies Act 2013. Leased vehicles, and building installed on leasehold land (other than perpetual lease) are depreciated over the lives of the respective asset or over the remaining lease period from the date of installation whichever is shorter.
Long term leasehold land (other than perpetual lease) is depreciated over the balance period of the lease, commencing from the date the land is put to use for commercial purposes.
The hotel buildings are depreciated equally over the balance useful life ascertained by independent technical expert, which ranges between 30 years and 60 years with effect from 31st March 2015 and are higher than those specified by Schedule II to the Companies Act; 2013. The management believes that the balance useful lives so assessed best represent the periods over which the hotel buildings are expected to be in use. The residual values are not more than 5% of the original cost of the asset. The assets’ residual values and useful lives are reviewed, and adjusted if appropriate, at the end of each reporting period.
Gains and losses on disposals are determined by comparing proceeds with carrying amount. These are included in profit or loss within other gains/(losses).
o) Intangible assets Goodwill on acquisition of subsidiaries is included in intangible assets. Goodwill is not amortised but it is tested for impairment
annually, or more frequently if events or changes in circumstances indicate that it might be impaired, and is carried at cost less accumulated impairment losses.
Other Intangible Assets are stated at cost less accumulated amortisation and net of impairments, if any. An intangible asset is recognised if it is probable that the expected future economic benefits that are attributable to the asset will flow to the Group and its cost can be measured reliably. Intangible assets are amortised on straight line basis over their estimated useful lives.
Transition to Ind AS On transition to Ind AS, the Group has elected to continue with the carrying value of all of its Intangible assets recognised as at
1 April 2015 measured as per the previous GAAP and use that carrying value as the deemed cost of the Intangible assets.
p) Trade and other payables These amounts represent liabilities for goods and services provided to the Group prior to the end of financial year which are
unpaid. The amounts are unsecured and are usually paid within 30 days of recognition. Trade and other payables are presented as current liabilities unless payment is not due within 12 months after the reporting period. They are recognised initially at their fair value and subsequently measured at amortised cost using the effective interest method.
q) Borrowing costs General and specific borrowing costs that are directly attributable to the acquisition, construction or production of a qualifying
asset are capitalised as part of the cost of respective assets during the period of time that is required to complete and prepare the asset for its intended use. Qualifying assets are assets that necessarily take a substantial period of time to get ready for their intended use or sale. Other borrowing costs are expensed in the period in which they are incurred.
(CONSOLIDATED)
169
Notes to Accounts — Contd.
r) Provisions, contingent liabilities and contingent assets Provisions are recognised when there is a present legal or statutory obligation or constructive obligation as a result of past events
and where it is probable that there will be outflow of resources to settle the obligation and when a reliable estimate of the amount of the obligation can be made.
Contingent liabilities are recognized only when there is a possible obligation arising from past events due to occurrence or non-occurrence of one or more uncertain future events not wholly within the control of the Group or where any present obligation cannot be measured in terms of future outflow of resources or where a reliable estimate of the obligation cannot be made. Obligations are assessed on an ongoing basis and only those having a largely probable outflow of resources are provided for.
Contingent assets where it is probable that future economic benefits will flow to the Group are not recognised but disclosed in the financial statements. However, when the realisation of income is virtually certain, then the related asset is no longer a contingent asset, but it is recognised as an asset.
s) Employeebenefits
(i) Short-term obligations Liabilities for wages and salaries, including non-monetary benefits that are expected to be settled wholly within 12 months
after the end of the period in which the employees render the related service are recognised in respect of employees’ services up to the end of the reporting period and are measured at the amounts expected to be paid when the liabilities are settled. The liabilities are presented as current employee benefit obligations in the balance sheet.
(ii) Post-employment obligations The Group operates the following post-employment schemes:
Gratuity obligations – Maintained as a defined benefit retirement plan and contribution is made to the Life Insurance Corporation of India. The liability
or asset recognised in the balance sheet in respect of defined benefit gratuity plans is the present value of the defined benefit obligation at the end of the reporting period less the fair value of plan assets. The defined benefit obligation is calculated annually by actuaries using the projected unit credit method.
The present value of the defined benefit obligation is determined by discounting the estimated future cash outflows by reference to market yields at the end of the reporting period on government bonds that have terms approximating to the terms of the related obligation.
The net interest cost is calculated by applying the discount rate to the net balance of the defined benefit obligation and the fair value of plan assets. This cost is included in employee benefit expense in the statement of profit and loss.
Re-measurement gains and losses arising from experience adjustments and changes in actuarial assumptions are recognised in the period in which they occur, directly in other comprehensive income. They are included in retained earnings in the statement of changes in equity and in the balance sheet.
Changes in the present value of the defined benefit obligation resulting from plan amendments or curtailments are recognised immediately in profit or loss as past service cost.
Leave encashment on termination of service – The liabilities for earned leave are expected to be settled after the retirement of employee. They are therefore measured as the
present value of expected future payments to be made in respect of services provided by employees up to the end of the reporting period using the projected unit credit method. The benefits are discounted using the market yields at the end of the reporting period that have terms approximating to the terms of the related obligation. Re-measurements as a result of experience adjustments and changes in actuarial assumptions are recognised in other comprehensive income.
The obligations are presented as current liabilities in the balance sheet if the entity does not have an unconditional right to defer settlement for at least twelve months after the reporting period, regardless of when the actual settlement is expected to occur.
Provident Fund – The Group pays provident fund contributions to a fund administered by Government Provident Fund Authority. The Group has
no further payment obligations once the contributions have been paid. The contributions are accounted for as defined contribution plans and the contributions are recognised as employee benefit expense when they are due. Prepaid contributions are recognised as an asset to the extent that a cash refund or a reduction in the future payments is available.
t) Dividends Liability is created for the amount of any dividend declared, being appropriately authorised and no longer at the discretion of
the entity, on or before the end of the reporting period but not distributed at the end of the reporting period.
(CONSOLIDATED)
170
Notes to Accounts — Contd.
u) Earnings per share (i) Basic earnings per share Basic earnings per share is calculated by dividing: – the profit attributable to equity shareholders of the Company – by the weighted average number of equity shares outstanding during the financial year,
(ii) Diluted earnings per share Diluted earnings per share adjusts the number of equity shares used in the determination of basic earnings per share to
take into account: – the after income tax effect of interest and other financing costs associated with dilutive potential equity shares, and – the weighted average number of equity shares including additional equity shares that would have been outstanding
assuming the conversion of all dilutive potential equity shares happened.
v) Government grants/incentives Government grants/incentives that the Group is entitled to on fulfillment of certain conditions, but are available to the Group
only on completion of some other conditions, are recognized as income at fair value on completion of such other conditions. Grants/incentives that the Group is entitled to unconditionally on fulfillment of certain conditions, such grants are recognized
at fair value as income when there is reasonable assurance that the grant will be received.
w) Rounding of amounts All amounts disclosed in the financial statements and notes have been rounded off to the nearest million with two decimals as
per the requirement of Schedule III, unless otherwise stated.
2 NEW STANDARDS/AMENDMENTS THAT ARE NOT YET EFFECTIVE AND HAVE NOT BEEN EARLY ADOPTED:
As set out below, amendments to standards are effective for annual periods beginning on or after April 1, 2017, and have not been applied in preparing these financial statements. None of these is expected to have a significant effect on the financial statements of the Company: Amendments to Ind AS 102, Share-based PaymentThe amendment to Ind AS 102 clarifies the measurement basis for cash-settled share-based payments and the accounting for modifications that change an award from cash-settled to equity-settled.
Since the Company does not have any share based plan outstanding at the reporting date, the abovementioned amendment will not have any impact on the financial statements of the Company. The amendment is effective for accounting periods beginning on or after April 1, 2017 and early adoption of the same is not permitted.
Amendments to Ind AS 7, Cash Flow StatementsThe amendment to Ind AS 7 introduces an additional disclosure that will enable users of financial statements to evaluate changes in liabilities arising from financing activities.
The said amendment will not have any impact on the Group’s cash flow. The amendment is effective for accounting periods beginning on or after April 1, 2017 and early adoption of the same is not permitted.
(CONSOLIDATED)
171
Notes to Accounts — Contd.
3 SIGNIFICANT ESTIMATES AND JUDGEMENTS
The preparation of financial statements requires the use of accounting estimates which, by definition, will seldom equal the actual results. Management also needs to exercise judgement in applying the company’s accounting policies. This note provides information about the areas that involved a higher degree of judgement or complexity, and of items which are more likely to be materially adjusted due to estimates and assumptions turning out to be different than those originally assessed. Estimates and judgements are continually evaluated. They are based on historical experience and other factors, including expectations of future events that may have a financial impact on the Group and that are believed to be reasonable under the circumstances.
i) Useful Life of Hotel Buildings EIH Limited, Mumtaz Hotels Limited and Mashobra Resort Limited have adopted useful life of fixed assets as stipulated
by Schedule II of the Companies Act 2013 except for the hotel buildings for computing depreciation. In the case of the hotel buildings of these companies, due to superior structural condition, management decided to assess the balance useful life by independent technical expert. As per the certificates of the technical expert as on 31.03.2015, the balance useful life of the hotel buildings of the Group ranges between 50-60 years. The carrying amount of each of the hotel buildings is being depreciated over its residual life.
ii) Advance towards Equity Shares In the case of Mashobra Resort Limited (“MRL”), several disputes with the Government of Himachal Pradesh, the joint venture
partner, were referred by the High Court of Himachal Pradesh on 17th December, 2003 to an arbitral tribunal consisting of a single arbitrator whose award has been challenged by both the Company and MRL, amongst others. The operation of the arbitration award was stayed pending substantive hearing of the applications by the High Court. Consequently, the status quo ante of the entire matter was restored to the position as on 17th December, 2003 and the hotel is being operated by MRL accordingly. The Company vide its letter dated 4th April, 2012 requested MRL to account for the entire amount of INR 1,361.93 Million provided to MRL upto 31st March, 2012 as ‘Advance Towards Equity’, including INR 130.00 Million being the opening balance of ‘Advance Towards Equity’. In view of the above, the Company has shown the said amount of INR 1,361.93 Million as ‘Advance Towards Equity’ in its books. The High Court passed an order dated 25th February, 2016 which was made available to the Company in the month of May 2016. The Court has decided not to interfere with the order of the Arbitrator. The Company amongst others, preferred an appeal before the Division Bench of the High Court of Himachal Pradesh. By an order dated 27th June, 2016 the Division Bench stayed the Single Judge Order dated 25th February, 2016 and directed the parties to maintain status quo till the matter is finally heard and disposed off. Final hearing is yet to commence.
iii) Recognition of Revenue (customer loyalty programs The Group is running certain customer loyalty programme for which revenue is being deferred on the basis of total loyalty
points/complimentary nights outstanding. As required by Ind AS 18, while calculating fair value of the loyalty points/complimentary nights, expected lapses are also considered by the Group (Reward points/Complimentary nights which will not be redeemed by the customers). On the basis of past trend, a significant portion of the complimentary nights/loyalty points has been estimated to be lapsed. Estimated lapse ratio is periodically evaluated by the Group and in case there is any change in the trend, the deferred revenue is adjusted accordingly. The fair value of complimentary nights/loyalty points is calculated on the basis of relative benefit pass on to the customers.
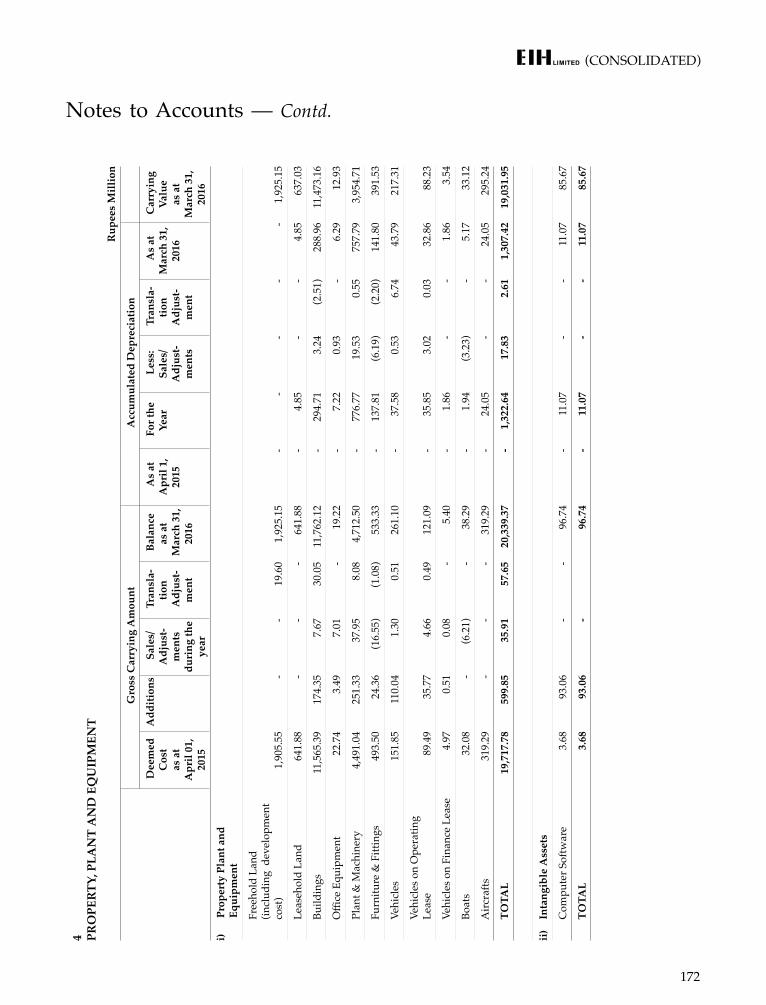
(CONSOLIDATED)
172
Notes to Accounts — Contd.
4 PRO
PERT
Y, P
LAN
T A
ND
EQ
UIP
MEN
T R
upee
s M
illio
n
Gro
ss C
arry
ing
Am
ount
A
ccum
ulat
ed D
epre
ciat
ion
Dee
med
C
ost
as a
t A
pril
01,
2015
Add
ition
s S
ales
/ A
djus
t-m
ents
du
ring
the
year
Tra
nsla
-tio
n A
djus
t-m
ent
Bal
ance
as
at
Mar
ch 3
1,
2016
As
at
Apr
il 1,
20
15
For
the
Year
L
ess:
Sa
les/
A
djus
t-m
ents
Tra
nsla
-tio
n A
djus
t-m
ent
As
at
Mar
ch 3
1,
2016
Car
ryin
g Va
lue
as
at
Mar
ch 3
1,
2016
i) P
rope
rty
Plan
t and
Eq
uipm
ent
Free
hold
Lan
d
(in
clud
ing
dev
elop
men
t co
st)
1,9
05.5
5 -
- 1
9.60
1
,925
.15
- -
- -
- 1
,925
.15
Leas
ehol
d La
nd 6
41.8
8 -
- -
641
.88
- 4
.85
- -
4.8
5 6
37.0
3
Build
ings
11,
565.
39
174
.35
7.6
7 3
0.05
1
1,76
2.12
-
294
.71
3.2
4 (2
.51)
288
.96
11,
473.
16
Offi
ce E
quip
men
t 2
2.74
3
.49
7.0
1 -
19.
22
- 7
.22
0.9
3 -
6.2
9 1
2.93
Plan
t & M
achi
nery
4,4
91.0
4 2
51.3
3 3
7.95
8
.08
4,7
12.5
0 -
776
.77
19.
53
0.5
5 7
57.7
9 3
,954
.71
Furn
iture
& F
ittin
gs 4
93.5
0 2
4.36
(1
6.55
) (1
.08)
533
.33
- 1
37.8
1 (6
.19)
(2.2
0) 1
41.8
0 3
91.5
3
Vehi
cles
151
.85
110
.04
1.3
0 0
.51
261
.10
- 3
7.58
0
.53
6.7
4 4
3.79
2
17.3
1
Vehi
cles
on
Ope
ratin
g Le
ase
89.
49
35.
77
4.6
6 0
.49
121
.09
- 3
5.85
3
.02
0.0
3 3
2.86
8
8.23
Vehi
cles
on
Fina
nce
Leas
e 4
.97
0.5
1 0
.08
- 5
.40
- 1
.86
- -
1.8
6 3
.54
Boat
s 3
2.08
-
(6.2
1) -
38.
29
- 1
.94
(3.2
3) -
5.1
7 3
3.12
Airc
rafts
319
.29
- -
- 3
19.2
9 -
24.
05
- -
24.
05
295
.24
TOTA
L 1
9,71
7.78
5
99.8
5 3
5.91
5
7.65
2
0,33
9.37
-
1,3
22.6
4 1
7.83
2
.61
1,3
07.4
2 1
9,03
1.95
ii)
Inta
ngib
le A
sset
s
Com
pute
r Sof
twar
e 3
.68
93.
06
- -
96.
74
- 1
1.07
-
- 1
1.07
8
5.67
TOTA
L 3
.68
93.
06
- 9
6.74
-
11.
07
- -
11.
07
85.
67
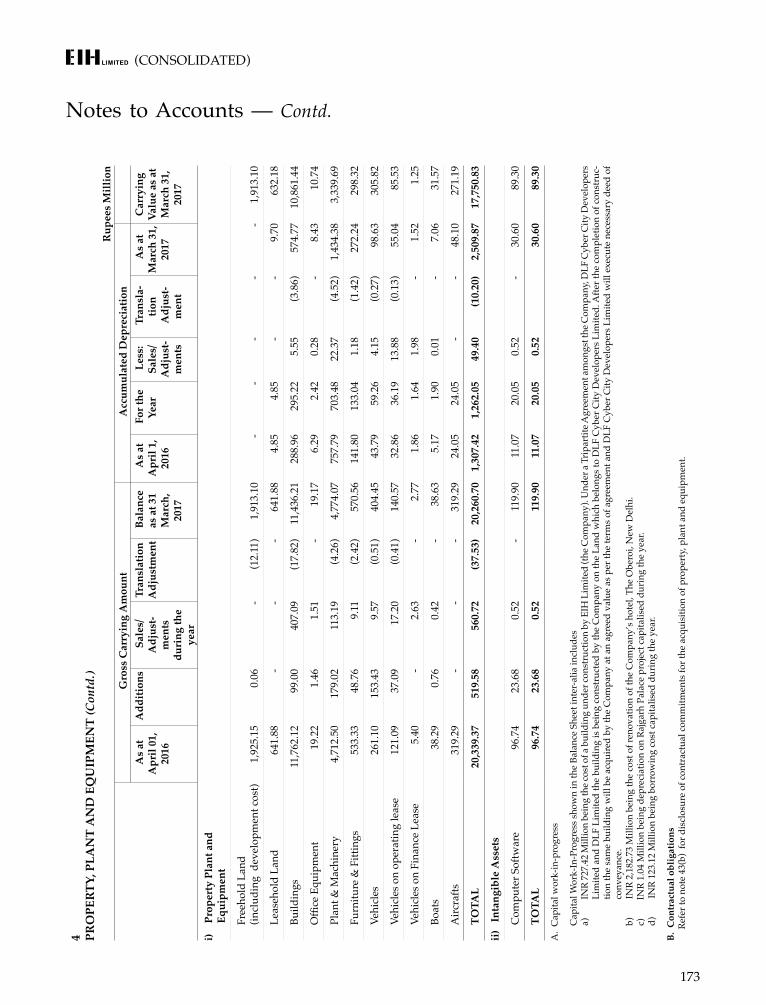
(CONSOLIDATED)
173
4 PRO
PERT
Y, P
LAN
T A
ND
EQ
UIP
MEN
T (C
ontd
.)R
upee
s M
illio
n G
ross
Car
ryin
g A
mou
nt
Acc
umul
ated
Dep
reci
atio
n A
s at
A
pril
01,
2016
Add
ition
s S
ales
/ A
djus
t- m
ents
du
ring
the
year
Tran
slat
ion
Adj
ustm
ent
Bal
ance
as
at 3
1 M
arch
, 20
17
As
at
Apr
il 1,
20
16
For
the
Year
L
ess:
Sa
les/
A
djus
t-m
ents
Tra
nsla
- tio
n A
djus
t- m
ent
As
at
Mar
ch 3
1,
2017
Car
ryin
g Va
lue
as a
t M
arch
31,
20
17
i) Pr
oper
ty P
lant
and
Eq
uipm
ent
F
reeh
old
Land
(in
clud
ing
dev
elop
men
t cos
t) 1
,925
.15
0.0
6 -
(12.
11)
1,9
13.1
0 -
- -
- -
1,9
13.1
0
L
ease
hold
Lan
d 6
41.8
8 -
- -
641
.88
4.8
5 4
.85
- -
9.7
0 6
32.1
8
B
uild
ings
11,
762.
12
99.
00
407
.09
(17.
82)
11,
436.
21
288
.96
295
.22
5.5
5 (3
.86)
574
.77
10,
861.
44
O
ffice
Equ
ipm
ent
19.
22
1.4
6 1
.51
- 1
9.17
6
.29
2.4
2 0
.28
- 8
.43
10.
74
P
lant
& M
achi
nery
4,7
12.5
0 1
79.0
2 1
13.1
9 (4
.26)
4,7
74.0
7 7
57.7
9 7
03.4
8 2
2.37
(4
.52)
1,4
34.3
8 3
,339
.69
F
urni
ture
& F
ittin
gs 5
33.3
3 4
8.76
9
.11
(2.4
2) 5
70.5
6 1
41.8
0 1
33.0
4 1
.18
(1.4
2) 2
72.2
4 2
98.3
2
V
ehic
les
261
.10
153
.43
9.5
7 (0
.51)
404
.45
43.
79
59.
26
4.1
5 (0
.27)
98.
63
305
.82
V
ehic
les o
n op
erat
ing
leas
e 1
21.0
9 3
7.09
1
7.20
(0
.41)
140
.57
32.
86
36.
19
13.
88
(0.1
3) 5
5.04
8
5.53
V
ehic
les o
n Fi
nanc
e Le
ase
5.4
0 -
2.6
3 -
2.7
7 1
.86
1.6
4 1
.98
- 1
.52
1.2
5
B
oats
38.
29
0.7
6 0
.42
- 3
8.63
5
.17
1.9
0 0
.01
- 7
.06
31.
57
A
ircra
fts 3
19.2
9 -
- -
319
.29
24.
05
24.
05
- -
48.
10
271
.19
T
OTA
L 2
0,33
9.37
5
19.5
8 5
60.7
2 (3
7.53
) 2
0,26
0.70
1
,307
.42
1,2
62.0
5 4
9.40
(1
0.20
) 2
,509
.87
17,
750.
83
ii)
Inta
ngib
le A
sset
s
C
ompu
ter S
oftw
are
96.
74
23.
68
0.5
2 -
119
.90
11.
07
20.
05
0.5
2 -
30.
60
89.
30
T
OTA
L 9
6.74
2
3.68
0
.52
119
.90
11.
07
20.
05
0.5
2 3
0.60
8
9.30
A.
Cap
ital w
ork-
in-p
rogr
ess
Cap
ital W
ork-
In-P
rogr
ess s
how
n in
the
Bala
nce
Shee
t int
er-a
lia in
clud
es
a)
IN
R 72
7.42
Mill
ion
bein
g th
e cos
t of a
bui
ldin
g un
der c
onst
ruct
ion
by E
IH L
imite
d (th
e Com
pany
). U
nder
a T
ripar
tite A
gree
men
t am
ongs
t the
Com
pany
, DLF
Cyb
er C
ity D
evel
oper
s Li
mite
d an
d D
LF L
imite
d th
e bu
ildin
g is
bei
ng c
onst
ruct
ed b
y th
e C
ompa
ny o
n th
e La
nd w
hich
bel
ongs
to D
LF C
yber
City
Dev
elop
ers L
imite
d. A
fter t
he c
ompl
etio
n of
con
stru
c-tio
n th
e sa
me
build
ing
will
be
acqu
ired
by th
e C
ompa
ny a
t an
agre
ed v
alue
as p
er th
e te
rms o
f agr
eem
ent a
nd D
LF C
yber
City
Dev
elop
ers L
imite
d w
ill e
xecu
te n
eces
sary
dee
d of
co
nvey
ance
.b)
INR
2,18
2.73
Mill
ion
bein
g th
e co
st o
f ren
ovat
ion
of th
e C
ompa
ny’s
hot
el, T
he O
bero
i, N
ew D
elhi
.c)
INR
1.04
Mill
ion
bein
g de
prec
iatio
n on
Raj
garh
Pal
ace
proj
ect c
apita
lised
dur
ing
the
year
.d)
INR
123.
12 M
illio
n be
ing
borr
owin
g co
st ca
pita
lised
dur
ing
the
year
.
B. C
ontr
actu
al o
blig
atio
ns
Ref
er to
not
e 43
(b)
for d
iscl
osur
e of
cont
ract
ual c
omm
itmen
ts fo
r the
acq
uisi
tion
of p
rope
rty,
pla
nt a
nd e
quip
men
t.
Notes to Accounts — Contd.
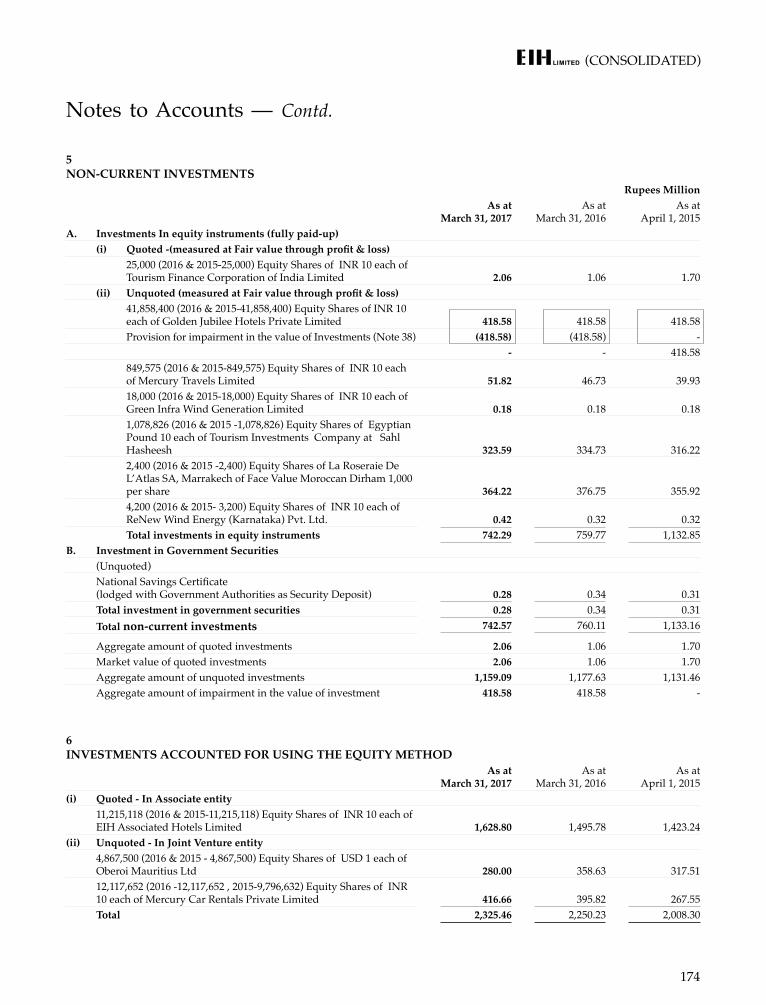
(CONSOLIDATED)
174
Notes to Accounts — Contd.
5 NON-CURRENT INVESTMENTS
Rupees MillionAs at
March 31, 2017As at
March 31, 2016As at
April 1, 2015A. Investments In equity instruments (fully paid-up)
(i) Quoted -(measured at Fair value through profit & loss)25,000 (2016 & 2015-25,000) Equity Shares of INR 10 each of Tourism Finance Corporation of India Limited 2.06 1.06 1.70
(ii) Unquoted (measured at Fair value through profit & loss)41,858,400 (2016 & 2015-41,858,400) Equity Shares of INR 10 each of Golden Jubilee Hotels Private Limited 418.58 418.58 418.58 Provision for impairment in the value of Investments (Note 38) (418.58) (418.58) -
- - 418.58 849,575 (2016 & 2015-849,575) Equity Shares of INR 10 each of Mercury Travels Limited 51.82 46.73 39.93 18,000 (2016 & 2015-18,000) Equity Shares of INR 10 each of Green Infra Wind Generation Limited 0.18 0.18 0.18 1,078,826 (2016 & 2015 -1,078,826) Equity Shares of Egyptian Pound 10 each of Tourism Investments Company at Sahl Hasheesh 323.59 334.73 316.22 2,400 (2016 & 2015 -2,400) Equity Shares of La Roseraie De L’Atlas SA, Marrakech of Face Value Moroccan Dirham 1,000 per share 364.22 376.75 355.92 4,200 (2016 & 2015- 3,200) Equity Shares of INR 10 each of ReNew Wind Energy (Karnataka) Pvt. Ltd. 0.42 0.32 0.32 Total investments in equity instruments 742.29 759.77 1,132.85
B. Investment in Government Securities (Unquoted)National Savings Certificate (lodged with Government Authorities as Security Deposit) 0.28 0.34 0.31 Total investment in government securities 0.28 0.34 0.31 Total non-current investments 742.57 760.11 1,133.16
Aggregate amount of quoted investments 2.06 1.06 1.70 Market value of quoted investments 2.06 1.06 1.70 Aggregate amount of unquoted investments 1,159.09 1,177.63 1,131.46 Aggregate amount of impairment in the value of investment 418.58 418.58 -
6INVESTMENTS ACCOUNTED FOR USING THE EQUITY METHOD
As at March 31, 2017
As at March 31, 2016
As at April 1, 2015
(i) Quoted - In Associate entity11,215,118 (2016 & 2015-11,215,118) Equity Shares of INR 10 each of EIH Associated Hotels Limited 1,628.80 1,495.78 1,423.24
(ii) Unquoted - In Joint Venture entity4,867,500 (2016 & 2015 - 4,867,500) Equity Shares of USD 1 each of Oberoi Mauritius Ltd 280.00 358.63 317.51 12,117,652 (2016 -12,117,652 , 2015-9,796,632) Equity Shares of INR 10 each of Mercury Car Rentals Private Limited 416.66 395.82 267.55 Total 2,325.46 2,250.23 2,008.30
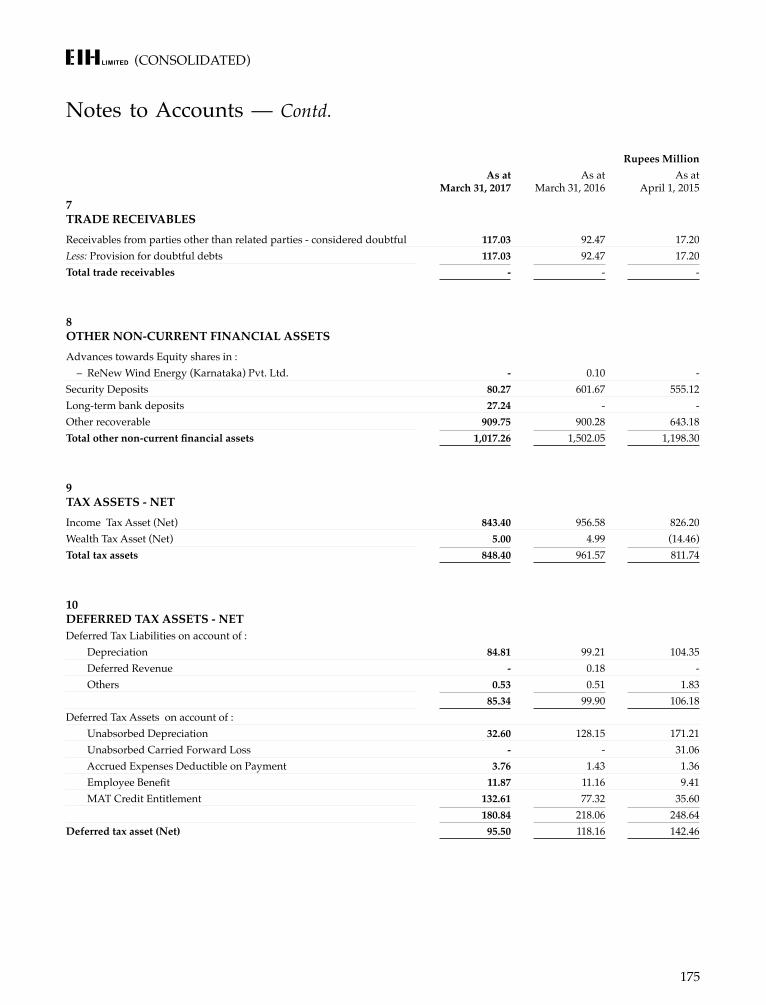
(CONSOLIDATED)
175
Notes to Accounts — Contd.
Rupees MillionAs at
March 31, 2017As at
March 31, 2016As at
April 1, 20157 TRADE RECEIVABLESReceivables from parties other than related parties - considered doubtful 117.03 92.47 17.20 Less: Provision for doubtful debts 117.03 92.47 17.20 Total trade receivables - - -
8 OTHER NON-CURRENT FINANCIAL ASSETSAdvances towards Equity shares in : – ReNew Wind Energy (Karnataka) Pvt. Ltd. - 0.10 - Security Deposits 80.27 601.67 555.12 Long-term bank deposits 27.24 - - Other recoverable 909.75 900.28 643.18 Total other non-current financial assets 1,017.26 1,502.05 1,198.30
9 TAX ASSETS - NETIncome Tax Asset (Net) 843.40 956.58 826.20 Wealth Tax Asset (Net) 5.00 4.99 (14.46)Total tax assets 848.40 961.57 811.74
10 DEFERRED TAX ASSETS - NETDeferred Tax Liabilities on account of : Depreciation 84.81 99.21 104.35 Deferred Revenue - 0.18 - Others 0.53 0.51 1.83
85.34 99.90 106.18 Deferred Tax Assets on account of : Unabsorbed Depreciation 32.60 128.15 171.21 Unabsorbed Carried Forward Loss - - 31.06 Accrued Expenses Deductible on Payment 3.76 1.43 1.36 Employee Benefit 11.87 11.16 9.41 MAT Credit Entitlement 132.61 77.32 35.60
180.84 218.06 248.64 Deferred tax asset (Net) 95.50 118.16 142.46
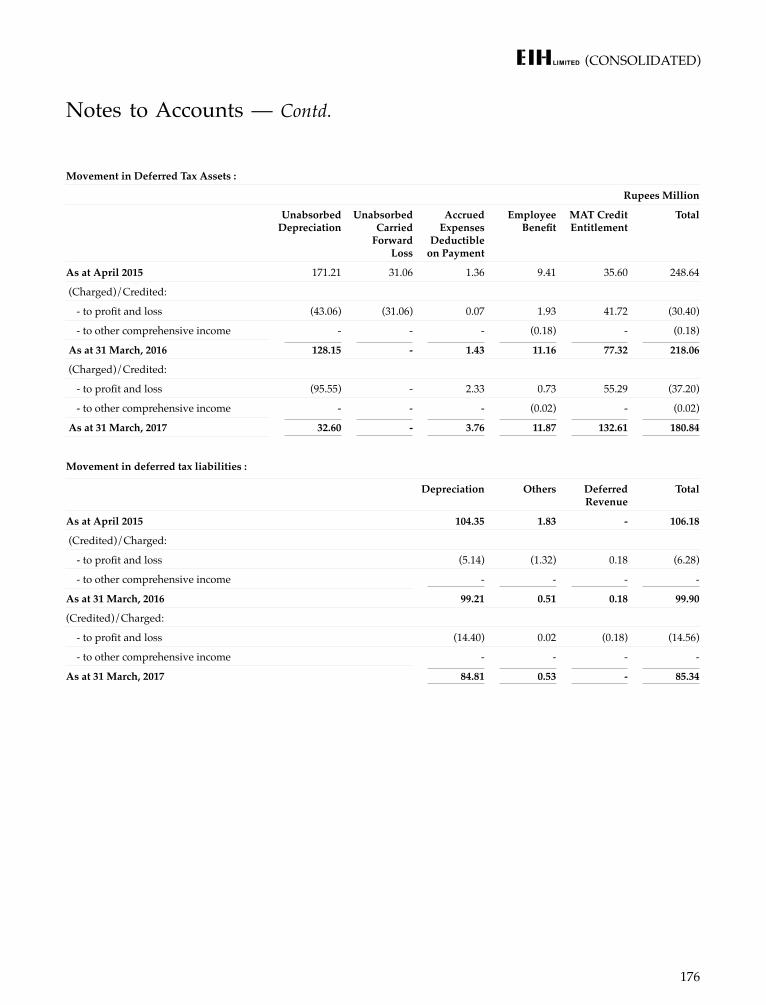
(CONSOLIDATED)
176
Notes to Accounts — Contd.
Movement in Deferred Tax Assets :
Rupees Million
Unabsorbed Depreciation
Unabsorbed Carried
Forward Loss
Accrued Expenses
Deductible on Payment
Employee Benefit
MAT Credit Entitlement
Total
As at April 2015 171.21 31.06 1.36 9.41 35.60 248.64
(Charged)/Credited:
- to profit and loss (43.06) (31.06) 0.07 1.93 41.72 (30.40)
- to other comprehensive income - - - (0.18) - (0.18)
As at 31 March, 2016 128.15 - 1.43 11.16 77.32 218.06
(Charged)/Credited:
- to profit and loss (95.55) - 2.33 0.73 55.29 (37.20)
- to other comprehensive income - - - (0.02) - (0.02)
As at 31 March, 2017 32.60 - 3.76 11.87 132.61 180.84
Movement in deferred tax liabilities :
Depreciation Others Deferred Revenue
Total
As at April 2015 104.35 1.83 - 106.18
(Credited)/Charged:
- to profit and loss (5.14) (1.32) 0.18 (6.28)
- to other comprehensive income - - - -
As at 31 March, 2016 99.21 0.51 0.18 99.90
(Credited)/Charged:
- to profit and loss (14.40) 0.02 (0.18) (14.56)
- to other comprehensive income - - - -
As at 31 March, 2017 84.81 0.53 - 85.34
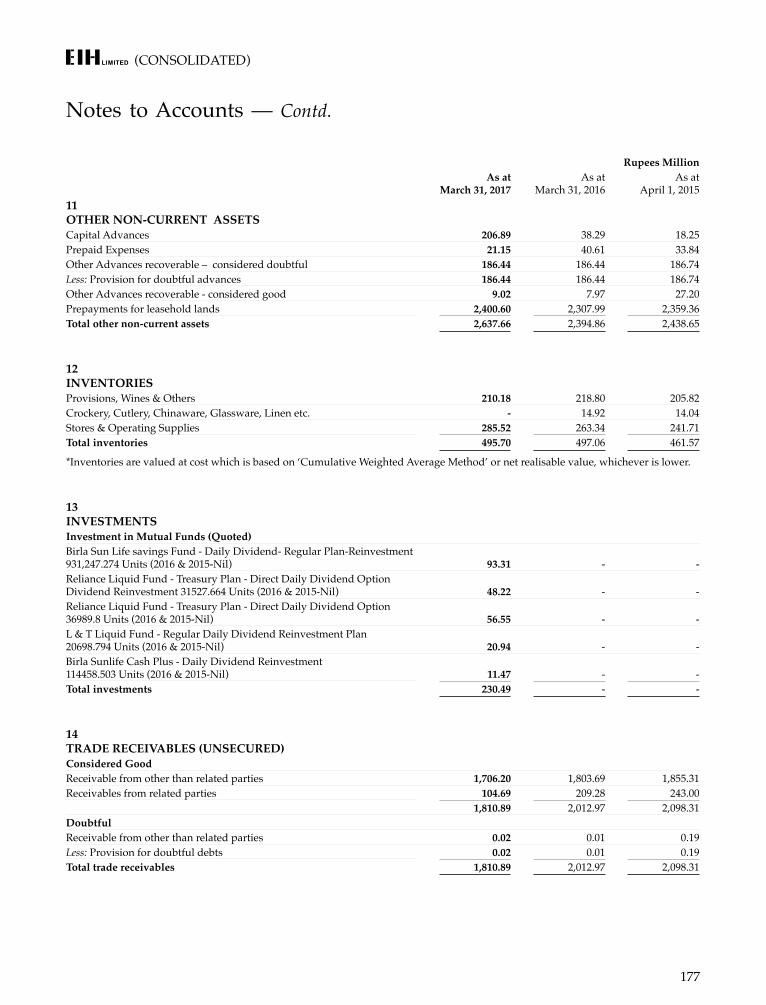
(CONSOLIDATED)
177
Notes to Accounts — Contd.
Rupees MillionAs at
March 31, 2017As at
March 31, 2016As at
April 1, 201511 OTHER NON-CURRENT ASSETSCapital Advances 206.89 38.29 18.25 Prepaid Expenses 21.15 40.61 33.84 Other Advances recoverable – considered doubtful 186.44 186.44 186.74 Less: Provision for doubtful advances 186.44 186.44 186.74 Other Advances recoverable - considered good 9.02 7.97 27.20 Prepayments for leasehold lands 2,400.60 2,307.99 2,359.36 Total other non-current assets 2,637.66 2,394.86 2,438.65
12 INVENTORIES Provisions, Wines & Others 210.18 218.80 205.82 Crockery, Cutlery, Chinaware, Glassware, Linen etc. - 14.92 14.04 Stores & Operating Supplies 285.52 263.34 241.71 Total inventories 495.70 497.06 461.57
*Inventories are valued at cost which is based on ‘Cumulative Weighted Average Method’ or net realisable value, whichever is lower.
13 INVESTMENTSInvestment in Mutual Funds (Quoted)Birla Sun Life savings Fund - Daily Dividend- Regular Plan-Reinvestment 931,247.274 Units (2016 & 2015-Nil) 93.31 - - Reliance Liquid Fund - Treasury Plan - Direct Daily Dividend Option Dividend Reinvestment 31527.664 Units (2016 & 2015-Nil) 48.22 - - Reliance Liquid Fund - Treasury Plan - Direct Daily Dividend Option 36989.8 Units (2016 & 2015-Nil) 56.55 - - L & T Liquid Fund - Regular Daily Dividend Reinvestment Plan 20698.794 Units (2016 & 2015-Nil) 20.94 - - Birla Sunlife Cash Plus - Daily Dividend Reinvestment 114458.503 Units (2016 & 2015-Nil) 11.47 - - Total investments 230.49 - -
14 TRADE RECEIVABLES (UNSECURED)Considered GoodReceivable from other than related parties 1,706.20 1,803.69 1,855.31 Receivables from related parties 104.69 209.28 243.00
1,810.89 2,012.97 2,098.31 DoubtfulReceivable from other than related parties 0.02 0.01 0.19 Less: Provision for doubtful debts 0.02 0.01 0.19 Total trade receivables 1,810.89 2,012.97 2,098.31
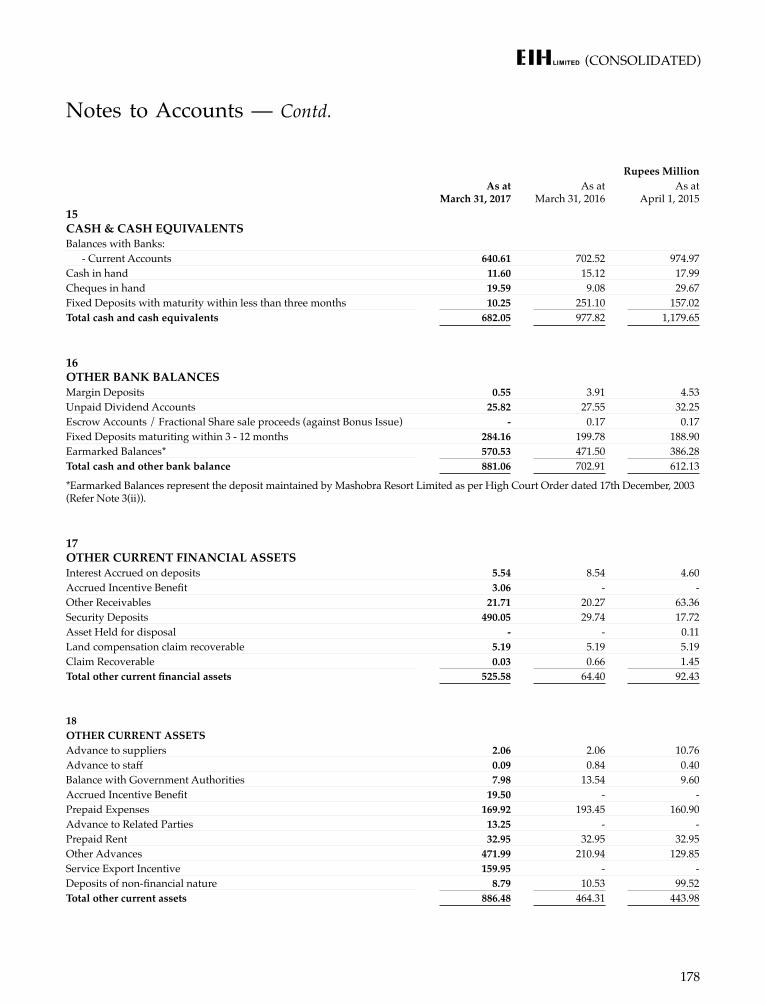
(CONSOLIDATED)
178
Notes to Accounts — Contd.
Rupees MillionAs at
March 31, 2017As at
March 31, 2016As at
April 1, 201515 CASH & CASH EQUIVALENTSBalances with Banks: - Current Accounts 640.61 702.52 974.97 Cash in hand 11.60 15.12 17.99 Cheques in hand 19.59 9.08 29.67 Fixed Deposits with maturity within less than three months 10.25 251.10 157.02 Total cash and cash equivalents 682.05 977.82 1,179.65
16 OTHER BANK BALANCESMargin Deposits 0.55 3.91 4.53 Unpaid Dividend Accounts 25.82 27.55 32.25 Escrow Accounts / Fractional Share sale proceeds (against Bonus Issue) - 0.17 0.17 Fixed Deposits maturiting within 3 - 12 months 284.16 199.78 188.90 Earmarked Balances* 570.53 471.50 386.28 Total cash and other bank balance 881.06 702.91 612.13
*Earmarked Balances represent the deposit maintained by Mashobra Resort Limited as per High Court Order dated 17th December, 2003 (Refer Note 3(ii)).
17 OTHER CURRENT FINANCIAL ASSETSInterest Accrued on deposits 5.54 8.54 4.60 Accrued Incentive Benefit 3.06 - - Other Receivables 21.71 20.27 63.36 Security Deposits 490.05 29.74 17.72 Asset Held for disposal - - 0.11 Land compensation claim recoverable 5.19 5.19 5.19 Claim Recoverable 0.03 0.66 1.45 Total other current financial assets 525.58 64.40 92.43
18OTHER CURRENT ASSETSAdvance to suppliers 2.06 2.06 10.76 Advance to staff 0.09 0.84 0.40 Balance with Government Authorities 7.98 13.54 9.60 Accrued Incentive Benefit 19.50 - - Prepaid Expenses 169.92 193.45 160.90 Advance to Related Parties 13.25 - - Prepaid Rent 32.95 32.95 32.95 Other Advances 471.99 210.94 129.85 Service Export Incentive 159.95 - - Deposits of non-financial nature 8.79 10.53 99.52 Total other current assets 886.48 464.31 443.98
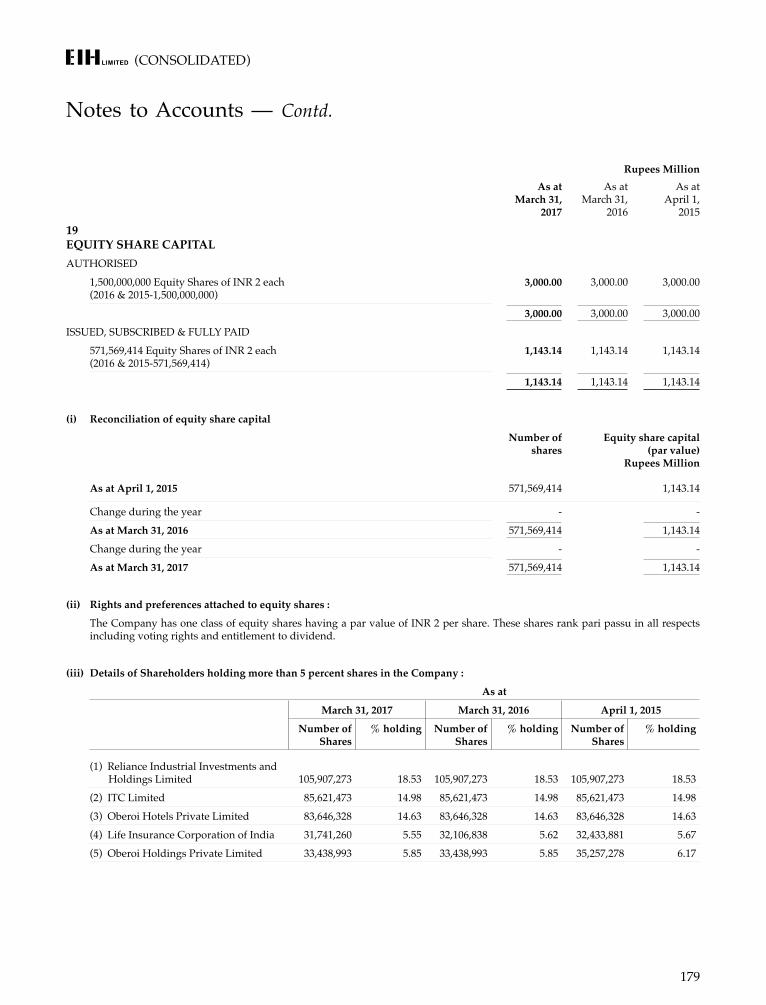
(CONSOLIDATED)
179
Notes to Accounts — Contd.
Rupees MillionAs at
March 31, 2017
As at March 31,
2016
As at April 1,
2015
19 EQUITY SHARE CAPITALAUTHORISED
1,500,000,000 Equity Shares of INR 2 each (2016 & 2015-1,500,000,000)
3,000.00 3,000.00 3,000.00
3,000.00 3,000.00 3,000.00
ISSUED, SUBSCRIBED & FULLY PAID
571,569,414 Equity Shares of INR 2 each (2016 & 2015-571,569,414)
1,143.14 1,143.14 1,143.14
1,143.14 1,143.14 1,143.14
(i) Reconciliation of equity share capital
Number of shares
Equity share capital (par value)
Rupees Million
As at April 1, 2015 571,569,414 1,143.14
Change during the year - -
As at March 31, 2016 571,569,414 1,143.14
Change during the year - -
As at March 31, 2017 571,569,414 1,143.14
(ii) Rights and preferences attached to equity shares :
The Company has one class of equity shares having a par value of INR 2 per share. These shares rank pari passu in all respects including voting rights and entitlement to dividend.
(iii) Details of Shareholders holding more than 5 percent shares in the Company :
As at
March 31, 2017 March 31, 2016 April 1, 2015
Number of Shares
% holding Number of Shares
% holding Number of Shares
% holding
(1) Reliance Industrial Investments and Holdings Limited 105,907,273 18.53 105,907,273 18.53 105,907,273 18.53
(2) ITC Limited 85,621,473 14.98 85,621,473 14.98 85,621,473 14.98
(3) Oberoi Hotels Private Limited 83,646,328 14.63 83,646,328 14.63 83,646,328 14.63
(4) Life Insurance Corporation of India 31,741,260 5.55 32,106,838 5.62 32,433,881 5.67
(5) Oberoi Holdings Private Limited 33,438,993 5.85 33,438,993 5.85 35,257,278 6.17
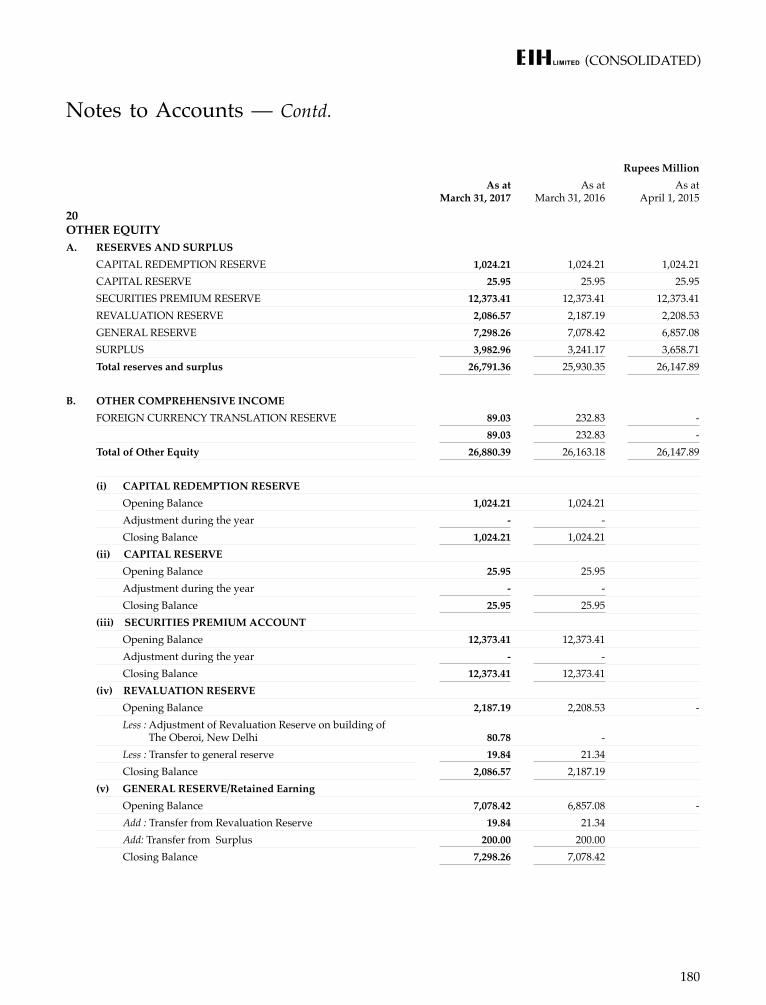
(CONSOLIDATED)
180
Notes to Accounts — Contd.
Rupees MillionAs at
March 31, 2017As at
March 31, 2016As at
April 1, 201520 OTHER EQUITYA. RESERVES AND SURPLUS
CAPITAL REDEMPTION RESERVE 1,024.21 1,024.21 1,024.21 CAPITAL RESERVE 25.95 25.95 25.95 SECURITIES PREMIUM RESERVE 12,373.41 12,373.41 12,373.41 REVALUATION RESERVE 2,086.57 2,187.19 2,208.53 GENERAL RESERVE 7,298.26 7,078.42 6,857.08 SURPLUS 3,982.96 3,241.17 3,658.71 Total reserves and surplus 26,791.36 25,930.35 26,147.89
B. OTHER COMPREHENSIVE INCOMEFOREIGN CURRENCY TRANSLATION RESERVE 89.03 232.83 -
89.03 232.83 - Total of Other Equity 26,880.39 26,163.18 26,147.89
(i) CAPITAL REDEMPTION RESERVE Opening Balance 1,024.21 1,024.21 Adjustment during the year - - Closing Balance 1,024.21 1,024.21 (ii) CAPITAL RESERVE Opening Balance 25.95 25.95 Adjustment during the year - - Closing Balance 25.95 25.95 (iii) SECURITIES PREMIUM ACCOUNT Opening Balance 12,373.41 12,373.41 Adjustment during the year - - Closing Balance 12,373.41 12,373.41 (iv) REVALUATION RESERVE Opening Balance 2,187.19 2,208.53 - Less : Adjustment of Revaluation Reserve on building of
The Oberoi, New Delhi 80.78 - Less : Transfer to general reserve 19.84 21.34 Closing Balance 2,086.57 2,187.19 (v) GENERAL RESERVE/Retained Earning Opening Balance 7,078.42 6,857.08 - Add : Transfer from Revaluation Reserve 19.84 21.34 Add: Transfer from Surplus 200.00 200.00 Closing Balance 7,298.26 7,078.42
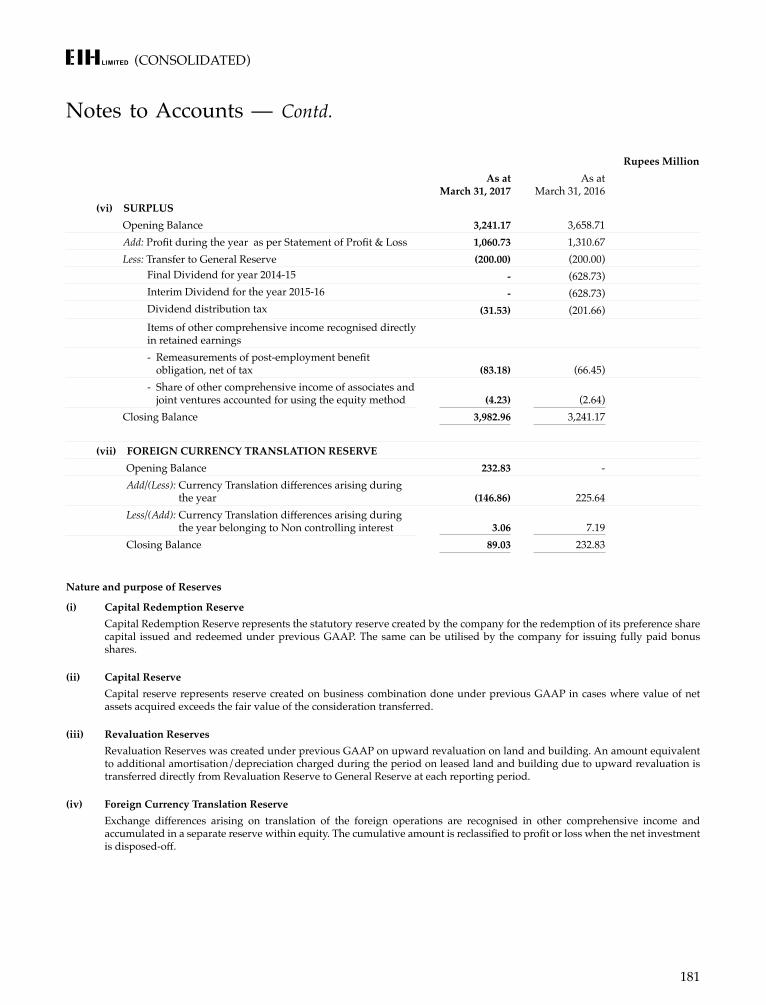
(CONSOLIDATED)
181
Notes to Accounts — Contd.
Rupees MillionAs at
March 31, 2017As at
March 31, 2016(vi) SURPLUS Opening Balance 3,241.17 3,658.71 Add: Profit during the year as per Statement of Profit & Loss 1,060.73 1,310.67 Less: Transfer to General Reserve (200.00) (200.00)
Final Dividend for year 2014-15 - (628.73) Interim Dividend for the year 2015-16 - (628.73) Dividend distribution tax (31.53) (201.66) Items of other comprehensive income recognised directly
in retained earnings - Remeasurements of post-employment benefit
obligation, net of tax (83.18) (66.45) - Share of other comprehensive income of associates and
joint ventures accounted for using the equity method (4.23) (2.64) Closing Balance 3,982.96 3,241.17
(vii) FOREIGN CURRENCY TRANSLATION RESERVEOpening Balance 232.83 - Add/(Less): Currency Translation differences arising during
the year (146.86) 225.64 Less/(Add): Currency Translation differences arising during
the year belonging to Non controlling interest 3.06 7.19 Closing Balance 89.03 232.83
Nature and purpose of Reserves
(i) Capital Redemption Reserve Capital Redemption Reserve represents the statutory reserve created by the company for the redemption of its preference share
capital issued and redeemed under previous GAAP. The same can be utilised by the company for issuing fully paid bonus shares.
(ii) Capital Reserve Capital reserve represents reserve created on business combination done under previous GAAP in cases where value of net
assets acquired exceeds the fair value of the consideration transferred.
(iii) Revaluation Reserves Revaluation Reserves was created under previous GAAP on upward revaluation on land and building. An amount equivalent
to additional amortisation/depreciation charged during the period on leased land and building due to upward revaluation is transferred directly from Revaluation Reserve to General Reserve at each reporting period.
(iv) Foreign Currency Translation Reserve Exchange differences arising on translation of the foreign operations are recognised in other comprehensive income and
accumulated in a separate reserve within equity. The cumulative amount is reclassified to profit or loss when the net investment is disposed-off.
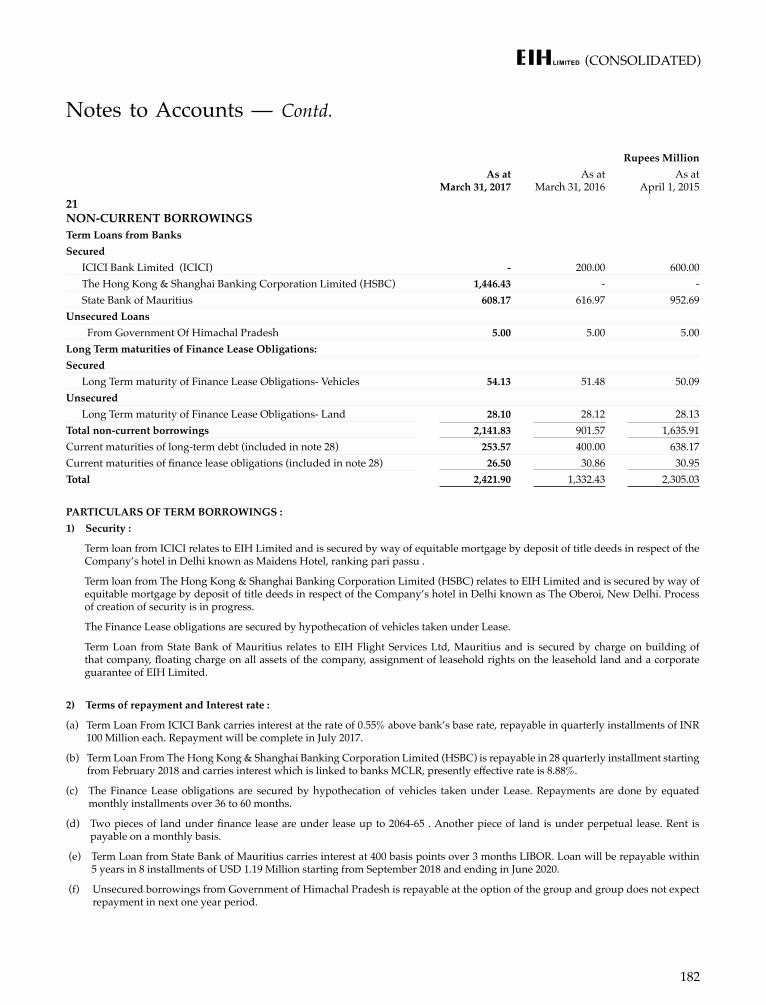
(CONSOLIDATED)
182
Notes to Accounts — Contd.
Rupees Million As at
March 31, 2017As at
March 31, 2016As at
April 1, 201521 NON-CURRENT BORROWINGS Term Loans from Banks Secured ICICI Bank Limited (ICICI) - 200.00 600.00 The Hong Kong & Shanghai Banking Corporation Limited (HSBC) 1,446.43 - - State Bank of Mauritius 608.17 616.97 952.69 Unsecured Loans From Government Of Himachal Pradesh 5.00 5.00 5.00 Long Term maturities of Finance Lease Obligations: Secured Long Term maturity of Finance Lease Obligations- Vehicles 54.13 51.48 50.09 Unsecured Long Term maturity of Finance Lease Obligations- Land 28.10 28.12 28.13 Total non-current borrowings 2,141.83 901.57 1,635.91 Current maturities of long-term debt (included in note 28) 253.57 400.00 638.17 Current maturities of finance lease obligations (included in note 28) 26.50 30.86 30.95 Total 2,421.90 1,332.43 2,305.03
PARTICULARS OF TERM BORROWINGS :1) Security :
Term loan from ICICI relates to EIH Limited and is secured by way of equitable mortgage by deposit of title deeds in respect of the Company’s hotel in Delhi known as Maidens Hotel, ranking pari passu .
Term loan from The Hong Kong & Shanghai Banking Corporation Limited (HSBC) relates to EIH Limited and is secured by way of equitable mortgage by deposit of title deeds in respect of the Company’s hotel in Delhi known as The Oberoi, New Delhi. Process of creation of security is in progress.
The Finance Lease obligations are secured by hypothecation of vehicles taken under Lease.
Term Loan from State Bank of Mauritius relates to EIH Flight Services Ltd, Mauritius and is secured by charge on building of that company, floating charge on all assets of the company, assignment of leasehold rights on the leasehold land and a corporate guarantee of EIH Limited.
2) Terms of repayment and Interest rate :
(a) Term Loan From ICICI Bank carries interest at the rate of 0.55% above bank’s base rate, repayable in quarterly installments of INR 100 Million each. Repayment will be complete in July 2017.
(b) Term Loan From The Hong Kong & Shanghai Banking Corporation Limited (HSBC) is repayable in 28 quarterly installment starting from February 2018 and carries interest which is linked to banks MCLR, presently effective rate is 8.88%.
(c) The Finance Lease obligations are secured by hypothecation of vehicles taken under Lease. Repayments are done by equated monthly installments over 36 to 60 months.
(d) Two pieces of land under finance lease are under lease up to 2064-65 . Another piece of land is under perpetual lease. Rent is payable on a monthly basis.
(e) Term Loan from State Bank of Mauritius carries interest at 400 basis points over 3 months LIBOR. Loan will be repayable within 5 years in 8 installments of USD 1.19 Million starting from September 2018 and ending in June 2020.
(f) Unsecured borrowings from Government of Himachal Pradesh is repayable at the option of the group and group does not expect repayment in next one year period.
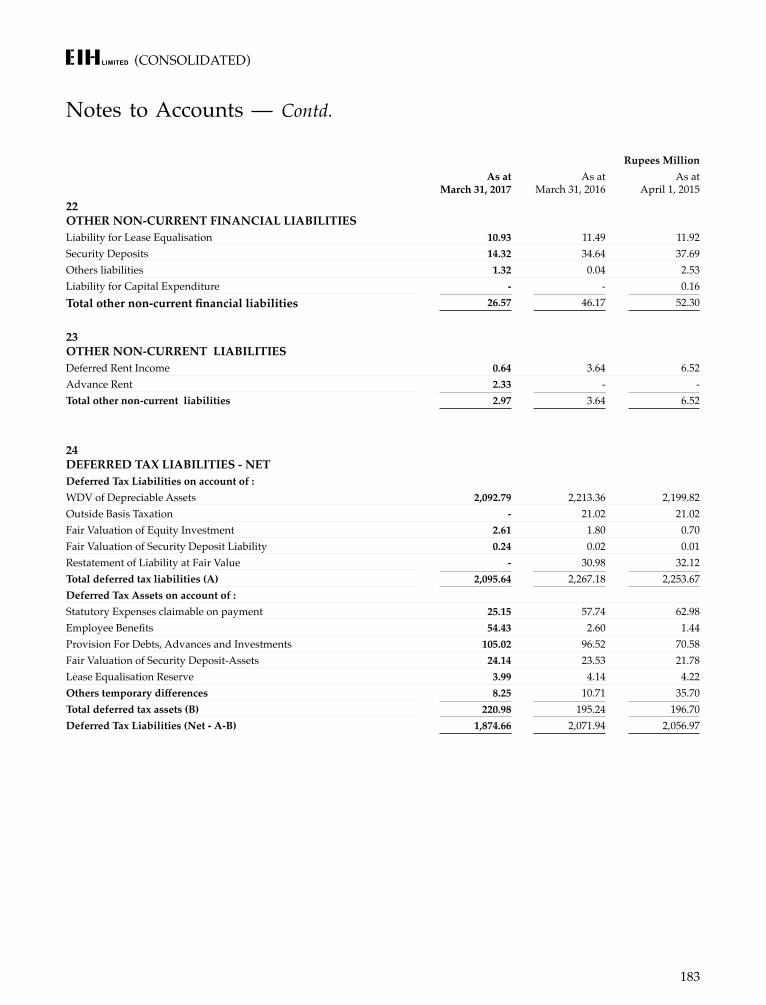
(CONSOLIDATED)
183
Notes to Accounts — Contd.
Rupees Million As at
March 31, 2017As at
March 31, 2016As at
April 1, 201522 OTHER NON-CURRENT FINANCIAL LIABILITIESLiability for Lease Equalisation 10.93 11.49 11.92 Security Deposits 14.32 34.64 37.69 Others liabilities 1.32 0.04 2.53 Liability for Capital Expenditure - - 0.16 Total other non-current financial liabilities 26.57 46.17 52.30
23 OTHER NON-CURRENT LIABILITIESDeferred Rent Income 0.64 3.64 6.52 Advance Rent 2.33 - - Total other non-current liabilities 2.97 3.64 6.52
24 DEFERRED TAX LIABILITIES - NET Deferred Tax Liabilities on account of : WDV of Depreciable Assets 2,092.79 2,213.36 2,199.82 Outside Basis Taxation - 21.02 21.02 Fair Valuation of Equity Investment 2.61 1.80 0.70 Fair Valuation of Security Deposit Liability 0.24 0.02 0.01 Restatement of Liability at Fair Value - 30.98 32.12 Total deferred tax liabilities (A) 2,095.64 2,267.18 2,253.67 Deferred Tax Assets on account of : Statutory Expenses claimable on payment 25.15 57.74 62.98 Employee Benefits 54.43 2.60 1.44 Provision For Debts, Advances and Investments 105.02 96.52 70.58 Fair Valuation of Security Deposit-Assets 24.14 23.53 21.78 Lease Equalisation Reserve 3.99 4.14 4.22 Others temporary differences 8.25 10.71 35.70 Total deferred tax assets (B) 220.98 195.24 196.70 Deferred Tax Liabilities (Net - A-B) 1,874.66 2,071.94 2,056.97
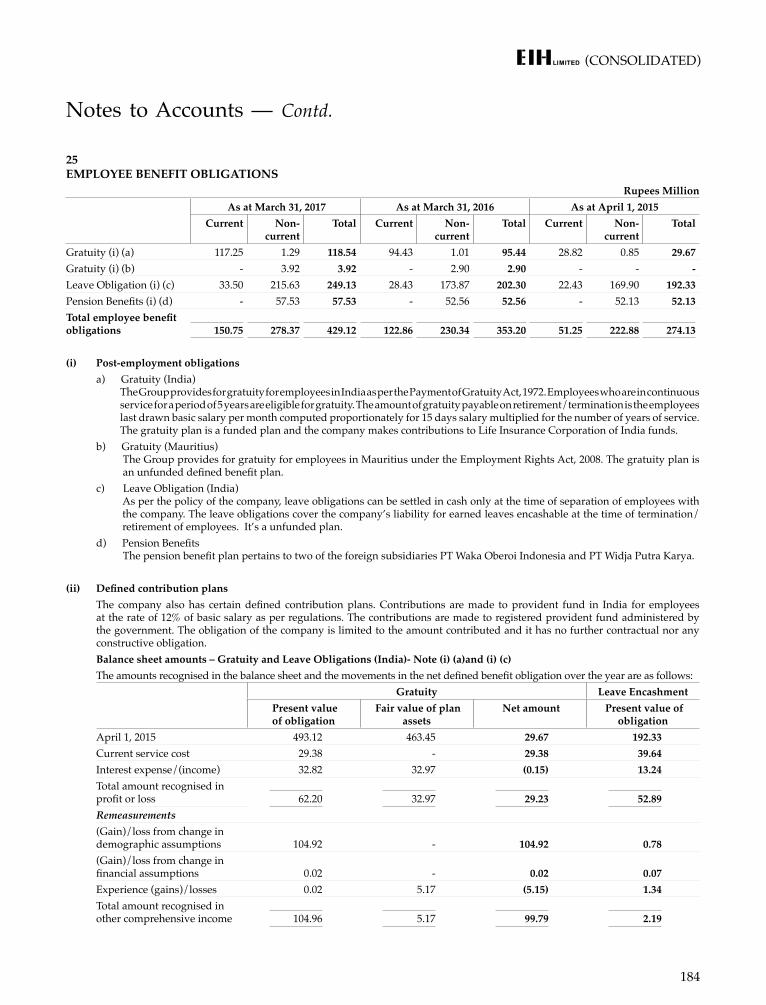
(CONSOLIDATED)
184
Notes to Accounts — Contd.
25 EMPLOYEE BENEFIT OBLIGATIONS
Rupees Million As at March 31, 2017 As at March 31, 2016 As at April 1, 2015
Current Non- current
Total Current Non- current
Total Current Non- current
Total
Gratuity (i) (a) 117.25 1.29 118.54 94.43 1.01 95.44 28.82 0.85 29.67 Gratuity (i) (b) - 3.92 3.92 - 2.90 2.90 - - - Leave Obligation (i) (c) 33.50 215.63 249.13 28.43 173.87 202.30 22.43 169.90 192.33 Pension Benefits (i) (d) - 57.53 57.53 - 52.56 52.56 - 52.13 52.13 Total employee benefit obligations 150.75 278.37 429.12 122.86 230.34 353.20 51.25 222.88 274.13
(i) Post-employment obligationsa) Gratuity (India) The Group provides for gratuity for employees in India as per the Payment of Gratuity Act, 1972. Employees who are in continuous
service for a period of 5 years are eligible for gratuity. The amount of gratuity payable on retirement/termination is the employees last drawn basic salary per month computed proportionately for 15 days salary multiplied for the number of years of service. The gratuity plan is a funded plan and the company makes contributions to Life Insurance Corporation of India funds.
b) Gratuity (Mauritius) The Group provides for gratuity for employees in Mauritius under the Employment Rights Act, 2008. The gratuity plan is
an unfunded defined benefit plan.c) Leave Obligation (India) As per the policy of the company, leave obligations can be settled in cash only at the time of separation of employees with
the company. The leave obligations cover the company’s liability for earned leaves encashable at the time of termination/retirement of employees. It’s a unfunded plan.
d) Pension Benefits The pension benefit plan pertains to two of the foreign subsidiaries PT Waka Oberoi Indonesia and PT Widja Putra Karya.
(ii) Defined contribution plans The company also has certain defined contribution plans. Contributions are made to provident fund in India for employees at the rate of 12% of basic salary as per regulations. The contributions are made to registered provident fund administered by the government. The obligation of the company is limited to the amount contributed and it has no further contractual nor any constructive obligation.Balance sheet amounts – Gratuity and Leave Obligations (India)- Note (i) (a)and (i) (c)The amounts recognised in the balance sheet and the movements in the net defined benefit obligation over the year are as follows:
Gratuity Leave Encashment Present value of obligation
Fair value of plan assets
Net amount Present value of obligation
April 1, 2015 493.12 463.45 29.67 192.33Current service cost 29.38 - 29.38 39.64 Interest expense/(income) 32.82 32.97 (0.15) 13.24 Total amount recognised in profit or loss 62.20 32.97 29.23 52.89 Remeasurements(Gain)/loss from change in demographic assumptions 104.92 - 104.92 0.78 (Gain)/loss from change in financial assumptions 0.02 - 0.02 0.07 Experience (gains)/losses 0.02 5.17 (5.15) 1.34 Total amount recognised in other comprehensive income 104.96 5.17 99.79 2.19
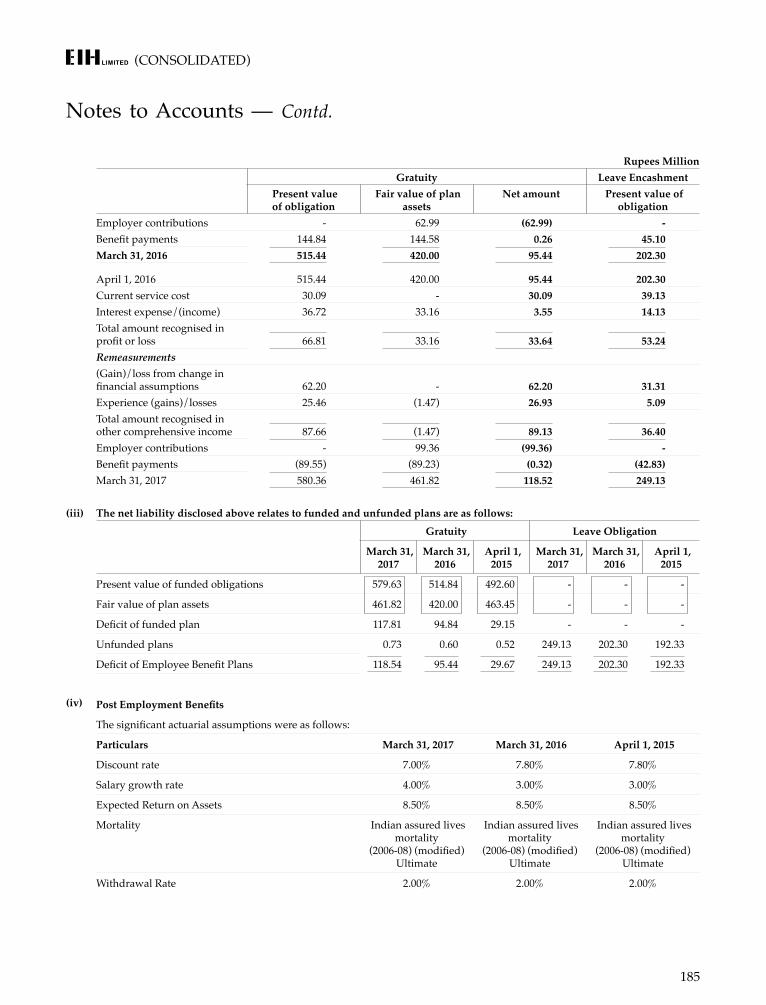
(CONSOLIDATED)
185
Notes to Accounts — Contd.
Rupees MillionGratuity Leave Encashment
Present value of obligation
Fair value of plan assets
Net amount Present value of obligation
Employer contributions - 62.99 (62.99) - Benefit payments 144.84 144.58 0.26 45.10 March 31, 2016 515.44 420.00 95.44 202.30
April 1, 2016 515.44 420.00 95.44 202.30 Current service cost 30.09 - 30.09 39.13 Interest expense/(income) 36.72 33.16 3.55 14.13 Total amount recognised in profit or loss 66.81 33.16 33.64 53.24 Remeasurements(Gain)/loss from change in financial assumptions 62.20 - 62.20 31.31 Experience (gains)/losses 25.46 (1.47) 26.93 5.09 Total amount recognised in other comprehensive income 87.66 (1.47) 89.13 36.40 Employer contributions - 99.36 (99.36) - Benefit payments (89.55) (89.23) (0.32) (42.83)March 31, 2017 580.36 461.82 118.52 249.13
(iii) The net liability disclosed above relates to funded and unfunded plans are as follows: Gratuity Leave Obligation
March 31, 2017
March 31, 2016
April 1, 2015
March 31, 2017
March 31, 2016
April 1, 2015
Present value of funded obligations 579.63 514.84 492.60 - - -
Fair value of plan assets 461.82 420.00 463.45 - - -
Deficit of funded plan 117.81 94.84 29.15 - - -
Unfunded plans 0.73 0.60 0.52 249.13 202.30 192.33
Deficit of Employee Benefit Plans 118.54 95.44 29.67 249.13 202.30 192.33
(iv) Post Employment Benefits
The significant actuarial assumptions were as follows:
Particulars March 31, 2017 March 31, 2016 April 1, 2015
Discount rate 7.00% 7.80% 7.80%
Salary growth rate 4.00% 3.00% 3.00%
Expected Return on Assets 8.50% 8.50% 8.50%
Mortality Indian assured lives mortality
(2006-08) (modified) Ultimate
Indian assured lives mortality
(2006-08) (modified) Ultimate
Indian assured lives mortality
(2006-08) (modified) Ultimate
Withdrawal Rate 2.00% 2.00% 2.00%
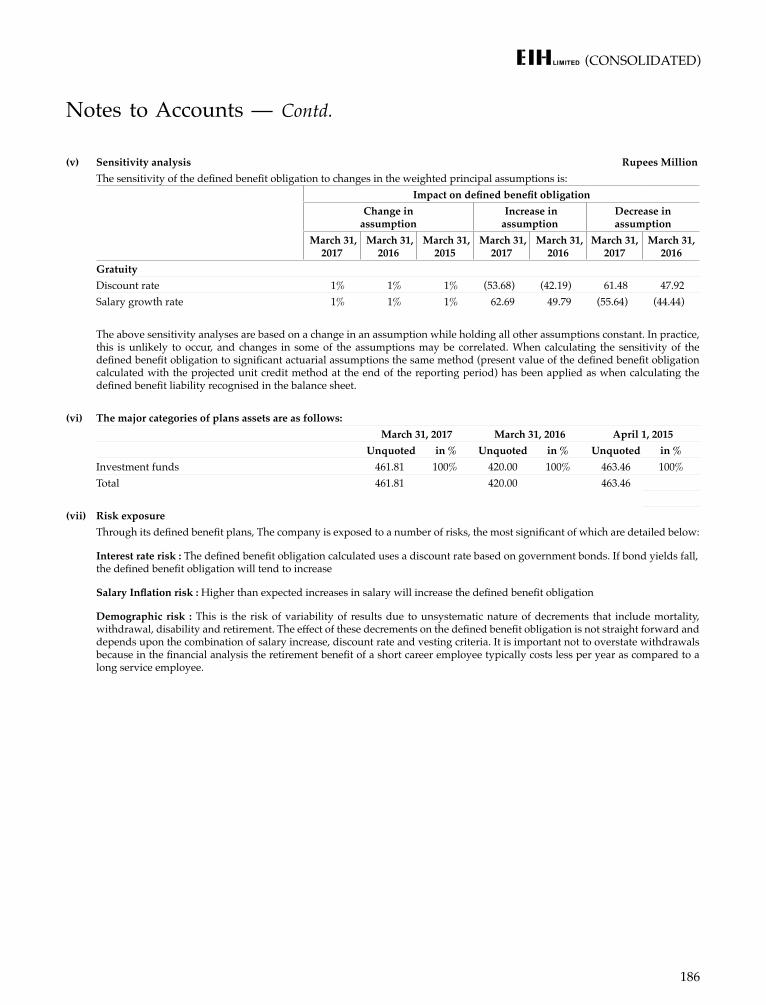
(CONSOLIDATED)
186
(v) Sensitivity analysis Rupees MillionThe sensitivity of the defined benefit obligation to changes in the weighted principal assumptions is:
Impact on defined benefit obligationChange in
assumption Increase in assumption
Decrease in assumption
March 31, 2017
March 31, 2016
March 31, 2015
March 31, 2017
March 31, 2016
March 31, 2017
March 31, 2016
GratuityDiscount rate 1% 1% 1% (53.68) (42.19) 61.48 47.92 Salary growth rate 1% 1% 1% 62.69 49.79 (55.64) (44.44)
The above sensitivity analyses are based on a change in an assumption while holding all other assumptions constant. In practice, this is unlikely to occur, and changes in some of the assumptions may be correlated. When calculating the sensitivity of the defined benefit obligation to significant actuarial assumptions the same method (present value of the defined benefit obligation calculated with the projected unit credit method at the end of the reporting period) has been applied as when calculating the defined benefit liability recognised in the balance sheet.
(vi) The major categories of plans assets are as follows:March 31, 2017 March 31, 2016 April 1, 2015
Unquoted in % Unquoted in % Unquoted in %Investment funds 461.81 100% 420.00 100% 463.46 100%Total 461.81 420.00 463.46
(vii) Risk exposure Through its defined benefit plans, The company is exposed to a number of risks, the most significant of which are detailed below:
Interest rate risk : The defined benefit obligation calculated uses a discount rate based on government bonds. If bond yields fall, the defined benefit obligation will tend to increase
Salary Inflation risk : Higher than expected increases in salary will increase the defined benefit obligation
Demographic risk : This is the risk of variability of results due to unsystematic nature of decrements that include mortality, withdrawal, disability and retirement. The effect of these decrements on the defined benefit obligation is not straight forward and depends upon the combination of salary increase, discount rate and vesting criteria. It is important not to overstate withdrawals because in the financial analysis the retirement benefit of a short career employee typically costs less per year as compared to a long service employee.
Notes to Accounts — Contd.
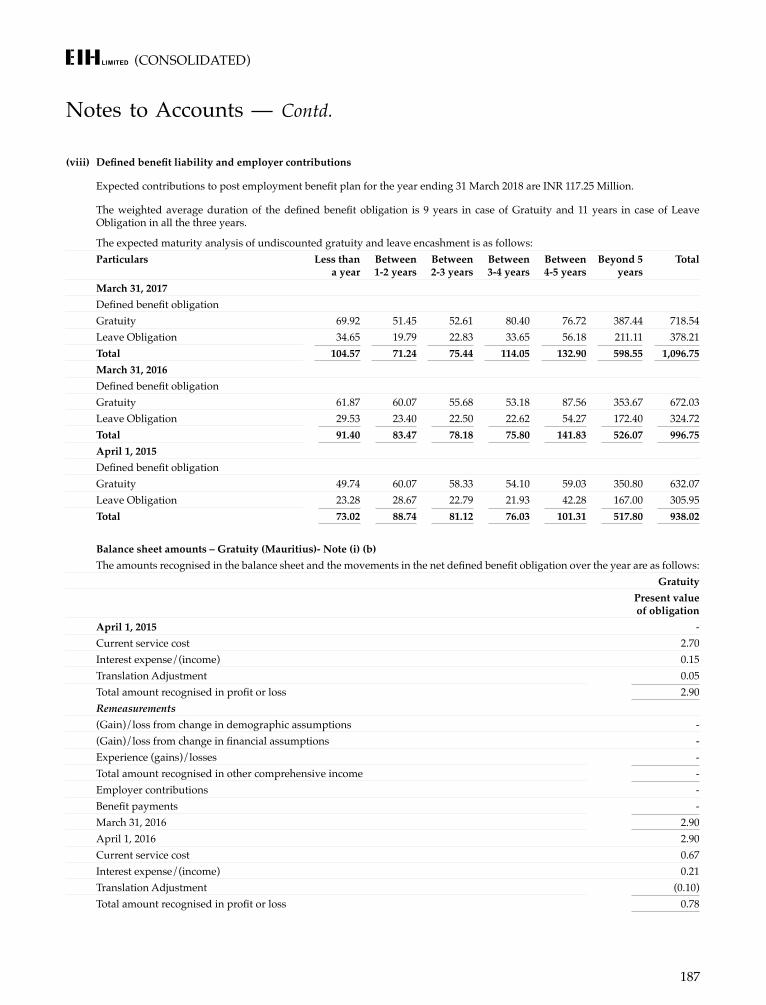
(CONSOLIDATED)
187
(viii) Defined benefit liability and employer contributions
Expected contributions to post employment benefit plan for the year ending 31 March 2018 are INR 117.25 Million.
The weighted average duration of the defined benefit obligation is 9 years in case of Gratuity and 11 years in case of Leave Obligation in all the three years.
The expected maturity analysis of undiscounted gratuity and leave encashment is as follows:Particulars Less than
a year Between 1-2 years
Between 2-3 years
Between 3-4 years
Between 4-5 years
Beyond 5 years
Total
March 31, 2017Defined benefit obligationGratuity 69.92 51.45 52.61 80.40 76.72 387.44 718.54 Leave Obligation 34.65 19.79 22.83 33.65 56.18 211.11 378.21 Total 104.57 71.24 75.44 114.05 132.90 598.55 1,096.75 March 31, 2016Defined benefit obligationGratuity 61.87 60.07 55.68 53.18 87.56 353.67 672.03 Leave Obligation 29.53 23.40 22.50 22.62 54.27 172.40 324.72 Total 91.40 83.47 78.18 75.80 141.83 526.07 996.75 April 1, 2015Defined benefit obligationGratuity 49.74 60.07 58.33 54.10 59.03 350.80 632.07 Leave Obligation 23.28 28.67 22.79 21.93 42.28 167.00 305.95 Total 73.02 88.74 81.12 76.03 101.31 517.80 938.02
Balance sheet amounts – Gratuity (Mauritius)- Note (i) (b)The amounts recognised in the balance sheet and the movements in the net defined benefit obligation over the year are as follows:
Gratuity Present value
of obligationApril 1, 2015 - Current service cost 2.70 Interest expense/(income) 0.15 Translation Adjustment 0.05 Total amount recognised in profit or loss 2.90 Remeasurements(Gain)/loss from change in demographic assumptions - (Gain)/loss from change in financial assumptions - Experience (gains)/losses - Total amount recognised in other comprehensive income - Employer contributions - Benefit payments - March 31, 2016 2.90 April 1, 2016 2.90 Current service cost 0.67 Interest expense/(income) 0.21 Translation Adjustment (0.10)Total amount recognised in profit or loss 0.78
Notes to Accounts — Contd.
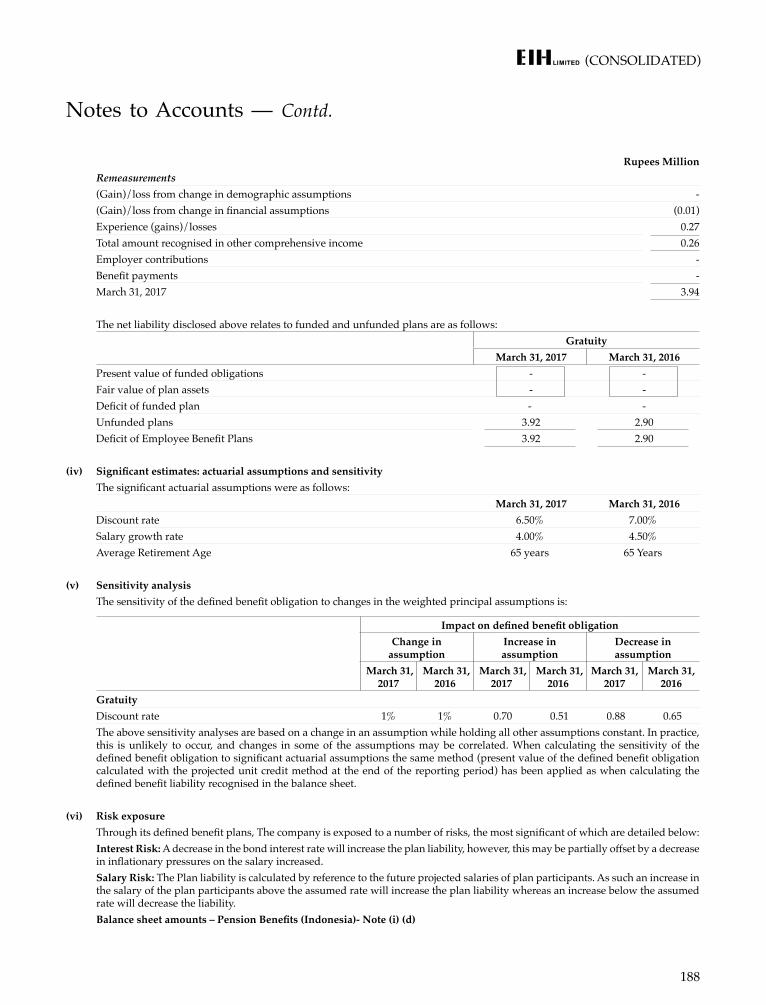
(CONSOLIDATED)
188
Rupees MillionRemeasurements(Gain)/loss from change in demographic assumptions -(Gain)/loss from change in financial assumptions (0.01)Experience (gains)/losses 0.27Total amount recognised in other comprehensive income 0.26Employer contributions -Benefit payments -March 31, 2017 3.94
The net liability disclosed above relates to funded and unfunded plans are as follows:Gratuity
March 31, 2017 March 31, 2016 Present value of funded obligations - - Fair value of plan assets - - Deficit of funded plan - - Unfunded plans 3.92 2.90 Deficit of Employee Benefit Plans 3.92 2.90
(iv) Significant estimates: actuarial assumptions and sensitivity The significant actuarial assumptions were as follows:
March 31, 2017 March 31, 2016 Discount rate 6.50% 7.00%Salary growth rate 4.00% 4.50%Average Retirement Age 65 years 65 Years
(v) Sensitivity analysisThe sensitivity of the defined benefit obligation to changes in the weighted principal assumptions is:
Impact on defined benefit obligationChange in
assumptionIncrease in assumption
Decrease in assumption
March 31, 2017
March 31, 2016
March 31, 2017
March 31, 2016
March 31, 2017
March 31, 2016
GratuityDiscount rate 1% 1% 0.70 0.51 0.88 0.65 The above sensitivity analyses are based on a change in an assumption while holding all other assumptions constant. In practice, this is unlikely to occur, and changes in some of the assumptions may be correlated. When calculating the sensitivity of the defined benefit obligation to significant actuarial assumptions the same method (present value of the defined benefit obligation calculated with the projected unit credit method at the end of the reporting period) has been applied as when calculating the defined benefit liability recognised in the balance sheet.
(vi) Risk exposure Through its defined benefit plans, The company is exposed to a number of risks, the most significant of which are detailed below:Interest Risk: A decrease in the bond interest rate will increase the plan liability, however, this may be partially offset by a decrease in inflationary pressures on the salary increased.Salary Risk: The Plan liability is calculated by reference to the future projected salaries of plan participants. As such an increase in the salary of the plan participants above the assumed rate will increase the plan liability whereas an increase below the assumed rate will decrease the liability.Balance sheet amounts – Pension Benefits (Indonesia)- Note (i) (d)
Notes to Accounts — Contd.
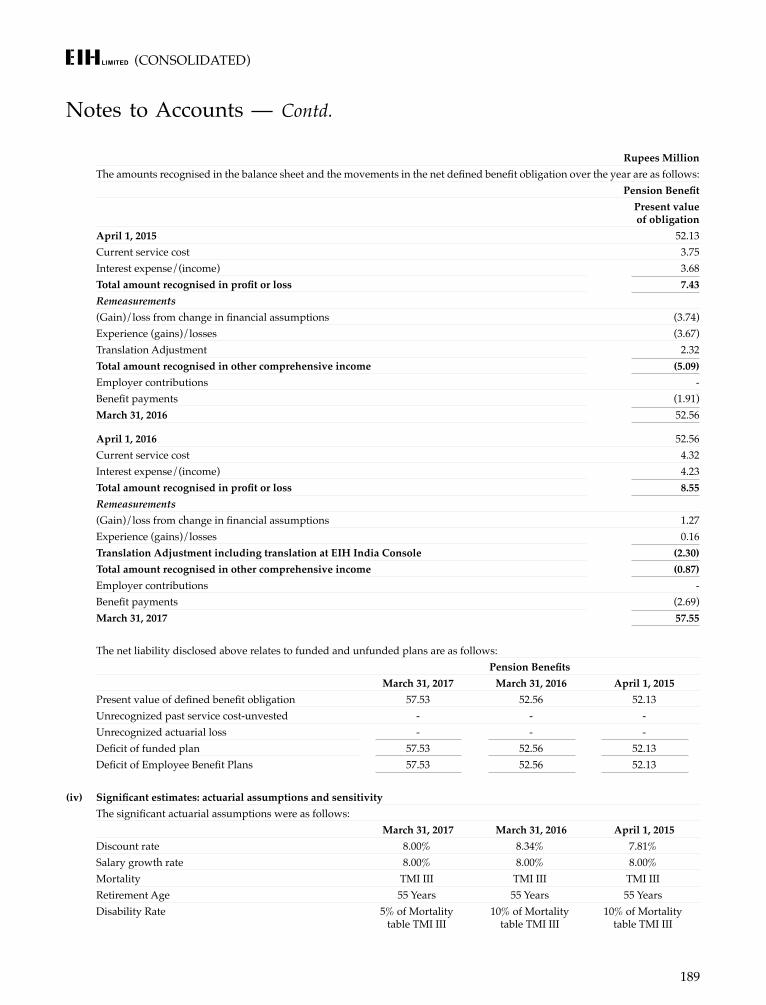
(CONSOLIDATED)
189
Rupees MillionThe amounts recognised in the balance sheet and the movements in the net defined benefit obligation over the year are as follows:
Pension Benefit Present value of obligation
April 1, 2015 52.13 Current service cost 3.75 Interest expense/(income) 3.68 Total amount recognised in profit or loss 7.43 Remeasurements(Gain)/loss from change in financial assumptions (3.74)Experience (gains)/losses (3.67)Translation Adjustment 2.32 Total amount recognised in other comprehensive income (5.09)Employer contributions - Benefit payments (1.91)March 31, 2016 52.56
April 1, 2016 52.56 Current service cost 4.32 Interest expense/(income) 4.23 Total amount recognised in profit or loss 8.55 Remeasurements(Gain)/loss from change in financial assumptions 1.27 Experience (gains)/losses 0.16 Translation Adjustment including translation at EIH India Console (2.30)Total amount recognised in other comprehensive income (0.87)Employer contributions - Benefit payments (2.69)March 31, 2017 57.55
The net liability disclosed above relates to funded and unfunded plans are as follows: Pension Benefits
March 31, 2017 March 31, 2016 April 1, 2015 Present value of defined benefit obligation 57.53 52.56 52.13 Unrecognized past service cost-unvested - - - Unrecognized actuarial loss - - - Deficit of funded plan 57.53 52.56 52.13 Deficit of Employee Benefit Plans 57.53 52.56 52.13
(iv) Significant estimates: actuarial assumptions and sensitivity The significant actuarial assumptions were as follows:
March 31, 2017 March 31, 2016 April 1, 2015 Discount rate 8.00% 8.34% 7.81%Salary growth rate 8.00% 8.00% 8.00%Mortality TMI III TMI III TMI IIIRetirement Age 55 Years 55 Years 55 YearsDisability Rate 5% of Mortality
table TMI III10% of Mortality
table TMI III10% of Mortality
table TMI III
Notes to Accounts — Contd.
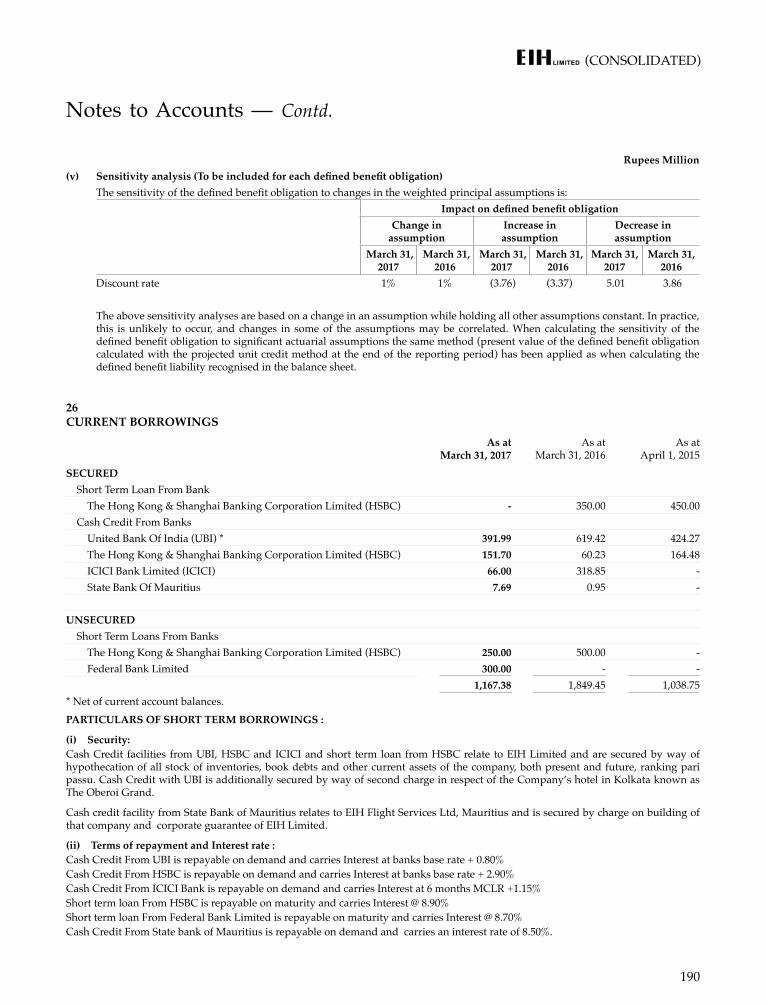
(CONSOLIDATED)
190
Rupees Million(v) Sensitivity analysis (To be included for each defined benefit obligation)
The sensitivity of the defined benefit obligation to changes in the weighted principal assumptions is:Impact on defined benefit obligation
Change in assumption
Increase in assumption
Decrease in assumption
March 31, 2017
March 31, 2016
March 31, 2017
March 31, 2016
March 31, 2017
March 31, 2016
Discount rate 1% 1% (3.76) (3.37) 5.01 3.86
The above sensitivity analyses are based on a change in an assumption while holding all other assumptions constant. In practice, this is unlikely to occur, and changes in some of the assumptions may be correlated. When calculating the sensitivity of the defined benefit obligation to significant actuarial assumptions the same method (present value of the defined benefit obligation calculated with the projected unit credit method at the end of the reporting period) has been applied as when calculating the defined benefit liability recognised in the balance sheet.
Notes to Accounts — Contd.
26 CURRENT BORROWINGS
As at March 31, 2017
As at March 31, 2016
As at April 1, 2015
SECURED Short Term Loan From Bank The Hong Kong & Shanghai Banking Corporation Limited (HSBC) - 350.00 450.00 Cash Credit From Banks United Bank Of India (UBI) * 391.99 619.42 424.27 The Hong Kong & Shanghai Banking Corporation Limited (HSBC) 151.70 60.23 164.48 ICICI Bank Limited (ICICI) 66.00 318.85 - State Bank Of Mauritius 7.69 0.95 -
UNSECURED Short Term Loans From Banks The Hong Kong & Shanghai Banking Corporation Limited (HSBC) 250.00 500.00 - Federal Bank Limited 300.00 - -
1,167.38 1,849.45 1,038.75 * Net of current account balances.PARTICULARS OF SHORT TERM BORROWINGS :
(i) Security:Cash Credit facilities from UBI, HSBC and ICICI and short term loan from HSBC relate to EIH Limited and are secured by way of hypothecation of all stock of inventories, book debts and other current assets of the company, both present and future, ranking pari passu. Cash Credit with UBI is additionally secured by way of second charge in respect of the Company’s hotel in Kolkata known as The Oberoi Grand.
Cash credit facility from State Bank of Mauritius relates to EIH Flight Services Ltd, Mauritius and is secured by charge on building of that company and corporate guarantee of EIH Limited.
(ii) Terms of repayment and Interest rate :Cash Credit From UBI is repayable on demand and carries Interest at banks base rate + 0.80%Cash Credit From HSBC is repayable on demand and carries Interest at banks base rate + 2.90%Cash Credit From ICICI Bank is repayable on demand and carries Interest at 6 months MCLR +1.15%Short term loan From HSBC is repayable on maturity and carries Interest @ 8.90%Short term loan From Federal Bank Limited is repayable on maturity and carries Interest @ 8.70%Cash Credit From State bank of Mauritius is repayable on demand and carries an interest rate of 8.50%.
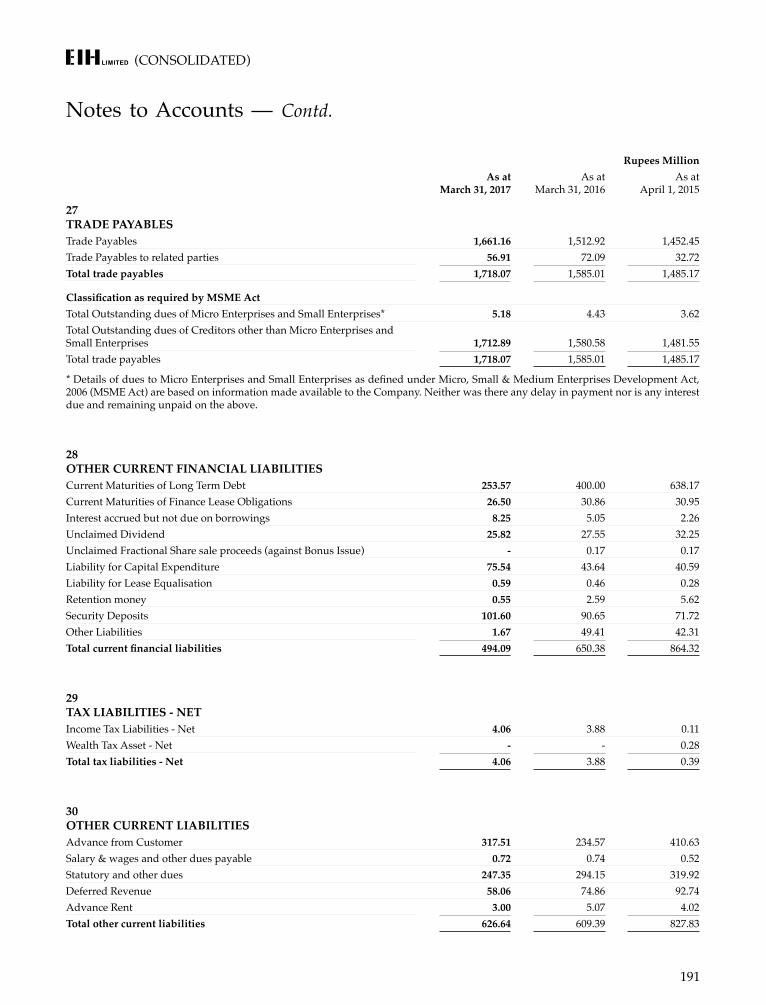
(CONSOLIDATED)
191
Rupees MillionAs at
March 31, 2017As at
March 31, 2016As at
April 1, 2015
27 TRADE PAYABLESTrade Payables 1,661.16 1,512.92 1,452.45 Trade Payables to related parties 56.91 72.09 32.72 Total trade payables 1,718.07 1,585.01 1,485.17
Classification as required by MSME ActTotal Outstanding dues of Micro Enterprises and Small Enterprises* 5.18 4.43 3.62 Total Outstanding dues of Creditors other than Micro Enterprises and Small Enterprises 1,712.89 1,580.58 1,481.55 Total trade payables 1,718.07 1,585.01 1,485.17
* Details of dues to Micro Enterprises and Small Enterprises as defined under Micro, Small & Medium Enterprises Development Act, 2006 (MSME Act) are based on information made available to the Company. Neither was there any delay in payment nor is any interest due and remaining unpaid on the above.
28 OTHER CURRENT FINANCIAL LIABILITIESCurrent Maturities of Long Term Debt 253.57 400.00 638.17 Current Maturities of Finance Lease Obligations 26.50 30.86 30.95 Interest accrued but not due on borrowings 8.25 5.05 2.26 Unclaimed Dividend 25.82 27.55 32.25 Unclaimed Fractional Share sale proceeds (against Bonus Issue) - 0.17 0.17 Liability for Capital Expenditure 75.54 43.64 40.59 Liability for Lease Equalisation 0.59 0.46 0.28 Retention money 0.55 2.59 5.62 Security Deposits 101.60 90.65 71.72 Other Liabilities 1.67 49.41 42.31 Total current financial liabilities 494.09 650.38 864.32
29 TAX LIABILITIES - NETIncome Tax Liabilities - Net 4.06 3.88 0.11 Wealth Tax Asset - Net - - 0.28 Total tax liabilities - Net 4.06 3.88 0.39
30 OTHER CURRENT LIABILITIESAdvance from Customer 317.51 234.57 410.63 Salary & wages and other dues payable 0.72 0.74 0.52 Statutory and other dues 247.35 294.15 319.92 Deferred Revenue 58.06 74.86 92.74 Advance Rent 3.00 5.07 4.02 Total other current liabilities 626.64 609.39 827.83
Notes to Accounts — Contd.
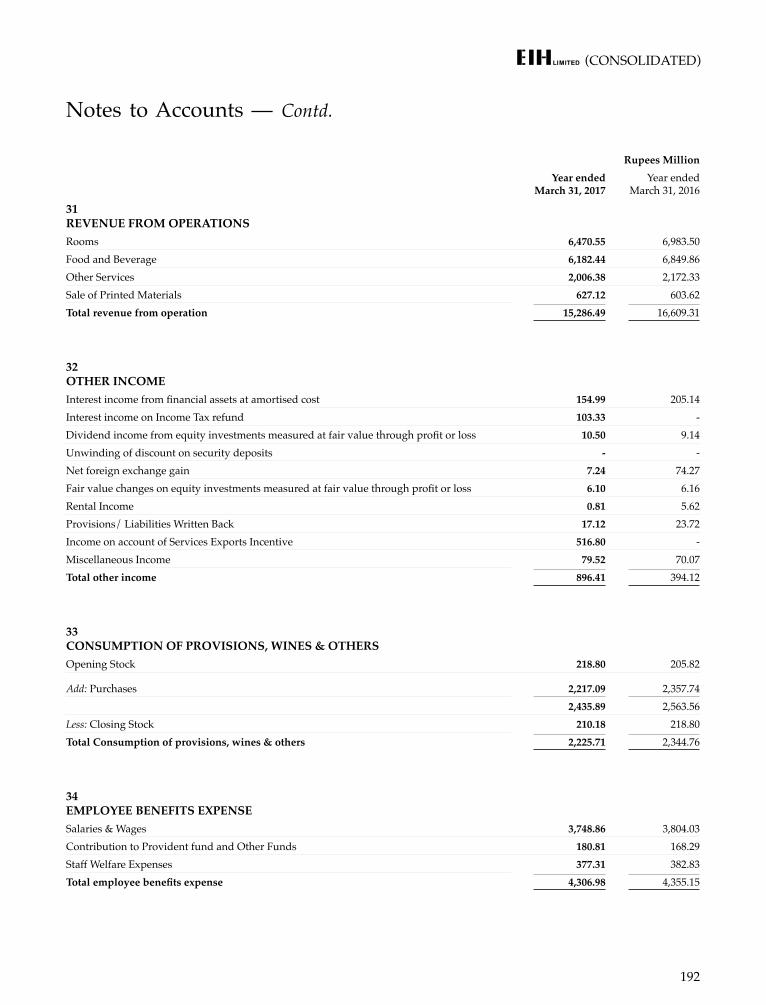
(CONSOLIDATED)
192
Rupees MillionYear ended
March 31, 2017Year ended
March 31, 2016
31 REVENUE FROM OPERATIONSRooms 6,470.55 6,983.50 Food and Beverage 6,182.44 6,849.86 Other Services 2,006.38 2,172.33 Sale of Printed Materials 627.12 603.62 Total revenue from operation 15,286.49 16,609.31
32 OTHER INCOMEInterest income from financial assets at amortised cost 154.99 205.14 Interest income on Income Tax refund 103.33 - Dividend income from equity investments measured at fair value through profit or loss 10.50 9.14 Unwinding of discount on security deposits - - Net foreign exchange gain 7.24 74.27 Fair value changes on equity investments measured at fair value through profit or loss 6.10 6.16 Rental Income 0.81 5.62 Provisions/ Liabilities Written Back 17.12 23.72 Income on account of Services Exports Incentive 516.80 - Miscellaneous Income 79.52 70.07 Total other income 896.41 394.12
33 CONSUMPTION OF PROVISIONS, WINES & OTHERSOpening Stock 218.80 205.82
Add: Purchases 2,217.09 2,357.74 2,435.89 2,563.56
Less: Closing Stock 210.18 218.80 Total Consumption of provisions, wines & others 2,225.71 2,344.76
34 EMPLOYEE BENEFITS EXPENSESalaries & Wages 3,748.86 3,804.03 Contribution to Provident fund and Other Funds 180.81 168.29 Staff Welfare Expenses 377.31 382.83 Total employee benefits expense 4,306.98 4,355.15
Notes to Accounts — Contd.
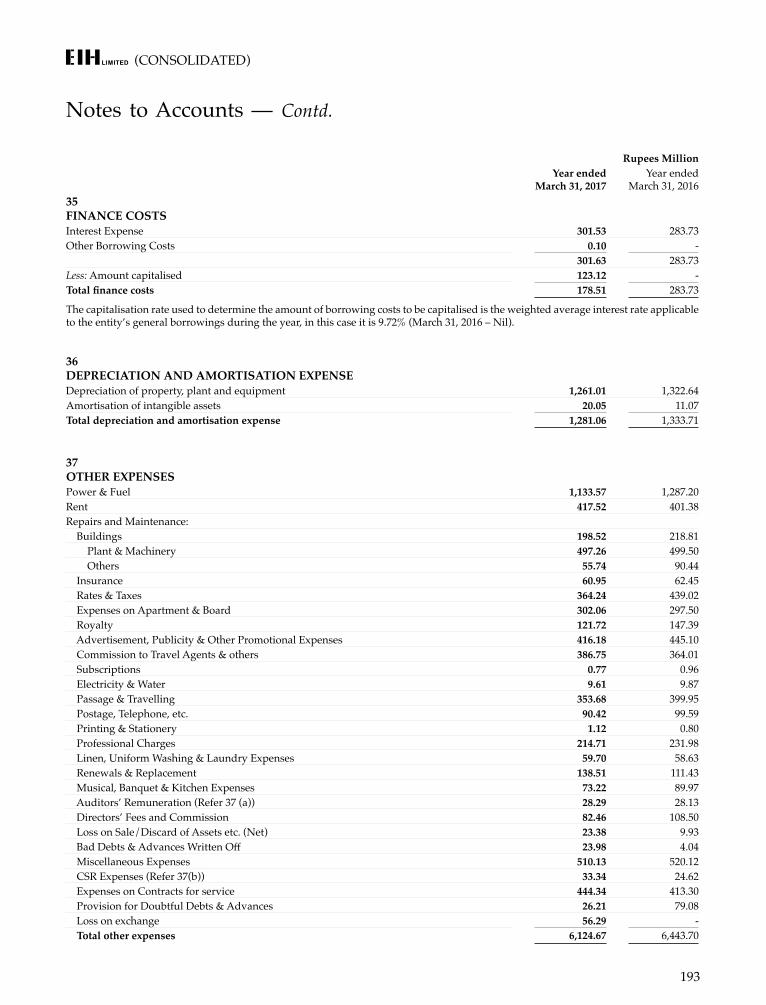
(CONSOLIDATED)
193
Rupees MillionYear ended
March 31, 2017Year ended
March 31, 201635 FINANCE COSTS Interest Expense 301.53 283.73 Other Borrowing Costs 0.10 -
301.63 283.73 Less: Amount capitalised 123.12 - Total finance costs 178.51 283.73
The capitalisation rate used to determine the amount of borrowing costs to be capitalised is the weighted average interest rate applicable to the entity’s general borrowings during the year, in this case it is 9.72% (March 31, 2016 – Nil).
36 DEPRECIATION AND AMORTISATION EXPENSE Depreciation of property, plant and equipment 1,261.01 1,322.64 Amortisation of intangible assets 20.05 11.07 Total depreciation and amortisation expense 1,281.06 1,333.71
37 OTHER EXPENSES Power & Fuel 1,133.57 1,287.20 Rent 417.52 401.38 Repairs and Maintenance: Buildings 198.52 218.81 Plant & Machinery 497.26 499.50 Others 55.74 90.44 Insurance 60.95 62.45 Rates & Taxes 364.24 439.02 Expenses on Apartment & Board 302.06 297.50 Royalty 121.72 147.39 Advertisement, Publicity & Other Promotional Expenses 416.18 445.10 Commission to Travel Agents & others 386.75 364.01 Subscriptions 0.77 0.96 Electricity & Water 9.61 9.87 Passage & Travelling 353.68 399.95 Postage, Telephone, etc. 90.42 99.59 Printing & Stationery 1.12 0.80 Professional Charges 214.71 231.98 Linen, Uniform Washing & Laundry Expenses 59.70 58.63 Renewals & Replacement 138.51 111.43 Musical, Banquet & Kitchen Expenses 73.22 89.97 Auditors’ Remuneration (Refer 37 (a)) 28.29 28.13 Directors’ Fees and Commission 82.46 108.50 Loss on Sale/Discard of Assets etc. (Net) 23.38 9.93 Bad Debts & Advances Written Off 23.98 4.04 Miscellaneous Expenses 510.13 520.12 CSR Expenses (Refer 37(b)) 33.34 24.62 Expenses on Contracts for service 444.34 413.30 Provision for Doubtful Debts & Advances 26.21 79.08 Loss on exchange 56.29 - Total other expenses 6,124.67 6,443.70
Notes to Accounts — Contd.
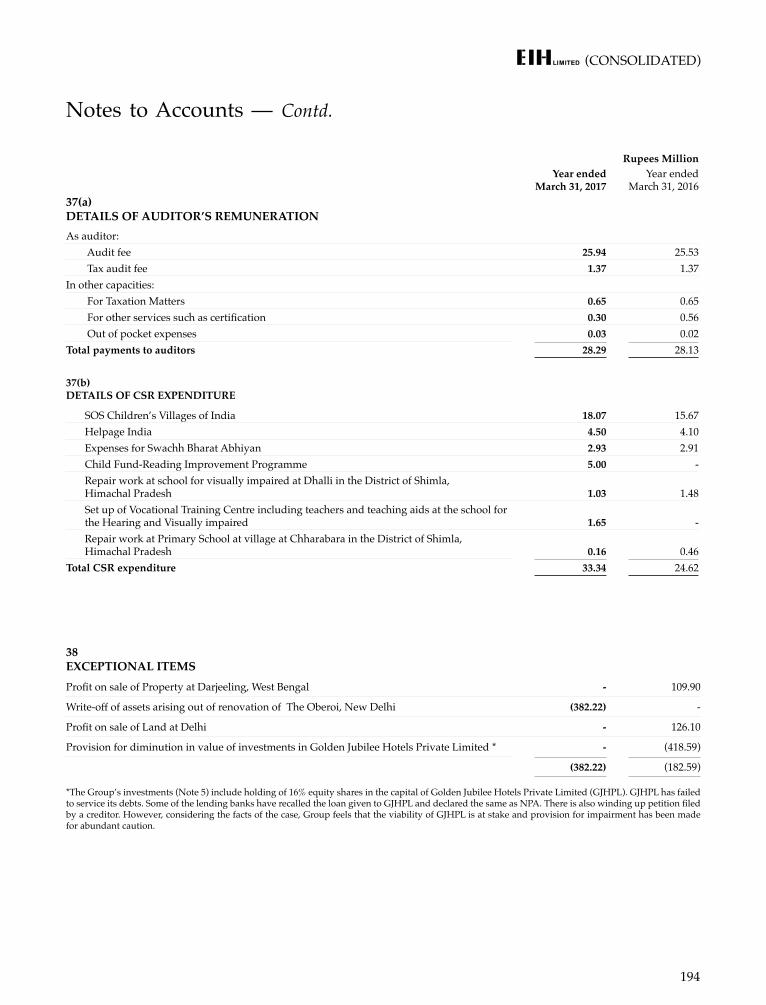
(CONSOLIDATED)
194
Rupees MillionYear ended
March 31, 2017Year ended
March 31, 201637(a) DETAILS OF AUDITOR’S REMUNERATION As auditor: Audit fee 25.94 25.53 Tax audit fee 1.37 1.37 In other capacities: For Taxation Matters 0.65 0.65 For other services such as certification 0.30 0.56 Out of pocket expenses 0.03 0.02 Total payments to auditors 28.29 28.13
37(b) DETAILS OF CSR EXPENDITURE
SOS Children’s Villages of India 18.07 15.67 Helpage India 4.50 4.10 Expenses for Swachh Bharat Abhiyan 2.93 2.91 Child Fund-Reading Improvement Programme 5.00 - Repair work at school for visually impaired at Dhalli in the District of Shimla, Himachal Pradesh 1.03 1.48 Set up of Vocational Training Centre including teachers and teaching aids at the school for the Hearing and Visually impaired 1.65 - Repair work at Primary School at village at Chharabara in the District of Shimla, Himachal Pradesh 0.16 0.46
Total CSR expenditure 33.34 24.62
Notes to Accounts — Contd.
38 EXCEPTIONAL ITEMSProfit on sale of Property at Darjeeling, West Bengal - 109.90
Write-off of assets arising out of renovation of The Oberoi, New Delhi (382.22) -
Profit on sale of Land at Delhi - 126.10
Provision for diminution in value of investments in Golden Jubilee Hotels Private Limited * - (418.59)
(382.22) (182.59)
*The Group’s investments (Note 5) include holding of 16% equity shares in the capital of Golden Jubilee Hotels Private Limited (GJHPL). GJHPL has failed to service its debts. Some of the lending banks have recalled the loan given to GJHPL and declared the same as NPA. There is also winding up petition filed by a creditor. However, considering the facts of the case, Group feels that the viability of GJHPL is at stake and provision for impairment has been made for abundant caution.
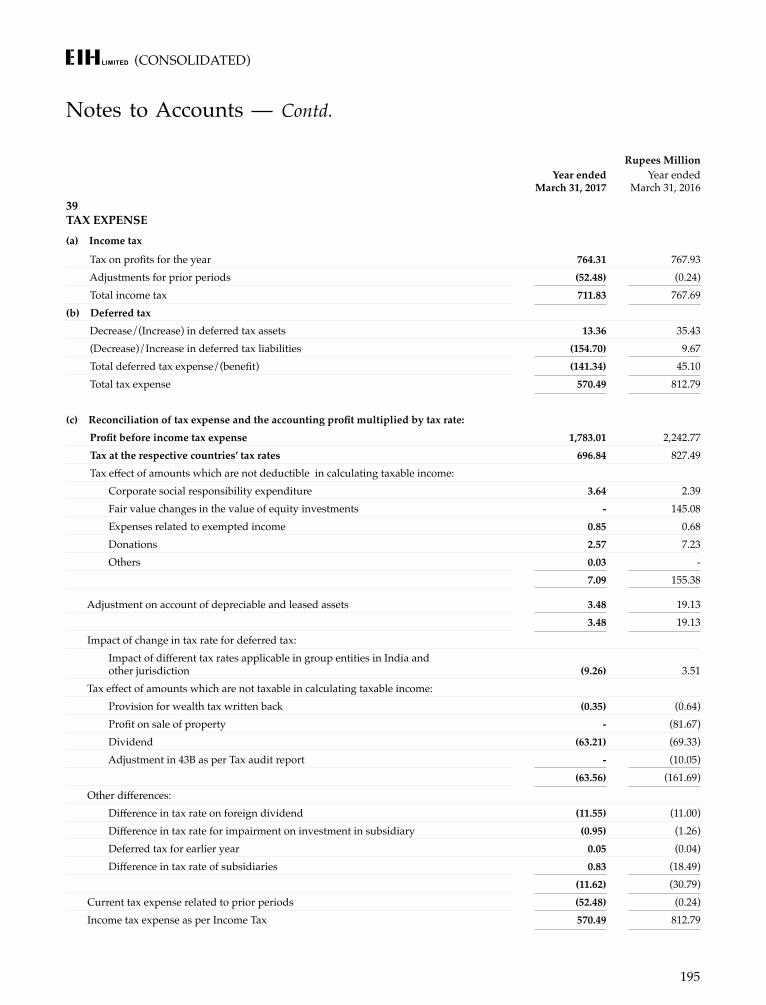
(CONSOLIDATED)
195
Notes to Accounts — Contd.
Rupees MillionYear ended
March 31, 2017Year ended
March 31, 2016
39 TAX EXPENSE(a) Income tax
Tax on profits for the year 764.31 767.93 Adjustments for prior periods (52.48) (0.24) Total income tax 711.83 767.69 (b) Deferred tax Decrease/(Increase) in deferred tax assets 13.36 35.43 (Decrease)/Increase in deferred tax liabilities (154.70) 9.67 Total deferred tax expense/(benefit) (141.34) 45.10 Total tax expense 570.49 812.79
(c) Reconciliation of tax expense and the accounting profit multiplied by tax rate: Profit before income tax expense 1,783.01 2,242.77 Tax at the respective countries’ tax rates 696.84 827.49 Tax effect of amounts which are not deductible in calculating taxable income: Corporate social responsibility expenditure 3.64 2.39 Fair value changes in the value of equity investments - 145.08 Expenses related to exempted income 0.85 0.68 Donations 2.57 7.23 Others 0.03 -
7.09 155.38
Adjustment on account of depreciable and leased assets 3.48 19.13 3.48 19.13
Impact of change in tax rate for deferred tax: Impact of different tax rates applicable in group entities in India and
other jurisdiction (9.26) 3.51 Tax effect of amounts which are not taxable in calculating taxable income: Provision for wealth tax written back (0.35) (0.64) Profit on sale of property - (81.67) Dividend (63.21) (69.33) Adjustment in 43B as per Tax audit report - (10.05)
(63.56) (161.69) Other differences: Difference in tax rate on foreign dividend (11.55) (11.00) Difference in tax rate for impairment on investment in subsidiary (0.95) (1.26) Deferred tax for earlier year 0.05 (0.04) Difference in tax rate of subsidiaries 0.83 (18.49)
(11.62) (30.79) Current tax expense related to prior periods (52.48) (0.24) Income tax expense as per Income Tax 570.49 812.79
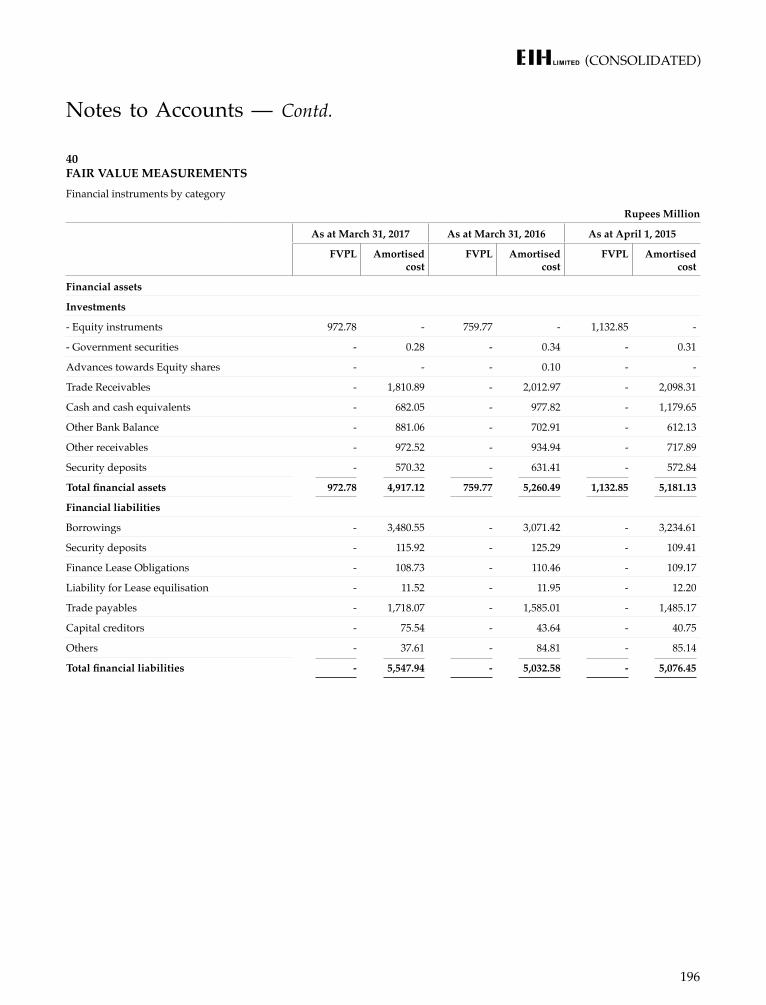
(CONSOLIDATED)
196
40 FAIR VALUE MEASUREMENTSFinancial instruments by category
Rupees Million
As at March 31, 2017 As at March 31, 2016 As at April 1, 2015
FVPL Amortised cost
FVPL Amortised cost
FVPL Amortised cost
Financial assets
Investments
- Equity instruments 972.78 - 759.77 - 1,132.85 -
- Government securities - 0.28 - 0.34 - 0.31
Advances towards Equity shares - - - 0.10 - -
Trade Receivables - 1,810.89 - 2,012.97 - 2,098.31
Cash and cash equivalents - 682.05 - 977.82 - 1,179.65
Other Bank Balance - 881.06 - 702.91 - 612.13
Other receivables - 972.52 - 934.94 - 717.89
Security deposits - 570.32 - 631.41 - 572.84
Total financial assets 972.78 4,917.12 759.77 5,260.49 1,132.85 5,181.13
Financial liabilities
Borrowings - 3,480.55 - 3,071.42 - 3,234.61
Security deposits - 115.92 - 125.29 - 109.41
Finance Lease Obligations - 108.73 - 110.46 - 109.17
Liability for Lease equilisation - 11.52 - 11.95 - 12.20
Trade payables - 1,718.07 - 1,585.01 - 1,485.17
Capital creditors - 75.54 - 43.64 - 40.75
Others - 37.61 - 84.81 - 85.14
Total financial liabilities - 5,547.94 - 5,032.58 - 5,076.45
Notes to Accounts — Contd.
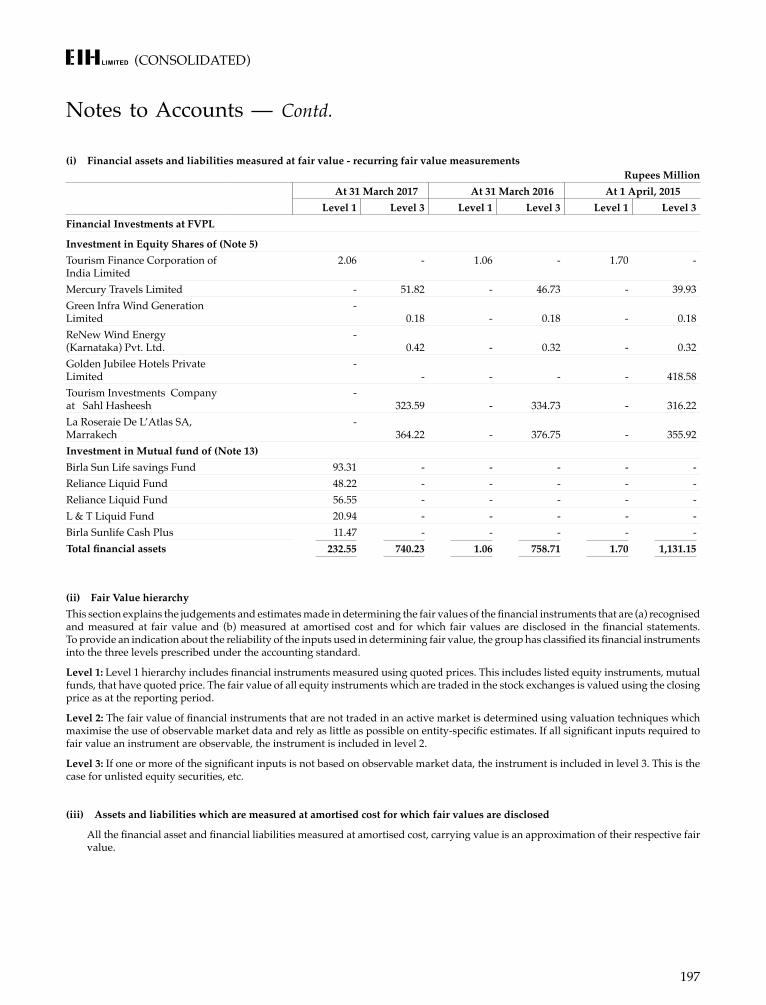
(CONSOLIDATED)
197
(i) Financial assets and liabilities measured at fair value - recurring fair value measurementsRupees Million
At 31 March 2017 At 31 March 2016 At 1 April, 2015Level 1 Level 3 Level 1 Level 3 Level 1 Level 3
Financial Investments at FVPL
Investment in Equity Shares of (Note 5) Tourism Finance Corporation of India Limited
2.06 - 1.06 - 1.70 -
Mercury Travels Limited - 51.82 - 46.73 - 39.93 Green Infra Wind Generation Limited
- 0.18 - 0.18 - 0.18
ReNew Wind Energy (Karnataka) Pvt. Ltd.
- 0.42 - 0.32 - 0.32
Golden Jubilee Hotels Private Limited
- - - - - 418.58
Tourism Investments Company at Sahl Hasheesh
- 323.59 - 334.73 - 316.22
La Roseraie De L’Atlas SA, Marrakech
- 364.22 - 376.75 - 355.92
Investment in Mutual fund of (Note 13) Birla Sun Life savings Fund 93.31 - - - - - Reliance Liquid Fund 48.22 - - - - - Reliance Liquid Fund 56.55 - - - - - L & T Liquid Fund 20.94 - - - - - Birla Sunlife Cash Plus 11.47 - - - - - Total financial assets 232.55 740.23 1.06 758.71 1.70 1,131.15
(ii) Fair Value hierarchyThis section explains the judgements and estimates made in determining the fair values of the financial instruments that are (a) recognised and measured at fair value and (b) measured at amortised cost and for which fair values are disclosed in the financial statements. To provide an indication about the reliability of the inputs used in determining fair value, the group has classified its financial instruments into the three levels prescribed under the accounting standard.
Level 1: Level 1 hierarchy includes financial instruments measured using quoted prices. This includes listed equity instruments, mutual funds, that have quoted price. The fair value of all equity instruments which are traded in the stock exchanges is valued using the closing price as at the reporting period.
Level 2: The fair value of financial instruments that are not traded in an active market is determined using valuation techniques which maximise the use of observable market data and rely as little as possible on entity-specific estimates. If all significant inputs required to fair value an instrument are observable, the instrument is included in level 2.
Level 3: If one or more of the significant inputs is not based on observable market data, the instrument is included in level 3. This is the case for unlisted equity securities, etc.
(iii) Assets and liabilities which are measured at amortised cost for which fair values are disclosed
All the financial asset and financial liabilities measured at amortised cost, carrying value is an approximation of their respective fair value.
Notes to Accounts — Contd.
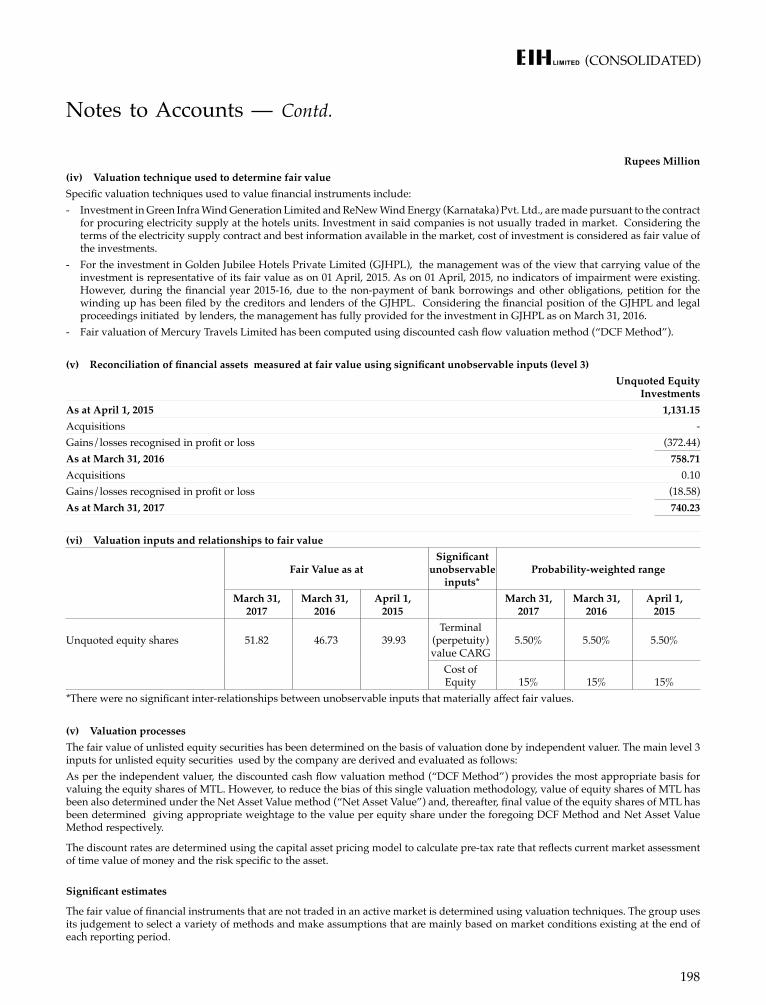
(CONSOLIDATED)
198
Rupees Million(iv) Valuation technique used to determine fair valueSpecific valuation techniques used to value financial instruments include:- Investment in Green Infra Wind Generation Limited and ReNew Wind Energy (Karnataka) Pvt. Ltd., are made pursuant to the contract
for procuring electricity supply at the hotels units. Investment in said companies is not usually traded in market. Considering the terms of the electricity supply contract and best information available in the market, cost of investment is considered as fair value of the investments.
- For the investment in Golden Jubilee Hotels Private Limited (GJHPL), the management was of the view that carrying value of the investment is representative of its fair value as on 01 April, 2015. As on 01 April, 2015, no indicators of impairment were existing. However, during the financial year 2015-16, due to the non-payment of bank borrowings and other obligations, petition for the winding up has been filed by the creditors and lenders of the GJHPL. Considering the financial position of the GJHPL and legal proceedings initiated by lenders, the management has fully provided for the investment in GJHPL as on March 31, 2016.
- Fair valuation of Mercury Travels Limited has been computed using discounted cash flow valuation method (“DCF Method”).
(v) Reconciliation of financial assets measured at fair value using significant unobservable inputs (level 3)Unquoted Equity
InvestmentsAs at April 1, 2015 1,131.15 Acquisitions - Gains/losses recognised in profit or loss (372.44)As at March 31, 2016 758.71 Acquisitions 0.10 Gains/losses recognised in profit or loss (18.58)As at March 31, 2017 740.23
(vi) Valuation inputs and relationships to fair value
Fair Value as at Significant
unobservable inputs*
Probability-weighted range
March 31, 2017
March 31, 2016
April 1, 2015
March 31, 2017
March 31, 2016
April 1, 2015
Unquoted equity shares
51.82 46.73 39.93 Terminal
(perpetuity) value CARG
5.50% 5.50% 5.50%
Cost of Equity 15% 15% 15%
*There were no significant inter-relationships between unobservable inputs that materially affect fair values.
(v) Valuation processesThe fair value of unlisted equity securities has been determined on the basis of valuation done by independent valuer. The main level 3 inputs for unlisted equity securities used by the company are derived and evaluated as follows:As per the independent valuer, the discounted cash flow valuation method (“DCF Method”) provides the most appropriate basis for valuing the equity shares of MTL. However, to reduce the bias of this single valuation methodology, value of equity shares of MTL has been also determined under the Net Asset Value method (“Net Asset Value”) and, thereafter, final value of the equity shares of MTL has been determined giving appropriate weightage to the value per equity share under the foregoing DCF Method and Net Asset Value Method respectively.
The discount rates are determined using the capital asset pricing model to calculate pre-tax rate that reflects current market assessment of time value of money and the risk specific to the asset.
Significant estimates
The fair value of financial instruments that are not traded in an active market is determined using valuation techniques. The group uses its judgement to select a variety of methods and make assumptions that are mainly based on market conditions existing at the end of each reporting period.
Notes to Accounts — Contd.
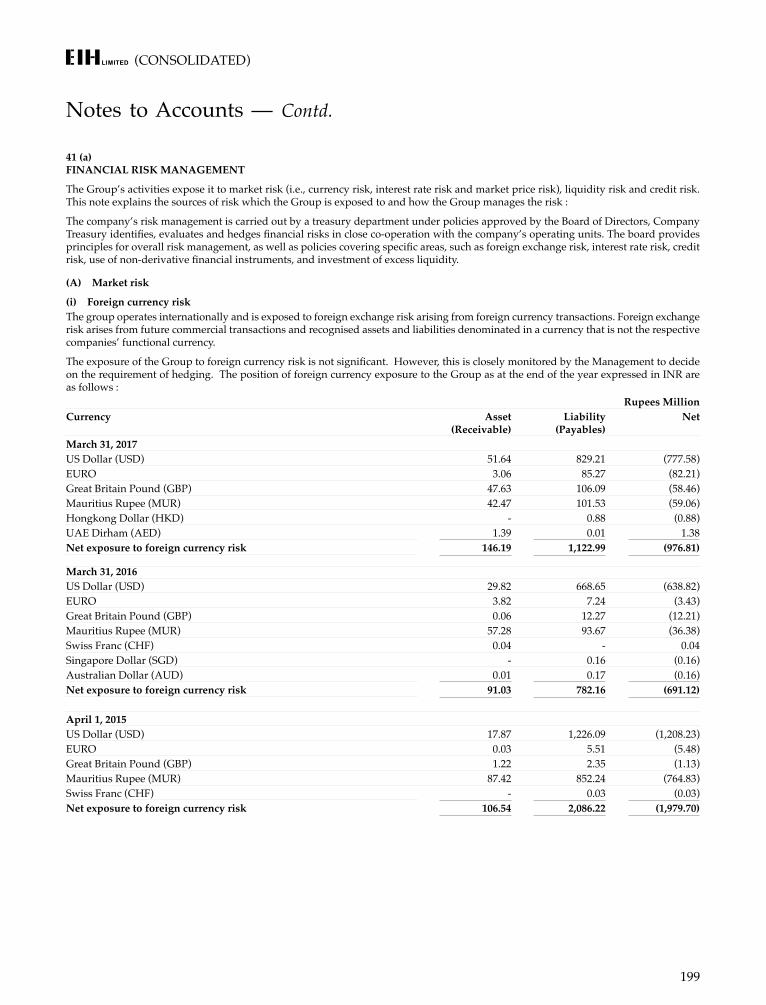
(CONSOLIDATED)
199
41 (a) FINANCIAL RISK MANAGEMENT
The Group’s activities expose it to market risk (i.e., currency risk, interest rate risk and market price risk), liquidity risk and credit risk. This note explains the sources of risk which the Group is exposed to and how the Group manages the risk :
The company’s risk management is carried out by a treasury department under policies approved by the Board of Directors, Company Treasury identifies, evaluates and hedges financial risks in close co-operation with the company’s operating units. The board provides principles for overall risk management, as well as policies covering specific areas, such as foreign exchange risk, interest rate risk, credit risk, use of non-derivative financial instruments, and investment of excess liquidity.
(A) Market risk
(i) Foreign currency riskThe group operates internationally and is exposed to foreign exchange risk arising from foreign currency transactions. Foreign exchange risk arises from future commercial transactions and recognised assets and liabilities denominated in a currency that is not the respective companies’ functional currency.
The exposure of the Group to foreign currency risk is not significant. However, this is closely monitored by the Management to decide on the requirement of hedging. The position of foreign currency exposure to the Group as at the end of the year expressed in INR are as follows :
Rupees MillionCurrency Asset
(Receivable)Liability
(Payables) Net
March 31, 2017US Dollar (USD) 51.64 829.21 (777.58)EURO 3.06 85.27 (82.21)Great Britain Pound (GBP) 47.63 106.09 (58.46)Mauritius Rupee (MUR) 42.47 101.53 (59.06)Hongkong Dollar (HKD) - 0.88 (0.88)UAE Dirham (AED) 1.39 0.01 1.38 Net exposure to foreign currency risk 146.19 1,122.99 (976.81)
March 31, 2016US Dollar (USD) 29.82 668.65 (638.82)EURO 3.82 7.24 (3.43)Great Britain Pound (GBP) 0.06 12.27 (12.21)Mauritius Rupee (MUR) 57.28 93.67 (36.38)Swiss Franc (CHF) 0.04 - 0.04 Singapore Dollar (SGD) - 0.16 (0.16)Australian Dollar (AUD) 0.01 0.17 (0.16)Net exposure to foreign currency risk 91.03 782.16 (691.12)
April 1, 2015US Dollar (USD) 17.87 1,226.09 (1,208.23)EURO 0.03 5.51 (5.48)Great Britain Pound (GBP) 1.22 2.35 (1.13)Mauritius Rupee (MUR) 87.42 852.24 (764.83)Swiss Franc (CHF) - 0.03 (0.03)Net exposure to foreign currency risk 106.54 2,086.22 (1,979.70)
Notes to Accounts — Contd.
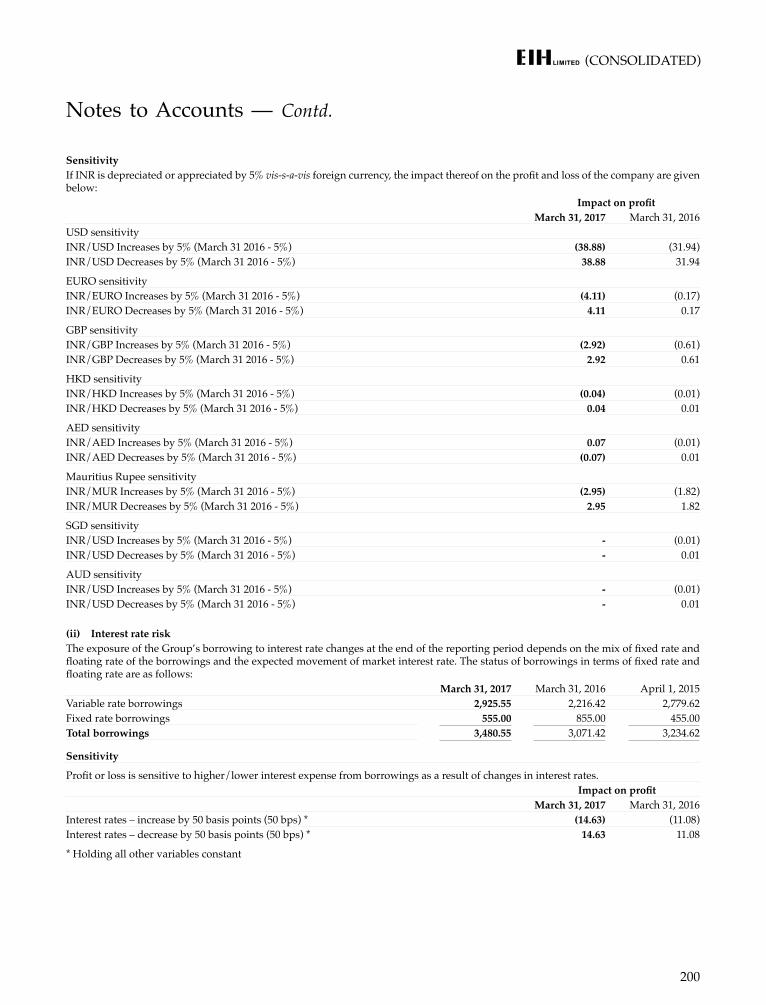
(CONSOLIDATED)
200
SensitivityIf INR is depreciated or appreciated by 5% vis-s-a-vis foreign currency, the impact thereof on the profit and loss of the company are given below:
Impact on profitMarch 31, 2017 March 31, 2016
USD sensitivityINR/USD Increases by 5% (March 31 2016 - 5%) (38.88) (31.94)INR/USD Decreases by 5% (March 31 2016 - 5%) 38.88 31.94
EURO sensitivityINR/EURO Increases by 5% (March 31 2016 - 5%) (4.11) (0.17)INR/EURO Decreases by 5% (March 31 2016 - 5%) 4.11 0.17
GBP sensitivityINR/GBP Increases by 5% (March 31 2016 - 5%) (2.92) (0.61)INR/GBP Decreases by 5% (March 31 2016 - 5%) 2.92 0.61
HKD sensitivityINR/HKD Increases by 5% (March 31 2016 - 5%) (0.04) (0.01)INR/HKD Decreases by 5% (March 31 2016 - 5%) 0.04 0.01
AED sensitivityINR/AED Increases by 5% (March 31 2016 - 5%) 0.07 (0.01)INR/AED Decreases by 5% (March 31 2016 - 5%) (0.07) 0.01
Mauritius Rupee sensitivityINR/MUR Increases by 5% (March 31 2016 - 5%) (2.95) (1.82)INR/MUR Decreases by 5% (March 31 2016 - 5%) 2.95 1.82
SGD sensitivityINR/USD Increases by 5% (March 31 2016 - 5%) - (0.01)INR/USD Decreases by 5% (March 31 2016 - 5%) - 0.01
AUD sensitivityINR/USD Increases by 5% (March 31 2016 - 5%) - (0.01)INR/USD Decreases by 5% (March 31 2016 - 5%) - 0.01
(ii) Interest rate riskThe exposure of the Group’s borrowing to interest rate changes at the end of the reporting period depends on the mix of fixed rate and floating rate of the borrowings and the expected movement of market interest rate. The status of borrowings in terms of fixed rate and floating rate are as follows:
March 31, 2017 March 31, 2016 April 1, 2015Variable rate borrowings 2,925.55 2,216.42 2,779.62 Fixed rate borrowings 555.00 855.00 455.00 Total borrowings 3,480.55 3,071.42 3,234.62
Sensitivity
Profit or loss is sensitive to higher/lower interest expense from borrowings as a result of changes in interest rates. Impact on profit
March 31, 2017 March 31, 2016Interest rates – increase by 50 basis points (50 bps) * (14.63) (11.08) Interest rates – decrease by 50 basis points (50 bps) * 14.63 11.08
* Holding all other variables constant
Notes to Accounts — Contd.
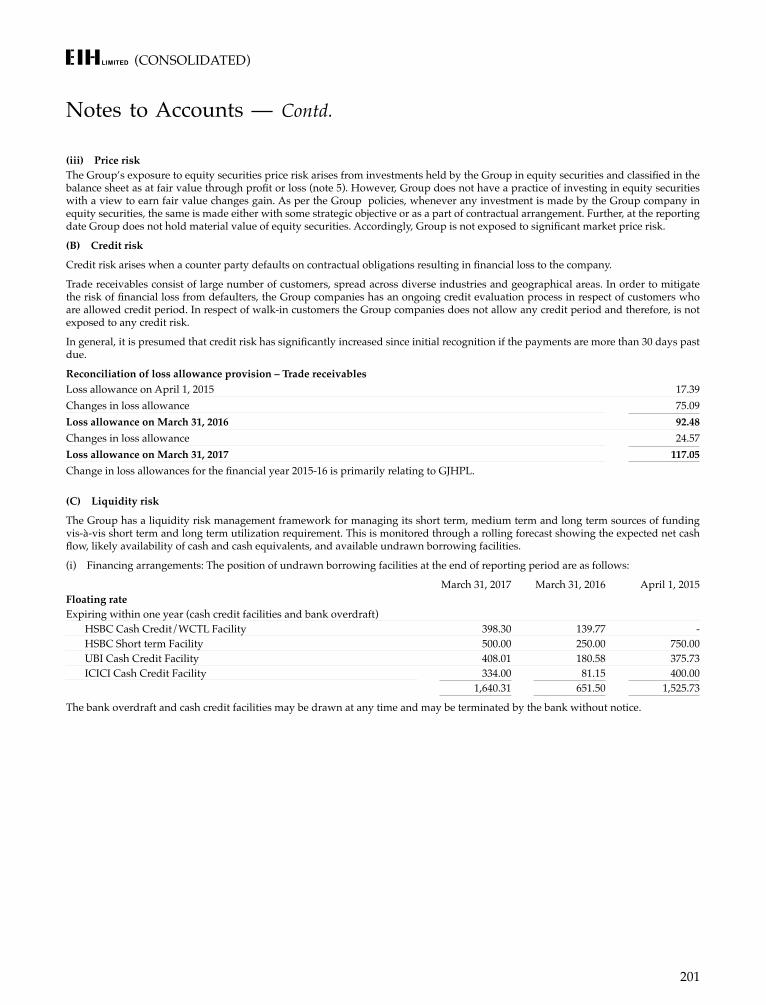
(CONSOLIDATED)
201
(iii) Price riskThe Group’s exposure to equity securities price risk arises from investments held by the Group in equity securities and classified in the balance sheet as at fair value through profit or loss (note 5). However, Group does not have a practice of investing in equity securities with a view to earn fair value changes gain. As per the Group policies, whenever any investment is made by the Group company in equity securities, the same is made either with some strategic objective or as a part of contractual arrangement. Further, at the reporting date Group does not hold material value of equity securities. Accordingly, Group is not exposed to significant market price risk.
(B) Credit risk
Credit risk arises when a counter party defaults on contractual obligations resulting in financial loss to the company.
Trade receivables consist of large number of customers, spread across diverse industries and geographical areas. In order to mitigate the risk of financial loss from defaulters, the Group companies has an ongoing credit evaluation process in respect of customers who are allowed credit period. In respect of walk-in customers the Group companies does not allow any credit period and therefore, is not exposed to any credit risk.
In general, it is presumed that credit risk has significantly increased since initial recognition if the payments are more than 30 days past due.
Reconciliation of loss allowance provision – Trade receivablesLoss allowance on April 1, 2015 17.39 Changes in loss allowance 75.09 Loss allowance on March 31, 2016 92.48 Changes in loss allowance 24.57 Loss allowance on March 31, 2017 117.05 Change in loss allowances for the financial year 2015-16 is primarily relating to GJHPL.
(C) Liquidity risk
The Group has a liquidity risk management framework for managing its short term, medium term and long term sources of funding vis-à-vis short term and long term utilization requirement. This is monitored through a rolling forecast showing the expected net cash flow, likely availability of cash and cash equivalents, and available undrawn borrowing facilities.
(i) Financing arrangements: The position of undrawn borrowing facilities at the end of reporting period are as follows:
March 31, 2017 March 31, 2016 April 1, 2015Floating rateExpiring within one year (cash credit facilities and bank overdraft)
HSBC Cash Credit/WCTL Facility 398.30 139.77 - HSBC Short term Facility 500.00 250.00 750.00 UBI Cash Credit Facility 408.01 180.58 375.73 ICICI Cash Credit Facility 334.00 81.15 400.00
1,640.31 651.50 1,525.73
The bank overdraft and cash credit facilities may be drawn at any time and may be terminated by the bank without notice.
Notes to Accounts — Contd.
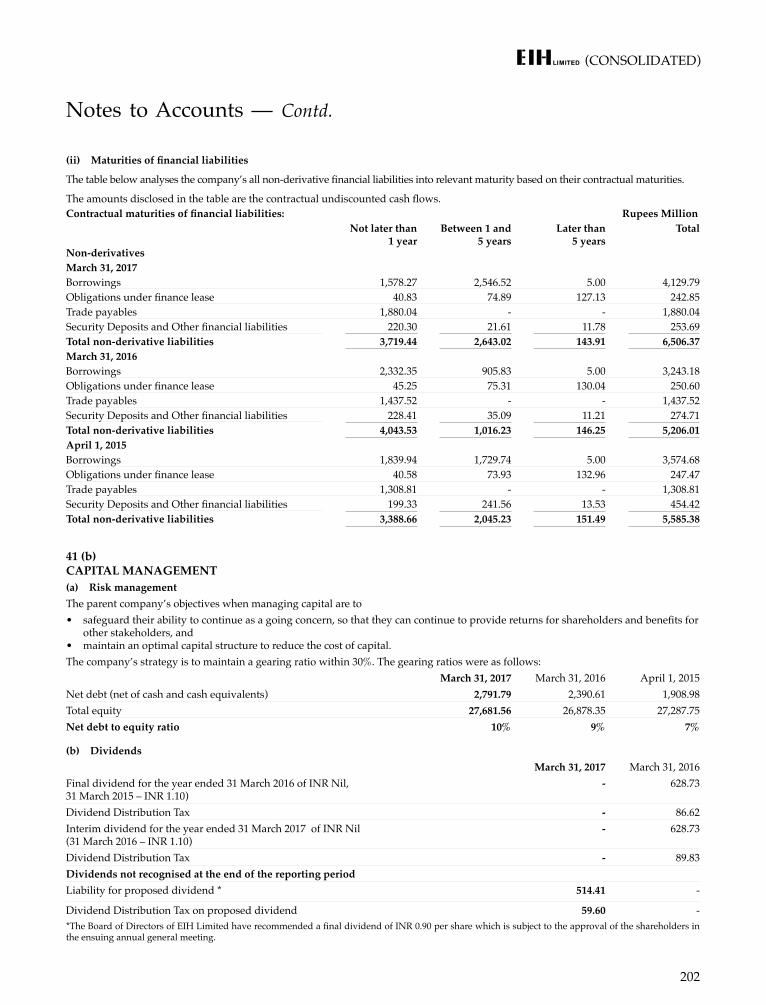
(CONSOLIDATED)
202
(ii) Maturities of financial liabilities
The table below analyses the company’s all non-derivative financial liabilities into relevant maturity based on their contractual maturities.
The amounts disclosed in the table are the contractual undiscounted cash flows.Contractual maturities of financial liabilities: Rupees Million
Not later than 1 year
Between 1 and 5 years
Later than 5 years
Total
Non-derivativesMarch 31, 2017Borrowings 1,578.27 2,546.52 5.00 4,129.79 Obligations under finance lease 40.83 74.89 127.13 242.85 Trade payables 1,880.04 - - 1,880.04 Security Deposits and Other financial liabilities 220.30 21.61 11.78 253.69 Total non-derivative liabilities 3,719.44 2,643.02 143.91 6,506.37 March 31, 2016Borrowings 2,332.35 905.83 5.00 3,243.18 Obligations under finance lease 45.25 75.31 130.04 250.60 Trade payables 1,437.52 - - 1,437.52 Security Deposits and Other financial liabilities 228.41 35.09 11.21 274.71 Total non-derivative liabilities 4,043.53 1,016.23 146.25 5,206.01 April 1, 2015Borrowings 1,839.94 1,729.74 5.00 3,574.68 Obligations under finance lease 40.58 73.93 132.96 247.47 Trade payables 1,308.81 - - 1,308.81 Security Deposits and Other financial liabilities 199.33 241.56 13.53 454.42 Total non-derivative liabilities 3,388.66 2,045.23 151.49 5,585.38
Notes to Accounts — Contd.
41 (b) CAPITAL MANAGEMENT(a) Risk managementThe parent company’s objectives when managing capital are to• safeguard their ability to continue as a going concern, so that they can continue to provide returns for shareholders and benefits for
other stakeholders, and• maintain an optimal capital structure to reduce the cost of capital.The company’s strategy is to maintain a gearing ratio within 30%. The gearing ratios were as follows:
March 31, 2017 March 31, 2016 April 1, 2015Net debt (net of cash and cash equivalents) 2,791.79 2,390.61 1,908.98 Total equity 27,681.56 26,878.35 27,287.75 Net debt to equity ratio 10% 9% 7%
(b) DividendsMarch 31, 2017 March 31, 2016
Final dividend for the year ended 31 March 2016 of INR Nil, 31 March 2015 – INR 1.10)
- 628.73
Dividend Distribution Tax - 86.62 Interim dividend for the year ended 31 March 2017 of INR Nil (31 March 2016 – INR 1.10)
- 628.73
Dividend Distribution Tax - 89.83 Dividends not recognised at the end of the reporting periodLiability for proposed dividend * 514.41 -
Dividend Distribution Tax on proposed dividend 59.60 - *The Board of Directors of EIH Limited have recommended a final dividend of INR 0.90 per share which is subject to the approval of the shareholders in the ensuing annual general meeting.
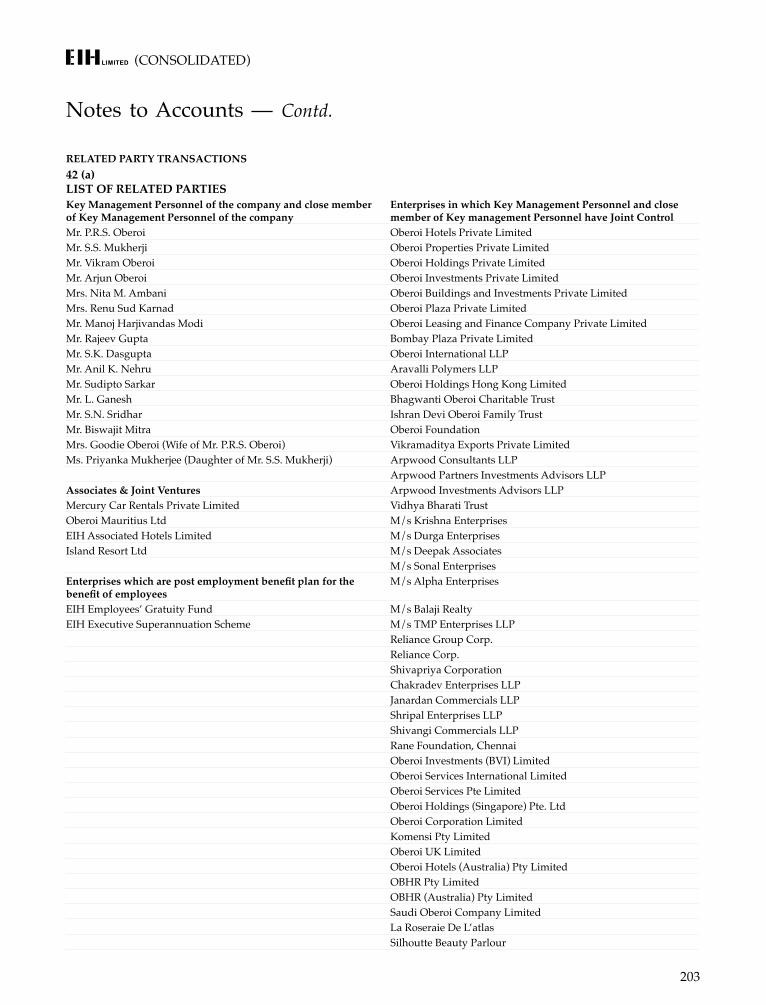
(CONSOLIDATED)
203
RELATED PARTY TRANSACTIONS42 (a) LIST OF RELATED PARTIESKey Management Personnel of the company and close member of Key Management Personnel of the company
Enterprises in which Key Management Personnel and close member of Key management Personnel have Joint Control
Mr. P.R.S. Oberoi Oberoi Hotels Private LimitedMr. S.S. Mukherji Oberoi Properties Private LimitedMr. Vikram Oberoi Oberoi Holdings Private LimitedMr. Arjun Oberoi Oberoi Investments Private LimitedMrs. Nita M. Ambani Oberoi Buildings and Investments Private LimitedMrs. Renu Sud Karnad Oberoi Plaza Private LimitedMr. Manoj Harjivandas Modi Oberoi Leasing and Finance Company Private LimitedMr. Rajeev Gupta Bombay Plaza Private LimitedMr. S.K. Dasgupta Oberoi International LLPMr. Anil K. Nehru Aravalli Polymers LLPMr. Sudipto Sarkar Oberoi Holdings Hong Kong LimitedMr. L. Ganesh Bhagwanti Oberoi Charitable TrustMr. S.N. Sridhar Ishran Devi Oberoi Family TrustMr. Biswajit Mitra Oberoi FoundationMrs. Goodie Oberoi (Wife of Mr. P.R.S. Oberoi) Vikramaditya Exports Private LimitedMs. Priyanka Mukherjee (Daughter of Mr. S.S. Mukherji) Arpwood Consultants LLP
Arpwood Partners Investments Advisors LLPAssociates & Joint Ventures Arpwood Investments Advisors LLPMercury Car Rentals Private Limited Vidhya Bharati TrustOberoi Mauritius Ltd M/s Krishna EnterprisesEIH Associated Hotels Limited M/s Durga EnterprisesIsland Resort Ltd M/s Deepak Associates
M/s Sonal EnterprisesEnterprises which are post employment benefit plan for the benefit of employees
M/s Alpha Enterprises
EIH Employees’ Gratuity Fund M/s Balaji RealtyEIH Executive Superannuation Scheme M/s TMP Enterprises LLP
Reliance Group Corp.Reliance Corp.Shivapriya CorporationChakradev Enterprises LLPJanardan Commercials LLPShripal Enterprises LLPShivangi Commercials LLPRane Foundation, ChennaiOberoi Investments (BVI) LimitedOberoi Services International LimitedOberoi Services Pte LimitedOberoi Holdings (Singapore) Pte. LtdOberoi Corporation LimitedKomensi Pty LimitedOberoi UK LimitedOberoi Hotels (Australia) Pty LimitedOBHR Pty LimitedOBHR (Australia) Pty LimitedSaudi Oberoi Company LimitedLa Roseraie De L’atlasSilhoutte Beauty Parlour
Notes to Accounts — Contd.

(CONSOLIDATED)
204
42(b) Transactions with Related Parties for the year ended March 31,2017
Rupees MillionNATURE OF TRANSACTIONS Associate &
Joint VenturesEnterprises in which
Key Management Personnel have Joint Control
Key Management Personnel/Relative of
Key Management Personnel
Enterprises which are post employment
benefit plan for the benefit of employees
2017 2016 2017 2016 2017 2016 2017 2016PURCHASESPurchase of Goods & ServicesMercury Car Rentals Private Limited 104.25 114.71 - - - - - -EIH Associated Hotels Limited 8.87 15.79 - - - - - -Island Resort Ltd 0.67 0.66 - - - - - -Oberoi Hotels Pvt Ltd - - 0.03 0.02 - - - -Oberoi International LLP - - 0.78 2.03 - - - -Total 113.79 131.16 0.81 2.05 - - - - Purchase of Fixed AssetsEIH Associated Hotels Limited - 0.29 - - - - - -Total - 0.29 - - - - - - EXPENSESRentEIH Associated Hotels Limited 1.52 1.41 - - - - - -Oberoi Hotels Pvt Ltd - - 0.36 0.36 - - - -Mrs. Goodie Oberoi ,W/o Mr. P.R.S.Oberoi - - - - 0.36 0.36 - -Total 1.52 1.41 0.36 0.36 0.36 0.36 - - RoyaltyOberoi Hotels Pvt Ltd - - 128.65 144.38 - - - -Total - - 128.65 144.38 - - - - Short-term employee benefitsMr. P.R.S. Oberoi - - - - 28.95 35.84 - -Mr. S.S. Mukherji - - - - 30.99 37.88 - -Mr. V.S. Oberoi - - - - 28.18 33.03 - -Mr. A.S. Oberoi - - - - 29.90 35.65 - -Mr. Biswajit Mitra - - - - 12.86 9.22 - -Mr. S.N. Sridhar - - - - 6.29 6.14 - -Ms. Priyanka Mukherjee, D/o Mr.S.S. Mukherji - - - - 1.48 1.37 - -Total - - - - 138.65 159.13 - - Post-employment benefitsMr. V.S. Oberoi - - - - 2.36 3.57 - -Mr. A.S. Oberoi - - - - 2.48 3.31 - -Mr. Biswajit Mitra - - - - 1.80 1.26 - -Mr. S.N. Sridhar - - - - 0.63 0.55 - -Ms. Priyanka Mukherjee, D/o Mr.S.S. Mukherji - - - - 0.16 0.10 - -Total - - - - 7.43 8.79 - - Directors’ Sitting FeesMrs. Nita M. Ambani - - - - 0.15 0.20 - -Mrs. Renu Sud Karnad - - - - 0.30 0.25 - -Mr. Manoj Harjivandas Modi - - - - 0.20 0.30 - -Mr. Rajeev Gupta - - - - 0.40 0.35 - -Mr. S.K. Dasgupta - - - - 1.20 0.95 - -Mr. Anil K. Nehru - - - - 0.75 0.60 - -Mr. Sudipto Sarkar - - - - 0.35 0.25 - -Mr. L. Ganesh - - - - 0.65 0.60 - -Total - - - - 4.00 3.50 - - Total Key management personnel compensation - - - - 150.08 171.42 - - SALESSale of Goods and ServicesMercury Car Rentals Private Limited 14.81 31.53 - - - - - -EIH Associated Hotels Limited 318.96 303.36 - - - - - -Island Resort Ltd 3.05 2.21 - - - - - -Oberoi Hotels Pvt Ltd - - 10.17 1.17 - - - -Silhouette Beauty Salon (Owned by Mrs. Prem Mehra, sister of Mr. P.R.S. Oberoi) - - - - 0.22 0.39 - -Oberoi International LLP - - 0.01 - - -Total 336.82 337.10 10.18 1.17 0.22 0.39 - -
Notes to Accounts — Contd.
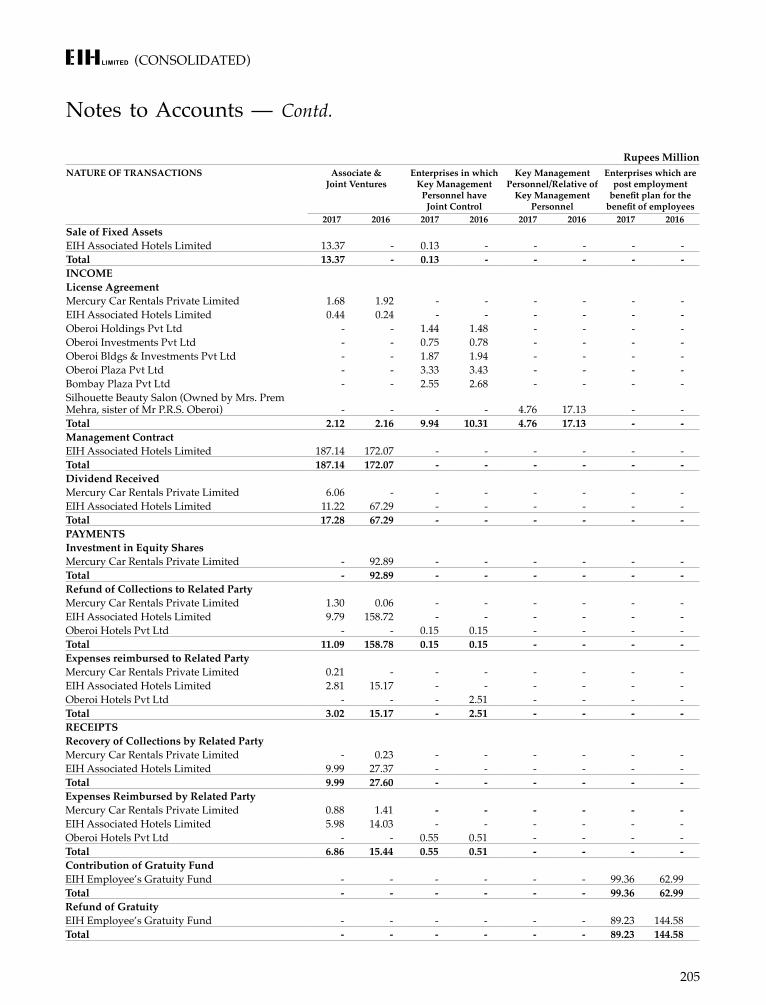
(CONSOLIDATED)
205
Sale of Fixed AssetsEIH Associated Hotels Limited 13.37 - 0.13 - - - - -Total 13.37 - 0.13 - - - - - INCOMELicense AgreementMercury Car Rentals Private Limited 1.68 1.92 - - - - - -EIH Associated Hotels Limited 0.44 0.24 - - - - - -Oberoi Holdings Pvt Ltd - - 1.44 1.48 - - - -Oberoi Investments Pvt Ltd - - 0.75 0.78 - - - -Oberoi Bldgs & Investments Pvt Ltd - - 1.87 1.94 - - - -Oberoi Plaza Pvt Ltd - - 3.33 3.43 - - - -Bombay Plaza Pvt Ltd - - 2.55 2.68 - - - -Silhouette Beauty Salon (Owned by Mrs. Prem Mehra, sister of Mr P.R.S. Oberoi) - - - - 4.76 17.13 - -Total 2.12 2.16 9.94 10.31 4.76 17.13 - - Management ContractEIH Associated Hotels Limited 187.14 172.07 - - - - - -Total 187.14 172.07 - - - - - - Dividend ReceivedMercury Car Rentals Private Limited 6.06 - - - - - - -EIH Associated Hotels Limited 11.22 67.29 - - - - - -Total 17.28 67.29 - - - - - - PAYMENTSInvestment in Equity SharesMercury Car Rentals Private Limited - 92.89 - - - - - -Total - 92.89 - - - - - - Refund of Collections to Related PartyMercury Car Rentals Private Limited 1.30 0.06 - - - - - -EIH Associated Hotels Limited 9.79 158.72 - - - - - -Oberoi Hotels Pvt Ltd - - 0.15 0.15 - - - -Total 11.09 158.78 0.15 0.15 - - - - Expenses reimbursed to Related PartyMercury Car Rentals Private Limited 0.21 - - - - - - -EIH Associated Hotels Limited 2.81 15.17 - - - - - -Oberoi Hotels Pvt Ltd - - - 2.51 - - - -Total 3.02 15.17 - 2.51 - - - - RECEIPTSRecovery of Collections by Related PartyMercury Car Rentals Private Limited - 0.23 - - - - - -EIH Associated Hotels Limited 9.99 27.37 - - - - - -Total 9.99 27.60 - - - - - - Expenses Reimbursed by Related PartyMercury Car Rentals Private Limited 0.88 1.41 - - - - - -EIH Associated Hotels Limited 5.98 14.03 - - - - - -Oberoi Hotels Pvt Ltd - - 0.55 0.51 - - - -Total 6.86 15.44 0.55 0.51 - - - - Contribution of Gratuity FundEIH Employee’s Gratuity Fund - - - - - - 99.36 62.99 Total - - - - - - 99.36 62.99 Refund of Gratuity EIH Employee’s Gratuity Fund - - - - - - 89.23 144.58 Total - - - - - - 89.23 144.58
Notes to Accounts — Contd.
Rupees MillionNATURE OF TRANSACTIONS Associate &
Joint VenturesEnterprises in which
Key Management Personnel have Joint Control
Key Management Personnel/Relative of
Key Management Personnel
Enterprises which are post employment
benefit plan for the benefit of employees
2017 2016 2017 2016 2017 2016 2017 2016
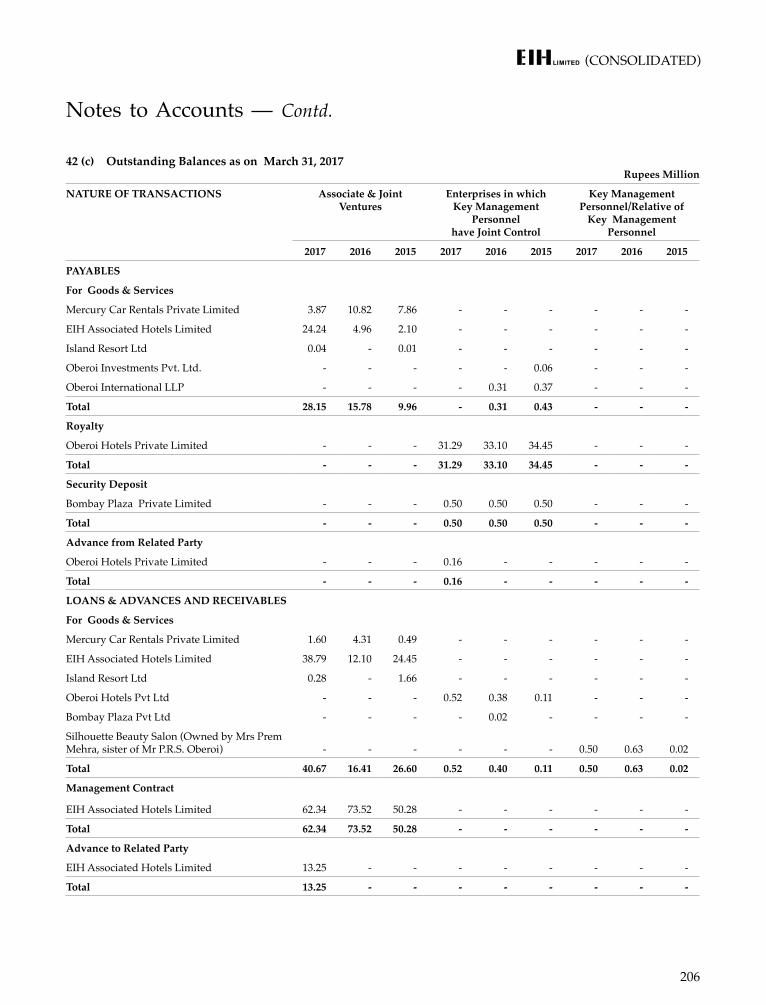
(CONSOLIDATED)
206
42 (c) Outstanding Balances as on March 31, 2017Rupees Million
NATURE OF TRANSACTIONS Associate & Joint Ventures
Enterprises in which Key Management
Personnelhave Joint Control
Key Management Personnel/Relative of
Key Management Personnel
2017 2016 2015 2017 2016 2015 2017 2016 2015
PAYABLES
For Goods & Services
Mercury Car Rentals Private Limited 3.87 10.82 7.86 - - - - - -
EIH Associated Hotels Limited 24.24 4.96 2.10 - - - - - -
Island Resort Ltd 0.04 - 0.01 - - - - - -
Oberoi Investments Pvt. Ltd. - - - - - 0.06 - - -
Oberoi International LLP - - - - 0.31 0.37 - - -
Total 28.15 15.78 9.96 - 0.31 0.43 - - -
Royalty
Oberoi Hotels Private Limited - - - 31.29 33.10 34.45 - - -
Total - - - 31.29 33.10 34.45 - - -
Security Deposit
Bombay Plaza Private Limited - - - 0.50 0.50 0.50 - - -
Total - - - 0.50 0.50 0.50 - - -
Advance from Related Party
Oberoi Hotels Private Limited - - - 0.16 - - - - -
Total - - - 0.16 - - - - -
LOANS & ADVANCES AND RECEIVABLES
For Goods & Services
Mercury Car Rentals Private Limited 1.60 4.31 0.49 - - - - - -
EIH Associated Hotels Limited 38.79 12.10 24.45 - - - - - -
Island Resort Ltd 0.28 - 1.66 - - - - - -
Oberoi Hotels Pvt Ltd - - - 0.52 0.38 0.11 - - -
Bombay Plaza Pvt Ltd - - - - 0.02 - - - -
Silhouette Beauty Salon (Owned by Mrs Prem Mehra, sister of Mr P.R.S. Oberoi) - - - - - - 0.50 0.63 0.02
Total 40.67 16.41 26.60 0.52 0.40 0.11 0.50 0.63 0.02
Management Contract
EIH Associated Hotels Limited 62.34 73.52 50.28 - - - - - -
Total 62.34 73.52 50.28 - - - - - -
Advance to Related Party
EIH Associated Hotels Limited 13.25 - - - - - - - -
Total 13.25 - - - - - - - -
Notes to Accounts — Contd.
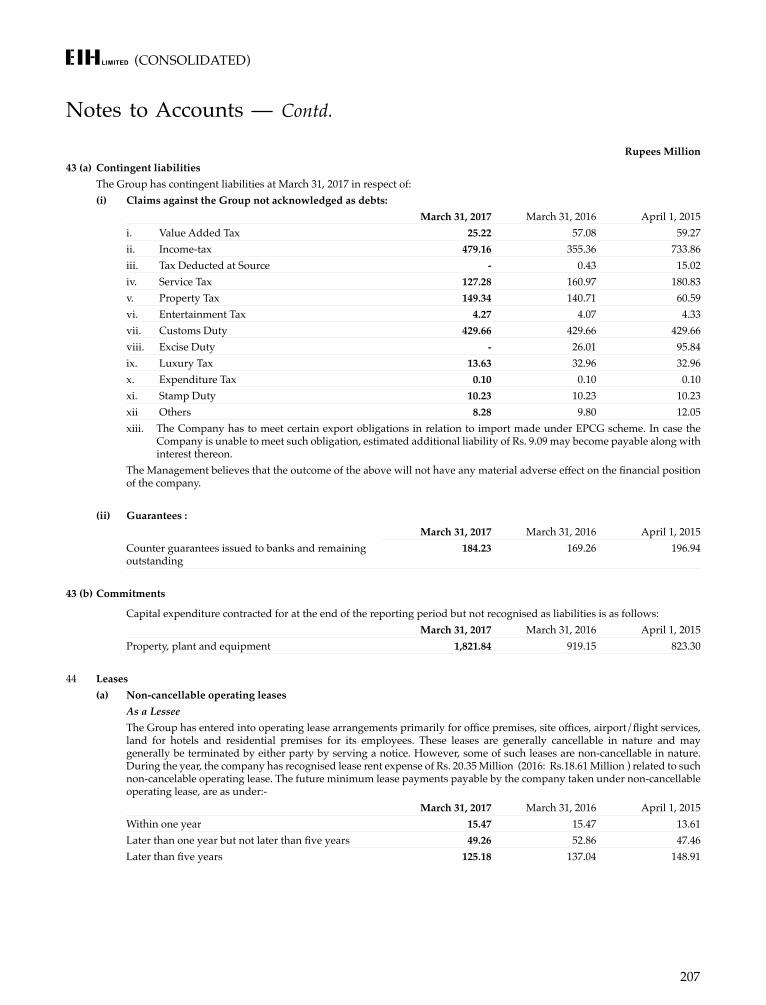
(CONSOLIDATED)
207
Rupees Million43 (a) Contingent liabilities
The Group has contingent liabilities at March 31, 2017 in respect of:(i) Claims against the Group not acknowledged as debts:
March 31, 2017 March 31, 2016 April 1, 2015i. Value Added Tax 25.22 57.08 59.27 ii. Income-tax 479.16 355.36 733.86 iii. Tax Deducted at Source - 0.43 15.02 iv. Service Tax 127.28 160.97 180.83 v. Property Tax 149.34 140.71 60.59 vi. Entertainment Tax 4.27 4.07 4.33 vii. Customs Duty 429.66 429.66 429.66 viii. Excise Duty - 26.01 95.84 ix. Luxury Tax 13.63 32.96 32.96 x. Expenditure Tax 0.10 0.10 0.10 xi. Stamp Duty 10.23 10.23 10.23 xii Others 8.28 9.80 12.05 xiii. The Company has to meet certain export obligations in relation to import made under EPCG scheme. In case the
Company is unable to meet such obligation, estimated additional liability of Rs. 9.09 may become payable along with interest thereon.
The Management believes that the outcome of the above will not have any material adverse effect on the financial position of the company.
(ii) Guarantees :March 31, 2017 March 31, 2016 April 1, 2015
Counter guarantees issued to banks and remaining outstanding
184.23 169.26 196.94
43 (b) Commitments
Capital expenditure contracted for at the end of the reporting period but not recognised as liabilities is as follows:March 31, 2017 March 31, 2016 April 1, 2015
Property, plant and equipment 1,821.84 919.15 823.30
44 Leases(a) Non-cancellable operating leases
As a LesseeThe Group has entered into operating lease arrangements primarily for office premises, site offices, airport/flight services, land for hotels and residential premises for its employees. These leases are generally cancellable in nature and may generally be terminated by either party by serving a notice. However, some of such leases are non-cancellable in nature. During the year, the company has recognised lease rent expense of Rs. 20.35 Million (2016: Rs.18.61 Million ) related to such non-cancelable operating lease. The future minimum lease payments payable by the company taken under non-cancellable operating lease, are as under:-
March 31, 2017 March 31, 2016 April 1, 2015Within one year 15.47 15.47 13.61 Later than one year but not later than five years 49.26 52.86 47.46 Later than five years 125.18 137.04 148.91
Notes to Accounts — Contd.
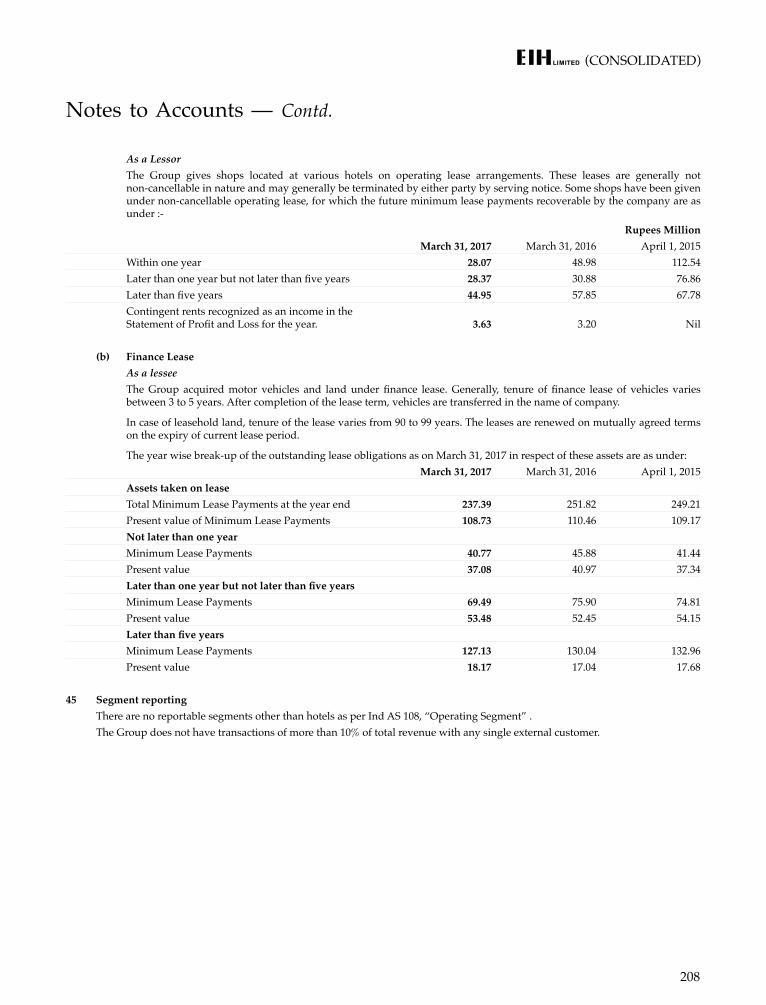
(CONSOLIDATED)
208
As a LessorThe Group gives shops located at various hotels on operating lease arrangements. These leases are generally not non-cancellable in nature and may generally be terminated by either party by serving notice. Some shops have been given under non-cancellable operating lease, for which the future minimum lease payments recoverable by the company are as under :-
Rupees MillionMarch 31, 2017 March 31, 2016 April 1, 2015
Within one year 28.07 48.98 112.54 Later than one year but not later than five years 28.37 30.88 76.86 Later than five years 44.95 57.85 67.78 Contingent rents recognized as an income in the Statement of Profit and Loss for the year. 3.63 3.20 Nil
(b) Finance LeaseAs a lesseeThe Group acquired motor vehicles and land under finance lease. Generally, tenure of finance lease of vehicles varies between 3 to 5 years. After completion of the lease term, vehicles are transferred in the name of company.
In case of leasehold land, tenure of the lease varies from 90 to 99 years. The leases are renewed on mutually agreed terms on the expiry of current lease period.
The year wise break-up of the outstanding lease obligations as on March 31, 2017 in respect of these assets are as under: March 31, 2017 March 31, 2016 April 1, 2015
Assets taken on lease Total Minimum Lease Payments at the year end 237.39 251.82 249.21 Present value of Minimum Lease Payments 108.73 110.46 109.17 Not later than one year Minimum Lease Payments 40.77 45.88 41.44 Present value 37.08 40.97 37.34 Later than one year but not later than five years Minimum Lease Payments 69.49 75.90 74.81 Present value 53.48 52.45 54.15 Later than five yearsMinimum Lease Payments 127.13 130.04 132.96 Present value 18.17 17.04 17.68
45 Segment reporting There are no reportable segments other than hotels as per Ind AS 108, “Operating Segment” .The Group does not have transactions of more than 10% of total revenue with any single external customer.
Notes to Accounts — Contd.
(CONSOLIDATED)
209
Year ended March 31, 2017
Rupees
Year ended March 31, 2016
Rupees
46 Earnings per share
(a) Basic earnings per share 1.86 2.29
(b) Diluted earnings per share 1.86 2.29
(c) Reconciliations of earnings used in calculating earnings per share
As at March 31, 2017
Rupees Million
As at March 31, 2016
Rupees Million
Profit attributable to the equity holders of the company used in calculating basic earnings per share: 1,060.72 1,310.67
Profit attributable to the equity holders of the company used in calculating diluted earnings per share 1,060.72 1,310.67
(d) Weighted average number of shares used as the denominator
As at March 31, 2017
Number of shares
As at March 31, 2016
Number of shares
Weighted average number of equity shares used as the denominator in calculating basic earnings per share 571,569,414 571,569,414
Adjustments for calculation of diluted earnings per share - -
Weighted average number of equity shares and potential equity shares used as the denominator in calculating diluted earnings per share 571,569,414 571,569,414
47 The parent company’s investment in the equity shares of one of its subsidiaries EIH Flight Services Ltd, Mauritius is long term in nature. During the last year the Company made a further contribution of INR 636.99 Million against which equity shares were issued in the current year. Considering the above and also considering the value as a going concern, assessed by an independent valuer, no adjustment is necessary to impair any part of the carrying cost.
Notes to Accounts — Contd.
48 First-time adoption of Ind AS
Transition to Ind ASThese are the group’s first consolidated financial statements prepared in accordance with Ind AS.
The accounting policies set out in note 1 have been applied in preparing the financial statements for the year ended 31 March 2017, the comparative information presented in these financial statements for the year ended March 31, 2016 and in the preparation of an opening Ind AS balance sheet at 1 April 2015 (the Group’s date of transition). In preparing its opening Ind AS balance sheet, the group has adjusted the amounts reported previously in financial statements prepared in accordance with the accounting standards notified under Companies (Accounting Standards) Rules, 2006 (as amended) and other relevant provisions of the Act (previous GAAP or Indian GAAP).
Set out below are the applicable Ind AS 101 optional exemptions and mandatory exceptions applied in the transition from previous GAAP to Ind AS.
A.1 Ind AS optional exemptions (a) Deemed cost of property, plant & equipment and intangible assets
Ind AS 101 permits a first-time adopter to elect to continue with the carrying value for all of its property, plant and equipment as recognised in the financial statements as at the date of transition to Ind AS, measured as per the previous GAAP and use that as its deemed cost as at the date of transition. This exemption is also used for intangible assets covered by Ind AS 38, Intangible Assets. Accordingly, the Group has elected to measure all of its property, plant and equipment and intangible assets at their previous GAAP carrying value, which has been considered as deemed cost.
(CONSOLIDATED)
210
Notes to Accounts — Contd.
(b) Business Combinations
Ind AS 101 provides the option to apply Ind AS 103 prospectively from the transition date or from a specific date prior to the transition date. This provides relief from full retrospective application of Ind AS 103, which would require restatement of all business combinations occurred prior to the transition date. If the entity restates any business combinations that occurred before the date of transition, then it restates all later business combinations and also applies the Ind AS 110, Consolidated Financial Statements from the same date.The Group has decided to apply this exemption at the transition date. Accordingly, business combination occurred prior to the transition date has not been restated by the Group.
(c) Cumulative Translation DifferenceInd AS 101 permits cumulative translation gains and losses to be reset to zero at the transition date. This provides relief from de-termining cumulative currency translation differences in accordance with Ind AS 21 from the date a subsidiary or equity method investee was formed or acquired.
The Group has elected to reset all cumulative translation gains and losses to zero by transferring it to retained earnings at its transition date, i.e., April 1, 2015.
(d) Classification and measurement of lease LandIn accordance with Ind AS 101, when a lease includes both land and building elements, a first time adopter may assess the classification of each element as finance or an operating lease at the date of transition to Ind AS on the basis of the facts and circumstances existing as at the date of transition. Accordingly, applying the same exemption, the Group has classified its land leases into finance lease and operating lease on the basis of the facts and circumstances existing as at the date of transition.
A.2 Ind AS mandatory exceptions
(a) EstimatesEstimates made under Ind AS as at April 1, 2015 are consistent with the estimates as under previous GAAP.
(b) Non-controlling interest Ind AS 110 requires that an entity shall attribute the profit or loss and each component of other comprehensive income to the owners of the parent and to the non-controlling interests even if this results in the non-controlling interests having a deficit (negative) balance. However, Ind AS 101 requires that such requirement should be applied prospectively from the date of transition to Ind ASs. Accordingly, the group has applied above mentioned requirements of Ind AS 110 prospectively from the date of transition.
(c) Changes in the proportion held by non-controlling interestsInd AS 110 requires that when the proportion of the equity held by non-controlling interests changes, an entity shall adjust the carrying amounts of the controlling and non-controlling interests to reflect the changes in their relative interests in the subsidiary and any difference between the amount by which the non-controlling interests are adjusted and the fair value of the consideration paid or received should be recognised directly in equity. However, Ind AS 101 requires that such requirement should be applied prospectively from the date of transition to Ind ASs.
Accordingly, the group has applied above mentioned requirements of Ind AS 110 prospectively from the date of transition.
(d) Loss of control of subsidiaryUnder Ind AS 110, if a parent loses control of a subsidiary, it should derecognise the assets (including any goodwill) and liabilities of the subsidiary at their carrying amounts and carrying amount of any non-controlling interests in the former subsidiary at the date when control is lost (including any components of other comprehensive income attributable to them) and should recognise the fair value of the consideration received, if any, and any investment retained in the former subsidiary at its fair value at the date when control is lost. Further any resulting difference should be recognised as gain or loss in profit or loss attributable to the parent. However, Ind AS 101 requires that such requirement should be applied prospectively from the date of transition to Ind ASs.
Accordingly, the group has applied above mentioned requirements of Ind AS 110 prospectively from the date of transition.
(e) Classification and measurement of financial assetsInd AS 101 requires that an entity should assess the classification of its financial assets on the basis of facts and circumstances exist on the date of transition. Accordingly, in its Opening Ind AS Balance Sheet, the group has classified all the financial assets on basis of facts and circumstances existed on the date of transition, i.e., April 1, 2015.
(CONSOLIDATED)
211
49 Reconciliations between previous GAAP and Ind ASInd AS 101 requires an entity to reconcile equity, total comprehensive income and cash flows for prior periods. The following tables represent the reconciliations from previous GAAP to Ind AS.a) Reconciliation of total equity as at March 31, 2016 and April 1, 2015
Rupees MillionNotes As at
March 31, 2016As at
April 1, 2015Total equity (shareholder’s funds) as per previous GAAP 27,323.21 26,876.90 AdjustmentsDeferred revenue on Customer Loyalty Programme i 89.25 92.25 Fair valuation of equity investments ii 28.59 22.43 Fair valuation of security deposits iii (67.06) (62.35)Reclassification of leases iv (35.28) (43.71)Proposed Dividend v 62.32 777.66 Tax effects of adjustments vi (37.55) (33.33)Other GAAP adjustments vii 723.95 429.81 Total adjustments 764.22 1,182.76 Total equity as per Ind AS 28,087.43 28,059.66
b) Reconciliation of total comprehensive income for the year ended March 31, 2016Notes Year ended
March 31, 2016Profit after tax as per previous GAAP 1,353.85 AdjustmentsDeferred revenue on Customer Loyalty Programme i (3.00)Fair valuation of equity investments ii 6.16 Fair valuation of security deposits iii (4.71)Reclassification of leases iv 8.48 Tax effects of adjustments vi (4.23)Other GAAP adjustments vii 4.10 Remeasurnment of Post-employment benefit obligations (Net of Tax) viii 69.33 Total adjustments 76.13 Profit after tax as per Ind AS 1,429.98 Other comprehensive income (Net of Tax) viiiRemeasurements of post-employment benefit obligation (69.33)Exchange difference on translation of foreign operations 225.64 Total other comprehensive income 156.31 Total comprehensive income as per Ind AS 1,586.29
c) Impact of Ind AS adoption on cash flow statementfor the year ended March 31, 2016 Rupees Million
Previous GAAP Adjustments Ind AS Net cash flow from operating activities 2,830.26 517.58 2,312.68 Net cash flow from investing activities (1,390.63) (810.40) (580.23)Net cash flow from financing activities (1,576.24) 358.04 (1,934.28)Net increase/(decrease) in cash and cash equivalents (136.61) 65.22 (201.83)Cash and cash equivalents as at April 1, 2015 1,368.51 188.86 1,179.65 Cash and cash equivalents as at March 31, 2016 1,231.90 254.08 977.82
Notes to Accounts — Contd.
(CONSOLIDATED)
212
i. Deferred revenue on Customer Loyalty ProgrammeThe group operates multiple customer reward points program under its hotel business. The programme allows customers to accumulate points/complimentary room nights on hotel bookings. The points can be redeemed by the customers on future bookings and other services such as dinning, SPA, etc. Under the previous GAAP, the group was creating provision towards its liability under the programmes on full value without considering the estimated lapses.Under Ind AS, sales consideration received has been allocated between the hospitality services and the reward points/complimentary room nights issued. The consideration allocated to the customer reward points/complimentary room nights has been deferred and will be recognised as revenue when the reward points/complimentary room nights are redeemed or lapsed. The consideration to be allocated to the customer reward points/complimentary room nights has been determined considering the past estimated lapses on the basis of past trend. Accordingly, the group has recognised deferred revenue with corresponding adjustment to retained earnings. The provision created under previous GAAP has been reversed with a credit to retained earnings.
ii. Fair valuation of equity investmentsThe group holds investment in Equity Shares of entities other than subsidiaries, associate and joint venture. Under previous GAAP such investments were measured at cost less provision for other than temporary diminution in the value of investment. Under Ind AS, these investments has been measured at fair value. The group has categorised these investments as fair value through profit & loss (FVTPL) and any changes in fair value of those investment has been recognised in the statement of profit and loss.
iii. Fair valuation of security depositUnder the previous GAAP, interest free lease security deposits assets (that are refundable in cash on completion of the contract term) are recorded at their transaction value. Under Ind AS, all financial assets are required to be recognised at fair value at initial recognition and subsequently at amortised cost. Accordingly, the group has fair valued these security deposits under Ind AS. Difference between the fair value and transaction value of the security deposit has been recognised as prepaid rent and recognised over the period of the security deposit.Under the previous GAAP, interest free lease security deposits liability (that are refundable in cash on completion of the contract term) are recorded at their transaction value. Under Ind AS, these financial liabilities are required to be recognised at fair value at initial recognition and subsequently at amortised cost. Accordingly, the group has fair valued these security deposits under Ind AS. Difference between the fair value and transaction value of the security deposit has been recognised as advance rent and recognised over the period of the security deposit.
iv. Reclassification of leasesUnder Previous GAAP the group has capitalised the leasehold land with the initial cost incurred to enter into the lease agreement along with the upfront payment of lease rent. Annual lease rent payment were charged to the profit or loss on annual basis.Under Ind AS, land lease has been classified into finance and operating leases depending on the terms of lease. In cases where land leases has been classified as finance lease on the basis of factors such as renewal right with the group, etc., finance lease obligations has been recognised for the future lease rent payable over the primary period of lease with corresponding impact to the retained earnings as these lands were already revalued at there fair value under previous GAAP.
In cases where land leases has been classified as operating leases, carrying value of the respective leasehold land has been reclassified to prepaid rent from property, plant and equipment.
v. Proposed dividendUnder the previous GAAP, dividends proposed by the board of directors after the balance sheet date but before the approval of the financial statements were considered as adjusting events. Accordingly, provision for proposed dividend was recognised as a liability. Under Ind AS, such dividends are recognised when the same is approved by the shareholders in the general meeting. Accordingly, the liability for proposed dividend included under provisions has been reversed with corresponding adjustment to retained earnings.
vi. Tax effects of adjustmentsAdditional deferred tax asset/(liability) has been recognised corresponding to the adjustments to retained earnings/profit or loss as a result of Ind AS Implementation. Also the group has created deferred tax liability on the undistributed profits of the subsidiaries, associate and joint ventures to the extent it is not able to control the timing of the reversal of temporary difference and it is expected that the temporary difference will reverse in near future.
vii. Other GAAP adjustmentsOther GAAP adjustments include adjustments pertaining to goodwill, foreign currency monetary translation reserve account, non controlling interest, change from proportionate consolidation method to equity method, etc.
viii. Remeasurements of post-employment benefit obligationUnder Ind AS, all items of income and expense recognised in a period should be included in profit or loss for the period, unless a standard requires or permits otherwise. Items of income and expense that are not recognised in profit or loss but are shown in the statement of profit and loss as ‘other comprehensive income’ includes remeasurements of defined benefit plans. The concept of other comprehensive income did not exist under previous GAAP. Accordingly, loss on remeasurements of post-employment benefit obligation has been reclassified to the Other Comprehensive Income for the period along with share in other comprehensive income of associate and joint ventures.
Further, as required by Ind AS, exchange difference arising on translation of foreign operation has been also recognised in other comprehensive income.
Notes to Accounts — Contd.
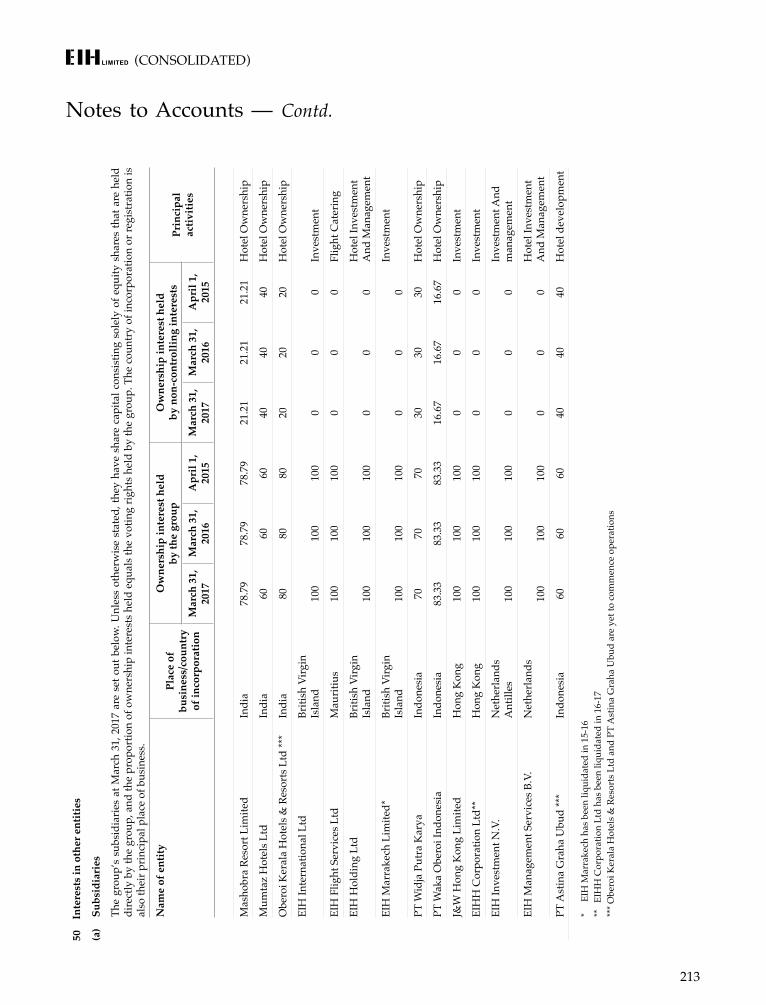
(CONSOLIDATED)
213
50
Inte
rest
s in
oth
er e
ntiti
es
(a)
Subs
idia
ries
The
grou
p’s
subs
idia
ries
at M
arch
31,
201
7 ar
e se
t out
bel
ow. U
nles
s ot
herw
ise
stat
ed, t
hey
have
sha
re c
apita
l con
sist
ing
sole
ly o
f equ
ity s
hare
s th
at a
re h
eld
dire
ctly
by
the
grou
p, a
nd th
e pr
opor
tion
of o
wne
rshi
p in
tere
sts h
eld
equa
ls th
e vo
ting
right
s hel
d by
the
grou
p. T
he c
ount
ry o
f inc
orpo
ratio
n or
regi
stra
tion
is
also
thei
r prin
cipa
l pla
ce o
f bus
ines
s.
Nam
e of
ent
ityPl
ace
of
busi
ness
/cou
ntry
of
inco
rpor
atio
n
Ow
ners
hip
inte
rest
hel
d
by th
e gr
oup
Ow
ners
hip
inte
rest
hel
d
by n
on-c
ontr
ollin
g in
tere
sts
Prin
cipa
l ac
tiviti
esM
arch
31,
20
17M
arch
31,
20
16A
pril
1,
2015
Mar
ch 3
1,
2017
Mar
ch 3
1,
2016
Apr
il 1,
20
15
Mas
hobr
a Re
sort
Lim
ited
Indi
a78
.79
78.7
978
.79
21.2
121
.21
21.2
1H
otel
Ow
ners
hip
Mum
taz
Hot
els L
tdIn
dia
6060
6040
4040
Hot
el O
wne
rshi
p
Obe
roi K
eral
a H
otel
s & R
esor
ts L
td **
*In
dia
8080
8020
2020
Hot
el O
wne
rshi
p
EIH
Inte
rnat
iona
l Ltd
Briti
sh V
irgin
Is
land
100
100
100
00
0In
vest
men
t
EIH
Flig
ht S
ervi
ces L
tdM
aurit
ius
100
100
100
00
0Fl
ight
Cat
erin
g
EIH
Hol
ding
Ltd
Briti
sh V
irgin
Is
land
100
100
100
00
0H
otel
Inve
stm
ent
And
Man
agem
ent
EIH
Mar
rake
ch L
imite
d*
Briti
sh V
irgin
Is
land
100
100
100
00
0In
vest
men
t
PT W
idja
Put
ra K
arya
Indo
nesi
a70
7070
3030
30H
otel
Ow
ners
hip
PT W
aka
Obe
roi I
ndon
esia
In
done
sia
83.3
383
.33
83.3
316
.67
16.6
716
.67
Hot
el O
wne
rshi
p
J&W
Hon
g K
ong
Lim
ited
Hon
g K
ong
100
100
100
00
0In
vest
men
t
EIH
H C
orpo
ratio
n Lt
d**
Hon
g K
ong
100
100
100
00
0In
vest
men
t
EIH
Inve
stm
ent N
.V.
Net
herla
nds
Ant
illes
100
100
100
00
0In
vest
men
t And
m
anag
emen
t
EIH
Man
agem
ent S
ervi
ces B
.V.
Net
herla
nds
100
100
100
00
0H
otel
Inve
stm
ent
And
Man
agem
ent
PT A
stin
a G
raha
Ubu
d **
*In
done
sia
6060
6040
4040
Hot
el d
evel
opm
ent
*
EIH
Mar
rake
ch h
as b
een
liqui
date
d in
15-
16**
EI
HH
Cor
pora
tion
Ltd
has b
een
liqui
date
d in
16-
17**
* Obe
roi K
eral
a H
otel
s & R
esor
ts L
td a
nd P
T A
stin
a G
raha
Ubu
d ar
e ye
t to
com
men
ce o
pera
tions
Notes to Accounts — Contd.
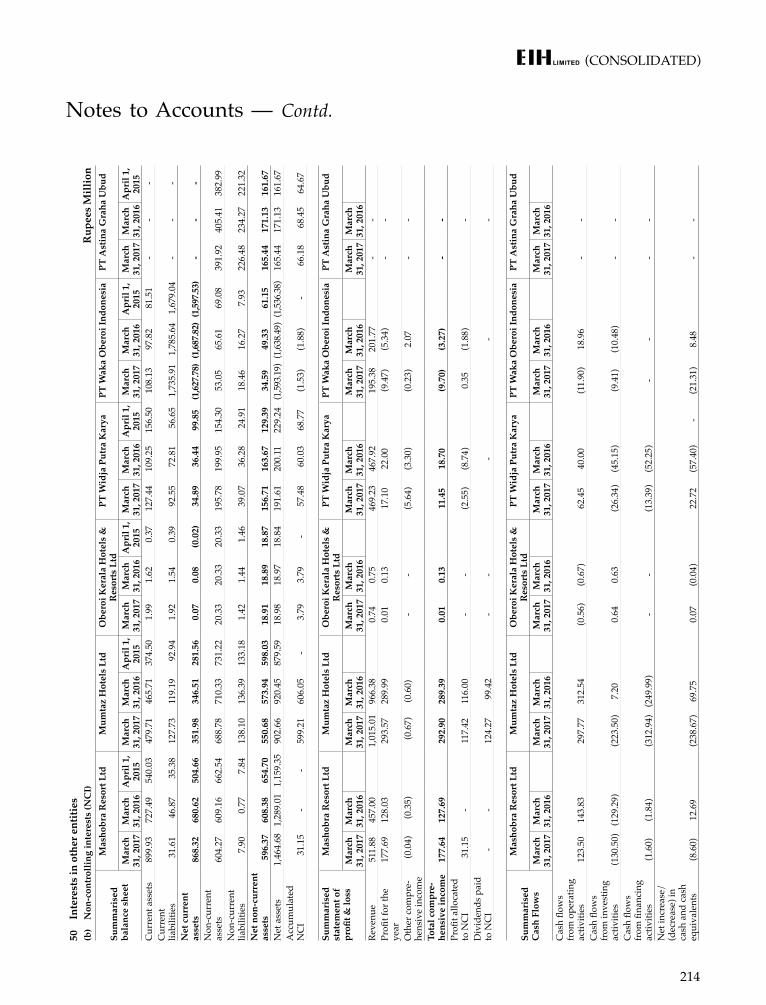
(CONSOLIDATED)
214
50
Inte
rest
s in
oth
er e
ntiti
es(b
) N
on-c
ontr
ollin
g in
tere
sts
(NC
I)
R
upee
s M
illio
n
Sum
mar
ised
ba
lanc
e sh
eet
Mas
hobr
a R
esor
t Ltd
Mum
taz
Hot
els
Ltd
Obe
roi K
eral
a H
otel
s &
R
esor
ts L
tdPT
Wid
ja P
utra
Kar
yaPT
Wak
a O
bero
i Ind
ones
iaPT
Ast
ina
Gra
ha U
bud
Mar
ch
31, 2
017
Mar
ch
31, 2
016
Apr
il 1,
20
15M
arch
31
, 201
7M
arch
31
, 201
6A
pril
1,
2015
Mar
ch
31, 2
017
Mar
ch
31, 2
016
Apr
il 1,
20
15M
arch
31
, 201
7M
arch
31
, 201
6A
pril
1,
2015
Mar
ch
31, 2
017
Mar
ch
31, 2
016
Apr
il 1,
20
15M
arch
31
, 201
7M
arch
31
, 201
6A
pril
1,
2015
Cur
rent
ass
ets
899
.93
727
.49
540
.03
479
.71
465
.71
374
.50
1.
99
1.6
2
0.37
1
27.4
4 1
09.2
5 1
56.5
0 1
08.1
3 9
7.82
8
1.51
-
- -
Cur
rent
lia
bilit
ies
31
.61
46
.87
35
.38
127
.73
119
.19
92
.94
1.
92
1.5
4
0.39
92.5
5
72.8
1
56.6
5 1
,735
.91
1,7
85.6
4 1
,679
.04
- -
- N
et c
urre
nt
asse
ts 8
68.3
2 6
80.6
2 5
04.6
6 3
51.9
8 3
46.5
1 2
81.5
6
0.07
0
.08
(0.0
2)
34.8
9
36.4
4 9
9.85
(1
,627
.78)
(1,6
87.8
2)(1
,597
.53)
- -
- N
on-c
urre
nt
asse
ts 6
04.2
7 6
09.1
6 6
62.5
4 6
88.7
8 7
10.3
3 7
31.2
2 2
0.33
2
0.33
2
0.33
1
95.7
8 1
99.9
5 1
54.3
0 5
3.05
6
5.61
6
9.08
3
91.9
2 4
05.4
1 3
82.9
9 N
on-c
urre
nt
liabi
litie
s
7.9
0
0.77
7.84
1
38.1
0 1
36.3
9 1
33.1
8
1.42
1
.44
1.
46
39
.07
36
.28
24
.91
18.
46
16.
27
7.9
3 2
26.4
8 2
34.2
7 2
21.3
2 N
et n
on-c
urre
nt
asse
ts
596.
37
608
.38
654
.70
550
.68
573
.94
598
.03
18.
91
18.
89
18.
87
156
.71
163
.67
129
.39
34.
59
49.
33
61.
15
165
.44
171
.13
161
.67
Net
ass
ets
1,4
64.6
8 1
,289
.01
1,1
59.3
5 9
02.6
6 9
20.4
5 8
79.5
9 1
8.98
1
8.97
1
8.84
1
91.6
1 2
00.1
1 2
29.2
4 (1
,593.1
9)(1
,638.4
9)(1
,536.3
8) 1
65.4
4 1
71.1
3 1
61.6
7 A
ccum
ulat
ed
NC
I
31.
15
- -
599
.21
606
.05
-
3.79
3
.79
-
57.4
8
60.0
3 6
8.77
(1
.53)
(1.8
8) -
66
.18
68
.45
64.
67
Sum
mar
ised
st
atem
ent o
f pr
ofit &
loss
Mas
hobr
a R
esor
t Ltd
Mum
taz
Hot
els
Ltd
Obe
roi K
eral
a H
otel
s &
R
esor
ts L
tdPT
Wid
ja P
utra
Kar
yaPT
Wak
a O
bero
i Ind
ones
iaPT
Ast
ina
Gra
ha U
bud
Mar
ch
31, 2
017
Mar
ch
31, 2
016
Mar
ch
31, 2
017
Mar
ch
31, 2
016
Mar
ch
31, 2
017
Mar
ch
31, 2
016
Mar
ch
31, 2
017
Mar
ch
31, 2
016
Mar
ch
31, 2
017
Mar
ch
31, 2
016
Mar
ch
31, 2
017
Mar
ch
31, 2
016
Reve
nue
511
.88
457
.00
1,0
15.0
1 9
66.3
8 0
.74
0.7
5 4
69.2
3 4
67.9
2 1
95.3
8 2
01.7
7 -
- Pr
ofit f
or th
e ye
ar 1
77.6
9 1
28.0
3 2
93.5
7 2
89.9
9 0
.01
0.1
3 1
7.10
2
2.00
(9
.47)
(5.3
4) -
-
Oth
er co
mpr
e-he
nsiv
e in
com
e
(0.0
4)
(0.3
5)
(0.6
7) (0
.60)
- -
(5.6
4) (3
.30)
(0.2
3) 2
.07
- -
Tota
l com
pre-
hens
ive
inco
me
177
.64
127
.69
292
.90
289
.39
0.0
1 0
.13
11.
45
18.
70
(9.7
0) (3
.27)
- -
Profi
t allo
cate
d to
NC
I
31.1
5 -
117
.42
116
.00
- -
(2.5
5) (8
.74)
0.3
5 (1
.88)
- D
ivid
ends
pai
d to
NC
I -
- 1
24.2
7
99.4
2 -
- -
- -
Sum
mar
ised
C
ash
Flow
s
Mas
hobr
a R
esor
t Ltd
Mum
taz
Hot
els
Ltd
Obe
roi K
eral
a H
otel
s &
R
esor
ts L
tdPT
Wid
ja P
utra
Kar
yaPT
Wak
a O
bero
i Ind
ones
iaPT
Ast
ina
Gra
ha U
bud
Mar
ch
31, 2
017
Mar
ch
31, 2
016
Mar
ch
31, 2
017
Mar
ch
31, 2
016
Mar
ch
31, 2
017
Mar
ch
31, 2
016
Mar
ch
31, 2
017
Mar
ch
31, 2
016
Mar
ch
31, 2
017
Mar
ch
31, 2
016
Mar
ch
31, 2
017
Mar
ch
31, 2
016
Cas
h flo
ws
from
ope
ratin
g ac
tiviti
es 1
23.5
0 1
43.8
3 2
97.7
7 3
12.5
4 (0
.56)
(0.6
7) 6
2.45
4
0.00
(1
1.90
) 1
8.96
-
- C
ash
flow
s fr
om in
vest
ing
activ
ities
(130
.50)
(129
.29)
(223
.50)
7.2
0 0
.64
0.6
3 (2
6.34
) (4
5.15
) (9
.41)
(10.
48)
- -
Cas
h flo
ws
from
fina
ncin
g ac
tiviti
es (1
.60)
(1.8
4) (3
12.9
4) (2
49.9
9) -
- (1
3.39
) (5
2.25
) -
- -
- N
et in
crea
se/
(dec
reas
e) in
ca
sh a
nd ca
sh
equi
vale
nts
(8.6
0) 1
2.69
(2
38.6
7) 6
9.75
0
.07
(0.0
4) 2
2.72
(5
7.40
) -
(21.
31)
8.4
8 -
-
Notes to Accounts — Contd.
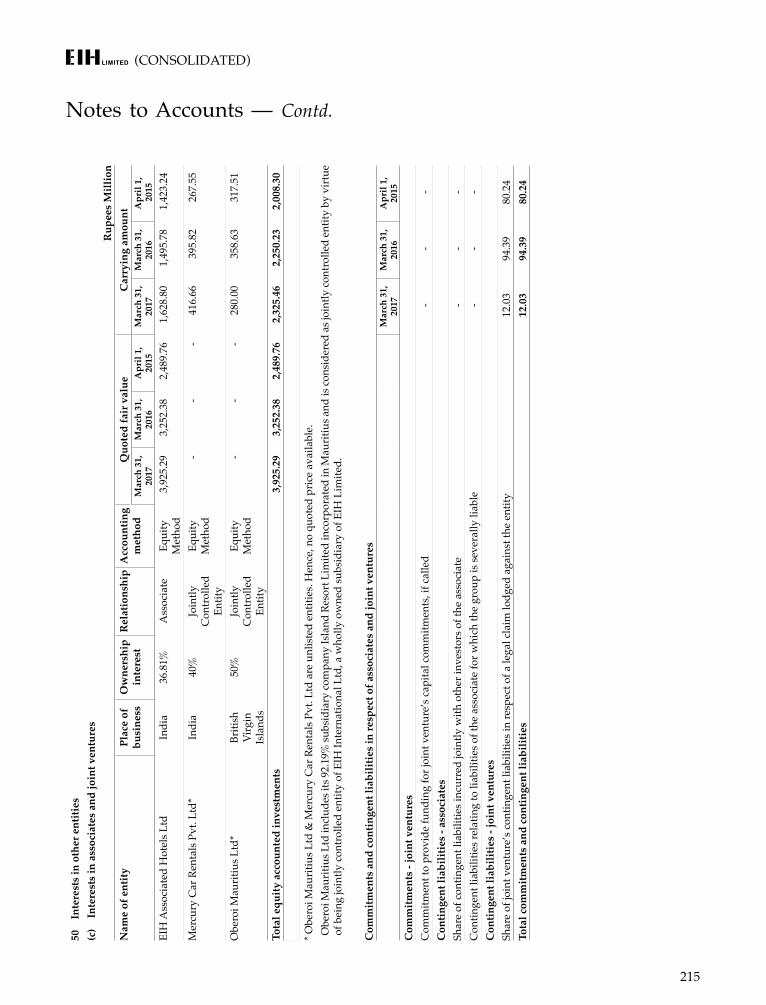
(CONSOLIDATED)
215
50
Inte
rest
s in
oth
er e
ntiti
es(c
) In
tere
sts
in a
ssoc
iate
s an
d jo
int v
entu
res
Rup
ees
Mill
ion
Nam
e of
ent
ity
Plac
e of
bu
sine
ssO
wne
rshi
p in
tere
stR
elat
ions
hip
Acc
ount
ing
met
hod
Quo
ted
fair
val
ue
Car
ryin
g am
ount
Mar
ch 3
1,
2017
Mar
ch 3
1,
2016
Apr
il 1,
20
15M
arch
31,
20
17M
arch
31,
20
16A
pril
1,
201
5EI
H A
ssoc
iate
d H
otel
s Ltd
Indi
a36
.81%
Ass
ocia
teEq
uity
M
etho
d 3
,925
.29
3,2
52.3
8 2
,489
.76
1,6
28.8
0 1
,495
.78
1,4
23.2
4
Mer
cury
Car
Ren
tals
Pvt
. Ltd
*In
dia
40%
Join
tly
Con
trol
led
Entit
y
Equi
ty
Met
hod
- -
- 4
16.6
6 3
95.8
2 2
67.5
5
Obe
roi M
aurit
ius L
td*
Briti
sh
Virg
in
Isla
nds
50%
Join
tly
Con
trol
led
Entit
y
Equi
ty
Met
hod
- -
- 2
80.0
0 3
58.6
3 3
17.5
1
Tota
l equ
ity a
ccou
nted
inve
stm
ents
3,9
25.2
9 3
,252
.38
2,4
89.7
6 2
,325
.46
2,2
50.2
3 2
,008
.30
* Obe
roi M
aurit
ius L
td &
Mer
cury
Car
Ren
tals
Pvt
. Ltd
are
unl
iste
d en
titie
s. H
ence
, no
quot
ed p
rice
avai
labl
e. O
bero
i Mau
ritiu
s Ltd
incl
udes
its 9
2.19
% su
bsid
iary
com
pany
Isla
nd R
esor
t Lim
ited
inco
rpor
ated
in M
aurit
ius a
nd is
cons
ider
ed a
s joi
ntly
cont
rolle
d en
tity
by v
irtue
of
bei
ng jo
intly
cont
rolle
d en
tity
of E
IH In
tern
atio
nal L
td, a
who
lly o
wne
d su
bsid
iary
of E
IH L
imite
d.
Com
mitm
ents
and
con
tinge
nt li
abili
ties
in re
spec
t of a
ssoc
iate
s an
d jo
int v
entu
res
Mar
ch 3
1,
2017
Mar
ch 3
1,
2016
Apr
il 1,
20
15C
omm
itmen
ts -
join
t ven
ture
sC
omm
itmen
t to
prov
ide
fund
ing
for j
oint
ven
ture
’s ca
pita
l com
mitm
ents
, if c
alle
d -
- -
Con
tinge
nt li
abili
ties
- ass
ocia
tes
Shar
e of
cont
inge
nt li
abili
ties i
ncur
red
join
tly w
ith o
ther
inve
stor
s of t
he a
ssoc
iate
- -
- C
ontin
gent
liab
ilitie
s rel
atin
g to
liab
ilitie
s of t
he a
ssoc
iate
for w
hich
the
grou
p is
seve
rally
liab
le -
- -
Con
tinge
nt li
abili
ties
- joi
nt v
entu
res
Shar
e of
join
t ven
ture
’s co
ntin
gent
liab
ilitie
s in
resp
ect o
f a le
gal c
laim
lodg
ed a
gain
st th
e en
tity
12.
03
94.
39
80.
24
Tota
l com
mitm
ents
and
con
tinge
nt li
abili
ties
12.
03
94.
39
80.
24
Notes to Accounts — Contd.
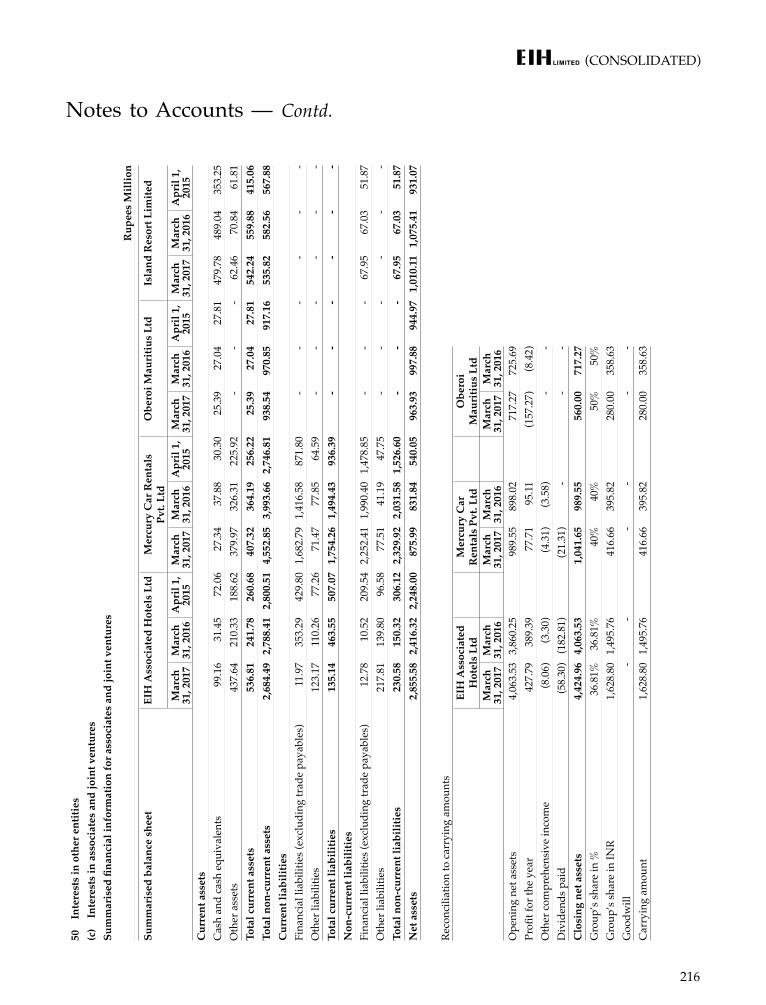
(CONSOLIDATED)
216
50
Inte
rest
s in
oth
er e
ntiti
es(c
) In
tere
sts
in a
ssoc
iate
s an
d jo
int v
entu
res
Sum
mar
ised
fina
ncia
l inf
orm
atio
n fo
r ass
ocia
tes
and
join
t ven
ture
s
Rup
ees
Mill
ion
Sum
mar
ised
bal
ance
she
etEI
H A
ssoc
iate
d H
otel
s Lt
dM
ercu
ry C
ar R
enta
ls
Pvt.
Ltd
Obe
roi M
auri
tius
Ltd
Isla
nd R
esor
t Lim
ited
Mar
ch
31, 2
017
Mar
ch
31, 2
016
Apr
il 1,
20
15M
arch
31
, 201
7M
arch
31
, 201
6A
pril
1,
2015
Mar
ch
31, 2
017
Mar
ch
31, 2
016
Apr
il 1,
20
15M
arch
31
, 201
7M
arch
31
, 201
6A
pril
1,
2015
Cur
rent
ass
ets
Cas
h an
d ca
sh e
quiv
alen
ts
99.
16
31.
45
72.
06
27.
34
37.
88
30.
30
25.
39
27.
04
27.
81
479
.78
489
.04
353
.25
Oth
er a
sset
s 4
37.6
4 2
10.3
3 1
88.6
2 3
79.9
7 3
26.3
1 2
25.9
2 -
- -
62.
46
70.
84
61.
81
Tota
l cur
rent
ass
ets
536
.81
241
.78
260
.68
407
.32
364
.19
256
.22
25.
39
27.
04
27.
81
542
.24
559
.88
415
.06
Tota
l non
-cur
rent
ass
ets
2,6
84.4
9 2
,788
.41
2,8
00.5
1 4
,552
.85
3,9
93.6
6 2
,746
.81
938
.54
970
.85
917
.16
535
.82
582
.56
567
.88
Cur
rent
liab
ilitie
s Fi
nanc
ial l
iabi
litie
s (ex
clud
ing
trad
e pa
yabl
es)
11.
97
353
.29
429
.80
1,6
82.7
9 1
,416
.58
871
.80
- -
- -
- -
Oth
er li
abili
ties
123
.17
110
.26
77.
26
71.
47
77.
85
64.
59
- -
- -
- -
Tota
l cur
rent
liab
ilitie
s 1
35.1
4 4
63.5
5 5
07.0
7 1
,754
.26
1,4
94.4
3 9
36.3
9 -
- -
- -
- N
on-c
urre
nt li
abili
ties
Fina
ncia
l lia
bilit
ies (
excl
udin
g tr
ade
paya
bles
) 1
2.78
1
0.52
2
09.5
4 2
,252
.41
1,9
90.4
0 1
,478
.85
- -
- 6
7.95
6
7.03
5
1.87
O
ther
liab
ilitie
s 2
17.8
1 1
39.8
0 9
6.58
7
7.51
4
1.19
4
7.75
-
- -
- -
- To
tal n
on-c
urre
nt li
abili
ties
230
.58
150
.32
306
.12
2,3
29.9
2 2
,031
.58
1,5
26.6
0 -
- -
67.
95
67.
03
51.
87
Net
ass
ets
2,8
55.5
8 2
,416
.32
2,2
48.0
0 8
75.9
9 8
31.8
4 5
40.0
5 9
63.9
3 9
97.8
8 9
44.9
7 1
,010
.11
1,0
75.4
1 9
31.0
7
Reco
ncili
atio
n to
carr
ying
am
ount
sEI
H A
ssoc
iate
d H
otel
s Lt
dM
ercu
ry C
ar
Ren
tals
Pvt
. Ltd
Obe
roi
Mau
ritiu
s Lt
dM
arch
31
, 201
7M
arch
31
, 201
6M
arch
31
, 201
7M
arch
31
, 201
6M
arch
31
, 201
7M
arch
31
, 201
6O
peni
ng n
et a
sset
s 4
,063
.53
3,8
60.2
5 9
89.5
5 8
98.0
2 7
17.2
7 7
25.6
9 Pr
ofit f
or th
e ye
ar 4
27.7
9 3
89.3
9 7
7.71
9
5.11
(1
57.2
7) (8
.42)
Oth
er co
mpr
ehen
sive
inco
me
(8.0
6) (3
.30)
(4.3
1) (3
.58)
- -
Div
iden
ds p
aid
(58.
30)
(182
.81)
(21.
31)
- -
- C
losi
ng n
et a
sset
s 4
,424
.96
4,0
63.5
3 1
,041
.65
989
.55
560
.00
717
.27
Gro
up’s
shar
e in
%36
.81%
36.8
1%40
%40
%50
%50
%G
roup
’s sh
are
in IN
R 1
,628
.80
1,4
95.7
6 4
16.6
6 3
95.8
2 2
80.0
0 3
58.6
3 G
oodw
ill -
--
--
-C
arry
ing
amou
nt 1
,628
.80
1,4
95.7
6 4
16.6
6 3
95.8
2 2
80.0
0 3
58.6
3
Notes to Accounts — Contd.
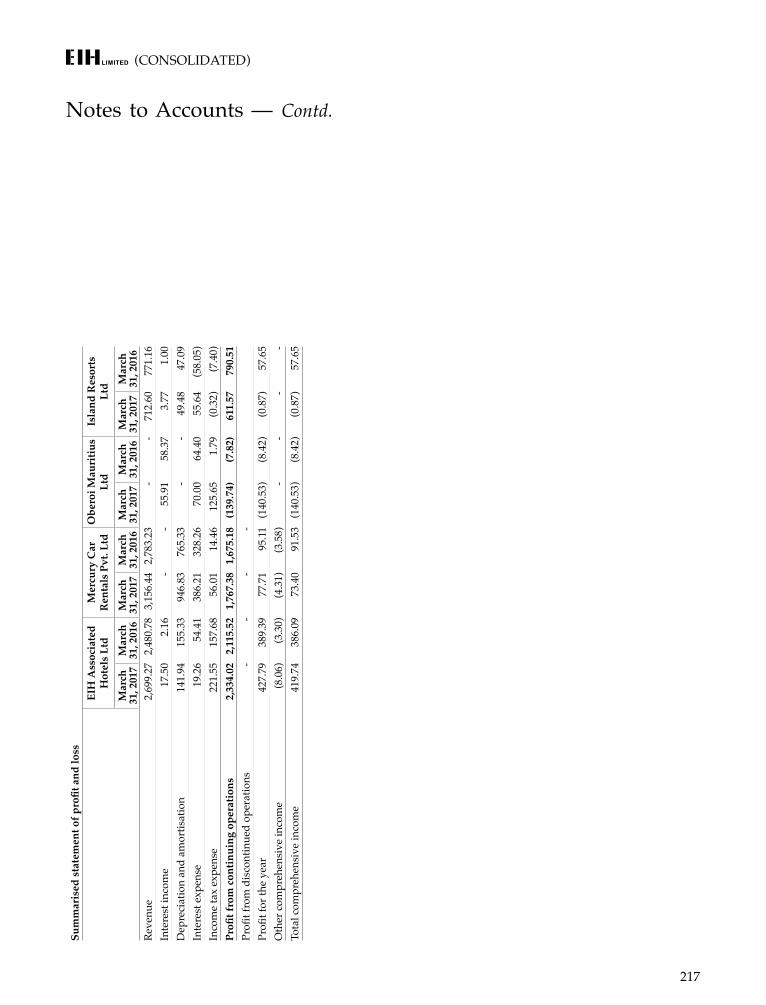
(CONSOLIDATED)
217
Sum
mar
ised
sta
tem
ent o
f pro
fit a
nd lo
ssEI
H A
ssoc
iate
d H
otel
s Lt
dM
ercu
ry C
ar
Ren
tals
Pvt
. Ltd
Obe
roi M
auri
tius
Ltd
Isla
nd R
esor
ts
Ltd
Mar
ch
31, 2
017
Mar
ch
31, 2
016
Mar
ch
31, 2
017
Mar
ch
31, 2
016
Mar
ch
31, 2
017
Mar
ch
31, 2
016
Mar
ch
31, 2
017
Mar
ch
31, 2
016
Reve
nue
2,6
99.2
7 2
,480
.78
3,1
56.4
4 2
,783
.23
- -
712
.60
771
.16
Inte
rest
inco
me
17.
50
2.1
6 -
- 5
5.91
5
8.37
3
.77
1.0
0 D
epre
ciat
ion
and
amor
tisat
ion
141
.94
155
.33
946
.83
765
.33
- -
49.
48
47.
09
Inte
rest
exp
ense
19.
26
54.
41
386
.21
328
.26
70.
00
64.
40
55.
64
(58.
05)
Inco
me
tax
expe
nse
221
.55
157
.68
56.
01
14.
46
125
.65
1.7
9 (0
.32)
(7.4
0)Pr
ofit f
rom
con
tinui
ng o
pera
tions
2,3
34.0
2 2
,115
.52
1,7
67.3
8 1
,675
.18
(139
.74)
(7.8
2) 6
11.5
7 7
90.5
1 Pr
ofit f
rom
dis
cont
inue
d op
erat
ions
- -
- -
Profi
t for
the
year
427
.79
389
.39
77.
71
95.
11
(140
.53)
(8.4
2) (0
.87)
57.
65
Oth
er co
mpr
ehen
sive
inco
me
(8.0
6) (3
.30)
(4.3
1) (3
.58)
- -
- -
Tota
l com
preh
ensi
ve in
com
e 4
19.7
4 3
86.0
9 7
3.40
9
1.53
(1
40.5
3) (8
.42)
(0.8
7) 5
7.65
Notes to Accounts — Contd.
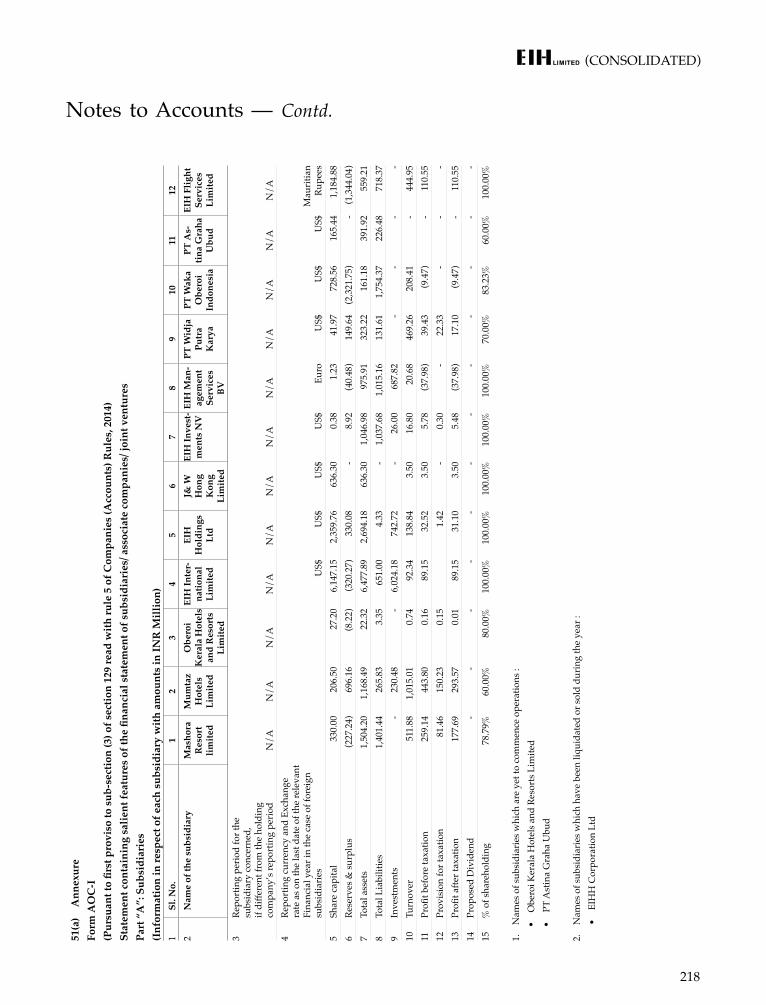
(CONSOLIDATED)
218
51(a
) A
nnex
ure
Form
AO
C-I
(Pur
suan
t to
first
pro
viso
to s
ub-s
ectio
n (3
) of s
ectio
n 12
9 re
ad w
ith ru
le 5
of C
ompa
nies
(Acc
ount
s) R
ules
, 201
4)St
atem
ent c
onta
inin
g sa
lient
feat
ures
of t
he fi
nanc
ial s
tate
men
t of s
ubsi
diar
ies/
ass
ocia
te c
ompa
nies
/ joi
nt v
entu
res
Part
“A
”: S
ubsi
diar
ies
(Inf
orm
atio
n in
resp
ect o
f eac
h su
bsid
iary
with
am
ount
s in
INR
Mill
ion)
1Sl
. No.
12
34
56
78
910
1112
2N
ame
of th
e su
bsid
iary
Mas
hora
R
esor
t lim
ited
Mum
taz
Hot
els
Lim
ited
Obe
roi
Ker
ala
Hot
els
and
Res
orts
Li
mite
d
EIH
Inte
r-na
tiona
l Li
mite
d
EIH
H
oldi
ngs
Ltd
J& W
H
ong
Kon
g Li
mite
d
EIH
Inve
st-
men
ts N
VEI
H M
an-
agem
ent
Serv
ices
BV
PT W
idja
Pu
tra
Kar
ya
PT W
aka
Obe
roi
Indo
nesi
a
PT A
s-tin
a G
raha
U
bud
EIH
Flig
ht
Serv
ices
Li
mite
d
3Re
port
ing
perio
d fo
r the
su
bsid
iary
conc
erne
d,
if di
ffere
nt fr
om th
e ho
ldin
g
com
pany
’s re
port
ing
perio
dN
/AN
/AN
/AN
/AN
/AN
/AN
/AN
/AN
/AN
/AN
/AN
/A4
Repo
rtin
g cu
rren
cy a
nd E
xcha
nge
rate
as o
n th
e la
st d
ate
of th
e re
leva
nt
Fina
ncia
l yea
r in
the
case
of f
orei
gn
subs
idia
ries
US$
US$
US$
US$
Euro
US$
US$
US$
Mau
ritia
n Ru
pees
5Sh
are
capi
tal
330
.00
206
.50
27.
20
6,1
47.1
5 2
,359
.76
636
.30
0.3
8 1
.23
41.
97
728
.56
165
.44
1,1
84.8
8 6
Rese
rves
& su
rplu
s (2
27.2
4) 6
96.1
6 (8
.22)
(320
.27)
330
.08
- 8
.92
(40.
48)
149
.64
(2,3
21.7
5) -
(1,3
44.0
4)7
Tota
l ass
ets
1,5
04.2
0 1
,168
.49
22.
32
6,4
77.8
9 2
,694
.18
636
.30
1,0
46.9
8 9
75.9
1 3
23.2
2 1
61.1
8 3
91.9
2 5
59.2
1 8
Tota
l Lia
bilit
ies
1,4
01.4
4 2
65.8
3 3
.35
651
.00
4.3
3 -
1,0
37.6
8 1
,015
.16
131
.61
1,7
54.3
7 2
26.4
8 7
18.3
7 9
Inve
stm
ents
- 2
30.4
8 -
6,0
24.1
8 7
42.7
2 -
26.
00
687
.82
- -
- -
10Tu
rnov
er 5
11.8
8 1
,015
.01
0.7
4 9
2.34
1
38.8
4 3
.50
16.
80
20.
68
469
.26
208
.41
- 4
44.9
5 11
Profi
t bef
ore
taxa
tion
259
.14
443
.80
0.1
6 8
9.15
3
2.52
3
.50
5.7
8 (3
7.98
) 3
9.43
(9
.47)
- 1
10.5
5 12
Prov
isio
n fo
r tax
atio
n 8
1.46
1
50.2
3 0
.15
1.4
2 -
0.3
0 -
22.
33
- -
- 13
Profi
t afte
r tax
atio
n 1
77.6
9 2
93.5
7 0
.01
89.
15
31.
10
3.5
0 5
.48
(37.
98)
17.
10
(9.4
7) -
110
.55
14Pr
opos
ed D
ivid
end
- -
- -
--
--
--
--
15%
of s
hare
hold
ing
78.7
9%60
.00%
80.0
0%10
0.00
%10
0.00
%10
0.00
%10
0.00
%10
0.00
%70
.00%
83.2
3%60
.00%
100.
00%
1.
Nam
es o
f sub
sidi
arie
s whi
ch a
re y
et to
com
men
ce o
pera
tions
:
•
Obe
roi K
eral
a H
otel
s and
Res
orts
Lim
ited
•
PT
Ast
ina
Gra
ha U
bud
2.
Nam
es o
f sub
sidi
arie
s whi
ch h
ave
been
liqu
idat
ed o
r sol
d du
ring
the
year
:
•
EIH
H C
orpo
ratio
n Lt
d
Notes to Accounts — Contd.
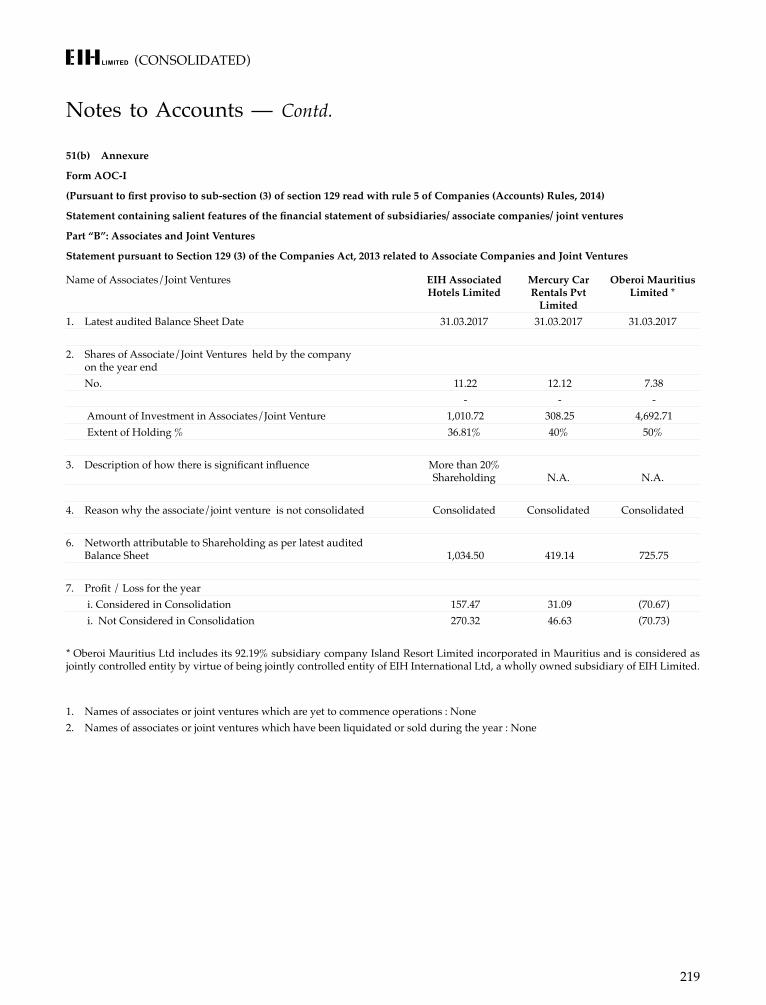
(CONSOLIDATED)
219
51(b) Annexure
Form AOC-I
(Pursuant to first proviso to sub-section (3) of section 129 read with rule 5 of Companies (Accounts) Rules, 2014)
Statement containing salient features of the financial statement of subsidiaries/ associate companies/ joint ventures
Part “B”: Associates and Joint Ventures
Statement pursuant to Section 129 (3) of the Companies Act, 2013 related to Associate Companies and Joint Ventures
Name of Associates/Joint Ventures EIH Associated Hotels Limited
Mercury Car Rentals Pvt
Limited
Oberoi Mauritius Limited *
1. Latest audited Balance Sheet Date 31.03.2017 31.03.2017 31.03.2017
2. Shares of Associate/Joint Ventures held by the company on the year end
No. 11.22 12.12 7.38 - - -
Amount of Investment in Associates/Joint Venture 1,010.72 308.25 4,692.71 Extent of Holding % 36.81% 40% 50%
3. Description of how there is significant influence More than 20% Shareholding N.A. N.A.
4. Reason why the associate/joint venture is not consolidated Consolidated Consolidated Consolidated
6. Networth attributable to Shareholding as per latest audited Balance Sheet 1,034.50 419.14 725.75
7. Profit / Loss for the year i. Considered in Consolidation 157.47 31.09 (70.67) i. Not Considered in Consolidation 270.32 46.63 (70.73)
* Oberoi Mauritius Ltd includes its 92.19% subsidiary company Island Resort Limited incorporated in Mauritius and is considered as jointly controlled entity by virtue of being jointly controlled entity of EIH International Ltd, a wholly owned subsidiary of EIH Limited.
1. Names of associates or joint ventures which are yet to commence operations : None2. Names of associates or joint ventures which have been liquidated or sold during the year : None
Notes to Accounts — Contd.
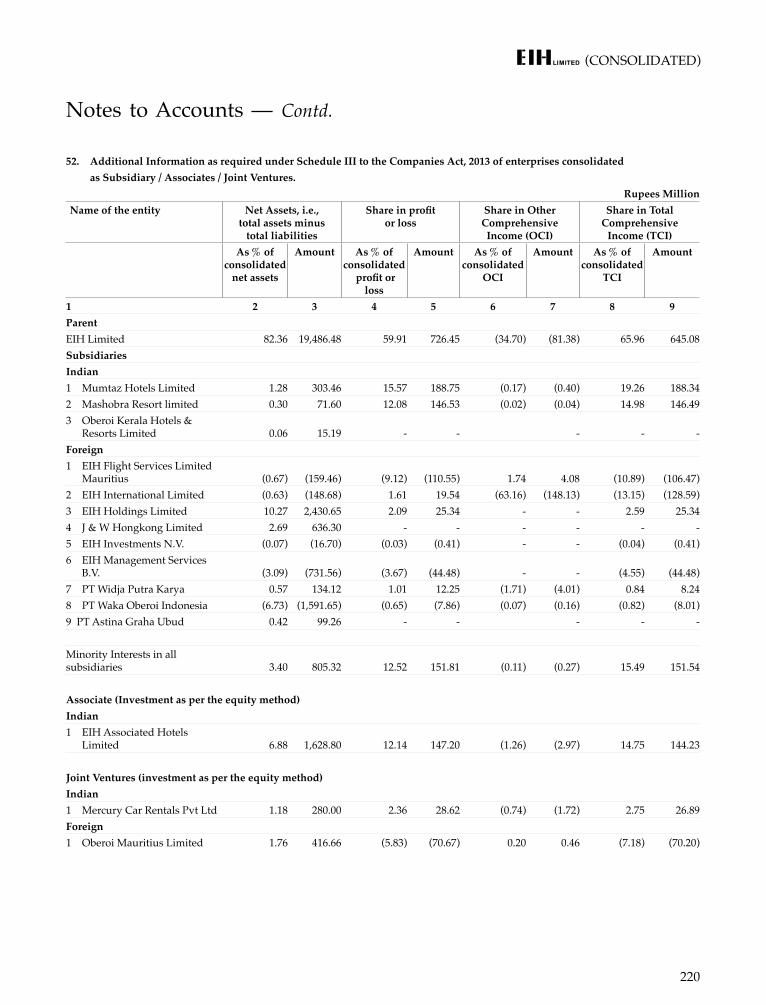
(CONSOLIDATED)
220
52. Additional Information as required under Schedule III to the Companies Act, 2013 of enterprises consolidated as Subsidiary / Associates / Joint Ventures.
Rupees MillionName of the entity Net Assets, i.e.,
total assets minus total liabilities
Share in profit or loss
Share in Other Comprehensive Income (OCI)
Share in Total Comprehensive
Income (TCI)As % of
consolidatednet assets
Amount As % of consolidated
profit or loss
Amount As % of consolidated
OCI
Amount As % of consolidated
TCI
Amount
1 2 3 4 5 6 7 8 9ParentEIH Limited 82.36 19,486.48 59.91 726.45 (34.70) (81.38) 65.96 645.08 SubsidiariesIndian1 Mumtaz Hotels Limited 1.28 303.46 15.57 188.75 (0.17) (0.40) 19.26 188.34 2 Mashobra Resort limited 0.30 71.60 12.08 146.53 (0.02) (0.04) 14.98 146.49 3 Oberoi Kerala Hotels &
Resorts Limited 0.06 15.19 - - - - - Foreign1 EIH Flight Services Limited
Mauritius (0.67) (159.46) (9.12) (110.55) 1.74 4.08 (10.89) (106.47)2 EIH International Limited (0.63) (148.68) 1.61 19.54 (63.16) (148.13) (13.15) (128.59)3 EIH Holdings Limited 10.27 2,430.65 2.09 25.34 - - 2.59 25.34 4 J & W Hongkong Limited 2.69 636.30 - - - - - - 5 EIH Investments N.V. (0.07) (16.70) (0.03) (0.41) - - (0.04) (0.41)6 EIH Management Services
B.V. (3.09) (731.56) (3.67) (44.48) - - (4.55) (44.48)7 PT Widja Putra Karya 0.57 134.12 1.01 12.25 (1.71) (4.01) 0.84 8.24 8 PT Waka Oberoi Indonesia (6.73) (1,591.65) (0.65) (7.86) (0.07) (0.16) (0.82) (8.01)9 PT Astina Graha Ubud 0.42 99.26 - - - - -
Minority Interests in all subsidiaries 3.40 805.32 12.52 151.81 (0.11) (0.27) 15.49 151.54
Associate (Investment as per the equity method)Indian1 EIH Associated Hotels
Limited 6.88 1,628.80 12.14 147.20 (1.26) (2.97) 14.75 144.23
Joint Ventures (investment as per the equity method)Indian1 Mercury Car Rentals Pvt Ltd 1.18 280.00 2.36 28.62 (0.74) (1.72) 2.75 26.89 Foreign1 Oberoi Mauritius Limited 1.76 416.66 (5.83) (70.67) 0.20 0.46 (7.18) (70.20)
Notes to Accounts — Contd.
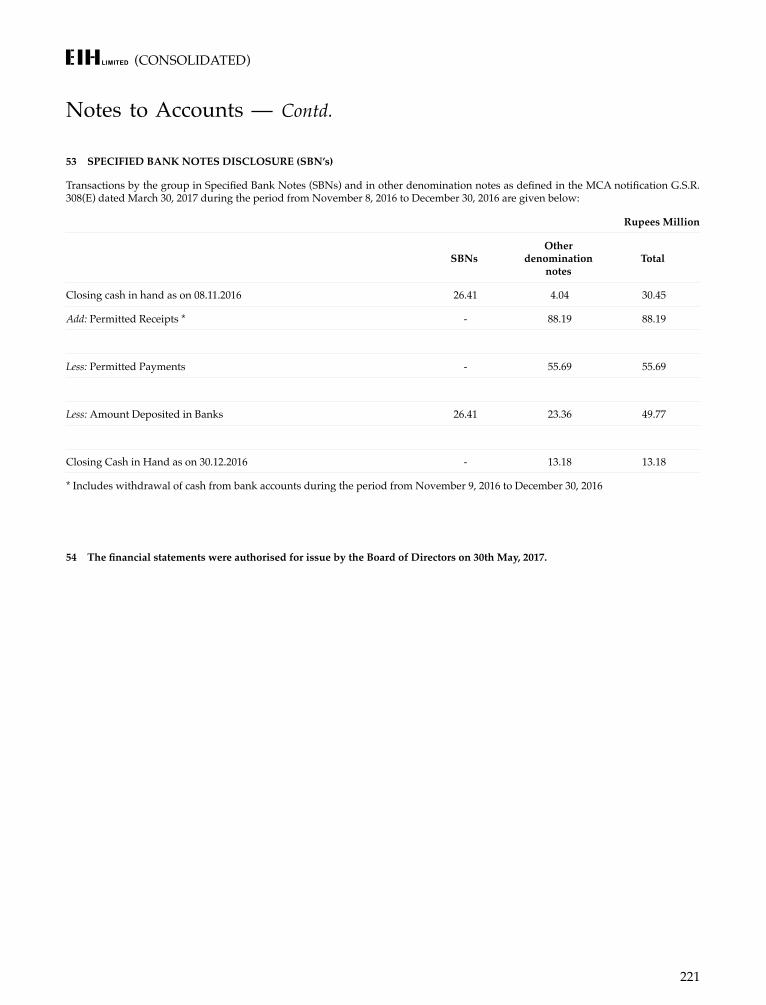
(CONSOLIDATED)
221
53 SPECIFIED BANK NOTES DISCLOSURE (SBN’s)
Transactions by the group in Specified Bank Notes (SBNs) and in other denomination notes as defined in the MCA notification G.S.R. 308(E) dated March 30, 2017 during the period from November 8, 2016 to December 30, 2016 are given below:
Rupees Million
SBNsOther
denomination notes
Total
Closing cash in hand as on 08.11.2016 26.41 4.04 30.45
Add: Permitted Receipts * - 88.19 88.19
Less: Permitted Payments - 55.69 55.69
Less: Amount Deposited in Banks 26.41 23.36 49.77
Closing Cash in Hand as on 30.12.2016 - 13.18 13.18
* Includes withdrawal of cash from bank accounts during the period from November 9, 2016 to December 30, 2016
54 The financial statements were authorised for issue by the Board of Directors on 30th May, 2017.
Notes to Accounts — Contd.
(CONSOLIDATED)
222
INDIA
Agra The Oberoi Amarvilas
Bangalore The Oberoi
Chandigarh The Oberoi Sukhvilas
Gurgaon The Oberoi
Jaipur The Oberoi Rajvilas
Kolkata The Oberoi Grand
Shimla in the Himalayas Wildflower Hall
Mumbai The Oberoi
New Delhi The Oberoi
Ranthambhore The Oberoi Vanyavilas
Shimla The Oberoi Cecil
Udaipur The Oberoi Udaivilas
Cochin Motor Vessel Vrinda (A luxury backwater cruiser)
EGYPT
Sahl Hasheesh The Oberoi
The Oberoi Zahra Luxury Nile Cruiser The Oberoi Philae Luxury Nile Cruiser
INDONESIA
Bali The Oberoi
Lombok The Oberoi
MAURITIUS
Mauritius The Oberoi
SAUDI ARABIA
Madina Madina Oberoi
UAE
Ajman The Oberoi Beach Resort, Al Zorah
Dubai The Oberoi
OBEROI HOTELS & RESORTS
TRIDENT HOTELS
Agra Trident
Bhubaneswar Trident
Chennai Trident
Cochin Trident
Gurgaon Trident Hyderabad Trident
Jaipur Trident
Mumbai Trident, Nariman Point Trident, Bandra Kurla
Udaipur Trident
OTHER BUSINESS UNITS
Delhi Maidens Hotel
Manesar, Gurgaon Printing Press
Mumbai, Delhi, Kolkata and Chennai Oberoi Flight Services
Mumbai Oberoi Airport Services
Luxury Car Hire and Car Leasing
Business Aircraft Charters
(CONSOLIDATED)
223
PROJECTS UNDER CONSTRUCTION
INTERNATIONAL
Marrakech, Morocco The Oberoi
Casablanca, Morocco The Oberoi (Construction commenced but under hold for environmental clearances)
INDIA
Rajgarh Palace, The Oberoi, Rajgarh Madhya Pradesh (Under construction)
Bangalore The Oberoi (Pending approval of new planning guidelines)
Goa The Oberoi (Awaiting planning approval)