
Development of a source oriented version of the WRF/Chem model and its application to the California...
38
ACPD 13, 16457–16494, 2013 Development of a source oriented version H. Zhang et al. Title Page Abstract Introduction Conclusions References Tables Figures Back Close Full Screen / Esc Printer-friendly Version Interactive Discussion Discussion Paper | Discussion Paper | Discussion Paper | Discussion Paper | Atmos. Chem. Phys. Discuss., 13, 16457–16494, 2013 www.atmos-chem-phys-discuss.net/13/16457/2013/ doi:10.5194/acpd-13-16457-2013 © Author(s) 2013. CC Attribution 3.0 License. Atmospheric Chemistry and Physics Open Access Discussions This discussion paper is/has been under review for the journal Atmospheric Chemistry and Physics (ACP). Please refer to the corresponding final paper in ACP if available. Development of a source oriented version of the WRF/Chem model and its application to the California Regional PM 10 /PM 2.5 Air Quality Study H. Zhang 1 , S. P. DeNero 1 , D. K. Joe 1 , H.-H. Lee 2 , S.-H. Chen 2 , J. Michalakes 3 , and M. J. Kleeman 1 1 Department of Civil and Environmental Engineering, University of California, Davis. One Shields Avenue, Davis CA, USA 2 Department of Land, Air, and Water Resources, University of California, Davis. One Shields Avenue, Davis CA, USA 3 National Renewable Energy Laboratory, Golden CO, USA Received: 8 May 2013 – Accepted: 29 May 2013 – Published: 19 June 2013 Correspondence to: M. J. Kleeman ([email protected]) Published by Copernicus Publications on behalf of the European Geosciences Union. 16457
Transcript of Development of a source oriented version of the WRF/Chem model and its application to the California...
ACPD13, 16457–16494, 2013
Development ofa source oriented
version
H. Zhang et al.
Title Page
Abstract Introduction
Conclusions References
Tables Figures
J I
J I
Back Close
Full Screen / Esc
Printer-friendly Version
Interactive Discussion
Discussion
Paper
|D
iscussionP
aper|
Discussion
Paper
|D
iscussionP
aper|
Atmos. Chem. Phys. Discuss., 13, 16457–16494, 2013www.atmos-chem-phys-discuss.net/13/16457/2013/doi:10.5194/acpd-13-16457-2013© Author(s) 2013. CC Attribution 3.0 License.
EGU Journal Logos (RGB)
Advances in Geosciences
Open A
ccess
Natural Hazards and Earth System
Sciences
Open A
ccess
Annales Geophysicae
Open A
ccess
Nonlinear Processes in Geophysics
Open A
ccess
Atmospheric Chemistry
and Physics
Open A
ccess
Atmospheric Chemistry
and Physics
Open A
ccess
Discussions
Atmospheric Measurement
Techniques
Open A
ccess
Atmospheric Measurement
Techniques
Open A
ccess
Discussions
Biogeosciences
Open A
ccess
Open A
ccess
BiogeosciencesDiscussions
Climate of the Past
Open A
ccess
Open A
ccess
Climate of the Past
Discussions
Earth System Dynamics
Open A
ccess
Open A
ccess
Earth System Dynamics
Discussions
GeoscientificInstrumentation
Methods andData Systems
Open A
ccess
GeoscientificInstrumentation
Methods andData Systems
Open A
ccess
Discussions
GeoscientificModel Development
Open A
ccess
Open A
ccess
GeoscientificModel Development
Discussions
Hydrology and Earth System
Sciences
Open A
ccess
Hydrology and Earth System
Sciences
Open A
ccess
Discussions
Ocean Science
Open A
ccess
Open A
ccess
Ocean ScienceDiscussions
Solid Earth
Open A
ccess
Open A
ccess
Solid EarthDiscussions
The Cryosphere
Open A
ccess
Open A
ccess
The CryosphereDiscussions
Natural Hazards and Earth System
Sciences
Open A
ccess
Discussions
This discussion paper is/has been under review for the journal Atmospheric Chemistryand Physics (ACP). Please refer to the corresponding final paper in ACP if available.
Development of a source oriented versionof the WRF/Chem model and itsapplication to the California RegionalPM10/PM2.5 Air Quality Study
H. Zhang1, S. P. DeNero1, D. K. Joe1, H.-H. Lee2, S.-H. Chen2, J. Michalakes3, andM. J. Kleeman1
1Department of Civil and Environmental Engineering, University of California, Davis. OneShields Avenue, Davis CA, USA2Department of Land, Air, and Water Resources, University of California, Davis. One ShieldsAvenue, Davis CA, USA3National Renewable Energy Laboratory, Golden CO, USA
Received: 8 May 2013 – Accepted: 29 May 2013 – Published: 19 June 2013
Correspondence to: M. J. Kleeman ([email protected])
Published by Copernicus Publications on behalf of the European Geosciences Union.
16457
ACPD13, 16457–16494, 2013
Development ofa source oriented
version
H. Zhang et al.
Title Page
Abstract Introduction
Conclusions References
Tables Figures
J I
J I
Back Close
Full Screen / Esc
Printer-friendly Version
Interactive Discussion
Discussion
Paper
|D
iscussionP
aper|
Discussion
Paper
|D
iscussionP
aper|
Abstract
A source-oriented representation of airborne particulate matter was added to theWeather Research & Forecasting (WRF) model with chemistry (WRF/Chem). Thesource-oriented aerosol separately tracks primary particles with different hygroscopicproperties rather than instantaneously combining them into an internal mixture. The5
source-oriented approach avoids artificially mixing light absorbing black+brown car-bon particles with materials such as sulfate that would encourage the formation of ad-ditional coatings. Source-oriented particles undergo coagulation and gas-particle con-version, but these processes are considered in a dynamic framework that realistically“ages” primary particles over hours and days in the atmosphere. The source-oriented10
WRF/Chem model more accurately predicts radiative feedbacks from anthropogenicaerosols compared to models that make internal mixing or other artificial mixing as-sumptions.
A three-week stagnation episode (15 December 2000 to 6 January 2001) duringthe California Regional PM10/PM2.5Air Quality Study (CRPAQS) was chosen for the15
initial application of the new modeling system. Emissions were obtained from the Cal-ifornia Air Resources Board. Gas-phase reactions were modeled with the SAPRC90photochemical mechanism. Gas-particle conversion was modeled as a dynamic pro-cess with semi-volatile vapor pressures at the particle surface calculated using ISOR-ROPIA. Source oriented calculations were performed for 8 particle size fractions rang-20
ing from 0.01–10 µm particle diameters with a spatial resolution of 4 km and hourlytime resolution. Primary particles emitted from diesel engines, wood smoke, high sul-fur fuel combustion, food cooking, and other anthropogenic sources were trackedseparately throughout the simulation as they aged in the atmosphere. Results showthat the source-oriented representation of particles with meteorological feedbacks in25
WRF/Chem changes the aerosol extinction coefficients, downward shortwave flux, andprimary and secondary particulate matter concentrations relative to the internally mixedversion of the model. Downward shortwave radiation predicted by source-oriented
16458

ACPD13, 16457–16494, 2013
Development ofa source oriented
version
H. Zhang et al.
Title Page
Abstract Introduction
Conclusions References
Tables Figures
J I
J I
Back Close
Full Screen / Esc
Printer-friendly Version
Interactive Discussion
Discussion
Paper
|D
iscussionP
aper|
Discussion
Paper
|D
iscussionP
aper|
model is enhanced by 1 % at ground level chiefly because diesel engine particlesin the source-oriented mixture are not artificially coated with material that increasestheir absorption efficiency. The extinction coefficient predicted by the source-orientedWRF/Chem model is reduced by an average of ∼ 5–10 % in the central valley witha maximum reduction of ∼ 20 %. Particulate matter concentrations predicted by the5
source-oriented WRF/Chem model are ∼ 5–10 % lower than the internally mixed ver-sion of the same model because increased solar radiation at the ground increasesatmospheric mixing. All of these results stem from the mixing state of black carbon.The source-oriented model representation with realistic aging processes predicts thathydrophobic diesel engine particles remain largely uncoated over the +7 day simulation10
period, while the internal mixture model representation predicts significant accumula-tion of secondary nitrate and water on diesel engine particles. Similar results will likelybe found in any air pollution stagnation episode that is characterized by significantparticulate nitrate production.
1 Introduction15
The Weather Research & Forecasting (WRF) model developed primarily by the Na-tional Center for Atmospheric Research (NCAR) and the National Oceanic and Atmo-spheric Administration (NOAA) is frequently used to predict meteorological conditionsduring stagnation events that lead to high concentrations of air pollutants (Borge et al.,2008; Hu et al., 2010; Huang et al., 2010; Zhang et al., 2012). The WRF model with20
chemistry (WRF/Chem) allows for coupled simulations of atmospheric chemistry andmeteorology so that feedbacks can be considered (Chapman et al., 2009; Grell et al.,2005). These feedback effects can be especially important during air pollution episodesthat occur as a result of stagnation events. Stagnation events are characterized byweak synoptic forcing of winds, leading to the buildup of pollutant concentrations close25
to emissions sources. Atmospheric mixing is largely determined by the distribution ofincoming radiation throughout the vertical column under these conditions. Airborne par-
16459

ACPD13, 16457–16494, 2013
Development ofa source oriented
version
H. Zhang et al.
Title Page
Abstract Introduction
Conclusions References
Tables Figures
J I
J I
Back Close
Full Screen / Esc
Printer-friendly Version
Interactive Discussion
Discussion
Paper
|D
iscussionP
aper|
Discussion
Paper
|D
iscussionP
aper|
ticles in the air pollution mixture scatter and/or absorb solar radiation which alters thevertical distribution of solar energy, atmospheric mixing, and therefore dilution rates.
The size, composition, and mixing state of airborne particles strongly affect theiroptical properties and therefore their effects on solar radiation (Jacobson, 2001; Mogoet al., 2012). Current versions of WRF/Chem have state-of-the-science representations5
of particle size and composition (Zaveri et al., 2008), but relatively simple representa-tions of particle mixing state. WRF/Chem makes a global internal mixing assumptionin which all particles with the same size in the same grid cell are instantaneously com-bined such that they have the same chemical composition. In reality, airborne particlesbecome internally mixed over a period of hours to days depending on atmospheric con-10
ditions. The instantaneous internal mixing assumption alters the optical properties ofparticles in WRF/Chem simulations and therefore has the potential to bias air pollution– meteorology feedback calculations in the WRF/Chem model.
More sophisticated treatments of airborne particle mixing state have been used in1-D box models (Zaveri et al., 2010) or 2-D trajectory models (Kleeman and Cass,15
1998) but these frameworks cannot support a full simulation of meteorological feed-backs on a regional scale. Regional 3-D air quality models that represent particlemixing state as a source-oriented external mixture have been available for more thana decade (Held et al., 2004; Kleeman, 2001; Ying et al., 2007). These models havetracked source contributions to primary and secondary particulate matter from 8–70020
sources (Hu et al., 2013; Ying et al., 2008a; Zhang et al., 2013; Zhang and Ying, 2010,2011) but they have not attempted to calculate feedbacks to meteorology other thanmodification of photolysis rates (Ying and Kleeman, 2003). Basic assumptions aboutparticle mixing state beyond the internal mixture approximation have been included inproprietary coupled meteorology-air pollution models (Jacobson, 2001). These calcula-25
tions have emphasized the role of black carbon as a potential short-lived climate forcingagent, but verification of these results by the broader scientific community has not beenpossible due to the lack of a publically-available tool capable of such calculations.
16460
ACPD13, 16457–16494, 2013
Development ofa source oriented
version
H. Zhang et al.
Title Page
Abstract Introduction
Conclusions References
Tables Figures
J I
J I
Back Close
Full Screen / Esc
Printer-friendly Version
Interactive Discussion
Discussion
Paper
|D
iscussionP
aper|
Discussion
Paper
|D
iscussionP
aper|
The purpose of the current paper is to demonstrate how a full source-oriented rep-resentation of airborne particles would influence predicted air pollution concentrationsin the publically-available WRF/Chem model. A source-oriented aerosol model repre-sents particles emitted from different sources using separate chemical composition sothat it is possible to simulate multiple particles with the same size but different chem-5
ical composition in the same grid cell. Atmospheric processes such as coagulationand gas-particle conversion age particles over time, but these processes occur overhours to days. The structure of the source-oriented WRF/Chem (SOWC) model is de-scribed, and the application of the model to a severe air pollution episode in centralCalifornia is discussed. Source-oriented particles in 8 size bins are resolved for diesel10
engines, wood smoke, high sulfur combustion, food cooking, and other anthropogenicsources. The current study calculates from first principles the composition and mix-ing state of each particle source type and size bin across the domain while consideringall relevant atmospheric processes including feedbacks to meteorology. Differences be-tween model predictions for the vertical distribution of energy, momentum, and pollutant15
concentrations carried out with internal vs. source-oriented external representations ofairborne particles are quantified, and recommendations are made for future researchdirections.
2 Background
Numerous air quality studies have used the source-oriented representation of particles20
to understand how different sources contribute to air pollution. Kleeman et al. (1997)showed that representing a plume as an externally-mixed aerosol led to specific differ-ences in composition between particles of the same diameter. Their study showed thatan externally-mixed representation will separate out species such as Na+ and SO=
4that exist independently the real world environment, while an internally-mixed plume25
will combine these into one aerosol. It was also observed through their results thatwith increasing relative humidity, the external mixture model could accurately predict
16461
ACPD13, 16457–16494, 2013
Development ofa source oriented
version
H. Zhang et al.
Title Page
Abstract Introduction
Conclusions References
Tables Figures
J I
J I
Back Close
Full Screen / Esc
Printer-friendly Version
Interactive Discussion
Discussion
Paper
|D
iscussionP
aper|
Discussion
Paper
|D
iscussionP
aper|
a mono-disperse plume evolving into a bimodally distributed aerosol. Ying et al. (2009)studied source contributions to secondary pollutants formation within California’s cen-tral valley using a source-oriented air quality model. They identified diesel engines asthe largest contributor to particle nitrate and agricultural sources as the leading sourceof the secondary ammonium ion.5
Black carbon has been identified as a major contributor to global warming (Jacob-son, 1998) but the assumptions about the mixing state of black carbon (what chemicalcomponents exist in the same particles with black carbon) have a large impact on thecalculation (Lesins et al., 2002; Mallet et al., 2004). Very few studies have incorpo-rated externally mixed particles into simulations that involve radiative feedbacks, and10
the majority of the studies that have considered this complication have made simplify-ing assumptions about the mixing state of the black carbon contained in those parti-cles. For example, Jacobson (1998) studied the effects of source-resolved aerosols onphotolysis and temperatures within and above urban areas, and found that aerosols in-creased radiative heating within the air column, but decreased solar flux at the surface.15
The study assumed that when particles contained more than 5 % secondary organicmaterial and UV wavelengths were considered, the shell was comprised of secondaryorganics while the rest of each particle was core material. However, when particlescontained less than 5 % secondary organics and when visible wavelengths were con-sidered, the core was assumed to be elemental (black) carbon.20
California’s Central Valley experiences some of the worst winter-time particulate airpollution in the United State (Ostro et al., 2006; Ostro and Chestnut, 1998; Woodruffet al., 2006) due to its unique mountain-valley topography and frequent stagnationevents. The California Regional PM10/PM2.5 Air Quality Study (CRPAQS) was a fieldcampaign starting in December 1999 and ending in January 2001. CRPAQS was de-25
signed to study the Central Valley’s elevated particulate matter (PM) concentrations.During this campaign, continuous concentrations of gaseous CO, NOX, and O3weremeasured throughout the valley. In addition, four different PM sampling events lasting3–4 days each were conducted during the winter months. These Intensive Operation
16462

ACPD13, 16457–16494, 2013
Development ofa source oriented
version
H. Zhang et al.
Title Page
Abstract Introduction
Conclusions References
Tables Figures
J I
J I
Back Close
Full Screen / Esc
Printer-friendly Version
Interactive Discussion
Discussion
Paper
|D
iscussionP
aper|
Discussion
Paper
|D
iscussionP
aper|
Periods (IOPs) collected information on particulate composition and size distributions,which can be used to support detailed modeling. Sampling and modeling studies fo-cusing on the CRPAQS episode have been well documented (Chow et al., 2006; Yinget al., 2008b; Ying et al., 2009). The SOWC model will be applied to the CRPAQS studyperiod in the present study.5
3 Model description
This Source Oriented WRF/Chem (SOWC) model was created using the frame-work of the Weather Research and Forecasting model coupled with Chemistry(WRF/Chem) version 3.1.1. The changes necessary to add source-oriented aerosolsto the WRF/Chem model fall within three branches of the code: the Registry, the chem-10
istry driver, and the Eulerian-mass conservation dynamic core. Figure 1 illustrates theoverall call structure of the chemistry driver, and names the files that were edited orcreated with the creation of the SOWC model and Fig. 2 provides the same informa-tion for code within the Eulerian mass conservation dynamic core. The details of themodification are provided in Appendix with the main features summarized below.15
3.1 Representation of particles and gas-phase species
Particles in each Eulerian grid cell of the SOWC model are described by their size bin,source-origin, number concentration, and chemical composition using 6 dimension ar-rays (i ,k, j ,source,size,species). Number concentration and radius were included asthe last two elements in the species dimension in order to simplify the coding struc-20
ture. The model conserves number concentrations and mass concentration throughoutthe simulation of atmospheric processes including emissions, transport, deposition,coagulation, and condensation/evaporation. Particle radius is updated after each ma-jor operator step to reflect the actions of operators that differentially affect number andmass concentrations. Figure 4a illustrates a representative snapshot of source-oriented25
16463

ACPD13, 16457–16494, 2013
Development ofa source oriented
version
H. Zhang et al.
Title Page
Abstract Introduction
Conclusions References
Tables Figures
J I
J I
Back Close
Full Screen / Esc
Printer-friendly Version
Interactive Discussion
Discussion
Paper
|D
iscussionP
aper|
Discussion
Paper
|D
iscussionP
aper|
particles in the current study. The gas-phase species in each grid cell are not source-oriented in the current study. Future work will extend the source-oriented treatment togas-phase species in support of source apportionment calculations for secondary par-ticulate matter (Ying and Kleeman, 2009; Ying et al., 2009), but these calculations haveno impact on the radiative feedback between air pollution and meteorology that forms5
the focus of the current study.All of the 6 dimensional arrays needed for the source-oriented particle representa-
tion were defined via the WRF registry program that was modified to accommodatearrays with dimensions higher than 4. The modified registry program in turn gener-ates FORTRAN subroutines that accomplish i/o operations, HALO communications,10
and nesting communications for 6 dimensional variables. The computational burden(memory footprint, communication time, computation time) scales approximately lin-early with the number of particle sources× size bins× chemical species. In order tokeep computational time reasonable, a new 3 dimensional domain decomposition wasspecified for particle-phase variables in the i , j ,source dimensions. This creates a com-15
munication topology in which dedicated processors are assigned to track particles witha target source type. Communication calls between such processors are only neces-sary before operators that require information about all particle source types, such asradiation drivers, gas-particle conversion drivers, etc. This strategy is more efficientthan using an equivalent number of processors in a 2 dimensional i , j domain decom-20
position because the fixed HALO region around each tile accounts for an increasinglylarge overhead as the tile shrinks in size.
3.2 Emissions, initial and boundary conditions
Source-oriented emissions were created in a netcdf format based on emissions inven-tories for the CRPAQS study period supplied by the California Air Resources Board25
(Ying et al., 2008a). The UCD emissions preprocessing system was used to transformregulatory inventories into source, size, and chemistry-resolved modeling inventories.As shown in Fig. 1, the process of adding fresh source-oriented emissions into the
16464

ACPD13, 16457–16494, 2013
Development ofa source oriented
version
H. Zhang et al.
Title Page
Abstract Introduction
Conclusions References
Tables Figures
J I
J I
Back Close
Full Screen / Esc
Printer-friendly Version
Interactive Discussion
Discussion
Paper
|D
iscussionP
aper|
Discussion
Paper
|D
iscussionP
aper|
SOWC model starts within the “emissions_driver” subroutine. Changes were made tomap source-oriented particle-phase emissions to source-oriented particle phase statevariables within SOWC.
Concentrations measured during the CRPAQS winter field campaign were used asinitial and boundary conditions for SOWC calculations. These initial and boundary con-5
ditions were used extensively in previous modeling studies (Ying et al., 2008a; Yinget al., 2008b; Ying et al., 2009). In the present study, the interpolated concentrationson the western (upwind) edge of the modeling domain were averaged as a best esti-mate of initial aerosol concentrations. The same concentrations were specified alongall four boundaries in the current study.10
3.3 Gas-particle partitioning in ISORROPIA and coagulation
Gas-particle interaction is a complex process that consumes a sizeable fraction of thetotal chemistry-related computing time in the SOWC model. The SOWC model uses theAPDC approach outlined by Jacobson (2005) for gas-particle conversion of inorganicspecies. In this approach, the ammonium ion is held in equilibrium while the anion con-15
centrations are solved dynamically. Mass and charge balance equations are then usedto determine final concentrations of each component. This numerical solution is stableat larger time steps (150–300 s), which greatly reduces the computational burden ofgas-particle conversion. The vapor pressures of inorganic gases HNO3, HCl, H2SO4,and NH3 immediately above the particle surface are calculated using the ISORROPIA20
equilibrium solver. These concentrations are updated for every particle source and sizebin at each model time step. Aerosol water content is calculated based on the parti-cle composition of each particle using the ZSR method (Stokes and Robinson, 1966).The current study resolves the distribution of aerosol water among source-orientedaerosols, which may result in modified optical properties (Beaver et al., 2010) when25
there is a difference in chemical composition between the particles being surveyed(Fuller et al., 1999).
16465
ACPD13, 16457–16494, 2013
Development ofa source oriented
version
H. Zhang et al.
Title Page
Abstract Introduction
Conclusions References
Tables Figures
J I
J I
Back Close
Full Screen / Esc
Printer-friendly Version
Interactive Discussion
Discussion
Paper
|D
iscussionP
aper|
Discussion
Paper
|D
iscussionP
aper|
A source-oriented coagulation calculation is performed immediately following thegas-particle exchange calculations (Ying et al., 2008a; Zhang and Ying, 2010). Thefastest coagulation rates occur between the smallest particles that have high Browniandiffusivity and the largest particles that provide a large target for collisions. The source-oriented algorithm transfers the mass of smaller particles involved in coagulation events5
to the larger particles, and reduces the number concentration of the smaller particles.The “source-origin” of the larger particles is preserved, at least approximately, sincethe mass added by coagulation events is generally small relative to the total mass inthese size fractions.
3.4 Advection, diffusion and vertical mixing10
Mass transport of the 6 dimensional source-oriented arrays is performed within the dy-namic core of the WRF model. The SOWC model can only be used with the Eulerianmass-conservation dynamic core (EM_CORE) at present. The standard Runge-Kuttamethod is used to calculate the tendency of each scalar array variable, and then solvethe corresponding ordinary differential equation in order to update the scalar value at15
the next time step. This operator can be separated into three steps: tendency calcula-tions, scalar updates, and boundary condition updates.
The asymmetric convective model version 2 (ACM2) (Pleim, 2007) was added tothe SOWC model to enhance the vertical mixing through a combination of non-localvertical mixing and eddy diffusion. ACM2 slightly increases the ozone transported to20
surface level from the upper atmosphere during winter stagnation events, which leadsto improved performance for ozone and nitrate concentration predictions.
3.5 Long-wave and short-wave physics/aerosol-radiation feedback
The SOWC model uses the short-wave radiation modules developed by the GoddardSpace Flight Center (GSFC). The current study introduced a comparable GSFC long-25
wave radiation module to the SOWC model framework (Chou and Suarez, 1999; Chou
16466
ACPD13, 16457–16494, 2013
Development ofa source oriented
version
H. Zhang et al.
Title Page
Abstract Introduction
Conclusions References
Tables Figures
J I
J I
Back Close
Full Screen / Esc
Printer-friendly Version
Interactive Discussion
Discussion
Paper
|D
iscussionP
aper|
Discussion
Paper
|D
iscussionP
aper|
et al., 2001; Chen et al., 2010). The standard WRF code used a pre-defined concen-tration profile of internally mixed pollutants for all aerosol optics calculations. A newsubroutine was implemented within the SOWC model to calculate layer-averaged op-tical properties of the size and source resolved aerosols. The refractive index for eachparticle size and source within each layer is calculated using the volume averaging5
method described by Stelson (1990) applied with a core and shell model for each par-ticle as described by Toon and Ackerman (1981). Elemental carbon and metals areassumed to reside in the particle core while semi-volatile materials and water are as-sumed to reside in the particle shell. A Mie routine is employed to calculate the opticalproperties for each particle which are combined into the grid-cell average values of10
single scattering albedo, asymmetry parameter, and optical thickness. These three op-tical parameters are then used as inputs with the standard radiation transfer code thatis part of the standard WRF model.
4 Model application
The SOWC model was applied to simulate the air quality and meteorology in Califor-15
nia’s Central Valley from 15 December 2000 to 6 January 2001. The modeling domainis a pair of nested grids at 12 km×12 km and 4 km×4 km resolution. The coarser outerdomain has 125 grid cells in each direction, while the more spatially resolved 4 km do-main has 100 grid cells in the West-East direction, and 106 grid cells in the South-Northdirection. Both domains have 31 vertical layers to the top of the modeling-atmosphere20
at a pressure of 10 000 Pa. Figure 3 shows the outer and inner domains together withthe surface terrain height. The outer domain encompasses the entire state of Cali-fornia. The inner domain extends from the San Francisco Bay Area eastward to theSierra Nevada Mountains and then extends from the Northern Sacramento Valley areasouthward to the edge of the Tehachapi Mountains.25
SOWC simulations were conducted without four dimensional data assimilation(FDDA) to minimize artificial forcing so that chemistry feedback effects on meteorol-
16467

ACPD13, 16457–16494, 2013
Development ofa source oriented
version
H. Zhang et al.
Title Page
Abstract Introduction
Conclusions References
Tables Figures
J I
J I
Back Close
Full Screen / Esc
Printer-friendly Version
Interactive Discussion
Discussion
Paper
|D
iscussionP
aper|
Discussion
Paper
|D
iscussionP
aper|
ogy would be most apparent. A statistical analysis shows that model meteorologicalerrors do not increase significantly with time, but the effects of a weak upper level dis-turbance after 24 December 2000 are over-predicted which allows accumulated pollu-tant concentrations to escape from the SJV. This brief disruption undermines predictedpollutant concentrations during the latter half of the stagnation event. The analysis of5
pollutant concentrations in the following sections is focused on 24 December 2000,nine days into the simulation and the day before the weak upper level disturbance.
Since the purpose of this paper is to examine how the source-oriented representationof airborne particles influences feedback effects on meteorology, two sets of simula-tions were conducted using the same model. One run was configured as an internally10
mixed case, i.e. singular-source type so the source-oriented feature was concealed(internal case hereinafter). Another run was configured as a source-oriented externallymixed case, i.e. the true source-oriented run with multiple-source types (external casehereinafter). The results of the internal case and the external case are compared tosee the differences caused by the source-oriented representation of particles.15
5 Results and discussion
5.1 Model performance evaluation
Table 1 presents the root mean squared errors (RMSE) and mean absolute errors(MAE) of meteorological parameters predicted by external SOWC model and the inter-nal SOWC model using all available observations within the 4 km domain illustrated in20
Fig. 3. The RMSE and MAE of the internal and external runs for temperature and windspeed are similar, with differences observed in RH. In contrast, the differences in con-centrations of PM and gas pollutants predicted using the internal vs. source-orientedexternal particle representations are more pronounced. Table 2 shows the mean frac-tional bias (MFB) of PM and gas species predicted by the internal and external runs at25
6 observation sites within the 4 km domain. The differences in secondary PM compo-
16468

ACPD13, 16457–16494, 2013
Development ofa source oriented
version
H. Zhang et al.
Title Page
Abstract Introduction
Conclusions References
Tables Figures
J I
J I
Back Close
Full Screen / Esc
Printer-friendly Version
Interactive Discussion
Discussion
Paper
|D
iscussionP
aper|
Discussion
Paper
|D
iscussionP
aper|
nents (nitrate, ammonium, and sulfate) and total PM2.5 mass are larger than the differ-ences in primary PM components (elemental carbon and organic carbon). The MFB ofgas-phase CO, NO, and NO2 is qualitatively similar to the performance of primary PMelemental and organic carbon, reflecting the importance of primary emissions in set-ting those gas phase concentrations. Ozone concentrations predicted by the internal5
and source-oriented external models are very similar. Previous studies have demon-strated that local production of ozone is minimal during the cold winter months in theSJV (Brown et al., 2006; Hu et al., 2010; Pun et al., 2009). The majority of the ozonemeasured at the surface is background ozone transported into the study domain bythe significant winds at higher elevations that mixes to the surface when solar radiation10
warms to ground sufficiently to break the nocturnal surface inversion.
5.2 Model representation of aerosols
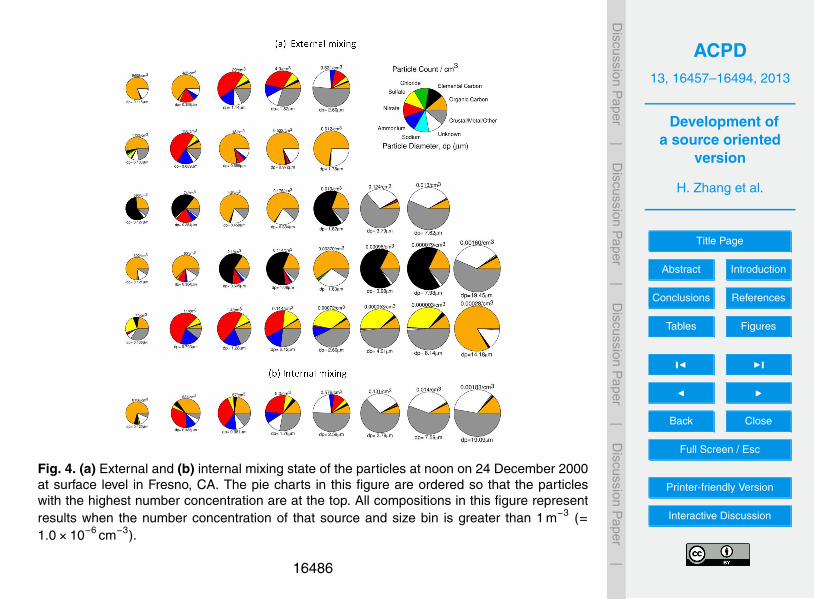
Figure 4 shows the calculated black carbon mixing state of the particles in the externalcase and the internal case at the surface in Fresno, CA at noon on 24 December2000. In Fig. 4a, the external case version of the model predicts that black carbon is15
concentrated in a minor number of total airborne particles. In these particles, blackcarbon accounts for more than 50 % of the total mass with little hygroscopic materialpresent. In Fig. 4b, the internal mixing model predicts that black carbon is distributedevenly across all particles in the atmosphere. This assumption artificially coats blackcarbon with hygroscopic material that alters the optical properties of the particles.20
Figure 5 presents the mass distribution of the internal mixture particle representa-tion as a function of particle diameter at the surface level in Fresno, CA at noon on24 December 2000. Total particle mass has 3 modes between 0.2–0.5 µm, 2–4 µm,and > 10 µm particle diameter. Elemental carbon accounts for only a small fractionof the mass in any size bin. Primary organic carbon dominates the mass at smaller25
particle diameters but plays a minor role at larger particle sizes. Nitrate is the mostabundant secondary component for particles with diameters between 0.15–5 µm, withadditional contributions from ammonium and sulfate.
16469

ACPD13, 16457–16494, 2013
Development ofa source oriented
version
H. Zhang et al.
Title Page
Abstract Introduction
Conclusions References
Tables Figures
J I
J I
Back Close
Full Screen / Esc
Printer-friendly Version
Interactive Discussion
Discussion
Paper
|D
iscussionP
aper|
Discussion
Paper
|D
iscussionP
aper|
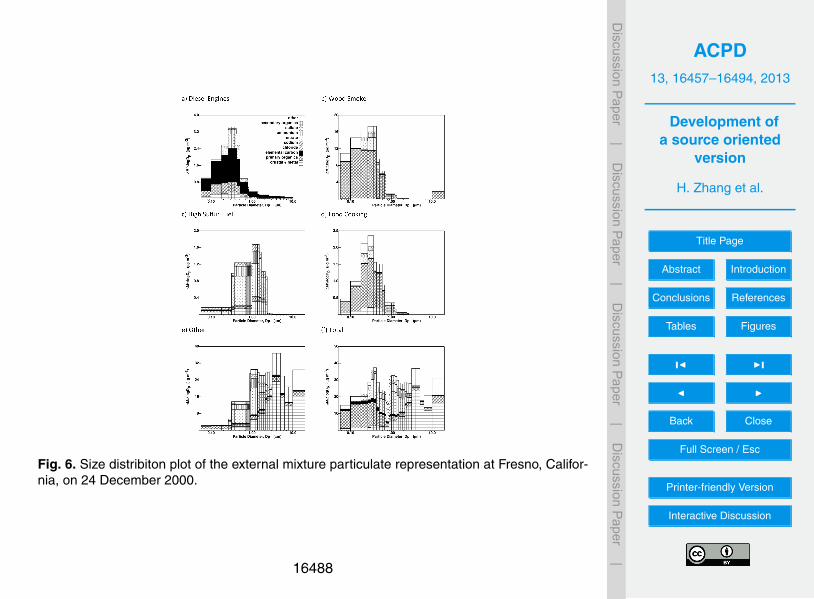
Figure 6 shows the mass distribution as a function of size for particles representedas a source-oriented external mixture on 24 December 2000 (9 days into the simula-tion). Figure 6a shows that the majority of the elemental carbon mass is concentratedin particles emitted from diesel engines. A minor amount of secondary componentssuch as nitrate, sulfate, and ammonium only partitioned onto diesel engine particles5
between 0.15–0.6 µm. The majority of the diesel engine particles do not appear toundergo significant aging through accumulation of secondary coatings. Wood smokeand food cooking particles are other major sources of primary PM that do not attractlarge amounts of secondary coating, similar to diesel engine emissions. The majorityof the secondary coating of ammonium nitrate that forms on the atmospheric aerosol10
is attracted to particles with hygroscopic primary emissions, such as particles emit-ted from the combustion of fuel with high sulfur content, and particles included in the“other sources” category in the current study. Ammonium nitrate condenses onto par-ticles emitted from these sources with a mass mode forming between 0.2–0.6 µm thatis much larger than the primary particle cores that act as the initial condensation site.15
Similar amounts of particulate nitrate are predicted using the source-oriented exter-nal mixture model and the internal mixture model, confirming the findings of previousstudies that the primary particle mixing state does not strongly influence the saturationconcentration product of gas-phase ammonia and nitric acid in the atmosphere (Klee-man and Cass, 2001; Ying et al., 2007; Ying et al., 2008a). The current study clearly20
demonstrates that the primary particle mixing state strongly affects the distribution ofsecondary ammonium nitrate on different particle cores, which in turn can strongly in-fluence the optical properties of the atmosphere. The following sections quantify thefeedback effects on meteorology and the resulting modification of pollutant concentra-tions based on the different treatments of particle mixing state.25
5.3 Meteorological feedback effects
Figure 7 illustrates the aerosol extinction coefficients predicted by the external case anddifferences between external and internal cases. Figure 7a presents the 1 h averaged
16470
ACPD13, 16457–16494, 2013
Development ofa source oriented
version
H. Zhang et al.
Title Page
Abstract Introduction
Conclusions References
Tables Figures
J I
J I
Back Close
Full Screen / Esc
Printer-friendly Version
Interactive Discussion
Discussion
Paper
|D
iscussionP
aper|
Discussion
Paper
|D
iscussionP
aper|
extinction coefficient predicted by external case at noon on 24 December 2000. Thehighest extinction coefficients are 0.83 km−1 in the SJV between Fresno and Bakers-field corresponding to the location with the greatest concentration of secondary ammo-nium nitrate. The difference between the external and internal mixture cases (Fig. 7b)shows that extinction coefficients calculated using the internal particle representation5
are higher than those predicted with the source-oriented external representation inthe SJV. The increased extinction is a consequence of artificially coating diesel en-gine particles with secondary ammonium nitrate and associated water. The differencesbetween the external case and the internal case are as large as −0.22 km−1 near Bak-ersfield.10
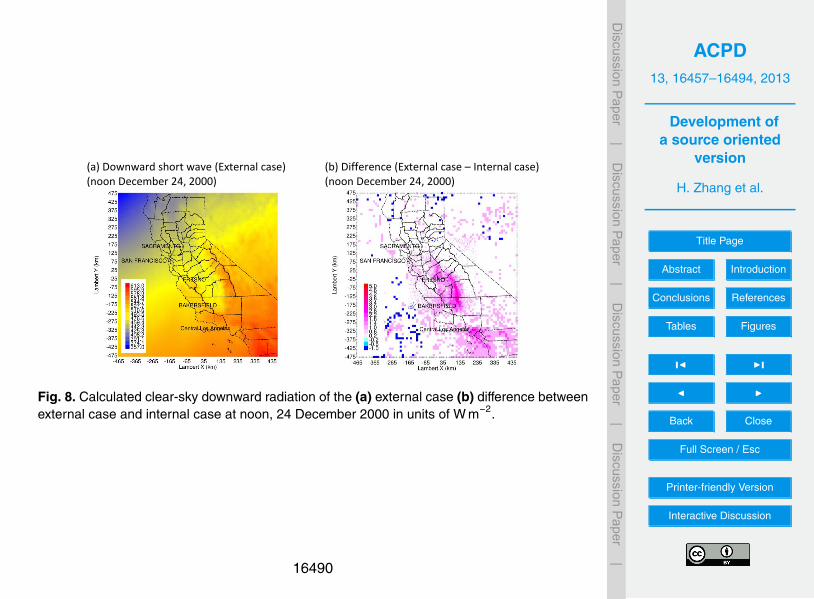
Downward clear-sky (aerosols but no clouds) shortwave radiation flux at the surfaceis the first meteorological variable affected by aerosol optical feedbacks. Figure 8ashows the downward shortwave flux predicted in the external case while Fig. 8b showsthe difference in the concentrations predicted by the internal and external cases. Theexternal case predicted as much as 5 Wm−2 higher short wave flux in SJV relative to15
the internal case (∼ 1 % increase). Although this difference appears to be minor, theeffects on atmospheric temperature structure, wind speed, and mixing may magnify thefeedback effects on pollutant concentrations.
Figure 9 (left column) shows the temperature at 2 m above the surface (T2), windspeed in the x direction at 10 m above the surface (U10) and wind speed in the y20
direction at 10 m above the surface (V10) predicted by external case at noon on 24 De-cember 2000. The right column of Fig. 9 illustrates the difference in the meteorologicalvariables when airborne particles are represented as an internal mixture rather thana source-oriented external mixture. Predicted T2 in the SJV is ∼ 280 K and the maxi-mum difference between the internal and external cases is ∼ 2 K. A coherent pattern of25
increased surface temperature in the external case is apparent in the SJV correspond-ing to the locations where aerosol extinction was reduced relative to the internal case.There are some points outside California where T2 in the external case was lower thanT2 in the internal case. The locations over the ocean where this occurs are influenced
16471

ACPD13, 16457–16494, 2013
Development ofa source oriented
version
H. Zhang et al.
Title Page
Abstract Introduction
Conclusions References
Tables Figures
J I
J I
Back Close
Full Screen / Esc
Printer-friendly Version
Interactive Discussion
Discussion
Paper
|D
iscussionP
aper|
Discussion
Paper
|D
iscussionP
aper|
by changes in sea spray as a result of changes to wind speed. The ∼ 1 % change in T2over the SJV does not fully characterize the magnitude of the redistribution of energyacross the planetary boundary layer. Wind speeds in the SJV predicted in the externaland internal cases differ by ∼ 10 % as shown in Fig. 9d and f. The external case tendsto predict slightly higher U10 and lower V10 in the SJV, with implications for dilution5
and pollutant concentrations.
5.4 Differences in PM concentrations
The source-oriented external mixture representation for airborne particles used in thisstudy has a more realistic representation of particle optical properties and it can alsomechanistically determine the primary particle cores that attract large amounts of sec-10
ondary particulate matter over the entire model domain. Figures 10–12 illustrate thesource-origin of the primary particle cores that are associated with elemental carbon,nitrate and total PM2.5. Since elemental carbon is a primary PM component, Fig. 10illustrates a source apportionment plot. The nitrate and PM2.5 total mass illustrated inFigs. 11 and 12 may have originated as gas-phase emissions from other sources, and15
so these results should not be interpreted as a regional source apportionment map.Readers are referred to the results of previous studies that performed source appor-tionment for all primary and secondary PM components for this information (Ying et al.,2008a; Ying et al., 2008b; Ying et al., 2009).
Figure 10 shows the predicted 24 h averaged PM2.5 elemental carbon concentrations20
on 24 December 2000. Diesel engines dominate the total elemental carbon concen-trations as shown in Fig. 10a. Central LA has highest elemental carbon concentrationwith maximum of 5.51 µgm−3. Elemental carbon concentrations from diesel engineswithin the SJV are ∼ 2–3 µgm−3 with a maximum at Bakersfield. Wood smoke con-tributes ∼ 0.2 µgm−3 of elemental carbon in the SJV while high sulfur fuel combustion25
and food cooking are not significant contributors. Sources not resolved in the source-oriented external mixture contribute ∼ 1 µgm−3 to elemental carbon concentrationsthroughout the SJV and Central LA areas. Figure 10f shows the difference in total
16472
ACPD13, 16457–16494, 2013
Development ofa source oriented
version
H. Zhang et al.
Title Page
Abstract Introduction
Conclusions References
Tables Figures
J I
J I
Back Close
Full Screen / Esc
Printer-friendly Version
Interactive Discussion
Discussion
Paper
|D
iscussionP
aper|
Discussion
Paper
|D
iscussionP
aper|
PM2.5 elemental carbon predicted by external and internal cases. No coherent patterncan be observed in the concentration difference fields, with some localized cells ex-periencing a 0.07 µgm−3 increase in elemental carbon concentrations and some cellsexperiencing a 0.2 µgm−3 decrease. Elemental carbon concentrations peak during thenighttime hours during severe winter stagnation events in the SJV, making the 24 h5
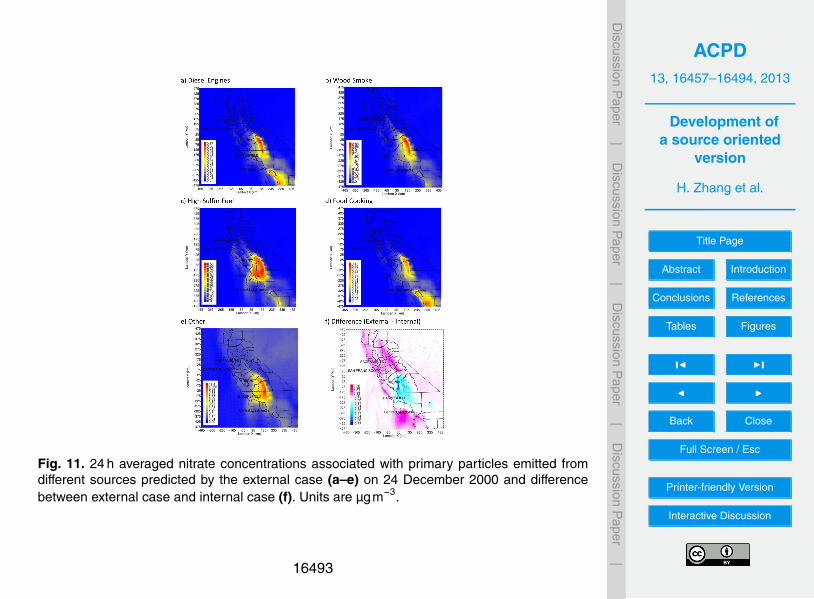
average concentration less susceptible to changes in daytime mixing rates.Figure 11 shows 24 h averaged PM2.5 nitrate concentrations associated with different
primary particle cores on 24 December 2000. The spatial patterns for all particle coresare similar, with high concentrations in the SJV between Fresno and Bakersfield andslightly lower concentrations in southern California (see Fig. 11a–e). On a regional10
basis, particles emitted from diesel engines, food cooking and combustion of high sulfurfuel have similar low amounts of particulate nitrate associated with them. The resultsshown in Fig. 6 illustrated that particles emitted from high sulfur fuel combustion havean affinity for nitrate formation, but these point sources are sparse on a regional scaleand so high sulfur fuel combustion sources do not account for a significant amount of15
nitrate condensation in the SJV. Wood smoke is the most abundant explicit source ofprimary particles that act as a condensation site for nitrate, with a maximum associatednitrate concentration of 2.88 µgm−3 in the SJV. It is apparent from the results shownin Fig. 11 that fresh wood smoke particles emitted in urban centers like Fresno andBakersfield do not account for a significant fraction of these condensation sites, since20
the highest nitrate concentration occur to the east of these cities. Particles emitted fromother sources are the dominant condensation sites for nitrate in the SJV, with maximumvalues as high as 11.4 µgm−3. The differences in total PM2.5 nitrate predicted betweenexternal and internal cases are shown in Fig. 11f. A coherent region of decreasednitrate concentrations is apparent between Fresno and Bakersfield in the SJV, with25
maximum concentration reductions as large as 0.77 µgm−3. A single grid cell in the12 km domain over the city of Barstow also experiences a large reduction in predictednitrate concentrations under the source-oriented external treatment of particles vs. theinternal treatment. It is noteworthy that nitrate concentrations increased in northern
16473

ACPD13, 16457–16494, 2013
Development ofa source oriented
version
H. Zhang et al.
Title Page
Abstract Introduction
Conclusions References
Tables Figures
J I
J I
Back Close
Full Screen / Esc
Printer-friendly Version
Interactive Discussion
Discussion
Paper
|D
iscussionP
aper|
Discussion
Paper
|D
iscussionP
aper|
California and in coastal locations by up to 0.36 µgm−3. These differences reflect theredistribution of solar energy in the atmosphere and the subsequent feedback effectson particle concentrations.
Other primary and secondary PM components in the simulation exhibit similar behav-ior to either elemental carbon (primary) or nitrate (secondary) and thus are not shown.5
Figure 12 sums up all PM components to show total PM2.5mass on 24 December 2000.Contributions from primary and secondary components associated with primary dieselengine particles (Fig. 12a) have a maximum PM2.5 concentration of ∼ 13.6 µgm−3.The highest PM concentrations from diesel engines are found and around major trans-portation corridors. Total PM2.5 concentrations associated with primary particles emit-10
ted from wood combustion have a maximum concentration of 46.1 µgm−3 in the SJVbetween Fresno and Bakersfield, with much lower concentrations apparent in southernCalifornia. Primary particles emitted from combustion of fuel with high sulfur contentalso attracts secondary PM components that contribute significantly to total PM2.5 con-centrations in central California as shown in Fig. 12c. Combustion of jet fuel by two15
air force bases in this region accounts for the majority of these primary particle cores.Total PM2.5 concentrations associated with primary particle cores emitted from foodcooking have a maximum concentration of 6.27 µgm−3. Primary particle cores emittedfrom other un-resolved sources (Fig. 12e) account for the majority of total PM2.5 totalmass because they attract large amounts of secondary ammonium nitrate condensa-20
tion. Maximum PM2.5concentrations associated with material on these primary particlecores reaches 145 µgm−3 in the SJV.
Figure 12f illustrates the difference in total PM2.5 concentrations predicted using thesource-oriented external mixture representation and the internal mixture representa-tion for particles. The 24 h averaged differences in total PM2.5 mass on 24 December25
2000 ranges from −15.0 to 1.4 µgm−3. The largest coherent patterns of differences arereductions in PM2.5 concentrations of 3–7 % between Fresno and Bakersfield in centralSJV when the source-oriented external mixture representation is employed.
16474

ACPD13, 16457–16494, 2013
Development ofa source oriented
version
H. Zhang et al.
Title Page
Abstract Introduction
Conclusions References
Tables Figures
J I
J I
Back Close
Full Screen / Esc
Printer-friendly Version
Interactive Discussion
Discussion
Paper
|D
iscussionP
aper|
Discussion
Paper
|D
iscussionP
aper|
Generally, the source-oriented external mixed representation of the particlespresents a more realistic mixing scenario for elemental carbon compared to internalmixed representations or external mixing representations based on arbitrary rules. Thesource-oriented external case predicts that hydrophobic diesel engine particles remainlargely uncoated during the 9 day simulation, while the internal mixture model predicts5
significant accumulation of secondary nitrate and water on diesel engine particles. Thesource-oriented treatment yields more accurate optical properties that provide more ac-curate feedbacks to meteorological conditions and pollutant concentrations. Althoughthe changes in meteorological parameters are relative small, the effects are magnifiedfor secondary PM concentrations, yielding significant differences in PM2.5 total mass.10
6 Conclusions
A source-oriented The Weather Research & Forecasting (WRF) model with chemistry(SOWC) was created so that airborne particulate matter with different hygroscopic andlight absorption properties could be aged realistically in the atmosphere rather thaninstantaneously combining them into an internal mixture. The SOWC model was used15
to simulate a three-week winter stagnation pollution event in central California as aninitial demonstration of its features. Source oriented calculations were performed for 8particle size fractions ranging from 0.01–10 µm particle diameter with a spatial resolu-tion of 4 km and hourly time resolution. Primary particles emitted from diesel engines,wood smoke, high sulfur combustion, food cooking, and other anthropogenic sources20
were tracked separately throughout the simulation as they aged in the atmosphere.The source-oriented external mixture representation of particles and the internal mix-
ture representation of particles with the WRF model yield different predictions for to-tal particle mass when meteorological feedbacks are considered. The aerosol extinc-tion coefficients, downward shortwave radiation flux, surface temperature, and wind25
fields all respond to the altered optical properties of the atmosphere resulting from thesource-oriented external mixture representation of particles. This in turn affects the
16475

ACPD13, 16457–16494, 2013
Development ofa source oriented
version
H. Zhang et al.
Title Page
Abstract Introduction
Conclusions References
Tables Figures
J I
J I
Back Close
Full Screen / Esc
Printer-friendly Version
Interactive Discussion
Discussion
Paper
|D
iscussionP
aper|
Discussion
Paper
|D
iscussionP
aper|
predicted concentrations of primary and secondary particulate matter. All of these re-sults stem from the mixing state of black carbon in particles within the simulation. Thesource-oriented model predicts that hydrophobic diesel engine particles remain largelyuncoated during the simulation, while the internal mixture model predicts significantaccumulation of secondary nitrate and water on diesel engine particles.5
The SOWC model calculation in this study is arguably the most realistic simulationof primary particle aging over a regional scale with meteorological feedbacks enabledsince it tracks particle mixing states realistically from the emissions source throughthe atmospheric aging calculation. The SOWC model is part of the open source WRFmodel and should enable useful future studies of interactions between air pollution,10
weather and climate. Future work should focus on including warm and cold cloud pro-cesses in the model so that climate-relevant questions can be addressed.
Supplementary material related to this article is available online at:http://www.atmos-chem-phys-discuss.net/13/16457/2013/acpd-13-16457-2013-supplement.pdf.15
Acknowledgement. This study was funded by the United States Environmental ProtectionAgency under Grant No. R833372. Although the research described in the article has beenfunded by the United States Environmental Protection Agency it has not been subject to theAgency’s required peer and policy review and therefore does not necessarily reflect the reviewsof the Agency and no official endorsement should be inferred.20
References
Beaver, M. R., Freedman, M. A., Hasenkopf, C. A., and Tolbert, M. A.: Cooling Enhancement ofAerosol Particles Due to Surfactant Precipitation, J. Phys. Chem. A, 114, 7070–7076, 2010.
16476

ACPD13, 16457–16494, 2013
Development ofa source oriented
version
H. Zhang et al.
Title Page
Abstract Introduction
Conclusions References
Tables Figures
J I
J I
Back Close
Full Screen / Esc
Printer-friendly Version
Interactive Discussion
Discussion
Paper
|D
iscussionP
aper|
Discussion
Paper
|D
iscussionP
aper|
Borge, R., Alexandrov, V., del Vas, J., Lumbreras, J., and Rodríguez, E.: A comprehensivesensitivity analysis of the WRF model for air quality applications over the Iberian Peninsula.Atmos. Environ. 42, 8560–8574, 2008.
Brown, S. G., Hyslop, N. P., Roberts, P. T., McCarthy, M. C., and Lurmann, F. W.: Wintertimevertical variations in Particulate Matter (PM) and precursor concentrations in the San Joaquin5
Valley during the California regional coarse PM/Fine PM Air Quality Study, J. Air Waste Man-age., 56, 1267–1277, 2006.
Chapman, E. G., Gustafson Jr., W. I., Easter, R. C., Barnard, J. C., Ghan, S. J., Pekour, M. S.,and Fast, J. D.: Coupling aerosol-cloud-radiative processes in the WRF-Chem model: In-vestigating the radiative impact of elevated point sources, Atmos. Chem. Phys., 9, 945–964,10
doi:10.5194/acp-9-945-2009, 2009.Chen, S. H., Wang, S. H., and Waylonis, M.: Modification of Saharan air layer and environmental
shear over the eastern Atlantic Ocean by dust-radiation effects, J. Geophys. Res.-Atmos.,115,D21202, doi:10.1029/2010JD014158, 2010.
Chow, J. C., Chen, L. W. A., Watson, J. G., Lowenthal, D. H., Magliano, K. A., Turkiewicz, K.,15
and Lehrman, D. E.: PM2.5 chemical composition and spatiotemporal variability during theCalifornia Regional PM10/PM2.5 Air Quality Study (CRPAQS), J. Geophys. Res.-Atmos., 111,D10S04, doi:10.1029/2005JD006457, 2006.
Fuller, K. A., Malm, W. C., and Kreidenweis, S. M.: Effects of mixing on extinction by carbona-ceous particles, J. Geophys. Res.-Atmos., 104, 15941–15954, 1999.20
Grell, G. A., Peckham, S. E., Schmitz, R., McKeen, S. A., Frost, G., Skamarock, W. C., andEder, B.: Fully coupled “online” chemistry within the WRF model, Atmos. Environ., 39, 6957–6975, 2005.
Held, T., Ying, Q., Kaduwela, A., and Kleeman, M.: Modeling particulate matter in the SanJoaquin Valley with a source-oriented externally mixed three-dimensional photochemical grid25
model, Atmos. Environ., 38, 3689–3711, 2004.Hu, J., Ying, Q., Chen, J., Mahmud, A., Zhao, Z., Chen, S.-H., and Kleeman, M. J.: Particulate
air quality model predictions using prognostic vs. diagnostic meteorology in central California,Atmos. Environ., 44, 215–226, 2010.
Hu, J., Chen, S., Wiedinmyer, C., Vandenberghe, F., Zhang, H., YIng, Q., and Kleeman, M. J.:30
Simulating primary PM2.5 and PM0.1 trace composition for epidemiological studies in Califor-nia, Environ. Sci. Technol., in review, 2013.
16477
ACPD13, 16457–16494, 2013
Development ofa source oriented
version
H. Zhang et al.
Title Page
Abstract Introduction
Conclusions References
Tables Figures
J I
J I
Back Close
Full Screen / Esc
Printer-friendly Version
Interactive Discussion
Discussion
Paper
|D
iscussionP
aper|
Discussion
Paper
|D
iscussionP
aper|
Huang, M., Carmichael, G. R., Adhikary, B., Spak, S. N., Kulkarni, S., Cheng, Y. F., Wei, C.,Tang, Y., Parrish, D. D., Oltmans, S. J., D’Allura, A., Kaduwela, A., Cai, C., Weinheimer, A. J.,Wong, M., Pierce, R. B., Al-Saadi, J. A., Streets, D. G., and Zhang, Q.: Impacts of transportedbackground ozone on California air quality during the ARCTAS-CARB period – a multi-scalemodeling study, Atmos. Chem. Phys., 10, 6947–6968, doi:10.5194/acp-10-6947-2010, 2010.5
Jacobson, M. Z.: Studying the effects of aerosols on vertical photolysis rate coefficient andtemperature profiles over an urban airshed. J. Geophys. Res.-Atmos., 103, 10593–10604,1998.
Jacobson, M. Z.: Strong radiative heating due to the mixing state of black carbon in atmosphericaerosols, Nature, 409, 695–697, 2001.10
Jacobson, M. Z.: A solution to the problem of nonequilibrium acid/base gas-particle transfer atlong time step, Aerosol. Sci. Tech., 39, 92–103, 2005.
Kleeman, M. J. and Cass, G. R.: Source contributions to the size and composition distributionof urban particulate air pollution, Atmos. Environ., 32, 2803–2816, 1998.
Kleeman, M. J. and Cass, G. R.: A 3D Eulerian source-oriented model for an externally mixed15
aerosol, Environ. Sci. Technol., 35, 4834–4848, 2001.Kleeman, M. J., Cass, G. R., and Eldering, A.: Modeling the airborne particle complex as
a source-oriented external mixture, J. Geophys. Res., 102, 21355–21372, 1997.Lesins, G., Chylek, P., and Lohmann, U.: A study of internal and external mixing scenarios and
its effect on aerosol optical properties and direct radiative forcing, J. Geophys. Res., 107,20
4094, doi:10.1029/2001JD000973, 2002.Mallet, M., Roger, J. C., Despiau, S., Putaud, J. P., and Dubovik, O.: A study of the
mixing state of black carbon in urban zone, J. Geophys. Res.-Atmos., 109, D04202,doi:10.1029/2003JD003940, 2004.
Mogo, S., Cachorro, V. E., Lopez, J. F., Montilla, E., Torres, B., Rodríguez, E., Bennouna, Y.,25
and de Frutos, A. M.: In situ measurements of aerosol optical properties and number sizedistributions in a coastal region of Norway during the summer of 2008, Atmos. Chem. Phys.,12, 5841–5857, doi:10.5194/acp-12-5841-2012, 2012.
Ostro, B. and Chestnut, L.: Assessing the health benefits of reducing particulate matter airpollution in the United States, Environ. Res., 76, 94–106, 1998.30
Ostro, B., Broadwin, R., Green, S., Feng, W. Y., and Lipsett, M.: Fine particulate air pollutionand mortality in nine California counties: results from CALFINE, Environ. Health Persp., 114,29–33, 2006.
16478
ACPD13, 16457–16494, 2013
Development ofa source oriented
version
H. Zhang et al.
Title Page
Abstract Introduction
Conclusions References
Tables Figures
J I
J I
Back Close
Full Screen / Esc
Printer-friendly Version
Interactive Discussion
Discussion
Paper
|D
iscussionP
aper|
Discussion
Paper
|D
iscussionP
aper|
Pleim, J. E.: A combined local and nonlocal closure model for the atmospheric boundary layer.Part I: Model description and testing, J Appl. Meteorol. Clim., 46, 1383–1395, 2007.
Pun, B. K., Balmori, R. T. F., and Seigneur, C.: Modeling wintertime particulate matter formationin central California, Atmos. Environ., 43, 402–409, 2009.
Stelson, A. W.: Urban aerosol refractive index prediction by partial molar refraction approach,5
Environ. Sci. Technol., 24, 1676–1679, 1990.Stokes, R. H. and Robinson, R. A.: Interactions in aqueous nonelectrolyte solutions, I. Solute-
solvent equilibria, J. Phys. Chem., 70, 2126–2131, 1966.Toon, O. B. and Ackerman, T. P.: Algorithms for the calculation of scattering by stratified
spheres, Appl. Optics, 20, 3657–3660, 1981.10
Woodruff, T. J., Parker, J. D., and Schoendorf, K. C.: Fine particulate matter (PM2.5) air pollutionand selected causes of postneonatal infant mortality in California, Environ. Health Persp.,114, 786–790, 2006.
Ying, Q. and Kleeman, M. J.: Effects of aerosol UV extinction on the formation of ozone andsecondary particulate matter, Atmos. Environ., 37, 5047–5068, 2003.15
Ying, Q. and Kleeman, M.: Regional contributions to airborne particulate matter in central Cali-fornia during a severe pollution episode, Atmos. Environ., 43, 1218–1228, 2009.
Ying, Q., Fraser, M. P., Griffin, R. J., Chen, J. J., and Kleeman, M. J.: Verification of a source-oriented externally mixed air quality model during a severe photochemical smog episode,Atmos. Environ., 41, 1521–1538, 2007.20
Ying, Q., Lu, J., Allen, P., Livingstone, P., Kaduwela, A., and Kleeman, M. J.: Modeling air qualityduring the California Regional PM10/PM2.5 Air Quality Study (CRPAQS) using the UCD/CITsource-oriented air quality model – Part I. Base case model results, Atmos. Environ., 42,8954–8966, 2008a.
Ying, Q., Lu, J., Kaduwela, A., and Kleeman, M.: Modeling air quality during the California25
Regional PM10/PM2.5 Air Quality Study (CPRAQS) using the UCD/CIT Source Oriented AirQuality Model – Part II. Regional source apportionment of primary airborne particulate mat-ter, Atmos. Environ., 42, 8967–8978, 2008b.
Ying, Q., Lu, J., and Kleeman, M. J.: Modeling air quality during the California RegionalPM10/PM2.5 Air Quality Study (CRPAQS) using the UCD/CIT sourceoriented air quality model30
– Part III. Regional source apportionment of secondary and total airborne particulate matter,Atmos. Environ., 43, 419–430, 2009.
16479

ACPD13, 16457–16494, 2013
Development ofa source oriented
version
H. Zhang et al.
Title Page
Abstract Introduction
Conclusions References
Tables Figures
J I
J I
Back Close
Full Screen / Esc
Printer-friendly Version
Interactive Discussion
Discussion
Paper
|D
iscussionP
aper|
Discussion
Paper
|D
iscussionP
aper|
Zaveri, R. A., Easter, R. C., Fast, J. D., and Peters, L. K.: Model for SimulatingAerosol Interactions and Chemistry (MOSAIC), J. Geophys. Res.-Atmos., 113, D13204,doi:10.1029/2007JD008782, 2008.
Zaveri, R. A., Barnard, J. C., Easter, R. C., Riemer, N., and West, M.: Particle-resolved simu-lation of aerosol size, composition, mixing state, and the associated optical and cloud con-5
densation nuclei activation properties in an evolving urban plume, J. Geophys. Res.-Atmos.,115, D17210, doi:10.1029/2009JD013616, 2010.
Zhang, H. and Ying, Q.: Source apportionment of airborne particulate matter in SoutheastTexas using a source-oriented 3D air quality model, Atmos. Environ., 44, 3547–3557, 2010.
Zhang, H. and Ying, Q.: Secondary organic aerosol formation and source apportionment in10
southeast Texas, Atmos. Environ., 45, 3217–3227, 2011.Zhang, H., Li, J., Ying, Q., Yu, J. Z., Wu, D., Cheng, Y., He, K., and Jiang, J.: Source apportion-
ment of PM2.5 nitrate and sulfate in China using a source-oriented chemical transport model,Atmos. Environ., 62, 228–242, 2012.
Zhang, H., Li, J., Ying, Q., Guven, B. B., and Olaguer, E. P.: Source apportionment of formalde-15
hyde during TexAQS 2006 using a source-oriented chemical transport model, J. Geophys.Res.-Atmos., 118, 1525–1535, 2013.
16480

ACPD13, 16457–16494, 2013
Development ofa source oriented
version
H. Zhang et al.
Title Page
Abstract Introduction
Conclusions References
Tables Figures
J I
J I
Back Close
Full Screen / Esc
Printer-friendly Version
Interactive Discussion
Discussion
Paper
|D
iscussionP
aper|
Discussion
Paper
|D
iscussionP
aper|
Table 1. Statistics of meteorological parameters predicted by external run and internal run forat all observation sites within 4 km domain. RMSE and MAE are the root mean squared errorand the mean absolute error, respectively.
Mean RMSE MAE
Temperature Obs. 8.05External 8.67 3.08 2.39Internal 8.67 3.09 2.39
RH Obs. 69.94External 49.99 29.57 24.69Internal 50.13 29.52 24.63
U wind Obs. 1.03External 1.41 1.57 1.06Internal 1.41 1.57 1.06
V wind Obs. 1.08External 1.51 1.81 1.19Internal 1.51 1.81 1.19
16481

ACPD13, 16457–16494, 2013
Development ofa source oriented
version
H. Zhang et al.
Title Page
Abstract Introduction
Conclusions References
Tables Figures
J I
J I
Back Close
Full Screen / Esc
Printer-friendly Version
Interactive Discussion
Discussion
Paper
|D
iscussionP
aper|
Discussion
Paper
|D
iscussionP
aper|
Table 2. Mean fractional biases of PM and gas species predicted by external run and internalrun at 6 observation sites within 4 km domain.
SITE ANGI BAC BTI FSF SDP M14
PM2.5 External 0.11 −0.67 −0.07 0.09 −0.03 –
Internal 0.25 −0.51 −0.08 0.17 −0.04 –
N(V) External −0.15 −0.92 0.22 −0.69 −0.47 −0.81Internal −0.11 −0.76 0.37 −0.56 −0.4 −0.62
NH4 External −1.34 −1.1 −0.26 −1.3 −0.5 −0.9Internal −1.38 −0.94 −0.08 −1.26 −0.5 −0.76
S(VI) External −0.38 −0.8 0.32 0.03 −0.04 −0.36Internal −0.34 −0.74 0.33 0.02 −0.04 −0.39
EC External 0.33 −0.9 −0.04 −0.31 0.32 0.33Internal 0.39 −0.86 −0.08 −0.24 0.32 0.3
OC External −0.21 −1.01 −0.39 −0.2 −0.26 −0.54Internal −0.28 −1 −0.46 −0.18 −0.64 −0.64
O3 External −1.19 −0.73 −0.85 −1.41 −0.33 −1Internal −1.19 −0.72 −0.84 −1.41 −0.31 −1
CO External – −0.34 −0.03 −0.21 −0.02 −0.29Internal – −0.3 0.03 −0.15 0.02 −0.24
NO External −0.04 −0.76 −0.3 −0.08 −0.56 −0.85Internal 0.03 −0.74 −0.25 −0.04 −0.53 −0.81
NO2 External 0.79 −0.49 −0.49 −0.36 −0.13 −0.39Internal 0.82 −0.45 −0.45 −0.32 −0.1 −0.36
16482
ACPD13, 16457–16494, 2013
Development ofa source oriented
version
H. Zhang et al.
Title Page
Abstract Introduction
Conclusions References
Tables Figures
J I
J I
Back Close
Full Screen / Esc
Printer-friendly Version
Interactive Discussion
Discussion
Paper
|D
iscussionP
aper|
Discussion
Paper
|D
iscussionP
aper|
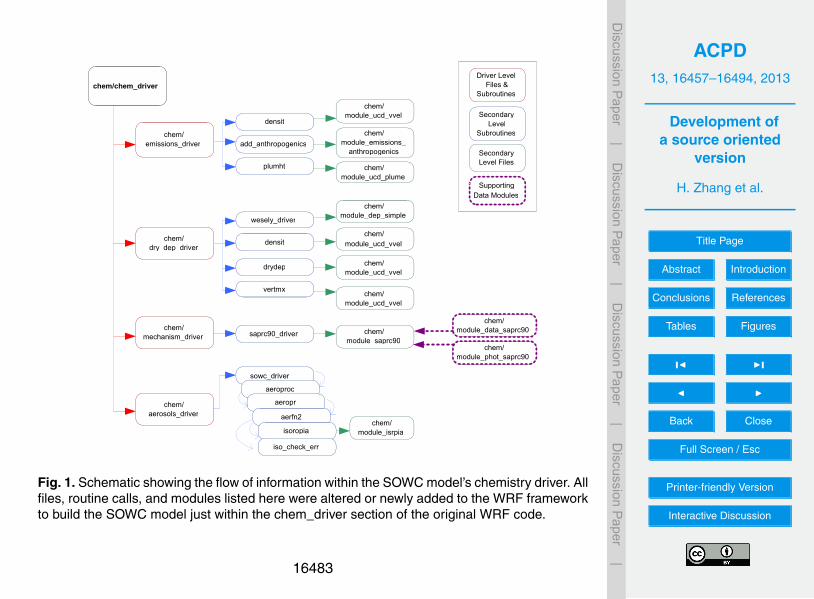
Figure 1. Schematic showing the flow of information within the SOWC model’s chemistry
driver. All files, routine calls, and modules listed here were altered or newly added to the WRF framework to build the SOWC model just within the chem_driver section of the original WRF code.
chem/chem_driver
chem/ emissions_driver
chem/ dry_dep_driver
chem/ mechanism_driver
chem/ aerosols_driver
densit
add_anthropogenics
plumht
chem/ module_emissions_
anthropogenics chem/
module_ucd_plume
chem/ module_ucd_vvel
densit
drydep
vertmx
wesely_driver chem/
module_dep_simple chem/
module_ucd_vvel chem/
module_ucd_vvel
chem/ module_ucd_vvel
saprc90_driver chem/ module_saprc90
chem/ module_phot_saprc90
chem/ module_data_saprc90
sowc_driver aeroproc
aeropr aerfn2 isoropia chem/
module_isrpia iso_check_err
Driver Level Files &
Subroutines
Secondary Level
Subroutines
Secondary Level Files
Supporting Data Modules
Fig. 1. Schematic showing the flow of information within the SOWC model’s chemistry driver. Allfiles, routine calls, and modules listed here were altered or newly added to the WRF frameworkto build the SOWC model just within the chem_driver section of the original WRF code.
16483

ACPD13, 16457–16494, 2013
Development ofa source oriented
version
H. Zhang et al.
Title Page
Abstract Introduction
Conclusions References
Tables Figures
J I
J I
Back Close
Full Screen / Esc
Printer-friendly Version
Interactive Discussion
Discussion
Paper
|D
iscussionP
aper|
Discussion
Paper
|D
iscussionP
aper|
Fig. 2. Schematic showing the flow of information within the SOWC model’s dynamic-Eulerianmass conservation core. All files, routine calls, and modules listed here were altered or newlyadded to the WRF framework to build the SOWC model just within the dynamic driver sectionof the original WRF code.
16484

ACPD13, 16457–16494, 2013
Development ofa source oriented
version
H. Zhang et al.
Title Page
Abstract Introduction
Conclusions References
Tables Figures
J I
J I
Back Close
Full Screen / Esc
Printer-friendly Version
Interactive Discussion
Discussion
Paper
|D
iscussionP
aper|
Discussion
Paper
|D
iscussionP
aper|
Figure 3. Relative configuration of the nested WRF computation domains. The 4km domain
illustrated by the rectangle box covers Central Jauqion Valley.
Fig. 3. Relative configuration of the nested WRF computation domains. The 4 km domain illus-trated by the rectangle box covers Central Valley.
16485
ACPD13, 16457–16494, 2013
Development ofa source oriented
version
H. Zhang et al.
Title Page
Abstract Introduction
Conclusions References
Tables Figures
J I
J I
Back Close
Full Screen / Esc
Printer-friendly Version
Interactive Discussion
Discussion
Paper
|D
iscussionP
aper|
Discussion
Paper
|D
iscussionP
aper|
Fig. 4. (a) External and (b) internal mixing state of the particles at noon on 24 December 2000at surface level in Fresno, CA. The pie charts in this figure are ordered so that the particleswith the highest number concentration are at the top. All compositions in this figure representresults when the number concentration of that source and size bin is greater than 1 m−3 (=1.0×10⁻⁶ cm−3).
16486

ACPD13, 16457–16494, 2013
Development ofa source oriented
version
H. Zhang et al.
Title Page
Abstract Introduction
Conclusions References
Tables Figures
J I
J I
Back Close
Full Screen / Esc
Printer-friendly Version
Interactive Discussion
Discussion
Paper
|D
iscussionP
aper|
Discussion
Paper
|D
iscussionP
aper|
Figure 5. Size distribution plot of the internal mixture particulate representation. Detailed composition information across lognormal particle diameter at noon on December 24, 2000 in Fresno, California.
Fig. 5. Size distribution plot of the internal mixture particulate representation at Fresno, Califor-nia.
16487
ACPD13, 16457–16494, 2013
Development ofa source oriented
version
H. Zhang et al.
Title Page
Abstract Introduction
Conclusions References
Tables Figures
J I
J I
Back Close
Full Screen / Esc
Printer-friendly Version
Interactive Discussion
Discussion
Paper
|D
iscussionP
aper|
Discussion
Paper
|D
iscussionP
aper|
Fig. 6. Size distribiton plot of the external mixture particulate representation at Fresno, Califor-nia, on 24 December 2000.
16488

ACPD13, 16457–16494, 2013
Development ofa source oriented
version
H. Zhang et al.
Title Page
Abstract Introduction
Conclusions References
Tables Figures
J I
J I
Back Close
Full Screen / Esc
Printer-friendly Version
Interactive Discussion
Discussion
Paper
|D
iscussionP
aper|
Discussion
Paper
|D
iscussionP
aper|
Fig. 7. (a) Calculated extinction coefficient at noon, 24 December 2000 of the external caseand (b) difference between the external and internal case in units of km−1
16489
ACPD13, 16457–16494, 2013
Development ofa source oriented
version
H. Zhang et al.
Title Page
Abstract Introduction
Conclusions References
Tables Figures
J I
J I
Back Close
Full Screen / Esc
Printer-friendly Version
Interactive Discussion
Discussion
Paper
|D
iscussionP
aper|
Discussion
Paper
|D
iscussionP
aper|
(a) Downward short wave (External case) (noon December 24, 2000)
(b) Difference (External case – Internal case) (noon December 24, 2000)
Fig. 8. Calculated clear-sky downward radiation of the (a) external case (b) difference betweenexternal case and internal case at noon, 24 December 2000 in units of W m−2.
16490

ACPD13, 16457–16494, 2013
Development ofa source oriented
version
H. Zhang et al.
Title Page
Abstract Introduction
Conclusions References
Tables Figures
J I
J I
Back Close
Full Screen / Esc
Printer-friendly Version
Interactive Discussion
Discussion
Paper
|D
iscussionP
aper|
Discussion
Paper
|D
iscussionP
aper|
Fig. 9. Calculated T2 (K), U10 (ms−1) and V10 (ms−1) by external case (a, c, and e) at noon,24 December 2000 and the differences between external case and internal case (b, d, and f).
16491

ACPD13, 16457–16494, 2013
Development ofa source oriented
version
H. Zhang et al.
Title Page
Abstract Introduction
Conclusions References
Tables Figures
J I
J I
Back Close
Full Screen / Esc
Printer-friendly Version
Interactive Discussion
Discussion
Paper
|D
iscussionP
aper|
Discussion
Paper
|D
iscussionP
aper|
Fig. 10. 24 h averaged elemental carbon concentrations associated with primary particles emit-ted from different sources predicted by external case (a–e) on 24 December 2000 and differ-ence between external case and internal case (f). Units are µgm−3.
16492
ACPD13, 16457–16494, 2013
Development ofa source oriented
version
H. Zhang et al.
Title Page
Abstract Introduction
Conclusions References
Tables Figures
J I
J I
Back Close
Full Screen / Esc
Printer-friendly Version
Interactive Discussion
Discussion
Paper
|D
iscussionP
aper|
Discussion
Paper
|D
iscussionP
aper|
Fig. 11. 24 h averaged nitrate concentrations associated with primary particles emitted fromdifferent sources predicted by the external case (a–e) on 24 December 2000 and differencebetween external case and internal case (f). Units are µgm−3.
16493

ACPD13, 16457–16494, 2013
Development ofa source oriented
version
H. Zhang et al.
Title Page
Abstract Introduction
Conclusions References
Tables Figures
J I
J I
Back Close
Full Screen / Esc
Printer-friendly Version
Interactive Discussion
Discussion
Paper
|D
iscussionP
aper|
Discussion
Paper
|D
iscussionP
aper|
Fig. 12. 24 h averaged PM2.5 concentrations associated with primary particles emitted fromdifferent sources predicted by the external case (a–e) on 24 December 2000 and differencebetween external case and internal case (f). Units are µgm−3.
16494