Benefit Monitoring and Evaluation (Mphil Lecture Notes, Tribhuvan University)
Upload
khangminh22Category
view
2download
0
Development of a Monitoring and Evaluation
Framework for sustainability assessment of
Microtransit systems
by
Reinhart Buenk
Dissertation presented for the degree of
Doctor of Philosophy in Industrial Engineering in the
Faculty of Engineering at
Stellenbosch University
Supervisor: Prof SS Grobbelaar
March 2020

Stellenbosch University https://scholar.sun.ac.za

i
Declaration
By submitting this dissertation electronically, I declare that the entirety of the work contained therein
is my own, original work, that I am the sole author thereof (save to the extent explicitly otherwise
stated), that reproduction and publication thereof by Stellenbosch University will not infringe any
third-party rights and that I have not previously in its entirety or in part submitted it for obtaining any
qualification.
March 2020
Copyright © 2020 Stellenbosch University
All rights reserved
Stellenbosch University https://scholar.sun.ac.za
ii
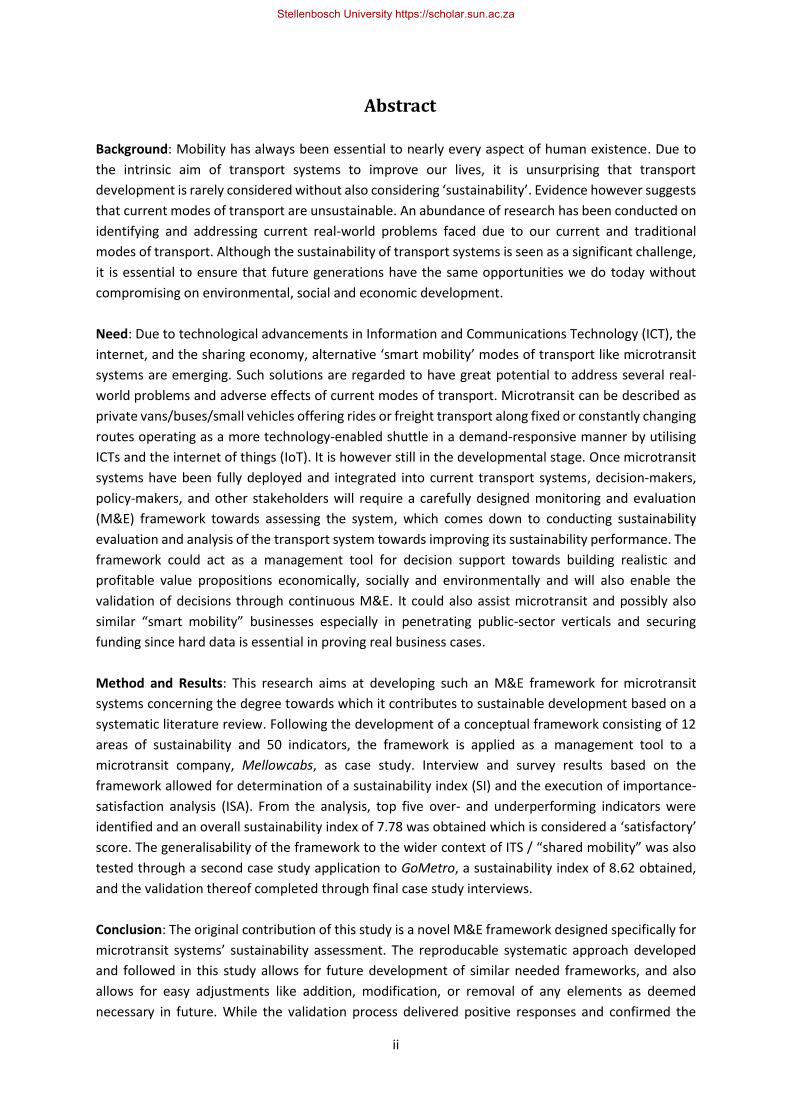
Abstract
Background: Mobility has always been essential to nearly every aspect of human existence. Due to
the intrinsic aim of transport systems to improve our lives, it is unsurprising that transport
development is rarely considered without also considering ‘sustainability’. Evidence however suggests
that current modes of transport are unsustainable. An abundance of research has been conducted on
identifying and addressing current real-world problems faced due to our current and traditional
modes of transport. Although the sustainability of transport systems is seen as a significant challenge,
it is essential to ensure that future generations have the same opportunities we do today without
compromising on environmental, social and economic development.
Need: Due to technological advancements in Information and Communications Technology (ICT), the
internet, and the sharing economy, alternative ‘smart mobility’ modes of transport like microtransit
systems are emerging. Such solutions are regarded to have great potential to address several real-
world problems and adverse effects of current modes of transport. Microtransit can be described as
private vans/buses/small vehicles offering rides or freight transport along fixed or constantly changing
routes operating as a more technology-enabled shuttle in a demand-responsive manner by utilising
ICTs and the internet of things (IoT). It is however still in the developmental stage. Once microtransit
systems have been fully deployed and integrated into current transport systems, decision-makers,
policy-makers, and other stakeholders will require a carefully designed monitoring and evaluation
(M&E) framework towards assessing the system, which comes down to conducting sustainability
evaluation and analysis of the transport system towards improving its sustainability performance. The
framework could act as a management tool for decision support towards building realistic and
profitable value propositions economically, socially and environmentally and will also enable the
validation of decisions through continuous M&E. It could also assist microtransit and possibly also
similar “smart mobility” businesses especially in penetrating public-sector verticals and securing
funding since hard data is essential in proving real business cases.
Method and Results: This research aims at developing such an M&E framework for microtransit
systems concerning the degree towards which it contributes to sustainable development based on a
systematic literature review. Following the development of a conceptual framework consisting of 12
areas of sustainability and 50 indicators, the framework is applied as a management tool to a
microtransit company, Mellowcabs, as case study. Interview and survey results based on the
framework allowed for determination of a sustainability index (SI) and the execution of importance-
satisfaction analysis (ISA). From the analysis, top five over- and underperforming indicators were
identified and an overall sustainability index of 7.78 was obtained which is considered a ‘satisfactory’
score. The generalisability of the framework to the wider context of ITS / “shared mobility” was also
tested through a second case study application to GoMetro, a sustainability index of 8.62 obtained,
and the validation thereof completed through final case study interviews.
Conclusion: The original contribution of this study is a novel M&E framework designed specifically for
microtransit systems’ sustainability assessment. The reproducable systematic approach developed
and followed in this study allows for future development of similar needed frameworks, and also
allows for easy adjustments like addition, modification, or removal of any elements as deemed
necessary in future. While the validation process delivered positive responses and confirmed the
Stellenbosch University https://scholar.sun.ac.za

iii
efficiency, effectiveness, applicability, and validity of the tool, complete implementation of the tool
on a microtransit system (once it has been fully deployed) could give rise to new issues that should be
addressed in future. In the short term, results would assist in decision-making especially in the
production-process. Its usefulness should also become apparent in the long-term as its overall goals
are achieved through continuous monitoring and conducting regular evaluations.
Stellenbosch University https://scholar.sun.ac.za
iv
Opsomming
Agtergrond: Mobiliteit is noodsaaklik vir byna elke aspek van die menslike bestaan. As gevolg van die
inherente doel van vervoerstelsels om ons lewens te verbeter, is dit geen verrassing dat
vervoerontwikkeling selde oorweeg word sonder om ook 'volhoubaarheid' in ag te neem nie. Bewyse
dui egter daarop dat huidige vervoerwyses onvolhoubaar is. 'n Groot hoeveelheid navorsing is reeds
gedoen om huidige regte-wêreld faktore te ondersoek wat te make mag hê met huidige en
tradisionele vervoermiddele. Alhoewel die volhoubaarheid van vervoerstelsels as 'n beduidende
uitdaging gesien word, is dit noodsaaklik om te verseker dat toekomstige generasies dieselfde
geleenthede as wat ons tans geniet, sonder om omgewings-, sosiale en ekonomiese ontwikkeling in
die gedrang te bring.
Behoefte: As gevolg van tegnologiese vooruitgang in inligting- en kommunikasietegnologie (IKT), die
internet en die deel-ekonomie word alternatiewe maniere om 'slim mobiliteit' soos
mikrotransitostelsels ontwikkel. Sulke oplossings beskik oor die potensiaal om verskeie probleme in
die wêreld aan te spreek soos nadelige gevolge van die huidige vervoersisteme. Microtransit kan
beskryf word as privaat klein-bus voertuie wat ritte of vragvervoer aanbied op vaste of veranderlike
roetes wat op 'n vraggerigte manier, 'n meer tegnologiese pendelbasis gebruik word deur gebruik te
maak van IKT's en die internet van die dinge (IvD). Dit is egter nog in die ontwikkelingsfase. Sodra
mikrotransitostelsels ten volle ontplooi en geïntegreer is in die huidige vervoerstelsels, sal
besluitnemers, beleidmakers en ander belanghebbendes 'n sorgvuldig ontwerpte raamwerk vir
monitering en evaluering (M&E) benodig vir die beoordeling van die stelsel, wat neerkom op die
uitvoering van volhoubaarheidsevaluering en ontleding van die vervoerstelsel om
volhoubaarheidsprestasie te verbeter. Die raamwerk kan dien as 'n instrument vir
besluitnemingsondersteuning vir die opbou van realistiese en winsgewende ekonomies-, sosiaal- en
omgewings-waardeproposisies en sal ook die bekragtiging van besluite deur middel van deurlopende
M&E moontlik maak. Dit kan ook mikrotransit en moontlik ook soortgelyke "slim mobiliteit"-
ondernemings help, veral met die penetrasie van vertikale in die openbare sektor en die verkryging
van geld, aangesien harde data noodsaaklik is vir die bewys van besigheidsake.
Metode en resultate: Hierdie navorsingstesis is gemik daarop om, op grond van 'n sistematiese
literatuuroorsig, 'n M&E-raamwerk vir mikrotransitosisteme te ontwikkel rakende die mate waartoe
dit bydra tot volhoubare ontwikkeling. Na die ontwikkeling van 'n konseptuele raamwerk bestaande
uit 12 volhoubaarheidsareas en 50 indikatore, word die raamwerk as 'n gevallestudie as 'n
bestuursinstrument op 'n mikrotransitonderneming, Mellowcabs, toegepas. Resultate van
onderhoude en opnames gebaseer op die raamwerk dra by tot die bepaling van 'n
volhoubaarheidsindeks (SI) en die uitvoering van 'n belangrikheidsbevrediging-analise (ISA). Uit die
analise is die top vyf oor-en-onderpresterende indikatore geïdentifiseer en is 'n algehele
volhoubaarheidsindeks van 7.78 verkry, wat as 'n 'bevredigende' telling beskou word. Die
veralgemeenbaarheid van die raamwerk vir die wyer konteks van Intelligente Transitosisteme (ITS) /
Gedeeldemobiliteit is ook getoets deur 'n tweede gevallestudie te voltooi, deur GoMetro, en 'n
volhoubaarheidsindeks van 8.62 is behaal. Die validering van die raamwerk is voltooi deur middel van
finale gevallestudieonderhoude.
Stellenbosch University https://scholar.sun.ac.za
v
Gevolgtrekking: Die oorspronklike bydrae van hierdie studie is 'n nuwe M&E-raamwerk wat spesifiek
ontwerp is vir die volhoubaarheidsbeoordeling van mikrotranitosisteme. Die herhaalbare sistematiese
benadering wat in hierdie studie ontwikkel en gebruik is, maak voorsiening vir toekomstige
ontwikkeling van soortgelyke benodigde raamwerke, en is ontwerp om maklik aanpasbaar te wees
ten opsigte van byvoeging, wysiging of verwydering van enige elemente wat in die toekoms mag
benodig word. Terwyl die valideringsproses positiewe reaksies gelewer het en die doeltreffendheid,
toepaslikheid en geldigheid van die instrument bevestig het, kan die volledige implementering van die
instrument op 'n mikrotransitostelsel (sodra dit ten volle ontplooi is) aanleiding gee tot nuwe
probleme wat aandag moet vereis in die toekoms. Op die kort termyn sal resultate help met die
besluitneming, veral in die produksieproses. Die bruikbaarheid daarvan moet ook op die langtermyn
ondersoek word, aangesien die algemene doelwitte daarvan bereik word deur deurlopende
monitering en gereelde evaluerings.
Stellenbosch University https://scholar.sun.ac.za
vi
Acknowledgements
I would like to express my deepest appreciation to all of the following for their assistance and support
in completing my postgraduate studies:
Foremost, my sincere gratitude to Dr Sara (Saartjie) Grobbelaar for her patience, continuous support
and the difficult questions asked from a perspective of immense knowledge. Your door always stood
open whenever I ran into trouble or required guidance in the right direction.
Secondly, to all expert participants (anonymous) in the interviews and surveys conducted for this
study. I realise how precious your time is and appreciate your patience. Your input was invaluable in
completing this study.
Also, my profound gratitude to my parents for their unconditional love, encouragement, and endless
support both financially and emotionally through all my years of studying. Without you I would not be
the person I am today, and this accomplishment would not have been possible.
Finally, and most importantly, I am grateful towards my Creator and Saviour for the opportunities I
have been granted and the ability and perseverance to complete my studies.
Stellenbosch University https://scholar.sun.ac.za
vii
Table of Contents
Declaration ............................................................................................................................................... i
Abstract ................................................................................................................................................... ii
Opsomming ............................................................................................................................................ iv
Acknowledgements ................................................................................................................................ vi
Table of Contents .................................................................................................................................. vii
List of Figures .......................................................................................................................................... x
List of Tables ......................................................................................................................................... xii
List of Acronyms and Abbreviations .....................................................................................................xiv
Chapter 1 Introduction ........................................................................................................................ 1
1.1 Background to and Rationale of the research ........................................................................ 1
1.2 Research problem statement, aim, objectives, and outcomes .............................................. 5
1.2.1 Research problem statement ......................................................................................... 5
1.2.2 Research aim, objectives, and outcomes ........................................................................ 6
1.3 Research scope, assumptions, and limitations ....................................................................... 6
1.3.1 Limitations ....................................................................................................................... 7
1.3.2 Delimitations ................................................................................................................... 7
1.4 Ethical implications of the research ........................................................................................ 8
1.5 Report content breakdown ..................................................................................................... 9
Chapter 2 Research Methodologies and Design ................................................................................ 11
2.1 Research Approaches ............................................................................................................ 12
2.1.1 Quantitative vs Qualitative research ............................................................................ 12
2.1.2 Inductive vs Deductive research ................................................................................... 13
2.2 Research Strategy ................................................................................................................. 15
2.2.1 Grounded Theory Methodology (GTM) ........................................................................ 15
2.3 Research Design .................................................................................................................... 17
2.3.1 Conceptual Literature Studies’ Methodology ............................................................... 17
2.3.2 Systematic Literature Review Methodology ................................................................. 17
2.4 Research Plan ........................................................................................................................ 22
2.5 Chapter 2: Summary of Research Strategy and Design ........................................................ 22
Chapter 3 A Conceptual Review of Microtransit Systems ................................................................. 23
3.1 Sustainability ......................................................................................................................... 24
3.1.1 Defining sustainability/sustainable development ........................................................ 24
3.1.2 Sustainable transport systems ...................................................................................... 24
3.1.3 Towards a framework for transport sustainability evaluation ..................................... 27
3.2 Microtransit and shared mobility within the sharing economy ........................................... 28
3.2.1 Shared mobility and the sharing economy ................................................................... 28
3.2.2 Defining Microtransit .................................................................................................... 30
3.2.3 SWOT Analysis of Microtransit ..................................................................................... 34
3.3 Chapter 3: Conclusion ........................................................................................................... 35
Chapter 4 A Conceptual Review of Monitoring and Evaluation ........................................................ 37
4.1 A brief history of Evaluation ................................................................................................. 38
4.2 Intervention Logic (Logic Model) .......................................................................................... 39
4.3 Evaluation ............................................................................................................................. 45
Stellenbosch University https://scholar.sun.ac.za
viii
4.3.1 Defining Evaluation ....................................................................................................... 45
4.3.2 Purposes of Evaluation.................................................................................................. 51
4.3.3 Evaluation theories (approaches) and main paradigms ............................................... 53
4.4 Monitoring ............................................................................................................................ 62
4.4.1 Defining Monitoring ...................................................................................................... 62
4.4.2 Monitoring types ........................................................................................................... 63
4.4.3 Differences between monitoring and evaluation ......................................................... 63
4.5 Monitoring & Evaluation (M&E) ........................................................................................... 64
4.6 Towards developing a sustainability M&E framework for Microtransit systems ................. 65
4.7 Chapter 4: Conclusion ........................................................................................................... 65
Chapter 5 Conducting the Systematic Comparative Literature Review ............................................ 67
5.1 Stage 2.1 – Scoping and Planning ......................................................................................... 68
5.2 Stage 2.2 – Identification (Searching) ................................................................................... 70
5.3 Stage 2.3 – Extensive reading and Categorisation of data ................................................... 72
5.4 Stage 2.4 – Data Analysis, Results and Interpretation .......................................................... 73
5.4.1 Number of publications per document type ................................................................ 74
5.4.2 Literature publications timeline .................................................................................... 74
5.4.3 Geographic analysis ...................................................................................................... 75
5.4.4 Relevance of publications ............................................................................................. 77
5.4.5 Publications per theme ................................................................................................. 77
5.4.6 Citation count per publication (relevant articles) ......................................................... 80
5.5 Chapter 5: Conclusion ........................................................................................................... 81
Chapter 6 Developing the Microtransit M&E Conceptual Framework ............................................. 83
6.1 Stage 2.3 – Extensive reading and Categorisation of data (continued) ................................ 84
6.2 Stage 2.4 – Data Analysis, Results and Interpretation (continued) ...................................... 84
6.3 Stage 2.5 – Conceptual Framework Development ............................................................... 88
6.4 Chapter 6: Conclusion ......................................................................................................... 105
Chapter 7 Validation of the Microtransit M&E Conceptual Framework ......................................... 107
7.1 Conceptual framework validation methodology ................................................................ 108
7.2 Stage 3.1 – Semi-structured interview ................................................................................ 110
7.3 Stage 3.2 – Indicator-weighting interviews ........................................................................ 115
7.3.1 Weighting: Likert scale method .................................................................................. 116
7.3.2 Weighting: AHP method ............................................................................................. 118
7.3.3 Weighting: EWA Method ............................................................................................ 122
7.3.4 Interview results and analysis ..................................................................................... 122
7.4 Enhanced and weighted conceptual framework ................................................................ 132
7.5 Chapter 7: Conclusion ......................................................................................................... 141
Chapter 8 Case Study Application: Mellowcabs .............................................................................. 144
8.1 Stage 4.1 – Application of the Framework to a Case Study ................................................ 145
8.1.1 Introduction to the Mellowcabs initiative: A Case Study............................................ 145
8.1.2 Performance vs Satisfaction measurement ................................................................ 146
8.1.3 Determining the Sustainability Index (SI).................................................................... 149
8.2 Stage 4.2 – Importance-Satisfaction Analysis (ISA) ............................................................. 151
8.2.1 Using importance ratings for performance/satisfaction aim ..................................... 154
8.2.2 Final ISA results and analysis....................................................................................... 154
Stellenbosch University https://scholar.sun.ac.za

ix
8.3 Stage 3.3 – Case Study Interview ........................................................................................ 161
8.4 Chapter 8: Conclusion ......................................................................................................... 162
Chapter 9 Case Study Application: GoMetro ................................................................................... 164
9.1 Stage 4.1 – Application of the Framework to a Case Study ................................................ 165
9.1.1 Introduction to the GoMetro initiative: A Case Study ................................................ 165
9.1.2 Satisfaction measurement .......................................................................................... 167
9.1.3 Determining the Sustainability Index (SI).................................................................... 169
9.2 Stage 4.2 – Importance-Satisfaction Analysis (ISA) ............................................................. 169
9.2.1 Final ISA results and analysis....................................................................................... 170
9.3 Stage 3.3 – Case Study Interview ........................................................................................ 176
9.4 Chapter 9: Conclusion ......................................................................................................... 178
Chapter 10 Conclusions and Recommendations ........................................................................... 180
10.1 Stage 5.1 – Conclusions ....................................................................................................... 181
10.1.1 Comparing the two case studies ................................................................................. 181
10.1.2 Overview summary of research parts ......................................................................... 185
10.1.3 Reaching the research objectives ............................................................................... 188
10.1.4 Distinctive contributions and implications of this research ....................................... 190
10.1.5 Critical reflection ......................................................................................................... 191
10.1.6 Limitations of this research: Reiteration and reflection ............................................. 192
10.2 Stage 5.2 – Recommendations ........................................................................................... 193
10.2.1 Recommendations to stakeholders concerning tool application ............................... 193
10.2.2 Recommendations to researchers for future work .................................................... 194
References .......................................................................................................................................... 195
Appendix A – Final set of relevant articles for SLR ............................................................................. 209
Appendix B – Data analysis of relevant articles .................................................................................. 216
Appendix C – Approach analysis of relevant articles .......................................................................... 225
Appendix D – Interviews ..................................................................................................................... 227
Appendix D1 – Written consent letter ............................................................................................ 227
Appendix D2 – Semi-structured Expert Interview Guide ................................................................ 231
Appendix D3 – Expert interview: Indicator-weighting survey ........................................................ 238
Appendix E – Summary of final results for each domain .................................................................... 243
Stellenbosch University https://scholar.sun.ac.za
x
List of Figures
Figure 2-1 Deductive reasoning approach ("Top-down") (Adapted from (Trochim 2006)) ................. 14
Figure 2-2 Inductive reasoning approach ("Bottom-up") (Adapted from (Trochim 2006)) ................. 14
Figure 2-3 Research strategy types (Adapted from (Datt, 2016)) ........................................................ 15
Figure 2-4 Overview of GTM process .................................................................................................... 16
Figure 2-5 Foundation for research design methodologies .................................................................. 16
Figure 2-6 Conceptual literature studies' methodology ....................................................................... 17
Figure 2-7 Systematic comparative literature review methodology .................................................... 21
Figure 2-8 Conceptual framework development methodology ........................................................... 21
Figure 2-9 Research Plan ....................................................................................................................... 22
Figure 3-1 Illustration of the overlapping fundamental spheres of sustainability (Adapted from:
(Zuidgeest et al. 2000; Litman 2016)) ................................................................................................... 26
Figure 3-2 Key Areas of Shared Mobility (Adapted from: (Shaheen et al. 2015)) ................................ 29
Figure 3-3 The continuum of shared transport (Source: (Cheyne & Imran 2016)) ............................... 30
Figure 3-4 Graphical depiction of Microtransit systems (Source: (Bos 2015)) ..................................... 31
Figure 3-5 A Ford van used by Chariot (Source: (LeFebvre 2017)) ....................................................... 32
Figure 3-6 A van used by Bridj in Washington, DC (Source: (Zimbabwe 2015)) ................................... 32
Figure 4-1 The logic of interventions (Adapted from: (ENRD 2014)) .................................................... 40
Figure 4-2 Hierarchical logic of the objectives of the LFA (Source: (Umhlaba Development Services
2011)) .................................................................................................................................................... 42
Figure 4-3 The 6 steps of Intervention Mapping (Source: Bartholomew et al. (2016)) ........................ 43
Figure 4-4 Evaluation throughout intervention logic (Adapted from: (Puoane 2010)) ........................ 44
Figure 4-5 Evaluation approaches during different life stages of an initiative (Source: (Patton 2011))
.............................................................................................................................................................. 53
Figure 4-6 Alkin and Christie's Evaluation Theory Tree (Source: (Alkin & Christie 2004)) .................... 54
Figure 4-7 Context, mechanism & regularity (Source: (Tilley & Pawson 2000)) ................................... 60
Figure 4-8 Changes in regularities due to realistic evaluation programmes (Source: (Tilley & Pawson
2000)) .................................................................................................................................................... 61
Figure 4-9 Realist effectiveness cycle (Source: (Kazi & Rostila 2002)) .................................................. 61
Figure 5-1 Systematic comparative literature review methodology .................................................... 68
Figure 5-2 Data selection criteria and process ..................................................................................... 72
Figure 5-3 Number of and percentage publications per document type ............................................. 74
Figure 5-4 Publications timeline for all document types ...................................................................... 75
Figure 5-5 Geographical representation of researcher nationalities ................................................... 75
Figure 5-6 Countries ranked according to number of publications per country .................................. 76
Figure 5-7 Percentage distribution of publications according to their relevance ................................ 77
Figure 5-8 Summary of publications analysis regarding relevance and main recurring themes .......... 78
Figure 5-9 Transportation: Number of publications containing each recurring theme ....................... 79
Figure 5-10 Monitoring and Evaluation: Number of publications containing each recurring theme .. 80
Figure 5-11 Impacts: Number of publications containing each recurring theme ................................. 80
Figure 5-12 Citation counts for 17 relevant articles ............................................................................. 81
Figure 6-1 Conceptual framework development methodology ........................................................... 84
Figure 6-2 Occurrence of approaches amongst relevant articles ......................................................... 86
Figure 6-3 Number and percentage of articles with a qualitative, quantitative, or mixed approach .. 88
Stellenbosch University https://scholar.sun.ac.za
xi
Figure 6-4 Process illustration of concept categorisation and integration ........................................... 89
Figure 6-5 Concept category hierarchy ................................................................................................. 89
Figure 6-6 Conceptual radial ‘mind-map-like’ diagram of microtransit system sustainability
considerations ..................................................................................................................................... 100
Figure 7-1 Methodology for the validation of the M&E conceptual framework ................................ 109
Figure 7-2 Method for the semi-structured interviews towards an adjusted more objective framework
............................................................................................................................................................ 110
Figure 7-3 Method for indicator-weighting interviews towards a weighted and enhanced framework
............................................................................................................................................................ 115
Figure 7-4 Exponential increase in number of comparisons needed per number of criteria/indicators
............................................................................................................................................................ 119
Figure 7-5 Direct pairwise comparison of 15 indicators ..................................................................... 119
Figure 7-6 Pairwise comparison of 15 indicators divided into 4 smaller categories .......................... 119
Figure 7-7 Average indicator fractional distances from mean per survey.......................................... 124
Figure 7-8 Indicators occurrence based on fractional distance groups .............................................. 128
Figure 7-9 AoS weights per survey and final mean weightings .......................................................... 129
Figure 7-10 Areas of Sustainability weights (%) and domain proportions ......................................... 131
Figure 7-11 Domain weights (%) and Areas of Sustainability proportions ......................................... 132
Figure 7-12 Overview of GTM process ................................................................................................ 132
Figure 7-13 Simplified radial 'mind-map-like' diagram for the conceptual framework ..................... 141
Figure 8-1 Method for case study application towards the finalised M&E framework ..................... 145
Figure 8-2 The Mellowcabs microtransit vehicle and interesting facts (Mellowcabs 2017) .............. 146
Figure 8-3 Importance-Satisfaction Analysis (ISA) theoretical graph ................................................. 153
Figure 8-4 Importance-satisfaction analysis (ISA) diagram (Mellowcabs) .......................................... 156
Figure 8-5 Importance-satisfaction analysis (ISA) diagram: Environmental (Mellowcabs) ................ 157
Figure 8-6 Importance-satisfaction analysis (ISA) diagram: Social (Mellowcabs) .............................. 158
Figure 8-7 Importance-satisfaction analysis (ISA) diagram: Economic (Mellowcabs) ........................ 159
Figure 9-1 Method for case study application towards the finalised M&E framework ..................... 165
Figure 9-2 Importance-satisfaction analysis (ISA) diagram (GoMetro) .............................................. 171
Figure 9-3 Importance-satisfaction analysis (ISA) diagram: Environmental (GoMetro) ..................... 172
Figure 9-4 Importance-satisfaction analysis (ISA) diagram: Social (GoMetro) ................................... 173
Figure 9-5 Importance-satisfaction analysis (ISA) diagram: Economic (GoMetro) ............................. 174
Figure 10-1 Various mobility system contexts .................................................................................... 181
Stellenbosch University https://scholar.sun.ac.za
xii
List of Tables
Table 1-1 Report content breakdown ..................................................................................................... 9
Table 2-1 Key differences between Quantitative and Qualitative research (Adapted from (Celano
2014)) .................................................................................................................................................... 13
Table 2-2 Different systematic literature review methodologies proposed by various authors ......... 18
Table 2-3 Proposed methodological framework for conducting the systematic literature review ..... 19
Table 2-4 Document structure .............................................................................................................. 22
Table 3-1 Key principles for adequate transport indicator selection (Adapted from: (Litman 2016)) . 27
Table 3-2 SWOT analysis of Microtransit .............................................................................................. 34
Table 4-1 Historical overview of Programme Evaluation ..................................................................... 38
Table 4-2 Core dimensions characterising interventions ..................................................................... 40
Table 4-3 Descriptions on the five dimensions to fidelity .................................................................... 44
Table 4-4 Evaluation Types (Adapted from (Salabarría-Peña et al. 2007)) ........................................... 48
Table 4-5 Main purposes of Evaluation ................................................................................................ 52
Table 4-6 Monitoring types ................................................................................................................... 63
Table 4-7 Differences between monitoring and evaluation (Source: (Puoane 2010)) ......................... 63
Table 4-8 Criteria for assessing the quality of M&E .............................................................................. 65
Table 5-1 Primary and secondary research questions .......................................................................... 68
Table 5-2 Limitations: Including and excluding terms .......................................................................... 69
Table 5-3 Search results for different internet data sources ................................................................ 70
Table 5-4 Data collection main categories and components/recurring themes .................................. 72
Table 6-1 List of approaches followed by relevant articles .................................................................. 87
Table 6-2 Deconstruction, categorisation, and integration of concepts regarding microtransit system
sustainability ......................................................................................................................................... 91
Table 6-3 Initial subjective conceptual framework ............................................................................. 101
Table 7-1 Semi-structured interview summary .................................................................................. 111
Table 7-2 Importance Likert scale (7-point) ........................................................................................ 116
Table 7-3 Number of comparisons needed per AoS ........................................................................... 120
Table 7-4 Relative importance ratings for AHP ................................................................................... 120
Table 7-5 Random Index (RI) values for small problems (n < 10) ....................................................... 121
Table 7-6 Expert participants (anonymous) in indicator-weighting interviews .................................. 123
Table 7-7 Expert survey results on AoS ............................................................................................... 125
Table 7-8 Expert survey results on indicators ..................................................................................... 125
Table 7-9 Indicator occurence based on CV groups ........................................................................... 128
Table 7-10 Expert survey results on AoS domains .............................................................................. 129
Table 7-11 Summary of expert survey results on AoS domains ......................................................... 130
Table 7-12 Enhanced and weighted conceptual framework .............................................................. 133
Table 7-13 Pollutants considered by different locations for air quality index determination ........... 140
Table 8-1 Indicator rating threshold categories and descriptions (Freitas 2013) ............................... 147
Table 8-2 Indicator satisfaction ratings and analysis .......................................................................... 147
Table 8-3 Importance fractions and relative importance values of indicators ................................... 152
Table 8-4 Description of each ISA quadrant ....................................................................................... 153
Table 8-5 "Aim-diagonal" nodes for the ISA graph ............................................................................. 154
Table 8-6 Summary of ISA results (Mellowcabs) ................................................................................ 160
Stellenbosch University https://scholar.sun.ac.za
xiii
Table 8-7 Top five underperforming indicators for each domain ...................................................... 161
Table 8-8 Summary of the final Mellowcabs case study interview .................................................... 162
Table 9-1 GoMetro's four M's towards improving the way we move ................................................ 166
Table 9-2 Indicator satisfaction ratings and analysis .......................................................................... 168
Table 9-3 Summary of ISA results (GoMetro) ..................................................................................... 175
Table 9-4 Top five underperforming indicators for each domain ...................................................... 176
Table 9-5 Summary of the final GoMetro case study interview ......................................................... 177
Table 10-1 Mobility contexts of the two case studies ........................................................................ 182
Table 10-2 Comparing the case studies’ overall standard deviation and coefficient of variance ...... 182
Table 10-3 Comparing the case studies’ sustainability indices ........................................................... 182
Table 10-4 Comparing the case studies’ top 5 over- and underperforming indicators ...................... 183
Table 10-5 Comparing the case studies’ effectiveness, efficiency, applicability, and validity ........... 183
Table 10-6 Comparing the possibility of performance instead of satisfaction analysis for both case
studies ................................................................................................................................................. 184
Table 10-7 Summary and salient points of each part of the research plan ........................................ 185
Table 10-8 Conclusions pertaining to reaching the research objectives ............................................ 188
Table 10-9 Criteria for assessing the quality of M&E .......................................................................... 193
Stellenbosch University https://scholar.sun.ac.za
xiv
List of Acronyms and Abbreviations
ADB Asian Development Bank
AHP Analytic Hierarchy Process
AoS Area of Sustainability
AQI Air Quality Index
AQHI Air Quality Health Index
CAI Comprehensive Air-quality Index
CAQI Common Air Quality Index
CFA Conceptual Framework Analysis
CNS Courier Network Services
CV Coefficient of Variance
ECMT European Conference of Ministers of Transport
EV Electric Vehicle
GTM Grounded Theory Methodology
ICT Information and Communication Technology
IE Industrial Engineering
IMECA Índice Metropolitano de la Calidad del Aire
IoT Internet of Things
ITS Intelligent Transportation System
JCSEE Joint Committee on Standards for Educational Evaluation
KPI Key Performance Indicator
M&E Monitoring and Evaluation
NDP National Development Plan
NMT Non-motorised Transport
OECD Organization for Economic Co-operative Development
P2P Peer-to-peer
PVS Personal Vehicle Sharing
RBM Results-based Management
SACOG Sacramento Area Council of Governments
SLR Systematic Literature Review
SOE State-Owned Enterprise
TNC Transportation Network Companies
UNDP United Nations Development Programme
Stellenbosch University https://scholar.sun.ac.za
1
Chapter 1 Introduction
This chapter sets the context of the study as it provides the reader with background information and
the rationale of the research with a clear introduction to the research problem. From the identified
problem, the research aim, objectives, and outcomes are established. This is followed by a discussion
on the research scope, assumptions, and limitations providing a clear outline and establishing the
focus of the study. Lastly, ethical implications of the research are considered and discussed. A report
content breakdown is also included at the end of this chapter.
Chapter key
outcomes
Provide context to the study through background information
Explain the rationale of the research
Describe the research problem statement
Describe research aim, objectives, and outcomes
Establish research scope, assumptions, and limitations
Consideration of ethical implications of the research
Report content breakdown
1.1 Background to and Rationale of the research
Humankind has always had the need for mobility. When we consider mobility today, we are prone to
think about transport and transport systems: the movement of humans and goods from one location
to another. Transport is considered indispensable for human existence, development and civilisation
(Bailey, Mokhtarian and Little, 2008). It enables people to have physical access to their jobs, health
services, education, and other essential social necessities and amenities. It is considered one of the
primary drivers of economic growth through trade by connecting people to resources and markets
(Hall, 2002). Modern companies, industries and general activities are all dependent on transport and
transport infrastructure for global and urban economic survival (Rodrigue, Comtois and Slack, 2016).
Developing a variety of and adequate transport systems is vital for social and economic development.
However, only considering these aspects would lead us to define transport for suiting the ‘developed
nation model’, which would mean it was designed to encourage activities focusing on seeking freedom
of mobility and wealth creation – typical for industrialised nations – without consideration of
environmental protection (Hall, 2002). Since transport also triggers negative impacts regarding human
health and the environment, it requires decisions-makers and policy-makers to also consider possible
negative impacts in addition to the social and economic benefits it might bring.
Transport is thus linked to nearly all aspects of human life: our natural environment, economic
prosperity, and social welfare which all are dependent on clean, effective, efficient, and equitable
transport systems (Hall, 2002). Due to the inherent aim of transport systems to improve our lives, it is
unsurprising that transport development is rarely considered without also considering ‘sustainability’
(in this thesis used interchangeably with ‘sustainable development’), which reflects the fundamental
human desire to protect and improve our planet (Litman, 2016). It was only after the publication of
Our Common Future (commonly referred to as the Brundtland Report) by the World Commission on
Environment and Development (Brundtland, 1987), that the concept of sustainable development
Stellenbosch University https://scholar.sun.ac.za

2
began to gather momentum. They define sustainable development: “Development that meets the
needs of the present without compromising the ability of future generations to meet their own needs”
(Brundtland, 1987, p. 15). This report forms the foundation for most discussions on sustainable
development today (Zuidgeest, Witbreuk and Maarseveen, 2000; Hall, 2002; Zegras, 2006; Olofsson
et al., 2011; Haghshenas and Vaziri, 2012; Litman, 2016). The concept of sustainability is however a
vast and complex issue often having conflicting goals and eliciting much debate. Its meaning changes
according to the context to which it is applied (Olofsson et al., 2011), and it encompasses several
different disciplines including the natural and social sciences, medicine, and engineering, and requires
various decisions (Poor and Lindquits, 2007). Sustainable development is therefore closely related to
the values and the value systems of those who attempt to define it (Koglin, 2009).
The concept of sustainability was first applied to the transport sector in developed countries during
the early nineties. Two reports in particular played a vital role during these early stages of the
sustainable transport debate (Hall, 2002): 1) Urban Travel and Sustainable Development by the
Organization for Economic Co-operative Development (OECD) Group on Urban Affairs and the
European Conference of Ministers of Transport (ECMT) (Breheny, 1995), and 2) Sustainable Transport:
Priorities for Policy Reform by the World Bank (World Bank, 1996). Since then the debate has persisted,
and is still an ongoing process today. Similar to the difficulty in defining sustainable development,
defining sustainable transport is not an easy task due to the strong influence of human factors and the
non-material side of life including perception, morals, and behaviour (Olofsson et al., 2011).
A continued discussion on sustainable transport and its definition is found later in this research. Still,
every development aspect of a country today considers sustainability as an integral part (Munira and
Santoso, 2017). Most societies have committed themselves explicitly or implicitly to the principles of
sustainable development in recent years (Zuidgeest, Witbreuk and Maarseveen, 2000; Klinger,
Kenworthy and Lanzendorf, 2013). The South African Department of Transport realises its
responsibility regarding conducting research, formulating legislation and policies, regulating, and
implementing monitoring systems in this regard towards achieving its strategic goals. The Government
has defined their broad objectives of its transport policy as follows:
• “To support the goals of the prevailing, overarching plan for national development
to meet the basic accessibility needs of the residents of South Africa, grow the
economy, develop and protect human resources and involve stakeholders in key
transport-related decision making;
• To enable customers requiring transport for people or goods to access the
transport system in ways that best satisfy their chosen criteria;
• To improve the safety, security, reliability, quality, and speed of transporting
goods and people;
• To improve South Africa's competitiveness and that of its transport infrastructure
and operations through greater effectiveness and efficiency to better meet the
needs of different customer groups, both locally and globally;
Stellenbosch University https://scholar.sun.ac.za

3
• To invest in infrastructure or transport systems in ways that satisfy social,
economic or strategic investment criteria; and
• To achieve the above objectives in a manner that is economically and
environmentally sustainable, and minimises negative side effects.” (Department
of Transport, 2017, p.2)
Despite these objectives and past attempts at changing transport systems to become sustainable, we
still observe many real-world problems today regarding current transport systems worldwide. Most
of the major negative effects of transport systems identified by Rosén in 2001 are still problems we
face today: pollution, loss of community, car dependence and widespread ownership, social exclusion,
land consumption, adverse economic, environmental and social impacts of traffic congestion, and
non-renewable natural resource depletion (Rosen, 2001).
Urban transport systems are considered the engine for economic activities and the backbone for
general mobility (Hall, 2002). Various modes of transport exist towards different purposes of physical
and economic development and general mobility. Some typical urban facilities include: railways,
waterways, airways and roads: the biggest player being road systems (Gwilliam, 2013). Urban areas
tend to develop at nodal points in transport networks with good road networks (Wyatt, 1997).
Naturally then, most sustainable transport research efforts and discussions revolve around road
transport, particularly in urban areas (Hall, 2002). This is also clear in the major negative effects of
current transport systems worldwide as identified by Rosén (Rosen, 2001).
As if addressing complex and at times abstract sustainability problems of which much debate and
conflicting ideas exist is not difficult enough, in recent times many urban areas have experienced large
increases in transport demands and road traffic as urbanisation continues (Gwilliam, 2013). This has
led to capacity deterioration and inefficient road network performance. Simply adding additional road
space to address these issues is ineffective since it also induces travel growth, and is not always
possible in already built-up and dense environments like cities (Chowdhury and Sadek, 2003). A more
relevant and acceptable strategy for addressing capacity and efficiency problems is through traffic
management applications like the recently introduced Intelligent Transportation Systems (ITS) (Nelson
and Mulley, 2013; Gschwender, Munizaga and Simonetti, 2016). A simple definition would be:
innovative and advanced application of information and communication technology (ICT) to various
modes of transport, particularly to road transport infrastructure, vehicles, users, and its interfaces
with other modes of transport (European Union, 2010). The directive of the European Union states
that ITS:
“…will make a significant contribution to improving environmental performance,
efficiency, including energy efficiency, safety and security of road transport,
including the transport of dangerous goods, public security and passenger and
freight mobility, whilst at the same time ensuring the functioning of the internal
market as well as increased levels of competitiveness and employment.”
(European Union, 2010)
Another recent strategy also utilising ICTs is the emergence of ‘shared mobility’ described as “the
shared use of a vehicle, bicycle, or other low speed mode that enables users to have short-term access
Stellenbosch University https://scholar.sun.ac.za
4
to transportation modes on an ‘as-needed’ basis” (Shaheen et al., 2015). Shared mobility is considered
an umbrella term that includes various forms of vehicle sharing, on-demand ride services as well as
alternative transit services including shuttles and private transit services e.g. microtransit (Shaheen et
al., 2015). According to Shaheen et al. (2015), microtransit has only recently emerged as a more
technology-enabled alternative transit service incorporating flexible routing and/or flexible scheduling
(Shaheen et al., 2015). A key characteristic is connecting supply and demand through the use of ICTs,
specifically in a demand-responsive manner often with a focus on “first-and-last-mile” transit (Bos,
2015). Utilising the internet and ICTs in an era of IoT towards intelligent transport systems (ITS),
combined with the concept of shared mobility within an era of sharing economies, applied to the
urban transport sector towards addressing current real-world problems, is what microtransit is all
about.
Modes of transport are thus continuously evolving and growing to adapt to changes and find
innovative and optimal ways of addressing current transport problems and the negative effects caused
by them. It is essential that continuous research must be conducted on both current and alternative
modes of transport as it contributes to an enormous variety of areas. However, since microtransit is a
contemporary concept, little in-depth research has been conducted in this area and a gap is identified
in the body of knowledge. Although microtransit presents an innovative new (or re-emerging) mode
of transport with great potential, it would however require a tool that decision-makers, policy-makers,
and stakeholders can use to monitor and evaluate the system concerning its sustainability
performance once it has been fully deployed and integrated with current traditional transport
networks and infrastructure.
A vital aspect for any organisation, state-owned enterprise (SOE), or institution that aims at
progressively improving the performance of any particular activity or service is monitoring and
evaluation (M&E) (Channa, 2013). M&E is however a wide field with many approaches, paradigms,
and types of evaluation. A general but brief description could be: M&E is a method used to increase
performance and succeed in reaching goals and achieving results by assessing the performance of
activities and projects of organisations and state-owned enterprises (SOEs). The major goal of M&E is
to improve the management of outcomes and outputs by establishing links between past, present and
future procedures and decisions (UNDP, 2009). The National Development Plan (NDP) of South Africa
also clearly states that planning and implementation should be informed by evidence-based
monitoring and evaluation (National Planning Commission, 2011). The UK Department of Transport
has also indicated the importance of M&E for them regarding decision-making, stating that effective
application of M&E can reduce the risk of making poor decisions, inefficiency, inability to demonstrate
accountability and unnecessary regulatory activities (Channa, 2013).
It is against this background that the importance and need are identified for appropriate monitoring
and evaluation of microtransit systems towards sustainable development, especially once it has been
fully deployed. Clearly, addressing sustainability is a complex and at times abstract subject around
which much debate and conflicting ideas exist (Hall, 2002). Despite the challenges of implementing a
measurement approach for transport sustainability evaluation and it being considered “more than
daunting” (Zegras, 2006), it is necessary to ensure future generations have the same benefits from
transport as we do today. An M&E framework for microtransit systems concerning sustainable
Stellenbosch University https://scholar.sun.ac.za

5
development would ensure that social well-being and economic growth is promoted while still
considering the environmental and health impacts it might have.
Apart from the importance of this research as pointed out in a theoretical sense, the need therefore
is also indicated by the start-up microtransit company Mellowcabs, used in this research for the case
study application.
1.2 Research problem statement, aim, objectives, and outcomes
“Sustainability is the next great game in transportation. The game becomes
serious when you keep score.” (Greenroads International., 2018)
1.2.1 Research problem statement
It is widely recognised that urban transport systems in its current form are unsustainable and in dire
need of improvement (Dobranskyte-Niskota et al., 2009; Olofsson et al., 2011; Haghshenas and Vaziri,
2012; Litman, 2016). Despite plentiful research conducted on current transport systems’
sustainability, we increasingly observe the emergence of new ‘smart mobility’ modes of transport
through technological advancements in ICT including ITS (Nelson and Mulley, 2013; Gschwender,
Munizaga and Simonetti, 2016), shared mobility (Cohen and Kietzmann, 2014; Shaheen et al., 2015),
and microtransit systems (Bos, 2015; Jaffe, 2015; MaRS Discovery District, 2016). These initiatives
challenge traditional ideas and support the claims that global economic sustainability cannot be
accomplished sufficiently with incremental improvements in our current systems (Lovins and Cohen,
2011; Stead and Stead, 2013). These alternative modes of transport (‘smart mobility’), particularly
microtransit systems, present great potential in addressing current real-world problems regarding the
transport sector (Shaheen et al., 2015).
While there seems to be an abundance of research concerning the sustainability assessment of current
modes of transport and general city mobility through monitoring and evaluation (M&E), little research
exists regarding sustainability evaluation of the contemporary ‘smart mobility’ transport alternatives.
Although some research has been conducted on the sustainability potential of shared transport and
ITS, a dearth of research exists regarding microtransit systems especially with regard to evaluating the
system’s sustainability performance.
As an emerging new field with great potential, microtransit is still in the developmental stage. For it
to effectively address and solve current real-world transport-related problems, stakeholders and
decision-makers would require a carefully designed Monitoring and Evaluation (M&E) framework
once the service has been fully deployed and integrated with current transport systems. This
framework would focus on improving transport sustainability through continuous M&E. The
framework could act as a management tool for decision support towards building realistic and
profitable value propositions economically, socially and environmentally and will also enable the
validation of decisions through continuous M&E. This framework could assist microtransit businesses
especially in penetrating public-sector verticals and securing funding since hard data is essential in
proving real business cases.
Stellenbosch University https://scholar.sun.ac.za
6
1.2.2 Research aim, objectives, and outcomes
Due to microtransit being a contemporary concept of which little in-depth research has been
conducted, and the need for transport systems to contribute towards sustainable development, a gap
was identified in literature. This research aims to fill this gap by developing an appropriate M&E
framework for microtransit systems concerning its sustainability. This was done through conducting
two qualitative literature studies on microtransit and M&E followed by a systematic literature review
towards conceptual framework development by means of indicator identification. The framework was
validated through expert interviews and surveys and applied to a case study as a management tool by
quantitatively estimating sustainability performance of transport activities. The generalisability of the
framework was then evaluated in the broader context of ITS through a second case study application.
The following research objectives have been created to aid in solving the research problem by
achieving the aim of this research:
I. Obtain a comprehensive understanding of microtransit through conducting a conceptual
literature study.
II. Conduct a second conceptual literature study to explore and fully understand the process of
Monitoring and Evaluation (M&E) through extensive literature analysis and recognize how to
apply the obtained knowledge towards building a conceptual framework.
III. To identify key approaches and concepts for a microtransit M&E framework by means of a
systematic comparative literature review.
IV. Develop the microtransit M&E conceptual framework.
V. Validate the microtransit M&E conceptual framework through expert interviews.
VI. Application of the validated framework to a case study as a management (M&E) tool for
evaluating its effectiveness and applicability in the context of an existing microtransit
company.
VII. Test the generalisability of the finalised framework in the broader context of ITS by
application to a second case study
The outcome of the research is to have developed an effective and generic M&E framework for
microtransit systems with the possibility of utilising it on similar small scale urban transport systems.
This framework will assist with decision support towards building a realistic, profitable, and overall
sustainable company and validate their decisions through continuous M&E. The M&E framework will
also to some extent be useful for other types of transport companies and possibly also distribution
companies.
In the specific case of Mellowcabs the M&E framework could assist them in effectively proving their
business case by quantifying data into practical information that can be used as compelling evidence
to secure funding. It could also provide guidance on how initiatives should be rolled out and how they
can be continuously monitored and evaluated effectively.
1.3 Research scope, assumptions, and limitations
Two conceptual literature studies, on microtransit and M&E, comprising the scope of this research are
conducted towards establishing a basis for framework development by means of conducting the
systematic literature review. While only the key concepts ‘microtransit’ and ‘M&E’ were considered
initially, drawing links between the two focal concepts led to sustainable transport becoming a third
Stellenbosch University https://scholar.sun.ac.za
7
focal point, even though not initially identified. The scope of this study is limited to developing a
conceptual framework for monitoring and evaluating microtransit systems’ sustainability.
For each of the two focal concepts, some limitations were identified in the form of including and
excluding terms as search criteria during the scoping and planning stage of the systematic comparative
literature review in Chapter 5
1.3.1 Limitations
The development of a conceptual framework for M&E of microtransit systems concerning sustainable
development is the primary aim of this research. While the framework could be used as a management
tool, the application thereof by means of a case study in this research is limited due to the following
reasons:
• The management tool can only be applied towards satisfaction measurement, and not
performance measurement since required data for several variables are not available at this
stage as microtransit systems have not yet been fully deployed.
• The tool is applied through limited satisfaction measurement interviews as only three
respondents from the first case study company, Mellowcabs, and three respondents from the
second case study company, GoMetro, had adequate knowledge and were available.
• The number of case study applications at this stage is limited by the contemporary nature of
ITS and microtransit systems and the existence of such companies. No iterative process was
undergone for improving the tool based on multiple practical case study applications to similar
companies – the tool could only be applied once to a single microtransit company,
Mellowcabs, as case study since it is the only company within realistic geographical proximity
to the researcher to his knowledge, and once to an ITS company, GoMetro, that was identified
as ideal towards determining the generalisability of the framework.
Other limitations of this research include:
• Due to time constraints, after multiple attempts, and the difficulty when attempting to
arrange interviews with Western Cape government officials from the Ministry of Transport
and Public Works, no government officials could be included in the final set of experts
interviewed.
• Experts in the field of microtransit are significantly rare since very few microtransit companies
exist locally, which then complicates the validation of the framework.
• The developed framework is conceptual and would require further additional research and
validation through experts prior to achieving a generic model for application to any particular
microtransit system.
• The developed framework is not suitable for application to traditional transport systems since
it was developed specifically for microtransit systems. Generalisability of the framework to
other ITS contexts will however be considered.
1.3.2 Delimitations
The delimitations within the control of the researcher identified for this research are as follows:
• This research focuses on monitoring and evaluation of microtransit systems.
• Initially, the literature research focused on only two concepts: Microtransit systems, and
Monitoring and Evaluation. This naturally led to the consideration of transport sustainability
as well. These three concepts outline the scope of literature consulted for this study.
Stellenbosch University https://scholar.sun.ac.za
8
• Microtransit systems are considered within urban areas.
• Only peer-reviewed literature was used for framework development through indicator
identification.
• While literature from diverse geographical contexts around the globe was considered for
framework development, framework application is only considered in a South African context.
• Only individuals who could be considered experts in fields relevant to microtransit systems or
sustainable development were interviewed. This is essential since indicator importance
cannot be weighted by individuals who do not have adequate knowledge of either of the two
concepts.
• With the development of a conceptual M&E framework for microtransit systems, this research
will focus on appropriate concept identification towards a comprehensive sustainability
‘skeleton’ for such systems.
• The developed conceptual framework will serve as a ‘foundational skeleton’ for organisations
to which variables could easily be added, removed and/or modified.
1.4 Ethical implications of the research
The need for conducting interviews and surveys was identified in this research. Participation of
respondents thus requires an ethical clearance process to be completed. In doing this, the researcher
ensures that all ethical aspects regarding scientific research are adhered to in accordance with SU
requirements. Even though the needed information is considered not sensitive, all information will be
handled anonymously and confidentially. Following successful completion of the ethical clearance
process (Project number: ING-2018-1646), institutional permission was also requested and granted
for allowing interviews to be conducted with SU academics.
The following stipulations regarding participation by respondents are followed to ensure an ethical
approach:
• The research is expected not to have any (negative) impact on those who are studied. No risk
of causing harm or any negative experiences or discomforts are anticipated.
• Before any interview or survey commences, informed consent will be obtained from the
participants by completing consent forms.
• All interviews and surveys are entirely voluntary and participation can be withdrawn at any
time during the interview with no negative consequences.
• Participants may choose not to answer certain questions. If information is refused (not
answered), research will commence without it and be based on the relevant information that
can well be disclosed.
• If the participant decides to withdraw completely from the interview and the research study,
all data will be eliminated and will not be used for the research.
The following stipulations regarding confidentiality ensured that all research was executed ethically:
• All information obtained from the participants will represent the company rather than the
individuals – the participants will thus remain anonymous.
• The information obtained from the interviews and surveys will be considered as opinion rather
than fact. No personal questions or personal details will be asked. If any information is
obtained that might be considered sensitive, it will not be disclosed.
Stellenbosch University https://scholar.sun.ac.za
9
• Voice recordings of the interviews instead of video recordings will ensure the interviewee’s
privacy. Voice recordings will be made with the investigator’s phone which is password
protected.
• All hard copy consent forms with personal information (e.g. signature) will be scanned and
kept on the investigator's laptop which is password protected and kept in a secure location,
and always locked or shut down when left unattended.
• All digital and hard copies of the consent forms will be destroyed within five years or after
completion of the Master’s thesis and the completion of journal article publication(s) within
the five-year period.
1.5 Report content breakdown
The layout of this research document and a content overview of each chapter are provided in Table
1-1. It serves as a summary of main themes considered in each chapter as well as a general overview
of the approach followed in completing this research: From acquiring the necessary background
knowledge, deriving research methods, and comprehensive literature studies, towards literature
analyses and comparative reviews for framework development, validation, and application.
Table 1-1 Report content breakdown
Chapter Heading Brief description
Chapter 1: Introduction
Through providing background information and the rationale of the
research, the context is set. The research problem statement is
described followed by the research aim, objectives, and outcomes. By
describing the research limitations and assumptions, the scope of the
study is also outlined. After consideration of the ethical implications of
the study, the chapter concludes with this report content breakdown.
Chapter 2: Research
Methodologies
and Design
Elucidation is provided on research approaches and the grounded theory
methodology (GTM) towards delineating the research strategy.
Methodologies are developed for conducting two conceptual literature
studies and a systematic literature review towards the development of
a conceptual microtransit M&E framework.
Chapter 3: A Conceptual
Review of
Microtransit
Systems
This chapter conducts the first qualitative literature study.
Contextualisation through defining sustainable development, transport
sustainability and shared mobility within the sharing economy paves the
way towards defining microtransit systems. The concept is discussed in
detail along with some of its strengths and weaknesses towards a
framework for microtransit system evaluation.
Chapter 4: A Conceptual
Review of
Monitoring and
Evaluation
The second qualitative conceptual literature study is conducted
regarding monitoring and evaluation (M&E). A brief historical overview
is provided followed by an introduction to intervention logic towards
defining the concept of evaluation. The various evaluation types,
purposes, and leading evaluation theories (main paradigms) are then
discussed. After defining ‘monitoring’, the concept of M&E is defined
and discussed towards the development of an evaluation framework for
microtransit.
Stellenbosch University https://scholar.sun.ac.za

10
Chapter Heading Brief description
Chapter 5: Conducting the
Systematic
Comparative
Literature Review
From the systematic literature review (SLR) method defined in chapter
2, this chapter conducts the systematic comparative part thereof
through review stages 2.1-2.4. Defined research questions, keywords,
and inclusion and exclusion terms assist in identifying a set of relevant
studies. High-level reading enables identification of main components
and recurring themes. The chapter concludes with descriptive statistical
analysis of the identified studies.
Chapter 6: Developing the
Microtransit M&E
Conceptual
Framework
By completing the second part of the SLR in this chapter, a
comprehensive understanding of the final set of relevant articles is
obtained through extensive reading. Data extraction, categorisation,
and the analysis thereof enabled concept identification, deconstruction,
categorisation, and integration into the initial subjective conceptual
microtransit M&E framework.
Chapter 7: Validation of the
Microtransit M&E
Conceptual
Framework
The SLR concludes with the validation of the initial subjective conceptual
framework into an enhanced conceptual framework. The methodology
for validation is developed first, followed by a discussion on and analysis
of the semi-structured and indicator-weighting interviews and their
techniques. The chapter concludes with the enhanced and weighted
conceptual framework.
Chapter 8: Case Study
Application:
Mellowcabs
The enhanced and weighted conceptual framework is applied to a case
study to illustrate its usefulness as a management tool. The Mellowcabs
initiative is introduced and used towards this purpose. Performance and
satisfaction measurement is considered towards the determination of a
sustainability index (SI). Importance-satisfaction analysis (ISA) is then
conducted. The chapter concludes with feedback from case study
interviews and finalise the microtransit M&E conceptual framework.
Chapter 9 Case Study
Application:
GoMetro
The finalised conceptual framework is applied in a different context than
it was originally developed for. Case study application to the GoMetro
company considers a context of “smart mobility”/ITS that is wider than
microtransit, and tests the generalisability of the framework in this
broader context. Sustainability index (SI) values are again determined
and importance-satisfaction analysis (ISA) conducted followed by a case
study interview to provide feedback. The results are then analysed,
discussed, and compared to the first case study with critical reflection.
Chapter 10: Conclusions and
Recommendations
In the final chapter of this research study, a concise summary of the
research is provided, conclusions are drawn about the findings regarding
the research objectives, and recommendations of future research are
suggested.
Stellenbosch University https://scholar.sun.ac.za
11
Chapter 2 Research Methodologies and Design
In Chapter 2, the aim is to develop and explain the research methodologies and design needed for
conducting two conceptual literature studies as well as a systematic literature review comprising of a
comparative literature review and a conceptual framework development process.
The chapter starts with elucidation on research approaches towards defining types of research
strategies. The Grounded Theory Methodology (GTM) is chosen for this study as the research strategy
for conducting the aforementioned two literature studies and systematic literature review. The
complete conceptual framework development process is created based on different research
approaches from various authors. Finally, the succinct research plan for this document is explained
followed by a summary of the study’s research methodologies and design in a ‘Document Structure’
table.
Chapter key
outcomes
Discussion on the research approaches employed
Introduction to and explanation of the Grounded Theory Methodology (GTM)
Delineation of the overall research strategy
Elucidation of the two conceptual literature studies’ methodology
Development and break-down of a comprehensive systematic literature review
methodology
Elucidation of the systematic comparative literature review methodology
Elucidation of the conceptual framework development methodology
Development of a succinct research plan
Summary of this document’s research strategy and design
Stellenbosch University https://scholar.sun.ac.za
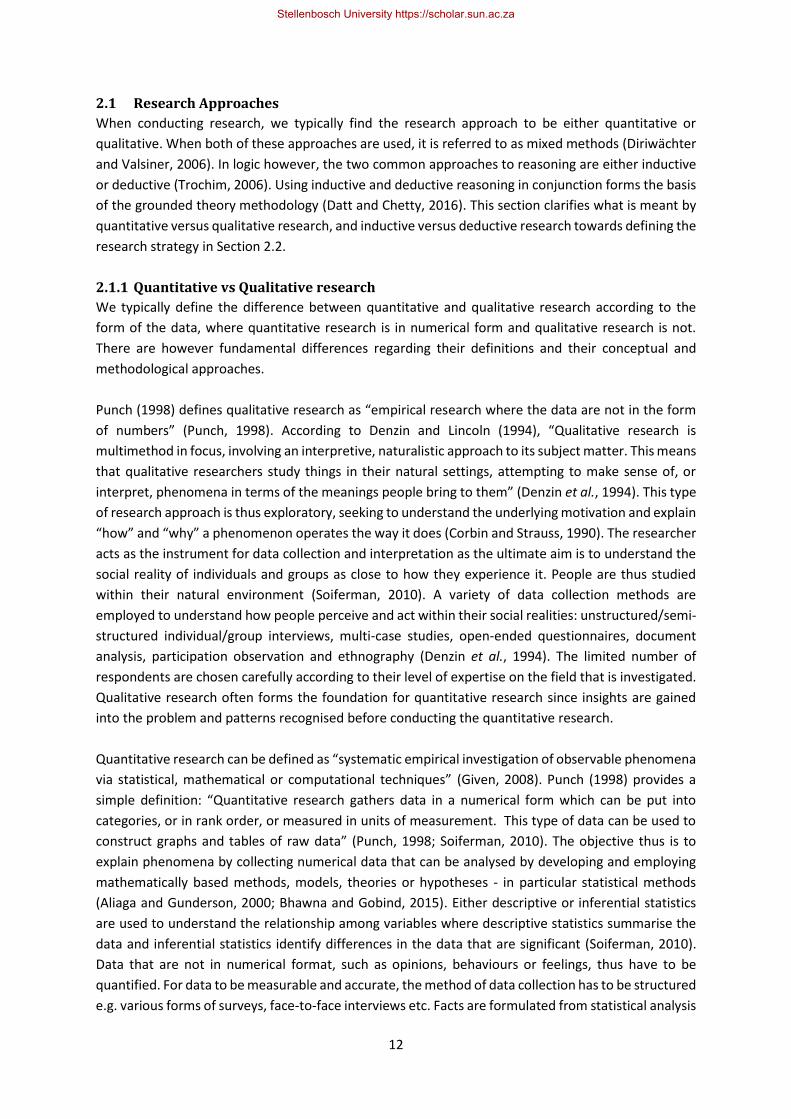
12
2.1 Research Approaches
When conducting research, we typically find the research approach to be either quantitative or
qualitative. When both of these approaches are used, it is referred to as mixed methods (Diriwächter
and Valsiner, 2006). In logic however, the two common approaches to reasoning are either inductive
or deductive (Trochim, 2006). Using inductive and deductive reasoning in conjunction forms the basis
of the grounded theory methodology (Datt and Chetty, 2016). This section clarifies what is meant by
quantitative versus qualitative research, and inductive versus deductive research towards defining the
research strategy in Section 2.2.
2.1.1 Quantitative vs Qualitative research
We typically define the difference between quantitative and qualitative research according to the
form of the data, where quantitative research is in numerical form and qualitative research is not.
There are however fundamental differences regarding their definitions and their conceptual and
methodological approaches.
Punch (1998) defines qualitative research as “empirical research where the data are not in the form
of numbers” (Punch, 1998). According to Denzin and Lincoln (1994), “Qualitative research is
multimethod in focus, involving an interpretive, naturalistic approach to its subject matter. This means
that qualitative researchers study things in their natural settings, attempting to make sense of, or
interpret, phenomena in terms of the meanings people bring to them” (Denzin et al., 1994). This type
of research approach is thus exploratory, seeking to understand the underlying motivation and explain
“how” and “why” a phenomenon operates the way it does (Corbin and Strauss, 1990). The researcher
acts as the instrument for data collection and interpretation as the ultimate aim is to understand the
social reality of individuals and groups as close to how they experience it. People are thus studied
within their natural environment (Soiferman, 2010). A variety of data collection methods are
employed to understand how people perceive and act within their social realities: unstructured/semi-
structured individual/group interviews, multi-case studies, open-ended questionnaires, document
analysis, participation observation and ethnography (Denzin et al., 1994). The limited number of
respondents are chosen carefully according to their level of expertise on the field that is investigated.
Qualitative research often forms the foundation for quantitative research since insights are gained
into the problem and patterns recognised before conducting the quantitative research.
Quantitative research can be defined as “systematic empirical investigation of observable phenomena
via statistical, mathematical or computational techniques” (Given, 2008). Punch (1998) provides a
simple definition: “Quantitative research gathers data in a numerical form which can be put into
categories, or in rank order, or measured in units of measurement. This type of data can be used to
construct graphs and tables of raw data” (Punch, 1998; Soiferman, 2010). The objective thus is to
explain phenomena by collecting numerical data that can be analysed by developing and employing
mathematically based methods, models, theories or hypotheses - in particular statistical methods
(Aliaga and Gunderson, 2000; Bhawna and Gobind, 2015). Either descriptive or inferential statistics
are used to understand the relationship among variables where descriptive statistics summarise the
data and inferential statistics identify differences in the data that are significant (Soiferman, 2010).
Data that are not in numerical format, such as opinions, behaviours or feelings, thus have to be
quantified. For data to be measurable and accurate, the method of data collection has to be structured
e.g. various forms of surveys, face-to-face interviews etc. Facts are formulated from statistical analysis
Stellenbosch University https://scholar.sun.ac.za
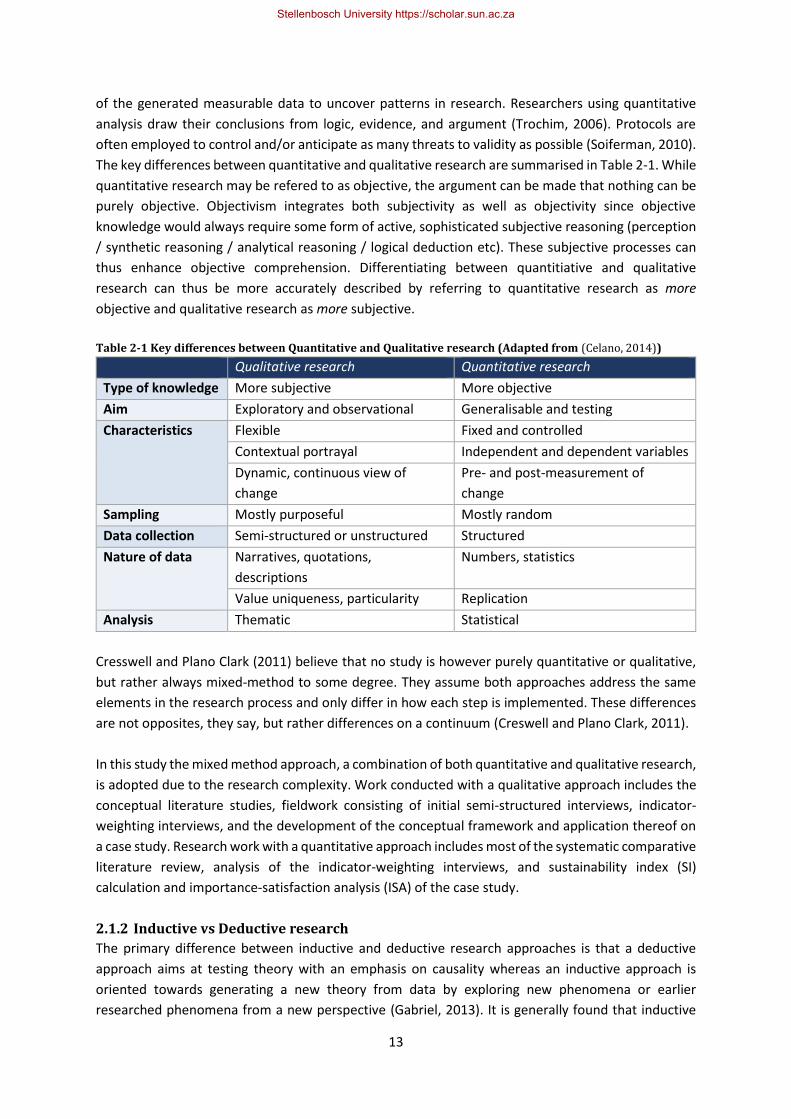
13
of the generated measurable data to uncover patterns in research. Researchers using quantitative
analysis draw their conclusions from logic, evidence, and argument (Trochim, 2006). Protocols are
often employed to control and/or anticipate as many threats to validity as possible (Soiferman, 2010).
The key differences between quantitative and qualitative research are summarised in Table 2-1. While
quantitative research may be refered to as objective, the argument can be made that nothing can be
purely objective. Objectivism integrates both subjectivity as well as objectivity since objective
knowledge would always require some form of active, sophisticated subjective reasoning (perception
/ synthetic reasoning / analytical reasoning / logical deduction etc). These subjective processes can
thus enhance objective comprehension. Differentiating between quantitiative and qualitative
research can thus be more accurately described by referring to quantitative research as more
objective and qualitative research as more subjective.
Table 2-1 Key differences between Quantitative and Qualitative research (Adapted from (Celano, 2014))
Qualitative research Quantitative research
Type of knowledge More subjective More objective
Aim Exploratory and observational Generalisable and testing
Characteristics Flexible Fixed and controlled
Contextual portrayal Independent and dependent variables
Dynamic, continuous view of
change
Pre- and post-measurement of
change
Sampling Mostly purposeful Mostly random
Data collection Semi-structured or unstructured Structured
Nature of data Narratives, quotations,
descriptions
Numbers, statistics
Value uniqueness, particularity Replication
Analysis Thematic Statistical
Cresswell and Plano Clark (2011) believe that no study is however purely quantitative or qualitative,
but rather always mixed-method to some degree. They assume both approaches address the same
elements in the research process and only differ in how each step is implemented. These differences
are not opposites, they say, but rather differences on a continuum (Creswell and Plano Clark, 2011).
In this study the mixed method approach, a combination of both quantitative and qualitative research,
is adopted due to the research complexity. Work conducted with a qualitative approach includes the
conceptual literature studies, fieldwork consisting of initial semi-structured interviews, indicator-
weighting interviews, and the development of the conceptual framework and application thereof on
a case study. Research work with a quantitative approach includes most of the systematic comparative
literature review, analysis of the indicator-weighting interviews, and sustainability index (SI)
calculation and importance-satisfaction analysis (ISA) of the case study.
2.1.2 Inductive vs Deductive research
The primary difference between inductive and deductive research approaches is that a deductive
approach aims at testing theory with an emphasis on causality whereas an inductive approach is
oriented towards generating a new theory from data by exploring new phenomena or earlier
researched phenomena from a new perspective (Gabriel, 2013). It is generally found that inductive
Stellenbosch University https://scholar.sun.ac.za
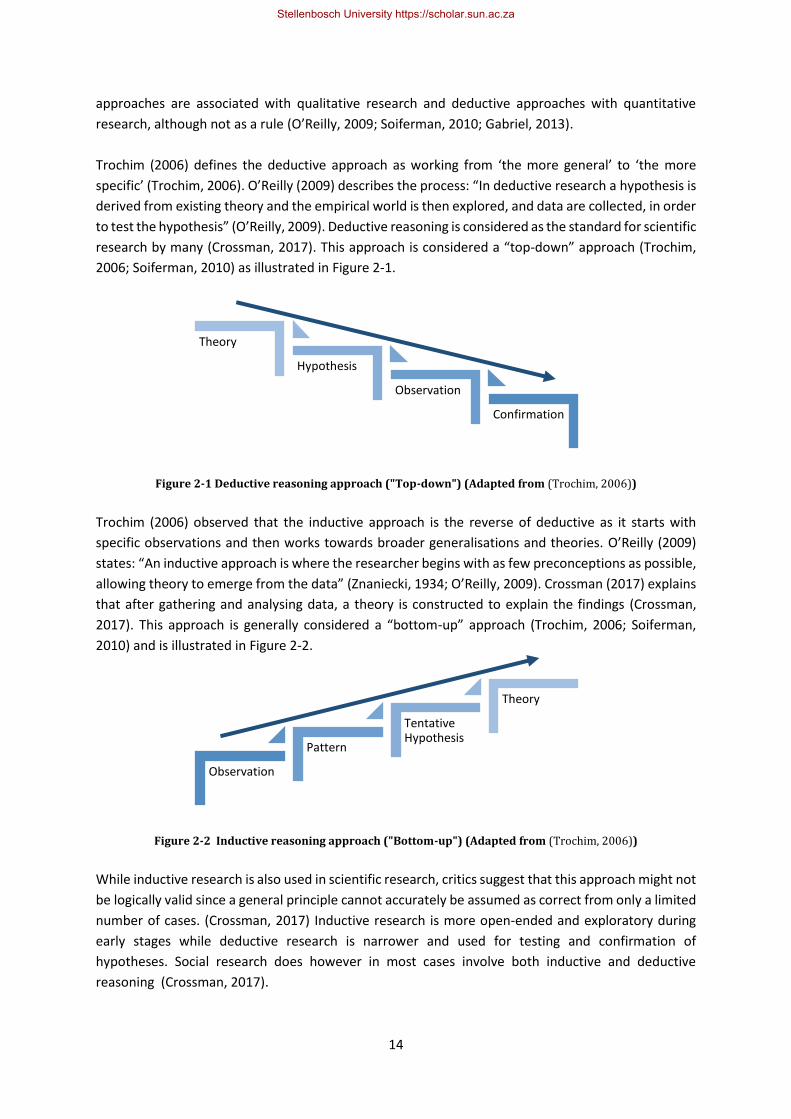
14
approaches are associated with qualitative research and deductive approaches with quantitative
research, although not as a rule (O’Reilly, 2009; Soiferman, 2010; Gabriel, 2013).
Trochim (2006) defines the deductive approach as working from ‘the more general’ to ‘the more
specific’ (Trochim, 2006). O’Reilly (2009) describes the process: “In deductive research a hypothesis is
derived from existing theory and the empirical world is then explored, and data are collected, in order
to test the hypothesis” (O’Reilly, 2009). Deductive reasoning is considered as the standard for scientific
research by many (Crossman, 2017). This approach is considered a “top-down” approach (Trochim,
2006; Soiferman, 2010) as illustrated in Figure 2-1.
Figure 2-1 Deductive reasoning approach ("Top-down") (Adapted from (Trochim, 2006))
Trochim (2006) observed that the inductive approach is the reverse of deductive as it starts with
specific observations and then works towards broader generalisations and theories. O’Reilly (2009)
states: “An inductive approach is where the researcher begins with as few preconceptions as possible,
allowing theory to emerge from the data” (Znaniecki, 1934; O’Reilly, 2009). Crossman (2017) explains
that after gathering and analysing data, a theory is constructed to explain the findings (Crossman,
2017). This approach is generally considered a “bottom-up” approach (Trochim, 2006; Soiferman,
2010) and is illustrated in Figure 2-2.
Figure 2-2 Inductive reasoning approach ("Bottom-up") (Adapted from (Trochim, 2006))
While inductive research is also used in scientific research, critics suggest that this approach might not
be logically valid since a general principle cannot accurately be assumed as correct from only a limited
number of cases. (Crossman, 2017) Inductive research is more open-ended and exploratory during
early stages while deductive research is narrower and used for testing and confirmation of
hypotheses. Social research does however in most cases involve both inductive and deductive
reasoning (Crossman, 2017).
Confirmation
Observation
Hypothesis
Theory
Observation
Pattern
Tentative Hypothesis
Theory
Stellenbosch University https://scholar.sun.ac.za
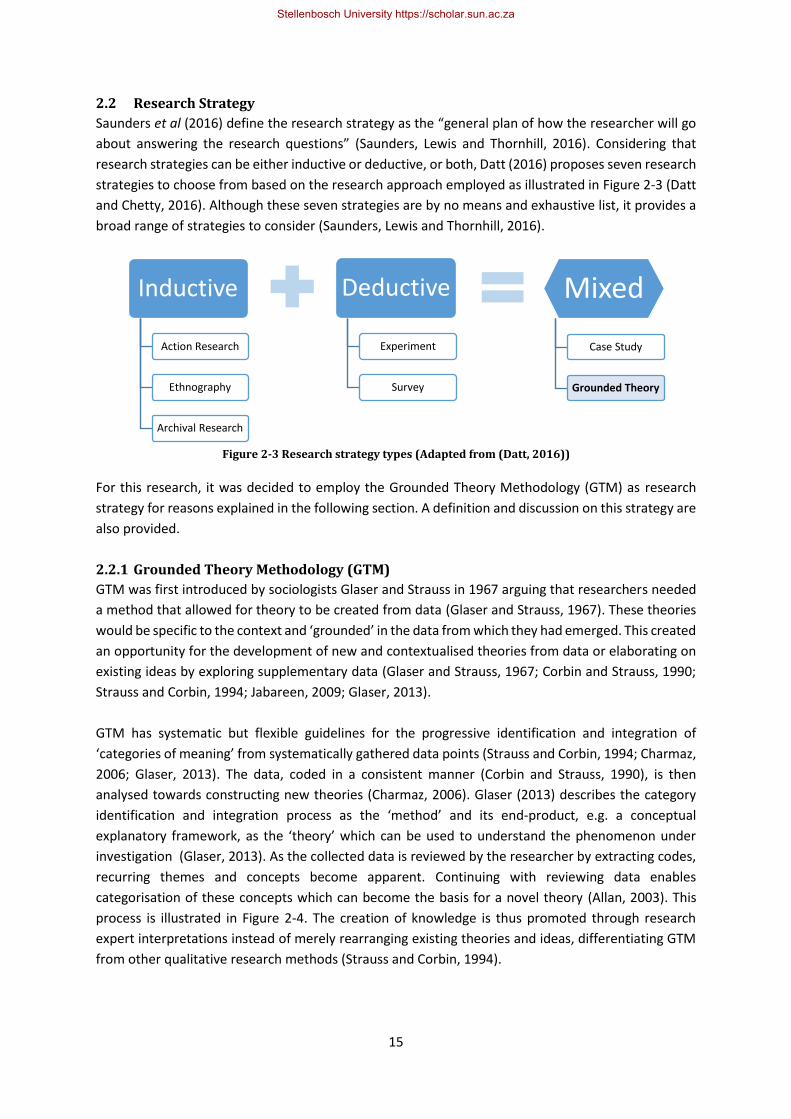
15
2.2 Research Strategy
Saunders et al (2016) define the research strategy as the “general plan of how the researcher will go
about answering the research questions” (Saunders, Lewis and Thornhill, 2016). Considering that
research strategies can be either inductive or deductive, or both, Datt (2016) proposes seven research
strategies to choose from based on the research approach employed as illustrated in Figure 2-3 (Datt
and Chetty, 2016). Although these seven strategies are by no means and exhaustive list, it provides a
broad range of strategies to consider (Saunders, Lewis and Thornhill, 2016).
For this research, it was decided to employ the Grounded Theory Methodology (GTM) as research
strategy for reasons explained in the following section. A definition and discussion on this strategy are
also provided.
2.2.1 Grounded Theory Methodology (GTM)
GTM was first introduced by sociologists Glaser and Strauss in 1967 arguing that researchers needed
a method that allowed for theory to be created from data (Glaser and Strauss, 1967). These theories
would be specific to the context and ‘grounded’ in the data from which they had emerged. This created
an opportunity for the development of new and contextualised theories from data or elaborating on
existing ideas by exploring supplementary data (Glaser and Strauss, 1967; Corbin and Strauss, 1990;
Strauss and Corbin, 1994; Jabareen, 2009; Glaser, 2013).
GTM has systematic but flexible guidelines for the progressive identification and integration of
‘categories of meaning’ from systematically gathered data points (Strauss and Corbin, 1994; Charmaz,
2006; Glaser, 2013). The data, coded in a consistent manner (Corbin and Strauss, 1990), is then
analysed towards constructing new theories (Charmaz, 2006). Glaser (2013) describes the category
identification and integration process as the ‘method’ and its end-product, e.g. a conceptual
explanatory framework, as the ‘theory’ which can be used to understand the phenomenon under
investigation (Glaser, 2013). As the collected data is reviewed by the researcher by extracting codes,
recurring themes and concepts become apparent. Continuing with reviewing data enables
categorisation of these concepts which can become the basis for a novel theory (Allan, 2003). This
process is illustrated in Figure 2-4. The creation of knowledge is thus promoted through research
expert interpretations instead of merely rearranging existing theories and ideas, differentiating GTM
from other qualitative research methods (Strauss and Corbin, 1994).
Deductive
Experiment
Survey
Inductive
Action Research
Ethnography
Archival Research
Mixed
Case Study
Grounded Theory
Figure 2-3 Research strategy types (Adapted from (Datt, 2016))
Stellenbosch University https://scholar.sun.ac.za
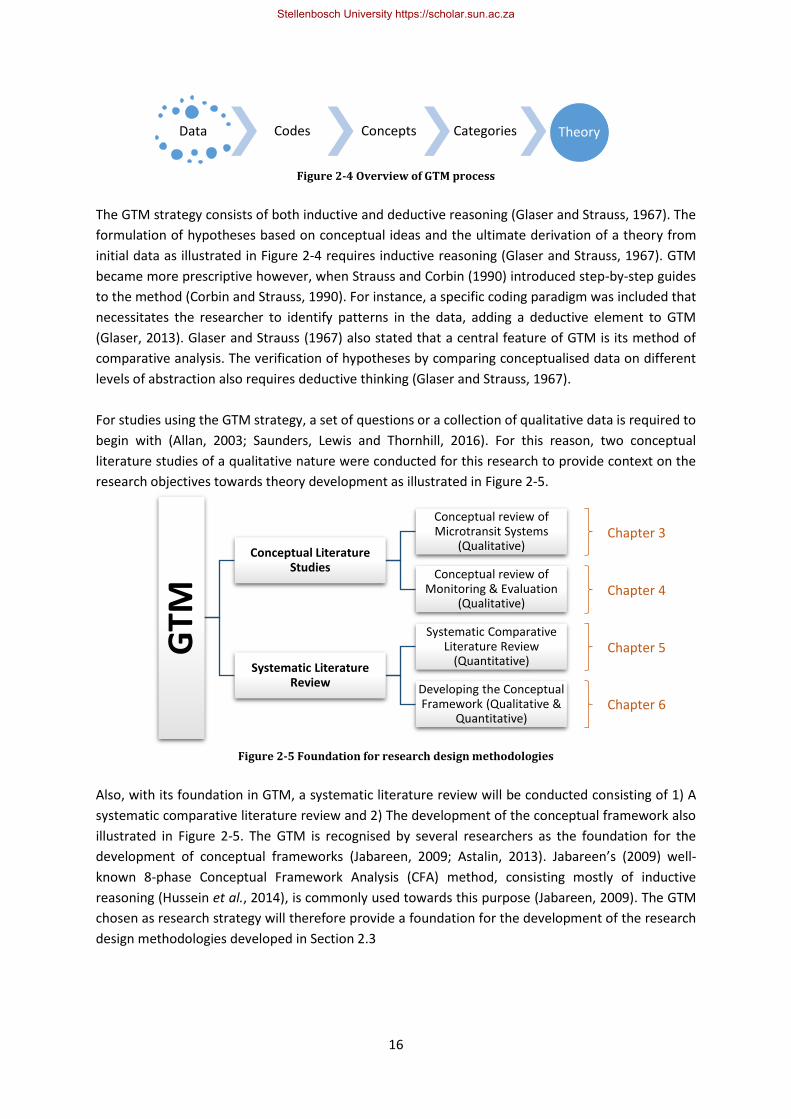
16
Figure 2-4 Overview of GTM process
The GTM strategy consists of both inductive and deductive reasoning (Glaser and Strauss, 1967). The
formulation of hypotheses based on conceptual ideas and the ultimate derivation of a theory from
initial data as illustrated in Figure 2-4 requires inductive reasoning (Glaser and Strauss, 1967). GTM
became more prescriptive however, when Strauss and Corbin (1990) introduced step-by-step guides
to the method (Corbin and Strauss, 1990). For instance, a specific coding paradigm was included that
necessitates the researcher to identify patterns in the data, adding a deductive element to GTM
(Glaser, 2013). Glaser and Strauss (1967) also stated that a central feature of GTM is its method of
comparative analysis. The verification of hypotheses by comparing conceptualised data on different
levels of abstraction also requires deductive thinking (Glaser and Strauss, 1967).
For studies using the GTM strategy, a set of questions or a collection of qualitative data is required to
begin with (Allan, 2003; Saunders, Lewis and Thornhill, 2016). For this reason, two conceptual
literature studies of a qualitative nature were conducted for this research to provide context on the
research objectives towards theory development as illustrated in Figure 2-5.
Figure 2-5 Foundation for research design methodologies
Also, with its foundation in GTM, a systematic literature review will be conducted consisting of 1) A
systematic comparative literature review and 2) The development of the conceptual framework also
illustrated in Figure 2-5. The GTM is recognised by several researchers as the foundation for the
development of conceptual frameworks (Jabareen, 2009; Astalin, 2013). Jabareen’s (2009) well-
known 8-phase Conceptual Framework Analysis (CFA) method, consisting mostly of inductive
reasoning (Hussein et al., 2014), is commonly used towards this purpose (Jabareen, 2009). The GTM
chosen as research strategy will therefore provide a foundation for the development of the research
design methodologies developed in Section 2.3
Data Codes Concepts Categories Theory
GTM
Conceptual Literature Studies
Conceptual review of Microtransit Systems
(Qualitative)
Conceptual review of Monitoring & Evaluation
(Qualitative)
Systematic Literature Review
Systematic Comparative Literature Review
(Quantitative)
Developing the Conceptual Framework (Qualitative &
Quantitative)
Chapter 3
Chapter 4
Chapter 5
Chapter 6
Stellenbosch University https://scholar.sun.ac.za
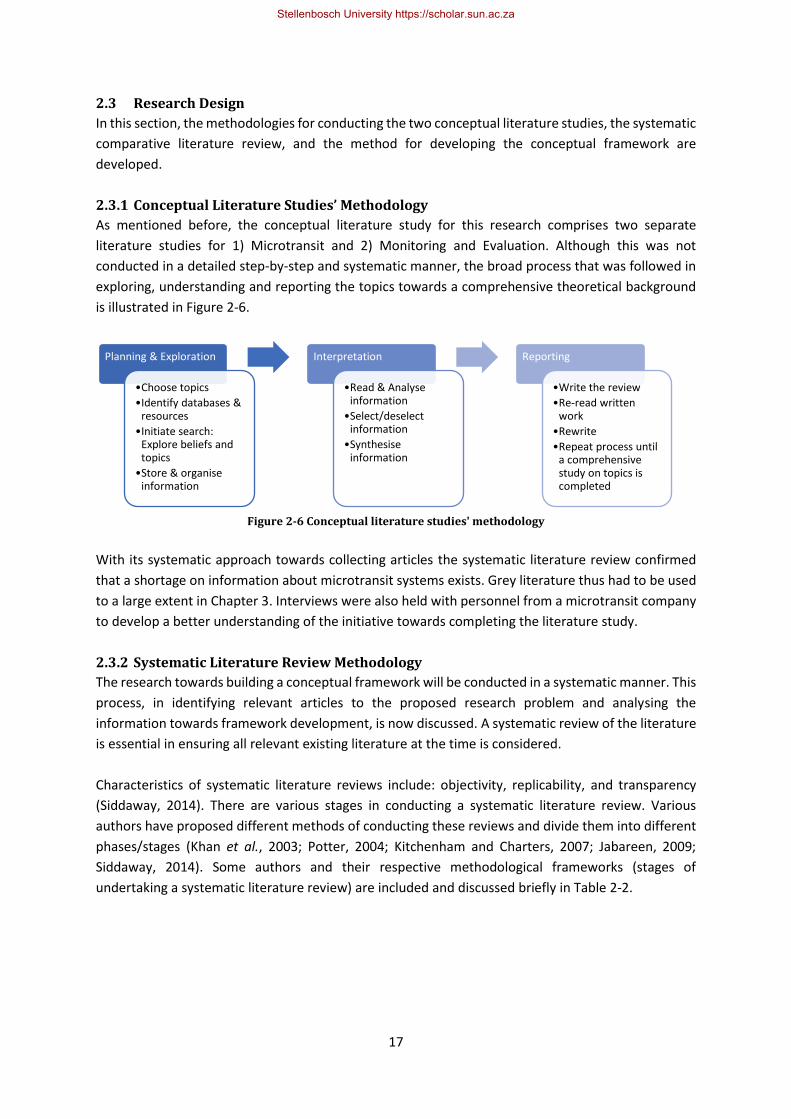
17
2.3 Research Design
In this section, the methodologies for conducting the two conceptual literature studies, the systematic
comparative literature review, and the method for developing the conceptual framework are
developed.
2.3.1 Conceptual Literature Studies’ Methodology
As mentioned before, the conceptual literature study for this research comprises two separate
literature studies for 1) Microtransit and 2) Monitoring and Evaluation. Although this was not
conducted in a detailed step-by-step and systematic manner, the broad process that was followed in
exploring, understanding and reporting the topics towards a comprehensive theoretical background
is illustrated in Figure 2-6.
Figure 2-6 Conceptual literature studies' methodology
With its systematic approach towards collecting articles the systematic literature review confirmed
that a shortage on information about microtransit systems exists. Grey literature thus had to be used
to a large extent in Chapter 3. Interviews were also held with personnel from a microtransit company
to develop a better understanding of the initiative towards completing the literature study.
2.3.2 Systematic Literature Review Methodology
The research towards building a conceptual framework will be conducted in a systematic manner. This
process, in identifying relevant articles to the proposed research problem and analysing the
information towards framework development, is now discussed. A systematic review of the literature
is essential in ensuring all relevant existing literature at the time is considered.
Characteristics of systematic literature reviews include: objectivity, replicability, and transparency
(Siddaway, 2014). There are various stages in conducting a systematic literature review. Various
authors have proposed different methods of conducting these reviews and divide them into different
phases/stages (Khan et al., 2003; Potter, 2004; Kitchenham and Charters, 2007; Jabareen, 2009;
Siddaway, 2014). Some authors and their respective methodological frameworks (stages of
undertaking a systematic literature review) are included and discussed briefly in Table 2-2.
Planning & Exploration
•Choose topics
•Identify databases & resources
•Initiate search: Explore beliefs and topics
•Store & organise information
Interpretation
•Read & Analyse information
•Select/deselect information
•Synthesise information
Reporting
•Write the review
•Re-read written work
•Rewrite
•Repeat process until a comprehensive study on topics is completed
Stellenbosch University https://scholar.sun.ac.za
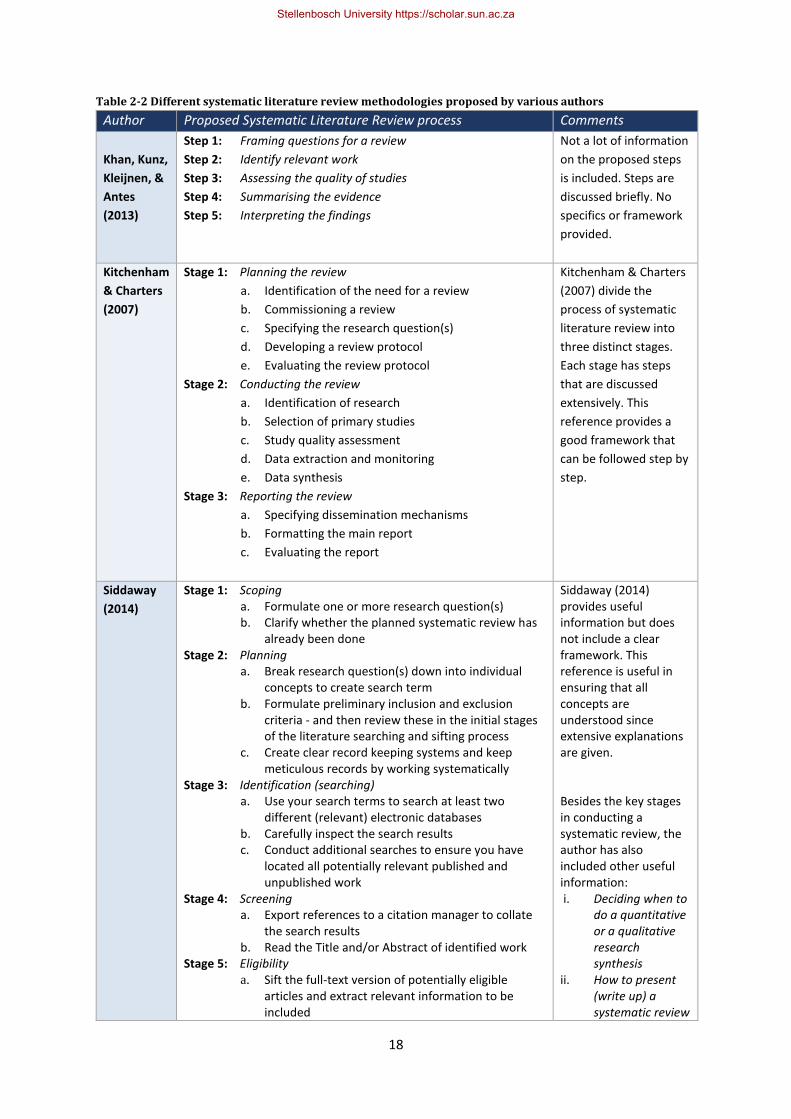
18
Table 2-2 Different systematic literature review methodologies proposed by various authors
Author Proposed Systematic Literature Review process Comments
Khan, Kunz,
Kleijnen, &
Antes
(2013)
Step 1: Framing questions for a review
Step 2: Identify relevant work
Step 3: Assessing the quality of studies
Step 4: Summarising the evidence
Step 5: Interpreting the findings
Not a lot of information
on the proposed steps
is included. Steps are
discussed briefly. No
specifics or framework
provided.
Kitchenham
& Charters
(2007)
Stage 1: Planning the review
a. Identification of the need for a review
b. Commissioning a review
c. Specifying the research question(s)
d. Developing a review protocol
e. Evaluating the review protocol
Stage 2: Conducting the review
a. Identification of research
b. Selection of primary studies
c. Study quality assessment
d. Data extraction and monitoring
e. Data synthesis
Stage 3: Reporting the review
a. Specifying dissemination mechanisms
b. Formatting the main report
c. Evaluating the report
Kitchenham & Charters
(2007) divide the
process of systematic
literature review into
three distinct stages.
Each stage has steps
that are discussed
extensively. This
reference provides a
good framework that
can be followed step by
step.
Siddaway
(2014)
Stage 1: Scoping a. Formulate one or more research question(s) b. Clarify whether the planned systematic review has
already been done Stage 2: Planning
a. Break research question(s) down into individual concepts to create search term
b. Formulate preliminary inclusion and exclusion criteria - and then review these in the initial stages of the literature searching and sifting process
c. Create clear record keeping systems and keep meticulous records by working systematically
Stage 3: Identification (searching) a. Use your search terms to search at least two
different (relevant) electronic databases b. Carefully inspect the search results c. Conduct additional searches to ensure you have
located all potentially relevant published and unpublished work
Stage 4: Screening a. Export references to a citation manager to collate
the search results b. Read the Title and/or Abstract of identified work
Stage 5: Eligibility a. Sift the full-text version of potentially eligible
articles and extract relevant information to be included
Siddaway (2014) provides useful information but does not include a clear framework. This reference is useful in ensuring that all concepts are understood since extensive explanations are given. Besides the key stages in conducting a systematic review, the author has also included other useful information: i. Deciding when to
do a quantitative or a qualitative research synthesis
ii. How to present (write up) a systematic review
Stellenbosch University https://scholar.sun.ac.za
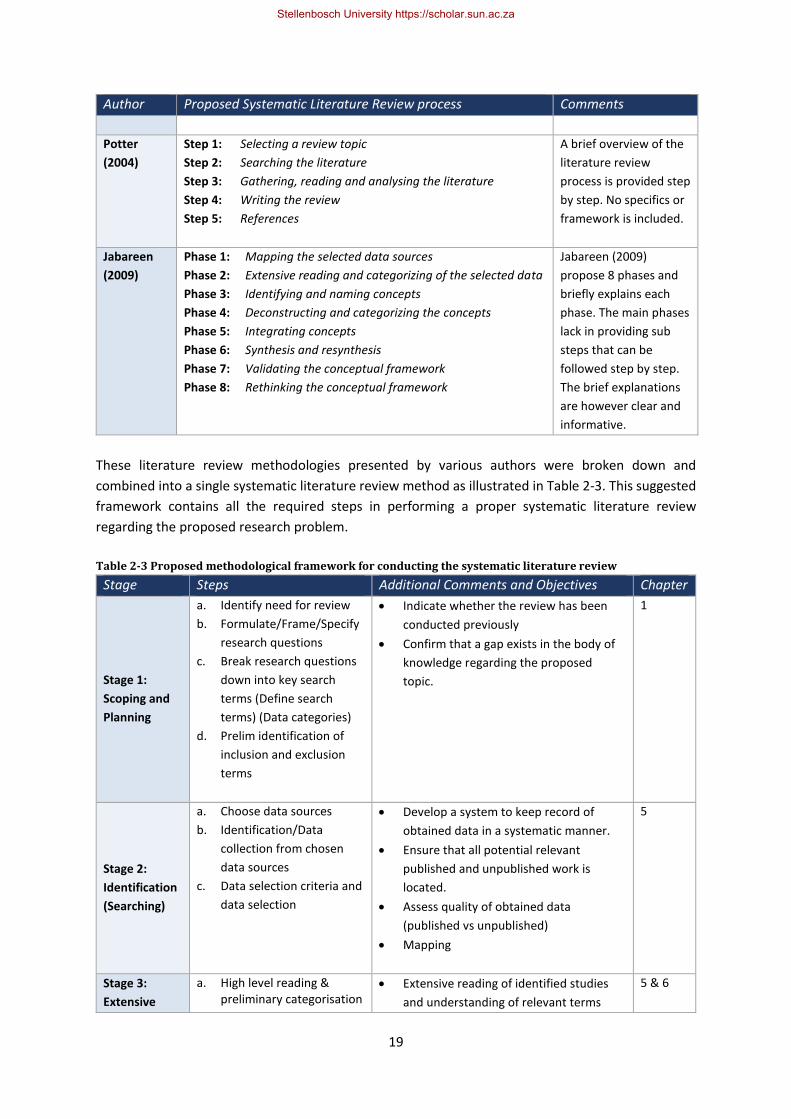
19
Author Proposed Systematic Literature Review process Comments
Potter
(2004)
Step 1: Selecting a review topic
Step 2: Searching the literature
Step 3: Gathering, reading and analysing the literature
Step 4: Writing the review
Step 5: References
A brief overview of the
literature review
process is provided step
by step. No specifics or
framework is included.
Jabareen
(2009)
Phase 1: Mapping the selected data sources
Phase 2: Extensive reading and categorizing of the selected data
Phase 3: Identifying and naming concepts
Phase 4: Deconstructing and categorizing the concepts
Phase 5: Integrating concepts
Phase 6: Synthesis and resynthesis
Phase 7: Validating the conceptual framework
Phase 8: Rethinking the conceptual framework
Jabareen (2009)
propose 8 phases and
briefly explains each
phase. The main phases
lack in providing sub
steps that can be
followed step by step.
The brief explanations
are however clear and
informative.
These literature review methodologies presented by various authors were broken down and
combined into a single systematic literature review method as illustrated in Table 2-3. This suggested
framework contains all the required steps in performing a proper systematic literature review
regarding the proposed research problem.
Table 2-3 Proposed methodological framework for conducting the systematic literature review
Stage Steps Additional Comments and Objectives Chapter
Stage 1:
Scoping and
Planning
a. Identify need for review
b. Formulate/Frame/Specify
research questions
c. Break research questions
down into key search
terms (Define search
terms) (Data categories)
d. Prelim identification of
inclusion and exclusion
terms
• Indicate whether the review has been
conducted previously
• Confirm that a gap exists in the body of
knowledge regarding the proposed
topic.
1
Stage 2:
Identification
(Searching)
a. Choose data sources
b. Identification/Data
collection from chosen
data sources
c. Data selection criteria and
data selection
• Develop a system to keep record of
obtained data in a systematic manner.
• Ensure that all potential relevant
published and unpublished work is
located.
• Assess quality of obtained data
(published vs unpublished)
• Mapping
5
Stage 3:
Extensive
a. High level reading & preliminary categorisation
• Extensive reading of identified studies
and understanding of relevant terms
5 & 6
Stellenbosch University https://scholar.sun.ac.za
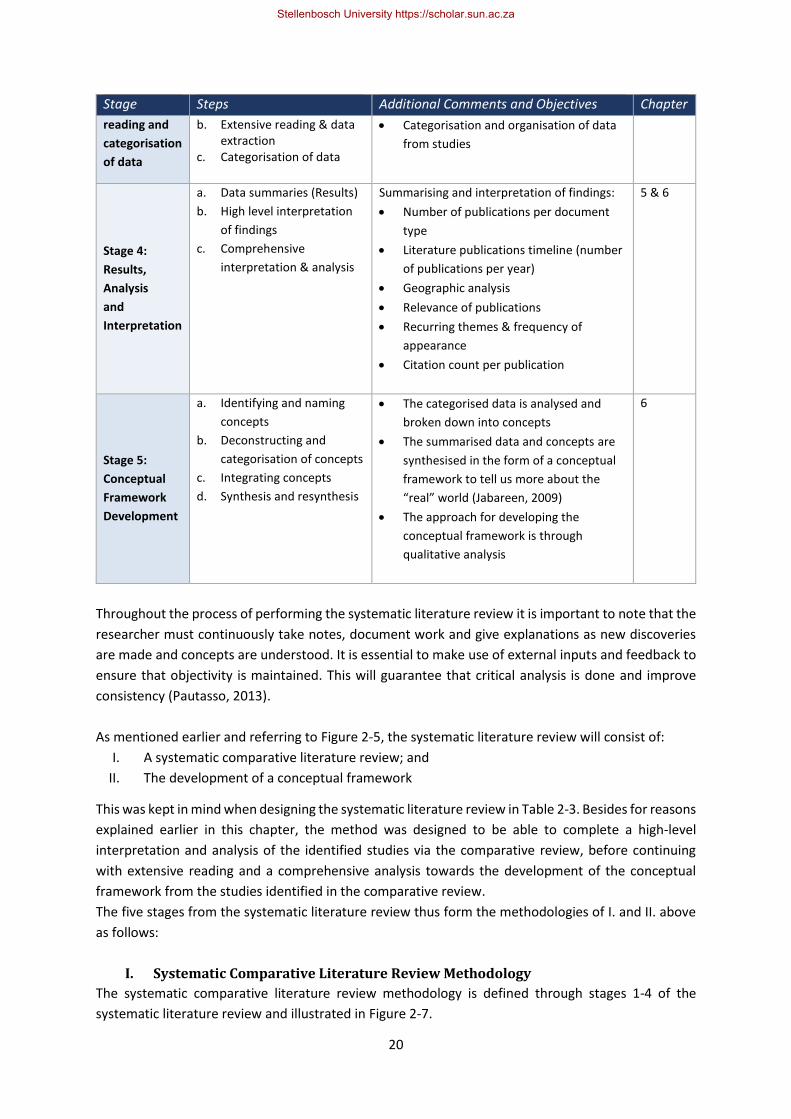
20
Stage Steps Additional Comments and Objectives Chapter
reading and
categorisation
of data
b. Extensive reading & data extraction
c. Categorisation of data
• Categorisation and organisation of data
from studies
Stage 4:
Results,
Analysis
and
Interpretation
a. Data summaries (Results)
b. High level interpretation
of findings
c. Comprehensive
interpretation & analysis
Summarising and interpretation of findings:
• Number of publications per document
type
• Literature publications timeline (number
of publications per year)
• Geographic analysis
• Relevance of publications
• Recurring themes & frequency of
appearance
• Citation count per publication
5 & 6
Stage 5:
Conceptual
Framework
Development
a. Identifying and naming
concepts
b. Deconstructing and
categorisation of concepts
c. Integrating concepts
d. Synthesis and resynthesis
• The categorised data is analysed and
broken down into concepts
• The summarised data and concepts are
synthesised in the form of a conceptual
framework to tell us more about the
“real” world (Jabareen, 2009)
• The approach for developing the
conceptual framework is through
qualitative analysis
6
Throughout the process of performing the systematic literature review it is important to note that the
researcher must continuously take notes, document work and give explanations as new discoveries
are made and concepts are understood. It is essential to make use of external inputs and feedback to
ensure that objectivity is maintained. This will guarantee that critical analysis is done and improve
consistency (Pautasso, 2013).
As mentioned earlier and referring to Figure 2-5, the systematic literature review will consist of:
I. A systematic comparative literature review; and
II. The development of a conceptual framework
This was kept in mind when designing the systematic literature review in Table 2-3. Besides for reasons
explained earlier in this chapter, the method was designed to be able to complete a high-level
interpretation and analysis of the identified studies via the comparative review, before continuing
with extensive reading and a comprehensive analysis towards the development of the conceptual
framework from the studies identified in the comparative review.
The five stages from the systematic literature review thus form the methodologies of I. and II. above
as follows:
I. Systematic Comparative Literature Review Methodology
The systematic comparative literature review methodology is defined through stages 1-4 of the
systematic literature review and illustrated in Figure 2-7.
Stellenbosch University https://scholar.sun.ac.za
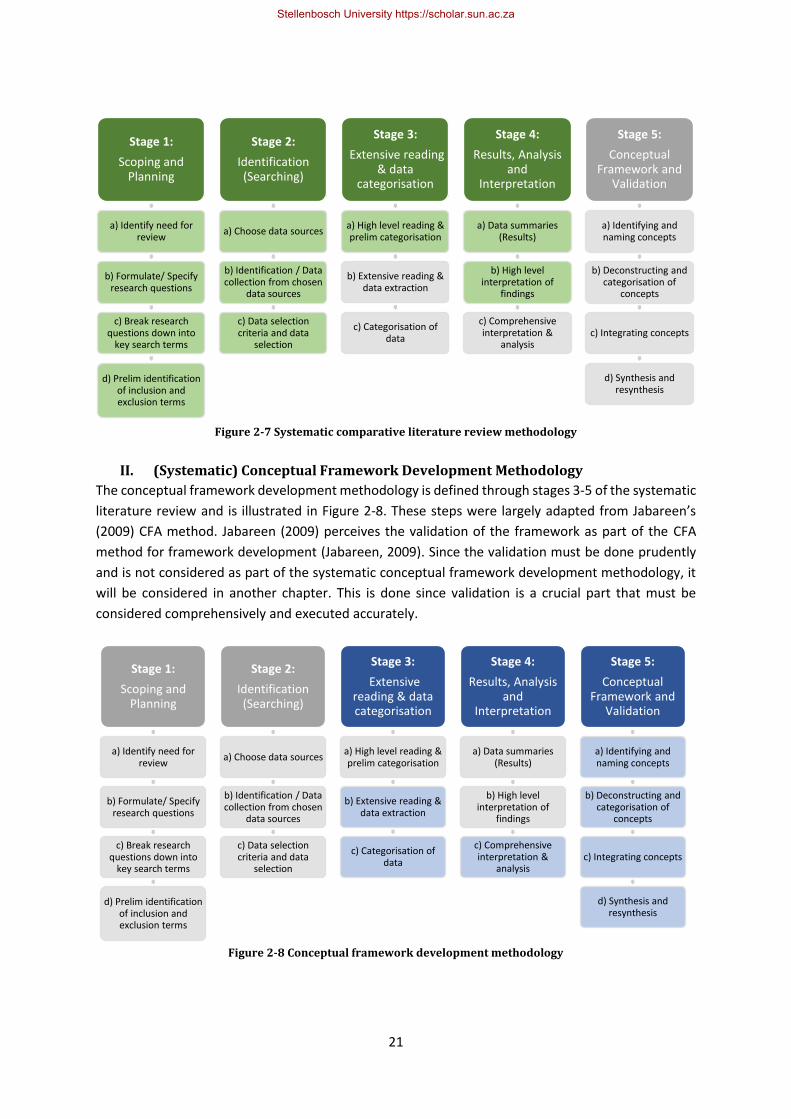
21
Figure 2-7 Systematic comparative literature review methodology
II. (Systematic) Conceptual Framework Development Methodology
The conceptual framework development methodology is defined through stages 3-5 of the systematic
literature review and is illustrated in Figure 2-8. These steps were largely adapted from Jabareen’s
(2009) CFA method. Jabareen (2009) perceives the validation of the framework as part of the CFA
method for framework development (Jabareen, 2009). Since the validation must be done prudently
and is not considered as part of the systematic conceptual framework development methodology, it
will be considered in another chapter. This is done since validation is a crucial part that must be
considered comprehensively and executed accurately.
Figure 2-8 Conceptual framework development methodology
Stage 1:
Scoping and Planning
a) Identify need for review
b) Formulate/ Specify research questions
c) Break research questions down into
key search terms
d) Prelim identification of inclusion and exclusion terms
Stage 2:
Identification (Searching)
a) Choose data sources
b) Identification / Data collection from chosen
data sources
c) Data selection criteria and data
selection
Stage 3:
Extensive reading & data
categorisation
a) High level reading & prelim categorisation
b) Extensive reading & data extraction
c) Categorisation of data
Stage 4:
Results, Analysis and
Interpretation
a) Data summaries (Results)
b) High level interpretation of
findings
c) Comprehensive interpretation &
analysis
Stage 5:
Conceptual Framework and
Validation
a) Identifying and naming concepts
b) Deconstructing and categorisation of
concepts
c) Integrating concepts
d) Synthesis and resynthesis
Stage 1:
Scoping and Planning
a) Identify need for review
b) Formulate/ Specify research questions
c) Break research questions down into
key search terms
d) Prelim identification of inclusion and exclusion terms
Stage 2:
Identification (Searching)
a) Choose data sources
b) Identification / Data collection from chosen
data sources
c) Data selection criteria and data
selection
Stage 3:
Extensive reading & data categorisation
a) High level reading & prelim categorisation
b) Extensive reading & data extraction
c) Categorisation of data
Stage 4:
Results, Analysis and
Interpretation
a) Data summaries (Results)
b) High level interpretation of
findings
c) Comprehensive interpretation &
analysis
Stage 5:
Conceptual Framework and
Validation
a) Identifying and naming concepts
b) Deconstructing and categorisation of
concepts
c) Integrating concepts
d) Synthesis and resynthesis
Stellenbosch University https://scholar.sun.ac.za
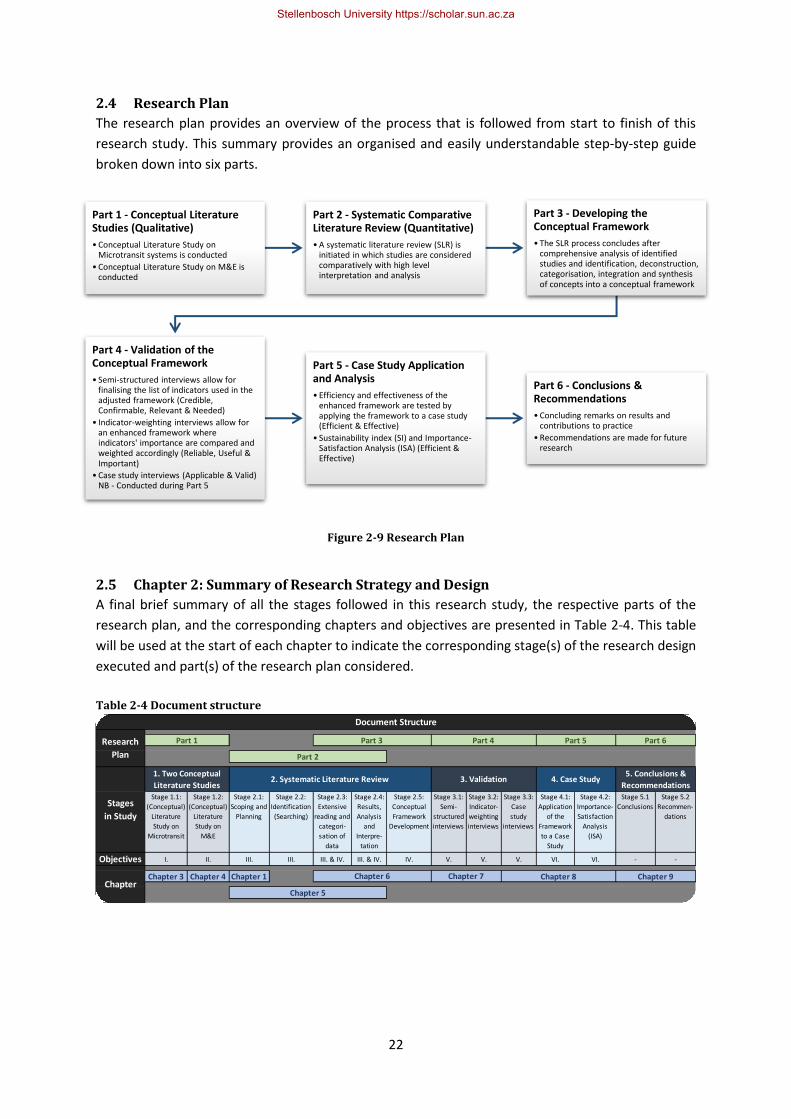
22
2.4 Research Plan
The research plan provides an overview of the process that is followed from start to finish of this
research study. This summary provides an organised and easily understandable step-by-step guide
broken down into six parts.
2.5 Chapter 2: Summary of Research Strategy and Design
A final brief summary of all the stages followed in this research study, the respective parts of the
research plan, and the corresponding chapters and objectives are presented in Table 2-4. This table
will be used at the start of each chapter to indicate the corresponding stage(s) of the research design
executed and part(s) of the research plan considered.
Table 2-4 Document structure
Stage 1.1:
(Conceptual)
Literature
Study on
Microtransit
Stage 1.2:
(Conceptual)
Literature
Study on
M&E
Stage 2.1:
Scoping and
Planning
Stage 2.2:
Identification
(Searching)
Stage 2.3:
Extensive
reading and
categori-
sation of
data
Stage 2.4:
Results,
Analysis
and
Interpre-
tation
Stage 2.5:
Conceptual
Framework
Development
Stage 3.1:
Semi-
structured
interviews
Stage 3.2:
Indicator-
weighting
interviews
Stage 3.3:
Case
study
interviews
Stage 4.1:
Application
of the
Framework
to a Case
Study
Stage 4.2:
Importance-
Satisfaction
Analysis
(ISA)
Stage 5.1
Conclusions
Stage 5.2
Recommen-
dations
Objectives I. II. III. III. III. & IV. III. & IV. IV. V. V. V. VI. VI. - -
Chapter 3 Chapter 4 Chapter 1
3. Validation
Chapter 7 Chapter 8
Part 4
Document Structure
Research
Plan
Part 1 Part 3 Part 5 Part 6
Part 2
ChapterChapter 6 Chapter 9
Chapter 5
Stages
in Study
1. Two Conceptual
Literature Studies2. Systematic Literature Review 4. Case Study
5. Conclusions &
Recommendations
Part 1 - Conceptual Literature Studies (Qualitative)
• Conceptual Literature Study on Microtransit systems is conducted
• Conceptual Literature Study on M&E is conducted
Part 2 - Systematic Comparative Literature Review (Quantitative)
• A systematic literature review (SLR) is initiated in which studies are considered comparatively with high level interpretation and analysis
Part 3 - Developing the Conceptual Framework
• The SLR process concludes after comprehensive analysis of identified studies and identification, deconstruction, categorisation, integration and synthesis of concepts into a conceptual framework
Part 4 - Validation of the Conceptual Framework
• Semi-structured interviews allow for finalising the list of indicators used in the adjusted framework (Credible, Confirmable, Relevant & Needed)
• Indicator-weighting interviews allow for an enhanced framework where indicators' importance are compared and weighted accordingly (Reliable, Useful & Important)
• Case study interviews (Applicable & Valid) NB - Conducted during Part 5
Part 5 - Case Study Application and Analysis
• Efficiency and effectiveness of the enhanced framework are tested by applying the framework to a case study (Efficient & Effective)
• Sustainability index (SI) and Importance-Satisfaction Analysis (ISA) (Efficient & Effective)
Part 6 - Conclusions & Recommendations
• Concluding remarks on results and contributions to practice
• Recommendations are made for future research
Figure 2-9 Research Plan
Stellenbosch University https://scholar.sun.ac.za
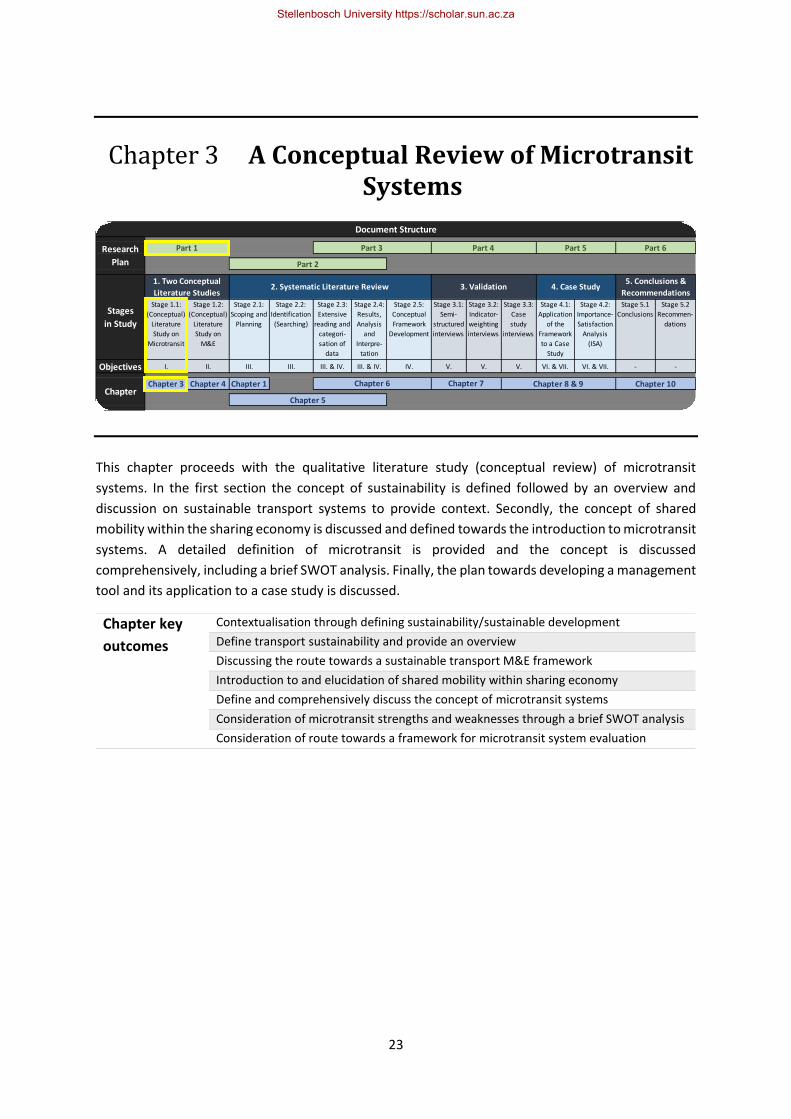
23
Chapter 3 A Conceptual Review of Microtransit Systems
This chapter proceeds with the qualitative literature study (conceptual review) of microtransit
systems. In the first section the concept of sustainability is defined followed by an overview and
discussion on sustainable transport systems to provide context. Secondly, the concept of shared
mobility within the sharing economy is discussed and defined towards the introduction to microtransit
systems. A detailed definition of microtransit is provided and the concept is discussed
comprehensively, including a brief SWOT analysis. Finally, the plan towards developing a management
tool and its application to a case study is discussed.
Stage 1.1:
(Conceptual)
Literature
Study on
Microtransit
Stage 1.2:
(Conceptual)
Literature
Study on
M&E
Stage 2.1:
Scoping and
Planning
Stage 2.2:
Identification
(Searching)
Stage 2.3:
Extensive
reading and
categori-
sation of
data
Stage 2.4:
Results,
Analysis
and
Interpre-
tation
Stage 2.5:
Conceptual
Framework
Development
Stage 3.1:
Semi-
structured
interviews
Stage 3.2:
Indicator-
weighting
interviews
Stage 3.3:
Case
study
interviews
Stage 4.1:
Application
of the
Framework
to a Case
Study
Stage 4.2:
Importance-
Satisfaction
Analysis
(ISA)
Stage 5.1
Conclusions
Stage 5.2
Recommen-
dations
Objectives I. II. III. III. III. & IV. III. & IV. IV. V. V. V. VI. & VII. VI. & VII. - -
Chapter 3 Chapter 4 Chapter 1
Stages
in Study
1. Two Conceptual
Literature Studies2. Systematic Literature Review 3. Validation 4. Case Study
5. Conclusions &
Recommendations
ChapterChapter 6 Chapter 7 Chapter 8 & 9 Chapter 10
Chapter 5
Document Structure
Research
Plan
Part 1 Part 3 Part 4 Part 5 Part 6
Part 2
Chapter key
outcomes
Contextualisation through defining sustainability/sustainable development
Define transport sustainability and provide an overview
Discussing the route towards a sustainable transport M&E framework
Introduction to and elucidation of shared mobility within sharing economy
Define and comprehensively discuss the concept of microtransit systems
Consideration of microtransit strengths and weaknesses through a brief SWOT analysis
Consideration of route towards a framework for microtransit system evaluation
Stellenbosch University https://scholar.sun.ac.za
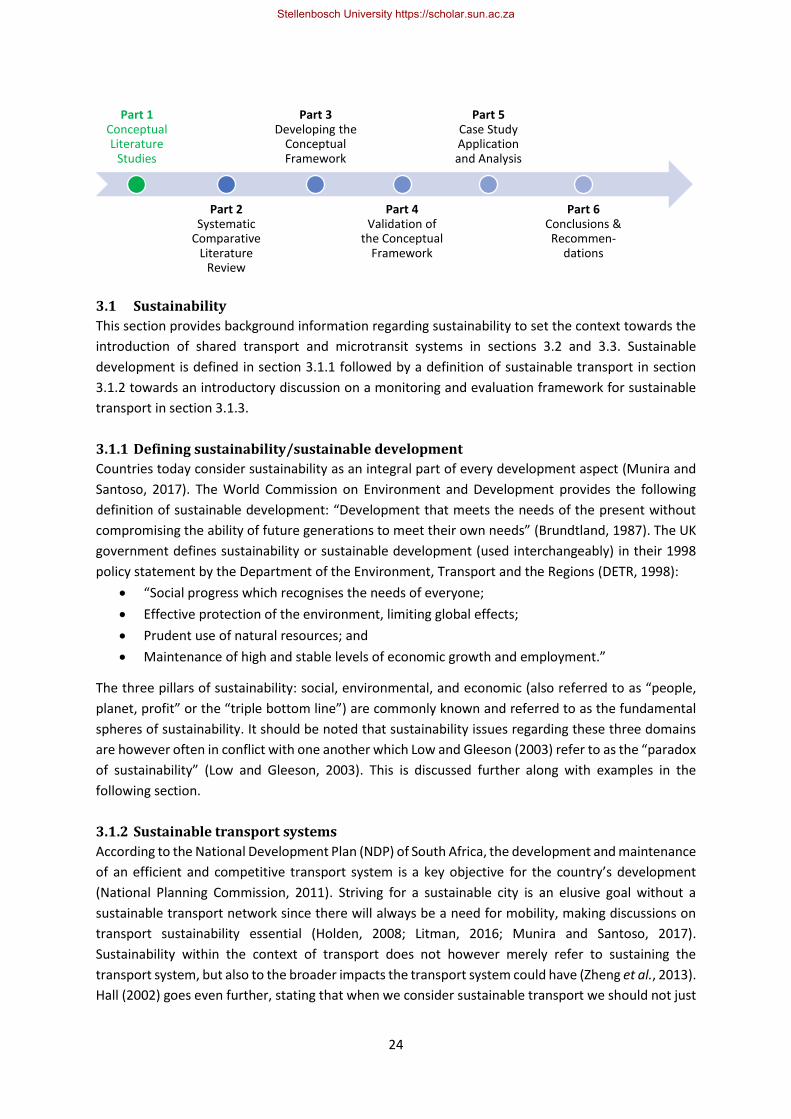
24
3.1 Sustainability
This section provides background information regarding sustainability to set the context towards the
introduction of shared transport and microtransit systems in sections 3.2 and 3.3. Sustainable
development is defined in section 3.1.1 followed by a definition of sustainable transport in section
3.1.2 towards an introductory discussion on a monitoring and evaluation framework for sustainable
transport in section 3.1.3.
3.1.1 Defining sustainability/sustainable development
Countries today consider sustainability as an integral part of every development aspect (Munira and
Santoso, 2017). The World Commission on Environment and Development provides the following
definition of sustainable development: “Development that meets the needs of the present without
compromising the ability of future generations to meet their own needs” (Brundtland, 1987). The UK
government defines sustainability or sustainable development (used interchangeably) in their 1998
policy statement by the Department of the Environment, Transport and the Regions (DETR, 1998):
• “Social progress which recognises the needs of everyone;
• Effective protection of the environment, limiting global effects;
• Prudent use of natural resources; and
• Maintenance of high and stable levels of economic growth and employment.”
The three pillars of sustainability: social, environmental, and economic (also referred to as “people,
planet, profit” or the “triple bottom line”) are commonly known and referred to as the fundamental
spheres of sustainability. It should be noted that sustainability issues regarding these three domains
are however often in conflict with one another which Low and Gleeson (2003) refer to as the “paradox
of sustainability” (Low and Gleeson, 2003). This is discussed further along with examples in the
following section.
3.1.2 Sustainable transport systems
According to the National Development Plan (NDP) of South Africa, the development and maintenance
of an efficient and competitive transport system is a key objective for the country’s development
(National Planning Commission, 2011). Striving for a sustainable city is an elusive goal without a
sustainable transport network since there will always be a need for mobility, making discussions on
transport sustainability essential (Holden, 2008; Litman, 2016; Munira and Santoso, 2017).
Sustainability within the context of transport does not however merely refer to sustaining the
transport system, but also to the broader impacts the transport system could have (Zheng et al., 2013).
Hall (2002) goes even further, stating that when we consider sustainable transport we should not just
Part 1 Conceptual Literature
Studies
Part 2 Systematic
Comparative Literature
Review
Part 3 Developing the
Conceptual Framework
Part 4 Validation of
the Conceptual Framework
Part 5 Case Study Application and Analysis
Part 6 Conclusions & Recommen-
dations
Stellenbosch University https://scholar.sun.ac.za
25
consider the broader impacts of the modes of transport, but also the implications that enhanced
mobility might bring (Hall, 2002).
The Asian Development Bank (ADB) Sustainable Transport Initiative (2010) states that “sustainable
transport supports a competitive economy and balanced regional development. It also promotes
equity, including gender equity, affordability, minimum use of land and resources, consequently
reducing emissions, waste, and noise” (ADB, 2010). The Centre for Sustainable Transportation (1998)
provides a more detailed definition which is widely accepted (Gilbert and Myrans, 2002; Cormier and
Gilbert, 2005; Munira and Santoso, 2017) stating that a sustainable transport system…
“1) …allows the basic access needs of individuals and societies to be met safely
and in a manner consistent with human and ecosystem health, and with equity
within and between generations.
2) It is affordable, operates efficiently, offers the choice of transport mode, and
supports a vibrant economy.
3) It limits emissions and waste within the planet’s ability to absorb them,
minimises consumption of nonrenewable resources, limits consumption of
renewable resources to the sustainable yield level, reuses and recycles its
components, and minimizes the use of land and the production of noise.” (CST,
1998)
The Ministers of Transport of the 15 European Union countries have adopted this definition almost
word for word. It is due to this reason that the European arm of the Rand Corporation and several
partners believe that this definition of sustainable transport should be favoured since it “has been
reviewed by political mechanisms and received general political acceptance” (Cormier and Gilbert,
2005).
Goals towards environmental conservation, social responsibility, and economic viability often overlap
or are in conflict with one another making it difficult to operationalize the concept of sustainability
(Low and Gleeson, 2003; Olofsson et al., 2011; Litman, 2016). Munira and Santosa (2017) provide
some examples: Although air pollution is an environmental issue, it also has effects on human health
(social) and agricultural activities (economic). Traffic congestion also impacts all three spheres since it
adds stress to people’s lives (social), causes increased pollution (environmental), and results in GDP
losses in lost productivity and hours worked (economic) (Munira and Santoso, 2017). These
overlapping issues are illustrated with a Venn diagram in Figure 3-1.
Stellenbosch University https://scholar.sun.ac.za
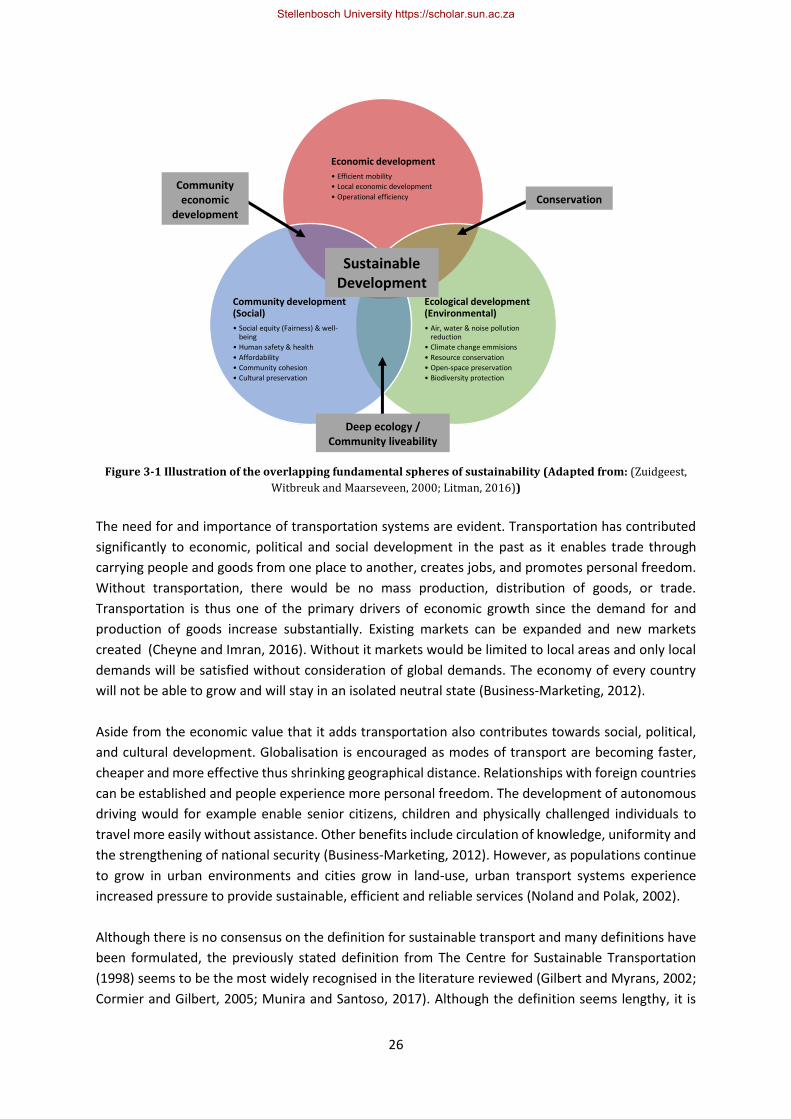
26
Figure 3-1 Illustration of the overlapping fundamental spheres of sustainability (Adapted from: (Zuidgeest,
Witbreuk and Maarseveen, 2000; Litman, 2016))
The need for and importance of transportation systems are evident. Transportation has contributed
significantly to economic, political and social development in the past as it enables trade through
carrying people and goods from one place to another, creates jobs, and promotes personal freedom.
Without transportation, there would be no mass production, distribution of goods, or trade.
Transportation is thus one of the primary drivers of economic growth since the demand for and
production of goods increase substantially. Existing markets can be expanded and new markets
created (Cheyne and Imran, 2016). Without it markets would be limited to local areas and only local
demands will be satisfied without consideration of global demands. The economy of every country
will not be able to grow and will stay in an isolated neutral state (Business-Marketing, 2012).
Aside from the economic value that it adds transportation also contributes towards social, political,
and cultural development. Globalisation is encouraged as modes of transport are becoming faster,
cheaper and more effective thus shrinking geographical distance. Relationships with foreign countries
can be established and people experience more personal freedom. The development of autonomous
driving would for example enable senior citizens, children and physically challenged individuals to
travel more easily without assistance. Other benefits include circulation of knowledge, uniformity and
the strengthening of national security (Business-Marketing, 2012). However, as populations continue
to grow in urban environments and cities grow in land-use, urban transport systems experience
increased pressure to provide sustainable, efficient and reliable services (Noland and Polak, 2002).
Although there is no consensus on the definition for sustainable transport and many definitions have
been formulated, the previously stated definition from The Centre for Sustainable Transportation
(1998) seems to be the most widely recognised in the literature reviewed (Gilbert and Myrans, 2002;
Cormier and Gilbert, 2005; Munira and Santoso, 2017). Although the definition seems lengthy, it is
Economic development
• Efficient mobility
• Local economic development
• Operational efficiency
Ecological development (Environmental)
• Air, water & noise pollution reduction
• Climate change emmisions
• Resource conservation
• Open-space preservation
• Biodiversity protection
Community development (Social)
• Social equity (Fairness) & well-being
• Human safety & health
• Affordability
• Community cohesion
• Cultural preservation
Sustainable Development
Deep ecology / Community liveability
Community economic
development
Conservation
Stellenbosch University https://scholar.sun.ac.za
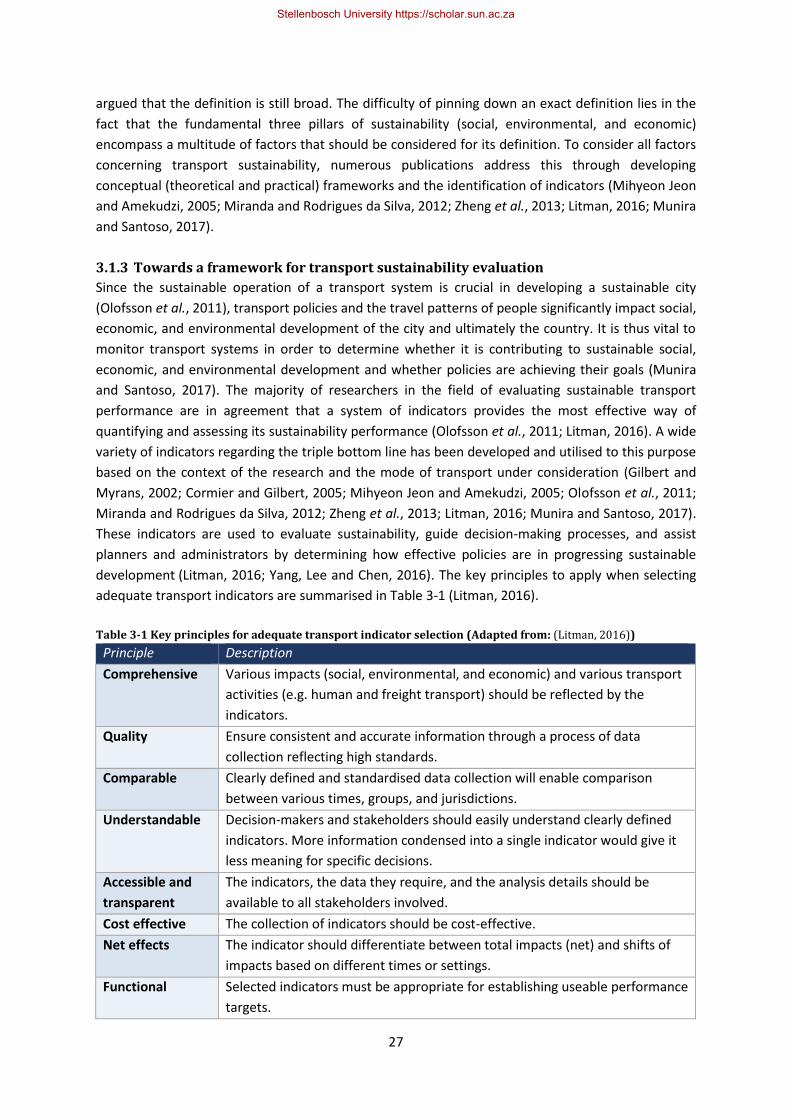
27
argued that the definition is still broad. The difficulty of pinning down an exact definition lies in the
fact that the fundamental three pillars of sustainability (social, environmental, and economic)
encompass a multitude of factors that should be considered for its definition. To consider all factors
concerning transport sustainability, numerous publications address this through developing
conceptual (theoretical and practical) frameworks and the identification of indicators (Mihyeon Jeon
and Amekudzi, 2005; Miranda and Rodrigues da Silva, 2012; Zheng et al., 2013; Litman, 2016; Munira
and Santoso, 2017).
3.1.3 Towards a framework for transport sustainability evaluation
Since the sustainable operation of a transport system is crucial in developing a sustainable city
(Olofsson et al., 2011), transport policies and the travel patterns of people significantly impact social,
economic, and environmental development of the city and ultimately the country. It is thus vital to
monitor transport systems in order to determine whether it is contributing to sustainable social,
economic, and environmental development and whether policies are achieving their goals (Munira
and Santoso, 2017). The majority of researchers in the field of evaluating sustainable transport
performance are in agreement that a system of indicators provides the most effective way of
quantifying and assessing its sustainability performance (Olofsson et al., 2011; Litman, 2016). A wide
variety of indicators regarding the triple bottom line has been developed and utilised to this purpose
based on the context of the research and the mode of transport under consideration (Gilbert and
Myrans, 2002; Cormier and Gilbert, 2005; Mihyeon Jeon and Amekudzi, 2005; Olofsson et al., 2011;
Miranda and Rodrigues da Silva, 2012; Zheng et al., 2013; Litman, 2016; Munira and Santoso, 2017).
These indicators are used to evaluate sustainability, guide decision-making processes, and assist
planners and administrators by determining how effective policies are in progressing sustainable
development (Litman, 2016; Yang, Lee and Chen, 2016). The key principles to apply when selecting
adequate transport indicators are summarised in Table 3-1 (Litman, 2016).
Table 3-1 Key principles for adequate transport indicator selection (Adapted from: (Litman, 2016))
Principle Description
Comprehensive Various impacts (social, environmental, and economic) and various transport
activities (e.g. human and freight transport) should be reflected by the
indicators.
Quality Ensure consistent and accurate information through a process of data
collection reflecting high standards.
Comparable Clearly defined and standardised data collection will enable comparison
between various times, groups, and jurisdictions.
Understandable Decision-makers and stakeholders should easily understand clearly defined
indicators. More information condensed into a single indicator would give it
less meaning for specific decisions.
Accessible and
transparent
The indicators, the data they require, and the analysis details should be
available to all stakeholders involved.
Cost effective The collection of indicators should be cost-effective.
Net effects The indicator should differentiate between total impacts (net) and shifts of
impacts based on different times or settings.
Functional Selected indicators must be appropriate for establishing useable performance
targets.
Stellenbosch University https://scholar.sun.ac.za
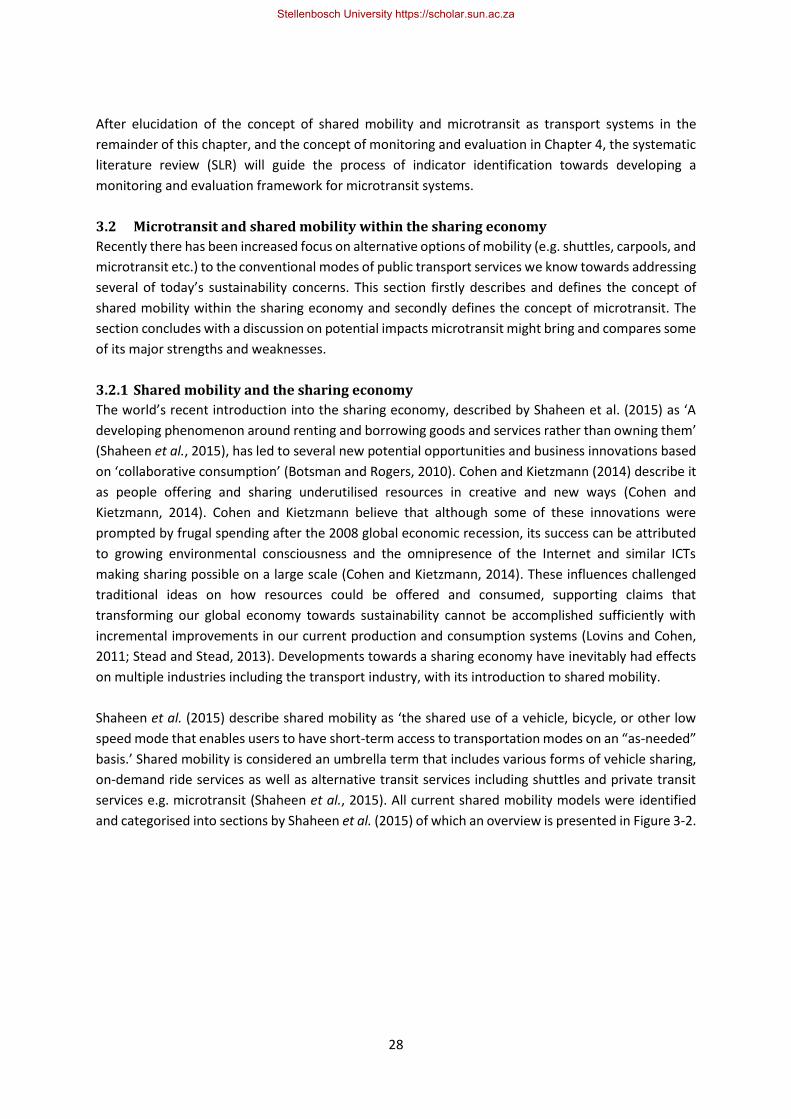
28
After elucidation of the concept of shared mobility and microtransit as transport systems in the
remainder of this chapter, and the concept of monitoring and evaluation in Chapter 4, the systematic
literature review (SLR) will guide the process of indicator identification towards developing a
monitoring and evaluation framework for microtransit systems.
3.2 Microtransit and shared mobility within the sharing economy
Recently there has been increased focus on alternative options of mobility (e.g. shuttles, carpools, and
microtransit etc.) to the conventional modes of public transport services we know towards addressing
several of today’s sustainability concerns. This section firstly describes and defines the concept of
shared mobility within the sharing economy and secondly defines the concept of microtransit. The
section concludes with a discussion on potential impacts microtransit might bring and compares some
of its major strengths and weaknesses.
3.2.1 Shared mobility and the sharing economy
The world’s recent introduction into the sharing economy, described by Shaheen et al. (2015) as ‘A
developing phenomenon around renting and borrowing goods and services rather than owning them’
(Shaheen et al., 2015), has led to several new potential opportunities and business innovations based
on ‘collaborative consumption’ (Botsman and Rogers, 2010). Cohen and Kietzmann (2014) describe it
as people offering and sharing underutilised resources in creative and new ways (Cohen and
Kietzmann, 2014). Cohen and Kietzmann believe that although some of these innovations were
prompted by frugal spending after the 2008 global economic recession, its success can be attributed
to growing environmental consciousness and the omnipresence of the Internet and similar ICTs
making sharing possible on a large scale (Cohen and Kietzmann, 2014). These influences challenged
traditional ideas on how resources could be offered and consumed, supporting claims that
transforming our global economy towards sustainability cannot be accomplished sufficiently with
incremental improvements in our current production and consumption systems (Lovins and Cohen,
2011; Stead and Stead, 2013). Developments towards a sharing economy have inevitably had effects
on multiple industries including the transport industry, with its introduction to shared mobility.
Shaheen et al. (2015) describe shared mobility as ‘the shared use of a vehicle, bicycle, or other low
speed mode that enables users to have short-term access to transportation modes on an “as-needed”
basis.’ Shared mobility is considered an umbrella term that includes various forms of vehicle sharing,
on-demand ride services as well as alternative transit services including shuttles and private transit
services e.g. microtransit (Shaheen et al., 2015). All current shared mobility models were identified
and categorised into sections by Shaheen et al. (2015) of which an overview is presented in Figure 3-2.
Stellenbosch University https://scholar.sun.ac.za
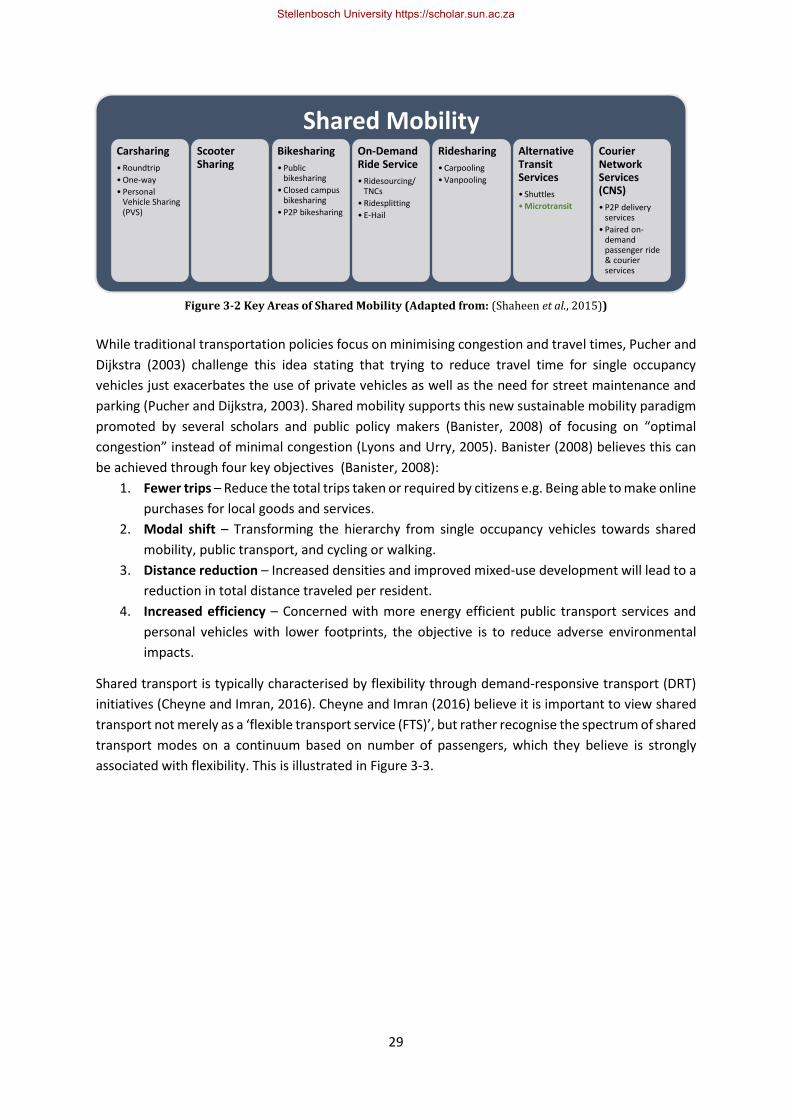
29
Figure 3-2 Key Areas of Shared Mobility (Adapted from: (Shaheen et al., 2015))
While traditional transportation policies focus on minimising congestion and travel times, Pucher and
Dijkstra (2003) challenge this idea stating that trying to reduce travel time for single occupancy
vehicles just exacerbates the use of private vehicles as well as the need for street maintenance and
parking (Pucher and Dijkstra, 2003). Shared mobility supports this new sustainable mobility paradigm
promoted by several scholars and public policy makers (Banister, 2008) of focusing on “optimal
congestion” instead of minimal congestion (Lyons and Urry, 2005). Banister (2008) believes this can
be achieved through four key objectives (Banister, 2008):
1. Fewer trips – Reduce the total trips taken or required by citizens e.g. Being able to make online
purchases for local goods and services.
2. Modal shift – Transforming the hierarchy from single occupancy vehicles towards shared
mobility, public transport, and cycling or walking.
3. Distance reduction – Increased densities and improved mixed-use development will lead to a
reduction in total distance traveled per resident.
4. Increased efficiency – Concerned with more energy efficient public transport services and
personal vehicles with lower footprints, the objective is to reduce adverse environmental
impacts.
Shared transport is typically characterised by flexibility through demand-responsive transport (DRT)
initiatives (Cheyne and Imran, 2016). Cheyne and Imran (2016) believe it is important to view shared
transport not merely as a ‘flexible transport service (FTS)’, but rather recognise the spectrum of shared
transport modes on a continuum based on number of passengers, which they believe is strongly
associated with flexibility. This is illustrated in Figure 3-3.
Shared MobilityCarsharing
• Roundtrip
• One-way
• Personal Vehicle Sharing (PVS)
Scooter Sharing
Bikesharing
• Public bikesharing
• Closed campus bikesharing
• P2P bikesharing
On-Demand Ride Service
• Ridesourcing/ TNCs
• Ridesplitting
• E-Hail
Ridesharing
• Carpooling
• Vanpooling
Alternative Transit Services
• Shuttles
• Microtransit
Courier Network Services (CNS)
• P2P delivery services
• Paired on-demand passenger ride & courier services
Stellenbosch University https://scholar.sun.ac.za
30
Figure 3-3 The continuum of shared transport (Source: (Cheyne and Imran, 2016))
Cheyne and Imran (2016) also believe that new digital platforms today provide flexible shared mobility
with opportunities to overcome several obstacles faced by public transport providers. They state that
transport policy-makers and planners need to recognise and support the expansion of flexible shared
transport due to its low carbon, and its social and economic inclusivity (Cheyne and Imran, 2016).
Several benefits regarding the triple bottom line have been reported through the use of various modes
of shared mobility. Numerous studies have observed a noticeable reduction in vehicle ownership,
vehicle usage, and vehicle total distance travelled (Shaheen et al., 2015). Shared transport could play
a vital role in bridging the gaps in current transport systems. Encouraging multi-modality by providing
‘first-and-last-mile’ solutions to public transit could extend the catchment area of public transit
(Shaheen et al., 2015). Further research is however needed to better understand the impacts each of
these wide variety of shared mobility modes could have on urban and regional development.
In this study, we consider microtransit systems as the mode of shared mobility. Although microtransit
has been around for many years, a renewed consideration thereof as a mode of shared mobility within
the “sharing economy” combined with ICT in an era of IoT will introduce a new understanding and
definition thereof and bring forward new possibilities. When considering the term in this regard,
microtransit is a contemporary concept of which little in-depth research has been conducted. Some
grey literature does however exist and will also be considered in the following section where a
definition is provided towards addressing the gap in literature regarding microtransit systems as a
mode of shared mobility.
3.2.2 Defining Microtransit
According to Shaheen et al. (2015), microtransit has only recently emerged as a more technology-
enabled alternative transit service incorporating flexible routing and/or flexible scheduling (Shaheen
et al., 2015). A key characteristic is connecting supply and demand through the use of ICT (Bos, 2015).
Making use of smartphone technology enables microtransit to avoid conventional and expensive
methods of booking rides. After considering various literature, some of the standout characteristics
also include: Microtransit can be described by vehicles operating on demand usually within a short-
distance range. This mode of transport lies somewhere between collective public transport and
individual private transport as illustrated in Figure 3-4 (Bos, 2015) and typically provides flexible ride
services for small-scale inner-city transport of either passengers or goods (Jaffe, 2015).
Stellenbosch University https://scholar.sun.ac.za
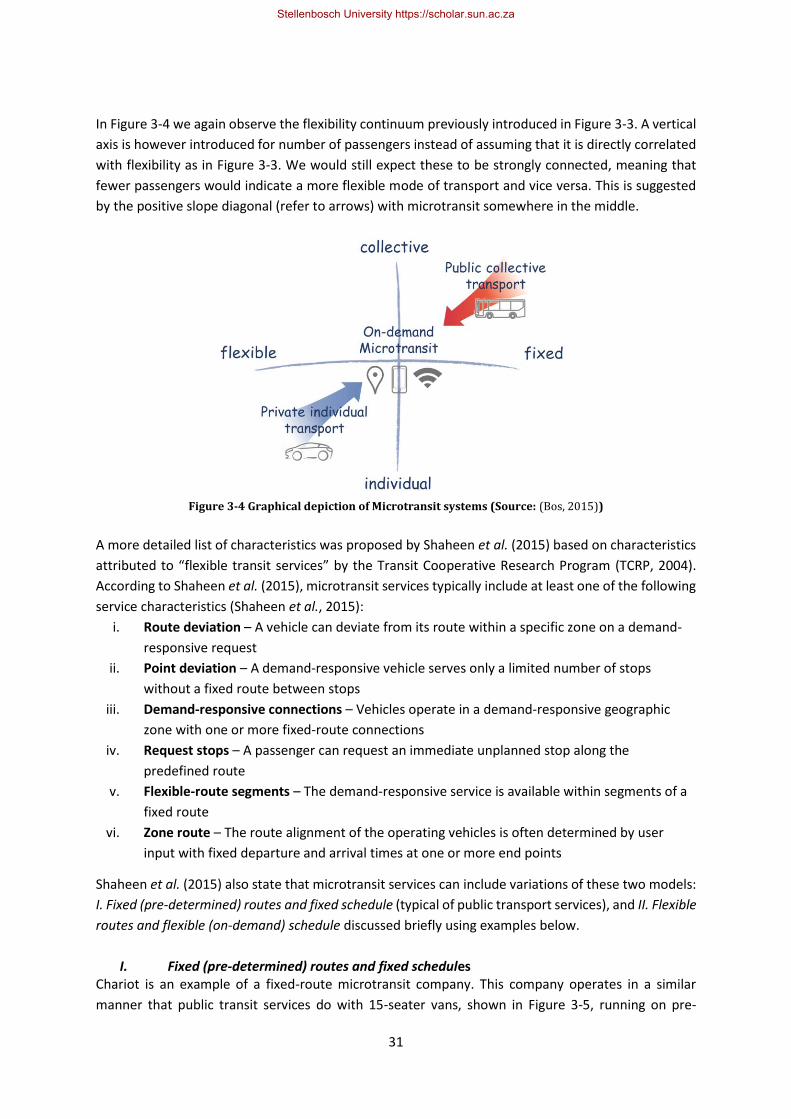
31
In Figure 3-4 we again observe the flexibility continuum previously introduced in Figure 3-3. A vertical
axis is however introduced for number of passengers instead of assuming that it is directly correlated
with flexibility as in Figure 3-3. We would still expect these to be strongly connected, meaning that
fewer passengers would indicate a more flexible mode of transport and vice versa. This is suggested
by the positive slope diagonal (refer to arrows) with microtransit somewhere in the middle.
Figure 3-4 Graphical depiction of Microtransit systems (Source: (Bos, 2015))
A more detailed list of characteristics was proposed by Shaheen et al. (2015) based on characteristics
attributed to “flexible transit services” by the Transit Cooperative Research Program (TCRP, 2004).
According to Shaheen et al. (2015), microtransit services typically include at least one of the following
service characteristics (Shaheen et al., 2015):
i. Route deviation – A vehicle can deviate from its route within a specific zone on a demand-
responsive request
ii. Point deviation – A demand-responsive vehicle serves only a limited number of stops
without a fixed route between stops
iii. Demand-responsive connections – Vehicles operate in a demand-responsive geographic
zone with one or more fixed-route connections
iv. Request stops – A passenger can request an immediate unplanned stop along the
predefined route
v. Flexible-route segments – The demand-responsive service is available within segments of a
fixed route
vi. Zone route – The route alignment of the operating vehicles is often determined by user
input with fixed departure and arrival times at one or more end points
Shaheen et al. (2015) also state that microtransit services can include variations of these two models:
I. Fixed (pre-determined) routes and fixed schedule (typical of public transport services), and II. Flexible
routes and flexible (on-demand) schedule discussed briefly using examples below.
I. Fixed (pre-determined) routes and fixed schedules Chariot is an example of a fixed-route microtransit company. This company operates in a similar
manner that public transit services do with 15-seater vans, shown in Figure 3-5, running on pre-
Stellenbosch University https://scholar.sun.ac.za
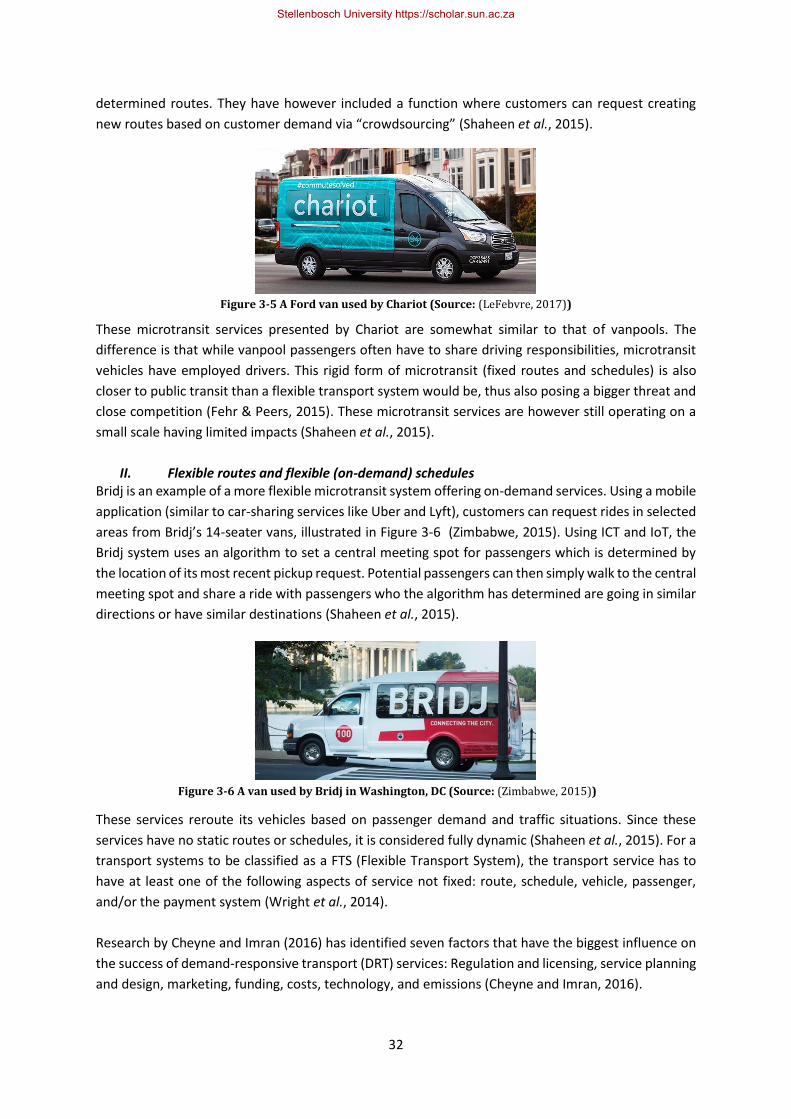
32
determined routes. They have however included a function where customers can request creating
new routes based on customer demand via “crowdsourcing” (Shaheen et al., 2015).
These microtransit services presented by Chariot are somewhat similar to that of vanpools. The
difference is that while vanpool passengers often have to share driving responsibilities, microtransit
vehicles have employed drivers. This rigid form of microtransit (fixed routes and schedules) is also
closer to public transit than a flexible transport system would be, thus also posing a bigger threat and
close competition (Fehr & Peers, 2015). These microtransit services are however still operating on a
small scale having limited impacts (Shaheen et al., 2015).
II. Flexible routes and flexible (on-demand) schedules Bridj is an example of a more flexible microtransit system offering on-demand services. Using a mobile
application (similar to car-sharing services like Uber and Lyft), customers can request rides in selected
areas from Bridj’s 14-seater vans, illustrated in Figure 3-6 (Zimbabwe, 2015). Using ICT and IoT, the
Bridj system uses an algorithm to set a central meeting spot for passengers which is determined by
the location of its most recent pickup request. Potential passengers can then simply walk to the central
meeting spot and share a ride with passengers who the algorithm has determined are going in similar
directions or have similar destinations (Shaheen et al., 2015).
These services reroute its vehicles based on passenger demand and traffic situations. Since these
services have no static routes or schedules, it is considered fully dynamic (Shaheen et al., 2015). For a
transport systems to be classified as a FTS (Flexible Transport System), the transport service has to
have at least one of the following aspects of service not fixed: route, schedule, vehicle, passenger,
and/or the payment system (Wright et al., 2014).
Research by Cheyne and Imran (2016) has identified seven factors that have the biggest influence on
the success of demand-responsive transport (DRT) services: Regulation and licensing, service planning
and design, marketing, funding, costs, technology, and emissions (Cheyne and Imran, 2016).
Figure 3-5 A Ford van used by Chariot (Source: (LeFebvre, 2017))
Figure 3-6 A van used by Bridj in Washington, DC (Source: (Zimbabwe, 2015))
Stellenbosch University https://scholar.sun.ac.za
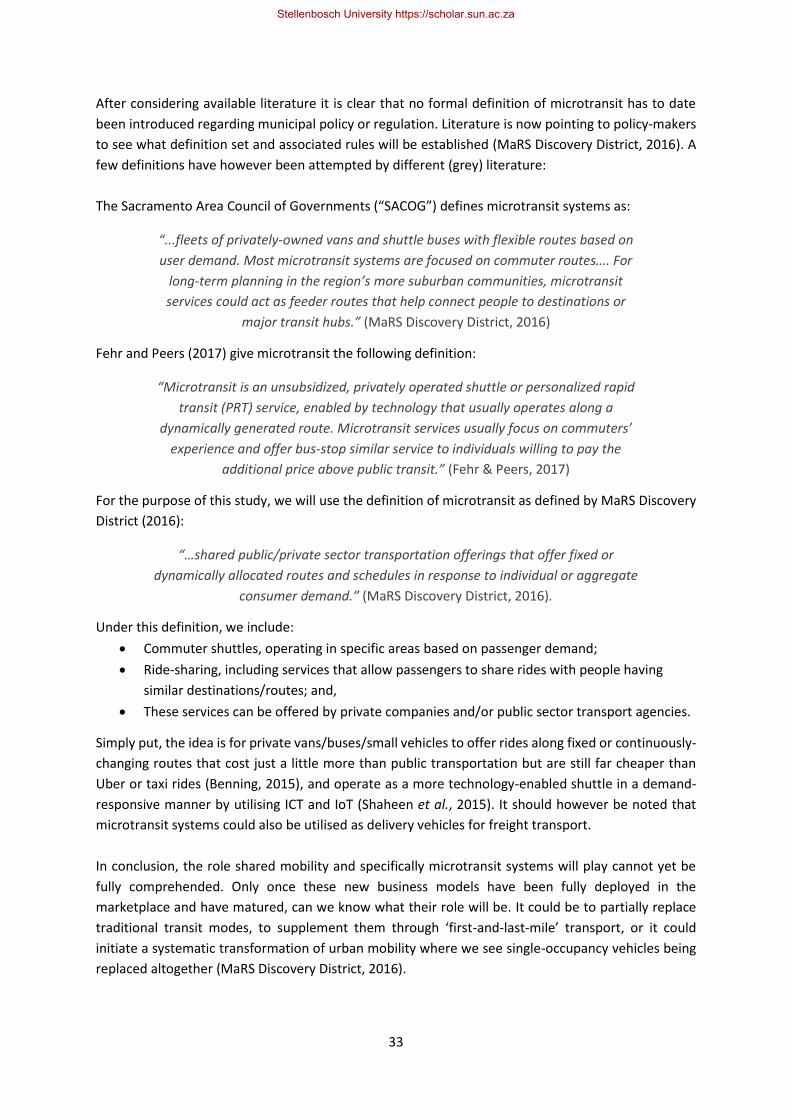
33
After considering available literature it is clear that no formal definition of microtransit has to date
been introduced regarding municipal policy or regulation. Literature is now pointing to policy-makers
to see what definition set and associated rules will be established (MaRS Discovery District, 2016). A
few definitions have however been attempted by different (grey) literature:
The Sacramento Area Council of Governments (“SACOG”) defines microtransit systems as:
“...fleets of privately-owned vans and shuttle buses with flexible routes based on
user demand. Most microtransit systems are focused on commuter routes…. For
long-term planning in the region’s more suburban communities, microtransit
services could act as feeder routes that help connect people to destinations or
major transit hubs.” (MaRS Discovery District, 2016)
Fehr and Peers (2017) give microtransit the following definition:
“Microtransit is an unsubsidized, privately operated shuttle or personalized rapid
transit (PRT) service, enabled by technology that usually operates along a
dynamically generated route. Microtransit services usually focus on commuters’
experience and offer bus-stop similar service to individuals willing to pay the
additional price above public transit.” (Fehr & Peers, 2017)
For the purpose of this study, we will use the definition of microtransit as defined by MaRS Discovery
District (2016):
“…shared public/private sector transportation offerings that offer fixed or
dynamically allocated routes and schedules in response to individual or aggregate
consumer demand.” (MaRS Discovery District, 2016).
Under this definition, we include:
• Commuter shuttles, operating in specific areas based on passenger demand;
• Ride-sharing, including services that allow passengers to share rides with people having
similar destinations/routes; and,
• These services can be offered by private companies and/or public sector transport agencies.
Simply put, the idea is for private vans/buses/small vehicles to offer rides along fixed or continuously-
changing routes that cost just a little more than public transportation but are still far cheaper than
Uber or taxi rides (Benning, 2015), and operate as a more technology-enabled shuttle in a demand-
responsive manner by utilising ICT and IoT (Shaheen et al., 2015). It should however be noted that
microtransit systems could also be utilised as delivery vehicles for freight transport.
In conclusion, the role shared mobility and specifically microtransit systems will play cannot yet be
fully comprehended. Only once these new business models have been fully deployed in the
marketplace and have matured, can we know what their role will be. It could be to partially replace
traditional transit modes, to supplement them through ‘first-and-last-mile’ transport, or it could
initiate a systematic transformation of urban mobility where we see single-occupancy vehicles being
replaced altogether (MaRS Discovery District, 2016).
Stellenbosch University https://scholar.sun.ac.za
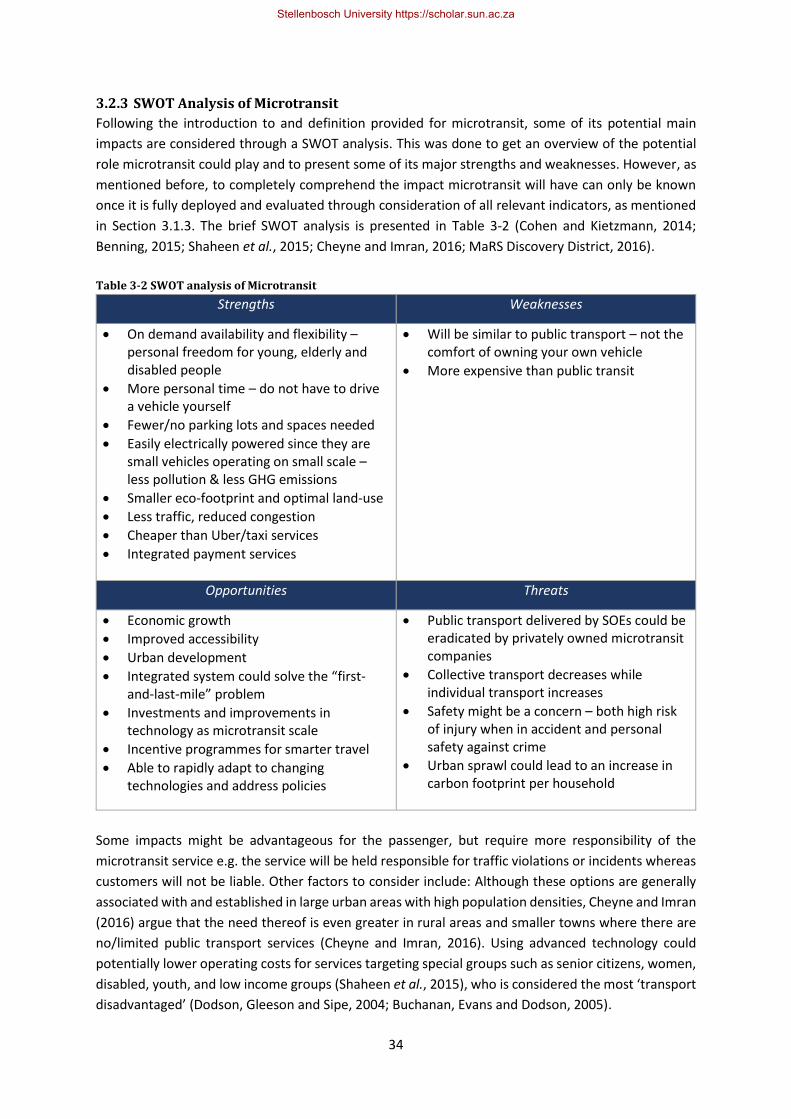
34
3.2.3 SWOT Analysis of Microtransit
Following the introduction to and definition provided for microtransit, some of its potential main
impacts are considered through a SWOT analysis. This was done to get an overview of the potential
role microtransit could play and to present some of its major strengths and weaknesses. However, as
mentioned before, to completely comprehend the impact microtransit will have can only be known
once it is fully deployed and evaluated through consideration of all relevant indicators, as mentioned
in Section 3.1.3. The brief SWOT analysis is presented in Table 3-2 (Cohen and Kietzmann, 2014;
Benning, 2015; Shaheen et al., 2015; Cheyne and Imran, 2016; MaRS Discovery District, 2016).
Table 3-2 SWOT analysis of Microtransit
Strengths Weaknesses
• On demand availability and flexibility – personal freedom for young, elderly and disabled people
• More personal time – do not have to drive a vehicle yourself
• Fewer/no parking lots and spaces needed
• Easily electrically powered since they are small vehicles operating on small scale – less pollution & less GHG emissions
• Smaller eco-footprint and optimal land-use
• Less traffic, reduced congestion
• Cheaper than Uber/taxi services
• Integrated payment services
• Will be similar to public transport – not the comfort of owning your own vehicle
• More expensive than public transit
Opportunities Threats
• Economic growth
• Improved accessibility
• Urban development
• Integrated system could solve the “first-and-last-mile” problem
• Investments and improvements in technology as microtransit scale
• Incentive programmes for smarter travel
• Able to rapidly adapt to changing technologies and address policies
• Public transport delivered by SOEs could be eradicated by privately owned microtransit companies
• Collective transport decreases while individual transport increases
• Safety might be a concern – both high risk of injury when in accident and personal safety against crime
• Urban sprawl could lead to an increase in carbon footprint per household
Some impacts might be advantageous for the passenger, but require more responsibility of the
microtransit service e.g. the service will be held responsible for traffic violations or incidents whereas
customers will not be liable. Other factors to consider include: Although these options are generally
associated with and established in large urban areas with high population densities, Cheyne and Imran
(2016) argue that the need thereof is even greater in rural areas and smaller towns where there are
no/limited public transport services (Cheyne and Imran, 2016). Using advanced technology could
potentially lower operating costs for services targeting special groups such as senior citizens, women,
disabled, youth, and low income groups (Shaheen et al., 2015), who is considered the most ‘transport
disadvantaged’ (Dodson, Gleeson and Sipe, 2004; Buchanan, Evans and Dodson, 2005).
Stellenbosch University https://scholar.sun.ac.za
35
3.3 Chapter 3: Conclusion
The concept of shared mobility and specifically microtransit systems poses several potential
sustainability benefits, especially from an organisational and environmental perspective and in the
context of the ever increasing rate of urbanisation that countries experience (Cohen and Kietzmann,
2014). Several drivers in these growing cities also support these innovations with a focus on
sustainability (Hansen, Grosse-Dunker and Reichwald, 2009).
Since these innovations are relatively new, research on the relationship between sustainability theory
and businesses in a sharing economy is scarce (Cohen and Kietzmann, 2014). Even though the demand
and opportunities for sustainable mobility solutions are growing in the private sector, there seems to
be a scarcity of research in public policy and management disciplines regarding what factors influence
the success or failure of deploying such innovations. This is true especially with regard to the
collaborative attempt of cities and the private sector in solving urban sustainability challenges
(Alexandrescu et al., 2014).
Modes of transport are thus continuously evolving and growing to adapt to changes and to find new
and optimal ways of contributing to economic, social, and environmental development. It is clear that
the consideration of the three pillars of sustainability is critical regarding the development of a
necessity like transport. It is then undeniable that continuous research has to be conducted on
transport and transport alternatives as it contributes to an enormous variety of areas.
Since Microtransit is a novel concept and not much research has been done on it, the need for research
on this topic is essential. Once a microtransit system is deployed, it will require a framework to
determine how the system is performing regarding its sustainability, and to continuously monitor and
evaluate appropriate indicators as mentioned in Section 3.1.3. It is to this purpose and need that this
research aims to develop a conceptual microtransit M&E framework that can be used by cities or
private sector businesses as a management tool to assess its sustainability performance.
Stellenbosch University https://scholar.sun.ac.za

36
This page intentionally left blank
Stellenbosch University https://scholar.sun.ac.za
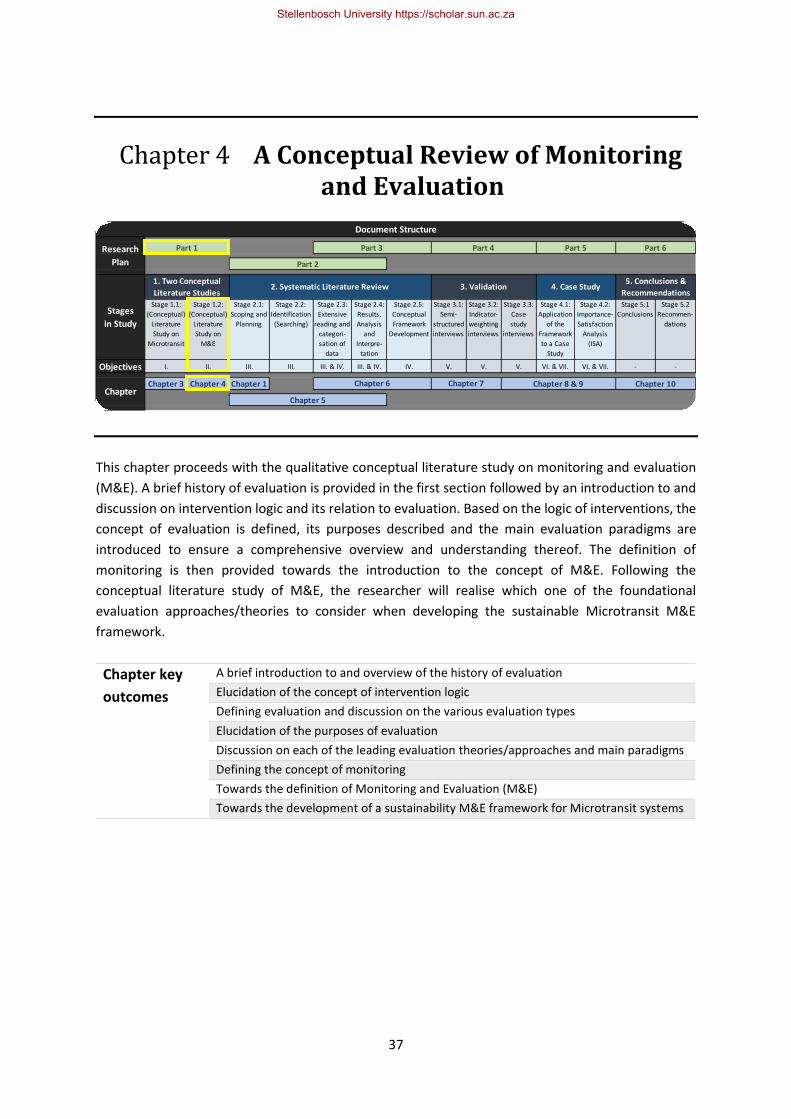
37
Chapter 4 A Conceptual Review of Monitoring and Evaluation
This chapter proceeds with the qualitative conceptual literature study on monitoring and evaluation
(M&E). A brief history of evaluation is provided in the first section followed by an introduction to and
discussion on intervention logic and its relation to evaluation. Based on the logic of interventions, the
concept of evaluation is defined, its purposes described and the main evaluation paradigms are
introduced to ensure a comprehensive overview and understanding thereof. The definition of
monitoring is then provided towards the introduction to the concept of M&E. Following the
conceptual literature study of M&E, the researcher will realise which one of the foundational
evaluation approaches/theories to consider when developing the sustainable Microtransit M&E
framework.
Chapter key
outcomes
A brief introduction to and overview of the history of evaluation
Elucidation of the concept of intervention logic
Defining evaluation and discussion on the various evaluation types
Elucidation of the purposes of evaluation
Discussion on each of the leading evaluation theories/approaches and main paradigms
Defining the concept of monitoring
Towards the definition of Monitoring and Evaluation (M&E)
Towards the development of a sustainability M&E framework for Microtransit systems
Stage 1.1:
(Conceptual)
Literature
Study on
Microtransit
Stage 1.2:
(Conceptual)
Literature
Study on
M&E
Stage 2.1:
Scoping and
Planning
Stage 2.2:
Identification
(Searching)
Stage 2.3:
Extensive
reading and
categori-
sation of
data
Stage 2.4:
Results,
Analysis
and
Interpre-
tation
Stage 2.5:
Conceptual
Framework
Development
Stage 3.1:
Semi-
structured
interviews
Stage 3.2:
Indicator-
weighting
interviews
Stage 3.3:
Case
study
interviews
Stage 4.1:
Application
of the
Framework
to a Case
Study
Stage 4.2:
Importance-
Satisfaction
Analysis
(ISA)
Stage 5.1
Conclusions
Stage 5.2
Recommen-
dations
Objectives I. II. III. III. III. & IV. III. & IV. IV. V. V. V. VI. & VII. VI. & VII. - -
Chapter 3 Chapter 4 Chapter 1
Stages
in Study
1. Two Conceptual
Literature Studies2. Systematic Literature Review 3. Validation 4. Case Study
5. Conclusions &
Recommendations
ChapterChapter 6 Chapter 7 Chapter 8 & 9 Chapter 10
Chapter 5
Document Structure
Research
Plan
Part 1 Part 3 Part 4 Part 5 Part 6
Part 2
Stellenbosch University https://scholar.sun.ac.za
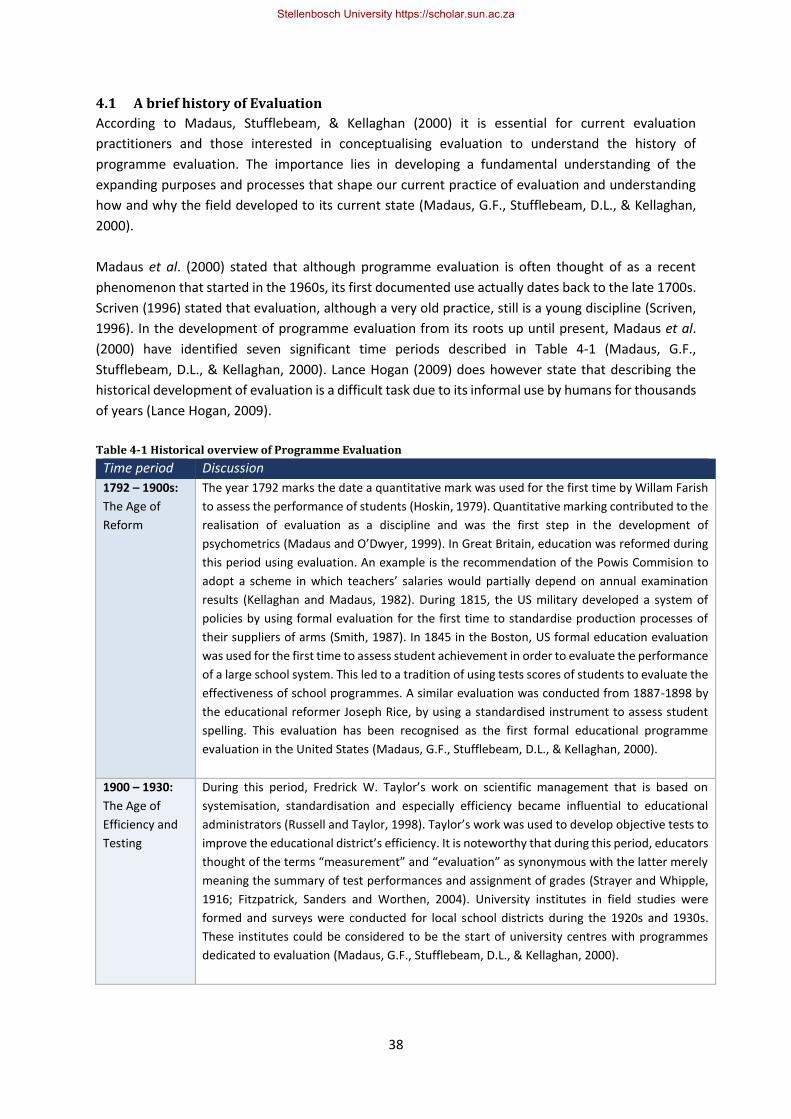
38
4.1 A brief history of Evaluation
According to Madaus, Stufflebeam, & Kellaghan (2000) it is essential for current evaluation
practitioners and those interested in conceptualising evaluation to understand the history of
programme evaluation. The importance lies in developing a fundamental understanding of the
expanding purposes and processes that shape our current practice of evaluation and understanding
how and why the field developed to its current state (Madaus, G.F., Stufflebeam, D.L., & Kellaghan,
2000).
Madaus et al. (2000) stated that although programme evaluation is often thought of as a recent
phenomenon that started in the 1960s, its first documented use actually dates back to the late 1700s.
Scriven (1996) stated that evaluation, although a very old practice, still is a young discipline (Scriven,
1996). In the development of programme evaluation from its roots up until present, Madaus et al.
(2000) have identified seven significant time periods described in Table 4-1 (Madaus, G.F.,
Stufflebeam, D.L., & Kellaghan, 2000). Lance Hogan (2009) does however state that describing the
historical development of evaluation is a difficult task due to its informal use by humans for thousands
of years (Lance Hogan, 2009).
Table 4-1 Historical overview of Programme Evaluation
Time period Discussion
1792 – 1900s:
The Age of
Reform
The year 1792 marks the date a quantitative mark was used for the first time by Willam Farish
to assess the performance of students (Hoskin, 1979). Quantitative marking contributed to the
realisation of evaluation as a discipline and was the first step in the development of
psychometrics (Madaus and O’Dwyer, 1999). In Great Britain, education was reformed during
this period using evaluation. An example is the recommendation of the Powis Commision to
adopt a scheme in which teachers’ salaries would partially depend on annual examination
results (Kellaghan and Madaus, 1982). During 1815, the US military developed a system of
policies by using formal evaluation for the first time to standardise production processes of
their suppliers of arms (Smith, 1987). In 1845 in the Boston, US formal education evaluation
was used for the first time to assess student achievement in order to evaluate the performance
of a large school system. This led to a tradition of using tests scores of students to evaluate the
effectiveness of school programmes. A similar evaluation was conducted from 1887-1898 by
the educational reformer Joseph Rice, by using a standardised instrument to assess student
spelling. This evaluation has been recognised as the first formal educational programme
evaluation in the United States (Madaus, G.F., Stufflebeam, D.L., & Kellaghan, 2000).
1900 – 1930:
The Age of
Efficiency and
Testing
During this period, Fredrick W. Taylor’s work on scientific management that is based on
systemisation, standardisation and especially efficiency became influential to educational
administrators (Russell and Taylor, 1998). Taylor’s work was used to develop objective tests to
improve the educational district’s efficiency. It is noteworthy that during this period, educators
thought of the terms “measurement” and “evaluation” as synonymous with the latter merely
meaning the summary of test performances and assignment of grades (Strayer and Whipple,
1916; Fitzpatrick, Sanders and Worthen, 2004). University institutes in field studies were
formed and surveys were conducted for local school districts during the 1920s and 1930s.
These institutes could be considered to be the start of university centres with programmes
dedicated to evaluation (Madaus, G.F., Stufflebeam, D.L., & Kellaghan, 2000).
Stellenbosch University https://scholar.sun.ac.za
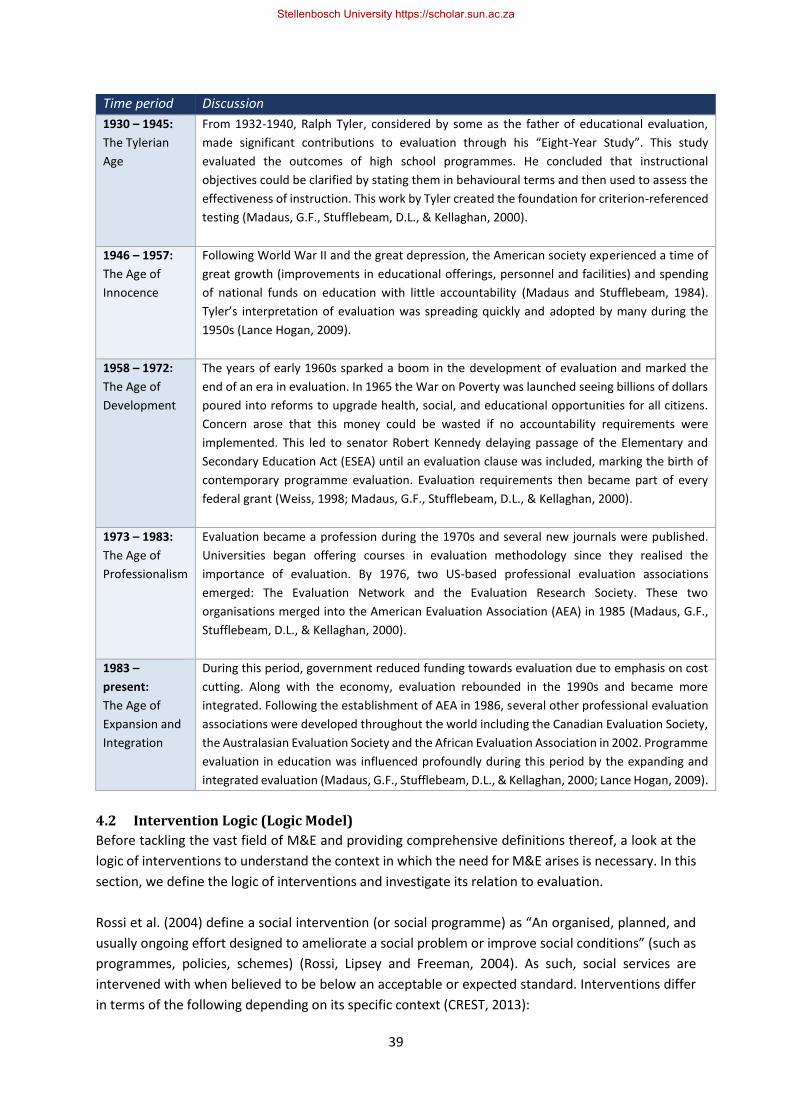
39
Time period Discussion
1930 – 1945:
The Tylerian
Age
From 1932-1940, Ralph Tyler, considered by some as the father of educational evaluation,
made significant contributions to evaluation through his “Eight-Year Study”. This study
evaluated the outcomes of high school programmes. He concluded that instructional
objectives could be clarified by stating them in behavioural terms and then used to assess the
effectiveness of instruction. This work by Tyler created the foundation for criterion-referenced
testing (Madaus, G.F., Stufflebeam, D.L., & Kellaghan, 2000).
1946 – 1957:
The Age of
Innocence
Following World War II and the great depression, the American society experienced a time of
great growth (improvements in educational offerings, personnel and facilities) and spending
of national funds on education with little accountability (Madaus and Stufflebeam, 1984).
Tyler’s interpretation of evaluation was spreading quickly and adopted by many during the
1950s (Lance Hogan, 2009).
1958 – 1972:
The Age of
Development
The years of early 1960s sparked a boom in the development of evaluation and marked the
end of an era in evaluation. In 1965 the War on Poverty was launched seeing billions of dollars
poured into reforms to upgrade health, social, and educational opportunities for all citizens.
Concern arose that this money could be wasted if no accountability requirements were
implemented. This led to senator Robert Kennedy delaying passage of the Elementary and
Secondary Education Act (ESEA) until an evaluation clause was included, marking the birth of
contemporary programme evaluation. Evaluation requirements then became part of every
federal grant (Weiss, 1998; Madaus, G.F., Stufflebeam, D.L., & Kellaghan, 2000).
1973 – 1983:
The Age of
Professionalism
Evaluation became a profession during the 1970s and several new journals were published.
Universities began offering courses in evaluation methodology since they realised the
importance of evaluation. By 1976, two US-based professional evaluation associations
emerged: The Evaluation Network and the Evaluation Research Society. These two
organisations merged into the American Evaluation Association (AEA) in 1985 (Madaus, G.F.,
Stufflebeam, D.L., & Kellaghan, 2000).
1983 –
present:
The Age of
Expansion and
Integration
During this period, government reduced funding towards evaluation due to emphasis on cost
cutting. Along with the economy, evaluation rebounded in the 1990s and became more
integrated. Following the establishment of AEA in 1986, several other professional evaluation
associations were developed throughout the world including the Canadian Evaluation Society,
the Australasian Evaluation Society and the African Evaluation Association in 2002. Programme
evaluation in education was influenced profoundly during this period by the expanding and
integrated evaluation (Madaus, G.F., Stufflebeam, D.L., & Kellaghan, 2000; Lance Hogan, 2009).
4.2 Intervention Logic (Logic Model)
Before tackling the vast field of M&E and providing comprehensive definitions thereof, a look at the
logic of interventions to understand the context in which the need for M&E arises is necessary. In this
section, we define the logic of interventions and investigate its relation to evaluation.
Rossi et al. (2004) define a social intervention (or social programme) as “An organised, planned, and
usually ongoing effort designed to ameliorate a social problem or improve social conditions” (such as
programmes, policies, schemes) (Rossi, Lipsey and Freeman, 2004). As such, social services are
intervened with when believed to be below an acceptable or expected standard. Interventions differ
in terms of the following depending on its specific context (CREST, 2013):
Stellenbosch University https://scholar.sun.ac.za
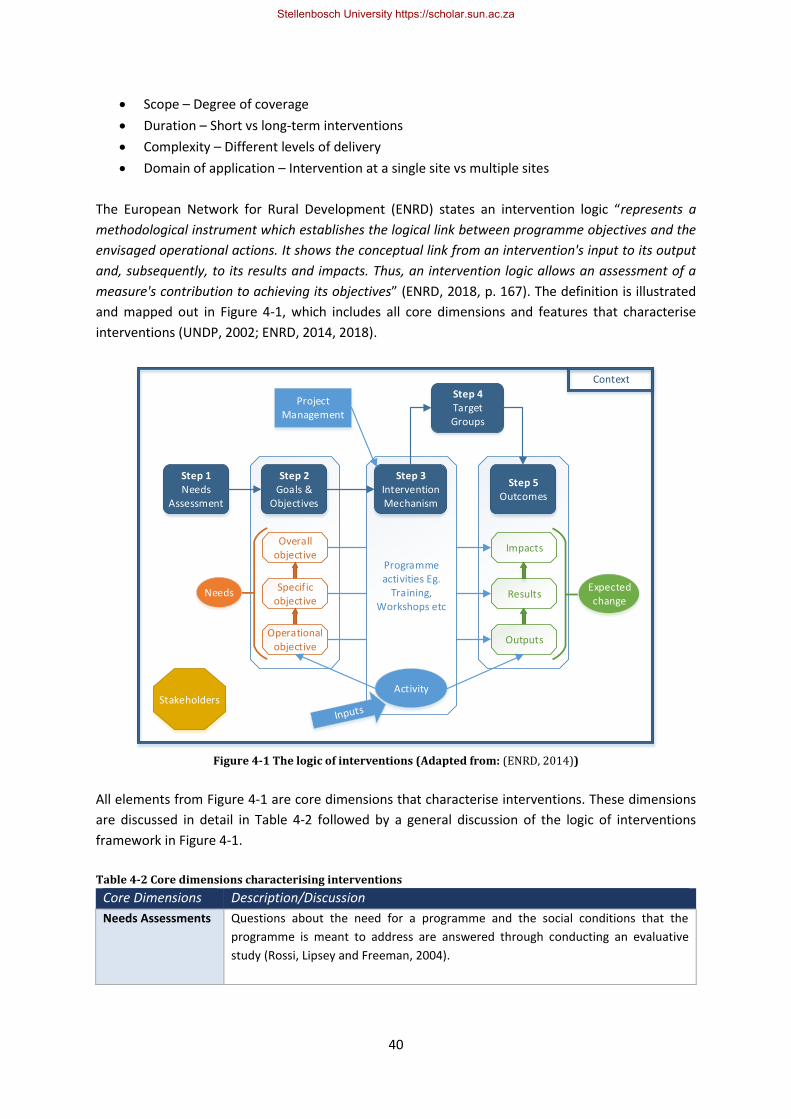
40
• Scope – Degree of coverage
• Duration – Short vs long-term interventions
• Complexity – Different levels of delivery
• Domain of application – Intervention at a single site vs multiple sites
The European Network for Rural Development (ENRD) states an intervention logic “represents a
methodological instrument which establishes the logical link between programme objectives and the
envisaged operational actions. It shows the conceptual link from an intervention's input to its output
and, subsequently, to its results and impacts. Thus, an intervention logic allows an assessment of a
measure's contribution to achieving its objectives” (ENRD, 2018, p. 167). The definition is illustrated
and mapped out in Figure 4-1, which includes all core dimensions and features that characterise
interventions (UNDP, 2002; ENRD, 2014, 2018).
Figure 4-1 The logic of interventions (Adapted from: (ENRD, 2014))
All elements from Figure 4-1 are core dimensions that characterise interventions. These dimensions
are discussed in detail in Table 4-2 followed by a general discussion of the logic of interventions
framework in Figure 4-1.
Table 4-2 Core dimensions characterising interventions
Core Dimensions Description/Discussion
Needs Assessments Questions about the need for a programme and the social conditions that the
programme is meant to address are answered through conducting an evaluative
study (Rossi, Lipsey and Freeman, 2004).
Step 1Needs
Assessment
Step 2Goals &
Objectives
Overall objective
Needs Specific objective
Expected change
Operational objective
Step 5 Outcomes
Impacts
Results
Outputs
Step 4Target Groups
Programme activities Eg.
Training, Workshops etc
Step 3Intervention Mechanism
ActivityStakeholders
Project Management
Context
Stellenbosch University https://scholar.sun.ac.za
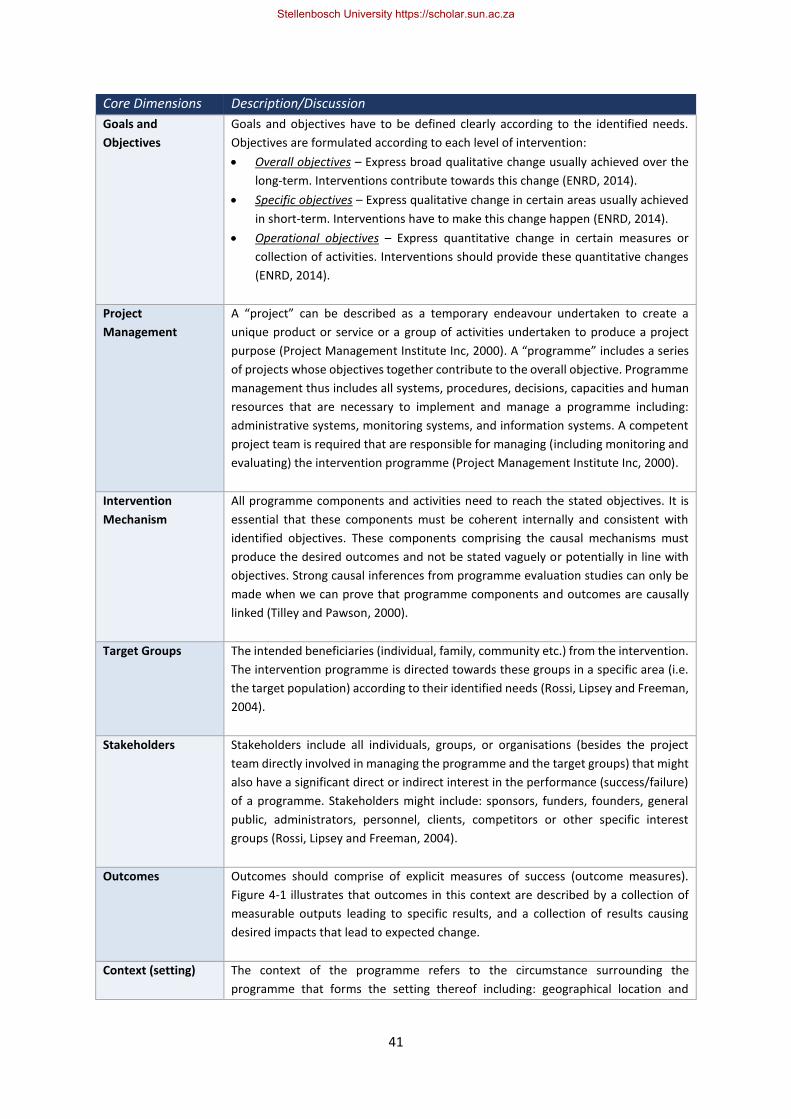
41
Core Dimensions Description/Discussion
Goals and
Objectives
Goals and objectives have to be defined clearly according to the identified needs.
Objectives are formulated according to each level of intervention:
• Overall objectives – Express broad qualitative change usually achieved over the
long-term. Interventions contribute towards this change (ENRD, 2014).
• Specific objectives – Express qualitative change in certain areas usually achieved
in short-term. Interventions have to make this change happen (ENRD, 2014).
• Operational objectives – Express quantitative change in certain measures or
collection of activities. Interventions should provide these quantitative changes
(ENRD, 2014).
Project
Management
A “project” can be described as a temporary endeavour undertaken to create a
unique product or service or a group of activities undertaken to produce a project
purpose (Project Management Institute Inc, 2000). A “programme” includes a series
of projects whose objectives together contribute to the overall objective. Programme
management thus includes all systems, procedures, decisions, capacities and human
resources that are necessary to implement and manage a programme including:
administrative systems, monitoring systems, and information systems. A competent
project team is required that are responsible for managing (including monitoring and
evaluating) the intervention programme (Project Management Institute Inc, 2000).
Intervention
Mechanism
All programme components and activities need to reach the stated objectives. It is
essential that these components must be coherent internally and consistent with
identified objectives. These components comprising the causal mechanisms must
produce the desired outcomes and not be stated vaguely or potentially in line with
objectives. Strong causal inferences from programme evaluation studies can only be
made when we can prove that programme components and outcomes are causally
linked (Tilley and Pawson, 2000).
Target Groups The intended beneficiaries (individual, family, community etc.) from the intervention.
The intervention programme is directed towards these groups in a specific area (i.e.
the target population) according to their identified needs (Rossi, Lipsey and Freeman,
2004).
Stakeholders Stakeholders include all individuals, groups, or organisations (besides the project
team directly involved in managing the programme and the target groups) that might
also have a significant direct or indirect interest in the performance (success/failure)
of a programme. Stakeholders might include: sponsors, funders, founders, general
public, administrators, personnel, clients, competitors or other specific interest
groups (Rossi, Lipsey and Freeman, 2004).
Outcomes Outcomes should comprise of explicit measures of success (outcome measures).
Figure 4-1 illustrates that outcomes in this context are described by a collection of
measurable outputs leading to specific results, and a collection of results causing
desired impacts that lead to expected change.
Context (setting) The context of the programme refers to the circumstance surrounding the
programme that forms the setting thereof including: geographical location and
Stellenbosch University https://scholar.sun.ac.za
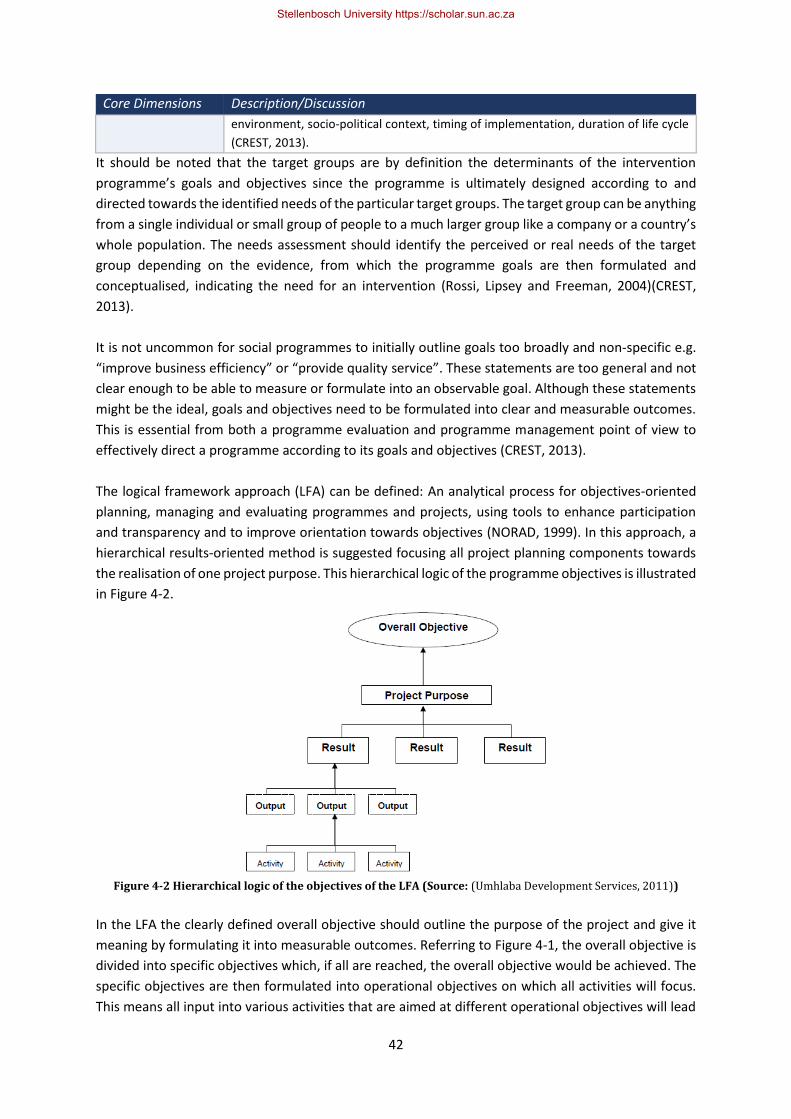
42
Core Dimensions Description/Discussion
environment, socio-political context, timing of implementation, duration of life cycle
(CREST, 2013).
It should be noted that the target groups are by definition the determinants of the intervention
programme’s goals and objectives since the programme is ultimately designed according to and
directed towards the identified needs of the particular target groups. The target group can be anything
from a single individual or small group of people to a much larger group like a company or a country’s
whole population. The needs assessment should identify the perceived or real needs of the target
group depending on the evidence, from which the programme goals are then formulated and
conceptualised, indicating the need for an intervention (Rossi, Lipsey and Freeman, 2004)(CREST,
2013).
It is not uncommon for social programmes to initially outline goals too broadly and non-specific e.g.
“improve business efficiency” or “provide quality service”. These statements are too general and not
clear enough to be able to measure or formulate into an observable goal. Although these statements
might be the ideal, goals and objectives need to be formulated into clear and measurable outcomes.
This is essential from both a programme evaluation and programme management point of view to
effectively direct a programme according to its goals and objectives (CREST, 2013).
The logical framework approach (LFA) can be defined: An analytical process for objectives-oriented
planning, managing and evaluating programmes and projects, using tools to enhance participation
and transparency and to improve orientation towards objectives (NORAD, 1999). In this approach, a
hierarchical results-oriented method is suggested focusing all project planning components towards
the realisation of one project purpose. This hierarchical logic of the programme objectives is illustrated
in Figure 4-2.
Figure 4-2 Hierarchical logic of the objectives of the LFA (Source: (Umhlaba Development Services, 2011))
In the LFA the clearly defined overall objective should outline the purpose of the project and give it
meaning by formulating it into measurable outcomes. Referring to Figure 4-1, the overall objective is
divided into specific objectives which, if all are reached, the overall objective would be achieved. The
specific objectives are then formulated into operational objectives on which all activities will focus.
This means all input into various activities that are aimed at different operational objectives will lead
Stellenbosch University https://scholar.sun.ac.za
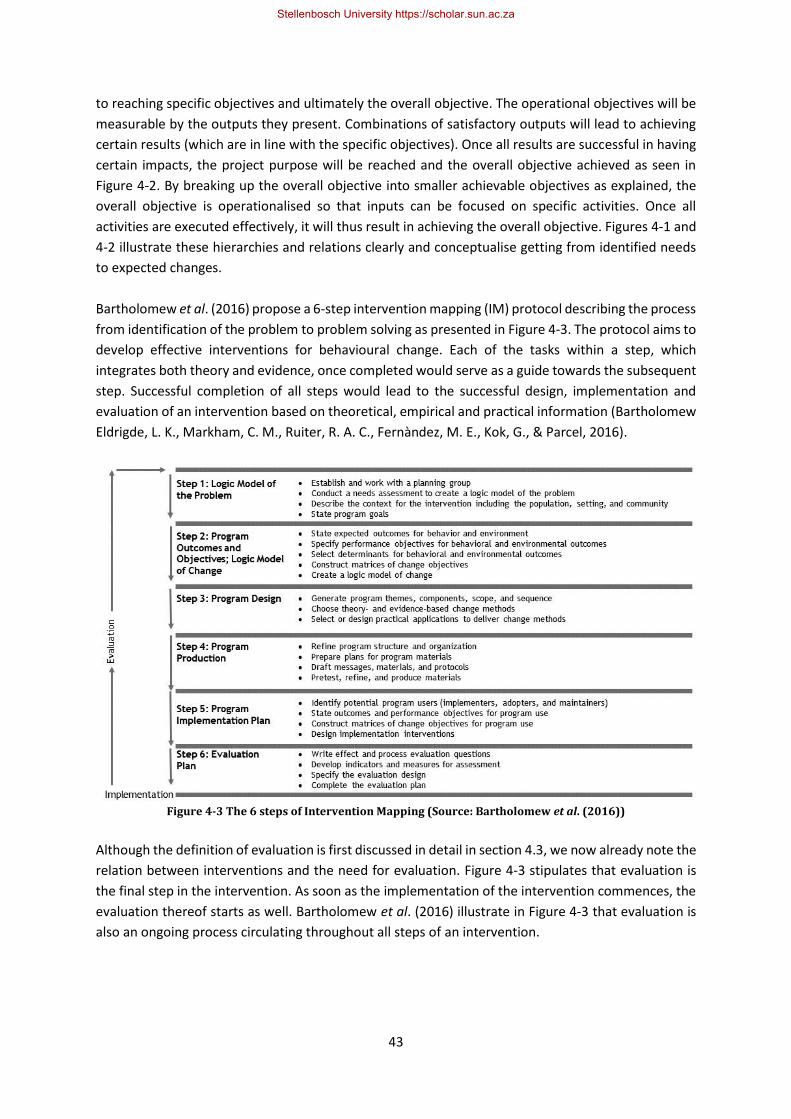
43
to reaching specific objectives and ultimately the overall objective. The operational objectives will be
measurable by the outputs they present. Combinations of satisfactory outputs will lead to achieving
certain results (which are in line with the specific objectives). Once all results are successful in having
certain impacts, the project purpose will be reached and the overall objective achieved as seen in
Figure 4-2. By breaking up the overall objective into smaller achievable objectives as explained, the
overall objective is operationalised so that inputs can be focused on specific activities. Once all
activities are executed effectively, it will thus result in achieving the overall objective. Figures 4-1 and
4-2 illustrate these hierarchies and relations clearly and conceptualise getting from identified needs
to expected changes.
Bartholomew et al. (2016) propose a 6-step intervention mapping (IM) protocol describing the process
from identification of the problem to problem solving as presented in Figure 4-3. The protocol aims to
develop effective interventions for behavioural change. Each of the tasks within a step, which
integrates both theory and evidence, once completed would serve as a guide towards the subsequent
step. Successful completion of all steps would lead to the successful design, implementation and
evaluation of an intervention based on theoretical, empirical and practical information (Bartholomew
Eldrigde, L. K., Markham, C. M., Ruiter, R. A. C., Fernàndez, M. E., Kok, G., & Parcel, 2016).
Figure 4-3 The 6 steps of Intervention Mapping (Source: Bartholomew et al. (2016))
Although the definition of evaluation is first discussed in detail in section 4.3, we now already note the
relation between interventions and the need for evaluation. Figure 4-3 stipulates that evaluation is
the final step in the intervention. As soon as the implementation of the intervention commences, the
evaluation thereof starts as well. Bartholomew et al. (2016) illustrate in Figure 4-3 that evaluation is
also an ongoing process circulating throughout all steps of an intervention.
Stellenbosch University https://scholar.sun.ac.za
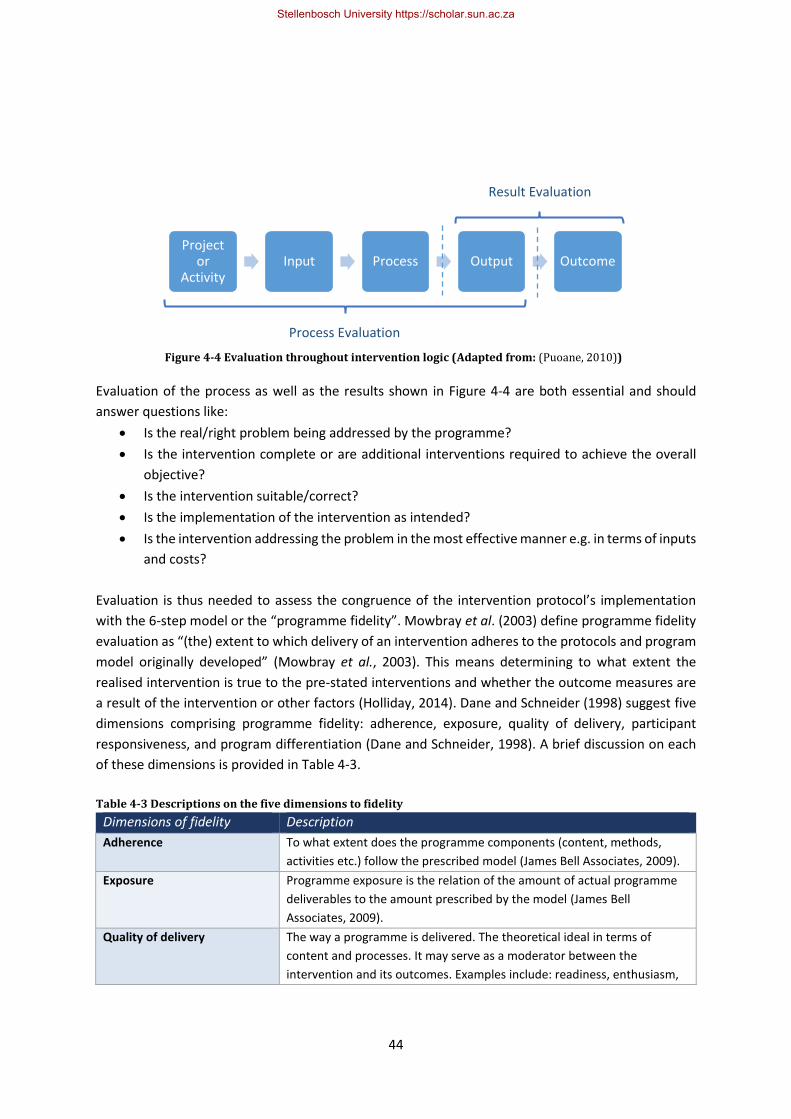
44
Evaluation of the process as well as the results shown in Figure 4-4 are both essential and should
answer questions like:
• Is the real/right problem being addressed by the programme?
• Is the intervention complete or are additional interventions required to achieve the overall
objective?
• Is the intervention suitable/correct?
• Is the implementation of the intervention as intended?
• Is the intervention addressing the problem in the most effective manner e.g. in terms of inputs
and costs?
Evaluation is thus needed to assess the congruence of the intervention protocol’s implementation
with the 6-step model or the “programme fidelity”. Mowbray et al. (2003) define programme fidelity
evaluation as “(the) extent to which delivery of an intervention adheres to the protocols and program
model originally developed” (Mowbray et al., 2003). This means determining to what extent the
realised intervention is true to the pre-stated interventions and whether the outcome measures are
a result of the intervention or other factors (Holliday, 2014). Dane and Schneider (1998) suggest five
dimensions comprising programme fidelity: adherence, exposure, quality of delivery, participant
responsiveness, and program differentiation (Dane and Schneider, 1998). A brief discussion on each
of these dimensions is provided in Table 4-3.
Table 4-3 Descriptions on the five dimensions to fidelity
Dimensions of fidelity Description
Adherence To what extent does the programme components (content, methods,
activities etc.) follow the prescribed model (James Bell Associates, 2009).
Exposure Programme exposure is the relation of the amount of actual programme
deliverables to the amount prescribed by the model (James Bell
Associates, 2009).
Quality of delivery The way a programme is delivered. The theoretical ideal in terms of
content and processes. It may serve as a moderator between the
intervention and its outcomes. Examples include: readiness, enthusiasm,
Project or
ActivityInput Process Output Outcome
Result Evaluation
Process Evaluation
Figure 4-4 Evaluation throughout intervention logic (Adapted from: (Puoane, 2010))
Stellenbosch University https://scholar.sun.ac.za

45
Dimensions of fidelity Description
style of interaction, respectfulness, confidence etc. (James Bell Associates,
2009).
Participant responsiveness The way participants react to a programme or engage in it e.g. level of
interest, perceptions, level of engagement, enthusiasm, willingness etc.
This might directly influence the outcomes or act as moderator between
the intervention and program fidelity/service delivery quality (James Bell
Associates, 2009).
Programme differentiation The extent to which critical programme components are distinguishable
from one another as well as from other programmes and identification of
these unique features (James Bell Associates, 2009).
According to Dane and Schneider (1998) the focus of fidelity research has been on adherence and
exposure. Evaluation should however examine all five dimensions of fidelity if it wants to provide the
most comprehensive depiction of the programme implementation and identify the dimension(s) that
have the biggest impact on the outcomes (Dane and Schneider, 1998).
4.3 Evaluation
In this section, a clear definition is given to evaluation and the various types of evaluation, followed
by a discussion on the three main purposes of evaluation. The section concludes with a summary of
the main paradigms and theories of evaluation to understand the different schools of thought thereof.
4.3.1 Defining Evaluation
Before unpacking the term into various types of evaluation, a formal definition is provided. Due to the
prominence of Scriven in the field of evaluation his simplified definition will be used as starting point.
In an article by Scriven released in the Yearbook of the National Society for the Study of Education in
1991 he provides the following definition:
“Evaluation is the process of determining the merit, worth, and value of things,
and evaluations are the products of that process.” (McLaughlin and Phillips, 1991)
By unpacking Scrivens definition a complete understanding thereof is ensured. According to Johnson
(2008) by merit Scriven refers to the “intrinsic value” of the evaluand (the evaluation object). By worth,
he refers to the evaluand’s “market value” or value to an organisation or stakeholder. Finally, by value,
Johnson indicates that Scriven believes evaluation will always require the making of value judgements
(Johnson, 2008). A more detailed definition of evaluation suggested by the OECD (2002) reads:
“The systematic and objective assessment of an ongoing or completed project, program, or policy,
including its design, implementation, and results. The aim is to determine the relevance and
fulfilment of objectives, development efficiency, effectiveness, impact, and sustainability. An
evaluation should provide information that is credible and useful, enabling the incorporation of
lessons learned into the decision-making process of both recipients and donors.” (OECD, 2002)
Evaluation in the context of Scriven’s definition refers to (programme) evaluation which is the
definition typically used in the practical endeavour of evaluating the processes and impacts of a
programme. Freeman and Rossi define (programme) evaluation as “the use of social research
procedures to systematically investigate the effectiveness of social intervention programmes that are
Stellenbosch University https://scholar.sun.ac.za
46
adapted to their political and organisational environments and designed to inform social action in
ways that improve social conditions” (Rossi, Lipsey and Freeman, 2004). Evaluation in this context
should not be confused with “evaluation research”, defined by Freeman and Rossi as “the systematic
application of social research procedures for assessing the conceptualisation, design, implementation
and utility of social intervention programmes” (Rossi, Lipsey and Freeman, 2004). Confusion between
these terms might arise as evaluation researchers and scholars use the term in a different way than
M&E practitioners typically would. The main difference can be ascribed to (programme) evaluation
specifically focusing on the effectiveness and efficiency of a programme/policy in the practical sense
(involving some form of value-judgement) whereas “research evaluation” is primarily defined in
typical academic terms and has a bigger scientific focus rather than on the practical endeavour of
evaluating the processes and impacts of a programme (Patton, 2002). From here on when using the
term ‘evaluation’, ‘(programme) evaluation’ will be referred to.
According to the United Nations Development Programme, evaluation is a selective independent
assessment of a completed project or current activity (or a stage within a project) in a systematic and
objective manner in order to assess the progress that is made towards an outcome. An evaluation
consists of various assessments of different scopes and depths as they are required and deliver data
and information which are used to improve future projects and inform strategic decisions. (UNDP,
2009) Within the evaluation process errors are identified that must not be repeated in current or
similar future projects while stronger features are also identified and highlighted. Activities are
typically evaluated according to the following main aspects (‘What is Monitoring and Evaluation?’,
2017):
• Relevance
• Effectiveness
• Efficiency
• Impact
• Sustainability
The primary distinction between types of evaluations pertaining to its purpose was identified by
Scriven in 1967. He stated that evaluations could be divided into formative and summative
evaluations. Scriven's (1991) definitions of formative and summative evaluation follows:
“Formative evaluation is evaluation designed, done, and intended to support the
process of improvement, and normally commissioned or done by, and delivered
to, someone who can make improvements. Summative evaluation is the rest of
evaluation: in terms of intentions, it is evaluation done for, or by, any observers or
decision makers (by contrast with developers) who need evaluative conclusions
for any reasons besides development.” (Scriven, 1991)
Rossi et al. (2004) define formative evaluation as “evaluative activities undertaken to furnish
information that will guide programme improvement” and summative evaluation as “evaluative
activities undertaken to render a summary judgement on certain critical aspects of the programme’s
performance, for instance, to determine if specific goals and objectives were met” (Rossi, Lipsey and
Freeman, 2004).
Stellenbosch University https://scholar.sun.ac.za
47
Formative evaluation ensures that a programme and its activities are feasible, appropriate, and
acceptable before it is implemented completely. It is usually conducted during the development of a
new programme/activity or when an existing programme is modified or used in a new setting or with
a new population (Salabarría-Peña, Apt and Walsh, 2007). Formative evaluations improve that which
is evaluated by examining programme delivery, implementation quality, and assessing the
organisational context, personnel, procedures, and inputs. Summative evaluation on the other hand
examines the outcomes and effects of a programme. A description is provided of what occurs after
the programme has been conducted. It determines whether the outcome is a direct result of the
programme, the overall impact the programme has besides its target outcomes, and the estimated
resource costs involved. Broadly, formative evaluation focuses on what leads to an intervention
working and its process whereas summative evaluation focuses on the outcomes on the target group.
Depending on that which is evaluated and the purpose of the evaluation, different types of evaluations
exist. Formative and summative evaluation can be further subdivided into various evaluation types.
These evaluation types are discussed in Table 4-4.
Stellenbosch University https://scholar.sun.ac.za
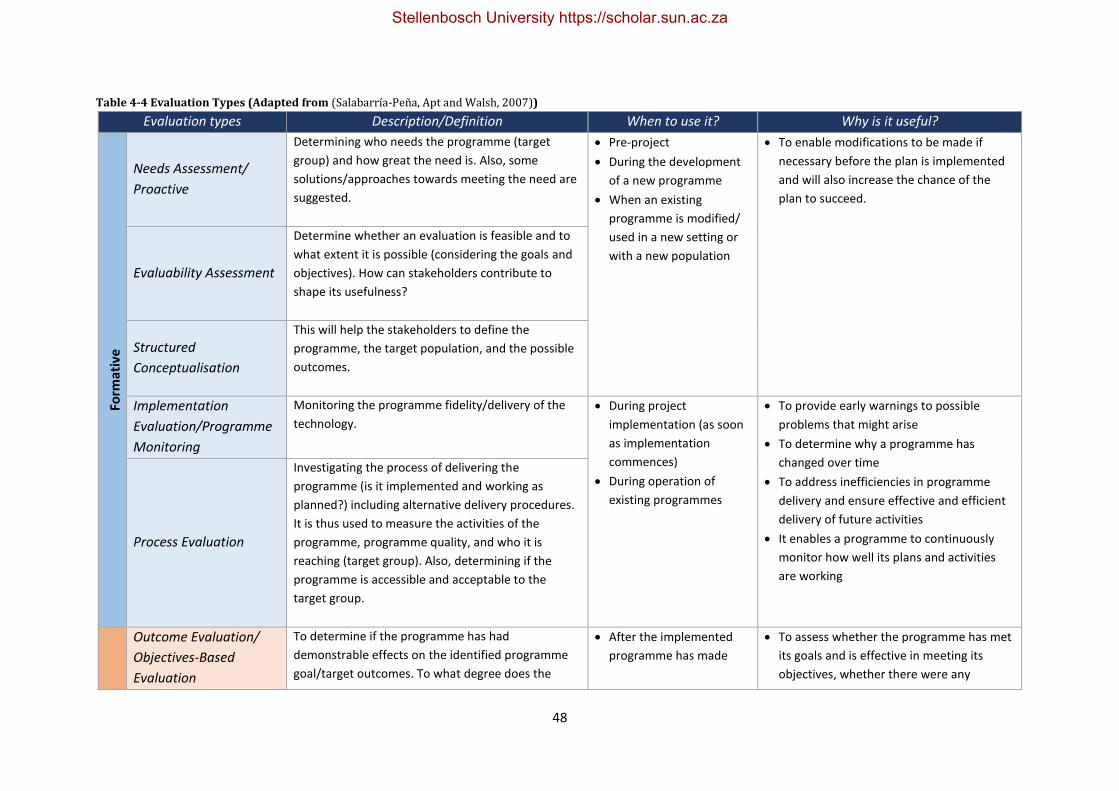
48
Table 4-4 Evaluation Types (Adapted from (Salabarría-Peña, Apt and Walsh, 2007))
Evaluation types Description/Definition When to use it? Why is it useful? Fo
rmat
ive
Form
ativ
e
Needs Assessment/
Proactive
Determining who needs the programme (target
group) and how great the need is. Also, some
solutions/approaches towards meeting the need are
suggested.
• Pre-project
• During the development
of a new programme
• When an existing
programme is modified/
used in a new setting or
with a new population
• To enable modifications to be made if
necessary before the plan is implemented
and will also increase the chance of the
plan to succeed.
Evaluability Assessment
Determine whether an evaluation is feasible and to
what extent it is possible (considering the goals and
objectives). How can stakeholders contribute to
shape its usefulness?
Structured
Conceptualisation
This will help the stakeholders to define the
programme, the target population, and the possible
outcomes.
Implementation
Evaluation/Programme
Monitoring
Monitoring the programme fidelity/delivery of the
technology.
• During project
implementation (as soon
as implementation
commences)
• During operation of
existing programmes
• To provide early warnings to possible
problems that might arise
• To determine why a programme has
changed over time
• To address inefficiencies in programme
delivery and ensure effective and efficient
delivery of future activities
• It enables a programme to continuously
monitor how well its plans and activities
are working
Process Evaluation
Investigating the process of delivering the
programme (is it implemented and working as
planned?) including alternative delivery procedures.
It is thus used to measure the activities of the
programme, programme quality, and who it is
reaching (target group). Also, determining if the
programme is accessible and acceptable to the
target group.
Outcome Evaluation/
Objectives-Based
Evaluation
To determine if the programme has had
demonstrable effects on the identified programme
goal/target outcomes. To what degree does the
• After the implemented
programme has made
• To assess whether the programme has met
its goals and is effective in meeting its
objectives, whether there were any
Stellenbosch University https://scholar.sun.ac.za
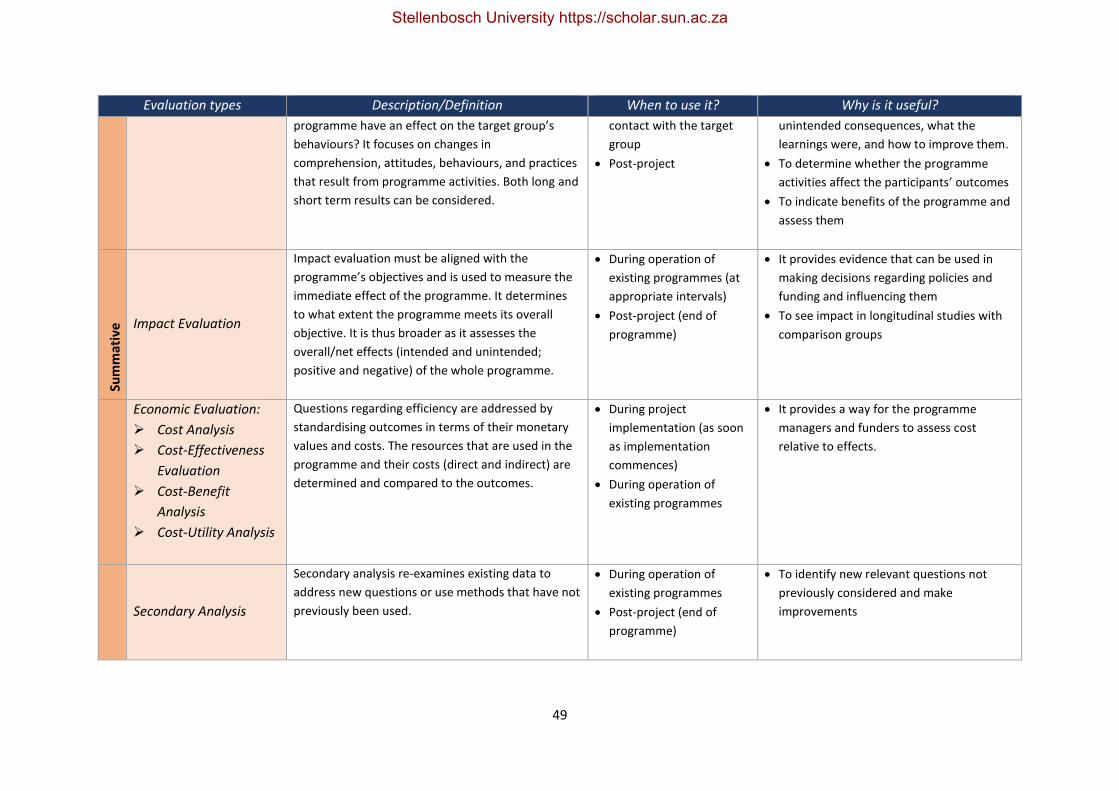
49
Evaluation types Description/Definition When to use it? Why is it useful?
programme have an effect on the target group’s
behaviours? It focuses on changes in
comprehension, attitudes, behaviours, and practices
that result from programme activities. Both long and
short term results can be considered.
contact with the target
group
• Post-project
unintended consequences, what the
learnings were, and how to improve them.
• To determine whether the programme
activities affect the participants’ outcomes
• To indicate benefits of the programme and
assess them
Sum
mat
ive
Impact Evaluation
Impact evaluation must be aligned with the
programme’s objectives and is used to measure the
immediate effect of the programme. It determines
to what extent the programme meets its overall
objective. It is thus broader as it assesses the
overall/net effects (intended and unintended;
positive and negative) of the whole programme.
• During operation of
existing programmes (at
appropriate intervals)
• Post-project (end of
programme)
• It provides evidence that can be used in
making decisions regarding policies and
funding and influencing them
• To see impact in longitudinal studies with
comparison groups
Economic Evaluation:
➢ Cost Analysis
➢ Cost-Effectiveness
Evaluation
➢ Cost-Benefit
Analysis
➢ Cost-Utility Analysis
Questions regarding efficiency are addressed by
standardising outcomes in terms of their monetary
values and costs. The resources that are used in the
programme and their costs (direct and indirect) are
determined and compared to the outcomes.
• During project
implementation (as soon
as implementation
commences)
• During operation of
existing programmes
• It provides a way for the programme
managers and funders to assess cost
relative to effects.
Secondary Analysis
Secondary analysis re-examines existing data to
address new questions or use methods that have not
previously been used.
• During operation of
existing programmes
• Post-project (end of
programme)
• To identify new relevant questions not
previously considered and make
improvements
Stellenbosch University https://scholar.sun.ac.za
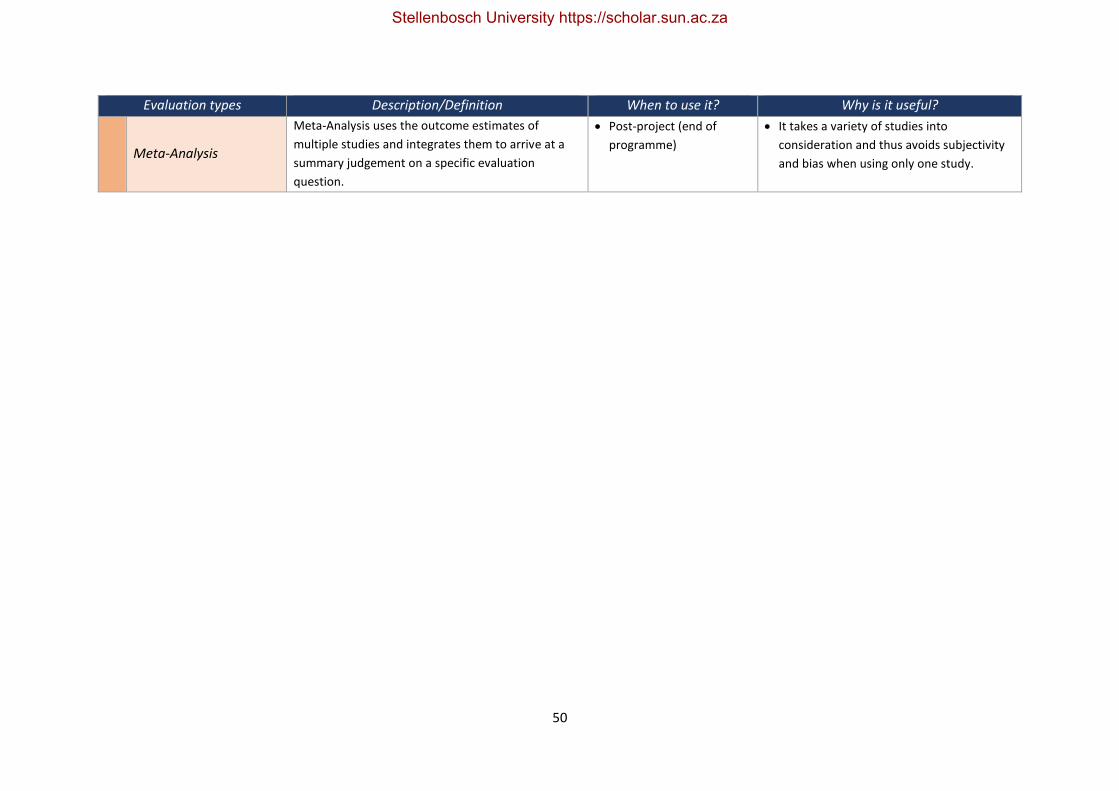
50
Evaluation types Description/Definition When to use it? Why is it useful?
Meta-Analysis
Meta-Analysis uses the outcome estimates of
multiple studies and integrates them to arrive at a
summary judgement on a specific evaluation
question.
• Post-project (end of
programme)
• It takes a variety of studies into
consideration and thus avoids subjectivity
and bias when using only one study.
Stellenbosch University https://scholar.sun.ac.za
51
It is important to realise that process evaluation should ideally be conducted while also implementing
outcome evaluation. If the outcome evaluation delivers unsatisfactory results, it can then be ensured
that it is not because of programme implementation issues. Out of all evaluation types process,
impact, and outcome evaluation are amongst the most common evaluation types (Salabarría-Peña,
Apt and Walsh, 2007).
4.3.2 Purposes of Evaluation
It was suggested in the previous section that different types of evaluations exist to different purposes.
All scholars do not agree on the main purposes of evaluation. Both Fitzpatrick et al. (2004) and Scriven
(1967) agree on the basic purpose of evaluation: to determine the worth/merit of that which is
evaluated to render judgements (Scriven, 1967; Fitzpatrick, Sanders and Worthen, 2004). Scriven
(1967) does however state that although he believes evaluation to have only one purpose, it can have
numerous uses over a variety of specific contexts (Scriven, 1967). Today, Scriven’s views on evaluation
are widely accepted with the exception of a few scholars:
Talmage (1982) believes evaluation has three main purposes (Talmage, 1982):
i. Evaluation is concerned with the worth of a programme ii. Evaluation assists in decision-making on future programme policies
iii. Evaluation has a key political aspect
Rallis and Rossman (2000) identify only two purposes. A noteworthy remark is that since decision
makers can learn more from evaluators about their programmes, they should be more capable of
understanding and interpreting observations (Rallis and Rossman, 2000).
According to Chelimsky (1997), there are four reasons as to why evaluations are made (Chelimsky and
Shadish, 1997):
i. Improving programmes ii. Accountability
iii. Generating knowledge iv. Political uses and/or public relations
More recent evaluators have indicated that these definitions are too limited in scope since their
purposes only deal with the direct and short-term impacts of evaluation and do not reflect the full
extent of possible purposes. According to Mark et al. (1999) and Henry (2000) the ultimate goal of
evaluation is to achieve social betterment by addressing social issues (Mark, Henry and Julnes, 1999;
Henry, 2000). Mark et al. (1999) suggest four long-term purposes in order to achieve this (Mark, Henry
and Julnes, 1999):
i. Determine the merit/worth of a programme ii. Supervision and observation
iii. Programme and organisational improvement iv. Development of new knowledge
Michael Patton (2008) suggests all aforementioned purposes can be combined into four main
purposes/uses: to judge the merit or worth of something, to improve programmes, to generate
knowledge, and for programme development (Patton, 2008). For the purpose of this study Michael
Patton’s combined view is accepted and discussed in Table 4-5 in further detail.
Stellenbosch University https://scholar.sun.ac.za
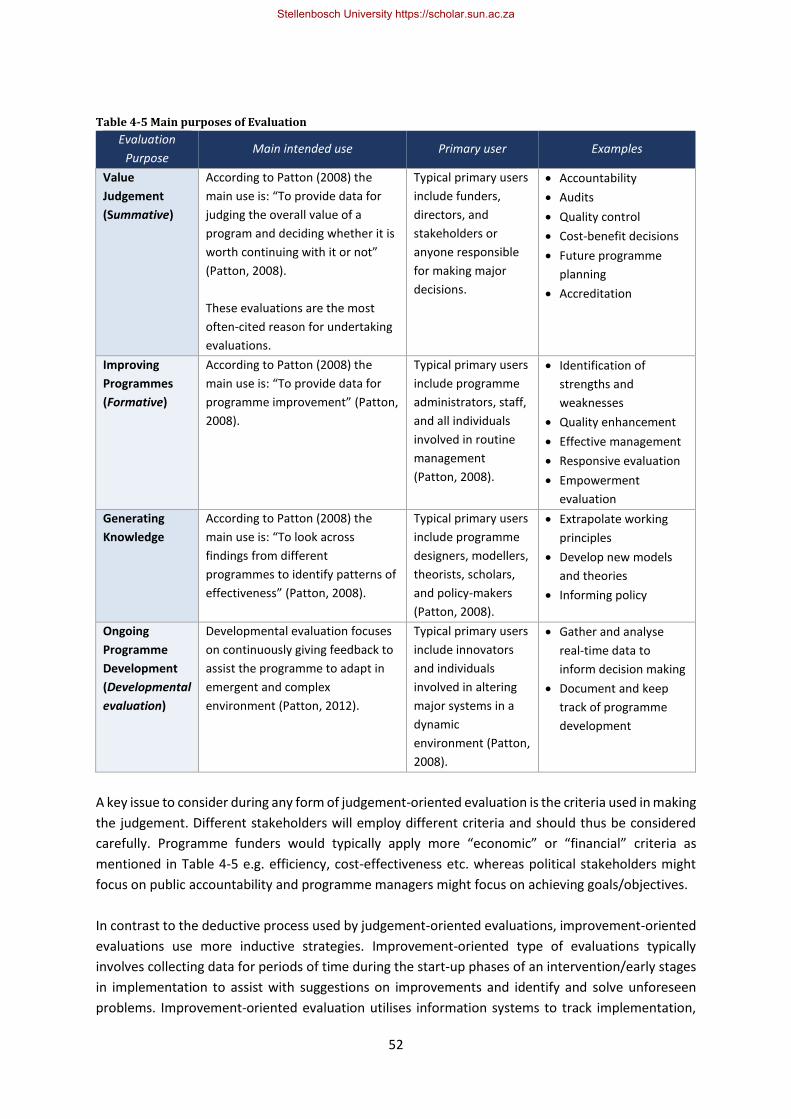
52
Table 4-5 Main purposes of Evaluation
Evaluation
Purpose Main intended use Primary user Examples
Value
Judgement
(Summative)
According to Patton (2008) the
main use is: “To provide data for
judging the overall value of a
program and deciding whether it is
worth continuing with it or not”
(Patton, 2008).
These evaluations are the most
often-cited reason for undertaking
evaluations.
Typical primary users
include funders,
directors, and
stakeholders or
anyone responsible
for making major
decisions.
• Accountability
• Audits
• Quality control
• Cost-benefit decisions
• Future programme
planning
• Accreditation
Improving
Programmes
(Formative)
According to Patton (2008) the
main use is: “To provide data for
programme improvement” (Patton,
2008).
Typical primary users
include programme
administrators, staff,
and all individuals
involved in routine
management
(Patton, 2008).
• Identification of
strengths and
weaknesses
• Quality enhancement
• Effective management
• Responsive evaluation
• Empowerment
evaluation
Generating
Knowledge
According to Patton (2008) the
main use is: “To look across
findings from different
programmes to identify patterns of
effectiveness” (Patton, 2008).
Typical primary users
include programme
designers, modellers,
theorists, scholars,
and policy-makers
(Patton, 2008).
• Extrapolate working
principles
• Develop new models
and theories
• Informing policy
Ongoing
Programme
Development
(Developmental
evaluation)
Developmental evaluation focuses
on continuously giving feedback to
assist the programme to adapt in
emergent and complex
environment (Patton, 2012).
Typical primary users
include innovators
and individuals
involved in altering
major systems in a
dynamic
environment (Patton,
2008).
• Gather and analyse
real-time data to
inform decision making
• Document and keep
track of programme
development
A key issue to consider during any form of judgement-oriented evaluation is the criteria used in making
the judgement. Different stakeholders will employ different criteria and should thus be considered
carefully. Programme funders would typically apply more “economic” or “financial” criteria as
mentioned in Table 4-5 e.g. efficiency, cost-effectiveness etc. whereas political stakeholders might
focus on public accountability and programme managers might focus on achieving goals/objectives.
In contrast to the deductive process used by judgement-oriented evaluations, improvement-oriented
evaluations use more inductive strategies. Improvement-oriented type of evaluations typically
involves collecting data for periods of time during the start-up phases of an intervention/early stages
in implementation to assist with suggestions on improvements and identify and solve unforeseen
problems. Improvement-oriented evaluation utilises information systems to track implementation,
Stellenbosch University https://scholar.sun.ac.za
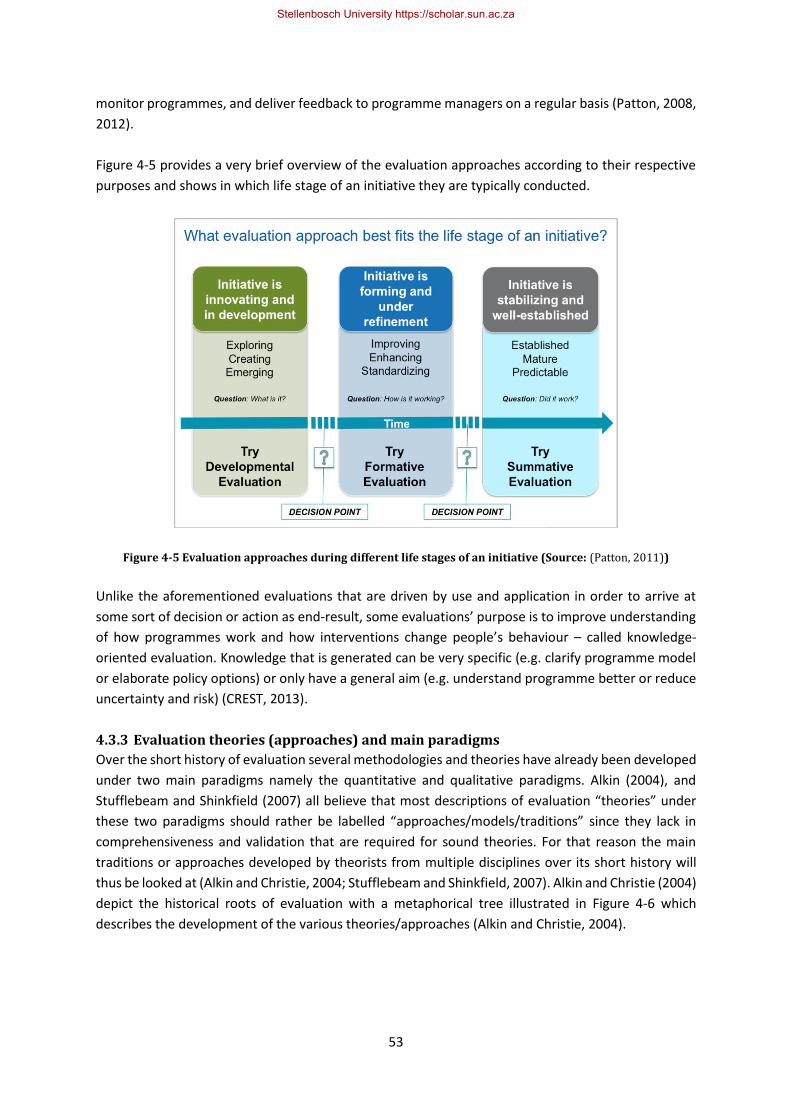
53
monitor programmes, and deliver feedback to programme managers on a regular basis (Patton, 2008,
2012).
Figure 4-5 provides a very brief overview of the evaluation approaches according to their respective
purposes and shows in which life stage of an initiative they are typically conducted.
Figure 4-5 Evaluation approaches during different life stages of an initiative (Source: (Patton, 2011))
Unlike the aforementioned evaluations that are driven by use and application in order to arrive at
some sort of decision or action as end-result, some evaluations’ purpose is to improve understanding
of how programmes work and how interventions change people’s behaviour – called knowledge-
oriented evaluation. Knowledge that is generated can be very specific (e.g. clarify programme model
or elaborate policy options) or only have a general aim (e.g. understand programme better or reduce
uncertainty and risk) (CREST, 2013).
4.3.3 Evaluation theories (approaches) and main paradigms
Over the short history of evaluation several methodologies and theories have already been developed
under two main paradigms namely the quantitative and qualitative paradigms. Alkin (2004), and
Stufflebeam and Shinkfield (2007) all believe that most descriptions of evaluation “theories” under
these two paradigms should rather be labelled “approaches/models/traditions” since they lack in
comprehensiveness and validation that are required for sound theories. For that reason the main
traditions or approaches developed by theorists from multiple disciplines over its short history will
thus be looked at (Alkin and Christie, 2004; Stufflebeam and Shinkfield, 2007). Alkin and Christie (2004)
depict the historical roots of evaluation with a metaphorical tree illustrated in Figure 4-6 which
describes the development of the various theories/approaches (Alkin and Christie, 2004).
Stellenbosch University https://scholar.sun.ac.za
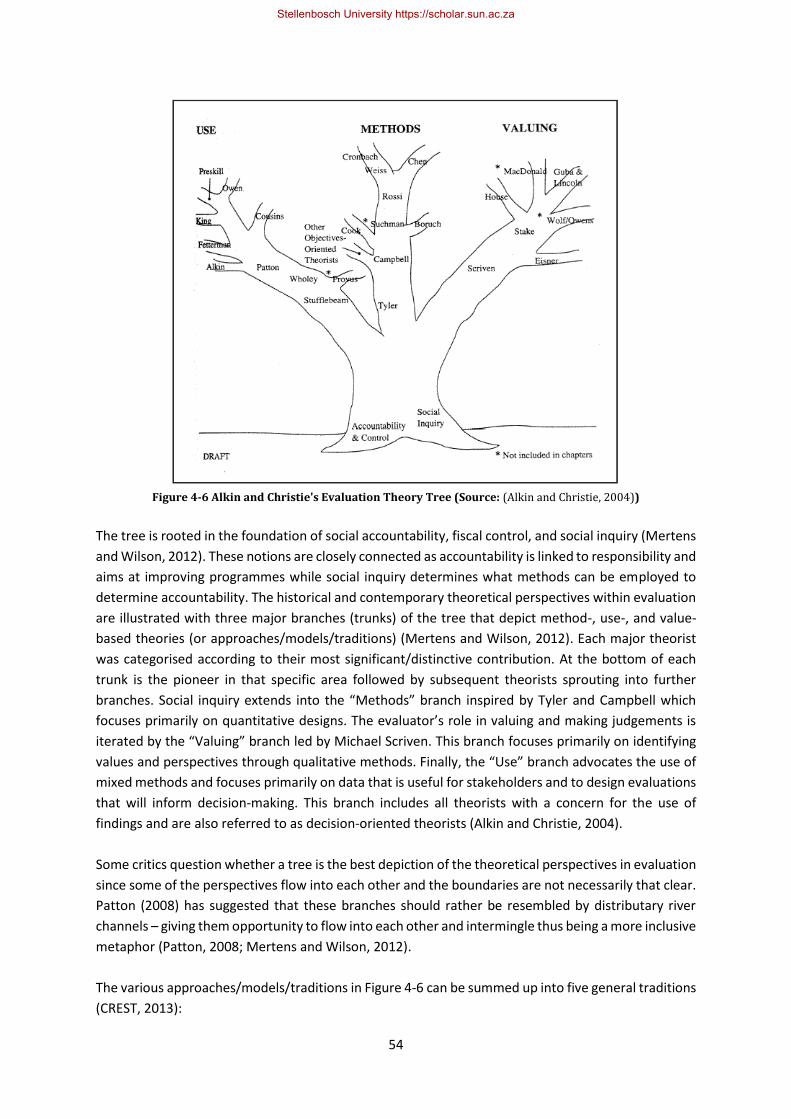
54
Figure 4-6 Alkin and Christie's Evaluation Theory Tree (Source: (Alkin and Christie, 2004))
The tree is rooted in the foundation of social accountability, fiscal control, and social inquiry (Mertens
and Wilson, 2012). These notions are closely connected as accountability is linked to responsibility and
aims at improving programmes while social inquiry determines what methods can be employed to
determine accountability. The historical and contemporary theoretical perspectives within evaluation
are illustrated with three major branches (trunks) of the tree that depict method-, use-, and value-
based theories (or approaches/models/traditions) (Mertens and Wilson, 2012). Each major theorist
was categorised according to their most significant/distinctive contribution. At the bottom of each
trunk is the pioneer in that specific area followed by subsequent theorists sprouting into further
branches. Social inquiry extends into the “Methods” branch inspired by Tyler and Campbell which
focuses primarily on quantitative designs. The evaluator’s role in valuing and making judgements is
iterated by the “Valuing” branch led by Michael Scriven. This branch focuses primarily on identifying
values and perspectives through qualitative methods. Finally, the “Use” branch advocates the use of
mixed methods and focuses primarily on data that is useful for stakeholders and to design evaluations
that will inform decision-making. This branch includes all theorists with a concern for the use of
findings and are also referred to as decision-oriented theorists (Alkin and Christie, 2004).
Some critics question whether a tree is the best depiction of the theoretical perspectives in evaluation
since some of the perspectives flow into each other and the boundaries are not necessarily that clear.
Patton (2008) has suggested that these branches should rather be resembled by distributary river
channels – giving them opportunity to flow into each other and intermingle thus being a more inclusive
metaphor (Patton, 2008; Mertens and Wilson, 2012).
The various approaches/models/traditions in Figure 4-6 can be summed up into five general traditions
(CREST, 2013):
Stellenbosch University https://scholar.sun.ac.za
55
I. The (quasi)-experimental tradition II. The naturalistic or qualitative tradition
III. The participatory/responsive/empowerment tradition IV. The utilization-focused tradition V. The realist tradition
A brief discussion on each of the five traditions will now be provided.
I. The (quasi)-experimental tradition The first efforts in measuring programme effectiveness came from the experimental era in which the
neighbouring disciplines of evaluation such as psychology and sociology applied classic experiments
as their model designs. There is general consensus that significant contributions were made during
the 1960s and 1970s by pioneers Ralph Tyler, Donald Campbell and later Thomas Cook and Robert
Boruch, revolutionising the tradition and marking the end of an era in evaluation. These pioneers
extend the “Methods” branch in Figure 4-6 primarily focusing on quantitative designs. Classic works
include Experimental and quasi-experimental evaluations in social research by Campbell and Stanley
(1963) and the more extensive Quasi-experimentation by Thomas Cook and Donald Campbell (1979)
(Campbell and Stanley, 1963; Campbell and Cook, 1979).
Ralph Tyler contributed by means of indicating the importance of evaluation against predetermined
objectives when he attempted to enhance the curriculum development process at the Bureau of
Educational Research and Service. His research showed that teachers can improve their curriculum by
expressing their objectives in terms of students’ behaviour change. Tyler’s revolutionary “Eight-year
study” publication emphasised the importance of setting behavioural objectives and contributed to a
better understanding of programme goals. Tyler’s work laid the foundation for other methodology
theorists to build on (Madaus and Stufflebeam, 2000).
After Tyler, Donald Campbell made influential contributions with defining terms such as internal
validation (cause and effect), external validation (generalisability) and randomised assignment. The
quasi-instrumental design was introduced in later years along with Stanley where the classic
experiment was not possible (Shadish, Cook and Leviton, 1991). The epistemic dimension to
Campbell’s work was clarified later on when stating that he viewed knowledge attainment as a process
of formulating and testing hypotheses and then keeping those that solved the problem. This approach
is similar to that of Popper’s trial and error approach in which interventions are tested on a small scale
to determine the overall effects (intended and unintended) when applying certain changes (Tilley and
Pawson, 2000).
Lastly, the contribution of Robert Boruch is considered. Boruch considered how the data produced
from technology of randomised tests could be used to inform policy. He used comparative studies
between diverse disciplines to indicate the conditions under which the use of randomised tests is
appropriate and proved that inadequacies in field experiments were not specific to certain disciplines.
The idea of using randomised experiments together with approximations to experiments in
programme evaluation was also encouraged by Boruch (Boruch, 1975).
Stellenbosch University https://scholar.sun.ac.za
56
After the uproar in the 1960s and 1970s of this paradigm in the US, towards the end of the 1970s
criticism escalated due to the “black box”-like mentality and atheoretical nature of the results. This
pathed the way for the dawn of a new evaluation tradition of a more qualitative nature.
II. The qualitative/naturalistic tradition
During the late 1970s a shift occurred from the experimental tradition in evaluation research towards
qualitative evaluation (Patton, 1980), also referred to by various theorists as: naturalistic evaluation
(David D. Williams, 1986), fourth-generation evaluation (Guba and Lincoln, 1981), and ethnographic
evaluation (Fetterman and Pitman, 1986). The reason for the transmission to a more qualitative nature
can be ascribed to the fact that qualitative research in general became more prominent in the late
1970s that led to several studies raising criticism on the usefulness of experimental approaches in
evaluation research. Increasing numbers of studies exposed several big social reform experiments as
failures and not showing any clear successes. Also, critics believed evaluation research results did not
lead directly to improved decision-making or were used in any useful way. As a result, responsive and
participatory evaluation eventually emerged (discussed in the following section).
Naturalistic/qualitative evaluation share the epistemic principles and methods of qualitative research.
David Williams (1986) formulated some questions on an evaluation project and suggested that
depending on the answers to those questions, it should be obvious whether a naturalistic or
experimental approach would be appropriate (David D Williams, 1986).
The prominence of Scriven in the field of evaluation is commonly known. Along with him on the
“Valuing” branch are a few other forerunners (Stake and Guba & Lincoln) generally referred to as the
fourth-generation evaluation theorists of the late 1970s and early 1980s. The fourth-generation
evaluation falls within the broader naturalistic tradition. According to Guba and Lincoln, the first
generation of evaluation had to do with measurement, the second generation with description, and
the third generation with judgement. The fourth generation of evaluation however, according to
them, “involves evaluations that are negotiated co-creations of social reality” (Guba and Lincoln, 1989)
Mod1. It is vital to empower the evaluated groups (stakeholders) to encourage co-creative
participation in the evaluation. The goal is to deepen understanding for all parties involved
(stakeholders, investigators, evaluators, evaluees etc.) in the issue as the evaluation progresses.
Evaluators help the evaluees to focus their constructions of reality and they act in a responsive manner
to evaluee concerns, criticisms, and suggestions. This should result in mutual learning, improved
awareness, and an increase in motivation to act upon the evaluation results (Guba and Lincoln, 1989)
Mod1. The evaluation process is strengthened by considering that human interactions could possibly
have adverse effects on the validity and addressing this concern by replacing it with the inclusion of
the research subject’s significance of situations and needs. Guba and Lincoln’s approach also
reconsiders the idea of causality and causal inferences in experimental traditions and defines the term
“mutual causality”. They recognise that human dynamics and events occur in a web-like structure of
multiple pathways and not sequentially. Guba and Lincoln also suggest that the trustworthiness of a
research study is important to evaluating its worth and are concerned with establishing (Lincoln and
Guba, 1986):
• Credibility – level of confidence in the “truth” of the findings
• Transferability – indicating that the findings are applicable in other contexts
• Dependability – indicating that the findings are repeatable and consistent
Stellenbosch University https://scholar.sun.ac.za
57
• Confirmability – indicating the extent to which the findings are shaped by the respondents rather than a researcher’s motivations, personal interest or biases.
This trustworthiness criteria were developed within what Guba and Lincoln called naturalistic
evaluation. Later on, Guba & Lincoln formulated what they called the “ten commandments” of their
evaluation approach and stated that evaluations (Guba, 1987):
1. ‘produce constructions/constructed realities’ 2. ‘are value-laden processes’ 3. ‘are local processes’ 4. ‘are socio-political processes’ 5. ‘are divergent and continuous processes’ 6. ‘are emergent processes’ 7. ‘share accountability – they don’t fix it’ 8. ‘involve evaluators and stakeholders in a hermeneutic relationship’ 9. ‘Evaluators play multiple roles’ 10. ‘Evaluators require a variety of skills/qualities’
In summary, during the 1980s the dominance of the experimental tradition came to a close with the
provision of the corrective naturalistic and fourth generation evaluation approaches. This was
accomplished through a renewed focus on the constructed nature of social programmes, the contexts
of social intervention, focusing on implementation processes, and assessing programme outcomes.
Again, criticisms arose regarding the usefulness of findings due to various reasons; one of the most
prevalent reasons being that evaluations did not involve the various stakeholders of their programmes
in their studies. This led to the emergence of a new range of evaluation approaches focusing on
consultation and participation (CREST, 2013).
III. The responsive/participatory/empowerment tradition
As mentioned under the previous heading, critics indicated a lack of usefulness in findings that did not
lead to improved decision-making as well as a lack of stakeholder involvement. As a result, responsive
and participatory (empowerment) evaluation eventually emerged.
The educational evaluator Robert Stake, who is considered the pioneer of responsive evaluation
according to Shadish, Leviton and Cook, aided in legitimising qualitative evaluation. Stake expressed
the importance of a responsive approach to programme activities and being responsive to stakeholder
concerns. This would ultimately provide stakeholders with the ability to do value judgements on their
programmes and also provide values that are expressed in such a manner that they have a clear
influence on decision-making processes (Shadish, Cook and Leviton, 1991). Responsive evaluation thus
has an important emphasis on the usefulness of evaluations and understanding the programme as a
whole. Instead of a linear model, Stake opts for a “democratic” model whereby evaluation results can
induce specific personal experiences which can lead to a change in practices. Stake believes the crucial
feature of the approach is to act responsively to key problems – especially those that are identified by
individuals at site. The design of the approach is a slow process of continuously changing and adapting
evaluation goals and data-gathering methods as the evaluators become more familiar with the
programme and its context. Besides being responsive to the participants’ problems and context, this
approach is also responsive to possible users of the evaluation findings.
Stellenbosch University https://scholar.sun.ac.za
58
Within the same generic paradigm, we consider participatory and empowerment evaluation. Various
authors responded to the critique that claims evaluation findings were not useful or contributed to
decision-making by identifying the main issue: a lack of stakeholder involvement and participation
during the evaluation design and implementation processes. The term participatory evaluation can
be described by some key principles:
• Evaluators methodologically consult on and facilitate the evaluation process. The
intervention’s target groups (beneficiaries) and evaluators decide together when and how
an evaluation should be conducted, what it is that should be evaluated, and what the
findings will be used for (CREST, 2013). This approach enables recognition of shared interest
amongst the involved parties.
• The participatory evaluation approach is an educational process in which social groups gain
knowledge about their reality that are action-oriented. The social groups then come to an
agreement on the actions that should be taken (CREST, 2013).
• Participatory evaluation is a learning process in which the evaluators may have to teach
other individuals from the evaluation team what to do. As the project develops however, the
evaluation team will gain knowledge and become more informed and efficient. A
progression in the change of attitudes, skills, and behaviour should be recognised (CREST,
2013).
Empowerment evaluation is considered one of the most popular traditions amongst participatory
evaluation approaches. David Fetterman (1996) defines empowerment evaluation: “The use of
evaluation concepts, techniques, and findings to foster improvement and self-determination”. The
only part about this definition that is novel is the focus on fostering self-determinisation which is the
defining factor of empowerment evaluation. According to Fetterman there are five facets of
empowerment evaluation (Fetterman, Kaftarian and Wandersman, 1996):
• Participants are trained to conduct their own evaluation thus building capacity
• Instead of acting like judges, evaluators act as facilitators and coaches
• Evaluators support disempowered groups by advocating for them or by enabling them to
advocate for themselves
• Illumination
• The liberation of all involved parties
The liberation/emancipation dimension to the empowerment evaluation tradition can be considered
the defining characteristic of empowerment evaluation. The facilitation and illumination dimensions
to Fettermans facets are however not unique to empowerment evaluation, but also play a role in the
participatory and utilisation-focused traditions (Fetterman, Kaftarian and Wandersman, 1996).
IV. The utilisation-focused tradition Pioneer Michael Patton conceptualised another theory under the qualitative paradigm called
utilisation-focused evaluation. According to Patton, utilisation-focused evaluation advocates for the
careful consideration of the intended use of evaluations and should primarily be judged by their utility
and usefulness.
This approach is personal and situational and not bound to a specific type of theory, methodology,
model, or purpose. Rather than being knowledge-orientated utilisation-focused evaluation should,
according to Patton, be action-orientated. Patton also suggests that utilisation-focused evaluation
Stellenbosch University https://scholar.sun.ac.za
59
starts with the premise that the evaluation should be judged according to its utility and use. This
means evaluators should facilitate and design the evaluation process by especially considering what
effects every step of the process will have on use (Patton, 2008). Each step must support what the
results will be used for – this would thus require a highly participative and collaborative process. It
should then be more likely that the end users of the evaluation take ownership of the results and find
improved uses (Patton, 2002). Finally, Patton suggests a fundamental change in the traditional use of
findings. He advises on moving beyond judgement towards a learning environment where
accountability is achieved from the use of findings:
“In the context of learning organizations, accountability focuses not on the
findings but upon the changes that are made as a result of the findings. This is
accountability that is achieved from the use of findings.” (Patton, 2002)
Some alternative uses of the results due to heightened involvement in the programme’s process
through participation and collaboration include: greater shared understanding, programme
intervention support and reinforcement, programme and organisational development, and increasing
self-determination and ownership (Patton, 2002).
V. The realist tradition (realistic evaluation) The final tradition as advocated by Ray Pawson and Nick Tilley serves as an extension of Campbell and
Stanley’s experimental tradition and is called the realist tradition. This tradition essentially questions
the usefulness of evaluation findings in improving policies. Pawson and Tilley believe the realist
tradition is more appropriate than the other traditions in the formulation and refinement of social
policies and practices. These policies and practices do however need informed and critical but also
sensitive application regarding the detail of the local context (Tilley and Pawson, 2000; Kazi and
Rostila, 2002). The realist tradition is not, however, depicted in Alkin & Christie's Evaluation Theory
Tree.
Similar to Campbell and Popper’s view, Pawson and Tilley also see the purpose of evaluation research
as informing the development of policies and practices. Their disagreement originates from the way
in which Campbell’s theory on experimentation is interpreted by some and the mechanical way in
which it is applied (Tilley and Pawson, 2000). Realistic evaluation’s view on what experimentation
entails differs from the orthodox custom in evaluation circles. The orthodox view is that
experimentation involves:
(1) Creating equivalent experimental and control groups, (2) Applying interventions to only the experimental group, and (3) Comparing the changes that have occurred in the experimental and control groups as a way
of determining if and how the intervention has had an effect. Random allocation would ensure that there are no differences between the groups before the
intervention is carried out. This means that once the experimental intervention has been applied, any
difference observed between the two groups after can be ascribed to the implemented action (the
applied experimental measure). It is however not always possible to have random allocation. Under
such circumstances, the experimental and control groups are selected as similar as possible through
quasi experimental methods. Once applied, it can be assumed that the measures are effective if the
following are evident in the findings (Tilley and Pawson, 2000):
Stellenbosch University https://scholar.sun.ac.za
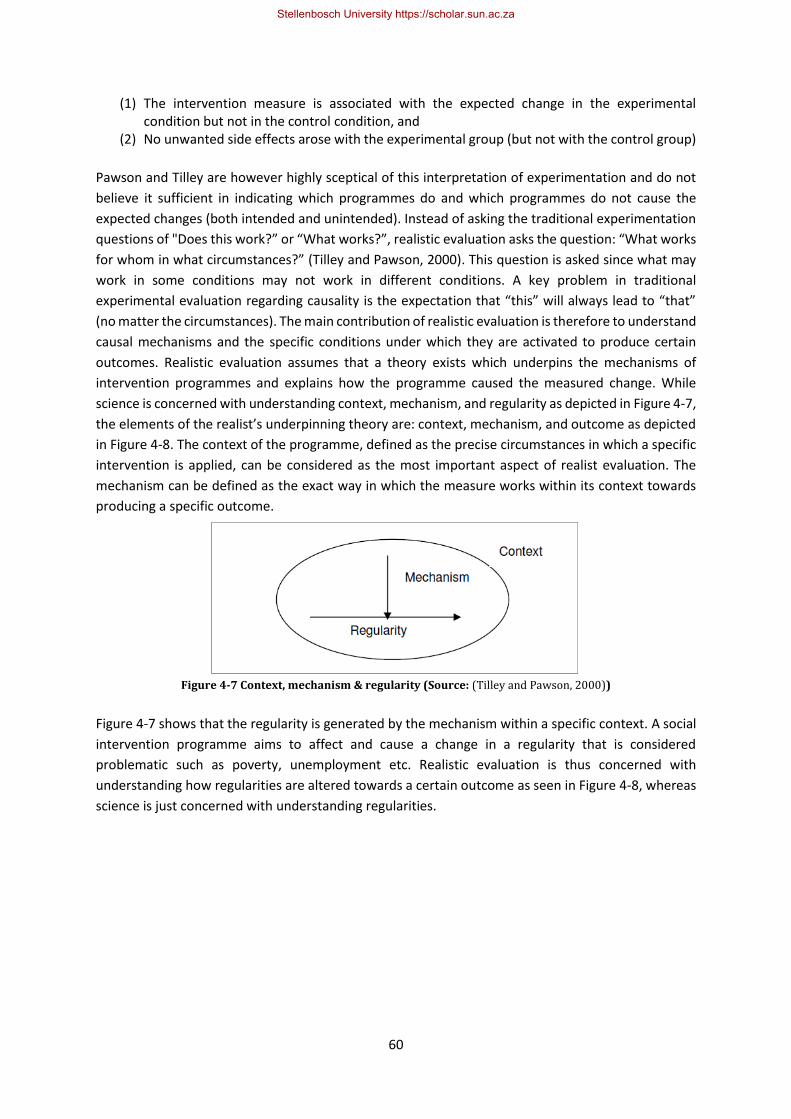
60
(1) The intervention measure is associated with the expected change in the experimental condition but not in the control condition, and
(2) No unwanted side effects arose with the experimental group (but not with the control group)
Pawson and Tilley are however highly sceptical of this interpretation of experimentation and do not
believe it sufficient in indicating which programmes do and which programmes do not cause the
expected changes (both intended and unintended). Instead of asking the traditional experimentation
questions of "Does this work?” or “What works?”, realistic evaluation asks the question: “What works
for whom in what circumstances?” (Tilley and Pawson, 2000). This question is asked since what may
work in some conditions may not work in different conditions. A key problem in traditional
experimental evaluation regarding causality is the expectation that “this” will always lead to “that”
(no matter the circumstances). The main contribution of realistic evaluation is therefore to understand
causal mechanisms and the specific conditions under which they are activated to produce certain
outcomes. Realistic evaluation assumes that a theory exists which underpins the mechanisms of
intervention programmes and explains how the programme caused the measured change. While
science is concerned with understanding context, mechanism, and regularity as depicted in Figure 4-7,
the elements of the realist’s underpinning theory are: context, mechanism, and outcome as depicted
in Figure 4-8. The context of the programme, defined as the precise circumstances in which a specific
intervention is applied, can be considered as the most important aspect of realist evaluation. The
mechanism can be defined as the exact way in which the measure works within its context towards
producing a specific outcome.
Figure 4-7 Context, mechanism & regularity (Source: (Tilley and Pawson, 2000))
Figure 4-7 shows that the regularity is generated by the mechanism within a specific context. A social
intervention programme aims to affect and cause a change in a regularity that is considered
problematic such as poverty, unemployment etc. Realistic evaluation is thus concerned with
understanding how regularities are altered towards a certain outcome as seen in Figure 4-8, whereas
science is just concerned with understanding regularities.
Stellenbosch University https://scholar.sun.ac.za
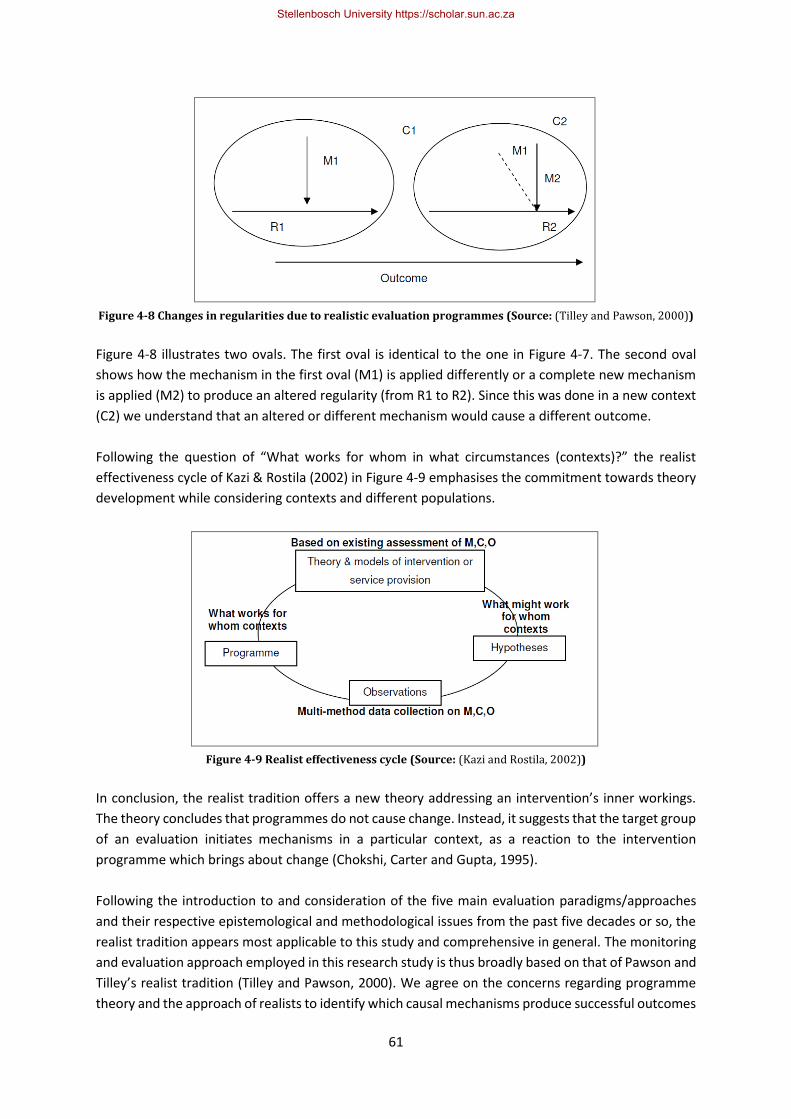
61
Figure 4-8 Changes in regularities due to realistic evaluation programmes (Source: (Tilley and Pawson, 2000))
Figure 4-8 illustrates two ovals. The first oval is identical to the one in Figure 4-7. The second oval
shows how the mechanism in the first oval (M1) is applied differently or a complete new mechanism
is applied (M2) to produce an altered regularity (from R1 to R2). Since this was done in a new context
(C2) we understand that an altered or different mechanism would cause a different outcome.
Following the question of “What works for whom in what circumstances (contexts)?” the realist
effectiveness cycle of Kazi & Rostila (2002) in Figure 4-9 emphasises the commitment towards theory
development while considering contexts and different populations.
Figure 4-9 Realist effectiveness cycle (Source: (Kazi and Rostila, 2002))
In conclusion, the realist tradition offers a new theory addressing an intervention’s inner workings.
The theory concludes that programmes do not cause change. Instead, it suggests that the target group
of an evaluation initiates mechanisms in a particular context, as a reaction to the intervention
programme which brings about change (Chokshi, Carter and Gupta, 1995).
Following the introduction to and consideration of the five main evaluation paradigms/approaches
and their respective epistemological and methodological issues from the past five decades or so, the
realist tradition appears most applicable to this study and comprehensive in general. The monitoring
and evaluation approach employed in this research study is thus broadly based on that of Pawson and
Tilley’s realist tradition (Tilley and Pawson, 2000). We agree on the concerns regarding programme
theory and the approach of realists to identify which causal mechanisms produce successful outcomes
Stellenbosch University https://scholar.sun.ac.za

62
in certain contexts. However, we also take into consideration the main assumptions of utilization-
focused and responsive evaluation, subscribing to the idea of conducting evaluations that encompass
a participatory and collaborative design and method. An evaluation should also be responsive to
stakeholders and useful to policy-makers and funders. This means adopting pluralism with regard to
methodology and design.
Essentially, both the purpose of the evaluation and the nature of the programme must be key
considerations for a successful evaluation design. The evaluator must have a deep understanding of
the programme, its structure and internal logic, its context and history, and its desired impacts and
outcomes for a successful evaluation (CREST, 2013).
4.4 Monitoring
In this section, a clear definition is given to the term ‘monitoring’. The various types of monitoring are
then discussed briefly, followed by a discussion on the differences between monitoring and
evaluation.
4.4.1 Defining Monitoring
A detailed definition of monitoring suggested by the Organization for Economic Co-operative
Development (OECD, 2002) reads:
“Monitoring is a continuous function that uses the systematic collection of data
on specified indicators to provide management and the main stakeholders of an
ongoing development intervention with indications of the extent of progress and
achievement of objectives and progress in the use of allocated funds.” (OECD,
2002)
Besides the definition of monitoring by OECD (2002), a simplified explanation thereof would be:
Monitoring is a continuous process in which information is systematically collected from projects and
programmes on routine basis by observation, supervision, measuring, and testing in order to:
• Provide management and stakeholders with regular feedback on the progress or delay of a
project or programme towards reaching it goals; (UNDP, 2009)
• Improve future activities and practices by learning from experience;
• Have resource usage accountability of internal and external parties;
• Provide informed decision support on what actions should be taken on initiatives;
• And to empower all stakeholders involved in a certain initiative. (‘What is Monitoring and
Evaluation?’, 2017)
According to UNDP (2009), merely reviewing the progress that is made in taking the actions as planned
is an inadequate definition of monitoring. They strongly advise that the focus should be on reviewing
the progress that is made towards achieving end goals that were set. The difference lies in focusing
on the end goals rather than just ticking boxes or taking actions that were decided on previously while
the path towards the end goal might have changed. (UNDP, 2009) It is important that the continuous
monitoring process should start in the planning stage of a project already. The data obtained through
monitoring the project is then used for evaluation.
Stellenbosch University https://scholar.sun.ac.za

63
The biggest obstacles in achieving successful monitoring of programmes are cultural and
organisational (Field et al., 2007). Strong collaboration is needed between managers and data
scientists without being hindered by organisational boundaries in order to achieve successful
monitoring. Other obstacles include too short funding cycles and the common practice of allowing
data to pile up without rigorous analyses which could assist in improving monitoring methods.
(Reynolds et al., 2016).
4.4.2 Monitoring types
Reynolds et al. (2016) distinguish between four types of monitoring depending on their relationship
to management actions for guiding design decisions (Reynolds et al., 2016). These four monitoring
types are described in Table 4-6.
Table 4-6 Monitoring types
Monitoring type Description When to use?
Status and trends
monitoring
Monitor to understand the
system with no action being
taken (Reynolds et al., 2016)
When no specific action is being considered and
the purpose is merely to characterise the state of
a system over time (Reynolds et al., 2016)
Threshold
monitoring
Monitor in order to decide when
to act with no initial action being
taken (Reynolds et al., 2016)
When the monitoring information will cause a
specific action (Reynolds et al., 2016)
Effectiveness
monitoring
Monitor in order to assess the
outcomes of certain actions
(Reynolds et al., 2016)
When the timing of a certain action is planned and
the expected response to the action has a
relatively low uncertainty (Reynolds et al., 2016)
Monitoring in an
adaptive
management
framework
Monitor to assess the outcomes
of multiple actions in a
framework in order to inform
what actions must be taken next
(Reynolds et al., 2016)
When the timing of a certain action is planned and
the expected response to the action has a medium
to high uncertainty. Comparisons with alternative
actions will inform improved future decisions
(Reynolds et al., 2016)
4.4.3 Differences between monitoring and evaluation
A key difference between evaluation and monitoring is that evaluations provide managers with more
objective judgements on whether they are still on the right track towards their goals since it is done
independently. Another difference is that evaluations usually have more precise and thorough
procedures and methodologies in order to do an extensive analysis of the project. The aim is however
still quite similar to that of monitoring: information is provided that will assist in decision-making,
improve performance and reach goals that were identified (UNDP, 2009). The School of Public Health
from UWC has identified the main differences between monitoring and evaluation as described in
Table 4-7 (Puoane, 2010).
Table 4-7 Differences between monitoring and evaluation (Source: (Puoane, 2010))
Monitoring Evaluation
Continuous Periodic; at important milestones e.g. mid-term, end of
term.
Stellenbosch University https://scholar.sun.ac.za
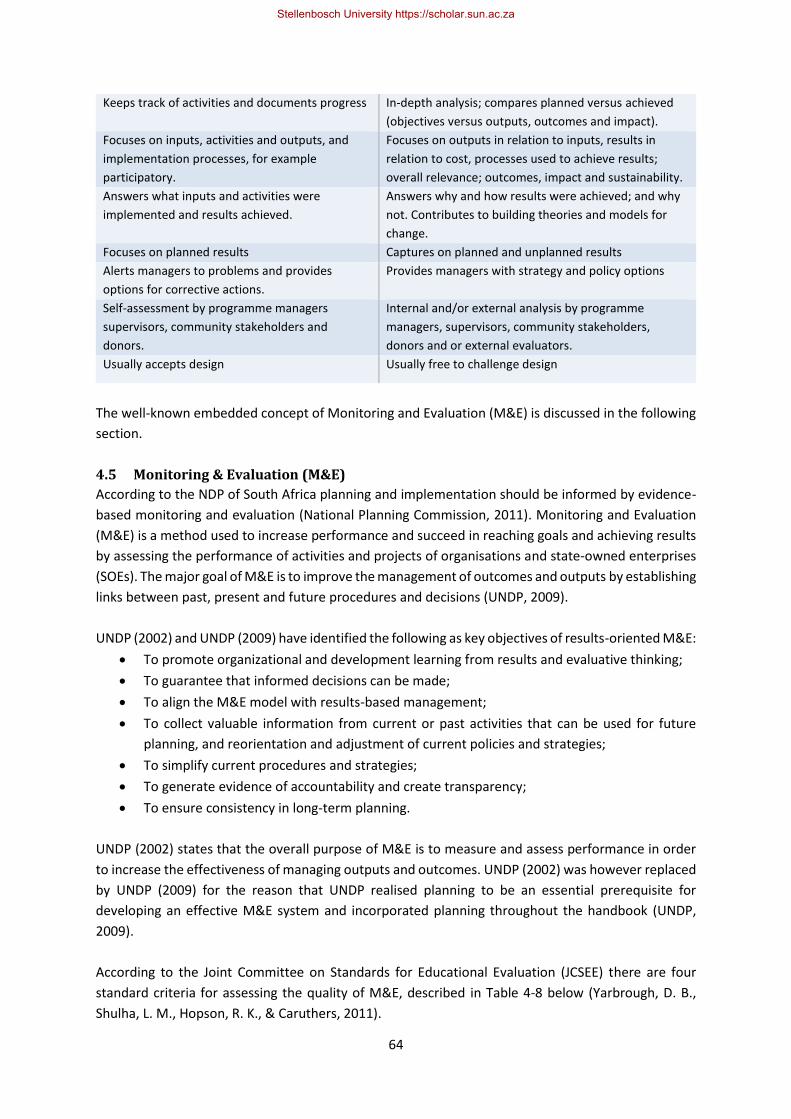
64
Keeps track of activities and documents progress In-depth analysis; compares planned versus achieved
(objectives versus outputs, outcomes and impact).
Focuses on inputs, activities and outputs, and
implementation processes, for example
participatory.
Focuses on outputs in relation to inputs, results in
relation to cost, processes used to achieve results;
overall relevance; outcomes, impact and sustainability.
Answers what inputs and activities were
implemented and results achieved.
Answers why and how results were achieved; and why
not. Contributes to building theories and models for
change.
Focuses on planned results Captures on planned and unplanned results
Alerts managers to problems and provides
options for corrective actions.
Provides managers with strategy and policy options
Self-assessment by programme managers
supervisors, community stakeholders and
donors.
Internal and/or external analysis by programme
managers, supervisors, community stakeholders,
donors and or external evaluators.
Usually accepts design Usually free to challenge design
The well-known embedded concept of Monitoring and Evaluation (M&E) is discussed in the following
section.
4.5 Monitoring & Evaluation (M&E)
According to the NDP of South Africa planning and implementation should be informed by evidence-
based monitoring and evaluation (National Planning Commission, 2011). Monitoring and Evaluation
(M&E) is a method used to increase performance and succeed in reaching goals and achieving results
by assessing the performance of activities and projects of organisations and state-owned enterprises
(SOEs). The major goal of M&E is to improve the management of outcomes and outputs by establishing
links between past, present and future procedures and decisions (UNDP, 2009).
UNDP (2002) and UNDP (2009) have identified the following as key objectives of results-oriented M&E:
• To promote organizational and development learning from results and evaluative thinking;
• To guarantee that informed decisions can be made;
• To align the M&E model with results-based management;
• To collect valuable information from current or past activities that can be used for future
planning, and reorientation and adjustment of current policies and strategies;
• To simplify current procedures and strategies;
• To generate evidence of accountability and create transparency;
• To ensure consistency in long-term planning.
UNDP (2002) states that the overall purpose of M&E is to measure and assess performance in order
to increase the effectiveness of managing outputs and outcomes. UNDP (2002) was however replaced
by UNDP (2009) for the reason that UNDP realised planning to be an essential prerequisite for
developing an effective M&E system and incorporated planning throughout the handbook (UNDP,
2009).
According to the Joint Committee on Standards for Educational Evaluation (JCSEE) there are four
standard criteria for assessing the quality of M&E, described in Table 4-8 below (Yarbrough, D. B.,
Shulha, L. M., Hopson, R. K., & Caruthers, 2011).
Stellenbosch University https://scholar.sun.ac.za
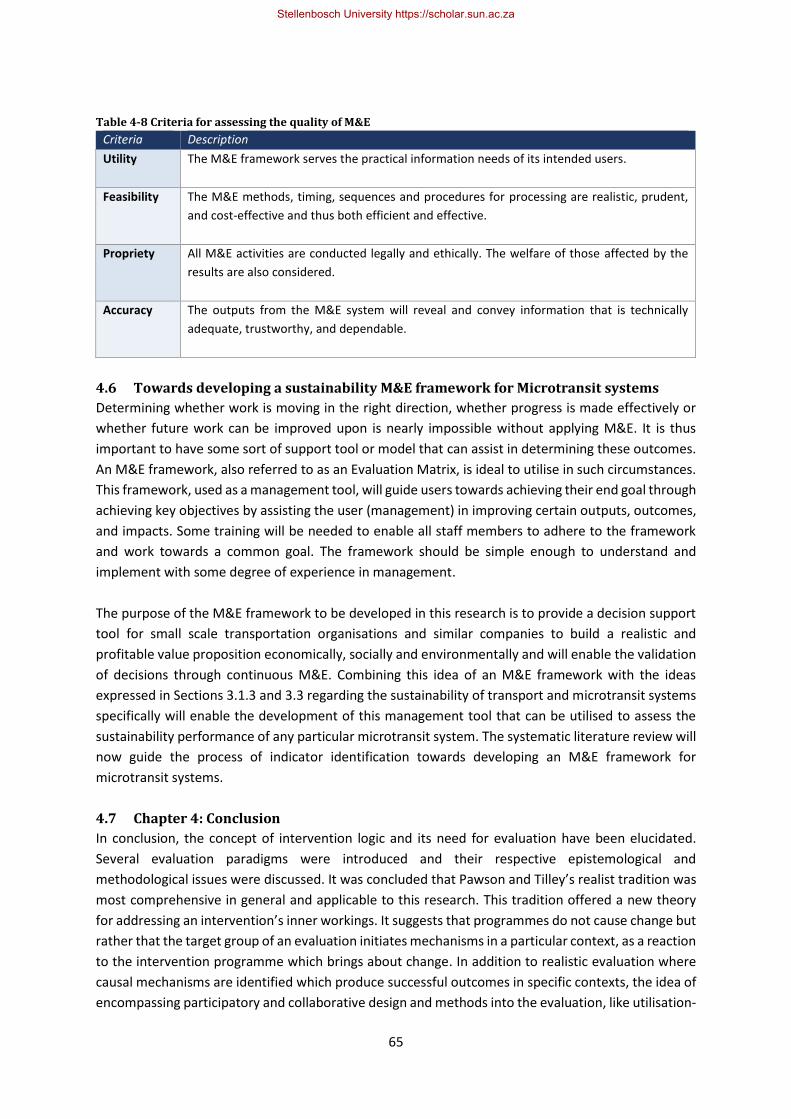
65
Table 4-8 Criteria for assessing the quality of M&E
Criteria Description
Utility The M&E framework serves the practical information needs of its intended users.
Feasibility The M&E methods, timing, sequences and procedures for processing are realistic, prudent,
and cost-effective and thus both efficient and effective.
Propriety All M&E activities are conducted legally and ethically. The welfare of those affected by the
results are also considered.
Accuracy The outputs from the M&E system will reveal and convey information that is technically
adequate, trustworthy, and dependable.
4.6 Towards developing a sustainability M&E framework for Microtransit systems
Determining whether work is moving in the right direction, whether progress is made effectively or
whether future work can be improved upon is nearly impossible without applying M&E. It is thus
important to have some sort of support tool or model that can assist in determining these outcomes.
An M&E framework, also referred to as an Evaluation Matrix, is ideal to utilise in such circumstances.
This framework, used as a management tool, will guide users towards achieving their end goal through
achieving key objectives by assisting the user (management) in improving certain outputs, outcomes,
and impacts. Some training will be needed to enable all staff members to adhere to the framework
and work towards a common goal. The framework should be simple enough to understand and
implement with some degree of experience in management.
The purpose of the M&E framework to be developed in this research is to provide a decision support
tool for small scale transportation organisations and similar companies to build a realistic and
profitable value proposition economically, socially and environmentally and will enable the validation
of decisions through continuous M&E. Combining this idea of an M&E framework with the ideas
expressed in Sections 3.1.3 and 3.3 regarding the sustainability of transport and microtransit systems
specifically will enable the development of this management tool that can be utilised to assess the
sustainability performance of any particular microtransit system. The systematic literature review will
now guide the process of indicator identification towards developing an M&E framework for
microtransit systems.
4.7 Chapter 4: Conclusion
In conclusion, the concept of intervention logic and its need for evaluation have been elucidated.
Several evaluation paradigms were introduced and their respective epistemological and
methodological issues were discussed. It was concluded that Pawson and Tilley’s realist tradition was
most comprehensive in general and applicable to this research. This tradition offered a new theory
for addressing an intervention’s inner workings. It suggests that programmes do not cause change but
rather that the target group of an evaluation initiates mechanisms in a particular context, as a reaction
to the intervention programme which brings about change. In addition to realistic evaluation where
causal mechanisms are identified which produce successful outcomes in specific contexts, the idea of
encompassing participatory and collaborative design and methods into the evaluation, like utilisation-
Stellenbosch University https://scholar.sun.ac.za
66
focused and responsive evaluation, is also appreciated. An evaluation should also be responsive to
stakeholders and useful to policy-makers and funders. This means adopting pluralism with regard to
evaluation methodology and design. Supplementing evaluation is the concept of continuously
conducting monitoring through systematic gathering of data on specified indicators to provide
managers with an ongoing intervention to provide an indication of the extent to which activities and
ultimately objectives are being reached. The evaluation’s structure, context, history, purpose, desired
impacts, the nature of the programme and the evaluators’ understanding thereof should therefore be
clear for successful evaluation design.
This page intentionally left blank
Stellenbosch University https://scholar.sun.ac.za
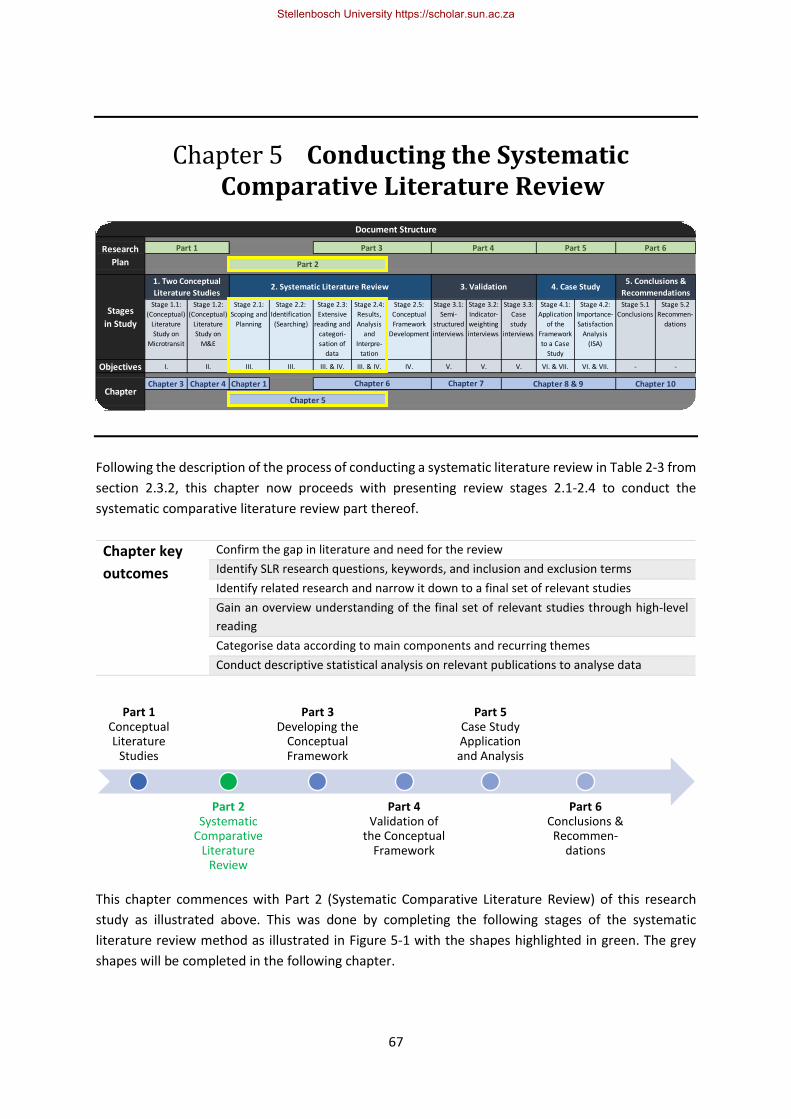
67
Chapter 5 Conducting the Systematic Comparative Literature Review
Following the description of the process of conducting a systematic literature review in Table 2-3 from
section 2.3.2, this chapter now proceeds with presenting review stages 2.1-2.4 to conduct the
systematic comparative literature review part thereof.
Chapter key
outcomes
Confirm the gap in literature and need for the review
Identify SLR research questions, keywords, and inclusion and exclusion terms
Identify related research and narrow it down to a final set of relevant studies
Gain an overview understanding of the final set of relevant studies through high-level
reading
Categorise data according to main components and recurring themes
Conduct descriptive statistical analysis on relevant publications to analyse data
This chapter commences with Part 2 (Systematic Comparative Literature Review) of this research
study as illustrated above. This was done by completing the following stages of the systematic
literature review method as illustrated in Figure 5-1 with the shapes highlighted in green. The grey
shapes will be completed in the following chapter.
Stage 1.1:
(Conceptual)
Literature
Study on
Microtransit
Stage 1.2:
(Conceptual)
Literature
Study on
M&E
Stage 2.1:
Scoping and
Planning
Stage 2.2:
Identification
(Searching)
Stage 2.3:
Extensive
reading and
categori-
sation of
data
Stage 2.4:
Results,
Analysis
and
Interpre-
tation
Stage 2.5:
Conceptual
Framework
Development
Stage 3.1:
Semi-
structured
interviews
Stage 3.2:
Indicator-
weighting
interviews
Stage 3.3:
Case
study
interviews
Stage 4.1:
Application
of the
Framework
to a Case
Study
Stage 4.2:
Importance-
Satisfaction
Analysis
(ISA)
Stage 5.1
Conclusions
Stage 5.2
Recommen-
dations
Objectives I. II. III. III. III. & IV. III. & IV. IV. V. V. V. VI. & VII. VI. & VII. - -
Chapter 3 Chapter 4 Chapter 1
Stages
in Study
1. Two Conceptual
Literature Studies2. Systematic Literature Review 3. Validation 4. Case Study
5. Conclusions &
Recommendations
ChapterChapter 6 Chapter 7 Chapter 8 & 9 Chapter 10
Chapter 5
Document Structure
Research
Plan
Part 1 Part 3 Part 4 Part 5 Part 6
Part 2
111
Part 1 Conceptual Literature
Studies
Part 2 Systematic
Comparative Literature
Review
Part 3 Developing the
Conceptual Framework
Part 4 Validation of
the Conceptual Framework
Part 5 Case Study Application and Analysis
Part 6 Conclusions & Recommen-
dations
111
Stellenbosch University https://scholar.sun.ac.za
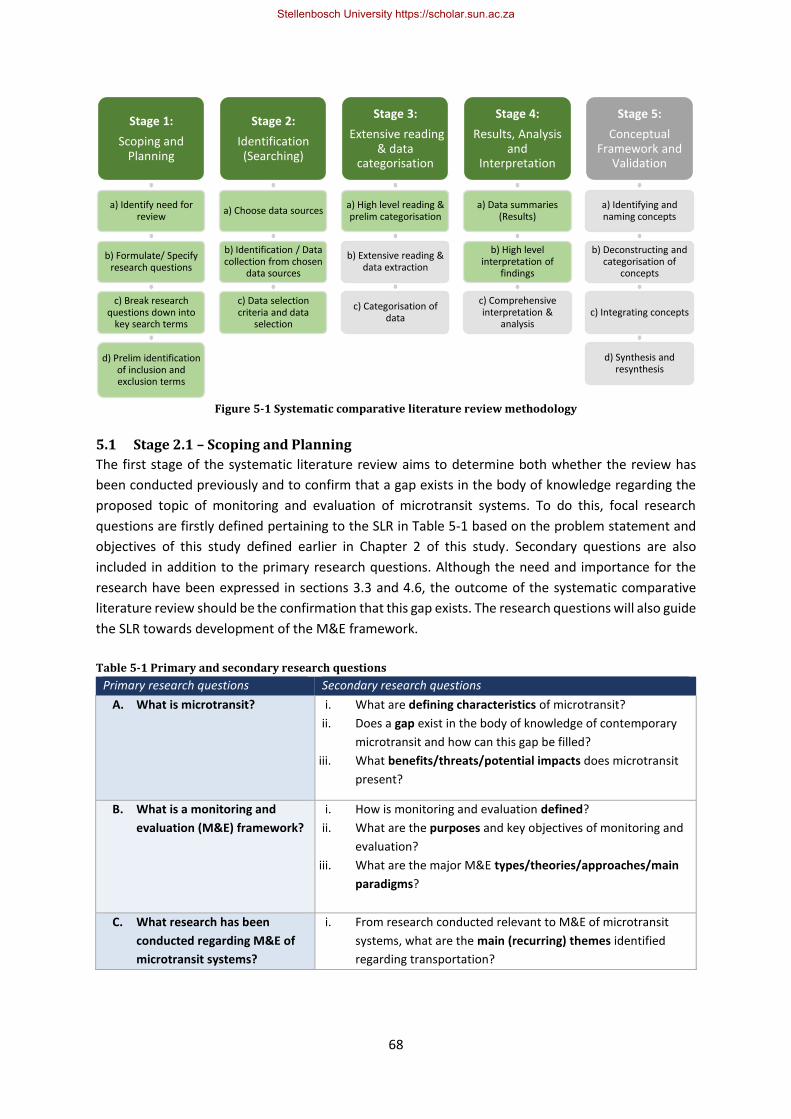
68
Figure 5-1 Systematic comparative literature review methodology
5.1 Stage 2.1 – Scoping and Planning
The first stage of the systematic literature review aims to determine both whether the review has
been conducted previously and to confirm that a gap exists in the body of knowledge regarding the
proposed topic of monitoring and evaluation of microtransit systems. To do this, focal research
questions are firstly defined pertaining to the SLR in Table 5-1 based on the problem statement and
objectives of this study defined earlier in Chapter 2 of this study. Secondary questions are also
included in addition to the primary research questions. Although the need and importance for the
research have been expressed in sections 3.3 and 4.6, the outcome of the systematic comparative
literature review should be the confirmation that this gap exists. The research questions will also guide
the SLR towards development of the M&E framework.
Table 5-1 Primary and secondary research questions
Primary research questions Secondary research questions
A. What is microtransit? i. What are defining characteristics of microtransit?
ii. Does a gap exist in the body of knowledge of contemporary
microtransit and how can this gap be filled?
iii. What benefits/threats/potential impacts does microtransit
present?
B. What is a monitoring and
evaluation (M&E) framework?
i. How is monitoring and evaluation defined?
ii. What are the purposes and key objectives of monitoring and
evaluation?
iii. What are the major M&E types/theories/approaches/main
paradigms?
C. What research has been
conducted regarding M&E of
microtransit systems?
i. From research conducted relevant to M&E of microtransit
systems, what are the main (recurring) themes identified
regarding transportation?
Stage 1:
Scoping and Planning
a) Identify need for review
b) Formulate/ Specify research questions
c) Break research questions down into
key search terms
d) Prelim identification of inclusion and exclusion terms
Stage 2:
Identification (Searching)
a) Choose data sources
b) Identification / Data collection from chosen
data sources
c) Data selection criteria and data
selection
Stage 3:
Extensive reading & data
categorisation
a) High level reading & prelim categorisation
b) Extensive reading & data extraction
c) Categorisation of data
Stage 4:
Results, Analysis and
Interpretation
a) Data summaries (Results)
b) High level interpretation of
findings
c) Comprehensive interpretation &
analysis
Stage 5:
Conceptual Framework and
Validation
a) Identifying and naming concepts
b) Deconstructing and categorisation of
concepts
c) Integrating concepts
d) Synthesis and resynthesis
Stellenbosch University https://scholar.sun.ac.za
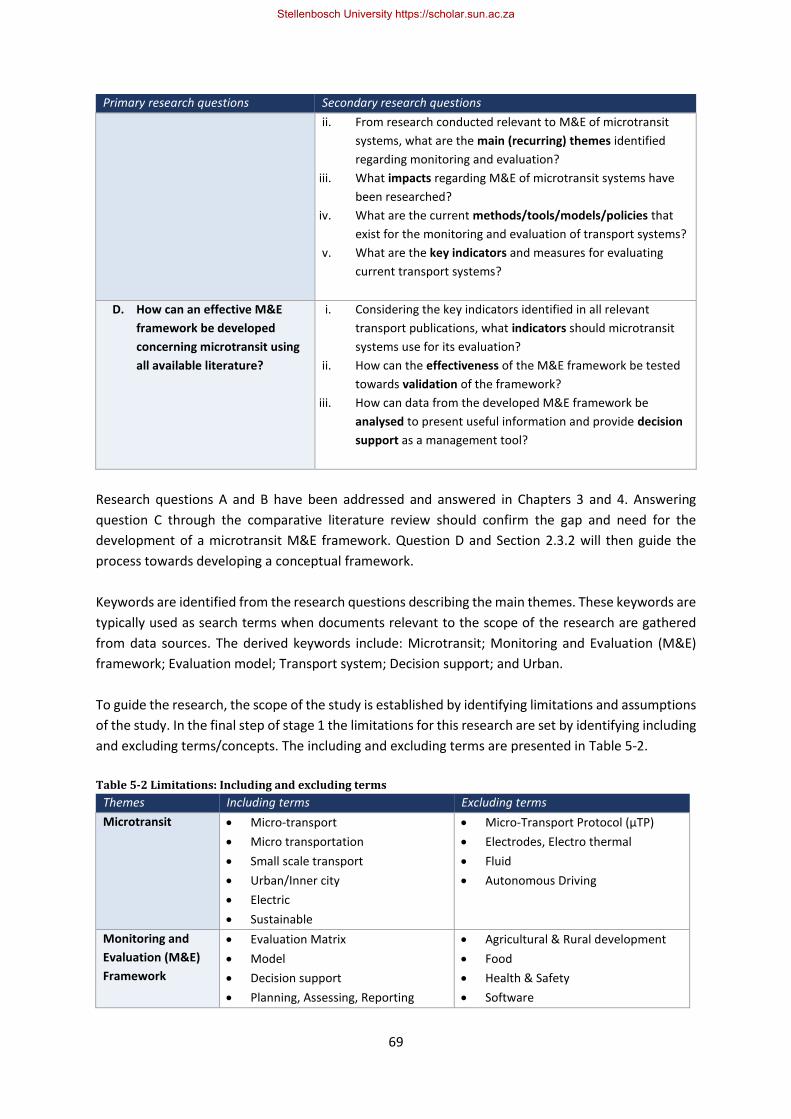
69
Primary research questions Secondary research questions
ii. From research conducted relevant to M&E of microtransit
systems, what are the main (recurring) themes identified
regarding monitoring and evaluation?
iii. What impacts regarding M&E of microtransit systems have
been researched?
iv. What are the current methods/tools/models/policies that
exist for the monitoring and evaluation of transport systems?
v. What are the key indicators and measures for evaluating
current transport systems?
D. How can an effective M&E
framework be developed
concerning microtransit using
all available literature?
i. Considering the key indicators identified in all relevant
transport publications, what indicators should microtransit
systems use for its evaluation?
ii. How can the effectiveness of the M&E framework be tested
towards validation of the framework?
iii. How can data from the developed M&E framework be
analysed to present useful information and provide decision
support as a management tool?
Research questions A and B have been addressed and answered in Chapters 3 and 4. Answering
question C through the comparative literature review should confirm the gap and need for the
development of a microtransit M&E framework. Question D and Section 2.3.2 will then guide the
process towards developing a conceptual framework.
Keywords are identified from the research questions describing the main themes. These keywords are
typically used as search terms when documents relevant to the scope of the research are gathered
from data sources. The derived keywords include: Microtransit; Monitoring and Evaluation (M&E)
framework; Evaluation model; Transport system; Decision support; and Urban.
To guide the research, the scope of the study is established by identifying limitations and assumptions
of the study. In the final step of stage 1 the limitations for this research are set by identifying including
and excluding terms/concepts. The including and excluding terms are presented in Table 5-2.
Table 5-2 Limitations: Including and excluding terms
Themes Including terms Excluding terms
Microtransit • Micro-transport
• Micro transportation
• Small scale transport
• Urban/Inner city
• Electric
• Sustainable
• Micro-Transport Protocol (µTP)
• Electrodes, Electro thermal
• Fluid
• Autonomous Driving
Monitoring and
Evaluation (M&E)
Framework
• Evaluation Matrix
• Model
• Decision support
• Planning, Assessing, Reporting
• Agricultural & Rural development
• Food
• Health & Safety
• Software
Stellenbosch University https://scholar.sun.ac.za
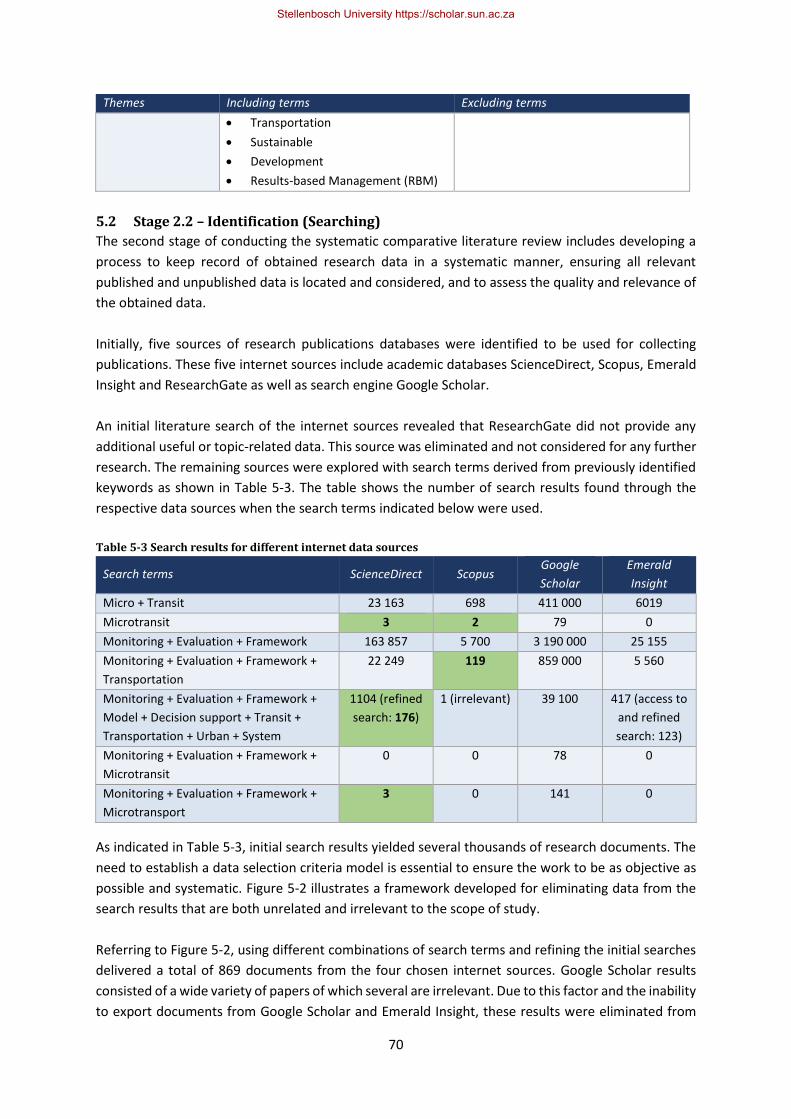
70
Themes Including terms Excluding terms
• Transportation
• Sustainable
• Development
• Results-based Management (RBM)
5.2 Stage 2.2 – Identification (Searching)
The second stage of conducting the systematic comparative literature review includes developing a
process to keep record of obtained research data in a systematic manner, ensuring all relevant
published and unpublished data is located and considered, and to assess the quality and relevance of
the obtained data.
Initially, five sources of research publications databases were identified to be used for collecting
publications. These five internet sources include academic databases ScienceDirect, Scopus, Emerald
Insight and ResearchGate as well as search engine Google Scholar.
An initial literature search of the internet sources revealed that ResearchGate did not provide any
additional useful or topic-related data. This source was eliminated and not considered for any further
research. The remaining sources were explored with search terms derived from previously identified
keywords as shown in Table 5-3. The table shows the number of search results found through the
respective data sources when the search terms indicated below were used.
Table 5-3 Search results for different internet data sources
Search terms ScienceDirect Scopus Google
Scholar
Emerald
Insight
Micro + Transit 23 163 698 411 000 6019
Microtransit 3 2 79 0
Monitoring + Evaluation + Framework 163 857 5 700 3 190 000 25 155
Monitoring + Evaluation + Framework +
Transportation
22 249 119 859 000 5 560
Monitoring + Evaluation + Framework +
Model + Decision support + Transit +
Transportation + Urban + System
1104 (refined
search: 176)
1 (irrelevant) 39 100 417 (access to
and refined
search: 123)
Monitoring + Evaluation + Framework +
Microtransit
0 0 78 0
Monitoring + Evaluation + Framework +
Microtransport
3 0 141 0
As indicated in Table 5-3, initial search results yielded several thousands of research documents. The
need to establish a data selection criteria model is essential to ensure the work to be as objective as
possible and systematic. Figure 5-2 illustrates a framework developed for eliminating data from the
search results that are both unrelated and irrelevant to the scope of study.
Referring to Figure 5-2, using different combinations of search terms and refining the initial searches
delivered a total of 869 documents from the four chosen internet sources. Google Scholar results
consisted of a wide variety of papers of which several are irrelevant. Due to this factor and the inability
to export documents from Google Scholar and Emerald Insight, these results were eliminated from
Stellenbosch University https://scholar.sun.ac.za
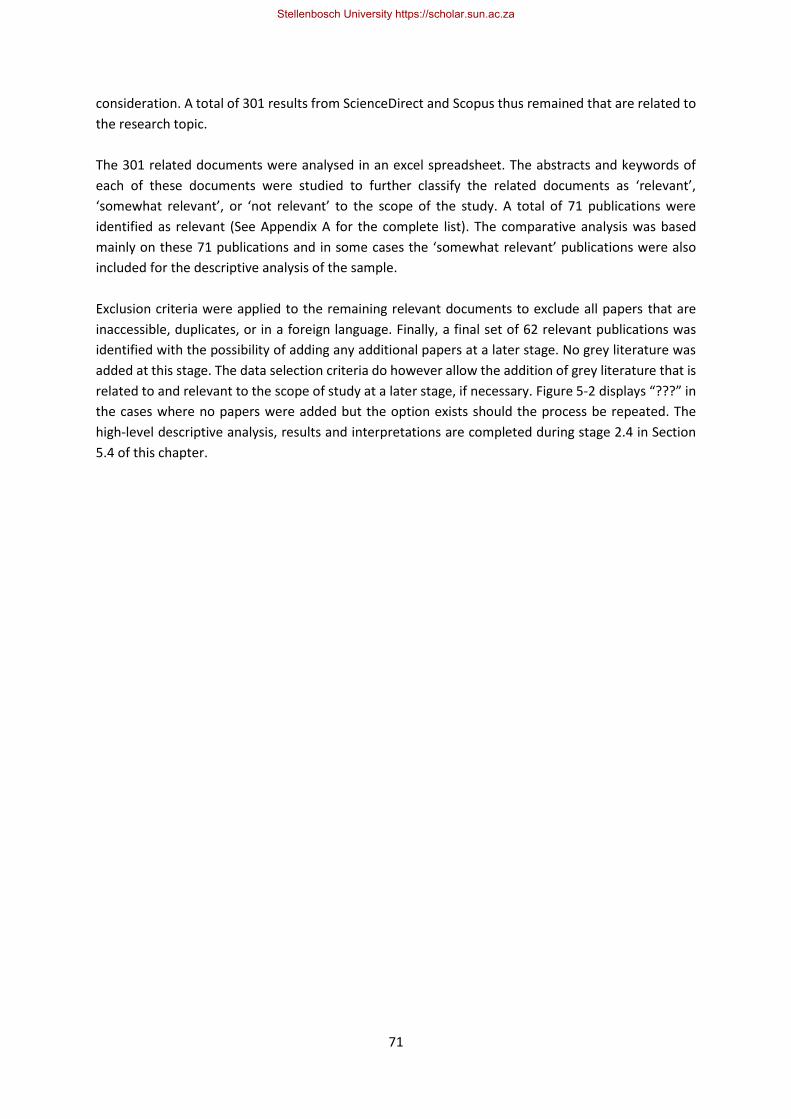
71
consideration. A total of 301 results from ScienceDirect and Scopus thus remained that are related to
the research topic.
The 301 related documents were analysed in an excel spreadsheet. The abstracts and keywords of
each of these documents were studied to further classify the related documents as ‘relevant’,
‘somewhat relevant’, or ‘not relevant’ to the scope of the study. A total of 71 publications were
identified as relevant (See Appendix A for the complete list). The comparative analysis was based
mainly on these 71 publications and in some cases the ‘somewhat relevant’ publications were also
included for the descriptive analysis of the sample.
Exclusion criteria were applied to the remaining relevant documents to exclude all papers that are
inaccessible, duplicates, or in a foreign language. Finally, a final set of 62 relevant publications was
identified with the possibility of adding any additional papers at a later stage. No grey literature was
added at this stage. The data selection criteria do however allow the addition of grey literature that is
related to and relevant to the scope of study at a later stage, if necessary. Figure 5-2 displays “???” in
the cases where no papers were added but the option exists should the process be repeated. The
high-level descriptive analysis, results and interpretations are completed during stage 2.4 in Section
5.4 of this chapter.
Stellenbosch University https://scholar.sun.ac.za
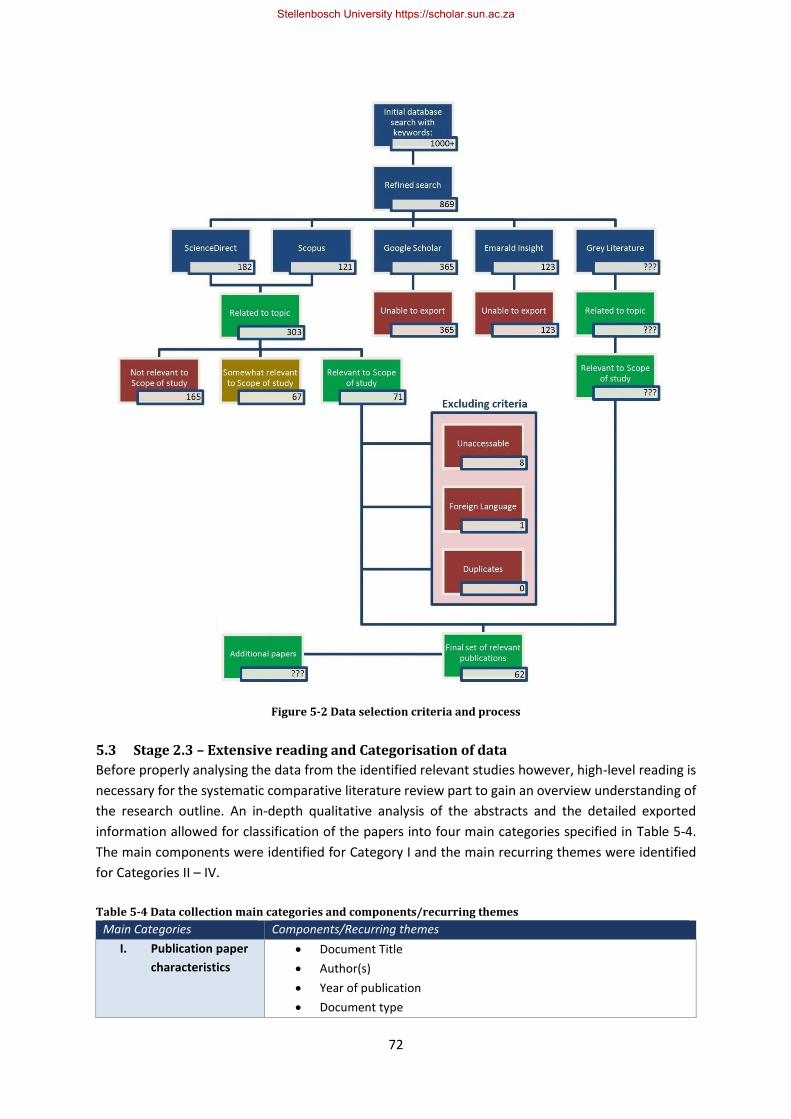
72
Figure 5-2 Data selection criteria and process
5.3 Stage 2.3 – Extensive reading and Categorisation of data
Before properly analysing the data from the identified relevant studies however, high-level reading is
necessary for the systematic comparative literature review part to gain an overview understanding of
the research outline. An in-depth qualitative analysis of the abstracts and the detailed exported
information allowed for classification of the papers into four main categories specified in Table 5-4.
The main components were identified for Category I and the main recurring themes were identified
for Categories II – IV.
Table 5-4 Data collection main categories and components/recurring themes
Main Categories Components/Recurring themes
I. Publication paper
characteristics
• Document Title
• Author(s)
• Year of publication
• Document type
Stellenbosch University https://scholar.sun.ac.za
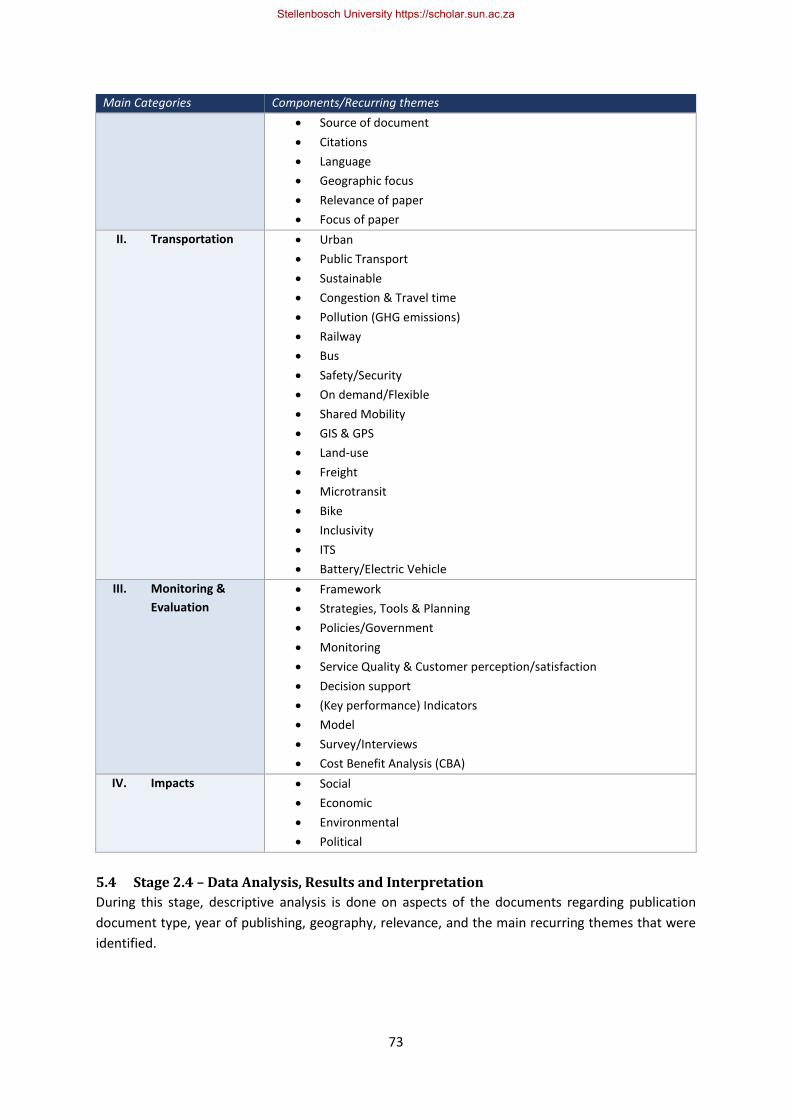
73
Main Categories Components/Recurring themes
• Source of document
• Citations
• Language
• Geographic focus
• Relevance of paper
• Focus of paper
II. Transportation • Urban
• Public Transport
• Sustainable
• Congestion & Travel time
• Pollution (GHG emissions)
• Railway
• Bus
• Safety/Security
• On demand/Flexible
• Shared Mobility
• GIS & GPS
• Land-use
• Freight
• Microtransit
• Bike
• Inclusivity
• ITS
• Battery/Electric Vehicle
III. Monitoring &
Evaluation
• Framework
• Strategies, Tools & Planning
• Policies/Government
• Monitoring
• Service Quality & Customer perception/satisfaction
• Decision support
• (Key performance) Indicators
• Model
• Survey/Interviews
• Cost Benefit Analysis (CBA)
IV. Impacts • Social
• Economic
• Environmental
• Political
5.4 Stage 2.4 – Data Analysis, Results and Interpretation
During this stage, descriptive analysis is done on aspects of the documents regarding publication
document type, year of publishing, geography, relevance, and the main recurring themes that were
identified.
Stellenbosch University https://scholar.sun.ac.za
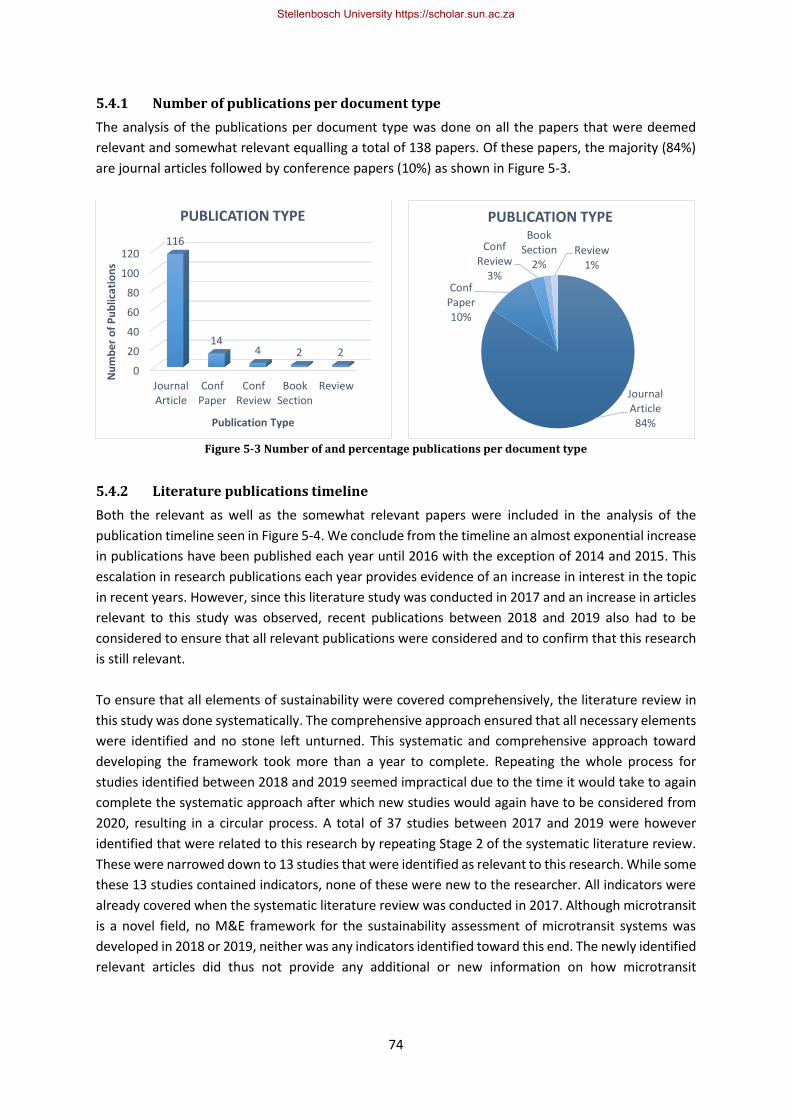
74
5.4.1 Number of publications per document type
The analysis of the publications per document type was done on all the papers that were deemed
relevant and somewhat relevant equalling a total of 138 papers. Of these papers, the majority (84%)
are journal articles followed by conference papers (10%) as shown in Figure 5-3.
Figure 5-3 Number of and percentage publications per document type
5.4.2 Literature publications timeline
Both the relevant as well as the somewhat relevant papers were included in the analysis of the
publication timeline seen in Figure 5-4. We conclude from the timeline an almost exponential increase
in publications have been published each year until 2016 with the exception of 2014 and 2015. This
escalation in research publications each year provides evidence of an increase in interest in the topic
in recent years. However, since this literature study was conducted in 2017 and an increase in articles
relevant to this study was observed, recent publications between 2018 and 2019 also had to be
considered to ensure that all relevant publications were considered and to confirm that this research
is still relevant.
To ensure that all elements of sustainability were covered comprehensively, the literature review in
this study was done systematically. The comprehensive approach ensured that all necessary elements
were identified and no stone left unturned. This systematic and comprehensive approach toward
developing the framework took more than a year to complete. Repeating the whole process for
studies identified between 2018 and 2019 seemed impractical due to the time it would take to again
complete the systematic approach after which new studies would again have to be considered from
2020, resulting in a circular process. A total of 37 studies between 2017 and 2019 were however
identified that were related to this research by repeating Stage 2 of the systematic literature review.
These were narrowed down to 13 studies that were identified as relevant to this research. While some
these 13 studies contained indicators, none of these were new to the researcher. All indicators were
already covered when the systematic literature review was conducted in 2017. Although microtransit
is a novel field, no M&E framework for the sustainability assessment of microtransit systems was
developed in 2018 or 2019, neither was any indicators identified toward this end. The newly identified
relevant articles did thus not provide any additional or new information on how microtransit
0
20
40
60
80
100
120
JournalArticle
ConfPaper
ConfReview
BookSection
Review
116
144 2 2
Nu
mb
er
of
Pu
blic
atio
ns
Publication Type
PUBLICATION TYPE
Journal Article
84%
Conf Paper10%
Conf Review
3%
Book Section
2%Review
1%
PUBLICATION TYPE
Stellenbosch University https://scholar.sun.ac.za

75
sustainability could be measured, but rather just used already identified indicators in different ways
or toward different purposes.
It was noted that even though microtransit is an emerging field, very little research on microtransit
has still been done in 2018 and 2019. The gap that was identified in this study still existed and this
research was thus still relevant. The articles identified during 2018 and 2019 could thus be excluded
from further consideration.
Figure 5-4 Publications timeline for all document types
5.4.3 Geographic analysis
A geographic analysis was done on the various nationalities of the relevant publications’ authors. A
summary of the geographic analysis is illustrated in Figure 5-5 where the numbers in the bottom left
corner equal the number of studies published by authors from the corresponding countries.
Figure 5-5 Geographical representation of researcher nationalities
0
5
10
15
20
25
30
35
Nu
mb
er
of
Pu
blic
atio
ns
PUBLICATIONS PER YEAR
Journal Article Conf Paper Conf Review Book Section Review
Stellenbosch University https://scholar.sun.ac.za

76
The number of publications that have been published by authors from a specific country is shown for
every country in Figure 5-6. The 71 identified relevant publications were conducted by researchers
from 25 countries globally. Of the 25 countries, 16 (64%) of these are developed countries and 9 (36%)
are developing countries. The 16 developed countries have published more research documents,
contributing 78% of the identified relevant publications, regarding the identified topic than developing
countries, contributing only 22% of the identified relevant publications. Authors from the top five
countries are all located in developed countries. The top contributor is the United States of America
with a total of 16 publications. The highest contributor from developing countries is Brazil with a total
of 4 publications.
Figure 5-6 Countries ranked according to number of publications per country
From these figures, we can deduce that authors from developed countries are more focused than
authors from developing countries on researching innovative ways in which they can improve their
countries’ transport systems which should indirectly have positive economic, social and
environmental impacts. Since developing countries are still in development, this type of research
could however prove to be particularly beneficial towards making sustainable economic, social and
environmental improvements.
0 2 4 6 8 10 12 14 16 18
USAUK
Italy
Australia
SpainBrazil
TaiwanNZ
GermanyTurkey
GreeceChinaIndiaChile
SwedenPortugal
IrelandBelgium
NetherlandsThailand
Vietnam
SACanadaNorway
Denmark
Number of Publications
NUMBER OF PUBLICATIONS PER COUNTRY
UK TaiwanDeveloped Developing
Stellenbosch University https://scholar.sun.ac.za
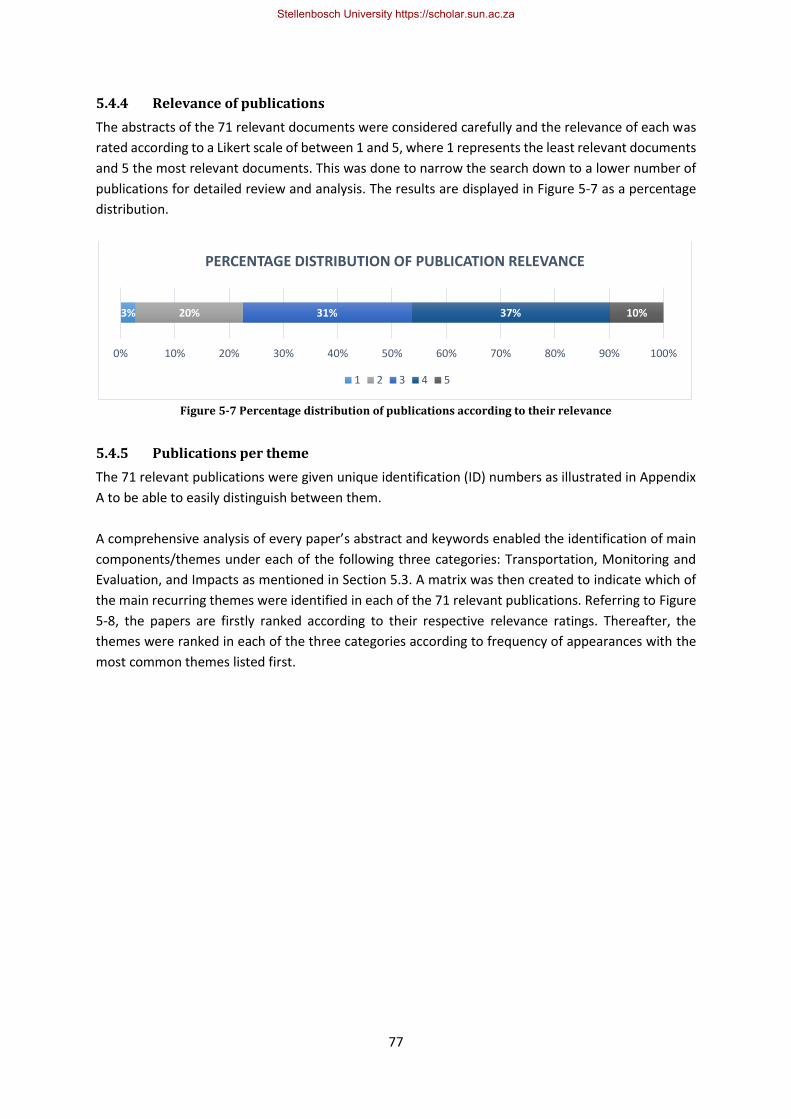
77
5.4.4 Relevance of publications
The abstracts of the 71 relevant documents were considered carefully and the relevance of each was
rated according to a Likert scale of between 1 and 5, where 1 represents the least relevant documents
and 5 the most relevant documents. This was done to narrow the search down to a lower number of
publications for detailed review and analysis. The results are displayed in Figure 5-7 as a percentage
distribution.
Figure 5-7 Percentage distribution of publications according to their relevance
5.4.5 Publications per theme
The 71 relevant publications were given unique identification (ID) numbers as illustrated in Appendix
A to be able to easily distinguish between them.
A comprehensive analysis of every paper’s abstract and keywords enabled the identification of main
components/themes under each of the following three categories: Transportation, Monitoring and
Evaluation, and Impacts as mentioned in Section 5.3. A matrix was then created to indicate which of
the main recurring themes were identified in each of the 71 relevant publications. Referring to Figure
5-8, the papers are firstly ranked according to their respective relevance ratings. Thereafter, the
themes were ranked in each of the three categories according to frequency of appearances with the
most common themes listed first.
3% 20% 31% 37% 10%
0% 10% 20% 30% 40% 50% 60% 70% 80% 90% 100%
PERCENTAGE DISTRIBUTION OF PUBLICATION RELEVANCE
1 2 3 4 5
Stellenbosch University https://scholar.sun.ac.za
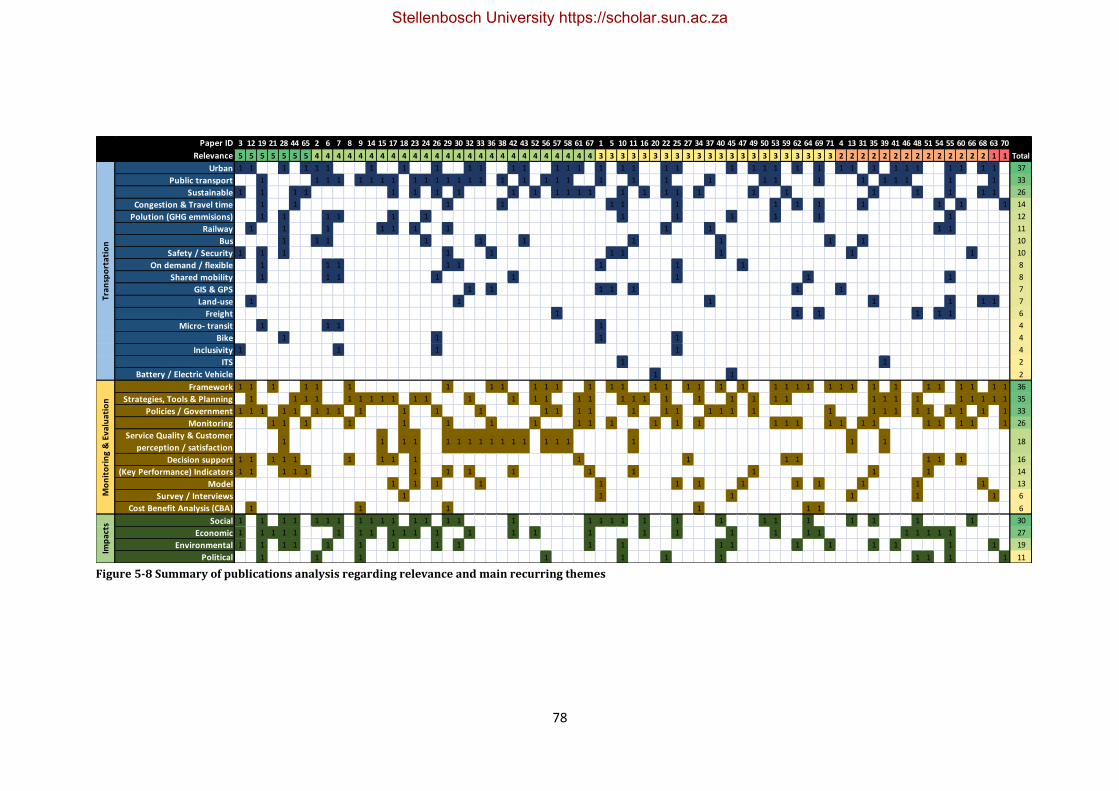
78
Figure 5-8 Summary of publications analysis regarding relevance and main recurring themes
Paper ID 3 12 19 21 28 44 65 2 6 7 8 9 14 15 17 18 23 24 26 29 30 32 33 36 38 42 43 52 56 57 58 61 67 1 5 10 11 16 20 22 25 27 34 37 40 45 47 49 50 53 59 62 64 69 71 4 13 31 35 39 41 46 48 51 54 55 60 66 68 63 70
Relevance 5 5 5 5 5 5 5 4 4 4 4 4 4 4 4 4 4 4 4 4 4 4 4 4 4 4 4 4 4 4 4 4 4 3 3 3 3 3 3 3 3 3 3 3 3 3 3 3 3 3 3 3 3 3 3 2 2 2 2 2 2 2 2 2 2 2 2 2 2 1 1 Total
Urban 1 1 1 1 1 1 1 1 1 1 1 1 1 1 1 1 1 1 1 1 1 1 1 1 1 1 1 1 1 1 1 1 1 1 1 1 1 37
Public transport 1 1 1 1 1 1 1 1 1 1 1 1 1 1 1 1 1 1 1 1 1 1 1 1 1 1 1 1 1 1 1 1 1 33
Sustainable 1 1 1 1 1 1 1 1 1 1 1 1 1 1 1 1 1 1 1 1 1 1 1 1 1 1 26
Congestion & Travel time 1 1 1 1 1 1 1 1 1 1 1 1 1 1 14
Polution (GHG emmisions) 1 1 1 1 1 1 1 1 1 1 1 1 12
Railway 1 1 1 1 1 1 1 1 1 1 1 11
Bus 1 1 1 1 1 1 1 1 1 1 10
Safety / Security 1 1 1 1 1 1 1 1 1 1 10
On demand / flexible 1 1 1 1 1 1 1 1 8
Shared mobility 1 1 1 1 1 1 1 1 8
GIS & GPS 1 1 1 1 1 1 1 7
Land-use 1 1 1 1 1 1 1 7
Freight 1 1 1 1 1 1 6
Micro- transit 1 1 1 1 4
Bike 1 1 1 1 4
Inclusivity 1 1 1 1 4
ITS 1 1 2
Battery / Electric Vehicle 1 1 2
Framework 1 1 1 1 1 1 1 1 1 1 1 1 1 1 1 1 1 1 1 1 1 1 1 1 1 1 1 1 1 1 1 1 1 1 1 1 36
Strategies, Tools & Planning 1 1 1 1 1 1 1 1 1 1 1 1 1 1 1 1 1 1 1 1 1 1 1 1 1 1 1 1 1 1 1 1 1 1 1 35
Policies / Government 1 1 1 1 1 1 1 1 1 1 1 1 1 1 1 1 1 1 1 1 1 1 1 1 1 1 1 1 1 1 1 1 1 33
Monitoring 1 1 1 1 1 1 1 1 1 1 1 1 1 1 1 1 1 1 1 1 1 1 1 1 1 1 26
Service Quality & Customer
perception / satisfaction1 1 1 1 1 1 1 1 1 1 1 1 1 1 1 1 1 1 18
Decision support 1 1 1 1 1 1 1 1 1 1 1 1 1 1 1 1 16
(Key Performance) Indicators 1 1 1 1 1 1 1 1 1 1 1 1 1 1 14
Model 1 1 1 1 1 1 1 1 1 1 1 1 1 13
Survey / Interviews 1 1 1 1 1 1 6
Cost Benefit Analysis (CBA) 1 1 1 1 1 1 6
Social 1 1 1 1 1 1 1 1 1 1 1 1 1 1 1 1 1 1 1 1 1 1 1 1 1 1 1 1 1 1 30
Economic 1 1 1 1 1 1 1 1 1 1 1 1 1 1 1 1 1 1 1 1 1 1 1 1 1 1 1 27
Environmental 1 1 1 1 1 1 1 1 1 1 1 1 1 1 1 1 1 1 1 19
Political 1 1 1 1 1 1 1 1 1 1 1 11
Tran
spo
rtat
ion
Mo
nit
ori
ng
& E
valu
atio
nIm
pac
ts
Stellenbosch University https://scholar.sun.ac.za
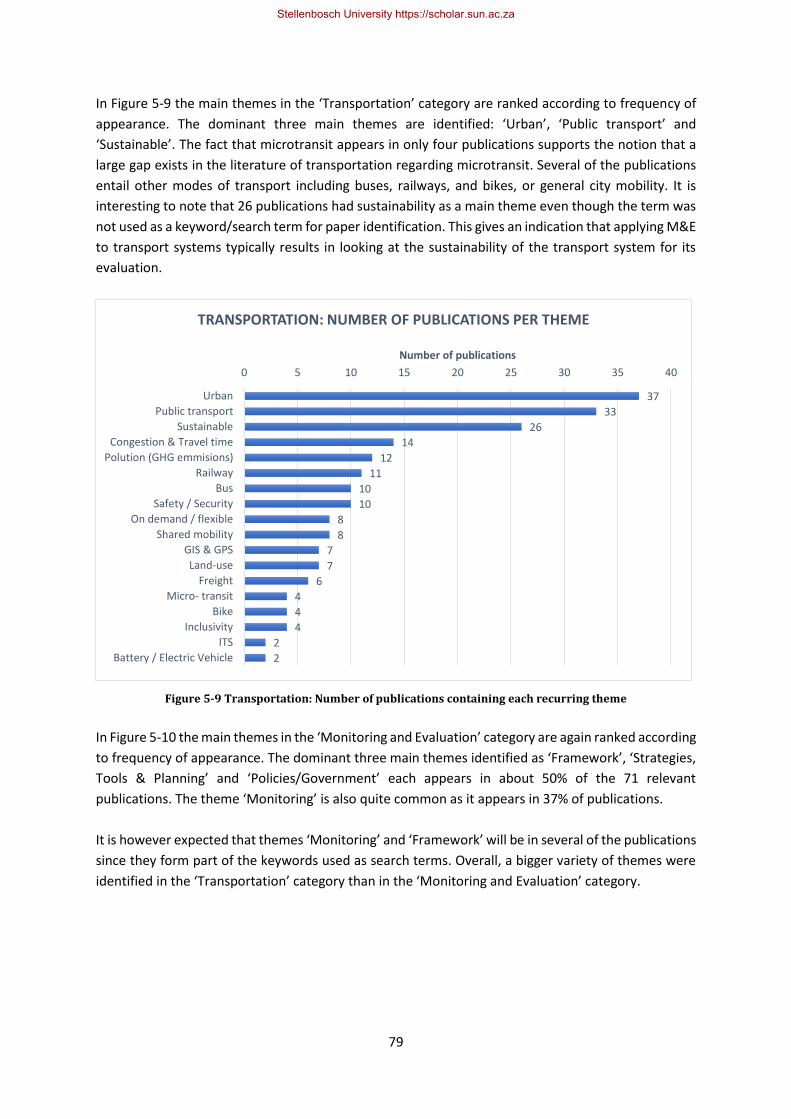
79
In Figure 5-9 the main themes in the ‘Transportation’ category are ranked according to frequency of
appearance. The dominant three main themes are identified: ‘Urban’, ‘Public transport’ and
‘Sustainable’. The fact that microtransit appears in only four publications supports the notion that a
large gap exists in the literature of transportation regarding microtransit. Several of the publications
entail other modes of transport including buses, railways, and bikes, or general city mobility. It is
interesting to note that 26 publications had sustainability as a main theme even though the term was
not used as a keyword/search term for paper identification. This gives an indication that applying M&E
to transport systems typically results in looking at the sustainability of the transport system for its
evaluation.
Figure 5-9 Transportation: Number of publications containing each recurring theme
In Figure 5-10 the main themes in the ‘Monitoring and Evaluation’ category are again ranked according
to frequency of appearance. The dominant three main themes identified as ‘Framework’, ‘Strategies,
Tools & Planning’ and ‘Policies/Government’ each appears in about 50% of the 71 relevant
publications. The theme ‘Monitoring’ is also quite common as it appears in 37% of publications.
It is however expected that themes ‘Monitoring’ and ‘Framework’ will be in several of the publications
since they form part of the keywords used as search terms. Overall, a bigger variety of themes were
identified in the ‘Transportation’ category than in the ‘Monitoring and Evaluation’ category.
37
33
26
14
12
11
10
10
8
8
7
7
6
4
4
4
2
2
0 5 10 15 20 25 30 35 40
Urban
Public transport
Sustainable
Congestion & Travel time
Polution (GHG emmisions)
Railway
Bus
Safety / Security
On demand / flexible
Shared mobility
GIS & GPS
Land-use
Freight
Micro- transit
Bike
Inclusivity
ITS
Battery / Electric Vehicle
Number of publications
TRANSPORTATION: NUMBER OF PUBLICATIONS PER THEME
Stellenbosch University https://scholar.sun.ac.za
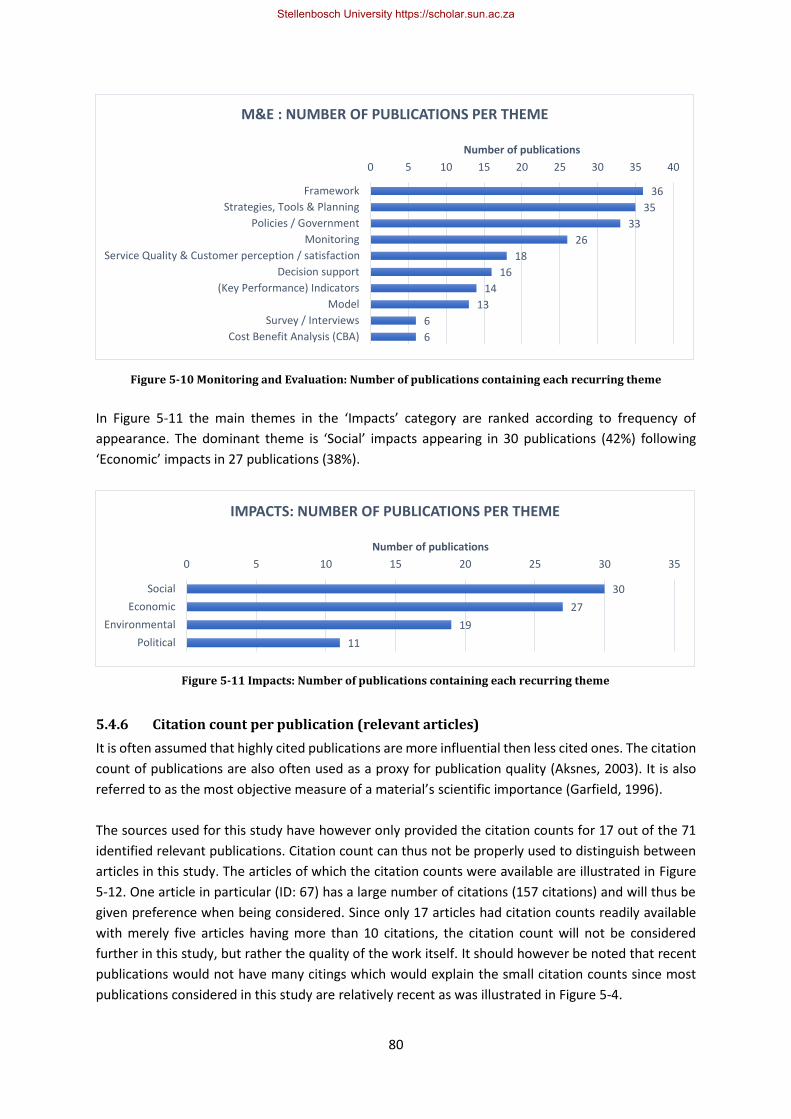
80
Figure 5-10 Monitoring and Evaluation: Number of publications containing each recurring theme
In Figure 5-11 the main themes in the ‘Impacts’ category are ranked according to frequency of
appearance. The dominant theme is ‘Social’ impacts appearing in 30 publications (42%) following
‘Economic’ impacts in 27 publications (38%).
5.4.6 Citation count per publication (relevant articles)
It is often assumed that highly cited publications are more influential then less cited ones. The citation
count of publications are also often used as a proxy for publication quality (Aksnes, 2003). It is also
referred to as the most objective measure of a material’s scientific importance (Garfield, 1996).
The sources used for this study have however only provided the citation counts for 17 out of the 71
identified relevant publications. Citation count can thus not be properly used to distinguish between
articles in this study. The articles of which the citation counts were available are illustrated in Figure
5-12. One article in particular (ID: 67) has a large number of citations (157 citations) and will thus be
given preference when being considered. Since only 17 articles had citation counts readily available
with merely five articles having more than 10 citations, the citation count will not be considered
further in this study, but rather the quality of the work itself. It should however be noted that recent
publications would not have many citings which would explain the small citation counts since most
publications considered in this study are relatively recent as was illustrated in Figure 5-4.
36
35
33
26
18
16
14
13
6
6
0 5 10 15 20 25 30 35 40
Framework
Strategies, Tools & Planning
Policies / Government
Monitoring
Service Quality & Customer perception / satisfaction
Decision support
(Key Performance) Indicators
Model
Survey / Interviews
Cost Benefit Analysis (CBA)
Number of publications
M&E : NUMBER OF PUBLICATIONS PER THEME
30
27
19
11
0 5 10 15 20 25 30 35
Social
Economic
Environmental
Political
Number of publications
IMPACTS: NUMBER OF PUBLICATIONS PER THEME
Figure 5-11 Impacts: Number of publications containing each recurring theme
Stellenbosch University https://scholar.sun.ac.za
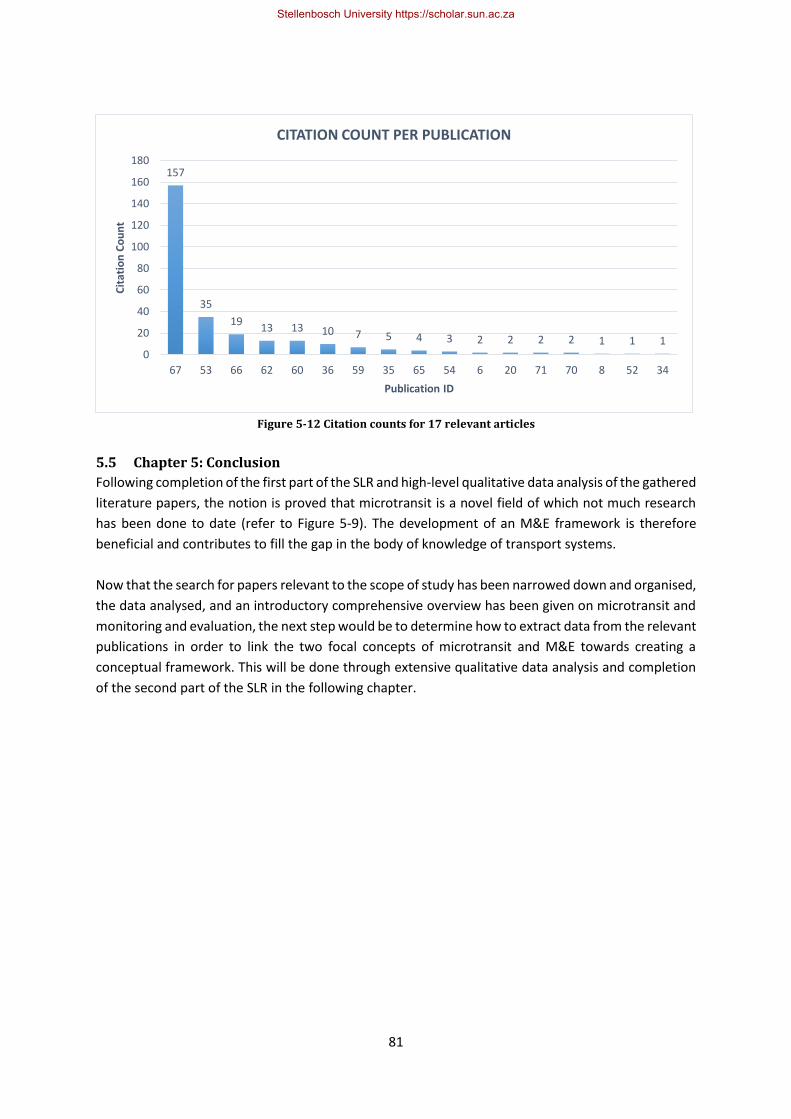
81
Figure 5-12 Citation counts for 17 relevant articles
5.5 Chapter 5: Conclusion
Following completion of the first part of the SLR and high-level qualitative data analysis of the gathered
literature papers, the notion is proved that microtransit is a novel field of which not much research
has been done to date (refer to Figure 5-9). The development of an M&E framework is therefore
beneficial and contributes to fill the gap in the body of knowledge of transport systems.
Now that the search for papers relevant to the scope of study has been narrowed down and organised,
the data analysed, and an introductory comprehensive overview has been given on microtransit and
monitoring and evaluation, the next step would be to determine how to extract data from the relevant
publications in order to link the two focal concepts of microtransit and M&E towards creating a
conceptual framework. This will be done through extensive qualitative data analysis and completion
of the second part of the SLR in the following chapter.
157
35
1913 13 10 7 5 4 3 2 2 2 2 1 1 1
0
20
40
60
80
100
120
140
160
180
67 53 66 62 60 36 59 35 65 54 6 20 71 70 8 52 34
Cit
atio
n C
ou
nt
Publication ID
CITATION COUNT PER PUBLICATION
Stellenbosch University https://scholar.sun.ac.za

82
This page intentionally left blank
Stellenbosch University https://scholar.sun.ac.za
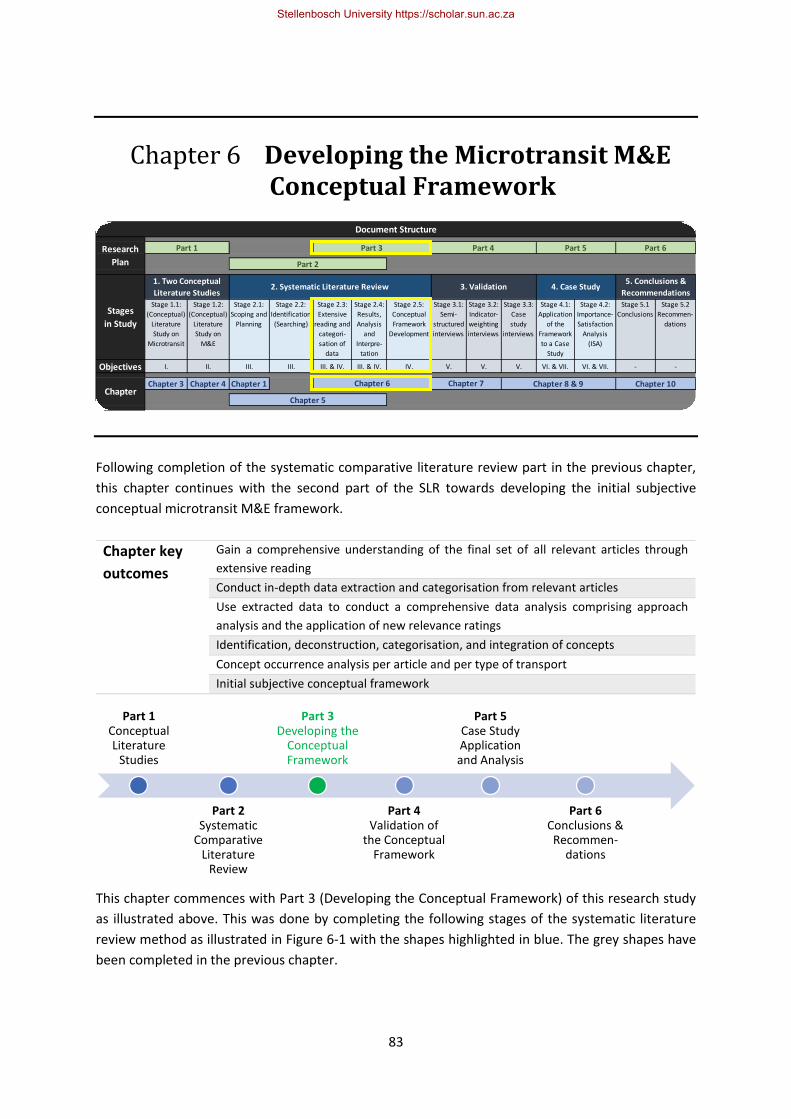
83
Chapter 6 Developing the Microtransit M&E Conceptual Framework
Following completion of the systematic comparative literature review part in the previous chapter,
this chapter continues with the second part of the SLR towards developing the initial subjective
conceptual microtransit M&E framework.
Chapter key
outcomes
Gain a comprehensive understanding of the final set of all relevant articles through
extensive reading
Conduct in-depth data extraction and categorisation from relevant articles
Use extracted data to conduct a comprehensive data analysis comprising approach
analysis and the application of new relevance ratings
Identification, deconstruction, categorisation, and integration of concepts
Concept occurrence analysis per article and per type of transport
Initial subjective conceptual framework
This chapter commences with Part 3 (Developing the Conceptual Framework) of this research study
as illustrated above. This was done by completing the following stages of the systematic literature
review method as illustrated in Figure 6-1 with the shapes highlighted in blue. The grey shapes have
been completed in the previous chapter.
Stage 1.1:
(Conceptual)
Literature
Study on
Microtransit
Stage 1.2:
(Conceptual)
Literature
Study on
M&E
Stage 2.1:
Scoping and
Planning
Stage 2.2:
Identification
(Searching)
Stage 2.3:
Extensive
reading and
categori-
sation of
data
Stage 2.4:
Results,
Analysis
and
Interpre-
tation
Stage 2.5:
Conceptual
Framework
Development
Stage 3.1:
Semi-
structured
interviews
Stage 3.2:
Indicator-
weighting
interviews
Stage 3.3:
Case
study
interviews
Stage 4.1:
Application
of the
Framework
to a Case
Study
Stage 4.2:
Importance-
Satisfaction
Analysis
(ISA)
Stage 5.1
Conclusions
Stage 5.2
Recommen-
dations
Objectives I. II. III. III. III. & IV. III. & IV. IV. V. V. V. VI. & VII. VI. & VII. - -
Chapter 3 Chapter 4 Chapter 1
Stages
in Study
1. Two Conceptual
Literature Studies2. Systematic Literature Review 3. Validation 4. Case Study
5. Conclusions &
Recommendations
ChapterChapter 6 Chapter 7 Chapter 8 & 9 Chapter 10
Chapter 5
Document Structure
Research
Plan
Part 1 Part 3 Part 4 Part 5 Part 6
Part 2
Part 1 Conceptual Literature
Studies
Part 2 Systematic
Comparative Literature
Review
Part 3 Developing the
Conceptual Framework
Part 4 Validation of
the Conceptual Framework
Part 5 Case Study Application and Analysis
Part 6 Conclusions & Recommen-
dations
111
111
Stellenbosch University https://scholar.sun.ac.za

84
Figure 6-1 Conceptual framework development methodology
6.1 Stage 2.3 – Extensive reading and Categorisation of data (continued)
Through extensive reading of all relevant publications, a comprehensive understanding of all papers
considered in the SLR was obtained. During the extensive reading process, specific data of each paper
was identified, extracted, and categorised as seen in Table B-1 from Appendix B into the following
categories:
• Relevance rating
• New relevance rating
• Main goal/objective of paper (Distinctive contribution)
• Number of KPIs
• KPIs of study
• Impacts
• Quantitative/Qualitative
• Methodology (Analysis Process)
• Approach (Type of Analysis/Theoretical lens)
The KPIs identified in each publication were also extracted and put into table format for easier analysis
thereof later on. For the sake of brevity, the KPIs of all articles were not included since they amount
to a total of 807 indicators/criteria/areas of sustainability/evaluation category/variables/metrics
depending on the author’s view. For this reason only the number of KPIs identified in each article is
given in Table B-1. The complete Excel spreadsheet with all information has been included on CD
format and is available for viewing.
6.2 Stage 2.4 – Data Analysis, Results and Interpretation (continued)
A more comprehensive understanding was gained when completing the extensive reading process.
This enabled the researcher to apply new relevance ratings that were not only based on the abstracts
and keywords as was done previously, but rather based on the articles as a whole. The new relevance
ratings were mainly based on the ability of the article to contribute relevant transport system
indicators, its main goal/objective of the paper (distinctive contribution), its methodology/analysis
Stage 1:
Scoping and Planning
a) Identify need for review
b) Formulate/ Specify research questions
c) Break research questions down into
key search terms
d) Prelim identification of inclusion and exclusion terms
Stage 2:
Identification (Searching)
a) Choose data sources
b) Identification / Data collection from chosen
data sources
c) Data selection criteria and data
selection
Stage 3:
Extensive reading & data categorisation
a) High level reading & prelim categorisation
b) Extensive reading & data extraction
c) Categorisation of data
Stage 4:
Results, Analysis and
Interpretation
a) Data summaries (Results)
b) High level interpretation of
findings
c) Comprehensive interpretation &
analysis
Stage 5:
Conceptual Framework and
Validation
a) Identifying and naming concepts
b) Deconstructing and categorisation of
concepts
c) Integrating concepts
d) Synthesis and resynthesis
Stellenbosch University https://scholar.sun.ac.za

85
process, and its approach (type of analysis/theoretical lens). The updated relevance ratings are
available in Table B-1.
In addition to the relevance rating analysis, the approaches followed by each article were also
analysed (see Table C-1 in Appendix C). Although these approaches are not all on the same level, the
occurrence of every approach among the relevant articles was established. A summary thereof is
provided in Figure 6-2.
Stellenbosch University https://scholar.sun.ac.za
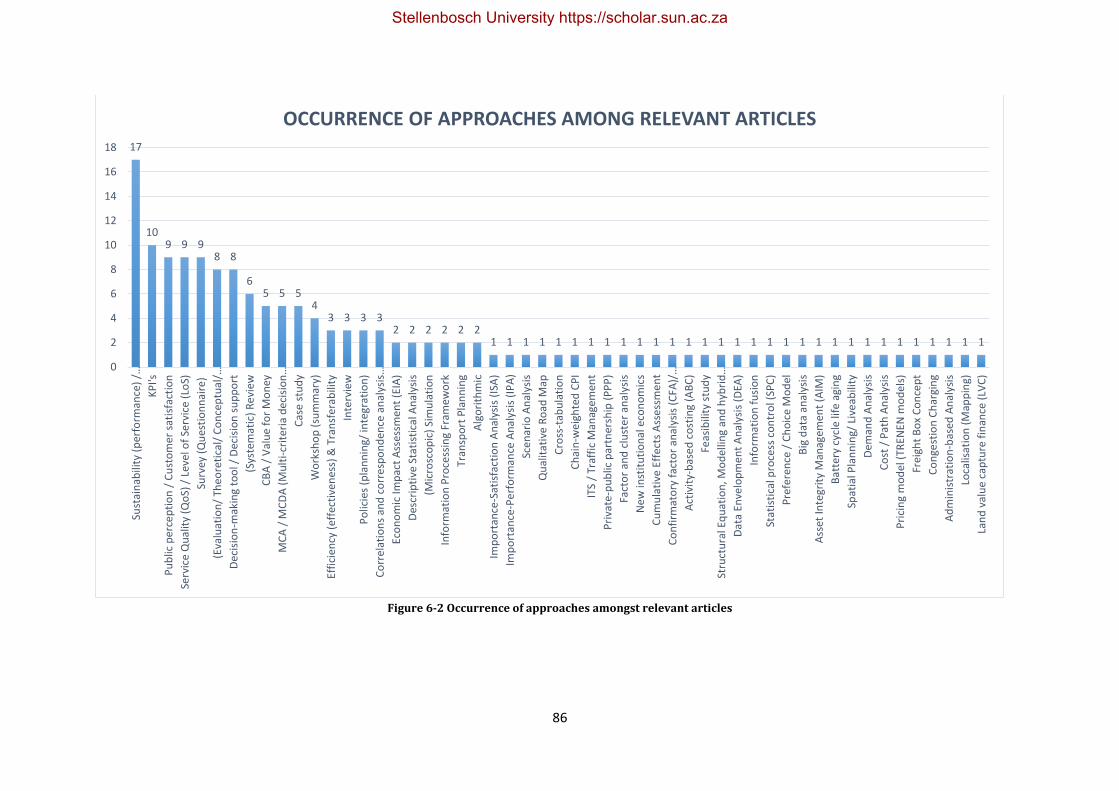
86
Figure 6-2 Occurrence of approaches amongst relevant articles
17
109 9 9
8 8
65 5 5
43 3 3 3
2 2 2 2 2 21 1 1 1 1 1 1 1 1 1 1 1 1 1 1 1 1 1 1 1 1 1 1 1 1 1 1 1 1 1 1
0
2
4
6
8
10
12
14
16
18Su
stai
nab
ility
(p
erfo
rman
ce)
/…
KP
I's
Pu
blic
per
cep
tio
n /
Cu
sto
mer
sat
isfa
ctio
n
Serv
ice
Qu
alit
y (Q
oS)
/ L
evel
of
Serv
ice
(Lo
S)
Surv
ey (
Qu
esti
on
nai
re)
(Eva
luat
ion
/ Th
eore
tica
l/ C
on
cep
tual
/…
Dec
isio
n-m
akin
g to
ol /
Dec
isio
n s
up
po
rt
(Sys
tem
atic
) R
evi
ew
CB
A /
Val
ue
fo
r M
on
ey
MC
A /
MC
DA
(M
ult
i-cr
iter
ia d
ecis
ion
…
Cas
e s
tud
y
Wo
rksh
op
(su
mm
ary)
Effi
cien
cy (
effe
ctiv
enes
s) &
Tra
nsf
erab
ility
Inte
rvie
w
Po
licie
s (p
lan
nin
g/ in
tegr
atio
n)
Co
rrel
atio
ns
and
co
rre
spo
nd
ence
an
alys
is…
Eco
no
mic
Imp
act
Ass
essm
ent
(EIA
)
Des
crip
tive
Sta
tist
ical
An
alys
is
(Mic
rosc
op
ic)
Sim
ula
tio
n
Info
rmat
ion
Pro
cess
ing
Fram
ewo
rk
Tran
spo
rt P
lan
nin
g
Alg
ori
thm
ic
Imp
ort
ance
-Sat
isfa
ctio
n A
nal
ysis
(IS
A)
Imp
ort
ance
-Pe
rfo
rman
ce A
nal
ysis
(IP
A)
Sce
nar
io A
nal
ysis
Qu
alit
ativ
e R
oad
Map
Cro
ss-t
abu
lati
on
Ch
ain
-wei
ghte
d C
PI
ITS
/ Tr
affi
c M
anag
emen
t
Pri
vate
-pu
blic
par
tner
ship
(P
PP
)
Fact
or
and
clu
ste
r an
alys
is
Ne
w in
stit
uti
on
al e
con
om
ics
Cu
mu
lati
ve E
ffec
ts A
sse
ssm
en
t
Co
nfi
rmat
ory
fac
tor
anal
ysis
(C
FA)/
…
Act
ivit
y-b
ase
d c
ost
ing
(AB
C)
Feas
ibili
ty s
tud
y
Stru
ctu
ral E
qu
atio
n, M
od
ellin
g an
d h
ybri
d…
Dat
a En
velo
pm
en
t A
nal
ysis
(D
EA)
Info
rmat
ion
fu
sio
n
Stat
isti
cal p
roce
ss c
on
tro
l (SP
C)
Pre
fere
nce
/ C
ho
ice
Mo
del
Big
dat
a an
alys
is
Ass
et In
tegr
ity
Man
agem
ent
(AIM
)
Bat
tery
cyc
le li
fe a
gin
g
Spat
ial P
lan
nin
g/ L
ive
abili
ty
Dem
and
An
alys
is
Co
st /
Pat
h A
nal
ysis
Pri
cin
g m
od
el (
TREN
EN m
od
els)
Frei
ght
Bo
x C
on
cep
t
Co
nge
stio
n C
har
gin
g
Ad
min
istr
atio
n-b
ased
An
alys
is
Loca
lisat
ion
(M
app
ing)
Lan
d v
alu
e ca
ptu
re f
inan
ce (
LVC
)
OCCURRENCE OF APPROACHES AMONG RELEVANT ARTICLES
Stellenbosch University https://scholar.sun.ac.za
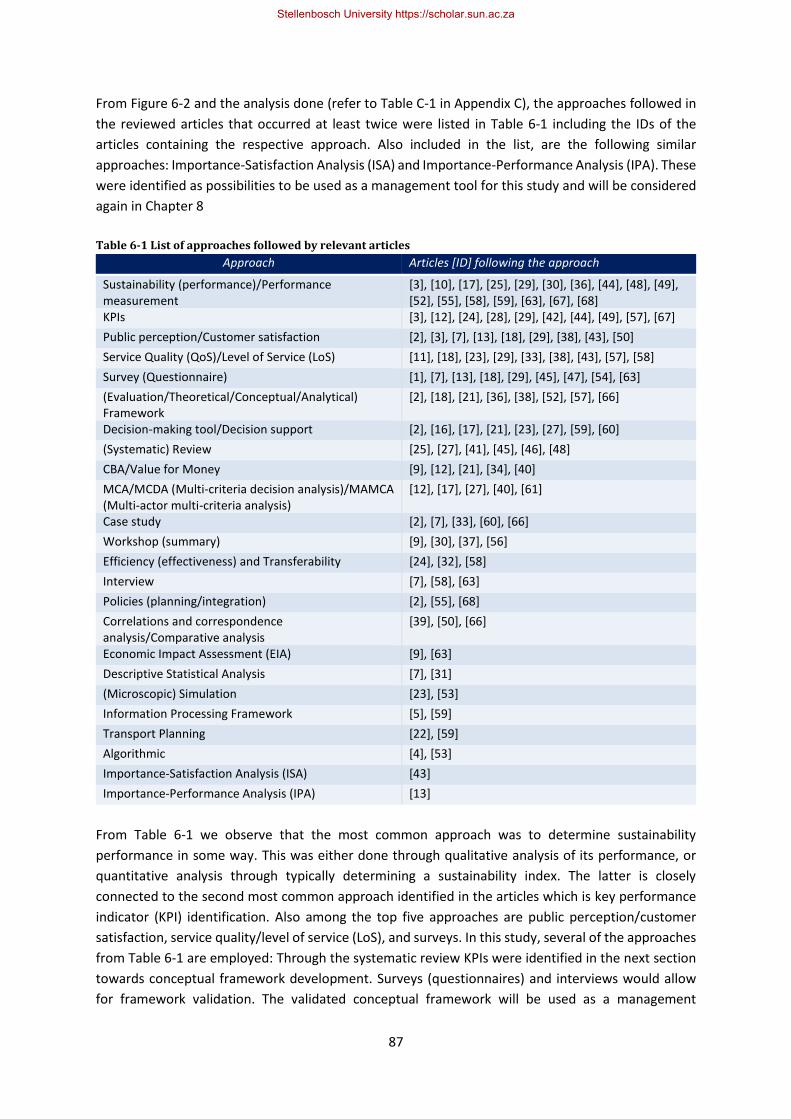
87
From Figure 6-2 and the analysis done (refer to Table C-1 in Appendix C), the approaches followed in
the reviewed articles that occurred at least twice were listed in Table 6-1 including the IDs of the
articles containing the respective approach. Also included in the list, are the following similar
approaches: Importance-Satisfaction Analysis (ISA) and Importance-Performance Analysis (IPA). These
were identified as possibilities to be used as a management tool for this study and will be considered
again in Chapter 8
Table 6-1 List of approaches followed by relevant articles
Approach Articles [ID] following the approach
Sustainability (performance)/Performance measurement
[3], [10], [17], [25], [29], [30], [36], [44], [48], [49], [52], [55], [58], [59], [63], [67], [68]
KPIs [3], [12], [24], [28], [29], [42], [44], [49], [57], [67]
Public perception/Customer satisfaction [2], [3], [7], [13], [18], [29], [38], [43], [50]
Service Quality (QoS)/Level of Service (LoS) [11], [18], [23], [29], [33], [38], [43], [57], [58]
Survey (Questionnaire) [1], [7], [13], [18], [29], [45], [47], [54], [63]
(Evaluation/Theoretical/Conceptual/Analytical) Framework
[2], [18], [21], [36], [38], [52], [57], [66]
Decision-making tool/Decision support [2], [16], [17], [21], [23], [27], [59], [60]
(Systematic) Review [25], [27], [41], [45], [46], [48]
CBA/Value for Money [9], [12], [21], [34], [40]
MCA/MCDA (Multi-criteria decision analysis)/MAMCA (Multi-actor multi-criteria analysis)
[12], [17], [27], [40], [61]
Case study [2], [7], [33], [60], [66]
Workshop (summary) [9], [30], [37], [56]
Efficiency (effectiveness) and Transferability [24], [32], [58]
Interview [7], [58], [63]
Policies (planning/integration) [2], [55], [68]
Correlations and correspondence analysis/Comparative analysis
[39], [50], [66]
Economic Impact Assessment (EIA) [9], [63]
Descriptive Statistical Analysis [7], [31]
(Microscopic) Simulation [23], [53]
Information Processing Framework [5], [59]
Transport Planning [22], [59]
Algorithmic [4], [53]
Importance-Satisfaction Analysis (ISA) [43]
Importance-Performance Analysis (IPA) [13]
From Table 6-1 we observe that the most common approach was to determine sustainability
performance in some way. This was either done through qualitative analysis of its performance, or
quantitative analysis through typically determining a sustainability index. The latter is closely
connected to the second most common approach identified in the articles which is key performance
indicator (KPI) identification. Also among the top five approaches are public perception/customer
satisfaction, service quality/level of service (LoS), and surveys. In this study, several of the approaches
from Table 6-1 are employed: Through the systematic review KPIs were identified in the next section
towards conceptual framework development. Surveys (questionnaires) and interviews would allow
for framework validation. The validated conceptual framework will be used as a management
Stellenbosch University https://scholar.sun.ac.za

88
(decision-making) tool by determining a sustainability index (which is also concerned with service
quality/level of service), and to perform importance-satisfaction analysis (ISA). This will be done by
means of a case study application. All of these approaches that are incorporated in this research study
were all identified in relevant articles as Table 6-1 suggests.
Analysing the relevant articles’ approaches regarding whether it is of a qualitative or quantitative
nature or both, delivered the results found in Figure 6-3. Although more articles conducted research
of a qualitative nature, the distribution is still fairly even. It is also noted that while some studies
focused mostly on quantitative analysis, several studies also included some qualitative research along
with its quantitative analysis. Referring to Section 2.1.1, it might even be argued that no study is purely
quantitative, and will always contain some form of qualitative analysis.
Figure 6-3 Number and percentage of articles with a qualitative, quantitative, or mixed approach
6.3 Stage 2.5 – Conceptual Framework Development
It should be noted that researchers sometimes classify concepts on different levels. While some
researchers might classify a certain concept as an indicator, others might classify it as a variable or an
area of sustainability or evaluation category. This was also true considering the identified set of
relevant publications. Due to this reason all evaluation categories (areas of sustainability), indicators,
metrics, and variables that were identified in the relevant publications were considered carefully and
sifted thoroughly as illustrated in the process from Figure 6-4.
0
10
20
30
40
Quantitative Qualitative &Quantitative
Qualitative
NUMBER OF QUALITATIVE VS QUANTITATIVE ARTICLES
30%
23%
48%
PERCENTAGE OF QUALITATIVE VS QUANTITATIVE ARTICLES
Quantitative
Qualitative &Quantitative
Qualitative
Stellenbosch University https://scholar.sun.ac.za

89
From Section 4.2, considering the logic of interventions as illustrated in Figure 4-1, it is clear that the
goal is to reach objectives by applying activities towards achieving certain outputs. Achieving these
outputs amounts to certain results, which ultimately results in desired impacts. These outputs, results
and impacts are in line with operational, specific, and overall objectives respectively as shown in Figure
6-4. Keeping this in mind, concepts were identified, categorised and integrated into evaluation
categories (areas of sustainability) consisting of indicators which again consist of variables. Evaluating
the sustainability of a microtransit system is thus broken down into specific measurable variables as
shown in Figure 6-5 where the hierarchical concept categories were established. Although several of
the indicators overlap regarding the impact they have on different areas of sustainability, they were
considered according to their direct impacts instead of the indirect impacts they could also have on
other areas of sustainability. For a complete synthesis, the indicators and areas of sustainability will
be weighted according to their relative contribution to each of the three pillars of sustainability,
further considered in Chapter 7
Following the process explained in Figure 6-4 and establishing the concept category hierarchy in Figure
6-5 the deconstruction, categorisation, and integration of the concepts were conducted by sifting
through all of the 807 identified key concepts also referred to as ‘KPIs’. The principles for transport
indicator selection as specified in Table 3-1 were applied during this process. This lengthy process is
Sustainability performance/ (SI)
AoS performance
Indicator performance
Variable performance
Metrics / Variables
Evaluation categories
(AoS)
Indicators
Overall objectives
Specific objectives
Operational objectives
Impacts
Results
Outputs
Figure 6-4 Process illustration of concept categorisation and integration
Areas of sustainability
Indicators
Variables
Figure 6-5 Concept category hierarchy
Stellenbosch University https://scholar.sun.ac.za

90
shown in Table 6-2. Also included in the table is the occurrence of each of the concepts per relevant
article. The ‘G’ refers to grey literature. Since the concepts were mainly derived from 21 of the relevant
articles, only these relevant articles are compared in the table. Each of these articles focused on one
of the following: rail, bus, city mobility, general public transport (PT), or other. The usage of certain
indicators per transport type could thus also be determined and is also listed. It is noted that the article
(ID 67) that was previously identified as the one with most citations, also had the largest set of
indicators. Since this article focused on city mobility, naturally there would be more indicators
identified under this category. All papers were considered equally and the large list of 807 concepts
or ‘KPIs’, was narrowed down to a total of 12 areas of sustainability, 50 indicators, and 198 variables
that are relevant to and considered important for the evaluation of a microtransit system’s
sustainability.
Stellenbosch University https://scholar.sun.ac.za
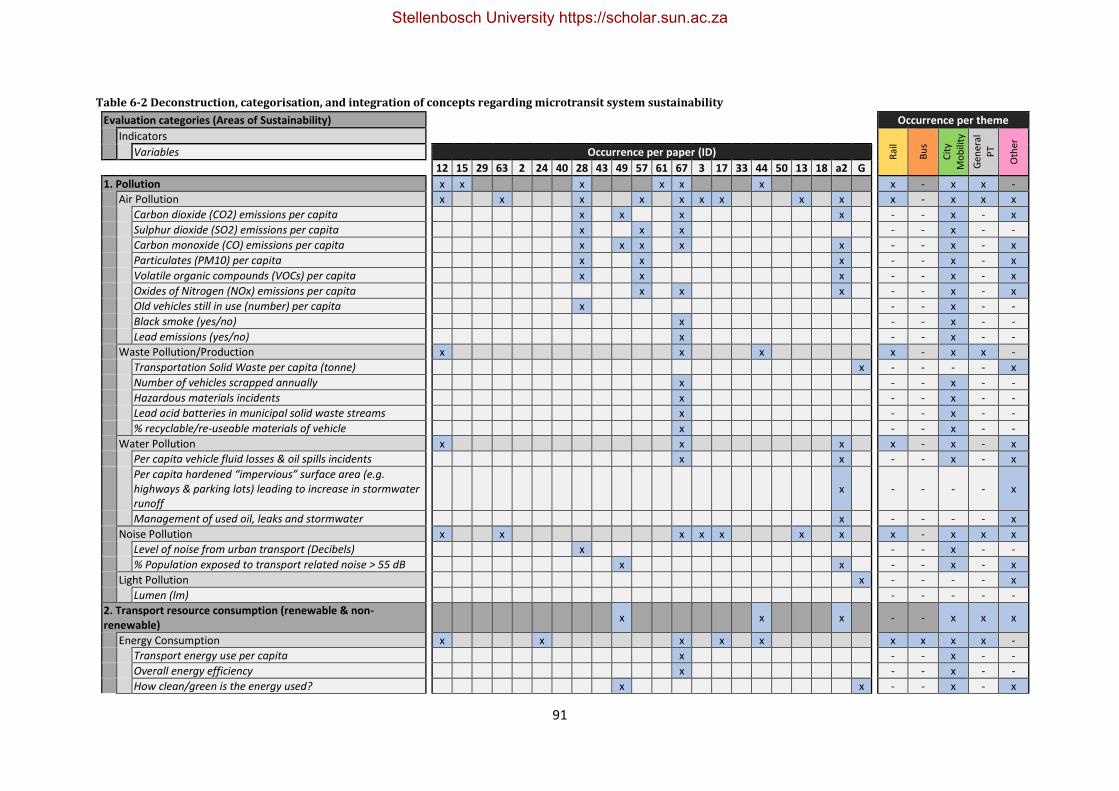
91
Table 6-2 Deconstruction, categorisation, and integration of concepts regarding microtransit system sustainability
Evaluation categories (Areas of Sustainability) Occurrence per theme
Indicators
Rai
l
Bu
s
Cit
y
Mo
bili
ty
Gen
eral
PT
Oth
er
Variables Occurrence per paper (ID)
12 15 29 63 2 24 40 28 43 49 57 61 67 3 17 33 44 50 13 18 a2 G
1. Pollution x x x x x x x - x x -
Air Pollution x x x x x x x x x x - x x x
Carbon dioxide (CO2) emissions per capita x x x x - - x - x
Sulphur dioxide (SO2) emissions per capita x x x - - x - -
Carbon monoxide (CO) emissions per capita x x x x x - - x - x
Particulates (PM10) per capita x x x - - x - x
Volatile organic compounds (VOCs) per capita x x x - - x - x
Oxides of Nitrogen (NOx) emissions per capita x x x - - x - x
Old vehicles still in use (number) per capita x - - x - -
Black smoke (yes/no) x - - x - -
Lead emissions (yes/no) x - - x - -
Waste Pollution/Production x x x x - x x -
Transportation Solid Waste per capita (tonne) x - - - - x
Number of vehicles scrapped annually x - - x - -
Hazardous materials incidents x - - x - -
Lead acid batteries in municipal solid waste streams x - - x - -
% recyclable/re-useable materials of vehicle x - - x - -
Water Pollution x x x x - x - x
Per capita vehicle fluid losses & oil spills incidents x x - - x - x
Per capita hardened “impervious” surface area (e.g. highways & parking lots) leading to increase in stormwater runoff
x - - - - x
Management of used oil, leaks and stormwater x - - - - x
Noise Pollution x x x x x x x x - x x x
Level of noise from urban transport (Decibels) x - - x - -
% Population exposed to transport related noise > 55 dB x x - - x - x
Light Pollution x - - - - x
Lumen (lm) - - - - -
2. Transport resource consumption (renewable & non-renewable)
x x x - - x x x
Energy Consumption x x x x x x x x x -
Transport energy use per capita x - - x - -
Overall energy efficiency x - - x - -
How clean/green is the energy used? x x - - x - x
Stellenbosch University https://scholar.sun.ac.za
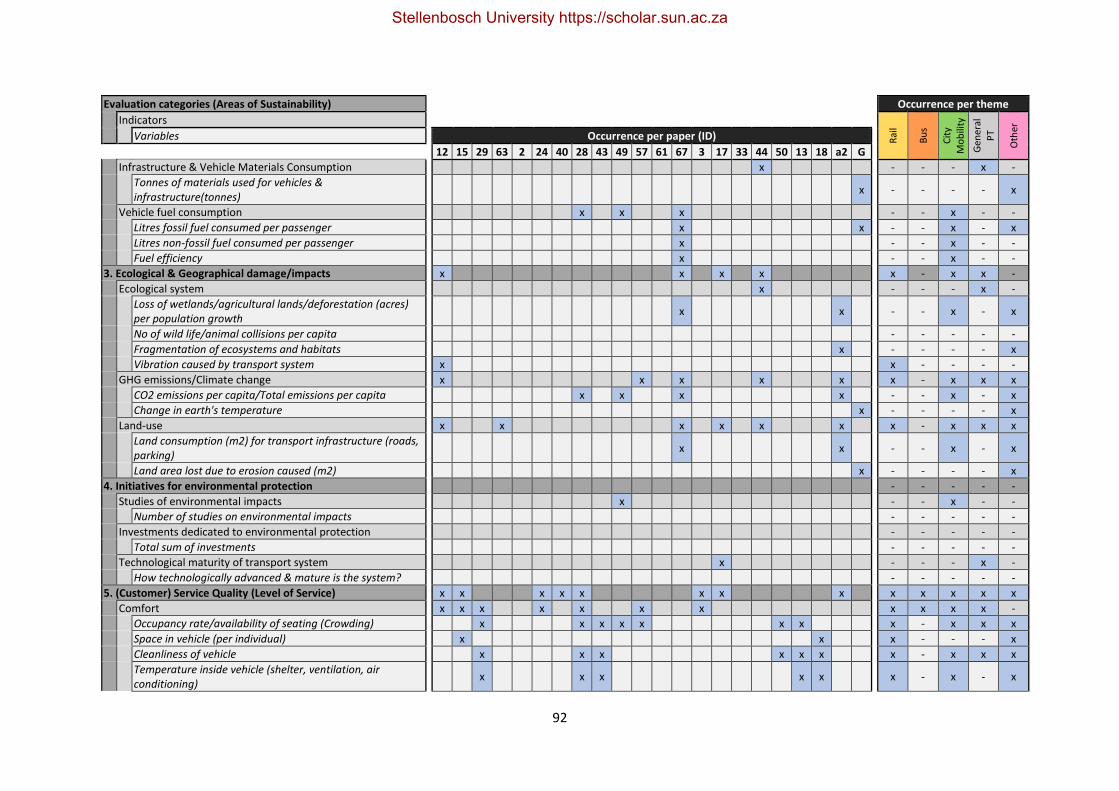
92
Evaluation categories (Areas of Sustainability) Occurrence per theme
Indicators
Rai
l
Bu
s
Cit
y
Mo
bili
ty
Gen
eral
PT
Oth
er
Variables Occurrence per paper (ID)
12 15 29 63 2 24 40 28 43 49 57 61 67 3 17 33 44 50 13 18 a2 G
Infrastructure & Vehicle Materials Consumption x - - - x -
Tonnes of materials used for vehicles & infrastructure(tonnes)
x - - - - x
Vehicle fuel consumption x x x - - x - -
Litres fossil fuel consumed per passenger x x - - x - x
Litres non-fossil fuel consumed per passenger x - - x - -
Fuel efficiency x - - x - -
3. Ecological & Geographical damage/impacts x x x x x - x x -
Ecological system x - - - x -
Loss of wetlands/agricultural lands/deforestation (acres) per population growth
x x - - x - x
No of wild life/animal collisions per capita - - - - -
Fragmentation of ecosystems and habitats x - - - - x
Vibration caused by transport system x x - - - -
GHG emissions/Climate change x x x x x x - x x x
CO2 emissions per capita/Total emissions per capita x x x x - - x - x
Change in earth's temperature x - - - - x
Land-use x x x x x x x - x x x
Land consumption (m2) for transport infrastructure (roads, parking)
x x - - x - x
Land area lost due to erosion caused (m2) x - - - - x
4. Initiatives for environmental protection - - - - -
Studies of environmental impacts x - - x - -
Number of studies on environmental impacts - - - - -
Investments dedicated to environmental protection - - - - -
Total sum of investments - - - - -
Technological maturity of transport system x - - - x -
How technologically advanced & mature is the system? - - - - -
5. (Customer) Service Quality (Level of Service) x x x x x x x x x x x x x
Comfort x x x x x x x x x x x -
Occupancy rate/availability of seating (Crowding) x x x x x x x x - x x x
Space in vehicle (per individual) x x x - - - x
Cleanliness of vehicle x x x x x x x - x x x
Temperature inside vehicle (shelter, ventilation, air conditioning)
x x x x x x - x - x
Stellenbosch University https://scholar.sun.ac.za
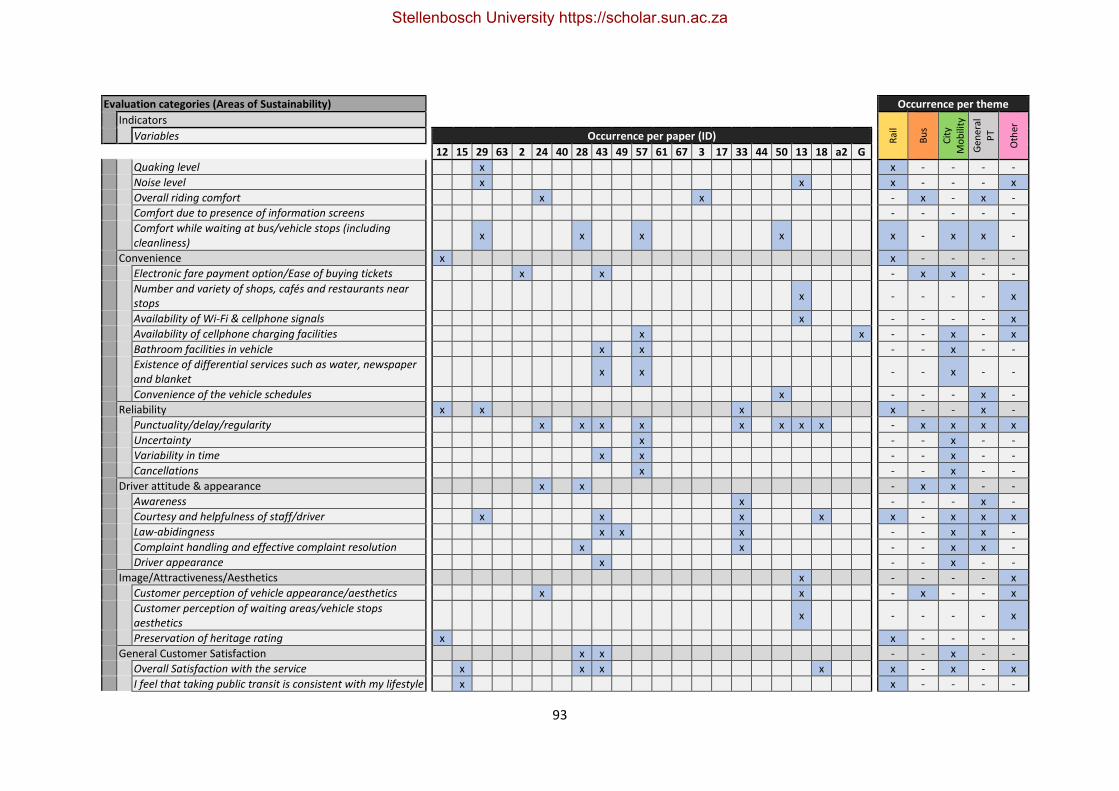
93
Evaluation categories (Areas of Sustainability) Occurrence per theme
Indicators
Rai
l
Bu
s
Cit
y
Mo
bili
ty
Gen
eral
PT
Oth
er
Variables Occurrence per paper (ID)
12 15 29 63 2 24 40 28 43 49 57 61 67 3 17 33 44 50 13 18 a2 G
Quaking level x x - - - -
Noise level x x x - - - x
Overall riding comfort x x - x - x -
Comfort due to presence of information screens - - - - -
Comfort while waiting at bus/vehicle stops (including cleanliness)
x x x x x - x x -
Convenience x x - - - -
Electronic fare payment option/Ease of buying tickets x x - x x - -
Number and variety of shops, cafés and restaurants near stops
x - - - - x
Availability of Wi-Fi & cellphone signals x - - - - x
Availability of cellphone charging facilities x x - - x - x
Bathroom facilities in vehicle x x - - x - -
Existence of differential services such as water, newspaper and blanket
x x - - x - -
Convenience of the vehicle schedules x - - - x -
Reliability x x x x - - x -
Punctuality/delay/regularity x x x x x x x x - x x x x
Uncertainty x - - x - -
Variability in time x x - - x - -
Cancellations x - - x - -
Driver attitude & appearance x x - x x - -
Awareness x - - - x -
Courtesy and helpfulness of staff/driver x x x x x - x x x
Law-abidingness x x x - - x x -
Complaint handling and effective complaint resolution x x - - x x -
Driver appearance x - - x - -
Image/Attractiveness/Aesthetics x - - - - x
Customer perception of vehicle appearance/aesthetics x x - x - - x
Customer perception of waiting areas/vehicle stops aesthetics
x - - - - x
Preservation of heritage rating x x - - - -
General Customer Satisfaction x x - - x - -
Overall Satisfaction with the service x x x x x - x - x
I feel that taking public transit is consistent with my lifestyle x x - - - -
Stellenbosch University https://scholar.sun.ac.za
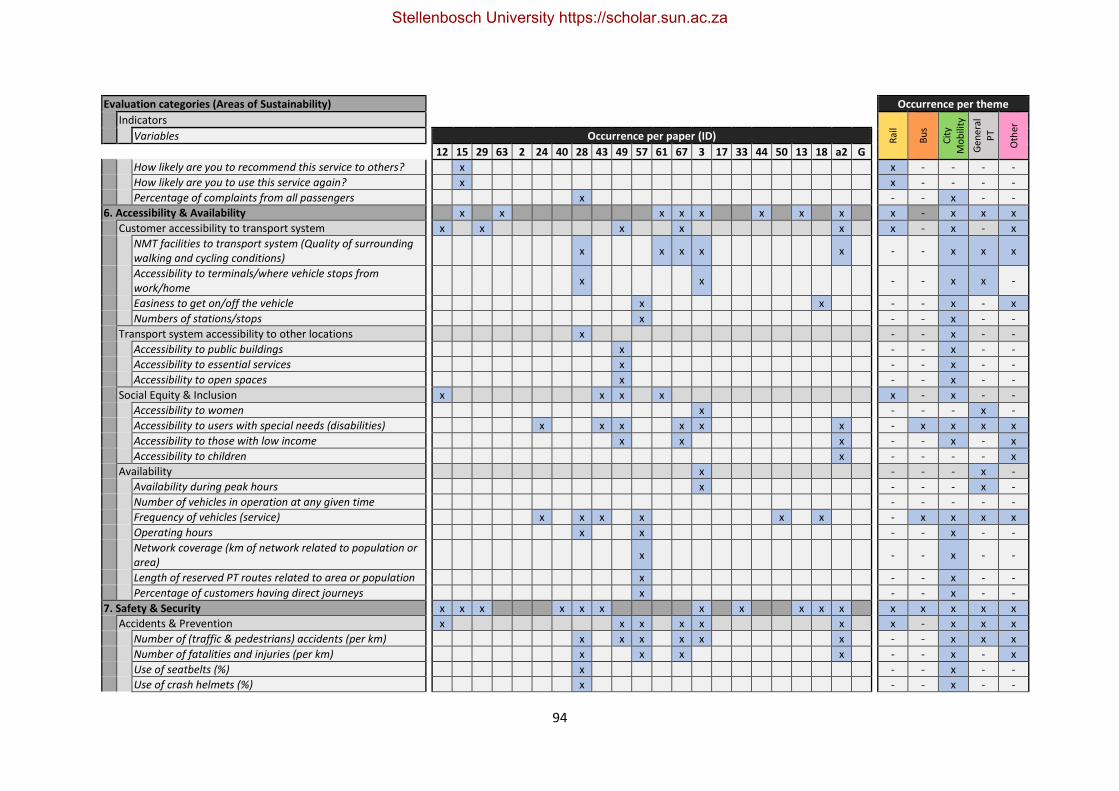
94
Evaluation categories (Areas of Sustainability) Occurrence per theme
Indicators
Rai
l
Bu
s
Cit
y
Mo
bili
ty
Gen
eral
PT
Oth
er
Variables Occurrence per paper (ID)
12 15 29 63 2 24 40 28 43 49 57 61 67 3 17 33 44 50 13 18 a2 G
How likely are you to recommend this service to others? x x - - - -
How likely are you to use this service again? x x - - - -
Percentage of complaints from all passengers x - - x - -
6. Accessibility & Availability x x x x x x x x x - x x x
Customer accessibility to transport system x x x x x x - x - x
NMT facilities to transport system (Quality of surrounding walking and cycling conditions)
x x x x x - - x x x
Accessibility to terminals/where vehicle stops from work/home
x x - - x x -
Easiness to get on/off the vehicle x x - - x - x
Numbers of stations/stops x - - x - -
Transport system accessibility to other locations x - - x - -
Accessibility to public buildings x - - x - -
Accessibility to essential services x - - x - -
Accessibility to open spaces x - - x - -
Social Equity & Inclusion x x x x x - x - -
Accessibility to women x - - - x -
Accessibility to users with special needs (disabilities) x x x x x x - x x x x
Accessibility to those with low income x x x - - x - x
Accessibility to children x - - - - x
Availability x - - - x -
Availability during peak hours x - - - x -
Number of vehicles in operation at any given time - - - - -
Frequency of vehicles (service) x x x x x x - x x x x
Operating hours x x - - x - -
Network coverage (km of network related to population or area)
x - - x - -
Length of reserved PT routes related to area or population x - - x - -
Percentage of customers having direct journeys x - - x - -
7. Safety & Security x x x x x x x x x x x x x x x x
Accidents & Prevention x x x x x x x - x x x
Number of (traffic & pedestrians) accidents (per km) x x x x x x - - x x x
Number of fatalities and injuries (per km) x x x x - - x - x
Use of seatbelts (%) x - - x - -
Use of crash helmets (%) x - - x - -
Stellenbosch University https://scholar.sun.ac.za

95
Evaluation categories (Areas of Sustainability) Occurrence per theme
Indicators
Rai
l
Bu
s
Cit
y
Mo
bili
ty
Gen
eral
PT
Oth
er
Variables Occurrence per paper (ID)
12 15 29 63 2 24 40 28 43 49 57 61 67 3 17 33 44 50 13 18 a2 G
Testing the crashworthiness of vehicles and rating (effectiveness)
x - - x - -
Sufficient vehicle lighting & use of reflective devices x x - - x - x
Crime x x - - x - -
Incidences of stolen items reported by commuters - - - - -
Incidences of commuters being attacked by armed robbers (number)
x - - x - -
Number of stolen vehicles - - - - -
Effective Police/Security patrol teams near service (number) x - - x - -
Emergency situation control - - - - -
Response time to emergency (minutes) x - - x - -
Availability of firefighting appliances x - - x - -
Information to improve your sense of security during emergency situations
x - - - - x
Passenger's perception of & satisfaction with safety level x - - x - -
Safety getting on and off transport x - - - - x
Safety on board x - - - - x
Feeling secure in transfer & waiting areas (during the day) x - - - - x
Feeling secure in transfer & waiting areas (evening/night) x - - - - x
Number of incidents of property damage (per total number of passengers)
x - - x - -
Incidence of overloading (number) x - - x - -
Sufficient lighting at stops/station x x x - - - x
Customer's perception of overall safety x x - x x - -
Driver's level of capability x - - x - -
Frequency of driver assessment x - - - - x
Drivers level of training/Percentage of trained/certified/experienced drivers (%)
x x x - x x - -
Incidence of exceeding speed limit (numbers) x - - x - -
Incidence of driving under the influence of alcohol/drugs (number)
x - - x - -
Incidence of red light running (traffic lights) (number) x - - x - -
Incidence of not stopping or yielding in junctions/pedestrian crossings/red lights (number)
x - - x - -
Vehicle & Road condition x - - x - -
Stellenbosch University https://scholar.sun.ac.za

96
Evaluation categories (Areas of Sustainability) Occurrence per theme
Indicators
Rai
l
Bu
s
Cit
y
Mo
bili
ty
Gen
eral
PT
Oth
er
Variables Occurrence per paper (ID)
12 15 29 63 2 24 40 28 43 49 57 61 67 3 17 33 44 50 13 18 a2 G
Frequency of potholes (%) x - - x - -
Overall road quality (Satisfaction with road system condition)
x - - x - -
Mechanically deficient vehicles still in use (%) x - - x - -
Old vehicles still in use (% or age of vehicles in use) x x x - - x - -
8. Government & Community Involvement x x - - - x x
Government Interoperability x - - - x -
Government performance x - x - - -
Government financial support x - - x - -
Degree to which system complies with legislation (Contracts and limitations)
x x - - x - x
Community Involvement x x x - - x x x
Public participation in decision-taking (degree to which public influence decisions)
x x x - - x x -
Public response to transit system x x - x x - -
9. Mobility (Travel & Transfer) x x x - - x x x
Time x x x x x x x - x - x
Average time making use of NMT before using the transport service
- - - - -
Average waiting time at stop/pick-up/drop-off point x x x x - x - x
Average time taken to board vehicle x - - x - -
Average commuting/In-vehicle travel time (% of total trip) x x x x x - x - x
Average parking search time x - - x - -
Delays due to congestion/Dwell time x x x x x x x x x x - -
Total average travel time to points of interest (per day) x x x x x x x x x - x x x
Speed x x x - - x -
Average speed of using NMT service before getting to stop/pick-up/drop-off point
x - - - - x
Average commuting/In-vehicle speed x x x x - x x - x
Total average transfer speed to points of interest x - - x - -
Distance x x x - - x - -
Average distance of using NMT service before getting to stop/pick-up/drop-off point
x x - - x - x
Average commuting distance x x - - x - -
Total average transfer distance x x - - - -
Stellenbosch University https://scholar.sun.ac.za
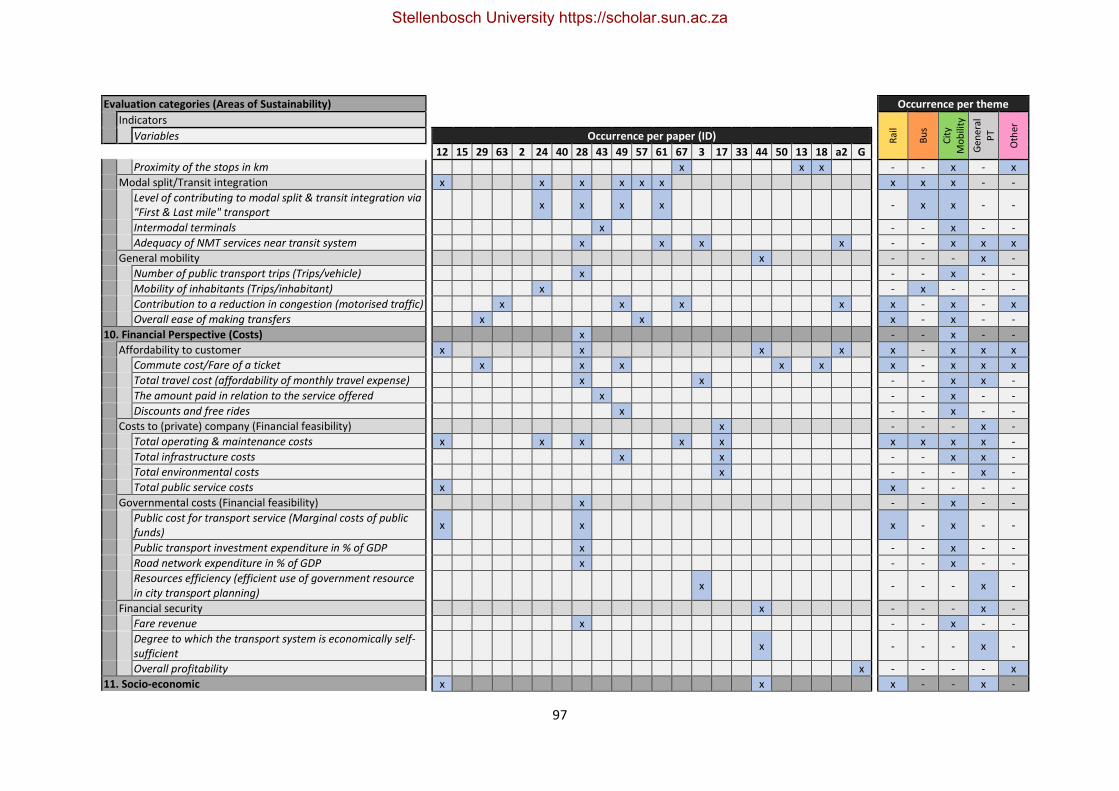
97
Evaluation categories (Areas of Sustainability) Occurrence per theme
Indicators
Rai
l
Bu
s
Cit
y
Mo
bili
ty
Gen
eral
PT
Oth
er
Variables Occurrence per paper (ID)
12 15 29 63 2 24 40 28 43 49 57 61 67 3 17 33 44 50 13 18 a2 G
Proximity of the stops in km x x x - - x - x
Modal split/Transit integration x x x x x x x x x - -
Level of contributing to modal split & transit integration via "First & Last mile" transport
x x x x - x x - -
Intermodal terminals x - - x - -
Adequacy of NMT services near transit system x x x x - - x x x
General mobility x - - - x -
Number of public transport trips (Trips/vehicle) x - - x - -
Mobility of inhabitants (Trips/inhabitant) x - x - - -
Contribution to a reduction in congestion (motorised traffic) x x x x x - x - x
Overall ease of making transfers x x x - x - -
10. Financial Perspective (Costs) x - - x - -
Affordability to customer x x x x x - x x x
Commute cost/Fare of a ticket x x x x x x - x x x
Total travel cost (affordability of monthly travel expense) x x - - x x -
The amount paid in relation to the service offered x - - x - -
Discounts and free rides x - - x - -
Costs to (private) company (Financial feasibility) x - - - x -
Total operating & maintenance costs x x x x x x x x x -
Total infrastructure costs x x - - x x -
Total environmental costs x - - - x -
Total public service costs x x - - - -
Governmental costs (Financial feasibility) x - - x - -
Public cost for transport service (Marginal costs of public funds)
x x x - x - -
Public transport investment expenditure in % of GDP x - - x - -
Road network expenditure in % of GDP x - - x - -
Resources efficiency (efficient use of government resource in city transport planning)
x - - - x -
Financial security x - - - x -
Fare revenue x - - x - -
Degree to which the transport system is economically self-sufficient
x - - - x -
Overall profitability x - - - - x
11. Socio-economic x x x - - x -
Stellenbosch University https://scholar.sun.ac.za

98
Evaluation categories (Areas of Sustainability) Occurrence per theme
Indicators
Rai
l
Bu
s
Cit
y
Mo
bili
ty
Gen
eral
PT
Oth
er
Variables Occurrence per paper (ID)
12 15 29 63 2 24 40 28 43 49 57 61 67 3 17 33 44 50 13 18 a2 G
Socio-economic development x x x x - - -
Socio-economic growth x x - - - -
Wider economic impacts x x - - - -
Area property values x x - - - -
Regional access to markets x - - x - -
Ease of reaching economically important assets x - - x - -
Support for local industries x
Social development x - - - x -
Promotion of career opportunities/creation of jobs x - - - x -
Promotion of local tourism x x x - - x -
Promotion of land-use x - - - x -
Land development x x - - - -
Green space preservation x x - - - -
Land development patterns (Sprawled vs. compact development)
x x - - - -
Regeneration x x - - - -
12. (Economic) Productivity of the system x - x - - -
Demand x - x - - -
Passengers demand x - x - - -
Demand for freight transport x - - - - x
Capacity x - - x - -
Seat capacity (space per person) x - - x - -
Seating/Passenger capacity per vehicle x x - x x - -
Network capacity of vehicles, terminals & stops x x - - x - -
Storage area in vehicle capacity x - - x - -
Maintenance x x - x x - -
Maintenance of facilities/stops x - - x - -
Maintenance of vehicles x x - x x - -
Vehicle failure x - x - - -
Ratio of non-working vehicles at any given time x - x - - -
Information systems/Travel information x x x x x x - x x x
Availability & Accessibility of real time travel information x x - x - - x
Availability & Accessibility of travel information before your trip (e.g. timetable of service)
x x - - - - x
Accuracy and reliability of travel information displays x - - - - x
Stellenbosch University https://scholar.sun.ac.za
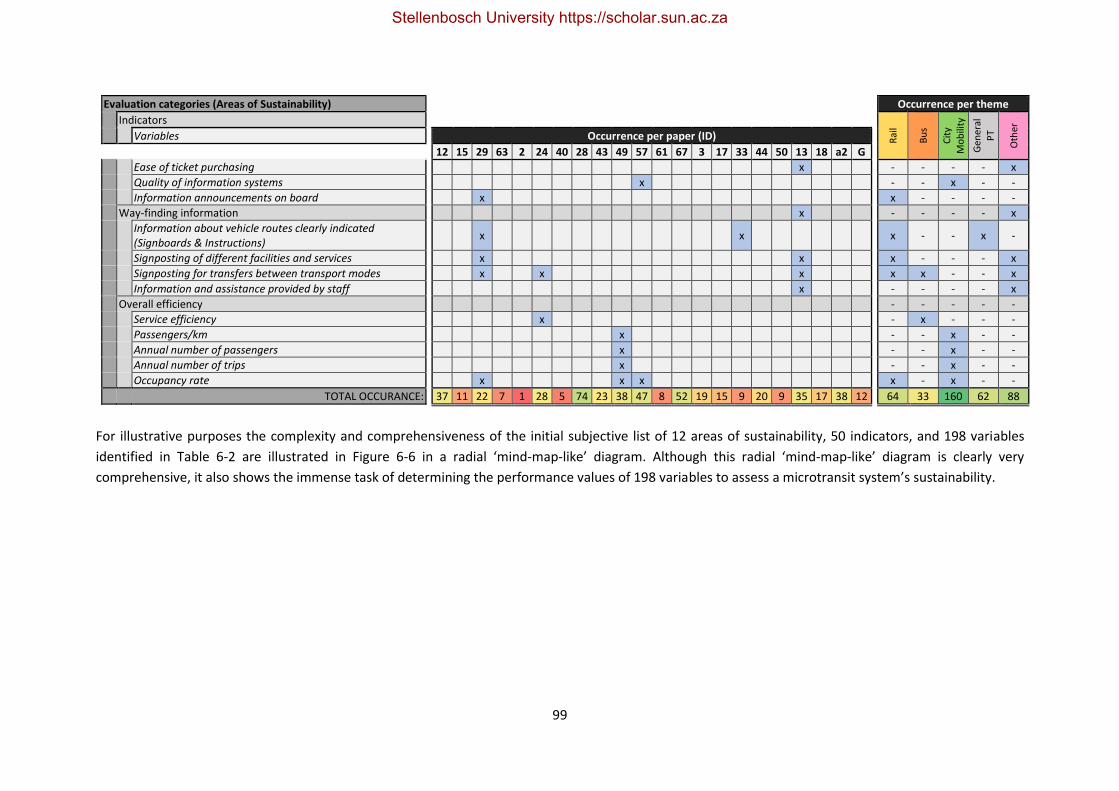
99
Evaluation categories (Areas of Sustainability) Occurrence per theme
Indicators
Rai
l
Bu
s
Cit
y
Mo
bili
ty
Gen
eral
PT
Oth
er
Variables Occurrence per paper (ID)
12 15 29 63 2 24 40 28 43 49 57 61 67 3 17 33 44 50 13 18 a2 G
Ease of ticket purchasing x - - - - x
Quality of information systems x - - x - -
Information announcements on board x x - - - -
Way-finding information x - - - - x
Information about vehicle routes clearly indicated (Signboards & Instructions)
x x x - - x -
Signposting of different facilities and services x x x - - - x
Signposting for transfers between transport modes x x x x x - - x
Information and assistance provided by staff x - - - - x
Overall efficiency - - - - -
Service efficiency x - x - - -
Passengers/km x - - x - -
Annual number of passengers x - - x - -
Annual number of trips x - - x - -
Occupancy rate x x x x - x - -
TOTAL OCCURANCE: 37 11 22 7 1 28 5 74 23 38 47 8 52 19 15 9 20 9 35 17 38 12 64 33 160 62 88
For illustrative purposes the complexity and comprehensiveness of the initial subjective list of 12 areas of sustainability, 50 indicators, and 198 variables
identified in Table 6-2 are illustrated in Figure 6-6 in a radial ‘mind-map-like’ diagram. Although this radial ‘mind-map-like’ diagram is clearly very
comprehensive, it also shows the immense task of determining the performance values of 198 variables to assess a microtransit system’s sustainability.
Stellenbosch University https://scholar.sun.ac.za
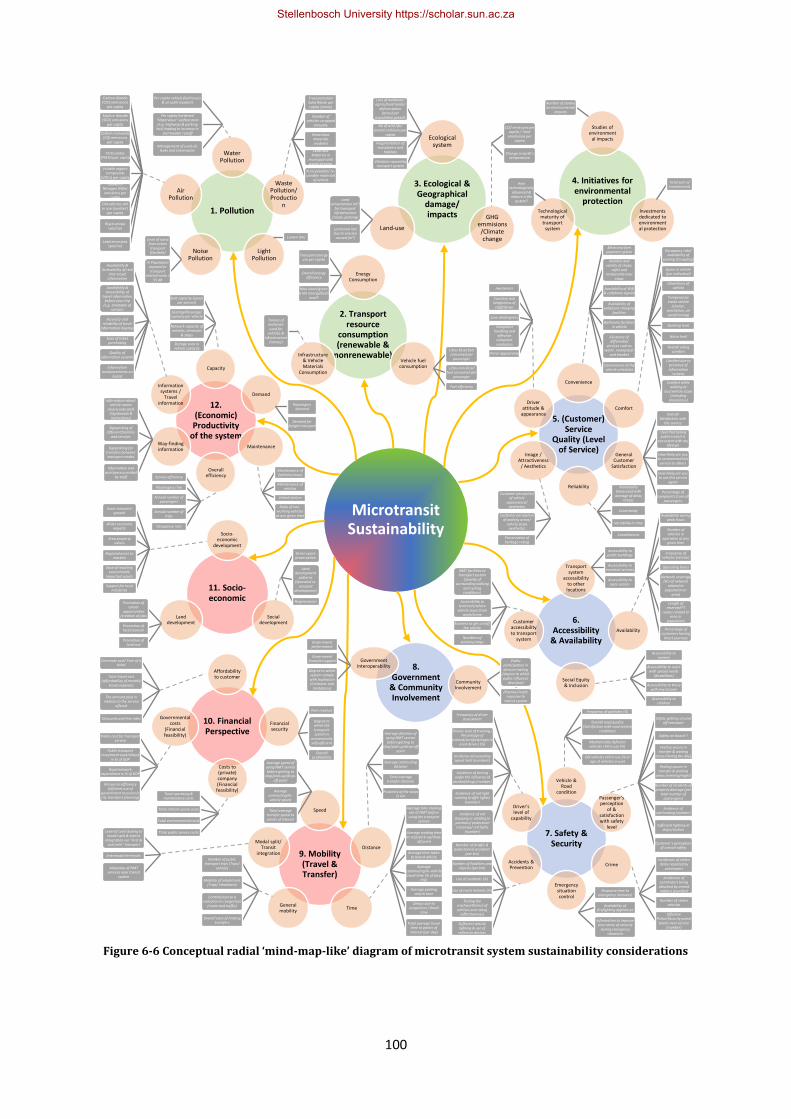
100
7. Safety & Security
Vehicle & Road
conditionPassenger's perception
of & satisfaction with safety
level
Crime
Emergency situation control
Accidents & Prevention
Driver's level of
capability
8. Government
& Community Involvement
Government Interoperability
Community Involvement
1. Pollution
Water Pollution
Waste Pollution/ Productio
n
Light Pollution
Noise Pollution
Air Pollution
2. Transport resource
consumption (renewable &
nonrenewable)
Energy Consumption
Vehicle fuel consumption
Infrastructure & Vehicle Materials
Consumption
4. Initiatives for environmental
protection
Studies of environment
al impacts
Investments dedicated to environmental protection
Technological maturity of transport
system
3. Ecological & Geographical
damage/ impacts
Ecological system
GHG emmisions
/Climate change
Land-use
5. (Customer) Service
Quality (Level of Service)
Convenience
Comfort
General Customer
Satisfaction
Reliability
Image / Attractiveness
/ Aesthetics
Driver attitude &
appearance
6. Accessibility
& Availability
Transport system
accessibility to other locations
Availability
Social Equity & Inclusion
Customer accessibility to transport
system
9. Mobility (Travel & Transfer)
Speed
Distance
TimeGeneral mobility
Modal split/ Transit
integration
10. Financial Perspective
Affordability to customer
Financial security
Costs to (private) company (Financial feasibility)
Governmental costs
(Financial feasibility)
11. Socio-economic
Socio-economic
development
Social development
Land development
12. (Economic) Productivity
of the system
Capacity
Demand
Maintenance
Overall efficiency
Way-finding information
Information systems /
Travel information
Microtransit Sustainability
Carbon dioxide (CO2) emissions
per capita
Sulphur dioxide (SO2) emissions
per capita
Carbon monoxide (CO) emissions
per capita
Particulates (PM10) per capita
Volatile organic compounds
(VOCs) per capita
Oxides of Nitrogen (NOx) emissions per
capita
Old vehicles still in use (number)
per capita
Black smoke (yes/no)
Lead emissions (yes/no)
Transportation Solid Waste per capita (tonne)
Number of vehicles scrapped
annually
Hazardous materials incidents
Lead acid batteries in
municipal solid waste streams
% recycleable/ re-useable materials
of vehicle
Per capita vehicle fluid losses & oil spills incidents
Per capita hardened “impervious” surface area (e.g. highways & parking
lots) leading to increase in stormwater runoff
Management of used oil, leaks and stormwater
Level of noise from urban transport (Decibels)
% Population exposed to transport
related noise > 55 dB
Lumen (lm)
Transport energy use per capita
Overall energy efficiency
How clean/green is the energy/fuels
used?
Tonnes of materials used for
vehicles & infrastructure
(tonnes)
Litres fossil fuel consumed per
passenger
Litres non-fossil fuel consumed per
passenger
Fuel efficiency
Loss of wetlands/ agricultural lands/
deforestation (acres) per
population growth
No of wild life/ animal collisions per
capita
Fragmentation of ecosystems and
habitats
Vibration caused by transport system
CO2 emissions per capita / Total
emmisions per capita
Change in earth's temperature
Land consumption (m2)
for transport infrastructure
(roads, parking)
Land area lost due to erosion
caused (m2)
Number of studies on environmental
impacts
How technologically
advanced & mature is the
system?
Total sum of investements
Occupancy rate/ availability of
seating (Crowding)
Space in vehicle (per individual)
Cleanliness of vehicle
Temperature inside vehicle
(shelter, ventilation, air conditioning)
Quaking level
Noise level
Overall riding comfort
Comfort due to presence of information
screens
Comfort while waiting at
bus/vehicle stops (including
cleanliness)
Electronic fare payment option
Number and variety of shops,
cafés and restaurants near
stops
Availability of Wifi & cellphone signals
Availability of cellphone charging
facilities
Bathroom facilities in vehicle
Existence of differential
services such as water, newspaper
and blanket
Convenience of the vehicle schedules
Overall Satisfaction with
the service
I feel that taking public transit is
consistent with my lifestyle
How likely are you to recommend this
service to others
How likely are you to use this service
again
Percentage of complaints from all
passengers
Awareness
Courtesy and helpfulness of
staff/driver
Law-abidingness
Complaint handling and
effective complaint resolution
Driver appearance
Punctuality (measured with average of delay
times)
Uncertainty
Variability in time
Cancellations
Customer perception of vehicle
appearance/ aesthetics
Customer perception of waiting areas/
vehicle stops aesthetics
Preservation of heritage rating
Availability during peak hours
Number of vehicles in
operation at any given time
Frequency of vehicles (service)
Operating hours
Network coverage (km of network
related to population or
area)
Length of reserved PT
routes related to area or
population
Percentage of customers having
direct journeys
Accessibility to public buildings
Accessibility to essential services
Accessibility to open spaces
NMT facilities to transport system
(Quality of surrounding walking
and cycling conditions)
Accessibility to terminals/where
vehicle stops from work/home
Easiness to get on/off the vehicle
Numbers of stations/stops
Accessibility to women
Accessibility to users with special needs
(disabilities)
Accessibility to those with low income
Accessibility to children
Availability & Accessibility of real
time travel information
Availability & Accessibility of
travel information before your trip
(e.g. timetable of service)
Accuracy and reliability of travel
information displays
Ease of ticket purchasing
Quality of information systems
Information announcements on
board
Information about vehicle routes
clearly indicated (Signboards & Instructions)
Signposting of different facilities
and services
Signposting for transfers between transport modes
Information and assistance provided
by staff
Seat capacity (space per person)
Seating/Passenger capacity per vehicle
Network capacity of vehicles, terminals
& stops
Storage area in vehicle capacity
Passengers demand
Demand for freight transport
Maintenance of facilities/stops
Maintenance of vehicles
Vehicle failure
Ratio of non-working vehicles at any given time
Service efficiency
Passengers / km
Annual number of passengers
Annual number of trips
Occupancy rate
Socio-economic growth
Wider economic impacts
Area property values
Regional acces to markets
Ease of reaching economically
important assets
Support for local industries
Green space preservation
Land development
patterns (Sprawled vs.
compact development)
RegenerationPromotion of career
opportunities /creation of jobs
Promotion of local tourism
Promotion of land-use
Safety getting on and off transport
Safety on board ?
Feeling secure in transfer & waiting
areas (during the day)
Feeling secure in transfer & waiting
areas (evening/night)
Number of incidents of property damage (per
total number of passengers)
Incidence of overloading (number)
Sufficient lighting at stops/station
Customer's perception of overall safety
Frequency of driver assessment
Drivers level of training / Percentage of
trained/certified/experienced drivers (%)
Incidence of exceeding speed limit (numbers)
Incidence of driving under the influence of
alcohol/drugs (number)
Incidence of red light running (traffic lights)
(number)
Incidence of not stopping or yielding in junctions/ pedestrian crossings/ red lights
(number)
Frequency of potholes (%)
Overall road quality (Satisfaction with road system
condition)
Mechanically deficient vehicles still in use (%)
Old vehicles still in use (% or age of vehicles in use)
Incidences of stolen items reported by
commuters
Incidences of commuters being
attacked by armed robbers (number)
Number of stolen vehicles
Effective Police/Security patrol
teams near service (number)
Response time to emergency (minutes)
Availability of firefighting appliances
Information to improve your sense of security
during emergency situations
Number of (traffic & pedestrians) accidents
(per km)
Number of fatalities and injuries (per km)
Use of seatbelts (%)
Use of crash helmets (%)
Testing the crashworthiness of vehicles and rating
(effectiveness)
Sufficient vehicle lighting & use of reflective devices
Fare revenue
Degree to which the transport system is
economically selfsufficient
Overall profitability
Average speed of using NMT service before getting to
stop/pick-up/drop-off point
Average commuting/In-vehicle speed
Total average transfer speed to points of interest
Number of public transport trips (Trips/
vehicle)
Mobility of inhabitants (Trips/ inhabitant)
Contribution to a reduction in congestion
(motorised traffic)
Overall ease of making transfers
Average distance of using NMT service before getting to
stop/pick-up/drop-off point
Average commuting distance
Total average transfer distance
Proximity of the stops in km
Average time making use of NMT before using the transport
service
Average waiting time at stop/pick-up/drop-
off point
Average time taken to board vehicle
Average commuting/In-vehicle travel time (% of total
trip)
Average parking search time
Delays due to congestion / Dwell
time
Total average travel time to points of interest (per day)
Public participation in decision-taking
(degree to which public influence
decisions)
(Postive) Public response to
transit system
Government performance
Government financial support
Degree to which system comply with legislation (Contracts and
limitations)
Public cost for transport service
Public transport investment expenditure
in % of GDP
Road network expenditure in % of GDP
Resources efficiency (efficient use of
government resource in city transport planning)
Commute cost/ Fare of a ticket
Total travel cost (affordability of monthly
travel expense)
The amount paid in relation to the service
offered
Discounts and free rides
Total operating & maintenance costs
Total infrastructure costs
Total environmental costs
Total public service costsLevel of contributing to modal split & transit
integration via "First & Last mile" transport
Intermodal terminals
Adequacy of NMT services near transit
system
Figure 6-6 Conceptual radial ‘mind-map-like’ diagram of microtransit system sustainability considerations
Stellenbosch University https://scholar.sun.ac.za
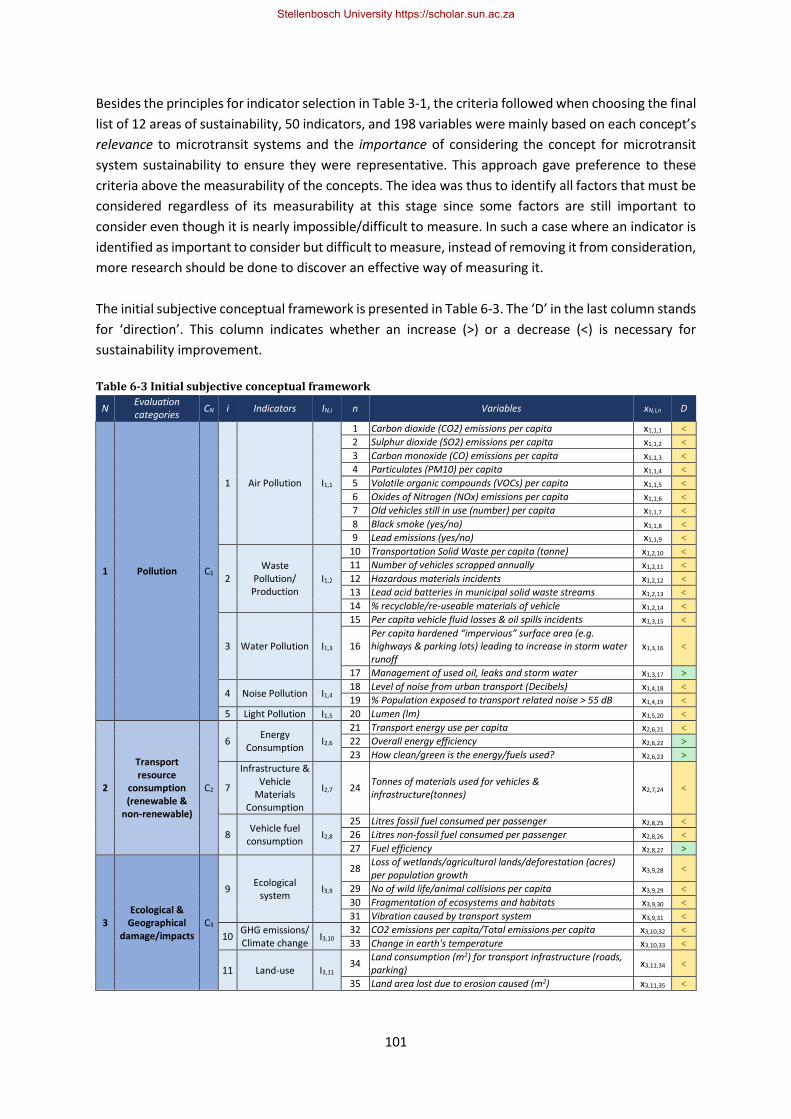
101
Besides the principles for indicator selection in Table 3-1, the criteria followed when choosing the final
list of 12 areas of sustainability, 50 indicators, and 198 variables were mainly based on each concept’s
relevance to microtransit systems and the importance of considering the concept for microtransit
system sustainability to ensure they were representative. This approach gave preference to these
criteria above the measurability of the concepts. The idea was thus to identify all factors that must be
considered regardless of its measurability at this stage since some factors are still important to
consider even though it is nearly impossible/difficult to measure. In such a case where an indicator is
identified as important to consider but difficult to measure, instead of removing it from consideration,
more research should be done to discover an effective way of measuring it.
The initial subjective conceptual framework is presented in Table 6-3. The ‘D’ in the last column stands
for ‘direction’. This column indicates whether an increase (>) or a decrease (<) is necessary for
sustainability improvement.
Table 6-3 Initial subjective conceptual framework
N Evaluation categories
CN i Indicators IN,i n Variables xN,i,n D
1 Pollution C1
1 Air Pollution I1,1
1 Carbon dioxide (CO2) emissions per capita x1,1,1 <
2 Sulphur dioxide (SO2) emissions per capita x1,1,2 <
3 Carbon monoxide (CO) emissions per capita x1,1,3 <
4 Particulates (PM10) per capita x1,1,4 <
5 Volatile organic compounds (VOCs) per capita x1,1,5 <
6 Oxides of Nitrogen (NOx) emissions per capita x1,1,6 <
7 Old vehicles still in use (number) per capita x1,1,7 <
8 Black smoke (yes/no) x1,1,8 <
9 Lead emissions (yes/no) x1,1,9 <
2 Waste
Pollution/ Production
I1,2
10 Transportation Solid Waste per capita (tonne) x1,2,10 <
11 Number of vehicles scrapped annually x1,2,11 <
12 Hazardous materials incidents x1,2,12 <
13 Lead acid batteries in municipal solid waste streams x1,2,13 <
14 % recyclable/re-useable materials of vehicle x1,2,14 <
3 Water Pollution I1,3
15 Per capita vehicle fluid losses & oil spills incidents x1,3,15 <
16 Per capita hardened “impervious” surface area (e.g. highways & parking lots) leading to increase in storm water runoff
x1,3,16 <
17 Management of used oil, leaks and storm water x1,3,17 >
4 Noise Pollution I1,4 18 Level of noise from urban transport (Decibels) x1,4,18 <
19 % Population exposed to transport related noise > 55 dB x1,4,19 <
5 Light Pollution I1,5 20 Lumen (lm) x1,5,20 <
2
Transport resource
consumption (renewable &
non-renewable)
C2
6 Energy
Consumption I2,6
21 Transport energy use per capita x2,6,21 <
22 Overall energy efficiency x2,6,22 >
23 How clean/green is the energy/fuels used? x2,6,23 >
7
Infrastructure & Vehicle
Materials Consumption
I2,7 24 Tonnes of materials used for vehicles & infrastructure(tonnes)
x2,7,24 <
8 Vehicle fuel
consumption I2,8
25 Litres fossil fuel consumed per passenger x2,8,25 <
26 Litres non-fossil fuel consumed per passenger x2,8,26 <
27 Fuel efficiency x2,8,27 >
3 Ecological & Geographical
damage/impacts C3
9 Ecological
system I3,9
28 Loss of wetlands/agricultural lands/deforestation (acres) per population growth
x3,9,28 <
29 No of wild life/animal collisions per capita x3,9,29 <
30 Fragmentation of ecosystems and habitats x3,9,30 <
31 Vibration caused by transport system x3,9,31 <
10 GHG emissions/ Climate change
I3,10 32 CO2 emissions per capita/Total emissions per capita x3,10,32 <
33 Change in earth's temperature x3,10,33 <
11 Land-use I3,11 34
Land consumption (m2) for transport infrastructure (roads, parking)
x3,11,34 <
35 Land area lost due to erosion caused (m2) x3,11,35 <
Stellenbosch University https://scholar.sun.ac.za
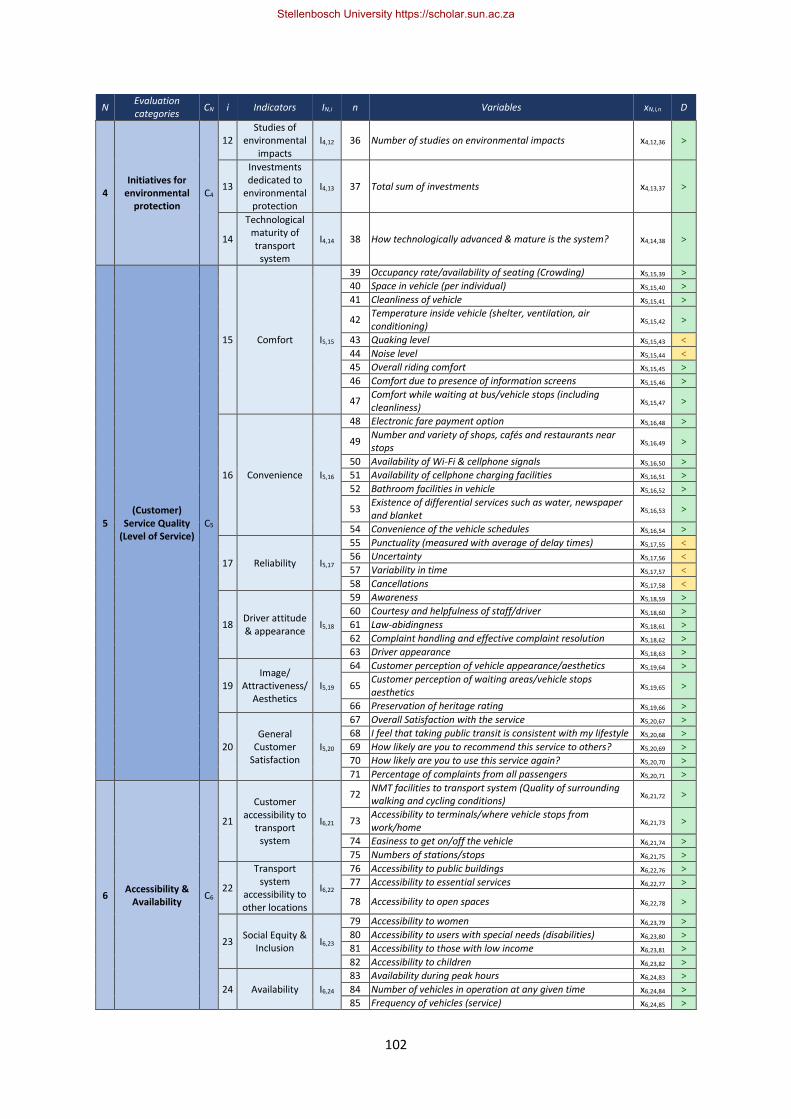
102
N Evaluation categories
CN i Indicators IN,i n Variables xN,i,n D
4 Initiatives for
environmental protection
C4
12 Studies of
environmental impacts
I4,12 36 Number of studies on environmental impacts x4,12,36 >
13
Investments dedicated to
environmental protection
I4,13 37 Total sum of investments x4,13,37 >
14
Technological maturity of transport
system
I4,14 38 How technologically advanced & mature is the system? x4,14,38 >
5 (Customer)
Service Quality (Level of Service)
C5
15 Comfort I5,15
39 Occupancy rate/availability of seating (Crowding) x5,15,39 >
40 Space in vehicle (per individual) x5,15,40 >
41 Cleanliness of vehicle x5,15,41 >
42 Temperature inside vehicle (shelter, ventilation, air conditioning)
x5,15,42 >
43 Quaking level x5,15,43 <
44 Noise level x5,15,44 <
45 Overall riding comfort x5,15,45 >
46 Comfort due to presence of information screens x5,15,46 >
47 Comfort while waiting at bus/vehicle stops (including cleanliness)
x5,15,47 >
16 Convenience I5,16
48 Electronic fare payment option x5,16,48 >
49 Number and variety of shops, cafés and restaurants near stops
x5,16,49 >
50 Availability of Wi-Fi & cellphone signals x5,16,50 >
51 Availability of cellphone charging facilities x5,16,51 >
52 Bathroom facilities in vehicle x5,16,52 >
53 Existence of differential services such as water, newspaper and blanket
x5,16,53 >
54 Convenience of the vehicle schedules x5,16,54 >
17 Reliability I5,17
55 Punctuality (measured with average of delay times) x5,17,55 <
56 Uncertainty x5,17,56 <
57 Variability in time x5,17,57 <
58 Cancellations x5,17,58 <
18 Driver attitude & appearance
I5,18
59 Awareness x5,18,59 >
60 Courtesy and helpfulness of staff/driver x5,18,60 >
61 Law-abidingness x5,18,61 >
62 Complaint handling and effective complaint resolution x5,18,62 >
63 Driver appearance x5,18,63 >
19 Image/
Attractiveness/ Aesthetics
I5,19
64 Customer perception of vehicle appearance/aesthetics x5,19,64 >
65 Customer perception of waiting areas/vehicle stops aesthetics
x5,19,65 >
66 Preservation of heritage rating x5,19,66 >
20 General
Customer Satisfaction
I5,20
67 Overall Satisfaction with the service x5,20,67 >
68 I feel that taking public transit is consistent with my lifestyle x5,20,68 >
69 How likely are you to recommend this service to others? x5,20,69 >
70 How likely are you to use this service again? x5,20,70 >
71 Percentage of complaints from all passengers x5,20,71 >
6 Accessibility &
Availability C6
21
Customer accessibility to
transport system
I6,21
72 NMT facilities to transport system (Quality of surrounding walking and cycling conditions)
x6,21,72 >
73 Accessibility to terminals/where vehicle stops from work/home
x6,21,73 >
74 Easiness to get on/off the vehicle x6,21,74 >
75 Numbers of stations/stops x6,21,75 >
22
Transport system
accessibility to other locations
I6,22
76 Accessibility to public buildings x6,22,76 >
77 Accessibility to essential services x6,22,77 >
78 Accessibility to open spaces x6,22,78 >
23 Social Equity &
Inclusion I6,23
79 Accessibility to women x6,23,79 >
80 Accessibility to users with special needs (disabilities) x6,23,80 >
81 Accessibility to those with low income x6,23,81 >
82 Accessibility to children x6,23,82 >
24 Availability I6,24
83 Availability during peak hours x6,24,83 >
84 Number of vehicles in operation at any given time x6,24,84 >
85 Frequency of vehicles (service) x6,24,85 >
Stellenbosch University https://scholar.sun.ac.za
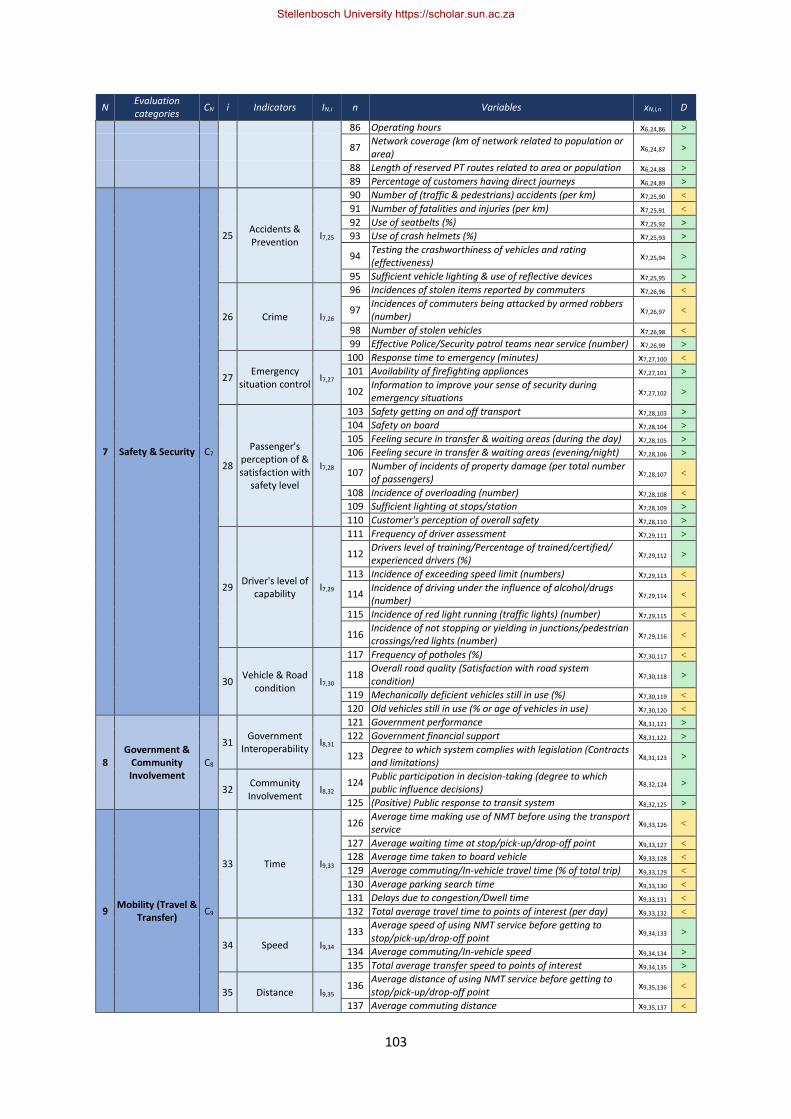
103
N Evaluation categories
CN i Indicators IN,i n Variables xN,i,n D
86 Operating hours x6,24,86 >
87 Network coverage (km of network related to population or area)
x6,24,87 >
88 Length of reserved PT routes related to area or population x6,24,88 >
89 Percentage of customers having direct journeys x6,24,89 >
7 Safety & Security C7
25 Accidents & Prevention
I7,25
90 Number of (traffic & pedestrians) accidents (per km) x7,25,90 <
91 Number of fatalities and injuries (per km) x7,25,91 <
92 Use of seatbelts (%) x7,25,92 >
93 Use of crash helmets (%) x7,25,93 >
94 Testing the crashworthiness of vehicles and rating (effectiveness)
x7,25,94 >
95 Sufficient vehicle lighting & use of reflective devices x7,25,95 >
26 Crime I7,26
96 Incidences of stolen items reported by commuters x7,26,96 <
97 Incidences of commuters being attacked by armed robbers (number)
x7,26,97 <
98 Number of stolen vehicles x7,26,98 <
99 Effective Police/Security patrol teams near service (number) x7,26,99 >
27 Emergency
situation control I7,27
100 Response time to emergency (minutes) x7,27,100 <
101 Availability of firefighting appliances x7,27,101 >
102 Information to improve your sense of security during emergency situations
x7,27,102 >
28
Passenger's perception of & satisfaction with
safety level
I7,28
103 Safety getting on and off transport x7,28,103 >
104 Safety on board x7,28,104 >
105 Feeling secure in transfer & waiting areas (during the day) x7,28,105 >
106 Feeling secure in transfer & waiting areas (evening/night) x7,28,106 >
107 Number of incidents of property damage (per total number of passengers)
x7,28,107 <
108 Incidence of overloading (number) x7,28,108 <
109 Sufficient lighting at stops/station x7,28,109 >
110 Customer's perception of overall safety x7,28,110 >
29 Driver's level of
capability I7,29
111 Frequency of driver assessment x7,29,111 >
112 Drivers level of training/Percentage of trained/certified/ experienced drivers (%)
x7,29,112 >
113 Incidence of exceeding speed limit (numbers) x7,29,113 <
114 Incidence of driving under the influence of alcohol/drugs (number)
x7,29,114 <
115 Incidence of red light running (traffic lights) (number) x7,29,115 <
116 Incidence of not stopping or yielding in junctions/pedestrian crossings/red lights (number)
x7,29,116 <
30 Vehicle & Road
condition I7,30
117 Frequency of potholes (%) x7,30,117 <
118 Overall road quality (Satisfaction with road system condition)
x7,30,118 >
119 Mechanically deficient vehicles still in use (%) x7,30,119 <
120 Old vehicles still in use (% or age of vehicles in use) x7,30,120 <
8 Government &
Community Involvement
C8
31 Government
Interoperability I8,31
121 Government performance x8,31,121 >
122 Government financial support x8,31,122 >
123 Degree to which system complies with legislation (Contracts and limitations)
x8,31,123 >
32 Community Involvement
I8,32 124
Public participation in decision-taking (degree to which public influence decisions)
x8,32,124 >
125 (Positive) Public response to transit system x8,32,125 >
9 Mobility (Travel &
Transfer) C9
33 Time I9,33
126 Average time making use of NMT before using the transport service
x9,33,126 <
127 Average waiting time at stop/pick-up/drop-off point x9,33,127 <
128 Average time taken to board vehicle x9,33,128 <
129 Average commuting/In-vehicle travel time (% of total trip) x9,33,129 <
130 Average parking search time x9,33,130 <
131 Delays due to congestion/Dwell time x9,33,131 <
132 Total average travel time to points of interest (per day) x9,33,132 <
34 Speed I9,34
133 Average speed of using NMT service before getting to stop/pick-up/drop-off point
x9,34,133 >
134 Average commuting/In-vehicle speed x9,34,134 >
135 Total average transfer speed to points of interest x9,34,135 >
35 Distance I9,35 136
Average distance of using NMT service before getting to stop/pick-up/drop-off point
x9,35,136 <
137 Average commuting distance x9,35,137 <
Stellenbosch University https://scholar.sun.ac.za
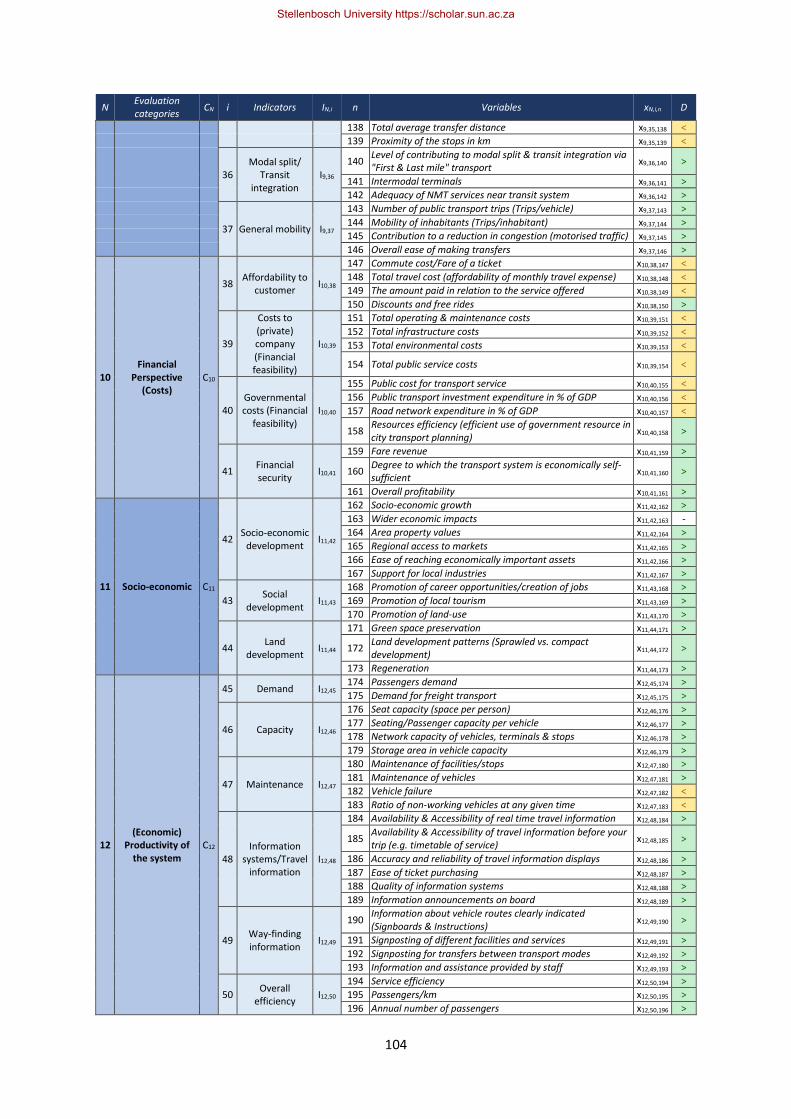
104
N Evaluation categories
CN i Indicators IN,i n Variables xN,i,n D
138 Total average transfer distance x9,35,138 <
139 Proximity of the stops in km x9,35,139 <
36 Modal split/
Transit integration
I9,36
140 Level of contributing to modal split & transit integration via "First & Last mile" transport
x9,36,140 >
141 Intermodal terminals x9,36,141 >
142 Adequacy of NMT services near transit system x9,36,142 >
37 General mobility I9,37
143 Number of public transport trips (Trips/vehicle) x9,37,143 >
144 Mobility of inhabitants (Trips/inhabitant) x9,37,144 >
145 Contribution to a reduction in congestion (motorised traffic) x9,37,145 >
146 Overall ease of making transfers x9,37,146 >
10 Financial
Perspective (Costs)
C10
38 Affordability to
customer I10,38
147 Commute cost/Fare of a ticket x10,38,147 <
148 Total travel cost (affordability of monthly travel expense) x10,38,148 <
149 The amount paid in relation to the service offered x10,38,149 <
150 Discounts and free rides x10,38,150 >
39
Costs to (private) company (Financial feasibility)
I10,39
151 Total operating & maintenance costs x10,39,151 <
152 Total infrastructure costs x10,39,152 <
153 Total environmental costs x10,39,153 <
154 Total public service costs x10,39,154 <
40 Governmental costs (Financial
feasibility) I10,40
155 Public cost for transport service x10,40,155 <
156 Public transport investment expenditure in % of GDP x10,40,156 <
157 Road network expenditure in % of GDP x10,40,157 <
158 Resources efficiency (efficient use of government resource in city transport planning)
x10,40,158 >
41 Financial security
I10,41
159 Fare revenue x10,41,159 >
160 Degree to which the transport system is economically self-sufficient
x10,41,160 >
161 Overall profitability x10,41,161 >
11 Socio-economic C11
42 Socio-economic
development I11,42
162 Socio-economic growth x11,42,162 >
163 Wider economic impacts x11,42,163 -
164 Area property values x11,42,164 >
165 Regional access to markets x11,42,165 >
166 Ease of reaching economically important assets x11,42,166 >
167 Support for local industries x11,42,167 >
43 Social
development I11,43
168 Promotion of career opportunities/creation of jobs x11,43,168 >
169 Promotion of local tourism x11,43,169 >
170 Promotion of land-use x11,43,170 >
44 Land
development I11,44
171 Green space preservation x11,44,171 >
172 Land development patterns (Sprawled vs. compact development)
x11,44,172 >
173 Regeneration x11,44,173 >
12 (Economic)
Productivity of the system
C12
45 Demand I12,45 174 Passengers demand x12,45,174 >
175 Demand for freight transport x12,45,175 >
46 Capacity I12,46
176 Seat capacity (space per person) x12,46,176 >
177 Seating/Passenger capacity per vehicle x12,46,177 >
178 Network capacity of vehicles, terminals & stops x12,46,178 >
179 Storage area in vehicle capacity x12,46,179 >
47 Maintenance I12,47
180 Maintenance of facilities/stops x12,47,180 >
181 Maintenance of vehicles x12,47,181 >
182 Vehicle failure x12,47,182 <
183 Ratio of non-working vehicles at any given time x12,47,183 <
48 Information
systems/Travel information
I12,48
184 Availability & Accessibility of real time travel information x12,48,184 >
185 Availability & Accessibility of travel information before your trip (e.g. timetable of service)
x12,48,185 >
186 Accuracy and reliability of travel information displays x12,48,186 >
187 Ease of ticket purchasing x12,48,187 >
188 Quality of information systems x12,48,188 >
189 Information announcements on board x12,48,189 >
49 Way-finding information
I12,49
190 Information about vehicle routes clearly indicated (Signboards & Instructions)
x12,49,190 >
191 Signposting of different facilities and services x12,49,191 >
192 Signposting for transfers between transport modes x12,49,192 >
193 Information and assistance provided by staff x12,49,193 >
50 Overall
efficiency I12,50
194 Service efficiency x12,50,194 >
195 Passengers/km x12,50,195 >
196 Annual number of passengers x12,50,196 >
Stellenbosch University https://scholar.sun.ac.za
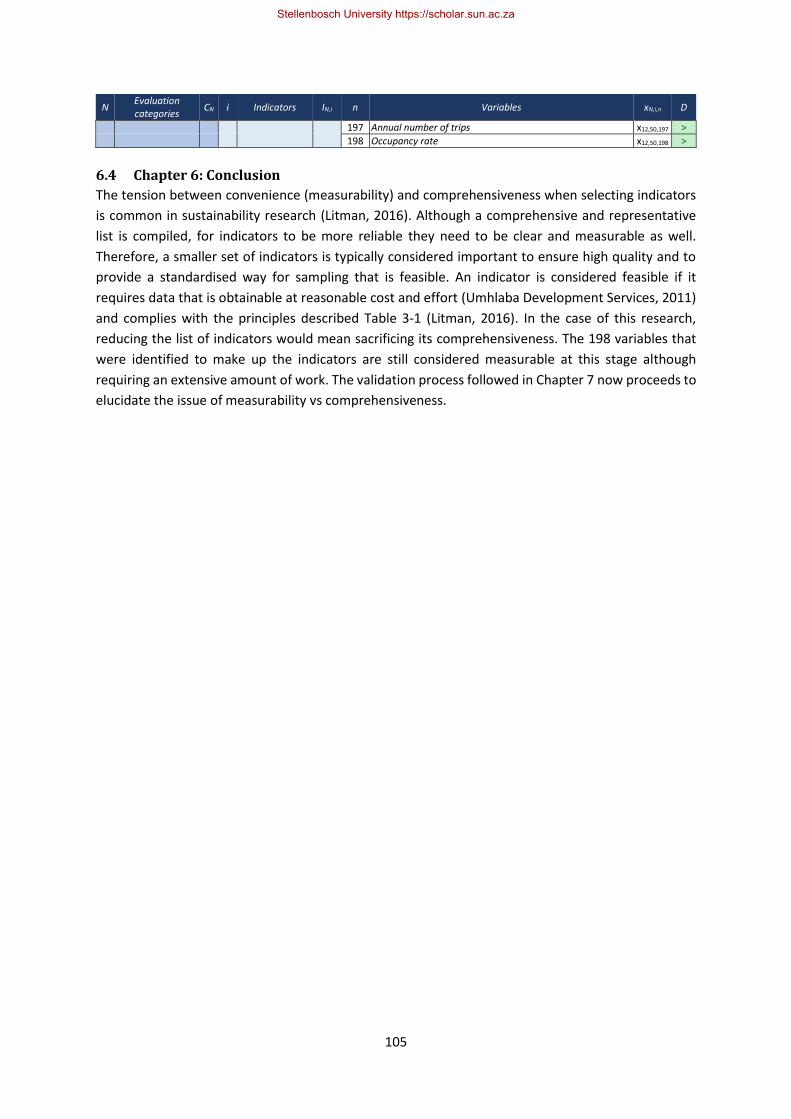
105
N Evaluation categories
CN i Indicators IN,i n Variables xN,i,n D
197 Annual number of trips x12,50,197 >
198 Occupancy rate x12,50,198 >
6.4 Chapter 6: Conclusion
The tension between convenience (measurability) and comprehensiveness when selecting indicators
is common in sustainability research (Litman, 2016). Although a comprehensive and representative
list is compiled, for indicators to be more reliable they need to be clear and measurable as well.
Therefore, a smaller set of indicators is typically considered important to ensure high quality and to
provide a standardised way for sampling that is feasible. An indicator is considered feasible if it
requires data that is obtainable at reasonable cost and effort (Umhlaba Development Services, 2011)
and complies with the principles described Table 3-1 (Litman, 2016). In the case of this research,
reducing the list of indicators would mean sacrificing its comprehensiveness. The 198 variables that
were identified to make up the indicators are still considered measurable at this stage although
requiring an extensive amount of work. The validation process followed in Chapter 7 now proceeds to
elucidate the issue of measurability vs comprehensiveness.
Stellenbosch University https://scholar.sun.ac.za

106
This page intentionally left blank
Stellenbosch University https://scholar.sun.ac.za
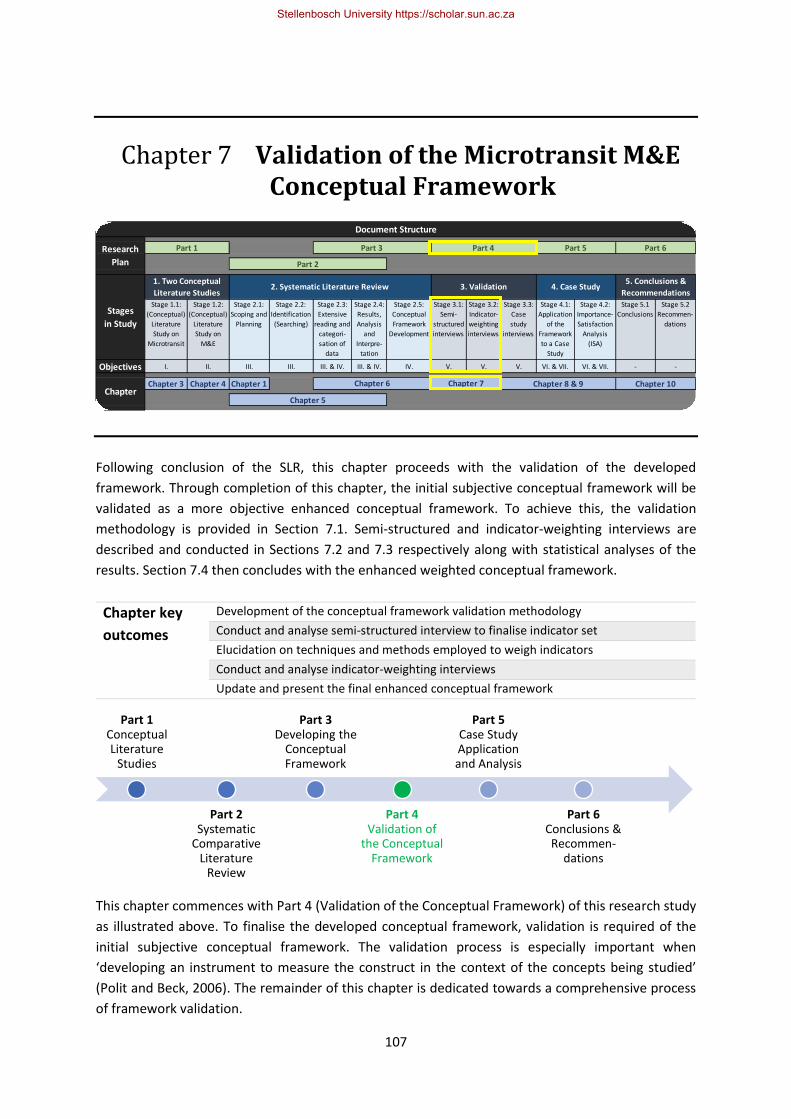
107
Chapter 7 Validation of the Microtransit M&E Conceptual Framework
Following conclusion of the SLR, this chapter proceeds with the validation of the developed
framework. Through completion of this chapter, the initial subjective conceptual framework will be
validated as a more objective enhanced conceptual framework. To achieve this, the validation
methodology is provided in Section 7.1. Semi-structured and indicator-weighting interviews are
described and conducted in Sections 7.2 and 7.3 respectively along with statistical analyses of the
results. Section 7.4 then concludes with the enhanced weighted conceptual framework.
Chapter key
outcomes
Development of the conceptual framework validation methodology
Conduct and analyse semi-structured interview to finalise indicator set
Elucidation on techniques and methods employed to weigh indicators
Conduct and analyse indicator-weighting interviews
Update and present the final enhanced conceptual framework
This chapter commences with Part 4 (Validation of the Conceptual Framework) of this research study
as illustrated above. To finalise the developed conceptual framework, validation is required of the
initial subjective conceptual framework. The validation process is especially important when
‘developing an instrument to measure the construct in the context of the concepts being studied’
(Polit and Beck, 2006). The remainder of this chapter is dedicated towards a comprehensive process
of framework validation.
Stage 1.1:
(Conceptual)
Literature
Study on
Microtransit
Stage 1.2:
(Conceptual)
Literature
Study on
M&E
Stage 2.1:
Scoping and
Planning
Stage 2.2:
Identification
(Searching)
Stage 2.3:
Extensive
reading and
categori-
sation of
data
Stage 2.4:
Results,
Analysis
and
Interpre-
tation
Stage 2.5:
Conceptual
Framework
Development
Stage 3.1:
Semi-
structured
interviews
Stage 3.2:
Indicator-
weighting
interviews
Stage 3.3:
Case
study
interviews
Stage 4.1:
Application
of the
Framework
to a Case
Study
Stage 4.2:
Importance-
Satisfaction
Analysis
(ISA)
Stage 5.1
Conclusions
Stage 5.2
Recommen-
dations
Objectives I. II. III. III. III. & IV. III. & IV. IV. V. V. V. VI. & VII. VI. & VII. - -
Chapter 3 Chapter 4 Chapter 1
Stages
in Study
1. Two Conceptual
Literature Studies2. Systematic Literature Review 3. Validation 4. Case Study
5. Conclusions &
Recommendations
ChapterChapter 6 Chapter 7 Chapter 8 & 9 Chapter 10
Chapter 5
Document Structure
Research
Plan
Part 1 Part 3 Part 4 Part 5 Part 6
Part 2
Part 1 Conceptual Literature
Studies
Part 2 Systematic
Comparative Literature
Review
Part 3 Developing the
Conceptual Framework
Part 4 Validation of
the Conceptual Framework
Part 5 Case Study Application and Analysis
Part 6 Conclusions & Recommen-
dations
Stellenbosch University https://scholar.sun.ac.za
108
7.1 Conceptual framework validation methodology
Methodological triangulation is a technique employed for validation of and ensuring credibility of
results (O’Donoghue and Punch, 2003; Angkananon, Wald and Gilbert, 2013). It involves studying a
phenomenon through more than one kind of method and has been found beneficial for confirmation
of findings, increased comprehensiveness and validity, and enhanced understandings of the
phenomenon considered (Bekhet and Zauszniewski, 2012).
Methodological triangulation was used in this study based on theory from existing transport
frameworks, semi-structured expert interviews and questionnaires, and ‘real world’ application to a
case study. The complete methodology for validation of the initial subjective conceptual framework
towards the weighted finalised M&E framework is illustrated in Figure 7-1.
Stellenbosch University https://scholar.sun.ac.za
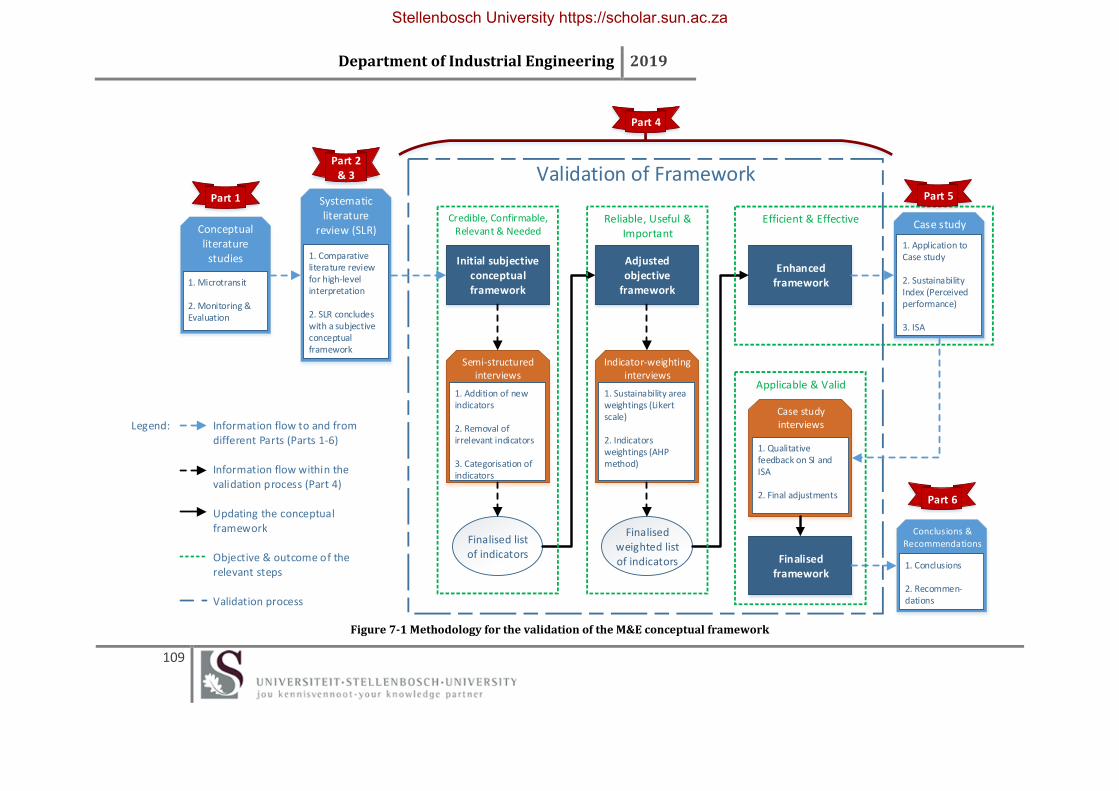
Department of Industrial Engineering 2019
109
Semi-structured interviews
Initial subjective conceptual framework
Adjusted objective
framework
1. Addition of new indicators
2. Removal of irrelevant indicators
3. Categorisation of indicators
Indicator-weighting interviews
1. Sustainability area weightings (Likert scale)
2. Indicators weightings (AHP method)
Enhanced framework
Validation of Framework
Finalised framework
Finalised list of indicators
Finalised weighted list of indicators
Legend: Information flow to and from different Parts (Parts 1-6)
Information flow within the validation process (Part 4)
Updating the conceptual framework
Objective & outcome of the relevant steps
Validation process
Credible, Confirmable, Relevant & Needed
Reliable, Useful & Important
Case study Efficient & Effective
1. Application to Case study
2. Sustainability Index (Perceived performance)
3. ISA
Conceptual literature
studies
1. Microtransit
2. Monitoring & Evaluation
Systematic literature
review (SLR)
1. Comparative literature review for high-level interpretation
2. SLR concludes with a subjective conceptual framework
Conclusions & Recommendations
1. Conclusions
2. Recommen-dations
Part 1
Part 2 & 3
Part 5
Part 6
Part 4
Case study interviews
1. Qualitative feedback on SI and ISA
2. Final adjustments
Applicable & Valid
Figure 7-1 Methodology for the validation of the M&E conceptual framework
Stellenbosch University https://scholar.sun.ac.za
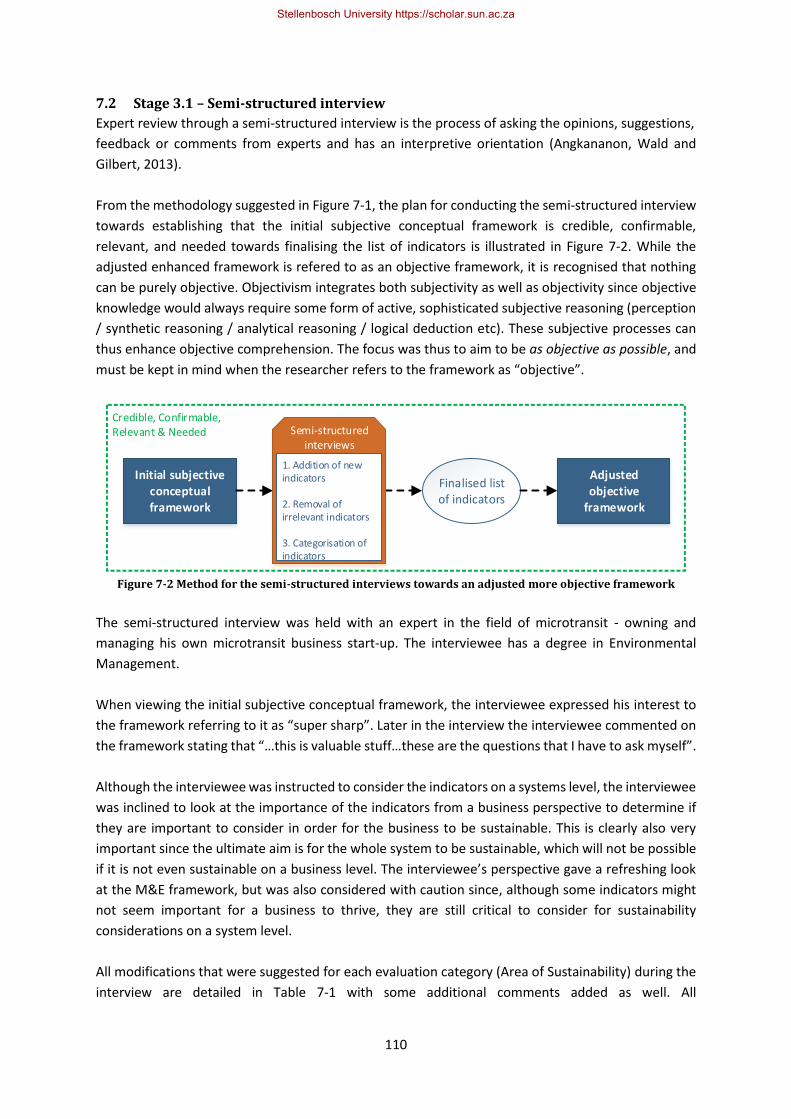
110
7.2 Stage 3.1 – Semi-structured interview
Expert review through a semi-structured interview is the process of asking the opinions, suggestions,
feedback or comments from experts and has an interpretive orientation (Angkananon, Wald and
Gilbert, 2013).
From the methodology suggested in Figure 7-1, the plan for conducting the semi-structured interview
towards establishing that the initial subjective conceptual framework is credible, confirmable,
relevant, and needed towards finalising the list of indicators is illustrated in Figure 7-2. While the
adjusted enhanced framework is refered to as an objective framework, it is recognised that nothing
can be purely objective. Objectivism integrates both subjectivity as well as objectivity since objective
knowledge would always require some form of active, sophisticated subjective reasoning (perception
/ synthetic reasoning / analytical reasoning / logical deduction etc). These subjective processes can
thus enhance objective comprehension. The focus was thus to aim to be as objective as possible, and
must be kept in mind when the researcher refers to the framework as “objective”.
Initial subjective conceptual framework
Finalised list of indicators
Credible, Confirmable,Relevant & Needed Semi-structured
interviews
1. Addition of new indicators
2. Removal of irrelevant indicators
3. Categorisation of indicators
Adjusted objective
framework
Figure 7-2 Method for the semi-structured interviews towards an adjusted more objective framework
The semi-structured interview was held with an expert in the field of microtransit - owning and
managing his own microtransit business start-up. The interviewee has a degree in Environmental
Management.
When viewing the initial subjective conceptual framework, the interviewee expressed his interest to
the framework referring to it as “super sharp”. Later in the interview the interviewee commented on
the framework stating that “…this is valuable stuff…these are the questions that I have to ask myself”.
Although the interviewee was instructed to consider the indicators on a systems level, the interviewee
was inclined to look at the importance of the indicators from a business perspective to determine if
they are important to consider in order for the business to be sustainable. This is clearly also very
important since the ultimate aim is for the whole system to be sustainable, which will not be possible
if it is not even sustainable on a business level. The interviewee’s perspective gave a refreshing look
at the M&E framework, but was also considered with caution since, although some indicators might
not seem important for a business to thrive, they are still critical to consider for sustainability
considerations on a system level.
All modifications that were suggested for each evaluation category (Area of Sustainability) during the
interview are detailed in Table 7-1 with some additional comments added as well. All
Stellenbosch University https://scholar.sun.ac.za
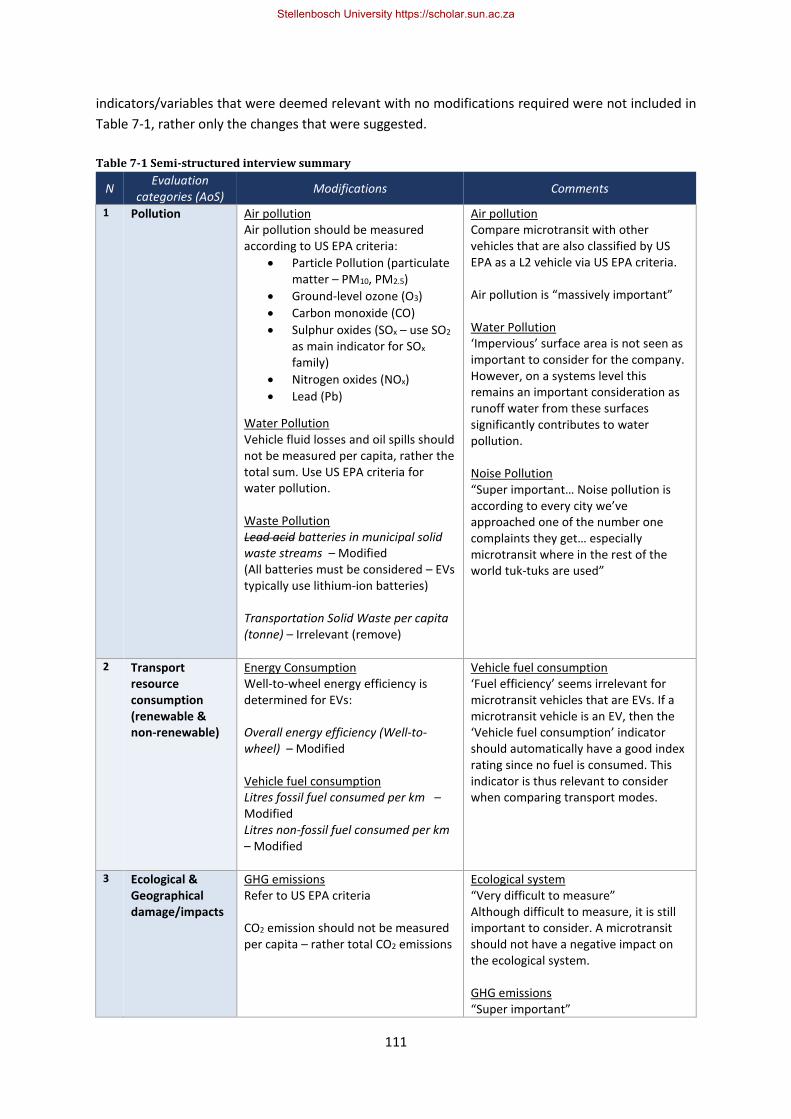
111
indicators/variables that were deemed relevant with no modifications required were not included in
Table 7-1, rather only the changes that were suggested.
Table 7-1 Semi-structured interview summary
N Evaluation
categories (AoS) Modifications Comments
1 Pollution Air pollution Air pollution should be measured according to US EPA criteria:
• Particle Pollution (particulate matter – PM10, PM2.5)
• Ground-level ozone (O3)
• Carbon monoxide (CO)
• Sulphur oxides (SOx – use SO2 as main indicator for SOx family)
• Nitrogen oxides (NOx)
• Lead (Pb)
Water Pollution Vehicle fluid losses and oil spills should not be measured per capita, rather the total sum. Use US EPA criteria for water pollution. Waste Pollution Lead acid batteries in municipal solid waste streams – Modified (All batteries must be considered – EVs typically use lithium-ion batteries) Transportation Solid Waste per capita (tonne) – Irrelevant (remove)
Air pollution Compare microtransit with other vehicles that are also classified by US EPA as a L2 vehicle via US EPA criteria. Air pollution is “massively important” Water Pollution ‘Impervious’ surface area is not seen as important to consider for the company. However, on a systems level this remains an important consideration as runoff water from these surfaces significantly contributes to water pollution. Noise Pollution “Super important… Noise pollution is according to every city we’ve approached one of the number one complaints they get… especially microtransit where in the rest of the world tuk-tuks are used”
2 Transport resource consumption (renewable & non-renewable)
Energy Consumption Well-to-wheel energy efficiency is determined for EVs: Overall energy efficiency (Well-to-wheel) – Modified Vehicle fuel consumption Litres fossil fuel consumed per km – Modified Litres non-fossil fuel consumed per km – Modified
Vehicle fuel consumption ‘Fuel efficiency’ seems irrelevant for microtransit vehicles that are EVs. If a microtransit vehicle is an EV, then the ‘Vehicle fuel consumption’ indicator should automatically have a good index rating since no fuel is consumed. This indicator is thus relevant to consider when comparing transport modes.
3 Ecological & Geographical damage/impacts
GHG emissions Refer to US EPA criteria CO2 emission should not be measured per capita – rather total CO2 emissions
Ecological system “Very difficult to measure” Although difficult to measure, it is still important to consider. A microtransit should not have a negative impact on the ecological system. GHG emissions “Super important”
Stellenbosch University https://scholar.sun.ac.za
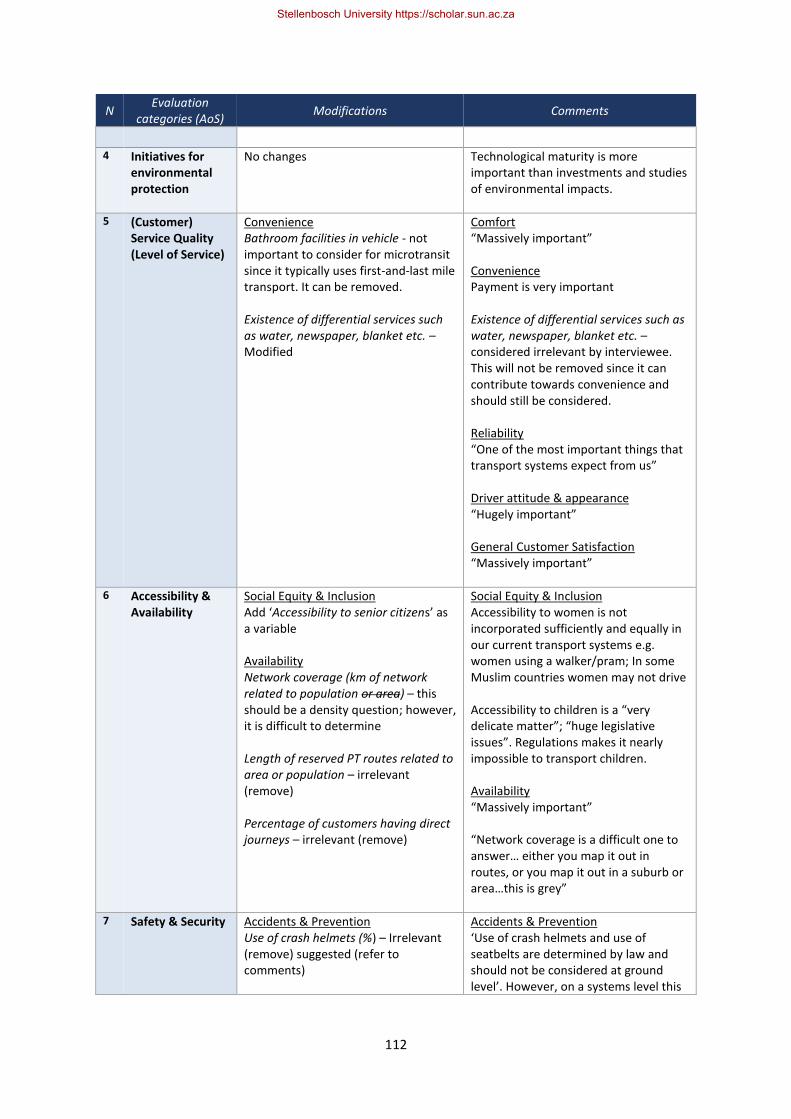
112
N Evaluation
categories (AoS) Modifications Comments
4 Initiatives for environmental protection
No changes
Technological maturity is more important than investments and studies of environmental impacts.
5 (Customer) Service Quality (Level of Service)
Convenience Bathroom facilities in vehicle - not important to consider for microtransit since it typically uses first-and-last mile transport. It can be removed. Existence of differential services such as water, newspaper, blanket etc. – Modified
Comfort “Massively important” Convenience Payment is very important Existence of differential services such as water, newspaper, blanket etc. – considered irrelevant by interviewee. This will not be removed since it can contribute towards convenience and should still be considered. Reliability “One of the most important things that transport systems expect from us” Driver attitude & appearance “Hugely important” General Customer Satisfaction “Massively important”
6 Accessibility & Availability
Social Equity & Inclusion Add ‘Accessibility to senior citizens’ as a variable Availability Network coverage (km of network related to population or area) – this should be a density question; however, it is difficult to determine Length of reserved PT routes related to area or population – irrelevant (remove) Percentage of customers having direct journeys – irrelevant (remove)
Social Equity & Inclusion Accessibility to women is not incorporated sufficiently and equally in our current transport systems e.g. women using a walker/pram; In some Muslim countries women may not drive Accessibility to children is a “very delicate matter”; “huge legislative issues”. Regulations makes it nearly impossible to transport children. Availability “Massively important” “Network coverage is a difficult one to answer… either you map it out in routes, or you map it out in a suburb or area…this is grey”
7 Safety & Security Accidents & Prevention Use of crash helmets (%) – Irrelevant (remove) suggested (refer to comments)
Accidents & Prevention ‘Use of crash helmets and use of seatbelts are determined by law and should not be considered at ground level’. However, on a systems level this
Stellenbosch University https://scholar.sun.ac.za

113
N Evaluation
categories (AoS) Modifications Comments
Passenger's perception of & satisfaction with safety level Feeling secure in transfer & waiting areas – Irrelevant (remove) Number of incidents of property damage and lost property – Modified
might still be important to consider to prevent accidents and injuries. Passenger's perception of & satisfaction with safety level This is amongst the most important to consider. The interviewee indicated that microtransit services have no specific waiting areas which means they cannot be measured and are irrelevant For insurance purposes, driver’s level of capability is important to measure.
8 Government & Community Involvement
Government Interoperability Government performance co-operation – Modified Government financial support – Irrelevant (remove) (This is already considered under Governmental costs (financial feasibility)
Government Interoperability “Historically, governments don’t really support first-and-last-mile systems”. For a private company evaluating its sustainability performance, whether government provides financial support will not affect its sustainability. However, government co-operation and legislative concerns will influence its sustainability.
9 Mobility (Travel & Transfer)
Speed Average speed of using NMT service before getting to stop/pick-up/drop-off point – Irrelevant (remove) Modal split/Transit integration Adequacy of NMT services near transit system – Irrelevant (remove) General mobility Number of trips per vehicle per day – Modified Overall ease of making transfers
Modal split/Transit integration “Important when doing reporting to the city” General mobility Contribution to a reduction in congestion “is probably one of the most important (factors to consider for general mobility)”
10 Financial Perspective
Governmental costs (Financial feasibility) If the microtransit company is a private company and not supported by government, then this indicator along with all its variables is not important to consider since it will not affect its sustainability. In such a case, these are irrelevant and can be removed. Since sustainability needs to be considered on a systems level, these will still be included since, for the system to work, it must still be financially feasible from
Governmental costs (Financial feasibility) “We don’t measure this… but the system does” Costs to (private) company (Financial feasibility) Especially for EVs operating and maintenance costs are very important: “EVs are very cheap to operate… we operate now at 9c per kilometre”
Stellenbosch University https://scholar.sun.ac.za
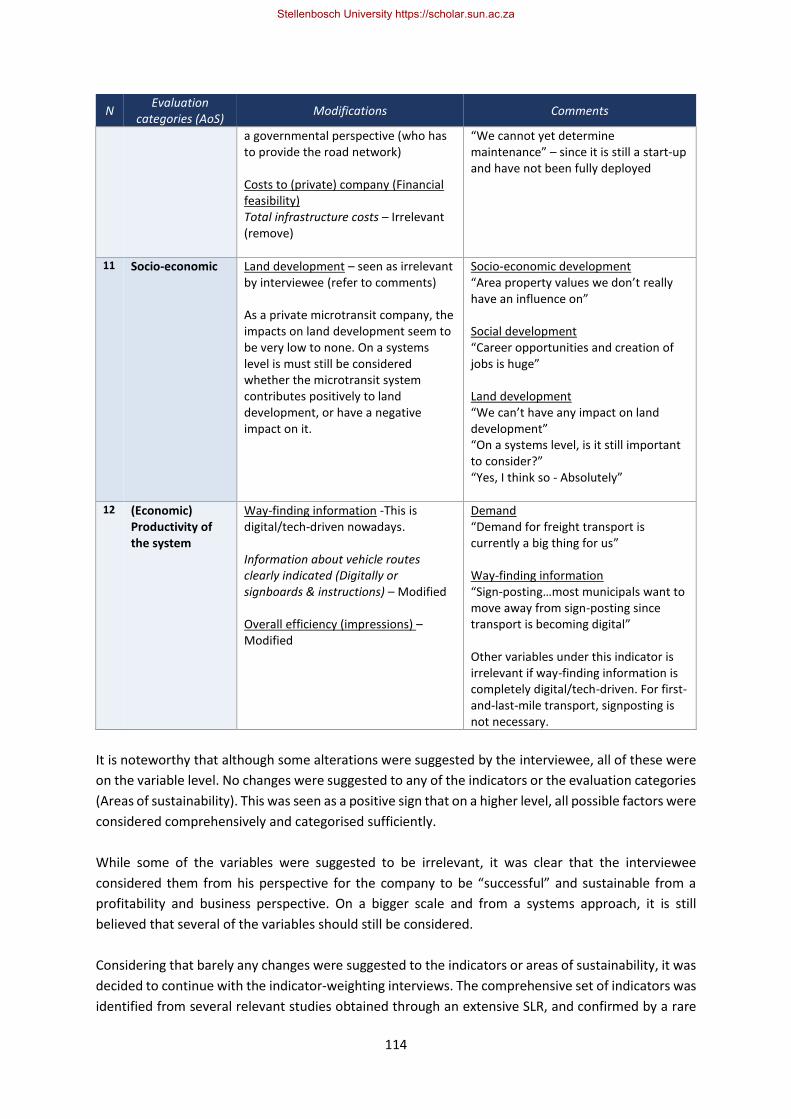
114
N Evaluation
categories (AoS) Modifications Comments
a governmental perspective (who has to provide the road network) Costs to (private) company (Financial feasibility) Total infrastructure costs – Irrelevant (remove)
“We cannot yet determine maintenance” – since it is still a start-up and have not been fully deployed
11 Socio-economic Land development – seen as irrelevant by interviewee (refer to comments) As a private microtransit company, the impacts on land development seem to be very low to none. On a systems level is must still be considered whether the microtransit system contributes positively to land development, or have a negative impact on it.
Socio-economic development “Area property values we don’t really have an influence on” Social development “Career opportunities and creation of jobs is huge” Land development “We can’t have any impact on land development” “On a systems level, is it still important to consider?” “Yes, I think so - Absolutely”
12 (Economic) Productivity of the system
Way-finding information -This is digital/tech-driven nowadays. Information about vehicle routes clearly indicated (Digitally or signboards & instructions) – Modified Overall efficiency (impressions) – Modified
Demand “Demand for freight transport is currently a big thing for us” Way-finding information “Sign-posting…most municipals want to move away from sign-posting since transport is becoming digital” Other variables under this indicator is irrelevant if way-finding information is completely digital/tech-driven. For first-and-last-mile transport, signposting is not necessary.
It is noteworthy that although some alterations were suggested by the interviewee, all of these were
on the variable level. No changes were suggested to any of the indicators or the evaluation categories
(Areas of sustainability). This was seen as a positive sign that on a higher level, all possible factors were
considered comprehensively and categorised sufficiently.
While some of the variables were suggested to be irrelevant, it was clear that the interviewee
considered them from his perspective for the company to be “successful” and sustainable from a
profitability and business perspective. On a bigger scale and from a systems approach, it is still
believed that several of the variables should still be considered.
Considering that barely any changes were suggested to the indicators or areas of sustainability, it was
decided to continue with the indicator-weighting interviews. The comprehensive set of indicators was
identified from several relevant studies obtained through an extensive SLR, and confirmed by a rare
Stellenbosch University https://scholar.sun.ac.za
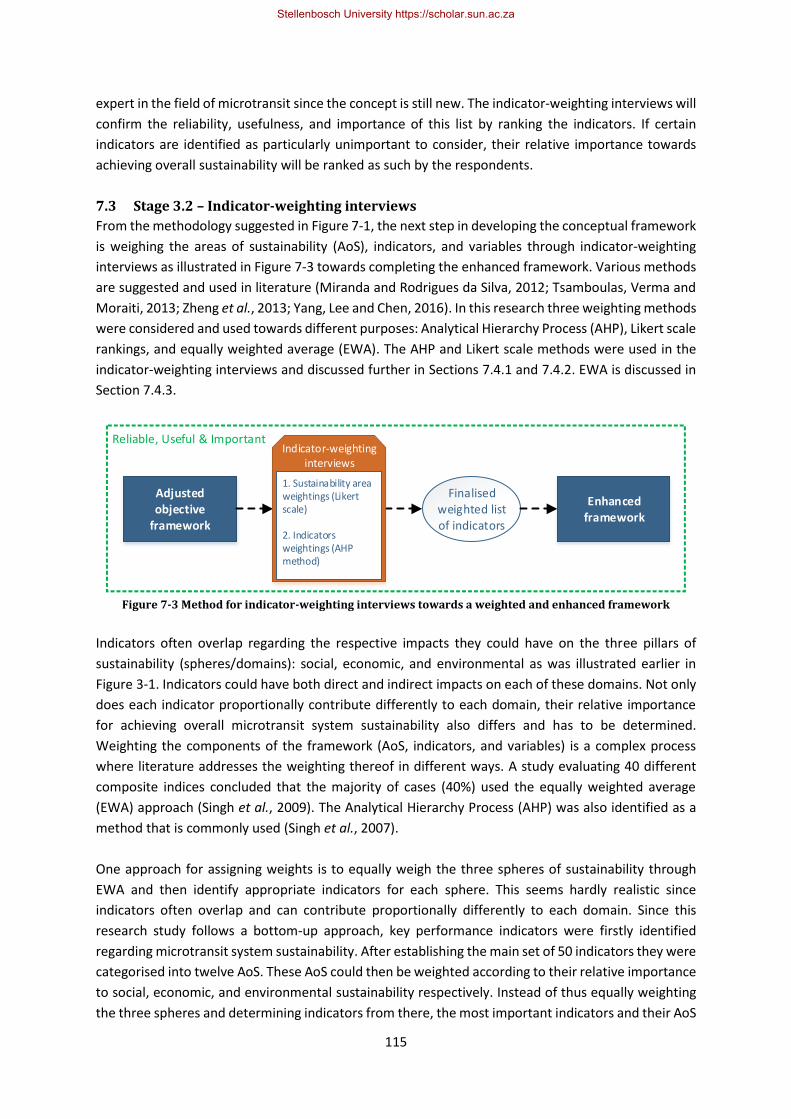
115
expert in the field of microtransit since the concept is still new. The indicator-weighting interviews will
confirm the reliability, usefulness, and importance of this list by ranking the indicators. If certain
indicators are identified as particularly unimportant to consider, their relative importance towards
achieving overall sustainability will be ranked as such by the respondents.
7.3 Stage 3.2 – Indicator-weighting interviews
From the methodology suggested in Figure 7-1, the next step in developing the conceptual framework
is weighing the areas of sustainability (AoS), indicators, and variables through indicator-weighting
interviews as illustrated in Figure 7-3 towards completing the enhanced framework. Various methods
are suggested and used in literature (Miranda and Rodrigues da Silva, 2012; Tsamboulas, Verma and
Moraiti, 2013; Zheng et al., 2013; Yang, Lee and Chen, 2016). In this research three weighting methods
were considered and used towards different purposes: Analytical Hierarchy Process (AHP), Likert scale
rankings, and equally weighted average (EWA). The AHP and Likert scale methods were used in the
indicator-weighting interviews and discussed further in Sections 7.4.1 and 7.4.2. EWA is discussed in
Section 7.4.3.
Adjusted objective
framework
Finalised weighted list of indicators
Reliable, Useful & ImportantIndicator-weighting
interviews
1. Sustainability area weightings (Likert scale)
2. Indicators weightings (AHP method)
Enhanced framework
Figure 7-3 Method for indicator-weighting interviews towards a weighted and enhanced framework
Indicators often overlap regarding the respective impacts they could have on the three pillars of
sustainability (spheres/domains): social, economic, and environmental as was illustrated earlier in
Figure 3-1. Indicators could have both direct and indirect impacts on each of these domains. Not only
does each indicator proportionally contribute differently to each domain, their relative importance
for achieving overall microtransit system sustainability also differs and has to be determined.
Weighting the components of the framework (AoS, indicators, and variables) is a complex process
where literature addresses the weighting thereof in different ways. A study evaluating 40 different
composite indices concluded that the majority of cases (40%) used the equally weighted average
(EWA) approach (Singh et al., 2009). The Analytical Hierarchy Process (AHP) was also identified as a
method that is commonly used (Singh et al., 2007).
One approach for assigning weights is to equally weigh the three spheres of sustainability through
EWA and then identify appropriate indicators for each sphere. This seems hardly realistic since
indicators often overlap and can contribute proportionally differently to each domain. Since this
research study follows a bottom-up approach, key performance indicators were firstly identified
regarding microtransit system sustainability. After establishing the main set of 50 indicators they were
categorised into twelve AoS. These AoS could then be weighted according to their relative importance
to social, economic, and environmental sustainability respectively. Instead of thus equally weighting
the three spheres and determining indicators from there, the most important indicators and their AoS
Stellenbosch University https://scholar.sun.ac.za
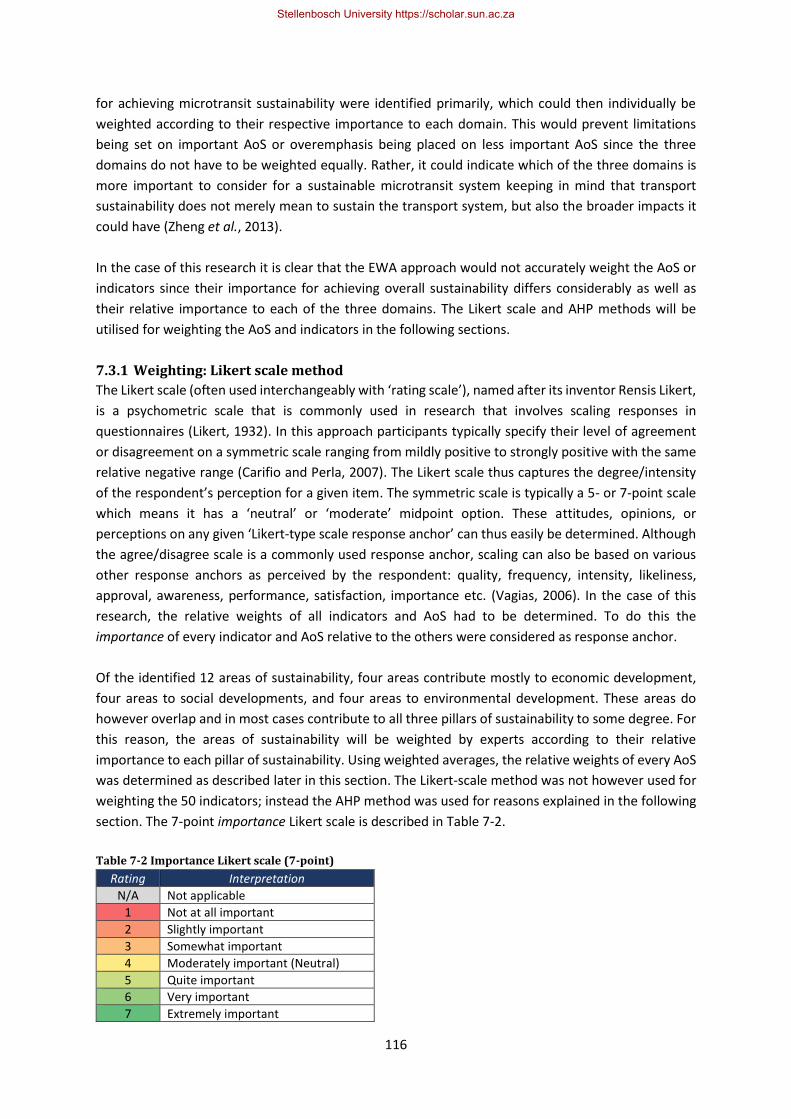
116
for achieving microtransit sustainability were identified primarily, which could then individually be
weighted according to their respective importance to each domain. This would prevent limitations
being set on important AoS or overemphasis being placed on less important AoS since the three
domains do not have to be weighted equally. Rather, it could indicate which of the three domains is
more important to consider for a sustainable microtransit system keeping in mind that transport
sustainability does not merely mean to sustain the transport system, but also the broader impacts it
could have (Zheng et al., 2013).
In the case of this research it is clear that the EWA approach would not accurately weight the AoS or
indicators since their importance for achieving overall sustainability differs considerably as well as
their relative importance to each of the three domains. The Likert scale and AHP methods will be
utilised for weighting the AoS and indicators in the following sections.
7.3.1 Weighting: Likert scale method
The Likert scale (often used interchangeably with ‘rating scale’), named after its inventor Rensis Likert,
is a psychometric scale that is commonly used in research that involves scaling responses in
questionnaires (Likert, 1932). In this approach participants typically specify their level of agreement
or disagreement on a symmetric scale ranging from mildly positive to strongly positive with the same
relative negative range (Carifio and Perla, 2007). The Likert scale thus captures the degree/intensity
of the respondent’s perception for a given item. The symmetric scale is typically a 5- or 7-point scale
which means it has a ‘neutral’ or ‘moderate’ midpoint option. These attitudes, opinions, or
perceptions on any given ‘Likert-type scale response anchor’ can thus easily be determined. Although
the agree/disagree scale is a commonly used response anchor, scaling can also be based on various
other response anchors as perceived by the respondent: quality, frequency, intensity, likeliness,
approval, awareness, performance, satisfaction, importance etc. (Vagias, 2006). In the case of this
research, the relative weights of all indicators and AoS had to be determined. To do this the
importance of every indicator and AoS relative to the others were considered as response anchor.
Of the identified 12 areas of sustainability, four areas contribute mostly to economic development,
four areas to social developments, and four areas to environmental development. These areas do
however overlap and in most cases contribute to all three pillars of sustainability to some degree. For
this reason, the areas of sustainability will be weighted by experts according to their relative
importance to each pillar of sustainability. Using weighted averages, the relative weights of every AoS
was determined as described later in this section. The Likert-scale method was not however used for
weighting the 50 indicators; instead the AHP method was used for reasons explained in the following
section. The 7-point importance Likert scale is described in Table 7-2.
Table 7-2 Importance Likert scale (7-point)
Rating Interpretation
N/A Not applicable
1 Not at all important
2 Slightly important
3 Somewhat important
4 Moderately important (Neutral)
5 Quite important
6 Very important
7 Extremely important
Stellenbosch University https://scholar.sun.ac.za
117
For every survey, 𝑆, a Likert scale rating, 𝑟, will be obtained for all three domains (soc, env, eco) of
every AoS, 𝑁 regarding the relative importance of every AoS to each domain:
𝑟𝑆,𝑁,𝑠𝑜𝑐 = 𝑠𝑜𝑐𝑖𝑎𝑙 𝑟𝑎𝑡𝑖𝑛𝑔 𝑏𝑒𝑡𝑤𝑒𝑒𝑛 1 𝑎𝑛𝑑 7 (𝑜𝑟 0 𝑓𝑜𝑟 𝑁/𝐴)
𝑟𝑆,𝑁,𝑒𝑛𝑣 = 𝑒𝑛𝑣𝑖𝑟𝑜𝑛𝑚𝑒𝑛𝑡𝑎𝑙 𝑟𝑎𝑡𝑖𝑛𝑔 𝑏𝑒𝑡𝑤𝑒𝑒𝑛 1 𝑎𝑛𝑑 7 (𝑜𝑟 0 𝑓𝑜𝑟 𝑁/𝐴)
𝑟𝑆,𝑁,𝑒𝑐𝑜 = 𝑒𝑐𝑜𝑛𝑜𝑚𝑖𝑐 𝑟𝑎𝑡𝑖𝑛𝑔 𝑏𝑒𝑡𝑤𝑒𝑒𝑛 1 𝑎𝑛𝑑 7 (𝑜𝑟 0 𝑓𝑜𝑟 𝑁/𝐴)
where ‘S’ is survery number ranging from 1 to 7
and ‘N’ is AoS ranging from 1 to 12
These ratings are summed to obtain a total for every AoS, 𝑁, per survey, 𝑆:
𝑟𝑆,𝑁,𝑡𝑜𝑡𝑎𝑙 = 𝑟𝑆,𝑁,𝑠𝑜𝑐 + 𝑟𝑆,𝑁,𝑒𝑛𝑣 + 𝑟𝑆,𝑁,𝑒𝑐𝑜
These ratings are used to determine weights, 𝑊, for all three domains of every AoS, 𝑁, per survey, 𝑆:
𝑊𝑆,𝑁,𝑠𝑜𝑐 = 𝑟𝑆,𝑁,𝑠𝑜𝑐 / 𝑟𝑆,𝑁,𝑡𝑜𝑡𝑎𝑙
𝑊𝑆,𝑁,𝑒𝑛𝑣 = 𝑟𝑆,𝑁,𝑒𝑛𝑣 / 𝑟𝑆,𝑁,𝑡𝑜𝑡𝑎𝑙
𝑊𝑆,𝑁,𝑒𝑐𝑜 = 𝑟𝑆,𝑁,𝑒𝑐𝑜 / 𝑟𝑆,𝑁,𝑡𝑜𝑡𝑎𝑙
The overall proportional weights that each AoS, 𝑁, contribute to the three domains respectively are
determined by taking the average from all surveys:
𝑊𝑁,𝑠𝑜𝑐 =∑ (𝑊𝑆,𝑁,𝑠𝑜𝑐𝑆 )
𝑆
𝑊𝑁,𝑒𝑛𝑣 =∑ (𝑊𝑆,𝑁,𝑒𝑛𝑣𝑆 )
𝑆
𝑊𝑁,𝑒𝑐𝑜 =∑ (𝑊𝑆,𝑁,𝑒𝑐𝑜𝑆 )
𝑆
The sum of the three domain ratings for every AoS, 𝑁, per survey, 𝑆, can be divided by the sum of all
ratings obtained for all AoS in order to determine the relative weightings, 𝑊1,𝑆,𝑁, of each AoS per
survey:
𝑊1,𝑆,𝑁 =𝑟𝑆,𝑁,𝑡𝑜𝑡𝑎𝑙
∑ (𝑟𝑆,𝑁,𝑡𝑜𝑡𝑎𝑙)𝑁
The above calculations used the Likert scale ratings assigned to the three domains of sustainability in
order to determine weightings for every AoS. This is one way to determine weightings for every AoS.
Another approach could be to obtain Likert scale ratings, 𝑟, directly for every AoS regarding its
importance for overall sustainability. This will enable the interviewee to assign ratings, 𝑟, according to
which AoS he/she believes is more important for overall sustainability relative to the others:
𝑟𝑆,𝑁,𝑠𝑢𝑠𝑡 = 𝑟𝑎𝑡𝑖𝑛𝑔 𝑏𝑒𝑡𝑤𝑒𝑒𝑛 1 𝑎𝑛𝑑 7 (𝑜𝑟 0 𝑓𝑜𝑟 𝑁/𝐴)
These ratings could then be divided by their sum in order to determine weightings for every AoS per
survey (weighted average):
𝑊2,𝑆,𝑁 =𝑟𝑆,𝑁,𝑠𝑢𝑠𝑡
∑ (𝑟𝑆,𝑁,𝑠𝑢𝑠𝑡)𝑁
Stellenbosch University https://scholar.sun.ac.za
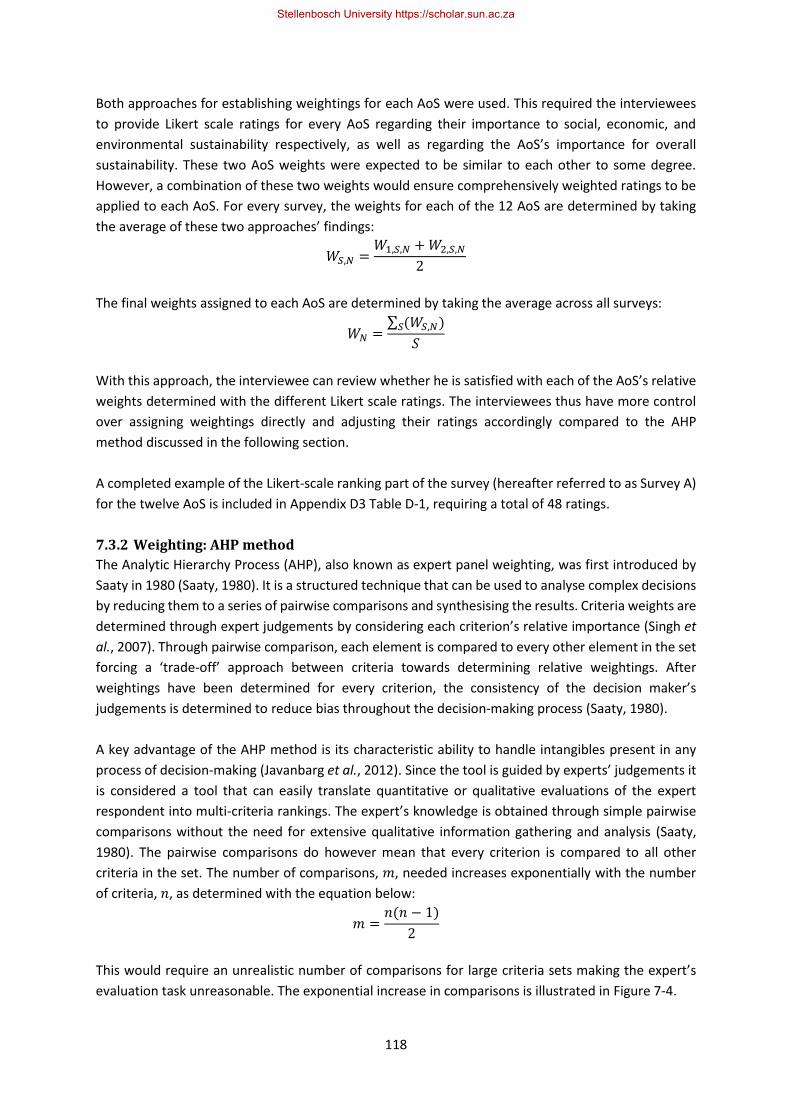
118
Both approaches for establishing weightings for each AoS were used. This required the interviewees
to provide Likert scale ratings for every AoS regarding their importance to social, economic, and
environmental sustainability respectively, as well as regarding the AoS’s importance for overall
sustainability. These two AoS weights were expected to be similar to each other to some degree.
However, a combination of these two weights would ensure comprehensively weighted ratings to be
applied to each AoS. For every survey, the weights for each of the 12 AoS are determined by taking
the average of these two approaches’ findings:
𝑊𝑆,𝑁 =𝑊1,𝑆,𝑁 + 𝑊2,𝑆,𝑁
2
The final weights assigned to each AoS are determined by taking the average across all surveys:
𝑊𝑁 =∑ (𝑊𝑆,𝑁𝑆 )
𝑆
With this approach, the interviewee can review whether he is satisfied with each of the AoS’s relative
weights determined with the different Likert scale ratings. The interviewees thus have more control
over assigning weightings directly and adjusting their ratings accordingly compared to the AHP
method discussed in the following section.
A completed example of the Likert-scale ranking part of the survey (hereafter referred to as Survey A)
for the twelve AoS is included in Appendix D3 Table D-1, requiring a total of 48 ratings.
7.3.2 Weighting: AHP method
The Analytic Hierarchy Process (AHP), also known as expert panel weighting, was first introduced by
Saaty in 1980 (Saaty, 1980). It is a structured technique that can be used to analyse complex decisions
by reducing them to a series of pairwise comparisons and synthesising the results. Criteria weights are
determined through expert judgements by considering each criterion’s relative importance (Singh et
al., 2007). Through pairwise comparison, each element is compared to every other element in the set
forcing a ‘trade-off’ approach between criteria towards determining relative weightings. After
weightings have been determined for every criterion, the consistency of the decision maker’s
judgements is determined to reduce bias throughout the decision-making process (Saaty, 1980).
A key advantage of the AHP method is its characteristic ability to handle intangibles present in any
process of decision-making (Javanbarg et al., 2012). Since the tool is guided by experts’ judgements it
is considered a tool that can easily translate quantitative or qualitative evaluations of the expert
respondent into multi-criteria rankings. The expert’s knowledge is obtained through simple pairwise
comparisons without the need for extensive qualitative information gathering and analysis (Saaty,
1980). The pairwise comparisons do however mean that every criterion is compared to all other
criteria in the set. The number of comparisons, 𝑚, needed increases exponentially with the number
of criteria, 𝑛, as determined with the equation below:
𝑚 =𝑛(𝑛 − 1)
2
This would require an unrealistic number of comparisons for large criteria sets making the expert’s
evaluation task unreasonable. The exponential increase in comparisons is illustrated in Figure 7-4.
Stellenbosch University https://scholar.sun.ac.za
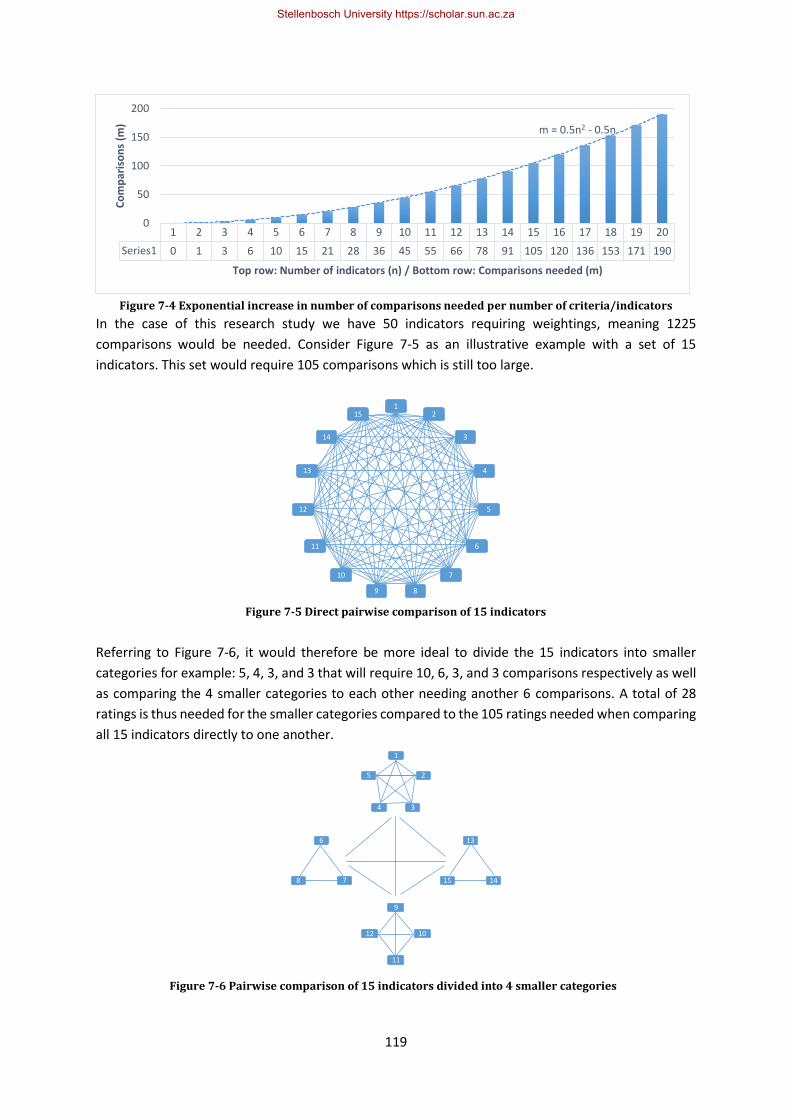
119
Figure 7-4 Exponential increase in number of comparisons needed per number of criteria/indicators
In the case of this research study we have 50 indicators requiring weightings, meaning 1225
comparisons would be needed. Consider Figure 7-5 as an illustrative example with a set of 15
indicators. This set would require 105 comparisons which is still too large.
Referring to Figure 7-6, it would therefore be more ideal to divide the 15 indicators into smaller
categories for example: 5, 4, 3, and 3 that will require 10, 6, 3, and 3 comparisons respectively as well
as comparing the 4 smaller categories to each other needing another 6 comparisons. A total of 28
ratings is thus needed for the smaller categories compared to the 105 ratings needed when comparing
all 15 indicators directly to one another.
1 2 3 4 5 6 7 8 9 10 11 12 13 14 15 16 17 18 19 20
Series1 0 1 3 6 10 15 21 28 36 45 55 66 78 91 105 120 136 153 171 190
m = 0.5n2 - 0.5n
0
50
100
150
200C
om
par
iso
ns
(m)
Top row: Number of indicators (n) / Bottom row: Comparisons needed (m)
12
3
4
5
6
7
89
10
11
12
13
14
15
1
2
34
5
13
1415
9
10
11
12
6
78
Figure 7-5 Direct pairwise comparison of 15 indicators
Figure 7-6 Pairwise comparison of 15 indicators divided into 4 smaller categories
Stellenbosch University https://scholar.sun.ac.za

120
The comparative approach of the AHP method is thus only useful and practical with smaller sets of
criteria/indicators (say < 10) within a category since each indicator has to be compared relative to all
other indicators in that category. Considering the above example, the number of categories can thus
also increase substantially when all indicators are split into smaller groups. The categories should thus
rather be compared with another method (Likert-scale) than the AHP method since pairwise
comparison becomes exponentially more impractical for larger sets. In the case of this research, the
50 indicators were categorised into 12 AoS. Due to too many comparisons required by the AHP
method and the Likert-scale’s ability to assign weights more directly, the 12 AoS were weighted using
a Likert-scale. It would thus be more feasible for experts to assign direct importance ratings to the AoS
based on their relative importance to environmental, social, and economic sustainability respectively
as well as the overall sustainability. Table 7-3 summarises the number of comparisons needed per AoS
for this research using the AHP method.
Table 7-3 Number of comparisons needed per AoS
N AoS/Evaluation category Number of
indicators (n)
Comparisons
needed (m)
1 Pollution 5 10
2 Transport resource consumption (renewable & nonrenewable) 3 3
3 Ecological & Geographical damage/impacts 3 3
4 Initiatives for environmental protection 3 3
5 (Customer) Service Quality (Level of Service) 6 15
6 Accessibility & Availability 4 6
7 Safety & Security 6 15
8 Government & Community Involvement 2 1
9 Mobility (Travel & Transfer) 5 10
10 Financial Perspective 4 6
11 Socio-economic 3 3
12 (Economic) Productivity of the system 6 15
Total 50 90
The AHP method for determining the relative weights for the indicators in each AoS is determined by
implementing the following steps:
i. Computing the vector of criteria weights:
A pairwise comparison 𝑛 x 𝑛 matrix, 𝑨, is created with its entries, 𝑎𝑖𝑗, representing the relative
importance of the 𝑖𝑡ℎ criterion to the 𝑗𝑡ℎ criterion (𝑎𝑖𝑗 denotes the entry in the 𝑖𝑡ℎ row and the 𝑗𝑡ℎ
column). For 𝑎𝑖𝑗 > 1 the 𝑖𝑡ℎ criterion is more important than the 𝑗𝑡ℎ criterion and vice versa for 𝑎𝑖𝑗 <
1. For 𝑎𝑖𝑗 = 1, the criteria are equally important. The following constraint is true for 𝑎𝑖𝑗 and 𝑎𝑗𝑖:
𝑎𝑖𝑗 ⋅ 𝑎𝑗𝑖 = 1
The numerical scale in Table 7-4 illustrates the degree of importance for two criteria relative to each
other for 𝑖 equally or more important than 𝑗. Although the interpretations are based on odd numbers
(1, 3, 5, 7, and 9) intermediate values not corresponding to a specific interpretation can also be
provided.
Table 7-4 Relative importance ratings for AHP
Value of aij Interpretation
1 Equally important
Stellenbosch University https://scholar.sun.ac.za
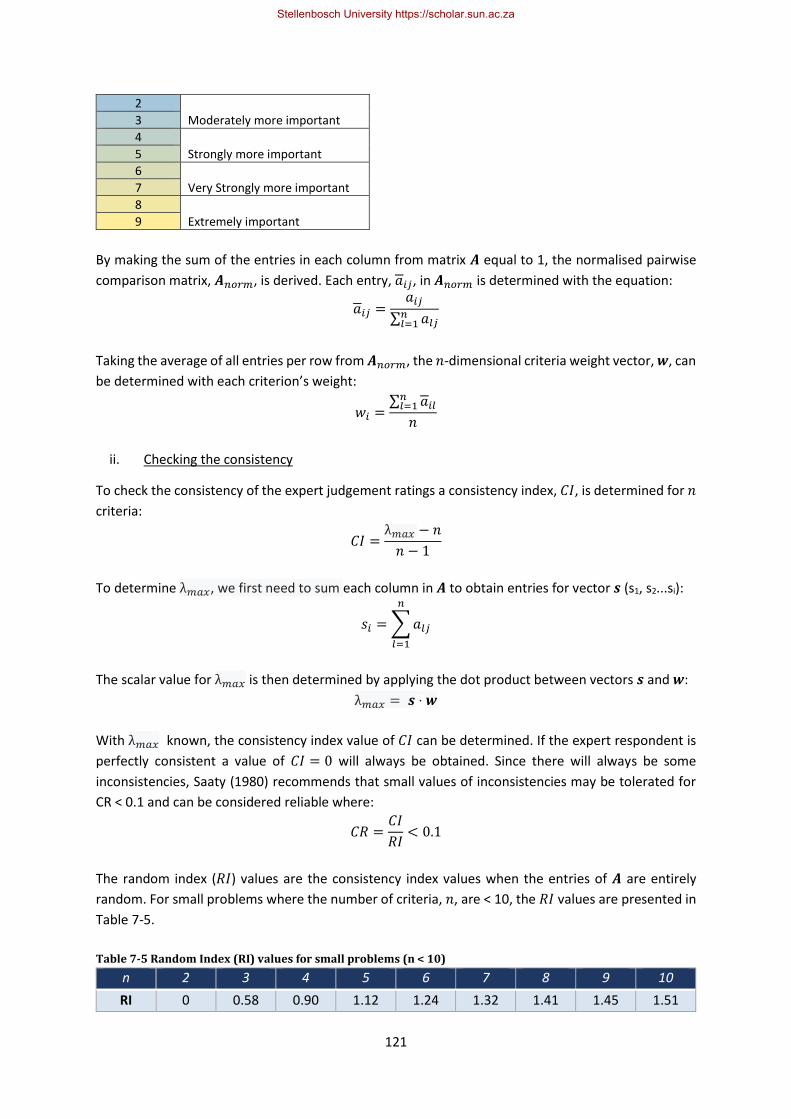
121
2
Moderately more important 3
4
Strongly more important 5
6
Very Strongly more important 7
8
Extremely important 9
By making the sum of the entries in each column from matrix 𝑨 equal to 1, the normalised pairwise
comparison matrix, 𝑨𝑛𝑜𝑟𝑚, is derived. Each entry, 𝑎𝑖𝑗, in 𝑨𝑛𝑜𝑟𝑚 is determined with the equation:
𝑎𝑖𝑗 =𝑎𝑖𝑗
∑ 𝑎𝑙𝑗𝑛𝑙=1
Taking the average of all entries per row from 𝑨𝑛𝑜𝑟𝑚, the 𝑛-dimensional criteria weight vector, 𝒘, can
be determined with each criterion’s weight:
𝑤𝑖 =∑ 𝑎𝑖𝑙
𝑛𝑙=1
𝑛
ii. Checking the consistency
To check the consistency of the expert judgement ratings a consistency index, 𝐶𝐼, is determined for 𝑛
criteria:
𝐶𝐼 =λ𝑚𝑎𝑥 − 𝑛
𝑛 − 1
To determine λ𝑚𝑎𝑥, we first need to sum each column in 𝑨 to obtain entries for vector 𝒔 (s1, s2...si):
𝑠𝑖 = ∑ 𝑎𝑙𝑗
𝑛
𝑙=1
The scalar value for λ𝑚𝑎𝑥 is then determined by applying the dot product between vectors 𝒔 and 𝒘:
λ𝑚𝑎𝑥 = 𝒔 ⋅ 𝒘
With λ𝑚𝑎𝑥 known, the consistency index value of 𝐶𝐼 can be determined. If the expert respondent is
perfectly consistent a value of 𝐶𝐼 = 0 will always be obtained. Since there will always be some
inconsistencies, Saaty (1980) recommends that small values of inconsistencies may be tolerated for
CR < 0.1 and can be considered reliable where:
𝐶𝑅 =𝐶𝐼
𝑅𝐼< 0.1
The random index (𝑅𝐼) values are the consistency index values when the entries of 𝑨 are entirely
random. For small problems where the number of criteria, 𝑛, are < 10, the 𝑅𝐼 values are presented in
Table 7-5.
Table 7-5 Random Index (RI) values for small problems (n < 10)
n 2 3 4 5 6 7 8 9 10
RI 0 0.58 0.90 1.12 1.24 1.32 1.41 1.45 1.51
Stellenbosch University https://scholar.sun.ac.za
122
Following this approach of determining weights and checking their consistencies were done for each
set of indicators of every AoS in this research project. Using Microsoft Excel during the indicator-
weighting interviews for answering the AHP survey enabled the researcher to determine and provide
𝐶𝑅 values for each AoS immediately after it has been entered. The experts thus had to adjust their
importance ratings if 𝐶𝑅 > 0.1 until they obtained a 𝐶𝑅 value below 0.1 for every AoS to ensure
consistency.
A completed example of the AHP weighting part of the survey (hereafter referred to as Survey B) for
the 50 indicators is included in Appendix D3 Table D-2.
7.3.3 Weighting: EWA Method
After establishing methods for ranking the AoS and indicator components, the variables remain to be
weighted. Neither the Likert scale method nor the AHP method would be realistic to assign weightings
during interviews since 188 variables would need to be weighted. Referring to Figure 7-4 it is clear
that the AHP method would be unrealistic since the exponential increase in comparisons needed per
number of variables would mean that 188 variables require 17 578 comparisons. If the Likert scale
method is used this would still require 188 ratings in the interview after 48 Likert-scale ratings have
already been given to the AoS and 90 pairwise comparison ratings have been given to the indicators.
Assigning weightings to each of the variables would not be possible due to the increase in length of
the surveys it will cause and the time-consuming interview process compared to what can realistically
be expected from expert interviewees while still obtaining accurate results. Interviewees might start
rushing through the survey if it is too extensive, risking the quality of the results.
Establishing accurate weightings for the AoS and the indicators is considered more critical than that
of the variables. These two components make up the skeleton that accurately indicates what factors
are most important for achieving overall sustainability. Due to this reason and the fact that the
majority of research studies concerning composite indices use the equally weighted average (EWA)
approach (Singh et al., 2009) where variables for determining a certain indicator are merely given
equal weights, the variables for each indicator in this study will be weighted according to the EWA
approach.
Even though it is believed that variables are not necessarily equally important for determining
indicator values, weighting each one is considered a trivial task especially since the variables can easily
change. The variables are not set in stone, rather the AoS and indicators are designed to represent the
concrete conceptual framework to which variables can be added, removed, or modified so that it can
be used as a management tool. It is believed that the most effective variables for determining each
indicator require additional research and would be clarified once the conceptual framework has been
applied on several fully deployed microtransit systems. The EWA method thus simplifies the addition
or removal of variables since they can easily be re-weighted without requiring expert interviews.
7.3.4 Interview results and analysis
While the AHP can be applied to large groups of respondents it is typically applied to smaller groups
of respondents considered experts in the field being researched. Several studies reported findings
from the AHP research that were based on small groups of experts: five respondents (Peterson, Silsbee
Stellenbosch University https://scholar.sun.ac.za
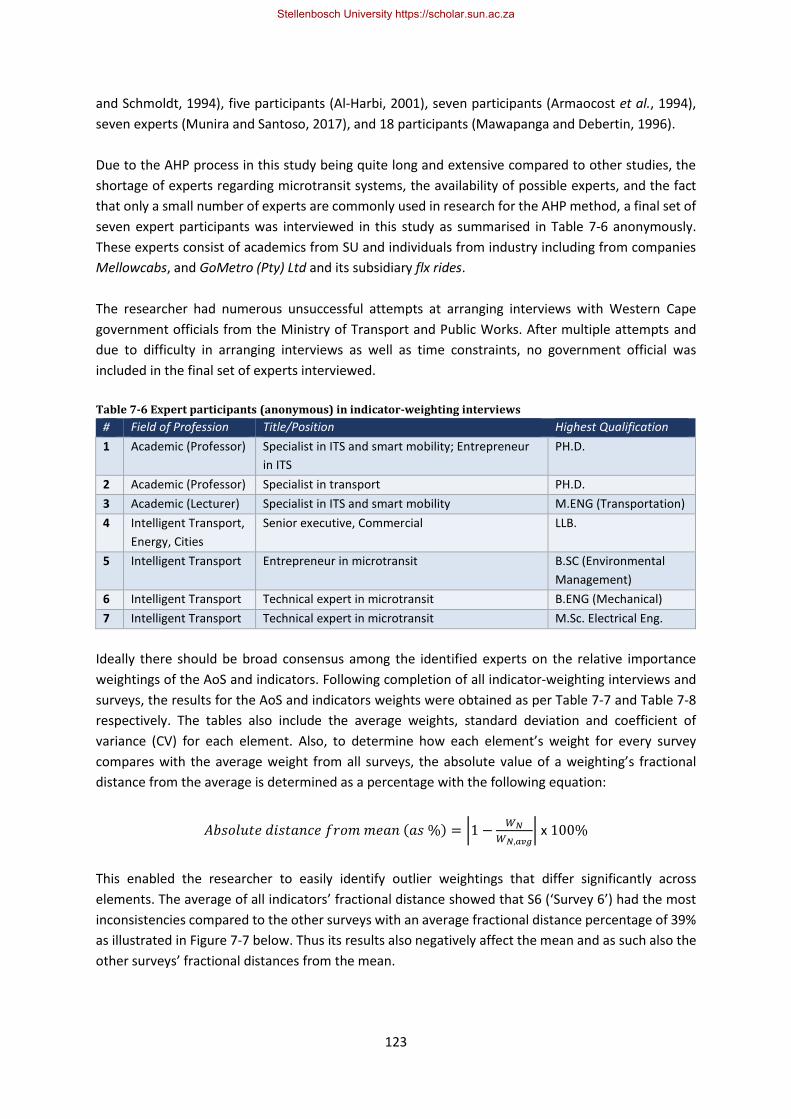
123
and Schmoldt, 1994), five participants (Al-Harbi, 2001), seven participants (Armaocost et al., 1994),
seven experts (Munira and Santoso, 2017), and 18 participants (Mawapanga and Debertin, 1996).
Due to the AHP process in this study being quite long and extensive compared to other studies, the
shortage of experts regarding microtransit systems, the availability of possible experts, and the fact
that only a small number of experts are commonly used in research for the AHP method, a final set of
seven expert participants was interviewed in this study as summarised in Table 7-6 anonymously.
These experts consist of academics from SU and individuals from industry including from companies
Mellowcabs, and GoMetro (Pty) Ltd and its subsidiary flx rides.
The researcher had numerous unsuccessful attempts at arranging interviews with Western Cape
government officials from the Ministry of Transport and Public Works. After multiple attempts and
due to difficulty in arranging interviews as well as time constraints, no government official was
included in the final set of experts interviewed.
Table 7-6 Expert participants (anonymous) in indicator-weighting interviews
# Field of Profession Title/Position Highest Qualification
1 Academic (Professor) Specialist in ITS and smart mobility; Entrepreneur
in ITS
PH.D.
2 Academic (Professor) Specialist in transport PH.D.
3 Academic (Lecturer) Specialist in ITS and smart mobility M.ENG (Transportation)
4 Intelligent Transport,
Energy, Cities
Senior executive, Commercial LLB.
5 Intelligent Transport Entrepreneur in microtransit B.SC (Environmental
Management)
6 Intelligent Transport Technical expert in microtransit B.ENG (Mechanical)
7 Intelligent Transport Technical expert in microtransit M.Sc. Electrical Eng.
Ideally there should be broad consensus among the identified experts on the relative importance
weightings of the AoS and indicators. Following completion of all indicator-weighting interviews and
surveys, the results for the AoS and indicators weights were obtained as per Table 7-7 and Table 7-8
respectively. The tables also include the average weights, standard deviation and coefficient of
variance (CV) for each element. Also, to determine how each element’s weight for every survey
compares with the average weight from all surveys, the absolute value of a weighting’s fractional
distance from the average is determined as a percentage with the following equation:
𝐴𝑏𝑠𝑜𝑙𝑢𝑡𝑒 𝑑𝑖𝑠𝑡𝑎𝑛𝑐𝑒 𝑓𝑟𝑜𝑚 𝑚𝑒𝑎𝑛 (𝑎𝑠 %) = |1 −𝑊𝑁
𝑊𝑁,𝑎𝑣𝑔| x 100%
This enabled the researcher to easily identify outlier weightings that differ significantly across
elements. The average of all indicators’ fractional distance showed that S6 (‘Survey 6’) had the most
inconsistencies compared to the other surveys with an average fractional distance percentage of 39%
as illustrated in Figure 7-7 below. Thus its results also negatively affect the mean and as such also the
other surveys’ fractional distances from the mean.
Stellenbosch University https://scholar.sun.ac.za
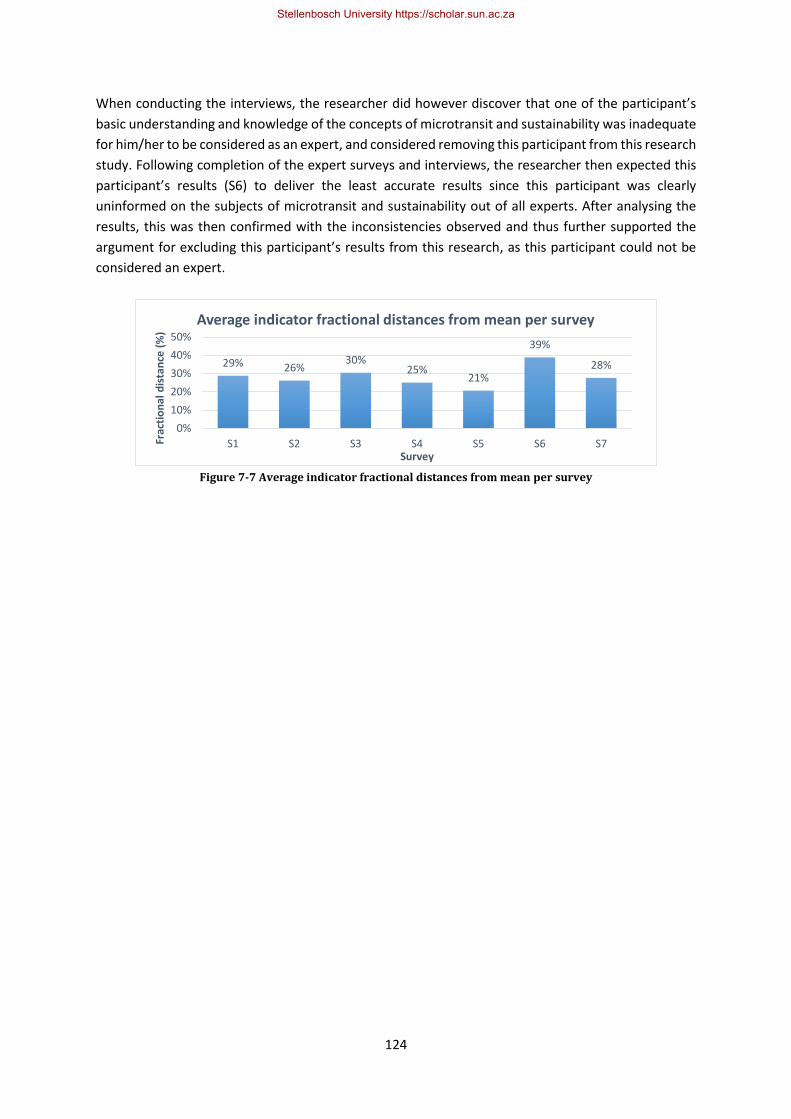
124
When conducting the interviews, the researcher did however discover that one of the participant’s
basic understanding and knowledge of the concepts of microtransit and sustainability was inadequate
for him/her to be considered as an expert, and considered removing this participant from this research
study. Following completion of the expert surveys and interviews, the researcher then expected this
participant’s results (S6) to deliver the least accurate results since this participant was clearly
uninformed on the subjects of microtransit and sustainability out of all experts. After analysing the
results, this was then confirmed with the inconsistencies observed and thus further supported the
argument for excluding this participant’s results from this research, as this participant could not be
considered an expert.
Figure 7-7 Average indicator fractional distances from mean per survey
29% 26%30%
25%21%
39%
28%
0%
10%
20%
30%
40%
50%
S1 S2 S3 S4 S5 S6 S7Frac
tio
nal
dis
tan
ce (
%)
Survey
Average indicator fractional distances from mean per survey
Stellenbosch University https://scholar.sun.ac.za
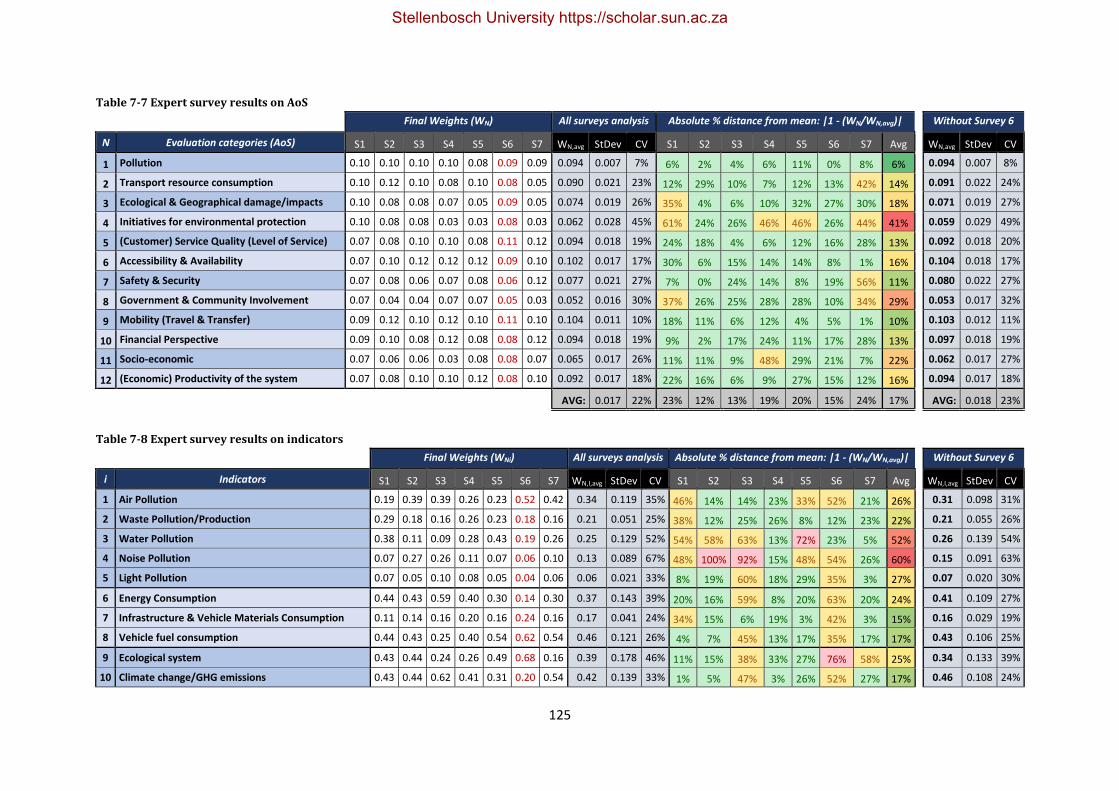
125
Table 7-7 Expert survey results on AoS
Final Weights (WN) All surveys analysis Absolute % distance from mean: |1 - (WN/WN,avg)|
Without Survey 6
N Evaluation categories (AoS) S1 S2 S3 S4 S5 S6 S7 WN,avg StDev CV S1 S2 S3 S4 S5 S6 S7 Avg WN,avg StDev CV
1 Pollution 0.10 0.10 0.10 0.10 0.08 0.09 0.09 0.094 0.007 7% 6% 2% 4% 6% 11% 0% 8% 6% 0.094 0.007 8%
2 Transport resource consumption 0.10 0.12 0.10 0.08 0.10 0.08 0.05 0.090 0.021 23% 12% 29% 10% 7% 12% 13% 42% 14% 0.091 0.022 24%
3 Ecological & Geographical damage/impacts 0.10 0.08 0.08 0.07 0.05 0.09 0.05 0.074 0.019 26% 35% 4% 6% 10% 32% 27% 30% 18% 0.071 0.019 27%
4 Initiatives for environmental protection 0.10 0.08 0.08 0.03 0.03 0.08 0.03 0.062 0.028 45% 61% 24% 26% 46% 46% 26% 44% 41% 0.059 0.029 49%
5 (Customer) Service Quality (Level of Service) 0.07 0.08 0.10 0.10 0.08 0.11 0.12 0.094 0.018 19% 24% 18% 4% 6% 12% 16% 28% 13% 0.092 0.018 20%
6 Accessibility & Availability 0.07 0.10 0.12 0.12 0.12 0.09 0.10 0.102 0.017 17% 30% 6% 15% 14% 14% 8% 1% 16% 0.104 0.018 17%
7 Safety & Security 0.07 0.08 0.06 0.07 0.08 0.06 0.12 0.077 0.021 27% 7% 0% 24% 14% 8% 19% 56% 11% 0.080 0.022 27%
8 Government & Community Involvement 0.07 0.04 0.04 0.07 0.07 0.05 0.03 0.052 0.016 30% 37% 26% 25% 28% 28% 10% 34% 29% 0.053 0.017 32%
9 Mobility (Travel & Transfer) 0.09 0.12 0.10 0.12 0.10 0.11 0.10 0.104 0.011 10% 18% 11% 6% 12% 4% 5% 1% 10% 0.103 0.012 11%
10 Financial Perspective 0.09 0.10 0.08 0.12 0.08 0.08 0.12 0.094 0.018 19% 9% 2% 17% 24% 11% 17% 28% 13% 0.097 0.018 19%
11 Socio-economic 0.07 0.06 0.06 0.03 0.08 0.08 0.07 0.065 0.017 26% 11% 11% 9% 48% 29% 21% 7% 22% 0.062 0.017 27%
12 (Economic) Productivity of the system 0.07 0.08 0.10 0.10 0.12 0.08 0.10 0.092 0.017 18% 22% 16% 6% 9% 27% 15% 12% 16% 0.094 0.017 18%
AVG: 0.017 22% 23% 12% 13% 19% 20% 15% 24% 17% AVG: 0.018 23%
Table 7-8 Expert survey results on indicators
Final Weights (WNi) All surveys analysis Absolute % distance from mean: |1 - (WN/WN,avg)|
Without Survey 6
i Indicators S1 S2 S3 S4 S5 S6 S7 WN,I,avg StDev CV S1 S2 S3 S4 S5 S6 S7 Avg WN,I,avg StDev CV
1 Air Pollution 0.19 0.39 0.39 0.26 0.23 0.52 0.42 0.34 0.119 35% 46% 14% 14% 23% 33% 52% 21% 26% 0.31 0.098 31%
2 Waste Pollution/Production 0.29 0.18 0.16 0.26 0.23 0.18 0.16 0.21 0.051 25% 38% 12% 25% 26% 8% 12% 23% 22% 0.21 0.055 26%
3 Water Pollution 0.38 0.11 0.09 0.28 0.43 0.19 0.26 0.25 0.129 52% 54% 58% 63% 13% 72% 23% 5% 52% 0.26 0.139 54%
4 Noise Pollution 0.07 0.27 0.26 0.11 0.07 0.06 0.10 0.13 0.089 67% 48% 100% 92% 15% 48% 54% 26% 60% 0.15 0.091 63%
5 Light Pollution 0.07 0.05 0.10 0.08 0.05 0.04 0.06 0.06 0.021 33% 8% 19% 60% 18% 29% 35% 3% 27% 0.07 0.020 30%
6 Energy Consumption 0.44 0.43 0.59 0.40 0.30 0.14 0.30 0.37 0.143 39% 20% 16% 59% 8% 20% 63% 20% 24% 0.41 0.109 27%
7 Infrastructure & Vehicle Materials Consumption 0.11 0.14 0.16 0.20 0.16 0.24 0.16 0.17 0.041 24% 34% 15% 6% 19% 3% 42% 3% 15% 0.16 0.029 19%
8 Vehicle fuel consumption 0.44 0.43 0.25 0.40 0.54 0.62 0.54 0.46 0.121 26% 4% 7% 45% 13% 17% 35% 17% 17% 0.43 0.106 25%
9 Ecological system 0.43 0.44 0.24 0.26 0.49 0.68 0.16 0.39 0.178 46% 11% 15% 38% 33% 27% 76% 58% 25% 0.34 0.133 39%
10 Climate change/GHG emissions 0.43 0.44 0.62 0.41 0.31 0.20 0.54 0.42 0.139 33% 1% 5% 47% 3% 26% 52% 27% 17% 0.46 0.108 24%
Stellenbosch University https://scholar.sun.ac.za
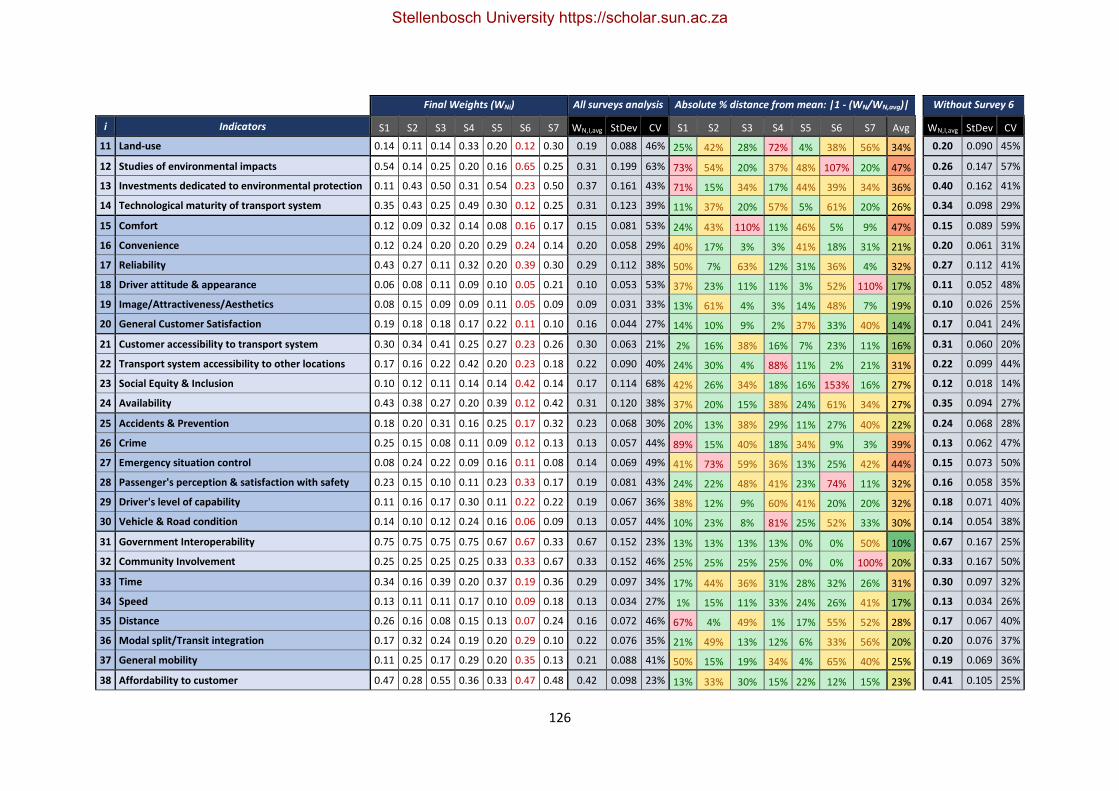
126
Final Weights (WNi) All surveys analysis Absolute % distance from mean: |1 - (WN/WN,avg)|
Without Survey 6
i Indicators S1 S2 S3 S4 S5 S6 S7 WN,I,avg StDev CV S1 S2 S3 S4 S5 S6 S7 Avg WN,I,avg StDev CV
11 Land-use 0.14 0.11 0.14 0.33 0.20 0.12 0.30 0.19 0.088 46% 25% 42% 28% 72% 4% 38% 56% 34% 0.20 0.090 45%
12 Studies of environmental impacts 0.54 0.14 0.25 0.20 0.16 0.65 0.25 0.31 0.199 63% 73% 54% 20% 37% 48% 107% 20% 47% 0.26 0.147 57%
13 Investments dedicated to environmental protection 0.11 0.43 0.50 0.31 0.54 0.23 0.50 0.37 0.161 43% 71% 15% 34% 17% 44% 39% 34% 36% 0.40 0.162 41%
14 Technological maturity of transport system 0.35 0.43 0.25 0.49 0.30 0.12 0.25 0.31 0.123 39% 11% 37% 20% 57% 5% 61% 20% 26% 0.34 0.098 29%
15 Comfort 0.12 0.09 0.32 0.14 0.08 0.16 0.17 0.15 0.081 53% 24% 43% 110% 11% 46% 5% 9% 47% 0.15 0.089 59%
16 Convenience 0.12 0.24 0.20 0.20 0.29 0.24 0.14 0.20 0.058 29% 40% 17% 3% 3% 41% 18% 31% 21% 0.20 0.061 31%
17 Reliability 0.43 0.27 0.11 0.32 0.20 0.39 0.30 0.29 0.112 38% 50% 7% 63% 12% 31% 36% 4% 32% 0.27 0.112 41%
18 Driver attitude & appearance 0.06 0.08 0.11 0.09 0.10 0.05 0.21 0.10 0.053 53% 37% 23% 11% 11% 3% 52% 110% 17% 0.11 0.052 48%
19 Image/Attractiveness/Aesthetics 0.08 0.15 0.09 0.09 0.11 0.05 0.09 0.09 0.031 33% 13% 61% 4% 3% 14% 48% 7% 19% 0.10 0.026 25%
20 General Customer Satisfaction 0.19 0.18 0.18 0.17 0.22 0.11 0.10 0.16 0.044 27% 14% 10% 9% 2% 37% 33% 40% 14% 0.17 0.041 24%
21 Customer accessibility to transport system 0.30 0.34 0.41 0.25 0.27 0.23 0.26 0.30 0.063 21% 2% 16% 38% 16% 7% 23% 11% 16% 0.31 0.060 20%
22 Transport system accessibility to other locations 0.17 0.16 0.22 0.42 0.20 0.23 0.18 0.22 0.090 40% 24% 30% 4% 88% 11% 2% 21% 31% 0.22 0.099 44%
23 Social Equity & Inclusion 0.10 0.12 0.11 0.14 0.14 0.42 0.14 0.17 0.114 68% 42% 26% 34% 18% 16% 153% 16% 27% 0.12 0.018 14%
24 Availability 0.43 0.38 0.27 0.20 0.39 0.12 0.42 0.31 0.120 38% 37% 20% 15% 38% 24% 61% 34% 27% 0.35 0.094 27%
25 Accidents & Prevention 0.18 0.20 0.31 0.16 0.25 0.17 0.32 0.23 0.068 30% 20% 13% 38% 29% 11% 27% 40% 22% 0.24 0.068 28%
26 Crime 0.25 0.15 0.08 0.11 0.09 0.12 0.13 0.13 0.057 44% 89% 15% 40% 18% 34% 9% 3% 39% 0.13 0.062 47%
27 Emergency situation control 0.08 0.24 0.22 0.09 0.16 0.11 0.08 0.14 0.069 49% 41% 73% 59% 36% 13% 25% 42% 44% 0.15 0.073 50%
28 Passenger's perception & satisfaction with safety 0.23 0.15 0.10 0.11 0.23 0.33 0.17 0.19 0.081 43% 24% 22% 48% 41% 23% 74% 11% 32% 0.16 0.058 35%
29 Driver's level of capability 0.11 0.16 0.17 0.30 0.11 0.22 0.22 0.19 0.067 36% 38% 12% 9% 60% 41% 20% 20% 32% 0.18 0.071 40%
30 Vehicle & Road condition 0.14 0.10 0.12 0.24 0.16 0.06 0.09 0.13 0.057 44% 10% 23% 8% 81% 25% 52% 33% 30% 0.14 0.054 38%
31 Government Interoperability 0.75 0.75 0.75 0.75 0.67 0.67 0.33 0.67 0.152 23% 13% 13% 13% 13% 0% 0% 50% 10% 0.67 0.167 25%
32 Community Involvement 0.25 0.25 0.25 0.25 0.33 0.33 0.67 0.33 0.152 46% 25% 25% 25% 25% 0% 0% 100% 20% 0.33 0.167 50%
33 Time 0.34 0.16 0.39 0.20 0.37 0.19 0.36 0.29 0.097 34% 17% 44% 36% 31% 28% 32% 26% 31% 0.30 0.097 32%
34 Speed 0.13 0.11 0.11 0.17 0.10 0.09 0.18 0.13 0.034 27% 1% 15% 11% 33% 24% 26% 41% 17% 0.13 0.034 26%
35 Distance 0.26 0.16 0.08 0.15 0.13 0.07 0.24 0.16 0.072 46% 67% 4% 49% 1% 17% 55% 52% 28% 0.17 0.067 40%
36 Modal split/Transit integration 0.17 0.32 0.24 0.19 0.20 0.29 0.10 0.22 0.076 35% 21% 49% 13% 12% 6% 33% 56% 20% 0.20 0.076 37%
37 General mobility 0.11 0.25 0.17 0.29 0.20 0.35 0.13 0.21 0.088 41% 50% 15% 19% 34% 4% 65% 40% 25% 0.19 0.069 36%
38 Affordability to customer 0.47 0.28 0.55 0.36 0.33 0.47 0.48 0.42 0.098 23% 13% 33% 30% 15% 22% 12% 15% 23% 0.41 0.105 25%
Stellenbosch University https://scholar.sun.ac.za
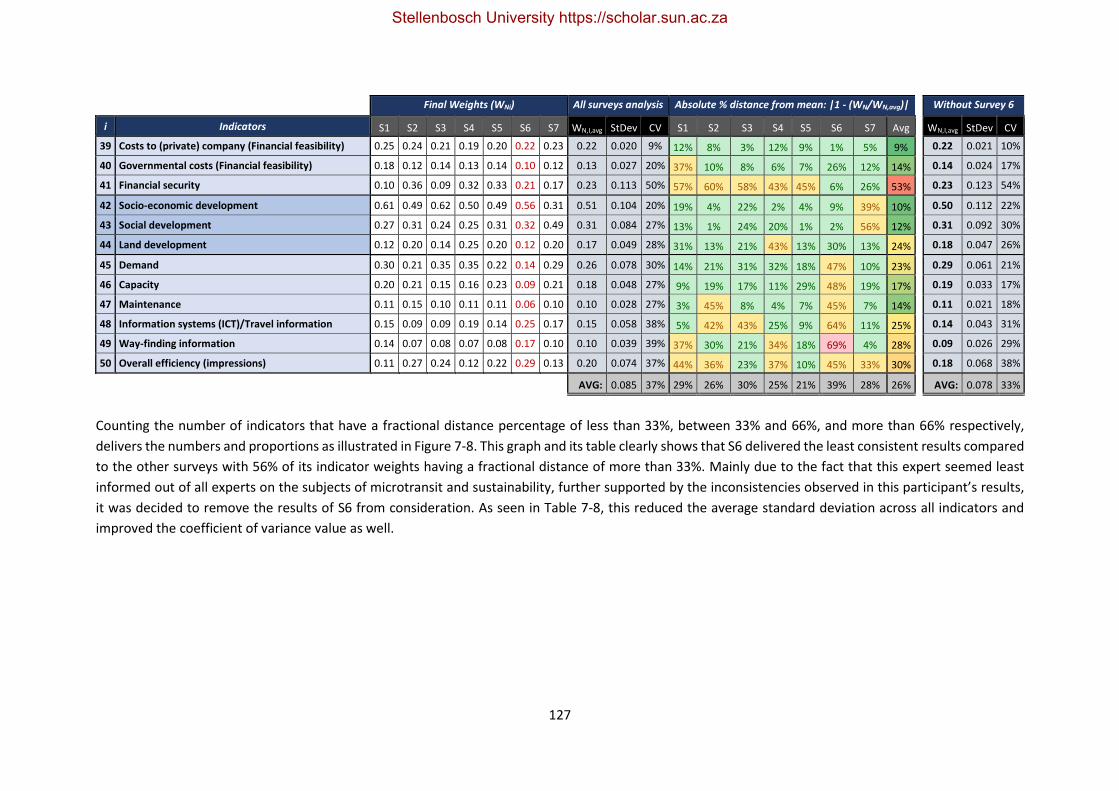
127
Final Weights (WNi) All surveys analysis Absolute % distance from mean: |1 - (WN/WN,avg)|
Without Survey 6
i Indicators S1 S2 S3 S4 S5 S6 S7 WN,I,avg StDev CV S1 S2 S3 S4 S5 S6 S7 Avg WN,I,avg StDev CV
39 Costs to (private) company (Financial feasibility) 0.25 0.24 0.21 0.19 0.20 0.22 0.23 0.22 0.020 9% 12% 8% 3% 12% 9% 1% 5% 9% 0.22 0.021 10%
40 Governmental costs (Financial feasibility) 0.18 0.12 0.14 0.13 0.14 0.10 0.12 0.13 0.027 20% 37% 10% 8% 6% 7% 26% 12% 14% 0.14 0.024 17%
41 Financial security 0.10 0.36 0.09 0.32 0.33 0.21 0.17 0.23 0.113 50% 57% 60% 58% 43% 45% 6% 26% 53% 0.23 0.123 54%
42 Socio-economic development 0.61 0.49 0.62 0.50 0.49 0.56 0.31 0.51 0.104 20% 19% 4% 22% 2% 4% 9% 39% 10% 0.50 0.112 22%
43 Social development 0.27 0.31 0.24 0.25 0.31 0.32 0.49 0.31 0.084 27% 13% 1% 24% 20% 1% 2% 56% 12% 0.31 0.092 30%
44 Land development 0.12 0.20 0.14 0.25 0.20 0.12 0.20 0.17 0.049 28% 31% 13% 21% 43% 13% 30% 13% 24% 0.18 0.047 26%
45 Demand 0.30 0.21 0.35 0.35 0.22 0.14 0.29 0.26 0.078 30% 14% 21% 31% 32% 18% 47% 10% 23% 0.29 0.061 21%
46 Capacity 0.20 0.21 0.15 0.16 0.23 0.09 0.21 0.18 0.048 27% 9% 19% 17% 11% 29% 48% 19% 17% 0.19 0.033 17%
47 Maintenance 0.11 0.15 0.10 0.11 0.11 0.06 0.10 0.10 0.028 27% 3% 45% 8% 4% 7% 45% 7% 14% 0.11 0.021 18%
48 Information systems (ICT)/Travel information 0.15 0.09 0.09 0.19 0.14 0.25 0.17 0.15 0.058 38% 5% 42% 43% 25% 9% 64% 11% 25% 0.14 0.043 31%
49 Way-finding information 0.14 0.07 0.08 0.07 0.08 0.17 0.10 0.10 0.039 39% 37% 30% 21% 34% 18% 69% 4% 28% 0.09 0.026 29%
50 Overall efficiency (impressions) 0.11 0.27 0.24 0.12 0.22 0.29 0.13 0.20 0.074 37% 44% 36% 23% 37% 10% 45% 33% 30% 0.18 0.068 38%
AVG: 0.085 37% 29% 26% 30% 25% 21% 39% 28% 26% AVG: 0.078 33%
Counting the number of indicators that have a fractional distance percentage of less than 33%, between 33% and 66%, and more than 66% respectively,
delivers the numbers and proportions as illustrated in Figure 7-8. This graph and its table clearly shows that S6 delivered the least consistent results compared
to the other surveys with 56% of its indicator weights having a fractional distance of more than 33%. Mainly due to the fact that this expert seemed least
informed out of all experts on the subjects of microtransit and sustainability, further supported by the inconsistencies observed in this participant’s results,
it was decided to remove the results of S6 from consideration. As seen in Table 7-8, this reduced the average standard deviation across all indicators and
improved the coefficient of variance value as well.
Stellenbosch University https://scholar.sun.ac.za

128
Figure 7-8 Indicators occurrence based on fractional distance groups
Removing the results of S6 from consideration improved the overall standard deviations and
coefficient of variance values as seen in Table 7-8. This is also illustrated in Table 7-9 with the
occurrence of CV of less than 33%, between 33% and 66%, and more than 66% respectively, for all
surveys and in the case where S6 is not considered.
Table 7-9 Indicator occurence based on CV groups
CV (%) Occurrence (# of indicators)
All surveys Without Survey 6
<33% 21 29
33%-66% 27 21
>66% 2 0
After the weightings have been assigned to the 12 AoS via the Likert scale, noticeable differences were
observed between the values of 𝑊1,𝑆,𝑁 and 𝑊2,𝑆,𝑁. While the idea was to assign a final weighting to
each AoS based on the average of 𝑊1,𝑆,𝑁 and 𝑊2,𝑆,𝑁, it was decided that it would not make sense to
use 𝑊1,𝑆,𝑁 towards this purpose. 𝑊1,𝑆,𝑁 was useful in determining relative weightings between the
three sustainability domains. However, it became clear that using the sum of the ratings for each
domain as a method for determining an AoS’s contribution to overall sustainability did not accurately
represent the participant’s view of that particular AoS’s overall importance, which is reflected directly
by 𝑊2,𝑆,𝑁. Thus, it was decided that the second part of Survey A provided a more representative and
direct reflection of the interviewees’ views on determining the priority and relative weightings of each
AoS. The final weightings assigned to each of the twelve AoS were thus based on 𝑊2,𝑆,𝑁 and are the
weights used in Table 7-7. Besides two outliers manually identified in Figure 7-9, we observe a general
trend with some AoS being identified as more important and thus having higher weightings than
others. Although we observe fluctuations among the weights as assigned by the different surveys, this
would be expected since values are based on value-judgement ratings and not observable hard data.
58%
70%
60%
72%
78%
44%
66%
34%
26%
36%
22%
20%
46%
30%
8%
4%
4%
6%
2%
10%
4%
0 5 10 15 20 25 30 35 40 45 50
S1
S2
S3
S4
S5
S6
S7
Indicator count
Surv
ey
ID
S1 S2 S3 S4 S5 S6 S7
<33% 29 35 30 36 39 22 33
33%-66% 17 13 18 11 10 23 15
>66% 4 2 2 3 1 5 2
Indicators occurance based on fractional distance groups
Stellenbosch University https://scholar.sun.ac.za

129
Figure 7-9 AoS weights per survey and final mean weightings
The results from the first part of Survey A pertaining to the three domains of sustainability and the
AoS’s contribution to each of these spheres are presented in Table 7-10.
Table 7-10 Expert survey results on AoS domains
I. Environmental
N Evaluation categories (AoS) S1 S2 S3 S4 S5 S6 S7 Avg StDev CV
1 Pollution 0.39 0.41 0.55 0.64 0.47 0.54 0.44 0.48 0.09 18%
2 Transport resource consumption 0.39 0.40 0.45 0.55 0.35 0.35 0.40 0.42 0.07 16%
3 Ecological & Geographical damage/impacts 0.41 0.47 0.44 0.46 0.58 0.44 0.41 0.46 0.06 13%
4 Initiatives for environmental protection 0.41 0.40 0.42 0.63 0.50 0.38 0.47 0.47 0.09 18%
5 (Customer) Service Quality (Level of Service) 0.21 0.00 0.00 0.00 0.08 0.13 0.15 0.07 0.09 117%
6 Accessibility & Availability 0.27 0.00 0.11 0.11 0.17 0.08 0.09 0.12 0.08 66%
7 Safety & Security 0.27 0.00 0.00 0.00 0.27 0.29 0.08 0.10 0.14 136%
8 Government & Community Involvement 0.23 0.00 0.17 0.00 0.17 0.09 0.28 0.14 0.11 77%
9 Mobility (Travel & Transfer) 0.31 0.29 0.18 0.09 0.15 0.00 0.21 0.21 0.11 53%
10 Financial Perspective 0.25 0.23 0.00 0.00 0.17 0.00 0.15 0.13 0.11 84%
11 Socio-economic 0.27 0.31 0.18 0.10 0.13 0.18 0.24 0.20 0.08 37%
12 (Economic) Productivity of the system 0.27 0.21 0.13 0.00 0.08 0.20 0.23 0.15 0.10 63%
Avg: 0.25 0.09 58%
II. Social
N Evaluation categories (AoS) S1 S2 S3 S4 S5 S6 S7 Avg StDev CV
1 Pollution 0.33 0.29 0.36 0.27 0.33 0.31 0.31 0.32 0.03 9%
2 Transport resource consumption 0.28 0.27 0.27 0.09 0.29 0.29 0.27 0.24 0.07 29%
3 Ecological & Geographical damage/impacts 0.29 0.27 0.44 0.23 0.25 0.38 0.29 0.30 0.08 26%
4 Initiatives for environmental protection 0.29 0.33 0.33 0.38 0.29 0.44 0.20 0.30 0.07 25%
0,000
0,020
0,040
0,060
0,080
0,100
0,120
0,140
We
igh
t fa
cto
r
Area of Sustainability (Evaluation category)
AoS weights per survey and final mean weightings
Avg WN S1 S2 S3 S4 S5 S6 S7
Stellenbosch University https://scholar.sun.ac.za
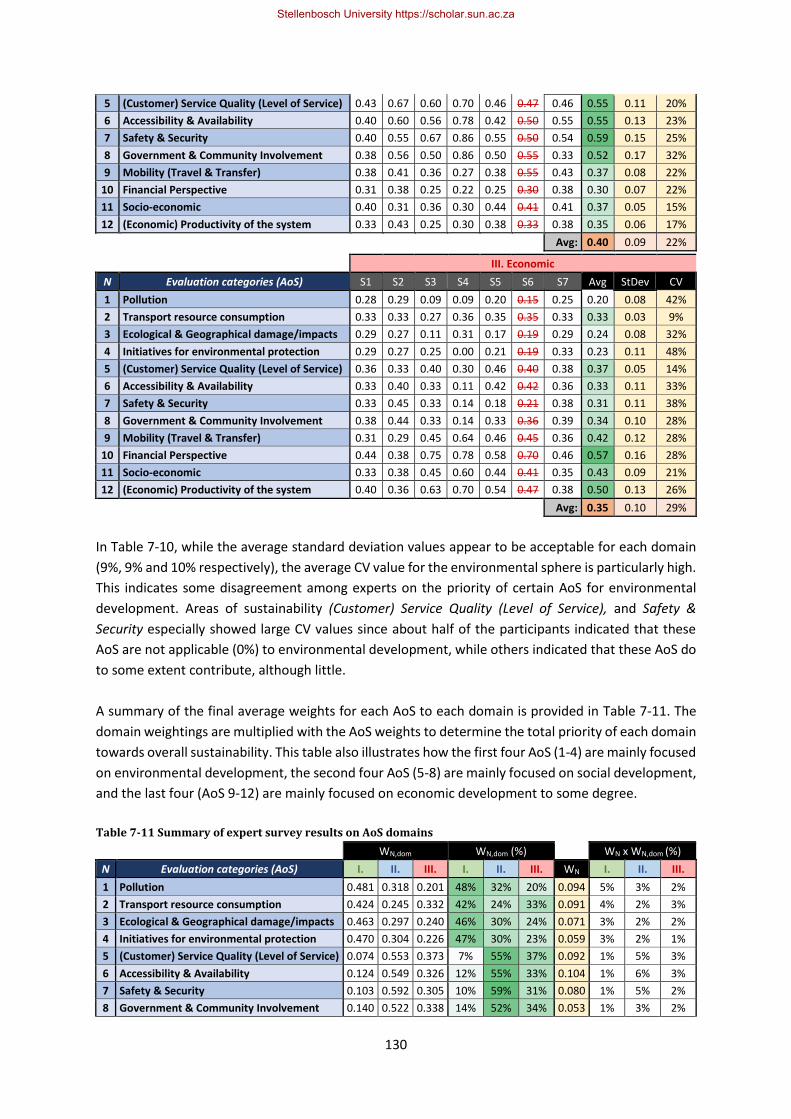
130
5 (Customer) Service Quality (Level of Service) 0.43 0.67 0.60 0.70 0.46 0.47 0.46 0.55 0.11 20%
6 Accessibility & Availability 0.40 0.60 0.56 0.78 0.42 0.50 0.55 0.55 0.13 23%
7 Safety & Security 0.40 0.55 0.67 0.86 0.55 0.50 0.54 0.59 0.15 25%
8 Government & Community Involvement 0.38 0.56 0.50 0.86 0.50 0.55 0.33 0.52 0.17 32%
9 Mobility (Travel & Transfer) 0.38 0.41 0.36 0.27 0.38 0.55 0.43 0.37 0.08 22%
10 Financial Perspective 0.31 0.38 0.25 0.22 0.25 0.30 0.38 0.30 0.07 22%
11 Socio-economic 0.40 0.31 0.36 0.30 0.44 0.41 0.41 0.37 0.05 15%
12 (Economic) Productivity of the system 0.33 0.43 0.25 0.30 0.38 0.33 0.38 0.35 0.06 17%
Avg: 0.40 0.09 22%
III. Economic
N Evaluation categories (AoS) S1 S2 S3 S4 S5 S6 S7 Avg StDev CV
1 Pollution 0.28 0.29 0.09 0.09 0.20 0.15 0.25 0.20 0.08 42%
2 Transport resource consumption 0.33 0.33 0.27 0.36 0.35 0.35 0.33 0.33 0.03 9%
3 Ecological & Geographical damage/impacts 0.29 0.27 0.11 0.31 0.17 0.19 0.29 0.24 0.08 32%
4 Initiatives for environmental protection 0.29 0.27 0.25 0.00 0.21 0.19 0.33 0.23 0.11 48%
5 (Customer) Service Quality (Level of Service) 0.36 0.33 0.40 0.30 0.46 0.40 0.38 0.37 0.05 14%
6 Accessibility & Availability 0.33 0.40 0.33 0.11 0.42 0.42 0.36 0.33 0.11 33%
7 Safety & Security 0.33 0.45 0.33 0.14 0.18 0.21 0.38 0.31 0.11 38%
8 Government & Community Involvement 0.38 0.44 0.33 0.14 0.33 0.36 0.39 0.34 0.10 28%
9 Mobility (Travel & Transfer) 0.31 0.29 0.45 0.64 0.46 0.45 0.36 0.42 0.12 28%
10 Financial Perspective 0.44 0.38 0.75 0.78 0.58 0.70 0.46 0.57 0.16 28%
11 Socio-economic 0.33 0.38 0.45 0.60 0.44 0.41 0.35 0.43 0.09 21%
12 (Economic) Productivity of the system 0.40 0.36 0.63 0.70 0.54 0.47 0.38 0.50 0.13 26%
Avg: 0.35 0.10 29%
In Table 7-10, while the average standard deviation values appear to be acceptable for each domain
(9%, 9% and 10% respectively), the average CV value for the environmental sphere is particularly high.
This indicates some disagreement among experts on the priority of certain AoS for environmental
development. Areas of sustainability (Customer) Service Quality (Level of Service), and Safety &
Security especially showed large CV values since about half of the participants indicated that these
AoS are not applicable (0%) to environmental development, while others indicated that these AoS do
to some extent contribute, although little.
A summary of the final average weights for each AoS to each domain is provided in Table 7-11. The
domain weightings are multiplied with the AoS weights to determine the total priority of each domain
towards overall sustainability. This table also illustrates how the first four AoS (1-4) are mainly focused
on environmental development, the second four AoS (5-8) are mainly focused on social development,
and the last four (AoS 9-12) are mainly focused on economic development to some degree.
Table 7-11 Summary of expert survey results on AoS domains
WN,dom WN,dom (%) WN x WN,dom (%)
N Evaluation categories (AoS) I. II. III. I. II. III. WN I. II. III.
1 Pollution 0.481 0.318 0.201 48% 32% 20% 0.094 5% 3% 2%
2 Transport resource consumption 0.424 0.245 0.332 42% 24% 33% 0.091 4% 2% 3%
3 Ecological & Geographical damage/impacts 0.463 0.297 0.240 46% 30% 24% 0.071 3% 2% 2%
4 Initiatives for environmental protection 0.470 0.304 0.226 47% 30% 23% 0.059 3% 2% 1%
5 (Customer) Service Quality (Level of Service) 0.074 0.553 0.373 7% 55% 37% 0.092 1% 5% 3%
6 Accessibility & Availability 0.124 0.549 0.326 12% 55% 33% 0.104 1% 6% 3%
7 Safety & Security 0.103 0.592 0.305 10% 59% 31% 0.080 1% 5% 2%
8 Government & Community Involvement 0.140 0.522 0.338 14% 52% 34% 0.053 1% 3% 2%
Stellenbosch University https://scholar.sun.ac.za
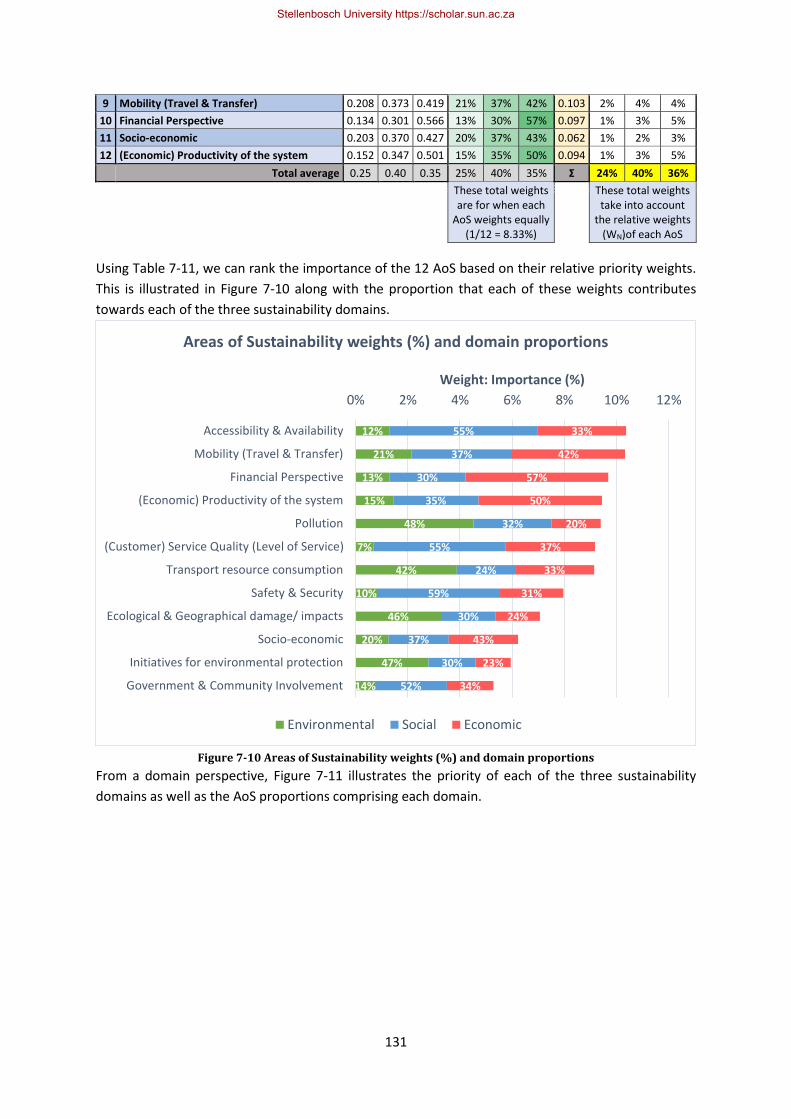
131
9 Mobility (Travel & Transfer) 0.208 0.373 0.419 21% 37% 42% 0.103 2% 4% 4%
10 Financial Perspective 0.134 0.301 0.566 13% 30% 57% 0.097 1% 3% 5%
11 Socio-economic 0.203 0.370 0.427 20% 37% 43% 0.062 1% 2% 3%
12 (Economic) Productivity of the system 0.152 0.347 0.501 15% 35% 50% 0.094 1% 3% 5%
Total average 0.25 0.40 0.35 25% 40% 35% Σ 24% 40% 36%
These total weights are for when each
AoS weights equally (1/12 = 8.33%)
These total weights take into account
the relative weights (WN)of each AoS
Using Table 7-11, we can rank the importance of the 12 AoS based on their relative priority weights.
This is illustrated in Figure 7-10 along with the proportion that each of these weights contributes
towards each of the three sustainability domains.
Figure 7-10 Areas of Sustainability weights (%) and domain proportions
From a domain perspective, Figure 7-11 illustrates the priority of each of the three sustainability
domains as well as the AoS proportions comprising each domain.
12%
21%
13%
15%
48%
7%
42%
10%
46%
20%
47%
14%
55%
37%
30%
35%
32%
55%
24%
59%
30%
37%
30%
52%
33%
42%
57%
50%
20%
37%
33%
31%
24%
43%
23%
34%
0% 2% 4% 6% 8% 10% 12%
Accessibility & Availability
Mobility (Travel & Transfer)
Financial Perspective
(Economic) Productivity of the system
Pollution
(Customer) Service Quality (Level of Service)
Transport resource consumption
Safety & Security
Ecological & Geographical damage/ impacts
Socio-economic
Initiatives for environmental protection
Government & Community Involvement
Weight: Importance (%)
Areas of Sustainability weights (%) and domain proportions
Environmental Social Economic
Stellenbosch University https://scholar.sun.ac.za

132
Figure 7-11 Domain weights (%) and Areas of Sustainability proportions
7.4 Enhanced and weighted conceptual framework
The SLR method developed for this research study (incorporating the CFA) enabled a comprehensive
approach in working from data towards concepts, categories, and ultimately the development of a
new theory (as illustrated in Figure 7-12) for a novel transport system that to date has not been fully
deployed. No framework of its kind to date existed prior to the one developed in this research.
Although similar transport evaluation frameworks exist for other transport modes, none had a focus
on the novel concept of microtransit systems which focuses on ‘first-and-last-mile’ technology-
enabled transport in an era of shared mobility, IoT, and a focus on ICT.
Figure 7-12 Overview of GTM process
Although the framework was developed for monitoring and evaluating the sustainability of
microtransit systems specifically, following completion thereof it is suggested that due to the
comprehensiveness of the framework and its modern stance, it could be considered generic to similar
transport modes to microtransit and also be applied to these modes to determine how their
sustainability performance would compare e.g. smart mobility services (ITS), shuttle services, bike
transport, minibus taxis etc. The finalised weighted M&E framework for microtransit systems,
enhanced and validated through expert interviews, is illustrated in Table 7-12. Possible units for
measurement were also included for each variable.
1%
6%
3%
2%
4%
4%
1%
3%
5%
1%
3%
5%
5%
3%
2%
1%
5%
3%
4%
2%
3%
1%
5%
2%
3%
2%
2%
1%
2%
3%
3%
2%
1%
1%
3%
2%
0% 5% 10% 15% 20% 25% 30% 35% 40% 45%
Environmental
Social
Economic
Weight: Importance (%)
Domain weights (%) and Areas of Sustainability proportions
Accessibility & Availability Mobility (Travel & Transfer)
Financial Perspective (Economic) Productivity of the system
Pollution (Customer) Service Quality (Level of Service)
Transport resource consumption Safety & Security
Ecological & Geographical damage/ impacts Socio-economic
Initiatives for environmental protection Government & Community Involvement
Data Codes Concepts Categories Theory
Stellenbosch University https://scholar.sun.ac.za
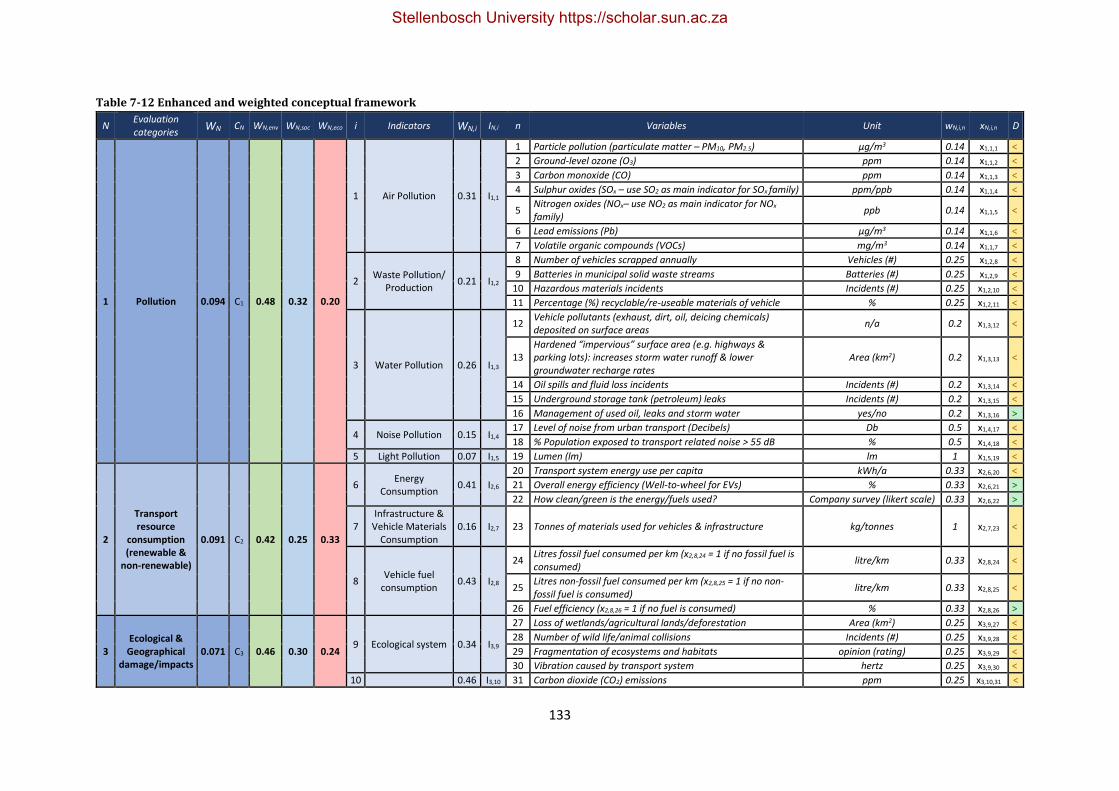
133
Table 7-12 Enhanced and weighted conceptual framework
N Evaluation categories
WN CN WN,env WN,soc WN,eco i Indicators WN,i IN,i n Variables Unit wN,i,n xN,i,n D
1 Pollution 0.094 C1 0.48 0.32 0.20
1 Air Pollution 0.31 I1,1
1 Particle pollution (particulate matter – PM10, PM2.5) μg/m3 0.14 x1,1,1 <
2 Ground-level ozone (O3) ppm 0.14 x1,1,2 <
3 Carbon monoxide (CO) ppm 0.14 x1,1,3 <
4 Sulphur oxides (SOx – use SO2 as main indicator for SOx family) ppm/ppb 0.14 x1,1,4 <
5 Nitrogen oxides (NOx– use NO2 as main indicator for NOx family)
ppb 0.14 x1,1,5 <
6 Lead emissions (Pb) μg/m3 0.14 x1,1,6 <
7 Volatile organic compounds (VOCs) mg/m3 0.14 x1,1,7 <
2 Waste Pollution/
Production 0.21 I1,2
8 Number of vehicles scrapped annually Vehicles (#) 0.25 x1,2,8 <
9 Batteries in municipal solid waste streams Batteries (#) 0.25 x1,2,9 <
10 Hazardous materials incidents Incidents (#) 0.25 x1,2,10 <
11 Percentage (%) recyclable/re-useable materials of vehicle % 0.25 x1,2,11 <
3 Water Pollution 0.26 I1,3
12 Vehicle pollutants (exhaust, dirt, oil, deicing chemicals) deposited on surface areas
n/a 0.2 x1,3,12 <
13 Hardened “impervious” surface area (e.g. highways & parking lots): increases storm water runoff & lower groundwater recharge rates
Area (km2) 0.2 x1,3,13 <
14 Oil spills and fluid loss incidents Incidents (#) 0.2 x1,3,14 <
15 Underground storage tank (petroleum) leaks Incidents (#) 0.2 x1,3,15 <
16 Management of used oil, leaks and storm water yes/no 0.2 x1,3,16 >
4 Noise Pollution 0.15 I1,4 17 Level of noise from urban transport (Decibels) Db 0.5 x1,4,17 <
18 % Population exposed to transport related noise > 55 dB % 0.5 x1,4,18 <
5 Light Pollution 0.07 I1,5 19 Lumen (lm) lm 1 x1,5,19 <
2
Transport resource
consumption (renewable &
non-renewable)
0.091 C2 0.42 0.25 0.33
6 Energy
Consumption 0.41 I2,6
20 Transport system energy use per capita kWh/a 0.33 x2,6,20 <
21 Overall energy efficiency (Well-to-wheel for EVs) % 0.33 x2,6,21 >
22 How clean/green is the energy/fuels used? Company survey (likert scale) 0.33 x2,6,22 >
7 Infrastructure &
Vehicle Materials Consumption
0.16 I2,7 23 Tonnes of materials used for vehicles & infrastructure kg/tonnes 1 x2,7,23 <
8 Vehicle fuel
consumption 0.43 I2,8
24 Litres fossil fuel consumed per km (x2,8,24 = 1 if no fossil fuel is consumed)
litre/km 0.33 x2,8,24 <
25 Litres non-fossil fuel consumed per km (x2,8,25 = 1 if no non-fossil fuel is consumed)
litre/km 0.33 x2,8,25 <
26 Fuel efficiency (x2,8,26 = 1 if no fuel is consumed) % 0.33 x2,8,26 >
3 Ecological & Geographical
damage/impacts 0.071 C3 0.46 0.30 0.24
9 Ecological system 0.34 I3,9
27 Loss of wetlands/agricultural lands/deforestation Area (km2) 0.25 x3,9,27 <
28 Number of wild life/animal collisions Incidents (#) 0.25 x3,9,28 <
29 Fragmentation of ecosystems and habitats opinion (rating) 0.25 x3,9,29 <
30 Vibration caused by transport system hertz 0.25 x3,9,30 <
10 0.46 I3,10 31 Carbon dioxide (CO2) emissions ppm 0.25 x3,10,31 <
Stellenbosch University https://scholar.sun.ac.za
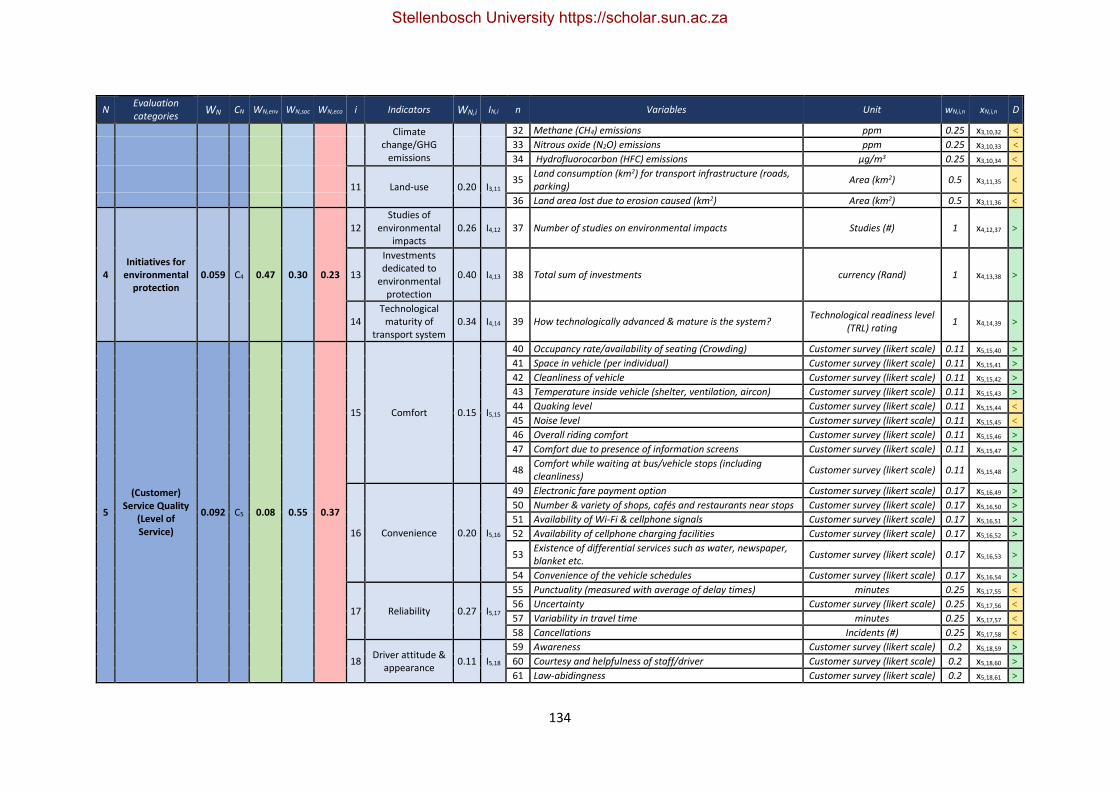
134
N Evaluation categories
WN CN WN,env WN,soc WN,eco i Indicators WN,i IN,i n Variables Unit wN,i,n xN,i,n D
Climate change/GHG
emissions
32 Methane (CH4) emissions ppm 0.25 x3,10,32 <
33 Nitrous oxide (N2O) emissions ppm 0.25 x3,10,33 <
34 Hydrofluorocarbon (HFC) emissions μg/m3 0.25 x3,10,34 <
11 Land-use 0.20 I3,11 35
Land consumption (km2) for transport infrastructure (roads, parking)
Area (km2) 0.5 x3,11,35 <
36 Land area lost due to erosion caused (km2) Area (km2) 0.5 x3,11,36 <
4 Initiatives for
environmental protection
0.059 C4 0.47 0.30 0.23
12 Studies of
environmental impacts
0.26 I4,12 37 Number of studies on environmental impacts Studies (#) 1 x4,12,37 >
13
Investments dedicated to
environmental protection
0.40 I4,13 38 Total sum of investments currency (Rand) 1 x4,13,38 >
14 Technological
maturity of transport system
0.34 I4,14 39 How technologically advanced & mature is the system? Technological readiness level
(TRL) rating 1 x4,14,39 >
5
(Customer) Service Quality
(Level of Service)
0.092 C5 0.08 0.55 0.37
15 Comfort 0.15 I5,15
40 Occupancy rate/availability of seating (Crowding) Customer survey (likert scale) 0.11 x5,15,40 >
41 Space in vehicle (per individual) Customer survey (likert scale) 0.11 x5,15,41 >
42 Cleanliness of vehicle Customer survey (likert scale) 0.11 x5,15,42 >
43 Temperature inside vehicle (shelter, ventilation, aircon) Customer survey (likert scale) 0.11 x5,15,43 >
44 Quaking level Customer survey (likert scale) 0.11 x5,15,44 <
45 Noise level Customer survey (likert scale) 0.11 x5,15,45 <
46 Overall riding comfort Customer survey (likert scale) 0.11 x5,15,46 >
47 Comfort due to presence of information screens Customer survey (likert scale) 0.11 x5,15,47 >
48 Comfort while waiting at bus/vehicle stops (including cleanliness)
Customer survey (likert scale) 0.11 x5,15,48 >
16 Convenience 0.20 I5,16
49 Electronic fare payment option Customer survey (likert scale) 0.17 x5,16,49 >
50 Number & variety of shops, cafés and restaurants near stops Customer survey (likert scale) 0.17 x5,16,50 >
51 Availability of Wi-Fi & cellphone signals Customer survey (likert scale) 0.17 x5,16,51 >
52 Availability of cellphone charging facilities Customer survey (likert scale) 0.17 x5,16,52 >
53 Existence of differential services such as water, newspaper, blanket etc.
Customer survey (likert scale) 0.17 x5,16,53 >
54 Convenience of the vehicle schedules Customer survey (likert scale) 0.17 x5,16,54 >
17 Reliability 0.27 I5,17
55 Punctuality (measured with average of delay times) minutes 0.25 x5,17,55 <
56 Uncertainty Customer survey (likert scale) 0.25 x5,17,56 <
57 Variability in travel time minutes 0.25 x5,17,57 <
58 Cancellations Incidents (#) 0.25 x5,17,58 <
18 Driver attitude &
appearance 0.11 I5,18
59 Awareness Customer survey (likert scale) 0.2 x5,18,59 >
60 Courtesy and helpfulness of staff/driver Customer survey (likert scale) 0.2 x5,18,60 >
61 Law-abidingness Customer survey (likert scale) 0.2 x5,18,61 >
Stellenbosch University https://scholar.sun.ac.za
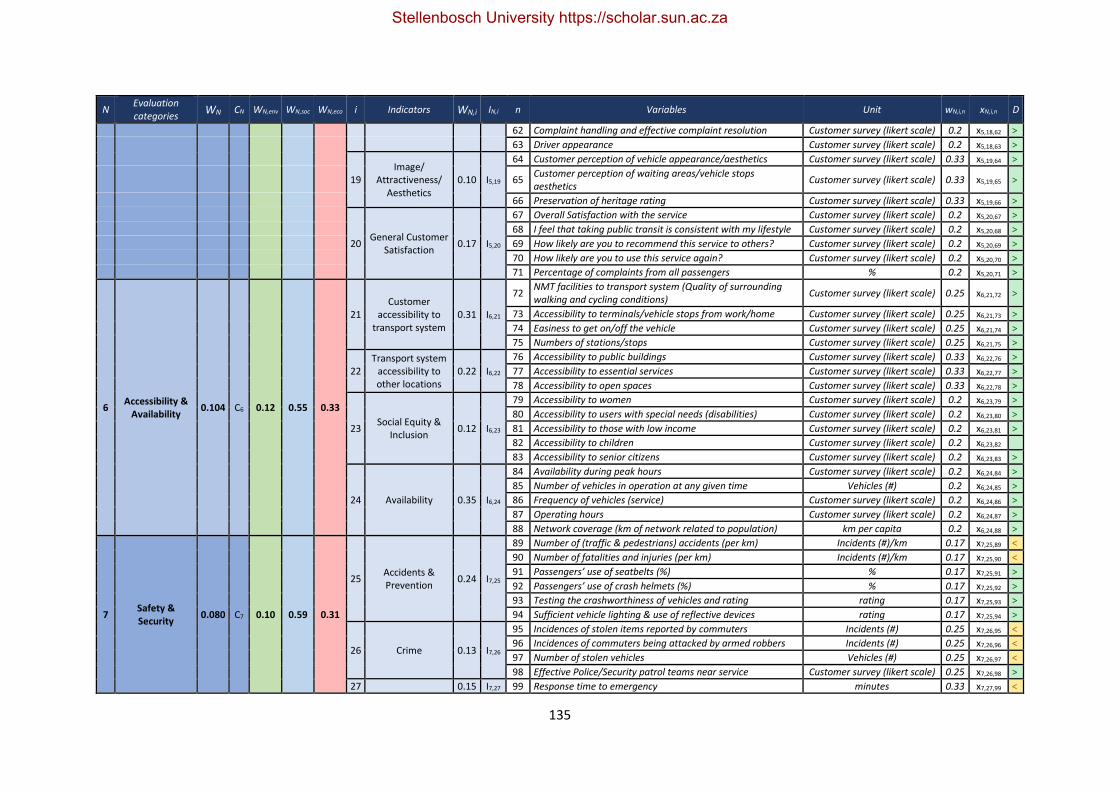
135
N Evaluation categories
WN CN WN,env WN,soc WN,eco i Indicators WN,i IN,i n Variables Unit wN,i,n xN,i,n D
62 Complaint handling and effective complaint resolution Customer survey (likert scale) 0.2 x5,18,62 >
63 Driver appearance Customer survey (likert scale) 0.2 x5,18,63 >
19 Image/
Attractiveness/ Aesthetics
0.10 I5,19
64 Customer perception of vehicle appearance/aesthetics Customer survey (likert scale) 0.33 x5,19,64 >
65 Customer perception of waiting areas/vehicle stops aesthetics
Customer survey (likert scale) 0.33 x5,19,65 >
66 Preservation of heritage rating Customer survey (likert scale) 0.33 x5,19,66 >
20 General Customer
Satisfaction 0.17 I5,20
67 Overall Satisfaction with the service Customer survey (likert scale) 0.2 x5,20,67 >
68 I feel that taking public transit is consistent with my lifestyle Customer survey (likert scale) 0.2 x5,20,68 >
69 How likely are you to recommend this service to others? Customer survey (likert scale) 0.2 x5,20,69 >
70 How likely are you to use this service again? Customer survey (likert scale) 0.2 x5,20,70 >
71 Percentage of complaints from all passengers % 0.2 x5,20,71 >
6 Accessibility &
Availability 0.104 C6 0.12 0.55 0.33
21 Customer
accessibility to transport system
0.31 I6,21
72 NMT facilities to transport system (Quality of surrounding walking and cycling conditions)
Customer survey (likert scale) 0.25 x6,21,72 >
73 Accessibility to terminals/vehicle stops from work/home Customer survey (likert scale) 0.25 x6,21,73 >
74 Easiness to get on/off the vehicle Customer survey (likert scale) 0.25 x6,21,74 >
75 Numbers of stations/stops Customer survey (likert scale) 0.25 x6,21,75 >
22 Transport system
accessibility to other locations
0.22 I6,22
76 Accessibility to public buildings Customer survey (likert scale) 0.33 x6,22,76 >
77 Accessibility to essential services Customer survey (likert scale) 0.33 x6,22,77 >
78 Accessibility to open spaces Customer survey (likert scale) 0.33 x6,22,78 >
23 Social Equity &
Inclusion 0.12 I6,23
79 Accessibility to women Customer survey (likert scale) 0.2 x6,23,79 >
80 Accessibility to users with special needs (disabilities) Customer survey (likert scale) 0.2 x6,23,80 >
81 Accessibility to those with low income Customer survey (likert scale) 0.2 x6,23,81 >
82 Accessibility to children Customer survey (likert scale) 0.2 x6,23,82
83 Accessibility to senior citizens Customer survey (likert scale) 0.2 x6,23,83 >
24 Availability 0.35 I6,24
84 Availability during peak hours Customer survey (likert scale) 0.2 x6,24,84 >
85 Number of vehicles in operation at any given time Vehicles (#) 0.2 x6,24,85 >
86 Frequency of vehicles (service) Customer survey (likert scale) 0.2 x6,24,86 >
87 Operating hours Customer survey (likert scale) 0.2 x6,24,87 >
88 Network coverage (km of network related to population) km per capita 0.2 x6,24,88 >
7 Safety & Security
0.080 C7 0.10 0.59 0.31
25 Accidents & Prevention
0.24 I7,25
89 Number of (traffic & pedestrians) accidents (per km) Incidents (#)/km 0.17 x7,25,89 <
90 Number of fatalities and injuries (per km) Incidents (#)/km 0.17 x7,25,90 <
91 Passengers’ use of seatbelts (%) % 0.17 x7,25,91 >
92 Passengers’ use of crash helmets (%) % 0.17 x7,25,92 >
93 Testing the crashworthiness of vehicles and rating rating 0.17 x7,25,93 >
94 Sufficient vehicle lighting & use of reflective devices rating 0.17 x7,25,94 >
26 Crime 0.13 I7,26
95 Incidences of stolen items reported by commuters Incidents (#) 0.25 x7,26,95 <
96 Incidences of commuters being attacked by armed robbers Incidents (#) 0.25 x7,26,96 <
97 Number of stolen vehicles Vehicles (#) 0.25 x7,26,97 <
98 Effective Police/Security patrol teams near service Customer survey (likert scale) 0.25 x7,26,98 >
27 0.15 I7,27 99 Response time to emergency minutes 0.33 x7,27,99 <
Stellenbosch University https://scholar.sun.ac.za
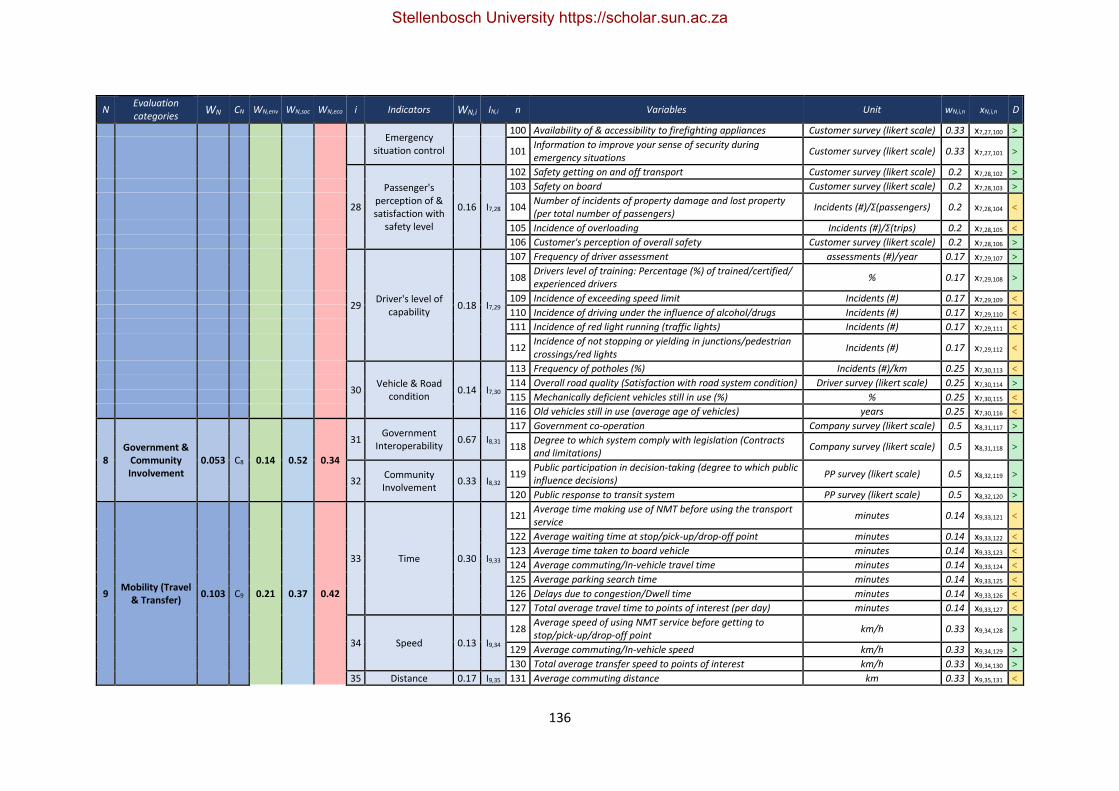
136
N Evaluation categories
WN CN WN,env WN,soc WN,eco i Indicators WN,i IN,i n Variables Unit wN,i,n xN,i,n D
Emergency situation control
100 Availability of & accessibility to firefighting appliances Customer survey (likert scale) 0.33 x7,27,100 >
101 Information to improve your sense of security during emergency situations
Customer survey (likert scale) 0.33 x7,27,101 >
28
Passenger's perception of & satisfaction with
safety level
0.16 I7,28
102 Safety getting on and off transport Customer survey (likert scale) 0.2 x7,28,102 >
103 Safety on board Customer survey (likert scale) 0.2 x7,28,103 >
104 Number of incidents of property damage and lost property (per total number of passengers)
Incidents (#)/Σ(passengers) 0.2 x7,28,104 <
105 Incidence of overloading Incidents (#)/Σ(trips) 0.2 x7,28,105 <
106 Customer's perception of overall safety Customer survey (likert scale) 0.2 x7,28,106 >
29 Driver's level of
capability 0.18 I7,29
107 Frequency of driver assessment assessments (#)/year 0.17 x7,29,107 >
108 Drivers level of training: Percentage (%) of trained/certified/ experienced drivers
% 0.17 x7,29,108 >
109 Incidence of exceeding speed limit Incidents (#) 0.17 x7,29,109 <
110 Incidence of driving under the influence of alcohol/drugs Incidents (#) 0.17 x7,29,110 <
111 Incidence of red light running (traffic lights) Incidents (#) 0.17 x7,29,111 <
112 Incidence of not stopping or yielding in junctions/pedestrian crossings/red lights
Incidents (#) 0.17 x7,29,112 <
30 Vehicle & Road
condition 0.14 I7,30
113 Frequency of potholes (%) Incidents (#)/km 0.25 x7,30,113 <
114 Overall road quality (Satisfaction with road system condition) Driver survey (likert scale) 0.25 x7,30,114 >
115 Mechanically deficient vehicles still in use (%) % 0.25 x7,30,115 <
116 Old vehicles still in use (average age of vehicles) years 0.25 x7,30,116 <
8 Government &
Community Involvement
0.053 C8 0.14 0.52 0.34
31 Government
Interoperability 0.67 I8,31
117 Government co-operation Company survey (likert scale) 0.5 x8,31,117 >
118 Degree to which system comply with legislation (Contracts and limitations)
Company survey (likert scale) 0.5 x8,31,118 >
32 Community Involvement
0.33 I8,32 119
Public participation in decision-taking (degree to which public influence decisions)
PP survey (likert scale) 0.5 x8,32,119 >
120 Public response to transit system PP survey (likert scale) 0.5 x8,32,120 >
9 Mobility (Travel
& Transfer) 0.103 C9 0.21 0.37 0.42
33 Time 0.30 I9,33
121 Average time making use of NMT before using the transport service
minutes 0.14 x9,33,121 <
122 Average waiting time at stop/pick-up/drop-off point minutes 0.14 x9,33,122 <
123 Average time taken to board vehicle minutes 0.14 x9,33,123 <
124 Average commuting/In-vehicle travel time minutes 0.14 x9,33,124 <
125 Average parking search time minutes 0.14 x9,33,125 <
126 Delays due to congestion/Dwell time minutes 0.14 x9,33,126 <
127 Total average travel time to points of interest (per day) minutes 0.14 x9,33,127 <
34 Speed 0.13 I9,34
128 Average speed of using NMT service before getting to stop/pick-up/drop-off point
km/h 0.33 x9,34,128 >
129 Average commuting/In-vehicle speed km/h 0.33 x9,34,129 >
130 Total average transfer speed to points of interest km/h 0.33 x9,34,130 >
35 Distance 0.17 I9,35 131 Average commuting distance km 0.33 x9,35,131 <
Stellenbosch University https://scholar.sun.ac.za
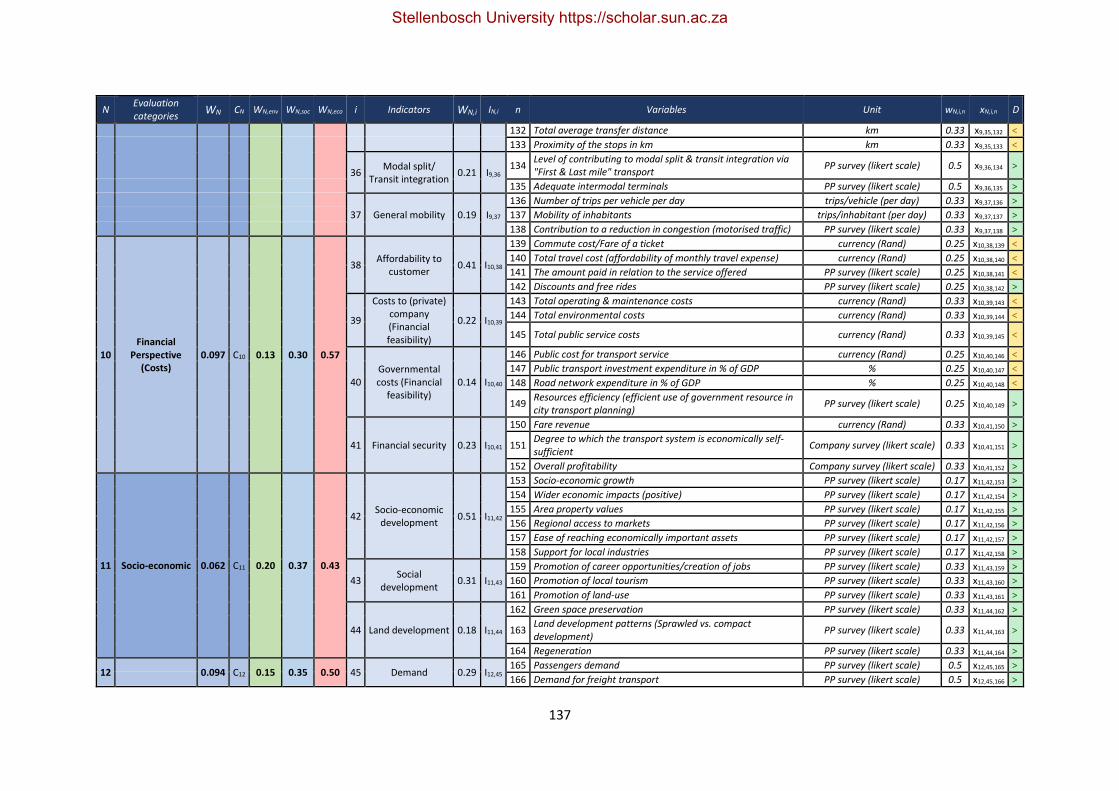
137
N Evaluation categories
WN CN WN,env WN,soc WN,eco i Indicators WN,i IN,i n Variables Unit wN,i,n xN,i,n D
132 Total average transfer distance km 0.33 x9,35,132 <
133 Proximity of the stops in km km 0.33 x9,35,133 <
36 Modal split/
Transit integration 0.21 I9,36
134 Level of contributing to modal split & transit integration via "First & Last mile" transport
PP survey (likert scale) 0.5 x9,36,134 >
135 Adequate intermodal terminals PP survey (likert scale) 0.5 x9,36,135 >
37 General mobility 0.19 I9,37
136 Number of trips per vehicle per day trips/vehicle (per day) 0.33 x9,37,136 >
137 Mobility of inhabitants trips/inhabitant (per day) 0.33 x9,37,137 >
138 Contribution to a reduction in congestion (motorised traffic) PP survey (likert scale) 0.33 x9,37,138 >
10 Financial
Perspective (Costs)
0.097 C10 0.13 0.30 0.57
38 Affordability to
customer 0.41 I10,38
139 Commute cost/Fare of a ticket currency (Rand) 0.25 x10,38,139 <
140 Total travel cost (affordability of monthly travel expense) currency (Rand) 0.25 x10,38,140 <
141 The amount paid in relation to the service offered PP survey (likert scale) 0.25 x10,38,141 <
142 Discounts and free rides PP survey (likert scale) 0.25 x10,38,142 >
39
Costs to (private) company (Financial feasibility)
0.22 I10,39
143 Total operating & maintenance costs currency (Rand) 0.33 x10,39,143 <
144 Total environmental costs currency (Rand) 0.33 x10,39,144 <
145 Total public service costs currency (Rand) 0.33 x10,39,145 <
40 Governmental costs (Financial
feasibility) 0.14 I10,40
146 Public cost for transport service currency (Rand) 0.25 x10,40,146 <
147 Public transport investment expenditure in % of GDP % 0.25 x10,40,147 <
148 Road network expenditure in % of GDP % 0.25 x10,40,148 <
149 Resources efficiency (efficient use of government resource in city transport planning)
PP survey (likert scale) 0.25 x10,40,149 >
41 Financial security 0.23 I10,41
150 Fare revenue currency (Rand) 0.33 x10,41,150 >
151 Degree to which the transport system is economically self-sufficient
Company survey (likert scale) 0.33 x10,41,151 >
152 Overall profitability Company survey (likert scale) 0.33 x10,41,152 >
11 Socio-economic 0.062 C11 0.20 0.37 0.43
42 Socio-economic
development 0.51 I11,42
153 Socio-economic growth PP survey (likert scale) 0.17 x11,42,153 >
154 Wider economic impacts (positive) PP survey (likert scale) 0.17 x11,42,154 >
155 Area property values PP survey (likert scale) 0.17 x11,42,155 >
156 Regional access to markets PP survey (likert scale) 0.17 x11,42,156 >
157 Ease of reaching economically important assets PP survey (likert scale) 0.17 x11,42,157 >
158 Support for local industries PP survey (likert scale) 0.17 x11,42,158 >
43 Social
development 0.31 I11,43
159 Promotion of career opportunities/creation of jobs PP survey (likert scale) 0.33 x11,43,159 >
160 Promotion of local tourism PP survey (likert scale) 0.33 x11,43,160 >
161 Promotion of land-use PP survey (likert scale) 0.33 x11,43,161 >
44 Land development 0.18 I11,44
162 Green space preservation PP survey (likert scale) 0.33 x11,44,162 >
163 Land development patterns (Sprawled vs. compact development)
PP survey (likert scale) 0.33 x11,44,163 >
164 Regeneration PP survey (likert scale) 0.33 x11,44,164 >
12 0.094 C12 0.15 0.35 0.50 45 Demand 0.29 I12,45 165 Passengers demand PP survey (likert scale) 0.5 x12,45,165 >
166 Demand for freight transport PP survey (likert scale) 0.5 x12,45,166 >
Stellenbosch University https://scholar.sun.ac.za
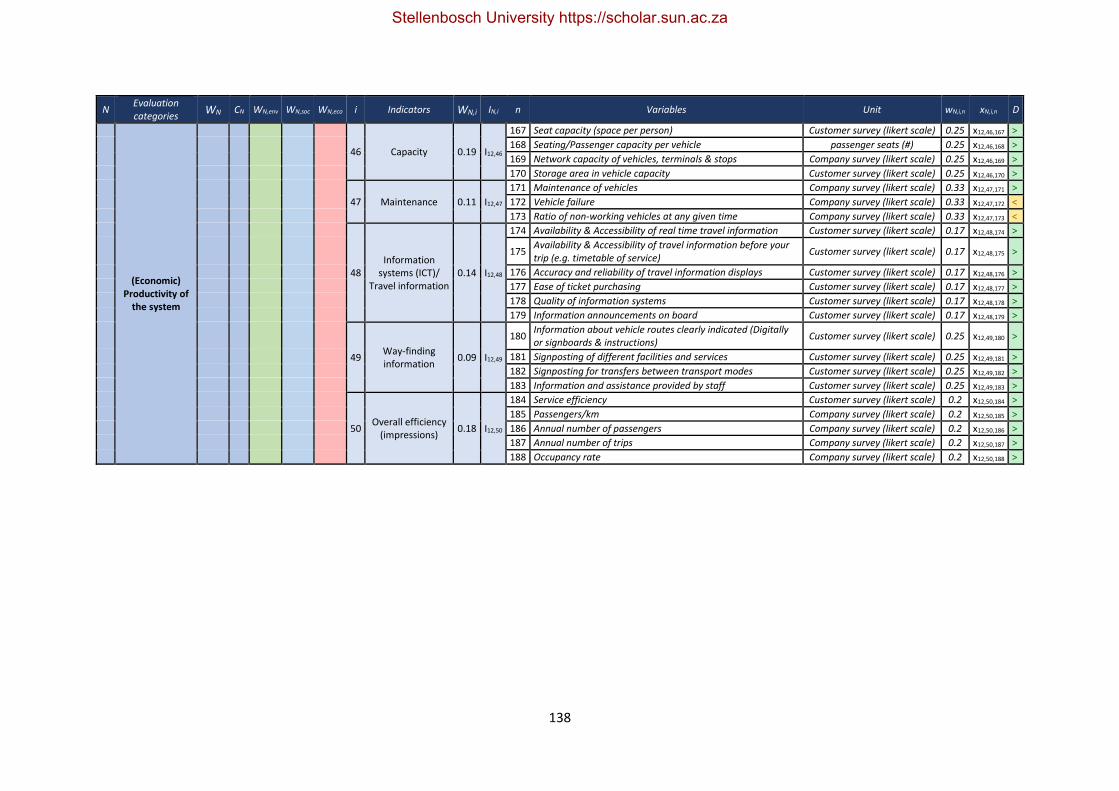
138
N Evaluation categories
WN CN WN,env WN,soc WN,eco i Indicators WN,i IN,i n Variables Unit wN,i,n xN,i,n D
(Economic) Productivity of
the system
46 Capacity 0.19 I12,46
167 Seat capacity (space per person) Customer survey (likert scale) 0.25 x12,46,167 >
168 Seating/Passenger capacity per vehicle passenger seats (#) 0.25 x12,46,168 >
169 Network capacity of vehicles, terminals & stops Company survey (likert scale) 0.25 x12,46,169 >
170 Storage area in vehicle capacity Customer survey (likert scale) 0.25 x12,46,170 >
47 Maintenance 0.11 I12,47
171 Maintenance of vehicles Company survey (likert scale) 0.33 x12,47,171 >
172 Vehicle failure Company survey (likert scale) 0.33 x12,47,172 <
173 Ratio of non-working vehicles at any given time Company survey (likert scale) 0.33 x12,47,173 <
48 Information
systems (ICT)/ Travel information
0.14 I12,48
174 Availability & Accessibility of real time travel information Customer survey (likert scale) 0.17 x12,48,174 >
175 Availability & Accessibility of travel information before your trip (e.g. timetable of service)
Customer survey (likert scale) 0.17 x12,48,175 >
176 Accuracy and reliability of travel information displays Customer survey (likert scale) 0.17 x12,48,176 >
177 Ease of ticket purchasing Customer survey (likert scale) 0.17 x12,48,177 >
178 Quality of information systems Customer survey (likert scale) 0.17 x12,48,178 >
179 Information announcements on board Customer survey (likert scale) 0.17 x12,48,179 >
49 Way-finding information
0.09 I12,49
180 Information about vehicle routes clearly indicated (Digitally or signboards & instructions)
Customer survey (likert scale) 0.25 x12,49,180 >
181 Signposting of different facilities and services Customer survey (likert scale) 0.25 x12,49,181 >
182 Signposting for transfers between transport modes Customer survey (likert scale) 0.25 x12,49,182 >
183 Information and assistance provided by staff Customer survey (likert scale) 0.25 x12,49,183 >
50 Overall efficiency
(impressions) 0.18 I12,50
184 Service efficiency Customer survey (likert scale) 0.2 x12,50,184 >
185 Passengers/km Company survey (likert scale) 0.2 x12,50,185 >
186 Annual number of passengers Company survey (likert scale) 0.2 x12,50,186 >
187 Annual number of trips Company survey (likert scale) 0.2 x12,50,187 >
188 Occupancy rate Company survey (likert scale) 0.2 x12,50,188 >
Stellenbosch University https://scholar.sun.ac.za
139
It should be noted that although the enhanced weighted framework includes suggested variables for
determining the respective indicators, the focus of this research was to develop a conceptual
framework where the main concepts were identified for microtransit systems’ sustainability. The
variables are an extensive list that is not set in stone. These variables have various units of
measurement, making it difficult to normalise and determine a sustainability index at this stage.
For each of the 50 indicators, several ways in which their performance can be measured, and much
disagreement on what variables to use towards this purpose (explained with example below) exist.
Several variables that are considered important for evaluating the microtransit system’s sustainability
are often difficult or nearly impossible to measure. Although a comprehensive approach towards
indicator identification was followed in this research study based on guidelines as stipulated earlier in
Table 3-1, it is argued that additional extensive research is necessary on each of the 50 indicators to
develop adequate ways of determining their performance index-values with appropriate variables
that are easily obtainable with little effort and cost-effectively.
This is a process that requires a vast amount of research from multiple disciplinarians that could result
in even more variables than the 188 (reduced from 198 from the initial framework) identified in this
research, already considered a too large number for simple and efficient M&E of the system. What
makes it even more complicated is that while every AoS has been weighted according to its
importance to sustainable development, and every indicator has been weighted according to their
respective contributions to each of the AoS, every variable would also have to be weighted according
to its contributions to every indicator. Although EWA is used in numerous composite indices (40% of
indices according to a study by Singh et al. (2009)), it is argued that even though the twelve AoS and
the indicators have been weighted, this does not mean that variables can simply be weighted equally.
Although the process might be simplified, accuracy would be sacrificed.
Consider the following example: The relative contribution of Pollution as an AoS has been identified
through Likert scale weightings, and the relative contribution of the indicator Air pollution through
AHP weightings. The variables (criteria) making up Air pollution as identified in this study are:
• Particle pollution (particulate matter – PM10, PM2.5)
• Ground-level ozone (O3)
• Carbon monoxide (CO)
• Sulphur oxides (SOx – use SO2 as main indicator for SOx family)
• Nitrogen oxides (NOx– use NO2 as main indicator for NOx family)
• Lead emissions (Pb)
• Volatile organic compounds (VOCs)
It is highly probable that each of the above-mentioned variables does not have an equal effect on air
quality, and should thus not be weighted as such. In addition to the fact that variables should also be
weighted (which would make the framework significantly more complex), we observe that several
agencies and researchers also disagree on the variables that should be considered. Referring to Table
7-13, it is clear how determining an air quality index (AQI) differs for different locations and according
to different institutions based on the variables they consider (CDMX, no date; Government of Canada,
2008; COMEAP, 2011; US EPA, 2011; Hsu, 2012; van den Elshout, 2012; Lakshmi, 2014). Researchers
from some of the relevant articles also suggest various combinations of variables to use.
Stellenbosch University https://scholar.sun.ac.za
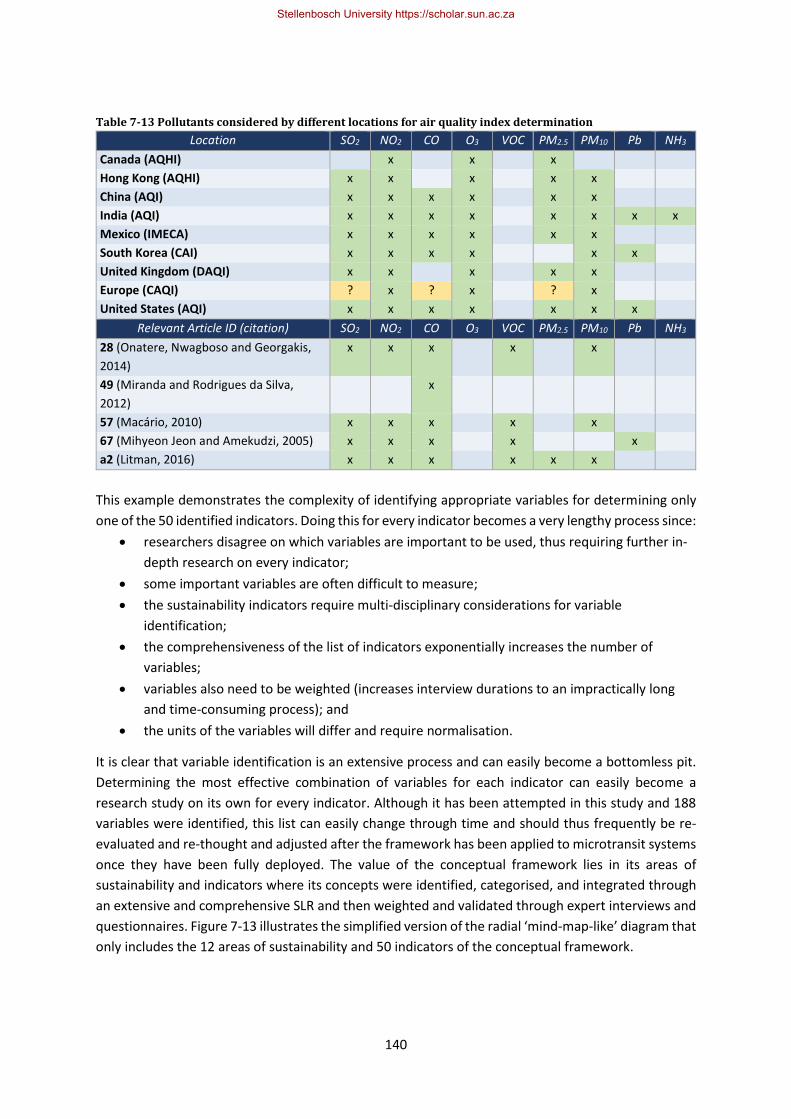
140
Table 7-13 Pollutants considered by different locations for air quality index determination
Location SO2 NO2 CO O3 VOC PM2.5 PM10 Pb NH3
Canada (AQHI) x x x
Hong Kong (AQHI) x x x x x
China (AQI) x x x x x x
India (AQI) x x x x x x x x
Mexico (IMECA) x x x x x x
South Korea (CAI) x x x x x x
United Kingdom (DAQI) x x x x x
Europe (CAQI) ? x ? x ? x
United States (AQI) x x x x x x x
Relevant Article ID (citation) SO2 NO2 CO O3 VOC PM2.5 PM10 Pb NH3
28 (Onatere, Nwagboso and Georgakis,
2014)
x x x x x
49 (Miranda and Rodrigues da Silva,
2012)
x
57 (Macário, 2010) x x x x x
67 (Mihyeon Jeon and Amekudzi, 2005) x x x x x
a2 (Litman, 2016) x x x x x x
This example demonstrates the complexity of identifying appropriate variables for determining only
one of the 50 identified indicators. Doing this for every indicator becomes a very lengthy process since:
• researchers disagree on which variables are important to be used, thus requiring further in-
depth research on every indicator;
• some important variables are often difficult to measure;
• the sustainability indicators require multi-disciplinary considerations for variable
identification;
• the comprehensiveness of the list of indicators exponentially increases the number of
variables;
• variables also need to be weighted (increases interview durations to an impractically long
and time-consuming process); and
• the units of the variables will differ and require normalisation.
It is clear that variable identification is an extensive process and can easily become a bottomless pit.
Determining the most effective combination of variables for each indicator can easily become a
research study on its own for every indicator. Although it has been attempted in this study and 188
variables were identified, this list can easily change through time and should thus frequently be re-
evaluated and re-thought and adjusted after the framework has been applied to microtransit systems
once they have been fully deployed. The value of the conceptual framework lies in its areas of
sustainability and indicators where its concepts were identified, categorised, and integrated through
an extensive and comprehensive SLR and then weighted and validated through expert interviews and
questionnaires. Figure 7-13 illustrates the simplified version of the radial ‘mind-map-like’ diagram that
only includes the 12 areas of sustainability and 50 indicators of the conceptual framework.
Stellenbosch University https://scholar.sun.ac.za
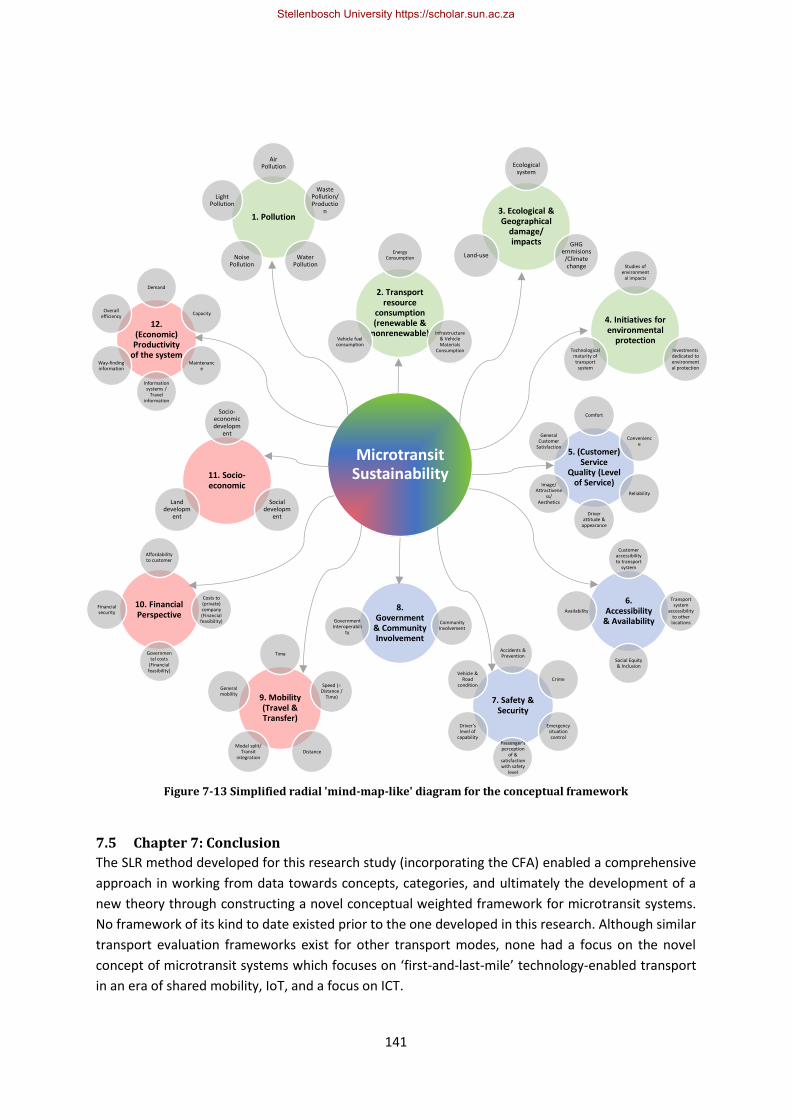
141
7.5 Chapter 7: Conclusion
The SLR method developed for this research study (incorporating the CFA) enabled a comprehensive
approach in working from data towards concepts, categories, and ultimately the development of a
new theory through constructing a novel conceptual weighted framework for microtransit systems.
No framework of its kind to date existed prior to the one developed in this research. Although similar
transport evaluation frameworks exist for other transport modes, none had a focus on the novel
concept of microtransit systems which focuses on ‘first-and-last-mile’ technology-enabled transport
in an era of shared mobility, IoT, and a focus on ICT.
7. Safety & Security
Accidents & Prevention
Crime
Emergency situation control
Passenger's perception
of & satisfaction with safety
level
Driver's level of
capability
Vehicle & Road
condition
8. Government
& Community Involvement
Government Interoperabili
ty
Community Involvement
1. Pollution
Air Pollution
Waste Pollution/ Productio
n
Water Pollution
Noise Pollution
Light Pollution
2. Transport resource
consumption (renewable &
nonrenewable)
Energy Consumption
Infrastructure & Vehicle Materials
Consumption
Vehicle fuel consumption
4. Initiatives for environmental
protection
Studies of environment
al impacts
Investments dedicated to environmental protection
Technological maturity of transport
system
3. Ecological & Geographical
damage/ impacts
Ecological system
GHG emmisions
/Climate change
Land-use
5. (Customer) Service
Quality (Level of Service)
Comfort
Convenience
Reliability
Driver attitude &
appearance
Image/ Attractivene
ss/ Aesthetics
General Customer
Satisfaction
6. Accessibility
& Availability
Customer accessibility to transport
system
Transport system
accessibility to other locations
Social Equity & Inclusion
Availability
9. Mobility (Travel & Transfer)
Time
Speed (= Distance /
Time)
DistanceModal split/
Transit integration
General mobility
10. Financial Perspective
Affordability to customer
Costs to (private) company (Financial feasibility)
Governmental costs
(Financial feasibility)
Financial security
11. Socio-economic
Socio-economic developm
ent
Social developm
ent
Land developm
ent
12. (Economic) Productivity
of the system
Demand
Capacity
Maintenance
Information systems /
Travel information
Way-finding information
Overall efficiency
Microtransit Sustainability
Figure 7-13 Simplified radial 'mind-map-like' diagram for the conceptual framework
Stellenbosch University https://scholar.sun.ac.za

142
The novel conceptual weighted framework was determined comprehensively and is considered fixed.
It provides a fixed foundation where variables can easily be modified, removed, or added. This can be
done as deemed necessary by future research on microtransit systems or by the policy-makers,
decision-makers and private companies utilising the framework in its current form.
In the following chapter, the conceptual framework is applied as a management tool to a case study
towards finalising the conceptual framework and the validation thereof.
Stellenbosch University https://scholar.sun.ac.za

143
This page intentionally left blank
Stellenbosch University https://scholar.sun.ac.za
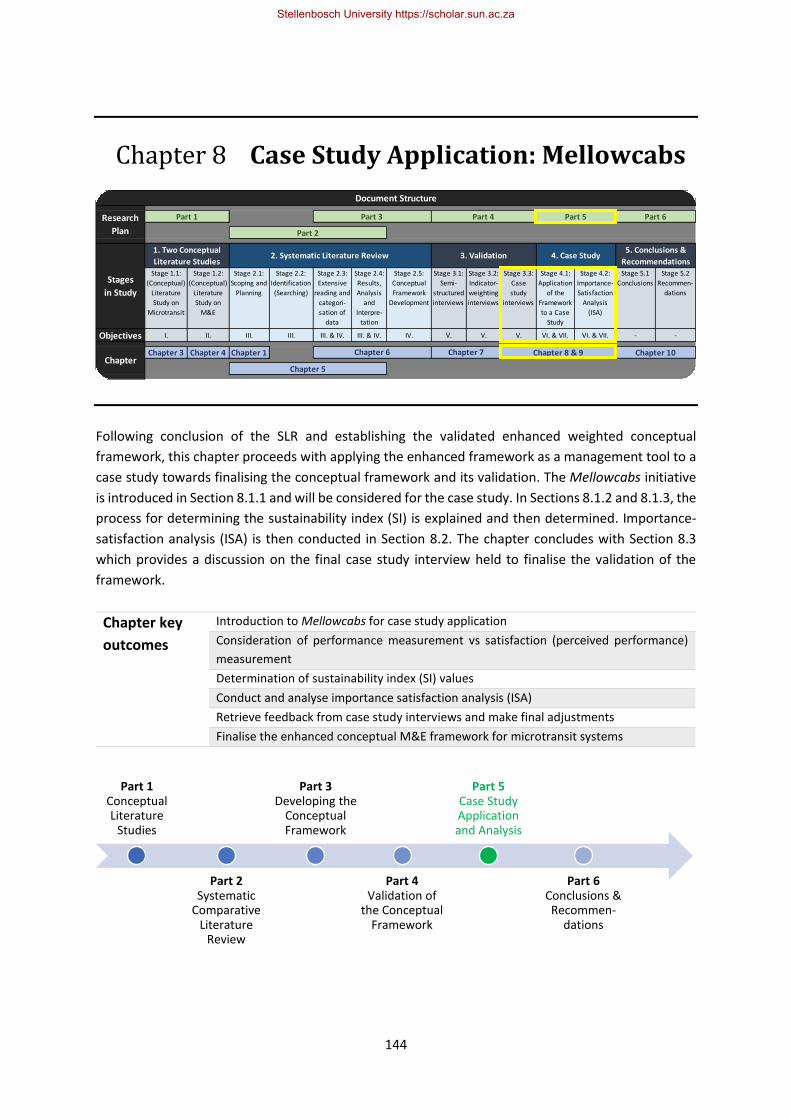
144
Chapter 8 Case Study Application: Mellowcabs
Following conclusion of the SLR and establishing the validated enhanced weighted conceptual
framework, this chapter proceeds with applying the enhanced framework as a management tool to a
case study towards finalising the conceptual framework and its validation. The Mellowcabs initiative
is introduced in Section 8.1.1 and will be considered for the case study. In Sections 8.1.2 and 8.1.3, the
process for determining the sustainability index (SI) is explained and then determined. Importance-
satisfaction analysis (ISA) is then conducted in Section 8.2. The chapter concludes with Section 8.3
which provides a discussion on the final case study interview held to finalise the validation of the
framework.
Chapter key
outcomes
Introduction to Mellowcabs for case study application
Consideration of performance measurement vs satisfaction (perceived performance)
measurement
Determination of sustainability index (SI) values
Conduct and analyse importance satisfaction analysis (ISA)
Retrieve feedback from case study interviews and make final adjustments
Finalise the enhanced conceptual M&E framework for microtransit systems
Stage 1.1:
(Conceptual)
Literature
Study on
Microtransit
Stage 1.2:
(Conceptual)
Literature
Study on
M&E
Stage 2.1:
Scoping and
Planning
Stage 2.2:
Identification
(Searching)
Stage 2.3:
Extensive
reading and
categori-
sation of
data
Stage 2.4:
Results,
Analysis
and
Interpre-
tation
Stage 2.5:
Conceptual
Framework
Development
Stage 3.1:
Semi-
structured
interviews
Stage 3.2:
Indicator-
weighting
interviews
Stage 3.3:
Case
study
interviews
Stage 4.1:
Application
of the
Framework
to a Case
Study
Stage 4.2:
Importance-
Satisfaction
Analysis
(ISA)
Stage 5.1
Conclusions
Stage 5.2
Recommen-
dations
Objectives I. II. III. III. III. & IV. III. & IV. IV. V. V. V. VI. & VII. VI. & VII. - -
Chapter 3 Chapter 4 Chapter 1
Stages
in Study
1. Two Conceptual
Literature Studies2. Systematic Literature Review 3. Validation 4. Case Study
5. Conclusions &
Recommendations
ChapterChapter 6 Chapter 7 Chapter 8 & 9 Chapter 10
Chapter 5
Document Structure
Research
Plan
Part 1 Part 3 Part 4 Part 5 Part 6
Part 2
Part 1 Conceptual Literature
Studies
Part 2 Systematic
Comparative Literature
Review
Part 3 Developing the
Conceptual Framework
Part 4 Validation of
the Conceptual Framework
Part 5 Case Study Application and Analysis
Part 6 Conclusions & Recommen-
dations
Stellenbosch University https://scholar.sun.ac.za
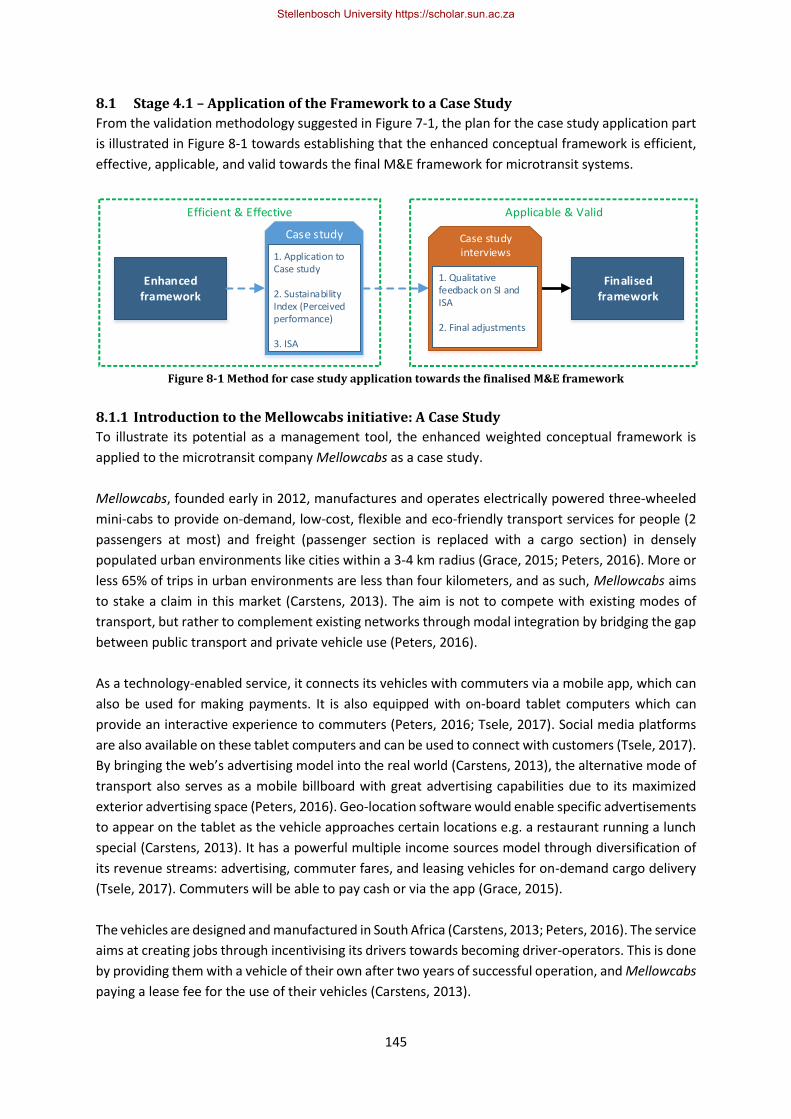
145
8.1 Stage 4.1 – Application of the Framework to a Case Study
From the validation methodology suggested in Figure 7-1, the plan for the case study application part
is illustrated in Figure 8-1 towards establishing that the enhanced conceptual framework is efficient,
effective, applicable, and valid towards the final M&E framework for microtransit systems.
Enhanced framework
Finalised framework
Efficient & Effective Applicable & Valid
Case study interviews
1. Qualitative feedback on SI and ISA
2. Final adjustments
Case study
1. Application to Case study
2. Sustainability Index (Perceived performance)
3. ISA
Figure 8-1 Method for case study application towards the finalised M&E framework
8.1.1 Introduction to the Mellowcabs initiative: A Case Study
To illustrate its potential as a management tool, the enhanced weighted conceptual framework is
applied to the microtransit company Mellowcabs as a case study.
Mellowcabs, founded early in 2012, manufactures and operates electrically powered three-wheeled
mini-cabs to provide on-demand, low-cost, flexible and eco-friendly transport services for people (2
passengers at most) and freight (passenger section is replaced with a cargo section) in densely
populated urban environments like cities within a 3-4 km radius (Grace, 2015; Peters, 2016). More or
less 65% of trips in urban environments are less than four kilometers, and as such, Mellowcabs aims
to stake a claim in this market (Carstens, 2013). The aim is not to compete with existing modes of
transport, but rather to complement existing networks through modal integration by bridging the gap
between public transport and private vehicle use (Peters, 2016).
As a technology-enabled service, it connects its vehicles with commuters via a mobile app, which can
also be used for making payments. It is also equipped with on-board tablet computers which can
provide an interactive experience to commuters (Peters, 2016; Tsele, 2017). Social media platforms
are also available on these tablet computers and can be used to connect with customers (Tsele, 2017).
By bringing the web’s advertising model into the real world (Carstens, 2013), the alternative mode of
transport also serves as a mobile billboard with great advertising capabilities due to its maximized
exterior advertising space (Peters, 2016). Geo-location software would enable specific advertisements
to appear on the tablet as the vehicle approaches certain locations e.g. a restaurant running a lunch
special (Carstens, 2013). It has a powerful multiple income sources model through diversification of
its revenue streams: advertising, commuter fares, and leasing vehicles for on-demand cargo delivery
(Tsele, 2017). Commuters will be able to pay cash or via the app (Grace, 2015).
The vehicles are designed and manufactured in South Africa (Carstens, 2013; Peters, 2016). The service
aims at creating jobs through incentivising its drivers towards becoming driver-operators. This is done
by providing them with a vehicle of their own after two years of successful operation, and Mellowcabs
paying a lease fee for the use of their vehicles (Carstens, 2013).
Stellenbosch University https://scholar.sun.ac.za
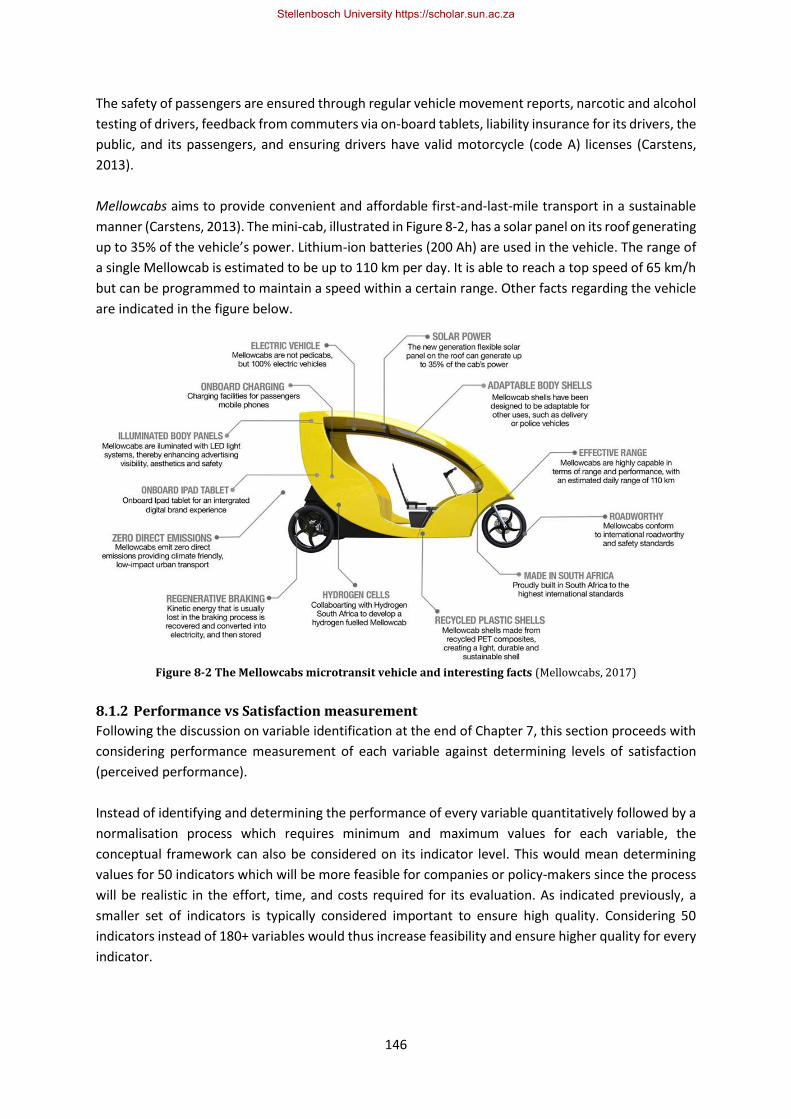
146
The safety of passengers are ensured through regular vehicle movement reports, narcotic and alcohol
testing of drivers, feedback from commuters via on-board tablets, liability insurance for its drivers, the
public, and its passengers, and ensuring drivers have valid motorcycle (code A) licenses (Carstens,
2013).
Mellowcabs aims to provide convenient and affordable first-and-last-mile transport in a sustainable
manner (Carstens, 2013). The mini-cab, illustrated in Figure 8-2, has a solar panel on its roof generating
up to 35% of the vehicle’s power. Lithium-ion batteries (200 Ah) are used in the vehicle. The range of
a single Mellowcab is estimated to be up to 110 km per day. It is able to reach a top speed of 65 km/h
but can be programmed to maintain a speed within a certain range. Other facts regarding the vehicle
are indicated in the figure below.
Figure 8-2 The Mellowcabs microtransit vehicle and interesting facts (Mellowcabs, 2017)
8.1.2 Performance vs Satisfaction measurement
Following the discussion on variable identification at the end of Chapter 7, this section proceeds with
considering performance measurement of each variable against determining levels of satisfaction
(perceived performance).
Instead of identifying and determining the performance of every variable quantitatively followed by a
normalisation process which requires minimum and maximum values for each variable, the
conceptual framework can also be considered on its indicator level. This would mean determining
values for 50 indicators which will be more feasible for companies or policy-makers since the process
will be realistic in the effort, time, and costs required for its evaluation. As indicated previously, a
smaller set of indicators is typically considered important to ensure high quality. Considering 50
indicators instead of 180+ variables would thus increase feasibility and ensure higher quality for every
indicator.
Stellenbosch University https://scholar.sun.ac.za
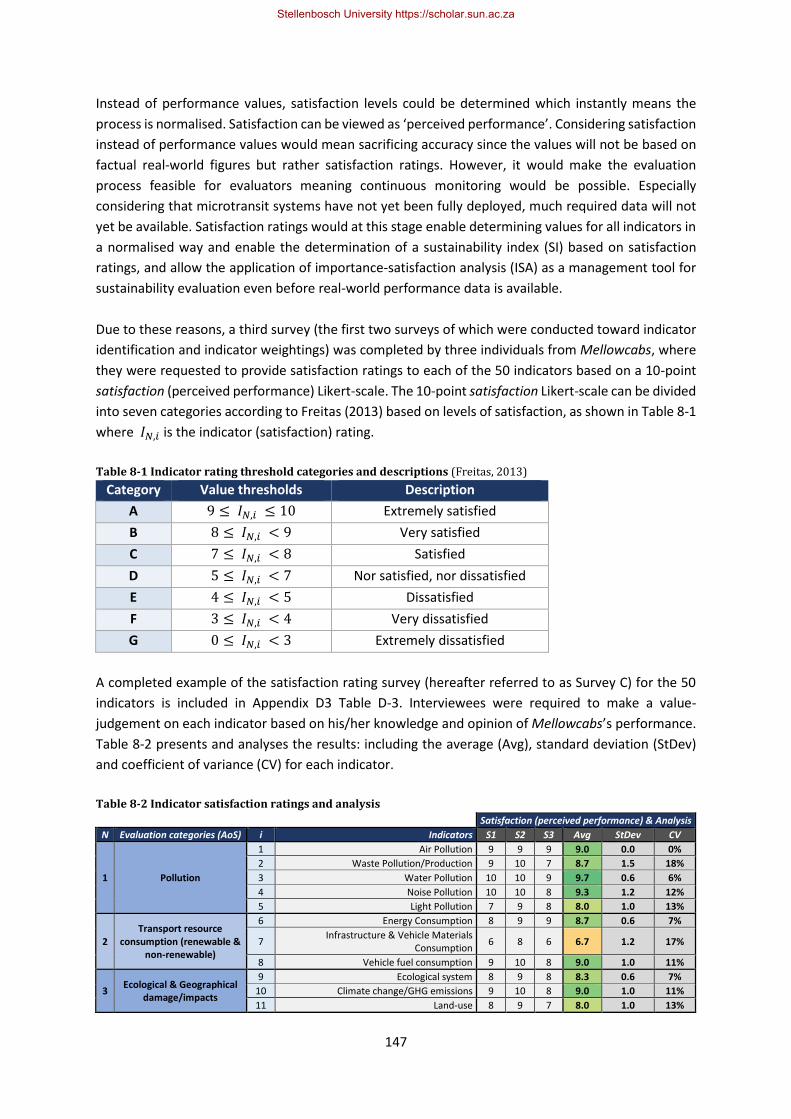
147
Instead of performance values, satisfaction levels could be determined which instantly means the
process is normalised. Satisfaction can be viewed as ‘perceived performance’. Considering satisfaction
instead of performance values would mean sacrificing accuracy since the values will not be based on
factual real-world figures but rather satisfaction ratings. However, it would make the evaluation
process feasible for evaluators meaning continuous monitoring would be possible. Especially
considering that microtransit systems have not yet been fully deployed, much required data will not
yet be available. Satisfaction ratings would at this stage enable determining values for all indicators in
a normalised way and enable the determination of a sustainability index (SI) based on satisfaction
ratings, and allow the application of importance-satisfaction analysis (ISA) as a management tool for
sustainability evaluation even before real-world performance data is available.
Due to these reasons, a third survey (the first two surveys of which were conducted toward indicator
identification and indicator weightings) was completed by three individuals from Mellowcabs, where
they were requested to provide satisfaction ratings to each of the 50 indicators based on a 10-point
satisfaction (perceived performance) Likert-scale. The 10-point satisfaction Likert-scale can be divided
into seven categories according to Freitas (2013) based on levels of satisfaction, as shown in Table 8-1
where 𝐼𝑁,𝑖 is the indicator (satisfaction) rating.
Table 8-1 Indicator rating threshold categories and descriptions (Freitas, 2013)
Category Value thresholds Description
A 9 ≤ 𝐼𝑁,𝑖 ≤ 10 Extremely satisfied
B 8 ≤ 𝐼𝑁,𝑖 < 9 Very satisfied
C 7 ≤ 𝐼𝑁,𝑖 < 8 Satisfied
D 5 ≤ 𝐼𝑁,𝑖 < 7 Nor satisfied, nor dissatisfied
E 4 ≤ 𝐼𝑁,𝑖 < 5 Dissatisfied
F 3 ≤ 𝐼𝑁,𝑖 < 4 Very dissatisfied
G 0 ≤ 𝐼𝑁,𝑖 < 3 Extremely dissatisfied
A completed example of the satisfaction rating survey (hereafter referred to as Survey C) for the 50
indicators is included in Appendix D3 Table D-3. Interviewees were required to make a value-
judgement on each indicator based on his/her knowledge and opinion of Mellowcabs’s performance.
Table 8-2 presents and analyses the results: including the average (Avg), standard deviation (StDev)
and coefficient of variance (CV) for each indicator.
Table 8-2 Indicator satisfaction ratings and analysis
Satisfaction (perceived performance) & Analysis
N Evaluation categories (AoS) i Indicators S1 S2 S3 Avg StDev CV
1 Pollution
1 Air Pollution 9 9 9 9.0 0.0 0%
2 Waste Pollution/Production 9 10 7 8.7 1.5 18%
3 Water Pollution 10 10 9 9.7 0.6 6%
4 Noise Pollution 10 10 8 9.3 1.2 12%
5 Light Pollution 7 9 8 8.0 1.0 13%
2 Transport resource
consumption (renewable & non-renewable)
6 Energy Consumption 8 9 9 8.7 0.6 7%
7 Infrastructure & Vehicle Materials
Consumption 6 8 6 6.7 1.2 17%
8 Vehicle fuel consumption 9 10 8 9.0 1.0 11%
3 Ecological & Geographical
damage/impacts
9 Ecological system 8 9 8 8.3 0.6 7%
10 Climate change/GHG emissions 9 10 8 9.0 1.0 11%
11 Land-use 8 9 7 8.0 1.0 13%
Stellenbosch University https://scholar.sun.ac.za
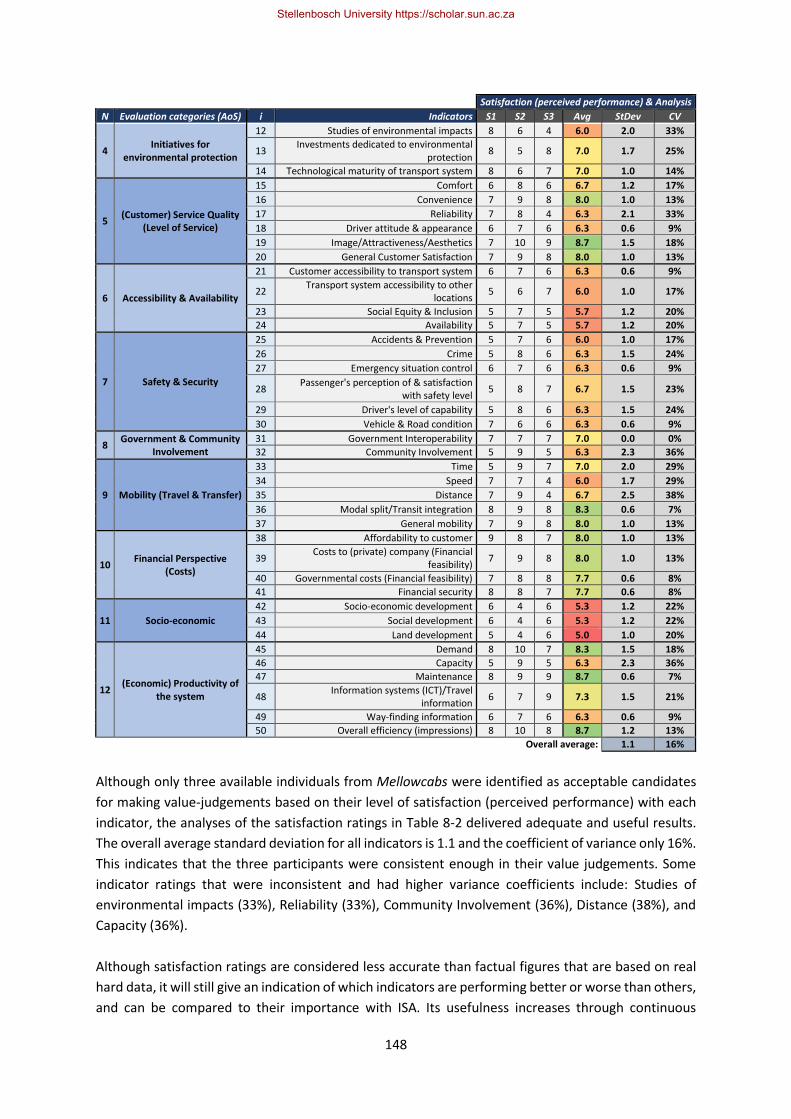
148
Satisfaction (perceived performance) & Analysis
N Evaluation categories (AoS) i Indicators S1 S2 S3 Avg StDev CV
4 Initiatives for
environmental protection
12 Studies of environmental impacts 8 6 4 6.0 2.0 33%
13 Investments dedicated to environmental
protection 8 5 8 7.0 1.7 25%
14 Technological maturity of transport system 8 6 7 7.0 1.0 14%
5 (Customer) Service Quality
(Level of Service)
15 Comfort 6 8 6 6.7 1.2 17%
16 Convenience 7 9 8 8.0 1.0 13%
17 Reliability 7 8 4 6.3 2.1 33%
18 Driver attitude & appearance 6 7 6 6.3 0.6 9%
19 Image/Attractiveness/Aesthetics 7 10 9 8.7 1.5 18%
20 General Customer Satisfaction 7 9 8 8.0 1.0 13%
6 Accessibility & Availability
21 Customer accessibility to transport system 6 7 6 6.3 0.6 9%
22 Transport system accessibility to other
locations 5 6 7 6.0 1.0 17%
23 Social Equity & Inclusion 5 7 5 5.7 1.2 20%
24 Availability 5 7 5 5.7 1.2 20%
7 Safety & Security
25 Accidents & Prevention 5 7 6 6.0 1.0 17%
26 Crime 5 8 6 6.3 1.5 24%
27 Emergency situation control 6 7 6 6.3 0.6 9%
28 Passenger's perception of & satisfaction
with safety level 5 8 7 6.7 1.5 23%
29 Driver's level of capability 5 8 6 6.3 1.5 24%
30 Vehicle & Road condition 7 6 6 6.3 0.6 9%
8 Government & Community
Involvement 31 Government Interoperability 7 7 7 7.0 0.0 0%
32 Community Involvement 5 9 5 6.3 2.3 36%
9 Mobility (Travel & Transfer)
33 Time 5 9 7 7.0 2.0 29%
34 Speed 7 7 4 6.0 1.7 29%
35 Distance 7 9 4 6.7 2.5 38%
36 Modal split/Transit integration 8 9 8 8.3 0.6 7%
37 General mobility 7 9 8 8.0 1.0 13%
10 Financial Perspective
(Costs)
38 Affordability to customer 9 8 7 8.0 1.0 13%
39 Costs to (private) company (Financial
feasibility) 7 9 8 8.0 1.0 13%
40 Governmental costs (Financial feasibility) 7 8 8 7.7 0.6 8%
41 Financial security 8 8 7 7.7 0.6 8%
11 Socio-economic
42 Socio-economic development 6 4 6 5.3 1.2 22%
43 Social development 6 4 6 5.3 1.2 22%
44 Land development 5 4 6 5.0 1.0 20%
12 (Economic) Productivity of
the system
45 Demand 8 10 7 8.3 1.5 18%
46 Capacity 5 9 5 6.3 2.3 36%
47 Maintenance 8 9 9 8.7 0.6 7%
48 Information systems (ICT)/Travel
information 6 7 9 7.3 1.5 21%
49 Way-finding information 6 7 6 6.3 0.6 9%
50 Overall efficiency (impressions) 8 10 8 8.7 1.2 13%
Overall average: 1.1 16%
Although only three available individuals from Mellowcabs were identified as acceptable candidates
for making value-judgements based on their level of satisfaction (perceived performance) with each
indicator, the analyses of the satisfaction ratings in Table 8-2 delivered adequate and useful results.
The overall average standard deviation for all indicators is 1.1 and the coefficient of variance only 16%.
This indicates that the three participants were consistent enough in their value judgements. Some
indicator ratings that were inconsistent and had higher variance coefficients include: Studies of
environmental impacts (33%), Reliability (33%), Community Involvement (36%), Distance (38%), and
Capacity (36%).
Although satisfaction ratings are considered less accurate than factual figures that are based on real
hard data, it will still give an indication of which indicators are performing better or worse than others,
and can be compared to their importance with ISA. Its usefulness increases through continuous
Stellenbosch University https://scholar.sun.ac.za

149
monitoring, where changes in the satisfaction ratings can be observed to indicate whether the
implemented actions had the desired effects and impacts. If in the future, performance values will be
determined, a normalisation process would be required for adding the variables together in order to
calculate a composite index. This can be done with linear scaling transformation (LST). This process is
however not applicable to this study since value-judgement satisfaction ratings have the same unit
and are thus already normalised. As such, a normalisation process will not be considered.
8.1.3 Determining the Sustainability Index (SI)
The conceptual framework developed in this study is constructed to deliver a single final value
expressing the sustainability performance of the microtransit system under consideration, and is
called the sustainability index (𝑆𝐼).
Since weighting and approaches to aggregation have a significant impact on the overall composite
indicator, choosing the correct approach to aggregation is important to consider. Although most
studies use the EWA method for aggregating elements into a composite index, it was previously
established and explained that this would not be sufficient.
In this study, various options were considered for weighting the variables, indicators, and AoS towards
establishing their importance relative to one another, as was discussed in Sections 7.3.1-7.3.3. It was
decided that the approach to aggregation in this study would be to use these relative importance
weightings for aggregating all elements into a composite index i.e. through a (nested) weighted sum
approach.
Some argue that challenges exist regarding multi-criteria sustainability appraisal: double counting of
indicators might arise due to correlations between indicators measuring some aspect of the same
underlying principle. While the response in literature would sometimes be to test indicators for
statistical correlation, it is believed that this risk is mitigated through the value-judgements that was
made by expert-based/participatory weighting used in this study as well as the trade-of approach that
the AHP used on each of the 50 indicators identified in this study. It must also be noted that there will
always to some extent be some correlation between different measures of the same aggregate (OECD
and JRC, 2008).
A concern when using additive aggregations such as the EWA is the full compensability they imply:
some indicators performing poorly can be compensated by other sufficiently higher performing
indicators i.e. through trade-offs (OECD and JRC, 2008). While it is possible to implement a “penalty
system” for when one indicator performs notably worse than others and adjusting the composite
indicator accordingly, it was decided to exclude this from this study since it is believed that the expert-
based/participatory weighting used in this study is sufficient for establishing weights for the diverse
range of indicators toward aggregation and the AHP allowed for lower compensability compared to
that of EWA. Also, since it is believed that detailed and important information might get lost through
this type of aggregation through compensation, this study accommodates for this by using ISA to
compare all indicators to each other and provide an overview analysis. While determining a 𝑆𝐼 might
be useful to some extent for the company under consideration, analysing the data through ISA is
considered to be of more value and a significant contributing factor of this study.
Stellenbosch University https://scholar.sun.ac.za
150
Regardless of what aggregation approach is used, all indicator weights are essentially value
judgements. While some researchers choose to determine weightings based on statistical methods
others might choose to implement a reward/penalty system to elements that are considered more
important based on expert opinion. According to the OECD/JRC Handbook, the absence of an
“objective” approach for determining weighting and aggregation methods does not necessarily lead
to rejection of the validity of composite indicators as long as the entire process is transparent (OECD
and JRC, 2008).
The final sustainability index (𝑆𝐼) can thus be determined by aggregation through a (nested) weighted
sum approach, which is the summation of all component parts of the framework based on relative
weightings as follows:
𝑆𝐼 = ∑ 𝑊𝑁𝐶𝑁𝑁
where 𝑊𝑁 = AoS weight
and 𝐶𝑁 = AoS (performance or satisfaction) rating
𝐶𝑁 = ∑ 𝑊𝑁,𝑖𝐼𝑁,𝑖𝑖
where 𝑊𝑁,𝑖 = indicator weight
and 𝐼𝑁,𝑖 = indicator (performance or satisfaction) rating
𝐼𝑁,𝑖 = ∑ 𝑤𝑁,𝑖,𝑛𝑥𝑁,𝑖,𝑛𝑛
where 𝑤𝑁,𝑖,𝑛 = variable weight
and 𝑥𝑁,𝑖,𝑛 = variable (performance or satisfaction) rating
Following the above-mentioned method and using the satisfaction ratings in Table 8-2 for determining
a sustainability index value for the Mellowcabs company delivered a final value of 𝑆𝐼 = 7.35. Since
this value is based on indicator satisfaction ratings and not performance ratings, it cannot be used to
compare Mellowcabs to other microtransit companies towards assessing its relative sustainability
performance. Instead, this value only has meaning to the company itself as it provides a perceived
standard from which it can aim to further improve this rating (by identifying and improving high-
priority indicators). At this stage, the meaning of the 𝑆𝐼 is limited to the company’s perception and
satisfaction through value-judgement.
A sustainability index can also be determined for each of the three sustainability domains. This can be
done with the following equation (also refer to Table 7-11):
𝑆𝐼𝑑𝑜𝑚 = ∑ (𝑊𝑁 · 𝑊𝑁,𝑑𝑜𝑚
∑ (𝑊𝑁 · 𝑊𝑁,𝑑𝑜𝑚)𝑁) 𝐶𝑁
𝑁
Using this equation, the sustainability indices for each domain were obtained as follows: 𝑆𝐼𝑒𝑛𝑣 = 7.76;
𝑆𝐼𝑠𝑜𝑐 = 7.14; and 𝑆𝐼𝑒𝑐𝑜 = 7.30. Based on the satisfaction (perceived performance) value-judgements
of three individuals from Mellowcabs, it can be assumed that the company performs best with regard
to environmental development, and struggles the most with social development at this stage,
Stellenbosch University https://scholar.sun.ac.za
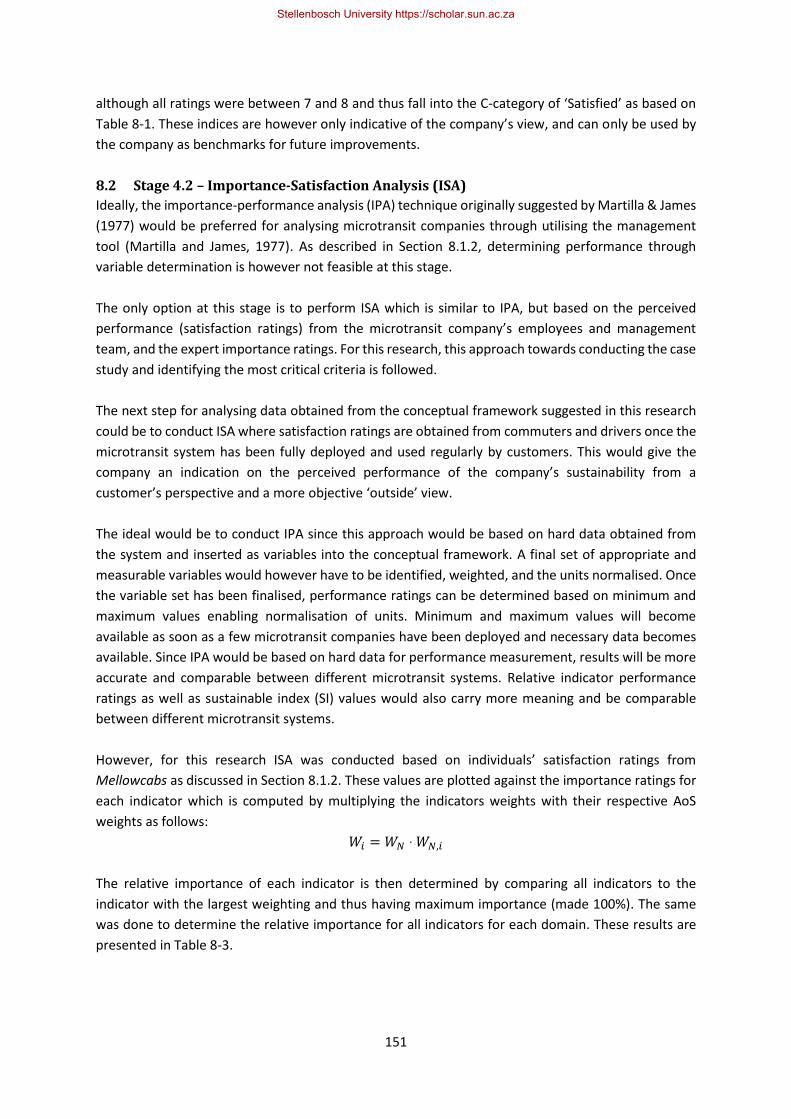
151
although all ratings were between 7 and 8 and thus fall into the C-category of ‘Satisfied’ as based on
Table 8-1. These indices are however only indicative of the company’s view, and can only be used by
the company as benchmarks for future improvements.
8.2 Stage 4.2 – Importance-Satisfaction Analysis (ISA)
Ideally, the importance-performance analysis (IPA) technique originally suggested by Martilla & James
(1977) would be preferred for analysing microtransit companies through utilising the management
tool (Martilla and James, 1977). As described in Section 8.1.2, determining performance through
variable determination is however not feasible at this stage.
The only option at this stage is to perform ISA which is similar to IPA, but based on the perceived
performance (satisfaction ratings) from the microtransit company’s employees and management
team, and the expert importance ratings. For this research, this approach towards conducting the case
study and identifying the most critical criteria is followed.
The next step for analysing data obtained from the conceptual framework suggested in this research
could be to conduct ISA where satisfaction ratings are obtained from commuters and drivers once the
microtransit system has been fully deployed and used regularly by customers. This would give the
company an indication on the perceived performance of the company’s sustainability from a
customer’s perspective and a more objective ‘outside’ view.
The ideal would be to conduct IPA since this approach would be based on hard data obtained from
the system and inserted as variables into the conceptual framework. A final set of appropriate and
measurable variables would however have to be identified, weighted, and the units normalised. Once
the variable set has been finalised, performance ratings can be determined based on minimum and
maximum values enabling normalisation of units. Minimum and maximum values will become
available as soon as a few microtransit companies have been deployed and necessary data becomes
available. Since IPA would be based on hard data for performance measurement, results will be more
accurate and comparable between different microtransit systems. Relative indicator performance
ratings as well as sustainable index (SI) values would also carry more meaning and be comparable
between different microtransit systems.
However, for this research ISA was conducted based on individuals’ satisfaction ratings from
Mellowcabs as discussed in Section 8.1.2. These values are plotted against the importance ratings for
each indicator which is computed by multiplying the indicators weights with their respective AoS
weights as follows:
𝑊𝑖 = 𝑊𝑁 · 𝑊𝑁,𝑖
The relative importance of each indicator is then determined by comparing all indicators to the
indicator with the largest weighting and thus having maximum importance (made 100%). The same
was done to determine the relative importance for all indicators for each domain. These results are
presented in Table 8-3.
Stellenbosch University https://scholar.sun.ac.za
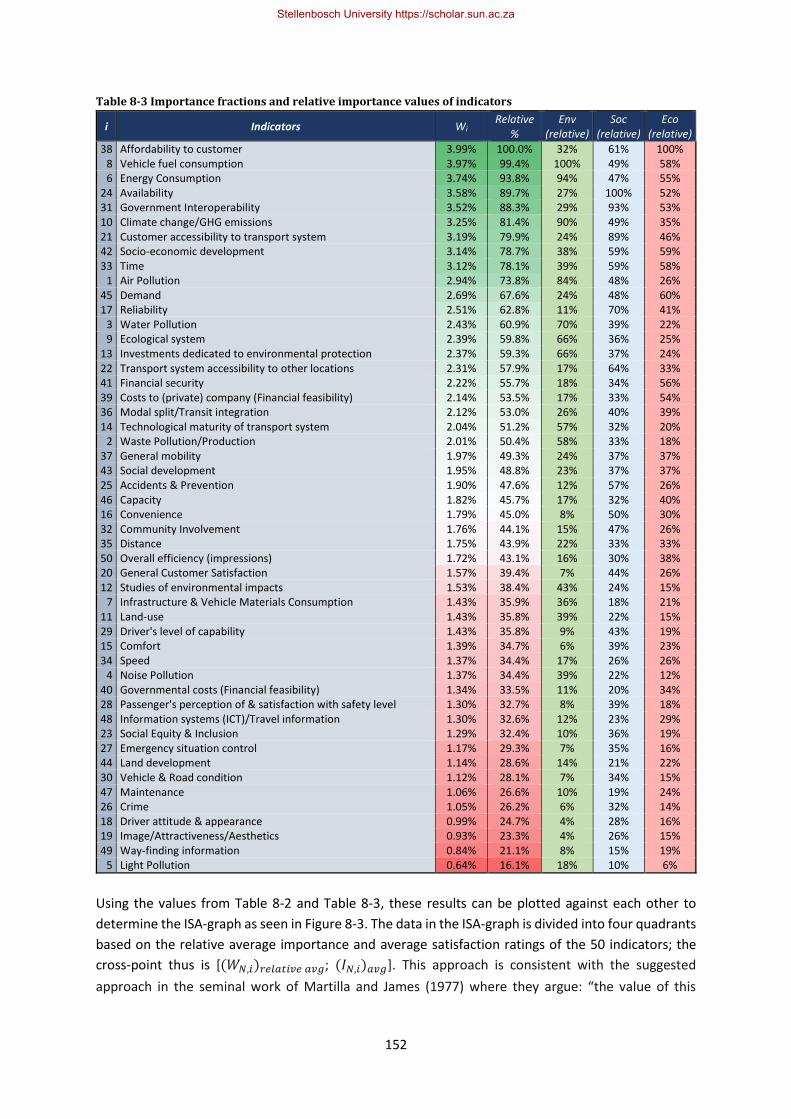
152
Table 8-3 Importance fractions and relative importance values of indicators
i Indicators Wi Relative
% Env
(relative) Soc
(relative) Eco
(relative)
38 Affordability to customer 3.99% 100.0% 32% 61% 100% 8 Vehicle fuel consumption 3.97% 99.4% 100% 49% 58% 6 Energy Consumption 3.74% 93.8% 94% 47% 55%
24 Availability 3.58% 89.7% 27% 100% 52% 31 Government Interoperability 3.52% 88.3% 29% 93% 53% 10 Climate change/GHG emissions 3.25% 81.4% 90% 49% 35% 21 Customer accessibility to transport system 3.19% 79.9% 24% 89% 46% 42 Socio-economic development 3.14% 78.7% 38% 59% 59% 33 Time 3.12% 78.1% 39% 59% 58%
1 Air Pollution 2.94% 73.8% 84% 48% 26% 45 Demand 2.69% 67.6% 24% 48% 60% 17 Reliability 2.51% 62.8% 11% 70% 41%
3 Water Pollution 2.43% 60.9% 70% 39% 22% 9 Ecological system 2.39% 59.8% 66% 36% 25%
13 Investments dedicated to environmental protection 2.37% 59.3% 66% 37% 24% 22 Transport system accessibility to other locations 2.31% 57.9% 17% 64% 33% 41 Financial security 2.22% 55.7% 18% 34% 56% 39 Costs to (private) company (Financial feasibility) 2.14% 53.5% 17% 33% 54% 36 Modal split/Transit integration 2.12% 53.0% 26% 40% 39% 14 Technological maturity of transport system 2.04% 51.2% 57% 32% 20%
2 Waste Pollution/Production 2.01% 50.4% 58% 33% 18% 37 General mobility 1.97% 49.3% 24% 37% 37% 43 Social development 1.95% 48.8% 23% 37% 37% 25 Accidents & Prevention 1.90% 47.6% 12% 57% 26% 46 Capacity 1.82% 45.7% 17% 32% 40% 16 Convenience 1.79% 45.0% 8% 50% 30% 32 Community Involvement 1.76% 44.1% 15% 47% 26% 35 Distance 1.75% 43.9% 22% 33% 33% 50 Overall efficiency (impressions) 1.72% 43.1% 16% 30% 38% 20 General Customer Satisfaction 1.57% 39.4% 7% 44% 26% 12 Studies of environmental impacts 1.53% 38.4% 43% 24% 15%
7 Infrastructure & Vehicle Materials Consumption 1.43% 35.9% 36% 18% 21% 11 Land-use 1.43% 35.8% 39% 22% 15% 29 Driver's level of capability 1.43% 35.8% 9% 43% 19% 15 Comfort 1.39% 34.7% 6% 39% 23% 34 Speed 1.37% 34.4% 17% 26% 26%
4 Noise Pollution 1.37% 34.4% 39% 22% 12% 40 Governmental costs (Financial feasibility) 1.34% 33.5% 11% 20% 34% 28 Passenger's perception of & satisfaction with safety level 1.30% 32.7% 8% 39% 18% 48 Information systems (ICT)/Travel information 1.30% 32.6% 12% 23% 29% 23 Social Equity & Inclusion 1.29% 32.4% 10% 36% 19% 27 Emergency situation control 1.17% 29.3% 7% 35% 16% 44 Land development 1.14% 28.6% 14% 21% 22% 30 Vehicle & Road condition 1.12% 28.1% 7% 34% 15% 47 Maintenance 1.06% 26.6% 10% 19% 24% 26 Crime 1.05% 26.2% 6% 32% 14% 18 Driver attitude & appearance 0.99% 24.7% 4% 28% 16% 19 Image/Attractiveness/Aesthetics 0.93% 23.3% 4% 26% 15% 49 Way-finding information 0.84% 21.1% 8% 15% 19%
5 Light Pollution 0.64% 16.1% 18% 10% 6%
Using the values from Table 8-2 and Table 8-3, these results can be plotted against each other to
determine the ISA-graph as seen in Figure 8-3. The data in the ISA-graph is divided into four quadrants
based on the relative average importance and average satisfaction ratings of the 50 indicators; the
cross-point thus is [(𝑊𝑁,𝑖)𝑟𝑒𝑙𝑎𝑡𝑖𝑣𝑒 𝑎𝑣𝑔; (𝐼𝑁,𝑖)𝑎𝑣𝑔]. This approach is consistent with the suggested
approach in the seminal work of Martilla and James (1977) where they argue: “the value of this
Stellenbosch University https://scholar.sun.ac.za
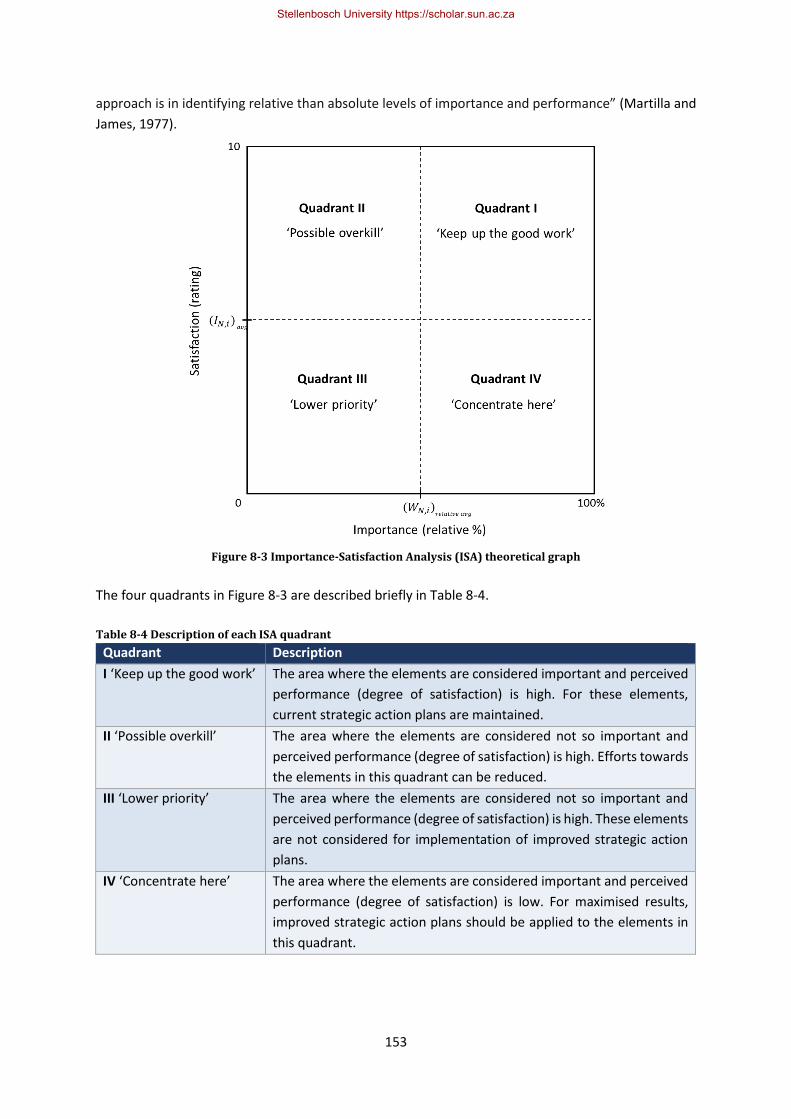
153
approach is in identifying relative than absolute levels of importance and performance” (Martilla and
James, 1977).
Figure 8-3 Importance-Satisfaction Analysis (ISA) theoretical graph
The four quadrants in Figure 8-3 are described briefly in Table 8-4.
Table 8-4 Description of each ISA quadrant
Quadrant Description
I ‘Keep up the good work’ The area where the elements are considered important and perceived
performance (degree of satisfaction) is high. For these elements,
current strategic action plans are maintained.
II ‘Possible overkill’ The area where the elements are considered not so important and
perceived performance (degree of satisfaction) is high. Efforts towards
the elements in this quadrant can be reduced.
III ‘Lower priority’ The area where the elements are considered not so important and
perceived performance (degree of satisfaction) is high. These elements
are not considered for implementation of improved strategic action
plans.
IV ‘Concentrate here’ The area where the elements are considered important and perceived
performance (degree of satisfaction) is low. For maximised results,
improved strategic action plans should be applied to the elements in
this quadrant.
Stellenbosch University https://scholar.sun.ac.za
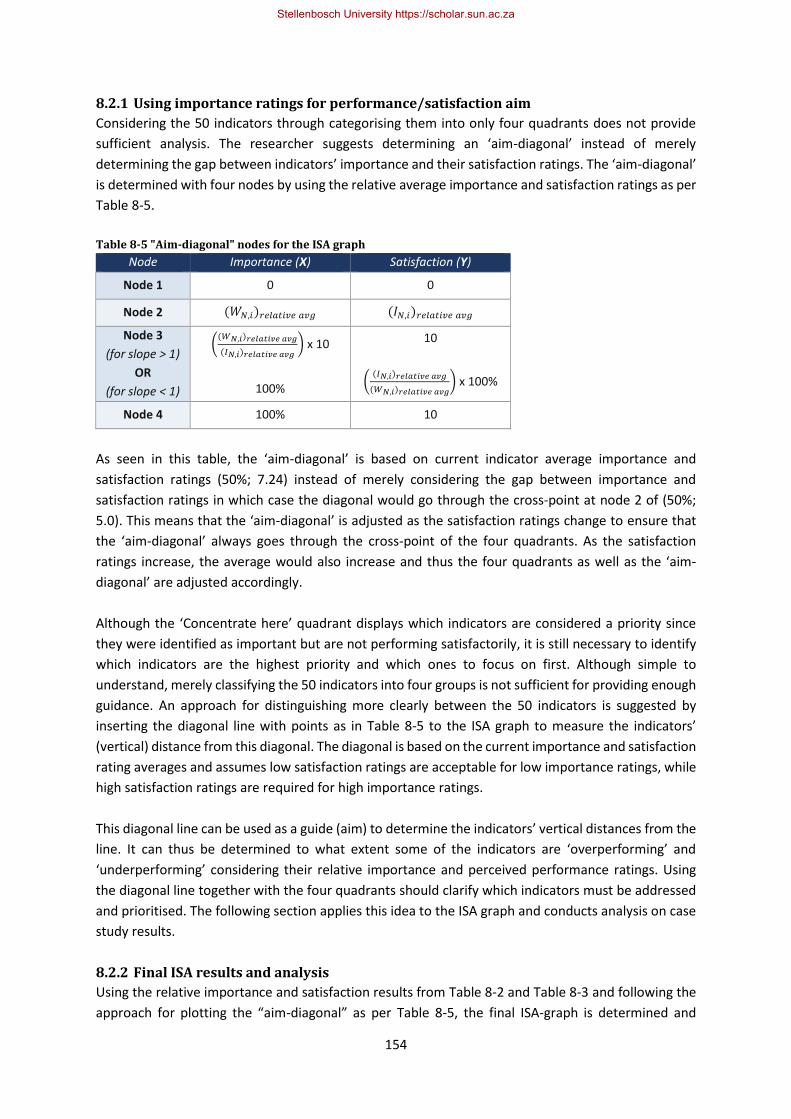
154
8.2.1 Using importance ratings for performance/satisfaction aim
Considering the 50 indicators through categorising them into only four quadrants does not provide
sufficient analysis. The researcher suggests determining an ‘aim-diagonal’ instead of merely
determining the gap between indicators’ importance and their satisfaction ratings. The ‘aim-diagonal’
is determined with four nodes by using the relative average importance and satisfaction ratings as per
Table 8-5.
Table 8-5 "Aim-diagonal" nodes for the ISA graph
Node Importance (X) Satisfaction (Y)
Node 1 0 0
Node 2 (𝑊𝑁,𝑖)𝑟𝑒𝑙𝑎𝑡𝑖𝑣𝑒 𝑎𝑣𝑔 (𝐼𝑁,𝑖)𝑟𝑒𝑙𝑎𝑡𝑖𝑣𝑒 𝑎𝑣𝑔
Node 3
(for slope > 1)
OR
(for slope < 1)
((𝑊𝑁,𝑖)𝑟𝑒𝑙𝑎𝑡𝑖𝑣𝑒 𝑎𝑣𝑔
(𝐼𝑁,𝑖)𝑟𝑒𝑙𝑎𝑡𝑖𝑣𝑒 𝑎𝑣𝑔) x 10
100%
10
((𝐼𝑁,𝑖)𝑟𝑒𝑙𝑎𝑡𝑖𝑣𝑒 𝑎𝑣𝑔
(𝑊𝑁,𝑖)𝑟𝑒𝑙𝑎𝑡𝑖𝑣𝑒 𝑎𝑣𝑔) x 100%
Node 4 100% 10
As seen in this table, the ‘aim-diagonal’ is based on current indicator average importance and
satisfaction ratings (50%; 7.24) instead of merely considering the gap between importance and
satisfaction ratings in which case the diagonal would go through the cross-point at node 2 of (50%;
5.0). This means that the ‘aim-diagonal’ is adjusted as the satisfaction ratings change to ensure that
the ‘aim-diagonal’ always goes through the cross-point of the four quadrants. As the satisfaction
ratings increase, the average would also increase and thus the four quadrants as well as the ‘aim-
diagonal’ are adjusted accordingly.
Although the ‘Concentrate here’ quadrant displays which indicators are considered a priority since
they were identified as important but are not performing satisfactorily, it is still necessary to identify
which indicators are the highest priority and which ones to focus on first. Although simple to
understand, merely classifying the 50 indicators into four groups is not sufficient for providing enough
guidance. An approach for distinguishing more clearly between the 50 indicators is suggested by
inserting the diagonal line with points as in Table 8-5 to the ISA graph to measure the indicators’
(vertical) distance from this diagonal. The diagonal is based on the current importance and satisfaction
rating averages and assumes low satisfaction ratings are acceptable for low importance ratings, while
high satisfaction ratings are required for high importance ratings.
This diagonal line can be used as a guide (aim) to determine the indicators’ vertical distances from the
line. It can thus be determined to what extent some of the indicators are ‘overperforming’ and
‘underperforming’ considering their relative importance and perceived performance ratings. Using
the diagonal line together with the four quadrants should clarify which indicators must be addressed
and prioritised. The following section applies this idea to the ISA graph and conducts analysis on case
study results.
8.2.2 Final ISA results and analysis
Using the relative importance and satisfaction results from Table 8-2 and Table 8-3 and following the
approach for plotting the “aim-diagonal” as per Table 8-5, the final ISA-graph is determined and
Stellenbosch University https://scholar.sun.ac.za

155
illustrated in Figure 8-4. The same approach was followed and ISA-graphs could also be determined
for each domain specifically based on the relative importance values of each indicator for that domain.
The environmental, social, and economic ISA-graphs are depicted in Figure 8-5, Figure 8-6, and Figure
8-7 respectively.
Stellenbosch University https://scholar.sun.ac.za

156
Figure 8-4 Importance-satisfaction analysis (ISA) diagram (Mellowcabs)
1
2 34
5
6
7
8
9
10
11
12
13
1415
16
1718
19
20
2122
23 2425
26
27 28
29
30
31
32
33
34
35
36
37 383940
41
424344
45
46
47
48
49
50
50%; 7,24
0% 10% 20% 30% 40% 50% 60% 70% 80% 90% 100%
0
1
2
3
4
5
6
7
8
9
10
0
1
2
3
4
5
6
7
8
9
10
0% 10% 20% 30% 40% 50% 60% 70% 80% 90% 100%
Sati
sfac
tio
n (
Avg
rat
ing)
Importance (relative %)
ISA
Possible overkill Keep up the good work
Lower priority Concentrate here
Stellenbosch University https://scholar.sun.ac.za
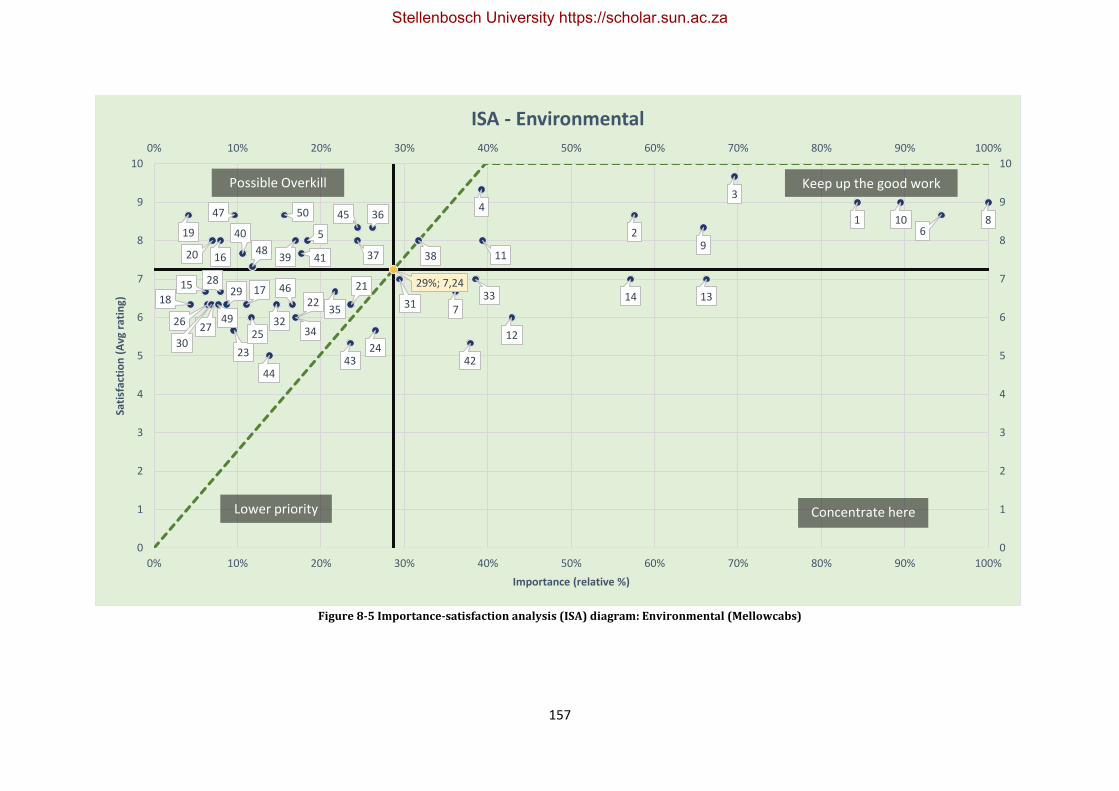
157
Figure 8-5 Importance-satisfaction analysis (ISA) diagram: Environmental (Mellowcabs)
12
34
5 6
7
8
9
10
11
12
131415
16
1718
19
20
21
22
23 2425
26 27
2829
30
31
32
33
34
35
36
37 3839
40
41
424344
45
46
47
48
49
50
29%; 7,24
0% 10% 20% 30% 40% 50% 60% 70% 80% 90% 100%
0
1
2
3
4
5
6
7
8
9
10
0
1
2
3
4
5
6
7
8
9
10
0% 10% 20% 30% 40% 50% 60% 70% 80% 90% 100%
Sati
sfac
tio
n (
Avg
rat
ing)
Importance (relative %)
ISA - Environmental
Possible Overkill Keep up the good work
Lower priority Concentrate here
Stellenbosch University https://scholar.sun.ac.za
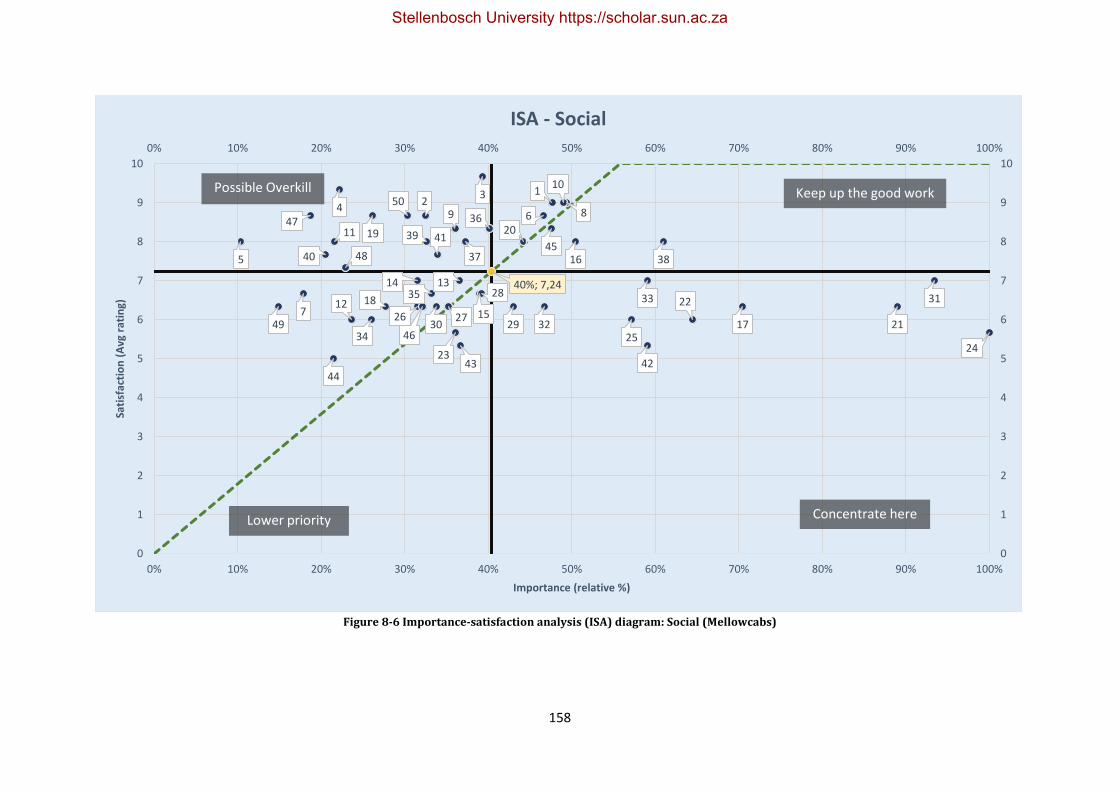
158
Figure 8-6 Importance-satisfaction analysis (ISA) diagram: Social (Mellowcabs)
12
34
5
6
7
89
10
11
12
1314
15
16
17
18
19 20
21
22
2324
25
26 27
28
2930
31
32
33
34
35
36
37 38
39
40
41
424344
45
46
47
48
49
50
40%; 7,24
0% 10% 20% 30% 40% 50% 60% 70% 80% 90% 100%
0
1
2
3
4
5
6
7
8
9
10
0
1
2
3
4
5
6
7
8
9
10
0% 10% 20% 30% 40% 50% 60% 70% 80% 90% 100%
Sati
sfac
tio
n (
Avg
rat
ing)
Importance (relative %)
ISA - Social
Possible Overkill Keep up the good work
Lower priority Concentrate here
Stellenbosch University https://scholar.sun.ac.za
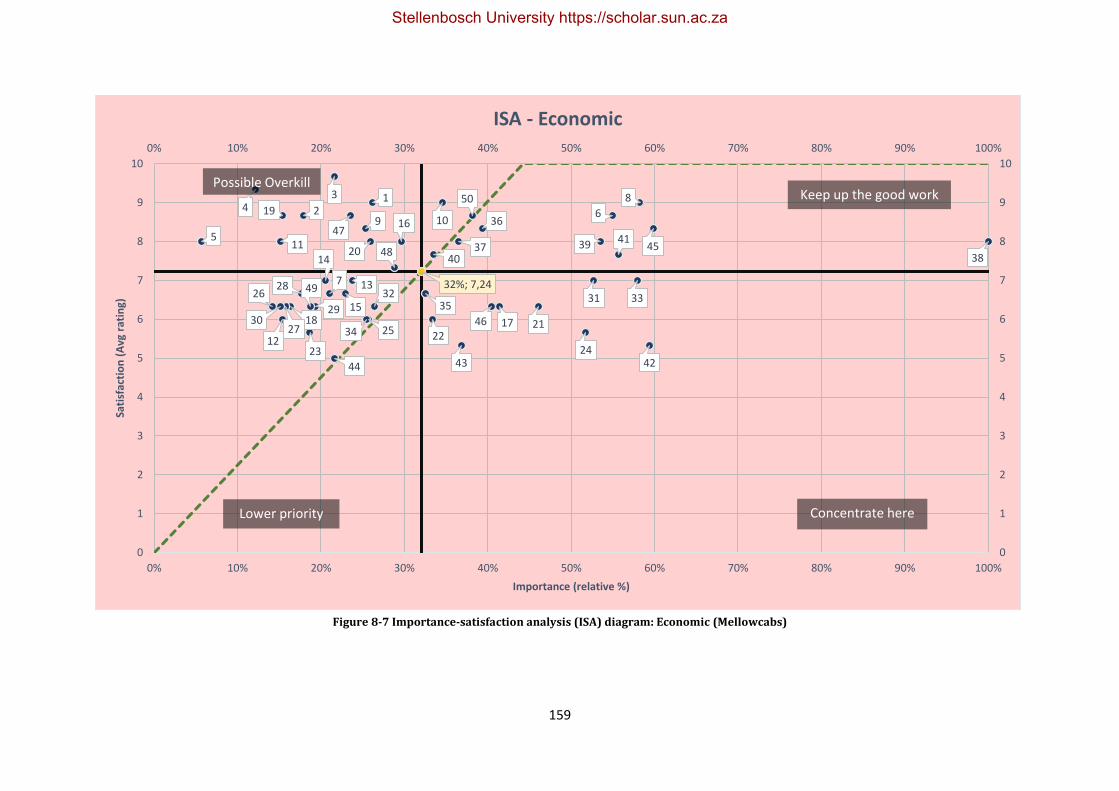
159
Figure 8-7 Importance-satisfaction analysis (ISA) diagram: Economic (Mellowcabs)
12
34
5
6
7
8
9 10
11
12
13
14
15
16
1718
19
20
2122
23 24
25
26
27
28
2930
3132 33
34
35
36
3738
3940
41
424344
45
46
47
48
49
50
32%; 7,24
0% 10% 20% 30% 40% 50% 60% 70% 80% 90% 100%
0
1
2
3
4
5
6
7
8
9
10
0
1
2
3
4
5
6
7
8
9
10
0% 10% 20% 30% 40% 50% 60% 70% 80% 90% 100%
Sati
sfac
tio
n (
Avg
rat
ing)
Importance (relative %)
ISA - Economic
Possible OverkillKeep up the good work
Lower priority Concentrate here
Stellenbosch University https://scholar.sun.ac.za
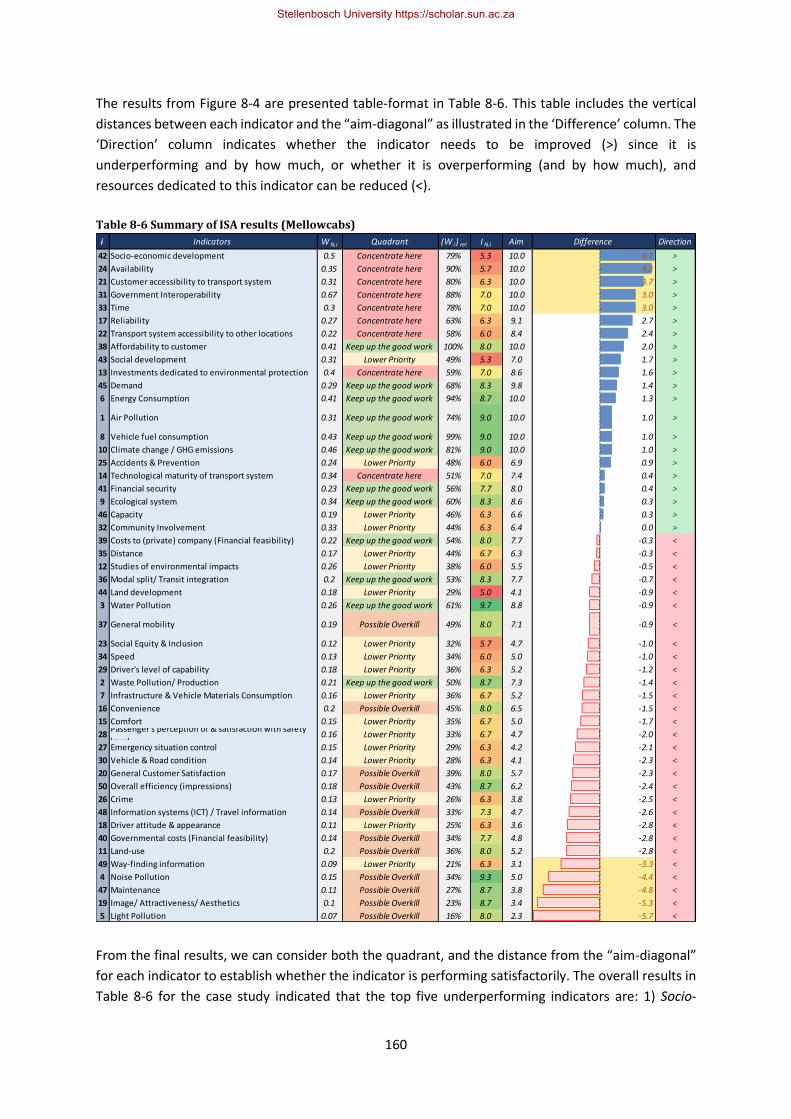
160
The results from Figure 8-4 are presented table-format in Table 8-6. This table includes the vertical
distances between each indicator and the “aim-diagonal” as illustrated in the ‘Difference’ column. The
‘Direction’ column indicates whether the indicator needs to be improved (>) since it is
underperforming and by how much, or whether it is overperforming (and by how much), and
resources dedicated to this indicator can be reduced (<).
Table 8-6 Summary of ISA results (Mellowcabs)
From the final results, we can consider both the quadrant, and the distance from the “aim-diagonal”
for each indicator to establish whether the indicator is performing satisfactorily. The overall results in
Table 8-6 for the case study indicated that the top five underperforming indicators are: 1) Socio-
i Indicators W N,i Quadrant (W i ) rel I N,i Aim Difference Direction
42 Socio-economic development 0.5 Concentrate here 79% 5.3 10.0 4.7 >
24 Availability 0.35 Concentrate here 90% 5.7 10.0 4.3 >
21 Customer accessibility to transport system 0.31 Concentrate here 80% 6.3 10.0 3.7 >
31 Government Interoperability 0.67 Concentrate here 88% 7.0 10.0 3.0 >
33 Time 0.3 Concentrate here 78% 7.0 10.0 3.0 >
17 Reliability 0.27 Concentrate here 63% 6.3 9.1 2.7 >
22 Transport system accessibility to other locations 0.22 Concentrate here 58% 6.0 8.4 2.4 >
38 Affordability to customer 0.41 Keep up the good work 100% 8.0 10.0 2.0 >
43 Social development 0.31 Lower Priority 49% 5.3 7.0 1.7 >
13 Investments dedicated to environmental protection 0.4 Concentrate here 59% 7.0 8.6 1.6 >
45 Demand 0.29 Keep up the good work 68% 8.3 9.8 1.4 >
6 Energy Consumption 0.41 Keep up the good work 94% 8.7 10.0 1.3 >
1 Air Pollution 0.31 Keep up the good work 74% 9.0 10.0 1.0 >
8 Vehicle fuel consumption 0.43 Keep up the good work 99% 9.0 10.0 1.0 >
10 Climate change / GHG emissions 0.46 Keep up the good work 81% 9.0 10.0 1.0 >
25 Accidents & Prevention 0.24 Lower Priority 48% 6.0 6.9 0.9 >
14 Technological maturity of transport system 0.34 Concentrate here 51% 7.0 7.4 0.4 >
41 Financial security 0.23 Keep up the good work 56% 7.7 8.0 0.4 >
9 Ecological system 0.34 Keep up the good work 60% 8.3 8.6 0.3 >
46 Capacity 0.19 Lower Priority 46% 6.3 6.6 0.3 >
32 Community Involvement 0.33 Lower Priority 44% 6.3 6.4 0.0 >
39 Costs to (private) company (Financial feasibility) 0.22 Keep up the good work 54% 8.0 7.7 -0.3 <
35 Distance 0.17 Lower Priority 44% 6.7 6.3 -0.3 <
12 Studies of environmental impacts 0.26 Lower Priority 38% 6.0 5.5 -0.5 <
36 Modal split/ Transit integration 0.2 Keep up the good work 53% 8.3 7.7 -0.7 <
44 Land development 0.18 Lower Priority 29% 5.0 4.1 -0.9 <
3 Water Pollution 0.26 Keep up the good work 61% 9.7 8.8 -0.9 <
37 General mobility 0.19 Possible Overkill 49% 8.0 7.1 -0.9 <
23 Social Equity & Inclusion 0.12 Lower Priority 32% 5.7 4.7 -1.0 <
34 Speed 0.13 Lower Priority 34% 6.0 5.0 -1.0 <
29 Driver's level of capability 0.18 Lower Priority 36% 6.3 5.2 -1.2 <
2 Waste Pollution/ Production 0.21 Keep up the good work 50% 8.7 7.3 -1.4 <
7 Infrastructure & Vehicle Materials Consumption 0.16 Lower Priority 36% 6.7 5.2 -1.5 <
16 Convenience 0.2 Possible Overkill 45% 8.0 6.5 -1.5 <
15 Comfort 0.15 Lower Priority 35% 6.7 5.0 -1.7 <
28Passenger's perception of & satisfaction with safety
level0.16 Lower Priority 33% 6.7 4.7 -2.0 <
27 Emergency situation control 0.15 Lower Priority 29% 6.3 4.2 -2.1 <
30 Vehicle & Road condition 0.14 Lower Priority 28% 6.3 4.1 -2.3 <
20 General Customer Satisfaction 0.17 Possible Overkill 39% 8.0 5.7 -2.3 <
50 Overall efficiency (impressions) 0.18 Possible Overkill 43% 8.7 6.2 -2.4 <
26 Crime 0.13 Lower Priority 26% 6.3 3.8 -2.5 <
48 Information systems (ICT) / Travel information 0.14 Possible Overkill 33% 7.3 4.7 -2.6 <
18 Driver attitude & appearance 0.11 Lower Priority 25% 6.3 3.6 -2.8 <
40 Governmental costs (Financial feasibility) 0.14 Possible Overkill 34% 7.7 4.8 -2.8 <
11 Land-use 0.2 Possible Overkill 36% 8.0 5.2 -2.8 <
49 Way-finding information 0.09 Lower Priority 21% 6.3 3.1 -3.3 <
4 Noise Pollution 0.15 Possible Overkill 34% 9.3 5.0 -4.4 <
47 Maintenance 0.11 Possible Overkill 27% 8.7 3.8 -4.8 <
19 Image/ Attractiveness/ Aesthetics 0.1 Possible Overkill 23% 8.7 3.4 -5.3 <
5 Light Pollution 0.07 Possible Overkill 16% 8.0 2.3 -5.7 <
Stellenbosch University https://scholar.sun.ac.za
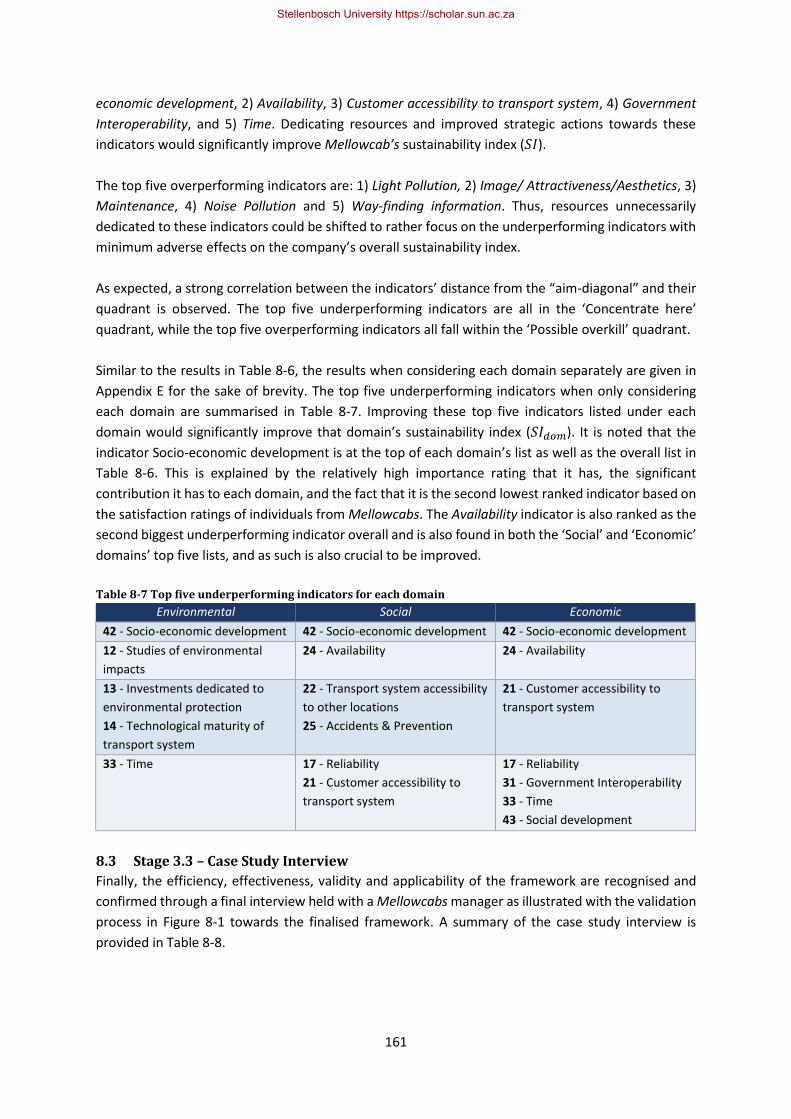
161
economic development, 2) Availability, 3) Customer accessibility to transport system, 4) Government
Interoperability, and 5) Time. Dedicating resources and improved strategic actions towards these
indicators would significantly improve Mellowcab’s sustainability index (𝑆𝐼).
The top five overperforming indicators are: 1) Light Pollution, 2) Image/ Attractiveness/Aesthetics, 3)
Maintenance, 4) Noise Pollution and 5) Way-finding information. Thus, resources unnecessarily
dedicated to these indicators could be shifted to rather focus on the underperforming indicators with
minimum adverse effects on the company’s overall sustainability index.
As expected, a strong correlation between the indicators’ distance from the “aim-diagonal” and their
quadrant is observed. The top five underperforming indicators are all in the ‘Concentrate here’
quadrant, while the top five overperforming indicators all fall within the ‘Possible overkill’ quadrant.
Similar to the results in Table 8-6, the results when considering each domain separately are given in
Appendix E for the sake of brevity. The top five underperforming indicators when only considering
each domain are summarised in Table 8-7. Improving these top five indicators listed under each
domain would significantly improve that domain’s sustainability index (𝑆𝐼𝑑𝑜𝑚). It is noted that the
indicator Socio-economic development is at the top of each domain’s list as well as the overall list in
Table 8-6. This is explained by the relatively high importance rating that it has, the significant
contribution it has to each domain, and the fact that it is the second lowest ranked indicator based on
the satisfaction ratings of individuals from Mellowcabs. The Availability indicator is also ranked as the
second biggest underperforming indicator overall and is also found in both the ‘Social’ and ‘Economic’
domains’ top five lists, and as such is also crucial to be improved.
Table 8-7 Top five underperforming indicators for each domain
Environmental Social Economic
42 - Socio-economic development 42 - Socio-economic development 42 - Socio-economic development
12 - Studies of environmental
impacts
24 - Availability
24 - Availability
13 - Investments dedicated to
environmental protection
14 - Technological maturity of
transport system
22 - Transport system accessibility
to other locations
25 - Accidents & Prevention
21 - Customer accessibility to
transport system
33 - Time 17 - Reliability
21 - Customer accessibility to
transport system
17 - Reliability
31 - Government Interoperability
33 - Time
43 - Social development
8.3 Stage 3.3 – Case Study Interview
Finally, the efficiency, effectiveness, validity and applicability of the framework are recognised and
confirmed through a final interview held with a Mellowcabs manager as illustrated with the validation
process in Figure 8-1 towards the finalised framework. A summary of the case study interview is
provided in Table 8-8.
Stellenbosch University https://scholar.sun.ac.za
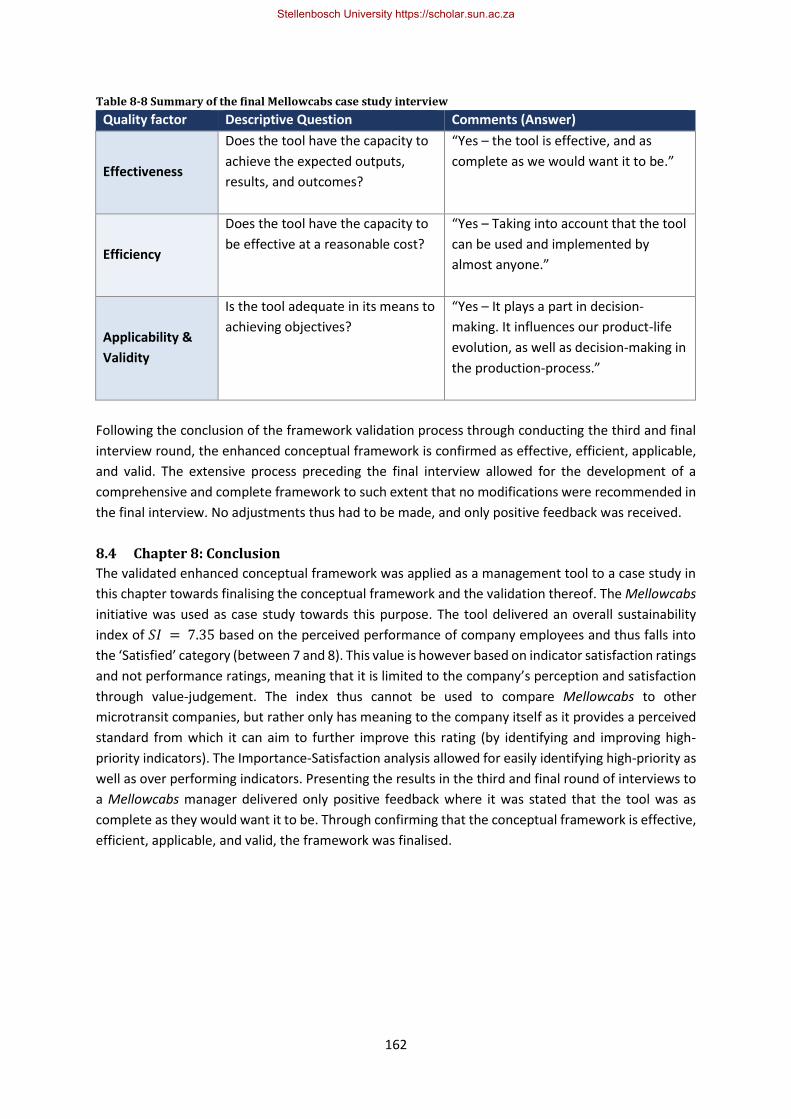
162
Table 8-8 Summary of the final Mellowcabs case study interview
Quality factor Descriptive Question Comments (Answer)
Effectiveness
Does the tool have the capacity to
achieve the expected outputs,
results, and outcomes?
“Yes – the tool is effective, and as
complete as we would want it to be.”
Efficiency
Does the tool have the capacity to
be effective at a reasonable cost?
“Yes – Taking into account that the tool
can be used and implemented by
almost anyone.”
Applicability &
Validity
Is the tool adequate in its means to
achieving objectives?
“Yes – It plays a part in decision-
making. It influences our product-life
evolution, as well as decision-making in
the production-process.”
Following the conclusion of the framework validation process through conducting the third and final
interview round, the enhanced conceptual framework is confirmed as effective, efficient, applicable,
and valid. The extensive process preceding the final interview allowed for the development of a
comprehensive and complete framework to such extent that no modifications were recommended in
the final interview. No adjustments thus had to be made, and only positive feedback was received.
8.4 Chapter 8: Conclusion
The validated enhanced conceptual framework was applied as a management tool to a case study in
this chapter towards finalising the conceptual framework and the validation thereof. The Mellowcabs
initiative was used as case study towards this purpose. The tool delivered an overall sustainability
index of 𝑆𝐼 = 7.35 based on the perceived performance of company employees and thus falls into
the ‘Satisfied’ category (between 7 and 8). This value is however based on indicator satisfaction ratings
and not performance ratings, meaning that it is limited to the company’s perception and satisfaction
through value-judgement. The index thus cannot be used to compare Mellowcabs to other
microtransit companies, but rather only has meaning to the company itself as it provides a perceived
standard from which it can aim to further improve this rating (by identifying and improving high-
priority indicators). The Importance-Satisfaction analysis allowed for easily identifying high-priority as
well as over performing indicators. Presenting the results in the third and final round of interviews to
a Mellowcabs manager delivered only positive feedback where it was stated that the tool was as
complete as they would want it to be. Through confirming that the conceptual framework is effective,
efficient, applicable, and valid, the framework was finalised.
Stellenbosch University https://scholar.sun.ac.za

163
This page intentionally left blank
Stellenbosch University https://scholar.sun.ac.za
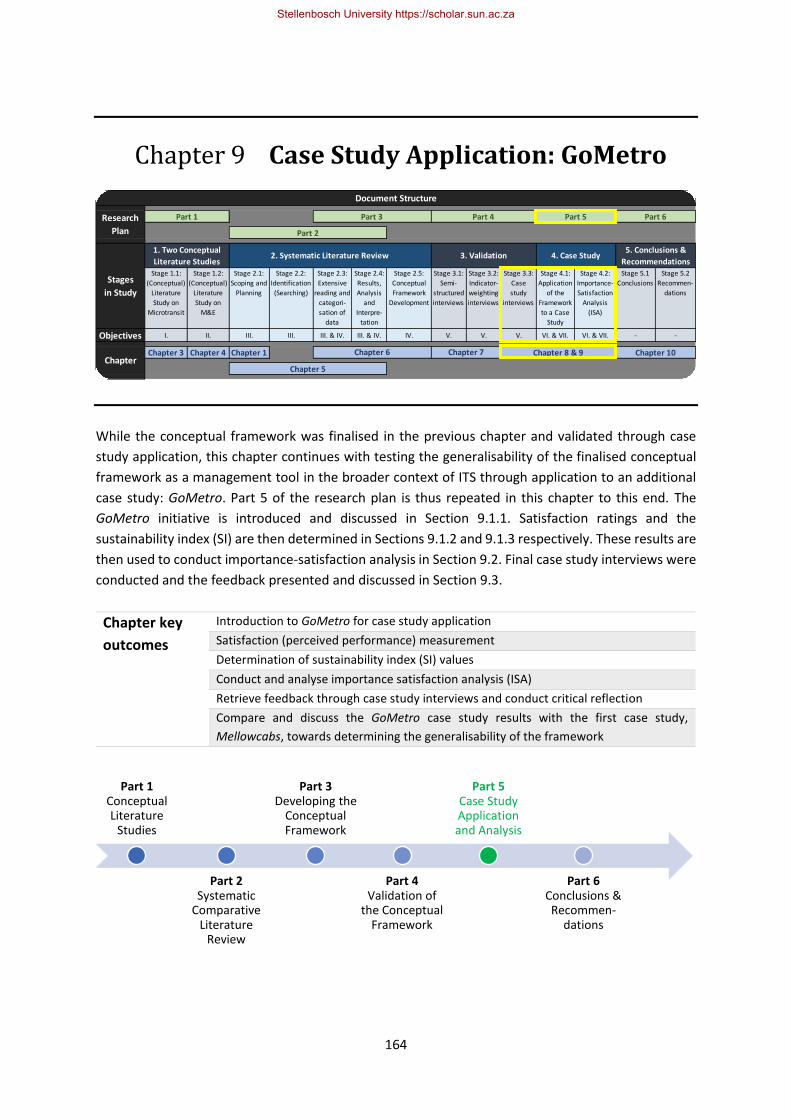
164
Chapter 9 Case Study Application: GoMetro
While the conceptual framework was finalised in the previous chapter and validated through case
study application, this chapter continues with testing the generalisability of the finalised conceptual
framework as a management tool in the broader context of ITS through application to an additional
case study: GoMetro. Part 5 of the research plan is thus repeated in this chapter to this end. The
GoMetro initiative is introduced and discussed in Section 9.1.1. Satisfaction ratings and the
sustainability index (SI) are then determined in Sections 9.1.2 and 9.1.3 respectively. These results are
then used to conduct importance-satisfaction analysis in Section 9.2. Final case study interviews were
conducted and the feedback presented and discussed in Section 9.3.
Chapter key
outcomes
Introduction to GoMetro for case study application
Satisfaction (perceived performance) measurement
Determination of sustainability index (SI) values
Conduct and analyse importance satisfaction analysis (ISA)
Retrieve feedback through case study interviews and conduct critical reflection
Compare and discuss the GoMetro case study results with the first case study,
Mellowcabs, towards determining the generalisability of the framework
Stage 1.1:
(Conceptual)
Literature
Study on
Microtransit
Stage 1.2:
(Conceptual)
Literature
Study on
M&E
Stage 2.1:
Scoping and
Planning
Stage 2.2:
Identification
(Searching)
Stage 2.3:
Extensive
reading and
categori-
sation of
data
Stage 2.4:
Results,
Analysis
and
Interpre-
tation
Stage 2.5:
Conceptual
Framework
Development
Stage 3.1:
Semi-
structured
interviews
Stage 3.2:
Indicator-
weighting
interviews
Stage 3.3:
Case
study
interviews
Stage 4.1:
Application
of the
Framework
to a Case
Study
Stage 4.2:
Importance-
Satisfaction
Analysis
(ISA)
Stage 5.1
Conclusions
Stage 5.2
Recommen-
dations
Objectives I. II. III. III. III. & IV. III. & IV. IV. V. V. V. VI. & VII. VI. & VII. - -
Chapter 3 Chapter 4 Chapter 1
Stages
in Study
1. Two Conceptual
Literature Studies2. Systematic Literature Review 3. Validation 4. Case Study
5. Conclusions &
Recommendations
ChapterChapter 6 Chapter 7 Chapter 8 & 9 Chapter 10
Chapter 5
Document Structure
Research
Plan
Part 1 Part 3 Part 4 Part 5 Part 6
Part 2
Part 1 Conceptual Literature
Studies
Part 2 Systematic
Comparative Literature
Review
Part 3 Developing the
Conceptual Framework
Part 4 Validation of
the Conceptual Framework
Part 5 Case Study Application and Analysis
Part 6 Conclusions & Recommen-
dations
Stellenbosch University https://scholar.sun.ac.za
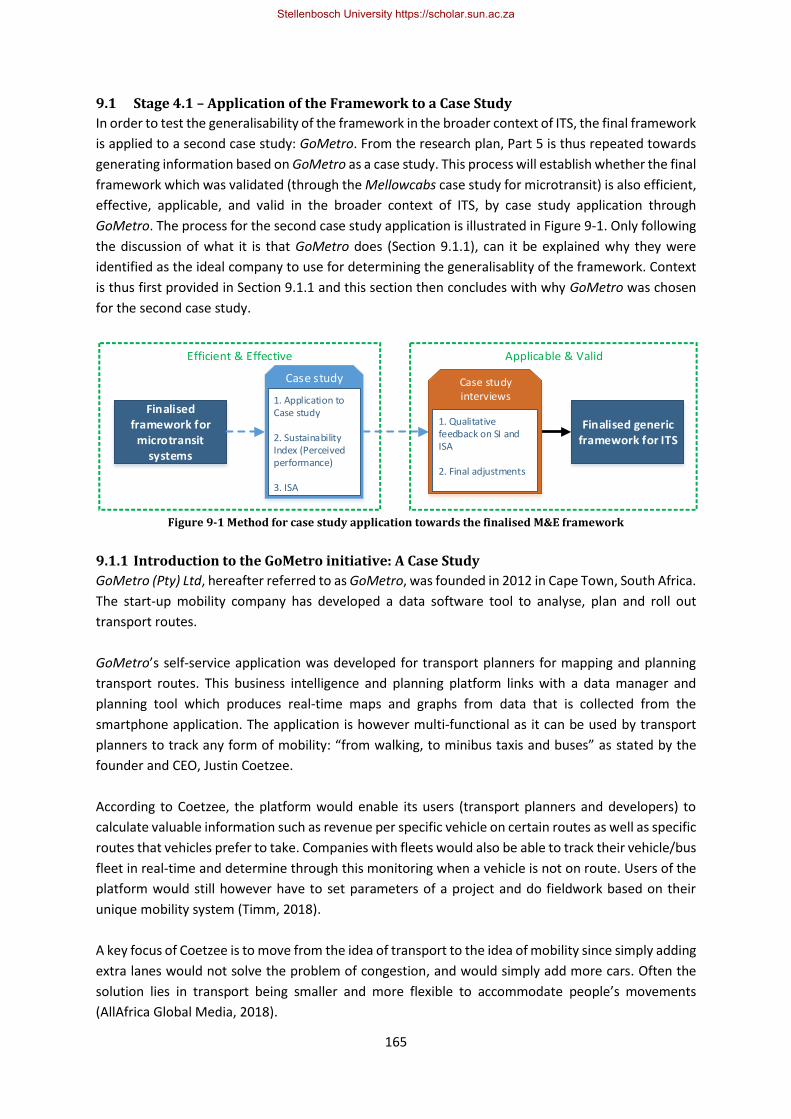
165
9.1 Stage 4.1 – Application of the Framework to a Case Study
In order to test the generalisability of the framework in the broader context of ITS, the final framework
is applied to a second case study: GoMetro. From the research plan, Part 5 is thus repeated towards
generating information based on GoMetro as a case study. This process will establish whether the final
framework which was validated (through the Mellowcabs case study for microtransit) is also efficient,
effective, applicable, and valid in the broader context of ITS, by case study application through
GoMetro. The process for the second case study application is illustrated in Figure 9-1. Only following
the discussion of what it is that GoMetro does (Section 9.1.1), can it be explained why they were
identified as the ideal company to use for determining the generalisablity of the framework. Context
is thus first provided in Section 9.1.1 and this section then concludes with why GoMetro was chosen
for the second case study.
Finalised framework for
microtransit systems
Finalised generic framework for ITS
Efficient & Effective Applicable & Valid
Case study interviews
1. Qualitative feedback on SI and ISA
2. Final adjustments
Case study
1. Application to Case study
2. Sustainability Index (Perceived performance)
3. ISA
Figure 9-1 Method for case study application towards the finalised M&E framework
9.1.1 Introduction to the GoMetro initiative: A Case Study
GoMetro (Pty) Ltd, hereafter referred to as GoMetro, was founded in 2012 in Cape Town, South Africa.
The start-up mobility company has developed a data software tool to analyse, plan and roll out
transport routes.
GoMetro’s self-service application was developed for transport planners for mapping and planning
transport routes. This business intelligence and planning platform links with a data manager and
planning tool which produces real-time maps and graphs from data that is collected from the
smartphone application. The application is however multi-functional as it can be used by transport
planners to track any form of mobility: “from walking, to minibus taxis and buses” as stated by the
founder and CEO, Justin Coetzee.
According to Coetzee, the platform would enable its users (transport planners and developers) to
calculate valuable information such as revenue per specific vehicle on certain routes as well as specific
routes that vehicles prefer to take. Companies with fleets would also be able to track their vehicle/bus
fleet in real-time and determine through this monitoring when a vehicle is not on route. Users of the
platform would still however have to set parameters of a project and do fieldwork based on their
unique mobility system (Timm, 2018).
A key focus of Coetzee is to move from the idea of transport to the idea of mobility since simply adding
extra lanes would not solve the problem of congestion, and would simply add more cars. Often the
solution lies in transport being smaller and more flexible to accommodate people’s movements
(AllAfrica Global Media, 2018).
Stellenbosch University https://scholar.sun.ac.za
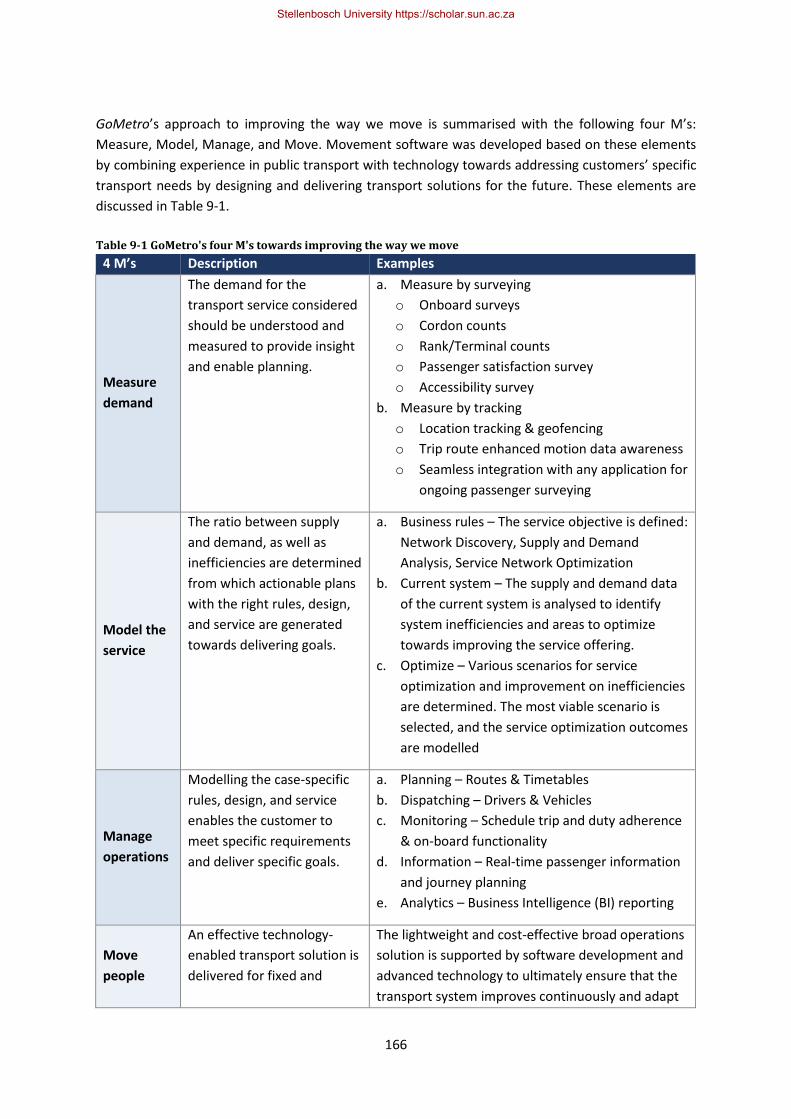
166
GoMetro’s approach to improving the way we move is summarised with the following four M’s:
Measure, Model, Manage, and Move. Movement software was developed based on these elements
by combining experience in public transport with technology towards addressing customers’ specific
transport needs by designing and delivering transport solutions for the future. These elements are
discussed in Table 9-1.
Table 9-1 GoMetro's four M's towards improving the way we move
4 M’s Description Examples
Measure
demand
The demand for the
transport service considered
should be understood and
measured to provide insight
and enable planning.
a. Measure by surveying
o Onboard surveys
o Cordon counts
o Rank/Terminal counts
o Passenger satisfaction survey
o Accessibility survey
b. Measure by tracking
o Location tracking & geofencing
o Trip route enhanced motion data awareness
o Seamless integration with any application for
ongoing passenger surveying
Model the
service
The ratio between supply
and demand, as well as
inefficiencies are determined
from which actionable plans
with the right rules, design,
and service are generated
towards delivering goals.
a. Business rules – The service objective is defined:
Network Discovery, Supply and Demand
Analysis, Service Network Optimization
b. Current system – The supply and demand data
of the current system is analysed to identify
system inefficiencies and areas to optimize
towards improving the service offering.
c. Optimize – Various scenarios for service
optimization and improvement on inefficiencies
are determined. The most viable scenario is
selected, and the service optimization outcomes
are modelled
Manage
operations
Modelling the case-specific
rules, design, and service
enables the customer to
meet specific requirements
and deliver specific goals.
a. Planning – Routes & Timetables
b. Dispatching – Drivers & Vehicles
c. Monitoring – Schedule trip and duty adherence
& on-board functionality
d. Information – Real-time passenger information
and journey planning
e. Analytics – Business Intelligence (BI) reporting
Move
people
An effective technology-
enabled transport solution is
delivered for fixed and
The lightweight and cost-effective broad operations
solution is supported by software development and
advanced technology to ultimately ensure that the
transport system improves continuously and adapt
Stellenbosch University https://scholar.sun.ac.za
167
flexible transport service
operations.
to efficient operations and overall improved
mobility of people.
While GoMetro itself is not a transport company owning vehicles or providing direct transport, they
do however provide intelligent transport solutions to existing traditional transport companies.
GoMetro thus have multiple clients from different contexts of transportation. Through application of
their business model with the four M’s strategy to specific cases of transport, they then in a sense
transform these traditional transport systems into intelligent / “smart mobility” transport companies.
Since GoMetro’s approach is not to focus on one specific type of transport (like microtransit), but
rather to consider different unique cases of mobility (various clients) and determine how to improve
that specific case towards a “smart mobility” solution, GoMetro was identified as the ideal company
for the second case study for determining whether the developed framework in this research would
be applicable to a wider audience of ITS and “smart mobility” besides microtransit for which it was
originally designed for and thus generalisable to the broader context of ITS (Coetzee, 2019).
9.1.2 Satisfaction measurement
As in Section 8.1.2, the process for determining the ‘perceived performance’ through satisfaction
ratings will be repeated in this section based on the second case study. While some data might be
available for GoMetro where it was not yet available for microtransit as it has not yet been fully
deployed, satisfaction ratings will again have to be used. This would allow fair comparison between
the two case studies since the data will be normalised. As discussed in Section 8.1.2, using satisfaction
ratings also makes the evaluation process more feasible, meaning continuous monitoring would be
practical for evaluators. Based on the indicator satisfaction ratings, a sustainability index (SI) can again
be determined and the data analysed through application of Importance-Satisfaction Analysis (ISA) as
a management tool for sustainability assessment.
During application to the second case study, it would be recognised whether the conceptual
framework might be used as a management tool through performance measurement. This would
enable the company to do Importance-Performance Analysis (IPA), which should give more accurate
results as these would be based on real-world performance data. While this was not yet possible for
microtransit systems, the second case study might indicate whether this would be possible and
practical at this stage.
The survey was thus repeated, but this time focused on GoMetro. Since GoMetro is a small start-up
company, only three individuals were identified as managers/strategists that could be interviewed
towards this purpose. These individuals had to provide satisfaction ratings to each of the 50 indicators
based on a 10-point satisfaction (perceived performance) Likert-scale as was done in the Mellowcabs
case study. The same seven categories identified by Freitas (2013), as was shown previously in Table
8-1, was used.
In this case study, the interviewees had to make value-judgements on each indicator based on his/her
knowledge and opinion of GoMetro’s performance. The results are presented and analysed in Table
9-2. Included are the average (Avg), standard deviation (StDev) and coefficient of variance (CV) for
each indicator.
Stellenbosch University https://scholar.sun.ac.za
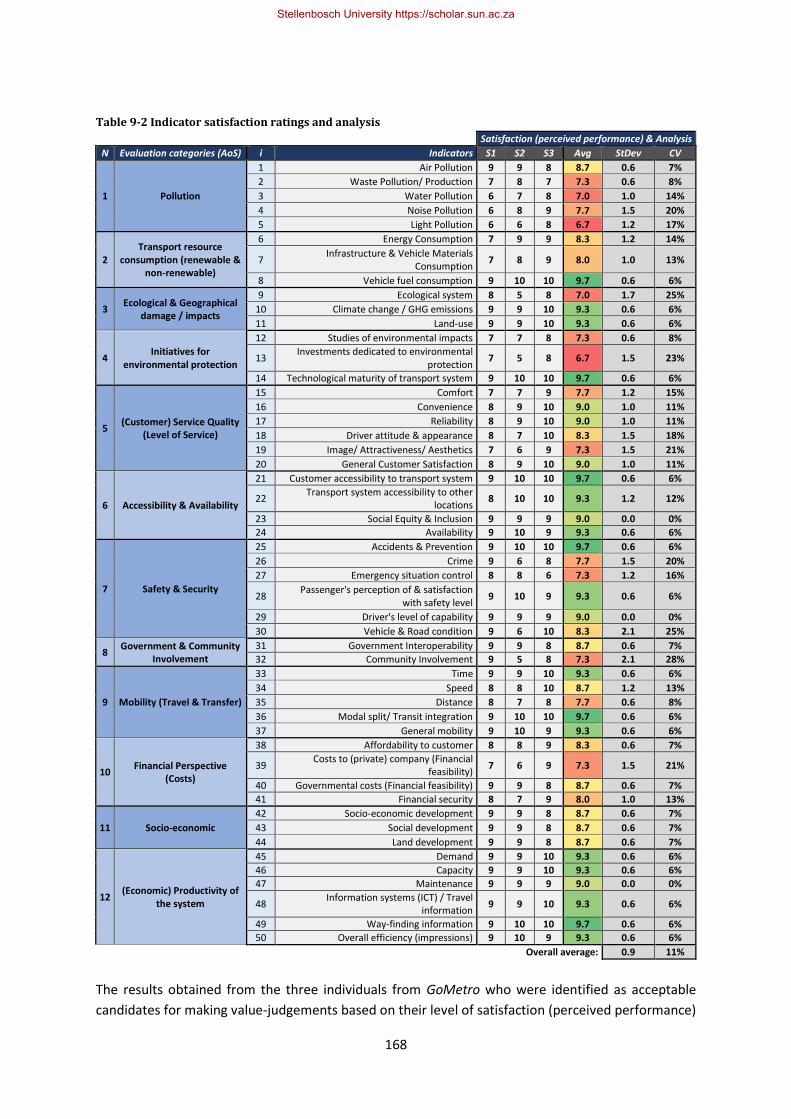
168
Table 9-2 Indicator satisfaction ratings and analysis
Satisfaction (perceived performance) & Analysis
N Evaluation categories (AoS) i Indicators S1 S2 S3 Avg StDev CV
1 Pollution
1 Air Pollution 9 9 8 8.7 0.6 7%
2 Waste Pollution/ Production 7 8 7 7.3 0.6 8%
3 Water Pollution 6 7 8 7.0 1.0 14%
4 Noise Pollution 6 8 9 7.7 1.5 20%
5 Light Pollution 6 6 8 6.7 1.2 17%
2 Transport resource
consumption (renewable & non-renewable)
6 Energy Consumption 7 9 9 8.3 1.2 14%
7 Infrastructure & Vehicle Materials
Consumption 7 8 9 8.0 1.0 13%
8 Vehicle fuel consumption 9 10 10 9.7 0.6 6%
3 Ecological & Geographical
damage / impacts
9 Ecological system 8 5 8 7.0 1.7 25%
10 Climate change / GHG emissions 9 9 10 9.3 0.6 6%
11 Land-use 9 9 10 9.3 0.6 6%
4 Initiatives for
environmental protection
12 Studies of environmental impacts 7 7 8 7.3 0.6 8%
13 Investments dedicated to environmental
protection 7 5 8 6.7 1.5 23%
14 Technological maturity of transport system 9 10 10 9.7 0.6 6%
5 (Customer) Service Quality
(Level of Service)
15 Comfort 7 7 9 7.7 1.2 15%
16 Convenience 8 9 10 9.0 1.0 11%
17 Reliability 8 9 10 9.0 1.0 11%
18 Driver attitude & appearance 8 7 10 8.3 1.5 18%
19 Image/ Attractiveness/ Aesthetics 7 6 9 7.3 1.5 21%
20 General Customer Satisfaction 8 9 10 9.0 1.0 11%
6 Accessibility & Availability
21 Customer accessibility to transport system 9 10 10 9.7 0.6 6%
22 Transport system accessibility to other
locations 8 10 10 9.3 1.2 12%
23 Social Equity & Inclusion 9 9 9 9.0 0.0 0%
24 Availability 9 10 9 9.3 0.6 6%
7 Safety & Security
25 Accidents & Prevention 9 10 10 9.7 0.6 6%
26 Crime 9 6 8 7.7 1.5 20%
27 Emergency situation control 8 8 6 7.3 1.2 16%
28 Passenger's perception of & satisfaction
with safety level 9 10 9 9.3 0.6 6%
29 Driver's level of capability 9 9 9 9.0 0.0 0%
30 Vehicle & Road condition 9 6 10 8.3 2.1 25%
8 Government & Community
Involvement 31 Government Interoperability 9 9 8 8.7 0.6 7%
32 Community Involvement 9 5 8 7.3 2.1 28%
9 Mobility (Travel & Transfer)
33 Time 9 9 10 9.3 0.6 6%
34 Speed 8 8 10 8.7 1.2 13%
35 Distance 8 7 8 7.7 0.6 8%
36 Modal split/ Transit integration 9 10 10 9.7 0.6 6%
37 General mobility 9 10 9 9.3 0.6 6%
10 Financial Perspective
(Costs)
38 Affordability to customer 8 8 9 8.3 0.6 7%
39 Costs to (private) company (Financial
feasibility) 7 6 9 7.3 1.5 21%
40 Governmental costs (Financial feasibility) 9 9 8 8.7 0.6 7%
41 Financial security 8 7 9 8.0 1.0 13%
11 Socio-economic
42 Socio-economic development 9 9 8 8.7 0.6 7%
43 Social development 9 9 8 8.7 0.6 7%
44 Land development 9 9 8 8.7 0.6 7%
12 (Economic) Productivity of
the system
45 Demand 9 9 10 9.3 0.6 6%
46 Capacity 9 9 10 9.3 0.6 6%
47 Maintenance 9 9 9 9.0 0.0 0%
48 Information systems (ICT) / Travel
information 9 9 10 9.3 0.6 6%
49 Way-finding information 9 10 10 9.7 0.6 6%
50 Overall efficiency (impressions) 9 10 9 9.3 0.6 6%
Overall average: 0.9 11%
The results obtained from the three individuals from GoMetro who were identified as acceptable
candidates for making value-judgements based on their level of satisfaction (perceived performance)
Stellenbosch University https://scholar.sun.ac.za
169
with each indicator, again delivered adequate and useful results when analysed. An overall average
standard deviation (StDev) for all indicators of 0.9 was obtained and an average coefficient of variance
(CV) of only 11% indicating that participants provided similar ratings and were consistent in providing
similar value judgements. The indicators that had the most inconsistent ratings and thus the highest
coefficients of variance are: Community Involvement (28%), Ecological system (25%), and Vehicle &
Road condition (25%).
As with the previous case study, the satisfaction ratings still give an indication of which indictors are
performing better or worse than others even though the data might be considered less accurate than
factual figures that would be based on hard data. As explained in Section 8.1.2, a normalisation
process will not be required in this study since satisfaction ratings already have the same unit and is
thus considered normalised. The data in Table 9-2 obtained from the second case study interviews
can thus be used to determine the Sustainability Index (SI) value for GoMetro.
9.1.3 Determining the Sustainability Index (SI)
In section 8.1.3 it was established that the conceptual framework developed in this study was
constructed to deliver a single final value expressing the sustainability performance of the microtransit
system under consideration, called the sustainability index (𝑆𝐼). In the second case study, the process
for determining a final sustainability index (𝑆𝐼) through aggregation will be identical to the process
that was established earlier for microtransit systems. All equations as per section 8.1.3 are thus used
to determine the 𝑆𝐼 and 𝑆𝐼𝑑𝑜𝑚 values for the GoMetro case study.
The sustainability index (𝑆𝐼) for the GoMetro case study was determined and delivered a final value
of 𝑆𝐼 = 8.62. It should be kept in mind that this value is based on internal value-judgements and as
such cannot be used to accurately compare the company’s relative sustainability performance with
similar companies. Sustainability index values could also be determined for each sustainability domain
( 𝑆𝐼𝑑𝑜𝑚). The sustainability indices for each domain were obtained as follows: 𝑆𝐼𝑒𝑛𝑣 = 8.47; 𝑆𝐼𝑠𝑜𝑐 =
8.67; and 𝑆𝐼𝑒𝑐𝑜 = 8.67.
Based on the satisfaction (perceived performance) value-judgements of three individuals from
GoMetro, it can be assumed that the company performs better regarding social and economic
development compared to environmental development at this stage. All average index ratings were
however between 8 and 9 meaning they fall in the B-Category of Table 8-1 indicating that GoMetro is
‘Very satisfied’ with their sustainability performance based on the participants’ results. Similar to the
previous case study, these indices are however only indicative of the company’s view, and can only be
used by the company as benchmarks for future improvements.
9.2 Stage 4.2 – Importance-Satisfaction Analysis (ISA)
While ideally, the importance-performance analysis (IPA) technique originally suggested by Martilla &
James (1977) would be preferred for analysing the GoMetro case study (Martilla and James, 1977), in
Sections 8.1.2 and 9.1.2 it was established that determining performance through variable
determination was not a feasible solution at this stage. To allow fair comparison between the two
case studies, the exact same approach had to be followed as was done for the Mellowcabs case study.
Stellenbosch University https://scholar.sun.ac.za

170
Since satisfaction ratings were used to determine the Sustainability Index (SI) values for GoMetro, this
means that the result values are normalised and as such can thus be used to conduct Importance-
Satisfaction Analysis (ISA). The approach for conducting Importance-Satisfaction Analysis (ISA) was
explained in Section 8.2. An approach for clearly distinguishing between indicators’ performance
values based on their relative importance was introduced in Section 8.2.1 with the development of
the ‘aim-diagonal’. This would indicate to what extent indicators are ‘overperforming’ and
‘underperforming’ considering their relative importance and perceived performance ratings to
indicate which indicators must be addressed and prioritised. This approach was used again when
determining the final ISA-graphs to analyse the data obtained from the GoMetro case study
interviews.
9.2.1 Final ISA results and analysis
Using the relative importance values for each indicator that was established previously with the
indicator-weighting interviews (Table 8-3) along with the satisfaction value results from the GoMetro
case study interviews (Table 9-2), the approach for plotting the ISA-graphs, and the approach for
determining the ‘aim-diagonal’, the final ISA-graph for the GoMetro case study was determined and
is illustrated in Figure 9-2. This process was repeated for each domain specifically based on the relative
importance values of each indicator for that domain. The environmental, social, and economic ISA-
graphs are depicted in Figure 9-3, Figure 9-4, and Figure 9-5 respectively.
Stellenbosch University https://scholar.sun.ac.za
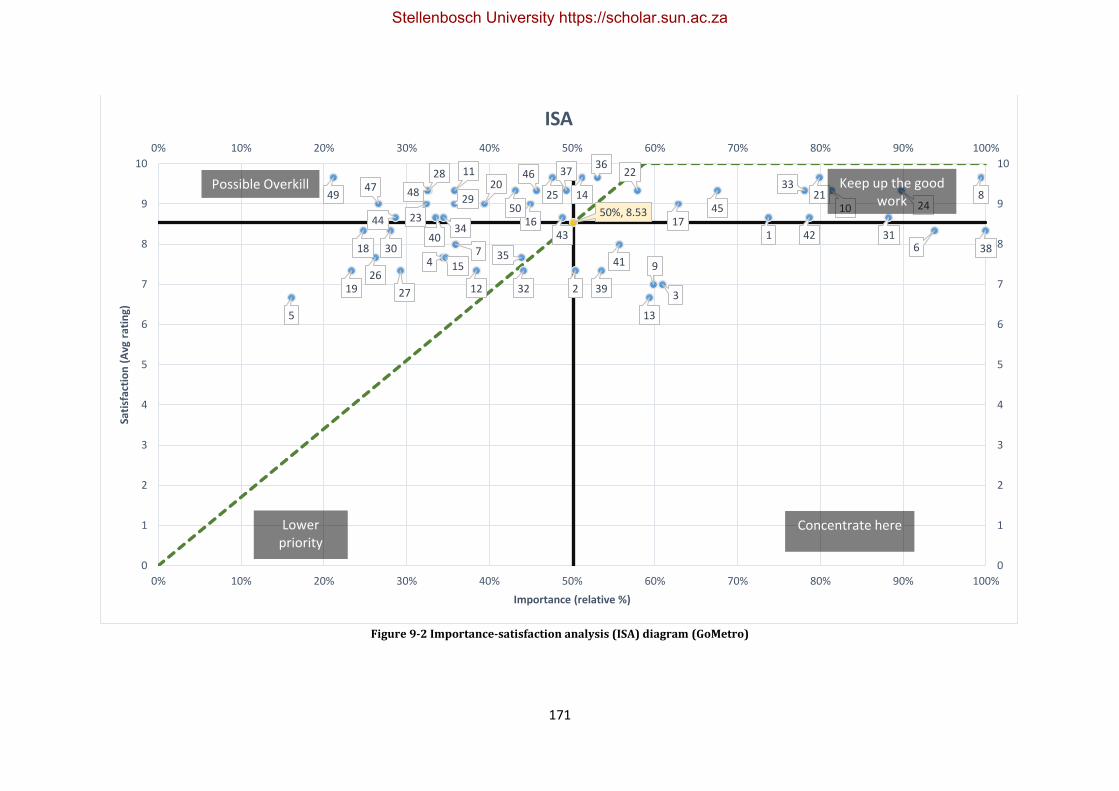
171
Figure 9-2 Importance-satisfaction analysis (ISA) diagram (GoMetro)
1
23
4
5
67
8
9
10
11
12
13
14
15
16 17
18
19
2021
22
2324
25
26
27
28
29
3031
32
33
34
35
3637
38
39
40
41
424344
45
4647 4849
50 50%, 8.53
0% 10% 20% 30% 40% 50% 60% 70% 80% 90% 100%
0
1
2
3
4
5
6
7
8
9
10
0
1
2
3
4
5
6
7
8
9
10
0% 10% 20% 30% 40% 50% 60% 70% 80% 90% 100%
Sati
sfac
tio
n (
Avg
rat
ing)
Importance (relative %)
ISA
Possible Overkill Keep up the good work
Lowerpriority
Concentrate here
Stellenbosch University https://scholar.sun.ac.za
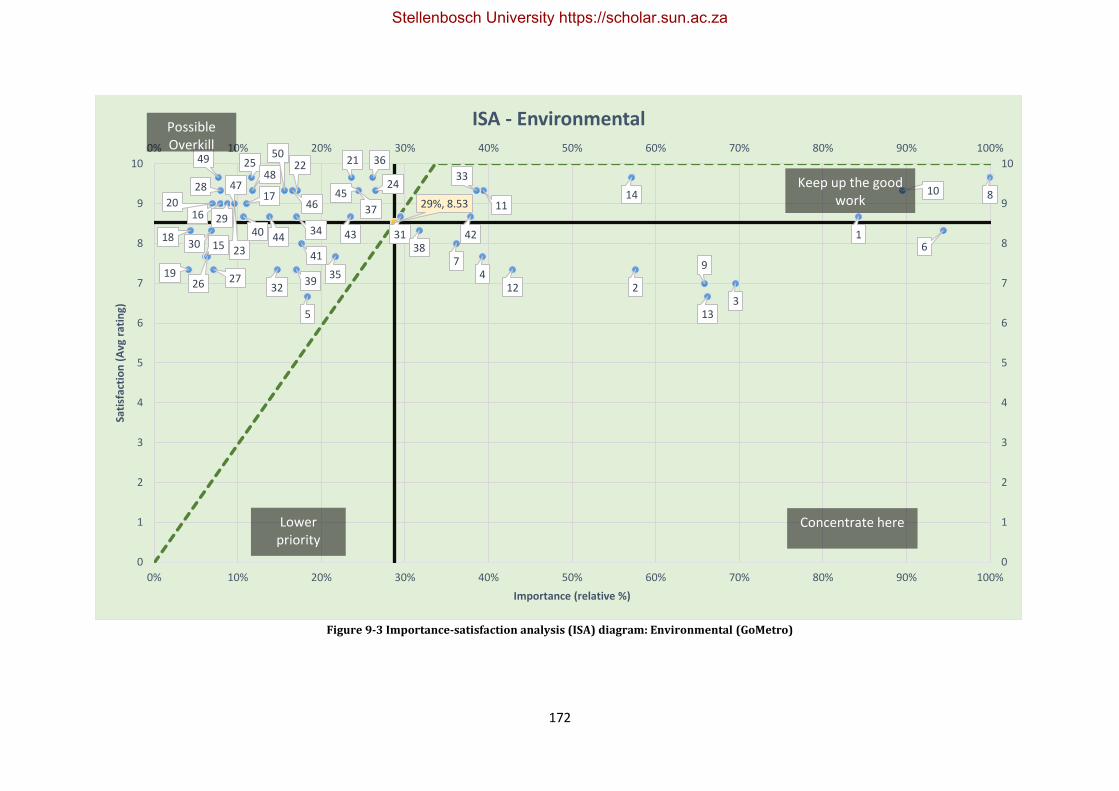
172
Figure 9-3 Importance-satisfaction analysis (ISA) diagram: Environmental (GoMetro)
1
23
4
5
67
8
9
1011
12
13
14
15
16
17
18
19
20
2122
23
24
25
26 27
28
29
3031
32
33
34
35
36
37
38
39
40
41
424344
4546
4748
49 50
29%, 8.53
0% 10% 20% 30% 40% 50% 60% 70% 80% 90% 100%
0
1
2
3
4
5
6
7
8
9
10
0
1
2
3
4
5
6
7
8
9
10
0% 10% 20% 30% 40% 50% 60% 70% 80% 90% 100%
Sati
sfac
tio
n (
Avg
rat
ing)
Importance (relative %)
ISA - EnvironmentalPossibleOverkill
Keep up the good work
Lowerpriority
Concentrate here
Stellenbosch University https://scholar.sun.ac.za
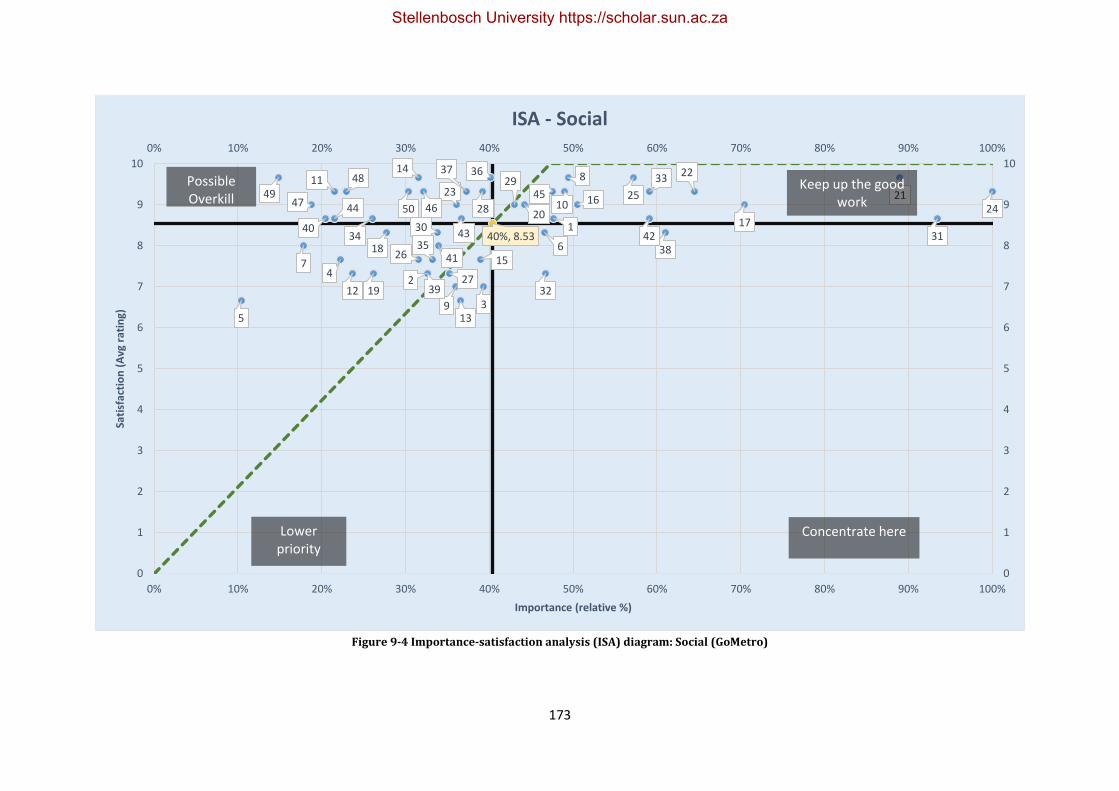
173
Figure 9-4 Importance-satisfaction analysis (ISA) diagram: Social (GoMetro)
1
2
3
4
5
6
7
8
9
10
11
12
13
14
15
16
17
18
19
20
21
22
23
2425
26
27
28
29
3031
32
33
3435
3637
38
39
40
41
4243
4445
4647
48
49
50
40%, 8.53
0% 10% 20% 30% 40% 50% 60% 70% 80% 90% 100%
0
1
2
3
4
5
6
7
8
9
10
0
1
2
3
4
5
6
7
8
9
10
0% 10% 20% 30% 40% 50% 60% 70% 80% 90% 100%
Sati
sfac
tio
n (
Avg
rat
ing)
Importance (relative %)
ISA - Social
PossibleOverkill
Keep up the good work
Lowerpriority
Concentrate here
Stellenbosch University https://scholar.sun.ac.za
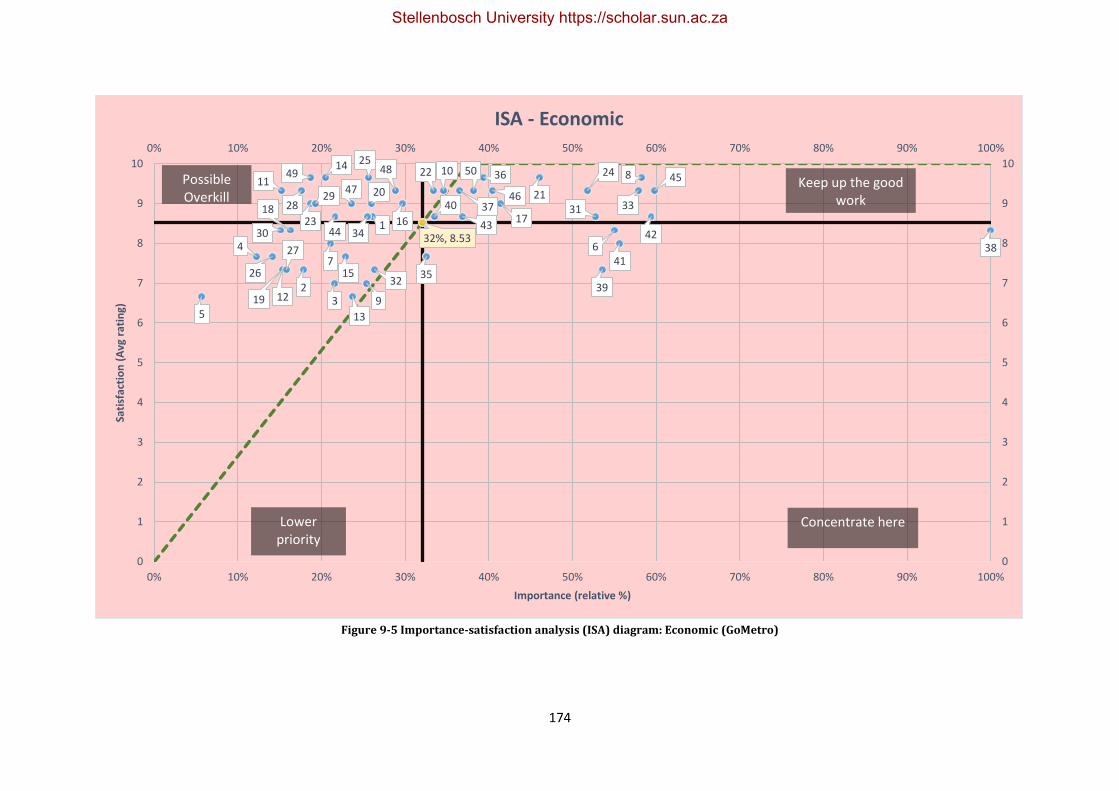
174
Figure 9-5 Importance-satisfaction analysis (ISA) diagram: Economic (GoMetro)
1
23
4
5
67
8
9
1011
12
13
14
15
16 1718
19
20 21
22
23
2425
26
27
2829
30
31
32
33
34
35
36
37
38
39
40
41
4243
44
45
4647
4849 50
32%, 8.53
0% 10% 20% 30% 40% 50% 60% 70% 80% 90% 100%
0
1
2
3
4
5
6
7
8
9
10
0
1
2
3
4
5
6
7
8
9
10
0% 10% 20% 30% 40% 50% 60% 70% 80% 90% 100%
Sati
sfac
tio
n (
Avg
rat
ing)
Importance (relative %)
ISA - Economic
PossibleOverkill
Keep up the good work
Lowerpriority
Concentrate here
Stellenbosch University https://scholar.sun.ac.za
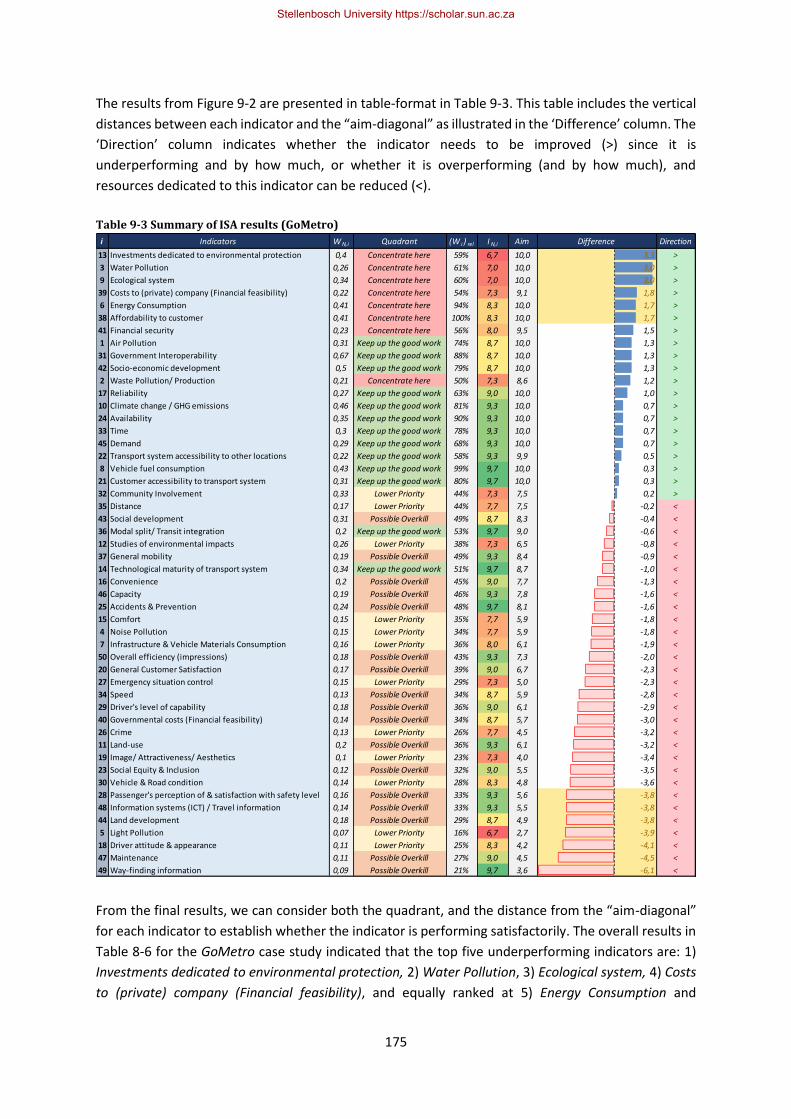
175
The results from Figure 9-2 are presented in table-format in Table 9-3. This table includes the vertical
distances between each indicator and the “aim-diagonal” as illustrated in the ‘Difference’ column. The
‘Direction’ column indicates whether the indicator needs to be improved (>) since it is
underperforming and by how much, or whether it is overperforming (and by how much), and
resources dedicated to this indicator can be reduced (<).
Table 9-3 Summary of ISA results (GoMetro)
From the final results, we can consider both the quadrant, and the distance from the “aim-diagonal”
for each indicator to establish whether the indicator is performing satisfactorily. The overall results in
Table 8-6 for the GoMetro case study indicated that the top five underperforming indicators are: 1)
Investments dedicated to environmental protection, 2) Water Pollution, 3) Ecological system, 4) Costs
to (private) company (Financial feasibility), and equally ranked at 5) Energy Consumption and
i Indicators W N,i Quadrant (W i ) rel I N,i Aim Difference Direction
13 Investments dedicated to environmental protection 0,4 Concentrate here 59% 6,7 10,0 3,3 >
3 Water Pollution 0,26 Concentrate here 61% 7,0 10,0 3,0 >
9 Ecological system 0,34 Concentrate here 60% 7,0 10,0 3,0 >
39 Costs to (private) company (Financial feasibility) 0,22 Concentrate here 54% 7,3 9,1 1,8 >
6 Energy Consumption 0,41 Concentrate here 94% 8,3 10,0 1,7 >
38 Affordability to customer 0,41 Concentrate here 100% 8,3 10,0 1,7 >
41 Financial security 0,23 Concentrate here 56% 8,0 9,5 1,5 >
1 Air Pollution 0,31 Keep up the good work 74% 8,7 10,0 1,3 >
31 Government Interoperability 0,67 Keep up the good work 88% 8,7 10,0 1,3 >
42 Socio-economic development 0,5 Keep up the good work 79% 8,7 10,0 1,3 >
2 Waste Pollution/ Production 0,21 Concentrate here 50% 7,3 8,6 1,2 >
17 Reliability 0,27 Keep up the good work 63% 9,0 10,0 1,0 >
10 Climate change / GHG emissions 0,46 Keep up the good work 81% 9,3 10,0 0,7 >
24 Availability 0,35 Keep up the good work 90% 9,3 10,0 0,7 >
33 Time 0,3 Keep up the good work 78% 9,3 10,0 0,7 >
45 Demand 0,29 Keep up the good work 68% 9,3 10,0 0,7 >
22 Transport system accessibility to other locations 0,22 Keep up the good work 58% 9,3 9,9 0,5 >
8 Vehicle fuel consumption 0,43 Keep up the good work 99% 9,7 10,0 0,3 >
21 Customer accessibility to transport system 0,31 Keep up the good work 80% 9,7 10,0 0,3 >
32 Community Involvement 0,33 Lower Priority 44% 7,3 7,5 0,2 >
35 Distance 0,17 Lower Priority 44% 7,7 7,5 -0,2 <
43 Social development 0,31 Possible Overkill 49% 8,7 8,3 -0,4 <
36 Modal split/ Transit integration 0,2 Keep up the good work 53% 9,7 9,0 -0,6 <
12 Studies of environmental impacts 0,26 Lower Priority 38% 7,3 6,5 -0,8 <
37 General mobility 0,19 Possible Overkill 49% 9,3 8,4 -0,9 <
14 Technological maturity of transport system 0,34 Keep up the good work 51% 9,7 8,7 -1,0 <
16 Convenience 0,2 Possible Overkill 45% 9,0 7,7 -1,3 <
46 Capacity 0,19 Possible Overkill 46% 9,3 7,8 -1,6 <
25 Accidents & Prevention 0,24 Possible Overkill 48% 9,7 8,1 -1,6 <
15 Comfort 0,15 Lower Priority 35% 7,7 5,9 -1,8 <
4 Noise Pollution 0,15 Lower Priority 34% 7,7 5,9 -1,8 <
7 Infrastructure & Vehicle Materials Consumption 0,16 Lower Priority 36% 8,0 6,1 -1,9 <
50 Overall efficiency (impressions) 0,18 Possible Overkill 43% 9,3 7,3 -2,0 <
20 General Customer Satisfaction 0,17 Possible Overkill 39% 9,0 6,7 -2,3 <
27 Emergency situation control 0,15 Lower Priority 29% 7,3 5,0 -2,3 <
34 Speed 0,13 Possible Overkill 34% 8,7 5,9 -2,8 <
29 Driver's level of capability 0,18 Possible Overkill 36% 9,0 6,1 -2,9 <
40 Governmental costs (Financial feasibility) 0,14 Possible Overkill 34% 8,7 5,7 -3,0 <
26 Crime 0,13 Lower Priority 26% 7,7 4,5 -3,2 <
11 Land-use 0,2 Possible Overkill 36% 9,3 6,1 -3,2 <
19 Image/ Attractiveness/ Aesthetics 0,1 Lower Priority 23% 7,3 4,0 -3,4 <
23 Social Equity & Inclusion 0,12 Possible Overkill 32% 9,0 5,5 -3,5 <
30 Vehicle & Road condition 0,14 Lower Priority 28% 8,3 4,8 -3,6 <
28 Passenger's perception of & satisfaction with safety level 0,16 Possible Overkill 33% 9,3 5,6 -3,8 <
48 Information systems (ICT) / Travel information 0,14 Possible Overkill 33% 9,3 5,5 -3,8 <
44 Land development 0,18 Possible Overkill 29% 8,7 4,9 -3,8 <
5 Light Pollution 0,07 Lower Priority 16% 6,7 2,7 -3,9 <
18 Driver attitude & appearance 0,11 Lower Priority 25% 8,3 4,2 -4,1 <
47 Maintenance 0,11 Possible Overkill 27% 9,0 4,5 -4,5 <
49 Way-finding information 0,09 Possible Overkill 21% 9,7 3,6 -6,1 <
Stellenbosch University https://scholar.sun.ac.za
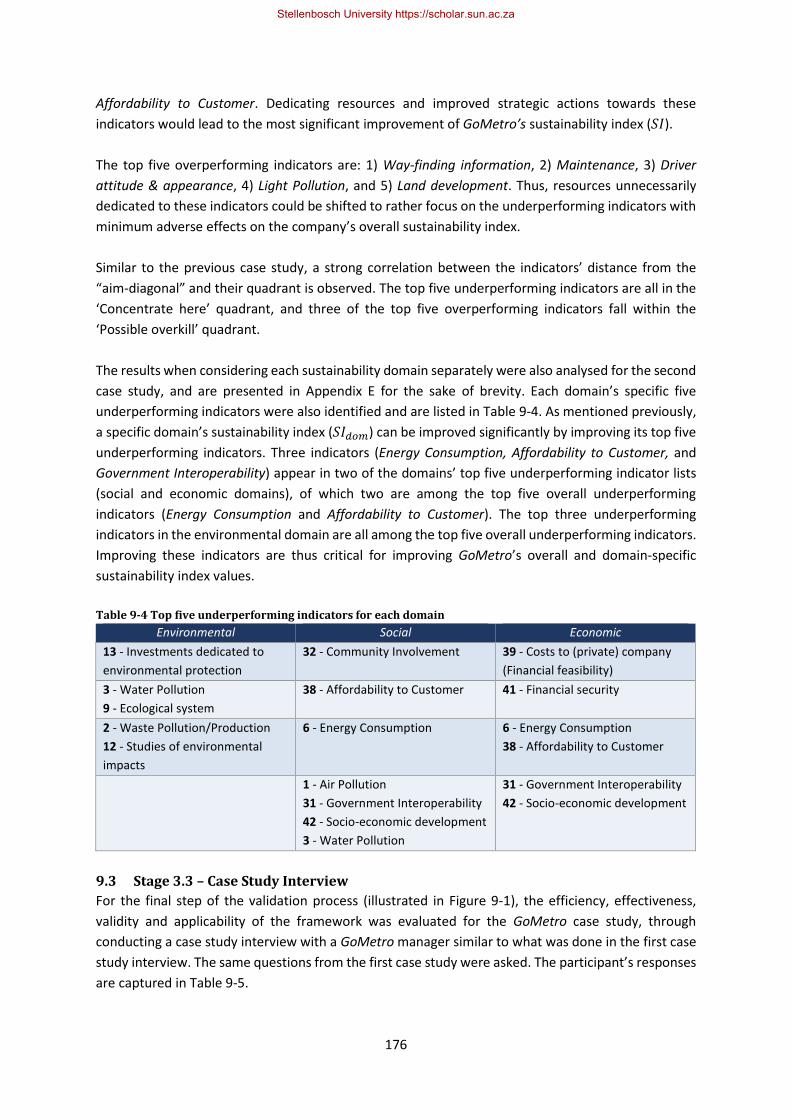
176
Affordability to Customer. Dedicating resources and improved strategic actions towards these
indicators would lead to the most significant improvement of GoMetro’s sustainability index (𝑆𝐼).
The top five overperforming indicators are: 1) Way-finding information, 2) Maintenance, 3) Driver
attitude & appearance, 4) Light Pollution, and 5) Land development. Thus, resources unnecessarily
dedicated to these indicators could be shifted to rather focus on the underperforming indicators with
minimum adverse effects on the company’s overall sustainability index.
Similar to the previous case study, a strong correlation between the indicators’ distance from the
“aim-diagonal” and their quadrant is observed. The top five underperforming indicators are all in the
‘Concentrate here’ quadrant, and three of the top five overperforming indicators fall within the
‘Possible overkill’ quadrant.
The results when considering each sustainability domain separately were also analysed for the second
case study, and are presented in Appendix E for the sake of brevity. Each domain’s specific five
underperforming indicators were also identified and are listed in Table 9-4. As mentioned previously,
a specific domain’s sustainability index (𝑆𝐼𝑑𝑜𝑚) can be improved significantly by improving its top five
underperforming indicators. Three indicators (Energy Consumption, Affordability to Customer, and
Government Interoperability) appear in two of the domains’ top five underperforming indicator lists
(social and economic domains), of which two are among the top five overall underperforming
indicators (Energy Consumption and Affordability to Customer). The top three underperforming
indicators in the environmental domain are all among the top five overall underperforming indicators.
Improving these indicators are thus critical for improving GoMetro’s overall and domain-specific
sustainability index values.
Table 9-4 Top five underperforming indicators for each domain
Environmental Social Economic
13 - Investments dedicated to
environmental protection
32 - Community Involvement 39 - Costs to (private) company
(Financial feasibility)
3 - Water Pollution
9 - Ecological system
38 - Affordability to Customer 41 - Financial security
2 - Waste Pollution/Production
12 - Studies of environmental
impacts
6 - Energy Consumption 6 - Energy Consumption
38 - Affordability to Customer
1 - Air Pollution
31 - Government Interoperability
42 - Socio-economic development
3 - Water Pollution
31 - Government Interoperability
42 - Socio-economic development
9.3 Stage 3.3 – Case Study Interview
For the final step of the validation process (illustrated in Figure 9-1), the efficiency, effectiveness,
validity and applicability of the framework was evaluated for the GoMetro case study, through
conducting a case study interview with a GoMetro manager similar to what was done in the first case
study interview. The same questions from the first case study were asked. The participant’s responses
are captured in Table 9-5.
Stellenbosch University https://scholar.sun.ac.za
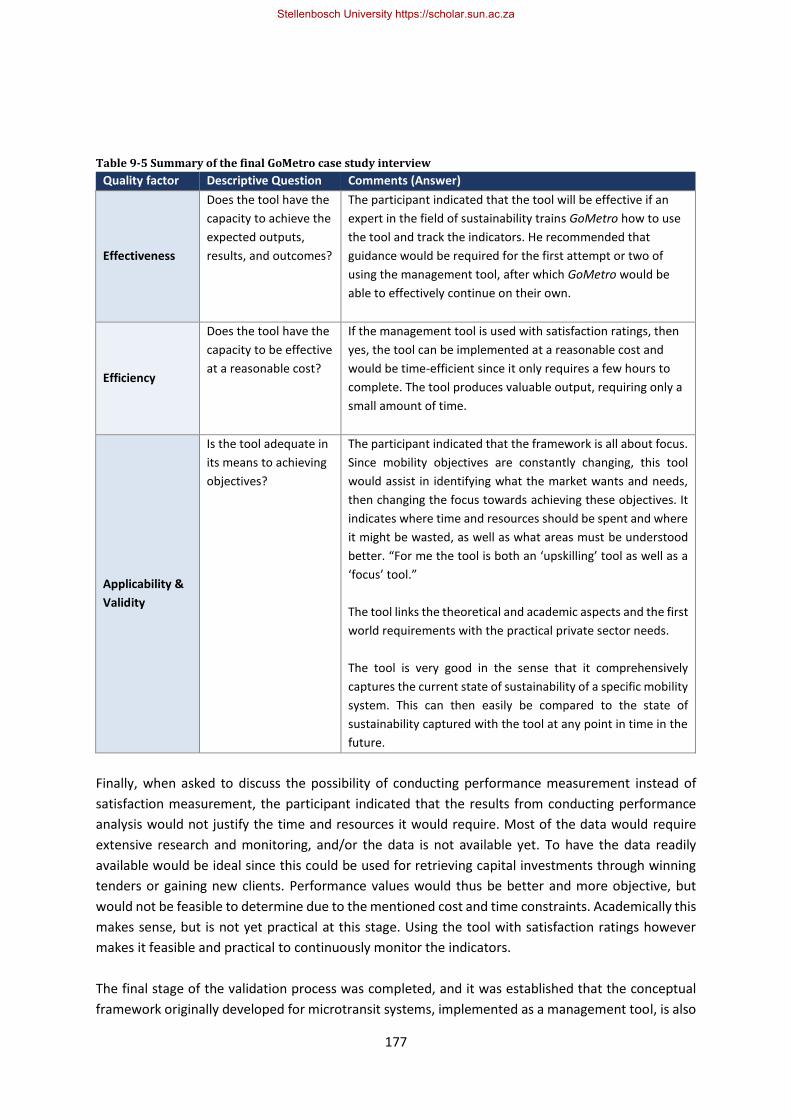
177
Table 9-5 Summary of the final GoMetro case study interview
Quality factor Descriptive Question Comments (Answer)
Effectiveness
Does the tool have the
capacity to achieve the
expected outputs,
results, and outcomes?
The participant indicated that the tool will be effective if an
expert in the field of sustainability trains GoMetro how to use
the tool and track the indicators. He recommended that
guidance would be required for the first attempt or two of
using the management tool, after which GoMetro would be
able to effectively continue on their own.
Efficiency
Does the tool have the
capacity to be effective
at a reasonable cost?
If the management tool is used with satisfaction ratings, then
yes, the tool can be implemented at a reasonable cost and
would be time-efficient since it only requires a few hours to
complete. The tool produces valuable output, requiring only a
small amount of time.
Applicability &
Validity
Is the tool adequate in
its means to achieving
objectives?
The participant indicated that the framework is all about focus.
Since mobility objectives are constantly changing, this tool
would assist in identifying what the market wants and needs,
then changing the focus towards achieving these objectives. It
indicates where time and resources should be spent and where
it might be wasted, as well as what areas must be understood
better. “For me the tool is both an ‘upskilling’ tool as well as a
‘focus’ tool.”
The tool links the theoretical and academic aspects and the first
world requirements with the practical private sector needs.
The tool is very good in the sense that it comprehensively
captures the current state of sustainability of a specific mobility
system. This can then easily be compared to the state of
sustainability captured with the tool at any point in time in the
future.
Finally, when asked to discuss the possibility of conducting performance measurement instead of
satisfaction measurement, the participant indicated that the results from conducting performance
analysis would not justify the time and resources it would require. Most of the data would require
extensive research and monitoring, and/or the data is not available yet. To have the data readily
available would be ideal since this could be used for retrieving capital investments through winning
tenders or gaining new clients. Performance values would thus be better and more objective, but
would not be feasible to determine due to the mentioned cost and time constraints. Academically this
makes sense, but is not yet practical at this stage. Using the tool with satisfaction ratings however
makes it feasible and practical to continuously monitor the indicators.
The final stage of the validation process was completed, and it was established that the conceptual
framework originally developed for microtransit systems, implemented as a management tool, is also
Stellenbosch University https://scholar.sun.ac.za
178
efficient, effective, applicable, and valid in the broader context of ITS, through case study application
to GoMetro. The extensive and systematic process towards developing the framework was
comprehensive to such an extent that no modifications to the framework were necessary and the
feedback received was only positive.
9.4 Chapter 9: Conclusion
The finalised microtransit conceptual framework was applied as a management tool to a second case
study in this chapter towards establishing whether it is applicable to the broader context of ITS. The
GoMetro initiative was used as case study towards this purpose. The tool delivered an overall
sustainability index of 𝑆𝐼 = 8.62 based on the perceived performance of company employees and
thus falls into the ‘Very Satisfied’ category (between 8 and 9). This value is however based on indicator
satisfaction ratings and not performance ratings, meaning that it is limited to the company’s
perception and satisfaction through value-judgement. It does, however, have meaning to the
company itself as it provides a perceived standard from which it can aim to further improve this rating
(by identifying and improving high-priority indicators). The Importance-Satisfaction analysis allowed
for easily identifying high-priority as well as overperforming indicators.
The final case study interview with a GoMetro manager delivered positive feedback regarding the
tool’s effectiveness, efficiency, applicability, and validity and confirmed that the conceptual
framework originally developed for microtransit systems, implemented as a management tool, is
generic in the sense that it can be used outside the scope of microtransit systems, and is also useful
and transferable to the broader scope of “smart mobility” or ITS systems. The extensive and
systematic process towards developing the framework was comprehensive to such an extent that no
modifications to the framework were necessary and the feedback received was only positive.
Stellenbosch University https://scholar.sun.ac.za

179
This page intentionally left blank
Stellenbosch University https://scholar.sun.ac.za
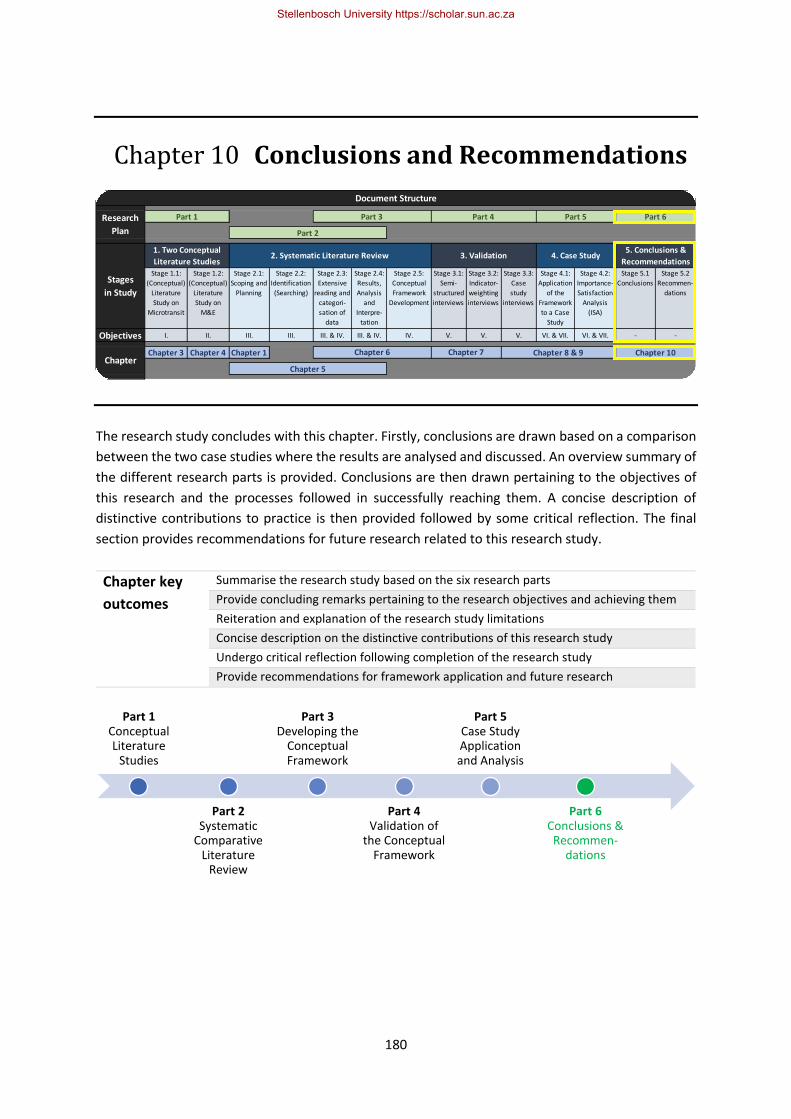
180
Chapter 10 Conclusions and Recommendations
The research study concludes with this chapter. Firstly, conclusions are drawn based on a comparison
between the two case studies where the results are analysed and discussed. An overview summary of
the different research parts is provided. Conclusions are then drawn pertaining to the objectives of
this research and the processes followed in successfully reaching them. A concise description of
distinctive contributions to practice is then provided followed by some critical reflection. The final
section provides recommendations for future research related to this research study.
Chapter key
outcomes
Summarise the research study based on the six research parts
Provide concluding remarks pertaining to the research objectives and achieving them
Reiteration and explanation of the research study limitations
Concise description on the distinctive contributions of this research study
Undergo critical reflection following completion of the research study
Provide recommendations for framework application and future research
Stage 1.1:
(Conceptual)
Literature
Study on
Microtransit
Stage 1.2:
(Conceptual)
Literature
Study on
M&E
Stage 2.1:
Scoping and
Planning
Stage 2.2:
Identification
(Searching)
Stage 2.3:
Extensive
reading and
categori-
sation of
data
Stage 2.4:
Results,
Analysis
and
Interpre-
tation
Stage 2.5:
Conceptual
Framework
Development
Stage 3.1:
Semi-
structured
interviews
Stage 3.2:
Indicator-
weighting
interviews
Stage 3.3:
Case
study
interviews
Stage 4.1:
Application
of the
Framework
to a Case
Study
Stage 4.2:
Importance-
Satisfaction
Analysis
(ISA)
Stage 5.1
Conclusions
Stage 5.2
Recommen-
dations
Objectives I. II. III. III. III. & IV. III. & IV. IV. V. V. V. VI. & VII. VI. & VII. - -
Chapter 3 Chapter 4 Chapter 1
Stages
in Study
1. Two Conceptual
Literature Studies2. Systematic Literature Review 3. Validation 4. Case Study
5. Conclusions &
Recommendations
ChapterChapter 6 Chapter 7 Chapter 8 & 9 Chapter 10
Chapter 5
Document Structure
Research
Plan
Part 1 Part 3 Part 4 Part 5 Part 6
Part 2
Part 1 Conceptual Literature
Studies
Part 2 Systematic
Comparative Literature
Review
Part 3 Developing the
Conceptual Framework
Part 4 Validation of
the Conceptual Framework
Part 5 Case Study Application and Analysis
Part 6 Conclusions & Recommen-
dations
Stellenbosch University https://scholar.sun.ac.za
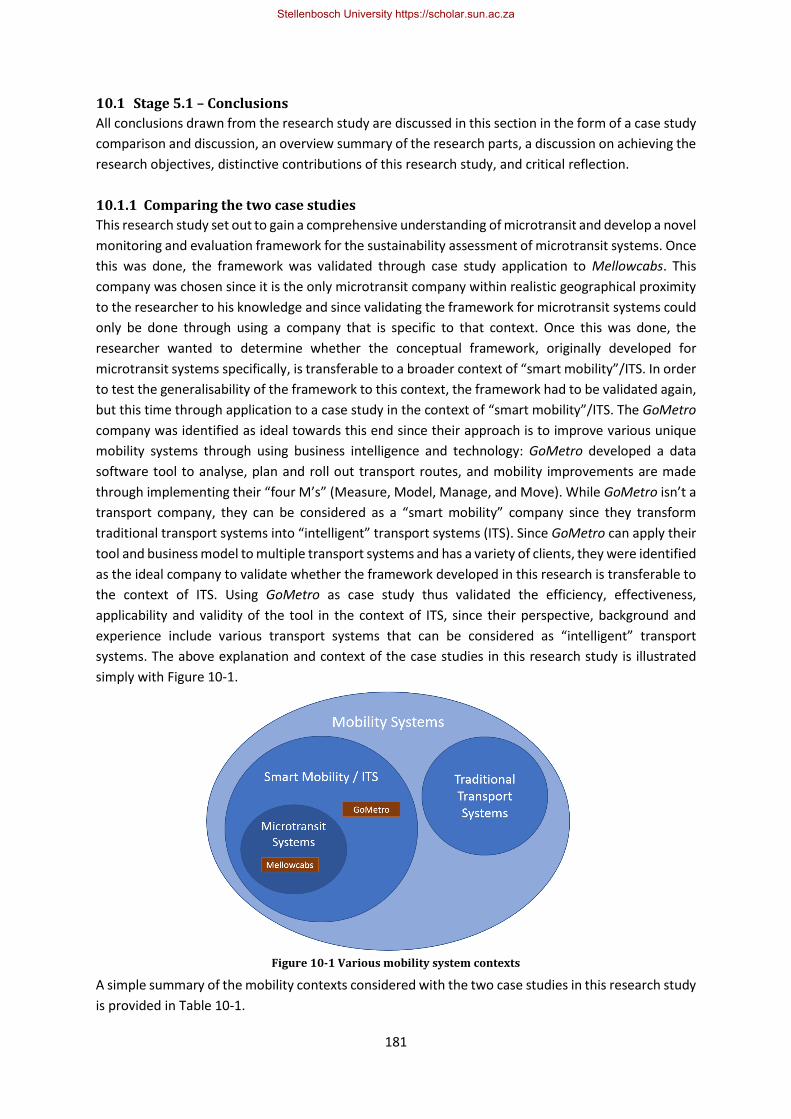
181
10.1 Stage 5.1 – Conclusions
All conclusions drawn from the research study are discussed in this section in the form of a case study
comparison and discussion, an overview summary of the research parts, a discussion on achieving the
research objectives, distinctive contributions of this research study, and critical reflection.
10.1.1 Comparing the two case studies
This research study set out to gain a comprehensive understanding of microtransit and develop a novel
monitoring and evaluation framework for the sustainability assessment of microtransit systems. Once
this was done, the framework was validated through case study application to Mellowcabs. This
company was chosen since it is the only microtransit company within realistic geographical proximity
to the researcher to his knowledge and since validating the framework for microtransit systems could
only be done through using a company that is specific to that context. Once this was done, the
researcher wanted to determine whether the conceptual framework, originally developed for
microtransit systems specifically, is transferable to a broader context of “smart mobility”/ITS. In order
to test the generalisability of the framework to this context, the framework had to be validated again,
but this time through application to a case study in the context of “smart mobility”/ITS. The GoMetro
company was identified as ideal towards this end since their approach is to improve various unique
mobility systems through using business intelligence and technology: GoMetro developed a data
software tool to analyse, plan and roll out transport routes, and mobility improvements are made
through implementing their “four M’s” (Measure, Model, Manage, and Move). While GoMetro isn’t a
transport company, they can be considered as a “smart mobility” company since they transform
traditional transport systems into “intelligent” transport systems (ITS). Since GoMetro can apply their
tool and business model to multiple transport systems and has a variety of clients, they were identified
as the ideal company to validate whether the framework developed in this research is transferable to
the context of ITS. Using GoMetro as case study thus validated the efficiency, effectiveness,
applicability and validity of the tool in the context of ITS, since their perspective, background and
experience include various transport systems that can be considered as “intelligent” transport
systems. The above explanation and context of the case studies in this research study is illustrated
simply with Figure 10-1.
A simple summary of the mobility contexts considered with the two case studies in this research study
is provided in Table 10-1.
Figure 10-1 Various mobility system contexts
Stellenbosch University https://scholar.sun.ac.za
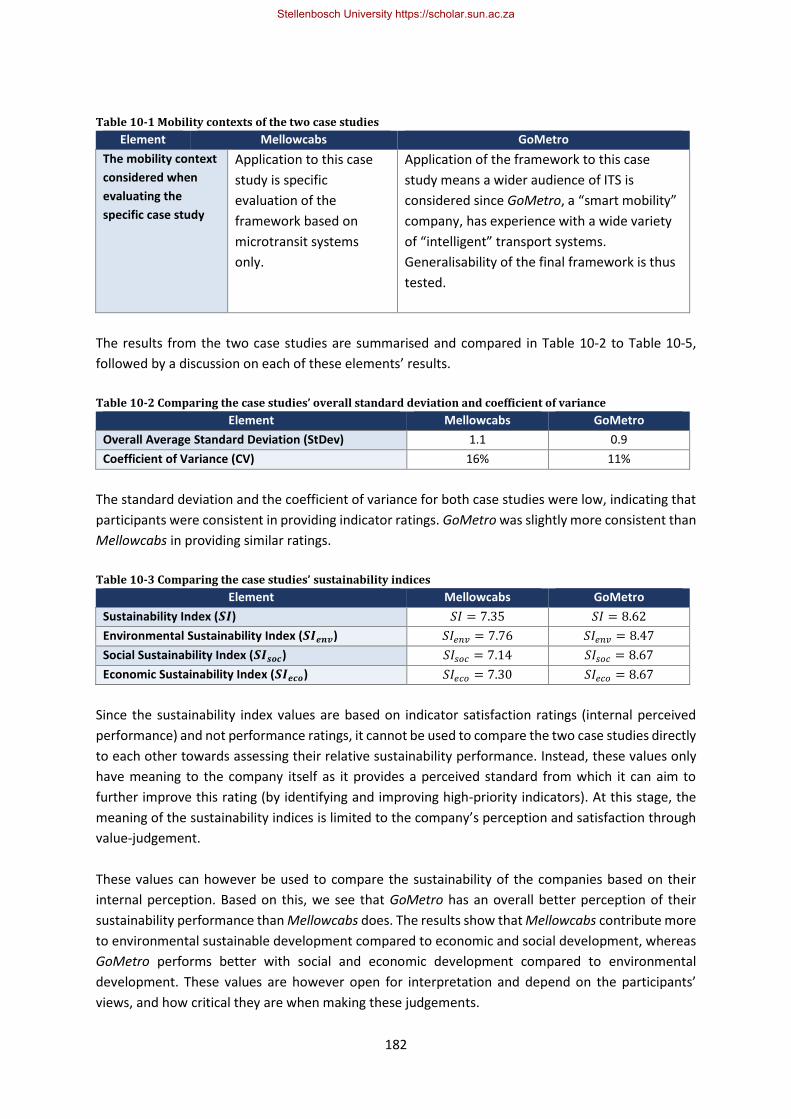
182
Table 10-1 Mobility contexts of the two case studies
Element Mellowcabs GoMetro
The mobility context
considered when
evaluating the
specific case study
Application to this case
study is specific
evaluation of the
framework based on
microtransit systems
only.
Application of the framework to this case
study means a wider audience of ITS is
considered since GoMetro, a “smart mobility”
company, has experience with a wide variety
of “intelligent” transport systems.
Generalisability of the final framework is thus
tested.
The results from the two case studies are summarised and compared in Table 10-2 to Table 10-5,
followed by a discussion on each of these elements’ results.
Table 10-2 Comparing the case studies’ overall standard deviation and coefficient of variance
Element Mellowcabs GoMetro
Overall Average Standard Deviation (StDev) 1.1 0.9
Coefficient of Variance (CV) 16% 11%
The standard deviation and the coefficient of variance for both case studies were low, indicating that
participants were consistent in providing indicator ratings. GoMetro was slightly more consistent than
Mellowcabs in providing similar ratings.
Table 10-3 Comparing the case studies’ sustainability indices
Element Mellowcabs GoMetro
Sustainability Index (𝑺𝑰) 𝑆𝐼 = 7.35 𝑆𝐼 = 8.62
Environmental Sustainability Index (𝑺𝑰𝒆𝒏𝒗) 𝑆𝐼𝑒𝑛𝑣 = 7.76 𝑆𝐼𝑒𝑛𝑣 = 8.47
Social Sustainability Index (𝑺𝑰𝒔𝒐𝒄) 𝑆𝐼𝑠𝑜𝑐 = 7.14 𝑆𝐼𝑠𝑜𝑐 = 8.67
Economic Sustainability Index (𝑺𝑰𝒆𝒄𝒐) 𝑆𝐼𝑒𝑐𝑜 = 7.30 𝑆𝐼𝑒𝑐𝑜 = 8.67
Since the sustainability index values are based on indicator satisfaction ratings (internal perceived
performance) and not performance ratings, it cannot be used to compare the two case studies directly
to each other towards assessing their relative sustainability performance. Instead, these values only
have meaning to the company itself as it provides a perceived standard from which it can aim to
further improve this rating (by identifying and improving high-priority indicators). At this stage, the
meaning of the sustainability indices is limited to the company’s perception and satisfaction through
value-judgement.
These values can however be used to compare the sustainability of the companies based on their
internal perception. Based on this, we see that GoMetro has an overall better perception of their
sustainability performance than Mellowcabs does. The results show that Mellowcabs contribute more
to environmental sustainable development compared to economic and social development, whereas
GoMetro performs better with social and economic development compared to environmental
development. These values are however open for interpretation and depend on the participants’
views, and how critical they are when making these judgements.
Stellenbosch University https://scholar.sun.ac.za
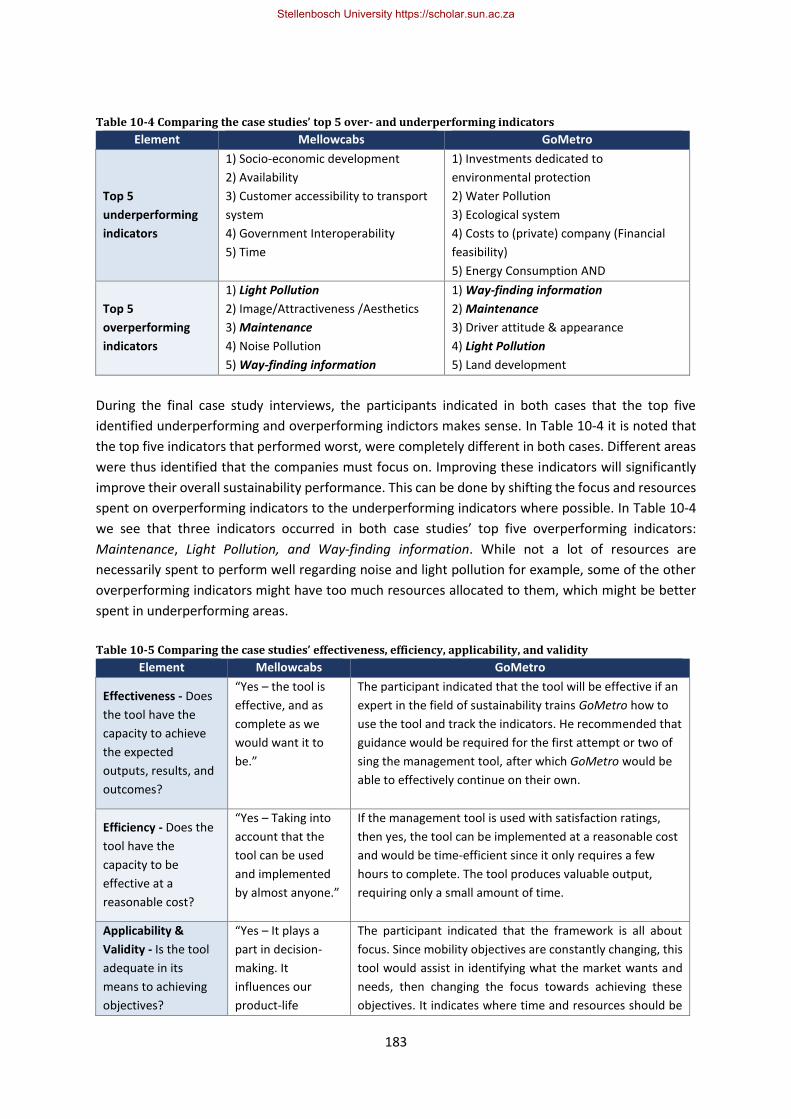
183
Table 10-4 Comparing the case studies’ top 5 over- and underperforming indicators
Element Mellowcabs GoMetro
Top 5
underperforming
indicators
1) Socio-economic development
2) Availability
3) Customer accessibility to transport
system
4) Government Interoperability
5) Time
1) Investments dedicated to
environmental protection
2) Water Pollution
3) Ecological system
4) Costs to (private) company (Financial
feasibility)
5) Energy Consumption AND
Top 5
overperforming
indicators
1) Light Pollution
2) Image/Attractiveness /Aesthetics
3) Maintenance
4) Noise Pollution
5) Way-finding information
1) Way-finding information
2) Maintenance
3) Driver attitude & appearance
4) Light Pollution
5) Land development
During the final case study interviews, the participants indicated in both cases that the top five
identified underperforming and overperforming indictors makes sense. In Table 10-4 it is noted that
the top five indicators that performed worst, were completely different in both cases. Different areas
were thus identified that the companies must focus on. Improving these indicators will significantly
improve their overall sustainability performance. This can be done by shifting the focus and resources
spent on overperforming indicators to the underperforming indicators where possible. In Table 10-4
we see that three indicators occurred in both case studies’ top five overperforming indicators:
Maintenance, Light Pollution, and Way-finding information. While not a lot of resources are
necessarily spent to perform well regarding noise and light pollution for example, some of the other
overperforming indicators might have too much resources allocated to them, which might be better
spent in underperforming areas.
Table 10-5 Comparing the case studies’ effectiveness, efficiency, applicability, and validity
Element Mellowcabs GoMetro
Effectiveness - Does
the tool have the
capacity to achieve
the expected
outputs, results, and
outcomes?
“Yes – the tool is
effective, and as
complete as we
would want it to
be.”
The participant indicated that the tool will be effective if an
expert in the field of sustainability trains GoMetro how to
use the tool and track the indicators. He recommended that
guidance would be required for the first attempt or two of
sing the management tool, after which GoMetro would be
able to effectively continue on their own.
Efficiency - Does the
tool have the
capacity to be
effective at a
reasonable cost?
“Yes – Taking into
account that the
tool can be used
and implemented
by almost anyone.”
If the management tool is used with satisfaction ratings,
then yes, the tool can be implemented at a reasonable cost
and would be time-efficient since it only requires a few
hours to complete. The tool produces valuable output,
requiring only a small amount of time.
Applicability &
Validity - Is the tool
adequate in its
means to achieving
objectives?
“Yes – It plays a
part in decision-
making. It
influences our
product-life
The participant indicated that the framework is all about
focus. Since mobility objectives are constantly changing, this
tool would assist in identifying what the market wants and
needs, then changing the focus towards achieving these
objectives. It indicates where time and resources should be
Stellenbosch University https://scholar.sun.ac.za
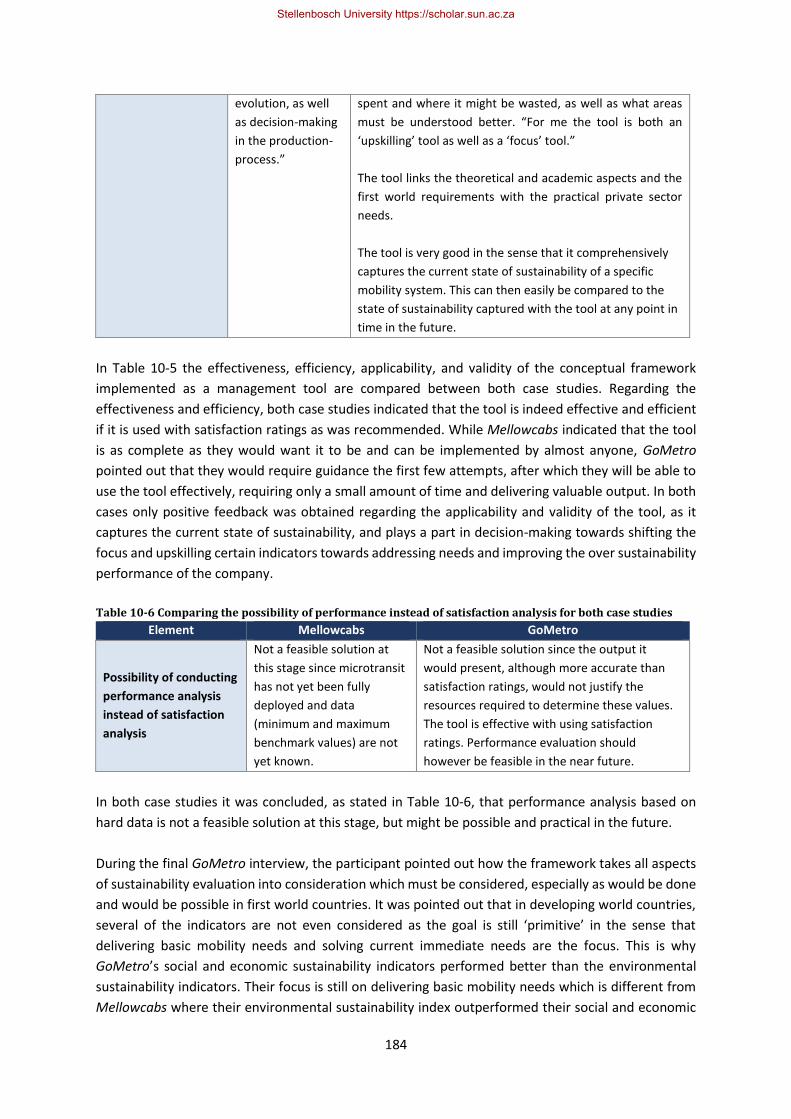
184
evolution, as well
as decision-making
in the production-
process.”
spent and where it might be wasted, as well as what areas
must be understood better. “For me the tool is both an
‘upskilling’ tool as well as a ‘focus’ tool.”
The tool links the theoretical and academic aspects and the
first world requirements with the practical private sector
needs.
The tool is very good in the sense that it comprehensively
captures the current state of sustainability of a specific
mobility system. This can then easily be compared to the
state of sustainability captured with the tool at any point in
time in the future.
In Table 10-5 the effectiveness, efficiency, applicability, and validity of the conceptual framework
implemented as a management tool are compared between both case studies. Regarding the
effectiveness and efficiency, both case studies indicated that the tool is indeed effective and efficient
if it is used with satisfaction ratings as was recommended. While Mellowcabs indicated that the tool
is as complete as they would want it to be and can be implemented by almost anyone, GoMetro
pointed out that they would require guidance the first few attempts, after which they will be able to
use the tool effectively, requiring only a small amount of time and delivering valuable output. In both
cases only positive feedback was obtained regarding the applicability and validity of the tool, as it
captures the current state of sustainability, and plays a part in decision-making towards shifting the
focus and upskilling certain indicators towards addressing needs and improving the over sustainability
performance of the company.
Table 10-6 Comparing the possibility of performance instead of satisfaction analysis for both case studies
Element Mellowcabs GoMetro
Possibility of conducting
performance analysis
instead of satisfaction
analysis
Not a feasible solution at
this stage since microtransit
has not yet been fully
deployed and data
(minimum and maximum
benchmark values) are not
yet known.
Not a feasible solution since the output it
would present, although more accurate than
satisfaction ratings, would not justify the
resources required to determine these values.
The tool is effective with using satisfaction
ratings. Performance evaluation should
however be feasible in the near future.
In both case studies it was concluded, as stated in Table 10-6, that performance analysis based on
hard data is not a feasible solution at this stage, but might be possible and practical in the future.
During the final GoMetro interview, the participant pointed out how the framework takes all aspects
of sustainability evaluation into consideration which must be considered, especially as would be done
and would be possible in first world countries. It was pointed out that in developing world countries,
several of the indicators are not even considered as the goal is still ‘primitive’ in the sense that
delivering basic mobility needs and solving current immediate needs are the focus. This is why
GoMetro’s social and economic sustainability indicators performed better than the environmental
sustainability indicators. Their focus is still on delivering basic mobility needs which is different from
Mellowcabs where their environmental sustainability index outperformed their social and economic
Stellenbosch University https://scholar.sun.ac.za

185
sustainability performance index values due to the niche market that is being targeted. The participant
did however point out that the market in developing countries is changing and the need for
considering all of these factors would eventually be essential, especially the focus on environmental
considerations would increase.
While some of these indicators are difficult to measure and monitor, this should become easier in the
near future as the market develops, data becomes available, more emphasis and the need for
sustainability increases, and as evolving technology simplifies the way of continuously monitoring the
indicators e.g. through automation, using sensors, big data, and machine learning etc. It was also
pointed out that the management tool is already helpful since the importance of all the indicators
have already been measured.
Comparing the results from the two case studies confirmed that the developed conceptual framework
implemented as a management tool is generic in the sense that it is applicable outside the scope of
microtransit systems, and useful and transferable to the broader context of “smart mobility”/ITS
systems. This instantly increases the value of the framework since it can be used, not only by
managers, decisions-makers, or other stakeholders from microtransit systems, but also by similar
individuals from the wider context ITS.
10.1.2 Overview summary of research parts
In summary, Table 10-7 provides an overview of the research study and salient points based on its
previously defined six parts of the research plan from Section 2.4 in Chapter 2.
Table 10-7 Summary and salient points of each part of the research plan
Part Summary & salient points
Part 1 -
Conceptual
Literature
Studies
Initially, a gap was identified regarding an emerging mode of transport, microtransit, which
aims at addressing several current real-world problems and thus would require continuous
monitoring and evaluation once it has been rolled out. The research study began with part 1
to set the context and gain a comprehensive understanding of two core concepts of this
research study, namely: microtransit, and M&E, through conducting two separate conceptual
literature studies. As a greater understanding of the two concepts was gained and the ideas
were being integrated, the researcher found that, based on the real-world problems that
microtransit aims to address and at the core of microtransit M&E, is the concept of sustainable
transport development. The introductory chapter and first conceptual literature study on
microtransit were expanded and the research was seen in a new light.
From the second conceptual literature study a comprehensive understanding of M&E and its
various main paradigms is gained. Put simply, M&E is recognised as a vital aspect for any
organisation or institution that aims at progressively improving the performance of any
particular activity or service, and reaching goals by achieving certain results. Its major goal is
to improve the management of outcomes and outputs by establishing links between past,
present and future procedures and decisions.
It is recognised that planning and implementation of microtransit systems should be informed
by evidence-based M&E to ensure good decision-making, accountability, and efficient
management and operation. Since these innovations are relatively new, research on the
relationship between sustainability theory and these businesses in a sharing economy is
Stellenbosch University https://scholar.sun.ac.za
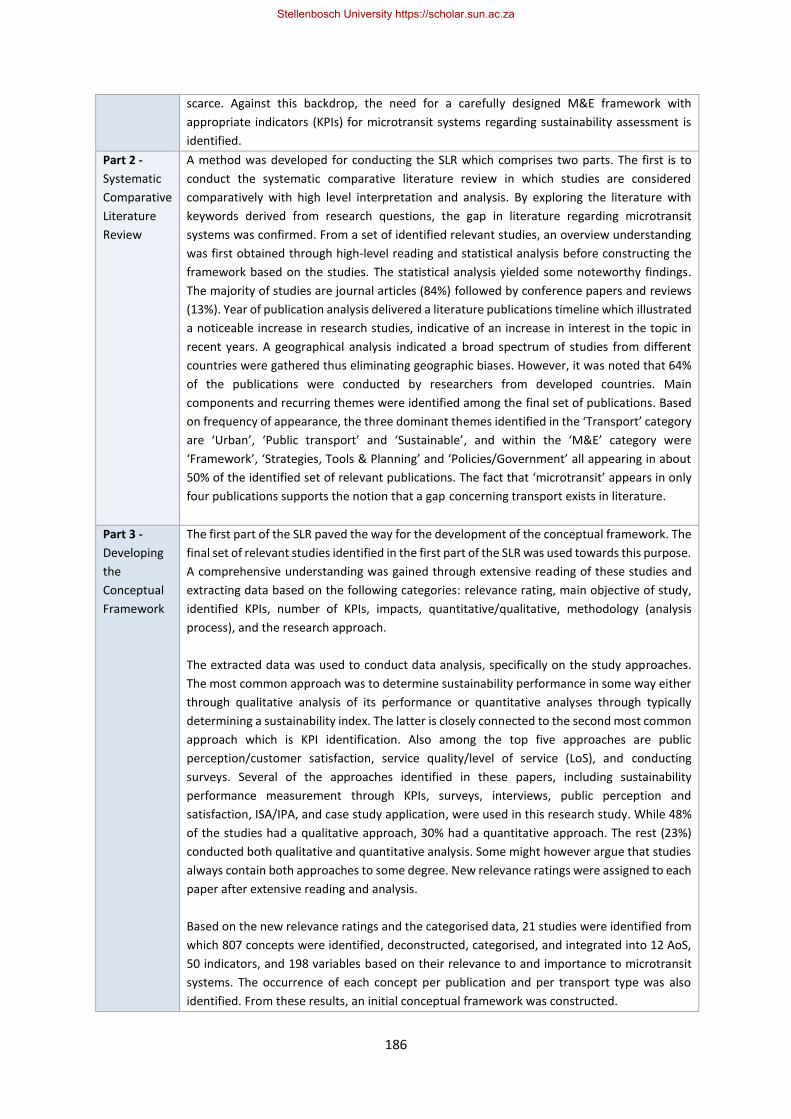
186
scarce. Against this backdrop, the need for a carefully designed M&E framework with
appropriate indicators (KPIs) for microtransit systems regarding sustainability assessment is
identified.
Part 2 -
Systematic
Comparative
Literature
Review
A method was developed for conducting the SLR which comprises two parts. The first is to
conduct the systematic comparative literature review in which studies are considered
comparatively with high level interpretation and analysis. By exploring the literature with
keywords derived from research questions, the gap in literature regarding microtransit
systems was confirmed. From a set of identified relevant studies, an overview understanding
was first obtained through high-level reading and statistical analysis before constructing the
framework based on the studies. The statistical analysis yielded some noteworthy findings.
The majority of studies are journal articles (84%) followed by conference papers and reviews
(13%). Year of publication analysis delivered a literature publications timeline which illustrated
a noticeable increase in research studies, indicative of an increase in interest in the topic in
recent years. A geographical analysis indicated a broad spectrum of studies from different
countries were gathered thus eliminating geographic biases. However, it was noted that 64%
of the publications were conducted by researchers from developed countries. Main
components and recurring themes were identified among the final set of publications. Based
on frequency of appearance, the three dominant themes identified in the ‘Transport’ category
are ‘Urban’, ‘Public transport’ and ‘Sustainable’, and within the ‘M&E’ category were
‘Framework’, ‘Strategies, Tools & Planning’ and ‘Policies/Government’ all appearing in about
50% of the identified set of relevant publications. The fact that ‘microtransit’ appears in only
four publications supports the notion that a gap concerning transport exists in literature.
Part 3 -
Developing
the
Conceptual
Framework
The first part of the SLR paved the way for the development of the conceptual framework. The
final set of relevant studies identified in the first part of the SLR was used towards this purpose.
A comprehensive understanding was gained through extensive reading of these studies and
extracting data based on the following categories: relevance rating, main objective of study,
identified KPIs, number of KPIs, impacts, quantitative/qualitative, methodology (analysis
process), and the research approach.
The extracted data was used to conduct data analysis, specifically on the study approaches.
The most common approach was to determine sustainability performance in some way either
through qualitative analysis of its performance or quantitative analyses through typically
determining a sustainability index. The latter is closely connected to the second most common
approach which is KPI identification. Also among the top five approaches are public
perception/customer satisfaction, service quality/level of service (LoS), and conducting
surveys. Several of the approaches identified in these papers, including sustainability
performance measurement through KPIs, surveys, interviews, public perception and
satisfaction, ISA/IPA, and case study application, were used in this research study. While 48%
of the studies had a qualitative approach, 30% had a quantitative approach. The rest (23%)
conducted both qualitative and quantitative analysis. Some might however argue that studies
always contain both approaches to some degree. New relevance ratings were assigned to each
paper after extensive reading and analysis.
Based on the new relevance ratings and the categorised data, 21 studies were identified from
which 807 concepts were identified, deconstructed, categorised, and integrated into 12 AoS,
50 indicators, and 198 variables based on their relevance to and importance to microtransit
systems. The occurrence of each concept per publication and per transport type was also
identified. From these results, an initial conceptual framework was constructed.
Stellenbosch University https://scholar.sun.ac.za
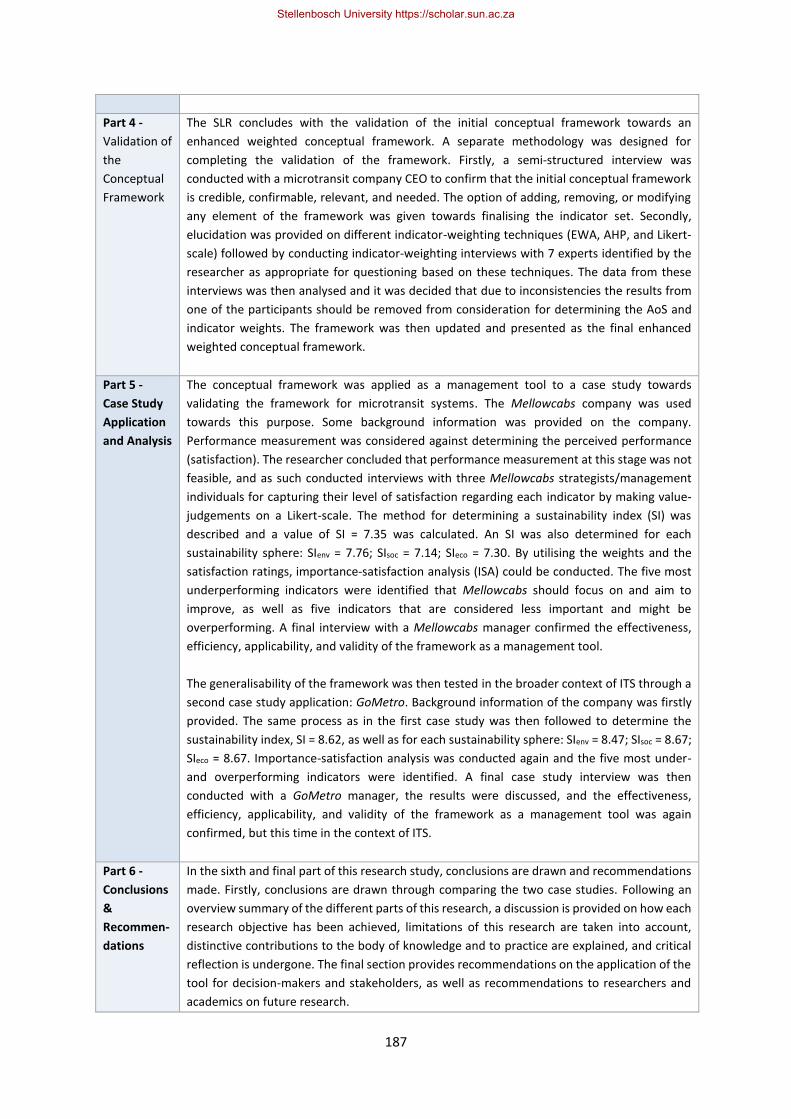
187
Part 4 -
Validation of
the
Conceptual
Framework
The SLR concludes with the validation of the initial conceptual framework towards an
enhanced weighted conceptual framework. A separate methodology was designed for
completing the validation of the framework. Firstly, a semi-structured interview was
conducted with a microtransit company CEO to confirm that the initial conceptual framework
is credible, confirmable, relevant, and needed. The option of adding, removing, or modifying
any element of the framework was given towards finalising the indicator set. Secondly,
elucidation was provided on different indicator-weighting techniques (EWA, AHP, and Likert-
scale) followed by conducting indicator-weighting interviews with 7 experts identified by the
researcher as appropriate for questioning based on these techniques. The data from these
interviews was then analysed and it was decided that due to inconsistencies the results from
one of the participants should be removed from consideration for determining the AoS and
indicator weights. The framework was then updated and presented as the final enhanced
weighted conceptual framework.
Part 5 -
Case Study
Application
and Analysis
The conceptual framework was applied as a management tool to a case study towards
validating the framework for microtransit systems. The Mellowcabs company was used
towards this purpose. Some background information was provided on the company.
Performance measurement was considered against determining the perceived performance
(satisfaction). The researcher concluded that performance measurement at this stage was not
feasible, and as such conducted interviews with three Mellowcabs strategists/management
individuals for capturing their level of satisfaction regarding each indicator by making value-
judgements on a Likert-scale. The method for determining a sustainability index (SI) was
described and a value of SI = 7.35 was calculated. An SI was also determined for each
sustainability sphere: SIenv = 7.76; SIsoc = 7.14; SIeco = 7.30. By utilising the weights and the
satisfaction ratings, importance-satisfaction analysis (ISA) could be conducted. The five most
underperforming indicators were identified that Mellowcabs should focus on and aim to
improve, as well as five indicators that are considered less important and might be
overperforming. A final interview with a Mellowcabs manager confirmed the effectiveness,
efficiency, applicability, and validity of the framework as a management tool.
The generalisability of the framework was then tested in the broader context of ITS through a
second case study application: GoMetro. Background information of the company was firstly
provided. The same process as in the first case study was then followed to determine the
sustainability index, SI = 8.62, as well as for each sustainability sphere: SIenv = 8.47; SIsoc = 8.67;
SIeco = 8.67. Importance-satisfaction analysis was conducted again and the five most under-
and overperforming indicators were identified. A final case study interview was then
conducted with a GoMetro manager, the results were discussed, and the effectiveness,
efficiency, applicability, and validity of the framework as a management tool was again
confirmed, but this time in the context of ITS.
Part 6 -
Conclusions
&
Recommen-
dations
In the sixth and final part of this research study, conclusions are drawn and recommendations
made. Firstly, conclusions are drawn through comparing the two case studies. Following an
overview summary of the different parts of this research, a discussion is provided on how each
research objective has been achieved, limitations of this research are taken into account,
distinctive contributions to the body of knowledge and to practice are explained, and critical
reflection is undergone. The final section provides recommendations on the application of the
tool for decision-makers and stakeholders, as well as recommendations to researchers and
academics on future research.
Stellenbosch University https://scholar.sun.ac.za

188
10.1.3 Reaching the research objectives
The primary aim of this research is to contribute to the development of microtransit systems through
constructing a conceptual M&E framework pertaining to sustainability. Six research objectives were
introduced in Section 1.2.2 from Chapter 1 towards achieving this main goal:
I. Obtain a comprehensive understanding of microtransit and its current state of understanding
II. Explore and fully understand the process of Monitoring and Evaluation (M&E) and recognize.
how to apply the obtained knowledge towards constructing a conceptual framework for
microtransit systems.
III. Gain an overview understanding when combining the concepts of microtransit and M&E
towards identifying key approaches and core concepts for a microtransit M&E framework.
IV. Develop the microtransit M&E conceptual framework.
V. Validate the microtransit M&E conceptual framework.
VI. Apply the validated framework to a case study as a management (M&E) tool for assessing its
effectiveness and applicability in the context of an existing microtransit company.
VII. Test the generalisability of the finalised framework in the broader context of ITS by application
to a second case study
Table 10-8 explains how each of the above-mentioned research objectives was achieved successfully.
Table 10-8 Conclusions pertaining to reaching the research objectives
Objective Stage(s) Conclusions Reference(s)
I. 1.1 The first of two conceptual literature studies was undertaken exploring
the concept of microtransit to complete the first objective. Background
information is given on concepts fundamental to understanding
microtransit systems:
✓ Sustainable development is defined and discussed
✓ Towards exploring transport sustainability
✓ The concept of a sharing economy
✓ Shared mobility/ride-sharing
All available literature that could be found on microtransit was used to
explore, discuss, and finally define microtransit. Potential strengths,
weaknesses, opportunities and threats were then considered briefly.
Chapter 1, 3
II. 1.2 The second conceptual literature study focused specifically on
Monitoring and Evaluation (M&E) to fully grasp what it entails. The
following main points were explored towards this purpose:
✓ The history of evaluation
✓ Intervention logic/The logic model
✓ General definition of evaluation
✓ Types of evaluation
✓ Purposes of evaluation
✓ Main paradigms/theories in evaluation
✓ General definition of monitoring
✓ Types of monitoring
✓ Differences between monitoring and evaluation
✓ The concept of M&E toward framework development
Chapter 1, 4
Stellenbosch University https://scholar.sun.ac.za

189
✓ Assessing the quality of M&E
An extensive and comprehensive M&E literature study was considered
critical for laying the theoretical foundation and ensuring the
researcher has a good grasp on what the field entails. This ensured that
the correct type of M&E is considered based on an appropriate main
paradigm/theoretical lens in a way adequate for the purpose it is
intended for.
III. 2.1-2.4 For completing this objective, a systematic comparative literature
review is conducted through stages 2.1-2.4, which constitutes the first
part of the SLR. Key approaches and core concepts regarding M&E of
microtransit were identified and discussed by completing the
comparative review stages and an overview understanding was gained
by conducting statistical analysis on the findings. The following was
completed towards these purposes:
✓ Formulate research questions and identify keywords
✓ Specify inclusion and exclusion terms
✓ Identify and choose data sources
✓ Define data selection criteria and selection process
✓ Identify a set of studies relevant to the scope of this research
✓ Gain an overview understanding through high-level reading
✓ Conduct descriptive statistical analysis based on:
o Number of publications per document type
o Literature publications timeline
o Geographic analysis
o Relevance of publications
o Citations
o Recurring themes and frequency of appearance
Following the data analyses, extensive reading of the final set of
relevant studies enabled data extraction and categorisation. From the
extracted data, key approaches and core concepts were identified.
Chapter 5, 6
IV. 2.3-2.5 From the final set of relevant studies, the second part of the SLR is
executed towards completing the fourth objective. Conducting data
analyses on the key approaches and core concepts identified through
achieving the third objective paved the way for framework
development. The extracted data was thus used to:
✓ Identify core concepts
✓ Deconstruct and categorise concepts
✓ Integrate concepts into an initial framework
Chapter 6, 7
V. 3.1-3.3 The fifth objective was achieved through developing a validation
methodology, and completing its subsequent steps:
✓ Conduct a semi-structured interview with a microtransit
expert to verify and finalise the list of indicators
✓ Elucidation on various techniques and methods (EWA, AHP,
and Likert-scale) employed for weighing indicators
✓ Identify experts based on scope of research study
Chapter 6, 7
Stellenbosch University https://scholar.sun.ac.za
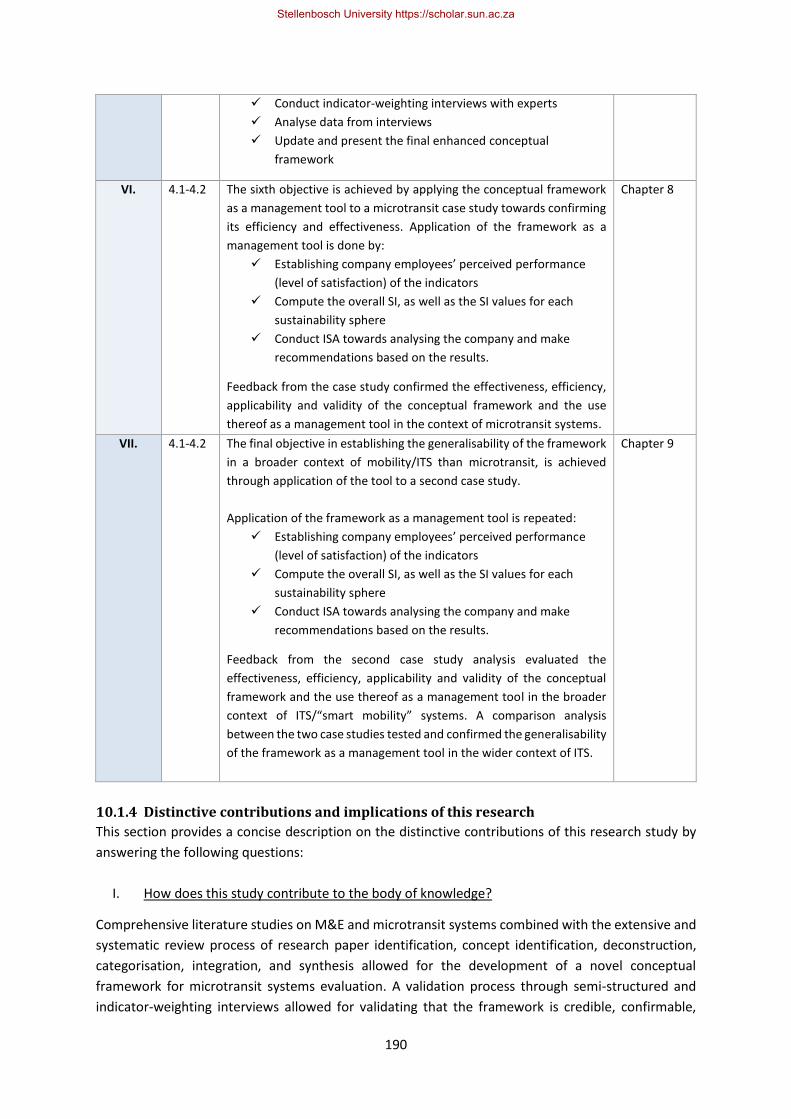
190
✓ Conduct indicator-weighting interviews with experts
✓ Analyse data from interviews
✓ Update and present the final enhanced conceptual
framework
VI. 4.1-4.2 The sixth objective is achieved by applying the conceptual framework
as a management tool to a microtransit case study towards confirming
its efficiency and effectiveness. Application of the framework as a
management tool is done by:
✓ Establishing company employees’ perceived performance
(level of satisfaction) of the indicators
✓ Compute the overall SI, as well as the SI values for each
sustainability sphere
✓ Conduct ISA towards analysing the company and make
recommendations based on the results.
Feedback from the case study confirmed the effectiveness, efficiency,
applicability and validity of the conceptual framework and the use
thereof as a management tool in the context of microtransit systems.
Chapter 8
VII. 4.1-4.2 The final objective in establishing the generalisability of the framework
in a broader context of mobility/ITS than microtransit, is achieved
through application of the tool to a second case study.
Application of the framework as a management tool is repeated:
✓ Establishing company employees’ perceived performance
(level of satisfaction) of the indicators
✓ Compute the overall SI, as well as the SI values for each
sustainability sphere
✓ Conduct ISA towards analysing the company and make
recommendations based on the results.
Feedback from the second case study analysis evaluated the
effectiveness, efficiency, applicability and validity of the conceptual
framework and the use thereof as a management tool in the broader
context of ITS/“smart mobility” systems. A comparison analysis
between the two case studies tested and confirmed the generalisability
of the framework as a management tool in the wider context of ITS.
Chapter 9
10.1.4 Distinctive contributions and implications of this research
This section provides a concise description on the distinctive contributions of this research study by
answering the following questions:
I. How does this study contribute to the body of knowledge?
Comprehensive literature studies on M&E and microtransit systems combined with the extensive and
systematic review process of research paper identification, concept identification, deconstruction,
categorisation, integration, and synthesis allowed for the development of a novel conceptual
framework for microtransit systems evaluation. A validation process through semi-structured and
indicator-weighting interviews allowed for validating that the framework is credible, confirmable,
Stellenbosch University https://scholar.sun.ac.za
191
relevant and needed. It also ensured the reliability, usefulness, efficiency, effectiveness, applicability,
and validity of the framework towards the final enhanced conceptual framework for monitoring and
evaluating microtransit systems. The generalisability of this framework was then established and it
was deemed usefull and transferable to the wider context of ITS.
II. For whom is the framework designed and who can utilise the tool?
While this research study sets out to develop a conceptual framework for monitoring and evaluating
microtransit systems specifically, it ended up developing a framework that would be applicable to and
useful for similar shared mobility or ‘smart mobility’/ITS modes of transport as well. This includes any
mode of transport that is based on the sharing economy and involve IoT and/or ICT and typically focus
on first-and-last-mile transport in densely populated areas. The conceptual framework provides these
alternative modes of transport with a tool which they can use to assess their current contribution to
sustainable development (sustainability performance) in a variety of areas and by determining an
overall sustainability index (SI) which can then be compared to other mobility systems based on
perceived performance. An environmental, social, and economic sustainability index can also be
determined and compared to other mobility systems.
The developed framework is not meant for application to traditional transport systems. Although the
conceptual framework with its approach to determining a sustainability index and conduct ISA or IPA
does not fit all transport contexts, the approach employed in this study in developing such a
framework and its method of analysis towards a management tool is universally transferable to
different contexts.
III. What are the short- and long-term implications of this research?
For companies, managers, policy-makers or any stakeholder of an ITS/microtransit system to gain an
improved understanding of its sustainability performance, quantification such as an index framework
is essential. By using such frameworks, its comprehensive outcomes could provide new perspectives
differing from conventional transportation metrics. These results would prove useful for short-term
system evaluations and provide guidance on decision-making. In the long-term, it would prove useful
in achieving overall goals iteratively through continuous monitoring and conducting regular
evaluations.
10.1.5 Critical reflection
Similar to realistic evaluation discussed in Section 4.3.3 and Figure 4-8 where a mechanism is applied
to a regularity to aim at changing the outcome, the developed conceptual M&E framework was
applied as a management tool to a case study to determine the perceived performance of certain
indicators. By identifying underperforming indicators, activities could be adjusted/applied to these
areas to address them. Through continuous monitoring of the indicators, it is possible to see how their
(perceived) performance change and whether the newly applied/adjusted activities (mechanisms) had
the desired effects (outcomes). It is important to determine whether the applied M&E framework is
in line with strategic objectives and has the desired impacts and also whether it is in line with
operational objectives and has the desired results. While it is clear that a transport system like
microtransit requires a tool to monitor and evaluate the system, it is just as important to continuously
also evaluate the tool itself. This is considered further in Section 10.2.1.
Stellenbosch University https://scholar.sun.ac.za
192
It is also significant to note that while some AoS consists of several indicators, others might only have
two or three indicators under them. This influenced the weight distribution since the sum of the
indicators was always equal to 1 for each AoS. Fewer indicators would thus automatically mean higher
weightings per indicator of that AoS. It was however believed that also weighting each AoS would
account for the aforementioned problem since the relative importance of each AoS will be known and
influence the indicators it is comprised of. Also, it is not realistic to have an equal number of indicators
under each AoS as a variety of factors make up each AoS.
It was also noted that technological maturity was not ranked as important as the researcher expected
it to be. This was surprising since technology (ICT and ITS) is essentially at the core of microtransit
systems and “smart mobility” modes of transport. It might be that this was not stated clearly enough
to the expert participants, or that they merely did not believe that it is as essential for sustainability
considerations as the researcher of this study expected it to be. Future application of the framework
once the microtransit systems have been fully deployed would further clarify the importance of
indicators and elucidate whether the ‘technological maturity’ indicator, as well as other indicators,
should be weighted differently.
10.1.6 Limitations of this research: Reiteration and reflection
When interpreting the findings of this research study, the following limitations should be recognised
and taken into account:
• The researcher recognises that while a systematic sampling approach was employed and
yielded a useful final set of relevant articles, some relevant studies may have failed to be
identified. However, it is believed that prior literature reviewal and proper keyword
identification mitigated this risk.
• Being an extremely wide-ranging, multi-disciplinary and complex field, sustainability could
only be considered comprehensively on a conceptual level through indicator identification.
While some variables are suggested for calculating indicators, the researcher recognises that
additional field-specific research regarding each indicator is needed towards refinement and
improved accuracy of the conceptual framework.
• The developed conceptual framework thus serves as a ‘foundational skeleton’ for institutions,
organisations or any stakeholders to which variables could easily be added, removed and/or
modified. The framework is thus conceptual and would require further additional research
and validation through experts prior to achieving a generic model for application to any
particular microtransit system.
• Geographically, the conceptual framework was developed for application to small-scale
transport systems within urban areas (e.g. cities) or other densely populated areas (e.g. towns
where many people reside, universities etc.), and not rural areas with sparse populations.
• From a technological perspective, the conceptual framework was developed for application
to microtransit systems (or similar ITS or ‘smart mobility’ transport) utilising ICT and IoT
towards a demand-responsive and/or shared mobility service, and not for traditional modes
of transport.
• The validation of the framework was dependent on and partially restricted by the availability,
willingness, and scarcity of identified experts in the field of microtransit or even more
generally ‘smart mobility’. Also, no government officials could be included in the final set of
Stellenbosch University https://scholar.sun.ac.za
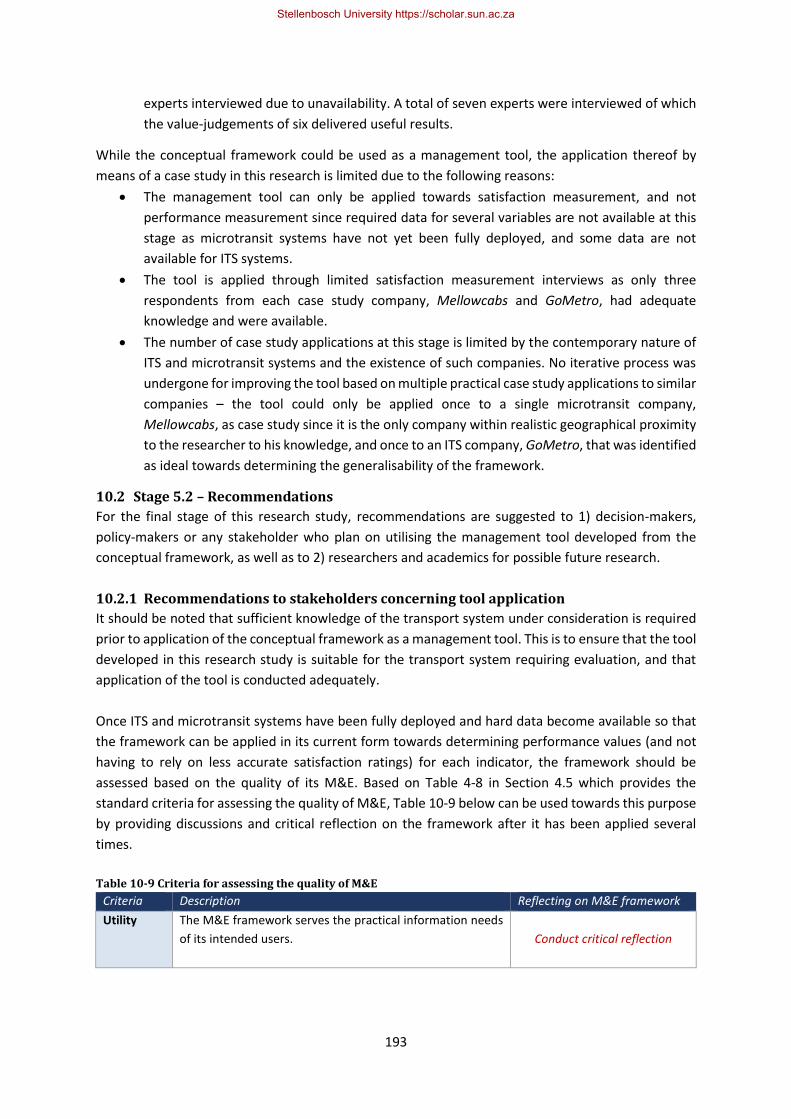
193
experts interviewed due to unavailability. A total of seven experts were interviewed of which
the value-judgements of six delivered useful results.
While the conceptual framework could be used as a management tool, the application thereof by
means of a case study in this research is limited due to the following reasons:
• The management tool can only be applied towards satisfaction measurement, and not
performance measurement since required data for several variables are not available at this
stage as microtransit systems have not yet been fully deployed, and some data are not
available for ITS systems.
• The tool is applied through limited satisfaction measurement interviews as only three
respondents from each case study company, Mellowcabs and GoMetro, had adequate
knowledge and were available.
• The number of case study applications at this stage is limited by the contemporary nature of
ITS and microtransit systems and the existence of such companies. No iterative process was
undergone for improving the tool based on multiple practical case study applications to similar
companies – the tool could only be applied once to a single microtransit company,
Mellowcabs, as case study since it is the only company within realistic geographical proximity
to the researcher to his knowledge, and once to an ITS company, GoMetro, that was identified
as ideal towards determining the generalisability of the framework.
10.2 Stage 5.2 – Recommendations
For the final stage of this research study, recommendations are suggested to 1) decision-makers,
policy-makers or any stakeholder who plan on utilising the management tool developed from the
conceptual framework, as well as to 2) researchers and academics for possible future research.
10.2.1 Recommendations to stakeholders concerning tool application
It should be noted that sufficient knowledge of the transport system under consideration is required
prior to application of the conceptual framework as a management tool. This is to ensure that the tool
developed in this research study is suitable for the transport system requiring evaluation, and that
application of the tool is conducted adequately.
Once ITS and microtransit systems have been fully deployed and hard data become available so that
the framework can be applied in its current form towards determining performance values (and not
having to rely on less accurate satisfaction ratings) for each indicator, the framework should be
assessed based on the quality of its M&E. Based on Table 4-8 in Section 4.5 which provides the
standard criteria for assessing the quality of M&E, Table 10-9 below can be used towards this purpose
by providing discussions and critical reflection on the framework after it has been applied several
times.
Table 10-9 Criteria for assessing the quality of M&E
Criteria Description Reflecting on M&E framework
Utility The M&E framework serves the practical information needs
of its intended users.
Conduct critical reflection
Stellenbosch University https://scholar.sun.ac.za

194
Feasibility The M&E methods, timing, sequences and procedures for
processing are realistic, prudent, and cost-effective and thus
both efficient and effective.
Conduct critical reflection
Propriety All M&E activities are conducted legally and ethically. The
welfare of those affected by the results is also considered.
Conduct critical reflection
Accuracy The outputs from the M&E system will reveal and convey
information that is technically adequate, trustworthy, and
dependable.
Conduct critical reflection
Through application of the M&E framework developed in this research to ITS and microtransit systems
once they have been fully deployed, the M&E framework must be evaluated continuously according
to above-mentioned criteria to determine where, if any, adjustments would be necessary.
10.2.2 Recommendations to researchers for future work
A contribution to the body of knowledge in the form of a conceptual framework for ITS and
microtransit systems is presented by this research study. However, throughout the research process
and following completion thereof, recommendation for future studies was recognised:
• While the framework is very extensive, it is considered necessary at this stage in order to
consider all significant factors. Future work might be to simplify or reduce the list (make it
shorter and easier to determine) even further without sacrificing its comprehensiveness while
still increasing its effectiveness.
• Re-consideration of the conceptual framework through the eyes of researchers from multiple
disciplines relevant to sustainable development since sustainability is a vast field and can be
considered through various lenses and perspectives as researchers from different disciplines
could prioritise different elements.
• In-depth research into each of the 50 indicators can be undertaken by experts in the
respective fields toward further validation, modification and addition of their key variables,
their units for measurement, and appropriate relative weightings based on the priority of the
variables pertaining to that particular expert’s field.
• Further research could be undertaken into the respective indicators as mentioned above,
especially re-evaluating the role of technology and technological maturity in microtransit
systems and similar “smart mobility” modes of transport since the researcher believes these
indicators should be weighted more heavily. The case studies however revealed that this
would not be possible at this stage since not enough data is available, but can be considered
in the future.
• While the developed index framework was designed for the specific context of microtransit
systems, the approach employed in this study in developing such a framework and its method
of analysis towards a management tool can easily be repeated and is universally transferable
to different contexts.
Stellenbosch University https://scholar.sun.ac.za
195
References
ADB (2010) Sustainable transport initiative: Operational plan. ADB. Manila: Asian Development Bank.
Aksnes, D. W. (2003) ‘Characteristics of highly cited papers’, Research Evaluation, 12(3), pp. 159–170.
Al-Harbi, K. M. A.-S. (2001) ‘Application of the AHP in project management’, International Journal of Project Management, 19(1), pp. 19–27.
Alexandrescu, F., Martinát, S., Klusáček, P. and Bartke, S. (2014) ‘The Path From Passivity Toward Entrepreneurship: Public Sector Actors in Brownfield Regeneration Processes in Central and Eastern Europe’, Organization and Environment, 27(2), pp. 181–201.
Aliaga, M. and Gunderson, B. (2000) ‘Interactive Statistics’, The Statistics Teacher Network, pp. 1–7.
Alkin, M. and Christie, C. (2004) ‘Evaluation Roots’. Thousand Oaks, California: SAGE Publications, Inc.
AllAfrica Global Media (2018) South African Transport Start-Up Gometro Opens a UK Office and Gets New Contracts Using Its Flx Transport Data Platform, AllAfrica Global Media. Available at: https://allafrica.com/stories/201812170304.html (Accessed: 15 October 2019).
Allam, A., Onori, S., Marelli, S. and Taborelli, C. (2015) ‘Battery Health Management System for Automotive Applications: A retroactivity-based aging propagation study’, Proceedings of the American Control Conference, 2015-July, pp. 703–716.
Allan, G. (2003) ‘A critique of using grounded theory as a research method’, Electronic Journal of Business Research Method, 2(1), pp. 1–10.
Almeida, A. C. L. (2019) ‘Multi actor multi criteria analysis (MAMCA) as a tool to build indicators and localize sustainable development goal 11 in Brazilian municipalities’, Heliyon, 5(8), p. e02128.
Anastasiadou, K. and Vougias, S. (2019) ‘“Smart” or “sustainably smart” urban road networks? The most important commercial street in Thessaloniki as a case study’, Transport Policy, 82(June), pp. 18–25.
Angkananon, K., Wald, M. and Gilbert, L. (2013) ‘Issues in Conducting Expert Validation and Review and User Evaluation of the Technology Enhanced Interaction Framework and Method’, ICIW 2013 : The Eighth International Conference on Internet and Web Applications and Services, (c), pp. 124–128.
Armaocost, R. L., Componation, P. J., Mullens, M. A. and Swart, W. W. (1994) ‘An AHP framework for prioritizing customer requirements in QFD: an industrialized housing application’, IIE Transactions. Taylor & Francis, 26(4), pp. 72–79.
Astalin, P. K. (2013) ‘Qualitative Research Designs: a Conceptual Framework’, International Journal of Social Science & Interdisciplinary Research, 2(1), pp. 118–124.
Bailey, L., Mokhtarian, P. L. and Little, A. (2008) The Broader Connection between Public Transportation, Energy Conservation and Greenhouse Gas Reduction, ICF International. Fairfax, VA.
Bandeira, R. A. M., D’Agosto, M. A., Ribeiro, S. K., Bandeira, A. P. F. and Goes, G. V. (2018) ‘A fuzzy multi-criteria model for evaluating sustainable urban freight transportation operations’, Journal of Cleaner Production, 184, pp. 727–739.
Banister, D. (2008) ‘The sustainable mobility paradigm’, Transport Policy, 15(2), pp. 73–80.
Bartholomew Eldrigde, L. K., Markham, C. M., Ruiter, R. A. C., Fernàndez, M. E., Kok, G., & Parcel, G. S. (2016) Planning health promotion programs: An Intervention Mapping approach. 4th edn. John Wiley & Sons.
Bekhet, A. K. and Zauszniewski, J. A. (2012) ‘Methodological triangulation: An approach to
Stellenbosch University https://scholar.sun.ac.za
196
understanding data’, Nurse Researcher, 20(2), pp. 40–43.
Benning, J. (2015) Microtransit aims to civilise the worst part of your workday, BBC Autos. Available at: http://www.bbc.com/autos/story/20150903-microtransit-aims-to-civilise-the-worst-part-of-your-workday (Accessed: 14 July 2018).
Bhawna and Gobind (2015) ‘Research Methodology and Approaches’, IOSR Journal of Research & Method in Education Ver, 5(3), pp. 2320–7388.
Boltze, M. and Tuan, V. A. (2016) ‘Approaches to Achieve Sustainability in Traffic Management’, Procedia Engineering, 142, pp. 205–212.
Born, P. H., Dumm, R. E. and Iii, R. J. E. (2015) ‘Developing a Framework for Financial Achievability of Department of Transportation Research and Development Projects’, Transportation Research Record: Journal of the Transportation Research Board, pp. 11–19.
Boruch, R. F. (1975) ‘Coupling Randomized Experiments and Approximations To Experiments in Social Program Evaluation’, Sociological Methods & Research, 4(1), pp. 31–53.
Borzacchiello, M. T., Torrieri, V. and Nijkamp, P. (2009) ‘An operational information systems architecture for assessing sustainable transportation planning: principles and design’, Evaluation and Program Planning, 32(4), pp. 381–389.
Bos, R. (2015) The rise of the Microtransit movement. Available at: http://www.smart-circle.org/blog/microtransit/ (Accessed: 26 August 2018).
Botsman, R. and Rogers, R. C. N. (2010) ‘The Rise of Collaborative Consumption’, in What’s Mine is Yours: how collaborative consumption is changing the way we live. HarperCollins, pp. 67–97.
Breheny, M. J. (1995) Urban travel and sustainable development, Energy. Paris, France: ECMT.
Brundtland, G. (1987) ‘Report of the World Commision on Environement and Development: Our Common Future’, Oxford paperbacks, p. 400.
Buchanan, N., Evans, R. and Dodson, J. (2005) ‘Transport Disadvantage and Social Status: A Gold Coast Pilot Study; URP Research Monograph 8’, Brisbane, Urban Research Program, Griffith University.
Buldeo Rai, H., van Lier, T., Meers, D. and Macharis, C. (2017) ‘Improving urban freight transport sustainability: Policy assessment framework and case study’, Research in Transportation Economics, 64, pp. 26–35.
Business-Marketing (2012) Role And Importance Of Transportation. Available at: http://marketinglord.blogspot.co.za/2012/06/role-and-importance-of-transportation.html (Accessed: 17 May 2017).
Campbell, D. and Cook, T. (1979) Quasi-experimentation: Design and analysis for field settings, Skokie, IL: Rand McNally. Rand McNally College Pub. Co.
Campbell, D. T. and Stanley, J. C. (1963) Experimental and Quasi-Experimental Design for Research, Handbook of Research on Teaching. Chicago: Rand McNally College Pub. Co.
Carifio, J. and Perla, R. J. (2007) ‘Ten Common Misunderstandings, Misconceptions, Persistent Myths and Urban Legends about Likert Scales and Likert Response Formats and their Antidotes’, Journal of Social Sciences, 3(3), pp. 106–116.
Carstens, M. (2013) Mellowcabs: using tech to disrupt first and last mile transport, the African way, Ventureburn. Available at: https://ventureburn.com/2013/08/mellowcabs-using-tech-to-disrupt-first-and-last-mile-transport-the-african-way/ (Accessed: 18 August 2018).
CDMX (no date) ‘Dirección de Monitoreo Atmosférico’. Available at: http://www.aire.cdmx.gob.mx/default.php?opc=%2527ZaBhnmI=&dc=%2527Yg== (Accessed: 27
Stellenbosch University https://scholar.sun.ac.za
197
August 2018).
Celano, L. (2014) ‘6 Methods of data collection and analysis’, Monitoring, Evaluation, Accountability and Learning (MEAL), pp. 1–30.
Channa, A. (2013) ‘Monitoring and Evaluation Strategy’. London, (March), p. 42.
Charmaz, K. (2006) Constructing grounded theory: a practical guide through qualitative analysis. SAGE Publications, Inc.
Chelimsky, E. and Shadish, W. (1997) Evaluation for the 21st Century: A Handbook. Thousand Oaks, California: SAGE Publications, Inc.
Cheyne, C. and Imran, M. (2016) ‘Shared transport: Reducing energy demand and enhancing transport options for residents of small towns’, Energy Research and Social Science, 18, pp. 139–150.
Chokshi, M., Carter, C. and Gupta, D. (1995) The History of Apartheid in South Africa. Available at: http://www-cs-students.stanford.edu/~cale/cs201/apartheid.hist.html (Accessed: 5 July 2018).
Chowdhury, M. A. and Sadek, A. W. (2003) Fundamentals of intelligent transportation systems planning, Artech House ITS library. Artech House.
Coetzee, J. (2019) GoMetro Company Profile. Cape Town.
Cohen, B. and Kietzmann, J. (2014) ‘Ride On! Mobility Business Models for the Sharing Economy’, Organization and Environment, 27(3), pp. 279–296.
COMEAP (2011) Review of the UK Air Quality Index. Available at: https://www.gov.uk/government/publications/comeap-review-of-the-uk-air-quality-index (Accessed: 27 August 2018).
Corbin, J. and Strauss, A. (1990) ‘Grounded Theory Research: Procedures, Canon and Evaluative Criteria’, Qualitative Sociology, 13(1), pp. 3–21.
Cormier, A. and Gilbert, R. (2005) ‘Defining Sustainable Transportation’, Transport, p. 22.
CREST (2013) Module 1 - General Prinsciples and paradigms of evaluation studies.
Creswell, J. W. and Plano Clark, V. L. (2011) Designing and conducting mixed methods research. SAGE Publications, Inc.
Croce, A. I., Musolino, G., Rindone, C. and Vitetta, A. (2019) ‘Sustainable mobility and energy resources: A quantitative assessment of transport services with electrical vehicles’, Renewable and Sustainable Energy Reviews, 113(June), p. 109236.
Crossman, A. (2017) Deductive vs Inductive Reasoning - What’s the Difference?, ThoughtCo. Available at: https://www.thoughtco.com/deductive-vs-inductive-reasoning-3026549 (Accessed: 20 June 2018).
CST (1998) Sustainable Transportation Monitor, The Centre for Sustainable Transportation, Toronto, Ontario.
Dane, A. V and Schneider, B. H. (1998) ‘Program Integrety in Primary and Early Secondary Prevention: are Imlementation Effects out of Control?’, Clinical Psychology Review, 18(1), pp. 23–45.
Datt, S. and Chetty, P. (2016) Types of inductive and deductive research strategy, ProjectGuru. Available at: https://www.projectguru.in/types-of-inductive-and-deductive-research-strategy/ (Accessed: 20 June 2018).
Denzin, N. K., Lincoln, Y. S., Norman, D. K., Yvonna, L. S., Denzin, N. K., Lincoln, Y. S., Norman, D. K. and Yvonna, L. S. (1994) Handbook of Qualitative Research. SAGE Publications, Inc.
Department of Transport (2017) Draft Revised White Paper on National Transport Policy. Pretoria.
Stellenbosch University https://scholar.sun.ac.za
198
DETR (1998) Planning for Sustainable Development : Towards Better Practice Summary, Transport. London. Available at: http://www.planning.detr.gov.uk/sustdev/6.htm (3 (Accessed: 18 June 2018).
Diana, M. (2012) ‘Measuring the satisfaction of multimodal travelers for local transit services in different urban contexts’, Transportation Research Part A: Policy and Practice, 46(1), pp. 1–11.
Diez, J. M., Lopez-Lambas, M. E., Gonzalo, H., Rojo, M. and Garcia-Martinez, A. (2018) ‘Methodology for assessing the cost effectiveness of Sustainable Urban Mobility Plans (SUMPs). The case of the city of Burgos’, Journal of Transport Geography, 68(February), pp. 22–30.
Diriwächter, R. and Valsiner, J. (2006) ‘Qualitative developmental research methods in their historical and epistemological contexts’, Forum Qualitative Sozialforschung, 7(1).
Dobranskyte-Niskota, A., Perujo, A., Jesinghaus, J. and Jensen, P. (2009) Indicators to Assess Sustainability of Transport Activities Part 2: Measurement and Evaluation of Transport Sustainability Performance in the EU27. Luxembourg: European Commision JRC Institute for Environment and Sustainability.
Dodson, J., Gleeson, B. and Sipe, N. (2004) Transport Disadvantage and Social Status: A review of literature and methods; Research Monograph 5. Brisbane.
Eisele, W. L. and Schrank, D. L. (2010) ‘Conceptual Framework and Trucking Application for Estimating Impact of Congestion on Freight’, Transportation Research Record: Journal of the Transportation Research Board, 2168(1), pp. 94–103.
van den Elshout, S. (2012) CAQI Air quliaty index: Comparing Urban Air Quality across Borders.
Emerson, D., Mulley, C. and Bliemer, M. C. J. (2016) ‘A theoretical analysis of business models for urban public transport systems, with comparative reference to a Community Franchise involving Individual Line Ownership’, Research in Transportation Economics, 59, pp. 368–378.
ENRD (2014) Intervention Logic and Evaluation Framework. Rome: European Evaluation Network for Rural Development.
ENRD (2018) Welcome to the European Evaluation Helpdesk for Rural Development. Available at: https://enrd.ec.europa.eu/evaluation/glossary_en (Accessed: 3 July 2018).
European Union (2010) ‘DIRECTIVE 2010/40/EU OF THE EUROPEAN PARLIAMENT AND OF THE COUNCIL of 7 July 2010 on the framework for the deployment of Intelligent Transport Systems in the field of road transport and for interfaces with other modes of transport’, Official Journal of the European Union, pp. 1–13.
Fehr & Peers (2015) FP Think. Available at: http://www.fehrandpeers.com/fpthink/ (Accessed: 13 July 2018).
Fehr & Peers (2017) Current & Emerging Transportation Technologies & Services. Available at: https://www.sacog.org/sites/main/files/file-attachments/current_and_emerging_trans_tech_glossary_9-14.pdf (Accessed: 16 July 2018).
Fetterman, D., Kaftarian, S. and Wandersman, A. (1996) ‘Empowerment Evaluation: Knowledge and Tools for Self-Assessment & Accountability’. Thousand Oaks, California: SAGE Publications, Inc.
Fetterman, D. M. and Pitman, M. A. (1986) Educational evaluation: ethnography in theory, practice, and politics. University of Michigan: SAGE Publications, Inc.
Field, S. A., O’Connor, P. J., Tyre, A. J. and Possingham, H. P. (2007) ‘Making monitoring meaningful’, Austral Ecology, 32(5), pp. 485–491.
Fitzpatrick, J. L., Sanders, J. R. and Worthen, B. R. (2004) ‘Program Evaluation: Alternative Approaches and Practical Guidelines’. American Journal of Evaluation, 20(3), pp. 603–605.
Stellenbosch University https://scholar.sun.ac.za
199
Frei, C., Hyland, M. and Mahmassani, H. S. (2017) ‘Flexing service schedules: Assessing the potential for demand-adaptive hybrid transit via a stated preference approach’, Transportation Research Part C: Emerging Technologies, 76, pp. 71–89.
Freitas, A. L. P. (2013) ‘Assessing the quality of intercity road transportation of passengers: An exploratory study in Brazil’, Transportation Research Part A: Policy and Practice, 49(2013), pp. 379–392.
Fuggini, C., Manfreda, A., Andrés, J. J. Á., Pardi, L., Holst, R., Bournas, D. A., Revel, G. M., Chiariotti, P., Llamas, J., Gatti, G., Dvorak, M. and Mariani, G. (2016) ‘Towards a Comprehensive Asset Integrity Management (AIM) Approach for European Infrastructures’, Transportation Research Procedia, 14, pp. 4060–4069.
Gabriel, D. (2013) Inductive and deductive approaches to research. Available at: https://deborahgabriel.com/2013/03/17/inductive-and-deductive-approaches-to-research/ (Accessed: 20 June 2018).
Garfield, E. (1996) ‘Citation Indexes for Retrieval and Research Evaluation’. The Scientist, pp. 144:649–54.
Georgiadis, G., Politis, I. and Papaioannou, P. (2014) ‘Measuring and improving the efficiency and effectiveness of bus public transport systems’, Research in Transportation Economics, 48, pp. 84–91.
Gilbert, R. and Myrans, K. (2002) ‘Sustainable transportation performance indicators (STPI)’. Toronto, Ontario, pp. 1–18.
Given, L. M. (2008) ‘The Sage Encyclopedia of Qualitative Research Methods’, The MIT Press, p. 1043.
Glaser, B. (2013) ‘Grounded theory methodology’, Introducing Qualitative Research in Psychology, pp. 69–82.
Glaser, B. G. and Strauss, A. L. (1967) The Discovery of Grounded Theory: Strategies for Qualitative Research. Routledge.
Government of Canada (2008) Environment Canada - Air - AQHI categories and explanations, Ec.gc.ca. Available at: https://www.canada.ca/en/environment-climate-change/services/air-quality-health-index/understanding-messages.html (Accessed: 27 August 2018).
Grace, W. (2015) Move over, taxi! This S. African three-wheeler wants to take you for a ride, Houston Style Magazine. Available at: http://stylemagazine.com/news/2014/nov/28/move-over-taxi-s-african-three-wheeler-wants-take-/ (Accessed: 27 August 2018).
Greenroads International. (2018) The Greenroads Rating System. Available at: https://www.greenroads.org/publications (Accessed: 19 August 2018).
Gschwender, A., Munizaga, M. and Simonetti, C. (2016) ‘Using smart card and GPS data for policy and planning: The case of Transantiago’, Research in Transportation Economics, 59, pp. 242–249.
Guba, E. G. (1987) ‘What Have We Learned About Naturalistic Evaluation?’, American Journal of Evaluation, 8(1), pp. 23–43.
Guba, E. G. and Lincoln, Y. S. (1981) Effective Evaluation: Improving the Usefulness of Evaluation Results Through Responsive and Naturalistic Approaches. 1st edn. Jossey-Bass Publishers.
Guba, E. G. and Lincoln, Y. S. (1989) Fourth Generation Evaluation. SAGE Publications, Inc.
Gudmundsson, H., Ericsson, E., Hugosson, M. B. and Rosqvist, L. S. (2009) ‘Framing the role of Decision Support in the case of Stockholm Congestion Charging Trial’, Transportation Research Part A: Policy and Practice, 43(3), pp. 258–268.
Gwilliam, K. (2013) ‘Cities on the move - Ten years after’, Research in Transportation Economics, 40(1),
Stellenbosch University https://scholar.sun.ac.za
200
pp. 3–18.
Haghshenas, H. and Vaziri, M. (2012) ‘Urban sustainable transportation indicators for global comparison’, Ecological Indicators, 15(1), pp. 115–121.
Hall, R. P. (2002) ‘Introducing the Concept of Sustainable Transportation to the U . S . DOT through the Reauthorization of TEA-21’.
Hansen, E. G., Grosse-Dunker, F. and Reichwald, R. (2009) ‘Sustainability innovation cube—a framework to evaluate sustainability-oriented innovations’, International Journal of Innovation Management, 13(4), pp. 683–713.
Henry, G. T. (2000) ‘Why not use?’, New Directions for Evaluation, (88), pp. 85–98.
Hernandez, S., Monzon, A. and de Oña, R. (2016) ‘Urban transport interchanges: A methodology for evaluating perceived quality’, Transportation Research Part A: Policy and Practice, 84, pp. 31–43.
Holden, E. (2008) ‘Achieving sustainable mobility. Everyday and leisure-time travel in the EU’, Journal of Environmental Planning and Management, pp. 471–472.
Holliday, L. R. (2014) ‘Using logic model mapping to evaluate program fidelity’, Studies in Educational Evaluation, 42, pp. 109–117.
Hoskin, K. (1979) ‘The examination, disciplinary power and rational schooling’, History of Education, 8(2), pp. 135–146.
Hsu, A. (2012) China’s new Air Quality Index: How does it measure up? Available at: https://web.archive.org/web/20130717033733/http://hsu.me/2012/03/chinas-new-air-quality-index-how-does-it-measure-up/ (Accessed: 27 August 2018).
Hull, A. (2005) ‘Integrated transport planning in the UK: From concept to reality’, Journal of Transport Geography, 13(4), pp. 318–328.
Hussein, M. El, Hirst, S., Salyers, V. and Osuji, J. (2014) ‘Using Grounded Theory as a Method of Inquiry: Advantages and Disadvantages’, The Qualitative Report, 19(27), pp. 1–15.
Imran, M. and Pearce, J. (2015) ‘Auckland’s first spatial plan: Ambitious aspirations or furthering the status quo?’, Cities, 45, pp. 18–28.
Isabello, A., Pensa, S., Arnone, M. and Rosa, A. (2014) ‘Reviewing Efficiency and Effectiveness of Interurban Public Transport Services: A Practical Experience’, Transportation Research Procedia, 1(1), pp. 243–252.
Jabareen, Y. (2009) ‘Building a conceptual framework: philosophy, definitions, and procedure’, International Journal of Qualitative Methods, 8, pp. 49–62.
Jaffe, E. (2015) How the Microtransit Movement Is Changing Urban Mobility. Available at: https://www.citylab.com/transportation/2015/04/how-the-microtransit-movement-is-changing-urban-mobility/391565/ (Accessed: 4 October 2017).
James Bell Associates (2009) Evaluation Brief: Measuring Implementation Fidelity. Arlington.
Javanbarg, M. B., Scawthorn, C., Kiyono, J. and Shahbodaghkhan, B. (2012) ‘Fuzzy AHP-based multicriteria decision making systems using particle swarm optimization’, Expert Systems with Applications, 39(1), pp. 960–966.
Jennings, G. (2015) ‘Finding our balance: Considering the opportunities for public bicycle systems in Cape Town, South Africa’, Research in Transportation Business and Management, 15(August 2014), pp. 6–14.
Johnson, R. B. (2008) ‘Evaluation in Instructional Design: A Comparison of Evaluation Models’, in Evaluating and managing instructional programs and projects, pp. 96–105.
Stellenbosch University https://scholar.sun.ac.za
201
Kazi, M. a F. and Rostila, I. (2002) ‘The Practice of realist evaluation in two countries’, Proceedings of the European Evaluation Society Conference, pp. 1–19.
Kellaghan, T. and Madaus, G. F. (1982) ‘Chapter 8 – Trends in Educational Standards in Great Britain and Ireland’, in The Rise and Fall of National Test Scores, pp. 195–214.
Kesten, A. S. and Ögüt, K. S. (2014) ‘A new passenger-oriented performance measurement framework for public rail transportation systems’, Promet - Traffic - Traffico, 26(4), pp. 299–311.
Khan, K. S., Kunz, R., Kleijnen, J. and Antes, G. (2003) ‘Five steps to conducting a systematic review.’, Journal of the Royal Society of Medicine, 96(3), pp. 118–121.
Kitchenham, B. and Charters, S. (2007) ‘Guidelines for performing Systematic Literature reviews in Software Engineering Version 2.3’, Engineering, 45(4ve), p. 1051.
Klinger, T., Kenworthy, J. R. and Lanzendorf, M. (2013) ‘Dimensions of urban mobility cultures – a comparison of German cities’, Journal of Transport Geography, 31, pp. 18–29.
Koglin, T. (2009) Sustainable Development in general and urban context: A literature review. Lund, Sweden: Lund University - Department of Technology and Society.
Lakshmi, R. (2014) India launches its own Air Quality Index. Can its numbers be trusted?, The Washington Post. Available at: https://www.washingtonpost.com/news/worldviews/wp/2014/10/17/india-launches-its-own-air-quality-index-can-its-numbers-be-trusted/?noredirect=on&utm_term=.8db1eaad584f (Accessed: 27 August 2018).
Lance Hogan, R. (2009) ‘The historical development of programme evaluation: Exploring the past and present’, Online Journal of Workforce Education and Development, II(4), pp. 1–10.
Lanka, S. and Jena, S. K. (2016) ‘On-road Vehicle Information Processing Framework for Advanced Traveler Information Systems’, 14(8), pp. 419–423.
LeFebvre, R. (2017) Ford’s commuter van service Chariot halts operations in San Francisco, endgadget. Available at: https://www.engadget.com/2017/10/20/ford-commuter-van-chariot-halts-operations/ (Accessed: 13 July 2018).
Likert, R. (1932) A technique for the measurement of attitudes. Edited by R. S. Woodworth. New York: Archives of Psychology.
Lin, L.-T., Yeh, C.-F., Chen, S. C. Y. and Huang, C.-C. (2017) ‘Role of governance in the achievement of 20-fold increase in bus ridership – A case study of Taichung City’, Transportation Research Part A: Policy and Practice, 98, pp. 64–76.
Lincoln, Y. S. and Guba, E. G. (1986) ‘But Is It Rigorous? Trustworthiness and Naturalistic Evaluation’, New Directions for Program Evaluation, 1986(30), pp. 73–84.
Lindholm, M. and Behrends, S. (2012) ‘Challenges in urban freight transport planning – a review in the Baltic Sea Region’, Journal of Transport Geography, 22, pp. 129–136.
Liou, J. J. H., Hsu, C.-C. and Chen, Y.-S. (2014) ‘Improving transportation service quality based on information fusion’, Transportation Research Part A: Policy and Practice, 67, pp. 225–239.
Litman, T. (2016) ‘Well Measured - Developing Indicators for Sustainable and Livable Transport Planning’, Transportation Research Record, pp. 10–15.
Loo, B. P. Y., Hung, W. T., Lo, H. K. and Wong, S. C. (2005) ‘Road Safety Strategies: A Comparative Framework and Case Studies’, Transport Reviews, 25(5), pp. 613–639.
Lovins, L. H. and Cohen, B. (2011) ‘A Future That Works’, Climate Capitalism: Capitalism in the Age of Climate Change, pp. 272–287.
Stellenbosch University https://scholar.sun.ac.za
202
Low, N. and Gleeson, B. (2003) Making Urban Transport Sustainable. 1st edn. Palgrave Macmillan UK.
Lyons, G. and Urry, J. (2005) ‘Travel time use in the information age’, Transportation Research Part A: Policy and Practice, 39(2-3 SPEC. ISS.), pp. 257–276.
Macário, R. (2010) ‘Competing for level of service in the provision of mobility services: Concepts, processes and measures’, Research in Transportation Economics, 29(1), pp. 261–274.
Machado-León, J. L., de Oña, R. and de Oña, J. (2016) ‘The role of involvement in regards to public transit riders’ perceptions of the service’, Transport Policy, 48, pp. 34–44.
Macharis, C. and Bernardini, A. (2015) ‘Reviewing the use of multi-criteria decision analysis for the evaluation of transport projects: Time for a multi-actor approach’, Transport Policy, 37, pp. 177–186.
Madaus, G.F., Stufflebeam, D.L., & Kellaghan, T. (2000) Evaluation models: Viewpoints on educational and human services evaluation. 2nd ed. Hingham, MA: Kluwer Academic Publishers.
Madaus, G. F. and O’Dwyer, L. M. (1999) ‘A short history of performance assessment: Lessons learned’, Phi Delta Kappan, 80, pp. 688–695.
Madaus, G. F. and Stufflebeam, D. L. (1984) ‘Educational evaluation and accountability: A review of quality assurance efforts’, American Behavioral Scientist. Sage Publications, 27(5), pp. 649–672.
Madaus, G. F. and Stufflebeam, D. L. (2000) ‘Program evaluation: A historical overview’, in Evaluation models: Viewpoints on educational and human services evaluation. Boston: Kluwer Academic Publishers, pp. 3–18.
Mark, M. M., Henry, G. T. and Julnes, G. (1999) ‘Toward an integrative framework for evaluation practice’, American Journal of Evaluation, 20(2), pp. 177–198.
MaRS Discovery District (2016) Microtransit : An assessment of potential to drive greenhouse gas reductions. Available at: https://www.marsdd.com/wp-content/uploads/2016/12/Microtransit-report-2016.pdf (Accessed: 1 June 2017).
Martilla, J. A. and James, J. C. (1977) ‘Importance-Performance Analysis’, Journal of Marketing, 41(1), p. 77.
Mawapanga, M. N. and Debertin, D. L. (1996) ‘Choosing between Alternative Farming Systems: An Application of the Analytic Hierarchy Process’, Applied Economic Perspectives and Policy, 18(3), pp. 385–401.
McLaughlin, M. W. and Phillips, D. C. (1991) ‘Evaluation and Education: At Quarter Century’, Yearbook of the National Society for the Study of Education, p. 296.
Medda, F. (2012) ‘Land value capture finance for transport accessibility: a review’, Journal of Transport Geography, 25, pp. 154–161.
Mellowcabs (2017) Mellowcabs Web Page, Mellowcabs. Available at: https://www.mellowcabs.com/ (Accessed: 27 August 2018).
Mertens, D. M. and Wilson, A. T. (2012) ‘Sample Chapter: Program Evaluation Theory and Practice: A Comprehensive Guide’, pp. 1–19.
Mihyeon Jeon, C. and Amekudzi, A. (2005) ‘Addressing Sustainability in Transportation Systems: Definitions, Indicators, and Metrics’, Journal of Infrastructure Systems, 11(1), pp. 31–50.
Miranda, H. de F. and Rodrigues da Silva, A. N. (2012) ‘Benchmarking sustainable urban mobility: The case of Curitiba, Brazil’, Transport Policy, 21, pp. 141–151.
Mlinarić, T. J., Đorđević, B. and Krmac, E. (2018) ‘Evaluation framework for key performance indicators of railway its’, Promet - Traffic - Traffico, 30(4), pp. 491–500.
Moreland, K., Ogle, J., Chowdhury, M. R. and Dunning, A. (2011) ‘Transit-system evaluation process:
Stellenbosch University https://scholar.sun.ac.za
203
From planning to realization’, ITE Journal (Institute of Transportation Engineers), 81(10), pp. 33–39.
Mowbray, C. T., Holter, M. C., Teague, G. B. and Bybee, D. (2003) ‘Fidelity criteria: Development, measurement, and validation’, American Journal of Evaluation, pp. 315–340.
Mozos-Blanco, M. Á., Pozo-Menéndez, E., Arce-Ruiz, R. and Baucells-Aletà, N. (2018) ‘The way to sustainable mobility. A comparative analysis of sustainable mobility plans in Spain’, Transport Policy, 72(July), pp. 45–54.
Mugion, R. G., Toni, M., Raharjo, H., Di Pietro, L. and Sebathu, S. P. (2018) ‘Does the service quality of urban public transport enhance sustainable mobility?’, Journal of Cleaner Production, 174, pp. 1566–1587.
Mulley, C. and Weisbrod, G. (2016) ‘Workshop 8 report: The wider economic, social and environmental impacts of public transport investment’, Research in Transportation Economics, 59, pp. 397–400.
Munira, S. and Santoso, D. S. (2017) ‘Examining public perception over outcome indicators of sustainable urban transport in Dhaka city’, Case Studies on Transport Policy. Elsevier, (March), pp. 0–1.
Muñoz, J. C. and de Grange, L. (2010) ‘On the development of public transit in large cities’, Research in Transportation Economics, 29(1), pp. 379–386.
Musso, A. and Corazza, M. V. (2015) ‘The European bus system of the future: Research and innovation’, Transportation Research Procedia, 5, pp. 13–29.
National Planning Commission (2011) ‘Our future - make it work, National Develoment Plan Executive Summary’, p. 70.
Nelson, J. D. and Mulley, C. (2013) ‘The impact of the application of new technology on public transport service provision and the passenger experience: A focus on implementation in Australia’, Research in Transportation Economics, 39(1), pp. 300–308.
Noland, R. B. and Polak, J. W. (2002) ‘Travel time variability: A review of theoretical and empirical issues’, Transport Reviews, 22(1), pp. 39–54.
NORAD (1999) ‘The Logical Framework Approach (LFA) - Handbook for objectives-oriented planning’, Zhurnal Eksperimental’noi i Teoreticheskoi Fiziki, p. 107.
O’Donoghue, T. A. and Punch, K. F. (2003) Qualitative educational research in action: Doing and reflecting. Edited by T. A. O’Donoghue. Psychology Press.
O’Reilly, K. (2009) ‘Inductive and Deductive’, in Key Concepts in Ethnography. London: SAGE Publications Ltd, pp. 104–109.
OECD (2002) ‘Glossary of Key Terms in Evaluation and Results Based Management’, Evaluation and Aid Effectiveness, p. 38.
OECD and JRC (2008) Handbook on Constructing Composite Indicators: Methodology and User Guide. Paris, France: OECD Publishing.
Olofsson, Z., Varhelyi, A., Koglin, T. and Angjelevska, B. (2011) ‘Measuring Sustainability of Transport in the City - Development of an Indicator-Set’, Bulletin 3, p. 99.
de Oña, J., de Oña, R., Eboli, L. and Mazzulla, G. (2016) ‘Index numbers for monitoring transit service quality’, Transportation Research Part A: Policy and Practice, 84, pp. 18–30.
Onatere, J. O., Nwagboso, C. and Georgakis, P. (2014) ‘Performance indicators for urban transport development in Nigeria’, WIT Transactions on the Built Environment, 138, pp. 555–568.
Ozbay, K., Bartin, B., Mudigonda, S. and Iyer, S. (2013) ‘Assist-Me’, Transportation Research Record:
Stellenbosch University https://scholar.sun.ac.za
204
Journal of the Transportation Research Board, 2399, pp. 63–73.
Patton, M. Q. (1980) ‘Qualitative Interviewing’, Qualitiative Evaluation Methods, pp. 195–263.
Patton, M. Q. (2002) ‘Qualitative Research & Evaluation Methods’. SAGE Publications, Inc.
Patton, M. Q. (2008) Utilization-focused evaluation. 4th edn. Beverly Hills: SAGE Publications, Inc.
Patton, M. Q. (2011) Developmental evaluation: Applying complexity concepts to enhance innovation and use. Guilford Press.
Patton, M. Q. (2012) ‘Identifying the Intended User(s) and Use(s) of an Evaluation’, International Development Research Centre.
Pautasso, M. (2013) ‘Ten Simple Rules for Writing a Literature Review’, PLoS Computational Biology, 9(7).
Perra, V. M., Sdoukopoulos, A. and Pitsiava-Latinopoulou, M. (2017) ‘Evaluation of sustainable urban mobility in the city of Thessaloniki’, Transportation Research Procedia, 24(2016), pp. 329–336.
Peters, S. (2016) #DesignMonth: Mellowcabs to hit SA streets in 2016, Biz Community. Available at: https://www.bizcommunity.com/Article/196/701/140903.html (Accessed: 27 August 2018).
Peterson, D. L., Silsbee, D. G. and Schmoldt, D. L. (1994) ‘A case study of resources management planning with multiple objectives and projects’, Environmental Management, 18(5), p. 729.
Placido, A. and D’Acierno, L. (2015) ‘A Methodology for Assessing the Feasibility of Fleet Compositions with Dynamic Demand’, Transportation Research Procedia, 10, pp. 595–604.
Polit, D. F. and Beck, C. T. (2006) ‘The content validity index: Are you sure you know what’s being reported? critique and recommendations’, Research in Nursing & Health. Wiley-Blackwell, 29(5), pp. 489–497.
Politis, I., Papaioannou, P. and Basbas, S. (2012) ‘Integrated choice and latent variable models for evaluating flexible transport mode choice’, Research in Transportation Business and Management, 3, pp. 24–38.
Poor, A. and Lindquits, K. (2007) Sustainability and Transportation, Definition and Relationship: Synthesis. Available at: http://www.cmque.com/publications/Sustainmobility2007.pdf (Accessed: 17 August 2018).
Potter, S. (2004) ‘Undertaking a Literature Review’, Doing Postgraduate Research, 4(4), pp. 411–429.
Project Management Institute Inc (2000) A guide to the project management body of knowledge (PMBOK® guide). Project Management Institute Inc.
Proost, S., Van Dender, K., Courcelle, C., De Borger, B., Peirson, J., Sharp, D., Vickerman, R., Gibbons, E., O’Mahony, M., Heaney, Q., Van Den Bergh, J. and Verhoef, E. (2002) ‘How large is the gap between present and efficient transport prices in Europe?’, Transport Policy, 9(1), pp. 41–57.
Pucher, J. and Dijkstra, L. (2003) ‘Promoting Safe Walking and Cycling to Improve Public Health: Lessons from The Netherlands and Germany’, American Journal of Public Health, 93(9), pp. 1509–1516.
Punch, K. F. (1998) Introduction to Social Research : Quantitative and Qualitative Approaches, Essential Resource Books for Social Research. SAGE Publications Ltd.
Puoane, T. (2010) Defining Monitoring and Evaluation. Cape Town: School of Public Health - UWC.
Rallis, S. F. and Rossman, G. B. (2000) ‘Dialogue for learning: Evaluator as critical friend’, New Directions for Evaluation, 2000(86), pp. 81–92.
Reynolds, J. H., Knutson, M. G., Newman, K. B., Silverman, E. D. and Thompson, W. L. (2016) ‘A road
Stellenbosch University https://scholar.sun.ac.za
205
map for designing and implementing a biological monitoring program’, Environmental Monitoring and Assessment. Springer, 188(7), pp. 1–25.
Ricci, M. (2015) ‘Bike sharing: A review of evidence on impacts and processes of implementation and operation’, Research in Transportation Business & Management, 15, pp. 28–38.
Rodrigue, J. P., Comtois, C. and Slack, B. (2016) The geography of transport systems. 3rd edn. Routledge.
Rohde, J., Benjamin, V., Mielenz, H. and Marius, J. Z. (2016) Precise vehicle localization in dense urban environments. Rio de Janeiro.
Rosen, P. (2001) ‘Technology Analysis & Strategic Management Towards Sustainable and Democratic Urban’, Technology Analysis & Strategic Management, 13, pp. 151–160.
Rossi, P. H., Lipsey, M. W. and Freeman, H. E. (2004) Evaluation: A Systematic Approach, Evaluation.
Russell, R. S. and Taylor, B. W. (1998) Operations management : Focusing on quality and competitiveness. 2nd ed. Upper Saddle River, N.J: Prentice-Hall International.
Saaty, T. L. (1980) The Analytic Hierarchy Process, Decision Analysis. McGraw-Hill.
Salabarría-Peña, Y., Apt, B. S. and Walsh, C. M. (2007) ‘Types of Evaluation’, Practical use of program evaluation among sexually transmitted disease (STD) programs, pp. 119–171.
Santos, G., Behrendt, H. and Teytelboym, A. (2010) ‘Part II: Policy instruments for sustainable road transport’, Research in Transportation Economics, 28(1), pp. 46–91.
Saunders, M. L., Lewis, P. and Thornhill, A. (2016) Research Methods for Business Students. 7th edn. Pearson Education Ltd.
Scriven, M. (1967) The methodology of evaluation. Purdue University: Lafayette, Ind.
Scriven, M. (1991) ‘Evaluation thesaurus’. SAGE Publications, Inc., pp. 138–139.
Scriven, M. (1996) ‘The Theory behind Practical Evaluation’, Evaluation, 2(4), pp. 393–404.
Sdoukopoulos, A., Pitsiava-Latinopoulou, M., Basbas, S. and Papaioannou, P. (2019) ‘Measuring progress towards transport sustainability through indicators: Analysis and metrics of the main indicator initiatives’, Transportation Research Part D: Transport and Environment, 67(December 2018), pp. 316–333.
Shadish, W. R., Cook, T. D. and Leviton, L. C. (1991) ‘Foundations of Program Evaluation: Theories of Practice.’, Contemporary Sociology, 21(1), p. 122.
Shaheen, S., Chan, N., Bansal, A. and Cohen, A. (2015) ‘Shared Mobility a Sustainablity and Technology Workshop: Definition, Industry Development and Early Understanding’, University of California Berkeley Transportation Sustainability Research Center, p. 30.
Siddaway, A. (2014) ‘What is a systematic literature review and how do I do one?’, University of Stirling, (Ii), pp. 1–13.
da Silva, A. N. R., da Silva Costa, M. and Macedo, M. H. (2008) ‘Multiple views of sustainable urban mobility: The case of Brazil’, Transport Policy, 15(6), pp. 350–360.
Simsek, B., Pakdil, F., Dengiz, B. and Testik, M. C. (2013) ‘Driver performance appraisal using GPS terminal measurements: A conceptual framework’, Transportation Research Part C: Emerging Technologies, 26, pp. 49–60.
Singh, R. K., Murty, H. R., Gupta, S. K. and Dikshit, A. K. (2007) ‘Development of composite sustainability performance index for steel industry’, Ecological Indicators, 7(3), pp. 565–588.
Singh, R. K., Murty, H. R., Gupta, S. K. and Dikshit, A. K. (2009) ‘An overview of sustainability assessment
Stellenbosch University https://scholar.sun.ac.za
206
methodologies’, Ecological Indicators, 9(2), pp. 189–212.
Skordylis, A. and Trigoni, N. (2011) ‘Efficient data propagation in traffic-monitoring vehicular networks’, IEEE Transactions on Intelligent Transportation Systems, 12(3), pp. 680–694.
Smith, M. R. (1987) Army Ordnance and the ‘American System’ of Manufacturing, 1815-1861. MIT Press.
Soiferman, L. K. (2010) Compare and Contrast Inductive and Deductive Research Approaches, Research Approach. ERIC Clearinghouse.
Stanley, J. and Longva, F. (2010) ‘Workshop report - A successful contractual setting’, Research in Transportation Economics, 29(1), pp. 80–88.
Stanley, J. and Lucas, K. (2014) ‘Workshop 6 Report: Delivering sustainable public transport’, Research in Transportation Economics, 48, pp. 315–322.
Stanley, J. and Smith, A. (2013) ‘Workshop 3A: Governance, contracting, ownership and competition issues in public transport: Looking up not down’, Research in Transportation Economics, 39(1), pp. 167–174.
Stead, J. G. and Stead, W. E. (2013) ‘The Coevolution of Sustainable Strategic Management in the Global Marketplace’, Organization & Environment, 26(2), pp. 162–183.
Strauss, A. and Corbin, J. (1994) ‘Grounded theory methodology’, Handbook of qualitative research, pp. 273–285.
Strayer, G. D. and Whipple, G. M. (1916) Standards and tests for the measurement of the efficiency of schools and school systems. 2018th edn. LLC: Creative Media Partners, LLC, 2018.
Strulak-Wójcikiewicz, R. and Lemke, J. (2019) ‘Concept of a Simulation Model for Assessing the Sustainable Development of Urban Transport’, Transportation Research Procedia, 39(2018), pp. 502–513.
Stufflebeam, D. L. and Shinkfield, A. J. (2007) ‘Evaluation theory, models, and applications’, in Research Methods for the Social Sciences. University of Michigan: John Wiley & Sons, pp. 1–736.
Taecharungroj, V., Boonchaiyapruek, P. and Muthuta, M. (2019) ‘Three-pronged sustainability assessment of ten towns in the vicinity of Bangkok, Thailand’, Environmental and Sustainability Indicators, 3–4(May), pp. 2–16.
Talmage, H. (1982) ‘Evaluation of programmes’, in Mitzel, H. E. (ed.) Encyclopedia of educational research. 5th Editio. New York: Free Press.
TCRP (2004) Operational Experiences with Flexible Transit Services : A Synthesis of Transit Practice. Washington, D.C. Available at: http://onlinepubs.trb.org/onlinepubs/tcrp/tcrp_syn_53.pdf (Accessed: 3 July 2018).
Tilley, N. and Pawson, R. (2000) ‘Realistic Evaluation: An Overview’, The British Journal of Sociology, 49(September), p. 331.
Timm, S. (2018) New mapping tool like Strava for public transport planners says GoMetro founder, Ventureburn. Available at: https://ventureburn.com/2018/05/new-gometro-mapping-tool-like-strava-public-transport-planners-says-startup-founder/ (Accessed: 28 January 2018).
Tricker, R. C. (2007) ‘Assessing cumulative environmental effects from major public transport projects’, Transport Policy, 14(4), pp. 293–305.
Trochim, W. M. K. (2006) Research Methods: The Concise Knowledge Base. Atomic Dog Pub.
Tsamboulas, D., Verma, A. and Moraiti, P. (2013) ‘Transport infrastructure provision and operations: Why should governments choose private-public partnership?’, Research in Transportation Economics,
Stellenbosch University https://scholar.sun.ac.za
207
38(1), pp. 122–127.
Tsele, L. (2017) Diversification Is Helping This Transport Startup To Stand Out In a Crowded Market, SME South Africa. Available at: https://smesouthafrica.co.za/17171/Startups-Mellowcabs-Neil-DuPreez-Model/ (Accessed: 27 August 2018).
Umhlaba Development Services (2011) Introduction to Monitoring and Evaluation Using the Logical Framework Approach. Johannesburg. Available at: http://eeas.europa.eu/archives/delegations/ethiopia/documents/eu_ethiopia/ressources/m_e_manual_en.pdf (Accessed: 3 July 2018).
UNDP (2002) Handbook on Monitoring and Evaluating for Results. New York: United Nations Development Programme Evaluation Office.
UNDP (2009) Handbook on Planning , Monitoring and Evaluating. New York: UNDP, 2002. Handbook on Monitoring and Evaluating for Results, New York: United Nations Development Programme Evaluation Office.
US EPA (2011) Air Quality Index (AQI) Basics, www.airnow.gov. Available at: https://www.airnow.gov/index.cfm?action=aqibasics.aqi (Accessed: 27 August 2018).
Ustaoglu, E., Williams, B. and Murphy, E. (2016) ‘Integrating CBA and land-use development scenarios: Evaluation of planned rail investments in the Greater Dublin Area, Ireland’, Case Studies on Transport Policy. World Conference on Transport Research Society, 4(2), pp. 104–121.
Vagias, W. (2006) ‘Likert-type scale response anchors’. Clemson University: Clemson International Institute for Tourism and Research Development, pp. 3–4.
Weiss, C. H. (1998) Evaluation: methods for studying programs and policies. Prentice Hall.
Williams, David D (1986) ‘Naturalistic Evaluation: Potential Conflicts Between Evaluation Standards and Criteria for Conducting Naturalistic Inquiry’, Educational Evaluation and Policy Analysis, 8(1), pp. 87–99.
Williams, David D. (1986) ‘When is naturalistic evaluation appropriate?’, New Directions for Program Evaluation, (30), pp. 85–92.
World Bank (1996) Sustainable Transport : Priorities for Policy Reform. Washington, DC: Development in Practice Books.
Wright, S., Emele, C. D., Fukumoto, M., Velaga, N. R. and Nelson, J. D. (2014) ‘The design, management and operation of flexible transport systems: Comparison of experience between UK, Japan and India’, Research in Transportation Economics, 48, pp. 330–338.
Wyatt, P. J. (1997) ‘The development of a GIS-based property information system for real estate valuation’, International Journal of Geographical Information Science, 11(5), pp. 435–450.
Yang, C.-H., Lee, K.-C. and Chen, H.-C. (2016) ‘Incorporating carbon footprint with activity-based costing constraints into sustainable public transport infrastructure project decisions’, Journal of Cleaner Production, 133, pp. 1154–1166.
Yarbrough, D. B., Shulha, L. M., Hopson, R. K., & Caruthers, F. A. (2011) The program evaluation standards: A guide for evaluators and evaluation users. 3rd ed. Thousand Oaks, CA: Sage.
Zegras, C. (2006) ‘Sustainable Transport Indicators and Assessment Methodologies’, Biannual Conference and Exhibit of the Clean Air Initiative for Latin American Cities. Sustainable Transport: Linkages to Mitigate Climate Change and Improve Air Quality, p. 17.
Zhao, J., Frumin, M., Wilson, N. and Zhao, Z. (2013) ‘Unified estimator for excess journey time under heterogeneous passenger incidence behavior using smartcard data’, Transportation Research Part C: Emerging Technologies, 34, pp. 70–88.
Stellenbosch University https://scholar.sun.ac.za
208
Zheng, J., Garrick, N. W., Atkinson-Palombo, C., McCahill, C. and Marshall, W. (2013) ‘Guidelines on developing performance metrics for evaluating transportation sustainability’, Research in Transportation Business and Management. Elsevier B.V., 7, pp. 4–13.
Zheng, J., Mehndiratta, S., Guo, J. Y. and Liu, Z. (2012) ‘Strategic policies and demonstration program of electric vehicle in China’, Transport Policy, 19(1), pp. 17–25.
Zimbabwe, J. (2015) First Over the Bridj, Urban Land. Available at: https://urbanland.uli.org/economy-markets-trends/first-bridj/ (Accessed: 13 July 2018).
Znaniecki, F. (1934) The Method of Sociology. New York: Farrar & Rinehart.
Zope, R., Vasudevan, N., Arkatkar, S. S. and Joshi, G. (2019) ‘Benchmarking: A tool for evaluation and monitoring sustainability of urban transport system in metropolitan cities of India’, Sustainable Cities and Society, 45(December 2017), pp. 48–58.
Zuidgeest, M. H. ., Witbreuk, M. J. G. and Maarseveen, M. F. a. M. Van (2000) ‘Sustainable Transport : a Review From a Pragmatic Perspective’, 19th Southern African Transport Conference (SATC2000), (July), pp. 17–20.
Stellenbosch University https://scholar.sun.ac.za
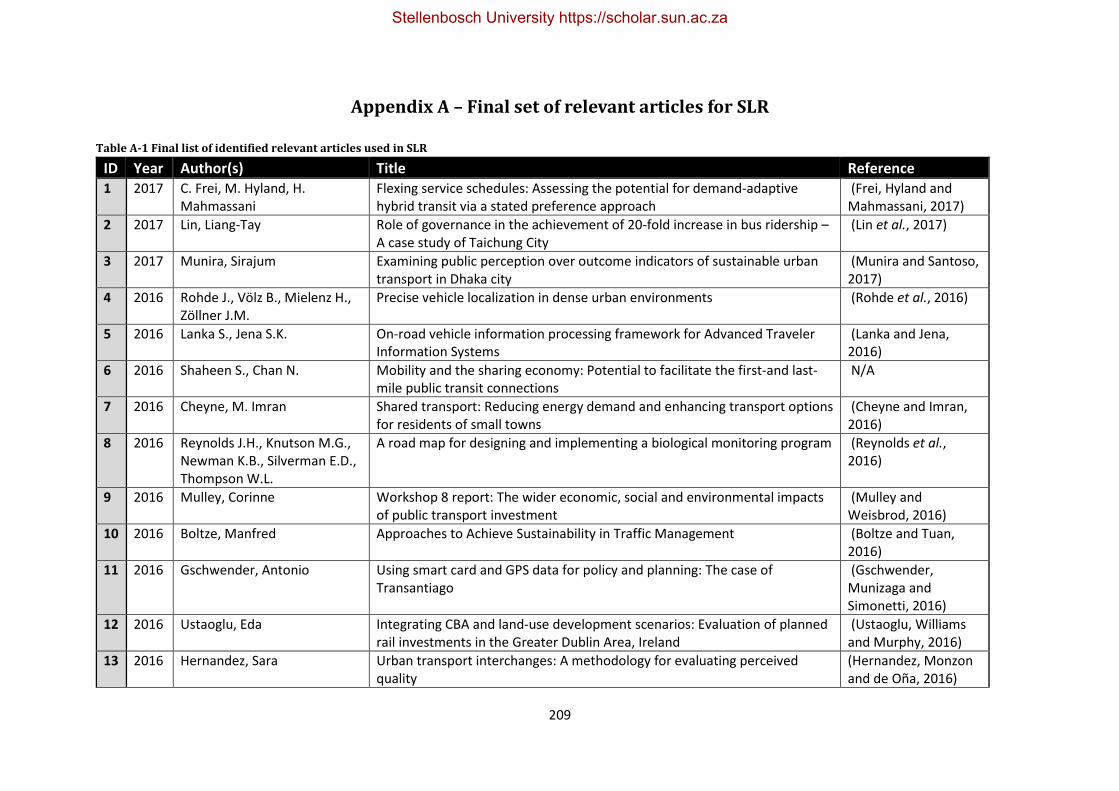
209
Appendix A – Final set of relevant articles for SLR Table A-1 Final list of identified relevant articles used in SLR
ID Year Author(s) Title Reference 1 2017 C. Frei, M. Hyland, H.
Mahmassani Flexing service schedules: Assessing the potential for demand-adaptive hybrid transit via a stated preference approach
(Frei, Hyland and Mahmassani, 2017)
2 2017 Lin, Liang-Tay Role of governance in the achievement of 20-fold increase in bus ridership – A case study of Taichung City
(Lin et al., 2017)
3 2017 Munira, Sirajum Examining public perception over outcome indicators of sustainable urban transport in Dhaka city
(Munira and Santoso, 2017)
4 2016 Rohde J., Völz B., Mielenz H., Zöllner J.M.
Precise vehicle localization in dense urban environments (Rohde et al., 2016)
5 2016 Lanka S., Jena S.K. On-road vehicle information processing framework for Advanced Traveler Information Systems
(Lanka and Jena, 2016)
6 2016 Shaheen S., Chan N. Mobility and the sharing economy: Potential to facilitate the first-and last-mile public transit connections
N/A
7 2016 Cheyne, M. Imran Shared transport: Reducing energy demand and enhancing transport options for residents of small towns
(Cheyne and Imran, 2016)
8 2016 Reynolds J.H., Knutson M.G., Newman K.B., Silverman E.D., Thompson W.L.
A road map for designing and implementing a biological monitoring program (Reynolds et al., 2016)
9 2016 Mulley, Corinne Workshop 8 report: The wider economic, social and environmental impacts of public transport investment
(Mulley and Weisbrod, 2016)
10 2016 Boltze, Manfred Approaches to Achieve Sustainability in Traffic Management (Boltze and Tuan, 2016)
11 2016 Gschwender, Antonio Using smart card and GPS data for policy and planning: The case of Transantiago
(Gschwender, Munizaga and Simonetti, 2016)
12 2016 Ustaoglu, Eda Integrating CBA and land-use development scenarios: Evaluation of planned rail investments in the Greater Dublin Area, Ireland
(Ustaoglu, Williams and Murphy, 2016)
13 2016 Hernandez, Sara Urban transport interchanges: A methodology for evaluating perceived quality
(Hernandez, Monzon and de Oña, 2016)
Stellenbosch University https://scholar.sun.ac.za
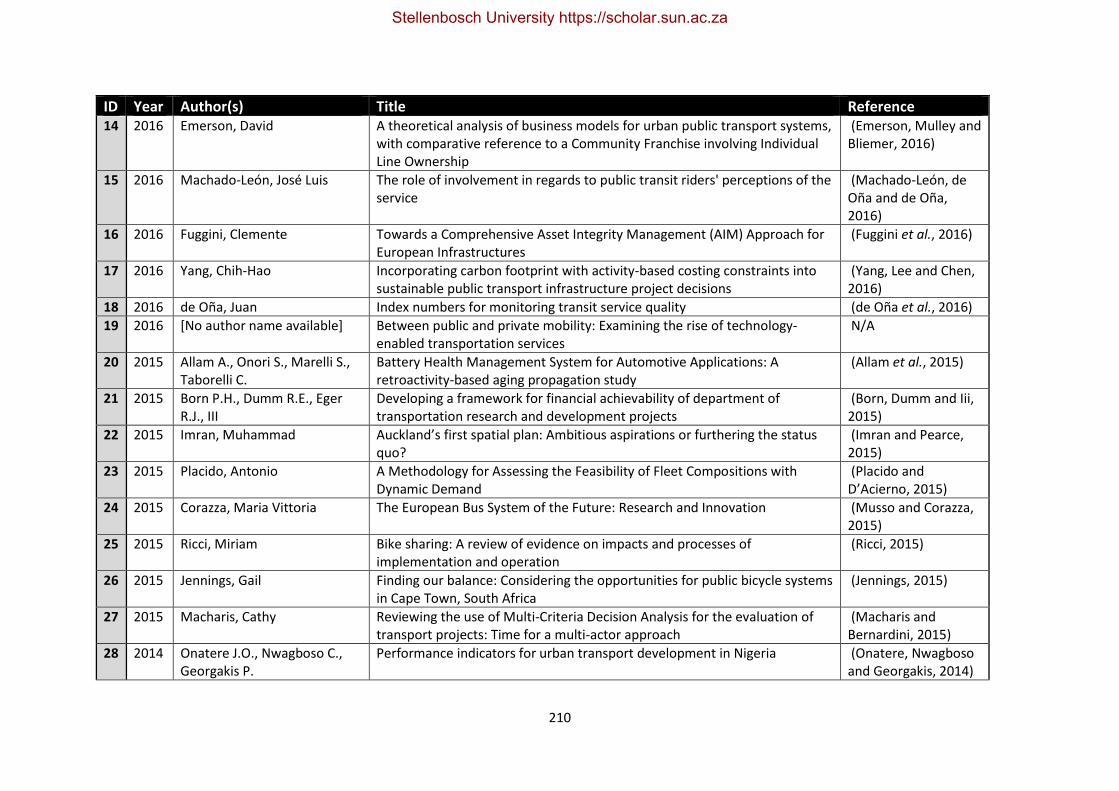
210
ID Year Author(s) Title Reference 14 2016 Emerson, David A theoretical analysis of business models for urban public transport systems,
with comparative reference to a Community Franchise involving Individual Line Ownership
(Emerson, Mulley and Bliemer, 2016)
15 2016 Machado-León, José Luis The role of involvement in regards to public transit riders' perceptions of the service
(Machado-León, de Oña and de Oña, 2016)
16 2016 Fuggini, Clemente Towards a Comprehensive Asset Integrity Management (AIM) Approach for European Infrastructures
(Fuggini et al., 2016)
17 2016 Yang, Chih-Hao Incorporating carbon footprint with activity-based costing constraints into sustainable public transport infrastructure project decisions
(Yang, Lee and Chen, 2016)
18 2016 de Oña, Juan Index numbers for monitoring transit service quality (de Oña et al., 2016)
19 2016 [No author name available] Between public and private mobility: Examining the rise of technology-enabled transportation services
N/A
20 2015 Allam A., Onori S., Marelli S., Taborelli C.
Battery Health Management System for Automotive Applications: A retroactivity-based aging propagation study
(Allam et al., 2015)
21 2015 Born P.H., Dumm R.E., Eger R.J., III
Developing a framework for financial achievability of department of transportation research and development projects
(Born, Dumm and Iii, 2015)
22 2015 Imran, Muhammad Auckland’s first spatial plan: Ambitious aspirations or furthering the status quo?
(Imran and Pearce, 2015)
23 2015 Placido, Antonio A Methodology for Assessing the Feasibility of Fleet Compositions with Dynamic Demand
(Placido and D’Acierno, 2015)
24 2015 Corazza, Maria Vittoria The European Bus System of the Future: Research and Innovation (Musso and Corazza, 2015)
25 2015 Ricci, Miriam Bike sharing: A review of evidence on impacts and processes of implementation and operation
(Ricci, 2015)
26 2015 Jennings, Gail Finding our balance: Considering the opportunities for public bicycle systems in Cape Town, South Africa
(Jennings, 2015)
27 2015 Macharis, Cathy Reviewing the use of Multi-Criteria Decision Analysis for the evaluation of transport projects: Time for a multi-actor approach
(Macharis and Bernardini, 2015)
28 2014 Onatere J.O., Nwagboso C., Georgakis P.
Performance indicators for urban transport development in Nigeria (Onatere, Nwagboso and Georgakis, 2014)
Stellenbosch University https://scholar.sun.ac.za

211
ID Year Author(s) Title Reference 29 2014 Kesten A.S., Ögüt K.S. A New Passenger-Oriented performance Measurement framework for public
Rail transportation systems (Kesten and Ögüt, 2014)
30 2014 Stanley, John Workshop 6 Report: Delivering sustainable public transport (Stanley and Lucas, 2014)
31 2014 Georgiadis, Georgios Measuring and improving the efficiency and effectiveness of bus public transport systems
(Georgiadis, Politis and Papaioannou, 2014)
32 2014 Isabello, Andrea Reviewing Efficiency and Effectiveness of Interurban Public Transport Services: A Practical Experience
(Isabello et al., 2014)
33 2014 Liou, James J.H. Improving transportation service quality based on information fusion (Liou, Hsu and Chen, 2014)
34 2013 Ozbay K., Bartin B., Mudigonda S., Iyer S.
ASSIST-ME (Ozbay et al., 2013)
35 2013 López-Lambas M.E., Corazza M.V., Monzon A., Musso A.
Rebalancing urban mobility: A tale of four cities N/A
36 2013 Şimşek B., Pakdil F., Dengiz B., Testik M.C.
Driver performance appraisal using GPS terminal measurements: A conceptual framework
(Simsek et al., 2013)
37 2013 Stanley, John Workshop 3A: Governance, contracting, ownership and competition issues in public transport: Looking up not down
(Stanley and Smith, 2013)
38 2013 Zhao, Jinhua Unified estimator for excess journey time under heterogeneous passenger incidence behavior using smartcard data
(Zhao et al., 2013)
39 2013 Nelson, John D. The impact of the application of new technology on public transport service provision and the passenger experience: A focus on implementation in Australia
(Nelson and Mulley, 2013)
40 2013 Tsamboulas, D. Transport infrastructure provision and operations: Why should governments choose private–public partnership?
(Tsamboulas, Verma and Moraiti, 2013)
41 2013 Gwilliam, Kenneth Cities on the move – Ten years after (Gwilliam, 2013)
42 2013 Klinger, Thomas Dimensions of urban mobility cultures – a comparison of German cities (Klinger, Kenworthy and Lanzendorf, 2013)
43 2013 Freitas, André Luís Policani Assessing the quality of intercity road transportation of passengers: An exploratory study in Brazil
(Freitas, 2013)
Stellenbosch University https://scholar.sun.ac.za
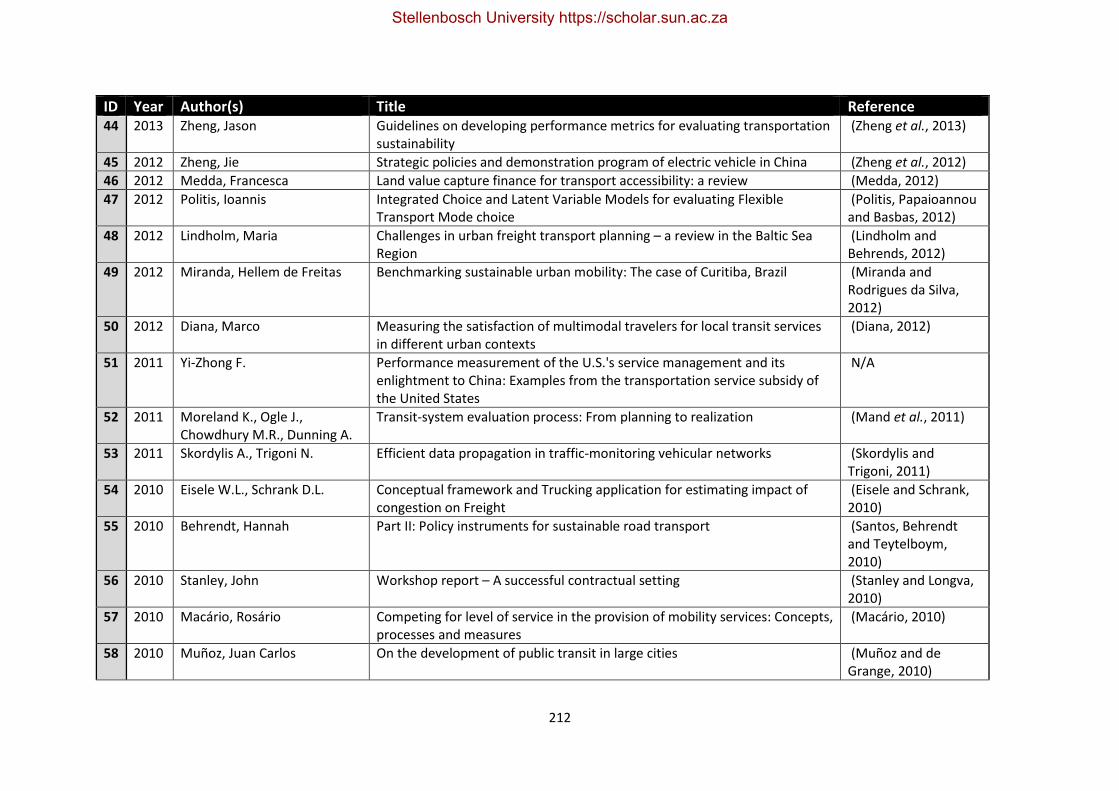
212
ID Year Author(s) Title Reference 44 2013 Zheng, Jason Guidelines on developing performance metrics for evaluating transportation
sustainability (Zheng et al., 2013)
45 2012 Zheng, Jie Strategic policies and demonstration program of electric vehicle in China (Zheng et al., 2012)
46 2012 Medda, Francesca Land value capture finance for transport accessibility: a review (Medda, 2012)
47 2012 Politis, Ioannis Integrated Choice and Latent Variable Models for evaluating Flexible Transport Mode choice
(Politis, Papaioannou and Basbas, 2012)
48 2012 Lindholm, Maria Challenges in urban freight transport planning – a review in the Baltic Sea Region
(Lindholm and Behrends, 2012)
49 2012 Miranda, Hellem de Freitas Benchmarking sustainable urban mobility: The case of Curitiba, Brazil (Miranda and Rodrigues da Silva, 2012)
50 2012 Diana, Marco Measuring the satisfaction of multimodal travelers for local transit services in different urban contexts
(Diana, 2012)
51 2011 Yi-Zhong F. Performance measurement of the U.S.'s service management and its enlightment to China: Examples from the transportation service subsidy of the United States
N/A
52 2011 Moreland K., Ogle J., Chowdhury M.R., Dunning A.
Transit-system evaluation process: From planning to realization (Mand et al., 2011)
53 2011 Skordylis A., Trigoni N. Efficient data propagation in traffic-monitoring vehicular networks (Skordylis and Trigoni, 2011)
54 2010 Eisele W.L., Schrank D.L. Conceptual framework and Trucking application for estimating impact of congestion on Freight
(Eisele and Schrank, 2010)
55 2010 Behrendt, Hannah Part II: Policy instruments for sustainable road transport (Santos, Behrendt and Teytelboym, 2010)
56 2010 Stanley, John Workshop report – A successful contractual setting (Stanley and Longva, 2010)
57 2010 Macário, Rosário Competing for level of service in the provision of mobility services: Concepts, processes and measures
(Macário, 2010)
58 2010 Muñoz, Juan Carlos On the development of public transit in large cities (Muñoz and de Grange, 2010)
Stellenbosch University https://scholar.sun.ac.za
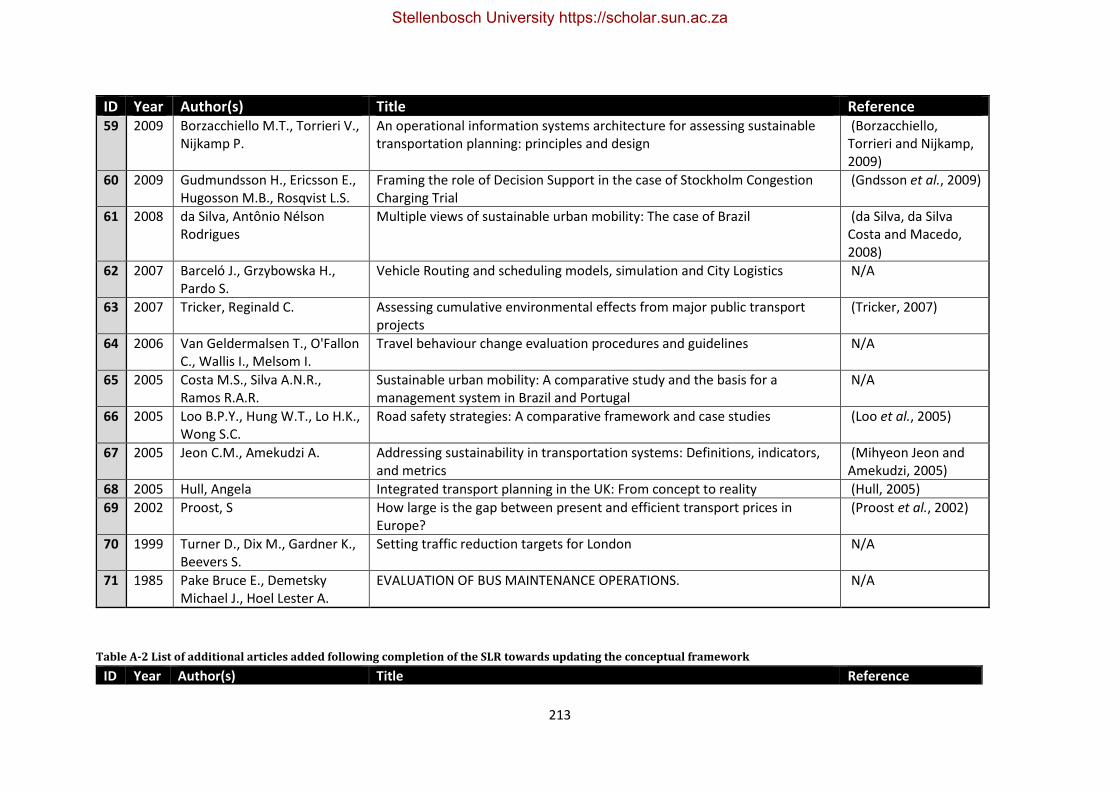
213
ID Year Author(s) Title Reference 59 2009 Borzacchiello M.T., Torrieri V.,
Nijkamp P. An operational information systems architecture for assessing sustainable transportation planning: principles and design
(Borzacchiello, Torrieri and Nijkamp, 2009)
60 2009 Gudmundsson H., Ericsson E., Hugosson M.B., Rosqvist L.S.
Framing the role of Decision Support in the case of Stockholm Congestion Charging Trial
(Gndsson et al., 2009)
61 2008 da Silva, Antônio Nélson Rodrigues
Multiple views of sustainable urban mobility: The case of Brazil (da Silva, da Silva Costa and Macedo, 2008)
62 2007 Barceló J., Grzybowska H., Pardo S.
Vehicle Routing and scheduling models, simulation and City Logistics N/A
63 2007 Tricker, Reginald C. Assessing cumulative environmental effects from major public transport projects
(Tricker, 2007)
64 2006 Van Geldermalsen T., O'Fallon C., Wallis I., Melsom I.
Travel behaviour change evaluation procedures and guidelines N/A
65 2005 Costa M.S., Silva A.N.R., Ramos R.A.R.
Sustainable urban mobility: A comparative study and the basis for a management system in Brazil and Portugal
N/A
66 2005 Loo B.P.Y., Hung W.T., Lo H.K., Wong S.C.
Road safety strategies: A comparative framework and case studies (Loo et al., 2005)
67 2005 Jeon C.M., Amekudzi A. Addressing sustainability in transportation systems: Definitions, indicators, and metrics
(Mihyeon Jeon and Amekudzi, 2005)
68 2005 Hull, Angela Integrated transport planning in the UK: From concept to reality (Hull, 2005)
69 2002 Proost, S How large is the gap between present and efficient transport prices in Europe?
(Proost et al., 2002)
70 1999 Turner D., Dix M., Gardner K., Beevers S.
Setting traffic reduction targets for London N/A
71 1985 Pake Bruce E., Demetsky Michael J., Hoel Lester A.
EVALUATION OF BUS MAINTENANCE OPERATIONS. N/A
Table A-2 List of additional articles added following completion of the SLR towards updating the conceptual framework
ID Year Author(s) Title Reference
Stellenbosch University https://scholar.sun.ac.za
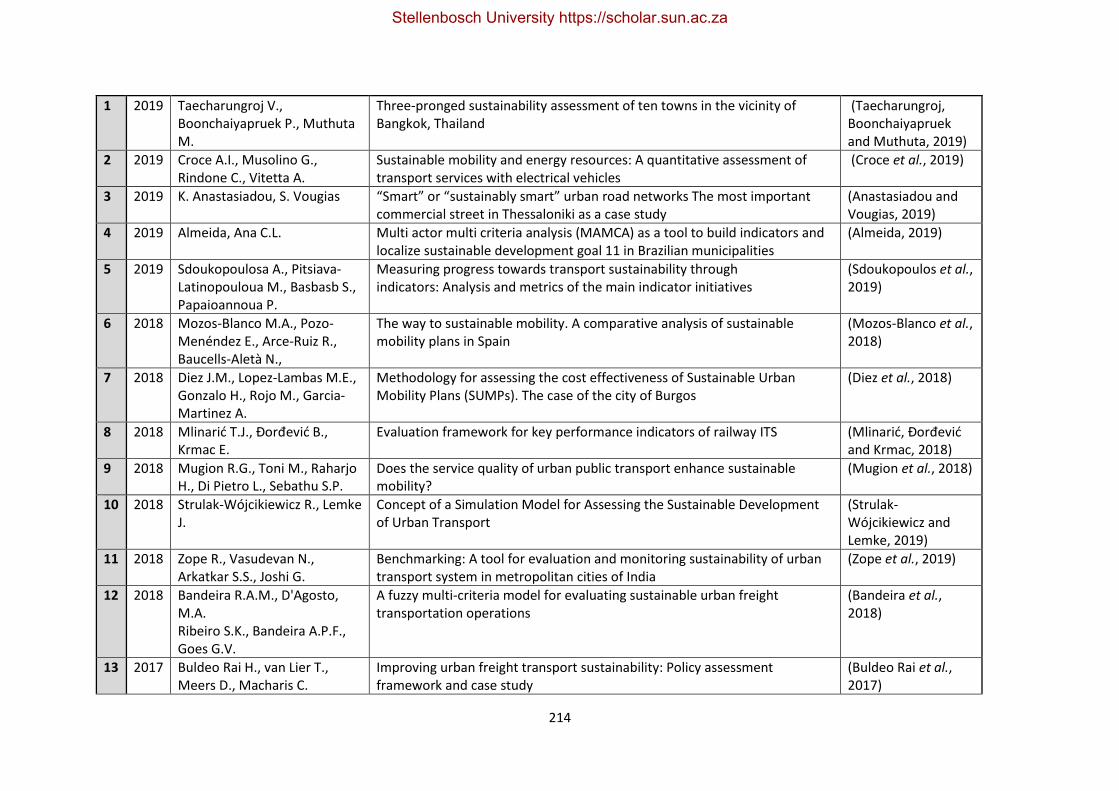
214
1 2019 Taecharungroj V., Boonchaiyapruek P., Muthuta M.
Three-pronged sustainability assessment of ten towns in the vicinity of Bangkok, Thailand
(Taecharungroj, Boonchaiyapruek and Muthuta, 2019)
2 2019 Croce A.I., Musolino G., Rindone C., Vitetta A.
Sustainable mobility and energy resources: A quantitative assessment of transport services with electrical vehicles
(Croce et al., 2019)
3 2019 K. Anastasiadou, S. Vougias “Smart” or “sustainably smart” urban road networks The most important commercial street in Thessaloniki as a case study
(Anastasiadou and Vougias, 2019)
4 2019 Almeida, Ana C.L. Multi actor multi criteria analysis (MAMCA) as a tool to build indicators and localize sustainable development goal 11 in Brazilian municipalities
(Almeida, 2019)
5 2019 Sdoukopoulosa A., Pitsiava-Latinopouloua M., Basbasb S., Papaioannoua P.
Measuring progress towards transport sustainability through indicators: Analysis and metrics of the main indicator initiatives
(Sdoukopoulos et al., 2019)
6 2018 Mozos-Blanco M.A., Pozo-Menéndez E., Arce-Ruiz R., Baucells-Aletà N.,
The way to sustainable mobility. A comparative analysis of sustainable mobility plans in Spain
(Mozos-Blanco et al., 2018)
7 2018 Diez J.M., Lopez-Lambas M.E., Gonzalo H., Rojo M., Garcia-Martinez A.
Methodology for assessing the cost effectiveness of Sustainable Urban Mobility Plans (SUMPs). The case of the city of Burgos
(Diez et al., 2018)
8 2018 Mlinarić T.J., Đorđević B., Krmac E.
Evaluation framework for key performance indicators of railway ITS (Mlinarić, Đorđević and Krmac, 2018)
9 2018 Mugion R.G., Toni M., Raharjo H., Di Pietro L., Sebathu S.P.
Does the service quality of urban public transport enhance sustainable mobility?
(Mugion et al., 2018)
10 2018 Strulak-Wójcikiewicz R., Lemke J.
Concept of a Simulation Model for Assessing the Sustainable Development of Urban Transport
(Strulak-Wójcikiewicz and Lemke, 2019)
11 2018 Zope R., Vasudevan N., Arkatkar S.S., Joshi G.
Benchmarking: A tool for evaluation and monitoring sustainability of urban transport system in metropolitan cities of India
(Zope et al., 2019)
12 2018 Bandeira R.A.M., D'Agosto, M.A. Ribeiro S.K., Bandeira A.P.F., Goes G.V.
A fuzzy multi-criteria model for evaluating sustainable urban freight transportation operations
(Bandeira et al., 2018)
13 2017 Buldeo Rai H., van Lier T., Meers D., Macharis C.
Improving urban freight transport sustainability: Policy assessment framework and case study
(Buldeo Rai et al., 2017)
Stellenbosch University https://scholar.sun.ac.za
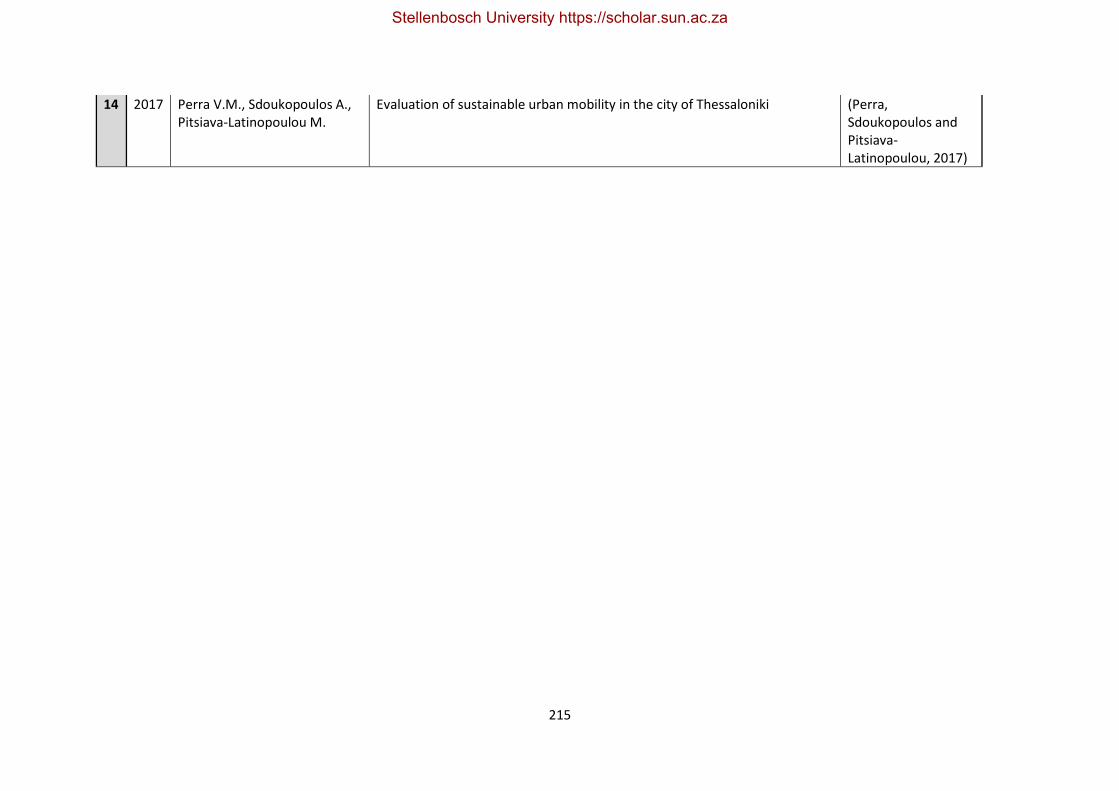
215
14 2017 Perra V.M., Sdoukopoulos A., Pitsiava-Latinopoulou M.
Evaluation of sustainable urban mobility in the city of Thessaloniki (Perra, Sdoukopoulos and Pitsiava-Latinopoulou, 2017)
Stellenbosch University https://scholar.sun.ac.za
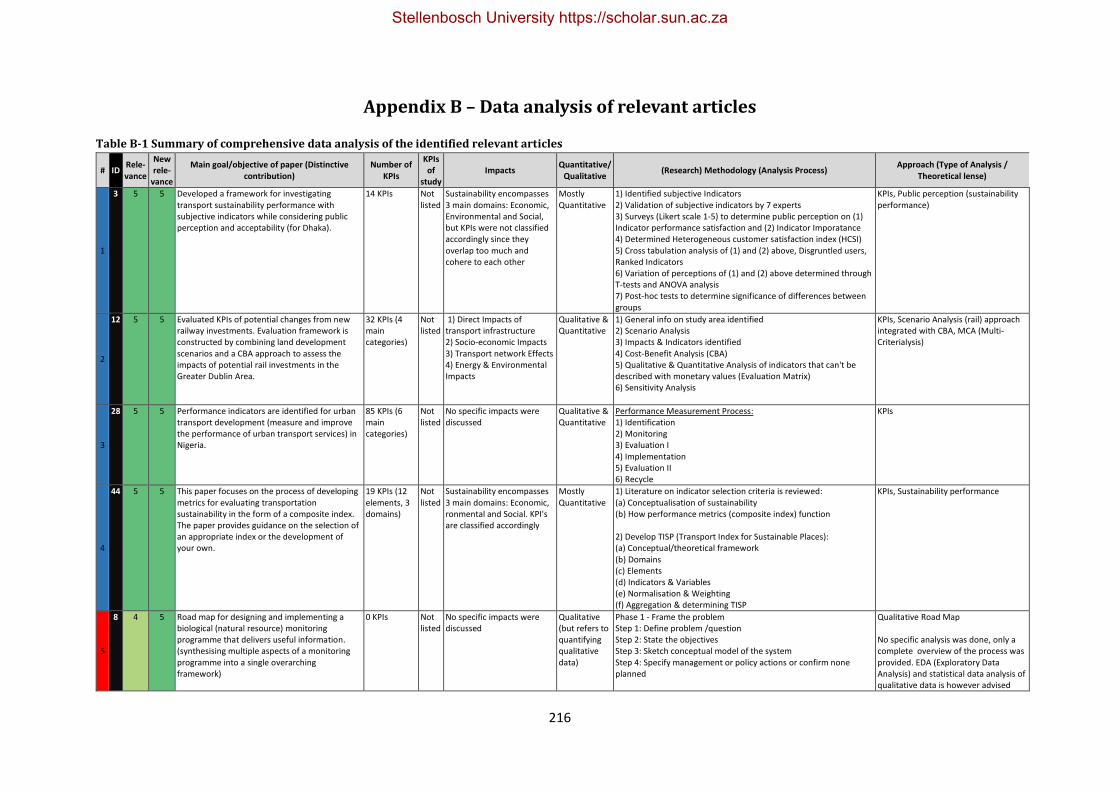
216
Appendix B – Data analysis of relevant articles
Table B-1 Summary of comprehensive data analysis of the identified relevant articles
# ID Rele-vance
New rele-
vance
Main goal/objective of paper (Distinctive contribution)
Number of KPIs
KPIs of
study Impacts
Quantitative/ Qualitative
(Research) Methodology (Analysis Process) Approach (Type of Analysis /
Theoretical lense)
1
3 5 5 Developed a framework for investigating transport sustainability performance with subjective indicators while considering public perception and acceptability (for Dhaka).
14 KPIs Not listed
Sustainability encompasses 3 main domains: Economic, Environmental and Social, but KPIs were not classified accordingly since they overlap too much and cohere to each other
Mostly Quantitative
1) Identified subjective Indicators 2) Validation of subjective indicators by 7 experts 3) Surveys (Likert scale 1-5) to determine public perception on (1) Indicator performance satisfaction and (2) Indicator Imporatance 4) Determined Heterogeneous customer satisfaction index (HCSI) 5) Cross tabulation analysis of (1) and (2) above, Disgruntled users, Ranked Indicators 6) Variation of perceptions of (1) and (2) above determined through T-tests and ANOVA analysis 7) Post-hoc tests to determine significance of differences between groups
KPIs, Public perception (sustainability performance)
2
12 5 5 Evaluated KPIs of potential changes from new railway investments. Evaluation framework is constructed by combining land development scenarios and a CBA approach to assess the impacts of potential rail investments in the Greater Dublin Area.
32 KPIs (4 main categories)
Not listed
1) Direct Impacts of transport infrastructure 2) Socio-economic Impacts 3) Transport network Effects 4) Energy & Environmental Impacts
Qualitative & Quantitative
1) General info on study area identified 2) Scenario Analysis 3) Impacts & Indicators identified 4) Cost-Benefit Analysis (CBA) 5) Qualitative & Quantitative Analysis of indicators that can't be described with monetary values (Evaluation Matrix) 6) Sensitivity Analysis
KPIs, Scenario Analysis (rail) approach integrated with CBA, MCA (Multi-Criterialysis)
3
28 5 5 Performance indicators are identified for urban transport development (measure and improve the performance of urban transport services) in Nigeria.
85 KPIs (6 main categories)
Not listed
No specific impacts were discussed
Qualitative & Quantitative
Performance Measurement Process: 1) Identification 2) Monitoring 3) Evaluation I 4) Implementation 5) Evaluation II 6) Recycle
KPIs
4
44 5 5 This paper focuses on the process of developing metrics for evaluating transportation sustainability in the form of a composite index. The paper provides guidance on the selection of an appropriate index or the development of your own.
19 KPIs (12 elements, 3 domains)
Not listed
Sustainability encompasses 3 main domains: Economic, ronmental and Social. KPI's are classified accordingly
Mostly Quantitative
1) Literature on indicator selection criteria is reviewed: (a) Conceptualisation of sustainability (b) How performance metrics (composite index) function 2) Develop TISP (Transport Index for Sustainable Places): (a) Conceptual/theoretical framework (b) Domains (c) Elements (d) Indicators & Variables (e) Normalisation & Weighting (f) Aggregation & determining TISP
KPIs, Sustainability performance
5
8 4 5 Road map for designing and implementing a biological (natural resource) monitoring programme that delivers useful information. (synthesising multiple aspects of a monitoring programme into a single overarching framework)
0 KPIs Not listed
No specific impacts were discussed
Qualitative (but refers to quantifying qualitative data)
Phase 1 - Frame the problem Step 1: Define problem /question Step 2: State the objectives Step 3: Sketch conceptual model of the system Step 4: Specify management or policy actions or confirm none planned
Qualitative Road Map No specific analysis was done, only a complete overview of the process was provided. EDA (Exploratory Data Analysis) and statistical data analysis of qualitative data is however advised
Stellenbosch University https://scholar.sun.ac.za
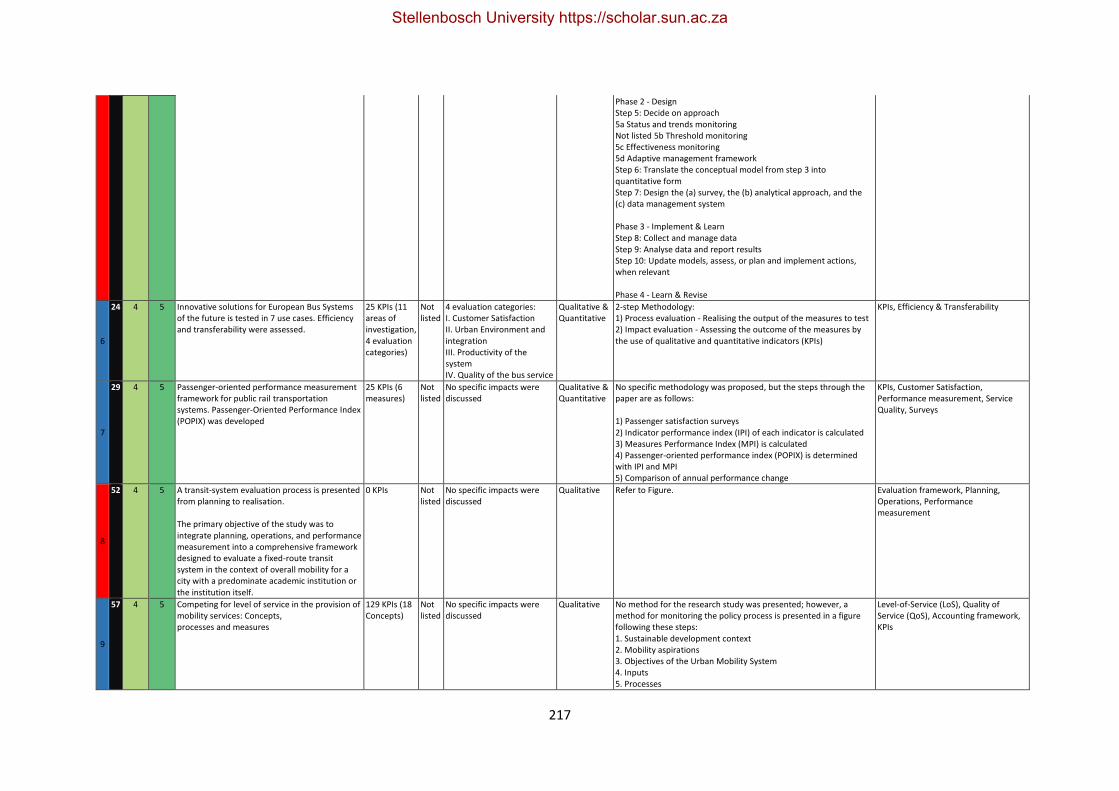
217
Phase 2 - Design Step 5: Decide on approach 5a Status and trends monitoring Not listed 5b Threshold monitoring 5c Effectiveness monitoring 5d Adaptive management framework Step 6: Translate the conceptual model from step 3 into quantitative form Step 7: Design the (a) survey, the (b) analytical approach, and the (c) data management system Phase 3 - Implement & Learn Step 8: Collect and manage data Step 9: Analyse data and report results Step 10: Update models, assess, or plan and implement actions, when relevant Phase 4 - Learn & Revise
6
24 4 5 Innovative solutions for European Bus Systems of the future is tested in 7 use cases. Efficiency and transferability were assessed.
25 KPIs (11 areas of investigation, 4 evaluation categories)
Not listed
4 evaluation categories: I. Customer Satisfaction II. Urban Environment and integration III. Productivity of the system IV. Quality of the bus service
Qualitative & Quantitative
2-step Methodology: 1) Process evaluation - Realising the output of the measures to test 2) Impact evaluation - Assessing the outcome of the measures by the use of qualitative and quantitative indicators (KPIs)
KPIs, Efficiency & Transferability
7
29 4 5 Passenger-oriented performance measurement framework for public rail transportation systems. Passenger-Oriented Performance Index (POPIX) was developed
25 KPIs (6 measures)
Not listed
No specific impacts were discussed
Qualitative & Quantitative
No specific methodology was proposed, but the steps through the paper are as follows: 1) Passenger satisfaction surveys 2) Indicator performance index (IPI) of each indicator is calculated 3) Measures Performance Index (MPI) is calculated 4) Passenger-oriented performance index (POPIX) is determined with IPI and MPI 5) Comparison of annual performance change
KPIs, Customer Satisfaction, Performance measurement, Service Quality, Surveys
8
52 4 5 A transit-system evaluation process is presented from planning to realisation. The primary objective of the study was to integrate planning, operations, and performance measurement into a comprehensive framework designed to evaluate a fixed-route transit system in the context of overall mobility for a city with a predominate academic institution or the institution itself.
0 KPIs Not listed
No specific impacts were discussed
Qualitative Refer to Figure. Evaluation framework, Planning, Operations, Performance measurement
9
57 4 5 Competing for level of service in the provision of mobility services: Concepts, processes and measures
129 KPIs (18 Concepts)
Not listed
No specific impacts were discussed
Qualitative No method for the research study was presented; however, a method for monitoring the policy process is presented in a figure following these steps: 1. Sustainable development context 2. Mobility aspirations 3. Objectives of the Urban Mobility System 4. Inputs 5. Processes
Level-of-Service (LoS), Quality of Service (QoS), Accounting framework, KPIs
Stellenbosch University https://scholar.sun.ac.za
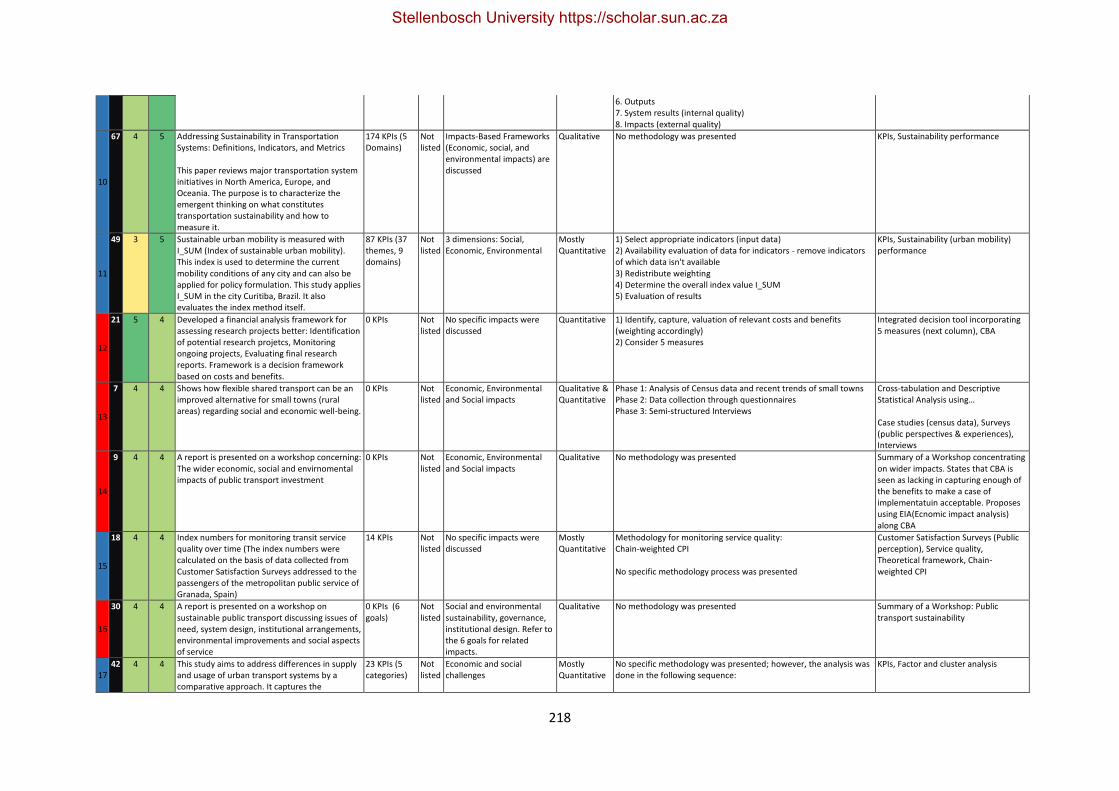
218
6. Outputs 7. System results (internal quality) 8. Impacts (external quality)
10
67 4 5 Addressing Sustainability in Transportation Systems: Definitions, Indicators, and Metrics This paper reviews major transportation system initiatives in North America, Europe, and Oceania. The purpose is to characterize the emergent thinking on what constitutes transportation sustainability and how to measure it.
174 KPIs (5 Domains)
Not listed
Impacts-Based Frameworks (Economic, social, and environmental impacts) are discussed
Qualitative No methodology was presented KPIs, Sustainability performance
11
49 3 5 Sustainable urban mobility is measured with I_SUM (Index of sustainable urban mobility). This index is used to determine the current mobility conditions of any city and can also be applied for policy formulation. This study applies I_SUM in the city Curitiba, Brazil. It also evaluates the index method itself.
87 KPIs (37 themes, 9 domains)
Not listed
3 dimensions: Social, Economic, Environmental
Mostly Quantitative
1) Select appropriate indicators (input data) 2) Availability evaluation of data for indicators - remove indicators of which data isn't available 3) Redistribute weighting 4) Determine the overall index value I_SUM 5) Evaluation of results
KPIs, Sustainability (urban mobility) performance
12
21 5 4 Developed a financial analysis framework for assessing research projects better: Identification of potential research projetcs, Monitoring ongoing projects, Evaluating final research reports. Framework is a decision framework based on costs and benefits.
0 KPIs Not listed
No specific impacts were discussed
Quantitative 1) Identify, capture, valuation of relevant costs and benefits (weighting accordingly) 2) Consider 5 measures
Integrated decision tool incorporating 5 measures (next column), CBA
13
7 4 4 Shows how flexible shared transport can be an improved alternative for small towns (rural areas) regarding social and economic well-being.
0 KPIs Not listed
Economic, Environmental and Social impacts
Qualitative & Quantitative
Phase 1: Analysis of Census data and recent trends of small towns Phase 2: Data collection through questionnaires Phase 3: Semi-structured Interviews
Cross-tabulation and Descriptive Statistical Analysis using… Case studies (census data), Surveys (public perspectives & experiences), Interviews
14
9 4 4 A report is presented on a workshop concerning: The wider economic, social and envirnomental impacts of public transport investment
0 KPIs Not listed
Economic, Environmental and Social impacts
Qualitative No methodology was presented Summary of a Workshop concentrating on wider impacts. States that CBA is seen as lacking in capturing enough of the benefits to make a case of implementatuin acceptable. Proposes using EIA(Ecnomic impact analysis) along CBA
15
18 4 4 Index numbers for monitoring transit service quality over time (The index numbers were calculated on the basis of data collected from Customer Satisfaction Surveys addressed to the passengers of the metropolitan public service of Granada, Spain)
14 KPIs Not listed
No specific impacts were discussed
Mostly Quantitative
Methodology for monitoring service quality: Chain-weighted CPI No specific methodology process was presented
Customer Satisfaction Surveys (Public perception), Service quality, Theoretical framework, Chain-weighted CPI
16
30 4 4 A report is presented on a workshop on sustainable public transport discussing issues of need, system design, institutional arrangements, environmental improvements and social aspects of service
0 KPIs (6 goals)
Not listed
Social and environmental sustainability, governance, institutional design. Refer to the 6 goals for related impacts.
Qualitative No methodology was presented Summary of a Workshop: Public transport sustainability
17 42 4 4 This study aims to address differences in supply
and usage of urban transport systems by a comparative approach. It captures the
23 KPIs (5 categories)
Not listed
Economic and social challenges
Mostly Quantitative
No specific methodology was presented; however, the analysis was done in the following sequence:
KPIs, Factor and cluster analysis
Stellenbosch University https://scholar.sun.ac.za
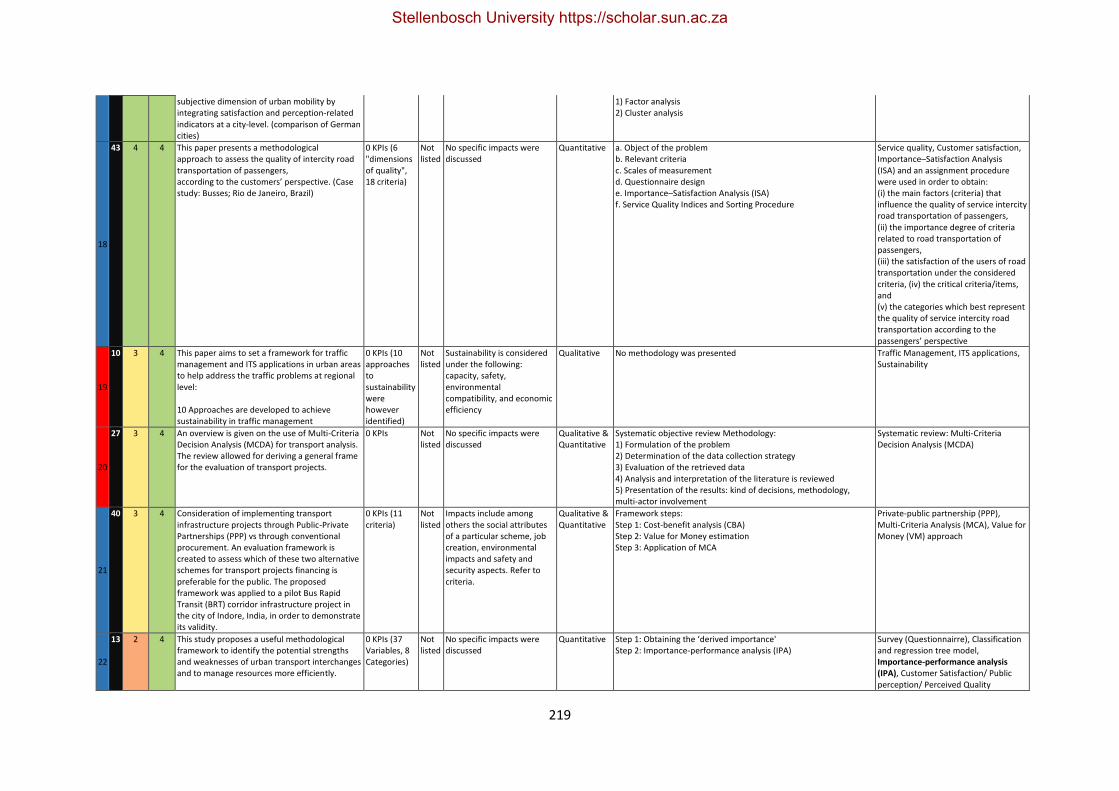
219
subjective dimension of urban mobility by integrating satisfaction and perception-related indicators at a city-level. (comparison of German cities)
1) Factor analysis 2) Cluster analysis
18
43 4 4 This paper presents a methodological approach to assess the quality of intercity road transportation of passengers, according to the customers’ perspective. (Case study: Busses; Rio de Janeiro, Brazil)
0 KPIs (6 "dimensions of quality", 18 criteria)
Not listed
No specific impacts were discussed
Quantitative a. Object of the problem b. Relevant criteria c. Scales of measurement d. Questionnaire design e. Importance–Satisfaction Analysis (ISA) f. Service Quality Indices and Sorting Procedure
Service quality, Customer satisfaction, Importance–Satisfaction Analysis (ISA) and an assignment procedure were used in order to obtain: (i) the main factors (criteria) that influence the quality of service intercity road transportation of passengers, (ii) the importance degree of criteria related to road transportation of passengers, (iii) the satisfaction of the users of road transportation under the considered criteria, (iv) the critical criteria/items, and (v) the categories which best represent the quality of service intercity road transportation according to the passengers’ perspective
19
10 3 4 This paper aims to set a framework for traffic management and ITS applications in urban areas to help address the traffic problems at regional level: 10 Approaches are developed to achieve sustainability in traffic management
0 KPIs (10 approaches to sustainability were however identified)
Not listed
Sustainability is considered under the following: capacity, safety, environmental compatibility, and economic efficiency
Qualitative No methodology was presented Traffic Management, ITS applications, Sustainability
20
27 3 4 An overview is given on the use of Multi-Criteria Decision Analysis (MCDA) for transport analysis. The review allowed for deriving a general frame for the evaluation of transport projects.
0 KPIs Not listed
No specific impacts were discussed
Qualitative & Quantitative
Systematic objective review Methodology: 1) Formulation of the problem 2) Determination of the data collection strategy 3) Evaluation of the retrieved data 4) Analysis and interpretation of the literature is reviewed 5) Presentation of the results: kind of decisions, methodology, multi-actor involvement
Systematic review: Multi-Criteria Decision Analysis (MCDA)
21
40 3 4 Consideration of implementing transport infrastructure projects through Public-Private Partnerships (PPP) vs through conventional procurement. An evaluation framework is created to assess which of these two alternative schemes for transport projects financing is preferable for the public. The proposed framework was applied to a pilot Bus Rapid Transit (BRT) corridor infrastructure project in the city of Indore, India, in order to demonstrate its validity.
0 KPIs (11 criteria)
Not listed
Impacts include among others the social attributes of a particular scheme, job creation, environmental impacts and safety and security aspects. Refer to criteria.
Qualitative & Quantitative
Framework steps: Step 1: Cost-benefit analysis (CBA) Step 2: Value for Money estimation Step 3: Application of MCA
Private-public partnership (PPP), Multi-Criteria Analysis (MCA), Value for Money (VM) approach
22
13 2 4 This study proposes a useful methodological framework to identify the potential strengths and weaknesses of urban transport interchanges and to manage resources more efficiently.
0 KPIs (37 Variables, 8 Categories)
Not listed
No specific impacts were discussed
Quantitative Step 1: Obtaining the ‘derived importance' Step 2: Importance-performance analysis (IPA)
Survey (Questionnairre), Classification and regression tree model, Importance-performance analysis (IPA), Customer Satisfaction/ Public perception/ Perceived Quality
Stellenbosch University https://scholar.sun.ac.za
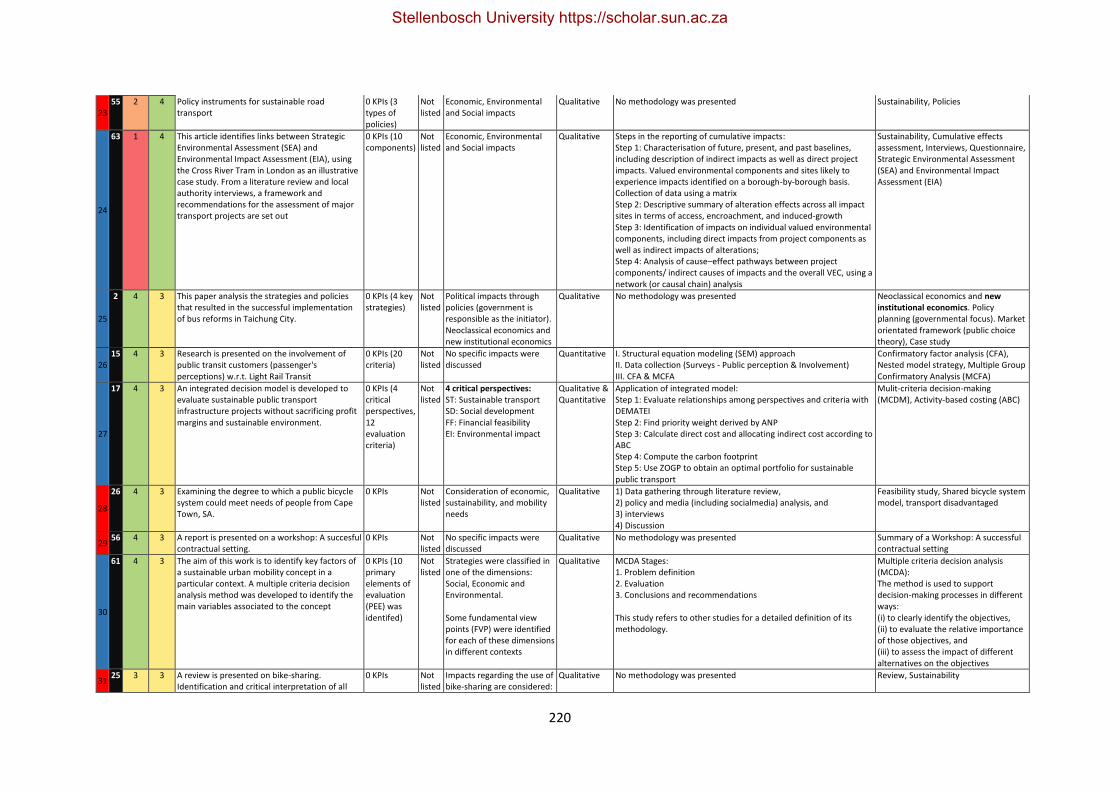
220
23 55 2 4 Policy instruments for sustainable road
transport 0 KPIs (3 types of policies)
Not listed
Economic, Environmental and Social impacts
Qualitative No methodology was presented Sustainability, Policies
24
63 1 4 This article identifies links between Strategic Environmental Assessment (SEA) and Environmental Impact Assessment (EIA), using the Cross River Tram in London as an illustrative case study. From a literature review and local authority interviews, a framework and recommendations for the assessment of major transport projects are set out
0 KPIs (10 components)
Not listed
Economic, Environmental and Social impacts
Qualitative Steps in the reporting of cumulative impacts: Step 1: Characterisation of future, present, and past baselines, including description of indirect impacts as well as direct project impacts. Valued environmental components and sites likely to experience impacts identified on a borough-by-borough basis. Collection of data using a matrix Step 2: Descriptive summary of alteration effects across all impact sites in terms of access, encroachment, and induced-growth Step 3: Identification of impacts on individual valued environmental components, including direct impacts from project components as well as indirect impacts of alterations; Step 4: Analysis of cause–effect pathways between project components/ indirect causes of impacts and the overall VEC, using a network (or causal chain) analysis
Sustainability, Cumulative effects assessment, Interviews, Questionnaire, Strategic Environmental Assessment (SEA) and Environmental Impact Assessment (EIA)
25
2 4 3 This paper analysis the strategies and policies that resulted in the successful implementation of bus reforms in Taichung City.
0 KPIs (4 key strategies)
Not listed
Political impacts through policies (government is responsible as the initiator). Neoclassical economics and new institutional economics
Qualitative No methodology was presented Neoclassical economics and new institutional economics. Policy planning (governmental focus). Market orientated framework (public choice theory), Case study
26 15 4 3 Research is presented on the involvement of
public transit customers (passenger's perceptions) w.r.t. Light Rail Transit
0 KPIs (20 criteria)
Not listed
No specific impacts were discussed
Quantitative I. Structural equation modeling (SEM) approach II. Data collection (Surveys - Public perception & Involvement) III. CFA & MCFA
Confirmatory factor analysis (CFA), Nested model strategy, Multiple Group Confirmatory Analysis (MCFA)
27
17 4 3 An integrated decision model is developed to evaluate sustainable public transport infrastructure projects without sacrificing profit margins and sustainable environment.
0 KPIs (4 critical perspectives, 12 evaluation criteria)
Not listed
4 critical perspectives: ST: Sustainable transport SD: Social development FF: Financial feasibility EI: Environmental impact
Qualitative & Quantitative
Application of integrated model: Step 1: Evaluate relationships among perspectives and criteria with DEMATEI Step 2: Find priority weight derived by ANP Step 3: Calculate direct cost and allocating indirect cost according to ABC Step 4: Compute the carbon footprint Step 5: Use ZOGP to obtain an optimal portfolio for sustainable public transport
Mulit-criteria decision-making (MCDM), Activity-based costing (ABC)
28
26 4 3 Examining the degree to which a public bicycle system could meet needs of people from Cape Town, SA.
0 KPIs Not listed
Consideration of economic, sustainability, and mobility needs
Qualitative 1) Data gathering through literature review, 2) policy and media (including socialmedia) analysis, and 3) interviews 4) Discussion
Feasibility study, Shared bicycle system model, transport disadvantaged
29 56 4 3 A report is presented on a workshop: A succesful
contractual setting. 0 KPIs Not
listed No specific impacts were discussed
Qualitative No methodology was presented Summary of a Workshop: A successful contractual setting
30
61 4 3 The aim of this work is to identify key factors of a sustainable urban mobility concept in a particular context. A multiple criteria decision analysis method was developed to identify the main variables associated to the concept
0 KPIs (10 primary elements of evaluation (PEE) was identifed)
Not listed
Strategies were classified in one of the dimensions: Social, Economic and Environmental. Some fundamental view points (FVP) were identified for each of these dimensions in different contexts
Qualitative MCDA Stages: 1. Problem definition 2. Evaluation 3. Conclusions and recommendations This study refers to other studies for a detailed definition of its methodology.
Multiple criteria decision analysis (MCDA): The method is used to support decision-making processes in different ways: (i) to clearly identify the objectives, (ii) to evaluate the relative importance of those objectives, and (iii) to assess the impact of different alternatives on the objectives
31 25 3 3 A review is presented on bike-sharing.
Identification and critical interpretation of all 0 KPIs Not
listed Impacts regarding the use of bike-sharing are considered:
Qualitative No methodology was presented Review, Sustainability
Stellenbosch University https://scholar.sun.ac.za
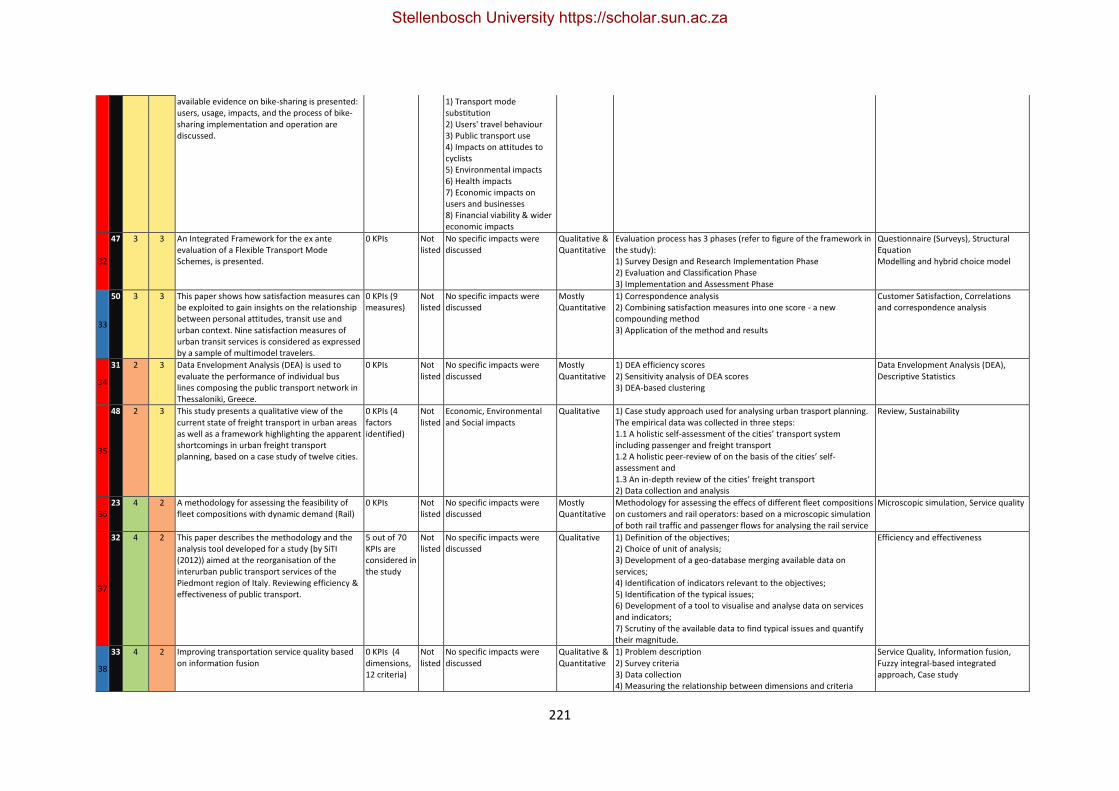
221
available evidence on bike-sharing is presented: users, usage, impacts, and the process of bike-sharing implementation and operation are discussed.
1) Transport mode substitution 2) Users' travel behaviour 3) Public transport use 4) Impacts on attitudes to cyclists 5) Environmental impacts 6) Health impacts 7) Economic impacts on users and businesses 8) Financial viability & wider economic impacts
32
47 3 3 An Integrated Framework for the ex ante evaluation of a Flexible Transport Mode Schemes, is presented.
0 KPIs Not listed
No specific impacts were discussed
Qualitative & Quantitative
Evaluation process has 3 phases (refer to figure of the framework in the study): 1) Survey Design and Research Implementation Phase 2) Evaluation and Classification Phase 3) Implementation and Assessment Phase
Questionnaire (Surveys), Structural Equation Modelling and hybrid choice model
33
50 3 3 This paper shows how satisfaction measures can be exploited to gain insights on the relationship between personal attitudes, transit use and urban context. Nine satisfaction measures of urban transit services is considered as expressed by a sample of multimodel travelers.
0 KPIs (9 measures)
Not listed
No specific impacts were discussed
Mostly Quantitative
1) Correspondence analysis 2) Combining satisfaction measures into one score - a new compounding method 3) Application of the method and results
Customer Satisfaction, Correlations and correspondence analysis
34
31 2 3 Data Envelopment Analysis (DEA) is used to evaluate the performance of individual bus lines composing the public transport network in Thessaloniki, Greece.
0 KPIs Not listed
No specific impacts were discussed
Mostly Quantitative
1) DEA efficiency scores 2) Sensitivity analysis of DEA scores 3) DEA-based clustering
Data Envelopment Analysis (DEA), Descriptive Statistics
35
48 2 3 This study presents a qualitative view of the current state of freight transport in urban areas as well as a framework highlighting the apparent shortcomings in urban freight transport planning, based on a case study of twelve cities.
0 KPIs (4 factors identified)
Not listed
Economic, Environmental and Social impacts
Qualitative 1) Case study approach used for analysing urban trasport planning. The empirical data was collected in three steps: 1.1 A holistic self-assessment of the cities’ transport system including passenger and freight transport 1.2 A holistic peer-review of on the basis of the cities’ self-assessment and 1.3 An in-depth review of the cities’ freight transport 2) Data collection and analysis
Review, Sustainability
36 23 4 2 A methodology for assessing the feasibility of
fleet compositions with dynamic demand (Rail) 0 KPIs Not
listed No specific impacts were discussed
Mostly Quantitative
Methodology for assessing the effecs of different fleet compositions on customers and rail operators: based on a microscopic simulation of both rail traffic and passenger flows for analysing the rail service
Microscopic simulation, Service quality
37
32 4 2 This paper describes the methodology and the analysis tool developed for a study (by SiTI (2012)) aimed at the reorganisation of the interurban public transport services of the Piedmont region of Italy. Reviewing efficiency & effectiveness of public transport.
5 out of 70 KPIs are considered in the study
Not listed
No specific impacts were discussed
Qualitative 1) Definition of the objectives; 2) Choice of unit of analysis; 3) Development of a geo-database merging available data on services; 4) Identification of indicators relevant to the objectives; 5) Identification of the typical issues; 6) Development of a tool to visualise and analyse data on services and indicators; 7) Scrutiny of the available data to find typical issues and quantify their magnitude.
Efficiency and effectiveness
38
33 4 2 Improving transportation service quality based on information fusion
0 KPIs (4 dimensions, 12 criteria)
Not listed
No specific impacts were discussed
Qualitative & Quantitative
1) Problem description 2) Survey criteria 3) Data collection 4) Measuring the relationship between dimensions and criteria
Service Quality, Information fusion, Fuzzy integral-based integrated approach, Case study
Stellenbosch University https://scholar.sun.ac.za
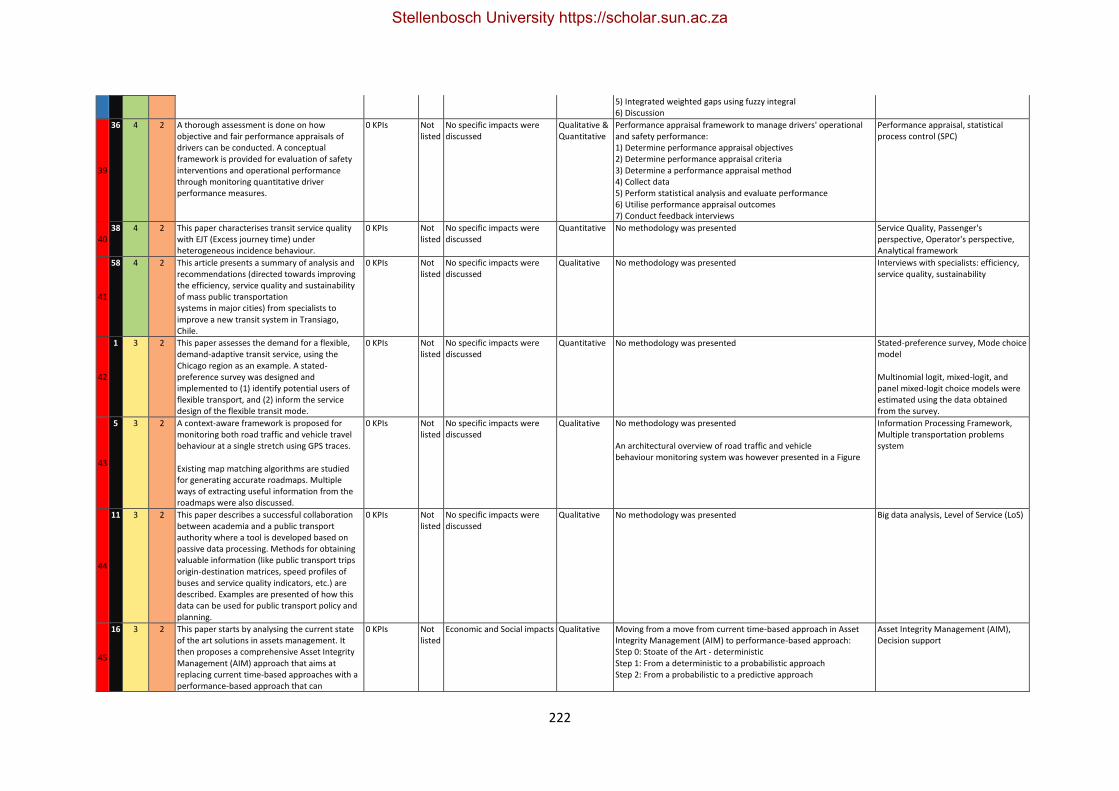
222
5) Integrated weighted gaps using fuzzy integral 6) Discussion
39
36 4 2 A thorough assessment is done on how objective and fair performance appraisals of drivers can be conducted. A conceptual framework is provided for evaluation of safety interventions and operational performance through monitoring quantitative driver performance measures.
0 KPIs Not listed
No specific impacts were discussed
Qualitative & Quantitative
Performance appraisal framework to manage drivers' operational and safety performance: 1) Determine performance appraisal objectives 2) Determine performance appraisal criteria 3) Determine a performance appraisal method 4) Collect data 5) Perform statistical analysis and evaluate performance 6) Utilise performance appraisal outcomes 7) Conduct feedback interviews
Performance appraisal, statistical process control (SPC)
40 38 4 2 This paper characterises transit service quality
with EJT (Excess journey time) under heterogeneous incidence behaviour.
0 KPIs Not listed
No specific impacts were discussed
Quantitative No methodology was presented Service Quality, Passenger's perspective, Operator's perspective, Analytical framework
41
58 4 2 This article presents a summary of analysis and recommendations (directed towards improving the efficiency, service quality and sustainability of mass public transportation systems in major cities) from specialists to improve a new transit system in Transiago, Chile.
0 KPIs Not listed
No specific impacts were discussed
Qualitative No methodology was presented Interviews with specialists: efficiency, service quality, sustainability
42
1 3 2 This paper assesses the demand for a flexible, demand-adaptive transit service, using the Chicago region as an example. A stated-preference survey was designed and implemented to (1) identify potential users of flexible transport, and (2) inform the service design of the flexible transit mode.
0 KPIs Not listed
No specific impacts were discussed
Quantitative No methodology was presented Stated-preference survey, Mode choice model Multinomial logit, mixed-logit, and panel mixed-logit choice models were estimated using the data obtained from the survey.
43
5 3 2 A context-aware framework is proposed for monitoring both road traffic and vehicle travel behaviour at a single stretch using GPS traces. Existing map matching algorithms are studied for generating accurate roadmaps. Multiple ways of extracting useful information from the roadmaps were also discussed.
0 KPIs Not listed
No specific impacts were discussed
Qualitative No methodology was presented An architectural overview of road traffic and vehicle behaviour monitoring system was however presented in a Figure
Information Processing Framework, Multiple transportation problems system
44
11 3 2 This paper describes a successful collaboration between academia and a public transport authority where a tool is developed based on passive data processing. Methods for obtaining valuable information (like public transport trips origin-destination matrices, speed profiles of buses and service quality indicators, etc.) are described. Examples are presented of how this data can be used for public transport policy and planning.
0 KPIs Not listed
No specific impacts were discussed
Qualitative No methodology was presented Big data analysis, Level of Service (LoS)
45
16 3 2 This paper starts by analysing the current state of the art solutions in assets management. It then proposes a comprehensive Asset Integrity Management (AIM) approach that aims at replacing current time-based approaches with a performance-based approach that can
0 KPIs Not listed
Economic and Social impacts Qualitative Moving from a move from current time-based approach in Asset Integrity Management (AIM) to performance-based approach: Step 0: Stoate of the Art - deterministic Step 1: From a deterministic to a probabilistic approach Step 2: From a probabilistic to a predictive approach
Asset Integrity Management (AIM), Decision support
Stellenbosch University https://scholar.sun.ac.za
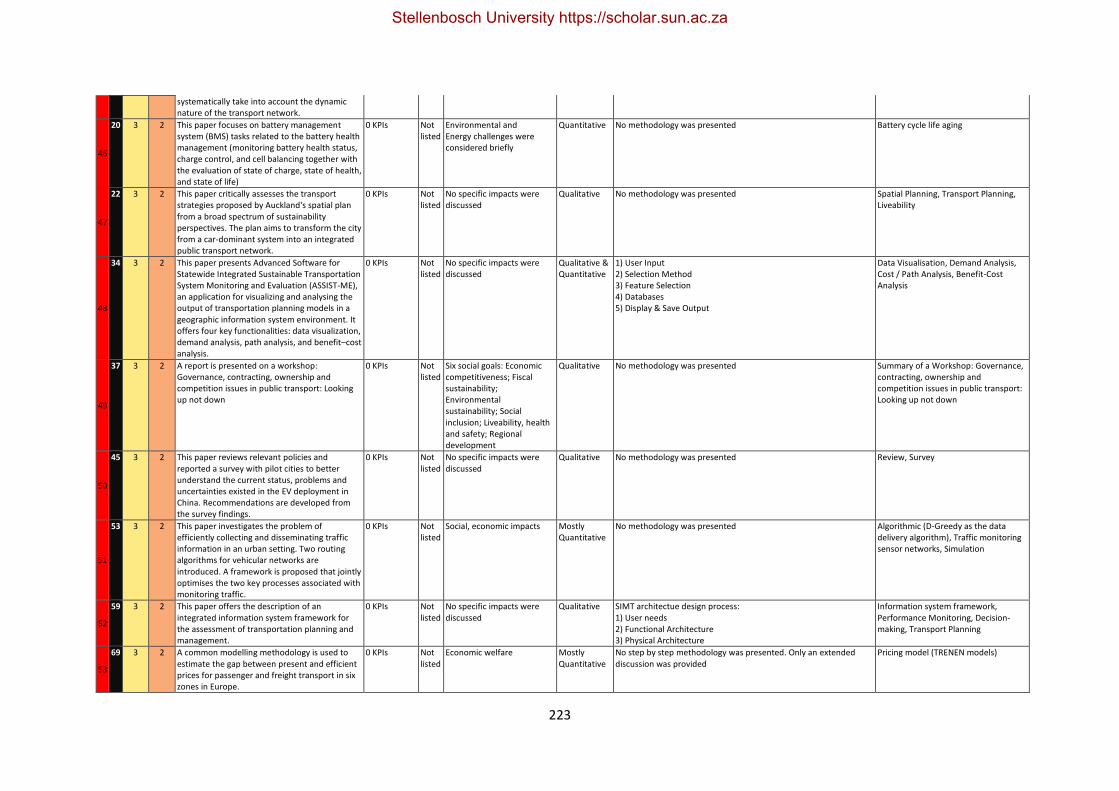
223
systematically take into account the dynamic nature of the transport network.
46
20 3 2 This paper focuses on battery management system (BMS) tasks related to the battery health management (monitoring battery health status, charge control, and cell balancing together with the evaluation of state of charge, state of health, and state of life)
0 KPIs Not listed
Environmental and Energy challenges were considered briefly
Quantitative No methodology was presented Battery cycle life aging
47
22 3 2 This paper critically assesses the transport strategies proposed by Auckland's spatial plan from a broad spectrum of sustainability perspectives. The plan aims to transform the city from a car-dominant system into an integrated public transport network.
0 KPIs Not listed
No specific impacts were discussed
Qualitative No methodology was presented Spatial Planning, Transport Planning, Liveability
48
34 3 2 This paper presents Advanced Software for Statewide Integrated Sustainable Transportation System Monitoring and Evaluation (ASSIST-ME), an application for visualizing and analysing the output of transportation planning models in a geographic information system environment. It offers four key functionalities: data visualization, demand analysis, path analysis, and benefit–cost analysis.
0 KPIs Not listed
No specific impacts were discussed
Qualitative & Quantitative
1) User Input 2) Selection Method 3) Feature Selection 4) Databases 5) Display & Save Output
Data Visualisation, Demand Analysis, Cost / Path Analysis, Benefit-Cost Analysis
49
37 3 2 A report is presented on a workshop: Governance, contracting, ownership and competition issues in public transport: Looking up not down
0 KPIs Not listed
Six social goals: Economic competitiveness; Fiscal sustainability; Environmental sustainability; Social inclusion; Liveability, health and safety; Regional development
Qualitative No methodology was presented Summary of a Workshop: Governance, contracting, ownership and competition issues in public transport: Looking up not down
50
45 3 2 This paper reviews relevant policies and reported a survey with pilot cities to better understand the current status, problems and uncertainties existed in the EV deployment in China. Recommendations are developed from the survey findings.
0 KPIs Not listed
No specific impacts were discussed
Qualitative No methodology was presented Review, Survey
51
53 3 2 This paper investigates the problem of efficiently collecting and disseminating traffic information in an urban setting. Two routing algorithms for vehicular networks are introduced. A framework is proposed that jointly optimises the two key processes associated with monitoring traffic.
0 KPIs Not listed
Social, economic impacts Mostly Quantitative
No methodology was presented Algorithmic (D-Greedy as the data delivery algorithm), Traffic monitoring sensor networks, Simulation
52
59 3 2 This paper offers the description of an integrated information system framework for the assessment of transportation planning and management.
0 KPIs Not listed
No specific impacts were discussed
Qualitative SIMT architectue design process: 1) User needs 2) Functional Architecture 3) Physical Architecture
Information system framework, Performance Monitoring, Decision-making, Transport Planning
53
69 3 2 A common modelling methodology is used to estimate the gap between present and efficient prices for passenger and freight transport in six zones in Europe.
0 KPIs Not listed
Economic welfare Mostly Quantitative
No step by step methodology was presented. Only an extended discussion was provided
Pricing model (TRENEN models)
Stellenbosch University https://scholar.sun.ac.za
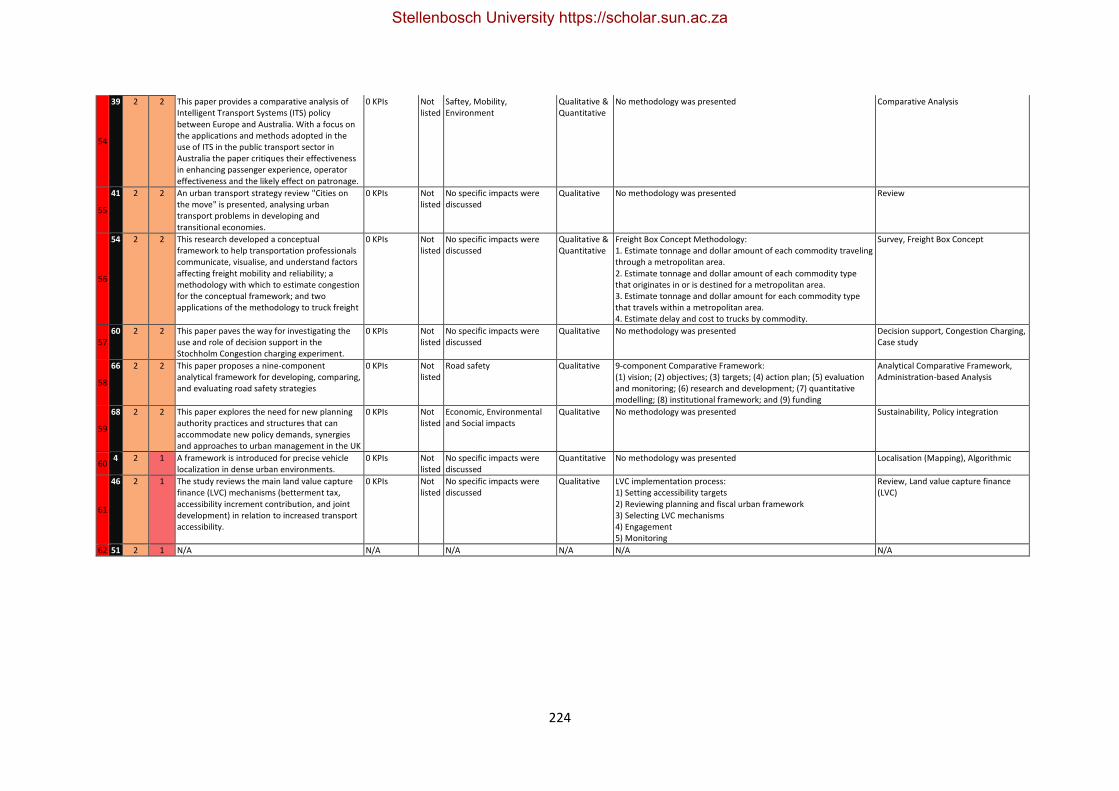
224
54
39 2 2 This paper provides a comparative analysis of Intelligent Transport Systems (ITS) policy between Europe and Australia. With a focus on the applications and methods adopted in the use of ITS in the public transport sector in Australia the paper critiques their effectiveness in enhancing passenger experience, operator effectiveness and the likely effect on patronage.
0 KPIs Not listed
Saftey, Mobility, Environment
Qualitative & Quantitative
No methodology was presented Comparative Analysis
55
41 2 2 An urban transport strategy review "Cities on the move" is presented, analysing urban transport problems in developing and transitional economies.
0 KPIs Not listed
No specific impacts were discussed
Qualitative No methodology was presented Review
56
54 2 2 This research developed a conceptual framework to help transportation professionals communicate, visualise, and understand factors affecting freight mobility and reliability; a methodology with which to estimate congestion for the conceptual framework; and two applications of the methodology to truck freight
0 KPIs Not listed
No specific impacts were discussed
Qualitative & Quantitative
Freight Box Concept Methodology: 1. Estimate tonnage and dollar amount of each commodity traveling through a metropolitan area. 2. Estimate tonnage and dollar amount of each commodity type that originates in or is destined for a metropolitan area. 3. Estimate tonnage and dollar amount for each commodity type that travels within a metropolitan area. 4. Estimate delay and cost to trucks by commodity.
Survey, Freight Box Concept
57 60 2 2 This paper paves the way for investigating the
use and role of decision support in the Stochholm Congestion charging experiment.
0 KPIs Not listed
No specific impacts were discussed
Qualitative No methodology was presented Decision support, Congestion Charging, Case study
58
66 2 2 This paper proposes a nine-component analytical framework for developing, comparing, and evaluating road safety strategies
0 KPIs Not listed
Road safety Qualitative 9-component Comparative Framework: (1) vision; (2) objectives; (3) targets; (4) action plan; (5) evaluation and monitoring; (6) research and development; (7) quantitative modelling; (8) institutional framework; and (9) funding
Analytical Comparative Framework, Administration-based Analysis
59
68 2 2 This paper explores the need for new planning authority practices and structures that can accommodate new policy demands, synergies and approaches to urban management in the UK
0 KPIs Not listed
Economic, Environmental and Social impacts
Qualitative No methodology was presented Sustainability, Policy integration
60 4 2 1 A framework is introduced for precise vehicle
localization in dense urban environments. 0 KPIs Not
listed No specific impacts were discussed
Quantitative No methodology was presented Localisation (Mapping), Algorithmic
61
46 2 1 The study reviews the main land value capture finance (LVC) mechanisms (betterment tax, accessibility increment contribution, and joint development) in relation to increased transport accessibility.
0 KPIs Not listed
No specific impacts were discussed
Qualitative LVC implementation process: 1) Setting accessibility targets 2) Reviewing planning and fiscal urban framework 3) Selecting LVC mechanisms 4) Engagement 5) Monitoring
Review, Land value capture finance (LVC)
62 51 2 1 N/A N/A N/A N/A N/A N/A
Stellenbosch University https://scholar.sun.ac.za
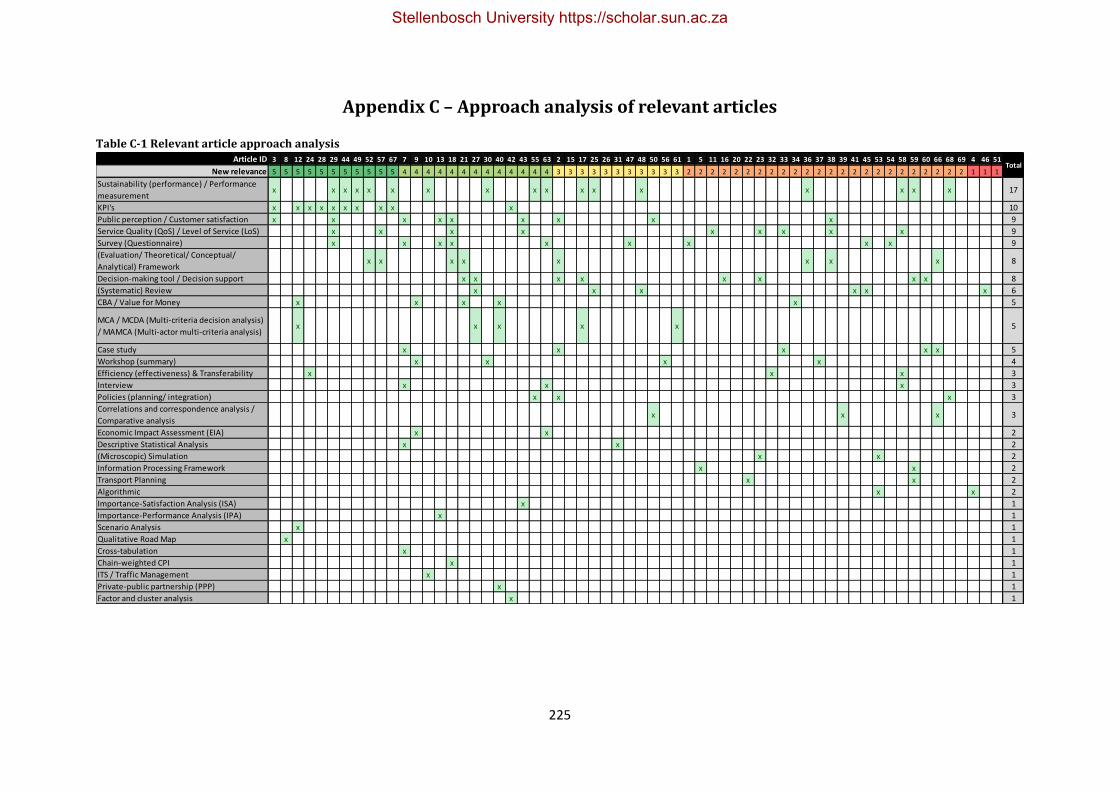
225
Appendix C – Approach analysis of relevant articles
Table C-1 Relevant article approach analysis
Article ID 3 8 12 24 28 29 44 49 52 57 67 7 9 10 13 18 21 27 30 40 42 43 55 63 2 15 17 25 26 31 47 48 50 56 61 1 5 11 16 20 22 23 32 33 34 36 37 38 39 41 45 53 54 58 59 60 66 68 69 4 46 51
New relevance 5 5 5 5 5 5 5 5 5 5 5 4 4 4 4 4 4 4 4 4 4 4 4 4 3 3 3 3 3 3 3 3 3 3 3 2 2 2 2 2 2 2 2 2 2 2 2 2 2 2 2 2 2 2 2 2 2 2 2 1 1 1
Sustainability (performance) / Performance
measurementx x x x x x x x x x x x x x x x x 17
KPI's x x x x x x x x x x 10
Public perception / Customer satisfaction x x x x x x x x x 9
Service Quality (QoS) / Level of Service (LoS) x x x x x x x x x 9
Survey (Questionnaire) x x x x x x x x x 9
(Evaluation/ Theoretical/ Conceptual/
Analytical) Frameworkx x x x x x x x 8
Decision-making tool / Decision support x x x x x x x x 8
(Systematic) Review x x x x x x 6
CBA / Value for Money x x x x x 5
MCA / MCDA (Multi-criteria decision analysis)
/ MAMCA (Multi-actor multi-criteria analysis)x x x x x 5
Case study x x x x x 5
Workshop (summary) x x x x 4
Efficiency (effectiveness) & Transferability x x x 3
Interview x x x 3
Policies (planning/ integration) x x x 3
Correlations and correspondence analysis /
Comparative analysisx x x 3
Economic Impact Assessment (EIA) x x 2
Descriptive Statistical Analysis x x 2
(Microscopic) Simulation x x 2
Information Processing Framework x x 2
Transport Planning x x 2
Algorithmic x x 2
Importance-Satisfaction Analysis (ISA) x 1
Importance-Performance Analysis (IPA) x 1
Scenario Analysis x 1
Qualitative Road Map x 1
Cross-tabulation x 1
Chain-weighted CPI x 1
ITS / Traffic Management x 1
Private-public partnership (PPP) x 1
Factor and cluster analysis x 1
Total
Stellenbosch University https://scholar.sun.ac.za
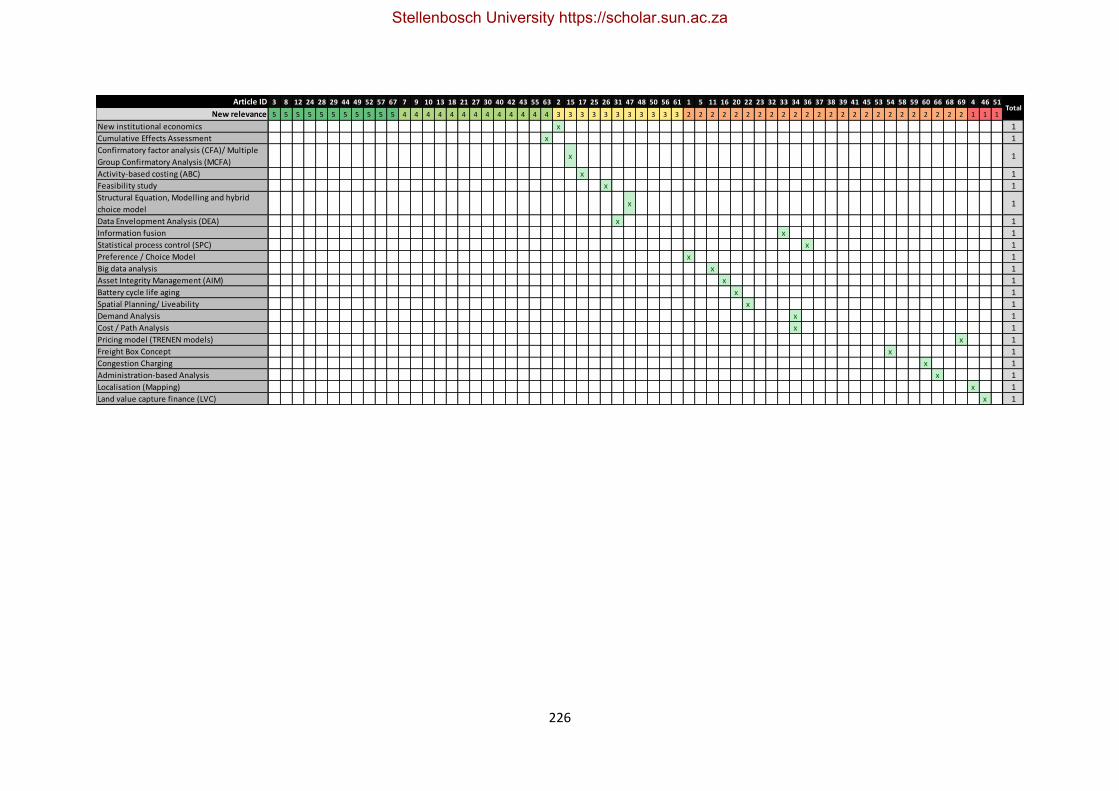
226
Article ID 3 8 12 24 28 29 44 49 52 57 67 7 9 10 13 18 21 27 30 40 42 43 55 63 2 15 17 25 26 31 47 48 50 56 61 1 5 11 16 20 22 23 32 33 34 36 37 38 39 41 45 53 54 58 59 60 66 68 69 4 46 51
New relevance 5 5 5 5 5 5 5 5 5 5 5 4 4 4 4 4 4 4 4 4 4 4 4 4 3 3 3 3 3 3 3 3 3 3 3 2 2 2 2 2 2 2 2 2 2 2 2 2 2 2 2 2 2 2 2 2 2 2 2 1 1 1
New institutional economics x 1
Cumulative Effects Assessment x 1
Confirmatory factor analysis (CFA)/ Multiple
Group Confirmatory Analysis (MCFA)x 1
Activity-based costing (ABC) x 1
Feasibility study x 1
Structural Equation, Modelling and hybrid
choice modelx 1
Data Envelopment Analysis (DEA) x 1
Information fusion x 1
Statistical process control (SPC) x 1
Preference / Choice Model x 1
Big data analysis x 1
Asset Integrity Management (AIM) x 1
Battery cycle life aging x 1
Spatial Planning/ Liveability x 1
Demand Analysis x 1
Cost / Path Analysis x 1
Pricing model (TRENEN models) x 1
Freight Box Concept x 1
Congestion Charging x 1
Administration-based Analysis x 1
Localisation (Mapping) x 1
Land value capture finance (LVC) x 1
Total
Stellenbosch University https://scholar.sun.ac.za
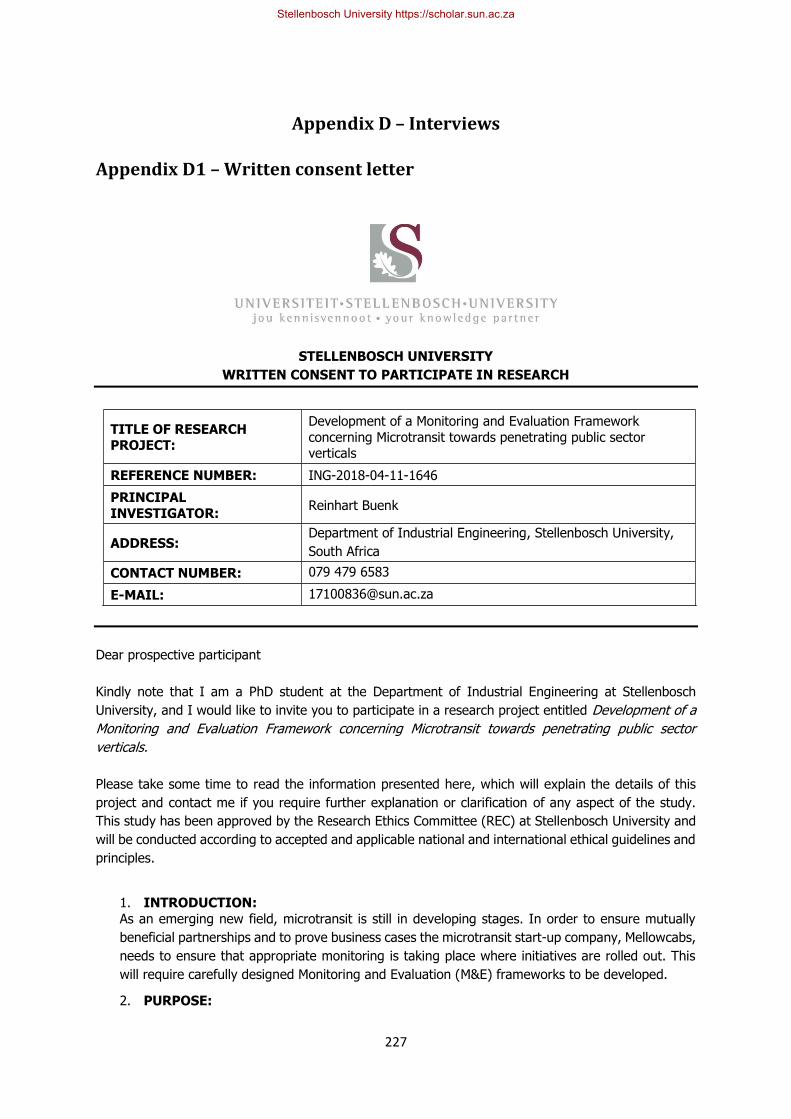
227
Appendix D – Interviews
Appendix D1 – Written consent letter
STELLENBOSCH UNIVERSITY
WRITTEN CONSENT TO PARTICIPATE IN RESEARCH
TITLE OF RESEARCH PROJECT:
Development of a Monitoring and Evaluation Framework
concerning Microtransit towards penetrating public sector verticals
REFERENCE NUMBER: ING-2018-04-11-1646
PRINCIPAL INVESTIGATOR:
Reinhart Buenk
ADDRESS: Department of Industrial Engineering, Stellenbosch University,
South Africa
CONTACT NUMBER: 079 479 6583
E-MAIL: [email protected]
Dear prospective participant
Kindly note that I am a PhD student at the Department of Industrial Engineering at Stellenbosch
University, and I would like to invite you to participate in a research project entitled Development of a
Monitoring and Evaluation Framework concerning Microtransit towards penetrating public sector
verticals.
Please take some time to read the information presented here, which will explain the details of this
project and contact me if you require further explanation or clarification of any aspect of the study.
This study has been approved by the Research Ethics Committee (REC) at Stellenbosch University and
will be conducted according to accepted and applicable national and international ethical guidelines and
principles.
1. INTRODUCTION:
As an emerging new field, microtransit is still in developing stages. In order to ensure mutually
beneficial partnerships and to prove business cases the microtransit start-up company, Mellowcabs,
needs to ensure that appropriate monitoring is taking place where initiatives are rolled out. This
will require carefully designed Monitoring and Evaluation (M&E) frameworks to be developed.
2. PURPOSE:
Stellenbosch University https://scholar.sun.ac.za
228
• To obtain a comprehensive understanding of what microtransit is through the process of a
systematic literature review;
• To fully understand the process of M&E through extensive literature analysis and recognise
how to apply the obtained knowledge towards building a microtransit framework;
• To develop the generic M&E framework that can be used by small scale transportation
organisations to analyse performance and impacts of microtransit systems (assisting in
proving business cases) and;
• To evaluate the effectiveness (Validation) of the developed M&E framework in the context
of an existing real microtransit company namely Mellowcabs.
3. PROCEDURES:
Please read through and complete this consent form to know what would be expected from you
prior to participating in the research. The procedure and expectations of the participant are as
follows:
i. Some questions will be asked during an interview 1) regarding the interviewee (kept anonymous) and 2) regarding the research conducted.
ii. A definition of microtransit is provided to the interviewee.
iii. Areas of sustainability (AoS) and sustainability key performance indicators (KPIs) were identified for microtransit systems via a systematic literature review. The interviewee will be
asked to identify which of the AoS and KPIs he believes are relevant (to keep) and which are irrelevant (remove) to microtransit systems. This will enable the researcher to know which
to keep/remove from the Monitoring and Evaluation (M&E) framework.
iv. Following the interview, the interviewee will be asked to complete a survey in order to assign weightings to the identified relevant AoS and KPIs.
4. TIME:
The interview is expected to take 40 minutes. Completion of the Survey should take an additional
20 minutes.
5. RISKS:
This interview has no risk of causing harm or any negative experiences/ discomforts.
6. BENEFITS:
Participation in this interview will greatly contribute to the completion of this research and the
development of a generic microtransit M&E framework.
7. PARTICIPATION AND WITHDRAWAL:
The interview is entirely voluntary and participation can be withdrawn at any time during the
interview with no negative consequences. Participants may choose not to answer certain questions.
If information is refused (not answered), research will commence without it and be based on the
relevant information that can well be disclosed. If, however, the interviewee decides to withdraw
completely from the interview and the research study, all data will be destroyed and will not be
used for the research.
8. CONFIDENTIALITY:
All information obtained from the individual(s) will represent the company rather than the
individuals – the individuals will thus remain anonymous. The information obtained from the
interview will be considered as opinion rather than fact. Voice recordings of the interviews instead
of video recordings will ensure the interviewee’s privacy. Voice recordings will be made with the
investigator’s phone which is password protected. No personal questions or personal details will
be asked. All hard copy consent forms with personal information (e.g. signature) will be scanned
and kept on the investigator's laptop which is password protected and kept in a secure location,
Stellenbosch University https://scholar.sun.ac.za
229
and always locked or shut down when left unattended. All digital and hard copies of the consent
forms will be destroyed within five years or after completion of the PhD thesis and the completion
of journal article publication(s) within the five-year period.
9. RECORDINGS:
Please note that a voice recording will be made of the interview. Please indicate to the interviewer
if you are not comfortable with this.
10. DATA STORAGE:
Voice recordings of the interviews instead of video recordings will ensure the interviewee’s privacy.
Voice recordings will be made with the investigator’s phone which is password protected. The
survey will not require the participant to provide personal details - only the company represented,
the participant’s field of expertise, and years of experience will be asked. Hard copies of the surveys
will be kept by the investigator at all times – the hard copies will however not reveal any personal
information about the interviewees or be identifiable. Only the investigator and his supervisor will
have access to these data. Any other data that might possibly be considered confidential will be
stored on the investigator's private computer which is password protected and kept in a secure
location, and always locked or shut down when left unattended. All digital and hard copies of the
consent forms, surveys, and interviews will be deleted within five years or after completion of the
Master’s thesis and the completion of journal article publication(s) within the five-year period.
If you have any questions or concerns about this research project, please feel free to contact me via
email ([email protected]) or telephonically (079 479 6583). Alternatively, feel free to contact my
supervisor, Sara Grobbelaar, via email ([email protected]) or telephonically (082 576 8123).
RIGHTS OF RESEARCH PARTICPANTS: You may withdraw your consent at any time and
discontinue participation without penalty. You are not waiving any legal claims, rights or remedies
because of your participation in this research study. If you have questions regarding your rights as a
research subject, contact Ms Maléne Fouché ([email protected] / 021 808 4622) at the Division for
Research Development. You have the right to receive a copy of this Consent form.
If you are willing to participate in this research project, please sign the Declaration of
Consent below and hand it to the investigator.
Stellenbosch University https://scholar.sun.ac.za
230
DECLARATION BY THE PARTICIPANT
As the participant I hereby declare that:
• I have read the above information and it is written in a language with which I am fluent and
comfortable.
• I have had a chance to ask questions and all my questions have been adequately answered.
• I understand that taking part in this study is voluntary and I have not been pressurised to take
part.
• I may choose to leave the study at any time and will not be penalised or prejudiced in any way.
• If the principal investigator feels that it is in my best interest, or if I do not follow the study
plan as agreed to, then I may be asked to leave the study before it has finished.
• All issues related to privacy, and the confidentiality and use of the information I provide, have
been explained to my satisfaction.
By signing below, I ______________________________ agree to take part in this research study,
as conducted by Reinhart Buenk.
_______________________________________ ___________________________
Signed at (place) Date
_______________________________________
Signature of Participant
DECLARATION BY THE PRINCIPAL INVESTIGATOR
As the principal investigator I hereby declare that the information contained in this document has
been thoroughly explained to the participant. I also declare that the participant has been encouraged
(and has been given ample time) to ask any questions. In addition I would like to select the following
option:
The conversation with the participant was conducted in a language in which the participant is fluent.
The conversation with the participant was conducted with the assistance of a translator, and this “Consent Form” is available to the participant in a language in which the participant is
fluent.
_______________________________________ ___________________________
Signed at (place) Date
________________________________________
Signature of Principal Investigator
Stellenbosch University https://scholar.sun.ac.za
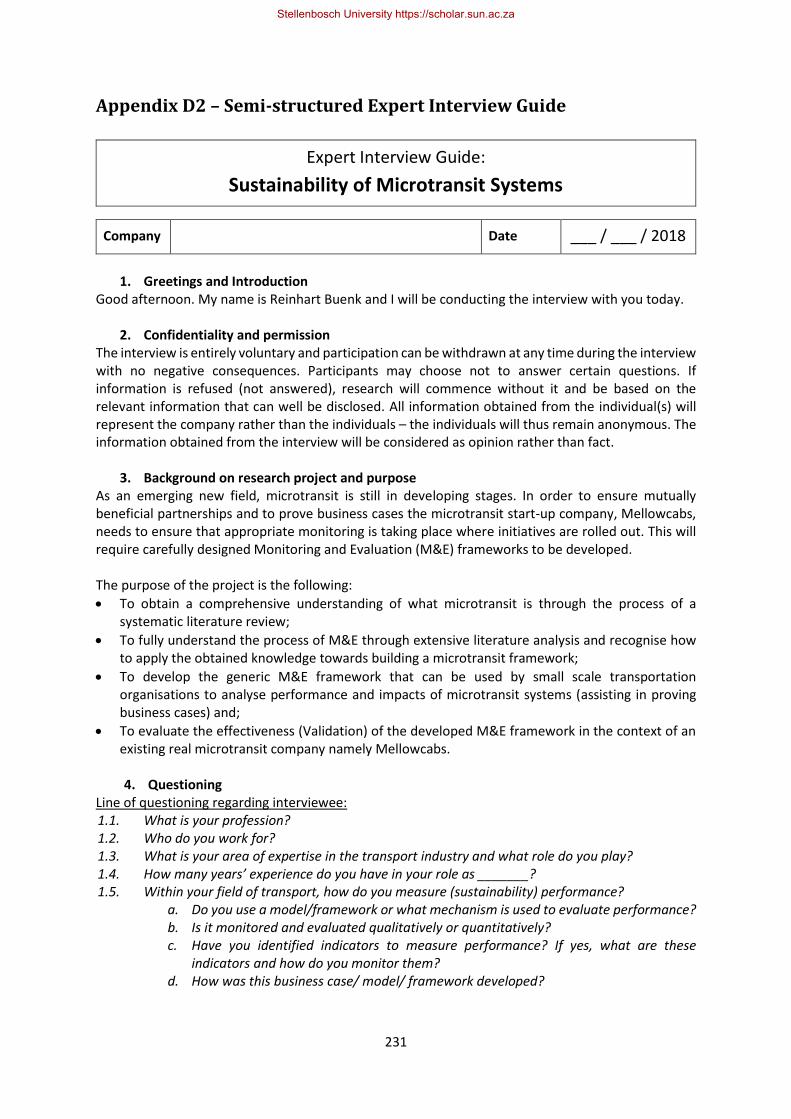
231
Appendix D2 – Semi-structured Expert Interview Guide
Expert Interview Guide:
Sustainability of Microtransit Systems
Company Date ___ / ___ / 2018
1. Greetings and Introduction
Good afternoon. My name is Reinhart Buenk and I will be conducting the interview with you today.
2. Confidentiality and permission The interview is entirely voluntary and participation can be withdrawn at any time during the interview with no negative consequences. Participants may choose not to answer certain questions. If information is refused (not answered), research will commence without it and be based on the relevant information that can well be disclosed. All information obtained from the individual(s) will represent the company rather than the individuals – the individuals will thus remain anonymous. The information obtained from the interview will be considered as opinion rather than fact.
3. Background on research project and purpose As an emerging new field, microtransit is still in developing stages. In order to ensure mutually beneficial partnerships and to prove business cases the microtransit start-up company, Mellowcabs, needs to ensure that appropriate monitoring is taking place where initiatives are rolled out. This will require carefully designed Monitoring and Evaluation (M&E) frameworks to be developed. The purpose of the project is the following:
• To obtain a comprehensive understanding of what microtransit is through the process of a systematic literature review;
• To fully understand the process of M&E through extensive literature analysis and recognise how to apply the obtained knowledge towards building a microtransit framework;
• To develop the generic M&E framework that can be used by small scale transportation organisations to analyse performance and impacts of microtransit systems (assisting in proving business cases) and;
• To evaluate the effectiveness (Validation) of the developed M&E framework in the context of an existing real microtransit company namely Mellowcabs.
4. Questioning
Line of questioning regarding interviewee: 1.1. What is your profession? 1.2. Who do you work for? 1.3. What is your area of expertise in the transport industry and what role do you play? 1.4. How many years’ experience do you have in your role as _______? 1.5. Within your field of transport, how do you measure (sustainability) performance?
a. Do you use a model/framework or what mechanism is used to evaluate performance? b. Is it monitored and evaluated qualitatively or quantitatively? c. Have you identified indicators to measure performance? If yes, what are these
indicators and how do you monitor them? d. How was this business case/ model/ framework developed?
Stellenbosch University https://scholar.sun.ac.za
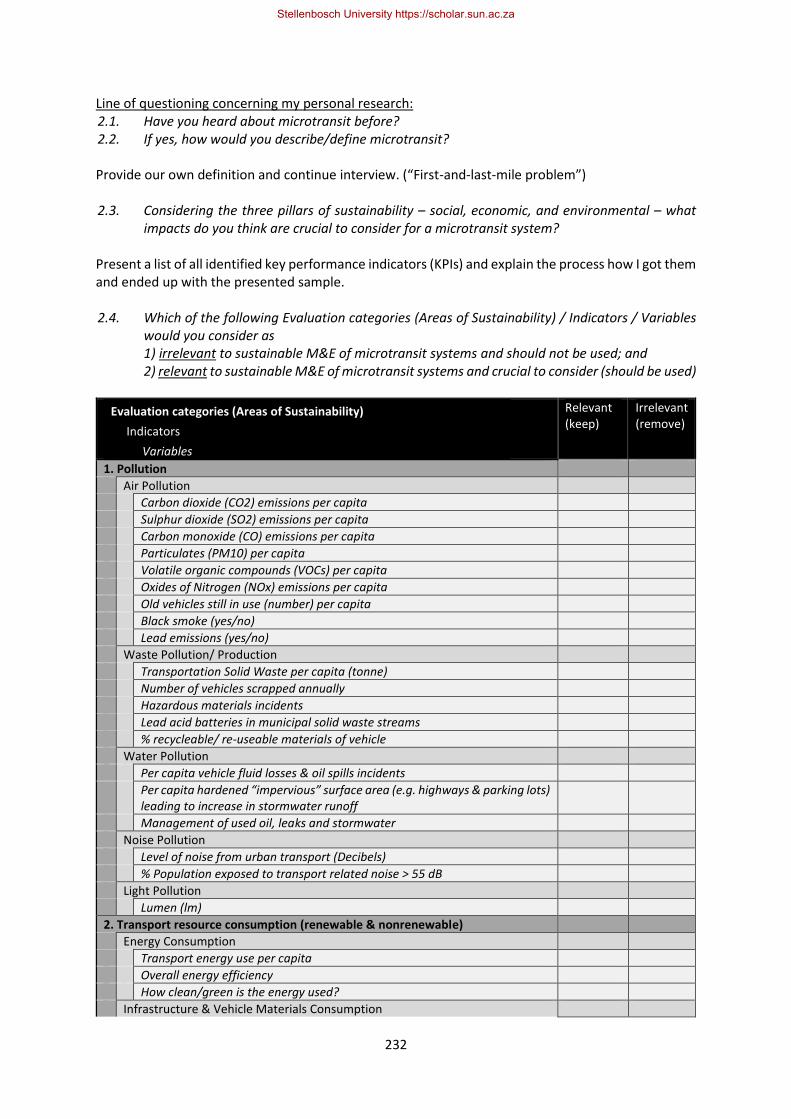
232
Line of questioning concerning my personal research: 2.1. Have you heard about microtransit before? 2.2. If yes, how would you describe/define microtransit? Provide our own definition and continue interview. (“First-and-last-mile problem”) 2.3. Considering the three pillars of sustainability – social, economic, and environmental – what
impacts do you think are crucial to consider for a microtransit system?
Present a list of all identified key performance indicators (KPIs) and explain the process how I got them and ended up with the presented sample. 2.4. Which of the following Evaluation categories (Areas of Sustainability) / Indicators / Variables
would you consider as 1) irrelevant to sustainable M&E of microtransit systems and should not be used; and 2) relevant to sustainable M&E of microtransit systems and crucial to consider (should be used)
Evaluation categories (Areas of Sustainability)
Indicators
Variables
Relevant (keep)
Irrelevant (remove)
1. Pollution
Air Pollution
Carbon dioxide (CO2) emissions per capita
Sulphur dioxide (SO2) emissions per capita
Carbon monoxide (CO) emissions per capita
Particulates (PM10) per capita
Volatile organic compounds (VOCs) per capita
Oxides of Nitrogen (NOx) emissions per capita
Old vehicles still in use (number) per capita
Black smoke (yes/no)
Lead emissions (yes/no)
Waste Pollution/ Production
Transportation Solid Waste per capita (tonne)
Number of vehicles scrapped annually
Hazardous materials incidents
Lead acid batteries in municipal solid waste streams
% recycleable/ re-useable materials of vehicle
Water Pollution
Per capita vehicle fluid losses & oil spills incidents
Per capita hardened “impervious” surface area (e.g. highways & parking lots) leading to increase in stormwater runoff
Management of used oil, leaks and stormwater
Noise Pollution
Level of noise from urban transport (Decibels)
% Population exposed to transport related noise > 55 dB
Light Pollution
Lumen (lm)
2. Transport resource consumption (renewable & nonrenewable)
Energy Consumption
Transport energy use per capita
Overall energy efficiency
How clean/green is the energy used?
Infrastructure & Vehicle Materials Consumption
Stellenbosch University https://scholar.sun.ac.za
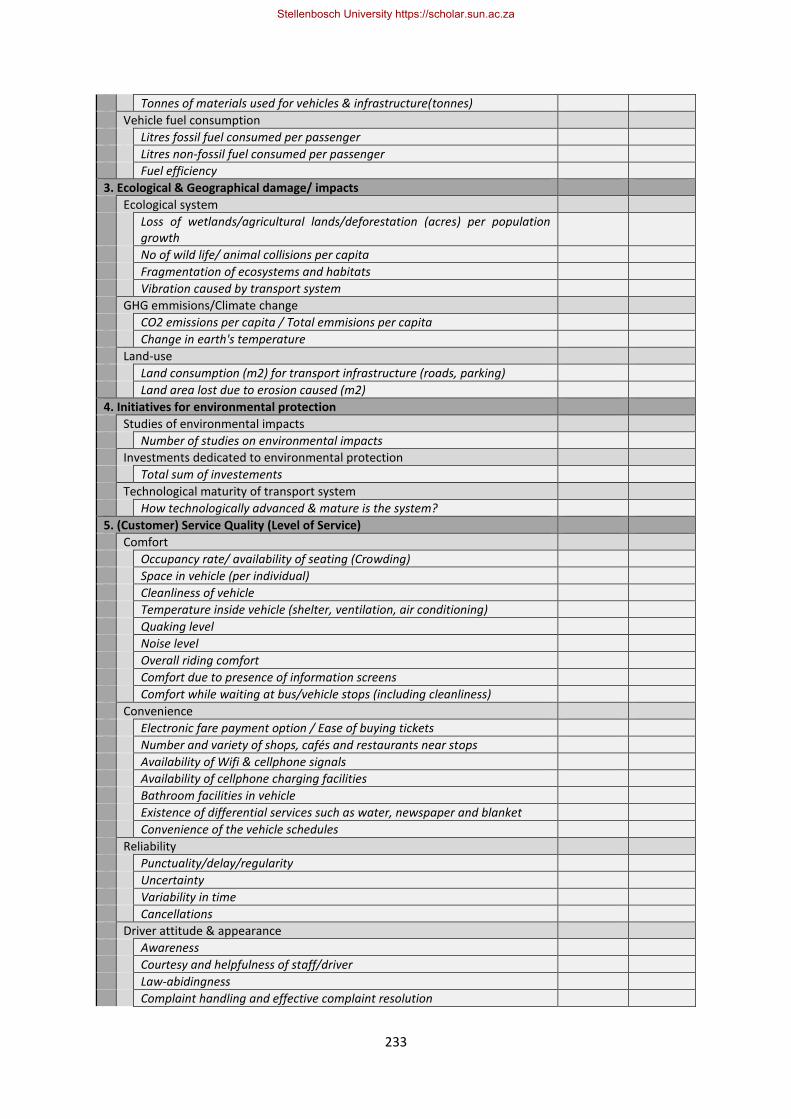
233
Tonnes of materials used for vehicles & infrastructure(tonnes)
Vehicle fuel consumption
Litres fossil fuel consumed per passenger
Litres non-fossil fuel consumed per passenger
Fuel efficiency
3. Ecological & Geographical damage/ impacts
Ecological system
Loss of wetlands/agricultural lands/deforestation (acres) per population growth
No of wild life/ animal collisions per capita
Fragmentation of ecosystems and habitats
Vibration caused by transport system
GHG emmisions/Climate change
CO2 emissions per capita / Total emmisions per capita
Change in earth's temperature
Land-use
Land consumption (m2) for transport infrastructure (roads, parking)
Land area lost due to erosion caused (m2)
4. Initiatives for environmental protection
Studies of environmental impacts
Number of studies on environmental impacts
Investments dedicated to environmental protection
Total sum of investements
Technological maturity of transport system
How technologically advanced & mature is the system?
5. (Customer) Service Quality (Level of Service)
Comfort
Occupancy rate/ availability of seating (Crowding)
Space in vehicle (per individual)
Cleanliness of vehicle
Temperature inside vehicle (shelter, ventilation, air conditioning)
Quaking level
Noise level
Overall riding comfort
Comfort due to presence of information screens
Comfort while waiting at bus/vehicle stops (including cleanliness)
Convenience
Electronic fare payment option / Ease of buying tickets
Number and variety of shops, cafés and restaurants near stops
Availability of Wifi & cellphone signals
Availability of cellphone charging facilities
Bathroom facilities in vehicle
Existence of differential services such as water, newspaper and blanket
Convenience of the vehicle schedules
Reliability
Punctuality/delay/regularity
Uncertainty
Variability in time
Cancellations
Driver attitude & appearance
Awareness
Courtesy and helpfulness of staff/driver
Law-abidingness
Complaint handling and effective complaint resolution
Stellenbosch University https://scholar.sun.ac.za
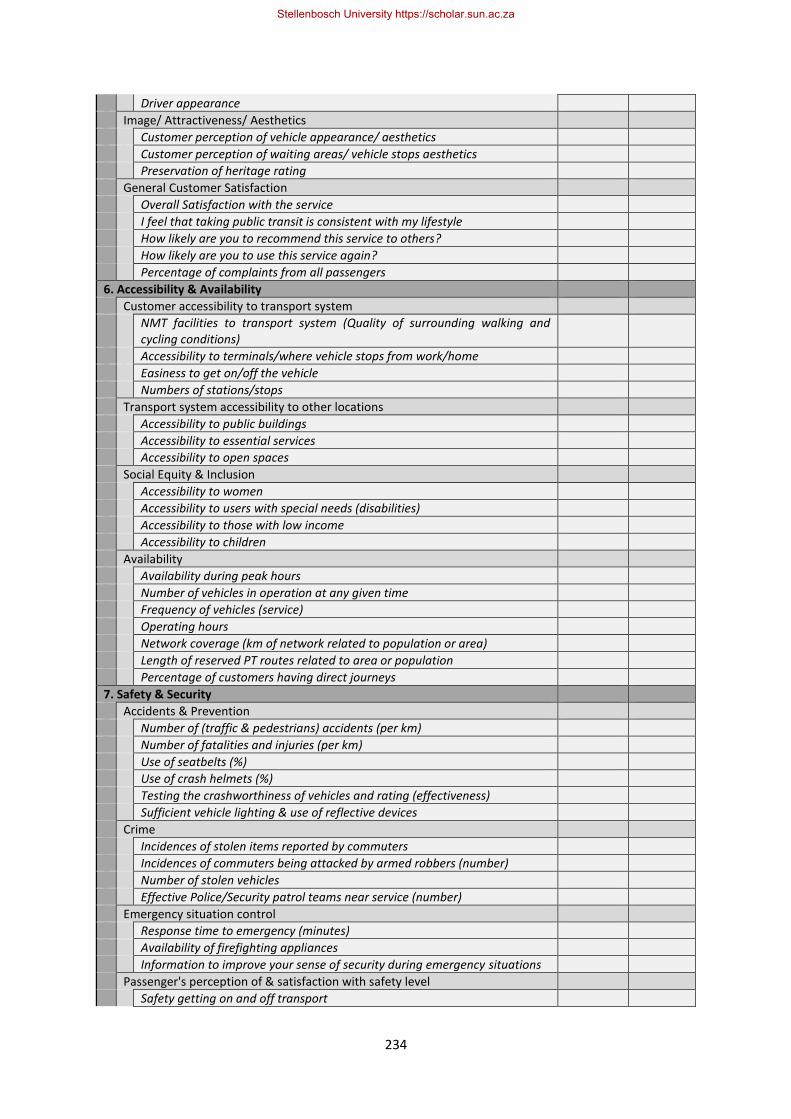
234
Driver appearance
Image/ Attractiveness/ Aesthetics
Customer perception of vehicle appearance/ aesthetics
Customer perception of waiting areas/ vehicle stops aesthetics
Preservation of heritage rating
General Customer Satisfaction
Overall Satisfaction with the service
I feel that taking public transit is consistent with my lifestyle
How likely are you to recommend this service to others?
How likely are you to use this service again?
Percentage of complaints from all passengers
6. Accessibility & Availability
Customer accessibility to transport system
NMT facilities to transport system (Quality of surrounding walking and cycling conditions)
Accessibility to terminals/where vehicle stops from work/home
Easiness to get on/off the vehicle
Numbers of stations/stops
Transport system accessibility to other locations
Accessibility to public buildings
Accessibility to essential services
Accessibility to open spaces
Social Equity & Inclusion
Accessibility to women
Accessibility to users with special needs (disabilities)
Accessibility to those with low income
Accessibility to children
Availability
Availability during peak hours
Number of vehicles in operation at any given time
Frequency of vehicles (service)
Operating hours
Network coverage (km of network related to population or area)
Length of reserved PT routes related to area or population
Percentage of customers having direct journeys
7. Safety & Security
Accidents & Prevention
Number of (traffic & pedestrians) accidents (per km)
Number of fatalities and injuries (per km)
Use of seatbelts (%)
Use of crash helmets (%)
Testing the crashworthiness of vehicles and rating (effectiveness)
Sufficient vehicle lighting & use of reflective devices
Crime
Incidences of stolen items reported by commuters
Incidences of commuters being attacked by armed robbers (number)
Number of stolen vehicles
Effective Police/Security patrol teams near service (number)
Emergency situation control
Response time to emergency (minutes)
Availability of firefighting appliances
Information to improve your sense of security during emergency situations
Passenger's perception of & satisfaction with safety level
Safety getting on and off transport
Stellenbosch University https://scholar.sun.ac.za
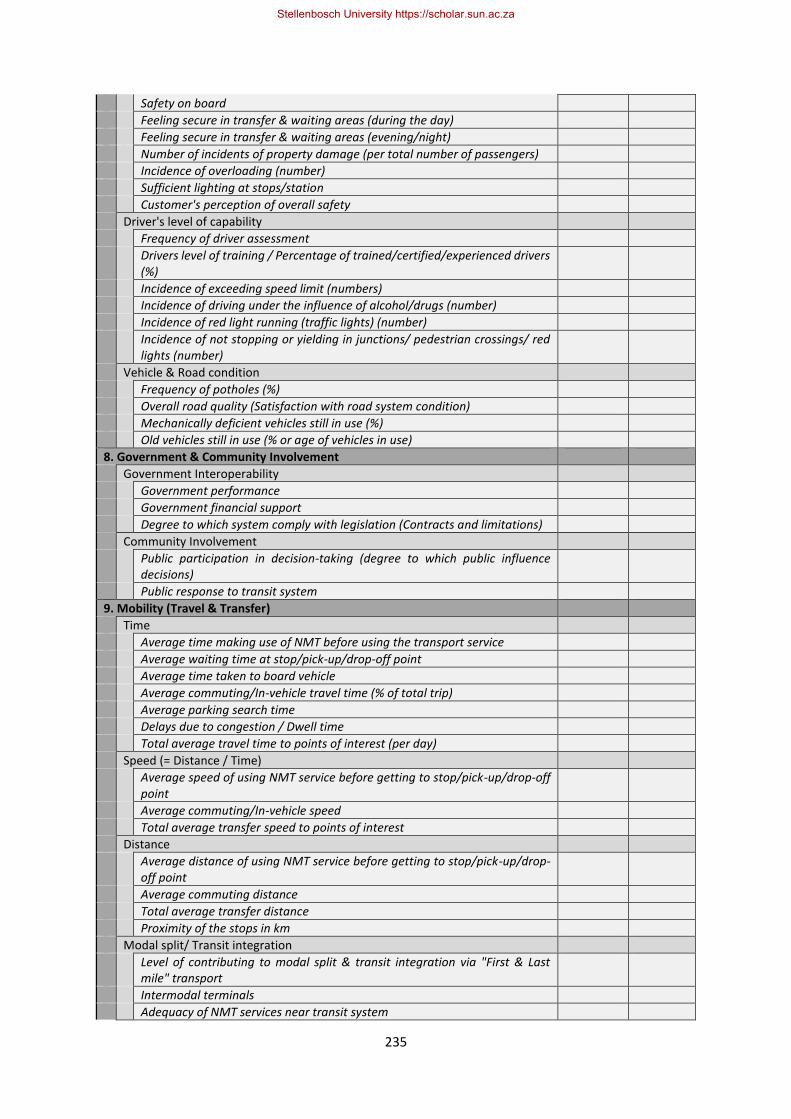
235
Safety on board
Feeling secure in transfer & waiting areas (during the day)
Feeling secure in transfer & waiting areas (evening/night)
Number of incidents of property damage (per total number of passengers)
Incidence of overloading (number)
Sufficient lighting at stops/station
Customer's perception of overall safety
Driver's level of capability
Frequency of driver assessment
Drivers level of training / Percentage of trained/certified/experienced drivers (%)
Incidence of exceeding speed limit (numbers)
Incidence of driving under the influence of alcohol/drugs (number)
Incidence of red light running (traffic lights) (number)
Incidence of not stopping or yielding in junctions/ pedestrian crossings/ red lights (number)
Vehicle & Road condition
Frequency of potholes (%)
Overall road quality (Satisfaction with road system condition)
Mechanically deficient vehicles still in use (%)
Old vehicles still in use (% or age of vehicles in use)
8. Government & Community Involvement
Government Interoperability
Government performance
Government financial support
Degree to which system comply with legislation (Contracts and limitations)
Community Involvement
Public participation in decision-taking (degree to which public influence decisions)
Public response to transit system
9. Mobility (Travel & Transfer)
Time
Average time making use of NMT before using the transport service
Average waiting time at stop/pick-up/drop-off point
Average time taken to board vehicle
Average commuting/In-vehicle travel time (% of total trip)
Average parking search time
Delays due to congestion / Dwell time
Total average travel time to points of interest (per day)
Speed (= Distance / Time)
Average speed of using NMT service before getting to stop/pick-up/drop-off point
Average commuting/In-vehicle speed
Total average transfer speed to points of interest
Distance
Average distance of using NMT service before getting to stop/pick-up/drop-off point
Average commuting distance
Total average transfer distance
Proximity of the stops in km
Modal split/ Transit integration
Level of contributing to modal split & transit integration via "First & Last mile" transport
Intermodal terminals
Adequacy of NMT services near transit system
Stellenbosch University https://scholar.sun.ac.za
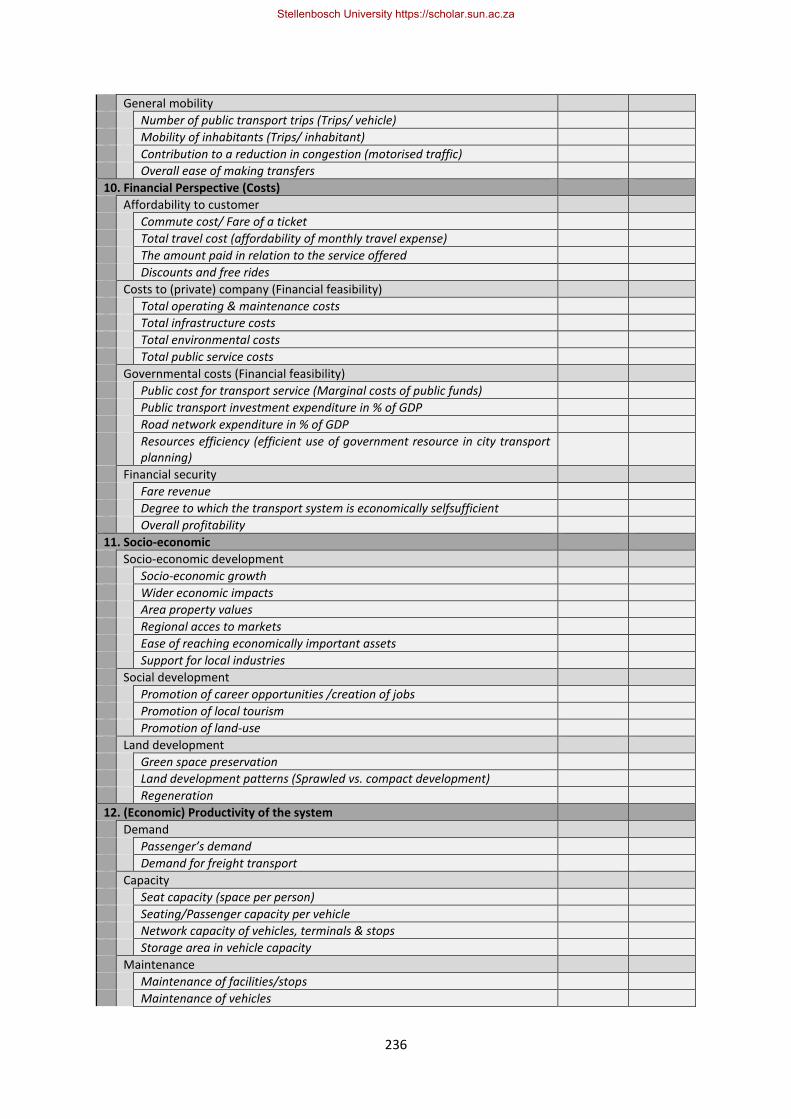
236
General mobility
Number of public transport trips (Trips/ vehicle)
Mobility of inhabitants (Trips/ inhabitant)
Contribution to a reduction in congestion (motorised traffic)
Overall ease of making transfers
10. Financial Perspective (Costs)
Affordability to customer
Commute cost/ Fare of a ticket
Total travel cost (affordability of monthly travel expense)
The amount paid in relation to the service offered
Discounts and free rides
Costs to (private) company (Financial feasibility)
Total operating & maintenance costs
Total infrastructure costs
Total environmental costs
Total public service costs
Governmental costs (Financial feasibility)
Public cost for transport service (Marginal costs of public funds)
Public transport investment expenditure in % of GDP
Road network expenditure in % of GDP
Resources efficiency (efficient use of government resource in city transport planning)
Financial security
Fare revenue
Degree to which the transport system is economically selfsufficient
Overall profitability
11. Socio-economic
Socio-economic development
Socio-economic growth
Wider economic impacts
Area property values
Regional acces to markets
Ease of reaching economically important assets
Support for local industries
Social development
Promotion of career opportunities /creation of jobs
Promotion of local tourism
Promotion of land-use
Land development
Green space preservation
Land development patterns (Sprawled vs. compact development)
Regeneration
12. (Economic) Productivity of the system
Demand
Passenger’s demand
Demand for freight transport
Capacity
Seat capacity (space per person)
Seating/Passenger capacity per vehicle
Network capacity of vehicles, terminals & stops
Storage area in vehicle capacity
Maintenance
Maintenance of facilities/stops
Maintenance of vehicles
Stellenbosch University https://scholar.sun.ac.za
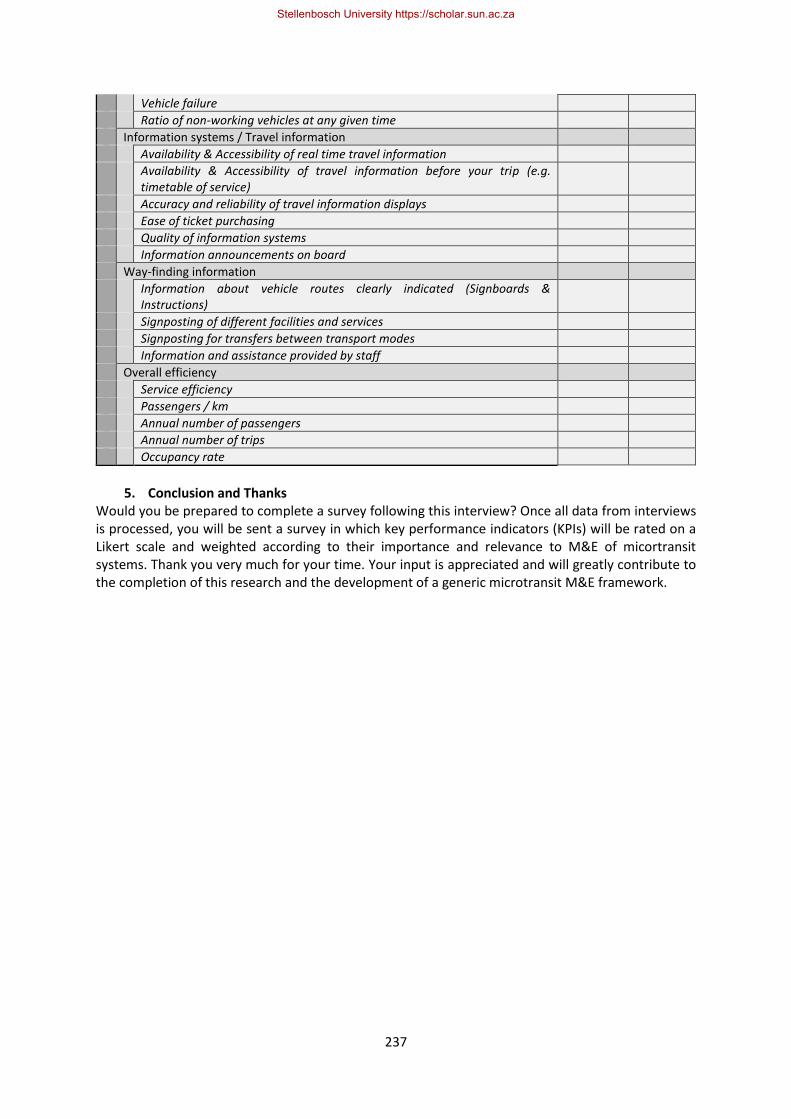
237
Vehicle failure
Ratio of non-working vehicles at any given time
Information systems / Travel information
Availability & Accessibility of real time travel information
Availability & Accessibility of travel information before your trip (e.g. timetable of service)
Accuracy and reliability of travel information displays
Ease of ticket purchasing
Quality of information systems
Information announcements on board
Way-finding information
Information about vehicle routes clearly indicated (Signboards & Instructions)
Signposting of different facilities and services
Signposting for transfers between transport modes
Information and assistance provided by staff
Overall efficiency
Service efficiency
Passengers / km
Annual number of passengers
Annual number of trips
Occupancy rate
5. Conclusion and Thanks
Would you be prepared to complete a survey following this interview? Once all data from interviews is processed, you will be sent a survey in which key performance indicators (KPIs) will be rated on a Likert scale and weighted according to their importance and relevance to M&E of micortransit systems. Thank you very much for your time. Your input is appreciated and will greatly contribute to the completion of this research and the development of a generic microtransit M&E framework.
Stellenbosch University https://scholar.sun.ac.za
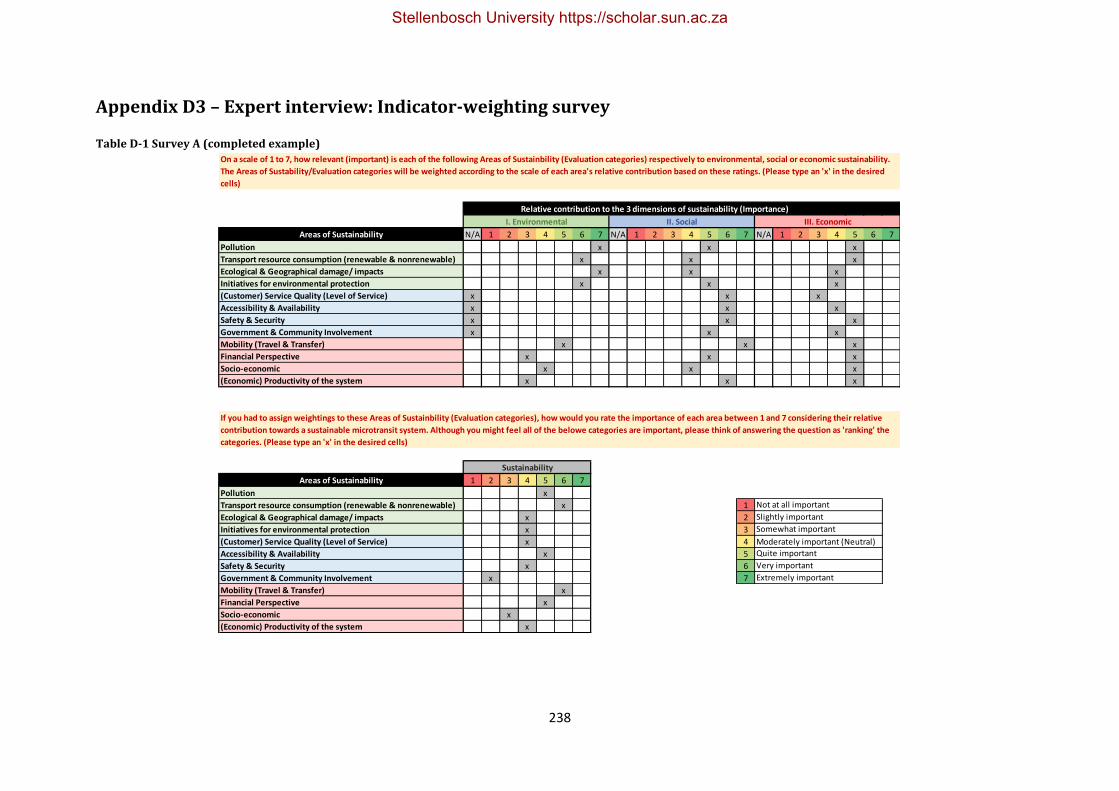
238
Appendix D3 – Expert interview: Indicator-weighting survey
Table D-1 Survey A (completed example)
Areas of Sustainability N/A 1 2 3 4 5 6 7 N/A 1 2 3 4 5 6 7 N/A 1 2 3 4 5 6 7
Pollution x x x
Transport resource consumption (renewable & nonrenewable) x x x
Ecological & Geographical damage/ impacts x x x
Initiatives for environmental protection x x x
(Customer) Service Quality (Level of Service) x x x
Accessibility & Availability x x x
Safety & Security x x x
Government & Community Involvement x x x
Mobility (Travel & Transfer) x x x
Financial Perspective x x x
Socio-economic x x x
(Economic) Productivity of the system x x x
Areas of Sustainability 1 2 3 4 5 6 7
Pollution x
Transport resource consumption (renewable & nonrenewable) x 1
Ecological & Geographical damage/ impacts x 2
Initiatives for environmental protection x 3
(Customer) Service Quality (Level of Service) x 4 Moderately important (Neutral)
Accessibility & Availability x 5
Safety & Security x 6
Government & Community Involvement x 7
Mobility (Travel & Transfer) x
Financial Perspective x
Socio-economic x
(Economic) Productivity of the system x
If you had to assign weightings to these Areas of Sustainbility (Evaluation categories), how would you rate the importance of each area between 1 and 7 considering their relative
contribution towards a sustainable microtransit system. Although you might feel all of the belowe categories are important, please think of answering the question as 'ranking' the
categories. (Please type an 'x' in the desired cells)
On a scale of 1 to 7, how relevant (important) is each of the following Areas of Sustainbility (Evaluation categories) respectively to environmental, social or economic sustainability.
The Areas of Sustability/Evaluation categories will be weighted according to the scale of each area's relative contribution based on these ratings. (Please type an 'x' in the desired
cells)
Relative contribution to the 3 dimensions of sustainability (Importance)
I. Environmental II. Social III. Economic
Sustainability
Extremely important
Very important
Quite important
Slightly important
Somewhat important
Not at all important
Stellenbosch University https://scholar.sun.ac.za
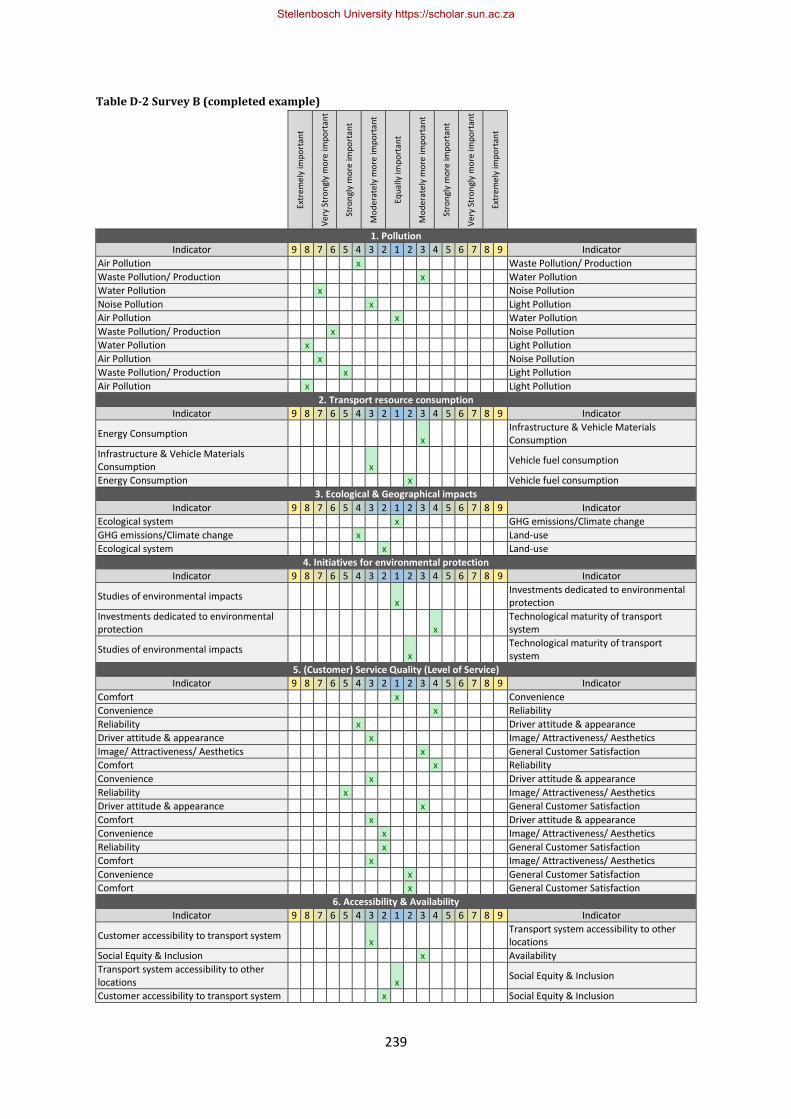
239
Table D-2 Survey B (completed example)
Extr
eme
ly im
po
rtan
t
Ve
ry S
tro
ngl
y m
ore
imp
ort
ant
Stro
ngl
y m
ore
imp
ort
ant
Mo
der
ate
ly m
ore
imp
ort
ant
Equ
ally
imp
ort
ant
Mo
der
ate
ly m
ore
imp
ort
ant
Stro
ngl
y m
ore
imp
ort
ant
Ve
ry S
tro
ngl
y m
ore
imp
ort
ant
Extr
eme
ly im
po
rtan
t
1. Pollution
Indicator 9 8 7 6 5 4 3 2 1 2 3 4 5 6 7 8 9 Indicator
Air Pollution x Waste Pollution/ Production
Waste Pollution/ Production x Water Pollution
Water Pollution x Noise Pollution
Noise Pollution x Light Pollution
Air Pollution x Water Pollution
Waste Pollution/ Production x Noise Pollution
Water Pollution x Light Pollution
Air Pollution x Noise Pollution
Waste Pollution/ Production x Light Pollution
Air Pollution x Light Pollution
2. Transport resource consumption
Indicator 9 8 7 6 5 4 3 2 1 2 3 4 5 6 7 8 9 Indicator
Energy Consumption x
Infrastructure & Vehicle Materials Consumption
Infrastructure & Vehicle Materials Consumption x
Vehicle fuel consumption
Energy Consumption x Vehicle fuel consumption
3. Ecological & Geographical impacts
Indicator 9 8 7 6 5 4 3 2 1 2 3 4 5 6 7 8 9 Indicator
Ecological system x GHG emissions/Climate change
GHG emissions/Climate change x Land-use
Ecological system x Land-use
4. Initiatives for environmental protection
Indicator 9 8 7 6 5 4 3 2 1 2 3 4 5 6 7 8 9 Indicator
Studies of environmental impacts x
Investments dedicated to environmental protection
Investments dedicated to environmental protection x
Technological maturity of transport system
Studies of environmental impacts x
Technological maturity of transport system
5. (Customer) Service Quality (Level of Service)
Indicator 9 8 7 6 5 4 3 2 1 2 3 4 5 6 7 8 9 Indicator
Comfort x Convenience
Convenience x Reliability
Reliability x Driver attitude & appearance
Driver attitude & appearance x Image/ Attractiveness/ Aesthetics
Image/ Attractiveness/ Aesthetics x General Customer Satisfaction
Comfort x Reliability
Convenience x Driver attitude & appearance
Reliability x Image/ Attractiveness/ Aesthetics
Driver attitude & appearance x General Customer Satisfaction
Comfort x Driver attitude & appearance
Convenience x Image/ Attractiveness/ Aesthetics
Reliability x General Customer Satisfaction
Comfort x Image/ Attractiveness/ Aesthetics
Convenience x General Customer Satisfaction
Comfort x General Customer Satisfaction
6. Accessibility & Availability
Indicator 9 8 7 6 5 4 3 2 1 2 3 4 5 6 7 8 9 Indicator
Customer accessibility to transport system x
Transport system accessibility to other locations
Social Equity & Inclusion x Availability
Transport system accessibility to other locations x
Social Equity & Inclusion
Customer accessibility to transport system x Social Equity & Inclusion
Stellenbosch University https://scholar.sun.ac.za

240
Transport system accessibility to other locations x
Availability
Customer accessibility to transport system x Availability
7. Safety & Security
Indicator 9 8 7 6 5 4 3 2 1 2 3 4 5 6 7 8 9 Indicator
Accidents & Prevention x Crime
Crime x Emergency situation control
Emergency situation control x
Passenger's perception of & satisfaction with safety level
Passenger's perception of & satisfaction with safety level x
Driver's level of capability
Driver's level of capability x Vehicle & Road condition
Accidents & Prevention x Emergency situation control
Crime x
Passenger's perception of & satisfaction with safety level
Emergency situation control x Driver's level of capability
Passenger's perception of & satisfaction with safety level x
Vehicle & Road condition
Accidents & Prevention x
Passenger's perception of & satisfaction with safety level
Crime x Driver's level of capability
Emergency situation control x Vehicle & Road condition
Accidents & Prevention x Driver's level of capability
Crime x Vehicle & Road condition
Accidents & Prevention x Vehicle & Road condition
8. Government & Community Involvement
Indicator 9 8 7 6 5 4 3 2 1 2 3 4 5 6 7 8 9 Indicator
Government Interoperability x Community Involvement
9. Mobility (Travel & Transfer)
Indicator 9 8 7 6 5 4 3 2 1 2 3 4 5 6 7 8 9 Indicator
Time x Speed (= Distance / Time)
Speed (= Distance / Time) x Distance
Distance x Modal split/ Transit integration
Modal split/ Transit integration x General mobility
Time x Distance
Speed (= Distance / Time) x Modal split/ Transit integration
Distance x General mobility
Time x Modal split/ Transit integration
Speed (= Distance / Time) x General mobility
Time x General mobility
10. Financial Perspective
Indicator 9 8 7 6 5 4 3 2 1 2 3 4 5 6 7 8 9 Indicator
Affordability to customer x
Costs to (private) company (Financial feasibility)
Governmental costs (Financial feasibility) x Financial security
Costs to (private) company (Financial feasibility) x
Governmental costs (Financial feasibility)
Affordability to customer x Governmental costs (Financial feasibility)
Costs to (private) company (Financial feasibility) x
Financial security
Affordability to customer x Financial security
11. Socio-economic
Indicator 9 8 7 6 5 4 3 2 1 2 3 4 5 6 7 8 9 Indicator
Socio-economic development x Social development
Social development x Land development
Socio-economic development x Land development
12. (Economic) Productivity of the system
Indicator 9 8 7 6 5 4 3 2 1 2 3 4 5 6 7 8 9 Indicator
Demand x Capacity
Capacity x Maintenance
Maintenance x Information systems / Travel information
Information systems / Travel information x Way-finding information
Way-finding information x Overall efficiency
Demand x Maintenance
Capacity x Information systems / Travel information
Maintenance x Way-finding information
Information systems / Travel information x Overall efficiency
Demand x Information systems / Travel information
Stellenbosch University https://scholar.sun.ac.za

241
Capacity x Way-finding information
Maintenance x Overall efficiency
Demand x Way-finding information
Capacity x Overall efficiency
Demand x Overall efficiency
Stellenbosch University https://scholar.sun.ac.za
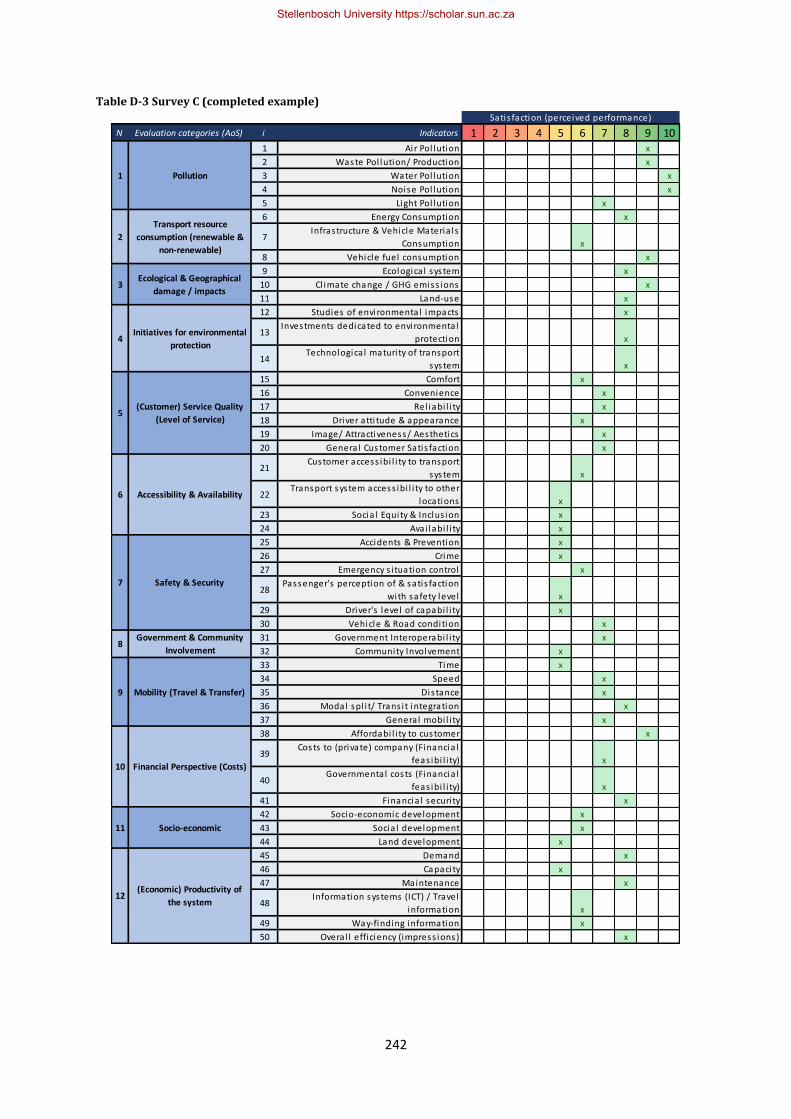
242
Table D-3 Survey C (completed example)
N Evaluation categories (AoS) i Indicators 1 2 3 4 5 6 7 8 9 101 Air Pol lution x
2 Waste Pol lution/ Production x
3 Water Pol lution x
4 Noise Pol lution x
5 Light Pol lution x
6 Energy Consumption x
7Infrastructure & Vehicle Materia ls
Consumption x
8 Vehicle fuel consumption x
9 Ecologica l system x
10 Cl imate change / GHG emiss ions x
11 Land-use x
12 Studies of environmental impacts x
13Investments dedicated to environmental
protection x
14Technologica l maturi ty of transport
system x
15 Comfort x
16 Convenience x
17 Rel iabi l i ty x
18 Driver atti tude & appearance x
19 Image/ Attractiveness/ Aesthetics x
20 Genera l Customer Satis faction x
21Customer access ibi l i ty to transport
system x
22Transport system access ibi l i ty to other
locations x
23 Socia l Equity & Inclus ion x
24 Avai labi l i ty x
25 Accidents & Prevention x
26 Crime x
27 Emergency s i tuation control x
28Passenger's perception of & satis faction
with safety level x
29 Driver's level of capabi l i ty x
30 Vehicle & Road condition x
31 Government Interoperabi l i ty x
32 Community Involvement x
33 Time x
34 Speed x
35 Distance x
36 Modal spl i t/ Trans i t integration x
37 Genera l mobi l i ty x
38 Affordabi l i ty to customer x
39Costs to (private) company (Financia l
feas ibi l i ty) x
40Governmental costs (Financia l
feas ibi l i ty) x
41 Financia l securi ty x
42 Socio-economic development x
43 Socia l development x
44 Land development x
45 Demand x
46 Capaci ty x
47 Maintenance x
48Information systems (ICT) / Travel
information x
49 Way-finding information x
50 Overa l l efficiency (impress ions) x
Initiatives for environmental
protection
3Ecological & Geographical
damage / impacts
12(Economic) Productivity of
the system
10 Financial Perspective (Costs)
8Government & Community
Involvement
1 Pollution
Satis faction (perceived performance)
11 Socio-economic
9 Mobility (Travel & Transfer)
7 Safety & Security
5(Customer) Service Quality
(Level of Service)
2
Transport resource
consumption (renewable &
non-renewable)
6 Accessibility & Availability
4
Stellenbosch University https://scholar.sun.ac.za
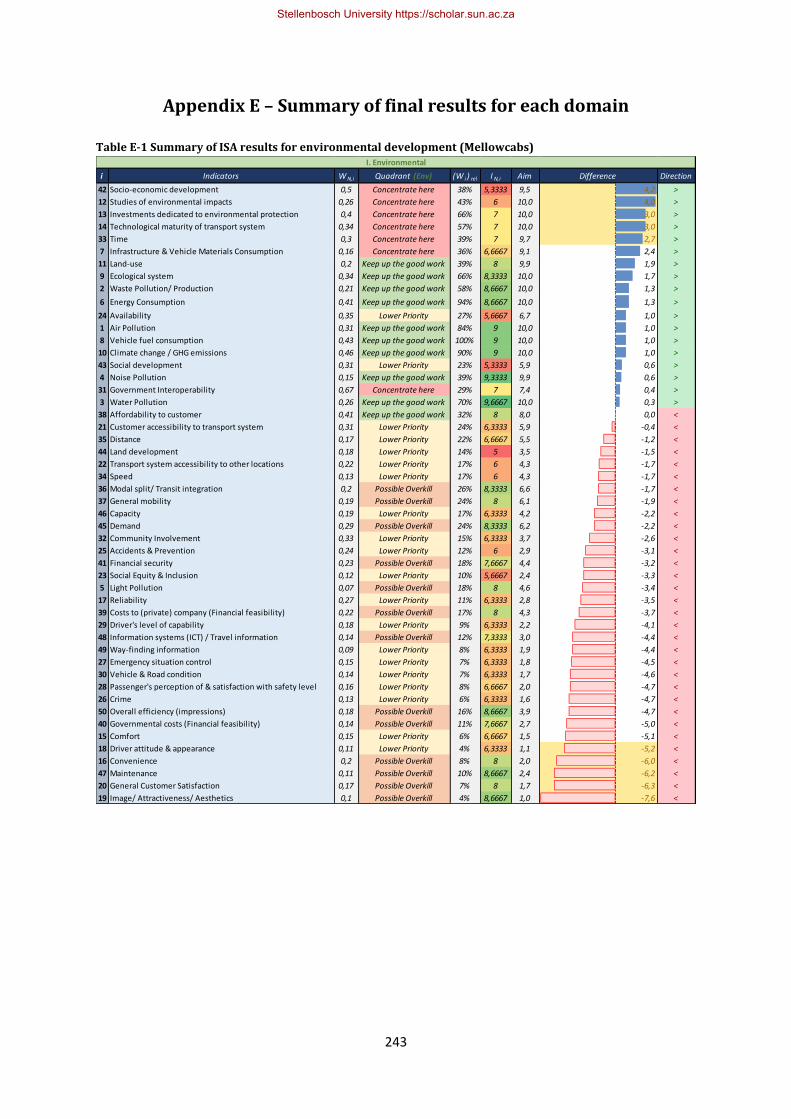
243
Appendix E – Summary of final results for each domain Table E-1 Summary of ISA results for environmental development (Mellowcabs)
i Indicators W N,i Quadrant (Env) (W i ) rel I N,i Aim Difference Direction
42 Socio-economic development 0,5 Concentrate here 38% 5,3333 9,5 4,2 >
12 Studies of environmental impacts 0,26 Concentrate here 43% 6 10,0 4,0 >
13 Investments dedicated to environmental protection 0,4 Concentrate here 66% 7 10,0 3,0 >
14 Technological maturity of transport system 0,34 Concentrate here 57% 7 10,0 3,0 >
33 Time 0,3 Concentrate here 39% 7 9,7 2,7 >
7 Infrastructure & Vehicle Materials Consumption 0,16 Concentrate here 36% 6,6667 9,1 2,4 >
11 Land-use 0,2 Keep up the good work 39% 8 9,9 1,9 >
9 Ecological system 0,34 Keep up the good work 66% 8,3333 10,0 1,7 >
2 Waste Pollution/ Production 0,21 Keep up the good work 58% 8,6667 10,0 1,3 >
6 Energy Consumption 0,41 Keep up the good work 94% 8,6667 10,0 1,3 >
24 Availability 0,35 Lower Priority 27% 5,6667 6,7 1,0 >
1 Air Pollution 0,31 Keep up the good work 84% 9 10,0 1,0 >
8 Vehicle fuel consumption 0,43 Keep up the good work 100% 9 10,0 1,0 >
10 Climate change / GHG emissions 0,46 Keep up the good work 90% 9 10,0 1,0 >
43 Social development 0,31 Lower Priority 23% 5,3333 5,9 0,6 >
4 Noise Pollution 0,15 Keep up the good work 39% 9,3333 9,9 0,6 >
31 Government Interoperability 0,67 Concentrate here 29% 7 7,4 0,4 >
3 Water Pollution 0,26 Keep up the good work 70% 9,6667 10,0 0,3 >
38 Affordability to customer 0,41 Keep up the good work 32% 8 8,0 0,0 <
21 Customer accessibility to transport system 0,31 Lower Priority 24% 6,3333 5,9 -0,4 <
35 Distance 0,17 Lower Priority 22% 6,6667 5,5 -1,2 <
44 Land development 0,18 Lower Priority 14% 5 3,5 -1,5 <
22 Transport system accessibility to other locations 0,22 Lower Priority 17% 6 4,3 -1,7 <
34 Speed 0,13 Lower Priority 17% 6 4,3 -1,7 <
36 Modal split/ Transit integration 0,2 Possible Overkill 26% 8,3333 6,6 -1,7 <
37 General mobility 0,19 Possible Overkill 24% 8 6,1 -1,9 <
46 Capacity 0,19 Lower Priority 17% 6,3333 4,2 -2,2 <
45 Demand 0,29 Possible Overkill 24% 8,3333 6,2 -2,2 <
32 Community Involvement 0,33 Lower Priority 15% 6,3333 3,7 -2,6 <
25 Accidents & Prevention 0,24 Lower Priority 12% 6 2,9 -3,1 <
41 Financial security 0,23 Possible Overkill 18% 7,6667 4,4 -3,2 <
23 Social Equity & Inclusion 0,12 Lower Priority 10% 5,6667 2,4 -3,3 <
5 Light Pollution 0,07 Possible Overkill 18% 8 4,6 -3,4 <
17 Reliability 0,27 Lower Priority 11% 6,3333 2,8 -3,5 <
39 Costs to (private) company (Financial feasibility) 0,22 Possible Overkill 17% 8 4,3 -3,7 <
29 Driver's level of capability 0,18 Lower Priority 9% 6,3333 2,2 -4,1 <
48 Information systems (ICT) / Travel information 0,14 Possible Overkill 12% 7,3333 3,0 -4,4 <
49 Way-finding information 0,09 Lower Priority 8% 6,3333 1,9 -4,4 <
27 Emergency situation control 0,15 Lower Priority 7% 6,3333 1,8 -4,5 <
30 Vehicle & Road condition 0,14 Lower Priority 7% 6,3333 1,7 -4,6 <
28 Passenger's perception of & satisfaction with safety level 0,16 Lower Priority 8% 6,6667 2,0 -4,7 <
26 Crime 0,13 Lower Priority 6% 6,3333 1,6 -4,7 <
50 Overall efficiency (impressions) 0,18 Possible Overkill 16% 8,6667 3,9 -4,7 <
40 Governmental costs (Financial feasibility) 0,14 Possible Overkill 11% 7,6667 2,7 -5,0 <
15 Comfort 0,15 Lower Priority 6% 6,6667 1,5 -5,1 <
18 Driver attitude & appearance 0,11 Lower Priority 4% 6,3333 1,1 -5,2 <
16 Convenience 0,2 Possible Overkill 8% 8 2,0 -6,0 <
47 Maintenance 0,11 Possible Overkill 10% 8,6667 2,4 -6,2 <
20 General Customer Satisfaction 0,17 Possible Overkill 7% 8 1,7 -6,3 <
19 Image/ Attractiveness/ Aesthetics 0,1 Possible Overkill 4% 8,6667 1,0 -7,6 <
I. Environmental
Stellenbosch University https://scholar.sun.ac.za

244
Table E-2 Summary of ISA results for social development (Mellowcabs)
i Indicators W N,i Quadrant (Soc) (W i ) rel I N,i Aim Difference Direction
42 Socio-economic development 0,5 Concentrate here 59% 5,3333 10,0 4,7 >
24 Availability 0,35 Concentrate here 100% 5,6667 10,0 4,3 >
22 Transport system accessibility to other locations 0,22 Concentrate here 64% 6 10,0 4,0 >
25 Accidents & Prevention 0,24 Concentrate here 57% 6 10,0 4,0 >
17 Reliability 0,27 Concentrate here 70% 6,3333 10,0 3,7 >
21 Customer accessibility to transport system 0,31 Concentrate here 89% 6,3333 10,0 3,7 >
31 Government Interoperability 0,67 Concentrate here 93% 7 10,0 3,0 >
33 Time 0,3 Concentrate here 59% 7 10,0 3,0 >
32 Community Involvement 0,33 Concentrate here 47% 6,3333 8,4 2,0 >
38 Affordability to customer 0,41 Keep up the good work 61% 8 10,0 2,0 >
29 Driver's level of capability 0,18 Concentrate here 43% 6,3333 7,7 1,4 >
43 Social development 0,31 Lower Priority 37% 5,3333 6,6 1,2 >
16 Convenience 0,2 Keep up the good work 50% 8 9,0 1,0 >
23 Social Equity & Inclusion 0,12 Lower Priority 36% 5,6667 6,5 0,8 >
28 Passenger's perception of & satisfaction with safety level 0,16 Lower Priority 39% 6,6667 7,0 0,4 >
15 Comfort 0,15 Lower Priority 39% 6,6667 7,0 0,3 >
45 Demand 0,29 Keep up the good work 48% 8,3333 8,5 0,2 >
27 Emergency situation control 0,15 Lower Priority 35% 6,3333 6,3 0,0 <
20 General Customer Satisfaction 0,17 Keep up the good work 44% 8 7,9 -0,1 <
8 Vehicle fuel consumption 0,43 Keep up the good work 49% 9 8,9 -0,1 <
10 Climate change / GHG emissions 0,46 Keep up the good work 49% 9 8,8 -0,2 <
30 Vehicle & Road condition 0,14 Lower Priority 34% 6,3333 6,1 -0,3 <
6 Energy Consumption 0,41 Keep up the good work 47% 8,6667 8,4 -0,3 <
13 Investments dedicated to environmental protection 0,4 Lower Priority 37% 7 6,6 -0,4 <
1 Air Pollution 0,31 Keep up the good work 48% 9 8,5 -0,5 <
46 Capacity 0,19 Lower Priority 32% 6,3333 5,8 -0,6 <
26 Crime 0,13 Lower Priority 32% 6,3333 5,6 -0,7 <
35 Distance 0,17 Lower Priority 33% 6,6667 5,9 -0,7 <
36 Modal split/ Transit integration 0,2 Possible Overkill 40% 8,3333 7,2 -1,1 <
44 Land development 0,18 Lower Priority 21% 5 3,9 -1,1 <
37 General mobility 0,19 Possible Overkill 37% 8 6,7 -1,3 <
34 Speed 0,13 Lower Priority 26% 6 4,7 -1,3 <
14 Technological maturity of transport system 0,34 Lower Priority 32% 7 5,7 -1,3 <
18 Driver attitude & appearance 0,11 Lower Priority 28% 6,3333 5,0 -1,4 <
41 Financial security 0,23 Possible Overkill 34% 7,6667 6,1 -1,6 <
12 Studies of environmental impacts 0,26 Lower Priority 24% 6 4,2 -1,8 <
9 Ecological system 0,34 Possible Overkill 36% 8,3333 6,5 -1,9 <
39 Costs to (private) company (Financial feasibility) 0,22 Possible Overkill 33% 8 5,9 -2,1 <
3 Water Pollution 0,26 Possible Overkill 39% 9,6667 7,1 -2,6 <
2 Waste Pollution/ Production 0,21 Possible Overkill 33% 8,6667 5,8 -2,8 <
48 Information systems (ICT) / Travel information 0,14 Possible Overkill 23% 7,3333 4,1 -3,2 <
50 Overall efficiency (impressions) 0,18 Possible Overkill 30% 8,6667 5,4 -3,2 <
7 Infrastructure & Vehicle Materials Consumption 0,16 Lower Priority 18% 6,6667 3,2 -3,5 <
49 Way-finding information 0,09 Lower Priority 15% 6,3333 2,7 -3,7 <
19 Image/ Attractiveness/ Aesthetics 0,1 Possible Overkill 26% 8,6667 4,7 -4,0 <
40 Governmental costs (Financial feasibility) 0,14 Possible Overkill 20% 7,6667 3,7 -4,0 <
11 Land-use 0,2 Possible Overkill 22% 8 3,9 -4,1 <
47 Maintenance 0,11 Possible Overkill 19% 8,6667 3,4 -5,3 <
4 Noise Pollution 0,15 Possible Overkill 22% 9,3333 4,0 -5,4 <
5 Light Pollution 0,07 Possible Overkill 10% 8 1,9 -6,1 <
II. Social
Stellenbosch University https://scholar.sun.ac.za
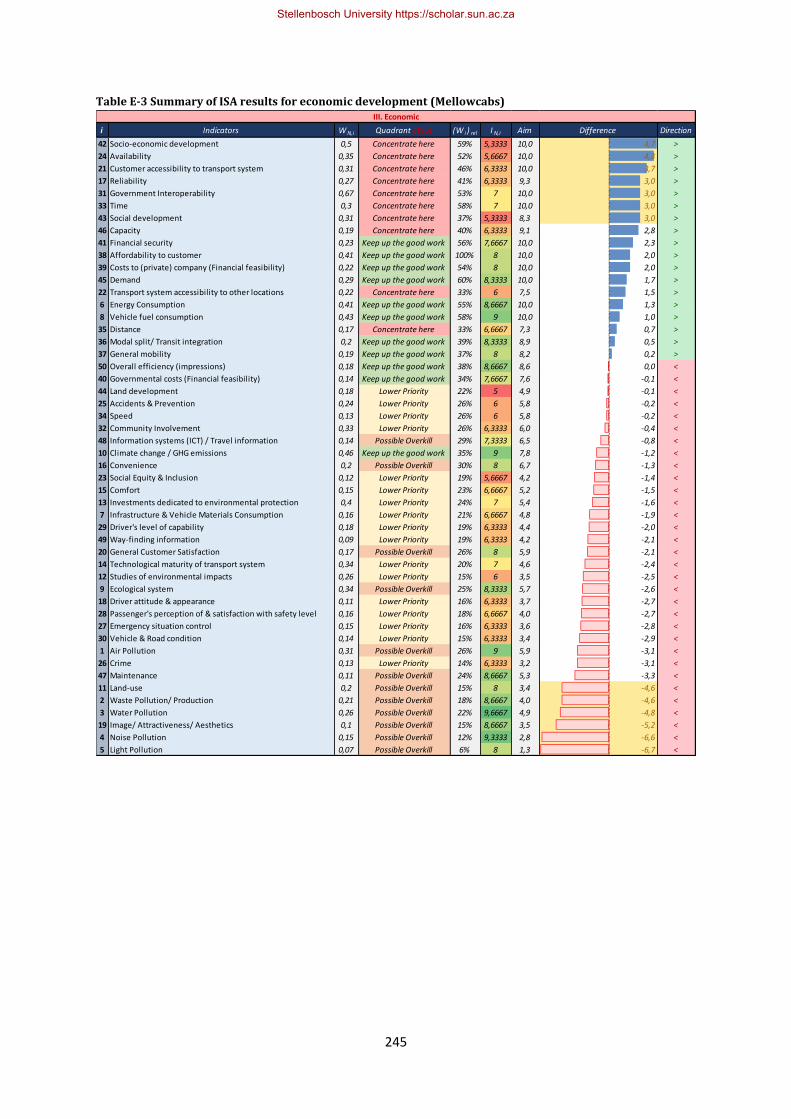
245
Table E-3 Summary of ISA results for economic development (Mellowcabs)
i Indicators W N,i Quadrant (Eco) (W i ) rel I N,i Aim Difference Direction
42 Socio-economic development 0,5 Concentrate here 59% 5,3333 10,0 4,7 >
24 Availability 0,35 Concentrate here 52% 5,6667 10,0 4,3 >
21 Customer accessibility to transport system 0,31 Concentrate here 46% 6,3333 10,0 3,7 >
17 Reliability 0,27 Concentrate here 41% 6,3333 9,3 3,0 >
31 Government Interoperability 0,67 Concentrate here 53% 7 10,0 3,0 >
33 Time 0,3 Concentrate here 58% 7 10,0 3,0 >
43 Social development 0,31 Concentrate here 37% 5,3333 8,3 3,0 >
46 Capacity 0,19 Concentrate here 40% 6,3333 9,1 2,8 >
41 Financial security 0,23 Keep up the good work 56% 7,6667 10,0 2,3 >
38 Affordability to customer 0,41 Keep up the good work 100% 8 10,0 2,0 >
39 Costs to (private) company (Financial feasibility) 0,22 Keep up the good work 54% 8 10,0 2,0 >
45 Demand 0,29 Keep up the good work 60% 8,3333 10,0 1,7 >
22 Transport system accessibility to other locations 0,22 Concentrate here 33% 6 7,5 1,5 >
6 Energy Consumption 0,41 Keep up the good work 55% 8,6667 10,0 1,3 >
8 Vehicle fuel consumption 0,43 Keep up the good work 58% 9 10,0 1,0 >
35 Distance 0,17 Concentrate here 33% 6,6667 7,3 0,7 >
36 Modal split/ Transit integration 0,2 Keep up the good work 39% 8,3333 8,9 0,5 >
37 General mobility 0,19 Keep up the good work 37% 8 8,2 0,2 >
50 Overall efficiency (impressions) 0,18 Keep up the good work 38% 8,6667 8,6 0,0 <
40 Governmental costs (Financial feasibility) 0,14 Keep up the good work 34% 7,6667 7,6 -0,1 <
44 Land development 0,18 Lower Priority 22% 5 4,9 -0,1 <
25 Accidents & Prevention 0,24 Lower Priority 26% 6 5,8 -0,2 <
34 Speed 0,13 Lower Priority 26% 6 5,8 -0,2 <
32 Community Involvement 0,33 Lower Priority 26% 6,3333 6,0 -0,4 <
48 Information systems (ICT) / Travel information 0,14 Possible Overkill 29% 7,3333 6,5 -0,8 <
10 Climate change / GHG emissions 0,46 Keep up the good work 35% 9 7,8 -1,2 <
16 Convenience 0,2 Possible Overkill 30% 8 6,7 -1,3 <
23 Social Equity & Inclusion 0,12 Lower Priority 19% 5,6667 4,2 -1,4 <
15 Comfort 0,15 Lower Priority 23% 6,6667 5,2 -1,5 <
13 Investments dedicated to environmental protection 0,4 Lower Priority 24% 7 5,4 -1,6 <
7 Infrastructure & Vehicle Materials Consumption 0,16 Lower Priority 21% 6,6667 4,8 -1,9 <
29 Driver's level of capability 0,18 Lower Priority 19% 6,3333 4,4 -2,0 <
49 Way-finding information 0,09 Lower Priority 19% 6,3333 4,2 -2,1 <
20 General Customer Satisfaction 0,17 Possible Overkill 26% 8 5,9 -2,1 <
14 Technological maturity of transport system 0,34 Lower Priority 20% 7 4,6 -2,4 <
12 Studies of environmental impacts 0,26 Lower Priority 15% 6 3,5 -2,5 <
9 Ecological system 0,34 Possible Overkill 25% 8,3333 5,7 -2,6 <
18 Driver attitude & appearance 0,11 Lower Priority 16% 6,3333 3,7 -2,7 <
28 Passenger's perception of & satisfaction with safety level 0,16 Lower Priority 18% 6,6667 4,0 -2,7 <
27 Emergency situation control 0,15 Lower Priority 16% 6,3333 3,6 -2,8 <
30 Vehicle & Road condition 0,14 Lower Priority 15% 6,3333 3,4 -2,9 <
1 Air Pollution 0,31 Possible Overkill 26% 9 5,9 -3,1 <
26 Crime 0,13 Lower Priority 14% 6,3333 3,2 -3,1 <
47 Maintenance 0,11 Possible Overkill 24% 8,6667 5,3 -3,3 <
11 Land-use 0,2 Possible Overkill 15% 8 3,4 -4,6 <
2 Waste Pollution/ Production 0,21 Possible Overkill 18% 8,6667 4,0 -4,6 <
3 Water Pollution 0,26 Possible Overkill 22% 9,6667 4,9 -4,8 <
19 Image/ Attractiveness/ Aesthetics 0,1 Possible Overkill 15% 8,6667 3,5 -5,2 <
4 Noise Pollution 0,15 Possible Overkill 12% 9,3333 2,8 -6,6 <
5 Light Pollution 0,07 Possible Overkill 6% 8 1,3 -6,7 <
III. Economic
Stellenbosch University https://scholar.sun.ac.za
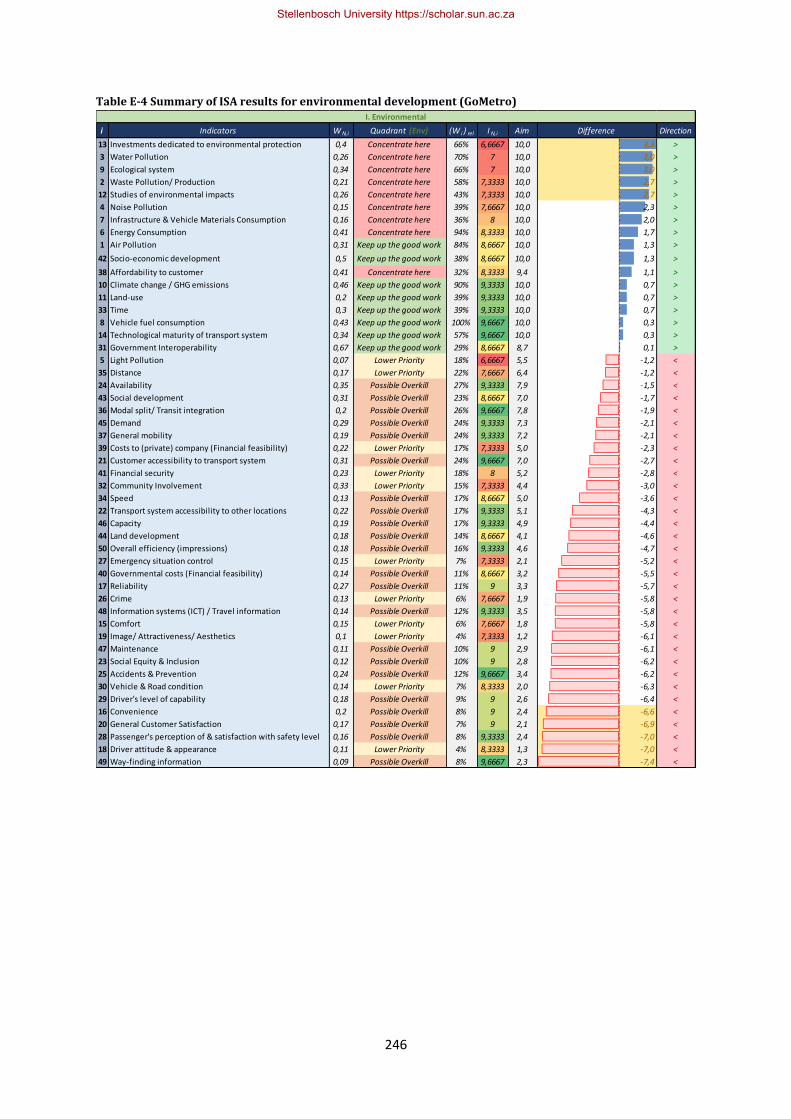
246
Table E-4 Summary of ISA results for environmental development (GoMetro)
i Indicators W N,i Quadrant (Env) (W i ) rel I N,i Aim Difference Direction
13 Investments dedicated to environmental protection 0,4 Concentrate here 66% 6,6667 10,0 3,3 >
3 Water Pollution 0,26 Concentrate here 70% 7 10,0 3,0 >
9 Ecological system 0,34 Concentrate here 66% 7 10,0 3,0 >
2 Waste Pollution/ Production 0,21 Concentrate here 58% 7,3333 10,0 2,7 >
12 Studies of environmental impacts 0,26 Concentrate here 43% 7,3333 10,0 2,7 >
4 Noise Pollution 0,15 Concentrate here 39% 7,6667 10,0 2,3 >
7 Infrastructure & Vehicle Materials Consumption 0,16 Concentrate here 36% 8 10,0 2,0 >
6 Energy Consumption 0,41 Concentrate here 94% 8,3333 10,0 1,7 >
1 Air Pollution 0,31 Keep up the good work 84% 8,6667 10,0 1,3 >
42 Socio-economic development 0,5 Keep up the good work 38% 8,6667 10,0 1,3 >
38 Affordability to customer 0,41 Concentrate here 32% 8,3333 9,4 1,1 >
10 Climate change / GHG emissions 0,46 Keep up the good work 90% 9,3333 10,0 0,7 >
11 Land-use 0,2 Keep up the good work 39% 9,3333 10,0 0,7 >
33 Time 0,3 Keep up the good work 39% 9,3333 10,0 0,7 >
8 Vehicle fuel consumption 0,43 Keep up the good work 100% 9,6667 10,0 0,3 >
14 Technological maturity of transport system 0,34 Keep up the good work 57% 9,6667 10,0 0,3 >
31 Government Interoperability 0,67 Keep up the good work 29% 8,6667 8,7 0,1 >
5 Light Pollution 0,07 Lower Priority 18% 6,6667 5,5 -1,2 <
35 Distance 0,17 Lower Priority 22% 7,6667 6,4 -1,2 <
24 Availability 0,35 Possible Overkill 27% 9,3333 7,9 -1,5 <
43 Social development 0,31 Possible Overkill 23% 8,6667 7,0 -1,7 <
36 Modal split/ Transit integration 0,2 Possible Overkill 26% 9,6667 7,8 -1,9 <
45 Demand 0,29 Possible Overkill 24% 9,3333 7,3 -2,1 <
37 General mobility 0,19 Possible Overkill 24% 9,3333 7,2 -2,1 <
39 Costs to (private) company (Financial feasibility) 0,22 Lower Priority 17% 7,3333 5,0 -2,3 <
21 Customer accessibility to transport system 0,31 Possible Overkill 24% 9,6667 7,0 -2,7 <
41 Financial security 0,23 Lower Priority 18% 8 5,2 -2,8 <
32 Community Involvement 0,33 Lower Priority 15% 7,3333 4,4 -3,0 <
34 Speed 0,13 Possible Overkill 17% 8,6667 5,0 -3,6 <
22 Transport system accessibility to other locations 0,22 Possible Overkill 17% 9,3333 5,1 -4,3 <
46 Capacity 0,19 Possible Overkill 17% 9,3333 4,9 -4,4 <
44 Land development 0,18 Possible Overkill 14% 8,6667 4,1 -4,6 <
50 Overall efficiency (impressions) 0,18 Possible Overkill 16% 9,3333 4,6 -4,7 <
27 Emergency situation control 0,15 Lower Priority 7% 7,3333 2,1 -5,2 <
40 Governmental costs (Financial feasibility) 0,14 Possible Overkill 11% 8,6667 3,2 -5,5 <
17 Reliability 0,27 Possible Overkill 11% 9 3,3 -5,7 <
26 Crime 0,13 Lower Priority 6% 7,6667 1,9 -5,8 <
48 Information systems (ICT) / Travel information 0,14 Possible Overkill 12% 9,3333 3,5 -5,8 <
15 Comfort 0,15 Lower Priority 6% 7,6667 1,8 -5,8 <
19 Image/ Attractiveness/ Aesthetics 0,1 Lower Priority 4% 7,3333 1,2 -6,1 <
47 Maintenance 0,11 Possible Overkill 10% 9 2,9 -6,1 <
23 Social Equity & Inclusion 0,12 Possible Overkill 10% 9 2,8 -6,2 <
25 Accidents & Prevention 0,24 Possible Overkill 12% 9,6667 3,4 -6,2 <
30 Vehicle & Road condition 0,14 Lower Priority 7% 8,3333 2,0 -6,3 <
29 Driver's level of capability 0,18 Possible Overkill 9% 9 2,6 -6,4 <
16 Convenience 0,2 Possible Overkill 8% 9 2,4 -6,6 <
20 General Customer Satisfaction 0,17 Possible Overkill 7% 9 2,1 -6,9 <
28 Passenger's perception of & satisfaction with safety level 0,16 Possible Overkill 8% 9,3333 2,4 -7,0 <
18 Driver attitude & appearance 0,11 Lower Priority 4% 8,3333 1,3 -7,0 <
49 Way-finding information 0,09 Possible Overkill 8% 9,6667 2,3 -7,4 <
I. Environmental
Stellenbosch University https://scholar.sun.ac.za
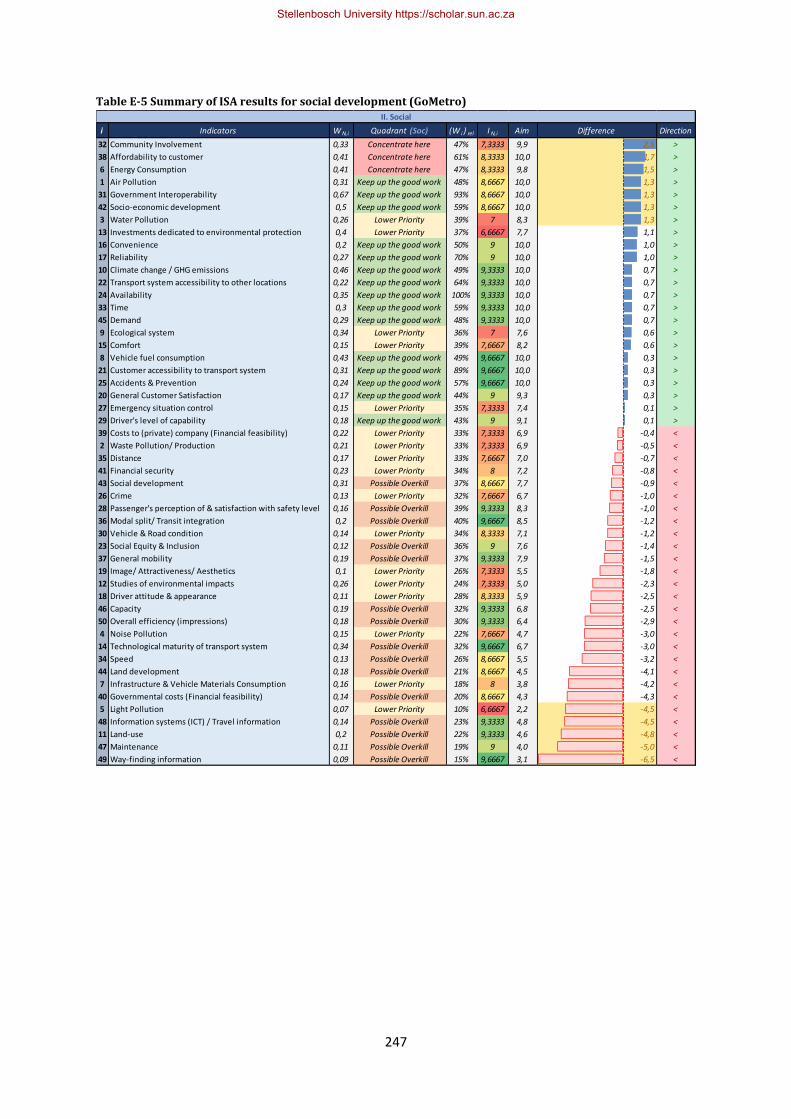
247
Table E-5 Summary of ISA results for social development (GoMetro)
i Indicators W N,i Quadrant (Soc) (W i ) rel I N,i Aim Difference Direction
32 Community Involvement 0,33 Concentrate here 47% 7,3333 9,9 2,5 >
38 Affordability to customer 0,41 Concentrate here 61% 8,3333 10,0 1,7 >
6 Energy Consumption 0,41 Concentrate here 47% 8,3333 9,8 1,5 >
1 Air Pollution 0,31 Keep up the good work 48% 8,6667 10,0 1,3 >
31 Government Interoperability 0,67 Keep up the good work 93% 8,6667 10,0 1,3 >
42 Socio-economic development 0,5 Keep up the good work 59% 8,6667 10,0 1,3 >
3 Water Pollution 0,26 Lower Priority 39% 7 8,3 1,3 >
13 Investments dedicated to environmental protection 0,4 Lower Priority 37% 6,6667 7,7 1,1 >
16 Convenience 0,2 Keep up the good work 50% 9 10,0 1,0 >
17 Reliability 0,27 Keep up the good work 70% 9 10,0 1,0 >
10 Climate change / GHG emissions 0,46 Keep up the good work 49% 9,3333 10,0 0,7 >
22 Transport system accessibility to other locations 0,22 Keep up the good work 64% 9,3333 10,0 0,7 >
24 Availability 0,35 Keep up the good work 100% 9,3333 10,0 0,7 >
33 Time 0,3 Keep up the good work 59% 9,3333 10,0 0,7 >
45 Demand 0,29 Keep up the good work 48% 9,3333 10,0 0,7 >
9 Ecological system 0,34 Lower Priority 36% 7 7,6 0,6 >
15 Comfort 0,15 Lower Priority 39% 7,6667 8,2 0,6 >
8 Vehicle fuel consumption 0,43 Keep up the good work 49% 9,6667 10,0 0,3 >
21 Customer accessibility to transport system 0,31 Keep up the good work 89% 9,6667 10,0 0,3 >
25 Accidents & Prevention 0,24 Keep up the good work 57% 9,6667 10,0 0,3 >
20 General Customer Satisfaction 0,17 Keep up the good work 44% 9 9,3 0,3 >
27 Emergency situation control 0,15 Lower Priority 35% 7,3333 7,4 0,1 >
29 Driver's level of capability 0,18 Keep up the good work 43% 9 9,1 0,1 >
39 Costs to (private) company (Financial feasibility) 0,22 Lower Priority 33% 7,3333 6,9 -0,4 <
2 Waste Pollution/ Production 0,21 Lower Priority 33% 7,3333 6,9 -0,5 <
35 Distance 0,17 Lower Priority 33% 7,6667 7,0 -0,7 <
41 Financial security 0,23 Lower Priority 34% 8 7,2 -0,8 <
43 Social development 0,31 Possible Overkill 37% 8,6667 7,7 -0,9 <
26 Crime 0,13 Lower Priority 32% 7,6667 6,7 -1,0 <
28 Passenger's perception of & satisfaction with safety level 0,16 Possible Overkill 39% 9,3333 8,3 -1,0 <
36 Modal split/ Transit integration 0,2 Possible Overkill 40% 9,6667 8,5 -1,2 <
30 Vehicle & Road condition 0,14 Lower Priority 34% 8,3333 7,1 -1,2 <
23 Social Equity & Inclusion 0,12 Possible Overkill 36% 9 7,6 -1,4 <
37 General mobility 0,19 Possible Overkill 37% 9,3333 7,9 -1,5 <
19 Image/ Attractiveness/ Aesthetics 0,1 Lower Priority 26% 7,3333 5,5 -1,8 <
12 Studies of environmental impacts 0,26 Lower Priority 24% 7,3333 5,0 -2,3 <
18 Driver attitude & appearance 0,11 Lower Priority 28% 8,3333 5,9 -2,5 <
46 Capacity 0,19 Possible Overkill 32% 9,3333 6,8 -2,5 <
50 Overall efficiency (impressions) 0,18 Possible Overkill 30% 9,3333 6,4 -2,9 <
4 Noise Pollution 0,15 Lower Priority 22% 7,6667 4,7 -3,0 <
14 Technological maturity of transport system 0,34 Possible Overkill 32% 9,6667 6,7 -3,0 <
34 Speed 0,13 Possible Overkill 26% 8,6667 5,5 -3,2 <
44 Land development 0,18 Possible Overkill 21% 8,6667 4,5 -4,1 <
7 Infrastructure & Vehicle Materials Consumption 0,16 Lower Priority 18% 8 3,8 -4,2 <
40 Governmental costs (Financial feasibility) 0,14 Possible Overkill 20% 8,6667 4,3 -4,3 <
5 Light Pollution 0,07 Lower Priority 10% 6,6667 2,2 -4,5 <
48 Information systems (ICT) / Travel information 0,14 Possible Overkill 23% 9,3333 4,8 -4,5 <
11 Land-use 0,2 Possible Overkill 22% 9,3333 4,6 -4,8 <
47 Maintenance 0,11 Possible Overkill 19% 9 4,0 -5,0 <
49 Way-finding information 0,09 Possible Overkill 15% 9,6667 3,1 -6,5 <
II. Social
Stellenbosch University https://scholar.sun.ac.za
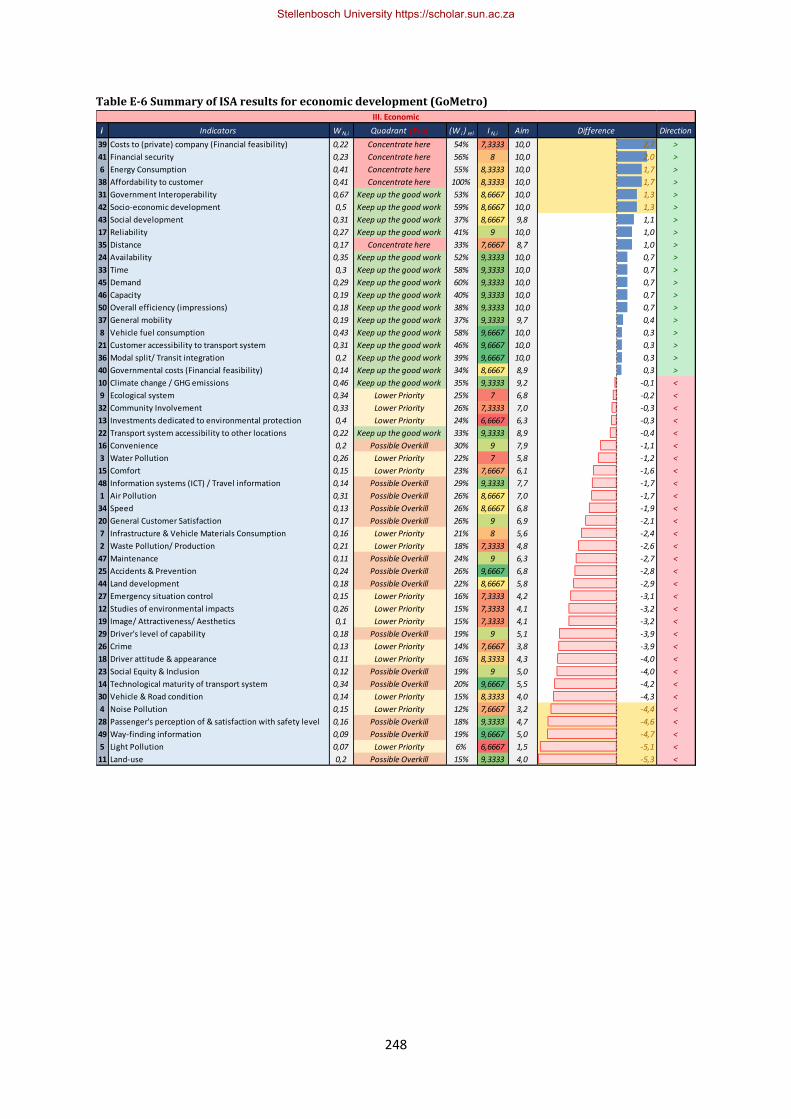
248
Table E-6 Summary of ISA results for economic development (GoMetro)
i Indicators W N,i Quadrant (Eco) (W i ) rel I N,i Aim Difference Direction
39 Costs to (private) company (Financial feasibility) 0,22 Concentrate here 54% 7,3333 10,0 2,7 >
41 Financial security 0,23 Concentrate here 56% 8 10,0 2,0 >
6 Energy Consumption 0,41 Concentrate here 55% 8,3333 10,0 1,7 >
38 Affordability to customer 0,41 Concentrate here 100% 8,3333 10,0 1,7 >
31 Government Interoperability 0,67 Keep up the good work 53% 8,6667 10,0 1,3 >
42 Socio-economic development 0,5 Keep up the good work 59% 8,6667 10,0 1,3 >
43 Social development 0,31 Keep up the good work 37% 8,6667 9,8 1,1 >
17 Reliability 0,27 Keep up the good work 41% 9 10,0 1,0 >
35 Distance 0,17 Concentrate here 33% 7,6667 8,7 1,0 >
24 Availability 0,35 Keep up the good work 52% 9,3333 10,0 0,7 >
33 Time 0,3 Keep up the good work 58% 9,3333 10,0 0,7 >
45 Demand 0,29 Keep up the good work 60% 9,3333 10,0 0,7 >
46 Capacity 0,19 Keep up the good work 40% 9,3333 10,0 0,7 >
50 Overall efficiency (impressions) 0,18 Keep up the good work 38% 9,3333 10,0 0,7 >
37 General mobility 0,19 Keep up the good work 37% 9,3333 9,7 0,4 >
8 Vehicle fuel consumption 0,43 Keep up the good work 58% 9,6667 10,0 0,3 >
21 Customer accessibility to transport system 0,31 Keep up the good work 46% 9,6667 10,0 0,3 >
36 Modal split/ Transit integration 0,2 Keep up the good work 39% 9,6667 10,0 0,3 >
40 Governmental costs (Financial feasibility) 0,14 Keep up the good work 34% 8,6667 8,9 0,3 >
10 Climate change / GHG emissions 0,46 Keep up the good work 35% 9,3333 9,2 -0,1 <
9 Ecological system 0,34 Lower Priority 25% 7 6,8 -0,2 <
32 Community Involvement 0,33 Lower Priority 26% 7,3333 7,0 -0,3 <
13 Investments dedicated to environmental protection 0,4 Lower Priority 24% 6,6667 6,3 -0,3 <
22 Transport system accessibility to other locations 0,22 Keep up the good work 33% 9,3333 8,9 -0,4 <
16 Convenience 0,2 Possible Overkill 30% 9 7,9 -1,1 <
3 Water Pollution 0,26 Lower Priority 22% 7 5,8 -1,2 <
15 Comfort 0,15 Lower Priority 23% 7,6667 6,1 -1,6 <
48 Information systems (ICT) / Travel information 0,14 Possible Overkill 29% 9,3333 7,7 -1,7 <
1 Air Pollution 0,31 Possible Overkill 26% 8,6667 7,0 -1,7 <
34 Speed 0,13 Possible Overkill 26% 8,6667 6,8 -1,9 <
20 General Customer Satisfaction 0,17 Possible Overkill 26% 9 6,9 -2,1 <
7 Infrastructure & Vehicle Materials Consumption 0,16 Lower Priority 21% 8 5,6 -2,4 <
2 Waste Pollution/ Production 0,21 Lower Priority 18% 7,3333 4,8 -2,6 <
47 Maintenance 0,11 Possible Overkill 24% 9 6,3 -2,7 <
25 Accidents & Prevention 0,24 Possible Overkill 26% 9,6667 6,8 -2,8 <
44 Land development 0,18 Possible Overkill 22% 8,6667 5,8 -2,9 <
27 Emergency situation control 0,15 Lower Priority 16% 7,3333 4,2 -3,1 <
12 Studies of environmental impacts 0,26 Lower Priority 15% 7,3333 4,1 -3,2 <
19 Image/ Attractiveness/ Aesthetics 0,1 Lower Priority 15% 7,3333 4,1 -3,2 <
29 Driver's level of capability 0,18 Possible Overkill 19% 9 5,1 -3,9 <
26 Crime 0,13 Lower Priority 14% 7,6667 3,8 -3,9 <
18 Driver attitude & appearance 0,11 Lower Priority 16% 8,3333 4,3 -4,0 <
23 Social Equity & Inclusion 0,12 Possible Overkill 19% 9 5,0 -4,0 <
14 Technological maturity of transport system 0,34 Possible Overkill 20% 9,6667 5,5 -4,2 <
30 Vehicle & Road condition 0,14 Lower Priority 15% 8,3333 4,0 -4,3 <
4 Noise Pollution 0,15 Lower Priority 12% 7,6667 3,2 -4,4 <
28 Passenger's perception of & satisfaction with safety level 0,16 Possible Overkill 18% 9,3333 4,7 -4,6 <
49 Way-finding information 0,09 Possible Overkill 19% 9,6667 5,0 -4,7 <
5 Light Pollution 0,07 Lower Priority 6% 6,6667 1,5 -5,1 <
11 Land-use 0,2 Possible Overkill 15% 9,3333 4,0 -5,3 <
III. Economic
Stellenbosch University https://scholar.sun.ac.za
Copyright © 2022 FDOKUMEN