An evaluation framework for comparing geocoding systems
15
RESEARCH Open Access An evaluation framework for comparing geocoding systems Daniel W Goldberg 1* , Morven Ballard 2 , James H Boyd 2 , Narelle Mullan 3 , Carol Garfield 4 , Diana Rosman 4 , Anna M Ferrante 2 and James B Semmens 2 Abstract Background: Geocoding, the process of converting textual information describing a location into one or more digital geographic representations, is a routine task performed at large organizations and government agencies across the globe. In a health context, this task is often a fundamental first step performed prior to all operations that take place in a spatially-based health study. As such, the quality of the geocoding system used within these agencies is of paramount concern to the agency (the producer) and researchers or policy-makers who wish to use these data (consumers). However, geocoding systems are continually evolving with new products coming on the market continuously. Agencies must develop and use criteria across a number axes when faced with decisions about building, buying, or maintaining any particular geocoding systems. To date, published criteria have focused on one or more aspects of geocode quality without taking a holistic view of a geocoding system’s role within a large organization. The primary purpose of this study is to develop and test an evaluation framework to assist a large organization in determining which geocoding systems will meet its operational needs. Methods: A geocoding platform evaluation framework is derived through an examination of prior literature on geocoding accuracy. The framework developed extends commonly used geocoding metrics to take into account the specific concerns of large organizations for which geocoding is a fundamental operational capability tightly-knit into its core mission of processing health data records. A case study is performed to evaluate the strengths and weaknesses of five geocoding platforms currently available in the Australian geospatial marketplace. Results: The evaluation framework developed in this research is proven successful in differentiating between key capabilities of geocoding systems that are important in the context of a large organization with significant investments in geocoding resources. Results from the proposed methodology highlight important differences across all axes of geocoding system comparisons including spatial data output accuracy, reference data coverage, system flexibility, the potential for tight integration, and the need for specialized staff and/or development time and funding. Such results can empower decisions-makers within large organizations as they make decisions and investments in geocoding systems. Keywords: Geocoding, Georeferencing, Record linkage, Postal address data, Health records * Correspondence: [email protected] 1 Department of Geography, Texas A&M University, College Station, Texas, USA Full list of author information is available at the end of the article INTERNATIONAL JOURNAL OF HEALTH GEOGRAPHICS © 2013 Goldberg et al.; licensee BioMed Central Ltd. This is an open access article distributed under the terms of the Creative Commons Attribution License (http://creativecommons.org/licenses/by/2.0), which permits unrestricted use, distribution, and reproduction in any medium, provided the original work is properly cited. Goldberg et al. International Journal of Health Geographics 2013, 12:50 http://www.ij-healthgeographics.com/content/12/1/50
-
Upload
independent -
Category
Documents
-
view
4 -
download
0
Transcript of An evaluation framework for comparing geocoding systems

INTERNATIONAL JOURNAL OF HEALTH GEOGRAPHICS
Goldberg et al. International Journal of Health Geographics 2013, 12:50http://www.ij-healthgeographics.com/content/12/1/50
RESEARCH Open Access
An evaluation framework for comparinggeocoding systems
Daniel W Goldberg1*, Morven Ballard2, James H Boyd2, Narelle Mullan3, Carol Garfield4, Diana Rosman4,Anna M Ferrante2 and James B Semmens2
Abstract
Background: Geocoding, the process of converting textual information describing a location into one or moredigital geographic representations, is a routine task performed at large organizations and government agenciesacross the globe. In a health context, this task is often a fundamental first step performed prior to all operationsthat take place in a spatially-based health study. As such, the quality of the geocoding system used within theseagencies is of paramount concern to the agency (the producer) and researchers or policy-makers who wish to usethese data (consumers). However, geocoding systems are continually evolving with new products coming on themarket continuously. Agencies must develop and use criteria across a number axes when faced with decisionsabout building, buying, or maintaining any particular geocoding systems. To date, published criteria have focusedon one or more aspects of geocode quality without taking a holistic view of a geocoding system’s role within alarge organization. The primary purpose of this study is to develop and test an evaluation framework to assist alarge organization in determining which geocoding systems will meet its operational needs.
Methods: A geocoding platform evaluation framework is derived through an examination of prior literature ongeocoding accuracy. The framework developed extends commonly used geocoding metrics to take into accountthe specific concerns of large organizations for which geocoding is a fundamental operational capability tightly-knitinto its core mission of processing health data records. A case study is performed to evaluate the strengths andweaknesses of five geocoding platforms currently available in the Australian geospatial marketplace.
Results: The evaluation framework developed in this research is proven successful in differentiating between keycapabilities of geocoding systems that are important in the context of a large organization with significantinvestments in geocoding resources. Results from the proposed methodology highlight important differencesacross all axes of geocoding system comparisons including spatial data output accuracy, reference data coverage,system flexibility, the potential for tight integration, and the need for specialized staff and/or development timeand funding. Such results can empower decisions-makers within large organizations as they make decisions andinvestments in geocoding systems.
Keywords: Geocoding, Georeferencing, Record linkage, Postal address data, Health records
* Correspondence: [email protected] of Geography, Texas A&M University, College Station, Texas,USAFull list of author information is available at the end of the article
© 2013 Goldberg et al.; licensee BioMed Central Ltd. This is an open access article distributed under the terms of the CreativeCommons Attribution License (http://creativecommons.org/licenses/by/2.0), which permits unrestricted use, distribution, andreproduction in any medium, provided the original work is properly cited.

Goldberg et al. International Journal of Health Geographics 2013, 12:50 Page 2 of 15http://www.ij-healthgeographics.com/content/12/1/50
IntroductionAcross the world, individuals, research groups, and organi-zations of all sizes ranging from non-profit and commer-cial entities to local-, state- and national-level governmentagencies are often required to perform geocoding for nu-merous mission critical tasks [1,2]. Within a health con-text, geocoding – the process of converting textualinformation describing a location into one or more digitalgeographic representations – is used for such diverse pro-cesses as linking the individual-level addresses associatedwith health records to census enumeration units for dis-ease surveillance at state and national levels, to determin-ing individual levels exposures to environmentalcontaminants and identifying the accessibility of healthyfood choices for populations of interest [3-10].The person or organizational group responsible for per-
forming the geocoding is faced with a number of choicesregarding which geocoding system to employ to achieve aresult that is sufficient for the purposes intended [11-15].These choices may greatly impact the results of the geo-coding process in terms of output data quality whichpropagates to subsequent studies that utilize these geo-coded data as input [4,7,11,12,14,16-22]. Despite the bestintentions of those responsible for providing geocodeddata, many of the choices may be conditioned by the con-straints of the organization for whom or within which thegeocoded data are produced. Within large organizationssuch as state and national Health Departments and Dis-ease Registries, for example, existing operational work-flows, data confidentiality requirements, and strategicpartnerships between external organizations and agenciesmay preclude a geocoding system from being purchased,implemented, or integrated [4,6,23-25].As can be expected with any mission-critical oper-
ational task, evaluating the factors that one might use todetermine which geocoding system will best meet theneeds of a specific organization or individual is often nota simple matter. Likewise, these factors may not be read-ily transferrable from one situation to another [2].Switching between geocoding systems represents the po-tential for expending significant levels of time, effort andfunding due to the need to integrate a new systemwithin existing production workflows, perform evalu-ation testing, re-train staff, etc. Given these up-front andcontinuing costs, the decision to change geocoding sys-tems is generally not entered into lightly. An evaluationwhich compares the benefits versus the costs of eachgeocoding system is a useful way of determining whichgeocoding system is the correct choice for a particularindividual, group, or organization given the specific sce-nario within which it must operate and the user-base itshould serve.In recent years, several research groups have under-
taken studies which have evaluated and compared the
performance of various geocoding systems. Contributionsto the body of geocoding literature have included evalua-tions of the spatial accuracy and match rates of geocodedsystems resulting from the use commercially available systemsversus in-house custom-built solutions [4,16,21,26,27];the use of various forms of reference data files - buildingcentroids, address points, areal units describing parcels,street centerline files, etc. [7,13,18,22,28-31]; and the useof different interpolation algorithms - address range,uniform lot, population weighted centroids, geographicimputation, etc. [18,22,32,33]; the use of different featurematching methods - probabilistic, deterministic, etc.[28,34-37]; the use of pre-processing techniques - addressstandardization, normalization, etc. [38]; and the use andeffectiveness of manual/clerical review processes toimprove non-matchable addresses [39].Other authors have investigated the non-random ef-
fects that an urban, rural, or remote geographic contextplays on the accuracy, completeness and correctness ofinput address data, reference data layers and ultimategeocode output [5,16,26,40-43]. Similarly, research hasinvestigated the non-random distribution of geocodingquality by demographic characteristics such as race, eth-nicity, and income [11,43-45].This rich body of prior work into geocoding compari-
sons has provided valuable insight into the role that vari-ous components of a geocoding system play in thequality of output produced and the effect these choicesmay have on subsequent research projects [3,46]. How-ever, despite this diverse set of resources that detail thefactors which influence geocode quality, there remains alack of up-to-date guidance that an organization or indi-vidual could use to assist in the determination of whichgeocoding system is right for a particular application/usage context. In particular, these prior studies have notconsidered the particular operational, technical, policyand legal issues that are present in large organizationsresponsible for securely collecting, linking, curating, pro-ducing and/or disseminating health-related geocodeddata such as state-level Health Departments and DiseaseRegistries [6,23,34]. Given that any number of high-quality commercial off the shelf (COTS) geocoding sys-tems are now available, this issue is particularly relevantif the data maintained by these agencies are to beemployed to the their full potential to best serve thepublic at large.The primary purpose of this study is to develop an
evaluation framework to assist a large organization todetermine which geocoding systems will meet its oper-ational needs. The decision criteria presented offer anenumeration of the capabilities that a governmentagency can consider, ranging from the most basic princi-ples of how the software gets installed to advanced re-quirements such as the flexibility of the system for

Table 1 Geocoding system quality metricsQuality Metric Description
Match rate (%) Percentage of all records capableof being geocoded
Match type (% by geographic level) Geographic levels of geocodematch – building level, parcel level,street centroid level, postcodelevel, etc. and percentages ofmatchable geocodes at each level
Match score (% at score levels) Frequency distribution of matchscores for matchable geocodes
Spatial accuracy (% at distance levels) Frequency distribution of distancesbetween matchable geocodes andground truth locations
Spatial accuracy variation(% variation from other systems)
Frequency distribution of distancesbetween the same geocodeproduced by multiple geocodingsystems.
Administrative unit concordance(% variation from other systems)
Frequency distribution ofadministrative unit concordancebetween the same geocodeproduced by multiple geocodingsystems.
Goldberg et al. International Journal of Health Geographics 2013, 12:50 Page 3 of 15http://www.ij-healthgeographics.com/content/12/1/50
allowing specialized matching rules for particular typesof input data. The framework developed is applicable toorganizations of all sizes across all regions of the world.The example used herein provides the upper bound ofrequirements in terms of operational needs and confi-dentiality requirements. While it is expected that, glo-bally, similar agencies would have comparably high-levelneeds, individual researchers working on small-scopeprojects may not require such stringent requirementsand as such would be able to make different choicesthan those required at an agency responsible for safe-guarding confidential information.However, to be clear, the current research does not
recommend the usage of any particular geocoding sys-tem; instead, it offers a methodology and a set of criteriaby which an organization or individual could make sucha decision for themselves. The strengths and weaknessesof the proposed approach are evaluated through thiscase study in Western Australia. In this case study, noneof the geocoding systems evaluated is listed by name dueto non-disclosure agreements with the vendors who par-ticipated in the study.The remainder of this paper is organized as follows.
We first develop the evaluation framework by definingseveral axes of criteria by which a geocoding system canbe characterized and measured. Within each, specific ex-amples of capabilities, constraints, and features are pro-vided. We next describe the context within which thecurrent evaluation was performed. This includes thegeneral characteristics of the types of input data, geo-coding systems, and reference data that were used. Onlygeneral characteristics are provided because of the confi-dential nature of the data processed and non-disclosureagreements. This limits the specific details that can bereported about the geocoding systems evaluated and thedata tested, but nonetheless provides an opportunity toevaluate the proposed approach. Following the descrip-tions of the data and systems used, we present the re-sults of the evaluation process and offer a discussion asto their meaning.
Evaluation frameworkThe evaluation framework developed and used to facili-tate the experiments contained herein is a combinationof traditional geocoding system performance tests(match rates, spatial variation, etc.) and a series of evalu-ations which capture the applicability of a geocoding sys-tem to a particular user scenario (workflow integration,cost, etc.). While both aspects are important, the com-bination of the two serves to highlight the balance thatmust be struck between performance and utility in orderfor an organization to decide upon an appropriate sys-tem given the requirements, limitations and constraintsof any particular organization or individual.
Geocode qualityOutput geocode quality is a primary concern for geo-coded data producers and end-users of these data.Table 1 lists the typical metrics used to measure geocodequality. These are: (a) match rates – the proportion ofinput data a geocoding system was capable of success-fully geocoding; (b) match type – the level of geographicmatch for a geocode (parcel, street centroid, postcode,etc.); (c) match score – the level of similarity betweenthe input address data requested and the reference geo-graphic feature matched to; and (d) spatial accuracy –the distance between the true location and the com-puted geocode location [2,6,34,47,48]. In addition tothese, administrative unit concordance is often used toindicate cases where two geocoding systems (or differentconfigurations of the same system) result in the assign-ment of differing administrative unit codes.In the current study, the first three of these metrics
were measured directly for each of the geocoding systemconfigurations (i.e., combinations of input data, geocod-ing system, and reference data). Ground truth GPSpoints were not available for this research, so variationmetrics were computed and reported for spatial accuracyand administrative unit concordance. Instances of highvariation between geocoding configurations for particu-lar addresses were used to guide the investigation of in-dividual addresses that performed differently betweengeocoding configurations. Census unit concordance wasnot evaluated.
Geocoding system operating characteristicsThe integration of a new geocoding system within anorganization potentially represents a great deal of time,

Goldberg et al. International Journal of Health Geographics 2013, 12:50 Page 4 of 15http://www.ij-healthgeographics.com/content/12/1/50
effort, and training, among other costs. Thus the deci-sion to scrap an old system and integrate a new one isgenerally not made lightly. As noted above, the qualitiesof geocode output (match rate, spatial accuracy, etc.) arebut one of the axes by which a geocoding system mustbe evaluated when considering the adoption of a geo-coding system at an organizational level. The applicabil-ity of a geocoding system to a particular user scenario(workflow integration, cost, etc.) is paramount in the de-cision to adopt a new system. A brief overview of thecategories and a few example metrics related to geocod-ing system operation that can be used to compare theapplicability and appropriateness of geocoding systemsto a particular set of user needs and usage scenarios aredisplayed in Table 2; each is discussed in detail in thefollowing sections. These listing are not intended to beexhaustive because different organizations will have dif-ferent needs.
System flexibilityThe flexibility of a geocoding system describes the abilityof the user of the system to make changes and additionsto the data sources and methods used by the system(Table 3). In this evaluation, flexibility was determined
Table 2 Geocoding system operational capabilities metrics
Category and notes Metric
System Flexibility User defined reference lay
Ability of the user of the system tomake changes and additions todata sources and methods usedby the system
Specialized address parsin
Specialized matching algo
Customized feature hierar
System Integration Operating system support
Ability to merge a geocoding systeminto an existing production system
System/Workflow Integrat
Varying operational mode
Desktop Version
In-house Server Version
API Version
Metadata Spatial confidence values
Types and level of detail reported aboutthe quality of the output data and/or thecharacteristics of the geocoding system
Input address/matched adconcordance
Capabilities Automatic batch geocodin
Baseline functionality of paramountimportance to agencies working withlarge health data sets
Interactive review
Alias tables
Weighted centroids
by the ability of a geocoding system to: (a) permit theutilization of user-defined reference data layers(points, lines, and polygons), e.g., import and use anyreference data sources; (b) create and use specializedaddress parsing rules, e.g., add in support for newstreet types, named places, etc.; (c) create and use spe-cialized matching algorithms, e.g., look in neighboringpostcodes or localities for matches; and (d) the ability tocreate and use specialized feature selection hierarchiesbased on organizational policies, e.g., search in parcelsfirst, then localities or postcodes, or alternatively, choosewhichever has the smaller area.
System integrationThe ability to merge a geocoding system into an existingproduction system is a major concern for large organiza-tions that routinely perform geocoding as one aspect ofa larger data processing system. Examples include theWestern Australia (WA) Department of Health (DoH),Data Linkage Branch where the current study wasundertaken. This group is responsible for providing datalinkage services that consolidate data from numeroushealth-related sources for data consumers within theWA DoH and other local-, state-, and national-level
Description and/or example
ers Is it possible to use any available reference data
g Add in support for new street types, named places
rithms Consider neighboring areas for matches
chies Hierarchy based on organizational policy
Windows, Unix/Linux/Solaris
ion Into tools and systems used by the organization(eg SAS wrappers)
s Batch/interactive/manual
Standalone product for highly sensitive data
Internal server for multiple users within agency firewall
Vendor or custom-written code for off-site processing
Descriptions of the region size (geographic area) thata geocode output is known to fall within
dress Descriptions of which attributes of the input addresswere incorrect, incomplete, partially matched or notused in the matching process
g The ability to process a data file of records using asingle process
The ability to perform manual review for non-matchedrecords to attempt to determine a correct output geocode
The ability to incorporate tables of named places, commonsynonyms for street address attributes
The ability to bias the output location of a geocode baseda known distribution of a characteristic of interest such asthe distribution of population or specific subsets of apopulation in an area

Table 3 Geocoding system flexibility metrics
Flexibility Metric Description
User-defined referencedata layers (Y/N)
Does the user have the ability to includehis/her own custom reference datalayers? Example – including one’s ownparcel layer for a locality if it is available.
Specialized addressparsing rules (Y/N)
Does the user have the ability to includehis/her own custom address parsingrules? Example – including a parsingapproach where the “St.” in “St. Patrick” isconverted to “Saint” to provide highermatch rates given a reference data sourcethat has the term listed as “Saint”.
Specialized matchingalgorithms (Y/N)
Does the user have the ability to includehis/her own custom matching rules?Example – Inspecting nearby postal codesfor similarly named streets and providinga higher matching score for candidatematch features that are found in adjacentpostal codes and lower match scored forcandidate match features found in non-adjacent postal codes.
Specialized featureselection hierarchies (Y/N)
Does the user have the ability to includehis/her own custom ordering of referencelayers? Example – Adding the ability tosearch first in postal codes then inmunicipalities in urban regions (wherepostal codes are small and municipalitiesare big) and municipalities first thenpostal codes in rural regions (wheremunicipalities are small and postal codesare large).
Table 4 Geocoding system integration metrics
Integration metric Description
Operating systemsupport (Y/N)
Does the system work on theoperating system used by theorganization? Example – Windows,Linux, Unix.
System and workflowintegration (Y/N)
Can the system be integrated intoexisting systems and workflows usedby the organization? Example – Asystem that can be wrapped as a SAScomponent so it can be integratedinto automated SAS data processingworkflows already used by theorganization.
Operational mode integration– Batch mode (Y/N)
Does the system have the ability togeocode records in batch? Example –Uploading a large data set to a serverand running the geocoding processover the whole file.
Operational mode integration– Interactive mode (Y/N)
Does the system have the ability toallow a user to interactively geocoderecords? Example – Displaying aninterface that allows a user togeocode one record at a time.
Operational mode integration– Manual review mode (Y/N)
Does the system have the ability toallow a user to interactively geocoderecords that do not process correctlyin batch mode? Example – Displayingan interface that lists records that didnot match in batch processing andallows the user to research, correct,and re-geocode individual recordsone-by-one.
Table 5 Geocoding system interface metrics
Interface metric Description
Desktop-based geocoding (Y/N) Does the system work on a desktopcomputer?
Server-based geocoding (Y/N) Does the system work on a server?
Application programmerinterface (API) geocoding (Y/N)
Does the system provide an API forwhich custom programs can bedeveloped?
Goldberg et al. International Journal of Health Geographics 2013, 12:50 Page 5 of 15http://www.ij-healthgeographics.com/content/12/1/50
agencies to facilitate research and policy-making. Geo-coding services are provided as data are processed(linked) in order to associate census enumeration unitvalues with each record as part of the larger data linkageprocess. Similar systems are found in other Health De-partments at the local-, regional-, state-, and nationallevels around the world, as well as Disease Registrieswhere data consolidation, cleaning, and/or linkage taskstake place. In each scenario, the geocoding componentof the overall organizational mission is tightly integratedinto other dependent workflows. The geocoding processoccurs as data are streamed through the system or in abatch-mode fashion from which the results are linkedback to the output linked/consolidated records.Table 4 lists the primary concerns for these organiza-
tions in terms of system integration. These are: (a) oper-ating system support – the geocoding system must beexecutable on the operating systems used by theorganization (Windows, Unix/Linux/Solaris, etc.); (b)system and workflow integration – the geocoding sys-tem should be integrateable with the tools and systemsused by the organization (SAS wrappers, COM compo-nents, dynamically linked libraries, APIs, etc.); (c) oper-ational modes – the geocoding system must be usablein the modes necessary to support the organizational
mission (batch-mode, interactive-mode, manual review/rematching, etc.).Table 5 lists various system interface modes that a geo-
coding platform could provide to a user. These refer tothe ways in which a user would interact with the system.These interface modes are important because datasecurity and/or confidentiality constraints may dictatecertain forms of data processing. For example, it is thecase that most health-related records cannot be trans-mitted outside of the secure environment within whichthey are housed so desktop or in-house server geocod-ing platforms may be the only option. In contrast, itmay be acceptable to transmit non-confidential dataover the Internet for offsite processing on a vendor’s

Goldberg et al. International Journal of Health Geographics 2013, 12:50 Page 6 of 15http://www.ij-healthgeographics.com/content/12/1/50
servers through an application programmer interface(API) using custom-written code or a vendor-providedthin client.Such APIs and other online batch-process geocoding
services where users can upload a database of addressesand have them geocoded by web-based services can becategorized as web-based geocoding options. Many com-mercial providers offer these services such as the APIsavailable from Google, Yahoo and Esri [49-51]. There areother similar community-specific geocoding services likethose offered by the North American Association ofCentral Cancer Registries (NAACCR) created to meetthe needs of specific research and practice communities[52]. Within the context of health data specifically, orga-nizations must be able to ensure data privacy, security,and confidentiality through data confidentiality and useagreements with these service providers. Current researchinto cyber-enabled GIS infrastructures (CyberGIS) [53] aswell as secure computing environments for health data[54] is broadening the scope of what is considered accept-able. However, it is the case that in some instances, healthorganizations may be specifically prohibited from usingweb-based geocoding services. At the time this study wasperformed, the organization performing this study had thisrestriction in place. Therefore web-based geocoding sys-tems were not included in the present evaluation.
CostThe true cost of a geocoding system can be a difficultthing to quantify. However, some aspects of the geocod-ing system cost are easy to quantify. The price for a soft-ware license for the geocoding system, the price of alicense for the required reference data layers, and theprice for a support contract are examples of one-time(or yearly) fixed costs that can readily be obtained froma software vendor or assumed to be zero for open sourcesoftware (Table 6). Each of these costs is a common
Table 6 Geocoding system cost metrics
Cost metric Description
Software license cost ($) Price of licensing the software
Reference data layer cost ($) Additional costs for licensingreference data
Support contract cost ($) Cost of support contract
FTE support cost ($) Cost of full time equivalent support(in-house)
FTE development cost ($) Cost of full time equivalentdevelopment (in-house)
FTE maintenance cost ($) Cost of full time equivalentmaintenance (in-house)
FTE training cost ($) Cost of full time equivalent training(in-house)
FTE specialized skills (Y/N) Full time equivalent specializationrequired (in-house)
expense in jurisdictions around the world, although thereare free geocoding systems such as geocoder.us a , free ref-erence data layers such as the US Census Bureau TIGER/Line files b , and unsupported geocoding systems such asthe Postal Address Geocoder (PACG) c . However, otherscomponents that must be considered when estimatingoverall cost are more complicated because they involvecomputing time and effort for staff members.Table 6 lists these costs, which include: (a) the level of
effort and/or number of full time equivalent positions(FTE) required to support the geocoding system – e.g.,time/effort for a staff member to identify, respond to, and/or fix errors reported by end-users; (b) the level of effortand/or number of FTE required to develop the geocodingsystem – e.g., time/effort for a staff member to build add-itional components into the geocoding system as needed;and (c) the level of effort and/or number of FTE requiredto maintain the geocoding system – e.g., time/effort for astaff member to update the system to use the latest refer-ence data files.When purchasing a commercial, off-the-shelf (COTS)
package, many of these items disappear because thevendor may charge fees to provide them to the cus-tomer; however, the flexibility of the geocoding systemmay decline because the vendor may not be capable ofbuilding in all of the custom functionality required bythe user. In contrast, when building and using a customin-house geocoding solution, flexibility is maximized,but it requires the availability and retention of spe-cialized staff with particular training and familiaritywith the geocoding system and the programming lan-guages and programming environments upon which it isbuilt. In evaluation performed in this report, cost is notconsidered as a factor due to non-disclosure agreementswith the vendors who participated. However, when theframework described herein is used to make geocodingdecisions within an organization, it is expected that costwould be a highly weighted metric.
Metadata reportingThe level of metadata reported by a geocoding systemrepresents a critical factor that discriminates one geo-coding system from another. As described above and innumerous research reports [29,45,46,55,56], geocodingquality indicators both at the per-record level (matchtype, match score, spatial accuracy) and overall processlevel (match rate) are important factors that describehow well a geocoding system performs. However, theseare not the only forms of metadata that a geocoding sys-tem could report. Other metadata items that data pro-ducers and consumers could be concerned with include:(a) spatial confidence values – descriptions of the re-gion size (geographic area) that a geocode output isknown to fall within; (b) input address/matched

Table 8 Geocoding system capability metrics
Capability metric Description
Automated batch geocoding Does the system provide the abilityto process a database of addressrecords in batch mode? Example –Running the geocoding systemover a database of records in atext file.
Interactive review Does the system provide an interfacethat allows a user to review addressrecords that do not match on acase-by-case basis? Example –Providing a graphical user interface(GUI) that allows a user to reviewgeocoded results, make correctionsand re-geocode.
Alias tables Does the system provide the abilityto add address alias tables into thegeocoding process? Example –Providing the user with a capabilityto include the coordinates of namedplaces, such as nursing homes, caravanparks, or prisons.
Weighted centroids Does the system allow for the useof weighting schemes to bias theplacement of centroid-level output?Example – Including a populationdensity layer that moves the output ofa postcode-level geocode closer to thelocation within the postcode that hasthe highest level of population density.
Goldberg et al. International Journal of Health Geographics 2013, 12:50 Page 7 of 15http://www.ij-healthgeographics.com/content/12/1/50
address concordance – descriptions of which attributesof the input address were incorrect, incomplete, partiallymatched with corrections, not used in the matchingprocess, etc. (Table 7).
CapabilitiesThe baseline capabilities that a geocoding system pro-vides are of paramount importance when evaluating theappropriateness of a geocoding system within a particu-lar usage scenario. In addition to simply providing theability to geocode a data set of input addresses, othercapabilities that a geocoding system either does or doesnot provide include: (a) automatic batch geocoding –the ability to process a data file of records using a singleprocess; (b) interactive review – the ability to performmanual review for non-matched records to attempt todetermine a correct output geocode; (c) alias tables –the ability to incorporate tables of named places, com-mon synonyms for street address attributes (suffixes,additional street names, etc.); and (d) weighted cen-troids – the ability to bias the output location based ona known distribution of a characteristic of interest suchas the distribution of population or specific subsets of apopulation in an area (postcode, locality, etc.) (Table 8).
End-user needs and expectationsAlthough the producers of geocoded data often makeuse of these data in-house within research projects andpolicy-making initiatives, it is often the case that the ul-timate end-user of geocoded data may be in another areaof an organization or be within a completely separateorganization. In each case, the user expectations andrequirements will vary by the end-user in terms of dataquality. For example, an end-user computing diseaserates at the state level would have an entirely differentexpectation for the accuracy of census unit assignmentsthan one who sought to quantify individual-level expos-ure metrics at a micro-scale environmental level such asindoor residential exposure to pesticide. Similarly, the
Table 7 Geocoding system metadata metrics
Metadata metric Description
Spatial confidencevalues
Does the system output spatial confidenceintervals with each geocoded location?Example – Returning a buffer around thelocation within which the true geocode isknown to be located
Input address/Matchedaddress concordance
Does the system return an indication of thesimilarity between the input addressrequested and the address of the geographicreference feature matched? Example –Providing a list of the input address attributesthat matched or did not match the addressattributes associated geographic referencefeature used for interpolation
user knowledge of the geocoding process and usercapacity to handle different levels of detail (metadata)about the geocoding process will vary by end-user group.For example, a policy-maker or legislative analyst maybe overwhelmed if provided with detail about the inputpostal address attributes that did and did not match in ageocoded result. In contrast, a spatial statistician maywish to know that a proximate postcode was used toproduce an output geocode for an input address wherethe input postcode was incorrect but the locality namewas correct. The evaluation of a geocoding system musttake into account the end-user needs, wants, andabilities to determine which features of a geocoding sys-tem are absolutely critical given the usage scenarios thatare anticipated in the end-user communities which anorganization’s geocoded data serve.Similarly, the frequency of geocoding requests that
are expected of a geocoding provider from end-users isan important aspect to consider, as is the volume ofrecords that must be processed in each instance. A timeconsuming geocoding process that results in highly ac-curate results may be an acceptable option if the staffthat must perform the geocoding are asked to do so in-frequently or the data files are small. In contrast, organi-zations that must continually process large amounts ofdata or do so as part of an automated process simplycannot spend a great deal of time on a per-record basis,
Goldberg et al. International Journal of Health Geographics 2013, 12:50 Page 8 of 15http://www.ij-healthgeographics.com/content/12/1/50
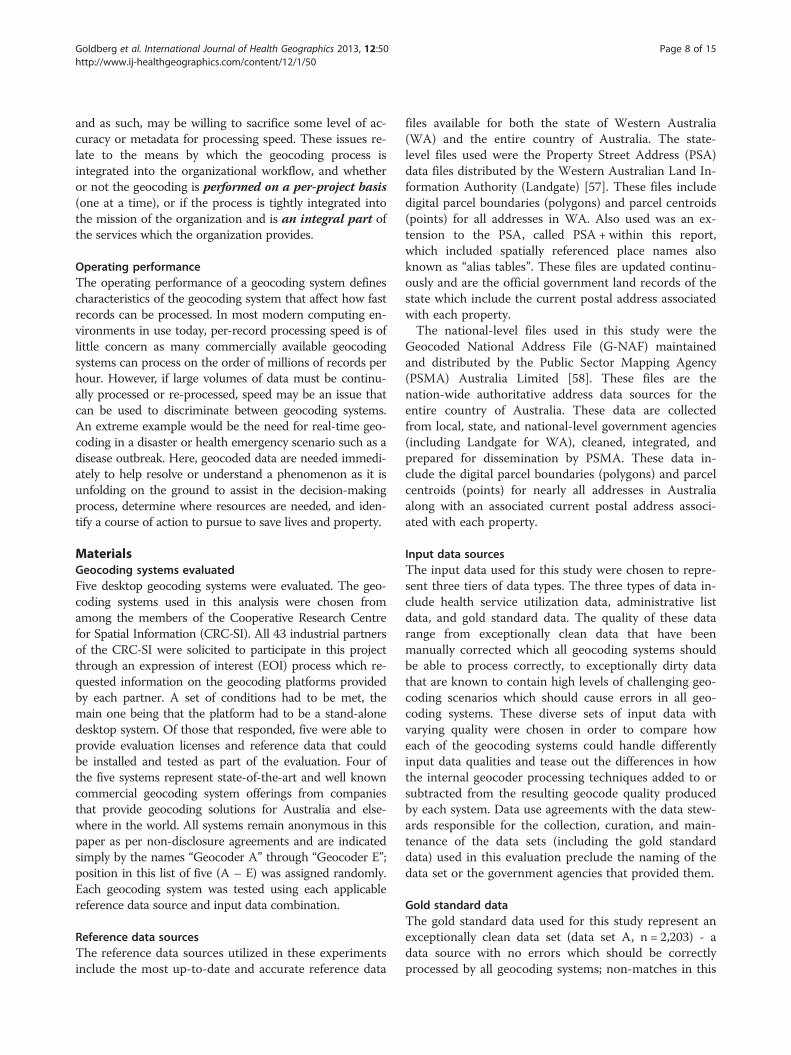
and as such, may be willing to sacrifice some level of ac-curacy or metadata for processing speed. These issues re-late to the means by which the geocoding process isintegrated into the organizational workflow, and whetheror not the geocoding is performed on a per-project basis(one at a time), or if the process is tightly integrated intothe mission of the organization and is an integral part ofthe services which the organization provides.
Operating performanceThe operating performance of a geocoding system definescharacteristics of the geocoding system that affect how fastrecords can be processed. In most modern computing en-vironments in use today, per-record processing speed is oflittle concern as many commercially available geocodingsystems can process on the order of millions of records perhour. However, if large volumes of data must be continu-ally processed or re-processed, speed may be an issue thatcan be used to discriminate between geocoding systems.An extreme example would be the need for real-time geo-coding in a disaster or health emergency scenario such as adisease outbreak. Here, geocoded data are needed immedi-ately to help resolve or understand a phenomenon as it isunfolding on the ground to assist in the decision-makingprocess, determine where resources are needed, and iden-tify a course of action to pursue to save lives and property.
MaterialsGeocoding systems evaluatedFive desktop geocoding systems were evaluated. The geo-coding systems used in this analysis were chosen fromamong the members of the Cooperative Research Centrefor Spatial Information (CRC-SI). All 43 industrial partnersof the CRC-SI were solicited to participate in this projectthrough an expression of interest (EOI) process which re-quested information on the geocoding platforms providedby each partner. A set of conditions had to be met, themain one being that the platform had to be a stand-alonedesktop system. Of those that responded, five were able toprovide evaluation licenses and reference data that couldbe installed and tested as part of the evaluation. Four ofthe five systems represent state-of-the-art and well knowncommercial geocoding system offerings from companiesthat provide geocoding solutions for Australia and else-where in the world. All systems remain anonymous in thispaper as per non-disclosure agreements and are indicatedsimply by the names “Geocoder A” through “Geocoder E”;position in this list of five (A – E) was assigned randomly.Each geocoding system was tested using each applicablereference data source and input data combination.
Reference data sourcesThe reference data sources utilized in these experimentsinclude the most up-to-date and accurate reference data
files available for both the state of Western Australia(WA) and the entire country of Australia. The state-level files used were the Property Street Address (PSA)data files distributed by the Western Australian Land In-formation Authority (Landgate) [57]. These files includedigital parcel boundaries (polygons) and parcel centroids(points) for all addresses in WA. Also used was an ex-tension to the PSA, called PSA + within this report,which included spatially referenced place names alsoknown as “alias tables”. These files are updated continu-ously and are the official government land records of thestate which include the current postal address associatedwith each property.The national-level files used in this study were the
Geocoded National Address File (G-NAF) maintainedand distributed by the Public Sector Mapping Agency(PSMA) Australia Limited [58]. These files are thenation-wide authoritative address data sources for theentire country of Australia. These data are collectedfrom local, state, and national-level government agencies(including Landgate for WA), cleaned, integrated, andprepared for dissemination by PSMA. These data in-clude the digital parcel boundaries (polygons) and parcelcentroids (points) for nearly all addresses in Australiaalong with an associated current postal address associ-ated with each property.
Input data sourcesThe input data used for this study were chosen to repre-sent three tiers of data types. The three types of data in-clude health service utilization data, administrative listdata, and gold standard data. The quality of these datarange from exceptionally clean data that have beenmanually corrected which all geocoding systems shouldbe able to process correctly, to exceptionally dirty datathat are known to contain high levels of challenging geo-coding scenarios which should cause errors in all geo-coding systems. These diverse sets of input data withvarying quality were chosen in order to compare howeach of the geocoding systems could handle differentlyinput data qualities and tease out the differences in howthe internal geocoder processing techniques added to orsubtracted from the resulting geocode quality producedby each system. Data use agreements with the data stew-ards responsible for the collection, curation, and main-tenance of the data sets (including the gold standarddata) used in this evaluation preclude the naming of thedata set or the government agencies that provided them.
Gold standard dataThe gold standard data used for this study represent anexceptionally clean data set (data set A, n = 2,203) - adata source with no errors which should be correctlyprocessed by all geocoding systems; non-matches in this

Goldberg et al. International Journal of Health Geographics 2013, 12:50 Page 9 of 15http://www.ij-healthgeographics.com/content/12/1/50
system would be considered false negatives. This dataset contained address data drawn from a previous, largerstudy. Each of the records in this data set represented anaddress that was not capable of being successfully geo-coded using an automated geocoding system. These re-cords were manually reviewed and processed to improvetheir output quality by verifying and/or correcting postaladdress attributes and the true location of the geocodedpoint following a method similar to that presented inGoldberg et al. (2008) [39]. The records were groundtruthed using a variety of methods including aerial im-agery, online “street view” software, contact of the par-ties responsible for the address to confirm addressattributes, and linkage with official government recordsand public domain data sources. The result of thesepainstaking efforts was the construction of an input dataset of addresses with attribute data (number, streetname, suffix, locality, postcode, etc.) that were manuallyconfirmed to be correct.
Administrative dataThe administrative data set (data set B, n = 1,364,058)used for this study was drawn from official records of alarge WA administrative database. These data containthe official addresses of a subset of residents of WA, andrepresent input address data that should be of fairly highquality. These data are representative of many adminis-trative lists that are used to send out government mail-ings, confirm postal delivery addresses, and otheressential government services.
Health service utilization dataThe health service utilization data set (data set C, n =1,264,941) used for this study was chosen to represent adata source with numerous errors in the input addresswhich would be the most difficult to geocode and resultin the highest number of non-matches, false positivematches (incorrect matches), and false negative non-matches (incorrect non-matches). These data weredrawn from the health service utilization records of aspecific Western Australian health agency and are repre-sentative of the quality of data that occur when data arecollected through a patient-facing organization wherethe patient self-reports his/her postal address.The primary challenges of these data were threefold –
� Blank fields in addresses resulting in input data withlimited input address fields, sometimes with just alocality and/or just a postcode;
� Named places such as prisons, nursing homes, andAboriginal communities, instead of street addresses; and
� Historical data which includes many versions of datainput systems all of which captured data in differentways ranging over a number of years.
Variations to data collection procedures through timeinclude:
� Truncations to save characters;� Transposition and introduction of new fields as user
interfaces were updated; and� Use of various codes for unknown/missing
information (e.g., entering postcode 9999 when thepostcode was unknown versus leaving it blank orentering 0000).
These data included numerous types of other frequentlyoccurring errors including misspellings to all componentsof the input address (number, street name, suffix, locality,postcode, etc.), the use of incorrect locality names andpostcodes, and all combinations of missing attributes forall fields of the input address.
Experimental designThe experiments performed for this research attemptedto apply the framework and metrics described above inthe context of the Western Australia (WA) Departmentof Health (DoH) as a test-case for evaluating their ap-plicability for comparing a set of available geocodingplatforms. To do so, the characteristics of each geocod-ing system were assessed across each aspect of theevaluation framework presented earlier. Table 9 wasconstructed in consultation with the WA DoH as thefeatures and capabilities of geocoding systems whichwere important to the organization. Each system wasevaluated based on published literature and documenta-tion of the geocoding systems. Additional communica-tion with each vendor was necessary to determine allcapabilities because not all vendors use the same termin-ology for all items.The project team attempted to install each system
‘out-of-the-box’ without customization as much as pos-sible. This included importing reference data layers intosome of the systems as necessary, i.e., those that did notinclude the reference data as part of the software, in-stead requiring a geocoding reference data layer to beconstructed or specified. An exception to this is the pro-gramming required to install Geocoder A which is de-scribed below.The three input data sets were batch-processed through
each of the geocoding systems on the same team-member’s computer in sequence. No data filtering, datacleansing, address standardization, or address normali-zation operations were applied to any of the input dataprior to geocoding being performed. All data were proc-essed directly as received from the data custodians al-though the first step in most batch geocoding systems isto standardize and normalize the input data internallywithin the geocoding system [59].

Table 9 Operational capabilities results
Evaluation metric Geocoder A Geocoder B Geocoder C Geocoder D Geocoder E
User-defined reference data layers license fee (Y/N) Yes Yes Yes Yes No
Specialized address parsing rules (Y/N) Yes Yes Yes Yes No
Specialized matching algorithms (Y/N) Yes No No Yes Yes
Specialized feature selection hierarchies (Y/N) Yes Yes* Yes* Yes Yes
Integration
Operating system support (Y/N) Yes (Unix) No (Windows) No (Windows) Yes (Windows, Unix, Linux) Windows
Native system and workflow integration (Y/N) Yes No No No No
Batch mode (Y/N) Yes Yes Yes Yes Yes
Interactive mode (Y/N) Yes No No Yes No
Manual review (Y/N) Yes Yes Yes Yes No
Confidentiality maintained (Y/N) Yes Yes Yes Yes Yes
Desktop version(Y/N) Yes Yes Yes Yes Yes
In-house server version (Y/N) Yes No No Yes No
Online API version (Y/N) No Yes Yes Yes No
Metadata
Match rate (Y/N) Yes Yes Yes Yes Yes
Match type (Y/N) No No No Yes Yes
Match score (Y/N) Yes Yes Yes Available (not by default) No
Spatial confidence (Y/N) Yes No No Yes No
Input address/matched address concordance (Y/N) Yes Yes Yes Yes Yes
Capabilities
Automatic batch geocoding (Y/N) Yes Yes Yes Yes Yes
Manual review (Y/N) Yes Yes Yes Yes Yes
Alias tables (Y/N) Yes Yes Yes Yes No
Weighted centroids (Y/N) No No No Yes No
Nearby address matching (Y/N) Yes No No Yes Yes
* Only if street centroids, suburb and postcode reference data are available.
Table 10 Reference data set support and setup time
Geocoder G-NAF PSA PSA+
A No Yes – 20 mins Yes – 3 weeks
B Yes – 1 day Yes – < 5 mins Yes– < 5 mins
C No Yes – < 5 mins Yes – < 5 mins
D Yes – < 5 mins Yes – < 5 mins No
E Yes – < 5 mins No No
Goldberg et al. International Journal of Health Geographics 2013, 12:50 Page 10 of 15http://www.ij-healthgeographics.com/content/12/1/50
The experiments performed controlled for differences ingeocoding quality due to the three main components ofgeocoding systems: (a) input data quality; (b) geocoding al-gorithms which include all components of the geocodingsystem that are beyond the control of a geocode user –address standardization and normalization, feature match-ing, and feature interpolation; and (c) the reference datalayers used. To do so, each of these three components wasevaluated separately by constructing usage scenarios thatattempted to vary one aspect and keep the other two con-stant. Each of these axes was tested by varying one andholding the other two constant.For example, to test the effect of input data quality
across each geocoding system, all three data sets whereprocessed by each geocoder using the same referencedata sources (as could be achieved based on differentreference data set support per geocoder). Holding thereference data sets static and changing the input data setallowed for analysis of the overall effect of excellent(Gold Standard), moderate (Administrative), and poor
(Health) quality data on each geocoding system. Simi-larly, the effect of reference data set usage was evaluatedby holding the input data set constant and processing itwith different combinations of reference data layers, pergeocoding system.
Results and discussionReference data layersTable 10 lists the supported reference data layers pereach geocoding system. Geocoding systems were evalu-ated on their ability to support the G-NAF, PSA, and

Goldberg et al. International Journal of Health Geographics 2013, 12:50 Page 11 of 15http://www.ij-healthgeographics.com/content/12/1/50
PSA + data (PSA with additional alias names contained).Only one of the geocoding systems tested, Geocoder B,could support all three reference data layers without anyadditional development work and associated costs. Allfour other geocoding systems could have supported theadditional reference data layers, but this would have re-quired specialized customization and/or developmentwork by the system providers which was beyond thebudget and scope of the current research.The most striking result shown in Table 10 is that fact
that Geocoder A took several weeks to import the latestdata layers available. This amount of time was neededfor specialized staff to perform custom programming tobuild in support for modern data formats (shapefiles andgeodatabases instead of older formats). This update rep-resented a large one-time investment for the GeocoderA system.
Processing timeTable 11 lists processing times required to geocode allrecords within each input data set using each applicablereference data layer within each geocoding system. Ingeneral, all but Geocoder A processed data at roughlythe same speed given the number of records. In all in-stances, the processing speed was deemed acceptable forthe number of records due to the fact that they wereprocessed in batch for non-real time purposes.
Operating metric comparisonEach of the five geocoding systems was evaluated usingthe operational capabilities described above. Table 9 dis-plays the evaluation results of each geocoding systemagainst an operational capabilities matrix derived fromthe above metrics which were deemed important withinthe context of the WA DoH usage scenario. Using thisdata, it is possible to make comparative assessments ofthe match rates across the varying geocoding systems. Itis expected that different organizations and/or usage sce-narios would choose or develop alternative/additionalframework metrics to evaluate geocoding systems based
Table 11 Processing time by geocoding system, reference dat
Dataset Reference data Geocoder A Ge
A – Gold Standard PSA <2 m <2
(n = 2,203) PSA+ <2 m <2
G-NAF - <2
B – Administrative PSA 45 m 19
(n = 1,364,058) PSA+ 39 m 19
G-NAF - 24
C – Health PSA 55 m 16
(n = 998,066 ) PSA+ 2 h 25 m 22
G-NAF - 19
on the most important operational and performanceneeds of the organization.
Match type and match rate summaryThe match type and match rate results from each of thefive geocoding systems are displayed in Tables 12, 13, and14. These results are divided between input data set andapplicable reference data layers for each geocoding sys-tem. The results are divided into ‘Parcel’ level match and‘Non-Parcel’ level match. For the geocoding systems thatindicate a match type (Geocoder D and Geocoder E),this output was used directly to determine ‘Parcel’ leveland ‘Non-Parcel’ level matches. For those systems whichdid not indicate a type of match, but instead assign amatch score only – a level of similarity between the in-put and reference data – (Geocoder A, B, and C) thresh-olds of match scores were selected to represent ‘Parcel’level and ‘Non-Parcel’ level geocodes.
Interpretation and discussionFunctionally, the biggest issues which affected geocoderperformance were 1) the ability to include additional ref-erence data layers; and 2) the ability to include alias ta-bles. The geocoding systems evaluated in this projectspanned the spectrum of flexibility in this regard. For ex-ample, Geocoder A included alias tables but could notinclude the G-NAF data. The Geocoding B and C sys-tems allowed users to include any parcel based file(G-NAF and PSA) but encountered challenges includingalias tables, although the documentation reports thatthese could be added if data layers can be obtained andformatted properly. Geocoder D could include bothG-NAF and PSA but could not utilize alias tables(PSA+), while Geocoder E could only utilize G-NAF with-out costly development at the Geocoder E organization toinclude the PSA or PSA + files.The impact of including alias tables was evident when
inspecting the results of the data set C (Health). GeocoderA was the only one that could include these and, as a re-sult, was the only system that performed well on this data
a set, and input data set
ocoder B Geocoder C Geocoder D Geocoder E
m <2 m <2 m -
m <2 m - -
m - <2 m <2 m
m 13 m 17 m -
m 12 m - -
m - 34 m 13 m
m 16 m 25 m -
m 17 m - -
m - 30 m 23 m

Table 12 Input data A (Gold standard) match type andmatch rate summary (n = 2203 records)Geocoder Reference ‘Parcel’ level ‘Non-parcel’ level Geocoded
Data N % N % N %
A G-NAF - - - - - -
PSA 1875 85.1 303 13.8 2178 98.9
PSA+ 1875 85.1 303 13.8 2178 98.9
B G-NAF 1765 80.1 67 3.0 1832 83.2
PSA 1624 73.7 77 3.5 1701 77.2
PSA+ 1624 73.7 77 3.5 1701 77.2
C G-NAF - - - - - -
PSA 1696 77.0 21 1.0 1717 77.9
PSA+ 1696 77.0 21 1.0 1717 77.9
D G-NAF 1959 88.9 236 10.7 2195 99.6
PSA 1938 88.0 257 11.7 2195 99.6
PSA+ - - - - - -
E G-NAF 1991 90.4 212 9.6 2203 100.0
PSA - - - - - -
PSA+ - - - - - -
Table 14 Input data C (Health) match type and matchrate summary (n = 998066 records)Geocoder Reference ‘Parcel’ level ‘Non-parcel’ level Geocoded
Data N % N % N %
A G-NAF - - - - - -
PSA 712645 71.4 149309 15.0 861954 86.4
PSA+ 724326 72.6 145595 14.6 869921 87.2
B G-NAF 446182 44.7 101049 10.1 547231 54.8
PSA 486188 48.7 78508 7.9 564696 56.6
PSA+ 486188 48.7 78508 7.9 564696 56.6
C G-NAF - - - - - -
PSA 440062 44.1 27806 2.8 467868 46.9
PSA+ 440062 44.1 27806 2.8 467868 46.9
D G-NAF 734518 73.6 211175 21.2 945693 94.8
PSA 725115 72.7 217965 21.8 943080 94.5
PSA+ - - - - - -
E G-NAF 716241 71.8 271326 27.2 987567 98.9
PSA - - - - - -
PSA+ - - - - - -
Goldberg et al. International Journal of Health Geographics 2013, 12:50 Page 12 of 15http://www.ij-healthgeographics.com/content/12/1/50
set. These data were known to include a high degree ofnamed places such as nursing homes and caravan parkswhich are not geocodable without the inclusion of alias ta-bles. Conversely, the lack of support for G-NAF data didnot appear to be a major problem that affected the qualityof Geocode A performance. Australia has a unique
Table 13 Input data B (Administrative) match type andmatch rate summary (n = 1364058 records)Geocoder Reference ‘Parcel’ level ‘Non-parcel’ level Geocoded
Data N % N % N %
A G-NAF - - - - - -
PSA 1306310 95.8 55907 4.1 1362217 99.9
PSA+ 1313046 96.3 49805 3.7 1362851 99.9
B G-NAF 1136220 83.3 36915 2.7 1173135 86.0
PSA 1165034 85.4 58664 4.3 1223698 89.7
PSA+ 1165034 85.4 58664 4.3 1223698 89.7
C G-NAF - - - - - -
PSA 1219245 89.4 21932 1.6 1241177 91.0
PSA+ 1219245 89.4 21932 1.6 1241177 91.0
D G-NAF 1318281 96.6 43825 3.2 1362106 99.9
PSA 1325911 97.2 35442 2.6 1361353 99.8
PSA+ - - - - - -
E G-NAF 1329627 97.5 34431 2.5 1364058 100.0
PSA - - - - - -
PSA+ - - - - - -
addressing system, which is why address-range geocodingsystems [32] are used less frequently than parcel oraddress-point based systems [28]. The increase in qualityof output data from systems which included alias tablesmay also be an artefact of the addressing system used inAustralia.Other differences between geocoding systems related
to the amount and quality of metadata returned alongwith a result. Geocoder A returned a quantitative valuedescribing an area within which the geocode is consid-ered to fall. Geocoders B and C, on the other hand, re-turn a match score describing the similarity between theinput address and the geographic feature that wasmatched to. Both Geocoders D and E provided a greaterdegree of detail about the specific attributes of the inputaddress that matched the reference feature, as well asdetails about the geographic level of the match and/ormismatch of these attributes. These types of details per-mit a user a greater understanding of the match qualitythan a simple match score, but do not provide a quanti-tative spatial measure with which to understand howspatially in/accurate an output geocode could be.As noted above, the most pronounced operational dis-
tinction between geocoding systems was the setup timenecessary to build a geocoding system and the amountof specialized skill required to maintain the system. Geo-coder A was the most difficult to setup for the evalu-ation due to required programming. With in-depthdocumentation and the upgrade to modern data formatscompleted, this time may be reduced going forward, but

Goldberg et al. International Journal of Health Geographics 2013, 12:50 Page 13 of 15http://www.ij-healthgeographics.com/content/12/1/50
in all cases it will remain a time-consuming task which re-quires specially-trained staff to be in-house experts. Allother geocoding systems could be installed, setup, and runin a fraction of the time required to update Geocoder A tothe latest version of the PSA and PSA + data.As results demonstrate, the overall quality of input
data had a pronounced impact on the quality of the out-put results. Data set C (Health), known to include a highdegree of difficult cases such as named places, resultedin the worst output geocode quality across systems.Similarly, the high quality data (Gold Standard) resultedin the highest quality matches. These results are indica-tive of the fact that input data quality matters. The re-sults demonstrate that, wherever possible, input datashould be cleaned as close to the source of collection aspossible.To account for these and other errors in the input
data, the geocoding algorithms, or the reference dataused by the geocoding systems, manual geocoding mayneed to be performed to correct or otherwise assign re-cords that could not be processed. The degree to whichmanual geocoding procedures are linked into the auto-mated geocode process varied between the geocodingsystems. Geocoders A, B and C included a post-processing step to automatically update the output files.These geocoding systems offer the ability for a user toreview specific types of records, make corrections, andoffer candidate matches. Geocoders A, B and C takeroughly the same amount of time to process individualrecords and offer the key benefit that they work directlyon the output data file and update an output geocode’svalue once it is reprocessed so that table joining betweenprocessed and post-processed data are not required.A central question a reader should be asking at this
point is: How should the findings presented here, or asimilar evaluation performed by another organization oron a different set of geocoders, be used to decide whichgeocoding system should be the correct choice? The an-swer is unfortunately not straightforward. As discussedabove, every organization is different and will value cer-tain aspects or capabilities of geocoding systems more orless than another organization. Every organization willhave different strengths (in-house programming skills,for example) or resources (access to reference datalayers, for example) which will affect the cost-benefitequation used to rank geocoding choices.One potential and simple method that could be used
to determine the correct choice would be to borrowfrom suitability research [60]. First determine which geo-coding system criteria are important and which are not.This list may include each of the criteria we have de-scribed here, a subset thereof, or others that may be im-portant to an organization but were not listed in the setpresented here. Next, assign a relative weight of
importance to each of these criteria so that some thingsare more important than others – i.e., nice-to-have’s ver-sus must-have’s. Next perform a capability analysisacross each of the criteria for each geocoder and assignthe appropriate binary (1/0) or scaled scores dependingon the data type determined or each criteria (i.e., nom-inal, ordinal, ratio, or interval data). These analysescould simply assess capabilities like those listed inTable 2, 3, 4, 5, 6, 7 and 8 or they could include large-scale geocoding system performance tests as we havedone here in order to determine a subset of the perform-ance metrics listed in Table 1.Once all geocoders are scored across all criteria, the
most promising option should rise to the top. A centralpurpose of performing the current research to develop amethodology of assessing geocoding systems was to en-able just this type of analysis for making geocoding sys-tem decision at the WA DoH. However, the exactcriteria and their weightings to be used in the WA DoHdecision-making process are not presented here; insteadjust the methodology organizations could follow to dosimilar tasks on their own.
Evaluation framework limitationsNot all enumerations of all geocoding test scenarioscould be performed due to limitations in the flexibilityof various geocoding systems. For example, the use ofalias tables could not be turned off in Geocoder A; norcould G-NAF data be loaded. This mean that resultsfrom Geocoder A could not be included in the analysesthat determined the benefits of (a) local versus nationalreference data files, and (b) the use of alias tables versusthe non-use. Similarly, all but Geocoder B had limita-tions to the types of reference data layers that could beutilized.
ConclusionThe central goal of this paper was to present an object-ive methodology for comparing geocoding systems. Thepurpose of such a methodology is to assist in thedecision-making process when evaluating the perform-ance and utility of a range of geocoding systems. Theparticular evaluation context investigated here was acase study involving a typical geocoding use-case per-formed within a large government agency for which geo-coding is a mission-critical task. This organizational casestudy and the current techniques employed within theorganization geocoding can, in many ways, be seen asrepresentative of many large organizations within thepublic or private sector around the globe. Like others,the organization in this study has spent a considerableamount of time and effort developing a geocodingprocess that is integral to its core business. The geocod-ing system currently in place is tightly integrated into

Goldberg et al. International Journal of Health Geographics 2013, 12:50 Page 14 of 15http://www.ij-healthgeographics.com/content/12/1/50
other core operational and workflow systems, has beenhighly tailored to the type of data it encounters, and hasproduced results of sufficient quality for a range ofusers.Notwithstanding current arrangements, there are
many reasons why decision-makers may wish to performan analysis of other available geocoding platforms, inpart to identify other alternatives that might work better,be cheaper, or offer an enhanced set of services. In par-ticular, government systems continue to be enhanced,the cost of hardware continues to drop, and data pro-cessing operations within government agencies are con-tinually reviewed for opportunities for modernizationand streamlining to better serve the public at lowercosts. Government departments and private industrycontinually re-evaluate practices to seek better ways ofoperating.The purpose of the methodology developed here is to
act as a tool for gathering data for use by decision-makers. The quantitative data generated by the frame-work presented here must be used in coordination withother strategic initiatives within an organization in orderto make the most informed and rational decision, giventhe specific context and plan of an organization.
Endnotesahttp://geocoder.us/bhttp://www.census.gov/geo/www/tiger/chttp://www.pagcgeo.org/
Competing interestsThe authors declare they have no competing interests.
Authors’ contributionsDWG conceived of the study design, performed data analysis, and draftedthe manuscript. MB contributed to study design, ran the experiments, andperformed data analysis. NM contributed to study design and facilitated theacquisition of test software and reference data. GC and DR contributed tostudy design, facilitated the acquisition and preparation of study data,enabled study execution. AF, JB & JS contributed to study design, datapreparation, and analysis. All authors contributed to and reviewed the finalmanuscript.
AcknowledgementsThis study was performed with support from the Cooperative ResearchCenter for Spatial Information (CRC-SI) under contract number P4.43 and theWA DoH under contract number P4.43. Dr. Goldberg was support in part byaward number 5P30ES007048 from the US National Institute ofEnvironmental Health Sciences, contract number N01-PC-35139 from the USNational Cancer Institute, and by cooperative agreement number1H13EH000793-01 from the US Centers for Disease Control and Prevention.The authors wish to thank staff from the Western Australia Department ofHealth; Curtin University; CRC-SI; New South Wales Department of Health;Landgate for contributions which facilitated the execution of this work.
Author details1Department of Geography, Texas A&M University, College Station, Texas,USA. 2Centre for Population Health Research, Curtin University, Perth,Western Australia, Australia. 3Cooperative Research Centre for SpatialInformation, Perth, Western Australia, Australia. 4Data Linkage Branch,Western Australia Department of Health, Perth, Western Australia, Australia.
Received: 7 August 2013 Accepted: 30 September 2013Published: 8 November 2013
References1. Zandbergen PA: Geocoding quality and implications for spatial analysis.
Geogr Compass 2009, 3(2):647–680.2. Goldberg D: A geocoding best practices guide. North American Association of
Central Cancer Registries: Springfield, IL; 2008.3. Mazumdar S, Rushton G, Smith BJ, Zimmerman DL, Donham KJ: Geocoding
accuracy and the recovery of relationships between environmentalexposures and health. Int J Health Geogr 2008, 7:13–31.
4. McElroy JA, Remington PL, Trentham-Dietz A, Roberts SA, Newcomber PA:Geocoding addresses from a large population based study: lessonslearned. Epidemiology 2003, 14(4):399–407.
5. Oliver MN, Matthews KA, Siadaty M, Hauck FR, Pickle LW: Geographic biasrelated to geocoding in epidemiologic studies. Int J Health Geogr 2005,4:29–38.
6. Rushton G, Armstrong MP, Gittler J, Greene BR, Pavlik CE, West MM,Zimmerman DL: Geocoding in cancer research: a review. Am J Prev Med2006, 30(2):S16–S24.
7. Schootman M, Sterling DA, Struthers J, Yan Y, Laboube T, Emo B, Higgs G:Positional accuracy and geographic bias of four methods of geocodingin epidemiologic research. Ann Epidemiol 2007, 17(6):379–387.
8. Skelly C, Black W, Hearnden M, Eyles R, Weinstein P: Disease surveillance inrural communities is compromised by address geocoding uncertainty: acase study of campylobacteriosis. Aust J Rural Health 2002, 10(2):87–93.
9. Zandbergen PA: Influence of geocoding quality on environmentalexposure assessment of children living near high traffic roads.BMC Public Health 2007, 7:37–50.
10. Zhan FB, Brender JD, De Lima I, Suarez L, Langlois PH: Match rate andpositional accuracy of two geocoding methods for epidemiologicresearch. Ann Epidemiol 2006, 16(11):842–849.
11. Gilboa SM, Mendola P, Olshan AF, Harness C, Loomis D, Langlois PH, SavitzDA, Herring AH: Comparison of residential geocoding methods inpopulation-based study of air quality and birth defects. Environ Res 2006,101(2):256–262.
12. Johnson SD: Address matching with stand-alone geocoding engines: part2. Bus Geogr 1998, 6:30–36.
13. Lixin Y: Development and evaluation of a framework for assessing theefficiency and accuracy of street address geocoding strategies. Albany, NY:University at Albany, State University of New York; 1996.
14. Lovasi GS, Weiss JC, Hoskins R, Whitsel EA, Rice K, Erickson CF, Psaty BM:Comparing a single-stage geocoding method to a multi-stage geocod-ing method: how much and where do they disagree? Int J Health Geogr2007, 6:12–23.
15. Swift JN, Goldberg DW, Wilson JP: Geocoding best practices: review of eightcommonly used geocoding systems. Los Angeles, CA: University of SouthernCalifornia GIS Research Laboratory; 2008.
16. Cayo MR, Talbot TO: Positional error in automated geocoding ofresidential addresses. Int J Health Geogr 2003, 2:10–22.
17. Davis CA Jr, Fonseca FT: Assessing the certainty of locations produced byan address geocoding system. GeoInformatica 2007, 11(1):103–129.
18. Goldberg D, Cockburn M: The effect of administrative boundaries andgeocoding error on cancer rates in California. Spat Spatio-TemporalEpidemiol 2012, 3(1):39–54.
19. Karimi HA, Durcik M, Rasdorf W: Evaluation of uncertainties associatedwith geocoding techniques. J Comput Aided Civ Infrastruct Eng 2004,19(3):170–185.
20. Nicoara G: Exploring the geocoding process: a municipal case study usingcrime data. Dallas, TX: University of Texas at Dallas; 2005.
21. Whitsel EA, Quibrera PM, Smith RL, Catellier DJ, Liao D, Henley AC, Heiss G:Accuracy of commercial geocoding: assessment and implications.Epidemiol Perspect Innov 2006, 3:8–20.
22. Zandbergen PA: A comparison of address point, parcel and streetgeocoding techniques. Comput Environ Urban Syst 2008, 32:214–232.
23. Abe T, Stinchcomb DG: Geocoding practices in cancer registries. InGeocoding health data - the use of geographic codes in cancer prevention andcontrol, research, and practice. Edited by Rushton G, Armstrong MP, Gittler J,Greene BR, Pavlik CE, West MM, Zimmerman DL. Boca Raton, FL: CRC Press;2008:195–223.

Goldberg et al. International Journal of Health Geographics 2013, 12:50 Page 15 of 15http://www.ij-healthgeographics.com/content/12/1/50
24. Goldberg D: Geocoding best practices survey. Los Angeles, CA: University ofSouthern California GIS Research Laboratory; 2009.
25. Sperling J: Enabling the national spatial data infrastructure: the need for anational geocoding service center. U.S. Federal Geographic Data Committee:U.S Federal Geographic Data Committee; 2002.
26. Ward MH, Nuckols JR, Giglierano J, Bonner MR, Wolter C, Airola M, Mix W,Colt JS, Hartge P: Positional accuracy of two methods of geocoding.Epidemiology 2005, 16(4):542–547.
27. Johnson SD: Address matching with commercial spatial data: part 1.Bus Geogr 1998:24–32.
28. Christen P, Churches T, Willmore A: A probabilistic geocoding system basedon a national address file. Proceedings of the Australasian Data MiningConference: Cairns, AU; 2004.
29. Zandbergen PA: Geocoding accuracy considerations in determining residencyrestrictions for sex offenders. Crim Justice Policy Rev 2009, 20(1):62–90.
30. Zandbergen PA: Influence of street reference data on geocoding qualit. GeocartoInt 2010, 26(1):35–47. Corrected proof published online December 4, 2010.
31. Wu J, Funk TH, Lurmann FW, Winer AM: Improving spatial accuracy ofroadway networks and geocoded addresses. Trans GIS 2005, 9(4):585–601.
32. Bakshi R, Knoblock CA, Thakkar S: Exploiting online sources to accuratelygeocode addresses. In Proceedings of the 12th annual ACM international workshopon geographic information systems.Washington, DC: ACM Press; 2004:194–203.
33. Goldberg D, Cockburn M: Improving geocode accuracy with candidateselection criteria. Trans GIS 2010, 14(s1):149–176.
34. Boscoe FP: The science and art of geocoding. In Geocoding health data -the use of geographic codes in cancer prevention and control, research, andpractice. Edited by Rushton G, Armstrong MP, Gittler J, Greene BR, Pavlik CE,West MM, Zimmerman DL. Boca Raton, FL: CRC Press; 2008:95–109.
35. Christen P, Churches T: A probabilistic deduplication, record linkage andgeocoding system. Proceedings of the Australian Research Council HealthData Mining Workshop: Canberra, AU; 2005.
36. Jaro M: Record linkage research and the calibration of record linkagealgorithms. In Statistical research division report series. Washington, DC:United States Census Bureau; 1984.
37. Jaro M: Advances in record-linkage methodology as applied to matchingthe 1985 Census of Tampa, Florida. J Am Stat Assoc 1989, 1989(89):414–420.
38. Yang D-H, Bilaver LM, Hayes O, Goerge R: Improving geocoding practices:evaluation of geocoding tools. J Med Syst 2004, 28(4):361–370.
39. Goldberg D, Wilson JP, Knoblock C, Ritz B, Cockburn M: An effective andefficient approach for manually improving geocoded data. Int J HealthGeogr 2008, 7:60–80.
40. Bonner MR, Han D, Nie J, Rogerson P, Vena JE, Freudenheim JL: Positionalaccuracy of geocoded addresses in epidemiologic research.Epidemiology 2003, 14(4):408–411.
41. Hurley SE, Saunders TM, Nivas R, Hertz A, Reynolds P: Post office boxaddresses: a challenge for geographic information system-based studies.Epidemiology 2003, 14:386–391.
42. Kravets N, Hadden WC: The accuracy of address coding and the effects ofcoding errors. Health Place 2007, 13(1):293–298.
43. Wey CL, Griesse J, Kightlinger L, Wimberly MC: Geographic variability ingeocoding success for West Nile virus cases in South Dakota.Health Place 2009, 15(4):1108–1114.
44. Krieger N, Chen JT, Waterman PD, Soobader MJ, Subramanian SV, Carson R:Geocoding and monitoring of US socioeconomic inequalities inmortality and cancer incidence: does the choice of area-based measureand geographic level matter? Am J Epidemiol 2002, 156(5):471–482.
45. Krieger N, Waterman PD, Chen JT, Soobader MJ, Subramanian SV, Carson R:ZIP code caveat: bias due to spatiotemporal mismatches between ZIPcodes and US census-defined areas: the public health disparitiesgeocoding project. Am J Public Health 2002, 92(7):1100–1102.
46. Krieger N, Waterman P, Lemieux K, Zierler S, Hogan JW: On the wrong sideof the tracts? Evaluating the accuracy of geocoding in public healthresearch. Am J Public Health 2001, 91(7):1114–1116.
47. Zimmerman DL, Fang X, Mazumdar S, Rushton G: Modeling the probabilitydistribution of positional errors incurred by residential addressgeocoding. Int J Health Geogr 2007, 6:1–16.
48. Duncan DT, Castro MC, Blossom JC, Bennett GG, Gortmaker SL: Evaluationof the positional difference between two common geocoding methods.Geospat Health 2011, 5(2):265–273.
49. Maps API reference - Google maps API - Google code. http://code.google.com/apis/maps/documentation/reference.html.
50. Yahoo! maps Web services - geocoding API. http://developer.yahoo.com/maps/rest/V1/geocode.html.
51. ArcGIS online geocoding service. http://geocode.arcgis.com/arcgis/index.html.52. North American association of central cancer registries. http://www.naaccr.org.53. Wang S: A CyberGIS framework for the synthesis of cyberinfrastructure,
GIS, and spatial analysis. Annu Assoc Am Geogr 2010, 100(3):535–557.54. Moncrieff S, Venkatesh S, West G: A framework for the design of privacy
preserving pervasive healthcare. In: IEEE International Conference onMultimedia and Expo. IEEE; 2009:1696–1699.
55. Beyer KMM, Schultz AF, Rushton G: Using ZIP codes as geocodes in cancerresearch. In Geocoding health data - the Use of geographic codes in cancerprevention and control, research, and practice. Edited by Rushton G,Armstrong MP, Gittler J, Greene BR, Pavlik CE, West MM, Zimmerman DL.Boca Raton, FL: CRC Press; 2008:37–68.
56. Goldberg D, Cockburn M: Toward quantitative geocode accuracy metrics.In Proceedings of the ninth international symposium on spatial accuracyassessment in natural resources and environmental sciences. Leicester, UK;2010:329–332.
57. Western Australian Land Information Authority: Property street address. Perth,WA: Western Australian Land Information Authority; 2012.
58. Public Sector Mapping Agency Australia Limited: Geocoded national addressfile. Canberra: ACT; PSMA Australia; 2012.
59. Goldberg D, Wilson J, Knoblock C: From text to geographic coordinates:the current state of geocoding. Urisa J 2007, 19(1):33–47.
60. Malczewski J: GIS-based land-use suitability analysis: a critical overview.Prog Plann 2004, 62(1):3–65.
doi:10.1186/1476-072X-12-50Cite this article as: Goldberg et al.: An evaluation framework for comparinggeocoding systems. International Journal of Health Geographics 2013 12:50.
Submit your next manuscript to BioMed Centraland take full advantage of:
• Convenient online submission
• Thorough peer review
• No space constraints or color figure charges
• Immediate publication on acceptance
• Inclusion in PubMed, CAS, Scopus and Google Scholar
• Research which is freely available for redistribution
Submit your manuscript at www.biomedcentral.com/submit