
Comparing distributed and face-to-face meetings for software architecture evaluation: A controlled...
24
Comparing distributed and face-to-face meetings for software architecture evaluation: A controlled experiment Muhammad Ali Babar & Barbara Kitchenham & Ross Jeffery Published online: 4 October 2007 # Springer Science + Business Media, LLC 2007 Editor: José Carlo Maldonado Abstract Scenario-based methods for evaluating software architecture require a large number of stakeholders to be collocated for evaluation meetings. Collocating stakeholders is often an expensive exercise. To reduce expense, we have proposed a framework for supporting software architecture evaluation process using groupware systems. This paper presents a controlled experiment that we conducted to assess the effectiveness of one of the key activities, developing scenario profiles, of the proposed groupware-supported process of evaluating software architecture. We used a cross-over experiment involving 32 teams of three 3rd and 4th year undergraduate students. We found that the quality of scenario profiles developed by distributed teams using a groupware tool were significantly better than the quality of scenario profiles developed by face-to-face teams (p <0.001). However, questionnaires indicated that most participants preferred the face-to-face arrangement (82%) and 60% thought the dis- tributed meetings were less efficient. We conclude that distributed meetings for developing scenario profiles are extremely effective but that tool support must be of a high standard or participants will not find distributed meetings acceptable. Keywords Architecture evaluation . Process improvement . Controlled experiments . Groupware support . Scenario development Empir Software Eng (2008) 13:39–62 DOI 10.1007/s10664-007-9052-6 M. A. Babar (*) Lero, University of Limerick, Limerick, Ireland e-mail: [email protected] B. Kitchenham : R. Jeffery National ICT Australia, Sydney, Australia B. Kitchenham e-mail: [email protected] R. Jeffery e-mail: [email protected]
-
Upload
independent -
Category
Documents
-
view
4 -
download
0
Transcript of Comparing distributed and face-to-face meetings for software architecture evaluation: A controlled...
Comparing distributed and face-to-face meetingsfor software architecture evaluation:A controlled experiment
Muhammad Ali Babar & Barbara Kitchenham &
Ross Jeffery
Published online: 4 October 2007# Springer Science + Business Media, LLC 2007Editor: José Carlo Maldonado
Abstract Scenario-based methods for evaluating software architecture require a large numberof stakeholders to be collocated for evaluation meetings. Collocating stakeholders is often anexpensive exercise. To reduce expense, we have proposed a framework for supportingsoftware architecture evaluation process using groupware systems. This paper presents acontrolled experiment that we conducted to assess the effectiveness of one of the key activities,developing scenario profiles, of the proposed groupware-supported process of evaluatingsoftware architecture. We used a cross-over experiment involving 32 teams of three 3rd and4th year undergraduate students. We found that the quality of scenario profiles developed bydistributed teams using a groupware tool were significantly better than the quality of scenarioprofiles developed by face-to-face teams (p<0.001). However, questionnaires indicated thatmost participants preferred the face-to-face arrangement (82%) and 60% thought the dis-tributed meetings were less efficient. We conclude that distributed meetings for developingscenario profiles are extremely effective but that tool support must be of a high standard orparticipants will not find distributed meetings acceptable.
Keywords Architecture evaluation . Process improvement . Controlled experiments .
Groupware support . Scenario development
Empir Software Eng (2008) 13:39–62DOI 10.1007/s10664-007-9052-6
M. A. Babar (*)Lero, University of Limerick, Limerick, Irelande-mail: [email protected]
B. Kitchenham : R. JefferyNational ICT Australia, Sydney, Australia
B. Kitchenhame-mail: [email protected]
R. Jefferye-mail: [email protected]
1 Introduction
Software architecture evaluation has proven an effective quality assurance technique that helpsdiscover potential architectural risks before they become expensive to fix (Bass et al. 2003;Clements et al. 2002; Maranzano et al. 2005). Most of the current software architectureevaluation approaches rely heavily on the collaborative efforts of multiple stakeholders toperform various tasks such as defining and refining business drivers, creating scenario profiles,i.e. a set of scenarios to precisely specify required quality requirements such as security,maintainability, and performance, and mapping the scenarios onto the proposed architecture toreason about the suitability of the various architectural decisions (Ali-Babar et al. 2004).
Most of these tasks are performed in a face-to-face (F2F) meeting by collocating a largenumber of stakeholders (Maranzano et al. 2005). In fact, Kazman and Bass (2002) suggestthat the software architecture evaluation meetings be held away from the development sitesto avoid potential interruptions or distractions. Collocating stakeholders for a number ofsessions can be an expensive exercise, which may also cause scheduling difficulties (Perryet al. 2002). Moreover, stakeholders may have to travel if they are geographically separated,which is becoming more likely as companies are increasingly adopting distributed softwaredevelopment paradigm (Herbsleb and Moitra 2001; Perry et al. 2002). Organizations areconcerned about the time, costs and logistical problems involved in collocating stakeholders(Paasivaara et al. 2003; Perry et al. 2002). Furthermore, current methods provide little sup-port to address several issues that characterise F2F meetings, such as conformity pressures,dominating personalities, and cultural differences (Nunamaker et al. 1996–1997; Nunamakeret al. 1991). Collectively, such issues may hinder the widespread adoption of the softwarearchitecture evaluation practices.
In an attempt to find appropriate techniques and technologies to address some of theseissues, we have proposed that Internet-based groupware systems can provide a cost effectiveand efficient alternative to the F2F software architecture evaluation meetings. Groupwaresystems have been successfully used to support geographically distributed teams in require-ments engineering and software inspection. Findings of empirical studies have confirmedthese computer-mediated processes as promising ways to minimise meeting costs, maximiseasynchronous work and preserve a number of organisational resources (Boeham et al. 2001;Damian et al. 2000; Genuchten et al. 1997–1998; Genuchten et al. 2001).
Given the positive results of using groupware systems in similar domains, it has beenproposed that groupware systems can be used to improve the software architecture evaluationprocess without compromising the quality of the artifacts and results (Ali-Babar et al. 2006a).However, there are a number of important issues that need to be studied before making anyconclusive claim about the effectiveness of using groupware systems for supporting variousactivities of the software architecture evaluation process in a distributed arrangement. Forexample, we need to understand the changes required in the existing architecture evaluationmethods. We also need to identify appropriate groupware technologies to support theproposed process, and gain a better understanding of how these technologies facilitate orhinder social processes involved in architecture evaluation.
We have designed an empirical research project to assess the feasibility of performing oneof the key activities of the software architecture evaluation process, developing scenarioprofiles, in a distributed arrangement using groupware system and to identify the uniquefeatures that a groupware system should have to successfully support the proposed process.Moreover, our research program will also attempt to understand the socio-technical aspects ofusing groupware systems in the software architecture evaluation process. The design of this
40 Empir Software Eng (2008) 13:39–62
research project is based on a framework of experimentation (Basili et al. 1986) with guide-lines provided in (Kitchenham et al. 2002).
Our experimental project consists of a pilot study followed by a large-scale experiment.The pilot study was run as a formal experiment using the experimental design described inthis paper (Ali-Babar et al. 2006b). In this paper we report the results of the large-scaleexperiment.
2 Research Background
2.1 Software Architecture Evaluation
Recently it has been widely recognized that quality attributes (such as maintainability,reliability etc.) of complex software intensive systems largely depend on the overall softwarearchitecture1 of such systems (Bass et al. 2003). Since software architecture plays a vitalrole in achieving system wide quality attributes, it is important to evaluate a system’sarchitecture with regard to desired quality requirements.
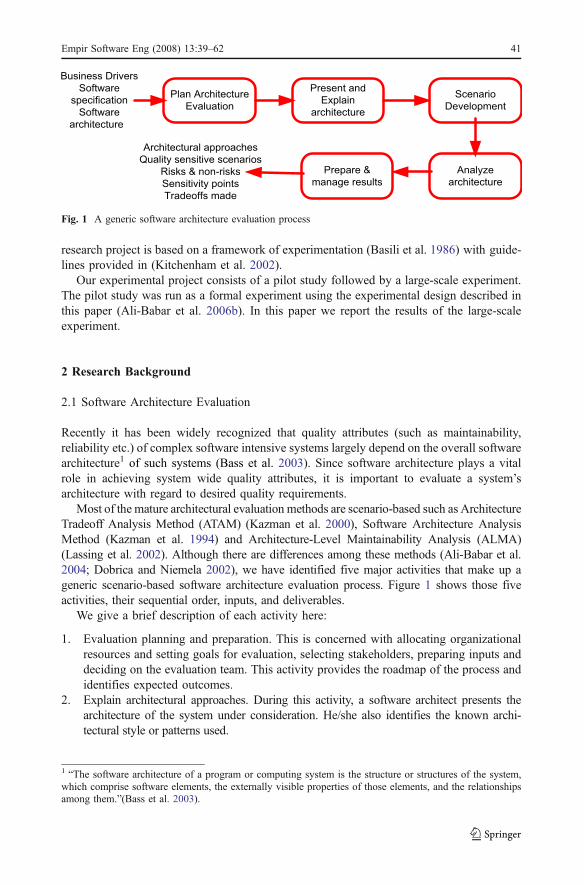
Most of the mature architectural evaluation methods are scenario-based such as ArchitectureTradeoff Analysis Method (ATAM) (Kazman et al. 2000), Software Architecture AnalysisMethod (Kazman et al. 1994) and Architecture-Level Maintainability Analysis (ALMA)(Lassing et al. 2002). Although there are differences among these methods (Ali-Babar et al.2004; Dobrica and Niemela 2002), we have identified five major activities that make up ageneric scenario-based software architecture evaluation process. Figure 1 shows those fiveactivities, their sequential order, inputs, and deliverables.
We give a brief description of each activity here:
1. Evaluation planning and preparation. This is concerned with allocating organizationalresources and setting goals for evaluation, selecting stakeholders, preparing inputs anddeciding on the evaluation team. This activity provides the roadmap of the process andidentifies expected outcomes.
2. Explain architectural approaches. During this activity, a software architect presents thearchitecture of the system under consideration. He/she also identifies the known archi-tectural style or patterns used.
1 “The software architecture of a program or computing system is the structure or structures of the system,which comprise software elements, the externally visible properties of those elements, and the relationshipsamong them.”(Bass et al. 2003).
Fig. 1 A generic software architecture evaluation process
Empir Software Eng (2008) 13:39–62 41
3. Scenario development. The purpose of this activity is to develop scenarios to characterizethe quality requirements for a system. For instance the maintainability quality require-ments can be specified by software change scenarios. This activity usually involves ameeting of stakeholders who develop scenarios to define precisely (and if possiblenumerically) the quality requirements of a system. We used a two stages process ofdeveloping scenario profiles in this research: during the first stage the participants work bythemselves to develop scenario profiles and during the second stage the participants worktogether to develop an integrated set of scenario profile.
4. Analyze architectural approaches. This activity is aimed at analyzing architecturalapproaches with respect to the scenarios developed during the previous stage. The mostcommon approach is to map each scenario onto the architecture and assess whether or notthe architecture satisfies that scenario. This activity identifies risks, sensitivity points andtrade-off points.
5. Interpret and present results. This activity is concerned with summarizing the results ofall previous activities, interpreting the deliverables and presenting results to the sponsors.
2.2 Groupware Systems
Groupware systems are computer-based systems that support communication, collaboration,and coordination among a group of people working towards a common goal; most of the timethese people are geographically distributed (Ellis et al. 1991). These systems have emergedover the past decade as mainstream business applications to support a variety of problemsolving and planning activities in a wide variety of organizations. A key benefit of groupwaresystems is to increase efficiency compared to F2F meetings (Genuchten et al. 2001).
It has been shown that F2F meetings for software inspections can both incur substantialcost, and lengthen the development process (Perry et al. 2002). Some studies have called intoquestion the value of F2F inspection meetings (Porter and Johnson 1997). Studies have alsoindicated that computer tools, including groupware, may improve inspections (Sauer et al.2000). Groupware-supported inspection processes have been successfully evaluated as apromising way to minimise meeting costs, maximise asynchronous work and conserveorganisational resources (Genuchten et al. 2001; Halling et al. 2001). Moreover, it has alsobeen shown that the software inspection process can be improved with group processsupport (Tyran and George 2002).
2.3 Scope of this Experiment
This research project evaluates the effectiveness of a groupware-supported architectureevaluation process by means of a controlled experiment. We have limited the scope of ourresearch inquiry to scenario development activity (i.e., third activity in Fig. 1) of thearchitecture evaluation process. We focus on the scenario development activity for severalreasons. Developing scenario profiles to specify quality attributes of a system is consideredto be the most expensive and time-consuming activity of the software architecture evaluationprocess. The accuracy of the results of an evaluation exercise is largely dependent on thequality of the scenarios used (Bass et al. 2003; Bengtsson and Bosch 2000). Moreover, thecontrolled experiment was planned to be run by recruiting the 3rd and 4th yearundergraduate students of a software engineering course and it was not possible to coverall topics of the software architecture evaluation process, e.g. architecture presentation andexplanation, evaluating architectural approaches, and others.
42 Empir Software Eng (2008) 13:39–62

Thus, our controlled experiment is designed to compare the performance of F2F groupsand Distributed groups based on the quality of the scenario profiles, developed by both typesof groups. We suggest that if it can be demonstrated that the quality of scenario profilesgenerated in a distributed arrangement using a groupware system is not significantly worsethan the quality of scenario profiles generated in a F2F arrangement, managers would find thecost savings inherent in a distributed meetings balanced any minor loss in quality of themeeting outcomes.
2.4 Scenario Profiles
Scenarios have been used for a long time in research and practice of many disciplines (militaryand business strategy, decision making, etc). A scenario is a textual, system independentspecification of a quality attribute (Bass et al. 2003). The software engineering communityuses scenarios in user-interface engineering, requirements elicitation, performance modeling,and more recently in software architecture evaluation (Kazman et al. 1996).
Scenarios make it possible to evaluate most quality attributes, e.g., we can use scenarios thatrepresent failure to examine availability and reliability, scenarios that represent change requeststo analyze modifiability, or scenarios that represent security threats to analyze security.Moreover, scenarios are normally very concrete, enabling the system user to understand theirdetailed effect (Lassing et al. 2003). A set of scenarios is called a scenario profile as Table 1shows a scenario profile for performance quality requirements.
It is important to note that the use of the term ‘scenarios’ in software architecture evaluationis different to the term used in Object-Oriented design methods where the term “scenarios”generally refers to use-case scenarios, i.e., scenarios describing system’s functions. Instead,quality attribute scenarios describe an action, or sequence of actions that might occur related tothe system to be built using a particular architecture. The description of a quality attributescenario includes a stimulus/response pair of which response part is usually measurablebehavior such as X number of transactions in Y time period. Hence, a change scenario describesa certain maintenance task or a change to be implemented (Bengtsson and Bosch 2000).Software architecture is assessed with respect to only the most relevant scenarios. Relevancyof scenarios can be decided based on some kind of weighting given, votes assigned, orprobability of occurrence within a certain time. The weight, votes or probability of occurrenceis assigned by stakeholders through a prioritization process to determine the most relevantscenarios, i.e., the most important ones. However, this study does not address that aspect ofthe scenarios. Rather, this study determines the relevancy of a scenario based on a rankingmethod described in section 3.3.4.
Table 1 A scenario profile for performance quality attribute
Quality factor Scenario description
Initialization System performs all initialization activities within 10 s of starting upLatency Run simulations with no instantaneous lags greater than 5 s, no average lags greater than 3 sCapacity Run-time simulation with debug enabledLatency Finish data collection within 30 s of simulation terminationThroughput Finish data collection request from 3 network sensors within 10 s
Empir Software Eng (2008) 13:39–62 43
3 Empirical Asssessment
3.1 Research Questions and Hypotheses
The results of the studies using groupware support for software development processesdescribed in (Boeham et al. 2001; Damian et al. 2000; Genuchten et al. 2001; Sakthivel2005) have helped us to identify the following three research questions:
1. How does groupware support affect the quality of the deliverables of software architectureevaluation process?
2. How does groupware support affect the satisfaction of the participants with the processand the deliverables of architecture evaluation process?
3. What type of features should a groupware application provide to successfully support adistributed architecture evaluation process?
Before addressing the first research question, we reviewed the literature on distributedmeetings. Several empirical studies of using groupware systems to support various activities(such as decision making, idea generation, software inspection, and requirements negotiation)have reported that groupware systems help improve a process and its outcome (Damian et al.2000; Genuchten et al. 2001; Tyran et al. 1992; Valacich et al. 1991). However, based on anextensive review of the literature on empirical studies of using groupware systems,(Fjermestad and Hiltz 1998–1999) reported that the introduction of a groupware systemmay not always result in significant improvement to the process being supported. Fur-thermore, there are research findings that warn that the introduction of a groupware system tosupport a process (such as group decision making) can be counter-productive and might havesome negative affect on the quality of the deliverables produced (Jarvenpaa et al. 1988;Kiesler et al. 1984).
According to the theoretical framework of task/media fit (McGrath and Hollingshead 1994),the literature on the groups’ performance in a computer-supported distributed arrangementversus a F2F arrangement presents a complex and ambiguous picture. Nonetheless, task/media fit and socio-psychological theories suggest that it is reasonable to expect an improve-ment in the architecture evaluation process when using a groupware system (Hiltz and Turoff1978; Kiesler et al. 1984). Thus, the hypotheses arising from the first research question are:
Null Hypothesis That there is no difference between the quality of scenario profiles developedby groups working in F2F meetings and groups working in distributed meetings usinggroupware system.
Alternative Hypothesis 1 The quality of scenario profiles developed by groups working inF2F meetings is significantly better than the quality of scenario profiles developed by groupsworking in distributed meetings using groupware system.
Alternative Hypothesis 2 The quality of scenario profiles developed by groups working indistributed meetings using groupware system is significantly better than the quality of scenarioprofiles developed by groups working in F2F meetings.
As far as our proposal for using distributed meetings is concerned, the idea is useful if thenull hypotheses cannot be rejected or the null hypothesis is rejected in favour of alternativehypothesis 2.
44 Empir Software Eng (2008) 13:39–62

In order to answer the second research question, we planned to use a questionnairedesigned to determine the satisfaction of the participants with the groupware-supportedprocess and its deliverables. For the third research question, we planned to use differentstrategies including a questionnaire to ask the participants’ opinion of the types of featuresrequired; task analysis of architecture evaluation process; and gathering anecdotal evidencefrom the literature, and colleagues.
3.2 Experiment Design
We used an AB/BA crossover design (Senn 2002). In a crossover study design, the par-ticipants are assigned to a sequence of treatments in order to study differences betweenindividual treatments. This is a balanced design in which each experimental unit (i.e. groupof three participants for this study) performs two scenario profile development tasks for twodifferent systems. Half of the groups use a F2F meeting for their first task followed by adistributed meeting for the second task. The other groups use a distributed meeting for the firsttask and a F2F task for the second meeting. Because scenario profiles need to be concrete, wedecided to select only one quality attribute, maintainability, for developing scenario profiles.That means the subjects are required to develop software change scenarios. However, theexperiment design allows the results to be applicable to scenario profiles for other qualityattributes as well (Bengtsson 2002). Table 2 shows the experimental design and groupassignments.
The formal model of a cross-over experiment is:
Yijk ¼ mþ t i þ oj þ lik þ "ijk
Where
Yijk is the outcome (i.e. the score of the scenario profile) for group k that used treatmenti (where i refers to the F2F or the distributed meeting arrangement) in sequence order j(where j refers to F2F first or F2F second).t i is the treatment effect for treatment i (where i refers to the F2F or the distributedmeeting arrangement)Oj is the sequence order effect for sequence order j (where j refers to F2F first or F2Fsecond).lik is the interaction effect between treatment i and sequence order j. This is assumed tobe negligible for AB/BA cross-over designs."ijk is the error for group k that used treatment i in sequence order j.
The advantages of crossover design are that they require fewer subjects than paralleldesigns and when there is no interaction (or negligible interaction) between treatments andorder, they are resilient to subject differences and maturation effects. The most significant
Table 2 Experimental design and group assignments
Material Treatments
F2F arrangement Distributed arrangement
Zwiki system A=25 groups of 3 members B=25 groups of 3 membersLiveNet B A
Empir Software Eng (2008) 13:39–62 45
disadvantage of a crossover design is that it is inappropriate if there is a large interaction betweentreatment and order. A treatment-order interaction occurs when doing one treatment first has aneffect that is different from doing the other treatment first. There is no interaction if there is anorder effect, such as a learning effect, that affects both treatments equally (Kitchenham et al.2004; Senn 2002).
Independent variable manipulated by this study is type of meeting arrangement (groupinteraction), with two treatments, F2F meeting and distributed meeting.
Dependent variable for this study is the quality of the scenario profiles developed in F2Fand distributed arrangements.
3.3 Experimental Logistics
3.3.1 Participants and Training
The participants were 3rd and 4th year students of software engineering and computerengineering degrees at the University of New SouthWales, Australia. In order to motivate theparticipants, the experimental tasks were course assessment tasks. However, the participantswere explicitly not advised that the assessment tasks were part of a formal experiment in orderto avoid any spurious effect as a result of the participants being aware of being studied (i.e.avoiding the “Good Subject” effect, (Rosnow and Rosenthal 1997)). Based on the results ofpower analysis of the pilot study data, 50 experiment units (groups of 3 subjects) wereconsidered a sufficient sample size. Our study was part of a course on software qualitymanagement in which 159 students were enrolled, which gave us the required number ofexperimental units.
For training purposes, there were two lectures, each of 2 h, covering the software archi-tecture evaluation process, and current methods of developing change scenarios to specifyquality attributes. Participants were provided with support materials at the beginning ofexperiment. They also received training on using a collaborative tool, LiveNet (Biuk-Aghaiand Hawryszkiewyez 1999), which was used to support the distributed meetings. Thiscollaborative application was an integral part of the course as the students were required touse the application to participate in the discussions on course related topics.
3.3.2 Software Requirements Specifications
This study used the Software Requirements Specification (SRS) of two different applications,an open source web-based content management system called Zwiki (2004) and the LiveNetweb-based collaborative system (Biuk-Aghai and Hawryszkiewyez 1999). It providesseveral collaborative features to support group work. We prepared simplified versions ofeach SRS and descriptions of these systems along with some screen shots to provide theparticipants as clear a picture of the systems as possible. There was also a verbal briefing onvarious aspects of both systems. In addition, we provided the participants with documentsexplaining software inspection.
3.3.3 Collaborative application
The members of distributed groups were required to brainstorm and structure their scenarioprofiles in a distributed arrangement using a web-based groupware system. We selected thegeneric collaborative application, LiveNet, based on its features and ease of availability for
46 Empir Software Eng (2008) 13:39–62

research purposes. LiveNet provides a generic workflow engine and different features tosupport collaboration among geographically distributed members of a team. It enables usersto create workspaces and define elements of a particular workspace, and supports emergentprocesses.
3.3.4 Measuring Quality of Scenario Profiles
In order to assess the performance of the groups working in a distributed arrangementcompared with the groups working in a F2F arrangement for the software architectureevaluation process, the quality of the artefacts developed in each arrangement needs to becompared. Since our study focuses on only one activity of the software architecture evaluationprocess, developing scenario profiles, it requires a method of comparing the quality of thescenario profiles developed in the distributed and the F2F arrangements.
Bengtsson (2002) proposed a method to measure the quality of scenario profiles based ona ranking process, which compares each scenario profile with a reference scenario profile. Inorder to use this method, the actual scenario profile for each individual and group must berecoded into a standard format for analysis. The quality of each of the recoded scenarioprofile is determined by the ranking assigned to that scenario profile based on its comparisonwith a reference scenario profile constructed from all the unique scenarios found in therecoded scenario profiles created for a particular system. This approach to assigning rankingto each scenario profile by comparing it with a reference scenario profile is based on theassumption that the importance of a scenario can be determined by the number of scenarioprofiles in which that particular scenario appears. The appearance of a scenario in a scenarioprofile shows that the creator of that profile considers that scenario relevant. Hence, the moreparticipants that mention a scenario, the more relevant it becomes. That means the mostrelevant scenario will have the highest frequency. The most relevant scenario profile consistsof the most relevant scenarios, which gives this profile the highest score. When scenarioprofiles are ranked by comparing them to the “reference scenario profile”, it is possible toassess which scenario profile is better than the other. A more formal way of describing theprocess of assigning a score to a particular scenario profile has been presented by Bengtsson(Bengtsson 2002) as follows:
A set of all the scenario profiles created during a scenario development work is denoted byQ={P1, P2,...Pn}, where Pi is a set of scenarios in one profile denoted by Pi={s1,...sn}. Thereference profile R is denoted as R={u1,u2,..., un}, where ui is a scenario that exists in one ormore scenario profiles P (individual or group) but it has only one instance recorded in thereference scenario profile. A function f(ui) returns the number of occurrences of the uniquescenario in Q, while a function m(si) maps a scenario from a scenario profile to a uniquescenario in the reference scenario profile. The score of a scenario profile is calculated asfollows:
Score Pið Þ ¼X
sx"Pi
f m sxð Þð Þ
Using this approach, the reference scenario profile is constructed by taking the union of allunique scenarios reported in one or more scenario profiles. It is usually done by taking eachscenario reported in individual or group scenario profile and checking whether there is alreadya scenario in the reference scenario profile describing a semantically equivalent situation. If asemantically or lexically equivalent scenario exists the frequency for that scenario in thereference scenario profile is incremented, otherwise, a new scenario is added to the reference
Empir Software Eng (2008) 13:39–62 47

scenario profile with a frequency of one. Lexically different, scenarios can be semanticallyequivalent. It is the job of the reference scenario profile builder to decide which scenarios aresemantically equivalent during the recoding process.
Since the reference scenario profile construction depends on the subjective judgment andknowledge of an individual, two researchers recoded scenario profiles and constructed tworeference scenario profiles independently. The reliability of the coding was assessed bycomparing the reference scenario profiles constructed by the two researchers, who checkedand discussed lexical adjustments to be made in scenario profiles to construct the referencescenario profile and the assignment of scores to each scenario profile. In addition to assigningscenarios to reference profile, each coder could nominate new scenarios or split old scenariosin the reference scenario profile developed by the other coder. Any disagreement wasdiscussed and resolved before assigning the final marks to group scenario profiles.
3.3.5 Post-Experiment Questionnaire
At the end of the experiment, each participant completed a questionnaire. The questionnaireasked the participant to give their opinion of the value of the different meeting arrangementsfor developing scenarios. This questionnaire (see Appendix A) required the participants torespond by circling a choice on a five point ordinal scale and providing a short explanationof their respective choice.
3.4 Experiment Validity
3.4.1 Threats to Internal Validity
Threats to internal validity are those factors that may affect the value of the dependent variablesapart from the independent variable (Kitchenham et al. 2002; Toothaker and Miller 1996).Wohlin et al. (2000) identify four main threats to internal validity: selection effects,maturation effects, instrumentation effects, and presentation effects (Wohlin et al. 2000).These threats are a problem for quasi-experiments, but are not relevant when using acrossover design with random allocation to sequence which is designed to avoid theseproblems (Senn 2002). However, using a crossover design is problematic if there is aninteraction between sequence and treatment. Since the treatment is about meeting structurenot about constructing the scenarios, we believe the probability of a significant interactioneffect is low. However, since one SRS concerns LiveNet which is actually used during theexperiment, it may be that individuals who used the distributed system first (when assessingscenarios for the Zwiki system) may find it easier to construct scenarios in the F2Farrangement on the LiveNet system because of their previous practical experience of using it.Thus, it would have been preferable to use the LiveNet system for the first task rather than forthe second task.
Another threat to the internal validity of our experiment is the method used to measure thequality of the scenario profiles. Bengtsson and Bosch (2000) developed and validated thismethod and discussed various threats to its internal validity and how they were addressed.However, one of the potential threats, skill, knowledge, and bias of reference profilebuilder, associated with this method needs to be addressed for each experiment. Weaddressed this issue by getting two researchers to create two independent reference scenarioprofiles and review each others’ reference scenario profiles. During the review process,each researcher could add more scenarios or split old scenarios in the reference scenarioprofile developed by the other researcher. Any disagreements were discussed and resolved
48 Empir Software Eng (2008) 13:39–62
before building a reference scenario profile for scoring the scenario profiles developed byboth the treatment and control groups. Moreover, it should also be noted that this approachranks scenarios based no their frequency of occurrence, which means a scenario with thehigh frequency may be the one that is the most obvious one rather than the most importantor non-trivial one. However, during architecture evaluation, scenarios with the highestnumber of votes are evaluated and that voting system is based on the frequency of votersfor a scenario.
3.4.2 Threats to External Validity
Threats to external validity are those that may limit the applicability of the experimental resultsto industry practices. The experiment considered three threats to external validity: participantrepresentativeness, instrumentation representativeness and process representativeness.
The participant representativeness is an issue because the participants were the 3rd and 4thyear undergraduate students with predominantly technical background. The participants hadno prior experience of software architecture evaluation process. They had limited experienceof developing scenarios for quality attributes. They also had very limited knowledge of theinspection process, which we attempted to address during training session and by providingthem with supporting documents. The amount of training provided to the participants of thisstudy was equivalent to the amount of training organizations usually provide to employeesthey require to participate in the software architecture evaluation process. Researchers havesuggested that software engineering students can be used instead of professionals for empiricalstudies (Host et al. 2000). The fact that most of the participants of our study had technicalbackground, computer science or engineering, may pose more of a real threat becausesoftware architecture evaluation in an industrial setting usually involves different classes ofparticipants from different fields such as technical, business, management, sales, and legal.Moreover, stakeholders may have much more domain knowledge than the participants inthis study but some (at least) will have less technical expertise. However, this aspect is anunavoidable factor when conducting an experiment with student participants.
To minimize threat to instrumentation representativeness, we used SRSs for systems thatare representative of real world systems: a web-based content management system and a web-based distributed collaboration support system. The participants of our study were fairlyfamiliar with web-based systems as they were real users of different web-based systems.However, the SRS provided to the participants is atypical of industrial SRS in terms of lengthand complexity. The participants used a relatively short and simple SRS document and thetime available for the scenario development task reflected the relatively simplicity of the SRS.We assume that the length of time allocated to the scenario development task should beadjusted according to the complexity of the SRS. This issue would affect F2F and distributedmeeting arrangements equally.
Another aspect of instrumentation representativeness we considered is the collaborativetool, LiveNet, used in this study. LiveNet is not a commercial standard tool targeted atsoftware architecture evaluation (in fact, to our knowledge, no such tool exists)2. Lack of anappropriate commercial standard tool means that the results of the distributed arrangementin this experiment are likely to be worse than could be obtained with a better quality tool.
2 There are a few tools developed to support distributed inspection such as IBIS and ISPIS. Although,software architecture evaluation is quite different to inspection, tools for distributed inspection may be usedto support distributed process of software architecture evaluation. For further discussion on this issue, see ourwork published in (Ali-Babar and Verner 2005).
Empir Software Eng (2008) 13:39–62 49
Finally, there may be a threat to the external validity if the scenario development process usedin our experiment is not representative of industrial practices for developing scenarios for softwarearchitecture evaluation. This is not an issue because the participants in our study followed ascenario development process that is quite similar to the one used for most of the scenario-basedsoftware architecture evaluation methods, e.g. ALMA (Lassing et al. 2002) and ATAM (Kazmanet al. 1999). Furthermore, Bengtsson and Bosch (2000) evaluated the two-staged scenariodevelopment process used in this study as the most effective and efficient process.
3.5 Experiment Operation
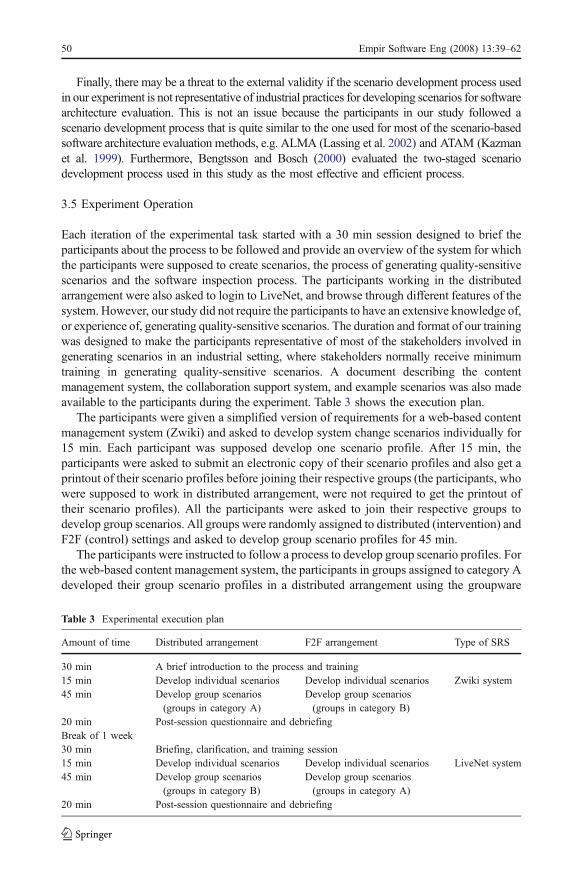
Each iteration of the experimental task started with a 30 min session designed to brief theparticipants about the process to be followed and provide an overview of the system for whichthe participants were supposed to create scenarios, the process of generating quality-sensitivescenarios and the software inspection process. The participants working in the distributedarrangement were also asked to login to LiveNet, and browse through different features of thesystem. However, our study did not require the participants to have an extensive knowledge of,or experience of, generating quality-sensitive scenarios. The duration and format of our trainingwas designed to make the participants representative of most of the stakeholders involved ingenerating scenarios in an industrial setting, where stakeholders normally receive minimumtraining in generating quality-sensitive scenarios. A document describing the contentmanagement system, the collaboration support system, and example scenarios was also madeavailable to the participants during the experiment. Table 3 shows the execution plan.
The participants were given a simplified version of requirements for a web-based contentmanagement system (Zwiki) and asked to develop system change scenarios individually for15 min. Each participant was supposed develop one scenario profile. After 15 min, theparticipants were asked to submit an electronic copy of their scenario profiles and also get aprintout of their scenario profiles before joining their respective groups (the participants, whowere supposed to work in distributed arrangement, were not required to get the printout oftheir scenario profiles). All the participants were asked to join their respective groups todevelop group scenarios. All groups were randomly assigned to distributed (intervention) andF2F (control) settings and asked to develop group scenario profiles for 45 min.
The participants were instructed to follow a process to develop group scenario profiles. Forthe web-based content management system, the participants in groups assigned to category Adeveloped their group scenario profiles in a distributed arrangement using the groupware
Table 3 Experimental execution plan
Amount of time Distributed arrangement F2F arrangement Type of SRS
30 min A brief introduction to the process and training15 min Develop individual scenarios Develop individual scenarios Zwiki system45 min Develop group scenarios
(groups in category A)Develop group scenarios(groups in category B)
20 min Post-session questionnaire and debriefingBreak of 1 week30 min Briefing, clarification, and training session15 min Develop individual scenarios Develop individual scenarios LiveNet system45 min Develop group scenarios
(groups in category B)Develop group scenarios(groups in category A)
20 min Post-session questionnaire and debriefing
50 Empir Software Eng (2008) 13:39–62

system. The only means of synchronous communication allowed was the chat-room providedby the groupware system (i.e. LiveNet). The participants exchanged their scenarios for groupdiscussion by pasting one scenario at a time in the chat-room of LiveNet in a round-robinfashion. The participants in groups assigned to category B developed their group profilescenarios in F2F meeting arrangement. After 45 min, one member of each group submitted anelectronic copy of his/her group scenario profile.
After a recess period (1 week in this study), the process started again for a web-basedcollaborative application to support distributed software inspection (LiveNet). The onlydifference for creating change scenario profiles for this system was during the group activity,when the groups which had worked in a F2F arrangement for content management systemwere asked to work in a distributed arrangement and groups which had worked in thedistributed arrangement were asked to work in a F2F arrangement. The amount of the timeallowed for individual and group tasks was the same, 15 and 45 min respectively.
After completing both parts of the study, the participants completed a post-sessionquestionnaire designed to gather their subjective opinions of various aspects of working ineach type of meeting arrangement. The questionnaire collected quantitative subjective datausing closed questions with three or five point scale. In addition, qualitative data werecollected through open-end questions aimed at seeking additional explanation for every choicemade on the scale as well as eliciting personal opinions about the pros and cons of distributedand F2F of meeting arrangements (see Appendix A for details). The experiment finished witha debriefing session, which was aimed at explaining the objectives of the study andanswering participants’ questions on any aspect of the research program.
3.6 Data Collection
Three sets of data were collected; the individual scenario profiles, group scenario profiles, andquestionnaires. Although our results are based on the comparison of group scenario profiles, weneeded both individual as well as group profiles to develop the reference profiles. Eachparticipant also filled out a questionnaire, which was designed to collect information on theparticipants’ attitude towards F2F versus distributed software architecture evaluation meetings.
4 Results and Analysis
4.1 Reference Profiles
We gathered 150 scenarios from 216 profiles for the Zwiki system and 152 scenarios from207 profiles for the LiveNet system. We developed two reference profiles, one for eachsystem, to rank the scenario profiles. The process of developing a reference profile to measurethe quality of the scenarios has been extensively reported in (Bengtsson and Bosch 2000).Each scenario profile was scored by comparing it with the reference profile. The 15 mosthighly scored scenarios in the reference profile, for each system, are shown in Appendix B.
Forty three groups participated in both sequences of the study (AB/BA). However, somegroups experienced changes in group membership because some participants could not jointhe same group for the second sequence due to scheduling problems; some members droppedout and new members were assigned to those groups; and some participants did not take partin the first sequence but turned up for the second sequence (all these changes are consideredas dropouts for analysis purpose). Only 32 groups did not experience any change in theirmembership over the whole experiment. Out of these 32 groups, 18 groups developed
Empir Software Eng (2008) 13:39–62 51
scenarios in distributed arrangement first and F2F second, while 14 groups developedscenarios in F2F arrangement first and distributed second.
4.2 Results of Statistical Analysis
In the previous section, we have mentioned that because of dropouts there were only 32experimental units (groups of 3 members) that could be used for statistical analysis to testhypothesis. Statistical analysis of an AB/BA crossover experiment design model depends onthe sequence of the treatment for each experimental unit. When the sample size for eachsequence is unequal (which is the case in our experiment), applying the regression method tothe crossover difference is the most appropriate approach to analysing the data from a crossoverexperiment (see Senn 2002, Section 3.6). The cross-over analysis is based on the differencebetween the score for the profile developed using the distributed arrangement and the profiledeveloped in the F2F arrangement for each group. The data is reported in Appendix C.
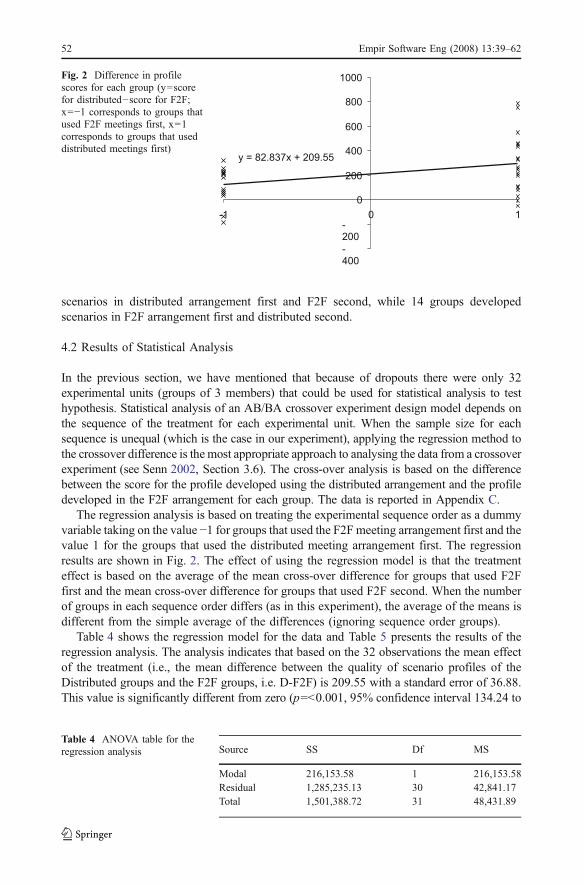
The regression analysis is based on treating the experimental sequence order as a dummyvariable taking on the value −1 for groups that used the F2F meeting arrangement first and thevalue 1 for the groups that used the distributed meeting arrangement first. The regressionresults are shown in Fig. 2. The effect of using the regression model is that the treatmenteffect is based on the average of the mean cross-over difference for groups that used F2Ffirst and the mean cross-over difference for groups that used F2F second. When the numberof groups in each sequence order differs (as in this experiment), the average of the means isdifferent from the simple average of the differences (ignoring sequence order groups).
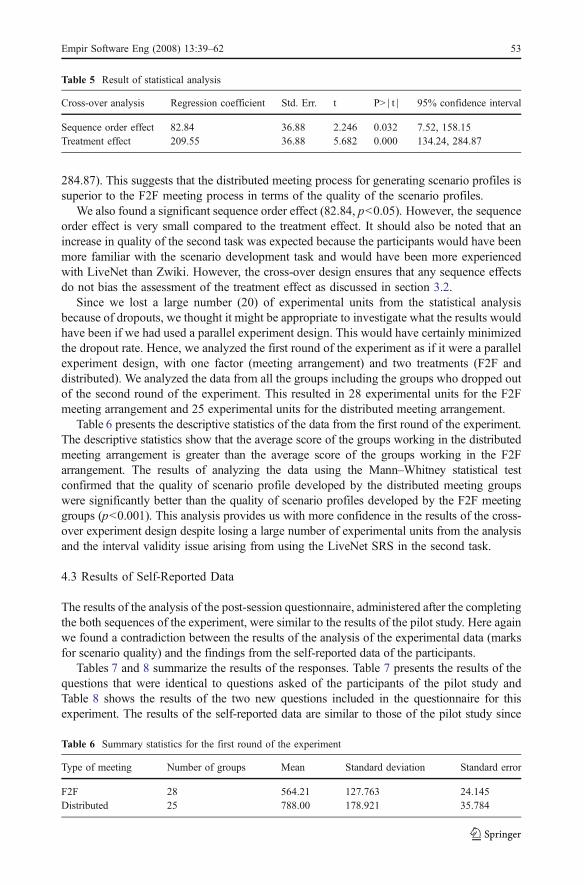
Table 4 shows the regression model for the data and Table 5 presents the results of theregression analysis. The analysis indicates that based on the 32 observations the mean effectof the treatment (i.e., the mean difference between the quality of scenario profiles of theDistributed groups and the F2F groups, i.e. D-F2F) is 209.55 with a standard error of 36.88.This value is significantly different from zero (p=<0.001, 95% confidence interval 134.24 to
y = 82.837x + 209.55
-
400
-
200
0
200
400
600
800
1000
-1 0 1
Fig. 2 Difference in profilescores for each group (y=scorefor distributed−score for F2F;x=−1 corresponds to groups thatused F2F meetings first, x=1corresponds to groups that useddistributed meetings first)
Source SS Df MS
Modal 216,153.58 1 216,153.58Residual 1,285,235.13 30 42,841.17Total 1,501,388.72 31 48,431.89
Table 4 ANOVA table for theregression analysis
52 Empir Software Eng (2008) 13:39–62
284.87). This suggests that the distributed meeting process for generating scenario profiles issuperior to the F2F meeting process in terms of the quality of the scenario profiles.
We also found a significant sequence order effect (82.84, p<0.05). However, the sequenceorder effect is very small compared to the treatment effect. It should also be noted that anincrease in quality of the second task was expected because the participants would have beenmore familiar with the scenario development task and would have been more experiencedwith LiveNet than Zwiki. However, the cross-over design ensures that any sequence effectsdo not bias the assessment of the treatment effect as discussed in section 3.2.
Since we lost a large number (20) of experimental units from the statistical analysisbecause of dropouts, we thought it might be appropriate to investigate what the results wouldhave been if we had used a parallel experiment design. This would have certainly minimizedthe dropout rate. Hence, we analyzed the first round of the experiment as if it were a parallelexperiment design, with one factor (meeting arrangement) and two treatments (F2F anddistributed). We analyzed the data from all the groups including the groups who dropped outof the second round of the experiment. This resulted in 28 experimental units for the F2Fmeeting arrangement and 25 experimental units for the distributed meeting arrangement.
Table 6 presents the descriptive statistics of the data from the first round of the experiment.The descriptive statistics show that the average score of the groups working in the distributedmeeting arrangement is greater than the average score of the groups working in the F2Farrangement. The results of analyzing the data using the Mann–Whitney statistical testconfirmed that the quality of scenario profile developed by the distributed meeting groupswere significantly better than the quality of scenario profiles developed by the F2F meetinggroups (p<0.001). This analysis provides us with more confidence in the results of the cross-over experiment design despite losing a large number of experimental units from the analysisand the interval validity issue arising from using the LiveNet SRS in the second task.
4.3 Results of Self-Reported Data
The results of the analysis of the post-session questionnaire, administered after the completingthe both sequences of the experiment, were similar to the results of the pilot study. Here againwe found a contradiction between the results of the analysis of the experimental data (marksfor scenario quality) and the findings from the self-reported data of the participants.
Tables 7 and 8 summarize the results of the responses. Table 7 presents the results of thequestions that were identical to questions asked of the participants of the pilot study andTable 8 shows the results of the two new questions included in the questionnaire for thisexperiment. The results of the self-reported data are similar to those of the pilot study since
Table 5 Result of statistical analysis
Cross-over analysis Regression coefficient Std. Err. t P>∣t∣ 95% confidence interval
Sequence order effect 82.84 36.88 2.246 0.032 7.52, 158.15Treatment effect 209.55 36.88 5.682 0.000 134.24, 284.87
Table 6 Summary statistics for the first round of the experiment
Type of meeting Number of groups Mean Standard deviation Standard error
F2F 28 564.21 127.763 24.145Distributed 25 788.00 178.921 35.784
Empir Software Eng (2008) 13:39–62 53
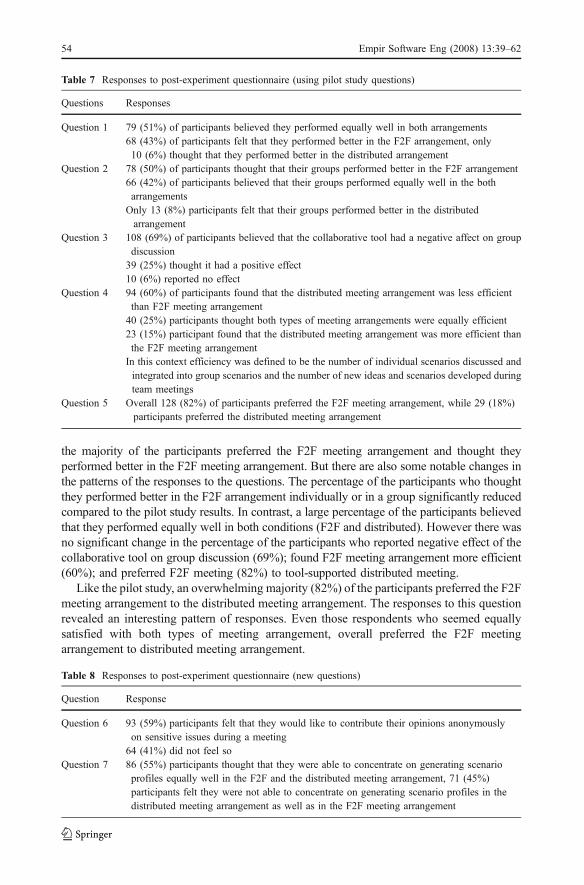
the majority of the participants preferred the F2F meeting arrangement and thought theyperformed better in the F2F meeting arrangement. But there are also some notable changes inthe patterns of the responses to the questions. The percentage of the participants who thoughtthey performed better in the F2F arrangement individually or in a group significantly reducedcompared to the pilot study results. In contrast, a large percentage of the participants believedthat they performed equally well in both conditions (F2F and distributed). However there wasno significant change in the percentage of the participants who reported negative effect of thecollaborative tool on group discussion (69%); found F2F meeting arrangement more efficient(60%); and preferred F2F meeting (82%) to tool-supported distributed meeting.
Like the pilot study, an overwhelming majority (82%) of the participants preferred the F2Fmeeting arrangement to the distributed meeting arrangement. The responses to this questionrevealed an interesting pattern of responses. Even those respondents who seemed equallysatisfied with both types of meeting arrangement, overall preferred the F2F meetingarrangement to distributed meeting arrangement.
Table 7 Responses to post-experiment questionnaire (using pilot study questions)
Questions Responses
Question 1 79 (51%) of participants believed they performed equally well in both arrangements68 (43%) of participants felt that they performed better in the F2F arrangement, only10 (6%) thought that they performed better in the distributed arrangement
Question 2 78 (50%) of participants thought that their groups performed better in the F2F arrangement66 (42%) of participants believed that their groups performed equally well in the botharrangementsOnly 13 (8%) participants felt that their groups performed better in the distributedarrangement
Question 3 108 (69%) of participants believed that the collaborative tool had a negative affect on groupdiscussion39 (25%) thought it had a positive effect10 (6%) reported no effect
Question 4 94 (60%) of participants found that the distributed meeting arrangement was less efficientthan F2F meeting arrangement40 (25%) participants thought both types of meeting arrangements were equally efficient23 (15%) participant found that the distributed meeting arrangement was more efficient thanthe F2F meeting arrangementIn this context efficiency was defined to be the number of individual scenarios discussed andintegrated into group scenarios and the number of new ideas and scenarios developed duringteam meetings
Question 5 Overall 128 (82%) of participants preferred the F2F meeting arrangement, while 29 (18%)participants preferred the distributed meeting arrangement
Table 8 Responses to post-experiment questionnaire (new questions)
Question Response
Question 6 93 (59%) participants felt that they would like to contribute their opinions anonymouslyon sensitive issues during a meeting64 (41%) did not feel so
Question 7 86 (55%) participants thought that they were able to concentrate on generating scenarioprofiles equally well in the F2F and the distributed meeting arrangement, 71 (45%)participants felt they were not able to concentrate on generating scenario profiles in thedistributed meeting arrangement as well as in the F2F meeting arrangement
54 Empir Software Eng (2008) 13:39–62
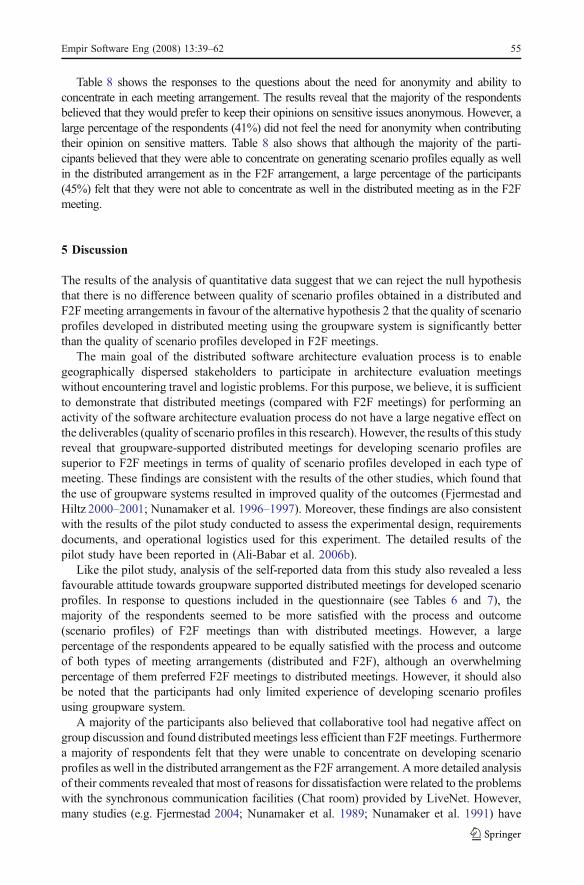
Table 8 shows the responses to the questions about the need for anonymity and ability toconcentrate in each meeting arrangement. The results reveal that the majority of the respondentsbelieved that they would prefer to keep their opinions on sensitive issues anonymous. However, alarge percentage of the respondents (41%) did not feel the need for anonymity when contributingtheir opinion on sensitive matters. Table 8 also shows that although the majority of the parti-cipants believed that they were able to concentrate on generating scenario profiles equally as wellin the distributed arrangement as in the F2F arrangement, a large percentage of the participants(45%) felt that they were not able to concentrate as well in the distributed meeting as in the F2Fmeeting.
5 Discussion
The results of the analysis of quantitative data suggest that we can reject the null hypothesisthat there is no difference between quality of scenario profiles obtained in a distributed andF2F meeting arrangements in favour of the alternative hypothesis 2 that the quality of scenarioprofiles developed in distributed meeting using the groupware system is significantly betterthan the quality of scenario profiles developed in F2F meetings.
The main goal of the distributed software architecture evaluation process is to enablegeographically dispersed stakeholders to participate in architecture evaluation meetingswithout encountering travel and logistic problems. For this purpose, we believe, it is sufficientto demonstrate that distributed meetings (compared with F2F meetings) for performing anactivity of the software architecture evaluation process do not have a large negative effect onthe deliverables (quality of scenario profiles in this research). However, the results of this studyreveal that groupware-supported distributed meetings for developing scenario profiles aresuperior to F2F meetings in terms of quality of scenario profiles developed in each type ofmeeting. These findings are consistent with the results of the other studies, which found thatthe use of groupware systems resulted in improved quality of the outcomes (Fjermestad andHiltz 2000–2001; Nunamaker et al. 1996–1997). Moreover, these findings are also consistentwith the results of the pilot study conducted to assess the experimental design, requirementsdocuments, and operational logistics used for this experiment. The detailed results of thepilot study have been reported in (Ali-Babar et al. 2006b).
Like the pilot study, analysis of the self-reported data from this study also revealed a lessfavourable attitude towards groupware supported distributed meetings for developed scenarioprofiles. In response to questions included in the questionnaire (see Tables 6 and 7), themajority of the respondents seemed to be more satisfied with the process and outcome(scenario profiles) of F2F meetings than with distributed meetings. However, a largepercentage of the respondents appeared to be equally satisfied with the process and outcomeof both types of meeting arrangements (distributed and F2F), although an overwhelmingpercentage of them preferred F2F meetings to distributed meetings. However, it should alsobe noted that the participants had only limited experience of developing scenario profilesusing groupware system.
A majority of the participants also believed that collaborative tool had negative affect ongroup discussion and found distributedmeetings less efficient than F2Fmeetings. Furthermorea majority of respondents felt that they were unable to concentrate on developing scenarioprofiles as well in the distributed arrangement as the F2F arrangement. Amore detailed analysisof their comments revealed that most of reasons for dissatisfaction were related to the problemswith the synchronous communication facilities (Chat room) provided by LiveNet. However,many studies (e.g. Fjermestad 2004; Nunamaker et al. 1989; Nunamaker et al. 1991) have
Empir Software Eng (2008) 13:39–62 55
reported that participants using groupware systems were equally or more satisfied than thosewho were performing the same task in a F2F arrangement. Hence, our findings concerninguser satisfaction with groupware-supported processes compared with F2F processes may bedue the specific technology rather than basic principle of distributed meetings.
In response to the question about the need of anonymity while discussing sensitive issues,the majority of the respondents (59%) felt the need for anonymity while expressing their viewson sensitive issues. However, 41% of the respondents did not feel any such need. Whileinterpreting the responses to the question, we should keep in mind that nature of the task andgroup composition can mitigate the influence of anonymity on group performance (Valacich etal. 1992). For example, scenario profile development task is not a highly controversial task.Furthermore, the studied groups did not have members with differing views or personalstakes in the outcome of the meetings. Therefore, participants might have little appreciation ofthe importance of anonymity for open and honest exchange of ideas. The groups were formedonly for this research activity and had neither prior history nor any anticipation of future work as agroup. These factors do not usually allow any adaptive structuring of technology that might be avital factor in improving participants’ satisfaction with a groupware-supported process (Poole andDesanctis 1990). The phases through which a group progresses have significant influence ongroup member behaviour, task focus, and overall performance (Nunamaker et al. 1996–1997).This group bonding process should be explored in further research on groupware-supportedprocesses in software engineering in general and in software architecture evaluation in particular.
6 Conclusion
Like any process of software development lifecycle, architecture evaluation process faces newchallenges posed by the increasing trend towards distributed software development. Currentprocesses do not scale up to the needs of geographically dispersed stakeholders. Hence, newprocesses and support mechanisms are necessary. We suggest that groupware systems canenable geographically dispersed stakeholders to participate in the architecture evaluationprocess. The results from our controlled experiment provide support for our assertion thatsoftware architecture evaluation process can be performed in distributed arrangement usinggroupware systems without affecting the quality of the artifacts (scenario profiles in our study).These results are consistent with the empirical findings of the use of groupware systems inother activities of software development, i.e. Requirements Engineering (Boeham et al. 2001;Damian et al. 2000) and software inspection (Genuchten et al. 2001; Lanubile et al. 2003).
Such positive results should encourage researchers and practitioners to identify and assessthe changes required to incorporate groupware support for the architecture evaluation process.However, it is clear that participants themselves are not very satisfied with distributed meetings.We hope our work will encourage groupware systems developers to develop groupwaresystems to support the architecture evaluation process that are more acceptable to participants.
Analysis of qualitative data collected using another questionnaire is continuing and thefinal results are expected to identify socio-psychological aspects of using groupware systemsto support architecture evaluation in a distributed arrangement. We are happy to make boththe additional quantitative and qualitative data available for analysis by other researchers.
Acknowledgment We greatly appreciate the anonymous reviewers’ comments, which helped us improvethis paper. We are grateful to the participants of this controlled experiment. Xiaowen Wang helped inpreparing reference scenario profile and marking scenario profiles. The first author was working with theNational ICT Australia when the reported work was performed.
56 Empir Software Eng (2008) 13:39–62

Appendix A
Questionnaire to gather self-reported data
1. Overall, did you feel you performed well in developing scenarios for non-functional requirements in:
I). a distributed arrangement using the collaborative tool
II). both arrangements
III). a face-to-face arrangement
Your choice is --------. Please explain the reason of your choice:
2. Overall, did you feel your group performed well in developing scenarios for non-functional
requirements in:
I). a distributed arrangement using the collaborative tool
II). both arrangements
III). a face-to-face arrangement
Your choice is --------. Please explain the reason of your choice:
3. Did you feel that using the collaborative tool had any positive or negative affect on your group
discussion? e.g., you may have been able to discuss issues more quickly (a positive effect) or you may
have found it more difficult to discuss issues (a negative effect).
Large positive effect Small positive effect No effect Small negative effect Large negative effect
Please explain your answer:
4. Compared with face-to-face group meeting, do you feel that a collaborative tool based group meeting
is
I). more efficient?
II). equally efficient?
III). less efficient?
Note: By efficiency, we mean the number of individual scenarios discussed and integrated into group
scenarios and the number of new ideas and scenarios developed during team meetings.
Your choice is --------. Please explain the reason of your choice:
5. Overall, what type of meeting you would like for generating scenarios, a face-to-face or distributed
arrangement using a collaborative tool?
Face-to-face arrangement Distributed arrangement using
collaborative tool
please give three reasons for your answer:
6. Do you like to contribute your opinion on sensitive issues during a meeting anonymously if its
possible?
Yes No
Please explain your answer:
7. While using collaborative tool to generate scenarios, were you able to concentrate on brainstorming
and generating scenarios as well as in the face-to-face meeting?
Yes No
Please explain your answer:
Empir Software Eng (2008) 13:39–62 57

Appendix B
Top 15 Reference Profile Scenarios
Table 9 Top 15 scenarios in the reference scenario profile for Zwiki system
No. Scenarios in reference profile for Zwiki Frequency
1 System supports various forms of content including multimedia 1072 System supports various naming conventions 933 Enable restriction and access authorization level 814 Security is enforced by suitable login and log out process 765 System keeps a log of change made in content 746 Upload/download information to/from different source 697 System shall provide editors to support rich content formatting 688 User should have different privileges based on various roles 619 Different types of search functions shall be supported 6010 User can set various options for personalizing the system 5911 System shall be secured from virus and other malicious attacks 5712 User can easily restore the previous version of a document 5113 Provide real-time communication service 4714 System supports an email notification mechanism 4415 User can browse through the content using a tree diagram 43
Table 10 Top 15 scenarios in the reference scenario profile for LiveNet system
No. Scenarios in reference profile for LiveNet Frequency
1 Provide different user access levels/privileges 1152 Email based message notification 913 System provides sophisticated mechanism of securing the content stored in it 824 Chatting supports thread-based recording/viewing of discussion 785 Capture and display user profiles 756 User should receive a quick response for a request 587 System provides calendar utility to schedule tasks and generate reminders 568 System provides wizards and online help to support various tasks 519 System provides a backup facility 5010 Logs shall include detailed information on the changes made and modifiers 4911 Chatting functionality shall be similar to popular chatting software 4612 System can handle large numbers of users concurrently connected to the system 4413 Roles and User management with templates 4314 Audio and Video channels are available 3915 Online project planning and management tools are available 38
58 Empir Software Eng (2008) 13:39–62

Appendix C
Experimental Data
References
Ali-Babar M, Verner J (2005) Groupware requirements for supporting software architecture evaluation process.In: Proceedings of the International Workshop on Distributed Software Development, Paris, 29 August 2005
Ali-Babar M, Zhu L, Jeffery R (2004) A Framework for Classifying and Comparing Software ArchitectureEvaluation Methods. In: Proceedings of the 15th Australian Software Engineering Conference,Melbourne, 13–16 April 2004
Ali-Babar M, Kitchenham B, Gorton I (2006a) Towards a distributed software architecture evaluationprocess—a preliminary assessment. In: Proceedings of the 28th International Conference on SoftwareEngineering (Emerging Result Track), Shanghai, 20–28 May 2006
Table 11 Experimental data
Group Treatment usedfirst
Distributedscore
F2Fscore
Crossover difference (distributed score–F2Fscore)
g1 F2F Meeting 505 419 86g2 F2F Meeting 891 713 178g3 F2F Meeting 750 541 209g4 F2F Meeting 567 752 −185g5 F2F Meeting 604 551 53g6 F2F Meeting 701 476 225g7 F2F Meeting 633 765 −132g8 F2F Meeting 756 538 218g9 F2F Meeting 616 586 30g10 F2F Meeting 793 722 71g11 F2F Meeting 733 517 216g12 F2F Meeting 842 587 255g13 F2F Meeting 959 642 317g14 F2F Meeting 871 638 233g15 Distributed 603 574 29g16 Distributed 539 461 78g17 Distributed 359 409 −50g18 Distributed 1,038 590 448g19 Distributed 733 740 −7g20 Distributed 1,029 280 749g21 Distributed 903 567 336g22 Distributed 782 321 461g23 Distributed 790 462 328g24 Distributed 722 611 111g25 Distributed 546 444 102g26 Distributed 901 355 546g27 Distributed 1,084 298 786g28 Distributed 648 404 244g29 Distributed 888 629 259g30 Distributed 678 465 213g31 Distributed 876 443 433g32 Distributed 861 664 197
Empir Software Eng (2008) 13:39–62 59
Ali-Babar M, Kitchenham B, Zhu L, Gorton I, Jeffery R (2006b) An empirical study of groupware supportfor distributed software architecture evaluation process. J Syst Softw 79(7):912–925
Basili VR, Selby RW, Hutchens DH (1986) Experimentation in software engineering. IEEE Trans Softw Eng12(7):733–743
Bass L, Clements P, Kazman R (2003) Software architecture in practice. Addison-Wesley, ReadingBengtsson P (2002) Architecture-level modifiability analysis. Ph.D. Thesis, Blekinge Institute of TechnologyBengtsson P, Bosch J (2000) An experiment on creating scenario profiles for software change. Ann Softw
Eng 9:59–78Biuk-Aghai RP, Hawryszkiewyez IT (1999) Analysis of virtual workspaces. In: Proceedings of the Database
Applications in Non-Traditional Environments. Japan, 28–30 November 1999Boeham B, Grunbacher P, Briggs RO (2001) Developing groupware for requirements negotiation: lessons
learned. IEEE Softw 18(3):46–55Clements P, Kazman R, Klein M (2002) Evaluating software architectures: methods and case studies.
Addison-Wesley, ReadingDamian DE, Eberlein A, Shaw MLG, Gaines BR (2000) Using different communication media in
requirements negotiation. IEEE Softw 17(3):28–36Dobrica L, Niemela E (2002) A survey on software architecture analysis methods. IEEE Trans Softw Eng 28
(7):638–653Ellis CA, Gibbs SJ, Rein GL (1991) Groupware: some issues and experiences. Commun ACM 34(1):38–58Fjermestad J (2004) An analysis of communication mode in group support systems research. Decis Support
Syst 37(2):239–263Fjermestad J, Hiltz SR (1998–1999) An assessment of group support systems experimental research:
methodology and results. J Manage Inf Syst 15(3):7–149Fjermestad J, Hiltz SR (2000–2001) Group support systems: a descriptive evaluation of case and field
studies. J Manage Inf Syst 17(3):115–159Genuchten MV, Cornelissen W, Dijk CV (1997–98) Supporting inspection with an electronic meeting
system. J Manage Inf Syst 14(3):165–178Genuchten MV, Van Dijk C, Scholten H, Vogel D (2001) Using group support systems for software
inspections. IEEE Softw 18(3):60–65Halling M, Grunbacher P, Biffl S (2001) Tailoring a COTS group support system for software requirements
inspection. In: Proceedings of the 16th International Conference on Automated Software Engineering,San Diego, 26–29 November 2001
Herbsleb JD, Moitra D (2001) Global software development. IEEE Softw 18(2):16–20Hiltz R, TuroffM (1978) The network of nations: human communication via computer. Addison-Wesley, ReadingHost M, Regnell B, Wohlin C (2000) Using students as subjects—a comparative study of students and
professionals in lead-time impact assessment. Empir Softw Eng 5:201–214Jarvenpaa SL, Rao VS, Huber GP (1988) Computer support for meetings of groups working on unstructured
problems: a field experiment. MIS Q 12(4):645–666Kazman R, Bass L (2002) Making architecture reviews work in the real world. IEEE Softw 19(1):67–73Kazman R, Bass L, Abowd G, Webb M (1994) SAAM: a method for analyzing the properties of software
architectures. In: Proceedings of the 16th International Conference on Software Engineering, Sorrento,May 1994
Kazman R, Abowd G, Bass L, Clements P (1996) Scenario-based analysis of software architecture. IEEESoftw Eng 13(6):47–55
Kazman R, Barbacci M, Klein M, Carriere SJ (1999) Experience with performing architecture tradeoffanalysis. In: Proceedings of the 21st International Conference on Software Engineering, Los Angeles,May
Kazman R, Klein M, Clements P (2000) ATAM: method for architecture evaluation. CMU/SEI-2000-TR-004, Software Engineering Institute, Carnegie Mellon University, Pittsburgh
Kiesler S, Siegel J, McGuire TW (1984) Social psychological aspects of computer-mediated communication.Am Psychol 9(10):1123–1134
KitchenhamBA, Pfleeger SL, Pickard LM, Jones PW, Hoaglin DC, El EmamK, Rosenberg J (2002) Preliminaryguidelines for empirical research in software engineering. IEEE Trans Softw Eng 28(8):721–734
Kitchenham B, Fay J, Linkman S (2004) The case against cross-over design in software engineering. In:Proceedings of the 11th International Workshop on Software Technology and Engineering Practice,Amsterdam, 19–21 September 2003
Lanubile F, Mallardo T, Calefato F (2003) Tool support for geographically dispersed inspection teams. SoftwProcess Improv Pract 8(4):217–231
Lassing N, Bengtsson P, Bosch J, Vliet HV (2002) Experience with ALMA: architecture-level modifiabilityanalysis. J Syst Softw 61(1):47–57
60 Empir Software Eng (2008) 13:39–62
Lassing N, Rijsenbrij D, Vliet HV (2003) How well can we predict changes at architecture design time? JSyst Softw 65(2):141–153
Maranzano JF, Rozsypal SA, Zimmerman GH, Warnken GW, Wirth PE, Weiss DM (2005) Architecturereviews: practice and experience. IEEE Softw 22(2):34–43
McGrath JE, Hollingshead AB (1994) Groups interacting with technology. Sage, Newbury ParkNunamaker J, Vogel D, Heminger A, Martz B (1989) Experiences at IBM with group support systems: a field
study. Decis Support Syst 5:183–196Nunamaker JF, Dennis AR, Valacich JS, Vogel D, George JF (1991) Electronic meeting systems to support
group work. Commun ACM 34(7):40–61Nunamaker JF, Briggs RO, Mittleman DD, Vogel DR, Balthazard PA (1996–1997) Lessons from a dozen years
of group support systems research: a discussion of lab and field findings. J Manage Inf Syst 13(3):163–207Paasivaara M, Lassenius C (2003) Collaboration practices in global inter-organizational software
development projects. Softw Process Improv Pract 8(4):183–199Perry DE, Porter A, Wade MW, Votta LG, Perpich J (2002) Reducing inspection interval in large-scale
software development. IEEE Trans Softw Eng 28(7):695–705Poole MS, Desanctis G (1990) Understanding the use of group decision support systems: the theory of
adaptive structuration. In: Fulk J, Steinfield C (eds) Organizations and communication technology. Sage,Newbury, pp 173–193
Porter AA, Johnson PM (1997) Assessing software review meetings: results of a comparative analysis of twoexperimental studies. IEEE Trans Softw Eng 23(3):129–145
Rosnow RL, Rosenthal R (1997) People studying people: artifacts and ethics in behavioral research.Freeman, San Francisco
Sakthivel S (2005) Virtual workgroups in offshore systems development. Inf Softw Technol 47(5):305–318Sauer C, Jeffery DR, Land L, Yetton P (2000) The effectiveness of software development technical reviews:
a behaviorally motivated program of research. IEEE Trans Softw Eng 26(1):1–14Senn S (2002) Cross-over trials in clinical research. Wiley, New YorkToothaker LE, Miller L (1996) Introductory statistics for the behavioral science. Brooks/Cole, Pacific GroveTyran CK, George JF (2002) Improving software inspections with group process support. Commun ACM 45
(9):87–92Tyran CK, Dennis AR, Vogal DR, Nunamaker JF (1992) The application of electronic meeting technology to
support strategic management. MIS Q 16:313–334Valacich JS, Dennis AR, Nunamaker JF (1991) Electronic meeting support: the GroupSystems concepts. Int J
Man-Mach Stud 34(2):261–282Valacich J, Dennis AR, Nunamaker JF (1992) Group size and anonymity effects on computer-mediated idea
generation. Small Group Res 23(1):49–73Wohlin C, Runeson P, Host M, Ohlsson MC, Regnell B, Wesslen A (2000) Experimentation in software
engineering: an introduction. Kluwer, NorwellZwiki (2004) Zwiki system. http://www.zwiki.org. Cited 30 November 2004.
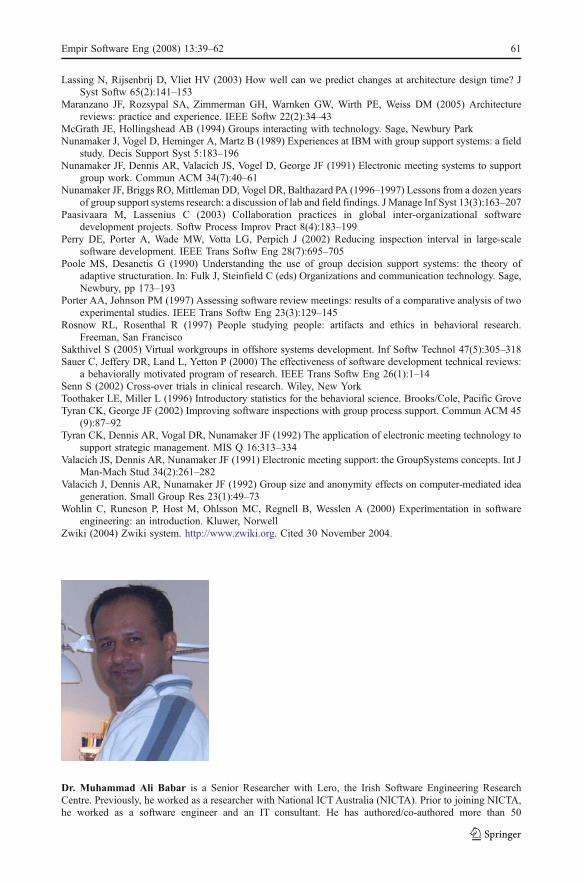
Dr. Muhammad Ali Babar is a Senior Researcher with Lero, the Irish Software Engineering ResearchCentre. Previously, he worked as a researcher with National ICT Australia (NICTA). Prior to joining NICTA,he worked as a software engineer and an IT consultant. He has authored/co-authored more than 50
Empir Software Eng (2008) 13:39–62 61

publications in peer-reviewed journals, conferences, and workshops. He has presented tutorials in the area ofsoftware architecture knowledge management at various international conferences including ICSE 2007,SATURN 2007 and WICSA 2007. His current research interests include software product lines, softwarearchitecture design and evaluation, architecture knowledge management, tooling supporting, and empiricalmethods of technology evaluation. He is a member of the IEEE Computer Society.
Barbara Kitchenham is Professor of Quantitative Software Engineering at Keele University in the UK. From2004-2007, she was a Senior Principal Researcher at National ICT Australia. She has worked in softwareengineering for nearly 30 years both in industry and academia. Her main research interest is softwaremeasurement and its application to project management, quality control, risk management and evaluation ofsoftware technologies. Her most recent research has focused on the application of evidence-based practice tosoftware engineering. She is a Chartered Mathematician and Fellow of the Institute of Mathematics and itsApplications, a Fellow of the Royal Statistical Society and a member of the IEEE Computer Society.
Dr. Ross Jeffery is Research Program Leader for Empirical Software Engineering in NICTA and Professorof Software Engineering in the School of Computer Science and Engineering at UNSW. His researchinterests are in software engineering process and product modeling and improvement, electronic processguides and software knowledge management, software quality, software metrics, software technical andmanagement reviews, and software resource modeling and estimation. His research has involved over fiftygovernment and industry organizations over a period of 20 years and has been funded by industry,government and universities. He has co-authored four books and over one hundred and forty research papers.He was elected Fellow of the Australian Computer Society for his contribution to software engineeringresearch.
62 Empir Software Eng (2008) 13:39–62