Evaluation of Vibration Monitoring of HFO Purifiers in the ...
140
Evaluation of Vibration Monitoring of HFO Purifiers in the Klaveness Fleet June 2019 Master's thesis Master's thesis Odin Dypdalen Kjærvik 2019 Odin Dypdalen Kjærvik NTNU Norwegian University of Science and Technology Faculty of Engineering Department of Marine Technology
-
Upload
khangminh22 -
Category
Documents
-
view
2 -
download
0
Transcript of Evaluation of Vibration Monitoring of HFO Purifiers in the ...

Evaluation of Vibration Monitoringof HFO Purifiers in the KlavenessFleet
June 2019
Mas
ter's
thes
is
Master's thesis
Odin Dypdalen Kjærvik
2019Odin Dypdalen Kjæ
rvik
NTNU
Nor
weg
ian
Univ
ersi
ty o
fSc
ienc
e an
d Te
chno
logy
Facu
lty o
f Eng
inee
ring
Depa
rtm
ent o
f Mar
ine
Tech
nolo
gy

Evaluation of Vibration Monitoring of HFOPurifiers in the Klaveness Fleet
Odin Dypdalen Kjærvik
Marine TechnologySubmission date: June 2019Supervisor: Ingrid Bouwer Utne, IMTCo-supervisor: Christian Bjanger Skjelbred, Klaveness Operation
Norwegian University of Science and TechnologyDepartment of Marine Technology


Preface
This master’s thesis is submitted for the degree of Master of Science in Marine Technology at the Norwe-
gian University of Science and Technology (NTNU) and corresponds to 30 credits. The thesis has been
written in its entirety by Odin Dypdalen Kjærvik for Klaveness Operation during the spring of 2019.
The author was supervised by Prof. Ingrid Bouwer Utne, Department of Marine Technology, whom I
gratefully acknowledge the assistance of. I am extremely thankful to her for sharing her expertise and
for providing valuable guidance and encouragement to the very end.
I would also like to thank Christian Bjanger Skjelbred in Klaveness for all the time and effort that he has
put into the guidance of this thesis. His passionate participation and input has been unvaluable and is
highly appreciated.
A thank you is also due to Vidar Andre Johannessen in Karsten Moholt for a clarifying and valuable
discussion about vibration monitoring towards the end of writing the thesis.
Finally, I would like to thank all of those who have supported, encouraged and given me valuable advice
throughout the entire period of writing this thesis. No one mentioned - no one forgotten.
Odin Dypdalen Kjærvik
Trondheim,
June 18, 2019
i

[This page intentionally left blank]
ii

Summary
Over the years, the maintenance discipline has been under constant development. It has evolved from
being a corrective process, performed after functional failure, to be more preventive, where components
and systems are overhauled or replaced based on a giving time-schedule, assuming that they have a
defined lifetime. However, such lifetime estimates often come with a high degree of uncertainty, resulting
in scheduled maintenance being performed too late or too early, causing functional failures or high costs
from unnecessary replacements.
To reduce the uncertainty associated with time-based schedules, predictive approaches based on evalua-
tion of asset condition have appeared. Such maintenance strategies can help to maximise asset lifetime
and further reduce downtime and maintenance costs. The perhaps most common is condition monitoring
(CM), which is a significant component of predictive maintenance (PdM), often referred to as condition-
based maintenance (CBM). These developments can be traced back to the air transportation industry in
the 1960s (Knutsen et al., 2014).
In 2018, Klaveness conducted a CBM pilot project on two of their combination carriers, where offline and
manual vibration monitoring equipment was installed on a considerable amount of equipment, mostly
compressors, pumps and engines. The pilot was initiated to help build knowledge and better understand
the benefits and limitations of CBM, as Klaveness does not have significant experience within this area
from before. They hope that this can help them move towards a more predictive maintenance regime in
the future.
After the pilot was conducted, Klaveness decided to reduce the number of equipment to be monitored
when implementing vibration monitoring equipment on vessels throughout their fleet. Among the equip-
ment removed from the scope was the heavy fuel oil (HFO) purifiers. The purpose of the purifiers is
to remove liquid and solid contaminants from the heavy fuel oil before being used in the main engine.
Failing to treat the fuel oil properly will result in decreased combustion efficiency and possibly cause
severe damage to the engine. Even though the purifiers have redundancy, it has a history of incidents that
could have been prevented.
The objective of this thesis is to assess whether it would be beneficial for Klaveness to equip HFO
iii

purifiers with vibration monitoring equipment onboard their ships in a fleet-wide installation. The thesis
answers the following two research questions:
1. What are the failure modes with the highest probabilities of occurrence and severity of conse-
quences, and how can these be detected?
2. What kind of information can be extracted from the incident reports regarding HFO purifiers in
the Klaveness fleet, and could any of these incidents have been detected by vibration monitoring?
A failure mode, effect and criticality (FMECA) analysis was performed along with an analysis of incident
reports on HFO purifiers in the Klaveness fleet to answer these questions. As a part of the FMECA, the
likelihood of occurrence of failures on the subsystem and sub-component level was estimated based on
the analysed incident reports. Further, a qualitative assessment of whether the incidents could have been
discovered by vibration monitoring (VM) was conducted based on available literature on the topic, the
author’s knowledge and discussions with Karsten Moholt, a company working with lifetime extension of
rotating equipment through, amongst others, condition monitoring and analysis.
The results from the FMECA and incident report analysis show that the most critical failures with respect
to the severity of consequences concerning safety, downtime and costs, are those related to leakages in
the system or failure of electronic equipment such as controllers and sensors. VM cannot detect these
failures. However, those failures that could potentially have been detected by VM constitute more than
half of the failures analysed. These are failures mainly related to the power transmission subsystem and
the electrical motor. Even though these failures are not as critical as those that cannot be detected by VM,
they may still result in downtime of up to two months and costs in the range between 20,000-200,000
USD.
Before a final decision is made, a life-cycle cost (LCC) analysis should be carried out to determine
whether this is a cost-effective method to prevent failures on the HFO purifiers.
iv

Sammendrag
Vedlikehold som fagfelt har til enhver tid vært under konstant utvikling. Det har utviklet seg fra a være en
korrektiv prosess utført etter at utstyr har sluttet a fungere slik det skal, til a bli mer forebyggende, hvor
utstyr og systemer blir reparert eller erstattet basert med faste mellomrom, forutsatt at de har en bestemt
levetid. Slike antagelser er ofte usikre, noe som ofte medfører at vedlikehold utføres for sjeldent eller
for ofte. Dette vil kunne resultere i hyppigere utstyrsfeil eller høye kostnader som følge av unødvendige
utskiftninger.
For a redusere usikkerheten knyttet til kalenderbaserte vedlikeholdsplaner, har det med arene blitt utviklet
prediktive vedlikeholdsstrategier som baserer seg pa en vurdering av utstyrets tilstand. Slike strategier
kan bidra til a maksimere utstyrets levetid, samt redusere nedetid og vedlikeholdskostnader. Den kanskje
mest av kjente av disse strategiene er tilstandsmonitorering, som er en viktig del av det som kalles predik-
tivt vedlikehold. Utviklingen i retning prediktivt vedlikehold kan spores tilbake til luftfartsindustrien pa
1960-tallet (Knutsen et al., 2014).
I 2018 gjennomførte det norske shippingselskapet Klaveness et pilotprosjekt som omhandlet tilstands-
basert vedlikehold pa to av deres skip. Som en del av prosjektet ble offline og manuelt vibrasjonsutstyr
installert pa en betydelig mengde utstyr, hovedsakelig pa kompressorer, pumper og motorer. Klaveness
iverksatte dette prosjektet for a tilegne seg kunnskap om fordelene og begrensningene med tilstandsbasert
vedlikehold, da de ikke har betydelig erfaring innen omradet fra før. De haper at dette kan hjelpe dem
med a bevege seg i retning av et mer tilstandsbasert vedlikeholdsregime i fremtiden.
Etter at piloten ble gjennomført bestemte Klaveness seg for a redusere mengden utstyr som skal overvakes
nar vibrasjonsmonitoreringsutstyr rulles ut i flaten. Blant utstyret som er besluttet fjernet finner man
drivstoffseparatorene. Formalet med disse separatorene er a fjerne uønsket væske og partikler fra drivstof-
fet før det brukes i hovedmaskineriet ombord. Dersom drivstoffet ikke blir tilstrekkelig renset vil det
kunne medføre redusert forbrenningseffekt og potensielt skade hovedmaskineriet ombord pa skipet. Selv
om drivstoffseparatorene er et redundant system, viser feilhistorikken at flere av hendelsene potensielt
kunne vært avverget.
Malet med denne oppgaven er a vurdere om det vil være en korrekt avgjørelse av Klaveness a ut-
v

styre drivstoffseparatorene med vibrasjonsmonitoreringsutstyr ombord i flaten sin. Oppgaven svarer pa
følgende spørsmal:
1. Hvilke feil forekommer med størst sannsynlighet og hvilke feil har de alvorligste konsekvensene?
Hvordan kan disse avdekkes?
2. Hvilken informasjon finner man i hendelsesrapportene som omhandler drivstoffseparatorene, og
kunne noen av disse hendelsene vært oppdaget ved hjelp av vibrasjonsmonitoreringsutstyr?
For a kunne svare pa disse spørsmalene ble det gjennomført en feilmode, effekt og kritikalitetsanalyse
(FMECA), samt gjort en analyse av hendelsesrapportene pa drivstoffseparatorene i Klaveness-flaten.
Som en del av FMECAen ble sannsynligheten for utstyrssvikt estimert basert pa de analysert rapportene.
Videre ble det foretatt en kvalitativ vurdering om hvorvidt de ulike hendelsene kunne vært oppdaget
dersom man hadde brukt vibrasjonsmonitoreringsutstyr. Denne vurderingen baserte seg pa tilgjengelig
litteratur og studier vedrørende vibrasjonsmonitorering, samt forfatterens egen kjennskap til temaet og
diskusjoner med Karsten Moholt, et selskap som blant annet driver med overvakning og analyse av
maskineri.
Resultatene fra FMECAen og analysen av hendelsesrapportene viser at de meste kritiske feilene med
hensyn til alvorlighetsgraden og konsekvenser for sikkerhet, nedetid og kostnader, er de som er relatert
til lekkasjer i systemet eller feil pa elektronisk utstyr som kontrollere og sensorer. Disse feilene kan
ikke avdekkes ved hjelp av vibrasjonsmonitorering. De feilene som kunne vært avdekket av vibrasjon-
smonitorering, derimot, utgjør mer enn halvparten av feilene som ble analysert. Dette er i hovedsak
feil tilknyttet elektromotoren, selve separatoren, og kraftoverføringssystemet mellom disse. Selv om
disse feilene ikke er like alvorlige som eventuelle lekkasjer, kan de likevel medføre nedetid pa opptil to
maneder og kostnader mellom 20.000-200.000 USD.
Før en endelig beslutning fattes bør en livssyklusanalyse med fokus pa kostnader utføres for a avgjøre
om vibrasjonsmonitorering er en kostnadseffektiv metode for a forhindre feil pa drivstoffseparatorene.
vi

Table of Contents
Preface i
Summary iii
Sammendrag v
List of Figures xi
List of Tables xiii
Acronyms xv
1 Introduction 11.1 Background . . . . . . . . . . . . . . . . . . . . . . . . . . . . . . . . . . . . . . . . . 1
1.2 Objective . . . . . . . . . . . . . . . . . . . . . . . . . . . . . . . . . . . . . . . . . . 3
1.3 Scope and Limitations . . . . . . . . . . . . . . . . . . . . . . . . . . . . . . . . . . . 3
1.4 Thesis Structure . . . . . . . . . . . . . . . . . . . . . . . . . . . . . . . . . . . . . . . 4
2 Literature 52.1 Maintenance . . . . . . . . . . . . . . . . . . . . . . . . . . . . . . . . . . . . . . . . . 5
2.1.1 History . . . . . . . . . . . . . . . . . . . . . . . . . . . . . . . . . . . . . . . 5
2.1.2 Status in Shipping . . . . . . . . . . . . . . . . . . . . . . . . . . . . . . . . . 7
2.1.3 Maintenance in the Future . . . . . . . . . . . . . . . . . . . . . . . . . . . . . 10
2.2 Condition-Based Maintenance . . . . . . . . . . . . . . . . . . . . . . . . . . . . . . . 13
2.2.1 Vibration Monitoring . . . . . . . . . . . . . . . . . . . . . . . . . . . . . . . . 14
2.3 Centrifugal Purifiers in Fuel Oil Treatment Systems . . . . . . . . . . . . . . . . . . . . 18
2.3.1 Fuel Oil Treatment Systems . . . . . . . . . . . . . . . . . . . . . . . . . . . . 18
2.3.2 Basic Principles of Separation . . . . . . . . . . . . . . . . . . . . . . . . . . . 19
2.3.3 Design and Function . . . . . . . . . . . . . . . . . . . . . . . . . . . . . . . . 19
2.3.4 Most Common Failure Modes and Causes . . . . . . . . . . . . . . . . . . . . . 23
vii
2.3.5 Previous Studies and Analyses . . . . . . . . . . . . . . . . . . . . . . . . . . . 30
2.4 Failure Modes, Effect and Criticality Analysis . . . . . . . . . . . . . . . . . . . . . . . 31
2.4.1 Objectives . . . . . . . . . . . . . . . . . . . . . . . . . . . . . . . . . . . . . . 31
2.4.2 Issues Addressed . . . . . . . . . . . . . . . . . . . . . . . . . . . . . . . . . . 33
2.4.3 Methodology . . . . . . . . . . . . . . . . . . . . . . . . . . . . . . . . . . . . 34
2.5 Incident Investigation . . . . . . . . . . . . . . . . . . . . . . . . . . . . . . . . . . . . 37
2.5.1 Incident Report Structure . . . . . . . . . . . . . . . . . . . . . . . . . . . . . . 38
3 Condition Monitoring Pilot in Klaveness 413.1 Background and Ambitions . . . . . . . . . . . . . . . . . . . . . . . . . . . . . . . . . 41
3.2 Short and Long-Term Benefits of Condition Monitoring . . . . . . . . . . . . . . . . . . 42
3.2.1 Short Term Benefits . . . . . . . . . . . . . . . . . . . . . . . . . . . . . . . . 42
3.2.2 Long Term Benefits . . . . . . . . . . . . . . . . . . . . . . . . . . . . . . . . . 43
3.3 Condition Monitoring Pilot on MV Balboa and MV Ballard . . . . . . . . . . . . . . . . 45
3.3.1 Key Takeaways . . . . . . . . . . . . . . . . . . . . . . . . . . . . . . . . . . . 45
3.3.2 Vibration Analysis Example . . . . . . . . . . . . . . . . . . . . . . . . . . . . 46
3.4 Offline or Online Condition Monitoring . . . . . . . . . . . . . . . . . . . . . . . . . . 47
3.5 Klaveness’ Proposal for Equipment To Be Monitored . . . . . . . . . . . . . . . . . . . 48
3.5.1 Incident History Across the Fleet . . . . . . . . . . . . . . . . . . . . . . . . . 48
4 Method 534.1 Failure Modes, Effect and Criticality Analysis . . . . . . . . . . . . . . . . . . . . . . . 53
4.1.1 Planning . . . . . . . . . . . . . . . . . . . . . . . . . . . . . . . . . . . . . . 53
4.1.2 Performing . . . . . . . . . . . . . . . . . . . . . . . . . . . . . . . . . . . . . 56
4.1.3 Documenting . . . . . . . . . . . . . . . . . . . . . . . . . . . . . . . . . . . . 58
4.2 Incident Analysis . . . . . . . . . . . . . . . . . . . . . . . . . . . . . . . . . . . . . . 58
4.2.1 Incident Report Structure . . . . . . . . . . . . . . . . . . . . . . . . . . . . . . 59
4.2.2 Analysis Process . . . . . . . . . . . . . . . . . . . . . . . . . . . . . . . . . . 59
5 Results 675.1 Failure Modes, Effects and Criticality Analysis (FMECA) . . . . . . . . . . . . . . . . 67
5.1.1 Failure Rate Estimation . . . . . . . . . . . . . . . . . . . . . . . . . . . . . . . 67
5.1.2 FMECA Worksheet . . . . . . . . . . . . . . . . . . . . . . . . . . . . . . . . . 71
5.1.3 Risk Matrix . . . . . . . . . . . . . . . . . . . . . . . . . . . . . . . . . . . . . 71
5.2 Incident Report Analysis . . . . . . . . . . . . . . . . . . . . . . . . . . . . . . . . . . 73
5.2.1 Incident Dates . . . . . . . . . . . . . . . . . . . . . . . . . . . . . . . . . . . 73
5.2.2 Failure Categories . . . . . . . . . . . . . . . . . . . . . . . . . . . . . . . . . 73
5.2.3 Equipment Involved . . . . . . . . . . . . . . . . . . . . . . . . . . . . . . . . 74
5.2.4 Main Components . . . . . . . . . . . . . . . . . . . . . . . . . . . . . . . . . 76
5.2.5 Immediate Cause . . . . . . . . . . . . . . . . . . . . . . . . . . . . . . . . . . 76
viii

5.2.6 Root Cause . . . . . . . . . . . . . . . . . . . . . . . . . . . . . . . . . . . . . 78
6 Discussion 816.1 Available Data . . . . . . . . . . . . . . . . . . . . . . . . . . . . . . . . . . . . . . . . 81
6.2 Failure Modes, Effects and Criticality Analysis . . . . . . . . . . . . . . . . . . . . . . 82
6.2.1 Probability of Occurrence . . . . . . . . . . . . . . . . . . . . . . . . . . . . . 82
6.2.2 Consequences of Next Level and Global Effects . . . . . . . . . . . . . . . . . . 83
6.3 Incident Analysis . . . . . . . . . . . . . . . . . . . . . . . . . . . . . . . . . . . . . . 85
6.3.1 Failure Categories . . . . . . . . . . . . . . . . . . . . . . . . . . . . . . . . . 85
6.3.2 Equipment Failures . . . . . . . . . . . . . . . . . . . . . . . . . . . . . . . . . 86
6.3.3 Main Component Failures . . . . . . . . . . . . . . . . . . . . . . . . . . . . . 86
6.3.4 Immediate and Root Causes . . . . . . . . . . . . . . . . . . . . . . . . . . . . 86
6.4 Incident Reports . . . . . . . . . . . . . . . . . . . . . . . . . . . . . . . . . . . . . . . 87
7 Conclusion 91
8 Further Work and Recommendations 93
Bibliography 95
Appendix 101
A HFO Purifier System P&ID 101
B Condition Monitoring Pilot 103
C Incident Report 105
D Results 109
ix

[This page intentionally left blank]
x

List of Figures
2.1 Evolution of maintenance practices. From Knutsen et al. (2014). . . . . . . . . . . . . . 6
2.2 Fatalities per year in passenger aircraft (left axis), and passenger carried (right axis).
From Knutsen et al. (2014). . . . . . . . . . . . . . . . . . . . . . . . . . . . . . . . . . 8
2.3 Fatalities per year in passenger ships (left axis), and ship-years (right axis). From Knut-
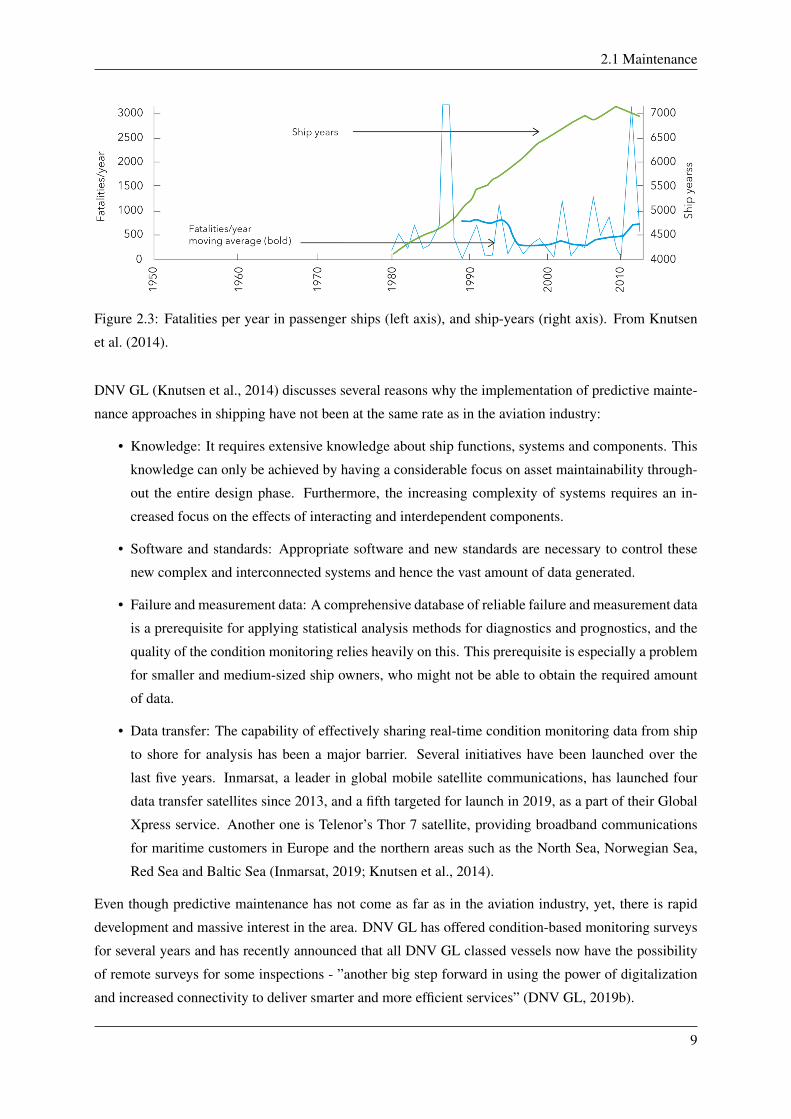
sen et al. (2014). . . . . . . . . . . . . . . . . . . . . . . . . . . . . . . . . . . . . . . . 9
2.4 A possible future for maintenance onboard ships. From Knutsen et al. (2014). . . . . . . 13
2.5 Baseline spectrum of a pump (left) and the vibration spectrum of the same pump three
months later (right). From (Bloch and Geitner, 1997). . . . . . . . . . . . . . . . . . . . 15
2.6 Flowchart of a generic fuel oil treatment system. Adapted from (Alfa Laval, 2018b). . . 19
2.7 Cross section view of a centrifugal separator with gravity discs. From (Alfa Laval, 2018b). 19
2.8 3D model of the Alfa Laval P 615 separator. From (Alfa Laval, 2018a). . . . . . . . . . 20
2.9 Cross section view of the P 615 separator. From (Alfa Laval, 2018a). . . . . . . . . . . . 21
2.10 Cross section view of the P 615 separator showing the liquid flow. From (Alfa Laval,
2018a). . . . . . . . . . . . . . . . . . . . . . . . . . . . . . . . . . . . . . . . . . . . 22
2.11 Close-up of separator cross section view. From (Alfa Laval, 2018a). . . . . . . . . . . . 23
2.12 Sources of drive problems. From (Gates Corporation, 2014). . . . . . . . . . . . . . . . 25
2.13 Distribution of failures in shafts. Adapted from (Sachs, 1993). . . . . . . . . . . . . . . 26
2.14 Distribution of failures in electrical motors. Adapted from (Thorsen and Dalva, 1994). . 26
2.15 Distribution of failures in bearings. Adapted from (Bloch and Budris, 2014). . . . . . . . 28
2.16 Distribution of failures in bearings in an oil refinery. Adapted from (Bloch and Budris,
2014). . . . . . . . . . . . . . . . . . . . . . . . . . . . . . . . . . . . . . . . . . . . . 28
2.17 Excerpt of the FMECA conducted in this thesis. . . . . . . . . . . . . . . . . . . . . . . 32
2.18 Overview of activities undertaken during the FMECA process. From (NEK, 2018) . . . 35
3.1 Klaveness’ operational targets. . . . . . . . . . . . . . . . . . . . . . . . . . . . . . . . 42
3.2 Short term benefits of piloting CBM on two CABU vessels. . . . . . . . . . . . . . . . . 43
3.3 Long term benefits of condition-based monitoring fleet-wide in Klaveness. . . . . . . . . 44
xi

3.4 Velocity spectrum, 12.06.2018, on the non drive end (NDE) of the Electric Motor of the
Purifier. . . . . . . . . . . . . . . . . . . . . . . . . . . . . . . . . . . . . . . . . . . . 46
3.5 Velocity spectrum on the non drive end (NDE) of the Electric Motor of the Purifier. Red:
12.06.2018, Blue: 05.12.2018. . . . . . . . . . . . . . . . . . . . . . . . . . . . . . . . 47
3.6 List of equipment and incidents that might have been detected by vibration monitoring.
The highlighted equipment should be reconsidered. The red symbol indicates equipment
that will not have vibration monitoring equipment installed. . . . . . . . . . . . . . . . . 50
3.7 Incident history plot, from 2015-2019, of equipment proposed for vibration monitoring. . 51
4.1 System boundaries (red) for the analysis of the HFO purifiers. Adapted from (Alfa Laval,
2018a). . . . . . . . . . . . . . . . . . . . . . . . . . . . . . . . . . . . . . . . . . . . 54
4.2 Functional block diagram of the HFO purifier. . . . . . . . . . . . . . . . . . . . . . . . 55
4.3 Excerpt from the FMECA analysis. . . . . . . . . . . . . . . . . . . . . . . . . . . . . . 56
4.4 General structure of the incident reports in Klaveness. . . . . . . . . . . . . . . . . . . . 59
4.5 Excerpt from the spreadsheet containing all the incident reports, untreated. The bottom
image is a continuation of the top one. . . . . . . . . . . . . . . . . . . . . . . . . . . . 61
4.6 Excerpt from the spreadsheet for the incident analysis. The bottom picture is a continu-
ation of the top one. . . . . . . . . . . . . . . . . . . . . . . . . . . . . . . . . . . . . . 63
4.7 Standby system with two items. . . . . . . . . . . . . . . . . . . . . . . . . . . . . . . 65
5.1 Distribution of failure consequences considering next level effects in the FMECA with
respect to safety, downtime and cost. . . . . . . . . . . . . . . . . . . . . . . . . . . . . 72
5.2 Distribution of failure consequences considering global effects in the FMECA with re-
spect to safety, downtime and cost. . . . . . . . . . . . . . . . . . . . . . . . . . . . . . 72
5.3 Distribution of Incidents per year. . . . . . . . . . . . . . . . . . . . . . . . . . . . . . 73
5.4 Distribution of failure categories and share of incidents that could potentially have been
detected by vibration monitoring. . . . . . . . . . . . . . . . . . . . . . . . . . . . . . . 74
5.5 Distribution of equipment failures and share of these that could potentially have been
detected by vibration monitoring. . . . . . . . . . . . . . . . . . . . . . . . . . . . . . . 75
5.6 Distribution of main component failures and share of these that could potentially have
been detected by vibration monitoring. . . . . . . . . . . . . . . . . . . . . . . . . . . . 76
5.7 Distribution of immediate causes and share of these that could potentially have been
detected by vibration monitoring. . . . . . . . . . . . . . . . . . . . . . . . . . . . . . . 77
5.8 Distribution of root causes and share of these that could potentially have been detected
by vibration monitoring. . . . . . . . . . . . . . . . . . . . . . . . . . . . . . . . . . . 78
B.1 List of monitored components in Klaveness’ CM pilot project. . . . . . . . . . . . . . . 104
C.1 Risk Matrix. . . . . . . . . . . . . . . . . . . . . . . . . . . . . . . . . . . . . . . . . . 108
xii

List of Tables
2.1 Failure causes of rolling and plain bearings. Adapted from (Versicherungs-AG, 1978). . 29
3.1 Equipment covered in the pilot project (Component column) and equipment proposed
for fleet-wide installation (Monitor column). . . . . . . . . . . . . . . . . . . . . . . . . 49
5.1 Failure estimation of main components. . . . . . . . . . . . . . . . . . . . . . . . . . . 68
5.2 Sub-component failure estimation for all parts. . . . . . . . . . . . . . . . . . . . . . . 69
5.3 Sub-component failure estimation for all parts when excluding the the electrical motors. . 70
5.4 Sub-component failure estimation for the electrical motors. . . . . . . . . . . . . . . . . 70
5.5 Mean time between failure for the passive redundant purifier system. . . . . . . . . . . . 71
5.6 Summary of the results from the incident analysis. . . . . . . . . . . . . . . . . . . . . . 79
xiii

xiv

Acronyms
CBM Condition-Based Maintenance.
CM Condition Monitoring.
FMECA Failure Modes, Effect and Criticality Analysis.
HFO Heavy Fuel Oil.
LCC Life-Cycle Costs.
MTBF Mean Time Between Failure.
MTTF Mean Time To Failure.
MTTR Mean Time To Repair.
PdM Predictive Maintenance.
PM Preventive Maintenance.
RCM Reliability Centered Maintenance.
SSC Structure, System and Component.
USD United States dollar.
VM Vibration Monitoring.
xv

[This page intentionally left blank]
xvi

Chapter 1Introduction
1.1 Background
Ships and other marine platforms are complex and capital-intensive systems designed for being in service
for many years. Most ships are in service for 25-30 years before reduced efficiency, increased wear,
costly operations and reparations make it unprofitable for the owner (Henriksen, 2015). While ships are
in service, their availability and operational readiness are highly crucial to the supply chain, due to costs
associated with downtime and knock-on effects on the entire transportation system.
Experiences with analyzing life-cycle costs (LCC) suggest that a large share of a system’s projected costs
are assigned maintenance and support activities to keep the system operational and available throughout
its planned service life. Such maintenance and support costs often account for up to 70-75% of the
system’s LCC (Blanchard et al., 1995; Dhillon, 1989). Since maintenance can account for a substantial
amount of the LCC of a ship, an increased focus on the maintenance system is likely to reduce total
life-cycle maintenance costs and durations, prevent long out-of-service times and possible injuries to
maintenance personnel and the environment.
Over the years, maintenance has evolved from being something performed after a functional failure to
a preventive activity, assuming that a component has a defined lifetime. Here, components and systems
are overhauled, or replaced, based on a schedule. However, such lifetime estimates often come with
a high degree of uncertainty. As a result, the scheduled maintenance is often performed too late or
too early, causing functional failures or high costs from unnecessary replacements. Additionally, when
disassembling components for inspection, there is also a risk of introducing faults, causing a failure
shortly after (Knutsen et al., 2014).
To reduce the uncertainty associated with time-based schedules, predictive approaches based on eval-
uation of asset condition have appeared. These developments can be traced back to the 1960s when
discovering that a considerable amount of failures in complex aircraft were random, and not age-related
1

Chapter 1. Introduction
as previously believed. Thus, regular inspections and condition monitoring using sensors were imple-
mented to determine whether any failures were imminent. These discoveries have, amongst others, led to
the development of Reliability Centered Maintenance (RCM), a maintenance framework using condition
monitoring (CM) as a means to cost-effectively increase safety and availability (Knutsen et al., 2014).
The reason for implementing condition monitoring is ”to increase the overall safety level in order to
reduce the risk of loss of life and property, while also minimizing the costs associated with maintenance
of the component or system being monitored” (Knutsen et al., 2014). To achieve this, one can increase
the reliability of the monitored component or system or reduce the consequences of failures. The relia-
bility can be improved by closely monitoring potential failure mechanisms and avoiding these through
operational measures and maintenance, in the short- and long-term, respectively.
Norwegian shipping company Klaveness is a leading service provider to the global dry bulk industry,
operating close to 135 vessels and carrying about 65 million tonnes of cargo annually. Also, Klaveness
has a unique concept for combination carriers. On two of their ships, they have installed a large amount
of offline and manual vibration monitoring equipment. Klaveness want this to take them from Preventive
Maintenance (PM) to Condition-Based Maintenance (CBM) and predictive maintenance.
The ships are now conducting monthly measurements, and they are receiving quarterly reports from
their supplier IKM Instrutek with information on system condition, in addition to advice and guidance
on recommended measures. On their most recently built ships, they will also send ashore operating
parameters from the automation systems that report pressures, temperatures, RPM and load, amongst
others, from most components on board. These parameters are also available on the vessels in the pilot
project, however, only locally onboard.
When installing online monitoring equipment in the entire fleet, Klaveness plan to reduce the number
of equipment being monitored to ensure that it adds value. One of the systems considered for online
monitoring is the heavy fuel oil (HFO) purifiers. The purpose of this system is to remove undesirable
liquid and solid contaminants from the HFO to prevent decreased fuel oil efficiency and damage to the
main engine. The HFO purifier system is a system with redundancy, but also with a history of incidents
that could have been prevented. Because of the importance of proper fuel treatment and the incident
history of the HFO purifiers, the thesis will focus on condition monitoring of the HFO purifiers.
2

1.2 Objective
1.2 Objective
The objective of this thesis is to assess whether it would be beneficial for Klaveness to equip HFO puri-
fiers with vibration monitoring equipment onboard their ships in a fleet-wide installation. This question
arose after Klaveness conducted a condition monitoring pilot onboard two of their ships. Even though
this is a redundant system, it has a history of incidents that could have been prevented.
The thesis will, in a qualitative manner, attempt to answer the following research questions:
1. What are the failure modes with the highest probabilities of occurrence and severity of conse-
quences, and how can these be detected?
2. What kind of information can be extracted from the incident reports regarding HFO purifiers in
the Klaveness fleet, and could any of these incidents have been detected by vibration monitoring?
The outcome of this thesis will aid Klaveness in the decision-making process regarding whether to equip
the HFO purifiers in their fleet with vibration monitoring equipment. The results may also help Klaveness
in optimizing the maintenance of these purifiers, primarily with regard to overall maintenance strategy.
1.3 Scope and Limitations
The scope in this task is twofold, but the two parts are still closely related. The first part is to exemplify
the practice of FMECA by analysing an HFO purifier system used onboard several ships in the Klaveness
fleet, while the second part consists of analysing incident reports related to the same HFO purifiers in
the fleet. The two parts are carried out in parallel as the incident reports provide important and valuable
input for the FMECA.
Therefore, the overall scope is to highlight the most critical parts of the HFO purifier system concern-
ing the probability of occurrence and severity of consequences and provide Klaveness with information
regarding the amount and type of incidents that could potentially have been revealed by vibration moni-
toring.
Due to time limitations, no further analyses of the most critical failures highlighted in the FMECA are
conducted. Furthermore, the FMECA is conducted in a semi-qualitative manner. Both the likelihood
of failures and the severity of consequences are given scores based on the risk matrix seen in Appendix
C. The likelihood of failure is estimated based on analysis of the provided incident reports, while the
severity of consequences are a result of Klaveness’ own experiences with the equipment and discussions
between Klaveness and the author.
Additionally, the FMECA and incident analysis is performed by the author alone. As the author’s first-
hand experience with the analysed system is somewhat limited, it must be expected that the outcome of
the analyses may contain minor errors. However, the FMECA analysis has been reviewed by Klaveness
throughout the process, and the author has discussed the probability that the occurred incidents could
3

Chapter 1. Introduction
have been detected by vibration monitoring with Karsten Moholt, a company with expertise in mainte-
nance and monitoring of rotating machinery and equipment. This ensures that the final results of the
thesis should be at an acceptable level.
1.4 Thesis Structure
The work of this thesis has essentially been carried out as follows: literature review, description of
the condition monitoring pilot conducted in Klaveness, explanation of the methods used, and finally a
presentation and discussion of the obtained results. The thesis is structured in the following way:
• Chapter 2 - Literature: First, the literature review explains the history of maintenance, followed
by the status of maintenance in shipping today and in the future. Then, CBM is explained, with
a focus on vibration monitoring (VM). Further, centrifugal purifiers in fuel oil treatment systems
are presented. This includes a description of fuel oil treatment systems in general, a more detailed
description of the function and design of HFO purifiers and their most common failure modes
and causes, followed by previous studies and analyses on such systems. Finally, the method of
FMECA and incident investigation is presented.
• Chapter 3 - Condition Monitoring Pilot in Klaveness: Here, the condition monitoring pilot
conducted on two ships in the Klaveness fleet is presented. First, the background for the pilot
and Klaveness’ maintenance ambitions are explained, followed by a description of the benefits
of condition monitoring. Further, the key takeaways from the pilot are summarised, followed by
a comparison between offline and online condition monitoring. Finally, Klaveness’ proposal for
which equipment should be monitored in a fleet-wide installation is given.
• Chapter 4 - Method: This chapter explains how the analyses in this thesis were carried out.
An explanation of the FMECA methodology is presented, followed by an explanation of how the
incident reports were analysed.
• Chapter 5 - Results: Following the structure of the previous chapter, the results of the FMECA is
presented first, followed by the results from the incident report analysis.
• Chapter 6 - Discussion: This chapter first discusses the data available for the FMECA and inci-
dent report analysis. Then, the FMECA and its results are discussed, followed by a review of the
results from the incident report analysis. Finally, the actual incident reports are discussed. This
includes their structure, content and recommended changes to improve the reports.
• Chapter 7 - Conclusions: As the penultimate part of this thesis, the conclusions is presented.
• Chapter 8 - Further Work and Recommendations: Finally, any recommendations and further
work that should be considered before a final decision is taken is given.
4

Chapter 2Literature
This chapter provides background information on the topic of maintenance, the system to be analysed,
and analysis methods used. It also serve as a more thorough introduction to the thesis itself. First, the
history of maintenance is described in brief. Then, the status and future of maintenance and condition
monitoring in shipping are reviewed. Next, an introduction to CBM is given, and vibration monitoring
is described in more detail. After that, the design and function of centrifugal separators in fuel oil
treatment systems is explained. Finally, the method of FMECA, as well as a brief introduction to incident
investigation, is presented.
2.1 Maintenance
2.1.1 History
Over the years, the maintenance discipline has been under constant development. It has evolved from
being a corrective process, performed after functional failure, to be more preventive, where compo-
nents and systems are overhauled or replaced based on a given time-schedule, assuming that they have a
defined lifetime, see Figure 2.1. However, such lifetime estimates often come with a high degree of un-
certainty. To reduce the uncertainty associated with time-based schedules, predictive approaches based
on evaluation of asset condition have appeared. The perhaps most common is condition monitoring
(CM), which is a significant component of predictive maintenance (PdM), also known as, and often used
interchangeably with, condition-based maintenance (CBM). These developments can be traced back to
the air transportation industry in the 1960s (Knutsen et al., 2014).
Moubray, 1997, one of the pioneers of RCM, say that the evolution of maintenance since the 1930s
can be traced through three generations. The first generation takes place in the period up to the Second
World War. In this period, industries were not particularly mechanised, but instead dependent on manual
labour. As a result, equipment downtime and prevention of failures was thus not devoted much attention.
Additionally, more complicated maintenance strategies than corrective maintenance was not deemed
5
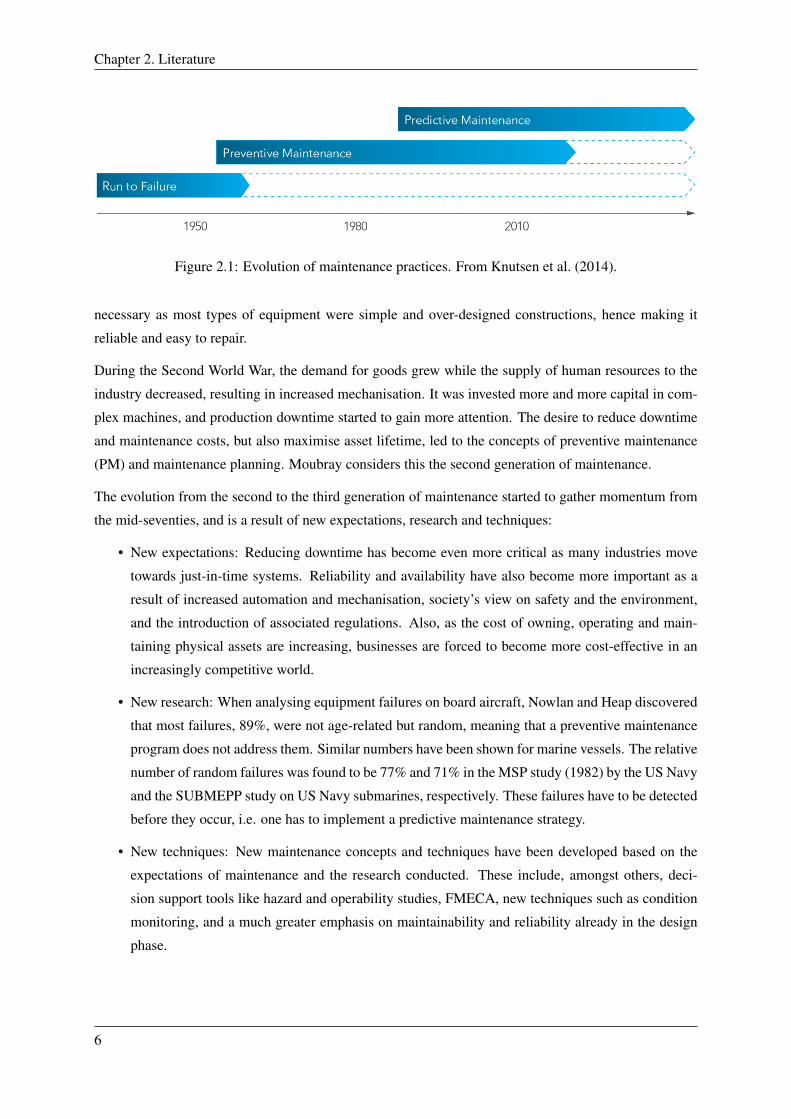
Chapter 2. Literature
Figure 2.1: Evolution of maintenance practices. From Knutsen et al. (2014).
necessary as most types of equipment were simple and over-designed constructions, hence making it
reliable and easy to repair.
During the Second World War, the demand for goods grew while the supply of human resources to the
industry decreased, resulting in increased mechanisation. It was invested more and more capital in com-
plex machines, and production downtime started to gain more attention. The desire to reduce downtime
and maintenance costs, but also maximise asset lifetime, led to the concepts of preventive maintenance
(PM) and maintenance planning. Moubray considers this the second generation of maintenance.
The evolution from the second to the third generation of maintenance started to gather momentum from
the mid-seventies, and is a result of new expectations, research and techniques:
• New expectations: Reducing downtime has become even more critical as many industries move
towards just-in-time systems. Reliability and availability have also become more important as a
result of increased automation and mechanisation, society’s view on safety and the environment,
and the introduction of associated regulations. Also, as the cost of owning, operating and main-
taining physical assets are increasing, businesses are forced to become more cost-effective in an
increasingly competitive world.
• New research: When analysing equipment failures on board aircraft, Nowlan and Heap discovered
that most failures, 89%, were not age-related but random, meaning that a preventive maintenance
program does not address them. Similar numbers have been shown for marine vessels. The relative
number of random failures was found to be 77% and 71% in the MSP study (1982) by the US Navy
and the SUBMEPP study on US Navy submarines, respectively. These failures have to be detected
before they occur, i.e. one has to implement a predictive maintenance strategy.
• New techniques: New maintenance concepts and techniques have been developed based on the
expectations of maintenance and the research conducted. These include, amongst others, deci-
sion support tools like hazard and operability studies, FMECA, new techniques such as condition
monitoring, and a much greater emphasis on maintainability and reliability already in the design
phase.
6

2.1 Maintenance
Even though this third generation of maintenance started to gather momentum already some 40-50 years
ago, few companies seem to have taken the final step into it. However, several companies are operating
between the second and third generation. Bellias, 2017, state that CBM is the most widely accepted
current method. The significant development within computer and sensor technology is making CBM
possible and profitable for an increasing number of companies. However, CBM solutions are data inten-
sive and require that condition monitoring processes are established, which is why it is not prevalent in
industries today, though this is starting to change as it is becoming increasingly more common. Further-
more, Bellias believes that prescriptive maintenance is the future. Like predictive maintenance, it utilizes
advanced analytics, but differ in the way that it does ”not only make recommendations but also act on
recommendations.”
2.1.2 Status in Shipping
Through the International Safety Management (ISM) Code, the International Maritime Organization
(IMO) provide an international standard for the safe management and operation of ships and pollution.
This standard applies to all commercial vessels greater than 500 gross tonnes (GT). About maintenance,
ISM states that ”The Company should establish procedures to ensure that the ship is maintained in
conformity with the provisions of the relevant rules and regulations and with any additional requirements
which may be established by the Company”. Thus, the shipping companies are required to perform
inspections at regular and appropriate intervals, report any nonconformities, take appropriate corrective
action and record these (International Maritime Organization, 2010). It is up to each company to decide
which maintenance strategy to opt for as long as they can show that they comply with the standard. Class
societies offer recommendations on maintenance, and DNV GL, for instance, declares that ”Every ship
shall have implemented a maintenance system” and that ”maintenance [...] shall be in accordance with
applicable recognised standards in the industry or in accordance with procedures recommended by the
manufacturer” (DNV GL, 2019a).
DNV GL (Knutsen et al., 2014), state that ”maintenance in shipping generally follows a preventive or
scheduled maintenance system, often called Planned Maintenance System (PMS)”. Many ship owners
and operators tend to follow the guidelines regarding maintenance as given by the manufacturer and class
(Mokashi et al., 2002). By doing so, the company do not have to spend resources on developing mainte-
nance schedules. Additionally, for the warranty to be valid, many suppliers require that their guidelines
are followed. Even though the strategy is both simple to follow and implement, it is rarely the most
optimal for the ship operator. Many equipment manufacturers and suppliers do not have sufficient or sat-
isfactorily knowledge about the operating context of the equipment and working environment where it
will be used, often leading to maintenance requirements that should be able to manage worst-case scenar-
ios. This is often likely to result in over-maintenance, thus wasting valuable resources for the shipowner
and operator (Linton, 2011; Mokashi et al., 2002; Tam et al., 2006). Linton (2011) demonstrates this
through laboratory tests conducted on an outboard engine on a ship in the US Coast Guard. The results
showed that the recommended maintenance requirements from the manufacturer were excessive. Never-
7

Chapter 2. Literature
Figure 2.2: Fatalities per year in passenger aircraft (left axis), and passenger carried (right axis). From
Knutsen et al. (2014).
theless, the manufacturer was unwilling to extend the maintenance intervals. One of the reasons might
be the fear of liability claims.
Only having to meet a minimum standard to comply with rules and regulations has, according to Shorten
(2012), lead to an industry that is ”lead by compliance” and ”does not normally seek to exceed the
minimum standard”. This puts most shipping companies in the second generation of maintenance, as
described by Moubray (1997). In his paper, Shorten (2012) presents numbers showing that only 17% of
classed ships operate with an approved PMS, and only 12% of these use CM, meaning that only 2% have
a CM scheme in place, despite the many benefits of implementing such schemes. DNV GL list several
benefits of moving towards a condition-based maintenance approach: diagnostics, prognostics and risk
tools, increased safety, reliability and industry transparency, reduced number and frequency of inspec-
tions and repairs, improved spare parts exchange and logistics, reduced costs related to maintenance and
downtime and to preserve asset value, and improved design (Knutsen et al., 2014).
The introduction of CBM has had a positive effect on aircraft safety. The discoveries of Nowlan and Heap
(1978), indicating that most failures are not age-related but random, shifted the maintenance paradigm
towards on-condition maintenance. MSG-1 (Maintenance steering group 1) was introduced in 1968,
followed by MSG-2 in 1970 and MSG-3 in 1980. The implementation of the maintenance strategies de-
veloped here shows that passenger safety improved greatly approximately 5-10 years after the documents
were published, as depicted in Figure 2.2. The number of fatalities per year peaked between 1970 and
1980 and has steadily decreased since then. At the same time, the number of passengers carried per year
has more than tripled, and seem to increase exponentially. The same numbers are not to be found in the
shipping industry as of today, see Figure 2.3. Here, it seems like the number of ship years has increased
linearly, while the number of fatalities per year has remained constant. The increase in fatalities per year,
and the number of ship years flattening out might indicate that the safety of, in this case, passenger ships
have become worse lately. The fact that the development of maintenance strategies and procedures has
been slower compared to the aviation industry could be a contributing cause (Knutsen et al., 2014).
8
2.1 Maintenance
Figure 2.3: Fatalities per year in passenger ships (left axis), and ship-years (right axis). From Knutsen
et al. (2014).
DNV GL (Knutsen et al., 2014) discusses several reasons why the implementation of predictive mainte-
nance approaches in shipping have not been at the same rate as in the aviation industry:
• Knowledge: It requires extensive knowledge about ship functions, systems and components. This
knowledge can only be achieved by having a considerable focus on asset maintainability through-
out the entire design phase. Furthermore, the increasing complexity of systems requires an in-
creased focus on the effects of interacting and interdependent components.
• Software and standards: Appropriate software and new standards are necessary to control these
new complex and interconnected systems and hence the vast amount of data generated.
• Failure and measurement data: A comprehensive database of reliable failure and measurement data
is a prerequisite for applying statistical analysis methods for diagnostics and prognostics, and the
quality of the condition monitoring relies heavily on this. This prerequisite is especially a problem
for smaller and medium-sized ship owners, who might not be able to obtain the required amount
of data.
• Data transfer: The capability of effectively sharing real-time condition monitoring data from ship
to shore for analysis has been a major barrier. Several initiatives have been launched over the
last five years. Inmarsat, a leader in global mobile satellite communications, has launched four
data transfer satellites since 2013, and a fifth targeted for launch in 2019, as a part of their Global
Xpress service. Another one is Telenor’s Thor 7 satellite, providing broadband communications
for maritime customers in Europe and the northern areas such as the North Sea, Norwegian Sea,
Red Sea and Baltic Sea (Inmarsat, 2019; Knutsen et al., 2014).
Even though predictive maintenance has not come as far as in the aviation industry, yet, there is rapid
development and massive interest in the area. DNV GL has offered condition-based monitoring surveys
for several years and has recently announced that all DNV GL classed vessels now have the possibility
of remote surveys for some inspections - ”another big step forward in using the power of digitalization
and increased connectivity to deliver smarter and more efficient services” (DNV GL, 2019b).
9
Chapter 2. Literature
2.1.3 Maintenance in the Future
When considering the development of maintenance, and especially condition monitoring, the aviation
experienced from 1970 to 2000, it is far from unlikely that the shipping industry might experience a
similar accelerated development in the years to come. In their position paper about condition monitoring
in the maritime industry, DNV GL says that shipping may even have caught up with aviation regarding
maintenance technologies by 2030. Together with the emerging wind turbine industry, shipping may
even be a part of those ”pushing forward the science of condition monitoring and maintenance”. In order
for the shipping industry to shift from today’s scheduled maintenance approach to condition-based main-
tenance, the development of, amongst others, smart sensors, i.e. sensors with integrated pre-processing
capabilities, connectivity between ship and shore, databases and information management systems is
essential (DNV GL, 2017).
2.1.3.1 Trends and Technologies Transforming Vessel Maintenance
As technology progresses, new techniques are continually emerging that can help improve maintenance
in the shipping industry. For the shipping companies, it is vital to keep up with these trends and develop-
ments and not fall behind in an increasingly competitive market. In the shipping and logistics industry,
”grow or go” is the new norm according to WNS, and it is essential for companies to continuously
identify opportunities to ”optimize revenues, reduce costs, improve profitability and enhance customer
experience” WNS (2019a,b). Some of the trends and technologies that are believed to transform vessel
maintenance are listed below and explained briefly.
Sensors: Sensor technologies are already well developed and widely used, but they are becoming in-
creasingly more intelligent. Smart sensors, i.e. sensors with integrated pre-processing capabilities, are
one of those technologies that have the potential to make maintenance more manageable, less expensive
and invasive. Energy harvesting devices are also emerging, thus removing the need for cabling and bat-
teries to power the wireless sensors. Sensors that are resilient to high temperatures and pressures are
also appearing, allowing for monitoring in, e.g. engine cylinder walls, turbine blades or other abrasive
locations. Another recent focus has been on how sensors can be combined to form a ”reconfigurable
and collaborative network”, thus optimizing their output (Knutsen et al., 2014). Besides, by introducing
artificial intelligence and machine learning, sensors can provide an even more detailed insight into ship
operations and immediately alert the crew if any components need maintenance.
Increased Connectivity: IT-based technologies and solutions are playing an increasingly more impor-
tant role in ship maintenance. As aforementioned, vast amounts of data will be collected and sent ashore
for further data processing, and a fast broadband connection between ship and shore is essential to maxi-
mize the potential of these new solutions and technologies. The advantage of sending the data to shore is
that experts and more computationally intensive analyses can be used to advice on operational measures
10

2.1 Maintenance
or corrective actions that need to be taken, thus also improving the competence of the crew onboard.
The lesser need for the physical presence of experts will also help reduce costs. The development of
”structures and methods for the collection, transmission, and handling of this new ’big data’” is therefore
essential for the shipping industry to migrate to real-time, risk-based maintenance (Knutsen et al., 2014).
Virtual Engineering and Augmented Reality: Support services from remote control centres can be
further enhanced by utilizing virtual engineering and augmented reality (AR) technologies. With this
technology, the crew can interact with technical experts onshore and receive real-time advice and techni-
cal support through mobile devices and specially made goggles. As a result, a crew member or engineer
does not have to be an expert in one discipline, but can rather be reasonably proficient across a range of
disciplines instead. These support services are highly relevant when operations are becoming increas-
ingly more autonomous, with less crew on board (Wingrove, 2018).
Artificial Intelligence and Machine Learning: With increased global connectivity and the advent of
the Internet of Things (IoT) technology, shipping companies are gathering vast amounts of data every day,
including fuel consumption, performance, weather and numerous of other variables. The big question
is how to utilize these amounts of data. Machine learning (ML) algorithms are the building blocks of
artificial intelligence (AI), that can prove to be important in the transition to predictive maintenance. AI is
capable of crunching numbers and detects anomalies at a much higher level than us humans. Even though
AI can provide beneficial results already today, humans will still play an essential role in finding the
causes of the detected anomalies, according to Wartsila (Lipsith, 2019). Among the obstacle to the uptake
of AI, Texas-based AI company SparkCognition mentions the ”lack of connectivity on many ships, [...]
the actual lack of sensors installed on ship equipment” and the fact that ”AI must be ’explainable’ rather
than a ’black box’”, i.e. it has to show its workings and how it reaches conclusions (Lipsith, 2019).
Digital Twins: One can define a digital twin as ”a digital replica of a living or non-living physical
entity. By bridging the physical and the virtual world, data is transmitted seamlessly allowing the virtual
entity to exist simultaneously with the physical entity” (El Saddik, 2018). Such digital models allow
for complex simulations of the ship and its systems, or even the entire ship itself. That way, anything
in the model can be tested before taking any risk. Also, by feeding live data into the digital twin, one
can potentially predict, and optimize, the performance and health of the vessel. In addition to operations
simulation and troubleshooting, digital twins can also aid in product improvement in the design phase, as
well as training of the crew and classification in the operational phase. Challenges with digital twins and
predictive maintenance are related to the difficulty of precisely modelling the physical twin’s properties
and any equipment changes made later on, as well as detailed information and data about equipment
failure modes (Shiklo, 2018).
11

Chapter 2. Literature
2.1.3.2 Stages of implementation
Considering the challenges mentioned above associated with a CBM approach, the transition towards
a real-time, risk-based maintenance regime will most likely be a step-wise process. Depending on the
level of ”commitment and corporal cultural changes” and will to invest in research, development and
necessary infrastructure, the benefits of implementing advanced condition monitoring systems will also
happen in stages. In their position paper (Knutsen et al., 2014), DNV GL list three possible stages
of implementation for ship-owners wanting to shift from today’s scheduled maintenance approach to
condition-based maintenance:
1. Identify the most critical failure modes of ship system and equip the relevant components with ap-
plicable sensors. The gathered data is to be analysed by onboard computers, determining whether
a component should continue to operate, be inspected, overhauled, or discarded.
2. Determine the remaining useful life (RUL), and thus what kind of maintenance that should be
performed and when, of components by combining statistical information about failures, physi-
cal degradation models and continuously measured parameters. This is also called prognostics.
The benefit here is that the reliability of the monitored ship systems can be estimated real-time,
improving availability and further reducing maintenance costs compared to the previous stages.
3. At this stage, condition-based maintenance will determine the correct amount and timing of main-
tenance for specific monitored components. Increased knowledge and experience with systems
and failure development improves the accuracy of diagnostics and prognostics, thus providing
more accurate RUL estimates. However, this requires considering asset maintainability through-
out the entire design phase. At the design stage, it is also necessary to develop models of ships
systems that can be used in future operations and be a part of a company’s decision support and
information management system.
2.1.3.3 A Possible Future
Further in their paper, DNV GL describes a possible future for the maintenance of shipping and how
it may develop until 2025, see Figure 2.4. Back in 2014, DNV GL predicted that systems to monitor
onboard conditions would become more mainstream in the next decade, and that data collection from
machinery would be performed on advanced ships by 2020 (e.g. offshore vessels). As of 2019, more
and more shipping companies are installing condition monitoring equipment, even on vessels that can be
considered less advanced, such as container vessels (Instrument, 2016).
Considering autonomy, DNV GL predicted that a prototype of a fully autonomous ship might appear
as early as 2015, and that we will see fully autonomous ships by 2025. There are several such projects
today, such as the container ship Yara Birkeland and DNV GL’s ReVolt. Also, the world’s first fully au-
tonomous ferry was successfully demonstrated by Rolls-Royce and Finferries in late 2018. Furthermore,
they believe that autonomous operation capabilities will become increasingly more standard on several
12

2.2 Condition-Based Maintenance
Figure 2.4: A possible future for maintenance onboard ships. From Knutsen et al. (2014).
types of ships by 2035. Combined with the development of automated systems in ports for loading and
unloading of cargo, some shipping segments, e.g. container transportation may become fully automated
by 2050 (DNV GL, 2014).
Among the other developments that might be expected in the future, DNV GL mentions ”collaborative
software tools to enable seamless coordination between various stakeholders, onboard robots, modular
designs, autonomous decision support systems, and tools for virtual operations, such as virtual surveys,
virtual guidance from land-based operators” as enablers for ”safer, smarter and greener” maintenance
procedures (DNV GL, 2014).
2.2 Condition-Based Maintenance
Condition-based maintenance, also known as and used interchangeably with predictive maintenance,
was first introduced in 1975 to ”maximise the effectiveness of PM decision making” (Ahmad and Ka-
maruddin, 2012). It is the most modern and aspiring maintenance technique, there exist vast amounts
of literature on the topic, and research in the area is rapidly growing (Jardine et al., 2006). According
to Jardine et al. (2006), CBM can be defined as ”a maintenance program that recommends maintenance
decisions based on the information collected through condition monitoring”, consisting of three main
steps: data acquisition, data processing and decision-making. Unlike previous maintenance techniques,
the lifetime of an asset is measured by monitoring different parameters that can say something about
its operating condition. Such parameters can, for instance, be vibration, lubricating oil, temperature or
noise. The main reason for adopting such a maintenance strategy is that 99% of machinery failures are
13
Chapter 2. Literature
preceded by some sign indicating an impending failure (Bloch and Geitner, 1997). CBM can, therefore,
help to maximise asset lifetime and further reduce downtime and maintenance costs.
Condition monitoring is the ”heart of CBM”, comprising data acquisition, processing and analysis (Cam-
pos, 2009). CM can be carried out in two ways: online or offline. These terms are often used in-
terchangeably with continuous and periodic condition monitoring. There exist different definitions for
these expressions in the literature. From now, it will be distinguished between online and offline con-
dition monitoring. For this thesis, online condition monitoring is defined as continuous and automatic
monitoring based on permanently installed measurement devices, such as vibration sensors. Thus, of-
fline condition monitoring is defined as periodic monitoring carried out with given time intervals by the
use of portable measurement devices, e.g. handheld vibration meters, where the data is downloaded and
analysed at a later time (Carnero, 2005).
Several condition monitoring techniques exist, some more suitable for a certain type of equipment than
others. Some of these are oil-analysis, lubricant monitoring, sound or acoustic monitoring, performance
monitoring, temperature or electrical monitoring. Physical condition monitoring is also a widely used
technique in many maintenance programs, focusing on the identification of physical changes of the
equipment, such as cracks and corrosion. The most popular technique, however, is vibration monitoring,
especially for rotating equipment (Ahmad and Kamaruddin, 2012; Barszcz, 2019; Higgs et al., 2004).
2.2.1 Vibration Monitoring
Braun et al. (1986) consider vibration analysis to be one of the two main techniques, along with lubri-
cant analysis, for obtaining information about the internal conditions of machines, especially for rotating
equipment (Hameed et al., 2009). It can, for instance, detect unbalanced rotating machinery, misalign-
ment, damaged gear teeth, belt drive defects and damaged bearings (Lazakis et al., 2016). It is by far the
most used method for condition monitoring, constituting about 58% of the total CM market (Barszcz,
2019; MarketsandMarkets Research Private Ltd., 2018).
No matter how good the condition of a machine, it generates vibrations. These vibrations can be linked
to periodic events in the operation of a machine, such as rotating shafts and meshing gear teeth, or for
instance fluid flow, as in for example pumps. When machine vibration increases, it is usually due to
wear or deterioration or changes made to the machine or structure. A proper functioning machine has
a specific vibration signature, thus allowing for fault detection by identifying changes in that signature,
linking those to potential failure modes.
The recorded vibration data is compared to characteristics of vibration of ”various types of trouble”
(Bloch and Geitner, 1997). Bloch and Geitner (1997) state that frequency is the key to this comparison.
The frequency comparison is based on the running or rotating speed(s) of the machine or machine parts.
When comparing the vibration data to the so-called baseline spectrum, i.e. vibration levels when the
machine is functioning correctly, the key is to compare frequencies. The displayed frequency determines
the type of fault or the source of the vibration. Different types of faults are associated with some multiple
14

2.2 Condition-Based Maintenance
Figure 2.5: Baseline spectrum of a pump (left) and the vibration spectrum of the same pump three months
later (right). From (Bloch and Geitner, 1997).
of the RPM (or running speed) of the machine. For instance, if there is an increase in amplitude at 1x
running speed (i.e. the RPM of the machine) compared to the baseline spectrum, the most likely cause is
an imbalance. The vibration frequency of unbalance is 1x running speed 90% of the time. If there is an
increased amplitude at 2x running speed instead, there is a high chance, 60%, that misalignment is the
cause (Bloch and Geitner, 1997).
Furthermore, the amplitude of the frequency determines the severity of the fault. Also, the larger the
amplitude is, the closer the sensor is to the source of the fault. How to interpret the collected vibration
data is shown in an example below:
Example: The vibration spectrum to the left in Figure 2.5 shows the initial vibrations of a pump, with
an amplitude of magnitude 1.5 at the running speed of the pump (1x CPM, or cycles per minute). After
three months, the amplitude at 1x running speed had increased significantly, to approximately 2.83, thus
calling for action. As mentioned above, this indicates an unbalance in the pump. After dismantling the
pump, it was discovered that a foreign object found its way through the pump and damaged the impeller
blades. This changed the centre of mass and led to an unbalance. Small harmonics can also be seen at
3600 CPM (2x running speed), 5400 CPM (3x running speed) and 7200 CPM (4x running speed). These
are small and were considered insignificant in this case (Bloch and Geitner, 1997).
Vibration monitoring has several advantages compared to other monitoring and analysis methods. As it
reacts immediately to any change, it can be used for both online (permanent) and offline (intermittent)
monitoring, as opposite to oil analysis which may take several days from sampling to the analysis is
completed. Some online oil analysis systems do exist, however. The method of vibration monitoring is
also more likely to pinpoint the faulty components. For example, while many bearings are made of the
same metal with the same chemical composition, only the defective one will experience increased vibra-
tion (Braun et al., 1986). According to Braun et al. (1986), the most important advantage of vibration
monitoring, however, is the possibility of applying multiple signal processing techniques to the vibration
15

Chapter 2. Literature
signals. Hence, even weak indications of faults, or developing faults, can be extracted from the signals.
Several companies have successfully used vibration analysis on rotating equipment to uncover devel-
oping machine problems, thus saving substantial amounts of money. In their paper, through different
case studies, Orhan et al. (2006) investigated how vibration monitoring can be used to diagnose ball and
cylindrical roller element bearing defects. In one of the case studies, a large centrifugal pump was moni-
tored. Vibration monitoring revealed the development of ball bearing looseness, thus preventing possible
damage and production loss. Renwick and Babson (1985) also describe several successful applications
of vibration monitoring. One of the case studies involved ”the detection of a bearing fault in a large [...]
gear reducer” in a mill. Vibration data was collected and analyzed bimonthly. The analysis suggested a
bearing failure, which was confirmed upon disassembly of the reducer case, once again proving vibration
monitoring to be both timely and cost-effective. Here, the cost of downtime for the mill was $2000/h,
while a replacement would have cost $200 000 with a 14-month delivery time (Renwick and Babson,
1985). Another early application of vibration monitoring can be seen in (Brown, 1985). Through weekly
checks conducted with a hand-held vibration meter, complemented by monthly machine-condition anal-
ysis, numerous faults were detected in rotating machinery at a nuclear power station.
2.2.1.1 Online vs Offline Monitoring
Critical machines are often continuously monitored so that they quickly can be shut down in case of
the detection of a potentially disastrous failure. Even though this most likely will disrupt operation and
production, the consequences of a disastrous failure are likely to result in damages causing even longer
and more expensive shutdowns (Randall, 2011). In his book, Randall (2011) presents some of the most
important advantages and disadvantages of online and offline condition monitoring. The advantages are:
• Sudden changes are quickly noticed, thus offering the most significant potential for maximising
up-time and protecting essential and costly equipment. However, ever-decreasing sensor costs
might also justify surveillance of non-critical assets.
• It is the best protection for sudden, unpredictable failures.
• Frees up working hours that can be used on, e.g. other maintenance tasks or to improve the quality
of equipment.
The disadvantages of online condition monitoring, however, are:
• The cost of purchasing, installing and configuring online monitoring equipment is very high com-
pared to offline monitoring. Therefore, it has historically been applied to critical equipment. How-
ever, ever-decreasing sensor costs might also justify surveillance of non-critical assets. Based on
their own experiences, Klaveness say that the cost of online monitoring is between three to six
times the price of offline monitoring. This does, however, depend on the number of components to
be monitored, the number of ships, as well as any discounts one might manage to negotiate from
the supplier.
16

2.2 Condition-Based Maintenance
• The reaction must be quick to shut down the equipment in time. Thus, online monitoring is nor-
mally based on simple parameters, e.g. overall RMS or peak vibration level. Such simple param-
eters do not give notice of impending failures long beforehand. This notice could be just a few
hours or days, as compared to more advanced diagnostic techniques, which could give warnings
weeks, or even months, in advance.
Even though online monitoring is used, it is still possible to analyse the vibration signals more thor-
oughly; however, not continuously. Hence, intermittent and online monitoring can be carried out in
parallel. This also allows for intermittent monitoring to be carried out even more frequently, typically on
a daily or weekly basis instead of once per month, or even more seldom.
For the vast majority of equipment and machines, especially those with redundancy, it might be chal-
lenging to justify the installation of online monitoring systems from a financial point of view. However,
Randall state that ”the major economic benefit from condition monitoring is the potential to predict incip-
ient failure weeks or months in advance, to be able to plan maintenance to give the minimum disruption
of production, acquire replacement parts, and so on”. Hence, it might not necessarily be that important
to do online monitoring. The intervals must, however, be shorter than the time required for maintenance
and production planning. The advantages of offline, or intermittent, condition monitoring are:
• Substantially lower cost of monitoring equipment. Requires smaller initial expenditures (Barszcz,
2019).
• The potential to obtain warning of impending failures long before they occur through detailed
signal analysis.
The disadvantages of offline condition monitoring are:
• Sudden failures causing rapid breakdowns may be missed. For equipment where unpredictable
failures are likely to happen, this technique is inappropriate.
• It is not necessarily easy to decide how often measurements should be taken. One has to weigh the
benefits of increased lead time to failure, the time between when a fault condition is detected and
has failed, against the cost of monitoring more frequently.
• Require more labour cost in the long run, as it is manual work (Barszcz, 2019). The offline system
has to be transported, measurements need to be conducted, and data has to be transferred and
analyzed (Barszcz, 2019).
To sum up, online monitoring has typically been used to shut down equipment and machines if sudden
changes that might lead to catastrophic failures are detected. Therefore, it has usually been used on
critical and expensive assets. It is, however, based on monitoring ”simple parameters that react quickly
to change”, which does not give alerts long in advance. Offline, intermittent, monitoring is used on a
more significant number of machines compared to online monitoring. Here, data is gathered manually
and then analyzed with advanced diagnostic techniques. It is widely used on assets where financial loss,
17
Chapter 2. Literature
caused by downtime and production loss, is ”the prime economic factor rather than the cost of machines
themselves”.
It should be emphasized that sensor technology, diagnostic techniques and other areas within condition
monitoring are improving every day. Sensors are becoming smaller, cheaper and better, and signal analy-
sis are revealing impending failures earlier and more accurate than before, mainly thanks to developments
in areas such as machine learning and big data. The main differences between online and offline con-
dition monitoring are still the same as earlier, but the most considerable advantages and disadvantages
between the two have possibly diminished over the years.
2.3 Centrifugal Purifiers in Fuel Oil Treatment Systems
This section provides an introduction to fuel oil systems, the basic principles and working of centrifugal
separators on ships, as well as a more detailed description of the HFO separator (operated as a purifier)
under review in this thesis; the Alfa Laval P 615 High-Speed Separator. This description includes both
design and function.
2.3.1 Fuel Oil Treatment Systems
Heavy fuel oil is a by-product of crude oil refining. It is widely available and inexpensive compared
to other fuel alternatives. However, it may contain different undesirable liquid and solid contaminants,
such as water, dust, rust, sand and solid particles known as catalytic fines. If such contaminants are not
removed before it enters the engine, it leads to a decrease in fuel oil efficiency, corrosion of internal parts
and abrasive damage to engine cylinders during the combustion process. A typical fuel oil treatment
system consists of the following stages (Babicz, 2008):
1. Settling tank. Fuel is received and delivered to settling tanks via fuel oil transfer pumps. These
tanks are used for pre-treatment of fuel oil using gravity. The denser water and solids settle on
the bottom where it can be drained off. A fuel oil treatment system often consists of two settling
tanks. The fuel is heated to 50-60°C to speed up the process.
2. Heater. The fuel is drawn out by a purifier inlet pump and delivered to a thermostatically controlled
heater. The temperature is raised to about 80°C before being transferred to a centrifugal purifier.
3. Centrifugal separator. Cleans the fuel oil by utilizing centrifugal force. In a purifier, the fuel oil is
cleaned from water and solid particles, with water being discharged continuously from a separate
outlet. In a clarifier, the fuel oil, which now contains little to no water, is being cleaned for finer
and lighter particles that were not removed by the purifier. The separator can be operated either
as a purifier or as a clarifier. Classification rules require that the fuel oil treatment system should
comprise at least two separators, i.e. it has to be redundant (MARINTEK, 2016).
4. Service tank. When the fuel oil has gone through purification and clarification, it is pumped to a
service tank, ready to be used by the engine.
18

2.3 Centrifugal Purifiers in Fuel Oil Treatment Systems
Figure 2.6: Flowchart of a generic fuel oil treatment system. Adapted from (Alfa Laval, 2018b).
Figure 2.7: Cross section view of a centrifugal separator with gravity discs. From (Alfa Laval, 2018b).
An illustration of a generic fuel oil treatment system is depicted in Figure 2.6. A piping and instrumenta-
tion diagram (P&ID) of the fuel oil treatment system onboard one of the CABU (Caustic Soda and Bulk
Carrier) combination carriers in the Klaveness fleet can be found in Appendix A.
2.3.2 Basic Principles of Separation
The purpose of separation is to remove solid particles in a liquid or separate liquids with different den-
sities while simultaneously removing any solid particles present. This separation can be achieved either
by gravity, e.g. in settling tanks, or by centrifugal separation. The latter is described here.
2.3.2.1 Centrifugal Separation
Since centrifugal force can be thousands of times greater than gravity, centrifugal separation is far more
effective than separation by gravity alone. Thus, what may take several hours by gravity in a tank may
be achieved within a few seconds by the centrifugal force in a separator bowl, a rapidly rotating bowl.
Figure 2.7 depicts the cross section of a centrifugal separator. The efficiency of a centrifugal separator is
affected by the fuel oil viscosity, temperature and throughput.
2.3.3 Design and Function
In this section, the Alfa Laval P 615 High-Speed Separator is described in more detail, based on its
manual (Alfa Laval, 2018a). This separator is the one installed on Klaveness’ CLEANBU ships, and not
19

Chapter 2. Literature
Figure 2.8: 3D model of the Alfa Laval P 615 separator. From (Alfa Laval, 2018a).
on the CABU combination carriers which were involved in the pilot project. However, this does not have
any effect on the obtained results and their validity.
2.3.3.1 Application
The separator, Figure 2.8, is a high-speed centrifugal separator designed for cleaning mineral oils from
water and solid particles (sludge). The cleaned oil is discharged continuously, while the sludge is dis-
charged at intervals, ranging from 2 to 60 minutes. It is capable of handling HFO with viscosity 30-600
cSt/50°C. It can be operated as either a purifier or a clarifier. When operated as a purifier, the separated
water is discharged continuously. When operated as a clarifier, i.e. there are only small amounts of water
present in the fuel oil, the water is discharged together with the sludge.
2.3.3.2 Design
The separator comprises a frame consisting of three parts: the frame lower part, the intermediate part and
the top part with a frame hood. The rotating separator bowl (C) is driven by an electric motor (A) via a
flat-belt power transmission (D) and bowl spindle (B). See Figure 2.9. To prevent overload, the motor
drive is equipped with a friction coupling.
The bowl is of the manual type, i.e. with gravity discs, and hydraulically operated at sludge discharges.
The hollow bowl spindle features an impeller that pumps closing water from an integrated tank (E) to the
operating system for sludge discharge.
In Figure 2.9, all main inlets and outlets, with corresponding connection numbers, are shown. These are
given in chapter 7, Technical Reference, in (Alfa Laval, 2018a). The basic size drawing of the separator
can also be found here.
20

2.3 Centrifugal Purifiers in Fuel Oil Treatment Systems
Figure 2.9: Cross section view of the P 615 separator. From (Alfa Laval, 2018a).
2.3.3.3 Outline of Function
The actual separation of the fuel oil takes place in the rotating bowl. The oil enters the bowl through the
inlet (201). The clean oil is discharged from the separator through the outlet (220) via a paring chamber.
Impurities heavier than the fuel oil accumulate in the sludge space at the bowl periphery. The sludge is
removed automatically at fixed intervals.
2.3.3.4 Separating Function
Liquid flow As mentioned above, the untreated fuel oil enters the separator bowl through the inlet pipe
(201). The oil is led towards the periphery of the bowl by the distributor (T), see Figure 2.10. When it
reaches the slots of the distributor, it will rise through channels formed by the stack of discs (G) and be
distributed uniformly into the disc stack.
The oil is continuously separated as it flows towards the centre of the bowl. From here, it rises upwards
into the paring chamber, before being pumped by the paring disc (F), and finally leaving the bowl through
the outlet (220).
Because of differences in density, sludge and water move towards the periphery of the bowl. During
purification, separated water rises along the outside of the disc stack, moves from the top disc (I) channels
and over the gravity disc (K), before being discharged through the common sludge and water outlet (221).
Heavier impurities accumulate in the sludge space at bowl periphery, where it is discharged through the
sludge ports (L) at fixed intervals.
Water seal in purification A water seal must be provided in the bowl to ensure that oil does not flow
out to the separated water outlet. This seal is achieved by filling the bowl with water through the water
inlet (206) before the oil feed supplying the unseparated fuel oil is turned on. When the oil feed is turned
on, the oil forces the water towards the periphery of the bowl, creating an interface (X) between the water
and the oil, see Figure 2.11. The position of this interface depends on the size of the gravity disc (K).
21

Chapter 2. Literature
Figure 2.10: Cross section view of the P 615 separator showing the liquid flow. From (Alfa Laval,
2018a).
22
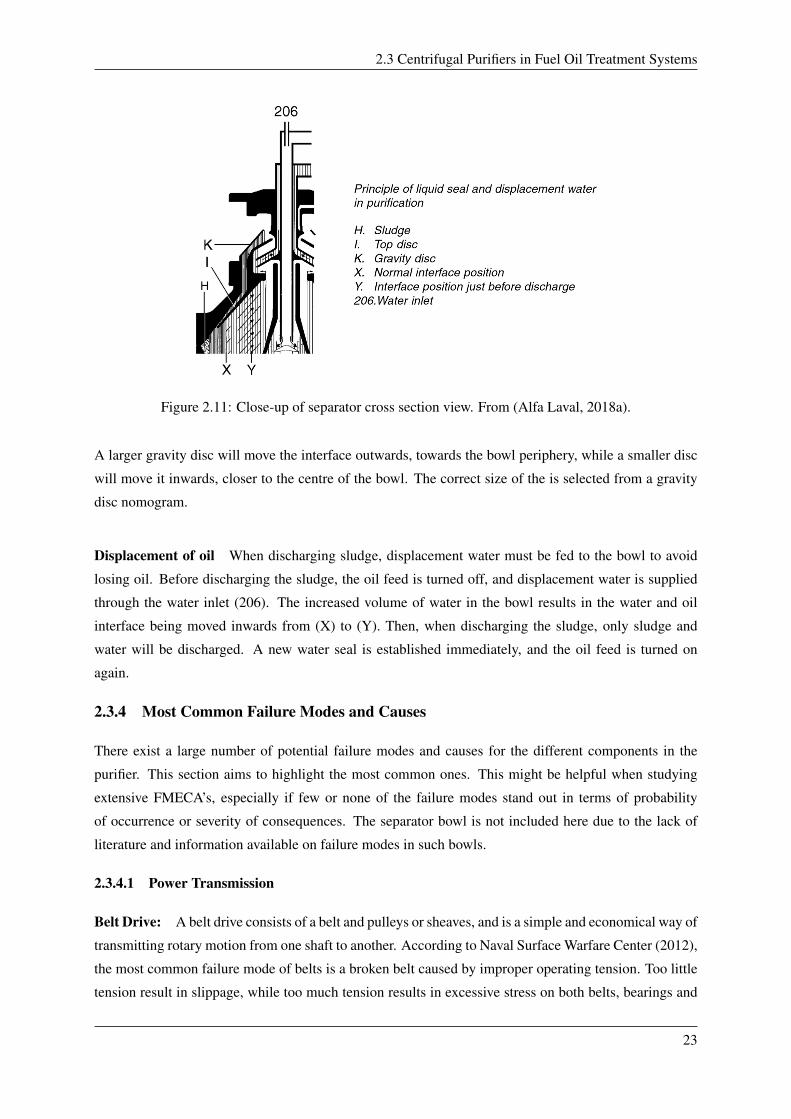
2.3 Centrifugal Purifiers in Fuel Oil Treatment Systems
Figure 2.11: Close-up of separator cross section view. From (Alfa Laval, 2018a).
A larger gravity disc will move the interface outwards, towards the bowl periphery, while a smaller disc
will move it inwards, closer to the centre of the bowl. The correct size of the is selected from a gravity
disc nomogram.
Displacement of oil When discharging sludge, displacement water must be fed to the bowl to avoid
losing oil. Before discharging the sludge, the oil feed is turned off, and displacement water is supplied
through the water inlet (206). The increased volume of water in the bowl results in the water and oil
interface being moved inwards from (X) to (Y). Then, when discharging the sludge, only sludge and
water will be discharged. A new water seal is established immediately, and the oil feed is turned on
again.
2.3.4 Most Common Failure Modes and Causes
There exist a large number of potential failure modes and causes for the different components in the
purifier. This section aims to highlight the most common ones. This might be helpful when studying
extensive FMECA’s, especially if few or none of the failure modes stand out in terms of probability
of occurrence or severity of consequences. The separator bowl is not included here due to the lack of
literature and information available on failure modes in such bowls.
2.3.4.1 Power Transmission
Belt Drive: A belt drive consists of a belt and pulleys or sheaves, and is a simple and economical way of
transmitting rotary motion from one shaft to another. According to Naval Surface Warfare Center (2012),
the most common failure mode of belts is a broken belt caused by improper operating tension. Too little
tension result in slippage, while too much tension results in excessive stress on both belts, bearings and
23

Chapter 2. Literature
shafts (Naval Surface Warfare Center, 2012). As stated by Gates Corporation (2014), improper drive
maintenance, followed by improper belt or pulley installation, are the most common sources of problems
with belt drives. See Figure 2.12 for a more detailed description of the most common belt drive failure
causes.
Friction coupling: Couplings are used to transmit power, i.e. torque, from one shaft to another. Fric-
tion couplings are used to, for instance, protect motors against overloads. Proper maintenance and equip-
ment handling is perhaps the most crucial factor affecting coupling lifetime. Failure rate data from
Versicherungs-AG (1978), show that operational faults, i.e. mishandling, maintenance and repair faults,
account for 63% of the number of damage cases of mechanical couplings. Also, 75% of all gear-coupling
failures are caused by improper or insufficient lubrication (Bloch and Geitner, 1997).
Spindle: A spindle is a short shaft. See Section 2.3.4.5.
2.3.4.2 Electrical Motor
An electrical motor comprises several parts, such as bearings and shafts (see Section 2.3.4.5), windings,
brushes and gears. The reliability of a motor, therefore, depends on the reliability of each part. According
to Naval Surface Warfare Center (2012), the reliability of electrical motors is ”usually associated with
bearing life and the life of the windings before they require rewinding”. The most common bearing
failure modes and causes are described further in Section 2.3.4.5.
There are several studies on the distribution of failures in electrical motors. Thorsen and Dalva (1994)
presents a survey of faults on induction motors (1637 failures) in the offshore oil industry, petrochemical
industry, gas terminals and oil refineries. This survey is also known as the 1995 IEEE survey. The
result shows that bearing faults account for more than half, 51%, of the failures, see Figure 2.14. These
could be due to, e.g. insufficient lubrication, wrong lubricant, shaft overload, misalignment, vibration, or
overheating. A similar failure distribution can be seen from the 1985 IEEE survey as well (O’Donnell,
1985; Bell et al., 1985; O’Donnell et al., 1987).
2.3.4.3 Inlet and Outlet
Fluid systems are connected using fluid conductors: pipes, tubing and hoses. The HFO purifier consists
of both rigid inlet and outlet pipes and flexible hoses. Their most common failure modes and causes are
described below. It should, however, be noted that there are many factors to consider when assessing
the reliability of fluid connector systems, such as the operating environment and usage and maintenance
variables, amongst others (Naval Surface Warfare Center, 2012).
Pipes: As with most fluid conductor systems, failures usually occur at or within interconnection points,
e.g. fittings and flanges. These are ”sensitive to installation and maintenance procedures and the inclusion
24

2.3 Centrifugal Purifiers in Fuel Oil Treatment Systems
Figure 2.12: Sources of drive problems. From (Gates Corporation, 2014).
25
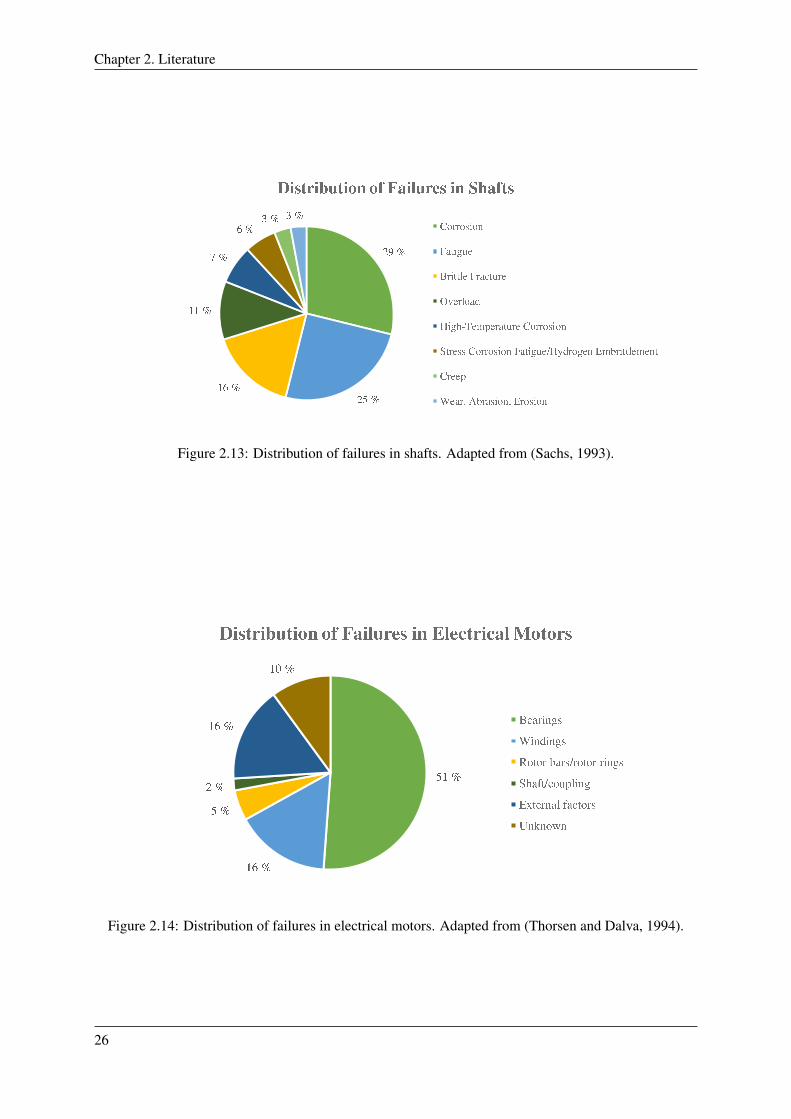
Chapter 2. Literature
Figure 2.13: Distribution of failures in shafts. Adapted from (Sachs, 1993).
Figure 2.14: Distribution of failures in electrical motors. Adapted from (Thorsen and Dalva, 1994).
26

2.3 Centrifugal Purifiers in Fuel Oil Treatment Systems
of seals” (Naval Surface Warfare Center, 2012). Connectors can be damaged due to, e.g. corrosion,
improper torque on fitting (damaging the pipe threads), and failure of gaskets or seals.
Hoses: There are several reasons to why flexible hoses may fail. Naval Surface Warfare Center (2012)
list the following as the most common causes of failure: violation of the minimum bend radius, operat-
ing the fluid system above maximum temperature, exposure to temperature extremes and frequent and
extreme pressure fluctuations, thus accelerating the ageing and fatigue of the hose. Excessive bending
and twisting of the hose will also drastically reduce its service life.
Solenoid valves: Dutch valve specialist Tameson state, based on their own experience, that the top
failure modes of solenoid valves are: leaks caused by dirt particles, valve not shutting off or leaking due
to damaged seals, or valve not opening and/or closing correctly as a result of inadequate power supply,
wrong flow direction, too high pressure or burnt out coil. The most prominent cause, however, is tiny
particles of cuttings, rust or sand, accounting for approximately 80% of the failures (Tameson, 2019).
2.3.4.4 Sensors and Controllers
Sensor and controller failures will often result in a process failure, which might have fatal consequences.
Lukat (2015), divide sensor failures into four categories: (1) Manufacturing defects caused by faulty
materials or poor workmanship; (2) Defects caused by premature failure in the field and covered by
the manufacturer’s warranty; (3) Random failures that just happen over time; (4) Field failures caused
by ageing and “wear and tear”. The most common, however, are failures due to wear and tear. These
include mechanical damage, electric overload as a result of misconnection during inspection or repair
work, and corrosion from ingress of moisture into the sensor. These failures also apply to controllers.
2.3.4.5 General
Bearings: Since there are several different types of bearings in us for a wide range of applications, it is
challenging to establish base failure rates for a distinct bearing design. This problem is further enhanced
by the many different bearing sizes, material properties, complexity and load capacity, amongst others
(Naval Surface Warfare Center, 2012).
In Bloch and Budris (2014), it is stated that ”most bearings fail at an early age because of static overload,
wear, corrosion, lubricant failure, contamination, or overheating.” A study by SKF USA showed that
lubrication-related failures (inadequate and contaminated lubrication) account for 54% of all bearing
failures, see Figure 2.15. Bloch and Budris (2014) refer to another study from an oil refinery showing
similar results, see Figure 2.16.
An older study from Versicherungs-AG (1978) investigated the causes of 1400 rolling-bearing and 530
plain-bearing failures. The results can be seen in Table 2.1. Here, it is suggested that between approxi-
mately 30-40% of the failures are caused by wear- or lubrication related processes.
27

Chapter 2. Literature
Figure 2.15: Distribution of failures in bearings. Adapted from (Bloch and Budris, 2014).
Figure 2.16: Distribution of failures in bearings in an oil refinery. Adapted from (Bloch and Budris,
2014).
28

2.3 Centrifugal Purifiers in Fuel Oil Treatment Systems
Table 2.1: Failure causes of rolling and plain bearings. Adapted from (Versicherungs-AG, 1978).
Failure cause Rolling bearings Plain bearings
Vendor problems 30.1% 23.4%
Workmanship 14.4% 10.7%
Errors in design/application 13.8% 9.1%
Wrong material of construction 1.9% 3.6%
User-induced problems 65.9% 69.6%
Operational errors, maintenance deficiencies, 37.4% 39.1%
failure of monitoring equipment
Wear 28.5% 30.5%
External problems 4.0% 7.0%
Contaminated lubricants; intermittent 4.0% 7.0%
of oil supply system
Shafts: A shaft is used to transmit power or motion, in this case from the belt drive to the separator
bowl. Shafts are generally designed for an infinite life, thus having a relatively low failure rate, and the
effect of shaft damage on other components is often more serious (Naval Surface Warfare Center, 2012).
Nevertheless, according to Raut and Raut (2014), fatigue is one of the most common causes of shaft
failure. This statement is in agreement with one industry study on the cause of shaft failures in rotating
machinery (Brooks and Choudhury, 1993), suggesting that 25% of failures are caused by fatigue. See
Figure 2.13 for a summary of the findings. Another study for motor applications suggest that fatigue
could account for more than 90% of shaft failures (Sachs, 1993). These failures do, however, include the
effects of corrosion and other shaft stresses such as mechanical loads, repair processes and temperature.
(Bonnett, 2000).
Seals and gaskets: A wide range of seals exist. They do, however, share some common types of failure
modes, the primary one being leakage. All seals can fail as a result of different environmental influences,
often a combination, such as ”temperature, pressure, fluid incompatibilities, time and human factors”
(Ashby, 2005). According to Ashby (2005), another important reason for failure is that seals often are
damaged during installation and maintenance.
Furthermore, Ashby state that the perhaps most well-known seal failure mode amongst elastomers is
compression set, i.e. permanent deformation after prolonged stresses. The next most common type of
failure is nibbling and extrusion. Another common failure mode, usually associated with O-rings, is a
spiral failure. Here, the seal is sliding and rolling at the same time. This twisting causes the seal to
develop cuts in a spiral pattern on its surface. Finally, normal wear is a common seal failure (Ashby,
2005).
29

Chapter 2. Literature
2.3.5 Previous Studies and Analyses
To the knowledge of the author, there exist a limited amount of risk and incident analyses that focus
on HFO purifiers. Some analyses that include fuel purifiers do, however, exist. Most of these are ap-
plications of the Reliability Centered Maintenance (RCM) methodology developed by Moubray, which
includes Failure Modes and Effect Analysis (FMEA). The latter often include an assessment of the con-
sequences as well, then abbreviated FMECA.
Wabakken (2015) assessed whether RCM was an applicable method to develop maintenance programs
for different systems. The thesis applied the method on an engine and the auxiliary systems onboard a
vessel within Wilhelmsen Ship Management’s (WSM) fleet. From the FMECA analysis, purifier failure
may be a result of a blockage, wear and tear, or assembly error. These failure modes were given fail-
ure rates (i.e. mean time between failure) of 10 years, five months and 1.5 years, respectively. These
rates were expert opinions provided by WSM. Wabakken pointed to the potentially high cost and time-
consumption caused by a failure of the purifiers as the reason for the high risk index values.
Jacobsen (2016) has also applied RCM principles in the analysis of fuel systems. The thesis aimed
at establishing a procedure that can help identify barriers in the design of unmanned engine rooms for
oceangoing merchant vessels. The procedure was based on the RCM methodology and applied in a
case study to identify barriers in a fuel oil system using HFO. In the FMECA conducted, ”separator
failure” was the only failure mode included for the purifiers. The consequences and likelihoods of failure
were divided into three levels, with values from one to three, with a risk index for each combination.
This division was based on a risk matrix used by shipping company Solvang ASA. The separator was
considered to have moderate risk, i.e. it may be acceptable. For comparison, four components had
unacceptable risk, and equally many had an acceptable risk.
A fuel oil purification system has also been used by Mokashi et al. (2002) to demonstrate the use of
RCM in the maritime industry. However, the analysis does not include all failure modes for the functional
failures investigated. Additionally, only the most severe consequences are considered. The failure modes
shown were ”speed to slow” and ”low fuel oil temperature”, resulting in failure to remove impurities in
the fuel oil and loss of liquid seal in the purifier, respectively. Based on its consequences, frequency,
probability of consequences, and detection rating, the risk index of failure mode ”speed to slow” was
considered unacceptable. Implementing the proposed action, consisting of an inspection of the friction
pads to be undertaken every 3000 h, reduced the risk index to an acceptable level. The failure mode ”low
fuel oil temperature” was denoted acceptable.
In their paper, Hadi et al. (2018) assessed the risk of the fuel oil system of a fishing vessel. Also
here an FMEA was conducted. The only purifier failure mode included was blockage of the separa-
tor. Amongst the analysed items in the fuel system, this failure mode had the second highest risk index.
As in (Wabakken, 2015), Hadi et al. denote the high risk index to the high cost and time-consumption
that follows such failures.
30

2.4 Failure Modes, Effect and Criticality Analysis
Faturachman et al. (2014) has also assessed the risk associated with fuel oil systems onboard ships by
applying the FMEA methodology. The only purifier failure mode looked into here was ”bad cleaning”,
resulting in reduced combustion efficiency in the main engine. The severity class of the failure mode
was denoted as ”critical”. In the FMEA, four failure modes were labelled ”critical”, while equally many
were labelled ”catastrophic”. Only one failure mode was described as ”marginal”. Alas, it is difficult to
draw any conclusions about the actual criticality of the purifier from this analysis.
Another application of FMEA on a marine engine fuel system is the one by Cicek et al. (2010). Also
here, the analysis is quite limited, only considering two purifier failure modes: abnormal sound caused
by defective bearings, and inadequate flow range as a result of inadequate pumping pressure or high
viscous oil. Compared to the other components analysed, these failure modes obtained risk indexes in
the lower range.
2.4 Failure Modes, Effect and Criticality Analysis
The purpose of this section is to describe the method used to analyse the HFO purifiers; FMECA. The
objectives, issues addressed, and the methodology itself is described. Additionally, several incident
reports regarding HFO purifiers across the Klaveness fleet, from 2015-2019, are analysed. However, this
analysis does not follow any specific methodology. The procedure for analysing the incident reports is
described in Chapter 4.
FMECA is a systematic technique for failure analysis, originally developed by the U.S. Military in the
1940s, which published the first guideline on the topic, Military Standard MIL-P-1629 ”Procedures for
Performing a Failure Mode, Effects and Criticality Analysis”, on November 9, 1949 (Military, 1949).
The function of an FMECA is, according to the IEEE Std. 352-2016, to ”consider each major part of the
structures, systems, and components (SSC), how it may fail (the mode of failure), and what the effect
of the failure on the SSC would be (the failure effect)” (IEEE, 2016). In short, the main objective of an
FMECA is to highlight failure modes with relatively high probabilities and severity of consequences, thus
allowing corrective actions to be directed where it will produce the highest value. As a result, an FMECA
is a set of both critical and non-critical component failures. The analysis is typically organised by creating
a worksheet like the one shown in Figure 2.17, which is an excerpt from the analysis conducted in this
thesis. Another example of such a worksheet can be found in (Rausand and Høyland, 2004).
2.4.1 Objectives
According to IEEE Std. 352-2016 (IEEE, 2016), the objectives, or purposes, of an FMECA are to:
1. To assist in selecting design alternatives with high reliability and high safety potential during early
design phases.
2. To ensure that all conceivable failure modes and their effects on the operational success of the
system have been considered.
31

Chapter 2. Literature
Com
ponent
Funct
ion
Sub-c
om
ponent
Failure
mode
Failure
cau
se o
r
mech
anism
Dete
ctio
n o
f fa
ilure
Loca
l effect
Next
leve
l effect
Glo
bal
effect
Hid
den/e
vident
Pro
bab
ility of
occ
urrence
Safe
tyEn
viro
nm
ent
Dow
ntim
eCost
Leak
age
Poor se
alin
g
bet
wee
n b
ow
l hood
seal
rin
g an
d the
edge
of th
e slid
ing
bow
l bott
om
Visual
insp
ection,
inte
rnal
insp
ection,
per
form
ance
monitoring
Syst
em le
akag
e, f
ire
and e
xplo
sion
haz
ard
The
HFO
purifier
is
inoper
ativ
e, n
o
stan
d-b
y in
cas
e of
emer
gency
. Lea
kage
mig
ht in
wors
t ca
se
resu
lt in
fire
and
explo
sion.
Fire
/exp
losions m
ay
spre
ad a
nd le
ad to
furt
her
maj
or
inju
ries
or fa
talit
ies,
evac
uat
ion m
ight be
nec
essa
ry. L
ong
dow
ntim
e an
d
maj
or/
extr
aord
inar
y
cost
s as
a res
ult o
f
the
nee
d for m
ajor
ove
rhau
l, m
ajor
com
ponen
ts,
retr
ofit or re
buill
d
can b
e ex
pec
ted.
Evid
ent
L (2
)M
(2,5
)M
(2,5
)M
(2,5
)M
(2,5
)
Clo
gged
bow
l,
blo
ckag
e
Bad
qual
ity
of
bunke
red H
FO
(conta
min
ated
)
Per
form
ance
monitoring,
inte
rnal
insp
ection, a
larm
funct
ion
HFO
purifier
not
work
ing
Evid
ent
Unbal
ance
d b
ow
lU
nev
en sed
imen
t
accu
mula
tion in
bow
l, in
suffic
ient
pre
ssure
in the
disc
stac
k
Vib
ration m
onitoring
Abnorm
al v
ibra
tion,
too h
igh str
ess on
bow
l and b
earing
(short
ened
life
)Ev
iden
t
M (3,4
)
Conse
quence
s
M (3,3
)
HFO
purifier
not
oper
atio
nal
, no
stan
d-b
y in
cas
e of
emer
gency
Effe
ct o
f fa
ilure
Desc
ription o
f fa
ilure
Separ
ator bow
lSe
par
ate
wat
er,
fore
ign m
atte
r an
d
sludge
fro
m H
FO b
y
centr
ifuga
l forc
e
Gen
eral
Two in
oper
ativ
e
HFO
purifier
s w
ill
even
tual
ly le
ad to
fuel
short
age
and
loss
of pro
pulsio
n.
L (3
)L
(3,1
)M
(3,4
)
Figure 2.17: Excerpt of the FMECA conducted in this thesis.
32

2.4 Failure Modes, Effect and Criticality Analysis
3. To list potential failures and identify the magnitude of their effects.
4. To develop early criteria for test planning and the design of test and checkout systems.
5. To provide a basis for quantitative reliability and availability analyses.
6. To provide historical documentation for future references to aid in the analysis of field failures and
consideration of design changes.
7. To provide input data for tradeoff studies.
8. To provide a basis for establishing corrective action priorities.
9. To assist in the objective evaluation of design requirements related to redundancy, failure detection
systems, fail-safe characteristics, and automatic and manual override.
An FMECA is mainly a qualitative analysis and is often the first step of a systems reliability study. It
is widely used in the early stages of product and system design and development to reveal design areas
that have to be improved to meet specified reliability requirements. However, an FMECA include a large
amount of information that is just as useful for maintenance planning and operation of the system under
review. Therefore, it may be useful to integrate the FMECA into the maintenance planning system and
update it as system failures and malfunctions are uncovered (Rausand and Høyland, 2004).
2.4.2 Issues Addressed
An FMECA is relatively straightforward to conduct, as it does not require any advanced analytical skills
of those performing the analysis. Unlike a complete reliability analysis, that requires comprehensive data
input that includes material properties, design details, and component failure rates, an FMECA can be
undertaken with limited design information. As the FMECA is not ”primarily concerned with the rate of
occurrence or frequency of failure”, it can still give a good indication of the reliability of the structure,
system or component under review. The premise, however, is that the analyst has sufficient knowledge
of the system and the environment in which it operates (IEEE, 2016; Rausand and Høyland, 2004). The
basic questions the be answered by an FMECA may, according to IEEE, include:
1. How can each part conceivably fail?
2. What mechanisms might produce these modes of failure?
3. What could the effects be if the failures did occur?
4. Is the failure in the safe or unsafe direction?
5. How is the failure detected?
6. What inherent provisions are provided in the design to compensate for the failure?
33

Chapter 2. Literature
2.4.3 Methodology
NEK, The Norwegian Electrotechnical Committee, distinguish between three phases when considering
the activities undertaken during an FMECA: planning, performing and documenting (NEK, 2018). An
overview of a generic FMECA methodology can be seen in the flowchart in Figure 2.18. It should be
noted that this specific flowchart is extensive and that the activities here can be tailored to the suit the
specific application.
2.4.3.1 Planning
Before conducting an FMECA, one has to go through several preparatory steps. This is done to ensure
that the analysis is performed as effectively and efficiently as possible. Also, this is necessary to obtain
a good result. The depth to which they are performed will depend on the complexity of the structure,
system or component (SSC) being reviewed, as well as the experience and knowledge the analyst has with
such, or similar, SSC (IEEE, 2016). Different standards, such as IEEE Std. 352-2016, IEC 60812:2018
and MIL-STD-1629A, as well as Rausand and Høyland (2004), all list several preparatory steps. They
are not very different from one another. In the planning stage of the analysis in this thesis, a combination
of the preparatory steps described by Rausand and Høyland (2004) and in IEEE (2016) was followed:
1. Definition of the system to be analyzed. Which components are within the boundaries of the
system (IEEE, 2016; Rausand and Høyland, 2004).
2. Definition of the main functions (missions) of the system and its operational modes (Rausand and
Høyland, 2004).
3. System breakdown into subsystems that can be handled effectively. Provide a list of components
for each subsystem (Rausand and Høyland, 2004)
4. Review of system functional diagrams and drawings to determine interrelationships between the
various subsystems, these could, for instance, be illustrated by block diagram.
5. Describe any operational and environmental conditions or stresses that may affect the system and
its operation (IEEE, 2016; Rausand and Høyland, 2004).
Additionally, to obtain a good and useful analysis, it is essential to have sufficient information about the
system. This information could, for instance, be system drawings, engineering manuals, equipment and
maintenance history, and failure data, amongst others. It is, however, difficult to obtain accurate failure
data. This difficulty has to do with both commercial sensitivity and the various operational profiles and
continuously changing working environments for different ships. Therefore, the failure data from one
ship might not be applicable for another. Furthermore, a single ship owner or company ”is not likely to
have enough sample size for the data to be reliable” (Mokashi et al., 2002). As a result, FMEA’s and
FMECA’s are often qualitative, or they only provide rough estimates for the failure rates to indicate the
most critical failure modes.
34
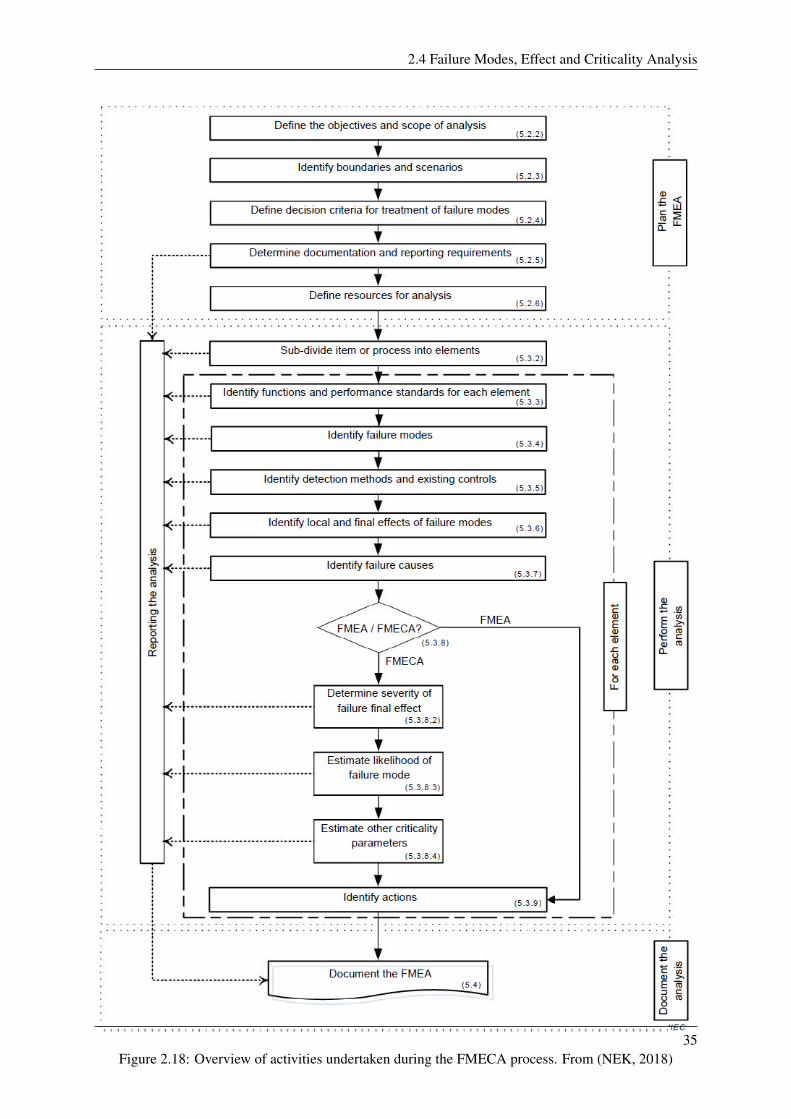
2.4 Failure Modes, Effect and Criticality Analysis
Figure 2.18: Overview of activities undertaken during the FMECA process. From (NEK, 2018)35

Chapter 2. Literature
2.4.3.2 Performing
The process of performing the actual FMECA can be seen in the flowchart in Figure 2.18, and does not
require any further explanation. Each of the columns given in the worksheet in Figure 2.17 are described
below (Rausand and Høyland, 2004).
Component (col. 1): The name of the component or equipment (hereafter referred to as item) being
reviewed. This could, for instance, be a reference to a drawing.
Function (col. 2): The function(s) of the item(s) is (are) described.
Failure mode (col. 4): A failure mode is a nonfulfillment of the functions described in column 2.
For every item’s function and operational mode, all failure modes are identified and registered. The
failure modes can be defined at different levels of detail. What is appropriate may vary from situation
to situation. JA1011 (1999) state that it is important that ”failure modes shall be identified at a level of
causation that makes it possible to identify an appropriate failure management policy”. Also, the list of
failure modes should include those that have happened before, those currently being prevented by the
maintenance program, and those who have not yet but are considered not unlikely to happen (JA1011,
1999).
Failure cause or mechanism (col. 5): Here, the possible failure causes, e.g. corrosion, fatigue, exces-
sive tension, or assembly error, that may lead to the failure modes mentioned above are recorded.
Detection of failure (col. 6): The different ways the failure modes can be detected are documented
here. This may be different alarms, testing, vibration monitoring and visual observations. One dis-
tinguishes between evident failures (instantly detected when they occur) and hidden failures (usually
detected only during testing).
Effect of failure (col. 7-8): Here, the effects ”if no specific task is done to anticipate, prevent, or detect
the failure” is described. Also here, the level of detail can vary. It can range from local effects on the
given component to global effects on the entire system, e.g. a ship or oil refinery.
Probability of occurrence (col. 9): The probability of occurrence can be given either qualitatively
or quantitatively. In the absence of adequate failure data, a qualitative probability assessment is done
instead. This is often based on tables describing the failure rate with words, e.g. ”very high”, ”high”,
”moderate”, ”low” and ”remote”. These occurrence categories are often further described in terms of
36

2.5 Incident Investigation
words and associated frequency. E.g. a ”remote” is ”unlikely to happen”, with a frequency of, e.g. 1 in
1 000 000.
Hidden or evident (col. 10): It is often useful to distinguish between hidden and evident failures.
Hidden failures are those that are revealed only upon demand or by functional testing. These failures are
often more critical than evident failures.
Consequences (col. 11): The consequences of each failure mode are usually divided into different
consequence categories. In (JA1011, 1999), it is stated that this categorization process shall clearly
distinguish between events with safety and environmental consequences and those with economic con-
sequences only. The severity of the consequences is often given on a qualitative scale, as with the
probability of occurrence (col. 9). Combined with the probability of occurrence, it forms a risk index,
indicating whether the risk is tolerable or not.
2.4.3.3 Documenting
An FMECA is a living document that can be used in all stages of product development, from concep-
tual design to data collection and maintenance planning. Therefore, it is of utmost importance that the
analysis is well documented, structured and easy to understand. Otherwise, the analysis is likely to be
discarded when it has served, what seems to be, its purpose - i.e. when the analysis is completed. An
FMECA is typically documented in some worksheet. The worksheet shown in Figure 2.17, an extract
from the analysis carried out as a part of this thesis, is one example of how an FMECA can be docu-
mented.
2.5 Incident Investigation
It is essential that incidents, including near misses and other non-conformities, are thoroughly investi-
gated and analysed. According to Sutton (2014), incident investigation combined with the appropriate
follow-up provides ”one of the most effective means of improving the safety and reliability of process
analysis”. An incident analysis differs from other risk management programs like hazards analysis and
management of change (MOC). While an incident analysis investigates failures that have already hap-
pened, the objective of a hazards analysis and MOC is to anticipate problems so that corrective measures
can be taken before a failure occurs. Sutton (2014) list several disadvantages with such methods:
1. The analyses are theoretical and speculative, and plausible failure mechanisms and events are
likely to be overlooked.
2. The actual risk level is hard to predict as the values for frequency of occurrence and consequences
usually are very approximate. Also, the consequence predictions are often influenced by the ana-
lyst’s own experiences.
37

Chapter 2. Literature
3. Most serious events often have multiple causes. These can be difficult to predict, and some might
seem implausible, even for experienced hazards analysis teams.
4. It is difficult to predict and quantify human error, a reason for many major incidents.
Incident investigation and analysis, on the other hand, will help identify weaknesses in a company’s
maintenance programme and system, thus providing insight to how the system can be improved to pre-
vent recurrence of similar incidents. Therefore, incident reports should be looked upon as a valuable
resource. By analysing incident reports, one can, amongst others, gain valuable insights into the root
causes of failures, improve machinery setup, minimise downtime in the future and improve maintenance
programs. Well documented incidents can also aid in solving future incidents that might occur. McHatton
(2017) lists four ways equipment breakdowns and incident investigations can be turned into opportunity:
1. ”Pinpoint the cause of failure to fix underlying problems.” Instead of addressing the root cause of
incidents, those performing maintenance will often perform a quick fix instead. A quick fix might
seem like a good solution in the short term; however, it may increase downtime in the long term.
Comprehensive incident reports will help maintenance personnel better understand why the failure
happened, and further help prevent the same from happening in the future.
2. ”Understand how the fault was fixed to equip yourself in future.” Detailed incident reports can
help to identify and solve similar problems more quickly in the future. For instance, if someone
discovers a fault that has happened before, they can look up the report and find out how the problem
can be fixed, potentially saving maintenance resources in terms of time and money.
3. ”Action ’Follow-up’ advice to prevent future equipment breakdown.” Follow-up advises, explain-
ing any risks or issues that cannot be fixed immediately, should be a part of the incident report.
Such advice can help fix recurring incidents once and for all.
4. ”Feed breakdown information back into improvement programs.” When a breakdown occurs, the
goal is to get back to normal as fast as possible. Once the system is up and running again, it is
essential that the failure is not forgotten. It is essential to ”find a way to holistically track” all
incidents and non-conformities such that advice for maintenance program improvement can be
given.
A proper report has to be written to maximise the potential of incident investigations. This is the final
step of the investigation, and Sutton (2014) state that ”the importance of writing a good report cannot be
overemphasised”. A more thorough description of incident investigation and root cause analysis can be
read in Chapter 11 of ”Process Risk and Reliability Management” (Sutton, 2014).
2.5.1 Incident Report Structure
There is no correct answer as to how an incident report should be structured and what it should contain.
However, an incident report should, generally, attempt to answer three questions according to Sutton
38

2.5 Incident Investigation
(2014):
1. What is/was the problem? I.e. what caused the failure and what were the consequences.
2. What is/was the solution? I.e. what was/has to be done to fix the failure.
3. What is the cost? I.e. what is/was the cost, considering time, money and people, of implementing
the actions given in question two
An example from the industry of how an incident report could be structured is given in Section 4.2.1. An
actual incident report can be seen in Appendix C.
39

Chapter 2. Literature
40

Chapter 3Condition Monitoring Pilot in Klaveness
In this chapter, the condition monitoring pilot initiated by Klaveness in 2018 is described in more detail.
First, the short and long term benefits of implementing condition monitoring are presented, followed by
Klaveness’ key takeaways from the pilot project. Then, an example of how vibration analysis success-
fully has discovered an impending failure in an HFO purifier is given. Before the fleet-wide installation
of CM equipment, Klaveness need to decide whether to opt for online or offline condition monitoring,
as in the pilot. Advantages and disadvantages are presented along with their initial recommendation.
Finally, incident history across the fleet is presented, followed by their proposal for which equipment to
be monitored.
3.1 Background and Ambitions
The vision of Torvald Klaveness is ”Improving the nature of shipping”, which underpins their commit-
ment to change and improve the shipping industry. Their ambitions are to become the leading digital
bulk operator, build a global energy effective combi service and provide the most useful and intuitive
digital services in shipping. Their vision and values are quantified in, amongst others, their operational
targets, as seen in Figure 3.1.
Historically, maintenance in the shipping industry has been either corrective or pre-planned. I.e. after
a breakdown or calendar-based, based on equipment running hours, or distance travelled, respectively.
This is still the case today. However, condition-based maintenance (CBM) and predictive maintenance
(PdM) is becoming increasingly more popular to increase asset reliability and decrease maintenance
costs. Unlike corrective and planned maintenance, CBM and PdM are based on the measurement of
different equipment parameters to decide if or when maintenance should be performed.
In 2018, Klaveness conducted a CBM pilot project on two of their combination carriers, MV Balboa
(built in 2016) and MV Ballard (built in 2017). Here, offline and manual vibration monitoring equip-
ment was installed on a considerable amount of equipment, mostly compressors, pumps and engines. The
41
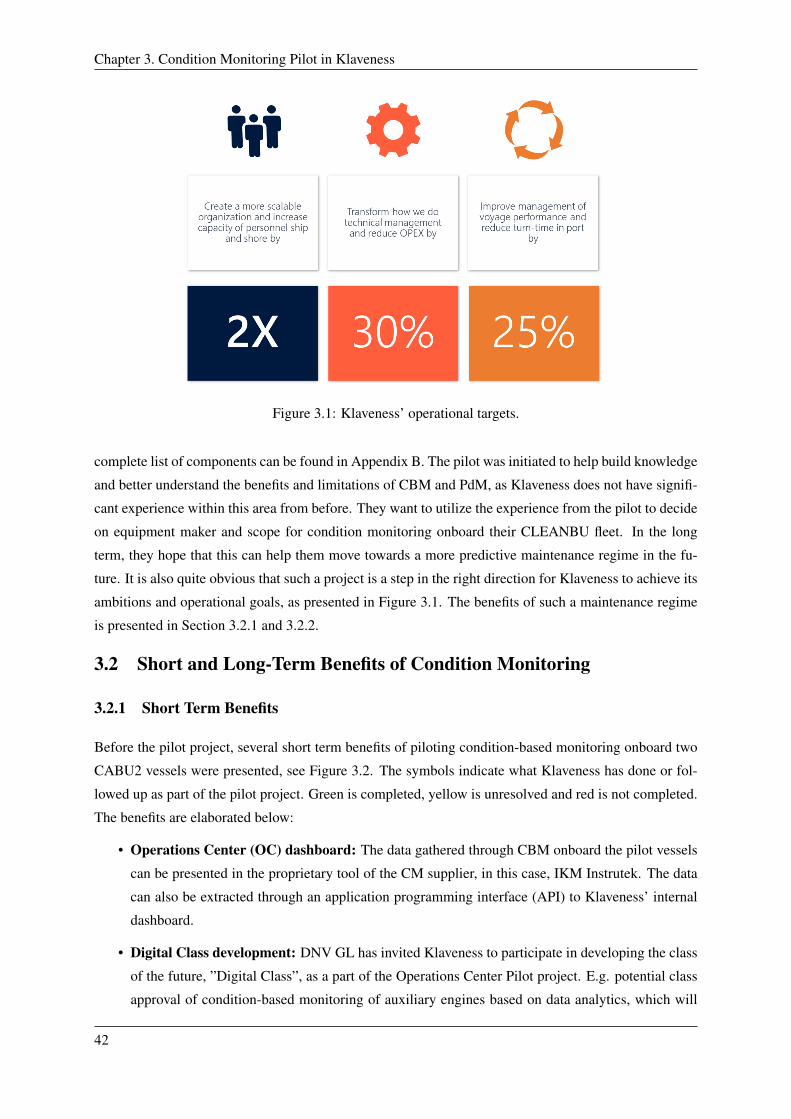
Chapter 3. Condition Monitoring Pilot in Klaveness
Figure 3.1: Klaveness’ operational targets.
complete list of components can be found in Appendix B. The pilot was initiated to help build knowledge
and better understand the benefits and limitations of CBM and PdM, as Klaveness does not have signifi-
cant experience within this area from before. They want to utilize the experience from the pilot to decide
on equipment maker and scope for condition monitoring onboard their CLEANBU fleet. In the long
term, they hope that this can help them move towards a more predictive maintenance regime in the fu-
ture. It is also quite obvious that such a project is a step in the right direction for Klaveness to achieve its
ambitions and operational goals, as presented in Figure 3.1. The benefits of such a maintenance regime
is presented in Section 3.2.1 and 3.2.2.
3.2 Short and Long-Term Benefits of Condition Monitoring
3.2.1 Short Term Benefits
Before the pilot project, several short term benefits of piloting condition-based monitoring onboard two
CABU2 vessels were presented, see Figure 3.2. The symbols indicate what Klaveness has done or fol-
lowed up as part of the pilot project. Green is completed, yellow is unresolved and red is not completed.
The benefits are elaborated below:
• Operations Center (OC) dashboard: The data gathered through CBM onboard the pilot vessels
can be presented in the proprietary tool of the CM supplier, in this case, IKM Instrutek. The data
can also be extracted through an application programming interface (API) to Klaveness’ internal
dashboard.
• Digital Class development: DNV GL has invited Klaveness to participate in developing the class
of the future, ”Digital Class”, as a part of the Operations Center Pilot project. E.g. potential class
approval of condition-based monitoring of auxiliary engines based on data analytics, which will
42

3.2 Short and Long-Term Benefits of Condition Monitoring
Figure 3.2: Short term benefits of piloting CBM on two CABU vessels.
not be possible without collecting data on the operation of the equipment onboard.
• Vibration monitoring: By conducting a condition-based monitoring pilot onboard a CABU,
sensors can be located at critical points to monitor vibrations and the effectiveness of vibration
dampers.
• Get supplier experience before CLEANBU delivery: The pilot is essential to get familiar with
the condition monitoring equipment and its quality, the analytics solution and supplier perfor-
mance. Thus, the rest of the fleet can be equipped with the best possible setup.
• Centralized maintenance function trials in OC pilot: One of Klaveness ambitions is to have
dedicated resources onshore that monitors maintenance performance and drive continuous im-
provement efforts. The data gathered in the pilot can, therefore, be the starting point of a central-
ized maintenance function.
• Organization increases knowledge regarding CBM: Klaveness has no significant experience
with CBM based on equipment monitoring and data analysis. Such a pilot would help build knowl-
edge and better understand the benefits and limitations of condition-based monitoring.
3.2.2 Long Term Benefits
More and more people are seeing the benefits of being more proactive when it comes to maintenance,
especially in the shipping industry. Ships usually employ a limited crew, making time and resource
management an essential part of a well functioning vessel. Klaveness list the following long term benefits
of implementing condition-based monitoring fleet-wide:
• Spare part stock reduction: By switching to a condition-based maintenance approach, spare
parts can be ordered ’just-in-time’ when measurements and prognostics suggest it, thus reducing
the number of spare parts and inventory cost. This is considered as ”one of the most important
indirect benefits of a predictive maintenance strategy” (Van Horenbeek et al., 2013).
• Enabler of data analytics and machine learning: Data analytics is an essential focus for Klave-
ness going forward, especially when considering their ambition to become the leading digital bulk
43

Chapter 3. Condition Monitoring Pilot in Klaveness
Figure 3.3: Long term benefits of condition-based monitoring fleet-wide in Klaveness.
operator and provide the most useful and intuitive digital services in shipping. Data availability
will also be critical to enable vessels to be enrolled to ”Digital Class”. The overall ambition is to
class vessels based on data, with as little physical presence as possible.
• Risk reduction and better control with less fault introduced: There is an inherent risk of in-
troducing new faults into the system and components being maintained (Nowlan and Heap, 1978;
Selvik and Aven, 2011). Condition monitoring will increase the quality of periodic condition con-
trol and, hopefully, help to uncover mistakes in maintenance at an early stage. This will likely
reduce the number of breakdowns and the general risk level onboard (Mobley, 2002; Shin and Jun,
2015).
• Enabling crew reduction through workload reduction: Unnecessary breakdowns and overhauls
can be eliminated by implementing a condition monitoring programme. Thus, valuable labour
hours can be freed and enable crew reduction (Sundberg and Ab, 2003). Klaveness considers
it difficult to reduce the workload and the number of crews without changing the maintenance
strategy to condition-based.
• Centralized maintenance Function: Another of Klaveness’ ambitions is to have dedicated re-
sources onshore that monitors maintenance performance, drive continuous improvement efforts
and shift the mindset from reactive to proactive. Condition monitoring equipment will be impor-
tant, if not essential, tool to improve the information and documentation that a centralized function
will utilize to make optimal maintenance decisions.
• TMSA rating improved: ”The Tanker Management and Self Assessment (TMSA) programme
provide companies with a means to improve and measure their safety management systems” (Oil
Companies International Marine Forum, 2019). The TMSA rating of Klaveness Ship Management
(KSM) will be an important parameter that customers will focus on going forward. Condition
Monitoring is required to achieve level 4 in the subject of Vessel Reliability and Maintenance.
44

3.3 Condition Monitoring Pilot on MV Balboa and MV Ballard
3.3 Condition Monitoring Pilot on MV Balboa and MV Ballard
3.3.1 Key Takeaways
The CM pilot project has provided Klaveness’ with valuable knowledge and experience before installing
condition monitoring equipment on eligible vessels throughout their fleet. Their key takeaways from the
pilot are presented below:
• Manual/offline monitoring of condition introduces new challenges. Each ship needs to be followed
up from ashore to ensure monitoring is being done as intended. Handover between the crew is
critical, and one must ensure that there are procedures in place for this. Also, proper monitoring
depends on the motivation and competence of selected personnel.
• Manual/offline monitoring somewhat contradicts the ambition of doubling the capacity of person-
nel onboard and onshore. Annual time spent doing measurements onboard is approximately 120
hours, and there is follow-up requirement on personnel ashore to ensure measurements are done
correctly.
• It is an entirely new experience for Klaveness to have an updated and objective overview of the
condition of a wide range of equipment onboard. Given that the stated condition is correct, which
needs to be verified going forward, this introduces a new level of control. Also, the ships need
clear instructions on what to report when overhauls are carried out on equipment that has been
identified as in various stages of breakdown. This is to compare CM analysis with the observed
condition of the equipment.
• Data transfer from ship to shore is a very manual process where the monitoring device needs to
be connected to the Master’s laptop to carry out the transfer. Vessels report that this procedure has
failed several times. This does, however, seem to be working satisfactorily after the monitoring
routes were divided into six.
• Condition monitoring has been implemented in the PMS of the two pilot vessels. This will then
enable them to remove the regular condition checks based on sound/visual. Going forward, it is
a recommendation to start increasing maintenance intervals of the monitored equipment – with a
target of reducing the number of maintenance labour hours.
• It is too early to claim that the pilot has demonstrated the ability to prevent breakdowns; however,
the main SW (sea water) pump on MV Balboa has shown early signs of failure and needs to be
monitored closely. Going forward, vessels should be required to carry out vibration measurements
following each overhaul to pick up any failures introduced as a result of poor maintenance.
45

Chapter 3. Condition Monitoring Pilot in Klaveness
Figure 3.4: Velocity spectrum, 12.06.2018, on the non drive end (NDE) of the Electric Motor of the
Purifier.
3.3.2 Vibration Analysis Example
During June 2018, IKM Instrutek ASA implemented an offline CM system on various rotating equip-
ment onboard MV Ballard. This implementation included the two HFO purifiers, both equipped with five
measuring points: two on the electric motor and three on the separator. The baseline report, which con-
tains the analysis from the baseline measurements acquired by the MV Ballard crew, indicated unbalance
in one of the purifiers. The velocity spectrum can be seen in Figure 3.4.
High overall velocity, 8.04 mm/s RMS (root-mean-square) at running speed, on the non-drive end (NDE)
of the electric motor, can be seen in Figure 3.4. The analysis from IKM shows an increased amplitude
at 1x running speed, marked ”f0” in the figure, at a frequency of approximately 60 Hz. Typically, this
indicates an unbalance in the unit. Another peak can also be seen at around 170 Hz. Based on the
analysis, the purifier was given status as a stage 1 defect: an early stage of a defect. According to IKM’s
severity chart, this represents ”an initial condition or change in condition that can develop to a defect over
time”. Usually, no action is needed, and the development of the defect is further monitored. However, in
this case, IKM recommended to check its foundation, tighten bolts, check for looseness over the whole
unit, and also clean the fan blades on the NDE of the electric motor as a first measure.
New vibration measurements were performed in December 2018, and the analysis showed decreased
overall velocity levels on the NDE of the electric motor. It was concluded that the levels had normalized.
See Figure 3.5 for a comparison between the two measurements.
46
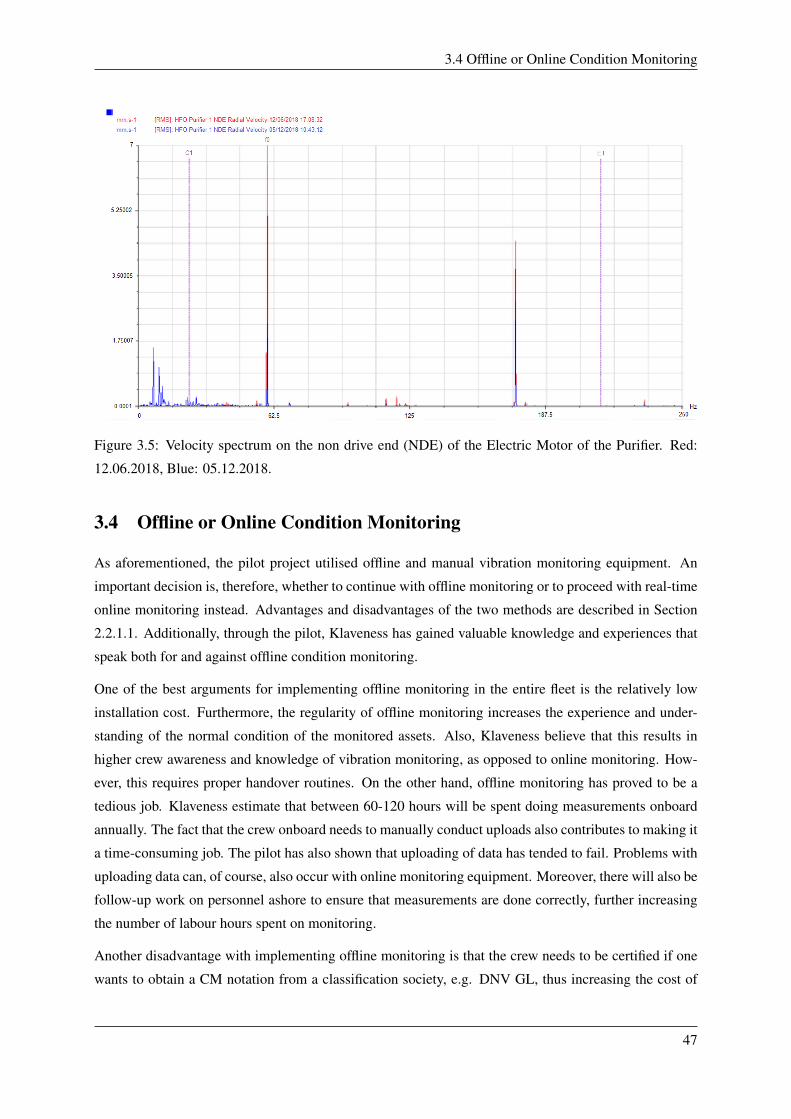
3.4 Offline or Online Condition Monitoring
Figure 3.5: Velocity spectrum on the non drive end (NDE) of the Electric Motor of the Purifier. Red:
12.06.2018, Blue: 05.12.2018.
3.4 Offline or Online Condition Monitoring
As aforementioned, the pilot project utilised offline and manual vibration monitoring equipment. An
important decision is, therefore, whether to continue with offline monitoring or to proceed with real-time
online monitoring instead. Advantages and disadvantages of the two methods are described in Section
2.2.1.1. Additionally, through the pilot, Klaveness has gained valuable knowledge and experiences that
speak both for and against offline condition monitoring.
One of the best arguments for implementing offline monitoring in the entire fleet is the relatively low
installation cost. Furthermore, the regularity of offline monitoring increases the experience and under-
standing of the normal condition of the monitored assets. Also, Klaveness believe that this results in
higher crew awareness and knowledge of vibration monitoring, as opposed to online monitoring. How-
ever, this requires proper handover routines. On the other hand, offline monitoring has proved to be a
tedious job. Klaveness estimate that between 60-120 hours will be spent doing measurements onboard
annually. The fact that the crew onboard needs to manually conduct uploads also contributes to making it
a time-consuming job. The pilot has also shown that uploading of data has tended to fail. Problems with
uploading data can, of course, also occur with online monitoring equipment. Moreover, there will also be
follow-up work on personnel ashore to ensure that measurements are done correctly, further increasing
the number of labour hours spent on monitoring.
Another disadvantage with implementing offline monitoring is that the crew needs to be certified if one
wants to obtain a CM notation from a classification society, e.g. DNV GL, thus increasing the cost of
47

Chapter 3. Condition Monitoring Pilot in Klaveness
implementation. Also, this certification has to be coordinated by the crewing department.
Real-time online monitoring, on the contrary, avoids many of the problems associated with offline mon-
itoring. Foremost, the workload on both crew and shore personnel are drastically reduced, thus freeing
up a substantial amount of work hours. This might also justify the higher installation costs compared
to offline monitoring. The continuous data flow from ship to shore should also eliminate the problems
experienced with manual uploading of data. Secondly, there is no certification requirement for the crew
if one wants to obtain a CM notation. Another essential point is that this is the most ”Future Opera-
tions” compatible solution, i.e. the solution that will take Klaveness the furthest concerning reaching
their ambitions to reduce OPEX with 30% and double the capacity of personnel onboard and onshore.
After conducting the pilot and assessing the advantages and disadvantages of the two methods, there is a
strong recommendation for online condition monitoring, pending cost considerations.
3.5 Klaveness’ Proposal for Equipment To Be Monitored
After the pilot period, a qualitative review of the equipment monitored was conducted to evaluate where
condition monitoring would add value when being installed on eligible vessels in the fleet. The selection
of equipment to be monitored or not can be seen in Table 3.1. The total number of monitored components
will be more than halved, from 56 to 27. The decision not to install monitoring equipment on much of
the machinery is based on a high-level analysis of incidents that partly support this decision. It is based
on the criticality of the system for the operation of the ship, whether it is redundant or not, how expensive
unexpected failures might be and if they could have been detected by vibration monitoring, or the size of
the equipment (e.g. only fans over a certain number of kW will be monitored). Not at least, the incident
history of the equipment has been an important factor. See Section 3.5.1 for a summary of the incident
history across the fleet.
The most significant change was to remove the hydraulic FRAMO pumps for cargo, ballast and slop
from the scope. These were never fitted with sensors as it was necessary to install a junction box on
deck. Furthermore, they are monitored through regular hydraulic oil analysis, which the manufacturer of
the pumps, FRAMO, consider being sufficient. Also, they do not recommend vibration monitoring for
these pumps.
3.5.1 Incident History Across the Fleet
Looking through the incident history of HFO purifiers across the fleet, Klaveness has put together a list of
some of the breakdowns and failures that might have been detected by vibration monitoring, see Figure
3.6. It is important to note that this list should not be considered a complete overview of all breakdowns
and failures across the fleet. An incident plot can also be seen in Figure 3.7, depicting incidents that were
’likely’ (orange) or ’very likely’ (green) to be discovered by vibration monitoring. The plot is based on
the list in Figure 3.5.1, but it is updated and slightly changed. It needs to be pointed out that the expenses,
given in brackets, only account for the cost of spare parts. It does not include any other costs associated
48

3.5 Klaveness’ Proposal for Equipment To Be Monitored
Table 3.1: Equipment covered in the pilot project (Component column) and equipment proposed for
fleet-wide installation (Monitor column).
Component Units Monitor Not Monitor
AC Compressor 2 7
Aux Boiler Feed Fuel Pump 2 7
Aux Boiler Feed Water Pump 2 7
Ballast Pumps 2 7
Burner for boiler 1 X
EGB Feed Pump 2 7
FO Supply Pump 2 7
FO Circulation Pumps 2 7
FRAMO Power Pack Motors 4 X
FRAMO Power Pack Jockey Pump 1 X
FRAMO Hydraulic Pumps 3 7
General Service Pumps 2 X
Generator (Main DG sets) 3 X
HFO Purifier 2 7
HT FW Cooling Pump 2 X
LO Purifier Aux Engine 1 7
LO Purifier Main Engine 1 7
LT FW Cooling Pump 3 X
Main Air Compressors 2 7
Main ER Fans 4 X
Main LO Pump 2 X
ME Turbocharger 1 X
ME Aux Blower 2 X
Provision Compressor 2 7
Steering Gear Motor 2 7
SW Cooling Pump 2 X
Vacuum Pump for Sewage Unit 1 7
Working Air Compressor 1 7
Total 56 27 29
49

Chapter 3. Condition Monitoring Pilot in Klaveness
Figure 3.6: List of equipment and incidents that might have been detected by vibration monitoring. The
highlighted equipment should be reconsidered. The red symbol indicates equipment that will not have
vibration monitoring equipment installed.
with the incident, such as any labour hours spent investigating the cause of the incident, ordering of
necessary spare parts, carrying out the actual maintenance or possible downtime or off-hire.
As can be seen from Figure 3.6 and 3.7 above, it has been decided not to install vibration monitoring
equipment on the ’Auxiliary boiler feed water pump’ and ’HFO Purifier’. However, of the equipment
not to be monitored, these two are among those with the most failures that potentially could have been
discovered by vibration monitoring, with three and seven incidents, respectively. When having a closer
look at the equipment list versus incidents, Klaveness believes that they should reconsider removing the
’Auxiliary boiler feed water pump’ and ’HFO Purifier’. For instance, looking at the list, the purifiers
have had just as many incidents that could have been discovered as the ’SW Cooling Pump’, which
will be monitored in the future. Based on its history of incidents that could have been avoided, and the
importance of the purifiers in the fuel oil treatment system, the thesis will focus on the HFO purifiers and
whether it would be beneficial to equip them with vibration monitoring equipment.
50

3.5 Klaveness’ Proposal for Equipment To Be Monitored
Figure 3.7: Incident history plot, from 2015-2019, of equipment proposed for vibration monitoring.
51

Chapter 3. Condition Monitoring Pilot in Klaveness
52

Chapter 4Method
The purpose of this chapter is to describe how the analyses of the HFO purifiers and associated inci-
dent reports were conducted. First, the process of the Failure Modes, Effects and Criticality Analy-
sis (FMECA) is described, followed by a description of how the incident reports were analysed. The
FMECA analysis was carried out in parallel with the incident report analysis, which provided valuable
input to the FMECA, especially in terms of failure modes.
4.1 Failure Modes, Effect and Criticality Analysis
The analysis is carried out step by step, as described in Section 2.4. It consists of three parts, namely
planning, performing and documenting.
4.1.1 Planning
A satisfactory result of an FMECA is the product of thorough preparations. As described in Section 2.4,
the preparatory steps listed below were undertaken. Before this, all the necessary information and data
was collected. From Klaveness the author received: P&ID for the fuel oil purifying system; engineering
manual for the Alfa Laval P 615 separator; fifty incident reports from twelve ships in their fleet; condition
monitoring reports for the two pilot ships from their monitoring equipment supplier IKM Instrutek;
PowerPoint presentation of the condition monitoring pilot evaluation.
Step 1: Definition of the system to be analyzed. Which components are within the boundaries ofthe system.
A fuel oil treatment system consists of several components, further described in Section 2.3.1: settling
tanks, feed pumps, pre-heaters, separators, service tanks, supply pumps and finally main and auxiliary
engines. In this thesis, the analysis focuses solely on the HFO purifier, i.e. the separator. The system
boundaries are drawn as depicted in Figure 4.1.
53

Chapter 4. Method
Figure 4.1: System boundaries (red) for the analysis of the HFO purifiers. Adapted from (Alfa Laval,
2018a).
Step 2: Definition of the main functions (missions) of the system and its operational modes.
The function of the HFO purifier is to separate undesirable liquid and solid contaminants, such as water,
dust and catalytic fines, from the heavy fuel oil. This is done using centrifugal force. The design and
functions of the separator are described in more detail in Section 2.3.3.
The fuel oil treatment consists of two purifiers, as classification societies like DNV GL require that the
system should be redundant. In the systems studied, one separator is operated continuously while the
other is in standby. If the fuel is not properly treated, the engine may be severely damaged or destroyed.
Step 3: System breakdown into subsystems that can be handled effectively. Provide a list of com-ponents for each subsystem.
The purifier can be divided into several subsystems. This division was done based on the separator’s
engineering manual (Alfa Laval, 2018a) and the incident reports. The subsystems and their functions
(italic), as well as their sub-components, are listed below. It should be noted that the subsystems include,
but are not limited to, these sub-components. The sub-components included in the analysis are those con-
sidered to be the main ones of the different subsystems. For the separator bowl and its sub-components,
it is referred to the engineering manual (Alfa Laval, 2018a).
• Electrical motor: Drive the separator via a belt power transmission.
Components: Rotor, stator, bearings, shaft, windings and brushes.
• Power transmission: Transmit power between the electric motor and the separator.
Components: Belt, bowl spindle and friction coupling.
• Inlet and outlet: Feed untreated fuel oil to and discharge treated oil from the separator bowl.
Components: Pipes, hoses and solenoid valve (sensor block).
• Controller and sensors: Controlling and monitor the operation of the separator, perform all
54

4.1 Failure Modes, Effect and Criticality Analysis
necessary alarm functions.
Components: Central Processing Unit (CPU), speed, temperature and pressure transmitter.
• Separator bowl: Separate water, foreign matter and sludge from HFO by centrifugal force.
Components: Bowl and gravity discs.
Step 4: Review of system functional diagrams and drawings to determine interrelationships be-tween the various subsystems, these could, for instance, be illustrated by block diagrams.
A functional block diagram was created based on the abovementioned subsystem division and the P&ID
of the fuel oil purifying system given in Appendix A, see Figure 4.2. Since the in- and outlet only consist
of piping, hoses and valves, they are not represented by blocks in the functional block diagram depicted
in Figure 4.2. Instead, the inlet is represented by the line ”unprocessed oil”, while the outlet is given
as ”clean oil to service tank”. Furthermore, the controller supervises the entire operation of the system,
performing monitoring, control, and alarm functions.
Figure 4.2: Functional block diagram of the HFO purifier.
Step 5: Describe any operational and environmental conditions or stresses that may affect thesystem and its operation.
Purifiers are usually located in a separate room. On some ships, however, they are located on the engine
room bottom floor. The purifiers operate together with pre-heaters, as they require that the fuel oil is
heated before being fed into the separator bowl. As a result, the purifier room usually is rather hot.
Additionally, inflammable gases and leakage might accumulate in the purifier room. Therefore, since
fuel oil is present in abundance, together with air for combustion and heat sources (e.g. hot oil or
electrical short circuit), the purifier room is prone to catching fires.
55
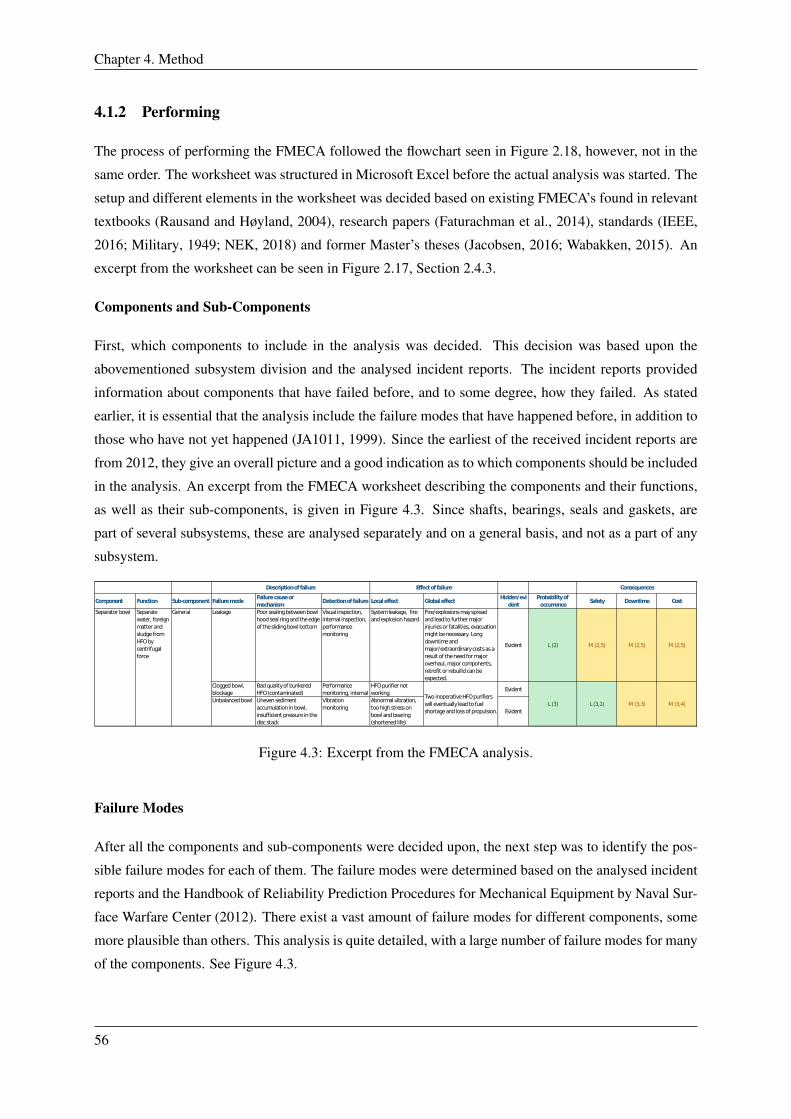
Chapter 4. Method
4.1.2 Performing
The process of performing the FMECA followed the flowchart seen in Figure 2.18, however, not in the
same order. The worksheet was structured in Microsoft Excel before the actual analysis was started. The
setup and different elements in the worksheet was decided based on existing FMECA’s found in relevant
textbooks (Rausand and Høyland, 2004), research papers (Faturachman et al., 2014), standards (IEEE,
2016; Military, 1949; NEK, 2018) and former Master’s theses (Jacobsen, 2016; Wabakken, 2015). An
excerpt from the worksheet can be seen in Figure 2.17, Section 2.4.3.
Components and Sub-Components
First, which components to include in the analysis was decided. This decision was based upon the
abovementioned subsystem division and the analysed incident reports. The incident reports provided
information about components that have failed before, and to some degree, how they failed. As stated
earlier, it is essential that the analysis include the failure modes that have happened before, in addition to
those who have not yet happened (JA1011, 1999). Since the earliest of the received incident reports are
from 2012, they give an overall picture and a good indication as to which components should be included
in the analysis. An excerpt from the FMECA worksheet describing the components and their functions,
as well as their sub-components, is given in Figure 4.3. Since shafts, bearings, seals and gaskets, are
part of several subsystems, these are analysed separately and on a general basis, and not as a part of any
subsystem.
Component Function Sub-component Failure modeFailure cause or
mechanismDetection of failure Local effect Globaleffect
Hidden/evi
dent
Probability of
occurrenceSafety Downtime Cost
Leakage Poor sealing between bowl
hood seal ring and the edge
of the sliding bowl bottom
Visual inspection,
internal inspection,
performance
monitoring
System leakage, fire
and explosion hazard
Fire/explosions may spread
and lead to further major
injuries or fatalities, evacuation
might be necessary. Long
downtime and
major/extraordinary costs asa
result of the need for major
overhaul, major components,
retrofit or rebuilld can be
expected.
Evident L (2) M (2,5) M (2,5) M (2,5)
Clogged bowl,
blockage
Bad quality of bunkered
HFO (contaminated)
Performance
monitoring, internal
HFO purifier not
workingEvident
Unbalanced bowl Uneven sediment
accumulation in bowl,
insufficient pressure in the
disc stack
Vibration
monitoring
Abnormal vibration,
too high stress on
bowl and bearing
(shortened life)
Evident
Consequences
Separator bowl Separate
water, foreign
matter and
sludge from
HFO by
centrifugal
force
General
Two inoperative HFO purifiers
will eventually lead to fuel
shortage and loss of propulsion.
L (3) L (3,1) M (3,3) M (3,4)
Description of failure Effect of failure
Figure 4.3: Excerpt from the FMECA analysis.
Failure Modes
After all the components and sub-components were decided upon, the next step was to identify the pos-
sible failure modes for each of them. The failure modes were determined based on the analysed incident
reports and the Handbook of Reliability Prediction Procedures for Mechanical Equipment by Naval Sur-
face Warfare Center (2012). There exist a vast amount of failure modes for different components, some
more plausible than others. This analysis is quite detailed, with a large number of failure modes for many
of the components. See Figure 4.3.
56
4.1 Failure Modes, Effect and Criticality Analysis
Failure Mechanisms and Causes
The next step was to determine the potential underlying causes of each failure. As with the failure modes,
this was based on the analysed incident reports, the handbook by Naval Surface Warfare Center (2012),
as well as the author’s knowledge. It is important to be aware of that one failure mode may have several
potential failure causes or mechanisms. The cause of the incident is often compound, and there may be
several underlying reasons. One of the problems encountered when analyzing the incident reports was
the lack of descriptions of what may have caused them. See Figure 4.3 for an example of different failure
modes for the separator bowl.
Detection of Failure
How the different failure modes can be detected is an interesting part of the FMECA. For Klaveness to
make the right decision as whether to install vibration monitoring equipment on the HFO purifiers in
their fleet, it is essential to know if the failures actually can be detected by vibration monitoring. This
part answers the first question stated in the objectives section (1.2), asking how the failure modes with
the highest probabilities of occurrence and severity of consequences can be detected. The method of
detection for each failure is based on the available literature, such as (Bloch, 2012; Scheffer and Girdhar,
2004), discussions with Klaveness and the author’s knowledge and intuition. An example can be seen in
Figure 4.3.
Effect of Failure
The effects of each failure were divided into local effects on the given component, next level effects on
the HFO purifier system, and global effects on the ship as a whole. The effects of each failure are based
on the handbook by Naval Surface Warfare Center (2012), the author’s knowledge and discussions with
Klaveness. The next level effects and global effects describe worst case scenarios.
Probability of Occurrence and Consequences
The final step of the analysis was to determine the probability of occurrence and severity of the con-
sequences of each failure mode. This was a qualitative assessment based on a risk matrix used in an
FMECA performed by DNV GL on behalf of Klaveness, see Appendix C. The risk matrix was also the
basis for the different consequence categories in the analysis: safety, downtime, and costs.
The probability of occurrence is based on the estimation of failure rates for the different components and
sub-components of the HFO purifier system. Due to difficulties with obtaining relevant and exact failure
data on failure mode level, the assessment of the probability of failure was conducted on component
and sub-component level, based on the incident reports provided by Klaveness. See Section 4.1 for an
explanation of the component division of the purifier system, Section 4.2.2.1 and 5.1.1 for how the failure
rates were calculate, and Section 5.1.1 the results.
57

Chapter 4. Method
The consequences are a result of discussions between Klaveness and the author and are to a large degree
based on Klaveness’ own experiences with the equipment. The two consequence categories ”Downtime”
and ”Cost” are explained further below:
Downtime: When considering the severity of consequences associated with next level effects, it is as-
sumed that the downtime is for one separator, and not the ship as a whole. A breakdown will most likely
cause a downtime between 1-10 days, i.e. the severity concerning downtime is in category 3 in the risk
matrix. However, this assumes that all necessary spare parts are available onboard. If these are not avail-
able, the downtime may be longer than ten days, i.e. category 4. When considering the global effects,
caused by a breakdown of both purifiers, it is assumed that the purifiers are repaired simultaneously.
Thus, the downtime is in the same category as for the next level effects.
Cost: A high-level analysis of breakdowns conducted by Klaveness show that the cost of spares associ-
ated with the breakdown of one purifier is in the range 1,000-5,000 USD. However, this does not include
costs of labour hours (onboard, procurement, ship management), freight forwarding, handling in port
and agent costs. Therefore, it is reasonable to assume that the actual cost usually will exceed 5,000 USD
but seldom exceed 20,000 USD. As a result, the severity of a purifier breakdown concerning cost will be
in category 3 in the risk matrix. It is assumed that the breakdown of both purifiers will result in costs
ending up in category 4.
4.1.3 Documenting
The FMECA analysis was documented along the way. The worksheet was structured in Microsoft Excel
and continually updated throughout the analysis process. Because of the very long mean time between
failure (MTBF) for the entire system, see Section 5.1.1, the consequences have been assessed for both
next-level effects and global effects. See Appendix D for the complete FMECA worksheets.
4.2 Incident Analysis
As stated in the objectives of the thesis, Section 1.2, one of the questions to be answered was what kind
of information that can be extracted from the incident reports regarding HFO purifiers in the Klaveness
fleet, and if any of these incidents could have been detected by vibration monitoring. The basis for
answering this question is 50 incident reports that are, directly or in some way, related to HFO purifiers
onboard different ships in Klaveness’ fleet of combination carriers and container ships. The incident
reports are from 2012 until the 19th of April 2019 and cover incidents from twelve different ships.
Most of the incidents analysed in this thesis are defined as nonconformities. The result of these incidents
has mostly been material damages of varying severity, from worn out seals to electrical motors having
to be renewed. These failures have not posed any significant threat to the safety onboard. Based on the
descriptions, it is difficult to determine the severity of the incidents defined as near accidents. Some are
related to minor breaches of maintenance procedures which could cause minor accidents, whereas most
of them are described as material damage equal to those labelled as nonconformities.
58

4.2 Incident Analysis
Figure 4.4: General structure of the incident reports in Klaveness.
4.2.1 Incident Report Structure
Klaveness has a template for their incident reports which is used throughout the fleet, thus simplifying
the analysis work to a certain degree. The reports follow the same general structure: summary of the
incident, written correspondence between the ship and ship management, relevant attachments and an
improvement report describing the incident, corrective actions and underlying causes, amongst others.
The general structure of the incident reports is depicted in Figure 4.4. An example of what an incident
report could look like can be found in Appendix C. The incident reports that have been read are of
varying quality. Whereas some are well structured, have a high level of detail and are easy to read, others
are much less comprehensive and clear, thus sometimes making it difficult to understand what has gone
wrong and what was done to fix the problem.
4.2.2 Analysis Process
To be able to analyse the incident reports in an attempt to find any relations between the incidents on the
purifiers, it was deemed necessary to gather all the information in one place. Microsoft Excel was chosen
as the easiest and most appropriate platform for the purpose. The entire analysis process was carried out
as follows:
Step 1: A large number of the incident reports, counting fifty in total, was read. This was done to gain
a better understanding of how the reports were built up and what kind of information they contained.
59
Chapter 4. Method
Because of its simplicity, flexibility and data visualisation abilities, Excel was chosen as the most suitable
tool for further analysis.
Step 2: All the information in each incident report was directly transferred, not treated in any way, to
a Microsoft Excel spreadsheet to gather all reports in one place. Each row in the spreadsheet represents
one incident report. The titles of the different columns in the spreadsheets are taken from the headlines
found in the incident reports. It should be noted that the different reports do not necessarily contain the
same information. As a result, several of the columns might be empty in some of the reports. An excerpt
from the spreadsheet can be seen in Figure 4.5.
Step 3: After gathering all the information in one place, all incident reports that were not directly
related to the HFO purifiers were removed from the scope. For example, incidents regarding HFO feed
pumps, the purifier sludge tank and heat exchangers were discarded. These are parts of the fuel oil
treatment system; however, they are not within the system boundaries set for this analysis. The number
of incident reports eligible for further analysis was reduced from 50 to 42.
Step 4: When all unrelated incidents were discarded, the remaining incidents were reviewed again.
The purpose was to rewrite the information and remove everything unnecessary or superfluous, thus
making it easier to understand what the incident reports describe. Additionally, two of the columns were
removed: the column describing the ”Immediate action” taken was merged with the ”Corrective action”
column, and the ”Probable cause” column was merged with ”Immediate cause”. This merging was done
because few reports used the terms ”Corrective action” and ”Probable cause”, but described the same
type of information as in the columns they were merged with.
Step 5: The incident reports were then further simplified, only keeping the information considered as
interesting and relevant for further analysis. The goal was only to list the faulty or damaged equipment
from each incident, i.e. reducing the entire description to one or several specific parts, in addition to the
underlying causes. An excerpt from this spreadsheet can be seen in Figure 4.6.
One of the main problems in this stage was that several reports use different names for the same com-
ponents. Based on the engineering manual for the separator, (Alfa Laval, 2018a), it was possible to
determine whether the different reports were describing the same component or not. Any uncertainties
were discussed and clarified with Klaveness. The equipment was then categorized into major compo-
nents of the HFO purifier: power transmission, electrical motor, inlet and outlet, separator and electronic
equipment (i.e. controllers and sensors).
Then, the underlying causes were addressed. When writing the reports, these causes can be chosen from
a list, with the possibility of adding remarks. The reports that had not provided ”Immediate cause” and
60

4.2 Incident Analysis
ID Origin Ship Type Event Date Category SFI
Importanc
e Event Type Cause Description
Immediate
Action
Probable
Cause
BURD621 MV Bardu Container 19.04.2019 Non
Conformity
4362 Heavy
Fuel Oil
Purifier
Needs
attention
- Defect Water in HFO serv. tank,
investigation started. Steam
heating pressure tested (re:
problems with fuel in cascade
tank), found ok. Checked
settings on HFO purifier, set
points for WMS altered – i.e.
no alarm if water is detected.
- -
BURD320 MV Bardu Container 22.08.2016 Non
Conformity
4365 IFO
Purifier
Feed Pump
Needs
correction
- Defect 17.08.2016 @ 08:30, no RPM
during start due to cut v-belt.
FO feed pump leaking because
of damaged oil seal.
- -
KLAV1139 MV Barry Container 22.11.2013 Non
Conformity
- Needs
correction
- - Cleaning the purifier plates
with chemicals without using
protective gloves.
- -
STR-
10KO1H0
MV Banastar CABU1 12.10.2012 Near
Accident
- Needs
attention
Machinery
Breakdown
- Bearing housing of electric
motor found worn out
excessively. Motor to be
renewed.
- -
STR-
10KU25P
MV Banastar CABU1 15.10.2012 Non
Conformity
- Needs
attention
Machinery
Breakdown
- HFO Purifier No. 2 breakdown. - -
ALMA151 MV Bangor CABU1 01.10.2014 Non
Conformity
4362 Heavy
Fuel Oil
Purifier
Needs
correction
Machinery
Breakdown
Breakdown Electric motor burnt due to
bearing damage.
- -
Personal Injury
or Material
Damage Corrective Action Proposed Preventive Action Proposed Corrective Action
Consequence If
No Corr./ Prev.
Action
Immediate
Cause Root Cause
Control
Action
Needed
Material damage Manual read, settings adjusted
accordingly.
Engineers have to be aware of
the importance of those
settings – must include this
information in handover notes.
- Breakdown of
several vital
machineries
Incorrect use of
equipment or
machinery
Lack of
knowledge
Planned
inspections
and
maintenance
Material damage Purifier stopped, all valves closed. V-belt
and oil seal replaced with spares. Test ok.
Needs to attention - No standby FO
purifier in case of
emergency
situation.
Defective
equipment,
machinery or tools
Inadequate
maintenance
-
- Job stopped, all engine crew instructed
to wear protection equipment.
- Instruct all engine crew to
wear protection equipment
before performing jobs.
Serious injury.
Burns etc.
Negligence of
safety
- -
- Bearing housing of electric motor found
worn out excessively. Motor to be
renewed. After replacement the old
motor will be sent for building/machining
the bearing housing. VRN sent for
purchase of new motor.
- - - - - -
- Purifier dismantled and following noted:
(1) bottom bearing found cracked; (2)
bearing hard on shaft and unable to
remove; (3) shaft had heavy scouring
marks near the threads; (4) bowl body
had heavy scorings in the internal taper
area. Investigation under progress.
Necessary spare parts procured, service
technician booked at Port Khalifa.
- - - Unable to
determine the
exact cause of
breakdown. SM
MDO informed by
mail with details.
- -
- Stopped and isolated HFO Purifier No. 1.
New motor ordered, will be delivered at
Fujairah. Burnt motor will be sent ashore
and kept as spare if repaired.
- Attention must be paid to all
running machineries, look for
abnormalities like noise,
vibration, etc.
No backup purifier
if HFO Purifer
No.2 runs into
trouble.
Bearing failure Wear and
tear of
bearing
-
Figure 4.5: Excerpt from the spreadsheet containing all the incident reports, untreated. The bottom image
is a continuation of the top one.
61

Chapter 4. Method
”Root cause” were assigned appropriate causes based on incident reports with similar (types of) fail-
ures. Two of the categories, ”Lack of skill” and ”Lack of knowledge” has been merged to ”Lack of
skill/knowledge”, as these are closely related. Furthermore, some incidents had their causes changed
to seemingly more appropriate ones. For example, based on the description in one report, faults had
most likely been introduced to the system during maintenance, resulting in a failure. Thus, the im-
mediate cause was changed from ”Defective equipment, machinery or tools” to ”Failure to follow re-
pair/maintenance instructions”, and the root cause labelled as ”Excessive wear and tear” was changed to
”Lack of skill/knowledge”.
Finally, one column describing whether the incident could have been discovered by vibration monitoring
was added to the spreadsheet. This is important for further analysis of the events to be able to answer the
questions stated in the objectives. After analyzing the reports in more detail, it was seen that several of
the incidents involved failures on more than one component or sub-component. Based on the information
given in these incident reports, it was unclear which of the components or sub-components failed first,
and whether the other failures occurred as a result of the first one or if they had already failed but not
been revealed yet. For example, one incident report described the failure of a lower ball bearing, rotor
and stator in one of the electric motors. Based on the incident description, it seemed very likely that the
rotor and stator failure was due to the failure of the lower ball bearing. Therefore, each of the equipment
failures was categorized as very likely to have been detected by vibration monitoring.
The probability of the sub-components involved in the incident being detected by vibration monitoring
was given on a qualitative scale: very likely, likely, or unlikely. The probability assigned to each sub-
component was based on the author’s knowledge, and the literature referred to in Section 2.2.1. This
assessment was reviewed, and any uncertainties were clarified, during a discussion between the author
and Karsten Moholt, a company working with lifetime extension of rotating equipment through smart
maintenance. The author received positive feedback on the initial assessment conducted of which sub-
components that could have been detected by vibration monitoring.
For the incidents involving more than one sub-component, the likeliness of the incident being detected
by vibration monitoring was determined by the likeliness of detection for the different sub-components
involved. For example, if an incident involved two sub-components that were very likely to have been
detected by vibration monitoring and one sub-component that was not, the incident would most likely
have been detected by vibration monitoring.
Step 6: The analysis was also carried out in Microsoft Excel. At this stage, four more incidents were
removed from the scope. These were incidents related to (1) cleaning equipment without protective gear;
(2) not cleaning up properly after maintenance; (3) special tool breaking during maintenance and (4)
special tools could not be found when needed during maintenance. The incidents were not related to any
system failure and were, therefore, not deemed relevant for further analysis.
The distribution of incidents concerning event date, incident category, equipment involved, and which
62

4.2 Incident Analysis
Title ID Origin Event Date Category Importance
HFO Purifier settings BURD621 MV Bardu 19.04.2019 Non Conformity Needs attention
FO Purifier No. 2 BURD320 MV Bardu 22.08.2016 Non Conformity Needs correction
Cleaning Purifier Plates KLAV1139 MV Barry 22.11.2013 Non Conformity Needs correction
Electric motor bearing housing STR-10KO1H0 MV Banastar 12.10.2012 Near Accident Needs attention
Burned HFO Purifier Electric
MotorALMA151 MV Bangor 01.10.2014 Non Conformity Needs correction
HFO Purifer ALMA367 MV Bangor 26.09.2016 Non Conformity Needs correction
HFO Purifier Breakdown ALMA612 MV Bangor 01.09.2018 Non Conformity Needs correction
Worn Out Belt Pulley of HFO
PurifierALMA700 MV Bangor 01.04.2019 Non Conformity Needs correction
HFO Purifier No.2 Belt Pulley ALMA537 MV Bangor 05.10.2017 Non Conformity Needs correction
HFO Purifier No. 2 STR-10KU25P MV Banastar 15.10.2012 Non Conformity Needs attention
Equipment Main component Immediate cause Root cause Discovered by VM?
Water Monitoring System Electronic equipmentIncorrect use of machinery or
equipmentLack of skill/knowledge Not likely
Drive belt Power transmissionDefective equipment, machinery or
toolsInadequate maintenance Very likely
N/A N/A Negligence of safety Lack of skill/knowledge N/A
Bearing housing (el. motor) Electrical motorDefective equipment, machinery or
toolsExcessive wear and tear Likely
Bottom bearing Very likely
Vertical shaft/spindle Very likely
Bowl Body Separator bowl Likely
Bearing (el. motor) Electrical motorDefective equipment, machinery or
toolsExcessive wear and tear Very likely
Sliding bowl bottom Separator bowlFailure to follow repair/maintenance
instructionsLack of skill/knowledge Not likely
Friction coupling/block/pad Likely
Belt pulley Likely
Bowl Separator bowl Bunkers and/or lubricating oils Received substandard fuel Not likely
Friction coupling/block/pad Likely
Belt pulley LikelyExcessive wear and tear
Defective equipment, machinery or
toolsExcessive wear and tear
Power transmissionFailure to follow repair/maintenance
instructions
Power transmission Defective equipment, machinery or
toolsExcessive wear and tear
Power transmission
Figure 4.6: Excerpt from the spreadsheet for the incident analysis. The bottom picture is a continuation
of the top one.
63

Chapter 4. Method
subsystem they belong to, immediate cause and root cause, was investigated. The distributions were
plotted as histograms. Each of the failure categories, types of equipment involved, main components,
immediate and root causes were compared to the qualitative assessment of whether they could have been
discovered by vibration monitoring. The results are given in Section 5.
4.2.2.1 Failure Rate Estimation
Failure rate estimation techniques are based on gathering failure data. This data can be roughly divided
into manufacturers own field return data, end-user field data or data obtained from industry databases,
comprising failure data from several companies. All of them can provide useful information; however,
they do all have advantages and disadvantages.
While manufacturer field return data is real, and failures are often thoroughly investigated, there are
several uncertainties regarding the failure rates. This could be how many failures are actually returned,
and whether it is assumed that all failures are returned or not, and how many of the returned failures are
classified as failures by the manufacturer.
The industry databases could contain a large amount of data, as failure rates are gathered from a large
number of companies. One of the most prominent databases is Offshore and Onshore Reliability Data
(OREDA). However, using a database like this to obtain failure rates for this thesis may be problematic
as the equipment most likely differs from those onboard a ship, both for design and operational profile
and environmental conditions.
The final way of estimating failure rates is based on a company’s data. As opposed to manufacturer
return field data and industry databases, the failure data of one single company is most probably less
extensive. Dependent on the amount of data, this could make the failure rate estimations more uncertain.
On the other hand, the data is highly relevant as the failures come from equipment that has worked under
the same environmental conditions and with similar operational profiles.
In this thesis, the failure estimation was based on Klaveness’ incident reports on HFO purifiers. The
42 analysed reports cover the period between 12.10.2012 to 01.04.2019, or approximately 6.5 years.
Furthermore, as the incidents are from 12 different ships, the reports cover approximately 78 ship years
in total. Then, the failure rate and mean time to failure (MTTF) for the different components and sub-
components was estimated, see Table 5.1-5.4 in Section 5.1.1.
These failure rates are for only one purifier. However, the HFO purifier has redundancy, as depicted
in Figure 4.7. This means that one purifier is kept in standby and is activated if the first purifier fails.
Since the reserve item carries no load in the waiting period before activation, the redundancy is passive.
Therefore, in order for the HFO purifier system to fail, both purifiers have to be out of operation at the
same time. If the purifier is being repaired after it fails, the failure rate of the system can be written as
(Dudley et al., 1993):
64

4.2 Incident Analysis
λn/n+1 =n(nλ+ (1 + P )µ)λ
µ+ n(P + 1)λ(4.1)
where:
λx/y = the effective failure rate of the redundant configuration where x of y units are required for success
n = number of active on-line units
λ = failure rate of an individual HFO purifier unit (incidents/hour).
µ = repair rate (µ = 1/Mct, where Mct is the mean corrective maintenance time in hours
P = probability switching mechanism will operate properly when needed (P = 1 with perfect switching)
There have been 38 incidents leading to an HFO purifier failure, and the incident reports cover a time
span of 01.04.2019 − 12.10.2012 = 2363 days = 6.47 years. As the incidents are from 12 different
ships, the incident reports cover 6.47 · 12 = 77.7 ship years. Then, the failure rate of an individual HFO
purifier unit is calculated by:
λHFO purifier =38
2362/365 ∗ 12= 0.489 [h−1] (4.2)
or given as MTTF
MTTFHFO purifier =1
λHFO purifier= 2.04355 years = 17, 901.5 hours (4.3)
Using Equation 4.1 for different repair rates, assuming perfect switching, one can obtain effective mean
time between failure (MTBF) of the system for different mean corrective maintenance times (Mct), i.e.
the average time it takes to repair the purifier. See Section 5.1.1 for the failure rate estimation for the
HFO purifier system, its components and sub-components.
Figure 4.7: Standby system with two items.
65

Chapter 4. Method
66

Chapter 5Results
5.1 Failure Modes, Effects and Criticality Analysis (FMECA)
First, the results from the failure rate estimation are presented. These form the basis for the assessment of
the probability of failure for the different components and sub-components in the HFO purifier system.
Then, the worksheet, i.e. the results of the FMECA, is presented.
5.1.1 Failure Rate Estimation
As discussed in Section 4.2.2.1, the failure rate and MTTF for the different components and sub-
components in the purifier system is estimated based on the number of incidents over a given time.
These results are given in Table 5.1, 5.2-5.4. These results are for one purifier. However, the HFO puri-
fier has redundancy, meaning that one purifier is kept in standby and is activated if the first purifier fails.
Since the reserve item carries no load in the waiting period before activation, the redundancy is passive.
Therefore, in order for the HFO purifier system to fail, both purifiers have to be out of operation at the
same time. If the purifier is being repaired after it fails, the failure rate of the system can be estimated
by using Equation 4.1. Using this equation for different repair rates, assuming perfect switching, we can
estimate the effective mean time between failure (MTBF) of the system, see Table 5.5. It can be seen that
the HFO purifier system, consisting of two purifiers, have a mean time between failure of approximately
113 years if the repair time of one purifier is two weeks.
67

Chapter 5. Results
Table 5.1: Failure estimation of main components.
Component Frequency λ∗ MTTF∗∗
[year−1] [year]
Electrical motor 7 0.090 11.1
Separator Bowl 7 0.090 11.1
Electronic Equipment 8 0.103 9.7
Inlet/Outlet 8 0.103 9.7
Power Transmission 14 0.180 5.5
Total (i.e. one purifier) 44∗∗∗ 0.567 1.8
∗ λ = incident frequency/total no. of ship years, where the number
of ship years is 78.∗∗ MTTF 1/λ.∗∗∗ The number of failures are higher than the number of incidents
because more than one main component was involved in some of the
incidents.
68

5.1 Failure Modes, Effects and Criticality Analysis (FMECA)
Table 5.2: Sub-component failure estimation for all parts.
Equipment Frequency λ∗ MTTF∗∗
[year−1] [year]
Centripetal Pump Chamber Cover 1 0.013 77.7
Hose 1 0.013 77.7
Rotor 1 0.013 77.7
Seal 1 0.013 77.7
Sensing Liquid Pump 1 0.013 77.7
Sight Glass 1 0.013 77.7
Stator Winding 1 0.013 77.7
Three-Way Valve 1 0.013 77.7
Water Monitoring System 1 0.013 77.7
Wing Insert 1 0.013 77.7
Belt Pulley 3 0.039 25.9
Friction Coupling/Block/Pad 3 0.039 25.9
Controller 4 0.052 19.4
Sensor 4 0.052 19.4
Bowl 6 0.077 12.9
Drive Belt 6 0.077 12.9
Sensor Block 6 0.077 12.9
Shaft/spindle 6 0.077 12.9
Bearing (incl. housing) 11 0.142 7.1
∗ λ = incident frequency/total no. of ship years, where the number of ship years
is 78.∗∗ MTTF = 1/λ.
69

Chapter 5. Results
Table 5.3: Sub-component failure estimation for all parts when excluding
the the electrical motors.
Equipment Frequency λ∗ MTTF∗∗
[year−1] [year]
Centripetal Pump Chamber Cover 1 0.013 77.7
Hose 1 0.013 77.7
Seal 1 0.013 77.7
Sensing Liquid Pump 1 0.013 77.7
Sight Glass 1 0.013 77.7
Three-Way Valve 1 0.013 77.7
Water Monitoring System 1 0.013 77.7
Wing Insert 1 0.013 77.7
Belt Pulley 3 0.039 25.9
Friction Coupling/Block/Pad 3 0.039 25.9
Controller 4 0.052 19.4
Sensor 4 0.052 19.4
Bearing (incl. housing) 5 0.064 15.5
Shaft/spindle 5 0.064 15.5
Bowl 6 0.077 12.9
Drive Belt 6 0.077 12.9
Sensor Block 6 0.077 12.9
∗ λ = incident frequency/total no. of ship years, where the number of ship years
is 78.∗∗ MTTF = 1/λ.
Table 5.4: Sub-component failure estimation for the
electrical motors.
Equipment Frequency λ∗ MTTF∗∗
[year−1] [year]
Stator Winding 1 0.013 77.7
Rotor 1 0.013 77.7
Shaft 1 0.013 77.7
Bearing 6 0.077 12.9
∗ λ = incident frequency/total no. of ship years, where the
number of ship years is 78.∗∗ MTTF 1/λ.
70

5.1 Failure Modes, Effects and Criticality Analysis (FMECA)
Table 5.5: Mean time between failure for the passive redundant purifier system.
Mean Corrective Repair Rate, µ MTBF MTBFMaintenance Time, Mct[hour] [hour−1] [hour] [year]
1 1.00000 320,499,505 36,587
2 0.50000 160,267,654 18,295
4 0.25000 80,151,729 9,150
8 0.12500 40,093,766 4,577
12 0.08333 26,741,112 3,053
24 0.41667 13,388,457 1,528
48 0.02083 6,712,130 766
72 0.01389 4,486,688 512
96 0.01042 3,373,967 385
120 0.00833 2,706,334 309
144 0.00694 2,261,245 258
168 (1 week) 0.00590 1,943,325 222
336 (2 weeks) 0.00298 989,564 113
The system failure rates are based on the number of incidents directly related to fail-
ure of the HFO purifier system, i.e. 38 incidents. The equipment involved in these
incidents are all within the system boundaries.
5.1.2 FMECA Worksheet
The results of the FMECA can be seen in Appendix D. Concerning the consequences of failure, the
severity was assessed both with respect to next level effects, i.e. on the HFO purifier itself, and global
effects, concerning the ship as a whole. The reason for doing so is the extremely long MTBF for the HFO
purifier system as a whole. If one of the purifiers fail, it is almost certain that it is repaired before the
standby purifier also breaks down. As a result, the next level effects are those that normally will occur.
5.1.3 Risk Matrix
The severity of consequences for failures of the different components in the HFO purifier systems was
based on the risk matrix provided by Klaveness, see Appendix C. The likelihood of occurrence combined
with the severity of consequence gives a score in the risk matrix. A description of these scores are given
below:
• Low (green): Monitoring actions are required to identify whether the risk rises to medium level.
• Medium (yellow): Risk reduction measures must be taken if their respective costs are not dis-
proportionately high as compared to their attained benefits (ALARP principal); actions need to be
taken to manage and measure risk.
71

Chapter 5. Results
• High (red): Actions must be taken to reduce risk to at least the medium level.
The distribution of these scores for the FMECA analyses was calculated. The distribution for the FMECA
where the consequences were based on next level effects are shown in Figure 5.1, while for the FMECA
were they are based on global effects are shown in Figure 5.2.
2 7
2 2
(a) Safety
2 7
2 2
(b) Downtime
2 6
2 3
(c) Cost
Figure 5.1: Distribution of failure consequences considering next level effects in the FMECA with re-
spect to safety, downtime and cost.
2 5
3 1
(a) Safety
2 5
3 1
(b) Downtime
2 5
3 1
(c) Cost
Figure 5.2: Distribution of failure consequences considering global effects in the FMECA with respect
to safety, downtime and cost.
When considering severity of consequences as a result of the next level effects, it can be seen that all the
failures fall within either the green or yellow section of the risk matrix. While the likelihood of occur-
rence is on the lower side, the severity of consequences are somewhat higher. The high consequences
are associated with leakages in the system leading to fire and explosion. When considering the next level
effects, it is considered that any fire or explosion is limited to the purifier and machinery space, thus not
spreading to the rest of the ship.
The distribution of failure consequences when considering global effects resembles the one considering
next level effects. Compared to the consequences of next level effects, the severity of consequences
associated with the global effects tend to be worse. This has to do with the assumption of fire and
explosions spreading to other parts of the ship instead of being limited to the purifier and machinery
space. Here, the increase in cost will also be considerably higher.
72

5.2 Incident Report Analysis
5.2 Incident Report Analysis
The starting point for the analysis was 50 incident reports that were, either directly or in some way,
related to HFO purifiers onboard twelve different ships in the Klaveness’ fleet of combination carriers
and container ships. The reports are from 12.10.2012 to 01.04.2019, approximately 6.5 years. Several
incidents were removed from the scope before the analysis was conducted, reducing the number of
incidents from 50 to 38. The removed incidents were either related to equipment outside the system
boundaries, as depicted in Figure 4.1 and 4.2, or they were not actual system failures. See Section 4.2.2
for further description. The results of the analysis are given in the sections below.
5.2.1 Incident Dates
The 42 incident reports related to the HFO purifiers were plotted as a histogram showing the distribution
of incidents from 2012 to 2019. The incident distribution is shown in Figure 5.3 below.
Figure 5.3: Distribution of Incidents per year.
It should be noted that four of these incidents were non-system failures. These occurred in 2013 (one
incident), 2015 (one incident) and 2017 (two incidents). In the following results, these four incidents are
removed from the scope.
5.2.2 Failure Categories
Each of the incident reports states a failure category in the summary section in the beginning. The
distribution of failure categories and share of incidents that could potentially (i.e. very likely or likely)
have been detected by vibration monitoring, is given in Figure 5.4 below.
73

Chapter 5. Results
3
16
1
5
32
0 5 10 15 20 25 30 35
Suggestion for Improvement
Near Accident
Non Conformity
Frequency
Distribution of Failure Categories
Frequency Could potentially have been detected by vibration monitoring
Figure 5.4: Distribution of failure categories and share of incidents that could potentially have been
detected by vibration monitoring.
The one incident labelled ”Suggestion for Improvement” was regarding a defect speed sensor, preventing
the purifier from obtaining its operational speed. Compared to the other incident reports, this could just
as well have been labelled as a ”Non Conformity”.
5.2.3 Equipment Involved
The equipment that was involved, i.e. defect or damaged in some way, was analysed. The frequency
of occurrence of each type of equipment involved in the incidents was plotted as a histogram. The
frequency of occurrence was compared to the share of incidents that could potentially have been detected
by vibration monitoring, which has been verified and discussed with Karsten Moholt. The distribution is
shown in Figure 5.5 below.
74

5.2 Incident Report Analysis
1
1
3
3
3
6
5
11
1
1
1
1
1
1
1
1
1
3
3
4
4
6
6
6
6
11
0 2 4 6 8 10 12
Hose
Rotor
Seal
Sensing Liquid Pump
Sight Glass
Stator Winding
Three-Way Valve
Water Monitoring System
Wing Insert
Belt Pulley
Friction Coupling/Block/Pad
Controller
Sensor
Bowl
Drive Belt
Sensor Block
Shaft/spindle
Bearing (incl. housing)
Distribution of Equipment Failures
Frequency Could potentially have been detected by vibration monitoring
Figure 5.5: Distribution of equipment failures and share of these that could potentially have been detected
by vibration monitoring.
The total number of equipment failures is 60, of which 33, or 55%, could potentially (i.e. very likely
or likely) have been detected by vibration monitoring. The number of equipment failures is higher than
the number of incidents because several types of equipment were defective or damaged in several of the
incidents.
75

Chapter 5. Results
5.2.4 Main Components
As described in Section 4.1, the HFO purifier system was divided into several main components. The
distribution of failures in each of these main components, and share of these that could potentially (i.e.
very likely or likely) have been detected by vibration monitoring is depicted in Figure 5.6 below.
3
7
13
7
7
8
8
14
0 2 4 6 8 10 12 14 16
Separator Bowl
Electrical motor
Inlet/Outlet
Electronic Equipment
Power Transmission
Distribution of Main Component Failures
Frequency Could potentially have been detected by vibration monitoring
Figure 5.6: Distribution of main component failures and share of these that could potentially have been
detected by vibration monitoring.
As with the distribution of equipment failures, the number of main component failures are higher than
the number of incidents because several main components had equipment with defects or damages in
some of the incidents.
5.2.5 Immediate Cause
As described in Section 4.2.2, most of the incident reports stated an immediate cause and a root cause.
The reports that had not provided any causes were assigned appropriate causes based on the incident
description and incident reports with similar (types of) failures. Furthermore, some incidents had their
causes changed to seemingly more appropriate ones. The distribution of immediate causes and share of
these that could potentially have been detected by vibration monitoring is shown in Figure 5.7 below.
76

5.2 Incident Report Analysis
1
1
5
12
1
1
1
1
1
1
1
1
1
2
7
20
0 5 10 15 20 25
Incorrect use of machinery or equipment
Bunkers and/or lubricating oils
Noise or temperature
Controller failure
High FO temperature on feed pump
Unable to attain required speed
Other substandard condition, or lubricating oils
Solenoid valve and wiring defective
Failure to warn
Speed sensor failure
Failure to follow repair/maintenance instructions
Defective equipment, machinery or tools
Distribution of Immediate Causes
Frequency Could potentially have been detected by vibration monitoring
Figure 5.7: Distribution of immediate causes and share of these that could potentially have been detected
by vibration monitoring.
As can be seen, most immediate causes, 27 out of 38, belong to the two categories ”Defective equipment,
machinery or tools” and ”Failure to follow repair/maintenance instructions”. These categories are broad,
and it is difficult to say much about the immediate cause of the failure. The categories with only one
entry appear to be incidents where it has been attempted to pinpoint the immediate cause. It should be
noted that it is not necessarily easy to know what the immediate cause is, which might explain the high
number of incidents described with the more general immediate causes categories.
Furthermore, it can be seen that 50% of the incidents, and 60% with immediate cause ”Defective equip-
ment, machinery or tools”, could potentially (i.e. very likely or likely) have been detected by vibration
77
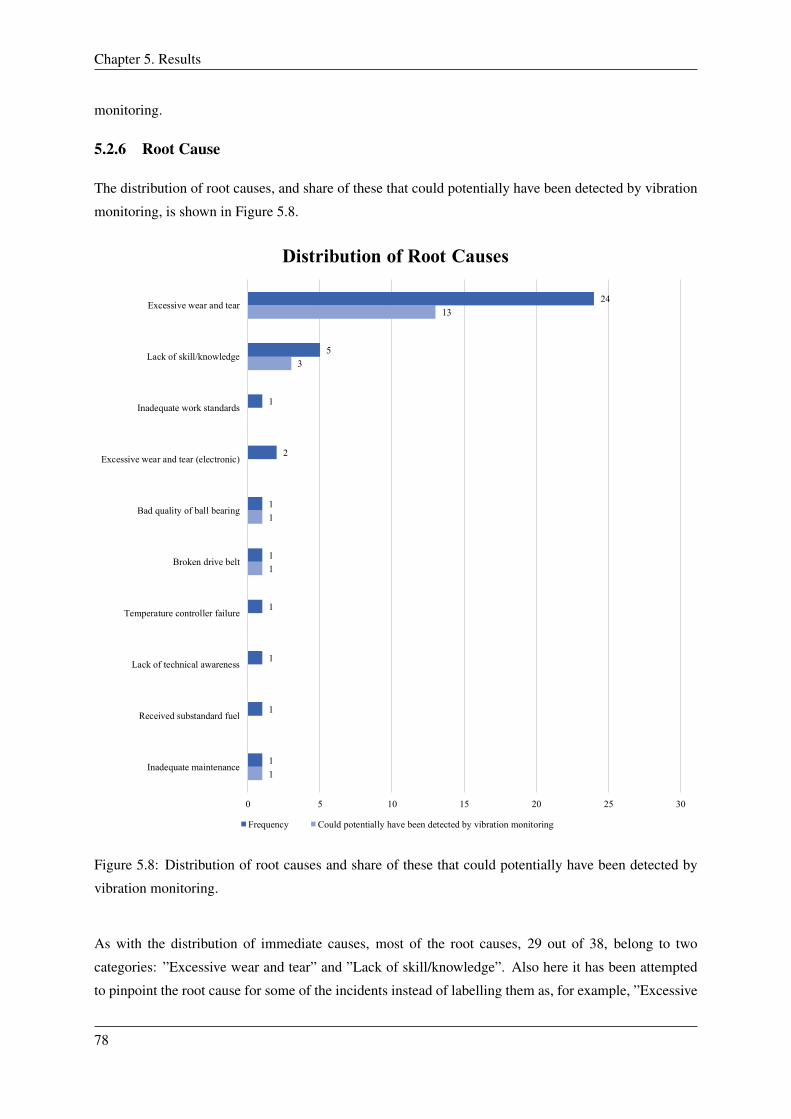
Chapter 5. Results
monitoring.
5.2.6 Root Cause
The distribution of root causes, and share of these that could potentially have been detected by vibration
monitoring, is shown in Figure 5.8.
1
1
1
3
13
1
1
1
1
1
1
2
1
5
24
0 5 10 15 20 25 30
Inadequate maintenance
Received substandard fuel
Lack of technical awareness
Temperature controller failure
Broken drive belt
Bad quality of ball bearing
Excessive wear and tear (electronic)
Inadequate work standards
Lack of skill/knowledge
Excessive wear and tear
Distribution of Root Causes
Frequency Could potentially have been detected by vibration monitoring
Figure 5.8: Distribution of root causes and share of these that could potentially have been detected by
vibration monitoring.
As with the distribution of immediate causes, most of the root causes, 29 out of 38, belong to two
categories: ”Excessive wear and tear” and ”Lack of skill/knowledge”. Also here it has been attempted
to pinpoint the root cause for some of the incidents instead of labelling them as, for example, ”Excessive
78

5.2 Incident Report Analysis
wear and tear”, a category which covers many types of failures.
Furthermore, it can be seen that 50% of the incidents, and more than half of the incidents caused by
”Excessive wear and tear”, could potentially (i.e. very likely or likely) have been detected by vibration
monitoring,
5.2.6.1 Summary
A summary of the proportion of incident failure categories, main components, sub-components, imme-
diate causes and root causes that were either very likely or likely to have been detected by vibration
monitoring is given in Table 5.6 below.
Table 5.6: Summary of the results from the incident analysis.
Potentially detected by VM
Failure Categories 50 %
- Very likely 68 %
- Likely 32 %
Main Components 52 %
- Very likely 70 %
- Likely 30 %
Sub-Components 56 %
- Very likely 59 %
- Likely 41 %
Immediate Cause 50 %
- Very likely 68 %
- Likely 32 %
Root Cause 50 %
- Very likely 68 %
- Likely 32 %
Independent of which incident category one looks at, it can be seen that at least half of the incidents or
failures would either very likely or likely have been detected by vibration monitoring.
79

Chapter 5. Results
80
Chapter 6Discussion
The discussion chapter of this thesis is divided into several parts. First, the available data, which forms
the basis for the analyses, are discussed. This is followed by a discussion of the FMECA and incident
analysis and their results. Finally, the incident reports, their structure, and how they are written, are
discussed.
6.1 Available Data
Documenting incidents and failure data is an essential part of the ability to improve long term asset
reliability. Knowing when and understanding how equipment fails allows for corrective measures to be
taken and directed where it will produce the greatest value. Thus, future failures can be mitigated or even
eliminated.
The information and results from failure data analysis can be used to determine the most appropriate
maintenance strategies for eliminating failure root causes. This could, for example, be through vibration
monitoring of rotating equipment, performance monitoring, more frequent inspections, new equipment
designs or revision of operating procedures. Thorough failure data analysis may also provide a solid
foundation for further analysis of parameters such as the MTTR and the total cost associated with a
failure. However, it is essential to stress the fact that any failure analysis is only as good as the quality
and quantity of the gathered data. Uncertain data will most likely result in uncertain results.
This failure data can be obtained from various sources. The division of failure data sources, as men-
tioned in Section 4.2.2.1, comprise end-user maintenance records, industry databases, reliability stan-
dards, handbooks, manufacturer data, documented reliability studies, expert opinions and published pa-
pers (Houtermans and Capelle, 2007). Houtermans and Capelle (2007) state that ”the most preferred
data is always the data from the plant itself”. The failure behaviour and rate of an asset or component are
dependent on, amongst others, environmental parameters, its operational use and the company’s mainte-
nance strategy. As the data used in this thesis comes from incident reports, it was undoubtedly the most
81

Chapter 6. Discussion
relevant and appropriate to use in the analyses conducted in this thesis.
There is, however, a few downsides with the incident reports and the failure data they provide. The
incident reports are of varying quality, and several of the incident reports are either lacking important
information, or the descriptions of the incidents and their possible causes, as well as what was done to
fix the failures, are undetailed or of poor quality. This is further discussed in Section 6.4. Moreover,
when considering the data quantity, it should be noted that the quantity of failure data collected from the
incident reports are somewhat limited. The incident reports are collected from twelve ships, spanning
over approximately 6.5 years. Hence, the reports cover a period of 78 ship years, i.e. the total operational
lifetime of three or four ships.
Nevertheless, the data used in this thesis is, as mentioned above, the most relevant for the conducted
analyses. Despite its somewhat limited extent in quantity, it should contribute to indicate as to whether
Klaveness should equip the HFO purifiers in their fleet with vibration monitoring equipment. This is one
of the main questions, as stated in the objectives of this thesis. The results may also help Klaveness in
optimizing the maintenance of these purifiers, primarily concerning the overall maintenance strategy.
6.2 Failure Modes, Effects and Criticality Analysis
The first questions stated in the objectives, Section 1.2, asked what failure modes were the ones with
the highest probability of occurrence and severity of consequences, and additionally, how can these
be detected. As mentioned earlier, the severity of consequences was assessed both for the next level
and global effects. A review of the probability of occurrence for the different components and sub-
components are presented, followed by a discussion of the severities of consequences.
6.2.1 Probability of Occurrence
As discussed previously, the data used in this thesis for assessing the probability of occurrence is the
most relevant and appropriate; however, somewhat limited in extent. It is of great importance to be
aware of the limited amount of data used to assess failure rates in this thesis and how this can affect the
reliability predictions. The accuracy of failure rate estimations and reliability predictions is dependent
on the amount of data available. The more data available, the more accurate the calculation will be.
With such a small amount of data, as was available for the analyses in this thesis, the final results may
give a false sense of confidence. The outcome of the analyses and calculations may also be a result of
coincidences and the possibility of underreporting of failures. However, since the data used to calculate
failure rates in this thesis are Klaveness’ field data from twelve ships and 78 ship years, the estimates are
deemed reasonable and believed to give a fair indication.
When assessing the severity of consequences, the probability of occurrence is mainly concerning fail-
ures on subsystem level (component column in the FMECA). This was done based on the limited data
available and due to the difficulty of obtaining relevant and applicable failure data on failure mode and
sub-component level from other sources. However, the probability of occurrence when considering the
82

6.2 Failure Modes, Effects and Criticality Analysis
electrical motor, inlet and outlet, is on sub-component level. For the electrical motor, bearing failures
constitute six out of nine failures. Therefore, the likelihood of failure on the bearings is separated from
failures on the other sub-components of the electrical motor. For the inlet and outlet, leakage of the
solenoid valve constitute most of the recorded failures and is therefore separated from failures on pipes
and hoses.
The probability of occurrence is further discussed in Section 6.2.2.
6.2.2 Consequences of Next Level and Global Effects
The next level effects are those that occur when one purifier breaks down. When looking at the FMECA
worksheet in Appendix D, it can be seen that the likelihood of failure for the components and sub-
components are in category 2 or 3, meaning that they are either not expected to happen or expected to
occur once or so within the lifetime of a vessel. The components and sub-components that are most
likely to fail, i.e. category 3, is the power transmission system, the solenoid valve, the separator bowl,
controllers and sensors, and bearings and shafts in general.
Looking at the FMECA and the summary of the incident report analysis in Appendix D, it can be seen
that these component and sub-component failures are those that could have been detected by vibration
monitoring. Going back to Table 5.1, it is seen that these components constitute more than 60% of the
total failures. For these subsystems and sub-components, the severity of a possible failure concerning
safety is also low. It is considered to be in category 1, i.e. ”no or superficial injuries”, for all of these
components. However, the consequences to downtime and cost are considerably higher, being given
severity of 3 both for downtime and cost. This means a downtime between 1-10 days and a considerable
cost impact requiring expensive spares or logistics (2,000 USD cost 20,000 USD), respectively. These
relatively high consequences related to downtime and costs indicate that there exists a great potential for
installing vibration monitoring on this equipment.
The most severe consequences, however, are related to leakages in the system, as this might result in fires
and explosions. These leakages can occur in pipes, hoses, solenoid valves and the separator bowl. If this
were going to happen, the severity related to safety, downtime and cost would be worse than for failures
of the power transmission system, electrical motor or an unbalanced separator bowl. It was assumed
that a fire in the HFO purifier room would not spread further to differentiate between the severity of
consequences related to the next level and global effects. The severity is given a score of 4 for all the
consequence categories, implying single fatality or permanent disability, a downtime between 10-60
days, and a major cost impact (20,000 - 200,000 [USD]).
Failures related to electronic equipment such as controllers and sensors are also likely to occur once or
so within the lifetime of a vessel. Nor can these be detected by vibration monitoring. The severity of
consequences with respect to downtime and cost is within category 3 for both downtime and cost.
The global effects are those that occur when both purifiers break down at the same time, or that the
83

Chapter 6. Discussion
standby purifier breaks down while the other is being repaired. A fire spreading to other parts of the ship
than the purifier or machinery space is also a global effect. Compared to the probability of one purifier
breaking down, the probability of the entire HFO purifier system breaking down is much smaller. From
Table 5.1, the MTBF of one purifier was estimated to be approximately 1.8 years. The MTBF for the
system, however, is more than 60 times longer. This MTBF depends on the average time it takes to
repair one purifier. As can be seen from Table 5.5, the MTBF is approximately 36,587 years and 113
years, for a mean corrective maintenance time of 1 hour and two weeks, respectively. In the FMECA,
the probability of leakages resulting in a fire is, however, assumed to be the same both when looking at
the next level and global effects.
As can be seen from the FMECA, the most severe consequences are related to failures on components
that vibration monitoring is not capable of detecting. As with the consequences of next level effects, these
are also related to failures involving leakages. However, the consequences of a fire spreading to other
parts of the ship are considered to be even more severe than a fire only within the purifier or machinery
space. The severity is given a score of 5, which means it will result in multiple fatalities, downtime
of more than 60 days and costs exceeding 200,000 USD. To detect these failures, other methods must
be used. In the case of leakages from the solenoid valves, these could be detected by inspections with
ultrasound equipment. Other alternatives are, of course, more frequent and thorough visual and internal
inspections. Any other leakages can also be detected by visual and internal inspection. Additionally,
performance monitoring may be a possible solution.
If one look at the failures not involving leakages or that is results of electronic equipment, vibration
monitoring is very likely or likely to detect these. The severity of consequences of these are low when it
comes to safety; however, they are high when considering the possible downtime and costs. It is assumed
that the downtime is similar regardless of the number of purifiers breaking down - the downtime would
not be longer than the time it takes to repair one of them. The cost associated with a failure of the system
is at least twice as high as for the breakdown of one purifier. The breakdown of both purifiers would also
cause delays, which will have a significant impact on the costs.
To summarize, the most critical failures concerning safety, downtime and cost, cannot be detected by
vibration monitoring. To avoid these failures, other measures are needed. Nevertheless, more than 60%
of the occurred failures could most likely have been detected by vibration monitoring. These failures
can in the worst case lead to downtime of up to two months, depending on the number of purifiers that
are out of operation, the severity of the failures and whether spare parts are readily available onboard.
A breakdown of one purifier will result in a downtime of at least one day. As mentioned in Section
4.1.2, the cost of spares associated with the breakdown of one purifier is in the range 1,000-5,000 USD.
When taking into account the cost of labour hours (onboard, procurement, ship management), freight
forwarding, handling in port and agent costs, it is reasonable to assume that the actual cost usually will
exceed 5,000 USD.
An example can illustrate the potential savings of implementing vibration monitoring. Looking at the
84

6.3 Incident Analysis
summary of the results from the incident report analysis, see Table 5.6, it can be seen that 50% or more
of the incidents could have been detected by vibration monitoring. As given in Table 5.1, the MTBF of
one purifier is 1.8 years. If one considers a fleet consisting of as many ships as Klaveness operate, which
is close to 135, these would together experience 135/1.8 = 75 purifier failures per year. If half of these
could be avoided with vibration monitoring, and one estimate that an average of 30% of these failures
are of such severity that the cost exceeds 5,000 USD, one would avoid at least (75/2) ·0.3 = 11.25 ≈ 11
such failure every year, thus saving a minimum of 55,000 USD per year.
6.3 Incident Analysis
The second question stated in the objectives, Section 1.2, asked what kind of information that could be
extracted from the incident reports regarding HFO purifiers in the Klaveness fleet, and whether any of
these incidents could have been detected by vibration monitoring.
As presented in Section 4.2.2, the reports were systematically reviewed and structured in a Microsoft
Excel worksheet. The information that can be directly extracted from the reports is given in Figure 4.5.
Further, the information considered most interesting and important for further analysis was extracted
from reports, see Appendix D.
A discussion of the different histograms presented in Section 5.2 is presented below:
6.3.1 Failure Categories
Only three different failure categories were encountered in the incident report analysis: nonconformity,
near accident and suggestion for improvement. As stated in Section 5.2, the one incident labelled ”Sug-
gestion for Improvement” could have been labelled as a nonconformity instead.
Most of the incidents, 32 of 38, were categorised as nonconformities, i.e. non-fulfilment of requirements.
Since there is one category for near accident-incidents and one for suggestions for improvement, those
categorised as nonconformities contain everything between, including any accidents. When considering
failure categories, the fact that half of the nonconformities, and half of the incidents in total, were very
likely or likely to have been detected by vibration monitoring indicates that it might be a right decision
to install vibration monitoring equipment on the HFO purifiers.
What is perhaps most interesting here is that 3 of 5 incidents that were near accidents could be revealed
by vibration monitoring. However, the incident descriptions reveal that most of these describe material
damage to the equipment involved. How the incident potentially could have resulted in an accident is not
described. Most of those incidents could, therefore, also have been categorised as nonconformities.
The reports were further analysed as the failure categories alone do not provide much information about
the incidents.
85
Chapter 6. Discussion
6.3.2 Equipment Failures
The 38 analysed incident reports described failures on a total of 59 sub-components. Among these, 56%,
or 33 sub-components, were either very likely or likely to have been detected by vibration monitoring.
If all the failures on electronic equipment (controller, sensors and water monitoring system) and any
leakages (i.e. pipes, hoses, sensor block and valves), which cannot be detected by vibration monitoring,
are discarded, this number increases to 79%.
Among the top five sub-components that fail most often, constituting 60% of the failures, more than 70%
of these failures could most likely have been detected by vibration monitoring. These are also among the
sub-components with the most costly spares. Failures on the sensor block are among the top five failing
sub-components that could not be detected by vibration monitoring. These failures could, however, have
been detected by ultrasound inspection.
Based on the results of the distribution of equipment failures, a fleet-wide installation of vibration moni-
toring equipment seems to be a right and correct decision.
6.3.3 Main Component Failures
When looking at the distribution of incident, or failures, on a higher level, it can be seen that more than
half, 52%, of the incidents most likely would have been detected by vibration monitoring. If we also
here discard the incidents related to electronic equipment and those involving leakages, which cannot be
detected by vibration monitoring, the number of main component failures that most likely could have
been detected increases to 82%. As with the distribution of failures on sub-components, this indicates
that a fleet-wide installation of VM equipment on HFO purifiers is likely to be beneficial.
6.3.4 Immediate and Root Causes
If the underlying causes are considered, instead of looking at failure categories or failure of components
and sub-components, it can be seen that VM would have most likely detected 50% of the incidents.
One interesting takeout in the distribution of immediate causes is that 5 out of 7 incidents resulting from
”failure to follow repair/maintenance instructions” could have been revealed by VM. As mentioned in
Section 1.1, it is not uncommon that faults are introduced to a system during disassembly and mainte-
nance, causing failures shortly after. Therefore, it would be beneficial if such failures could be prevented
by vibration monitoring.
When considering the distribution of root causes, there is an overweight of incidents caused by ”excessive
wear and tear”. As discussed later on, in Section 6.4, this category is rather unclear and ambiguous. If
one takes a closer look at the incident reports, see Appendix D, it can be seen that the distribution of
excessive wear and tear-caused incidents with respect to main components resembles the distribution
of main component failures. Ergo, more than 60% of incidents caused by excessive wear and tear are
86

6.4 Incident Reports
related to either the power transmission, the electrical motor or separator bowl, of which more than 8 out
of 10 were very likely or likely to have been detected by VM.
6.4 Incident Reports
Accidents and incidents onboard a ship can result in economic losses, environmental damage, injuries to
personnel or even fatalities, further leading to loss of reputation. Therefore, prevention and reducing the
number of incidents are of vital importance to all ship owners and operators. Proper incident investigation
and analysis is essential to identify weaknesses in a system or a company’s maintenance programme.
This will aid in providing insight into how the system or maintenance programme can be improved to
prevent recurrence of similar incidents in the future. The final step of the investigation is to write a report.
The incident reports should be looked upon as a valuable resource, and according to Sutton (2014), ”the
importance of writing a good report cannot be overemphasised”.
Having reviewed and analysed all the incident reports, there are several aspects of the reports that the
author believes could have been improved for Klaveness to benefit even more from them in the future.
This includes both the report template and how those responsible for documenting the incident writes the
reports.
When analysing event reports, as done in this thesis, it is desirable to quickly understand what type of
incident it is, its criticality, and which equipment is involved, at least at a higher level. This makes it easier
to categorise the events for further analysis and is especially important for complex assets comprising a
wide range of different machinery and equipment, such as ships. In Klaveness, this information is given
in the summary part of each report, as depicted in Figure 4.4 and that can be seen in the example report
in Appendix C.
In the 42 incident reports analysed in this thesis, the incident category and importance was given for
all incidents. However, the SFI code was given in only six out of ten reports. SFI is an international
classification system for the maritime and offshore industry, and provides a functional subdivision of
technical and financial information of a ship or rig. The reason why just above half of the analysed
reports have stated this is unknown to the author. The SFI code should be included in every incident
report to ease the process of categorising incidents by, for example, equipment or machinery in the
future. A suggestion would be to make this field in the incident mandatory, thus preventing completion
of the report before this is determined.
Another field in the analysed reports that often lacked information was ”event type”. This field is a part
of the ”improvement report” section of the reports. The event types are only mentioned in less than two
out of ten reports. These event types were either ”machinery breakdown” or ”property damaged”. For
each of these reports, one could argue that either two of these event types would have been suitable based
on their incident description. Since less than twenty per cent of the reports stated the event type, this field
does seem superfluous. However, it may be of interest to categorise incidents based on the event type.
This presupposes, of course, that this field is completed in each report and that one can choose between
87

Chapter 6. Discussion
several events that make it possible actually to differentiate the incidents. As with the abovementioned
SFI codes, it may be an idea to make also this field mandatory.
Furthermore, when reading through the ”Improvement report” part of the incidents, see Figure 4.4, it
is inevitable to notice that several of the reports are poorly written. Common to many is a lack of
comprehensive descriptions, often combined with poor language and grammar, which make the analysis
of the reports more difficult and time-consuming than necessary.
Among the first fields to be filled out in this section is a description of the incident. One thing that
was common in the event descriptions is that they often included an explanation of the ”Immediate” and
”Corrective” action taken, fields that are described later on as well. It appears to be uncertainty about
what type of information should be included in each of these three fields. Not only does this make the
analysis process more cumbersome, but it also makes it harder for maintenance personnel to effectively
use past incident reports to correct similar errors or failures if they occur in the future. Ideally, the
incident description and explanation of actions taken should be as detailed and descriptive as possible.
That way, the reports can potentially serve as a guide for how to fix reoccurring problems, as well as a
helpful tool in future incident investigations. Based on the analysed reports, a suggestion would be to
merge the two fields ”Immediate action” and ”Corrective action” into one input field, as only one of them
is used in each of the analysed reports. It will most likely be more straightforward for the person writing
the report to have to deal only with one entry, as well as it would potentially make future reports more
consistent content-wise.
Moreover, there also seem to be uncertainty about the difference between the entries describing ”Pro-
posed preventive” and ”Proposed corrective” action, two entries of paramount importance. It is impera-
tive to carefully consider and describe in detail what could have been changed or done differently when
an incident has occurred. Only then can the same events be prevented from happening again in the future.
The definition of preventive and corrective action can be found in most ISO standards, e.g. in ISO 9001,
The International Standard for Quality Management Systems (QMS):
• Preventive action: action to eliminate the cause of a detected non-conformity or other undesirable
situation.
• Corrective action: action to eliminate the cause of a potential non-conformity or other undesirable
situation.
As can be seen from the two definitions, preventive actions are proactive, taken to prevent incidents from
ever occurring. This could, for example, be risk assessments, e.g. FMECAs, the development of work
instructions, training of personnel and other regular preventive actions such as audits and inspections.
Corrective actions, on the other hand, are reactive, taken to prevent the recurrence of incidents. These
are typically product or event focused. Examples of corrective actions are root cause analysis, process or
product redesign, and improvements to maintenance schedules or spare part stock management.
The Cambridge Dictionary defines ”preventive” as ”intended to stop something before it happens”. Based
88

6.4 Incident Reports
on this definition, it is understandable that most of the incident reports, approximately 70%, have de-
scribed preventive actions instead of corrective actions, used in approximately 15% of the reports. ”Cor-
rective” is defined as ”intended to improve a situation” in the Cambridge Dictionary. Nevertheless,
whether either one is used most likely depends on the report writer’s interpretation of the two expres-
sions. As with the abovementioned ”Immediate” and ”Corrective” actions, it may also here be beneficial
to merge the two entries. One could opt for one of them or name it, for instance, ”Proposed improvement
actions” or something similar.
Another essential part of the incident reports is the consequence description. It is beneficial that it is
detailed and describes the damage potential of the incident if no action is taken. By explaining the
severity of possible consequences, it is easier to highlight the most critical incidents. Otherwise, the
incidents may not receive sufficient attention and resources to fix the problem, or they may, in the worst
case, be ignored. The consequence description should not only be concerning machinery damage, as
is the case with several of the analysed reports, but also describe any consequences related to safety,
environment, system availability and possible compliance breach resulting in loss of reputation. The risk
matrix used in this thesis could be a useful tool to help describe the consequences.
The final part of the incident report is the ”Analysis”, describing immediate causes, root causes and
control actions needed. As mentioned earlier, also this is a crucial part of the report, especially the
identification of the root cause. Pinpointing the exact cause and location of the failure is necessary to fix
the underlying problems and help prevent the same from happening in the future. Else, the maintenance
personnel may perform a quick fix instead, which may increase downtime in the long run.
Even though nine out of ten incident reports stated the immediate and root cause, it is a potential problem
that some of the most used cause categories are somewhat unclear, thus not providing much information
about the actual cause of the incidents. For instance, more than half of the reports described the root
cause of the incidents as a result of ”excessive wear and tear”, which could cover many different causes
to failure. This category is slightly ambiguous and unclear and does not provide much information
about the underlying causes of the incidents. In the reports, there is an opportunity to add any additional
remarks to elaborate the immediate and root cause; however, this was seldom used. Adding such remarks
should be emphasised among the maintenance personnel.
To conclude, there are several aspects of the incident reports that could be improved for Klaveness to
benefit even more from them in the future. This applies to both the structure and the actual content of the
report, i.e. what is being written. For the first part of the incident reports, the summary section, there is
a lack of description of what equipment is involved, with only six out of ten reports stating the SFI code.
The titles of the reports may give an indication; however, these are not suitable to use for categorisation.
Another common problem is that the event type is only given in two out of ten reports. If it is desirable to
sort incident reports based on either the equipment or event type, it should be considered to make these
entries mandatory, thus preventing completion of the report before this is written.
Furthermore, several of the reports are poorly written. Many are incomplete and lack comprehensive
89

Chapter 6. Discussion
incident descriptions and explanations of improvement actions, both preventive and corrective, and con-
sequences if no action is taken. This is often combined with poor language and grammar, which make
the analysis work increasingly more difficult and time-consuming.
It is also possible that the incident report template contains too many entries, some of which could be
merged. It should be considered to merge the ”Immediate action” and ”Corrective action” entries into
one, as it is evident that there is uncertainty about which one should be used. The same is proposed
for the ”Proposed preventive action” and ”Proposed corrective action”, which can advantageously be
combined into for example ”Proposed improvement actions”. Having fewer entries will not only cause
less confusion and make it easier to write incident reports, but it will also contribute to making future
incident reports more consistent.
Moreover, describing the immediate and root causes in more detail by adding additional remarks should
be emphasised. However, writing a good incident report may sometimes be challenging. In addition to
the abovementioned suggestions, other measures that should be considered to increase the overall quality
of the incident reports are training in writing incident reports, and have examples of good incident reports
readily available for the maintenance personnel. The latter could also be an integrated part of the tool
used to write the reports. It could, for instance, be readily available by clicking a button next to the
input field, or the input field could by default contain an example of how it can be written. This is often
referred to as placeholder text.
Finally, it would be of great interest and value if the incident reports included the repair times associated
with the failures. Together with the cost of spares, this would make it easier to assess the total cost
of failure. This is important to accurately measure the effectiveness, or return on investment, of the
maintenance programme or strategy.
90

Chapter 7Conclusion
The overall objective of this thesis was to assess whether it would be beneficial for Klaveness to equip
HFO purifiers with vibration monitoring equipment onboard their ships in a fleet-wide installation. In
line with the research questions formulated, this thesis has analysed and determined the failures with
the highest probabilities of occurrence and severity of consequences and described how these could be
detected. The FMECA methodology was utilised for this purpose. Furthermore, several incident reports
regarding HFO purifiers in the Klaveness fleet was analysed to determine what kind of information
can be extracted from them and whether any of these incidents could have been detected by vibration
monitoring. The analyses were carried out in parallel.
Due to a somewhat limited amount of incident reports with a detailed description of root causes, com-
bined with the difficulty of obtaining relevant and applicable reliability data on failure mode level, the
probability of occurrence was determined for the subsystems and their components instead. See Section
4.1.1 for a description of the subsystems and their sub-components.
The subsystem failing most frequently, constituting 14 out of the 44 analysed failures, is the power
transmission system with an MTTF of 5.5 years, followed by the inlet and outlet system and electronic
equipment (controllers and sensors), each with an MTTF of 9.7 years.
Considering failures on sub-component level, bearings and bearing housings fail most often, with an
MTTF of 7.1 years. Then follows shafts, the solenoid valve (i.e. sensor block), the drive belt and
separator bowl, each with an MTTF of 12.9 years. For a complete list of estimated failure rates for
subsystems and components, see Table 5.1-5.5.
When looking at the severity of consequences, it can be seen that the most critical failures are those re-
sulting in leakages in the system, potentially leading to fire or explosions with the possibility of spreading
to other parts of the ship. A worst case scenario will result in multiple fatalities, downtime of more than
two months and extraordinary costs incurred. However, vibration monitoring is not capable of detect-
ing leakages. Other measures must be taken to reveal leakages. These measures could, for instance, be
91
Chapter 7. Conclusion
more frequent and thorough visual and internal inspections, and inspections with ultrasound equipment
to reveal leaking valves.
The failures that could have been detected by vibration monitoring are mainly those related to the power
transmission system, the electrical motor and unbalance of the separator bowl, which constitutes more
than 60% of the total failures analysed. When looking at the distribution of failures of subsystems, it can
be seen that more than half, 52%, of these most likely would have been detected by vibration monitoring.
This number increase to 82% if failures related to electronic equipment and those involving leakages,
which cannot be detected by vibration monitoring, are discarded. Going down one level, considering the
different sub-components, 56% of the failures were either very likely or likely to have been detected by
vibration monitoring. Also here, if incidents related to electronic equipment and leakages are discarded,
this number increases to 79%. It is referred to Table 5.6 for a summary of the failures that could have
been detected by VM for failure categories, subsystems, sub-components, immediate and root causes.
The thesis has shown that the most critical failures concerning the severity of consequences cannot be
detected by VM. However, those failures that could potentially have been detected constitute more than
half of the failures analysed. Among these, approximately 80% were either very likely or likely to have
been detected. Furthermore, the top five sub-components that fail most often constitute 60% of the total
number of failures, whereas 70% of these would most likely also have been detected by VM.
Based on the results of the distribution of failures, the author believes that a fleet-wide installation of
vibration monitoring equipment of the HFO purifiers is a good and correct decision.
92

Chapter 8Further Work and Recommendations
The information and data behind the results and conclusions are based on experiences and field data col-
lected by Klaveness, information from the purifier manufacturer, discussions with providers of condition
monitoring equipment, and relevant literature within the topic. It should be emphasised that the analyses
may contain minor errors. Before a final decision is taken, some recommendations to further work are
given.
First, due to the somewhat limited amount of data available, it would be beneficial to include incidents
and failures regarding similar types of machinery, equipment and components onboard the ships. Increas-
ing the amount of relevant data would increase the quality of the reliability estimations and bring further
confidence to the final results. Secondly, it would be of interest to analyse the system reliability more
thoroughly, for instance, by Monte Carlo simulations or Markov analysis. Furthermore, a life-cycle cost
(LCC) analysis should be carried out to determine whether a fleet-wide installation of VM equipment on
HFO purifiers is a cost-effective method to prevent failures.
Since an FMECA has already been conducted, it is also recommended that an analysis based on the
Reliability Centered Maintenance (RCM) method (Moubray, 1997) is conducted, as this is usually based
on the information obtained in an FMECA. RCM is a common method for identifying the most suitable
maintenance type and frequency for various equipment. Such an analysis would help determine whether
the current maintenance strategy is cost-optimal, or whether, and how, it could be more efficient.
Moreover, due to the severity of the most critical failures discovered in the FMECA, these should be
further investigated, for example, by fault tree analysis (FTA) or event tree analysis (ETA). Following
that, suitable measures for the prevention and detection of these should be assessed.
Finally, for Klaveness to benefit even more from the incident reports in the future, the recommendations
discussed in Section 6.4 should be considered. These recommendations apply to both the structure and
content of the reports.
93

[This page intentionally left blank]
94

Bibliography
Ahmad, R. and Kamaruddin, S. (2012). An overview of time-based and condition-based maintenance in
industrial application. Computers & Industrial Engineering, 63(1):135–149.
Alfa Laval (2018a). Separator manual - High speed separator P 615.
Alfa Laval (2018b). The Alfa Laval Adaptive Fuel Line.
Ashby, D. M. (2005). Diagnosing common causes of sealing failures. Chemical Engineering, 112(6):41–
45.
Babicz, J. (2008). Wartsila encyclopedia of ship technology. Baobab Naval Consultancy.
Barszcz, T. (2019). Vibration-Based Condition Monitoring of Wind Turbines. Springer.
Bell, R., Heising, C., O’donnell, P., Singh, C., and Wells, S. (1985). Report of large motor reliability
survey of industrial and commercial installations. ii. IEEE Transactions on Industry applications,
21(4):865–872.
Bellias, M. (2017). The evolution of maintenance. [Accessed 4 September 2018].
Blanchard, B. S., Verma, D. C., and Peterson, E. L. (1995). Maintainability: a key to effective service-
ability and maintenance management, volume 13. John Wiley & Sons.
Bloch, Heinz P. ; Geitner, F. K. (2012). Machinery Failure Analysis and Troubleshooting: Practical
Machinery Management for Process Plants, volume 2. Elsevier Science, 4 edition.
Bloch, H. P. and Budris, A. R. (2014). Pump user’s handbook: life extension. Fairmont Press.
Bloch, H. P. and Geitner, F. K. (1997). Practical Machinery Management for Process Plants: Volume 2:
Machinery Failure Analysis and Troubleshooting. Elsevier.
Bonnett, A. H. (2000). Root cause ac motor failure analysis with a focus on shaft failures. IEEE
transactions on industry applications, 36(5):1435–1448.
Braun, S. et al. (1986). Mechanical signature analysis: theory and applications.
95
BIBLIOGRAPHY
Brooks, C. and Choudhury, A. (1993). Fracture mechanisms and microfractographic features. Metallur-
gical Failure Analysis; McGraw-Hill: New York, NY, USA, pages 119–211.
Brown, D. (1985). Machine-condition monitoring using vibration analysis: a case study from a nuclear
power-plant. Bruel & Kjaer application notes, (209):12.
Campos, J. (2009). Development in the application of ict in condition monitoring and maintenance.
Computers in industry, 60(1):1–20.
Carnero, M. C. (2005). Selection of diagnostic techniques and instrumentation in a predictive mainte-
nance program. a case study. Decision support systems, 38(4):539–555.
Cicek, K., Turan, H. H., Topcu, Y. I., and Searslan, M. N. (2010). Risk-based preventive maintenance
planning using failure mode and effect analysis (fmea) for marine engine systems. In 2010 Second
International Conference on Engineering System Management and Applications, pages 1–6. IEEE.
Dhillon, B. (1989). Life cycle costing: techniques, models and applications. Routledge.
DNV GL (2014). The future of shipping.
DNV GL (2017). Creating Value from Data in Shipping - Practical Guide.
DNV GL (2019a). DNV GL rules for classification: Ships (RU-SHIP), Part 7 Fleet in service, Ch.1
Survey requirements for fleet in service. .
DNV GL (2019b). DNV GL rolls out remote surveys for all vessels. [Accessed 5 June 2019].
Dudley, B., Morris, S., and Feduccia, A. (1993). The rome laboratory reliability engineer’s toolkit.
El Saddik, A. (2018). Digital twins: the convergence of multimedia technologies. IEEE MultiMedia,
25(2):87–92.
Faturachman, D., Mustafa, S., Octaviany, F., and Novita, T. D. (2014). Failure mode and effects analysis
of diesel engine for ship navigation system improvement. International Journal of Service Science,
Management and Engineering, 1(1):6–16.
Gates Corporation (2014). Check Your Drive Before You Wreck Your Drive. [Accessed 4 June 2019].
Hadi, S., Priharanto, and Latief (2018). Failure mode and effect analysis (fmea) applied for risk assess-
ment of fuel oil system on diesel engine of fishing vessel.
Hameed, Z., Hong, Y., Cho, Y., Ahn, S., and Song, C. (2009). Condition monitoring and fault detection of
wind turbines and related algorithms: A review. Renewable and Sustainable energy reviews, 13(1):1–
39.
Henriksen, S. (2015). Sier nei til beaching av skip. [Accessed 19 September 2018].
Higgs, P. A., Parkin, R., Jackson, M., Al-Habaibeh, A., Zorriassatine, F., and Coy, J. (2004). A survey on
96

BIBLIOGRAPHY
condition monitoring systems in industry. In ASME 7th Biennial Conference on Engineering Systems
Design and Analysis, pages 163–178. American Society of Mechanical Engineers.
Houtermans, M. and Capelle, T. V. (2007). Reliability engineering & data collection. In Proceedings of
the Second International Conference on Systems, page 42. IEEE Computer Society.
IEEE (2016). IEEE 352-2016 - Guide for General Principles of Reliability Analysis of Nuclear Power
Generating Station Systems and Other Nuclear Facilities. 2016.
Inmarsat (2019). Global Xpress. [Accessed 8 April 2019].
Instrument, S. (2016). Maersk Line installs SPM online condition monitoring on container ships. [Ac-
cessed 23 April 2019].
International Maritime Organization (2010). International safety management code (ISM code) and
guidelines on the implementation of the ISM code. London: International Maritime Organization.
JA1011, S. (1999). Evaluation criteria for reliability-centered maintenance (rcm) processes. Society for
Automotive Engineers.
Jacobsen, N. H. (2016). Application of rcm principles to identify barriers in design of unmanned engine
rooms for oceangoing merchant vessels. Master’s thesis, NTNU.
Jardine, A. K., Lin, D., and Banjevic, D. (2006). A review on machinery diagnostics and prognostics
implementing condition-based maintenance. Mechanical systems and signal processing, 20(7):1483–
1510.
Knutsen, K., Manno, G., and Vartdal, B. (2014). Beyond condition monitoring in the maritime industry.
DNV GL Strategic Research & Inovation Position Paper.
Lazakis, I., Dikis, K., Michala, A. L., and Theotokatos, G. (2016). Advanced ship systems condition
monitoring for enhanced inspection, maintenance and decision making in ship operations. Trans-
portation Research Procedia, 14:1679–1688.
Linton, E. M. (2011). Coast guard reliability-centered maintenance. Naval Engineers Journal,
123(1):25–30.
Lipsith, G. (2019). Smarter than human? How AI is revolutionising maintenance. [Accessed 22 April
2019].
Lukat, R. (2015). Understanding Pressure Sensor Failure and Reliability. [Accessed 5 June 2019].
MARINTEK (2016). Possible hazards for engines and fuel systems using heavy fuel oil in cold climate.
2016.
MarketsandMarkets Research Private Ltd. (2018). Machine condition monitoring market, by product (vi-
bration monitoring, thermography, ultrasound emission, lubricating oil analysis, corrosion monitoring,
97
BIBLIOGRAPHY
and motor current signature analysis), component, application, and geography — global forecast to
2024. 2018.
McHatton, D. (2017). How to turn equipment breakdown into golden opportunities. [Accessed 30 May
2019].
Military, U. (1949). Procedures for performing a failure mode, effects and criticality analysis, united
states military procedure mil-p-1629. 1949.
Mobley, R. K. (2002). An introduction to predictive maintenance. Elsevier.
Mokashi, A., Wang, J., and Vermar, A. (2002). A study of reliability-centred maintenance in maritime
operations. Marine Policy, 26(5):325–335.
Moubray, J. (1997). Reliability-centered maintenance. Industrial Press Inc.
Naval Surface Warfare Center (2012). Handbook of reliability prediction procedures for mechanical
equipment. Carderock Division, Naval Surface Warfare Center.
NEK (2018). NEK IEC 60812:2018 - Failure modes and effects analysis (FMEA and FMECA). 2018.
Nowlan, F. S. and Heap, H. F. (1978). Reliability-centered maintenance. Technical report, United Air
Lines Inc San Francisco Ca.
O’Donnell, P. (1985). Report of large motor reliability survey of industrial and commercial installations.
i. IEEE Transactions on Industry Applications, 21(4):853–864.
O’Donnell, P., Heising, C., Singh, C., and Wells, S. (1987). Report of large motor reliability survey of
industrial and commercial installations. iii. IEEE Transactions on Industry Applications, 23(1):153–
158.
Oil Companies International Marine Forum (2019). About TMSA. [Accessed 20 May 2019].
Orhan, S., Akturk, N., and Celik, V. (2006). Vibration monitoring for defect diagnosis of rolling ele-
ment bearings as a predictive maintenance tool: Comprehensive case studies. Ndt & E International,
39(4):293–298.
Randall, R. B. (2011). Vibration-based condition monitoring: industrial, aerospace and automotive
applications. John Wiley & Sons.
Rausand, M. and Høyland, A. (2004). System reliability theory: models, statistical methods, and appli-
cations, volume 396. John Wiley & Sons.
Raut, S. P. and Raut, L. P. (2014). A review of various techniques used for shaft failure analysis. Inter-
national Journal of Engineering Research and General Science, 2(2):2091–2730.
Renwick, J. T. and Babson, P. E. (1985). Vibration analysis—a proven technique as a predictive mainte-
nance tool. IEEE Transactions on Industry Applications, (2):324–332.
98

BIBLIOGRAPHY
Sachs, N. (1993). Failure analysis of mechanical components. Maintenance Technology, 6(9):28–33.
Scheffer, C. and Girdhar, P. (2004). Practical machinery vibration analysis and predictive maintenance.
Elsevier.
Selvik, J. T. and Aven, T. (2011). A framework for reliability and risk centered maintenance. Reliability
Engineering & System Safety, 96(2):324–331.
Shiklo, B. (2018). A Digital Twin Approach to Predictive Maintenance. [Accessed 22 April 2019].
Shin, J.-H. and Jun, H.-B. (2015). On condition based maintenance policy. Journal of Computational
Design and Engineering, 2(2):119–127.
Shorten, D. (2012). Marine machinery condition monitoring. why has the shipping industry been slow
to adopt. TECHNICAL INVESTIGATIONS DEPARTMENT (ed.). Lloyd’s Register EMEA, United
Kingdom.
Sundberg, A. and Ab, S. (2003). Management aspects on condition based maintenance–the new opportu-
nity for maritime industry. In Proceedings of the 9th international conference on marine engineering
systems.
Sutton, I. (2014). Process risk and reliability management. Gulf Professional Publishing.
Tam, A., Chan, W., and Price, J. (2006). Optimal maintenance intervals for a multi-component system.
Production Planning and Control, 17(8):769–779.
Tameson (2019). Solenoid valve troubleshooting: the most common failure modes. [Accessed 5 June
2019].
Thorsen, O. V. and Dalva, M. (1994). A survey of faults on induction motors in offshore oil indus-
try, petrochemical industry, gas terminals and oil refineries. In Proceedings of IEEE Petroleum and
Chemical Industry Technical Conference (PCIC’94), pages 1–9. IEEE.
Van Horenbeek, A., Bure, J., Cattrysse, D., Pintelon, L., and Vansteenwegen, P. (2013). Joint mainte-
nance and inventory optimization systems: A review. International Journal of Production Economics,
143(2):499–508.
Versicherungs-AG, A. (1978). Handbook of loss prevention. Springer.
Wabakken, I. (2015). Application of rcm to construct a maintenance program for a maritime vessel.
Master’s thesis, NTNU.
Wingrove, M. (2018). Five technologies to transform vessel maintenance. [Accessed 22 April 2019].
WNS (2019a). Top 3 Trends in Shipping and Logistics. [Accessed 15 April 2019].
WNS (2019b). Shipping and Logistics - Ocean Shipping Industry. [Accessed 15 April 2019].
99

[This page intentionally left blank]
100

Appendix AHFO Purifier System P&ID
P&ID Fuel Oil Purifying System
See next page.
101


Appendix BCondition Monitoring Pilot
List of Monitored Components
See next page.
103

Chapter B. Condition Monitoring Pilot
Figure B.1: List of monitored components in Klaveness’ CM pilot project.
104

Appendix CIncident Report
Incident Report Example
See the two subsequent pages.
105

MemoPrinted: 09.05.2019
HFO Separator Leakage 07.10.2018
Origin: Balao ID: BALO395
Category: Non Conformity, Balao
Ref.No.:
SFI:
Importance:
Cause:
4362 HEAVY FUEL OIL PURIFIER
Needs correction
Breakdown
Responsible:
Prewarning: 06.11.2018 Executed: 22.11.2018Deadline: 05.01.2019
Sections
22.11.2018 10.26.34Karl Uno Holm (kuh)
23.10.2018 12.53.01Anette Jacobsen (aja)
Improvement Report
Incident date 05.10.2018
Subject Engine room equipment / spares / maintenance
Department Engine
Description On 05.10.2018 In port of Melbourne, on checking routine in engineroom, duty engineer found on HFO purifier in service fuel oilaround. Purifier was immediately stopped. After isolate fuel andcleaning around we start to investigate problem. Was found thatleakage was coming from inside Sensor Block from one Solenoidvalve from discharge line. Also we noted that some leakage wascoming from flexible hose from discharge line.
Personal Injury or Material Damage Material damage
Corrective Action Solenoid valve vas replaced with one valve new witch was spare onboad and flexible hose was taken from another HFO purifier in standby.
Proposed preventive action Solenoid valves and hose are working on high termperatore andneed to inspected more oftern, also for flexible hoses IN-OUT noneed to be in tension when are in operation.
Consequence if no corrective/preventive action When engine room is unattended, we can have fuel oil spill in engineroom.
Immediate cause
Select from list Defective equipment, machinery or tools
Remarks (optional) Leakage was minor and purifier was not given alarm for low pressuredischarge.
Page 1 of 2K-Fleet Experience 4.1.58.8935

Root cause
Select from list Excessive wear and tear
Remarks (optional)
Control action needed
Select from list Other (Add remark below)
Remarks (optional) Spare parts need to be ordered and stored.
Page 2 of 2K-Fleet Experience 4.1.58.8935

Chapter C. Incident Report
Risk Matrix
Figure C.1: Risk Matrix.
108

Appendix DResults
FMECA Worksheet, Next Level Effects
The FMECA worksheet considering the consequences of next level effects can be seen in the subsequent
four pages.
109

Com
pone
ntFu
nctio
nSu
b-co
mpo
nent
Failu
re m
ode
Failu
re c
ause
or m
echa
nism
Det
ectio
n of
failu
reLo
cal e
ffec
tN
ext l
evel
eff
ect
Hid
den/
evid
ent
Prob
abili
ty o
f occ
urre
nce
Safe
tyD
ownt
ime
Cost
Impr
oper
ope
ratin
g te
nsio
nIn
stal
latio
n er
ror
Vibr
atio
n m
onito
ring
Exce
ssiv
e vi
brat
ions
and
ev
entu
al b
elt f
ailu
rePu
lley/
shea
ve m
isal
ignm
ent
Inst
alla
tion
erro
rBe
lt cr
acki
ng a
nd e
vent
ual f
ailu
re
Wor
n pu
lley/
shea
veIn
corr
ect t
ensi
onRa
pid
wea
r rat
e on
bel
t
Fore
ign
obje
cts i
n be
lt dr
ive
asse
mbl
yO
pera
ting
envi
ronm
ent
Belt
wea
r and
eve
ntua
l fai
lure
Belt
slip
Insu
ffici
ent t
ensi
onVi
brat
ion
mon
itorin
g, in
tern
al
insp
ectio
n, li
sten
ing
Exce
ssiv
e w
ear o
n be
lt
Belt
fatig
ueEx
cess
ive
tens
ions
Brok
en b
elt
Chem
ical
con
tam
inat
ion
Ope
ratin
g en
viro
nmen
tBe
lt w
ear a
nd e
vent
ual f
ailu
re
Bow
l spi
ndle
Vibr
atio
n m
onito
ring
Dam
aged
or b
roke
n sp
indl
eH
FO p
urifi
er n
ot o
pera
tiona
l, no
st
and-
by in
cas
e of
em
erge
ncy
Evid
ent
Wor
n fle
ele
men
t or
shaf
t bus
hing
sEx
cess
ive
shaf
t mis
alig
nmen
tVi
brat
ion
mon
itorin
g, in
tern
al
insp
ectio
nRu
ptur
ed e
last
omer
ic
flexi
ng e
lem
ent,
shea
red
hub
pins
or t
eeth
Tors
iona
l sho
ck o
verlo
adVi
brat
ion
mon
itorin
g, in
tern
al
insp
ectio
n
Fatig
ue o
f fle
ele
men
t, hu
b pi
ns, o
r disc
sEx
cess
ive
star
ts a
nd s
tops
, to
rsio
nal v
ibra
tion
Vibr
atio
n m
onito
ring,
inte
rnal
in
spec
tion
Shaf
t bea
ring
failu
reLu
bric
ant f
ailu
re, e
xces
sive
shaf
t m
isal
ignm
ent,
oper
atio
nal
tem
pera
ture
ext
rem
es
Vibr
atio
n m
onito
ring,
inte
rnal
in
spec
tion
Loos
e hu
bs o
n sh
aft
Tors
iona
l sho
ck o
verlo
ad, h
igh
peak
-to-
peak
tors
iona
l ove
rload
Vibr
atio
n m
onito
ring,
inte
rnal
in
spec
tion
Wor
n ge
ar te
eth
Lubr
icat
ion
failu
re, h
igh
peak
-to-
peak
ove
rload
Vibr
atio
n m
onito
ring,
inte
rnal
in
spec
tion
High
pitc
hed
ham
mer
ing
or
clac
king
noi
seEx
cess
ive
shaf
t mis
alig
nmen
t, lo
ose
hubs
or b
olt c
onne
ctio
ns,
lubr
ican
t fai
lure
Vibr
atio
n m
onito
ring,
list
enin
g
Swol
len,
dis
tort
ed, o
r cr
acke
d el
asto
mer
ic fl
exin
g m
embe
r, se
vere
hub
co
rros
ion
Chem
ical
att
ack,
exc
essiv
e he
atVi
brat
ion
mon
itorin
g, in
tern
al
insp
ectio
n
Roto
rSh
eare
d ar
mat
ure
shaf
t, cr
acke
d ro
tor l
amin
atio
nsFa
tigue
, mis
alig
nmen
t, be
arin
g fa
ilure
Perf
orm
ance
mon
itorin
g,
inte
rnal
insp
ectio
nSe
ized
, arm
atur
e ru
bbin
g st
ator
HFO
pur
ifier
not
ope
ratio
nal,
no
stan
d-by
in c
ase
of e
mer
genc
yEv
iden
tL
(2)
L (2
,1)
M (2
,3)
M (2
,3)
Wor
n be
arin
g Ex
cess
ive
stat
ic lo
ad, b
elt
mis
alig
nmen
t, fr
eque
nt s
tart
s an
d st
ops
unde
r hea
vy lo
ads,
lu
bric
atio
n pr
oble
m,
cont
amin
atio
n, o
verlo
adin
g or
hi
gh te
mpe
ratu
re
Vibr
atio
n m
onito
ring,
inte
rnal
in
spec
tion
Noi
sy, h
eat b
uild
up, a
rmat
ure
rubb
ing
stat
or, m
otor
sei
zed
Evid
ent
Bear
ing
failu
reSh
aft m
isalig
nmen
t, in
corr
ect
coup
ling,
bel
t misa
lignm
ent,
inco
rrec
t bel
t ten
sion
, wor
n be
arin
g
Vibr
atio
n m
onito
ring,
inte
rnal
in
spec
tion
Noi
sy o
pera
tion,
mot
or fa
ilure
Evid
ent
Win
ding
sO
pen/
shor
ted
win
ding
Insu
latio
n br
eakd
own,
hig
h am
bien
t tem
pera
ture
, hig
h al
titud
e, m
echa
nica
l ove
rload
, fr
eque
nt s
tops
and
sta
rts,
dirt
bu
ildup
on
cool
ing
fins,
vi
brat
ion,
mec
hani
cal s
choc
k
Perf
orm
ance
mon
itorin
g,
inte
rnal
insp
ectio
nM
otor
won
't st
art,
mot
or fa
ilure
, sp
arki
ng a
t bru
shes
HFO
pur
ifier
not
ope
ratio
nal,
no
stan
d-by
in c
ase
of e
mer
genc
y
Evid
ent
Brus
hes
Wor
n br
ushe
s (fa
il to
ope
n)Im
prop
er m
aint
enan
ce,
cont
amin
atio
n, h
igh
tem
pera
ture
, im
prop
er c
onta
ct
pres
sure
Perf
orm
ance
mon
itorin
g,
liste
ning
Exce
ssiv
e sp
arki
ng, c
hatt
er o
r hi
ssin
g no
ise, m
otor
runs
too
fast
or t
oo s
low
und
er lo
ad,
mot
or w
on't
run
HFO
pur
ifier
not
ope
ratio
nal,
no
stan
d-by
in c
ase
of e
mer
genc
yEv
iden
t
Shaf
tVi
brat
ion
mon
itorin
gSe
e "S
haft
s" u
nder
"G
ener
al".
H
FO p
urifi
er n
ot o
pera
tiona
l, no
st
and-
by in
cas
e of
em
erge
ncy
Crac
ked
hous
ing
Fatig
ue, e
xter
nal s
hock
, vib
ratio
nVi
brat
ion
mon
itorin
g, v
isua
l in
spec
tion
Leak
age
of d
ust i
nto
mot
or,
shor
ted
or s
eize
dEv
iden
t
Noi
sy o
pera
tion
Wor
n or
ben
t sha
ft, s
haft
al
ignm
ent,
mec
hani
cal v
ibra
tion,
ba
se p
late
dist
ortio
n, b
roke
n m
otor
mou
nts
Vibr
atio
n m
onito
ring,
list
enin
gHe
at b
uild
up
Evid
ent
Mot
or o
verh
eatin
gFr
eque
nt s
tart
s, in
corr
ect s
uppl
y vo
ltage
, hig
h am
bien
t te
mpe
ratu
re, p
olyp
hase
vol
tage
un
bala
nce
>1%
, mot
or o
verlo
ad,
bloc
ked
vent
ilatio
n
Ther
mog
raph
y, in
tern
al
insp
ectio
nSh
ort m
otor
life
, mot
or fa
ilure
Evid
ent
Ove
rload
trip
ping
Inco
rrec
t sup
ply
volta
ge,
exce
ssiv
e lo
ad s
peed
Alar
m fu
nctio
n, p
erfo
rman
ce
mon
itorin
g, fu
nctio
nal t
est
Mot
or w
on't
star
tEv
iden
t
L (3
,1)
M (3
,3)
M (3
,3)
L (3
)
L (2
,1)
M (2
,3)
M (3
,3)
L (3
,1)
M (3
,3)
Oth
er
HFO
pur
ifier
not
ope
ratio
nal,
no
stan
d-by
in c
ase
of e
mer
genc
y
M (2
,3)
L (2
)
Elec
tric
al m
otor
Driv
e th
e se
para
tor v
ia
a be
lt po
wer
tr
ansm
issio
nBe
arin
gs
HFO
pur
ifier
not
ope
ratio
nal,
no
stan
d-by
in c
ase
of e
mer
genc
yL
(3)
HFO
pur
ifier
not
ope
ratio
nal,
no
stan
d-by
in c
ase
of e
mer
genc
yEv
iden
t
Vibr
atio
n m
onito
ring,
inte
rnal
in
spec
tion
Vibr
atio
n m
onito
ring,
inte
rnal
in
spec
tion
See
com
pone
nt "
Shaf
ts"
See
"Sha
fts"
und
er "
Gen
eral
".
Des
crip
tion
of fa
ilure
Effe
ct o
f fai
lure
Cons
eque
nces
Pow
er tr
ansm
issio
nTr
ansm
issio
n of
pow
er
betw
een
elec
tric
al
mot
or a
nd s
epar
ator
Belt
HFO
pur
ifier
not
ope
ratio
nal,
no
stan
d-by
in c
ase
of e
mer
genc
yEv
iden
t
Fric
tion
coup
ling
Dam
aged
or b
roke
n fr
ictio
n co
uplin
g

Dam
aged
con
nect
orCo
rros
ion,
impr
oper
torq
ue o
n fit
ting,
gas
ket f
ailu
reG
radu
al in
crea
se in
sys
tem
le
akag
e, fi
re a
nd e
xplo
sion
Bu
rst f
ailu
reRa
pidl
y ap
plie
d lo
ad, p
ress
ure
tran
sien
tsCa
tast
roph
ic p
ipe
asse
mbl
y fa
ilure
, fire
and
exp
losi
on h
azar
dBu
cklin
g fa
ilure
Insu
ffici
ent p
ipin
g su
ppor
tsIm
med
iate
leak
age
abov
e sy
stem
requ
irem
ents
, fire
and
ex
plos
ion
haza
rdBe
ndin
g fa
ilure
Bend
radi
us le
ss th
an a
llow
able
Imm
edia
te le
akag
e ab
ove
syst
em re
quire
men
ts, f
ire a
nd
expl
osio
n ha
zard
Crac
k in
rigi
d pi
peEx
tern
al s
tres
sSy
stem
leak
age,
fire
and
ex
plos
ion
haza
rdLe
akag
eCh
emic
al a
ttac
k/im
prop
er
thre
ad s
eala
ntG
radu
al in
crea
se in
sys
tem
le
akag
e, f
ire a
nd e
xplo
sion
ha
zard
Fatig
ue fa
ilure
Wat
er h
amm
er fr
om u
pstr
eam
co
mpo
nent
Syst
em fl
uid
leak
age,
fire
and
ex
plos
ion
haza
rdEx
cess
ive
fluid
tem
pera
ture
High
flui
d te
mpe
ratu
re c
ause
d by
exc
essiv
e flo
w v
eloc
ityTh
erm
ogra
phy
Prem
atur
e ho
se fa
ilure
, fir
e an
d ex
plos
ion
haza
rdFr
actu
red
hose
Exce
ssiv
ely
smal
l ben
d ra
dius
, ho
se b
end
imm
edia
tely
beh
ind
the
coup
ling
Visu
al in
spec
tion,
per
form
ance
m
onito
ring
Redu
ced
abili
ty to
with
stan
d in
tern
al p
ress
ure,
fire
and
ex
plos
ion
haza
rdHo
se le
akag
eCo
ntin
uous
exp
osur
e to
hig
h te
mpe
ratu
re, c
hem
ical
de
terio
ratio
n
Visu
al in
spec
tion,
per
form
ance
m
onito
ring
Loss
of h
ose
flexi
bilit
y, f
ire a
nd
expl
osio
n ha
zard
Inne
r tub
e fa
ilure
Inad
equa
te c
ompa
tibili
ty w
ith
fluid
Perf
orm
ance
mon
itorin
g,
inte
rnal
insp
ectio
nEv
entu
al h
ose
failu
re,
fire
and
expl
osio
n ha
zard
Hidd
en
Leak
age
Dirt
par
ticle
s (c
uttin
gs/r
ust/
sand
) on
the
valv
e se
at o
r in
orifi
ces
Visu
al a
nd in
tern
al in
spec
tion
Impr
oper
flow
, gra
dual
incr
ease
in
sys
tem
leak
age,
fire
and
ex
plos
ion
haza
rdEv
iden
t
Dam
aged
sea
lD
amag
ed o
r wor
n m
embr
anes
, se
als
and
O-r
ings
Visu
al a
nd in
tern
al in
spec
tion
Impr
oper
flow
, the
val
ve d
oes
not s
hut o
ff or
leak
s, f
ire a
nd
expl
osio
n ha
zard
Evid
ent
Not
ope
ning
/clo
sing
co
rrec
tlyBa
d po
wer
sup
ply
(inco
rrec
t vo
ltage
and
freq
uenc
y) o
r co
nnec
tions
, flo
w d
irect
ion
does
no
t mat
ch w
ith in
dica
tors
on
the
valv
e, p
ress
ure
are
outs
ide
the
spec
ified
lim
its, d
amag
ed o
r bu
rnt o
ut c
oil
Perf
orm
ance
mon
itorin
g, a
larm
fu
nctio
nN
o/w
rong
fuel
out
put/
disc
harg
eTh
e H
FO p
urifi
er is
inop
erat
ive,
no
sta
nd-b
y in
cas
e of
em
erge
ncy.
A n
ot p
rope
rly
func
tioni
ng p
urifi
er m
ight
cau
se
dam
age
to m
ain
mac
hine
ry.
Hidd
enL
(3,1
)M
(3,3
)M
(3,4
)
Leak
age
Poor
sea
ling
betw
een
bow
l hoo
d se
al ri
ng a
nd th
e ed
ge o
f the
sl
idin
g bo
wl b
otto
m
Visu
al in
spec
tion,
inte
rnal
in
spec
tion,
per
form
ance
m
onito
ring
Syst
em le
akag
e, f
ire a
nd
expl
osio
n ha
zard
The
HFO
pur
ifier
is in
oper
ativ
e,
no s
tand
-by
in c
ase
of
emer
genc
y. L
eaka
ge m
ight
in
wor
st c
ase
resu
lt in
fire
and
ex
plos
ion.
Evid
ent
M (3
,4)
M (3
,4)
M (3
,4)
Clog
ged
bow
l, bl
ocka
geBa
d qu
ality
of b
unke
red
HFO
(c
onta
min
ated
)Pe
rfor
man
ce m
onito
ring,
in
tern
al in
spec
tion,
ala
rm
func
tion
HFO
pur
ifier
not
wor
king
Evid
ent
Unb
alan
ced
bow
lU
neve
n se
dim
ent a
ccum
ulat
ion
in b
owl,
insu
ffici
ent p
ress
ure
in
the
disc
sta
ck
Vibr
atio
n m
onito
ring
Abno
rmal
vib
ratio
n, to
o hi
gh
stre
ss o
n bo
wl a
nd b
earin
g (s
hort
ened
life
)Ev
iden
t
M (3
,4)
M (2
,4)
M (2
,4)
L (3
,1)
M (3
,3)
M (3
,3)
M (2
,4)
M (3
,4)
M (3
,4)
HFO
pur
ifier
not
ope
ratio
nal,
no
stan
d-by
in c
ase
of e
mer
genc
y
Sepa
rato
r bow
lSe
para
te w
ater
, fo
reig
n m
atte
r and
sl
udge
from
HFO
by
cent
rifug
al fo
rce
Gen
eral
L (3
)
Sole
noid
val
ve (s
enso
r bl
ock)
The
HFO
pur
ifier
is in
oper
ativ
e,
no s
tand
-by
in c
ase
of
emer
genc
y. L
eaka
ge m
ight
in
wor
st c
ase
resu
lt in
fire
and
ex
plos
ion.
L (3
)
L (2
)
Evid
ent
Hose
The
HFO
pur
ifier
is in
oper
ativ
e,
no s
tand
-by
in c
ase
of
emer
genc
y. L
eaka
ge m
ight
in
wor
st c
ase
resu
lt in
fire
and
ex
plos
ion.
Evid
ent
Inle
t and
out
let,
fram
eFe
ed u
ntre
ated
oil
to
and
disc
harg
e tr
eate
d oi
l fro
m th
e se
para
tor
bow
l
Pipe
(inl
et/o
utle
t)
Visu
al in
spec
tion,
per
form
ance
m
onito
ring
The
HFO
pur
ifier
is in
oper
ativ
e,
no s
tand
-by
in c
ase
of
emer
genc
y. L
eaka
ge m
ay in
w
orst
cas
e re
sult
in fi
re a
nd
expl
osio
n.

Inco
rrec
t set
tings
Alte
red
sett
ings
bec
ause
of
hum
an e
rror
HFO
pur
ifier
not
func
tioni
ng
prop
erly
Mal
func
tioni
ngPr
oble
m w
ith m
ain
circ
uit b
oard
or
ele
ctro
nic
mod
ule
Cont
rolle
r is n
ot o
pera
tiona
l
Inco
rrec
t sig
nal f
rom
se
nsor
ele
men
tRe
duce
d si
gnal
leve
l, im
peda
nce
mis
mat
ch, A
/D c
onve
rsio
n er
ror
Pote
ntia
l pro
cess
ing
erro
rHi
dden
Loss
of s
igna
l fro
m s
enso
r el
emen
tCh
ip fa
ilure
, cor
rode
d se
nsor
Loss
of s
igna
l to
proc
esso
r
Com
plet
e lo
ss o
f sig
nal i
n tr
ansm
issio
n lin
eBr
oken
or d
iscon
nect
ed w
ireLo
ss o
f sig
nal t
o pr
oces
sor
Sign
al e
rror
in tr
ansm
issio
n lin
ePo
wer
line
inte
rfer
ence
Pote
ntia
l pro
cess
ing
erro
r
Inco
rrec
t sig
nal i
n co
mpu
tatio
n de
vice
Erro
r in
algo
rithm
Proc
essi
ng e
rror
Pow
er s
uppl
y lo
ss o
f vo
ltage
Pow
er s
uppl
y m
alfu
nctio
nLo
ss o
f sig
nal t
o pr
oces
sor
Evid
ent
Impr
oper
resp
onse
to
info
rmat
ion
reci
pien
tIn
corr
ect i
nter
pret
atio
n, s
yste
m
mal
func
tion,
err
or in
alg
orith
mPo
tent
ial s
yste
m m
alfu
nctio
n
Calib
ratio
n er
ror
Soft
war
e er
ror,
erro
r in
algo
rithm
Pote
ntia
l sys
tem
mal
func
tion
Batt
ery
ener
gy d
eple
tion
Batt
ery
mal
func
tion
Loss
of s
igna
l to
proc
esso
r
Fatig
ue d
amag
eMecha
nism
: Sp
allin
g of
race
way
, br
inel
ling,
sm
earin
g. Cau
se:
Heav
y, p
rolo
nged
load
, exc
essiv
e sp
eed,
sho
ck lo
ad, e
xces
sive
vibr
atio
nN
oisy
bea
ring
Mecha
nism
: Sur
face
fatig
ue,
glaz
ing,
mic
rosp
allin
g of
str
esse
d su
rfac
es.
Ca
use
: Los
s of
lubr
ican
t, ho
usin
g bo
re o
ut o
f ro
und,
cor
rosi
ve a
gent
s,
dist
orte
d be
arin
g se
als
Bear
ing
seizu
reMecha
nism
: Cra
ck fo
rmat
ion
on
rings
and
bal
ls/ro
llers
, ski
ddin
g.
Cause
: Ina
dequ
ate
heat
rem
oval
ca
pabi
lity,
loss
of l
ubric
ant,
high
te
mpe
ratu
re, e
xces
sive
spee
d.
Bear
ing
vibr
atio
nMecha
nism
: Scu
ffing
, fre
ttin
g,
pitt
ing
of s
urfa
ces.
Cau
se:
Mis
alig
nmen
t, ho
usin
g bo
re o
ut
of ro
und,
unb
alan
ced
/ ex
cess
ive
load
, ina
dequ
ate
hous
ing
supp
ort
Pres
ence
of e
lect
ric
curr
ents
Mecha
nism
: Pits
on
race
way
s an
d ba
lls, c
orro
sion
. Cau
se:
Exte
nsiv
e pi
ttin
g of
sur
face
ca
used
by
elec
tric
cur
rent
Part
s fo
und
in s
ever
al o
f the
com
pone
nts
are
desc
ribe
d be
low
:
L (3
,1)
M (3
,3)
M (3
,3)
M (3
,3)
HFO
pur
ifier
not
ope
ratio
nal,
no
stan
d-by
in c
ase
of e
mer
genc
yEv
iden
tL
(3)
L (3
,1)
M (3
,3)
Evid
ent
Hidd
en
Hidd
en
Bear
ings
, bal
l/rol
ler
(not
el.
mot
or)
Redu
ce fr
ictio
n be
twee
n m
ovin
g co
mpo
nent
s, s
uppo
rt
load
s an
d gu
ide
com
pone
nts
turn
ing
rela
tive
to o
ne a
noth
er
N/A
Vibr
atio
n m
onito
ring,
inte
rnal
in
spec
tion
Bear
ing
wea
r and
eve
ntua
l be
arin
g fa
ilure
Sens
ors
(indi
vidu
al)
Alar
m fu
nctio
n, fu
nctio
nal t
est,
perf
orm
ance
mon
itorin
g, c
asua
l ob
serv
atio
n
Cont
rolle
r or s
enso
r err
ors
can
caus
e da
mag
e to
the
HFO
pu
rifie
r, m
akin
g it
inop
erat
ive.
N
o st
and-
by p
urifi
er in
cas
e of
em
erge
ncy
Cont
rolle
r & S
enso
rsCo
ntro
lling
and
m
onito
r the
ope
ratio
n of
the
sepa
rato
r, pe
rfor
m a
ll ne
cess
ary
alar
m fu
nctio
ns
Cont
rolle
r
Alar
m fu
nctio
n, fu
nctio
nal t
est,
casu
al o
bser
vatio
n
Cont
rolle
r or s
enso
r err
ors
can
caus
e da
mag
e to
the
HFO
pu
rifie
r, m
akin
g it
inop
erat
ive.
N
o st
and-
by p
urifi
er in
cas
e of
em
erge
ncy
Hidd
en
L (3
)

Bent
sha
ftEx
cess
ive
load
/tor
que,
impa
ct
load
s, b
earin
g fa
ilure
Asse
mbl
y vi
brat
ion,
dam
aged
be
arin
g, im
pelle
r, w
ear r
ing,
m
echa
nica
l sea
l, ge
ar b
oxEx
cess
ive
shaf
t def
lect
ion
Dyn
amic
load
on
shaf
t, re
vers
ing
load
s, c
ritic
al s
haft
spe
ed
exce
eded
, unb
alan
ced
load
Even
tual
sha
ft d
amag
e,
dam
aged
bea
ring,
impe
ller,
wea
r rin
g, m
echa
nica
l sea
l, ge
ar
Shaf
t misa
lignm
ent
Impr
oper
ass
embl
y, w
orn
bear
ings
, exc
essi
ve lo
adAs
sem
bly
vibr
atio
n, d
amag
ed
bear
ing,
impe
ller,
wea
r rin
g,
mec
hani
cal s
eal,
gear
box
Dam
aged
sur
face
fini
shCo
rros
ion,
con
tam
inan
ts,
man
ufac
turin
g pr
oces
s, th
erm
al
expa
nsio
n at
hig
h te
mpe
ratu
res
Shaf
t bea
ring
failu
re
Shaf
t fat
igue
/fra
ctur
eSt
ress
rise
r at f
illet
, str
ess
conc
entr
atio
n at
key
way
, sha
ft
radi
i cha
nges
, ben
ding
fatig
ue,
exce
ssiv
e ve
loci
ty, h
igh
torq
ue
load
Dam
aged
bea
ring,
impe
ller,
wea
r rin
g, m
echa
nica
l sea
l, ge
ar
box
Fret
ting
corr
osio
nRe
lativ
e m
ovem
ents
of t
ight
ly
fitte
d pa
rts
Surf
ace
crac
ks, e
vent
ual s
haft
fa
ilure
, bea
ring/
gear
/cou
plin
g co
rros
ion
Wea
r due
to: c
onta
min
ants
, m
isal
ignm
ent,
vibr
atio
n or
poo
r su
rfac
e fin
ish
Elas
tic d
efor
mat
ion
or
gask
et/s
eal d
isto
rtio
n du
e to
: ex
trem
e te
mpe
ratu
re,
mis
alig
nmen
t, se
al e
ccen
tric
ity,
extr
eme
load
ing/
extr
usio
n or
co
mpr
essi
on s
et/o
vert
orqu
ed
bolts
Surf
ace
dam
age
or
embr
ittle
men
t due
to:
inad
equa
te lu
bric
atio
n,
cont
amin
ants
, flu
id/s
eal
degr
adat
ion,
ther
mal
de
grad
atio
n, id
le p
erio
ds
betw
een
com
pone
nt u
se,
expo
sure
to a
tmos
pher
e/oz
one,
ex
cess
ive
tem
pera
ture
Cree
p du
e to
: flu
id p
ress
ure
surg
es, m
ater
ial d
egra
datio
n,
ther
mal
exp
ansi
on &
con
trac
tion
Com
pres
sion
set
due
to:
exce
ssiv
e sq
ueez
e to
ach
ieve
se
al, i
ncom
plet
e vu
lcan
izat
ion,
ha
rden
ing/
high
tem
pera
ture
Inst
alla
tion
dam
age
due
to:
insu
ffici
ent l
ead-
in c
ham
fer,
shar
p co
rner
s on
mat
ing
met
al
part
s, in
adeq
uate
pro
tect
ion
of
spar
es
L (2
)M
(2,4
)M
(2,4
)M
(2,4
)
M (3
,3)
Stat
ic s
eals
and
gask
ets
Join
sys
tem
s tog
ethe
r by
pre
vent
ing
leak
age,
co
ntai
n pr
essu
re, o
r ex
clud
e co
ntam
inat
ion
N/A
Leak
age
Visu
al in
spec
tion,
inte
rnal
in
spec
tion,
per
form
ance
m
onito
ring,
ala
rm fu
nctio
n
Brok
en s
eal o
r gas
ket c
ausi
ng
leak
age,
fire
and
exp
losi
on
haza
rd
The
HFO
pur
ifier
is in
oper
ativ
e,
no s
tand
-by
in c
ase
of
emer
genc
y. L
eaka
ge m
ight
in
wor
st c
ase
resu
lt in
fire
and
ex
plos
ion.
Evid
ent
Shaf
ts (n
ot e
l. m
otor
)Tr
ansm
it po
wer
be
twee
n tw
o pa
rts,
or
betw
een
a so
urce
that
pr
oduc
es p
ower
to th
e m
achi
ne a
bsor
bing
it
N/A
Vibr
atio
n m
onito
ring,
inte
rnal
in
spec
tion
HFO
pur
ifier
not
ope
ratio
nal,
no
stan
d-by
in c
ase
of e
mer
genc
yEv
iden
tL
(3)
L (3
,1)
M (3
,3)

Chapter D. Results
FMECA Worksheet, Global Effects
The FMECA worksheet considering the consequences of global effects can be seen in the subsequent
four pages.
114

Com
pone
ntFu
nctio
nSu
b-co
mpo
nent
Failu
re m
ode
Failu
re c
ause
or m
echa
nism
Det
ectio
n of
failu
reLo
cal e
ffec
tG
loba
l eff
ect
Hid
den/
evid
ent
Prob
abili
ty o
f occ
urre
nce
Safe
tyD
ownt
ime
Cost
Impr
oper
ope
ratin
g te
nsio
nIn
stal
latio
n er
ror
Vibr
atio
n m
onito
ring
Exce
ssiv
e vi
brat
ions
and
ev
entu
al b
elt f
ailu
rePu
lley/
shea
ve m
isal
ignm
ent
Inst
alla
tion
erro
rBe
lt cr
acki
ng a
nd e
vent
ual f
ailu
re
Wor
n pu
lley/
shea
veIn
corr
ect t
ensi
onRa
pid
wea
r rat
e on
bel
t
Fore
ign
obje
cts i
n be
lt dr
ive
asse
mbl
yO
pera
ting
envi
ronm
ent
Belt
wea
r and
eve
ntua
l fai
lure
Belt
slip
Insu
ffici
ent t
ensi
onVi
brat
ion
mon
itorin
g, in
tern
al
insp
ectio
n, li
sten
ing
Exce
ssiv
e w
ear o
n be
lt
Belt
fatig
ueEx
cess
ive
tens
ions
Brok
en b
elt
Chem
ical
con
tam
inat
ion
Ope
ratin
g en
viro
nmen
tBe
lt w
ear a
nd e
vent
ual f
ailu
re
Bow
l spi
ndle
Vibr
atio
n m
onito
ring
Dam
aged
or b
roke
n sp
indl
eEv
iden
t
Wor
n fle
ele
men
t or
shaf
t bus
hing
sEx
cess
ive
shaf
t mis
alig
nmen
tVi
brat
ion
mon
itorin
g, in
tern
al
insp
ectio
nRu
ptur
ed e
last
omer
ic
flexi
ng e
lem
ent,
shea
red
hub
pins
or t
eeth
Tors
iona
l sho
ck o
verlo
adVi
brat
ion
mon
itorin
g, in
tern
al
insp
ectio
n
Fatig
ue o
f fle
ele
men
t, hu
b pi
ns, o
r disc
sEx
cess
ive
star
ts a
nd s
tops
, to
rsio
nal v
ibra
tion
Vibr
atio
n m
onito
ring,
inte
rnal
in
spec
tion
Shaf
t bea
ring
failu
reLu
bric
ant f
ailu
re, e
xces
sive
shaf
t m
isal
ignm
ent,
oper
atio
nal
tem
pera
ture
ext
rem
es
Vibr
atio
n m
onito
ring,
inte
rnal
in
spec
tion
Loos
e hu
bs o
n sh
aft
Tors
iona
l sho
ck o
verlo
ad, h
igh
peak
-to-
peak
tors
iona
l ove
rload
Vibr
atio
n m
onito
ring,
inte
rnal
in
spec
tion
Wor
n ge
ar te
eth
Lubr
icat
ion
failu
re, h
igh
peak
-to-
peak
ove
rload
Vibr
atio
n m
onito
ring,
inte
rnal
in
spec
tion
Hig
h pi
tche
d ha
mm
erin
g or
cl
acki
ng n
oise
Exce
ssiv
e sh
aft m
isal
ignm
ent,
loos
e hu
bs o
r bol
t con
nect
ions
, lu
bric
ant f
ailu
re
Vibr
atio
n m
onito
ring,
list
enin
g
Swol
len,
dis
tort
ed, o
r cr
acke
d el
asto
mer
ic fl
exin
g m
embe
r, se
vere
hub
co
rros
ion
Chem
ical
att
ack,
exc
essiv
e he
atVi
brat
ion
mon
itorin
g, in
tern
al
insp
ectio
n
Roto
rSh
eare
d ar
mat
ure
shaf
t, cr
acke
d ro
tor l
amin
atio
nsFa
tigue
, mis
alig
nmen
t, be
arin
g fa
ilure
Perf
orm
ance
mon
itorin
g,
inte
rnal
insp
ectio
nSe
ized
, arm
atur
e ru
bbin
g st
ator
Evid
ent
Wor
n be
arin
g Ex
cess
ive
stat
ic lo
ad, b
elt
mis
alig
nmen
t, fr
eque
nt s
tart
s an
d st
ops
unde
r hea
vy lo
ads,
lu
bric
atio
n pr
oble
m,
cont
amin
atio
n, o
verlo
adin
g or
hi
gh te
mpe
ratu
re
Vibr
atio
n m
onito
ring,
inte
rnal
in
spec
tion
Noi
sy, h
eat b
uild
up, a
rmat
ure
rubb
ing
stat
or, m
otor
sei
zed
Evid
ent
Bear
ing
failu
reSh
aft m
isalig
nmen
t, in
corr
ect
coup
ling,
bel
t misa
lignm
ent,
inco
rrec
t bel
t ten
sion
, wor
n be
arin
g
Vibr
atio
n m
onito
ring,
inte
rnal
in
spec
tion
Noi
sy o
pera
tion,
mot
or fa
ilure
Evid
ent
Win
ding
sO
pen/
shor
ted
win
ding
Insu
latio
n br
eakd
own,
hig
h am
bien
t tem
pera
ture
, hig
h al
titud
e, m
echa
nica
l ove
rload
, fr
eque
nt s
tops
and
sta
rts,
dirt
bu
ildup
on
cool
ing
fins,
vi
brat
ion,
mec
hani
cal s
choc
k
Perf
orm
ance
mon
itorin
g,
inte
rnal
insp
ectio
nM
otor
won
't st
art,
mot
or fa
ilure
, sp
arki
ng a
t bru
shes
Evid
ent
Brus
hes
Wor
n br
ushe
s (fa
il to
ope
n)Im
prop
er m
aint
enan
ce,
cont
amin
atio
n, h
igh
tem
pera
ture
, im
prop
er c
onta
ct
pres
sure
Perf
orm
ance
mon
itorin
g,
liste
ning
Exce
ssiv
e sp
arki
ng, c
hatt
er o
r hi
ssin
g no
ise, m
otor
runs
too
fast
or t
oo s
low
und
er lo
ad,
mot
or w
on't
run
Evid
ent
Shaf
tVi
brat
ion
mon
itorin
gSe
e "S
haft
s" u
nder
"G
ener
al".
Crac
ked
hous
ing
Fatig
ue, e
xter
nal s
hock
, vib
ratio
nVi
brat
ion
mon
itorin
g, v
isua
l in
spec
tion
Leak
age
of d
ust i
nto
mot
or,
shor
ted
or s
eize
dEv
iden
t
Noi
sy o
pera
tion
Wor
n or
ben
t sha
ft, s
haft
al
ignm
ent,
mec
hani
cal v
ibra
tion,
ba
se p
late
dist
ortio
n, b
roke
n m
otor
mou
nts
Vibr
atio
n m
onito
ring,
list
enin
gH
eat b
uild
up
Evid
ent
Mot
or o
verh
eatin
gFr
eque
nt s
tart
s, in
corr
ect s
uppl
y vo
ltage
, hig
h am
bien
t te
mpe
ratu
re, p
olyp
hase
vol
tage
un
bala
nce
>1%
, mot
or o
verlo
ad,
bloc
ked
vent
ilatio
n
Ther
mog
raph
y, in
tern
al
insp
ectio
nSh
ort m
otor
life
, mot
or fa
ilure
Evid
ent
Ove
rload
trip
ping
Inco
rrec
t sup
ply
volta
ge,
exce
ssiv
e lo
ad s
peed
Alar
m fu
nctio
n, p
erfo
rman
ce
mon
itorin
g, fu
nctio
nal t
est
Mot
or w
on't
star
tEv
iden
t
L (2
)
L (2
)
Vibr
atio
n m
onito
ring,
inte
rnal
in
spec
tion
Vibr
atio
n m
onito
ring,
inte
rnal
in
spec
tion
Two
inop
erat
ive
HFO
pur
ifier
s w
ill e
vent
ually
lead
to fu
el
shor
tage
and
loss
of p
ropu
lsio
n.
L (2
,1)
M (2
,3)
M (2
,4)
L (2
,1)
M (2
,3)
M (2
,4)
Evid
ent
Evid
ent
Two
inop
erat
ive
HFO
pur
ifier
s w
ill e
vent
ually
lead
to fu
el
shor
tage
and
loss
of p
ropu
lsio
n.
Dam
aged
or b
roke
n fr
ictio
n co
uplin
g
Tran
smiss
ion
of p
ower
be
twee
n el
ectr
ical
m
otor
and
sep
arat
or
Pow
er tr
ansm
issio
n
Fric
tion
coup
ling
See
com
pone
nt "
Shaf
ts"
See
"Sha
fts"
und
er "
Gen
eral
".
Elec
tric
al m
otor
Driv
e th
e se
para
tor v
ia
a be
lt po
wer
tr
ansm
issio
nBe
arin
gs
Oth
er
Belt
Des
crip
tion
of fa
ilure
Cons
eque
nces
Effe
ct o
f fai
lure

Dam
aged
con
nect
orCo
rros
ion,
impr
oper
torq
ue o
n fit
ting,
gas
ket f
ailu
reG
radu
al in
crea
se in
sys
tem
le
akag
e, fi
re a
nd e
xplo
sion
Bu
rst f
ailu
reRa
pidl
y ap
plie
d lo
ad, p
ress
ure
tran
sien
tsCa
tast
roph
ic p
ipe
asse
mbl
y fa
ilure
, fire
and
exp
losi
on h
azar
dBu
cklin
g fa
ilure
Insu
ffici
ent p
ipin
g su
ppor
tsIm
med
iate
leak
age
abov
e sy
stem
requ
irem
ents
, fire
and
ex
plos
ion
haza
rdBe
ndin
g fa
ilure
Bend
radi
us le
ss th
an a
llow
able
Imm
edia
te le
akag
e ab
ove
syst
em re
quire
men
ts, f
ire a
nd
expl
osio
n ha
zard
Crac
k in
rigi
d pi
peEx
tern
al s
tres
sSy
stem
leak
age,
fire
and
ex
plos
ion
haza
rdLe
akag
eCh
emic
al a
ttac
k/im
prop
er
thre
ad s
eala
ntG
radu
al in
crea
se in
sys
tem
le
akag
e, f
ire a
nd e
xplo
sion
ha
zard
Fatig
ue fa
ilure
Wat
er h
amm
er fr
om u
pstr
eam
co
mpo
nent
Syst
em fl
uid
leak
age,
fire
and
ex
plos
ion
haza
rdEx
cess
ive
fluid
tem
pera
ture
Hig
h flu
id te
mpe
ratu
re c
ause
d by
exc
essiv
e flo
w v
eloc
ityTh
erm
ogra
phy
Prem
atur
e ho
se fa
ilure
, fir
e an
d ex
plos
ion
haza
rdFr
actu
red
hose
Exce
ssiv
ely
smal
l ben
d ra
dius
, ho
se b
end
imm
edia
tely
beh
ind
the
coup
ling
Visu
al in
spec
tion,
per
form
ance
m
onito
ring
Redu
ced
abili
ty to
with
stan
d in
tern
al p
ress
ure,
fire
and
ex
plos
ion
haza
rdH
ose
leak
age
Cont
inuo
us e
xpos
ure
to h
igh
tem
pera
ture
, che
mic
al
dete
riora
tion
Visu
al in
spec
tion,
per
form
ance
m
onito
ring
Loss
of h
ose
flexi
bilit
y, f
ire a
nd
expl
osio
n ha
zard
Inne
r tub
e fa
ilure
Inad
equa
te c
ompa
tibili
ty w
ith
fluid
Perf
orm
ance
mon
itorin
g,
inte
rnal
insp
ectio
nEv
entu
al h
ose
failu
re,
fire
and
expl
osio
n ha
zard
Hidd
en
Leak
age
Dirt
par
ticle
s (c
uttin
gs/r
ust/
sand
) on
the
valv
e se
at o
r in
orifi
ces
Visu
al a
nd in
tern
al in
spec
tion
Impr
oper
flow
, gra
dual
incr
ease
in
sys
tem
leak
age,
fire
and
ex
plos
ion
haza
rdEv
iden
t
Dam
aged
sea
lD
amag
ed o
r wor
n m
embr
anes
, se
als
and
O-r
ings
Visu
al a
nd in
tern
al in
spec
tion
Impr
oper
flow
, the
val
ve d
oes
not s
hut o
ff or
leak
s, f
ire a
nd
expl
osio
n ha
zard
Evid
ent
Not
ope
ning
/clo
sing
co
rrec
tlyBa
d po
wer
sup
ply
(inco
rrec
t vo
ltage
and
freq
uenc
y) o
r co
nnec
tions
, flo
w d
irect
ion
does
no
t mat
ch w
ith in
dica
tors
on
the
valv
e, p
ress
ure
are
outs
ide
the
spec
ified
lim
its, d
amag
ed o
r bu
rnt o
ut c
oil
Alar
m fu
nctio
n, fu
nctio
nal t
est,
perf
orm
ance
mon
itorin
g N
o/w
rong
fuel
out
put/
disc
harg
eIm
prop
er p
urifi
catio
n m
ay c
ause
re
duce
d co
mbu
stio
n ef
ficie
ncy
or b
reak
dow
n of
fuel
pum
ps o
r th
e m
ain
engi
ne. T
wo
inop
erat
ive
HFO
pur
ifier
s will
ev
entu
ally
lead
to fu
el s
hort
age
and
loss
of p
ropu
lsio
n.
Hidd
enL
(3,1
)M
(3,3
)M
(3,4
)
Leak
age
Poor
sea
ling
betw
een
bow
l hoo
d se
al ri
ng a
nd th
e ed
ge o
f the
sl
idin
g bo
wl b
otto
m
Visu
al in
spec
tion,
inte
rnal
in
spec
tion,
per
form
ance
m
onito
ring
Syst
em le
akag
e, f
ire a
nd
expl
osio
n ha
zard
Fire
/exp
losi
ons
may
spr
ead
and
lead
to fu
rthe
r maj
or in
jurie
s or
fa
talit
ies,
eva
cuat
ion
mig
ht b
e ne
cess
ary.
Lon
g do
wnt
ime
and
maj
or/e
xtra
ordi
nary
cos
ts a
s a
resu
lt of
the
need
for m
ajor
ov
erha
ul, m
ajor
com
pone
nts,
re
trof
it or
rebu
illd
can
be
expe
cted
.
Evid
ent
L (2
)M
(2,5
)M
(2,5
)M
(2,5
)
Clog
ged
bow
l, bl
ocka
geBa
d qu
ality
of b
unke
red
HFO
(c
onta
min
ated
)Pe
rfor
man
ce m
onito
ring,
in
tern
al in
spec
tion,
ala
rm
func
tion
HFO
pur
ifier
not
wor
king
Evid
ent
Unb
alan
ced
bow
lU
neve
n se
dim
ent a
ccum
ulat
ion
in b
owl,
insu
ffici
ent p
ress
ure
in
the
disc
sta
ck
Vibr
atio
n m
onito
ring
Abno
rmal
vib
ratio
n, to
o hi
gh
stre
ss o
n bo
wl a
nd b
earin
g (s
hort
ened
life
)Ev
iden
t
L (3
)
M (3
,5)
M (3
,5)
L (3
,1)
M (3
,3)
M (3
,4)
Two
inop
erat
ive
HFO
pur
ifier
s w
ill e
vent
ually
lead
to fu
el
shor
tage
and
loss
of p
ropu
lsio
n.
L (3
)
L (2
)Fi
re/e
xplo
sion
s m
ay s
prea
d an
d le
ad to
furt
her m
ajor
inju
ries
or
fata
litie
s, e
vacu
atio
n m
ight
be
nece
ssar
y. L
ong
dow
ntim
e an
d m
ajor
/ext
raor
dina
ry c
osts
as
a re
sult
of th
e ne
ed fo
r maj
or
over
haul
, maj
or c
ompo
nent
s,
retr
ofit
or re
buill
d ca
n be
ex
pect
ed.
M (3
,5)
M (2
,5)
M (2
,5)
M (2
,5)
Evid
ent
Evid
ent
Inle
t and
out
let,
fram
eFe
ed u
ntre
ated
oil
to
and
disc
harg
e tr
eate
d oi
l fro
m th
e se
para
tor
bow
l
Visu
al in
spec
tion,
per
form
ance
m
onito
ring
Sole
noid
val
ve (s
enso
r bl
ock)
Sepa
rato
r bow
lSe
para
te w
ater
, fo
reig
n m
atte
r and
sl
udge
from
HFO
by
cent
rifug
al fo
rce
Gen
eral
Hos
e
Pipe
(inl
et/o
utle
t)
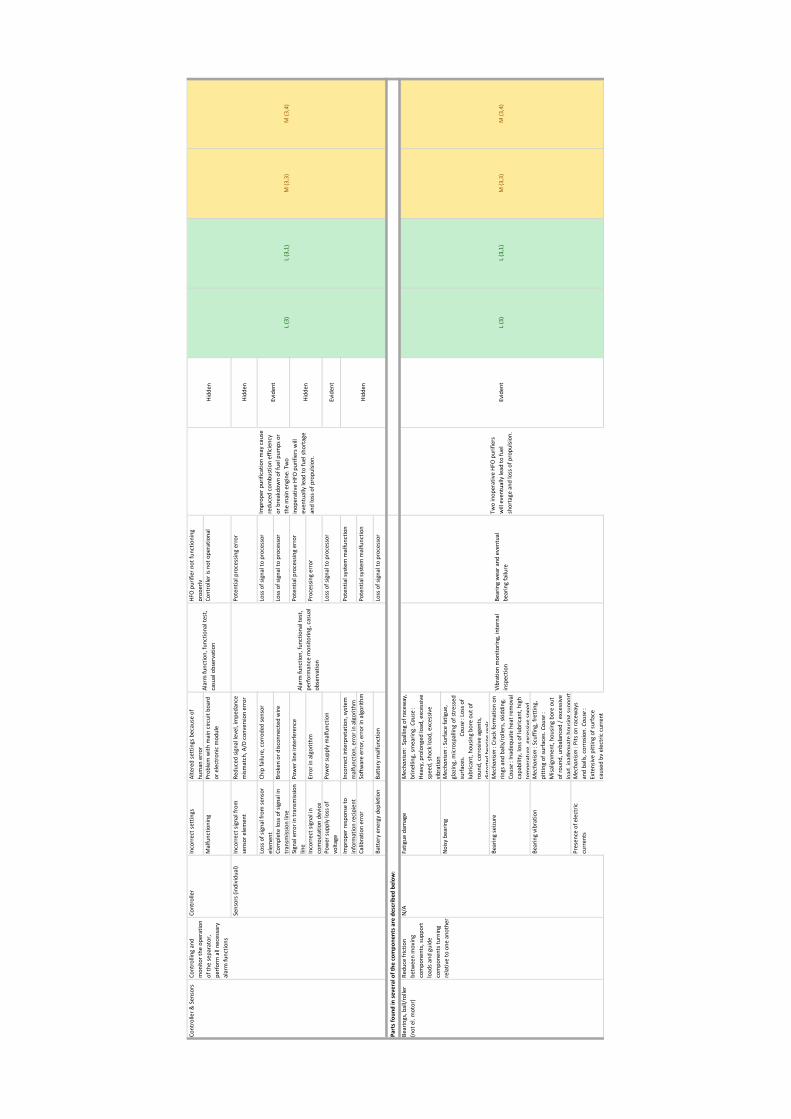
Inco
rrec
t set
tings
Alte
red
sett
ings
bec
ause
of
hum
an e
rror
HFO
pur
ifier
not
func
tioni
ng
prop
erly
Mal
func
tioni
ngPr
oble
m w
ith m
ain
circ
uit b
oard
or
ele
ctro
nic
mod
ule
Cont
rolle
r is n
ot o
pera
tiona
l
Inco
rrec
t sig
nal f
rom
se
nsor
ele
men
tRe
duce
d si
gnal
leve
l, im
peda
nce
mis
mat
ch, A
/D c
onve
rsio
n er
ror
Pote
ntia
l pro
cess
ing
erro
rHi
dden
Loss
of s
igna
l fro
m s
enso
r el
emen
tCh
ip fa
ilure
, cor
rode
d se
nsor
Loss
of s
igna
l to
proc
esso
r
Com
plet
e lo
ss o
f sig
nal i
n tr
ansm
issio
n lin
eBr
oken
or d
iscon
nect
ed w
ireLo
ss o
f sig
nal t
o pr
oces
sor
Sign
al e
rror
in tr
ansm
issio
n lin
ePo
wer
line
inte
rfer
ence
Pote
ntia
l pro
cess
ing
erro
r
Inco
rrec
t sig
nal i
n co
mpu
tatio
n de
vice
Erro
r in
algo
rithm
Proc
essi
ng e
rror
Pow
er s
uppl
y lo
ss o
f vo
ltage
Pow
er s
uppl
y m
alfu
nctio
nLo
ss o
f sig
nal t
o pr
oces
sor
Evid
ent
Impr
oper
resp
onse
to
info
rmat
ion
reci
pien
tIn
corr
ect i
nter
pret
atio
n, s
yste
m
mal
func
tion,
err
or in
alg
orith
mPo
tent
ial s
yste
m m
alfu
nctio
n
Calib
ratio
n er
ror
Soft
war
e er
ror,
erro
r in
algo
rithm
Pote
ntia
l sys
tem
mal
func
tion
Batt
ery
ener
gy d
eple
tion
Batt
ery
mal
func
tion
Loss
of s
igna
l to
proc
esso
r
Fatig
ue d
amag
eMecha
nism
: Sp
allin
g of
race
way
, br
inel
ling,
sm
earin
g. Cau
se:
Hea
vy, p
rolo
nged
load
, exc
essiv
e sp
eed,
sho
ck lo
ad, e
xces
sive
vibr
atio
nN
oisy
bea
ring
Mecha
nism
: Sur
face
fatig
ue,
glaz
ing,
mic
rosp
allin
g of
str
esse
d su
rfac
es.
Ca
use
: Los
s of
lubr
ican
t, ho
usin
g bo
re o
ut o
f ro
und,
cor
rosi
ve a
gent
s,
dist
orte
d be
arin
g se
als
Bear
ing
seizu
reMecha
nism
: Cra
ck fo
rmat
ion
on
rings
and
bal
ls/ro
llers
, ski
ddin
g.
Cause
: Ina
dequ
ate
heat
rem
oval
ca
pabi
lity,
loss
of l
ubric
ant,
high
te
mpe
ratu
re, e
xces
sive
spee
d.
Bear
ing
vibr
atio
nMecha
nism
: Scu
ffing
, fre
ttin
g,
pitt
ing
of s
urfa
ces.
Cau
se:
Mis
alig
nmen
t, ho
usin
g bo
re o
ut
of ro
und,
unb
alan
ced
/ ex
cess
ive
load
, ina
dequ
ate
hous
ing
supp
ort
Pres
ence
of e
lect
ric
curr
ents
Mecha
nism
: Pits
on
race
way
s an
d ba
lls, c
orro
sion
. Cau
se:
Exte
nsiv
e pi
ttin
g of
sur
face
ca
used
by
elec
tric
cur
rent
L (3
)L
(3,1
)M
(3,3
)M
(3,4
)
Impr
oper
pur
ifica
tion
may
cau
se
redu
ced
com
bust
ion
effic
ienc
y or
bre
akdo
wn
of fu
el p
umps
or
the
mai
n en
gine
. Tw
o in
oper
ativ
e HF
O p
urifi
ers w
ill
even
tual
ly le
ad to
fuel
sho
rtag
e an
d lo
ss o
f pro
puls
ion.
L (3
,1)
M (3
,3)
M (3
,4)
L (3
)
Evid
ent
Hidd
en
Hidd
en
Evid
ent
Hidd
en
Redu
ce fr
ictio
n be
twee
n m
ovin
g co
mpo
nent
s, s
uppo
rt
load
s an
d gu
ide
com
pone
nts
turn
ing
rela
tive
to o
ne a
noth
er
Bear
ings
, bal
l/rol
ler
(not
el.
mot
or)
Cont
rolle
r
Sens
ors
(indi
vidu
al)
Alar
m fu
nctio
n, fu
nctio
nal t
est,
casu
al o
bser
vatio
n
Alar
m fu
nctio
n, fu
nctio
nal t
est,
perf
orm
ance
mon
itorin
g, c
asua
l ob
serv
atio
n
Two
inop
erat
ive
HFO
pur
ifier
s w
ill e
vent
ually
lead
to fu
el
shor
tage
and
loss
of p
ropu
lsio
n.
Part
s fo
und
in s
ever
al o
f the
com
pone
nts
are
desc
ribe
d be
low
:
Bear
ing
wea
r and
eve
ntua
l be
arin
g fa
ilure
N/A
Vibr
atio
n m
onito
ring,
inte
rnal
in
spec
tion
Cont
rolle
r & S
enso
rsCo
ntro
lling
and
m
onito
r the
ope
ratio
n of
the
sepa
rato
r, pe
rfor
m a
ll ne
cess
ary
alar
m fu
nctio
ns

Bent
sha
ftEx
cess
ive
load
/tor
que,
impa
ct
load
s, b
earin
g fa
ilure
Asse
mbl
y vi
brat
ion,
dam
aged
be
arin
g, im
pelle
r, w
ear r
ing,
m
echa
nica
l sea
l, ge
ar b
oxEx
cess
ive
shaf
t def
lect
ion
Dyn
amic
load
on
shaf
t, re
vers
ing
load
s, c
ritic
al s
haft
spe
ed
exce
eded
, unb
alan
ced
load
Even
tual
sha
ft d
amag
e,
dam
aged
bea
ring,
impe
ller,
wea
r rin
g, m
echa
nica
l sea
l, ge
ar
Shaf
t misa
lignm
ent
Impr
oper
ass
embl
y, w
orn
bear
ings
, exc
essi
ve lo
adAs
sem
bly
vibr
atio
n, d
amag
ed
bear
ing,
impe
ller,
wea
r rin
g,
mec
hani
cal s
eal,
gear
box
Dam
aged
sur
face
fini
shCo
rros
ion,
con
tam
inan
ts,
man
ufac
turin
g pr
oces
s, th
erm
al
expa
nsio
n at
hig
h te
mpe
ratu
res
Shaf
t bea
ring
failu
re
Shaf
t fat
igue
/fra
ctur
eSt
ress
rise
r at f
illet
, str
ess
conc
entr
atio
n at
key
way
, sha
ft
radi
i cha
nges
, ben
ding
fatig
ue,
exce
ssiv
e ve
loci
ty, h
igh
torq
ue
load
Dam
aged
bea
ring,
impe
ller,
wea
r rin
g, m
echa
nica
l sea
l, ge
ar
box
Fret
ting
corr
osio
nRe
lativ
e m
ovem
ents
of t
ight
ly
fitte
d pa
rts
Surf
ace
crac
ks, e
vent
ual s
haft
fa
ilure
, bea
ring/
gear
/cou
plin
g co
rros
ion
Wea
r due
to: c
onta
min
ants
, m
isal
ignm
ent,
vibr
atio
n or
poo
r su
rfac
e fin
ish
Elas
tic d
efor
mat
ion
or
gask
et/s
eal d
isto
rtio
n du
e to
: ex
trem
e te
mpe
ratu
re,
mis
alig
nmen
t, se
al e
ccen
tric
ity,
extr
eme
load
ing/
extr
usio
n or
co
mpr
essi
on s
et/o
vert
orqu
ed
bolts
Surf
ace
dam
age
or
embr
ittle
men
t due
to:
inad
equa
te lu
bric
atio
n,
cont
amin
ants
, flu
id/s
eal
degr
adat
ion,
ther
mal
de
grad
atio
n, id
le p
erio
ds
betw
een
com
pone
nt u
se,
expo
sure
to a
tmos
pher
e/oz
one,
ex
cess
ive
tem
pera
ture
Cree
p du
e to
: flu
id p
ress
ure
surg
es, m
ater
ial d
egra
datio
n,
ther
mal
exp
ansi
on &
con
trac
tion
Com
pres
sion
set
due
to:
exce
ssiv
e sq
ueez
e to
ach
ieve
se
al, i
ncom
plet
e vu
lcan
izat
ion,
ha
rden
ing/
high
tem
pera
ture
Inst
alla
tion
dam
age
due
to:
insu
ffici
ent l
ead-
in c
ham
fer,
shar
p co
rner
s on
mat
ing
met
al
part
s, in
adeq
uate
pro
tect
ion
of
spar
es
Two
inop
erat
ive
HFO
pur
ifier
s w
ill e
vent
ually
lead
to fu
el
shor
tage
and
loss
of p
ropu
lsio
n.
Fire
may
spr
ead
and
lead
to
furt
her m
ajor
inju
ries
or
fata
litie
s, e
vacu
atio
n m
ight
be
nece
ssar
y. L
ong
dow
ntim
e an
d m
ajor
/ext
raor
dina
ry c
osts
as
a re
sult
of th
e ne
ed fo
r maj
or
over
haul
, maj
or c
ompo
nent
s,
retr
ofit
or re
buill
d ca
n be
ex
pect
ed.
M (2
,5)
M (2
,5)
M (2
,5)
L (3
,1)
M (3
,3)
M (3
,4)
L (3
)
L (2
)Ev
iden
t
Evid
ent
Brok
en s
eal o
r gas
ket c
ausi
ng
leak
age,
fire
and
exp
losi
on
haza
rd
Visu
al in
spec
tion,
inte
rnal
in
spec
tion,
per
form
ance
m
onito
ring,
ala
rm fu
nctio
n
Shaf
ts (n
ot e
l. m
otor
)
Stat
ic s
eals
and
gask
ets
N/A
Leak
age
Vibr
atio
n m
onito
ring,
inte
rnal
in
spec
tion
N/A
Tran
smit
pow
er
betw
een
two
part
s, o
r be
twee
n a
sour
ce th
at
prod
uces
pow
er to
the
mac
hine
abs
orbi
ng it
Join
sys
tem
s tog
ethe
r by
pre
vent
ing
leak
age,
co
ntai
n pr
essu
re, o
r ex
clud
e co
ntam
inat
ion

Incident Report Analysis
See next page.
119

Tit
leID
Ori
gin
Eve
nt
Dat
eC
ateg
ory
Imp
ort
ance
Eq
uip
men
t M
ain
co
mp
on
ent
Imm
edia
te c
ause
Ro
ot
cau
seD
isco
vere
d b
y V
M?
HFO
Pur
ifier
set
tings
BURD
621
MV
Bard
u19
.04.
2019
Non
Con
form
ityN
eeds
att
entio
nW
ater
Mon
itorin
g Sy
stem
Elec
tron
ic e
quip
men
tIn
corr
ect
use
of m
achi
nery
or
equi
pmen
tLa
ck o
f sk
ill/k
now
ledg
eN
ot li
kely
FO P
urifi
er N
o. 2
BURD
320
MV
Bard
u22
.08.
2016
Non
Con
form
ityN
eeds
cor
rect
ion
Driv
e be
ltPo
wer
tra
nsm
issi
onD
efec
tive
equi
pmen
t, m
achi
nery
or
tool
sIn
adeq
uate
mai
nten
ance
Very
like
ly
Clea
ning
Pur
ifier
Pla
tes
KLAV
1139
MV
Barr
y22
.11.
2013
Non
Con
form
ityN
eeds
cor
rect
ion
N/A
N/A
Neg
ligen
ce o
f sa
fety
Lack
of
skill
/kno
wle
dge
N/A
Elec
tric
mot
or b
earin
g ho
usin
gST
R-1
0KO
1H0
MV
Bana
star
12.1
0.20
12N
ear
Acci
dent
Nee
ds a
tten
tion
Bear
ing
hous
ing
(el.
mot
or)
Elec
tric
al m
otor
Def
ectiv
e eq
uipm
ent,
mac
hine
ry o
r to
ols
Exce
ssiv
e w
ear
and
tear
Like
ly
Bott
om b
earin
gVe
ry li
kely
Vert
ical
sha
ft/s
pind
leVe
ry li
kely
Bow
l Bod
ySe
para
tor
bow
lLi
kely
Burn
ed H
FO P
urifi
er E
lect
ric M
otor
ALM
A151
MV
Bang
or01
.10.
2014
Non
Con
form
ityN
eeds
cor
rect
ion
Bear
ing
(el.
mot
or)
Elec
tric
al m
otor
Def
ectiv
e eq
uipm
ent,
mac
hine
ry o
r to
ols
Exce
ssiv
e w
ear
and
tear
Very
like
ly
HFO
Pur
ifer
ALM
A367
MV
Bang
or26
.09.
2016
Non
Con
form
ityN
eeds
cor
rect
ion
Slid
ing
bow
l bot
tom
Sepa
rato
r bo
wl
Failu
re t
o fo
llow
rep
air/
mai
nten
ance
inst
ruct
ions
Lack
of
skill
/kno
wle
dge
Not
like
ly
Fric
tion
coup
ling/
bloc
k/pa
dLi
kely
Belt
pulle
yLi
kely
HFO
Pur
ifier
Bre
akdo
wn
ALM
A612
MV
Bang
or01
.09.
2018
Non
Con
form
ityN
eeds
cor
rect
ion
Bow
lSe
para
tor
bow
lBu
nker
s an
d/or
lubr
icat
ing
oils
Rec
eive
d su
bsta
ndar
d fu
elN
ot li
kely
Fric
tion
coup
ling/
bloc
k/pa
dLi
kely
Belt
pulle
yLi
kely
Sigh
t gl
ass
Not
like
ly
Vert
ical
sha
ft/s
pind
leLi
kely
Vert
ical
sha
ft s
pace
rLi
kely
Bear
ing
hous
ing
(sep
arat
or)
Like
ly
Sens
or b
lock
(so
leno
id v
alve
)In
let/
outle
tN
ot li
kely
Flex
ible
hos
e (d
isch
arge
line
)In
let/
outle
tN
ot li
kely
Cent
ripet
al p
ump
cham
ber
cove
rN
ot li
kely
Sens
ing
liqui
d pu
mp
Not
like
ly
Oil
and
wat
er c
omin
g ou
t of
the
HFO
pur
ifier
sen
sor
bloc
kBA
NA2
44M
V Ba
nak
18.0
6.20
16N
on C
onfo
rmity
Nee
ds c
orre
ctio
nSe
nsor
blo
ckIn
let/
outle
tD
efec
tive
equi
pmen
t, m
achi
nery
or
tool
sEx
cess
ive
wea
r an
d te
arN
ot li
kely
3-w
ay v
alve
(pn
eum
atic
val
ve)
Inle
t/ou
tlet
Not
like
ly
Shaf
t se
alPo
wer
tra
nsm
issi
onN
ot li
kely
0093
FO
Pur
ifier
No.
1 S
peed
Sen
sor
BAN
T45
MV
Bant
ry06
.09.
2013
Sugg
estio
n fo
r Im
prov
emen
tN
eeds
cor
rect
ion
Spee
d se
nsor
Elec
tron
ic e
quip
men
tSp
eed
sens
or f
ailu
reEx
cess
ive
wea
r an
d te
ar (
elec
tron
ic)
Not
like
ly
011
EPC
50 c
ontr
olle
r H
FO P
urifi
er N
o. 1
mal
func
tion
BAN
T201
MV
Bant
ry02
.02.
2015
Non
Con
form
ityN
eeds
cor
rect
ion
Cont
rolle
rEl
ectr
onic
equ
ipm
ent
Cont
rolle
r fa
ilure
Exce
ssiv
e w
ear
and
tear
(el
ectr
onic
)N
ot li
kely
Fire
Haz
ard
in P
urifi
er R
oom
BAN
T395
MV
Bant
ry10
.01.
2017
Nea
r Ac
cide
ntN
eeds
cor
rect
ion
N/A
N/A
Neg
ligen
ce o
f sa
fety
Lack
of
skill
/kno
wle
dge
N/A
FO P
urifi
er N
o. 2
Spe
ed S
enso
r Ca
ble
BDAL
249
MV
Bakk
edal
02.0
6.20
15N
on C
onfo
rmity
Nee
ds c
orre
ctio
nSp
eed
sens
or (
cabl
e)El
ectr
onic
equ
ipm
ent
Spee
d se
nsor
fai
lure
Lack
of
tech
nica
l aw
aren
ess.
Unp
rote
cted
cab
le w
ire in
stal
latio
n.N
ot li
kely
FO P
urifi
er S
peci
al T
ool
BDAL
257
MV
Bakk
edal
23.0
6.20
15N
on C
onfo
rmity
Nee
ds a
tten
tion
Spec
ial t
ool
Oth
erD
efec
tive
equi
pmen
t, m
achi
nery
or
tool
sLa
ck o
f sk
ill/k
now
ledg
eN
/A
FO P
urifi
er T
empe
ratu
re C
ontr
olle
r M
alfu
nctio
nBD
AL33
2M
V Ba
kked
al12
.03.
2016
Nea
r Ac
cide
ntN
eeds
cor
rect
ion
Tem
pera
ture
con
trol
ler
Elec
tron
ic e
quip
men
tH
igh
FO t
empe
ratu
re o
n fe
ed p
ump
Tem
pera
ture
con
trol
ler
failu
reN
ot li
kely
HFO
Pur
ifier
No.
2 b
reak
dow
nBD
AL33
9M
V Ba
kked
al22
.04.
2016
Non
Con
form
ityN
eeds
att
entio
nFa
n (s
haft
), v
ertic
al s
haft
/spi
ndle
, up
per
ball
bear
ing
Pow
er t
rans
mis
sion
Failu
re t
o fo
llow
rep
air/
mai
nten
ance
inst
ruct
ions
Lack
of
skill
/kno
wle
dge
Like
ly
Driv
e be
ltPo
wer
tra
nsm
issi
onVe
ry li
kely
Bow
l loc
k rin
gSe
para
tor
bow
lLi
kely
HFO
Pur
ifier
1 &
2 E
PC F
ront
Mod
ule
Trou
ble
BDAL
486
MV
Bakk
edal
28.0
6.20
17N
ear
Acci
dent
Nee
ds c
orre
ctio
nCo
ntro
ller
Elec
tron
ic e
quip
men
tD
efec
tive
equi
pmen
t, m
achi
nery
or
tool
sEx
cess
ive
wea
r an
d te
arN
ot li
kely
HFO
Pur
ifier
No.
1 W
ing
Inse
rtBI
YS29
8M
V Ba
rcar
ena
21.0
2.20
16N
on C
onfo
rmity
Nee
ds c
orre
ctio
nW
ing
inse
rtSe
para
tor
bow
lD
efec
tive
equi
pmen
t, m
achi
nery
or
tool
sEx
cess
ive
wea
r an
d te
arN
ot li
kely
Bear
ings
(el
. m
otor
)El
ectr
ical
mot
orVe
ry li
kely
Fric
tion
coup
ling/
bloc
k/pa
dLi
kely
Belt
pulle
yLi
kely
HFO
Pur
ifier
Ele
ctric
Mot
or S
haft
wor
n ou
tBI
YS53
4M
V Ba
rcar
ena
27.0
4.20
18N
on C
onfo
rmity
Nee
ds a
tten
tion
Shaf
t (e
l. m
otor
)El
ectr
ical
mot
orD
efec
tive
equi
pmen
t, m
achi
nery
or
tool
sEx
cess
ive
wea
r an
d te
arVe
ry li
kely
Brok
en
Driv
e Be
lt of
Fue
l Oil
Purif
ier
BLEA
24M
V Ba
lear
es12
.03.
2014
Non
Con
form
ityN
eeds
cor
rect
ion
Driv
e be
ltPo
wer
tra
nsm
issi
onU
nabl
e to
att
ain
requ
ired
spee
dBr
oken
driv
e be
ltVe
ry li
kely
HFO
Pur
ifier
leak
s fu
el in
sol
enoi
d va
lve
BLEA
312
MV
Bale
ares
20.0
9.20
16N
on C
onfo
rmity
Nee
ds c
orre
ctio
nSe
nsor
blo
ck (
sole
noid
val
ve)
Inle
t/ou
tlet
Def
ectiv
e eq
uipm
ent,
mac
hine
ry o
r to
ols
Exce
ssiv
e w
ear
and
tear
Not
like
ly
HFO
Pur
ifier
No.
2 B
elt
wor
n ou
tBL
EA40
3M
V Ba
lear
es04
.05.
2017
Non
Con
form
ityN
eeds
cor
rect
ion
Driv
e be
ltPo
wer
tra
nsm
issi
onD
efec
tive
equi
pmen
t, m
achi
nery
or
tool
sEx
cess
ive
wea
r an
d te
arVe
ry li
kely
Driv
e be
ltVe
ry li
kely
Vert
ical
sha
ft b
earin
gVe
ry li
kely
HFO
Pur
ifier
No.
1 S
enso
r Bl
ock
Failu
reBL
EA51
6M
V Ba
lear
es25
.09.
2018
Non
Con
form
ityN
eeds
cor
rect
ion
Sens
or b
lock
(so
leno
id v
alve
)In
let/
outle
tSo
leno
id v
alve
and
wiri
ng d
efec
tive
Exce
ssiv
e w
ear
and
tear
Not
like
ly
Sens
or b
lock
(so
leno
id v
alve
)N
ot li
kely
Pres
sure
tra
nsm
itter
Not
like
ly
HFO
Pur
ifier
No.
2 S
olen
oid
valv
e of
Sen
sor
bloc
k w
orn
out
BLSA
571
MV
Bals
a04
.08.
2017
Non
Con
form
ityN
eeds
att
entio
nSe
nsor
blo
ck (
sole
noid
val
ve)
Inle
t/ou
tlet
Def
ectiv
e eq
uipm
ent, m
achi
nery
or
tool
sEx
cess
ive
wea
r an
d te
arN
ot li
kely
HFO
Pur
ifier
No.
1BR
RY5
25M
V Ba
rry
10.0
6.20
17N
on C
onfo
rmity
Nee
ds c
orre
ctio
nCo
ntro
ller
Elec
tron
ic e
quip
men
tD
efec
tive
equi
pmen
t, m
achi
nery
or
tool
sEx
cess
ive
wea
r an
d te
arN
ot li
kely
No
Stby
HFO
Pur
ifier
and
Spe
cial
Too
ls M
issi
ngBR
RY6
13M
V Ba
rry
26.1
1.20
17N
on C
onfo
rmity
Nee
ds c
orre
ctio
nSp
ecia
l too
l O
ther
Spec
ial t
ools
mis
sing
Inad
equa
te w
ork
stan
dard
sN
/A
Bow
lSe
para
tor
bow
lN
ot li
kely
Cont
rolle
rEl
ectr
onic
equ
ipm
ent
Not
like
ly
Driv
e be
ltVe
ry li
kely
Vert
ical
sha
ft/s
pind
leVe
ry li
kely
Bow
lSe
para
tor
bow
lLi
kely
Vert
ical
sha
ft/s
pind
leVe
ry li
kely
Bear
ings
Very
like
ly
Low
er b
all b
earin
g (e
l. m
otor
)Ve
ry li
kely
Rot
or (
el. m
otor
)Ve
ry li
kely
Stat
or w
indi
ng (
el. m
otor
)Ve
ry li
kely
FO P
urifi
er E
lect
ric M
otor
BSO
L378
MV
Bana
sol
19.0
6.20
16N
on C
onfo
rmity
Nee
ds c
orre
ctio
nBe
arin
g (e
l. m
otor
)El
ectr
ical
mot
orD
efec
tive
equi
pmen
t, m
achi
nery
or
tool
sEx
cess
ive
wea
r an
d te
arVe
ry li
kely
No.
2 F
uel o
il pu
rifie
r El
ectr
ic M
otor
BSTR
236
MV
Bana
star
30.0
9.20
15N
on C
onfo
rmity
Nee
ds c
orre
ctio
nBe
arin
g (e
l. m
otor
)El
ectr
ical
mot
orD
efec
tive
equi
pmen
t, m
achi
nery
or
tool
sEx
cess
ive
wea
r an
d te
arVe
ry li
kely
Elec
tric
al m
otor
Def
ectiv
e eq
uipm
ent,
mac
hine
ry o
r to
ols
Bad
qual
ity o
f ba
ll be
arin
g#
244
FO P
urifi
er E
lect
ric M
otor
Bre
akdo
wn
BSO
L241
MV
Bana
sol
01.0
4.20
15N
on C
onfo
rmity
Nee
ds c
orre
ctio
n
Exce
ssiv
e w
ear
and
tear
HFO
Pur
ifier
No.
2 B
reak
dow
nBR
RY7
94M
V Ba
rry
28.0
1.20
19N
on C
onfo
rmity
Nee
ds a
tten
tion
Failu
re t
o fo
llow
rep
air/
mai
nten
ance
inst
ruct
ions
Exce
ssiv
e w
ear
and
tear
Pow
er t
rans
mis
sion
Failu
re t
o w
arn
Exce
ssiv
e w
ear
and
tear
HFO
Pur
ifier
No.
2BR
RY6
94M
V Ba
rry
21.0
7.20
18N
on C
onfo
rmity
Nee
ds c
orre
ctio
nPo
wer
tra
nsm
issi
onD
efec
tive
equi
pmen
t, m
achi
nery
or
tool
s
HFO
Pur
ifier
No.
1
BRRY6
90M
V Ba
rry
18.0
7.20
18N
on C
onfo
rmity
Nee
ds c
orre
ctio
n
Exce
ssiv
e w
ear
and
tear
HFO
Pur
ifier
No.
1 S
enso
r Bl
ock
Dam
aged
BLSA
568
MV
Bals
a18
.07.
2017
Non
Con
form
ityN
eeds
att
entio
nIn
let/
outle
tD
efec
tive
equi
pmen
t, m
achi
nery
or
tool
sEx
cess
ive
wea
r an
d te
ar
Pow
er t
rans
mis
sion
HFO
Pur
ifier
#1
Belt
wor
n ou
t an
d Ve
rtic
al S
haft
bea
ring
dam
age
BLEA
439
MV
Bale
ares
21.0
8.20
17N
on C
onfo
rmity
Nee
ds c
orre
ctio
nPo
wer
tra
nsm
issi
onO
ther
sub
stan
dard
con
ditio
n, o
r lu
bric
atin
g oi
ls
Lack
of
skill
/kno
wle
dge
FO. Pu
rifie
r N
o. 2
Bel
t Pu
lley
BIYS
311
MV
Barc
aren
a11
.04.
2016
Non
Con
form
ityN
eeds
cor
rect
ion
Def
ectiv
e eq
uipm
ent,
mac
hine
ry o
r to
ols
Exce
ssiv
e w
ear
and
tear
Noi
se o
r te
mpe
ratu
reEx
cess
ive
wea
r an
d te
ar
Lock
Rin
g of
HFO
Pur
ifier
in B
ad C
ondi
tion
BDAL
366
MV
Bakk
edal
27.0
9.20
16N
ear
Acci
dent
Nee
ds c
orre
ctio
nFa
ilure
to
follo
w r
epai
r/m
aint
enan
ce in
stru
ctio
ns
N/A
Failu
re t
o fo
llow
rep
air/
mai
nten
ance
inst
ruct
ions
Inad
equa
te w
ork
stan
dard
s
HFO
Pur
ifier
no.
2 le
akin
g 3-
way
pne
umat
ic v
alve
BAN
A566
MV
Bana
k01
.04.
2019
Non
Con
form
ityN
eeds
Cor
rect
ion
FO P
urifi
er N
o. 2
dam
age
part
s af
ter
mai
nten
ance
BAN
A169
MV
Bana
k01
.09.
2015
Non
Con
form
ityN
eeds
cor
rect
ion
HFO
Sep
arat
or L
eaka
geBA
LO39
5M
V Ba
lao
05.1
0.20
18N
on C
onfo
rmity
Nee
ds c
orre
ctio
nD
efec
tive
equi
pmen
t, m
achi
nery
or
tool
sEx
cess
ive
wea
r an
d te
ar
Exce
ssiv
e w
ear
and
tear
HFO
Pur
ifier
Hig
h Te
mp.
on
Cran
kcas
Oil
BALO
196
MV
Bala
o22
.03.
2016
Nea
r Ac
cide
ntN
eeds
att
entio
nPo
wer
tra
nsm
issi
onW
rong
inst
alla
tion
of p
arts
, fa
ilure
to
follo
w r
epai
r/m
aint
enan
ce in
stru
ctio
nsLa
ck o
f sk
ill/k
now
ledg
e
Def
ectiv
e eq
uipm
ent,
mac
hine
ry o
r to
ols
Exce
ssiv
e w
ear
and
tear
Wor
n O
ut B
elt
Pulle
y of
HFO
Pur
ifier
ALM
A700
MV
Bang
or01
.04.
2019
Non
Con
form
ityN
eeds
cor
rect
ion
Pow
er t
rans
mis
sion
Failu
re t
o fo
llow
rep
air/
mai
nten
ance
inst
ruct
ions
Pow
er t
rans
mis
sion
Def
ectiv
e eq
uipm
ent,
mac
hine
ry o
r to
ols
Exce
ssiv
e w
ear
and
tear
HFO
Pur
ifier
No.
2 Be
lt Pu
lley
ALM
A537
MV
Bang
or05
.10.
2017
Non
Con
form
ityN
eeds
cor
rect
ion
Pow
er t
rans
mis
sion
HFO
Pur
ifier
No.
2ST
R-1
0KU
25P
MV
Bana
star
15.1
0.20
12N
on C
onfo
rmity
Nee
ds a
tten
tion