
Development of a DSM-Based Methodology in an Academic Setting
11
George Platanitis e-mail: [email protected] Remon Pop-Iliev 1 e-mail: [email protected] Ahmad Barari e-mail: [email protected] Faculty of Engineering and Applied Science, University of Ontario Institute of Technology (UOIT), Oshawa, ON L1H 7K4, Canada Development of a DSM-Based Methodology in an Academic Setting This paper proposes the use of a design structure matrix/work transformation matrix (DSM/WTM)-based methodology in academic settings to serve engineering educators as a facilitating tool for predetermining the difficulty and feasibility of design engineering projects they assign, given both the time constraints of the academic term and the expected skill level of the respective learners. By using a third-year engineering design project as a case study, engineering students actively participated in this comprehensive use of DSM methodologies. The engineering design process has been thoroughly ana- lyzed to determine convergence characteristics based on the eigenvalues of the system followed by a sensitivity analysis on the originally determined DSM based on data pro- vided by students in terms of task durations and number of iterations for each task. Finally, an investigation of the design process convergence due to unexpected events or random disturbances has been conducted. The obtained predictive model of the design process was compared to the actual dynamics of the project as experienced by the stu- dents and the effect of random disturbances at any point in the design process has thereby been evaluated. [DOI: 10.1115/1.4005591] 1 Introduction Often, design engineering educators create their own open- ended design term project problems/topics to be assigned to stu- dents during a particular course offering within the undergraduate engineering curriculum. Normally, design projects assigned to students in a first-year course do not require a large number of tasks to be performed, making it relatively easy to plan the tasks and their order for the design process. Few steps are required, with very few tasks being coupled. Even then, with perhaps only a small number of tasks requiring iteration, these tasks can be com- pleted fairly quickly. However, this is usually not the case with many second-, third-, and fourth-year level design projects, which are more complex, are often of multidisciplinary nature, and require many tasks with complex relationships to be completed, with each coupled task relying on information from each other. Very often such tasks cannot be sequenced in an order so that one is completed after another, but rather they have to be performed concurrently. This directly affects the relative difficulty of the design engineering challenge being assigned to students. The question becomes could we quantify this level of difficulty in a meaningful way ahead of time so that we can compare and rank different projects in terms of such difficulty? There is a necessity to do so, given the time constraints of an academic term, and the expected student knowledge and skill level for the course in ques- tion. With such information, educators can assess the level of dif- ficulty and feasibility (or “doability”) of a design project, while students can use the information from the analysis to efficiently organize tasks and carry out the design while reducing the number of iterations. DSM-based methodologies have been widely used in industry to assist engineers and project managers in organizing tasks asso- ciated with product design processes where complex relationships exist, and algorithms have been developed around them to effi- ciently plan tasks by eliminating iterations or reducing the dura- tion of coupled tasks where eliminating iterations are not possible. An extension of this tool, the Work transformation matrix, defines the strength of the relationships between tasks in terms of rework probability of a task when new information becomes available. Also, it is used to evaluate the design process stability and conver- gence under various circumstances and to predict the duration of the entire design process based on estimates of the durations of individual tasks. But can this methodology be applied in an aca- demic setting? In this paper, the use of DSM methodologies in this context is examined for a third-year engineering design project assigned at UOIT, as an example, and is presented in three parts. First, using an eigenvalue and eigenvector analysis on the WTM, the stability of the design process is determined, the modes of the design itera- tion are identified, and the tasks that contribute the greatest amount of work to each mode before the design process converges to an acceptable design are determined. Second, a sensitivity anal- ysis is performed to compare the theoretically determined dynam- ics of the design process to the dynamics that were experienced by the students undertaking the project. Finally, random distur- bances of varying degrees and points of occurrence are introduced to the design process and their effect on the design process con- vergence is analyzed. 2 Background Research in the last several years has focused on methods that improve the organization of design tasks as well as to anticipate the effects of design changes in a given product design and devel- opment process. In one example, the authors demonstrated via simulation experiments that clients committing early design decision-making in conditions of uncertainty bore higher design rework risk in introducing changes to designs unless they improved their planning for unforeseen circumstances and judi- ciously instructed changes to the design team, especially where design reuse capabilities are low [1]. In another example, the authors developed the dynamic development process model (DDPM) to manage overlapped iterative product development by considering rework due to development errors and corruptions [2]. More recently, Barari and Pop-Iliev [3] extended a cost due to change model [4] to understand the role of rigidity (by defining a rigidity factor) and level of changeability of a design, that is, the total cost or difficulty of a desired change on a design project. Ag- ile manufacturing has also been incorporated in lean productions 1 Corresponding author. Contributed by the Design Automation Committee of ASME for publication in the JOURNAL OF MECHANICAL DESIGN. Manuscript received August 12, 2010; final manuscript received November 19, 2011; published online February 3, 2012. Assoc. Editor: Janis Terpenny. Journal of Mechanical Design FEBRUARY 2012, Vol. 134 / 021007-1 Copyright V C 2012 by ASME Downloaded From: http://mechanicaldesign.asmedigitalcollection.asme.org/ on 10/31/2014 Terms of Use: http://asme.org/terms
-
Upload
independent -
Category
Documents
-
view
1 -
download
0
Transcript of Development of a DSM-Based Methodology in an Academic Setting

George Platanitise-mail: [email protected]
Remon Pop-Iliev1
e-mail: [email protected]
Ahmad Bararie-mail: [email protected]
Faculty of Engineering and Applied Science,
University of Ontario
Institute of Technology (UOIT),
Oshawa, ON L1H 7K4, Canada
Development of a DSM-BasedMethodology in an AcademicSettingThis paper proposes the use of a design structure matrix/work transformation matrix(DSM/WTM)-based methodology in academic settings to serve engineering educators asa facilitating tool for predetermining the difficulty and feasibility of design engineeringprojects they assign, given both the time constraints of the academic term and theexpected skill level of the respective learners. By using a third-year engineering designproject as a case study, engineering students actively participated in this comprehensiveuse of DSM methodologies. The engineering design process has been thoroughly ana-lyzed to determine convergence characteristics based on the eigenvalues of the systemfollowed by a sensitivity analysis on the originally determined DSM based on data pro-vided by students in terms of task durations and number of iterations for each task.Finally, an investigation of the design process convergence due to unexpected events orrandom disturbances has been conducted. The obtained predictive model of the designprocess was compared to the actual dynamics of the project as experienced by the stu-dents and the effect of random disturbances at any point in the design process has therebybeen evaluated. [DOI: 10.1115/1.4005591]
1 Introduction
Often, design engineering educators create their own open-ended design term project problems/topics to be assigned to stu-dents during a particular course offering within the undergraduateengineering curriculum. Normally, design projects assigned tostudents in a first-year course do not require a large number oftasks to be performed, making it relatively easy to plan the tasksand their order for the design process. Few steps are required,with very few tasks being coupled. Even then, with perhaps only asmall number of tasks requiring iteration, these tasks can be com-pleted fairly quickly. However, this is usually not the case withmany second-, third-, and fourth-year level design projects, whichare more complex, are often of multidisciplinary nature, andrequire many tasks with complex relationships to be completed,with each coupled task relying on information from each other.Very often such tasks cannot be sequenced in an order so that oneis completed after another, but rather they have to be performedconcurrently. This directly affects the relative difficulty of thedesign engineering challenge being assigned to students. Thequestion becomes could we quantify this level of difficulty in ameaningful way ahead of time so that we can compare and rankdifferent projects in terms of such difficulty? There is a necessityto do so, given the time constraints of an academic term, and theexpected student knowledge and skill level for the course in ques-tion. With such information, educators can assess the level of dif-ficulty and feasibility (or “doability”) of a design project, whilestudents can use the information from the analysis to efficientlyorganize tasks and carry out the design while reducing the numberof iterations.
DSM-based methodologies have been widely used in industryto assist engineers and project managers in organizing tasks asso-ciated with product design processes where complex relationshipsexist, and algorithms have been developed around them to effi-ciently plan tasks by eliminating iterations or reducing the dura-tion of coupled tasks where eliminating iterations are not possible.An extension of this tool, the Work transformation matrix, defines
the strength of the relationships between tasks in terms of reworkprobability of a task when new information becomes available.Also, it is used to evaluate the design process stability and conver-gence under various circumstances and to predict the duration ofthe entire design process based on estimates of the durations ofindividual tasks. But can this methodology be applied in an aca-demic setting?
In this paper, the use of DSM methodologies in this context isexamined for a third-year engineering design project assigned atUOIT, as an example, and is presented in three parts. First, usingan eigenvalue and eigenvector analysis on the WTM, the stabilityof the design process is determined, the modes of the design itera-tion are identified, and the tasks that contribute the greatestamount of work to each mode before the design process convergesto an acceptable design are determined. Second, a sensitivity anal-ysis is performed to compare the theoretically determined dynam-ics of the design process to the dynamics that were experiencedby the students undertaking the project. Finally, random distur-bances of varying degrees and points of occurrence are introducedto the design process and their effect on the design process con-vergence is analyzed.
2 Background
Research in the last several years has focused on methods thatimprove the organization of design tasks as well as to anticipatethe effects of design changes in a given product design and devel-opment process. In one example, the authors demonstrated viasimulation experiments that clients committing early designdecision-making in conditions of uncertainty bore higher designrework risk in introducing changes to designs unless theyimproved their planning for unforeseen circumstances and judi-ciously instructed changes to the design team, especially wheredesign reuse capabilities are low [1]. In another example, theauthors developed the dynamic development process model(DDPM) to manage overlapped iterative product development byconsidering rework due to development errors and corruptions [2].More recently, Barari and Pop-Iliev [3] extended a cost due tochange model [4] to understand the role of rigidity (by defining arigidity factor) and level of changeability of a design, that is, thetotal cost or difficulty of a desired change on a design project. Ag-ile manufacturing has also been incorporated in lean productions
1Corresponding author.Contributed by the Design Automation Committee of ASME for publication in
the JOURNAL OF MECHANICAL DESIGN. Manuscript received August 12, 2010; finalmanuscript received November 19, 2011; published online February 3, 2012. Assoc.Editor: Janis Terpenny.
Journal of Mechanical Design FEBRUARY 2012, Vol. 134 / 021007-1Copyright VC 2012 by ASME
Downloaded From: http://mechanicaldesign.asmedigitalcollection.asme.org/ on 10/31/2014 Terms of Use: http://asme.org/terms
to reduce waste, thereby reducing production costs [5]. Theauthors use the F-22 program as a case study to explore the effectof novelty, complexity, instability, and buffering on the relation-ship between lean implementation and production costs. Somerecent research in design adaptability has been performed byLewis et al. [6]. The authors present a methodology, multi-objective optimization, for organizing a design process to developoptimal products that can adapt to changing needs over time. Theconcept of a Pareto frontier is introduced which contains a set ofnondominant optimal solutions (all of which satisfy the designobjectives). Product design moves from one design along the Par-eto frontier to another design by the addition of a module. Theauthors use the design of a UAV as an example. Finally, Brown-ing [7] discusses better methodologies for improving decision-making among project managers for large complex projects. Heexamines task-technology fit theory to align the purpose of a pro-cess model in project management and many common modelviews. Case studies were performed which identified 28 purposes,15 views, and 56 attributes of process information. Then, meas-ures of alignment are developed for sufficiency of attributes perpurpose, superfluous attributes, and the composite of these to mea-sure purpose-view alignment (PVA). Technology fit theory isextended to project management, and a new construct (processmodel PVA) is introduced to help with project efficiency andeffectiveness, especially in large, complex projects, where mentalmodels are insufficient. Having a method to filter and organizeproject information provides managers with that necessary deci-sion support.
A key attribute of a good design process is that it converges toa feasible solution to a design problem. Much research has takenplace to find methods that provide for more efficient and bettermanagement of complex design processes, where knowledge mustcome from several design teams, making it impossible to have acentralized decision-maker. For example, Chanron et al. [8] exam-ine decentralized decision-making processes using multidiscipli-nary and highly nonlinear systems as examples. Surfaceapproximations and game theory are used to solve issues of multi-disciplinary optimization and nonlinear control theory to study thestability of equilibrium points of a decentralized problem. Thedesign of a pressure vessel is used as a practical example, with theend result being a tool to allow design engineers to make betterdecisions in a decentralized environment and to assist engineers indistributed design environments. Chanron and Lewis [9] alsodeveloped the Cobweb model, which uses matrix series and linearalgebra to establish the conditions of convergence in decentralizeddesign problems and then to efficiently find the equilibrium solu-tion of a decentralized problem.
In another research effort, Gurnani and Lewis [10] examine thecognitive behavior of the decision-makers of a design process.They found that for rational designers, the decision-making pro-cess allows the design process to converge to an equilibrium solu-tion that lies at the intersection of the decision-makers’ rationalreaction sets; however, the solution is not Pareto optimal (i.e., an“everybody wins” solution). Further, Gurnani and Lewis [11] pro-pose a framework using bounded rationality in conjunction withset-based design, metamodeling, and multi-objective optimizationtechniques to improve the solutions of convergent, decentralizeddesign problems, for which the determined solutions are superiorto Nash equilibrium. The approach used in Ref. [11] is a decen-tralized product design where there is no “system-level” designer;rather, individual subsystems communicate iteratively with eachother directly to exchange design information.
One area in which significant research has been performed overthe past several years is in matrix methodologies to organize tasksand define relationships between them. Of significance is the de-velopment of the DSM, which is used to define the sequence ofand the technical relationships between design tasks. Using thistechnical structure, strategies have been developed to determinealternative sequences of tasks or task definitions to improve thedesign process by reducing the number of iterations required [12].
Browning [13] introduces several types and applications of theDSM, including component-based (relating to the system’s archi-tecture), team-based (relating to team interactions in the process),activity-based (models information flow among process activ-ities), and parameter-based (making use of the design parameterrelationships). Browning and Danilovic [14] further explores analternative method to overcome some issues with simply using aDSM to represent task relationships, developing the domain map-ping matrix (DMM), which compares two DSMs of different pro-ject domains, augmenting traditional DSM analysis, and addingfurther insights. These include transformation and traceability ofinformation between domains, cross-domain verification of sys-tem models and project assumptions, and understanding of infor-mation between several project participants.
The DSM has been further extended to make use of the fullycoupled portion, which is called the WTM [15]. Here, the WTMnot only relates dependencies between tasks but also includes thestrengths of these dependencies, in terms of the probability ofrework of a task. Rework is the required repetition of a task when ithas originally been attempted with imperfect information and needsto be “reworked” when new or modified information becomesavailable for that task. Such would result from the completion of adesign iteration stage where the design has not yet satisfied therequired specifications. Further, using an eigenstructure analysis,design modes were identified for a camera design and an automo-bile brake system design. The design modes determine the control-ling features of the design iteration. The DSM was further used bySmith and Eppinger [16] in order to predict the expected durationof the iterative solution process and used optimizing algorithms andthe reward Markov chain method to find the best order for coupleddesign tasks. Subsequent research led to the development of effi-cient tools to optimize task sequences and included the use ofgenetic algorithms [17–19]. The authors [17] use a “competent”genetic algorithm (ordering messy GA), extending it with a localsearch strategy, to optimize task sequences for a set of design activ-ities. The design manager’s aid for intelligent decomposition(DeMAID) [18,19] has been used to optimize task/process sequen-ces using the process’ DSM representation, allowing managers toexamine different combinations of ordering of processes and opti-mize that order based on cost, time, and iteration requirements. Ref-erence [19] further describes the incorporation of a geneticalgorithm into DeMAID, creating the tool Gendes (GENetic designsequencer), where the authors test the tool in task sequencing whileexploring the most effective settings (population size, objectivefunction weighting for trade-off between feedbacks and crossovers,mutation rate, selection operator, and fitness function form).
Design structure matrix methods have been useful in determin-ing sensitivities to design process changes. Cronemyr et al. [20]used DSM and WTM methods to predict the effect of improve-ments to certain aspects of the development process. They intro-duced the concept of total process time and the simulated to-be/as-is ratio (STAR), where the latter is a sensitivity measurementof the total process time with suggested improvement versus theoriginal process time. Suggested improvements include methodsfor speeding up iterations or avoiding some iterations altogether.Using eigenvalue analysis, the slowest converging mode of theiteration was identified, and from the corresponding eigenvector,which task had the largest contribution. Improvements were thensuggested to speed up the task, should it be among the tasks withthe longest completion times. The methodology was applied tothe design of a gas turbine blade, where improvements introducedto the design process included using common CAD/CAE softwarewith parameterized geometry for both the mechanical designersand the stress engineers to reduce development time.
In another application of DSM and WTM methods, the designprocess was represented as a discrete-time state-space system,using well-established methods of dynamic analysis techniques toinvestigate and predict the dynamics of the concurrent design pro-cess [21]. Using Smith and Eppinger’s camera design example[15], the author was able to predict the required number of
021007-2 / Vol. 134, FEBRUARY 2012 Transactions of the ASME
Downloaded From: http://mechanicaldesign.asmedigitalcollection.asme.org/ on 10/31/2014 Terms of Use: http://asme.org/terms
iterations for each of the design tasks, proving that for a giventask dependency, the required iteration is dependent on the eigen-values of the WTM. The methodology utilized took advantage ofmodal analysis to determine the stability of each of the design iter-ation modes. This methodology also overcame deficiencies of pre-vious methods performing stability analysis which usedcontinuous time state-space models [22]. Further research in DSMmethods includes closed-loop control for the design process [23].The authors determined, from the homogeneous analysis of thedynamical representation of the design process, the number ofdesign iterations necessary for the design tasks to be completed,identifying the tasks consuming disproportionate amounts ofresources and time to complete (i.e., slowest converging tasks).They then used an algorithm they developed to determine aclosed-loop gain matrix based on eigenvalue analysis, with thegain matrix defined to improve the stability and convergence rateof design tasks. Moreover, this matrix is useful for determiningresource distribution to expedite particularly slow tasks toincrease their speed of convergence.
3 Method Implementation Example
Engineering students enrolled in mechanical-based programs atUOIT in their third year undertake an integrated design projectbetween two courses which combines concepts of CAD/CAM/CAE
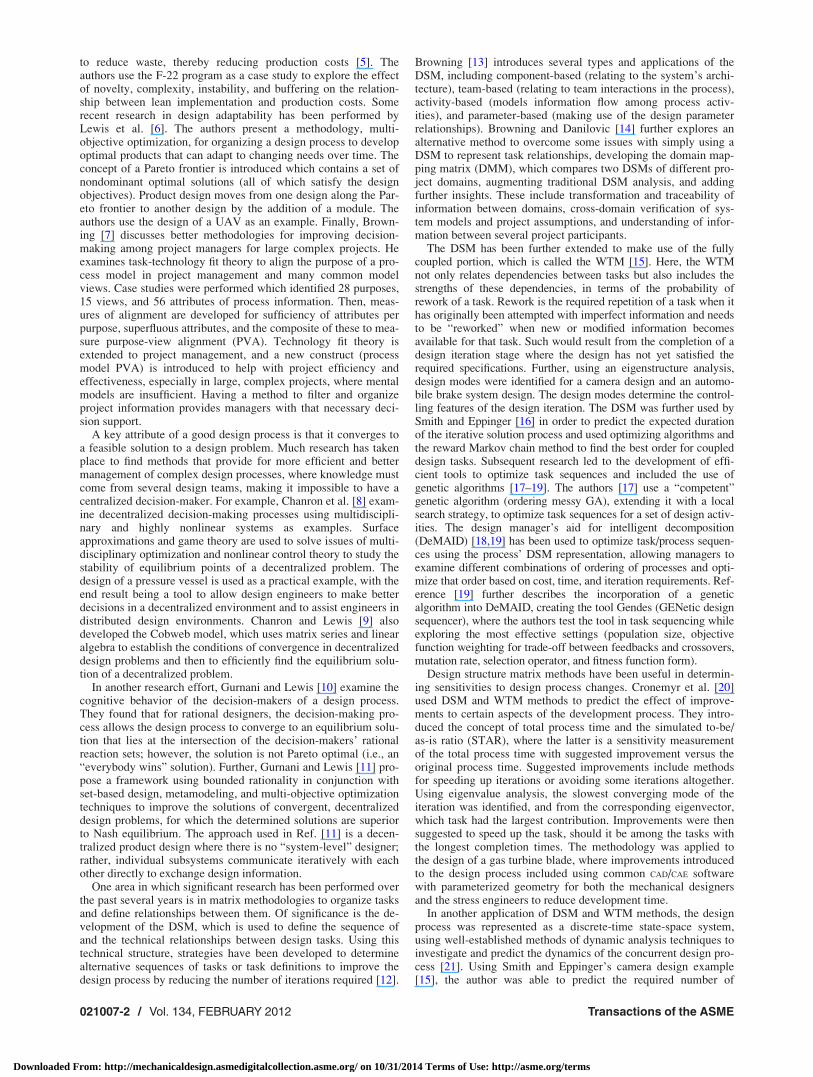
design principles (3D scanning, solid modeling, rapid prototyping,finite element methods, etc.) with kinematic and dynamic analysisof machines. Working in groups of four or five, students werecharged with the task of designing a mechanism for handling andmanipulating three different tire sizes, to be picked up from threeinput conveyor belts oriented at 90 deg to each other, and placedon an output conveyor (see Fig. 1). The mechanism must bedesigned with a factor of safety between 2.5 and 5 (anythinggreater is considered overengineered) and must be able to handletires weighing no more than 50 kg each. In addition to the CAD
design, students must build and demonstrate a prototype of theirdesign using Lego MindstormsVR . Students were required to designthe actual manipulator in CAD using real parts and to the propersize (not to simply enlarge the Lego pieces).
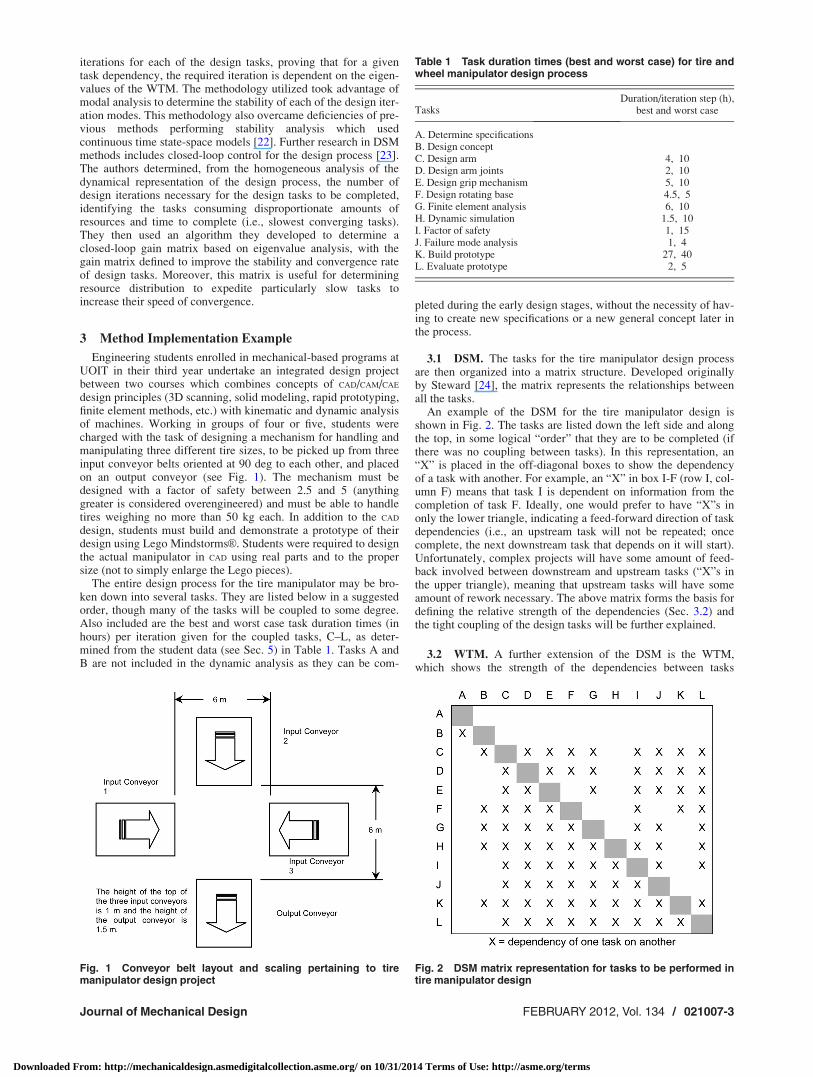
The entire design process for the tire manipulator may be bro-ken down into several tasks. They are listed below in a suggestedorder, though many of the tasks will be coupled to some degree.Also included are the best and worst case task duration times (inhours) per iteration given for the coupled tasks, C–L, as deter-mined from the student data (see Sec. 5) in Table 1. Tasks A andB are not included in the dynamic analysis as they can be com-
pleted during the early design stages, without the necessity of hav-ing to create new specifications or a new general concept later inthe process.
3.1 DSM. The tasks for the tire manipulator design processare then organized into a matrix structure. Developed originallyby Steward [24], the matrix represents the relationships betweenall the tasks.
An example of the DSM for the tire manipulator design isshown in Fig. 2. The tasks are listed down the left side and alongthe top, in some logical “order” that they are to be completed (ifthere was no coupling between tasks). In this representation, an“X” is placed in the off-diagonal boxes to show the dependencyof a task with another. For example, an “X” in box I-F (row I, col-umn F) means that task I is dependent on information from thecompletion of task F. Ideally, one would prefer to have “X”s inonly the lower triangle, indicating a feed-forward direction of taskdependencies (i.e., an upstream task will not be repeated; oncecomplete, the next downstream task that depends on it will start).Unfortunately, complex projects will have some amount of feed-back involved between downstream and upstream tasks (“X”s inthe upper triangle), meaning that upstream tasks will have someamount of rework necessary. The above matrix forms the basis fordefining the relative strength of the dependencies (Sec. 3.2) andthe tight coupling of the design tasks will be further explained.
3.2 WTM. A further extension of the DSM is the WTM,which shows the strength of the dependencies between tasks
Fig. 1 Conveyor belt layout and scaling pertaining to tiremanipulator design project
Table 1 Task duration times (best and worst case) for tire andwheel manipulator design process
TasksDuration/iteration step (h),
best and worst case
A. Determine specificationsB. Design conceptC. Design arm 4, 10D. Design arm joints 2, 10E. Design grip mechanism 5, 10F. Design rotating base 4.5, 5G. Finite element analysis 6, 10H. Dynamic simulation 1.5, 10I. Factor of safety 1, 15J. Failure mode analysis 1, 4K. Build prototype 27, 40L. Evaluate prototype 2, 5
Fig. 2 DSM matrix representation for tasks to be performed intire manipulator design
Journal of Mechanical Design FEBRUARY 2012, Vol. 134 / 021007-3
Downloaded From: http://mechanicaldesign.asmedigitalcollection.asme.org/ on 10/31/2014 Terms of Use: http://asme.org/terms
[12,15,16,20,21]. Several assumptions need to be made to performthe stability analysis on the design process [15] which are asfollows:
• All tasks are completed at every stage (fully parallel iteration).• Rework is a function of work done in the previous iteration
stage.• Work transformation parameters are time invariant.
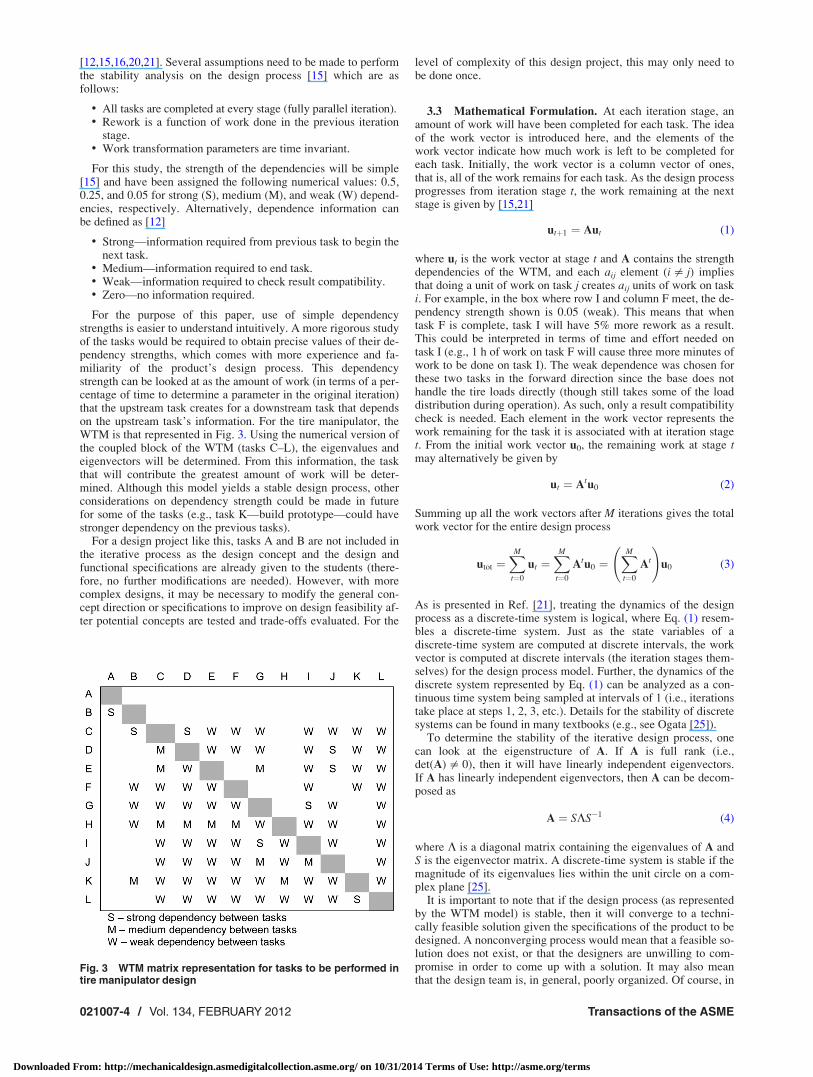
For this study, the strength of the dependencies will be simple[15] and have been assigned the following numerical values: 0.5,0.25, and 0.05 for strong (S), medium (M), and weak (W) depend-encies, respectively. Alternatively, dependence information canbe defined as [12]
• Strong—information required from previous task to begin thenext task.
• Medium—information required to end task.• Weak—information required to check result compatibility.• Zero—no information required.
For the purpose of this paper, use of simple dependencystrengths is easier to understand intuitively. A more rigorous studyof the tasks would be required to obtain precise values of their de-pendency strengths, which comes with more experience and fa-miliarity of the product’s design process. This dependencystrength can be looked at as the amount of work (in terms of a per-centage of time to determine a parameter in the original iteration)that the upstream task creates for a downstream task that dependson the upstream task’s information. For the tire manipulator, theWTM is that represented in Fig. 3. Using the numerical version ofthe coupled block of the WTM (tasks C–L), the eigenvalues andeigenvectors will be determined. From this information, the taskthat will contribute the greatest amount of work will be deter-mined. Although this model yields a stable design process, otherconsiderations on dependency strength could be made in futurefor some of the tasks (e.g., task K—build prototype—could havestronger dependency on the previous tasks).
For a design project like this, tasks A and B are not included inthe iterative process as the design concept and the design andfunctional specifications are already given to the students (there-fore, no further modifications are needed). However, with morecomplex designs, it may be necessary to modify the general con-cept direction or specifications to improve on design feasibility af-ter potential concepts are tested and trade-offs evaluated. For the
level of complexity of this design project, this may only need tobe done once.
3.3 Mathematical Formulation. At each iteration stage, anamount of work will have been completed for each task. The ideaof the work vector is introduced here, and the elements of thework vector indicate how much work is left to be completed foreach task. Initially, the work vector is a column vector of ones,that is, all of the work remains for each task. As the design processprogresses from iteration stage t, the work remaining at the nextstage is given by [15,21]
utþ1 ¼ Aut (1)
where ut is the work vector at stage t and A contains the strengthdependencies of the WTM, and each aij element (i= j) impliesthat doing a unit of work on task j creates aij units of work on taski. For example, in the box where row I and column F meet, the de-pendency strength shown is 0.05 (weak). This means that whentask F is complete, task I will have 5% more rework as a result.This could be interpreted in terms of time and effort needed ontask I (e.g., 1 h of work on task F will cause three more minutes ofwork to be done on task I). The weak dependence was chosen forthese two tasks in the forward direction since the base does nothandle the tire loads directly (though still takes some of the loaddistribution during operation). As such, only a result compatibilitycheck is needed. Each element in the work vector represents thework remaining for the task it is associated with at iteration staget. From the initial work vector u0, the remaining work at stage tmay alternatively be given by
ut ¼ Atu0 (2)
Summing up all the work vectors after M iterations gives the totalwork vector for the entire design process
utot ¼XM
t¼0
ut ¼XM
t¼0
Atu0 ¼XM
t¼0
At
!u0 (3)
As is presented in Ref. [21], treating the dynamics of the designprocess as a discrete-time system is logical, where Eq. (1) resem-bles a discrete-time system. Just as the state variables of adiscrete-time system are computed at discrete intervals, the workvector is computed at discrete intervals (the iteration stages them-selves) for the design process model. Further, the dynamics of thediscrete system represented by Eq. (1) can be analyzed as a con-tinuous time system being sampled at intervals of 1 (i.e., iterationstake place at steps 1, 2, 3, etc.). Details for the stability of discretesystems can be found in many textbooks (e.g., see Ogata [25]).
To determine the stability of the iterative design process, onecan look at the eigenstructure of A. If A is full rank (i.e.,det(A)= 0), then it will have linearly independent eigenvectors.If A has linearly independent eigenvectors, then A can be decom-posed as
A ¼ SKS�1 (4)
where K is a diagonal matrix containing the eigenvalues of A andS is the eigenvector matrix. A discrete-time system is stable if themagnitude of its eigenvalues lies within the unit circle on a com-plex plane [25].
It is important to note that if the design process (as representedby the WTM model) is stable, then it will converge to a techni-cally feasible solution given the specifications of the product to bedesigned. A nonconverging process would mean that a feasible so-lution does not exist, or that the designers are unwilling to com-promise in order to come up with a solution. It may also meanthat the design team is, in general, poorly organized. Of course, in
Fig. 3 WTM matrix representation for tasks to be performed intire manipulator design
021007-4 / Vol. 134, FEBRUARY 2012 Transactions of the ASME
Downloaded From: http://mechanicaldesign.asmedigitalcollection.asme.org/ on 10/31/2014 Terms of Use: http://asme.org/terms
modeling the process, instability could be the result of poorly cho-sen dependencies.
4 Results of the Stability Analysis
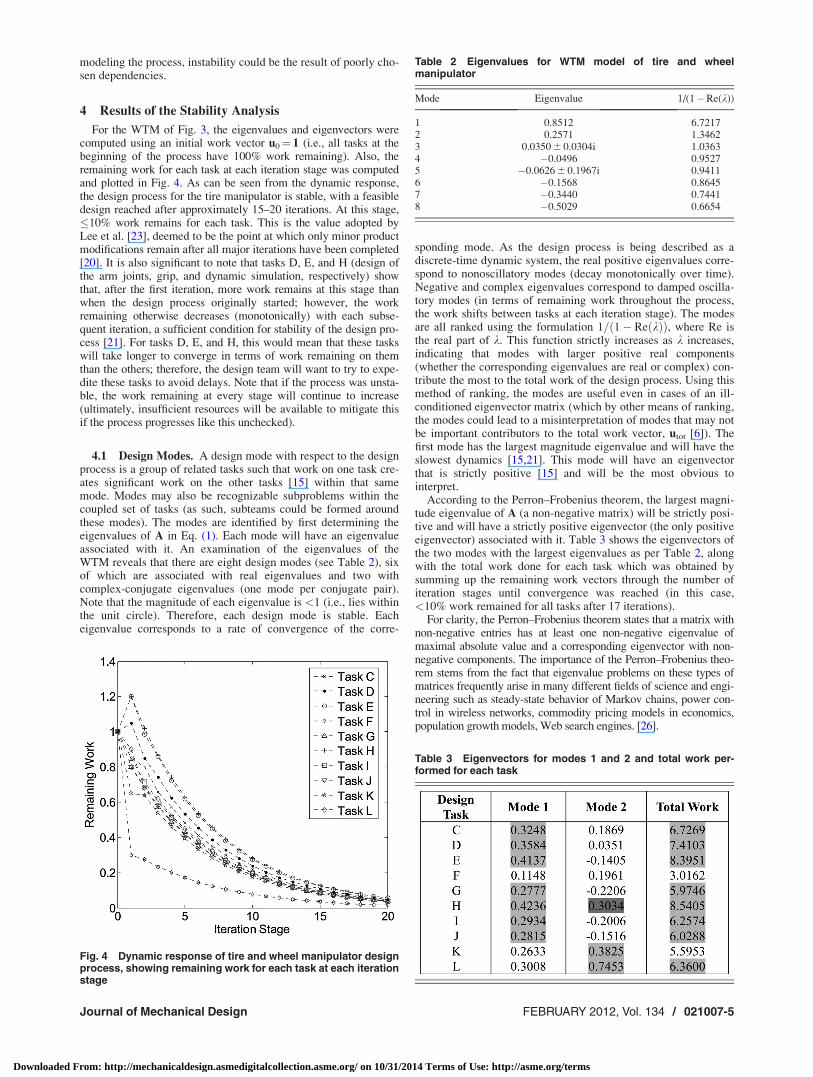
For the WTM of Fig. 3, the eigenvalues and eigenvectors werecomputed using an initial work vector u0¼ 1 (i.e., all tasks at thebeginning of the process have 100% work remaining). Also, theremaining work for each task at each iteration stage was computedand plotted in Fig. 4. As can be seen from the dynamic response,the design process for the tire manipulator is stable, with a feasibledesign reached after approximately 15–20 iterations. At this stage,�10% work remains for each task. This is the value adopted byLee et al. [23], deemed to be the point at which only minor productmodifications remain after all major iterations have been completed[20]. It is also significant to note that tasks D, E, and H (design ofthe arm joints, grip, and dynamic simulation, respectively) showthat, after the first iteration, more work remains at this stage thanwhen the design process originally started; however, the workremaining otherwise decreases (monotonically) with each subse-quent iteration, a sufficient condition for stability of the design pro-cess [21]. For tasks D, E, and H, this would mean that these taskswill take longer to converge in terms of work remaining on themthan the others; therefore, the design team will want to try to expe-dite these tasks to avoid delays. Note that if the process was unsta-ble, the work remaining at every stage will continue to increase(ultimately, insufficient resources will be available to mitigate thisif the process progresses like this unchecked).
4.1 Design Modes. A design mode with respect to the designprocess is a group of related tasks such that work on one task cre-ates significant work on the other tasks [15] within that samemode. Modes may also be recognizable subproblems within thecoupled set of tasks (as such, subteams could be formed aroundthese modes). The modes are identified by first determining theeigenvalues of A in Eq. (1). Each mode will have an eigenvalueassociated with it. An examination of the eigenvalues of theWTM reveals that there are eight design modes (see Table 2), sixof which are associated with real eigenvalues and two withcomplex-conjugate eigenvalues (one mode per conjugate pair).Note that the magnitude of each eigenvalue is <1 (i.e., lies withinthe unit circle). Therefore, each design mode is stable. Eacheigenvalue corresponds to a rate of convergence of the corre-
sponding mode. As the design process is being described as adiscrete-time dynamic system, the real positive eigenvalues corre-spond to nonoscillatory modes (decay monotonically over time).Negative and complex eigenvalues correspond to damped oscilla-tory modes (in terms of remaining work throughout the process,the work shifts between tasks at each iteration stage). The modesare all ranked using the formulation 1= 1� Re kð Þð Þ, where Re isthe real part of k. This function strictly increases as k increases,indicating that modes with larger positive real components(whether the corresponding eigenvalues are real or complex) con-tribute the most to the total work of the design process. Using thismethod of ranking, the modes are useful even in cases of an ill-conditioned eigenvector matrix (which by other means of ranking,the modes could lead to a misinterpretation of modes that may notbe important contributors to the total work vector, utot [6]). Thefirst mode has the largest magnitude eigenvalue and will have theslowest dynamics [15,21]. This mode will have an eigenvectorthat is strictly positive [15] and will be the most obvious tointerpret.
According to the Perron–Frobenius theorem, the largest magni-tude eigenvalue of A (a non-negative matrix) will be strictly posi-tive and will have a strictly positive eigenvector (the only positiveeigenvector) associated with it. Table 3 shows the eigenvectors ofthe two modes with the largest eigenvalues as per Table 2, alongwith the total work done for each task which was obtained bysumming up the remaining work vectors through the number ofiteration stages until convergence was reached (in this case,<10% work remained for all tasks after 17 iterations).
For clarity, the Perron–Frobenius theorem states that a matrix withnon-negative entries has at least one non-negative eigenvalue ofmaximal absolute value and a corresponding eigenvector with non-negative components. The importance of the Perron–Frobenius theo-rem stems from the fact that eigenvalue problems on these types ofmatrices frequently arise in many different fields of science and engi-neering such as steady-state behavior of Markov chains, power con-trol in wireless networks, commodity pricing models in economics,population growth models, Web search engines. [26].
Fig. 4 Dynamic response of tire and wheel manipulator designprocess, showing remaining work for each task at each iterationstage
Table 2 Eigenvalues for WTM model of tire and wheelmanipulator
Mode Eigenvalue 1/(1�Re(k))
1 0.8512 6.72172 0.2571 1.34623 0.0350 6 0.0304i 1.03634 �0.0496 0.95275 �0.0626 6 0.1967i 0.94116 �0.1568 0.86457 �0.3440 0.74418 �0.5029 0.6654
Table 3 Eigenvectors for modes 1 and 2 and total work per-formed for each task
Journal of Mechanical Design FEBRUARY 2012, Vol. 134 / 021007-5
Downloaded From: http://mechanicaldesign.asmedigitalcollection.asme.org/ on 10/31/2014 Terms of Use: http://asme.org/terms
By examining the elements of the eigenvector associated withthe first mode, it can be seen that the tasks which require the great-est amount of work throughout the iteration process until a feasi-ble solution is reached are associated with the largest values of theeigenvector (tasks C–E, G–J). It was also observed from thedynamic response of the design process that tasks D, E, and Hrequire more rework after one iteration, and confirmation of thisresult is in the fact that these tasks are most significant in the firstmode (largest associated eigenvector values). This is indicative ofthe tighter coupling between these three tasks compared to othersof lower dependency relationships as well as being among themost difficult tasks to complete (where additional work may berequired initially). Summing the work vectors of the design pro-cess also indicates that tasks D, E, and H require the most work tobe done compared to the other tasks.
An examination of the second mode shows that by far the domi-nating task is task L (evaluating prototype). Although the eigenvec-tor value for task L is somewhat significant in the first mode, it ismuch more significant in the second mode (by almost 2.5 times asmuch); as such, the task can be considered part of a separate designmode, as opposed to being considered part of the first mode. Also,a related task, task K (building prototype), is slightly more signifi-cant in the second mode. We could also argue that task H could bepart of the second mode instead of the first, as the correspondingeigenvector values are comparable in magnitude (0.4236 versus0.3034). In the design of the tire and wheel manipulating mecha-nism, students design the product according to various requirementsfor performance, safety, and economy, with their concept provedby a scaled-down prototype. From the information given by the firstand second mode, it can be said that there are two subprocesses—design and validation (mode 1) and prototype evaluation (mode 2).
The information provided by the eigenstructure analysis abovewould be primarily useful to instructors as a means of quantifyingthe relative difficulty of design term projects as well as being use-ful to students in planning out design tasks for the project. Forexample, the task of evaluating the design using dynamic simula-tion (task H) requires much work in the early stages of iteration(over 100% work remaining after the first iteration), but studentscan reduce the work involved at this stage (e.g., require fewer sim-ulations) by developing the improved concept early in the designprocess. At this preliminary stage, faster iterations may be neces-sary. Further, it should be noted that students in this project are re-stricted to using the available components of their LegoMindstormsVR kits (i.e., they cannot introduce new components).By better understanding this restriction, students can be morefocused in developing the detailed design in CAD, determining bet-ter how components should be placed to efficiently come up witha design that could feasibly be built using the Lego MindstormsVR
kit. This way, fewer iteration steps would be required to build andevaluate the prototype.
5 Model Sensitivity Analysis
One question that arises is how good the DSM–WTM modelfor the design process is. Are there alternative models possible? Inorder to examine alternate possibilities and their sensitivity to thedynamic response of the design process, the students of the third-year engineering design course were assigned to re-examine theDSM–WTM initially proposed to describe the dynamics of thedesign process of the tire and wheel manipulator design. Theywere required to
• determine alternative DSM–WTM (defining any additionaltasks they thought necessary)
• re-examine the task dependencies and/or task order of theoriginal matrix presented to them
• note the actual number of iterations and number of hoursrequired for each task based on their experience (that theywould note during their group meetings)
• predict the total duration of the design project
As an example, one iteration step through the design processwould be counted every time students determined a possibledesign, tested it by theoretical means, and further validated it via aprototype of the design. Each time students completed a designtask, they would note the estimated duration of that task. This in-formation was to be included in their logbooks. The raw data werethen used to compare the actual dynamics of the project as experi-enced by the students to the predictive model. From this analysis,the sensitivity to the model based on the eigenstructure analysis,actual task iterations, and rework predictions was determined.
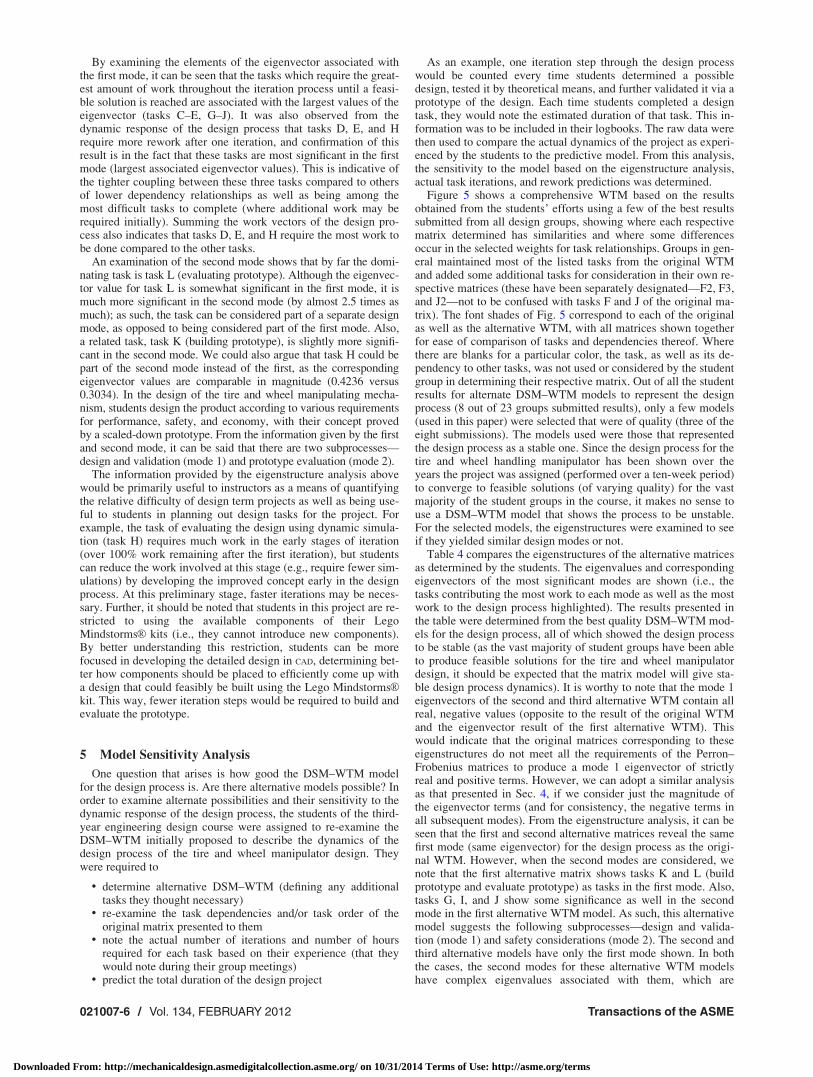
Figure 5 shows a comprehensive WTM based on the resultsobtained from the students’ efforts using a few of the best resultssubmitted from all design groups, showing where each respectivematrix determined has similarities and where some differencesoccur in the selected weights for task relationships. Groups in gen-eral maintained most of the listed tasks from the original WTMand added some additional tasks for consideration in their own re-spective matrices (these have been separately designated—F2, F3,and J2—not to be confused with tasks F and J of the original ma-trix). The font shades of Fig. 5 correspond to each of the originalas well as the alternative WTM, with all matrices shown togetherfor ease of comparison of tasks and dependencies thereof. Wherethere are blanks for a particular color, the task, as well as its de-pendency to other tasks, was not used or considered by the studentgroup in determining their respective matrix. Out of all the studentresults for alternate DSM–WTM models to represent the designprocess (8 out of 23 groups submitted results), only a few models(used in this paper) were selected that were of quality (three of theeight submissions). The models used were those that representedthe design process as a stable one. Since the design process for thetire and wheel handling manipulator has been shown over theyears the project was assigned (performed over a ten-week period)to converge to feasible solutions (of varying quality) for the vastmajority of the student groups in the course, it makes no sense touse a DSM–WTM model that shows the process to be unstable.For the selected models, the eigenstructures were examined to seeif they yielded similar design modes or not.
Table 4 compares the eigenstructures of the alternative matricesas determined by the students. The eigenvalues and correspondingeigenvectors of the most significant modes are shown (i.e., thetasks contributing the most work to each mode as well as the mostwork to the design process highlighted). The results presented inthe table were determined from the best quality DSM–WTM mod-els for the design process, all of which showed the design processto be stable (as the vast majority of student groups have been ableto produce feasible solutions for the tire and wheel manipulatordesign, it should be expected that the matrix model will give sta-ble design process dynamics). It is worthy to note that the mode 1eigenvectors of the second and third alternative WTM contain allreal, negative values (opposite to the result of the original WTMand the eigenvector result of the first alternative WTM). Thiswould indicate that the original matrices corresponding to theseeigenstructures do not meet all the requirements of the Perron–Frobenius matrices to produce a mode 1 eigenvector of strictlyreal and positive terms. However, we can adopt a similar analysisas that presented in Sec. 4, if we consider just the magnitude ofthe eigenvector terms (and for consistency, the negative terms inall subsequent modes). From the eigenstructure analysis, it can beseen that the first and second alternative matrices reveal the samefirst mode (same eigenvector) for the design process as the origi-nal WTM. However, when the second modes are considered, wenote that the first alternative matrix shows tasks K and L (buildprototype and evaluate prototype) as tasks in the first mode. Also,tasks G, I, and J show some significance as well in the secondmode in the first alternative WTM model. As such, this alternativemodel suggests the following subprocesses—design and valida-tion (mode 1) and safety considerations (mode 2). The second andthird alternative models have only the first mode shown. In boththe cases, the second modes for these alternative WTM modelshave complex eigenvalues associated with them, which are
021007-6 / Vol. 134, FEBRUARY 2012 Transactions of the ASME
Downloaded From: http://mechanicaldesign.asmedigitalcollection.asme.org/ on 10/31/2014 Terms of Use: http://asme.org/terms
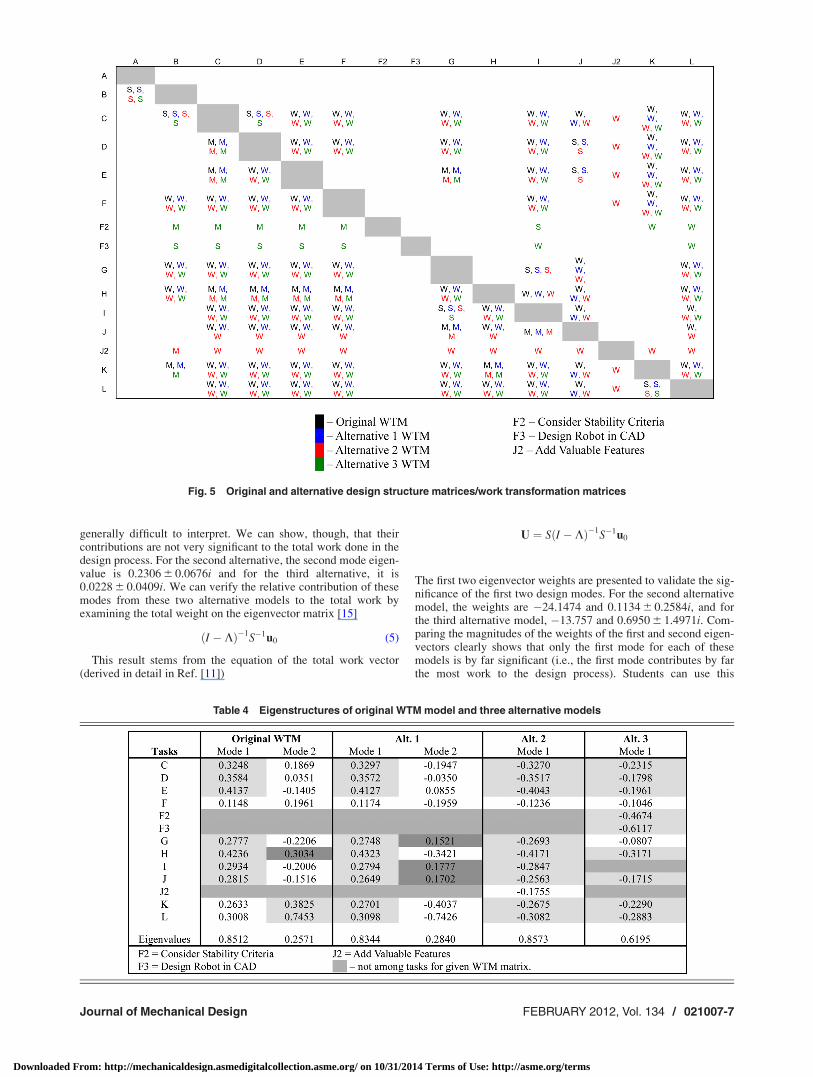
generally difficult to interpret. We can show, though, that theircontributions are not very significant to the total work done in thedesign process. For the second alternative, the second mode eigen-value is 0.2306 6 0.0676i and for the third alternative, it is0.0228 6 0.0409i. We can verify the relative contribution of thesemodes from these two alternative models to the total work byexamining the total weight on the eigenvector matrix [15]
I � Kð Þ�1S�1u0 (5)
This result stems from the equation of the total work vector(derived in detail in Ref. [11])
U ¼ S I � Kð Þ�1S�1u0
The first two eigenvector weights are presented to validate the sig-nificance of the first two design modes. For the second alternativemodel, the weights are �24.1474 and 0.1134 6 0.2584i, and forthe third alternative model, �13.757 and 0.6950 6 1.4971i. Com-paring the magnitudes of the weights of the first and second eigen-vectors clearly shows that only the first mode for each of thesemodels is by far significant (i.e., the first mode contributes by farthe most work to the design process). Students can use this
Table 4 Eigenstructures of original WTM model and three alternative models
Fig. 5 Original and alternative design structure matrices/work transformation matrices
Journal of Mechanical Design FEBRUARY 2012, Vol. 134 / 021007-7
Downloaded From: http://mechanicaldesign.asmedigitalcollection.asme.org/ on 10/31/2014 Terms of Use: http://asme.org/terms

information to determine what group of tasks to channel theirefforts in this design process.
Table 5 shows the total work done on each task over the dura-tion of the design project, with values highlighted to show whichtasks contributed the most work for each dynamic model of thedesign process. These values were based on the predicted numberof iterations for the design process to converge for each WTMmodel. It should be noted that only the relative size of the totalwork done is important here (as the total work done on each taskthroughout the design process is unitless). The number of itera-tions to complete the design process (when all tasks have <10%work remaining) was also determined, and the total work for thedesign process for each WTM model determined over their re-spective iteration span using Eq. (3). The original WTM and thefirst two alternatives show somewhat similar results in terms ofthe total work done for each task. For example, Task G (finite ele-ment analysis) required a total work (fraction) of 5.9746, 5.4034,and 6.2392, respectively, for the original and first two alternativeWTM models, with a difference of no more than two iterations inthe alternative models more or less to complete the task than whatthe original WTM model predicted. The third alternative WTMmodel showed some very different results for total work done oneach task, as well as fewer iterations to complete the design. Forexample, the original WTM model predicted a total work of6.7269 for task C (design arm), while the third alternative showeda total work of 2.9686. As can be seen through this analysis, dif-ferent WTM models for the same design process can yield varyingresults for the design modes and which tasks are part of eachmode, as well as varying predictions of the numbers of iterationsneeded for the process to converge.
Using the total work vectors computed for each WTM, the totalduration of the design project was computed based on estimatedtask duration times from the various student groups. A diagonal
matrix W is defined with the diagonal terms containing the taskduration times, with all other terms of the matrix being zero. Thefollowing relationship was applied to obtain the total duration ofthe design process:
Total design duration ¼X
i
WUð Þi ¼X
i
WXn
1
ut
!i
(6)
where U is the vector whose elements are the total work per-formed for each task in fractional terms, with the values in Table 5being used in the subsequent calculation. The task duration timesused in the computations were those listed in Table 1, which givethe best and worst case duration times for each task. It will benoted here that the student group that determined the third alterna-tive WTM model gave the best case task duration times, and thegroup that determined the first alternative WTM model gave theworst case task duration times (found when total design durationswere computed for each WTM model with the duration times).The total duration of the design process was then divided over an11-week period that the design project took place and then dividedby the number of members in each design group (an average ofsix members per group). Table 6 summarizes the task durationresults, using the best and worst cases as observed by the studentgroups themselves listed in Table 1. Each case was evaluatedusing the original WTM, as well as the corresponding matricesdetermined by the respective student groups for each set of taskduration times. The result was that the design project duration laywithin the range of 177–760 h (or 2.7–11.5 h per person perweek). Such a difference in duration between groups could beattributed to factors such as different skill levels and abilities ofstudents, as well as experience and familiarity in the various ele-ments of the design project. Student groups also found that theirtotal project duration lay within the above range. Finally, as stu-dents have limited familiarity with the design process as a whole(and how tasks will be related) for this moderately complexdesign at this level, their results will also have different
Table 5 Total work performed on each task throughout designprocess for each WTM model (sum of work fractions)
Table 6 Summary of task duration results showing best and worst case scenarios
Design process durationusing original WTM and best and
worst task duration times
Design process durationusing first and third alternative
with respective task duration times
Best Worst Alt. 3 Alt. 1
Total design Duration (h) 322.0136 759.1421 177.1396 690.6551Per week hours (11 weeks) 29.2740 69.0129 16.1036 62.7868Per person h/Wk (6 per gp) 4.8790 11.5022 2.683933 10.4645
Fig. 6 Dynamic response for the design arm task showingremaining work at each iteration stage for various WTM models
021007-8 / Vol. 134, FEBRUARY 2012 Transactions of the ASME
Downloaded From: http://mechanicaldesign.asmedigitalcollection.asme.org/ on 10/31/2014 Terms of Use: http://asme.org/terms
predictions of the model itself and the task duration times. Withthe variety of experiences that each group has with the design pro-ject tasks individually and as a whole, it is difficult to gauge howrealistic the duration times are, since these are based on the stu-dent groups’ observations. It may be possible to reduce the differ-ence in process duration between each group by providingadditional training in the necessary skill sets, opportunities foradditional feedback, as well as access to any additional tools touse in the design and analysis that may help speed up tasks.
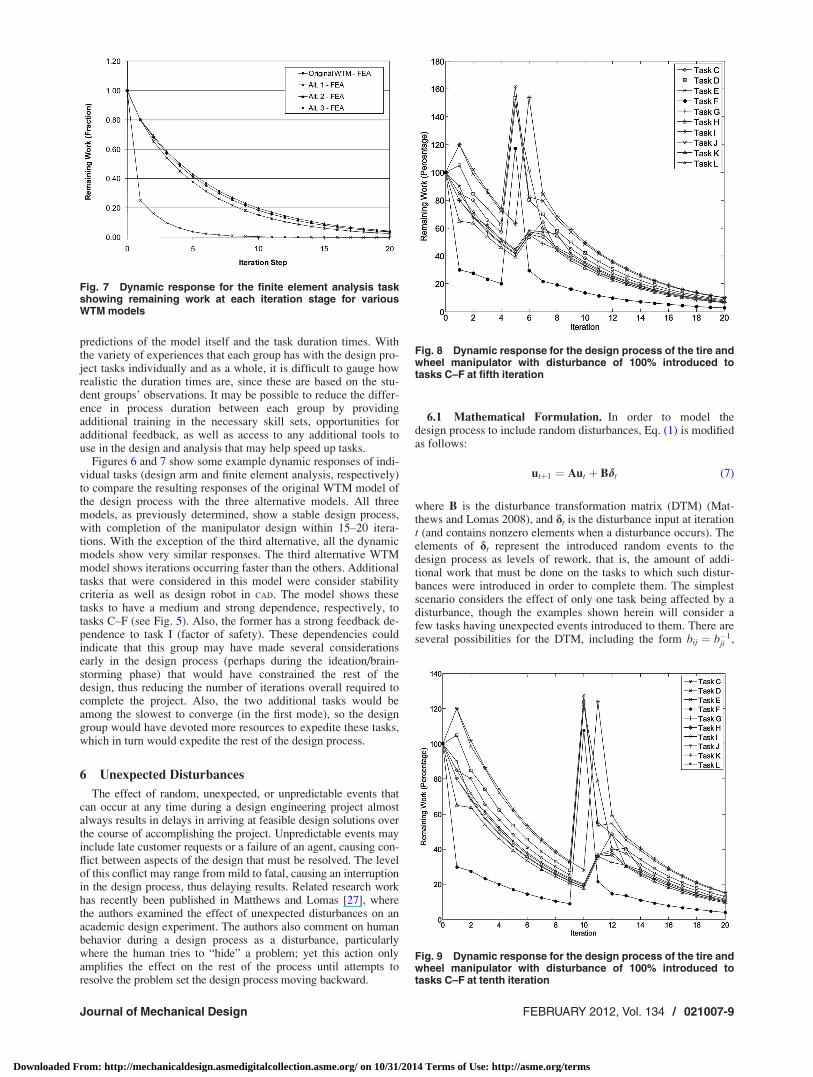
Figures 6 and 7 show some example dynamic responses of indi-vidual tasks (design arm and finite element analysis, respectively)to compare the resulting responses of the original WTM model ofthe design process with the three alternative models. All threemodels, as previously determined, show a stable design process,with completion of the manipulator design within 15–20 itera-tions. With the exception of the third alternative, all the dynamicmodels show very similar responses. The third alternative WTMmodel shows iterations occurring faster than the others. Additionaltasks that were considered in this model were consider stabilitycriteria as well as design robot in CAD. The model shows thesetasks to have a medium and strong dependence, respectively, totasks C–F (see Fig. 5). Also, the former has a strong feedback de-pendence to task I (factor of safety). These dependencies couldindicate that this group may have made several considerationsearly in the design process (perhaps during the ideation/brain-storming phase) that would have constrained the rest of thedesign, thus reducing the number of iterations overall required tocomplete the project. Also, the two additional tasks would beamong the slowest to converge (in the first mode), so the designgroup would have devoted more resources to expedite these tasks,which in turn would expedite the rest of the design process.
6 Unexpected Disturbances
The effect of random, unexpected, or unpredictable events thatcan occur at any time during a design engineering project almostalways results in delays in arriving at feasible design solutions overthe course of accomplishing the project. Unpredictable events mayinclude late customer requests or a failure of an agent, causing con-flict between aspects of the design that must be resolved. The levelof this conflict may range from mild to fatal, causing an interruptionin the design process, thus delaying results. Related research workhas recently been published in Matthews and Lomas [27], wherethe authors examined the effect of unexpected disturbances on anacademic design experiment. The authors also comment on humanbehavior during a design process as a disturbance, particularlywhere the human tries to “hide” a problem; yet this action onlyamplifies the effect on the rest of the process until attempts toresolve the problem set the design process moving backward.
6.1 Mathematical Formulation. In order to model thedesign process to include random disturbances, Eq. (1) is modifiedas follows:
utþ1 ¼ Aut þ Bdt (7)
where B is the disturbance transformation matrix (DTM) (Mat-thews and Lomas 2008), and dt is the disturbance input at iterationt (and contains nonzero elements when a disturbance occurs). Theelements of dt represent the introduced random events to thedesign process as levels of rework, that is, the amount of addi-tional work that must be done on the tasks to which such distur-bances were introduced in order to complete them. The simplestscenario considers the effect of only one task being affected by adisturbance, though the examples shown herein will consider afew tasks having unexpected events introduced to them. There areseveral possibilities for the DTM, including the form bij ¼ b�1
ji ,
Fig. 7 Dynamic response for the finite element analysis taskshowing remaining work at each iteration stage for variousWTM models
Fig. 8 Dynamic response for the design process of the tire andwheel manipulator with disturbance of 100% introduced totasks C–F at fifth iteration
Fig. 9 Dynamic response for the design process of the tire andwheel manipulator with disturbance of 100% introduced totasks C–F at tenth iteration
Journal of Mechanical Design FEBRUARY 2012, Vol. 134 / 021007-9
Downloaded From: http://mechanicaldesign.asmedigitalcollection.asme.org/ on 10/31/2014 Terms of Use: http://asme.org/terms
representing pairwise negotiation of tasks to minimize pairwiseimpact, but not necessarily global impact [23]. For simplicity,B¼ I, where I is the identity matrix.
6.2 Results With Random Disturbances Introduced. Exam-ples of the resulting dynamic responses for the design process ofthe tire and wheel mechanism are presented. Unexpected events ofvarying rework levels were introduced to the first four tasks (thosepertaining to the design of the manipulator itself). The effect ofthese unexpected events on the design process in terms of the num-ber of iterations needed to complete the design tasks was analyzed.Figures 8 and 9 show the predicted response of the design processusing the original WTM model when 100% additional work isintroduced into tasks C–F at the fifth and tenth iteration, respec-tively, representing one of the worst cases for this design process.This could be the result of late design changes, in-productionchanges, or some other agent failure. Also, recruiting new mem-bers to the team later in the process or to help resolve a problemwill result in time penalties because of initiation of the new mem-ber and redeployment of the project work [19].
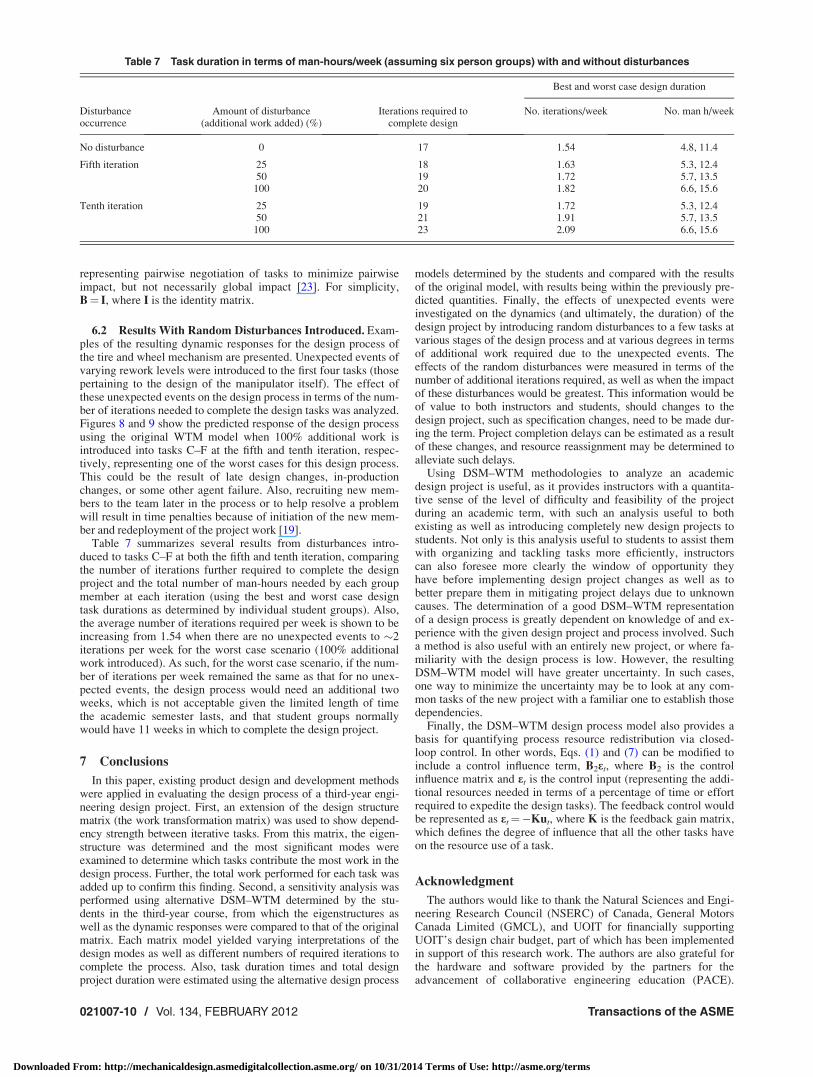
Table 7 summarizes several results from disturbances intro-duced to tasks C–F at both the fifth and tenth iteration, comparingthe number of iterations further required to complete the designproject and the total number of man-hours needed by each groupmember at each iteration (using the best and worst case designtask durations as determined by individual student groups). Also,the average number of iterations required per week is shown to beincreasing from 1.54 when there are no unexpected events to �2iterations per week for the worst case scenario (100% additionalwork introduced). As such, for the worst case scenario, if the num-ber of iterations per week remained the same as that for no unex-pected events, the design process would need an additional twoweeks, which is not acceptable given the limited length of timethe academic semester lasts, and that student groups normallywould have 11 weeks in which to complete the design project.
7 Conclusions
In this paper, existing product design and development methodswere applied in evaluating the design process of a third-year engi-neering design project. First, an extension of the design structurematrix (the work transformation matrix) was used to show depend-ency strength between iterative tasks. From this matrix, the eigen-structure was determined and the most significant modes wereexamined to determine which tasks contribute the most work in thedesign process. Further, the total work performed for each task wasadded up to confirm this finding. Second, a sensitivity analysis wasperformed using alternative DSM–WTM determined by the stu-dents in the third-year course, from which the eigenstructures aswell as the dynamic responses were compared to that of the originalmatrix. Each matrix model yielded varying interpretations of thedesign modes as well as different numbers of required iterations tocomplete the process. Also, task duration times and total designproject duration were estimated using the alternative design process
models determined by the students and compared with the resultsof the original model, with results being within the previously pre-dicted quantities. Finally, the effects of unexpected events wereinvestigated on the dynamics (and ultimately, the duration) of thedesign project by introducing random disturbances to a few tasks atvarious stages of the design process and at various degrees in termsof additional work required due to the unexpected events. Theeffects of the random disturbances were measured in terms of thenumber of additional iterations required, as well as when the impactof these disturbances would be greatest. This information would beof value to both instructors and students, should changes to thedesign project, such as specification changes, need to be made dur-ing the term. Project completion delays can be estimated as a resultof these changes, and resource reassignment may be determined toalleviate such delays.
Using DSM–WTM methodologies to analyze an academicdesign project is useful, as it provides instructors with a quantita-tive sense of the level of difficulty and feasibility of the projectduring an academic term, with such an analysis useful to bothexisting as well as introducing completely new design projects tostudents. Not only is this analysis useful to students to assist themwith organizing and tackling tasks more efficiently, instructorscan also foresee more clearly the window of opportunity theyhave before implementing design project changes as well as tobetter prepare them in mitigating project delays due to unknowncauses. The determination of a good DSM–WTM representationof a design process is greatly dependent on knowledge of and ex-perience with the given design project and process involved. Sucha method is also useful with an entirely new project, or where fa-miliarity with the design process is low. However, the resultingDSM–WTM model will have greater uncertainty. In such cases,one way to minimize the uncertainty may be to look at any com-mon tasks of the new project with a familiar one to establish thosedependencies.
Finally, the DSM–WTM design process model also provides abasis for quantifying process resource redistribution via closed-loop control. In other words, Eqs. (1) and (7) can be modified toinclude a control influence term, B2et, where B2 is the controlinfluence matrix and et is the control input (representing the addi-tional resources needed in terms of a percentage of time or effortrequired to expedite the design tasks). The feedback control wouldbe represented as et¼�Kut, where K is the feedback gain matrix,which defines the degree of influence that all the other tasks haveon the resource use of a task.
Acknowledgment
The authors would like to thank the Natural Sciences and Engi-neering Research Council (NSERC) of Canada, General MotorsCanada Limited (GMCL), and UOIT for financially supportingUOIT’s design chair budget, part of which has been implementedin support of this research work. The authors are also grateful forthe hardware and software provided by the partners for theadvancement of collaborative engineering education (PACE).
Table 7 Task duration in terms of man-hours/week (assuming six person groups) with and without disturbances
Best and worst case design duration
Disturbanceoccurrence
Amount of disturbance(additional work added) (%)
Iterations required tocomplete design
No. iterations/week No. man h/week
No disturbance 0 17 1.54 4.8, 11.4
Fifth iteration 25 18 1.63 5.3, 12.450 19 1.72 5.7, 13.5100 20 1.82 6.6, 15.6
Tenth iteration 25 19 1.72 5.3, 12.450 21 1.91 5.7, 13.5100 23 2.09 6.6, 15.6
021007-10 / Vol. 134, FEBRUARY 2012 Transactions of the ASME
Downloaded From: http://mechanicaldesign.asmedigitalcollection.asme.org/ on 10/31/2014 Terms of Use: http://asme.org/terms
Finally, the authors thank the collective efforts of the students ofthe third-year computer-aided design course in providing data forthe DSM–WTM analysis.
References[1] Gil, N., Tammelein, I. D., and Schruben, L. W., 2006, “External Change in
Large Engineering Design Projects: the Role of the Client,” IEEE Trans. Eng.Manage., 53(3), pp. 426–439.
[2] Lin, J., Chai, K. H., Wong, Y. S., and Brombacher, A. C., 2008, “A DynamicModel for Managing Overlapped Iterative Product Development,” Eur. J. Oper.Res., 185(1), pp. 378–392.
[3] Barari, A., and Pop-Iliev, R., 2009, “Reducing Rigidity by ImplementingClosed-Loop Engineering in Adaptable Design and Manufacturing Systems,”J. Manuf. Syst., 28(2–3), pp. 47–54.
[4] Prasad, B., 1996, Concurrent Engineering Fundamentals: Integrated Productand Process Organization, Prentice Hall, NJ, Vol. I.
[5] Browning, T. R., and Heath, R. D., 2009, “Reconceptualizing the Effects ofLean on Production Costs With Evidence From the F-22 Program,” J. Oper.Manage., 27(1), pp. 23–44.
[6] Lewis, P. K., Murray, V. R., and Mattson, C. A., 2011, “A Design OptimizationStrategy for Creating Devices That Traverse the Pareto Frontier Over Time,”Struct. Multidiscip. Opt., 43(2), pp. 191–204.
[7] Browning, T. R., 2010, “On the Alignment of the Purposes and Views of Pro-cess Models in Project Management,” J. Oper. Manage., 28(4), pp. 316–332.
[8] Chanron, V., Singh, T., and Lewis, K., 2005, “Equilibrium Stability in Decen-tralized Design Systems,” Int. J. Syst. Sci., 36(10), pp. 651–662.
[9] Chanron, V., and Lewis, K., 2005, “A Study of Convergence in DecentralizedDesign Processes,” Res. Eng. Des., 16(3), pp. 133–145.
[10] Gurnani, A., and Lewis, K., 2008, “Collaborative, Decentralized EngineeringDesign at the Edge of Rationality,” ASME J. Mech. Des., 130(12), pp. 121101-1–121101-9.
[11] Gurnani, A., and Lewis, K., 2008, “Using Bounded Rationality to ImproveDecentralized Design,” AIAA J., 46(12), pp. 3049–3059.
[12] Eppinger, S. D., Whitney, D. E., Smith, R. P., and Gebala, D. A., 1994, “AModel-Based Method for Organizing Tasks in Product Development,” Res.Eng. Des., 6(1), pp. 1–13.
[13] Browning, T. R., 2001, “Applying the Design Structure Matrix to SystemDecomposition and Integration Problems: A Review and New Directions,”IEEE Trans. Eng. Manage., 28(3), pp. 292–306.
[14] Browning, T. R., and Danilovic, M., 2007, “Managing Complex Product Devel-opment Projects With Design Structure Matrices and Domain MappingMatrices,” Int. J. Proj. Manage., 25(3), pp. 300–314.
[15] Smith, R. P., and Eppinger, S. D., 1997, “Identifying Controlling Features ofEngineering Design Iteration,” Manage. Sci., 43(3), pp. 276–293.
[16] Smith, R. P., and Eppinger, S. D., 1997, “A Predictive Model of Sequential Iter-ation in Engineering Design,” Manage. Sci., 43(8), pp. 1104–1120.
[17] Meyer, C., Yassine, A. A., and Browning, T. R., 2007, “Design Process SequencingWith Competent Genetic Algorithms,” ASME J. Mech. Des., 129(6), pp. 566–585.
[18] McCulley, C., and Bloebaum, C. L., 1996, “A Genetic Tool for Optimal DesignSequencing in Complex Engineering Systems,” Struc. Opt., 12(2–3), pp.186–201.
[19] Rogers, J. L., McCulley, C. M., and Bloebaum, C. L., 1996, “Integrating aGenetic Algorithm Into a Knowledge-Based System for Ordering ComplexDesign Processes,” NASA TM-110247.
[20] Cronemyr, P., Ronnback, A. O., and Eppinger, S. D., 2001, “A Decision Sup-port Tool for Predicting the Impact of Development Process Improvements,”J. Eng. Des., 12(3), pp. 177–199.
[21] Kim, D., 2001, “On Representations and Dynamic Analysis of Concurrent En-gineering Design,” J. Eng. Des., 18(3), pp. 265–277.
[22] Ong, K. L., Yee, S. G., and Khoo, L. P., 2003, “Homogeneous State-Space Rep-resentation of Concurrent Design,” J. Eng. Des., 14(2), pp. 221–245.
[23] Lee, S. G., Ong, K. L., and Khoo, L. P., 2004, “Control and Monitoring of Con-current Design Tasks in a Dynamic Environment,” Concurr. Eng. Res. Appl.,12(1), pp. 59–66.
[24] Steward, D. V., 1981, “The Design Structure System: A Method for Managingthe Design of Complex Systems,” IEEE Trans. Eng. Manage., 28(3), pp.71–74.
[25] Ogata, K., 1995, Discrete-Time Control Systems, 2nd ed., Prentice Hall Inc.,NJ, pp. 74–288.
[26] Pillai, U., Suel, T., and Cha, S., 2005, “The Perron–Frobenius Theorem – Someof its Applications,” IEEE Signal Process. Mag., 22(2), pp. 62–75.
[27] Matthews, P. C., and Lomas, C. D. W., 2010, “A Methodology for QuantitativeEstimates for the Work and Disturbance Transformation Matrices,” J. Eng.Des., 21(4), pp. 413–425.
Journal of Mechanical Design FEBRUARY 2012, Vol. 134 / 021007-11
Downloaded From: http://mechanicaldesign.asmedigitalcollection.asme.org/ on 10/31/2014 Terms of Use: http://asme.org/terms