Setting priorities in prevention
11
Health policy, 20 (1992)277-287 01992 Else.vier Science Publishers B.V. All rights reserved. 0168-8510/92/$05.00 HPE 00453 Setting priorities in prevention Kees Schaapveld, Harry P.A. van de Water Ellen W. Bergsma The Netherlands Institute for Preventive Health Care - The Netherlands Accepted 18 October 1991 Summary 211 and TNO, Leiden, In the last few years prevention has again become the focus of attention because of various international developments such as the WHO strategy for Health for All by the year 2000. When resources are scarce, it is all the more important to set priorities. This applies to prevention as well as to curative care. In this paper, we describe a method for comparing prevention programmes with one another, using efkiency as the final parameter. To determine efficiency it is necessary to collect facts about a number of aspects of the health problems to be prevented: size of the health problem, degree of preventability, monetary and other costs involved and the probability that the prevention programme will cause changes in the overall pattern of morbidtty and/or mortality. These aspects are discussed and some examples given. Efficiency; Health policy; Health priority; The Netherlands; Preventive health service Introduction Since the publication of “A new perspective on the health of the Canadians” [l], so-called health policy has been gaining ground as the leading principle of ministries of health all over the world. Health policy is the endeavour to improve the health status of a population by dealing with the factors that determine this health status. It is meant as a shift away from the mere planning of curative health care services. Although these curative health care services Address Ibr correspondence: K. Schaapveld, Tha Netherlands Institute for Preventive Health Care - TNO, P.O. Box 124,230O AC Leiden, The Netherlands.
-
Upload
independent -
Category
Documents
-
view
1 -
download
0
Transcript of Setting priorities in prevention

Health policy, 20 (1992)277-287 01992 Else.vier Science Publishers B.V. All rights reserved. 0168-8510/92/$05.00
HPE 00453
Setting priorities in prevention
Kees Schaapveld, Harry P.A. van de Water Ellen W. Bergsma
The Netherlands Institute for Preventive Health Care - The Netherlands
Accepted 18 October 1991
Summary
211
and
TNO, Leiden,
In the last few years prevention has again become the focus of attention because of various international developments such as the WHO strategy for Health for All by the year 2000. When resources are scarce, it is all the more important to set priorities. This applies to prevention as well as to curative care. In this paper, we describe a method for comparing prevention programmes with one another, using efkiency as the final parameter. To determine efficiency it is necessary to collect facts about a number of aspects of the health problems to be prevented: size of the health problem, degree of preventability, monetary and other costs involved and the probability that the prevention programme will cause changes in the overall pattern of morbidtty and/or mortality. These aspects are discussed and some examples given.
Efficiency; Health policy; Health priority; The Netherlands; Preventive health service
Introduction
Since the publication of “A new perspective on the health of the Canadians” [l], so-called health policy has been gaining ground as the leading principle of ministries of health all over the world. Health policy is the endeavour to improve the health status of a population by dealing with the factors that determine this health status. It is meant as a shift away from the mere planning of curative health care services. Although these curative health care services
Address Ibr correspondence: K. Schaapveld, Tha Netherlands Institute for Preventive Health Care - TNO, P.O. Box 124,230O AC Leiden, The Netherlands.

278
are recognized as one of the determinants of health, the policy change has led towards a renewed interest in the prevention of health problems by acting upon the other determinants, broadly grouped together as: biological (hereditary) factors; the physical and chemical environment (including infectious diseases); and the social environment and life style factors.
Within the framework of its “Health for all by the year 2000” strategy and in the spirit of the health policy the Regional Office for Europe of the World Health Organization has formulated 38 health targets to be achieved by the year 2000 [2]. Primary and secondary prevention has to play the main role here. These targets have been endorsed by the member states in 1984.
This article is a discussion paper based on a report commissioned by the Dutch Ministry of Welfare, Health and Cultural Affairs and prepared by The Netherlands Institute for Preventive Health Care [3]. The report gives a methodology to answer the questions: “What can we realistically expect of prevention, how do we measure any improvements, is it worth it and is it possible to establish priorities for a list of prevention programmes?’ Setting priorities in prevention should ideally be based on knowledge about the occurrence, socio-economic consequences and preventability of health problems, thereby taking into account possible future trends and the expected costs and benefits of preventive measures. The setting of priorities is, of course, not restricted to preventive health care, but is needed in any field where various solutions are proposed and the financial means are limited.
Methods
We have taken the efficciency of prevention programmes as the parameter for establishing a rank order among them. The efficiency of a prevention programme relative to others depends on a number of criteria.
In the first place, the programme that prevents a certain percentage of a major health problem will be more efficient than another that prevents the same percentage of a less important health problem at the same cost. For example, the elimination of 10% of the cancer problem will carry more health benefit than the near total disappearance of, say, congenital hypothyroidism and phenylketonuria. Therefore, health problems have to be classified according to their size. We have tried to measure the size of the problems posed by the 17 main sections of the International Classification of Diseases, Injuries and Causes of Death (ICD, ninth revision, 1975). For this purpose, numerous indicators are available, each leading to another rank order: specific prevalence and mortality rates, use of health services, economic consequences, and so on. We have used the seven indicators mentioned in Table 1 for which data were available in The Netherlands or could be calculated. The sources of these data are not listed here, as they are in Dutch only (see Ref. 3). As in all developed countries, mortality by cause of death is well registered in The Netherlands. From those mortality data, it is easy to calculate the number of

219
Table 1
Rank orders (l-9) according to size of the 17 maln ICD categories of health problems In The Nsthsrlands, as measured with seven lndlcators during various periods between 1981 and 1989. Source Ref. 3 A, mortality rate; B, potential years of life lost; C, prevalence rate; D, consultation with general practitioners; E, hospital admissions; F, main diagnoses in nursing homes; and G, sickness absenteeism + work disability.
ABCDEF G AG Comb.
Infectious and parasitic diseases Neoplasms 2 2 Endocrine, nutritional and metabolic
diseases Diseases of the blood and bloodforming
organs Mental disorders Diseases of the nervous system and sense
organs Diseases of the circulatory system I I Diseases of the respiratory system 3 5 Diseases of the digestive system 5 Diseases of the genito-urinary system Complications of pregnancy, childbirth
and the puerperium Diseases of the skin and subcutaneous tissue Diseases of the musculoskeletal system and
cotmective tissue Congenital anomalies Certain conditions originating in the
perinatal period Symptoms, signs and ill-defined conditions 4 External causes of injury and poisoning 4 3
2
1 5
3 1 5
4 4
2 3
4
1
1 3
3
5
2 4
5 -
potential years of life lost per disease category, an important indicator of premature death as a target for prevention [4]. Prevalence rates of chronic diseases and handicaps can be supplied by various kinds of surveys organized in many countries; we used the Health Interview Survey from The Netherlands Central Bureau of Statistics. In The Netherlands, all patients, including those who need specialist care, are seen by general practitioners, who therefore have an excellent overview of actual morbidity in the population. Sentinel stations and special surveys supply data on consultations with general practitioners. Hospital admissions and discharges by diagnosis have been available for many years, as in many other countries. The reasons for sickness absenteeism and work disability can be supplied by the registries of occupational health care and insurance boards.
Not only the present size of the health problems has to be taken into account, but also past and future size. For example, poliomyelitis is almost non-existent in The Netherlands because of a prevention programme, but the size of the problem would be considerable without prevention. Therefore, well- established and successful prevention programmes have to be submitted to the

280
same assessment as proposed ones. Another reason to take the future size of health problems into account is
that the prevalence of diseases associated with higher age will increase with the present ageing of the population.
Secondly, the efficiency of a preventive measure will be determined by the preventability of the health problem in question. Preventability is another word for the amount of health benefit that can be expected from a prevention programme, such as the decrease in the incidence of skull fractures of motorcyclists since the wearing of helmets was made compulsory. Some minor health problems are more easily prevented than major ones. There is also a difference between theoretical preventability (x efficacy) and practical preventability (~effectiveness). In practice, the result of a prevention programme is often less than expected because an eficaceous measure may be difficult to carry out or less acceptable to the population. Practical preventability will determine the outcome of the programme. However, for research purposes and policy-making it is useful to demonstrate any gap between theoretical and practical preventability.
Future technological developments may improve the chances of preventing a disease.
Third, all prevention programmes carry a certain cost. First of all there are direct costs spent on the programme in terms of money, time and manpower. They are usually relatively easy to quantify. Other costs of prevention include possible extra costs for the health care sector (through increasing longevity and/or changes in the pattern of morbidity) as well as costs that cannot be expressed in terms of money, such as the burden on the population to change lifestyles or to participate in tests, the anxiety caused by screening procedures, ‘medicalization’ (making patients out of people who previously regarded themselves as healthy), loss of freedom and abandonment of pleasure. Little is known about these other costs and they are difticult to quantify.
In this article, expenditures will not be given for each of the prevention programmes mentioned, although this information is available in The Netherlands for some. Instead, direct costs will be shown per organizational subsector of the Dutch health care system in order to give a impression of the preventive effort. It has to be kept in mind that in many cases effective prevention does not save money but offers health benefit at a price. As such it is not different from curative health care.
And fmally there may be other reasons why the outcome of prevention is not as high as expected: obstructing developments may diminish its results. The partial elimination of a potentially lethal health problem at an older age may lead to a relative or even absolute increase in another; this is the phenomenon of ‘competing causes of death’ [3,5]. Also, an increase in life expectancy - caused by prevention or otherwise - may result in more healthy years but also in an expansion of morbidity. On the other hand, if one could succeed in preventing or postponing an old age health problem, a ‘compression of morbidity’ is also a theoretical outcome [6].

281
We gave examples of these criteria and offer a methodology to combine data into an overview of the efficiency of prevention programmes. A word of caution is necessary: as can be deduced from the criteria needed to determine the efficiency of prevention programmes, hard data will be used whenever possible, but subjective elements cannot be avoided when setting priorities in prevention.
Results
The use of seven indicators to measure the health of the Dutch population leads in each case to a different rank order for separate categories of health problems (see Table 1). As explained in the section Methods, the data on which these rank orders are based were readily available in The Netherlands and no serious limitations are to be expected in their validity other than the limitations inherent to the registrations described.
It is not possible to construct a single mathematical index for the magnitude of each disease category, but when the scores of columns A-43 are considered together one could arrive at the following (subjective) order in The Netherlands: cardiovascular disease, cancer, mental disorders, diseases of the musculo-skeletal system and accidents. The positions of cancer, mental disorders and diseases of the musculo-skeletal system in this order could be interchanged, depending on the weight one attaches to the various indicators. A future increase of many important chronic diseases will be determined mainly by the ageing of the population.
In the literature, the effectiveness of prevention of certain diseases is usually expressed as decreasing age-adjusted incidence of that disease (e.g., myocardial infarctions) or decreasing specific mortality (e.g., of breast cancer). It would be more interesting to know the effect on the quality of life and total mortality, but these are usually not taken into account (see below). Anyway, the preventability of many health problems can only be assessed in a qualitative way.
Some diseases, such as a number of infectious diseases, can be nearly completely eliminated by prevention. For other important diseases prevention seems nearly impossible at the moment: some psychiatric disorders, dementia and arthritis, for example. Lung cancer is quite preventable, coronary disease to some extent and breast cancer less again. When examining the theoretical and practical preventability of health problems, it became clear that any rank order by preventability would look very different from the one by the size of these health problems.
In The Netherlands in 1988 approximately 41 billion guilders (approx. $20 billion) - i.e. 9% of the Gross National Product - were spent on total health care, of which approximately 5% or two billion guilders (approx. $1 billion) can be considered as the direct costs of primary and secondary prevention. This figure is comparable to the 5-6% in the United Kingdom [7& The
282
Table 2
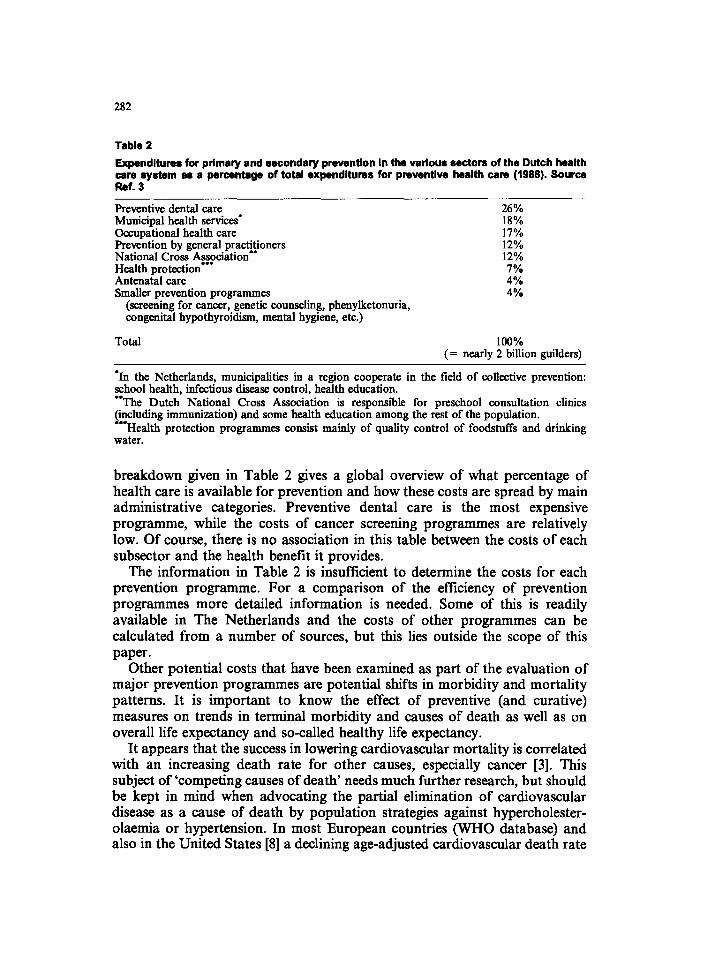
Expenditures for prlmaty and secondary prevention In the varlous sectors of the Dutch health care system as a percentage of total expsndltums for preventlve health cam (1999). Source Ref. 3
Preventive dental care Municipal health services* Occupational health care Prevemion by general practitioners National Cross Association” Health protection”’ Antenatal care Smaller prevention programmes
(screening for cancer, genetic counseling, phenylketonuria, congenital hypothyroidism, mental hygiene, etc.)
26% 18% 17% 12% 12% 7% 4% 4%
Total 100% (= nearly 2 billion guilders)
*In the Netherlands, municipalities in a region cooperate in the field of collective prevention: school health, infectious disease control, health education. **The Dutch National Cross Association is responsible for preschool consultation clinics (including immunization) and some health education among the rest of the population. ***Health protection programmes consist mainly of quality control of foodstuffs and drinking water.
breakdown given in Table 2 gives a global overview of what percentage of health care is available for prevention and how these costs are spread by main administrative categories. Preventive dental care is the most expensive programme, while the costs of cancer screening programmes are relatively low. Of course, there is no association in this table between the costs of each subsector and the health benefit it provides.
The information in Table 2 is insufficient to determine the costs for each prevention programme. For a comparison of the efficiency of prevention programmes more detailed information is needed. Some of this is readily available in The Netherlands and the costs of other programmes can be calculated from a number of sources, but this lies outside the scope of this paper.
Other potential costs that have been examined as part of the evaluation of major prevention programmes are potential shifts in morbidity and mortality patterns. It is important to know the effect of preventive (and curative) measures on trends in terminal morbidity and causes of death as well as on overall life expectancy and so-called healthy life expectancy.
It appears that the success in lowering cardiovascular mortality is correlated with an increasing death rate for other causes, especially cancer [3]. This subject of ‘competing causes of death’ needs much further research, but should be kept in mind when advocating the partial elimination of cardiovascular disease as a cause of death by population strategies against hypercholester- olaemia or hypertension. In most European countries (WHO database) and also in the United States [8] a declining age-adjusted cardiovascular death rate

283
20
I , I I 1960 1965 1970 1975 1860 1965 1990 2000 2010 '64 '69 '74 '79 '64 '88
year
Fig. 1. Percentage of total mortality for cardiovascular disease and cancer in The Netherlands, lQ6Q-1988.
and a more or less stable age-adjusted cancer death rate lead to an increasing proportion of the population who die of the latter. In the beginning of the next century cancer may overtake cardiovascular disease as the main cause of death in these countries. Fig. 1 shows the disturbing result of the projection of recent Dutch trends.
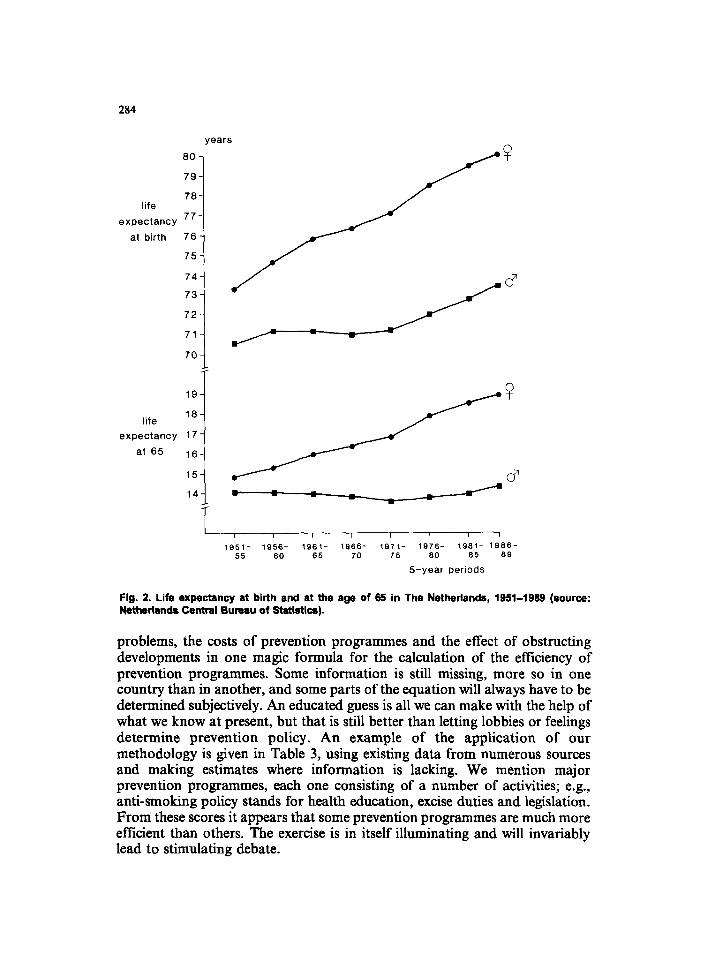
Healthy life expectancy - also called disability-free life expectancy - is the average number of years one can expect to live without disease, disability or institutionalization [9]. As total life expectancy continues to rise, also in The Netherlands (see Fig. 2), optimists predict an even faster growth of healthy life expectancy, resulting in less years of disability than before. This is represented as scenario B in Fig. 3, the so-called compression of morbidity [6]. Scenario C is the worst one, because all the years gained will be spent with disease and disabilities. On the basis of some data from health care statistics and health surveys in The Netherlands and other countries, it seems that scenario D is already taking place and will continue: total life expectancy and healthy life expectancy are rising, but so is the number of unhealthy years [IO]. Fig. 3 is a schematic representation of theoretical possibilities for compression or expansion of morbidity. Scenario D shows an increase in the number of healthy years, but a decrease in the ratio between healthy life expectancy and total life expectancy in comparison to the original situation A. One could and should speculate what the effect is of major prevention programmes (as well as forms of curative health care and other factors) on the overall burden of morbidity during a life time.
It is not possible to combine data on the size and preventability of health
284
80 -
79-
life 78
expectancy 77-
at birth 78 -
75-
74
73
72 J
life 18
expectancy 17
at 85 ,8
years
- I I I 1 I 1 I I
1951- 1956- 1961- 1966- 1971- 1976- 19ai- 19a6- 55 a0 65 70 75 a0 a5 a9
5-year periods
Fig. 2. Life expectancy at birth end et the age of 65 in The Netherlands, 1951-1999 (source: Netherlands Central Bureau of Ststistics).
problems, the costs of prevention programmes and the effect of obstructing developments in one magic formula for the calculation of the efficiency of prevention programmes. Some information is still missing, more so in one country than in another, and some parts of the equation will always have to be determined subjectively. An educated guess is all we can make with the help of what we know at present, but that is still better than letting lobbies or feelings determine prevention policy. An example of the application of our methodology is given in Table 3, using existing data from numerous sources and making estimates where information is lacking. We mention major prevention programmes, each one consisting of a number of activities; e.g., anti-smoking policy stands for health education, excise duties and legislation. From these scores it appears that some prevention programmes are much more efficient than others. The exercise is in itself illuminating and will invariably lead to stimulating debate.

Tabl
e 3
An
exam
ple
of a
ran
k or
der
of p
reve
ntlo
n pr
ogra
mm
es a
ccor
ding
to
efflc
lenc
y +,
low
; +
+ ,
mod
erat
e;
+ +
+ , h
igh;
-,
abse
nt;
and
7. u
nkno
wn.
Prev
entio
n pr
ogra
mm
e (P
oten
tial)
Theo
retic
al
Prac
tical
co
sts
of
size
of
heal
th
prev
enta
bilit
y pr
even
tabi
lity
Obs
truct
ing
Effic
ienc
y
prob
lem
(T
z: ef
ficac
y)
(z
effe
ctiv
enes
s)
prev
entio
n de
velo
pmen
ts
Ant
i-sm
okin
g po
licy
+++
Scre
enin
g fo
r ch
oles
tero
l ++
+ Sc
reen
ing
for
hype
rtens
ion
+++
Scre
enin
g fo
r br
east
ca
ncer
++
Sc
reen
ing
for
cerv
ical
ca
ncer
+
Ant
i-alc
ohol
po
licy
++
Imm
uniz
atio
n of
chi
ldre
n ++
Sc
hool
he
alth
+
Ant
enat
al
care
+
Con
trace
ptio
n ++
O
ccup
atio
nal
heal
th
care
++
+ G
enet
ic
test
ing
++
Prev
entiv
e de
ntal
ca
re
++
Men
tal
hygi
ene
+++
Traf
fic
safe
ty
++
Safe
sex
+
Scre
enin
g fo
r PK
IJ/C
HT*
+
Nut
ritio
n po
licy
++
Food
qu
ality
co
ntro
l ++
Sa
fe d
rinki
ng
wat
er
+++
Fluo
ridat
ion
of d
rinki
ng
wat
er
+
++
++
+=
++
+++
+++
+++
++
+++
+tt + ++
++
+ ? t+
+++
ttt
++
tt t++
ttt
+ + t t t t ++
+ + ++
t ++
t + tt - t t
+++ t t
ttt
+++
t+
++t
++t
++
tt tt t t+ + +
+++ + ++
+t
ttt t t tt t tt t
ttt
t ttt
t
ttt
t t
t -
t -
t -
ttt t
- tt
_ tt
_ t tt
_ tt
- ? t
_ t
1 tt t tt
-
ttt
- tt
+P
heny
lket
onur
ia/c
onge
nita
l hy
poth
yroi
dism
.

286
A
B
C
D
1
“1 Orn 0 60 60
Fig. 3. Theoretical possibilities for compression or expansion of morbidity. (A) Present situation: life expectancy, 75 years; healthy life expectancy, 60 years (solid bar); and period of less good health, 15 years (shaded bar). (g), (C) and (D), increase in life expectancy to 80 years: (6) best case scenario, compression of morbidity; (C) worst case scenario, merely expansion of morbidity; and (D) probable scenario, increase in healthy life expectancy and expansion of morbidity.
Conclusions
We have given a framework for determining the efficiency of prevention programmes. Prevention of disease is sometimes possible and sometimes not. Even if prevention of a specific disease is to some extent feasible, a prevention programme is not always called for. The expected ratio of benefits to costs should be favourable when compared to other prevention programmes. That does not mean that prevention should lead to a net financial benefit: this is often not the case. Prevention is worthwile for the health benefit it produces and there are many programmes that have proven their effectiveness. However, cost benefit ratios should be acceptable. The costs would depend on several components, including the possibility of shifts in morbidity and mortality patterns as a result of prevention programmes. These shifts should be taken into account when assessing whether a prevention measure is worthwhile: a reduction in incidence or specific mortality can no longer be accepted as the only outcome of a programme for the prevention of cancer or cardiovascular disease.
References
1 Lalonde, M., A new perspective on the health of Canadians, Ministry of National Health and Welfare, Ottawa, 1974.
2 World Health Organization - Regional OfI& for Europe, Targets for health for all: targets in support of the European regional strategy for health for all, WHO, Copenhagen, 1985.
3 Schaapveld, K., Bergsma, E.W., Van Ginneken, J.K.S. and Van de Water, H.P.A., Setting

281
priorities in prevention, The Netherlands Institute for Preventive Health Care - TNO, Leiden, 1990.
4 Romeder, J.M. and McWhinnie, J.R., Potential years of life lost between ages 1 and 70: an indicator of premature mortality for health planning, International Journal of Epidemiology, 6 (1977) 143-151.
5 Wong, O., A competing-risk model based on the life table procedure in epidemiological studies, International Journal of Epidemiology, 6 (1977) 153-159.
6 Fries, J.F., Green, L.W. and Levine, S., Health promotion and the compression of morbidity, Lancet, i (1989) 481-483.
7 Cohen, D.R. and Henderson, J.B., Health, prevention and economics, Oxford University Press, Oxford, 1988.
8 Breslow, L. and Cumberland, W.G., Progress and objectives in cancer control, JAMA, 259 (1988) 1690-1694.
9 Van Ginneken, J.K.S., Dissevelt, A.G., Van de Water, H.P.A. and Van Sonsbeek, J.L.A., Results of two methods to determine health expectancy in TheNetherlands in 1981-1985, Social Science and Medicine, 32 (1991) 1129-1136.
10 Robine, J.M. and Ritchie, K., Healthy life expectancy: evaluation of global indicator of change in population health, British Medical Journal, 302 (1991) 457460.