
Indian territory, descriptive, biographical and genealogical ...
Upload
khangminh22Category
view
4download
0
Dissertations and Theses
2019
Development of a Descriptive Model of Flow Disruption Effect on Development of a Descriptive Model of Flow Disruption Effect on
Bypass Time in a Cardiovascular Operating Room Bypass Time in a Cardiovascular Operating Room
Timothy J. Disher
Follow this and additional works at: https://commons.erau.edu/edt
Part of the Anesthesia and Analgesia Commons, Medical Humanities Commons, and the Surgical
Procedures, Operative Commons
Scholarly Commons Citation Scholarly Commons Citation Disher, Timothy J., "Development of a Descriptive Model of Flow Disruption Effect on Bypass Time in a Cardiovascular Operating Room" (2019). Dissertations and Theses. 456. https://commons.erau.edu/edt/456
This Dissertation - Open Access is brought to you for free and open access by Scholarly Commons. It has been accepted for inclusion in Dissertations and Theses by an authorized administrator of Scholarly Commons. For more information, please contact [email protected].
Running Head: CVOR Descriptive Model 1
DEVELOPMENT OF A DESCRIPTIVE MODEL OF FLOW DISRUPTION EFFECT
ON BYPASS TIME IN A CARDIOVASCULAR OPERATING ROOM
By:
Timothy J. Disher, M.S.
A dissertation submitted in partial fulfillment of requirements for the degree of Doctor of
Philosophy in Human Factors at Embry-Riddle Aeronautical University 2019
Dissertation Chair:
Albert J. Boquet, Ph.D.

CVOR Descriptive Model 2
Copyright 2019
by
Timothy J. Disher
CVOR Descriptive Model 4
Table of Contents - Sections:
Table of Contents – Figures: ................................................................................9
Table of Contents – Tables: ...............................................................................15
Abstract: .............................................................................................................16
Acknowledgements: ...........................................................................................18
Acronyms: ..........................................................................................................20
Chapter 1: Introduction ..................................................................................22
Forward ..............................................................................................................22
Medical Human Factors Overview ....................................................................23
Cardiovascular Operating Room: ......................................................................26
Team Members: .............................................................................................26
Bypass Time: .................................................................................................28
Flow Disruptions: ..............................................................................................29
RIPCHORD-TWA Taxonomy: .....................................................................31
Weaknesses in Current Methodology: ...........................................................34
Error Space: .......................................................................................................36
Flow Disruptions as Threats ..........................................................................36
Conceptualization: .........................................................................................37
Purpose of Current Research .............................................................................39
Preceding Studies: ..............................................................................................40
Medical University of South Carolina: ..........................................................40
Florida Hospital: ............................................................................................41

CVOR Descriptive Model 5
Chapter 2: Preliminary Analysis ....................................................................42
Data Available ...................................................................................................42
Normalized Data: ...........................................................................................42
Concept Visualization ........................................................................................43
Power Laws ....................................................................................................43
Prism Diagrams ..............................................................................................44
Heat Maps ......................................................................................................45
Correlational Development ................................................................................46
Correlational Testing .........................................................................................53
Three-Dimensional Correlational Mapping .......................................................59
Other Preliminary Analysis ...............................................................................62
Next Steps ..........................................................................................................63
Chapter 3: Model Theory ................................................................................64
Overview of Mathematical Modeling ................................................................64
Control Theory ...............................................................................................64
Markovian Chain ...........................................................................................64
Similar Research: ...............................................................................................67
Research Questions: ...........................................................................................69
Model Design .....................................................................................................72
Breakdown by Role........................................................................................73
Interaction of Roles ........................................................................................74
Breakdown by Major Category ......................................................................76
CVOR Descriptive Model 6
Methodology to be Employed ............................................................................76
Chapter 4: Model Development and Testing ................................................80
Procedural Modeling ..........................................................................................80
Mathematical Modeling .....................................................................................86
Final Mathematical Model .............................................................................89
Peripheral Task Absorbsion Factor ................................................................92
True Data Inclusion........................................................................................93
Visual Modeling ................................................................................................94
Image Models .................................................................................................94
Video Models .................................................................................................97
Chapter 5: Results ...........................................................................................98
Overall Results ...................................................................................................98
Breakdown by Team Member .........................................................................104
Anesthesia Role ...........................................................................................105
Circulating Nurse Role ................................................................................107
Perfusionist Role ..........................................................................................110
Surgical Role ................................................................................................113
Breakdown by RIPCHORD-TWA Category ...................................................116
Communication ............................................................................................116
Coordination ................................................................................................118
Equipment Issues .........................................................................................121
CVOR Descriptive Model 7
Interruptions .................................................................................................122
Layout ..........................................................................................................124
Usability .......................................................................................................127
Results Summary .............................................................................................128
Chapter 6: Discussion and Conclusions .......................................................129
CVOR Flow Disruptions .................................................................................129
General Analysis ..........................................................................................130
Error Space ...................................................................................................131
Modeling ......................................................................................................133
Breakdown by Team Member .....................................................................134
Interaction between Team Members ............................................................136
Breakdown by Major Category ....................................................................138
CVOR State Interpretation ...........................................................................140
Interventions ....................................................................................................143
Communication ............................................................................................143
Coordination ................................................................................................146
Equipment Issues .........................................................................................148
Interruptions .................................................................................................149
Layout ..........................................................................................................151
Usability .......................................................................................................153
Conclusions ......................................................................................................154
CVOR Descriptive Model 8
Recommendations for Future Research ...........................................................156
Limitations and Delimitations .........................................................................157
Limitations ...................................................................................................157
Delimitations ................................................................................................158
Chapter 7: Supporting Information ...........................................................1600
References: .....................................................................................................1600
Appendix A -- Complete RIPCHORD Taxonomy: .......................................1700
Appendix B – Visual Depiction of CVOR Data ............................................1733
Appendix C – Data, pre- & post- normalization ............................................1744
Appendix D – Select Surgeries ......................................................................1755
Appendix E – Layered Diagrams of FD Occurrence .....................................1811
Appendix F – Bypass FDs by Surgery ...........................................................2011

CVOR Descriptive Model 9
Table of Contents – Figures:
Figure 2.1: Demonstration of continuous line ..................................................... 44
Figure 2.2: Hexagonal prism diagram ................................................................. 45
Figure 2.3: Heatmap of data interaction showing correlations ............................ 46
Figure 2.4: Depiction of bypass time measures ................................................... 47
Figure 2.5: TBypass / TSurgery (Black) compared to total number of FDs (Blue) .... 48
Figure 2.6: TBypass / TSurgery (Black) compared to total duration of all FDs (Blue)
....................................................................................................... 49
Figure 2.7: TBypass / TSurgery (Black) compared to total duration of all overlapped
FDs (Blue) ..................................................................................... 49
Figure 2.8: TBypass / TSurgery (Black) compared to total duration double overlapped
FDs (Blue) ..................................................................................... 50
Figure 2.9: TBypass / TSurgery (Black) compared to total duration of triple
overlapped FDs (Blue) .................................................................. 50
Figure 2.10: TBypass / TSurgery (Black) compared to total duration quadruple or
greater overlapped FDs (Blue) ...................................................... 51
Figure 2.11: Real bypass time versus modified ................................................... 54
Figure 2.12: Total duration of all FDs during surgery by phase, phases 1, 3, 5 .. 57
Figure 2.13: Count of all FDs by phase and surgery ........................................... 58
Figure 2.14: Duration of all FDs by phase and surgery ....................................... 59
Figure 2.15: 3D Grid of FD duration and count by bypass time ......................... 60
Figure 2.16: Heatmap of Figure 2.15 (FD duration and count by bypass time) .. 60
Figure 2.17: Heatmap with surgery duration overlay .......................................... 61
CVOR Descriptive Model 10
Figure 2.18: Heatmaps with 2-FD and 4-FD overlaps ......................................... 62
Figure 3.1: Model Depiction by Role and Major Category ................................. 73
Figure 3.2: Model Depicting a 3-Team Member Interaction ............................... 75
Figure 4.1: Depiction of Simple Labyrinth .......................................................... 87
Figure 4.2: Representation of Y-Axis Variables ................................................. 95
Figure 5.1: Conglomerate Data for Time Between FDs Across Team Members –
Anesthesia (Green), Circulating Nurse (Light Blue), Perfusionist
(Purple), and Surgical (Red) ......................................................... 99
Figure 5.2: Conglomerate Data for FD Duration Across Team Members –
Anesthesia (Green), Circulating Nurse (Light Blue), Perfusionist
(Purple), and Surgical (Red) ....................................................... 100
Figure 5.3: Conglomerate Data for Time between FDs across RIPCHORD-TWA
Major Categories – Communication (Red), Coordination (Green),
Equipment Issues (Light Blue), Interruptions (Blue), Layout
(Purple) Usability (Pink) ............................................................. 101
Figure 5.4: Conglomerate Data for FD Duration across RIPCHORD-TWA Major
Categories – Communication (Red), Coordination (Green),
Equipment Issues (Light Blue), Interruptions (Blue), Layout
(Purple) Usability (Pink) ............................................................. 101
Figure 5.5: Scalogram Examples for Time Between FDs for Long Bypass
(surgery 11, left) and Short Bypass (surgery 8, right) ................ 102
Figure 5.6: Scalogram Examples for Duration of FDs for Long Bypass (surgery
11, left) and Short Bypass (surgery 8, right) ............................... 102
CVOR Descriptive Model 11
Figure 5.7: Three-Dimensional Scalogram for Surgery 11, Long Bypass Time,
Duration of FDs .......................................................................... 103
Figure 5.8: Three-Dimensional Scalogram for Surgery 8, Short Bypass Time,
Duration of FDs .......................................................................... 104
Figure 5.9: Anesthesia Role Conglomerate Data – Time Between FDs (Left) and
FD Duration (Right) .................................................................... 105
Figure 5.10: Anesthesia Role Time between FDs Full Data Bypass Comparison –
Long Bypass (Left) and Short Bypass (Right) ............................ 106
Figure 5.11: Anesthesia Role Time between FDs Bypass Comparison ............ 106
Figure 5.12: Anesthesia Role FD Duration Full Data Bypass Comparison – Long
Bypass (Left) and Short Bypass (Right) ..................................... 107
Figure 5.13: Anesthesia Role FD Duration Bypass Comparison ...................... 107
Figure 5.14: Circulating Nurse Role Conglomerate Data – Time Between FDs
(Left) and FD Duration (Right) ................................................... 108
Figure 5.15: Circulating Nurse Role Time between FDs Full Data Bypass
Comparison – Long Bypass (Left) and Short Bypass (Right) .... 108
Figure 5.16: Circulating Nurse Role Time between FDs Bypass Comparison . 109
Figure 5.17: Circulating Nurse Role FD Duration Full Data Bypass Comparison
– Long Bypass (Left) and Short Bypass (Right) ......................... 109
Figure 5.18: Circulating Nurse Role FD Duration Bypass Comparison ........... 110
Figure 5.19: Perfusionist Role Conglomerate Data – Time Between FDs (Left)
and FD Duration (Right) ............................................................. 111
CVOR Descriptive Model 12
Figure 5.20: Perfusionist Role Time between FDs Full Data Bypass Comparison
– Long Bypass (Left) and Short Bypass (Right) ......................... 111
Figure 5.21: Perfusionist Role Time between FDs Bypass Comparison ........... 112
Figure 5.22: Perfusionist Role FD Duration Full Data Bypass Comparison –
Long Bypass (Left) and Short Bypass (Right) ............................ 112
Figure 5.23: Perfusionist Role FD Duration Bypass Comparison ..................... 113
Figure 5.24: Surgical Role Conglomerate Data – Time Between FDs (Left) and
FD Duration (Right) .................................................................... 113
Figure 5.25: Surgical Role Time between FDs Full Data Bypass Comparison –
Long Bypass (Left) and Short Bypass (Right) ............................ 114
Figure 5.26: Surgical Role Time between FDs Bypass Comparison ................ 114
Figure 5.27: Surgical Role FD Duration Full Data Bypass Comparison – Long
Bypass (Left) and Short Bypass (Right) ..................................... 115
Figure 5.28: Surgical Role FD Duration Bypass Comparison ........................... 115
Figure 5.29: Communication Major Category Conglomerate Data – Time
Between FDs (Left) and FD Duration (Right) ............................ 116
Figure 5.30: Communication Major Category Time between FDs Full Data
Bypass Comparison – Long Bypass (Left) and Short Bypass
(Right) ......................................................................................... 117
Figure 5.31: Communication Major Category Time between FDs Bypass
Comparison ................................................................................. 117
Figure 5.32: Communication Major Category FD Duration Full Data Bypass
Comparison – Long Bypass (Left) and Short Bypass (Right) .... 118
CVOR Descriptive Model 13
Figure 5.33: Communication Major Category FD Duration Bypass Comparison
..................................................................................................... 118
Figure 5.34: Coordination Major Category Conglomerate Data – Time Between
FDs (Left) and FD Duration (Right) ........................................... 119
Figure 5.35: Coordination Major Category Time between FDs Full Data Bypass
Comparison – Long Bypass (Left) and Short Bypass (Right) .... 119
Figure 5.36: Coordination Major Category Time between FDs Bypass
Comparison ................................................................................. 120
Figure 5.37: Coordination Major Category FD Duration Full Data Bypass
Comparison – Long Bypass (Left) and Short Bypass (Right) .... 120
Figure 5.38: Coordination Major Category FD Duration Bypass Comparison . 121
Figure 5.39: Equipment Issues Major Category Conglomerate Data – Time
Between FDs (Left) and FD Duration (Right) ............................ 122
Figure 5.40: Interruptions Major Category Conglomerate Data – Time Between
FDs (Left) and FD Duration (Right) ........................................... 122
Figure 5.41: Interruptions Major Category Time between FDs Full Data Bypass
Comparison – Long Bypass (Left) and Short Bypass (Right) .... 123
Figure 5.42: Interruptions Major Category Time between FDs Bypass
Comparison ................................................................................. 123
Figure 5.43: Interruptions Major Category FD Duration Full Data Bypass
Comparison – Long Bypass (Left) and Short Bypass (Right) .... 124
Figure 5.44: Interruptions Major Category FD Duration Bypass Comparison . 124
CVOR Descriptive Model 14
Figure 5.45: Layout Major Category Conglomerate Data – Time Between FDs
(Left) and FD Duration (Right) ................................................... 125
Figure 5.46: Layout Major Category Time between FDs Full Data Bypass
Comparison – Long Bypass (Left) and Short Bypass (Right) .... 125
Figure 5.47: Layout Major Category Time between FDs Bypass Comparison . 126
Figure 5.48: Layout Major Category FD Duration Full Data Bypass Comparison
– Long Bypass (Left) and Short Bypass (Right) ......................... 126
Figure 5.49: Layout Major Category FD Duration Bypass Comparison ........... 127
Figure 5.50: Usability Major Category Conglomerate Data – Time Between FDs
(Left) and FD Duration (Right) ................................................... 127
Figure 6.1: Total frequencies by major category from MUSC data set (Cohen et
al, 2016a)..................................................................................... 130
Figure 6.2: Total frequencies by team role from MUSC data set (Cohen et al,
2016a) ......................................................................................... 130
Figure 6.3: Average resolution time by major category across both data sets .. 131
Figure 6.4: Error space for Interruptions and Communication categories (Boquet
et al., 2017a) ................................................................................ 132
CVOR Descriptive Model 15
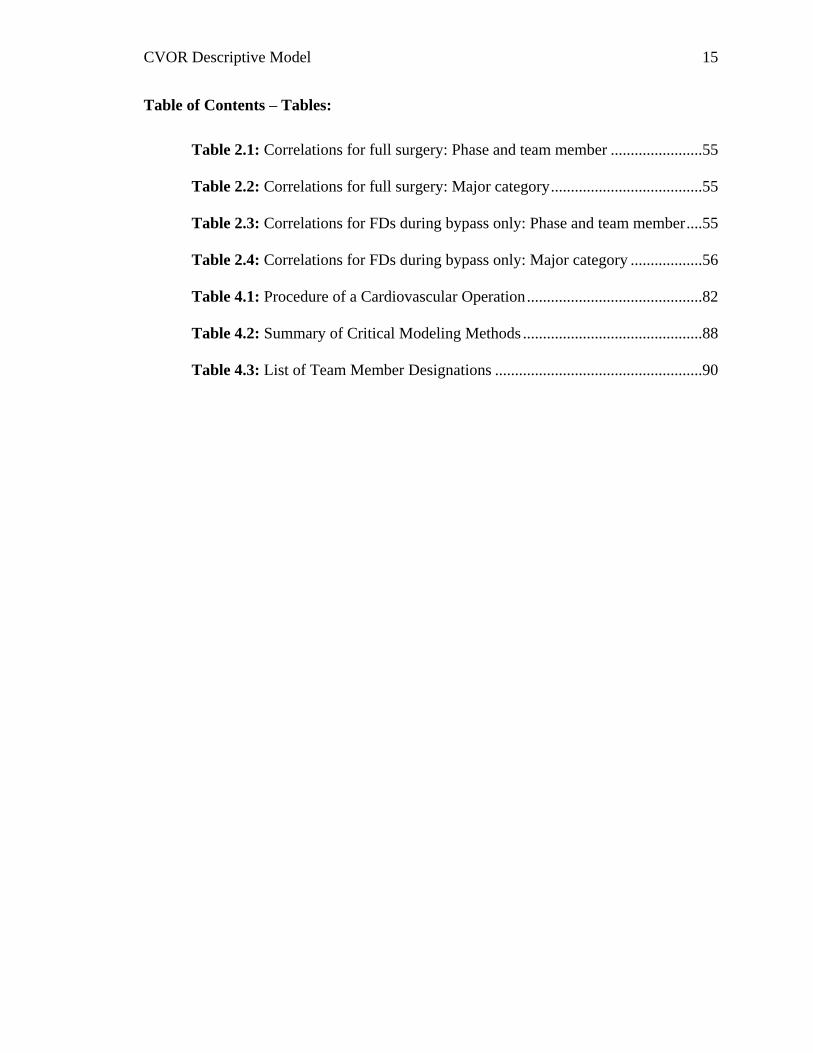
Table of Contents – Tables:
Table 2.1: Correlations for full surgery: Phase and team member .......................55
Table 2.2: Correlations for full surgery: Major category ......................................55
Table 2.3: Correlations for FDs during bypass only: Phase and team member ....55
Table 2.4: Correlations for FDs during bypass only: Major category ..................56
Table 4.1: Procedure of a Cardiovascular Operation ............................................82
Table 4.2: Summary of Critical Modeling Methods .............................................88
Table 4.3: List of Team Member Designations ....................................................90
CVOR Descriptive Model 16
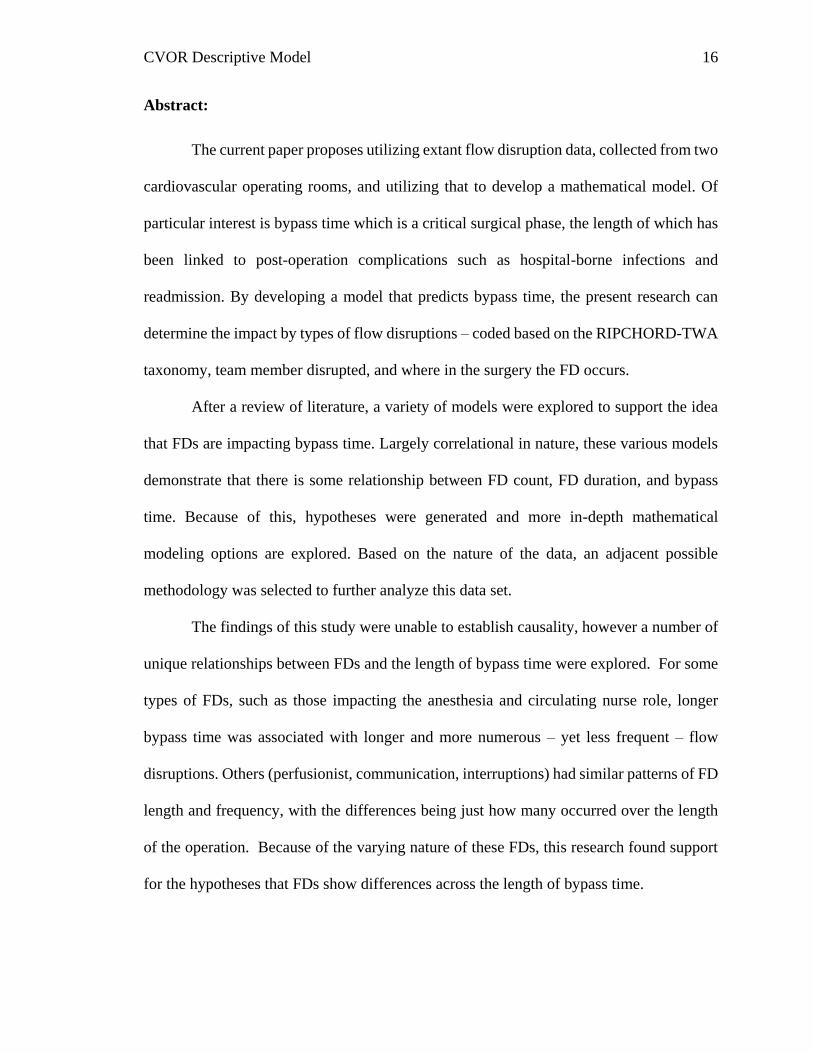
Abstract:
The current paper proposes utilizing extant flow disruption data, collected from two
cardiovascular operating rooms, and utilizing that to develop a mathematical model. Of
particular interest is bypass time which is a critical surgical phase, the length of which has
been linked to post-operation complications such as hospital-borne infections and
readmission. By developing a model that predicts bypass time, the present research can
determine the impact by types of flow disruptions – coded based on the RIPCHORD-TWA
taxonomy, team member disrupted, and where in the surgery the FD occurs.
After a review of literature, a variety of models were explored to support the idea
that FDs are impacting bypass time. Largely correlational in nature, these various models
demonstrate that there is some relationship between FD count, FD duration, and bypass
time. Because of this, hypotheses were generated and more in-depth mathematical
modeling options are explored. Based on the nature of the data, an adjacent possible
methodology was selected to further analyze this data set.
The findings of this study were unable to establish causality, however a number of
unique relationships between FDs and the length of bypass time were explored. For some
types of FDs, such as those impacting the anesthesia and circulating nurse role, longer
bypass time was associated with longer and more numerous – yet less frequent – flow
disruptions. Others (perfusionist, communication, interruptions) had similar patterns of FD
length and frequency, with the differences being just how many occurred over the length
of the operation. Because of the varying nature of these FDs, this research found support
for the hypotheses that FDs show differences across the length of bypass time.
CVOR Descriptive Model 17
Most importantly, this project brings with it a new understanding of the nature of
the CVOR and the nature of flow disruptions occurring within it. The FDs are not
themselves Markovian, and they are not just noise within the system either. By utilizing
the adjacent possible methodology and applying that to the CVOR, this project helps to
work past barriers in analyzing the system. The process itself, the surgical procedure, can
be considered Markovian. Flow disruptions therefore must fit into this system to be better
understood. The final conclusions of this project are that FDs represent adjacent possible
clouds nested within the Markovian process, demonstrated through the presented data.
Keywords: Flow Disruptions, Bypass Time, Mathematical Modeling,
Cardiovascular Operating Room (CVOR)

CVOR Descriptive Model 18
Acknowledgements:
My first thanks has to go to Dr. Albert Boquet, my incredible advisor who has
guided me through this long and arduous process. Without your support and wisdom this
project would not have been possible. I’ve learned a lot from you through the years of my
graduate career, both on this project, other projects I’ve been involved in, and in the
handful of classes I’ve taken with you. Your constant willingness to help out and your
humor has helped to see me through and ensured I’d have the ability to succeed. I also am
very grateful to Dr. Andrei Ludu, who has been an unofficial second advisor on this
work. Your consistent hard work and your expertise has allowed this project to become a
reality. You’ve probably put in far more hours than I realize, and I know that there is no
way I could have accomplished this without you. I’d also like to thank both Dr. Scott
Shappell and Dr. Stephen Rice for adding your input and insight into this project and
helping it to reach its potential. Finally, for the research itself, I have to extend my
gratitude to those whose work I’ve built off of – Dr. Boquet and Dr. Shappell again, plus
a number of their former students: Dr. Tara Cohen, Dr. Tracey Litzinger, Jen Cabrera,
and several others who I never met, and whose contribution I’ll never truly realize. I feel
I’m truly standing on the shoulders of giants, and I’m so grateful for the opportunity your
work has given me.
I would also like to extend a huge thank you to Grey, my partner. You have been
there for me through so much, providing love and support and a fair deal of
encouragement. This process has not been the easiest on either of us, and I am so grateful
for the sacrifices you have made to make this dream a reality. I could not have done this

CVOR Descriptive Model 19
without you, and I love you so much. We’re finally moving on to the next phase of our
lives, and I can’t imagine someone I’d rather continue through this adventure with.
Additionally, I would like to extend my thanks to my friends and family who have
provided support through the past few years. Special shout-outs to Tony, Emily, and
Victoria for the fun times we’ve had together: you three especially have made this
experience a fun one and I’ll never forget the laughs we’ve shared. Also thank you to my
wonderful friends from before Riddle: Stacia, Glen, and Aaron – each of whom I’ve
known for many years, and although our paths have taken us to drastically different
places I know I can always count on your support. Finally, I would like to thank my
parents, who have supported me, believed in me, and pushed me to reach beyond where I
imagined I’d be a decade ago. I know you both are proud of what I’ve accomplished, and
that pride has helped to sustain me.
CVOR Descriptive Model 20
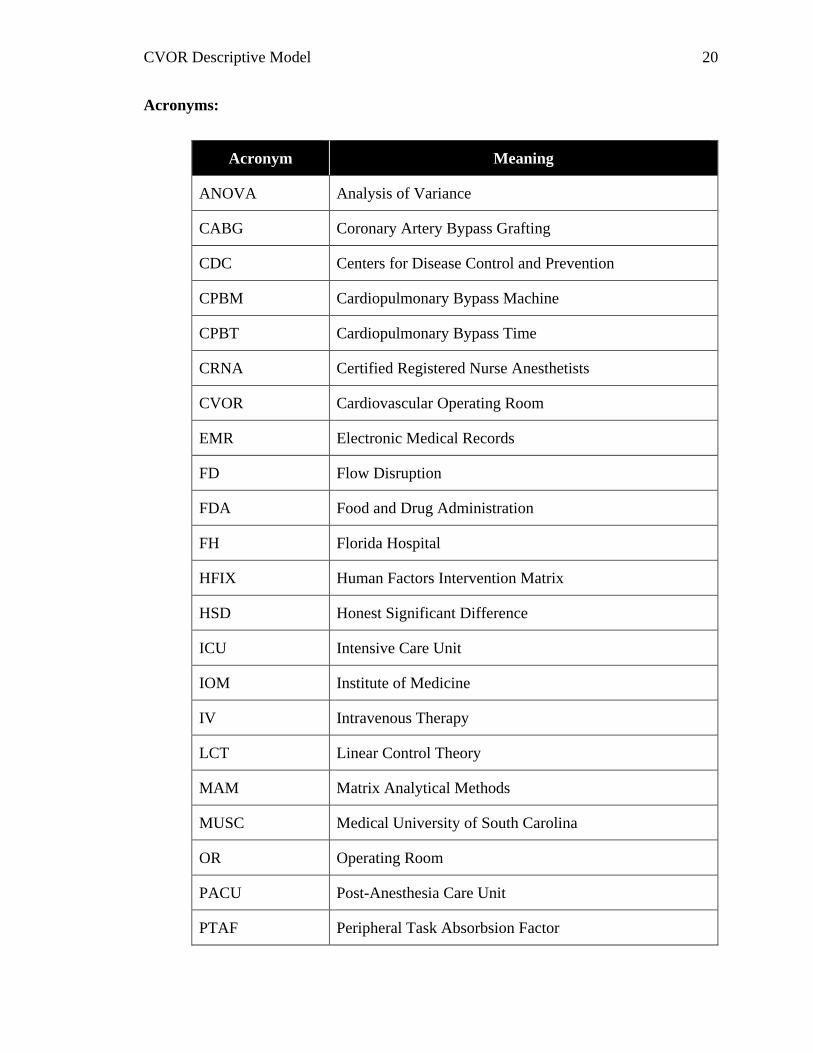
Acronyms:
Acronym Meaning
ANOVA Analysis of Variance
CABG Coronary Artery Bypass Grafting
CDC Centers for Disease Control and Prevention
CPBM Cardiopulmonary Bypass Machine
CPBT Cardiopulmonary Bypass Time
CRNA Certified Registered Nurse Anesthetists
CVOR Cardiovascular Operating Room
EMR Electronic Medical Records
FD Flow Disruption
FDA Food and Drug Administration
FH Florida Hospital
HFIX Human Factors Intervention Matrix
HSD Honest Significant Difference
ICU Intensive Care Unit
IOM Institute of Medicine
IV Intravenous Therapy
LCT Linear Control Theory
MAM Matrix Analytical Methods
MUSC Medical University of South Carolina
OR Operating Room
PACU Post-Anesthesia Care Unit
PTAF Peripheral Task Absorbsion Factor
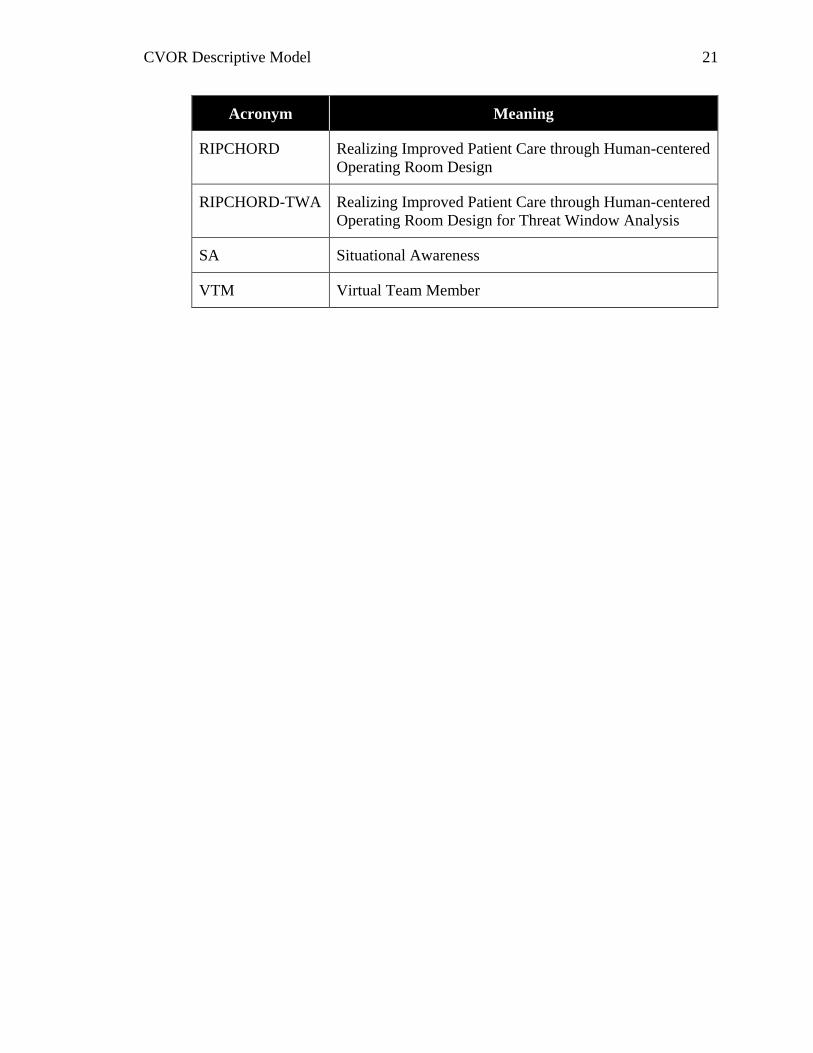
CVOR Descriptive Model 21
Acronym Meaning
RIPCHORD Realizing Improved Patient Care through Human-centered
Operating Room Design
RIPCHORD-TWA Realizing Improved Patient Care through Human-centered
Operating Room Design for Threat Window Analysis
SA Situational Awareness
VTM Virtual Team Member
CVOR Descriptive Model 22
Chapter 1: Introduction
Forward
In the medical setting, patient safety and outcomes are always of utmost concern.
There are many aspects that influence these factors, such as resources available and pre-
existing conditions. What is not well understood is how small distractions in an operating
room, which could be as simple as an off-topic conversation, can contribute to these
negative outcomes. These small events, termed flow disruptions, have been observed
many times in different surgical environments. This includes several preceding studies
that have collected data from a cardiovascular operating room (CVOR) through
observational research.
The current dissertation is a research project that sheds more light on flow
disruptions in the CVOR. Specifically, this project addresses the question “Do flow
disruptions impact patient outcomes?” To address this question accurately, mathematical
modeling techniques were employed to thoroughly explore the impact these flow
disruptions have. For patient outcomes, bypass time – a critical phase in the CVOR – was
examined because of previously established links to patient well-being. Because of this,
the question this study answers can more specifically be stated as “Can a mathematical
model of flow disruptions be developed that can predict bypass time in a CVOR?”
The remainder of Section 1 will introduce the CVOR environment, the construct
of flow disruptions, and the previous studies that formed the foundation for this research.
Section 2 builds the justification for development of a mathematical model, through some
background research as well as some preliminary modeling using various correlational
and visual methods. Section 3 presents a literature review specific to mathematical

CVOR Descriptive Model 23
modeling and outlines the type of modeling chosen to address the goals of this project, as
well as present the hypotheses. Section 4 walks through developing the mathematical
model with the results of this research presented in Section 5. Finally, Section 6 presents
the discussion and conclusions, and Section 7 wraps up the document with supporting
information such as references and appendices.
Medical Human Factors Overview
Human factors is a broad and interdisciplinary science which draws heavily from
both psychology and engineering (Misasi & Keebler, 2017). The application of a
“systems” approach simply means that all components of an operational system should be
considered during a review/evaluation so that, if needed, the appropriate improvements
can be made. Human factors system components include the technology, operational
environment and other humans. Human factors plays an important role in many different
industries. The current project focuses on the medical industry, a complex environment
where success or failure by individuals and the teams they are on can mean life or death
for patients.
The push for human factors in healthcare owes its roots to a report from almost
two decades ago by Kohn, Corrigan, and Donaldson (2000). Compiled for the Institute
of Medicine (IOM), it aimed at understanding deaths occurring across the US healthcare
system. Fittingly called To Err is Human, this report suggested as many as 98,000
preventable deaths occur annually. Years later, James (2013) pushed this number to as
many as 400,000 deaths due to human error. These alarming and increasing numbers –
which only account for fatalities, and not a variety of other life-altering and costly
mistakes – resulted in substantial interest in human factors from the medical field.
CVOR Descriptive Model 24
Many researchers have produced system evaluation methods that lead to
improvements aimed at reducing incidents contributing to the high patient morbidity and
mortality rate. Human factors interventions have had a major impact on this industry: for
example, ICUs across Michigan reduced costly and life-threatening, catheter-related
bloodstream infections by as much as 66% (Pronovost et al., 2006). This was
accomplished by the development of (among other things) a checklist for catheter
insertion and maintenance. This simple but effective intervention demonstrated that by
identifying where human breakdowns occur, both general and individualized procedural
changes can help hospitals improve patient care and reduce patient morbidity &
mortality.
The complexity of the healthcare system also creates opportunities for Human
Factors researchers to implement changes aimed at simplifying the system. These
changes may take on a variety of forms, and can focus on individuals, teams, or the
environment. For example, a human factors specialist may focus on procedures to ensure
a sterile field is not violated by an individual’s tasks. On the team level, training may be
created and implemented to improve communication techniques and ensure correct
information is passed on among team members. For the environment, a human factors
specialist may be employed to help design the ideal layout of a surgical suite, or by the
interface design of medical equipment to ensure that controls and interfaces are
ergonomically sound. Human factors is a broad field, with many different sub-fields that
share a common tie: where humans are involved in a complex system such as healthcare,
human factors can be employed.
CVOR Descriptive Model 25
Just a few years ago, Mitchell, Shuster, Smith, Pronovost, and Wu (2015) wrote a
paper exploring expert opinions on the impact the IOM report had, and if after 15 years
the industry had changed to address the concerns. Specifically, the researchers explored
reporting systems to see if they had lived up to the thoroughness often cited from the
aviation industry. The findings suggested that these reporting systems often fall short of
desired outcomes. Although many are sound in theory they are often wrought with issues
such as inadequate processing of the reports, lack of funding, and a dearth of institutional
support that prevents these systems from being efficiently employed. Issues in healthcare
aren’t just limited to the U.S., other countries such as New Zealand (Perezgonzalez,
2013) are still facing an overwhelming need to respond to human error. Modernizing the
healthcare field, therefore, still has a lot of room for growth.
With respect to interventions employed, unfortunately, the medical field has
historically utilized a reactive approach to identify and mitigate threats. Research has
primarily focused on accident and incident data to pinpoint areas of human error. While
this method has been effective for recognizing adverse events in the past, it may not be
the best technique for understanding threats to patient safety. Conversely, patient
safety may be significantly better served by employing a proactive approach
that will allow for an early detection of underlying threats before they manifest and
become hazardous. The current research is on this edge of human factors, aiming to use
existing data in order to construct a descriptive model that can work to prevent future
errors, by understanding the complexities of the current system.
CVOR Descriptive Model 26
Cardiovascular Operating Room:
Surgery is typically considered a life-changing and life-saving event.
Unfortunately, at the same time, surgical procedures are a major stressor on an individual.
This sometimes results in death on the operating table, or death from complications post-
operation (e.g. postoperative blood loss, hospital borne infection). The cardiovascular
operating room (CVOR) is just one of the many surgical environments employed by
hospitals and surgical centers across the world, but due to its commonality (≈11% of
Americans living with heart disease, CDC, 2015), as well as criticality and level of
invasiveness, it is of particular interest.
Team Members:
Surgery is a complex system involving a wide range of equipment, supplies, and
people. Although not a comprehensive list of individuals who are involved at some point
in the process, the present research is exploring four separate roles or sub-groups which
are critical to CVOR operation. These are anesthesia, circulating nurse, perfusionist, and
the surgical team.
The anesthetist role has two separate positions that fall into this category,
depending on the phase of the operation. The two sub-roles are the physician
anesthesiologist, a medical doctor specialist, and the nurse anesthesiologist, or certified
registered nurse anesthetist (CRNA). This team is responsible for monitoring and
managing a patient’s pain, level of sedation, as well as sustaining critical life functions
affected by surgery (American Society of Anesthesiologists, 2017). Apart from setting
up the operation, typically only one of these individuals is in the CVOR at a time,
CVOR Descriptive Model 27
monitoring vitals and administering drugs as needed. The anesthesia role falls outside of
the sterile field.
The circulating nurse is a critical role, responsible for coordinating the procedure
and ensuring patient is safe and comfortable (Matson, 2001). This individual is the
connection across the sterile field. Over the course of a surgery, a circulating nurse will
assist team members in donning and doffing their sterile gear, obtaining resources from
outside of the sterile field or even outside of the room for other members of the team,
communicating between the team within the room and hospital personnel outside of it,
and documentation of equipment and the procedure.
The perfusionist is the team member responsible for operating the
cardiopulmonary bypass machine (Texas Heart Institute, 2016). During those periods of
the surgery where the patients’ heart is stopped, the cardiopulmonary bypass machine
(CPBM) both oxygenates the patient’s blood and circulates this oxygenated blood
through the patient in order to maintain life. The perfusionist monitors the CPBM and
blood content, and in some cases, will administer drugs through their equipment.
The surgical team encompasses those individuals in the sterile field operating on
the patient directly. This includes the surgeon, who is the primary lead in the surgery and
the one operating directly on the patient, and their first assist. The scrub nurse or nurses
are also a part of this team, and are responsible for a variety of tasks based around
ensuring the surgeon has the necessary equipment. This ranges from getting tools and
equipment from the circulating nurse across the sterile field to preparing and handing
equipment to the surgeon for use (Nursing Crib, 2017). This individual also is critical in
ensuring the sterile field is not broken.
CVOR Descriptive Model 28
Bypass Time:
As with any process, surgery in a CVOR can easily be divided into different
chunks of time, or phases. Many of these phases are almost universally common across
surgery types and locations, broken down into perioperative, preoperative, intraoperative,
postoperative, and post-discharge (American College of Surgeons, 2018). The
perioperative phase covers the entire surgical experience at the hospital, with
preoperative, intraoperative, and postoperative phases encompassed within it. The
preoperative phase begins when the patient is admitted to the hospital and continues until
they are moved to the surgical room, which includes appraisal, consulting, verification of
the procedure, to name a few. The Intraoperative phase encompasses the entire time the
patient is in the surgical room, which begins with preparing the site and anesthetizing the
patient, and continues through the operation itself, suturing, and bandaging up the patient.
The postoperative phase is the time the patient is observed in the PACU, leading up until
they are discharged. The final phase, post-discharge, involves any necessary follow-up to
ensure the operation was successful, as well as recovery and potentially rehabilitation.
It is during the intraoperative phase that a lot of procedure-specific differences
occur. In typical cardiovascular surgery, for instance, after the patient has been
anesthetized there are a number of specific steps that take place. The surgeon must first
access the heart, which typically involves an incision on the chest, followed by a cut
through the breastbone and spread of the ribcage. The patient is then attached to a bypass
machine. Following this, the surgeon performs the operation – in a coronary artery
bypass grafting (CABG), this is where a healthy vein or artery is used to make a new path
around the block. Finally, the surgeon closes up the breastbone and sutures the outer cut.
CVOR Descriptive Model 29
Cardiopulmonary bypass time (CPBT) is unique to cardiovascular surgery and
can be considered a critical phase. This activity is incredibly invasive, because during
this process the patient’s blood is oxygenated not through the lungs, but rather via the
cardiopulmonary bypass machine. While this process has revolutionized cardiovascular
surgery, it leaves room for bacteria and viruses to be acquired. Additionally, the fact that
oxygen is added by the machine, without the benefit of the body’s own system to filter it
out of the air means that oxygen levels are maintained via the perfusionist in concert with
the anesthesiologist. Because of these factors, CPBT brings with it the potential of harm
to the patient. For example, Salis and colleagues (2008) found that the length of CPBT
was a predictor of post-operative complications such as rates of hospital-borne infections
and internal bleeding. This research demonstrated that CPBT could independently
predict patient morbidity and mortality. This finding underscores the importance of
mitigating those events that may serve to lengthen the bypass time and by default
increase the risk of harm to the patient.
Flow Disruptions:
A flow disruption (FD) can be defined as delays or deviations from the natural
progression of a task or care that potentially compromises the safety and efficiency of the
process (Shouhed et al., 2014; Wiegmann, El Bardissi, Dearani, Daly & Sundt, 2007).
The presence of events impacting patient outcomes have been included in modeling of
the state of the OR for quite some time. One example is the Systems Engineering
Initiative for Patient Safety (SEIPS), which took an engineering approach to understand
the overall surgical system (Carayon et al., 2003; Carayon et al., 2006). FDs are
CVOR Descriptive Model 30
important to identify, address, and ideally prevent because of the adverse effect they can
have on outcomes.
The impact that FDs have is not fully understood, but pieces of the complex
system have been addressed many times by many different authors. Hazlehurst,
McMullen, and Gorman (2007), for example, explored information exchanges between
surgeon and perfusionist such as “goal-sharing” and “explanation”, which had a positive
impact on clarity in the operating room. Although discussed as a positive outcome, these
communication pathways are always in danger of being disrupted. If the discussion lacks
clarity, for example, the sender may have to repeat their information, or the receiver may
continue to operate off of unclear instructions.
The CVOR is an early area where FDs were studied in the healthcare industry.
Catchpole and colleagues (2007a) started this line of research by examining errors in
handoffs between surgery and intensive care, finding a large amount of technical errors
and information omissions. The authors applied interventions tailored to the issues, many
of these based off of other industries such as aviation. Analyses were also conducted on
what were termed ‘minor failures’, which included FDs such as equipment failures,
distractions, failures in planning, and coordination & communication absences
(Catchpole et al., 2007b). Although not termed FDs, these two studies worked towards
the same concept proposed by Wiegmann and colleagues (2007), which outlined the
impact that disruptions can have in a medical system. Wiegmann focused on the CVOR,
and specifically looked at the relationship that exists between flow disruptions and
medical errors, demonstrating that some linearity exists between them: where more flow
disruptions were related to increased numbers of errors during surgery.
CVOR Descriptive Model 31
The identification of the relationship between flow disruptions and errors by
Wiegman and colleagues (2007) motivated many medical researchers to use flow
disruptions as a starting point in addressing medical errors and the potential for increased
morbidity and mortality. For example, a number of studies focused on trauma care FDs,
due to the time constraints and lack of intact teams. These investigations were critical in
understanding both the types of FDs which were most common, as well as threats to
specific tasks. Blocker and colleagues (2012), found that the majority of FDs resulted
from coordination and communication issues, with a full 80% causing at most a
momentary delay. A follow-up study (Blocker et al., 2013) examined more closely the
CT scan associated with trauma care, finding a similar pattern of types of FDs observed.
A post-hoc analysis of the data (Catchpole et al., 2013) explored the transitions occurring
between different locations in the hospital, and found the majority of FDs in transition
were coordination issues. Finally, Catchpole and colleagues (2014) were able to reduce
flow disruptions following the introduction of data-driven interventions to trauma care.
For the present research, FDs are conceptualized as a state of being. For example,
if an individual faced a FD, they would transfer from a state of no FDs to the state of “in
disruption”. Essentially, at any given moment, every individual or team is either in an
FD state or not in one, with a state change occurring at the start and stop of an FD.
RIPCHORD-TWA Taxonomy:
Taxonomy is a method or metric for classification. In the investigational side of
human factors, this term commonly is applied to a system of classifying negative events
such as flow disruptions. The taxonomy Realizing Improved Patient Care through
Human-centered Operating Room Design (RIPCHORD) is one such taxonomy that was
CVOR Descriptive Model 32
originally developed to identify points of concern in a CVOR from an architectural
standpoint (Palmer et al., 2013). This taxonomy divided potential errors into a total of six
separate major categories (communication, usability, physical layout, environmental
hazards, general interruptions, and equipment failures). These were further divided into
minor categories, with a total of 33 listed. In this early form, this taxonomy was focused
on the impact of the environment, such as how the room is laid out, what structures could
block communication, and where different team members moved through the space.
Over several years, this taxonomy was adjusted to focus more on the members of
the team, instead of on the environment that they operated in. This shift resulted in the
creation of the Threat Window Analysis version of RIPCHORD, earning it the moniker
RIPCHORD-TWA, as developed and employed by Boquet and colleagues (2016). The
original major categories would be adjusted to include communication, usability, layout,
interruptions, coordination, and equipment issues, showing a shift from the
environmental to the team function. Similar to the original iteration, RIPCHORD-TWA
features minor categories, this time a total of 37. The complete breakdown of minor
categories can be found in Appendix A.
Communication FDs are those that affect the ability of the team to transfer
necessary information. This category encompasses both verbal and non-verbal
communication, however the majority of FDs identified in this category are classified as
verbal (Boquet, et al., 2017a; Cohen, et al., 2016a). An example would be two individuals
talking about something unrelated to the current task, in one instance two individuals had
a discussion about how one of the new nurses was performing and what direction their
training should take (ID 2266, minor category: nonessential communication). In another

CVOR Descriptive Model 33
event, the anesthesiologist had to repeat themselves several times to the surgeon to be
heard over the sound of the saw (ID 4496, minor category: environmental noise).
Usability FDs are made up of issues surrounding the ability of users to operate a
piece of equipment or interact with an interface. These FDs are defined by interfaces that
lend themselves to inaccuracies and inefficiencies. Examples of usability FDs observed
were the scrub nurse having a difficult time removing the cover from a drape (ID 1454,
minor category: barrier design), or the anesthesia resident having a difficult time
separating packaging in order to start a new IV drip (ID 5105, minor category: packaging
design).
Layout FDs involve issues with the space the surgery team is in. These range
from the room or even hospital itself to individual workspaces within the CVOR. A
“Connector Positioning” FD that was observed involved the circulating nurse attempting
to unplug a device from an outlet on the boom that they couldn’t reach without assistance
(ID 124), while an “inadequate space” FD involved the surgeon trying to move to the
patient after he had already scrubbed in, but due to equipment and other personnel had to
wait to move through without risking compromising sterility (ID 2907).
Interruptions are a broad category that covers a wide range of possible FDs.
These can range from the more mundane such as a “distraction” to more critical such as
“alerts”. Examples of these are the perfusionist dropping a bag of sodium chloride,
requiring a new one to be brought in (ID 1798, minor category: spilling/dropping), or the
surgeon ripping his glove during the operation, requiring him to replace it (ID 3926,
minor category: interaction with biohazards).
CVOR Descriptive Model 34
Coordination FDs cover personnel and protocol issues. This is the primary
category concerned with how the team in the CVOR is functioning together. An example
of a “personnel rotation” FD involved a new nurse starting their shift, requiring the
original nurse to take time away from their task to explain the current operation’s
specifics (ID 779), or a “protocol failure” FD which involved the circulating nurse having
to instruct the perfusionist to ensure that a perfusionist student was wearing their PPE
properly (ID 4735).
Finally, equipment issues are malfunctions with a machine or device within the
surgery. This category is divided into minor categories based on the personnel
responsible for operation of the piece of equipment. For example, a “Surgeon
Equipment” issue involved an issue with the saw causing the surgeon to have a difficult
time cutting open the chest cavity (ID 1856), or a “Perfusion Equipment” issue involved
a pump making a lot more noise than normal, causing a number of the team members to
stop what they were doing and try to investigate (ID 4948).
Weaknesses in Current Methodology:
On their own, FDs are a great method to attempt to describe what is happening in
a CVOR, or any other complex system. Unfortunately, there are weaknesses inherent
with the typical methods of FD research, and the conclusions that are reached as a result.
Analysis is often one area where there is a major weakness – conclusions drawn are
limited to descriptive statistics from the data including frequencies of different
classifications such as RIPCHORD categories, impact level, or team member affected
(e.g. Blocker, Eggman, Zemple, Wu & Wiegmann 2010; Blocker et al, 2012).
Oftentimes when more in-depth analyses are preformed they are in a more comparative
CVOR Descriptive Model 35
setting, such as looking at the changes in frequencies of FDs following interventions (e.g.
Catchpole et al, 2014). Although these types of studies bring a lot of value and provide
good insight into FD occurrences, they fail to address the true impact that each FD is
having.
FDs cover a wide range of different events, which occur over many different
stages in the operation. Because of this it is important to try to understand them beyond
just the presence or absence, but to understand how each one is impacting the operation
as a whole. Consider a stream as a metaphor for the operation, and each flow disruption
as a rock thrown into that stream. Some rocks might not have any noticeable impact on
the stream’s flow, a slight shift around the rock and back to the original course, while
others that are larger (longer time in disruption) or in different shapes or orientations
(different types of disruptions) may have a more noticeable impact. Additionally, smaller
disruptions may also have an impact if many of them pile up at the same place, instead of
landing spread out across the whole stream. The characteristics, the placement, and the
quantities of rocks will have an impact on how flow is disrupted, and the same is true for
FDs in the operating room: a critical phase like bypass time may not be impacted by
“nonessential communication” before the operation, but an “interaction with biohazards”
involving a glove tearing at the table during bypass time almost certainly would.
Because of the more complex reality of FDs, it is critical to their understanding to
map the impact using more thorough and complex methods. To address this, some
researchers have come up with other means of conceptualizing the impact FDs have on
the surgical system. One of the more recent methods describes them as an “error space”
(Boquet, Cohen, Diljohn, Reeves, & Shappell, 2017b).
CVOR Descriptive Model 36
Error Space:
Historical research into high-risk environments such as the healthcare industry
focused on errors themselves. For instance, Reason (1990; see also Shappell &
Wiegmann, 2000) developed the “Swiss Cheese” model, which aimed to describe the
errors occurring in a system. Reasons model focused on the different levels in a system
in which failures might occur. The 4 levels described by Reason included unsafe acts,
described as active failures, preconditions for unsafe acts, supervisory failures, and
organizational failures, with these three described as latent failures. These errors at
different levels were shown to exist as holes in the system, where failures in one layer do
not cause disaster overall, but instead allow for the potential of disaster if holes in the
various layers line up. An error, by Reason’s model, is a gap through which the system is
potentially compromised.
Flow Disruptions as Threats
The FDs described in the previous section are not stand-alone events, but rather
interconnected and contributing to the overall status of the surgery. This concept is
shown by previous work by Boquet and colleagues (2016) that introduced broken
window theory as a way to explaining the impact that FDs have. Developed originally by
Wilson and Kelling (1982), this theory was meant as a way to explain how crime
progresses in a neighborhood: as minor crimes and disrepair in a neighborhood goes
unaddressed, this sets the stage increasing criminal activity as more law abiding citizens
abandon the neighborhood and criminal elements proliferate. While this is a simplistic
explanation of a complex social issue, it isn’t much of a stretch to see how crime and
instability may become self-propagating. Similarly, in surgery, Boquet and colleagues

CVOR Descriptive Model 37
(2016) explained disruptions as a way to gauge the overall status of the system, giving a
glimpse at underlying issues that could manifest in more serious events occurring. The
exact effect of each individual FD, such as their impact on bypass time in a CVOR, is
more difficult to gauge; each FD may only directly impact a single team member, but
indirectly impact the overall operation. This is because flow disruptions are not
themselves errors in the operation, but instead are mental or physical distractions that
allow the possibility of errors to occur.
Boquet, Cohen, Reeves, and Shappell (2017a) made the observation that FDs may
impact situational awareness (SA), where each FD was described as a potential distractor
to the team members. As a result, as a result, when members of the surgical team
disengage from the primary task, this creates an opening or a space for errors or failure to
occur. This conceptualization is consistent with Smith and Hancock’s (1995) model
which refers to SA as externally directed consciousness that an individual displays during
a task. It doesn’t exist within the individual or the environment, but is instead due to the
interaction and understanding from the individual as they affect – and are affected by –
the environment around them. By considering FDs as potential threats to SA, past
research (Boquet et al., 2017a; 2017b) has built a theoretical need to limit them.
Conceptualization:
To build an understanding of FDs for the current project, the concept of an error
space is utilized, which is also referred to as a threat window (Boquet et al., 2017b).
Similar to the visual holes in Reason’s Swiss Cheese, the error space is symbolic of the
potential gap within which errors may occur. By quantifying this value in a way that
demonstrates the impact on SA, it is theoretically possible to determine the actual effect

CVOR Descriptive Model 38
individual FDs – as well as the overall interaction of multiple FDs – have on the
efficiency of the operation and on critical phases such as bypass time.
The error space itself goes beyond counts of FDs, and instead focuses on the time
to resolve each one. The effect that time has on these FDs makes logical sense: a 3
minute long phone call that the circulating nurse has to clarify details of the surgeon’s
next case would cause more distraction than a phone call that only lasted 10 seconds to
update management on when the current operation will be finished. In the middle of an
operation, time is critical, and longer periods pulled away from task – even if just
partially on a mental level due to off-topic conversations – creates a threat window. Past
research (Boquet et al, 2017a; 2017b) calculated threat windows based off of the time to
resolve FDs. This was also aggregated based on categories using RIPCHORD-TWA.
These lengths of time, both for single FDs and for aggregated categories of FDs,
represent the amount of time the team member impacted is off-task, therefore lowering
their SA and increasing the likelihood that errors occur. This is drastically different than
research that focused on counts of different types of FDs, because length of FD is an
important variable necessary to accurately describing the impact.
While researchers have visually depicted the error space for FDs in a hospital
setting (see Boquet et al, 2017a; 2017b), it is much more challenging to quantify. Efforts
have also been made to calculate the volume of the shape produced, but as Feldman
(2013) notes, the volume of the shape in a radar plot is directly tied to the number of axes
utilized by the data, as well as the order in which the axes are arranged. This means that
quantitative comparisons between error spaces tend to lack validity. The purpose of the
CVOR Descriptive Model 39
present research is to take this gap in applicability and develop a new concept for
describing and modeling the error space.
The reason for this is because a wide array of research (e.g. Boquet et al, 2017a;
2017b; Blocker et al, 2010; 2012; Catchpole et al, 2013; Cohen et al, 2016a; 2016b;
Wiegmann et al, 2007) has shown the presence of what have been categorized as FDs, yet
the actual effect that these have on the state of the operation is still unknown. If the
previously developed error space theory is viable, a more mathematically rigorous model
can be created to show how the error space allows potential disarray into the operating
room. Basing this model on types of disruptions, length of disruptions, and who is
affected, the findings of the present research can build a better understanding of the
CVOR. This has implications for both hospital operations, and more importantly patient
wellbeing. By understanding the impact FDs have on the CVOR environment, tailored
interventions can be developed that address specific needs.
Purpose of Current Research
This chapter so far has discussed the CVOR, with emphasis on team members and
phases such as the critical CPBT. Additionally, the concept of flow disruptions has been
introduced, and the theory behind them. Moving forward, several research questions will
be asked over the course of this project. These will be addressed in more detail in
Chapter 3.
The first question is if the creation of a more rigorous mathematical model is even
feasible. Because the current study will be focused on extant data, this will be difficult –
data collection cannot be tailored to the model. This will impact the predictive power,
and the methodology that can be employed. There still is a lot of data to work with, so
CVOR Descriptive Model 40
the current project will start by answering the question “Can CPBT be described or
predicted based on the occurrence of flow disruptions?”. By exploring mathematical
modeling from previous research, and developing theory to move forward, this question
will be addressed.
Once a model is established, the other important question is “what characteristics
of flow disruptions impact bypass time?”, or alternatively “what characteristics of flow
disruptions are related to bypass time?”. There are three factors that will be explored in
the current project: team member role, RIPCHORD-TWA category, and interactions
between team members. All three of these factors will be explored separately, with the
developed models focusing on presenting data for each of these.
Preceding Studies:
The research proposed in the current paper is not a complete stand-alone project,
but instead a continuation of past research into FDs at two separate CVORs. Several
surgeries were already observed (n = 40), with a large number of different flow
disruptions noted across the surgeries (n = 5111). A mean of 127.78 FDs were observed
per case, with a large standard deviation (74.27) partially attributable to the variance in
collection – number of team members observed differed from case to case.
Medical University of South Carolina:
The first part of the data consists of a total of 15 cases (Cohen et al., 2016a)
collected at The Medical University of South Carolina (MUSC). Data was collected by
observation from student researchers embedded within three separate surgical teams.
Three team members were observed (anesthetist, circulating nurse, perfusionist), with
two team members observed at one time. Because of this, each team member was
CVOR Descriptive Model 41
observed for 10 of the 15 cases. A dedicated observer was assigned to a single team
member for each case, meaning that 2 people observed each case.
Florida Hospital:
The second part of the data contains a total of 25 cases (Cohen, Wiegmann,
Reeves, Boquet, & Shappell, 2016b) collected at a private hospital – Florida Hospital
(FH) in Orlando. Data was collected from 145.04 hours of observation by student
researchers. For this investigation, data collection was expanded to include the role of
the surgical team in addition to anesthetist, circulating nurse, and perfusionist. Each of
the cases had two observers assigned, each of whom was responsible for observing two
separate roles (anesthetist/surgery and perfusionist/circulating nurse).
CVOR Descriptive Model 42
Chapter 2: Preliminary Analysis
The large quantity of data collected from MUSC and Florida Hospital presents a
lot of possibilities for determining how FDs impact a CVOR. Before developing models
to try to predict bypass time, the first steps are to understand and analyze the data in order
to determine what modeling technique is appropriate.
Data Available
The first step was to gain an understanding of the data collected for previous
research projects (see Cohen, et al., 2016a; 2016b). Specifically, what types of data was
collected and how it can be used. Appendix B includes a visual representation of the
breadth of data available. There are two operation time periods presented – total
operation time (wheels in to wheels out), and the length of bypass time. Also included is
data from each of the roles – depicted by different colors on the figure. Within each role
are flow disruptions directly affecting that role. The positioning on this chart gives when
they started and stopped relative to the overall operation time, the portion of the operation
in which they occurred and the duration of those FDs. Finally, the data includes the
classification of the flow disruptions’ major categories from the RIPCHORD-TWA
taxonomy.
Normalized Data:
The data points for flow disruptions themselves cover a wide range of time
periods, from several seconds to some that are over an hour. The distribution of data is
heavily weighted towards shorter time intervals. In other words, most FDs last for less
than a minute, with many of them only lasting for a few seconds. This is potentially
problematic when modeling mathematically, because the skew of these values means that
CVOR Descriptive Model 43
certain methods are not relevant. By transforming the data to normalize it (give the data
set a normal distribution), different modeling methodologies are possible.
First the data points (n = 5,111) were converted to seconds and descriptive
statistics calculated of the overall set (m = 97.50; SD = 689.87). Data values returning
errors or zero-second values were removed, as well as 3 extreme values (greater than 6
standard deviations from the mean) that are presumed to be errors. This still left a
significant number of data points (n = 5078), which by themselves were found to have a
mean of 84.94 (SD = 229.38).
To normalize the data of flow disruption length to help with potential analyses,
the logarithm of the data was taken with a base of 10, generating an approximate normal
curve (M = 1.504, SD = .571, Kurtosis = .893, Skewness = .216). Graphically, the
original and normalized versions of the data are displayed in Appendix C. Both the
original and normalized data will be considered for model development.
Concept Visualization
The purpose of this section is to demonstrate that some relationship exists in the
data, in order to justify a full analysis as the main focus of the current project.
Power Laws
To demonstrate that the present research is in line with data from other realms, a
test of the data as a power law function was employed. Figure 2.1 below demonstrates
the strong correlation between the data set and a power law function. There are several
power law theories, such as Zipf’s and Heaps’ laws (Eliazar & Cohen, 2013) that define
the connection. These laws have their roots in drastically different fields than FDs in
surgery, such as Zipf’s, which is tied to the statistics of word occurrences in language.
CVOR Descriptive Model 44
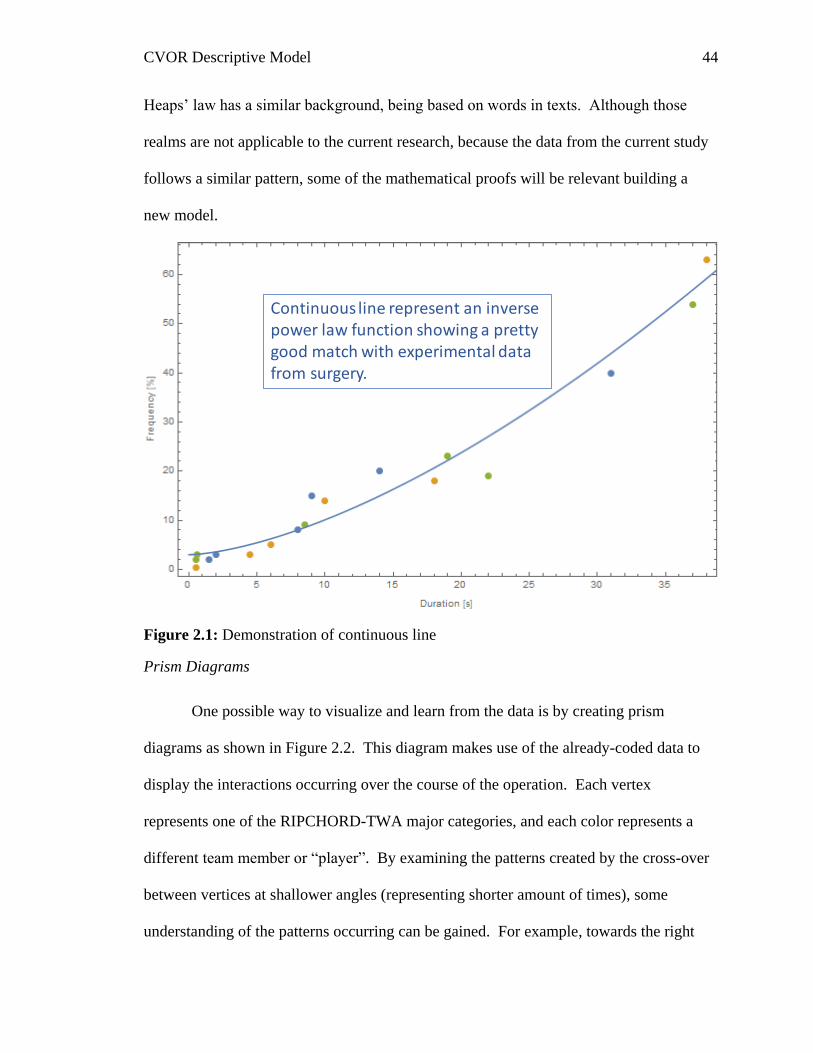
Heaps’ law has a similar background, being based on words in texts. Although those
realms are not applicable to the current research, because the data from the current study
follows a similar pattern, some of the mathematical proofs will be relevant building a
new model.
Figure 2.1: Demonstration of continuous line
Prism Diagrams
One possible way to visualize and learn from the data is by creating prism
diagrams as shown in Figure 2.2. This diagram makes use of the already-coded data to
display the interactions occurring over the course of the operation. Each vertex
represents one of the RIPCHORD-TWA major categories, and each color represents a
different team member or “player”. By examining the patterns created by the cross-over
between vertices at shallower angles (representing shorter amount of times), some
understanding of the patterns occurring can be gained. For example, towards the right
Continuous line represent an inversepower law function showing a pretty good match with experimental data from surgery.
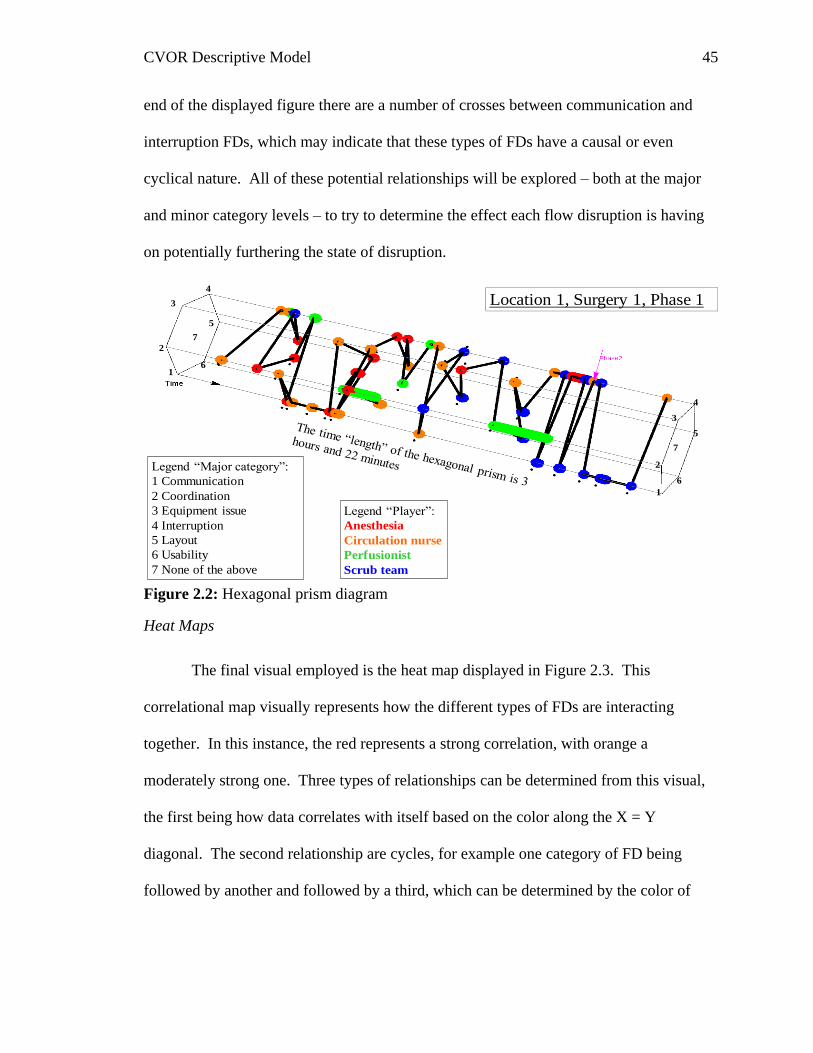
CVOR Descriptive Model 45
end of the displayed figure there are a number of crosses between communication and
interruption FDs, which may indicate that these types of FDs have a causal or even
cyclical nature. All of these potential relationships will be explored – both at the major
and minor category levels – to try to determine the effect each flow disruption is having
on potentially furthering the state of disruption.
Figure 2.2: Hexagonal prism diagram
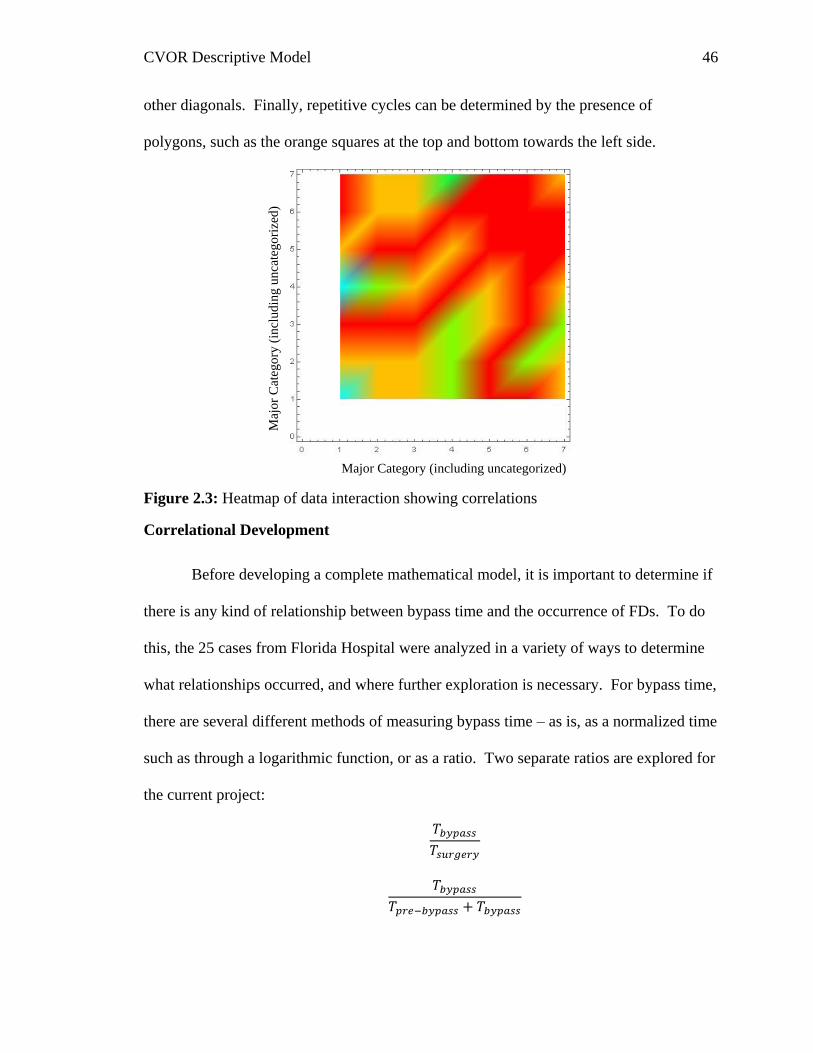
Heat Maps
The final visual employed is the heat map displayed in Figure 2.3. This
correlational map visually represents how the different types of FDs are interacting
together. In this instance, the red represents a strong correlation, with orange a
moderately strong one. Three types of relationships can be determined from this visual,
the first being how data correlates with itself based on the color along the X = Y
diagonal. The second relationship are cycles, for example one category of FD being
followed by another and followed by a third, which can be determined by the color of
2
2
3
4
3
4
6
5
6
5
1
1
Legend “Major category”:
1 Communication
2 Coordination
3 Equipment issue
4 Interruption
5 Layout
6 Usability
7 None of the above
7
7
Legend “Player”:
Anesthesia
Circulation nurse
Perfusionist
Scrub team
Location 1, Surgery 1, Phase 1
CVOR Descriptive Model 46
other diagonals. Finally, repetitive cycles can be determined by the presence of
polygons, such as the orange squares at the top and bottom towards the left side.
Figure 2.3: Heatmap of data interaction showing correlations
Correlational Development
Before developing a complete mathematical model, it is important to determine if
there is any kind of relationship between bypass time and the occurrence of FDs. To do
this, the 25 cases from Florida Hospital were analyzed in a variety of ways to determine
what relationships occurred, and where further exploration is necessary. For bypass time,
there are several different methods of measuring bypass time – as is, as a normalized time
such as through a logarithmic function, or as a ratio. Two separate ratios are explored for
the current project:
𝑇𝑏𝑦𝑝𝑎𝑠𝑠
𝑇𝑠𝑢𝑟𝑔𝑒𝑟𝑦
𝑇𝑏𝑦𝑝𝑎𝑠𝑠
𝑇𝑝𝑟𝑒−𝑏𝑦𝑝𝑎𝑠𝑠 + 𝑇𝑏𝑦𝑝𝑎𝑠𝑠
Major Category (including uncategorized)
Maj
or
Cat
ego
ry (
incl
ud
ing
unca
teg
ori
zed)
CVOR Descriptive Model 47
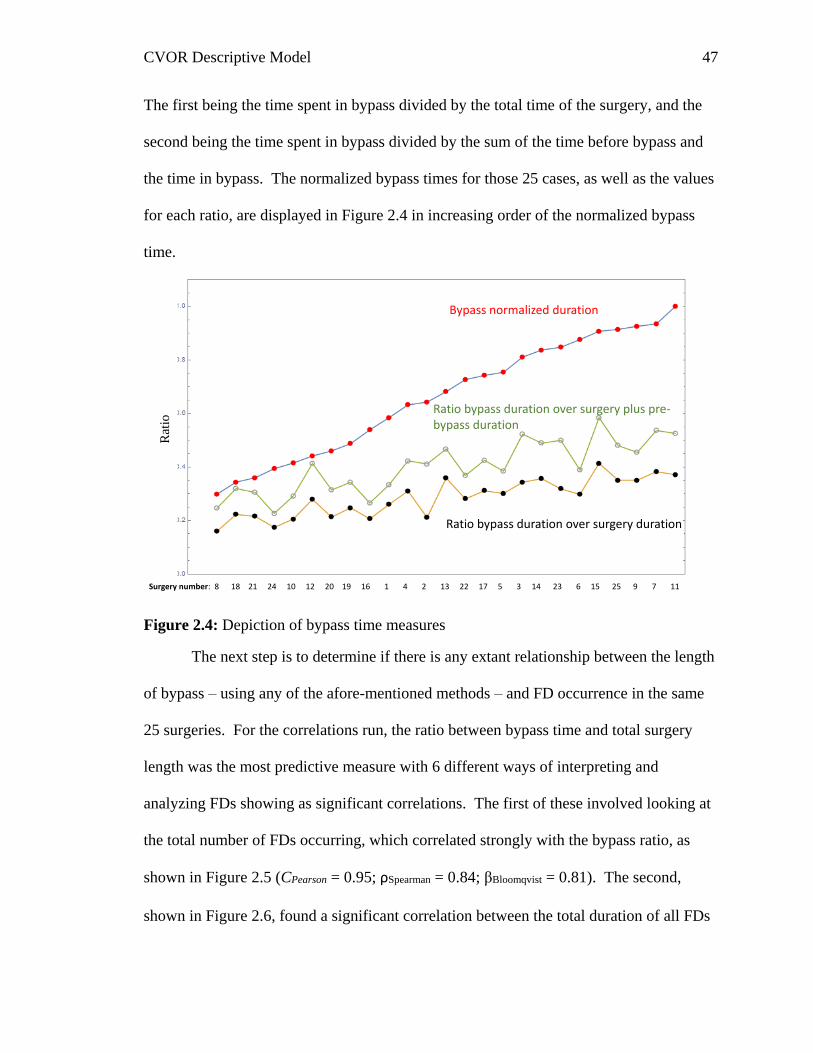
The first being the time spent in bypass divided by the total time of the surgery, and the
second being the time spent in bypass divided by the sum of the time before bypass and
the time in bypass. The normalized bypass times for those 25 cases, as well as the values
for each ratio, are displayed in Figure 2.4 in increasing order of the normalized bypass
time.
Figure 2.4: Depiction of bypass time measures
The next step is to determine if there is any extant relationship between the length
of bypass – using any of the afore-mentioned methods – and FD occurrence in the same
25 surgeries. For the correlations run, the ratio between bypass time and total surgery
length was the most predictive measure with 6 different ways of interpreting and
analyzing FDs showing as significant correlations. The first of these involved looking at
the total number of FDs occurring, which correlated strongly with the bypass ratio, as
shown in Figure 2.5 (CPearson = 0.95; ρSpearman = 0.84; βBloomqvist = 0.81). The second,
shown in Figure 2.6, found a significant correlation between the total duration of all FDs
Surgery number: 8 18 21 24 10 12 20 19 16 1 4 2 13 22 17 5 3 14 23 6 15 25 9 7 11
Bypass normalized duration
Ratio bypass duration over surgery duration
Ratio bypass duration over surgery plus pre-bypass duration
Rat
io
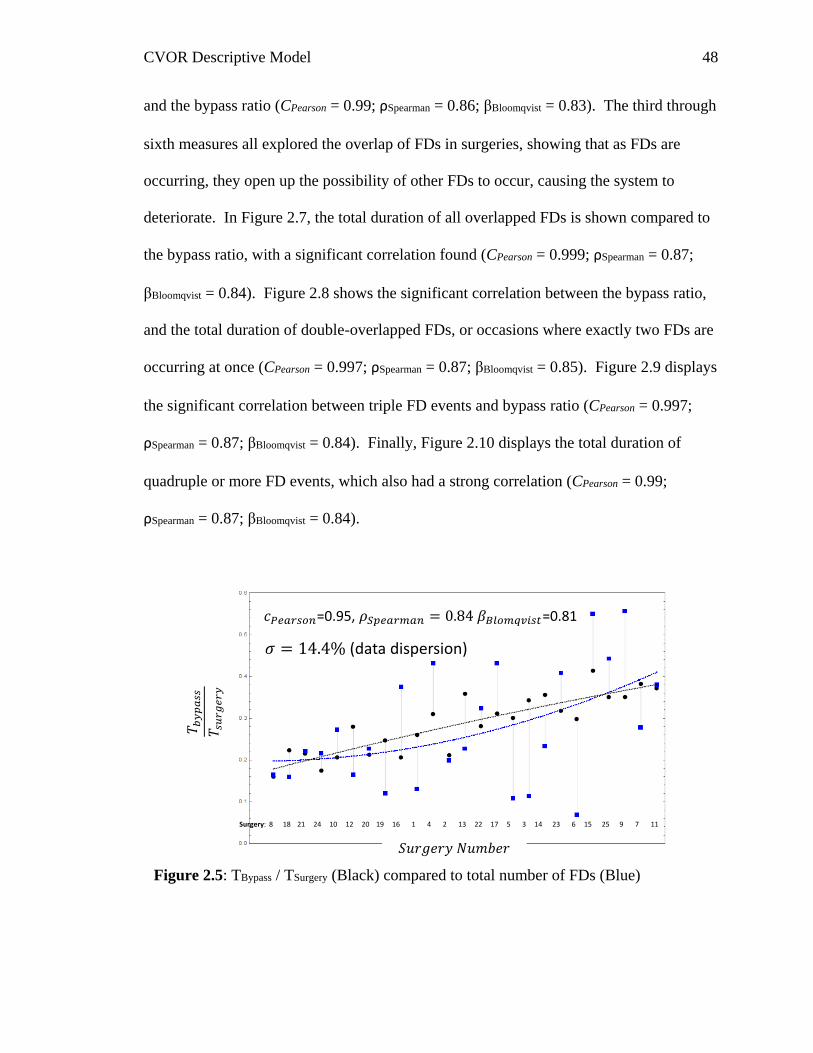
CVOR Descriptive Model 48
and the bypass ratio (CPearson = 0.99; ρSpearman = 0.86; βBloomqvist = 0.83). The third through
sixth measures all explored the overlap of FDs in surgeries, showing that as FDs are
occurring, they open up the possibility of other FDs to occur, causing the system to
deteriorate. In Figure 2.7, the total duration of all overlapped FDs is shown compared to
the bypass ratio, with a significant correlation found (CPearson = 0.999; ρSpearman = 0.87;
βBloomqvist = 0.84). Figure 2.8 shows the significant correlation between the bypass ratio,
and the total duration of double-overlapped FDs, or occasions where exactly two FDs are
occurring at once (CPearson = 0.997; ρSpearman = 0.87; βBloomqvist = 0.85). Figure 2.9 displays
the significant correlation between triple FD events and bypass ratio (CPearson = 0.997;
ρSpearman = 0.87; βBloomqvist = 0.84). Finally, Figure 2.10 displays the total duration of
quadruple or more FD events, which also had a strong correlation (CPearson = 0.99;
ρSpearman = 0.87; βBloomqvist = 0.84).
Figure 2.5: TBypass / TSurgery (Black) compared to total number of FDs (Blue)
Surgery: 8 18 21 24 10 12 20 19 16 1 4 2 13 22 17 5 3 14 23 6 15 25 9 7 11
=0.95, =0.81
(data dispersion)
𝑇 𝑏𝑦
𝑝𝑎
𝑠𝑠
𝑇 𝑠𝑢
𝑟𝑔
𝑒𝑟
𝑦
𝑆𝑢𝑟𝑔𝑒𝑟𝑦 𝑁𝑢𝑚𝑏𝑒𝑟
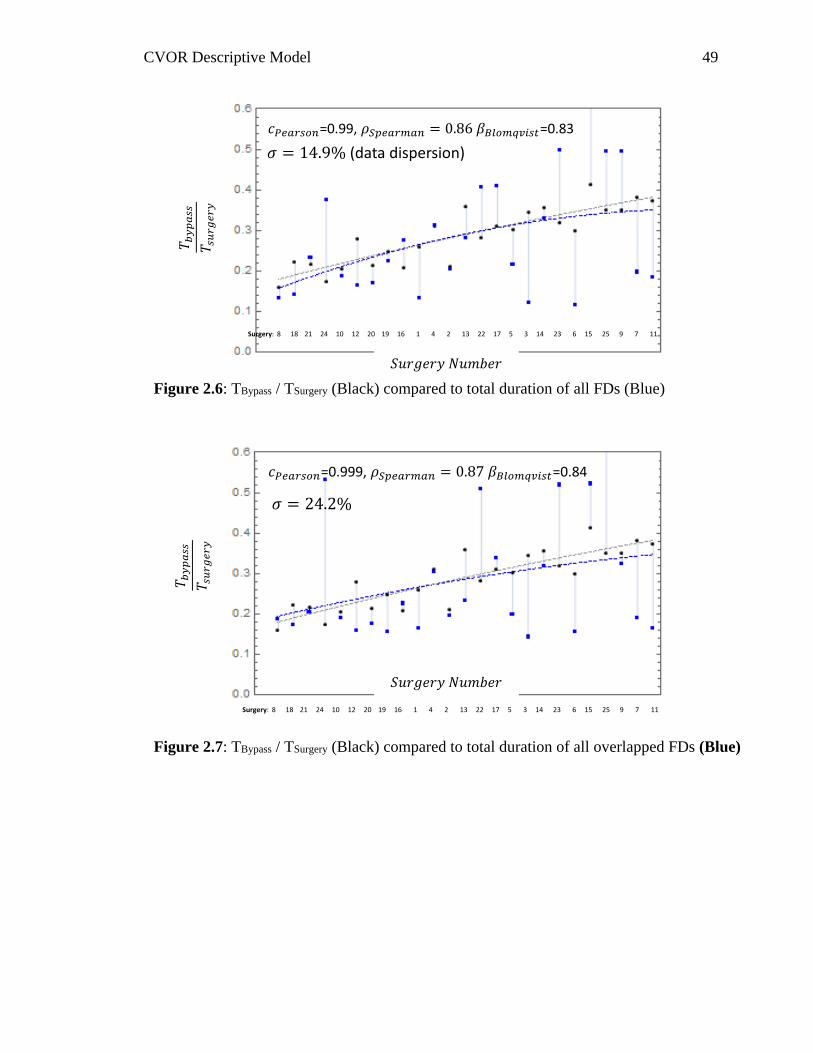
CVOR Descriptive Model 49
Figure 2.6: TBypass / TSurgery (Black) compared to total duration of all FDs (Blue)
=0.99, =0.83
(data dispersion)
Surgery: 8 18 21 24 10 12 20 19 16 1 4 2 13 22 17 5 3 14 23 6 15 25 9 7 11
Figure 2.7: TBypass / TSurgery (Black) compared to total duration of all overlapped FDs (Blue)
Surgery: 8 18 21 24 10 12 20 19 16 1 4 2 13 22 17 5 3 14 23 6 15 25 9 7 11
=0.999, =0.84
𝑇 𝑏𝑦
𝑝𝑎
𝑠𝑠
𝑇 𝑠𝑢
𝑟𝑔
𝑒𝑟
𝑦
𝑆𝑢𝑟𝑔𝑒𝑟𝑦 𝑁𝑢𝑚𝑏𝑒𝑟
𝑇 𝑏𝑦
𝑝𝑎
𝑠𝑠
𝑇 𝑠𝑢
𝑟𝑔
𝑒𝑟
𝑦
𝑆𝑢𝑟𝑔𝑒𝑟𝑦 𝑁𝑢𝑚𝑏𝑒𝑟
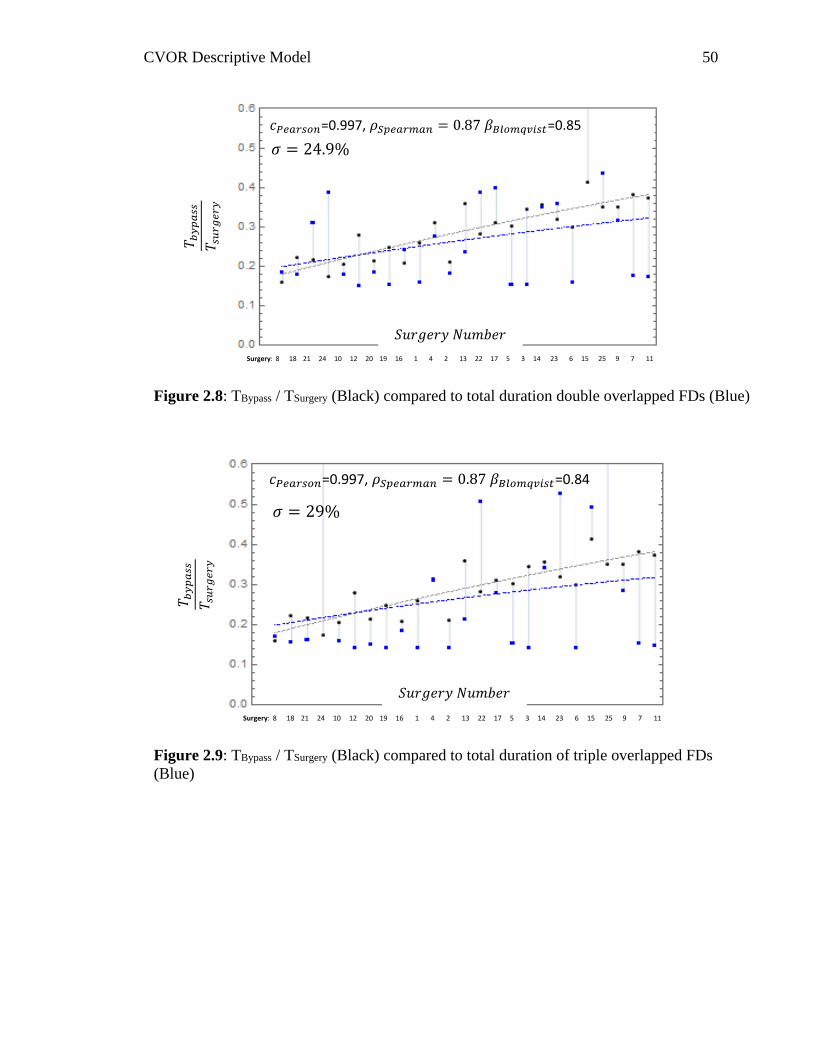
CVOR Descriptive Model 50
Figure 2.8: TBypass / TSurgery (Black) compared to total duration double overlapped FDs (Blue)
Surgery: 8 18 21 24 10 12 20 19 16 1 4 2 13 22 17 5 3 14 23 6 15 25 9 7 11
=0.997, =0.85
Figure 2.9: TBypass / TSurgery (Black) compared to total duration of triple overlapped FDs
(Blue)
Surgery: 8 18 21 24 10 12 20 19 16 1 4 2 13 22 17 5 3 14 23 6 15 25 9 7 11
=0.997, =0.84
𝑇 𝑏𝑦
𝑝𝑎
𝑠𝑠
𝑇 𝑠𝑢
𝑟𝑔
𝑒𝑟
𝑦
𝑆𝑢𝑟𝑔𝑒𝑟𝑦 𝑁𝑢𝑚𝑏𝑒𝑟
𝑇 𝑏𝑦
𝑝𝑎
𝑠𝑠
𝑇 𝑠𝑢
𝑟𝑔
𝑒𝑟
𝑦
𝑆𝑢𝑟𝑔𝑒𝑟𝑦 𝑁𝑢𝑚𝑏𝑒𝑟
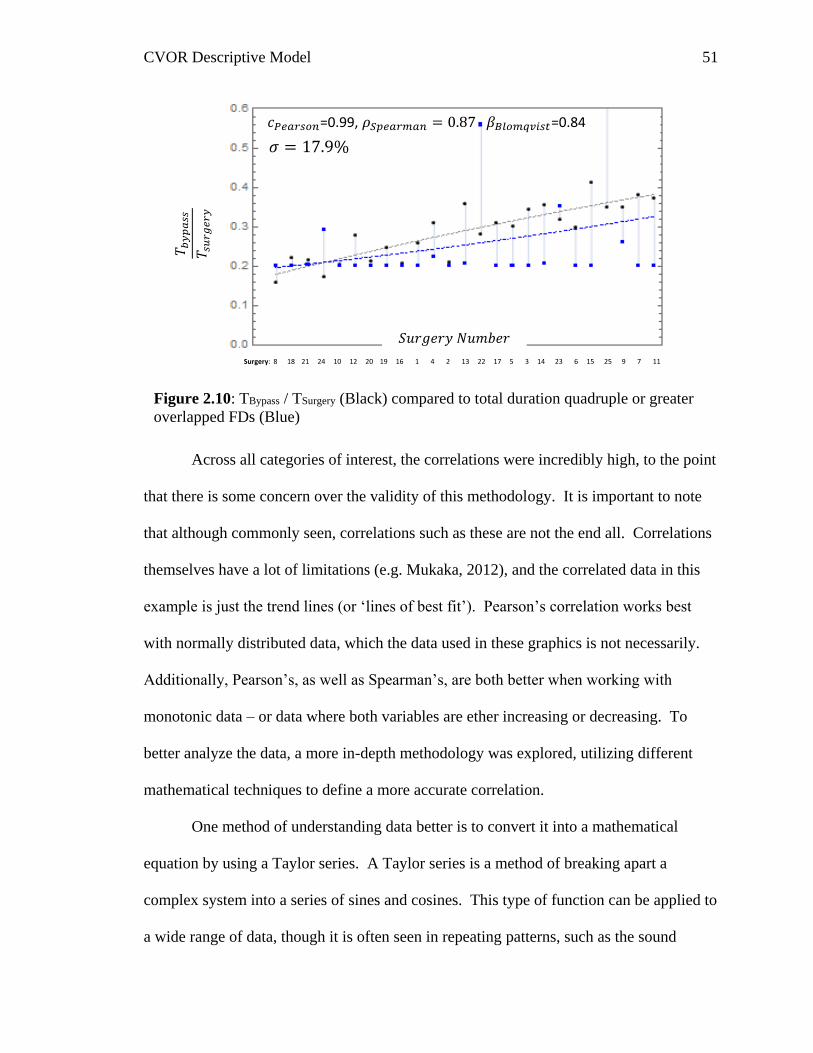
CVOR Descriptive Model 51
Across all categories of interest, the correlations were incredibly high, to the point
that there is some concern over the validity of this methodology. It is important to note
that although commonly seen, correlations such as these are not the end all. Correlations
themselves have a lot of limitations (e.g. Mukaka, 2012), and the correlated data in this
example is just the trend lines (or ‘lines of best fit’). Pearson’s correlation works best
with normally distributed data, which the data used in these graphics is not necessarily.
Additionally, Pearson’s, as well as Spearman’s, are both better when working with
monotonic data – or data where both variables are ether increasing or decreasing. To
better analyze the data, a more in-depth methodology was explored, utilizing different
mathematical techniques to define a more accurate correlation.
One method of understanding data better is to convert it into a mathematical
equation by using a Taylor series. A Taylor series is a method of breaking apart a
complex system into a series of sines and cosines. This type of function can be applied to
a wide range of data, though it is often seen in repeating patterns, such as the sound
Figure 2.10: TBypass / TSurgery (Black) compared to total duration quadruple or greater
overlapped FDs (Blue)
Surgery: 8 18 21 24 10 12 20 19 16 1 4 2 13 22 17 5 3 14 23 6 15 25 9 7 11
=0.99, =0.84
𝑇 𝑏𝑦
𝑝𝑎
𝑠𝑠
𝑇 𝑠𝑢
𝑟𝑔
𝑒𝑟
𝑦
𝑆𝑢𝑟𝑔𝑒𝑟𝑦 𝑁𝑢𝑚𝑏𝑒𝑟
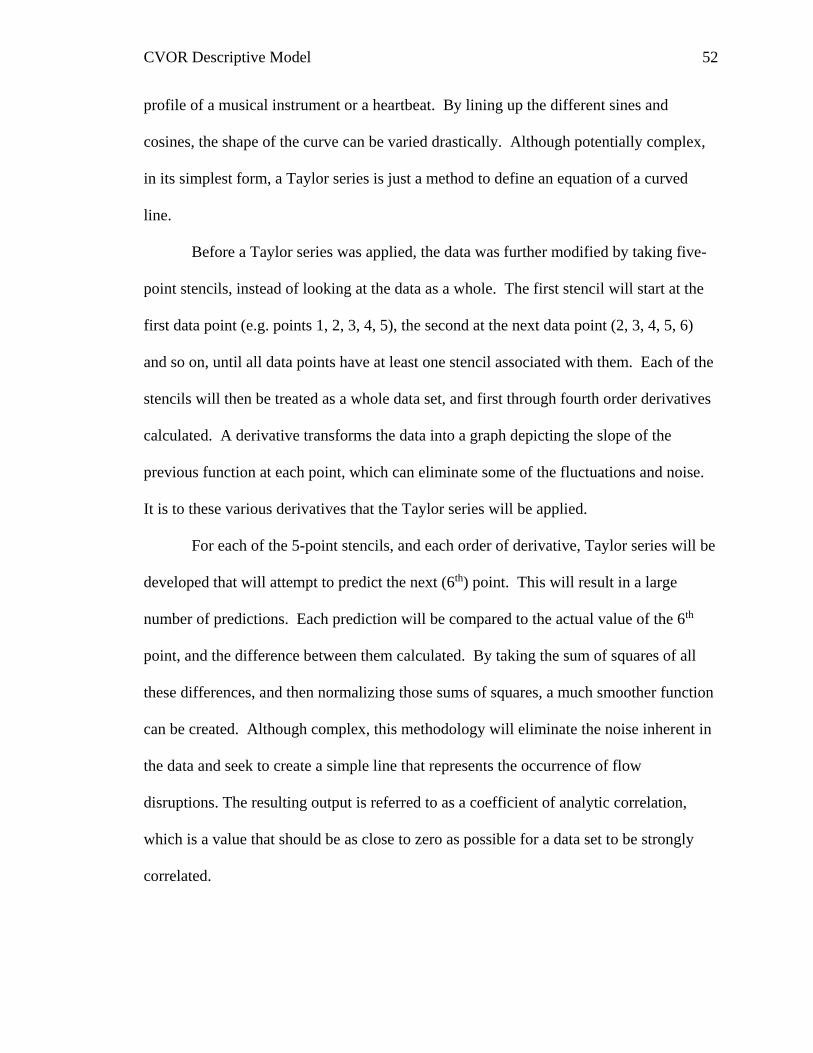
CVOR Descriptive Model 52
profile of a musical instrument or a heartbeat. By lining up the different sines and
cosines, the shape of the curve can be varied drastically. Although potentially complex,
in its simplest form, a Taylor series is just a method to define an equation of a curved
line.
Before a Taylor series was applied, the data was further modified by taking five-
point stencils, instead of looking at the data as a whole. The first stencil will start at the
first data point (e.g. points 1, 2, 3, 4, 5), the second at the next data point (2, 3, 4, 5, 6)
and so on, until all data points have at least one stencil associated with them. Each of the
stencils will then be treated as a whole data set, and first through fourth order derivatives
calculated. A derivative transforms the data into a graph depicting the slope of the
previous function at each point, which can eliminate some of the fluctuations and noise.
It is to these various derivatives that the Taylor series will be applied.
For each of the 5-point stencils, and each order of derivative, Taylor series will be
developed that will attempt to predict the next (6th) point. This will result in a large
number of predictions. Each prediction will be compared to the actual value of the 6th
point, and the difference between them calculated. By taking the sum of squares of all
these differences, and then normalizing those sums of squares, a much smoother function
can be created. Although complex, this methodology will eliminate the noise inherent in
the data and seek to create a simple line that represents the occurrence of flow
disruptions. The resulting output is referred to as a coefficient of analytic correlation,
which is a value that should be as close to zero as possible for a data set to be strongly
correlated.
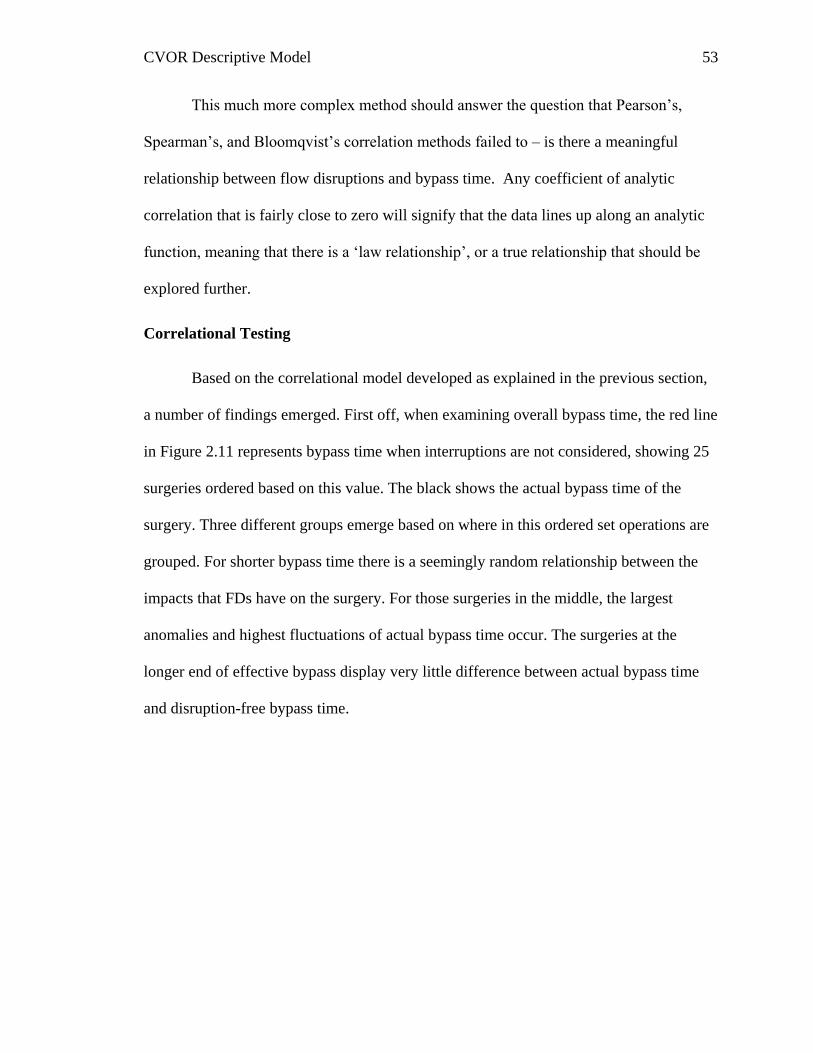
CVOR Descriptive Model 53
This much more complex method should answer the question that Pearson’s,
Spearman’s, and Bloomqvist’s correlation methods failed to – is there a meaningful
relationship between flow disruptions and bypass time. Any coefficient of analytic
correlation that is fairly close to zero will signify that the data lines up along an analytic
function, meaning that there is a ‘law relationship’, or a true relationship that should be
explored further.
Correlational Testing
Based on the correlational model developed as explained in the previous section,
a number of findings emerged. First off, when examining overall bypass time, the red line
in Figure 2.11 represents bypass time when interruptions are not considered, showing 25
surgeries ordered based on this value. The black shows the actual bypass time of the
surgery. Three different groups emerge based on where in this ordered set operations are
grouped. For shorter bypass time there is a seemingly random relationship between the
impacts that FDs have on the surgery. For those surgeries in the middle, the largest
anomalies and highest fluctuations of actual bypass time occur. The surgeries at the
longer end of effective bypass display very little difference between actual bypass time
and disruption-free bypass time.
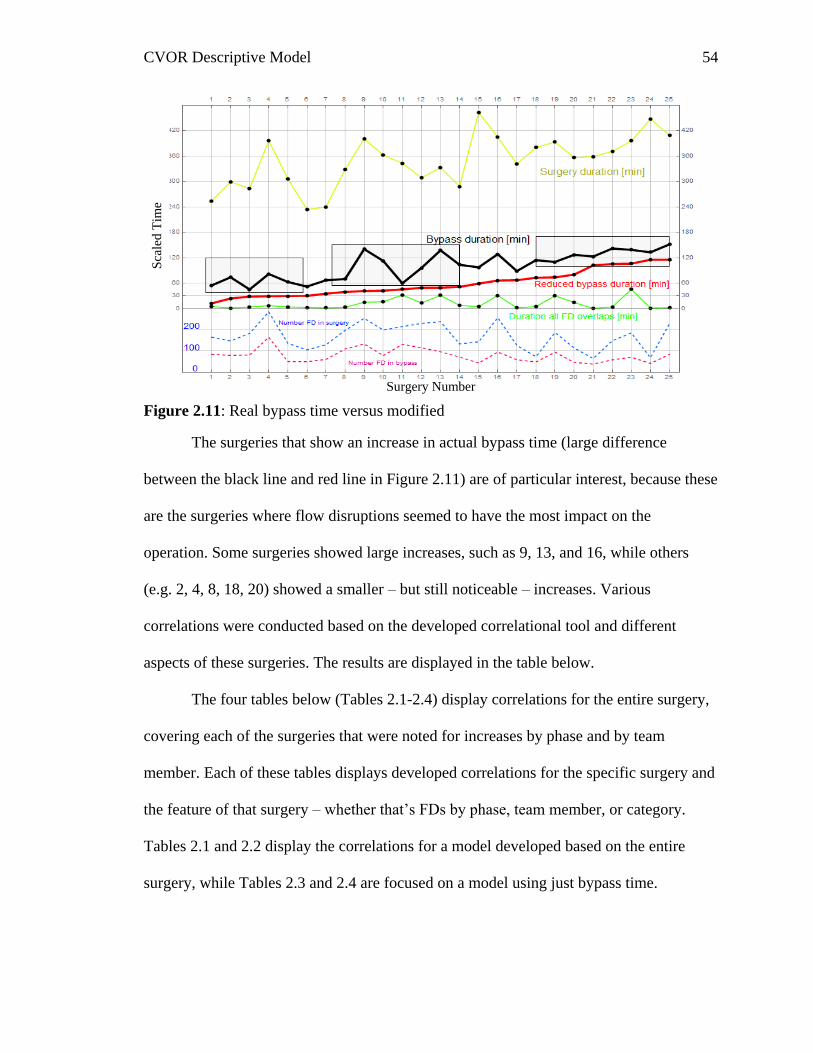
CVOR Descriptive Model 54
Figure 2.11: Real bypass time versus modified
The surgeries that show an increase in actual bypass time (large difference
between the black line and red line in Figure 2.11) are of particular interest, because these
are the surgeries where flow disruptions seemed to have the most impact on the
operation. Some surgeries showed large increases, such as 9, 13, and 16, while others
(e.g. 2, 4, 8, 18, 20) showed a smaller – but still noticeable – increases. Various
correlations were conducted based on the developed correlational tool and different
aspects of these surgeries. The results are displayed in the table below.
The four tables below (Tables 2.1-2.4) display correlations for the entire surgery,
covering each of the surgeries that were noted for increases by phase and by team
member. Each of these tables displays developed correlations for the specific surgery and
the feature of that surgery – whether that’s FDs by phase, team member, or category.
Tables 2.1 and 2.2 display the correlations for a model developed based on the entire
surgery, while Tables 2.3 and 2.4 are focused on a model using just bypass time.
Surgery Number
Sca
led
Tim
e
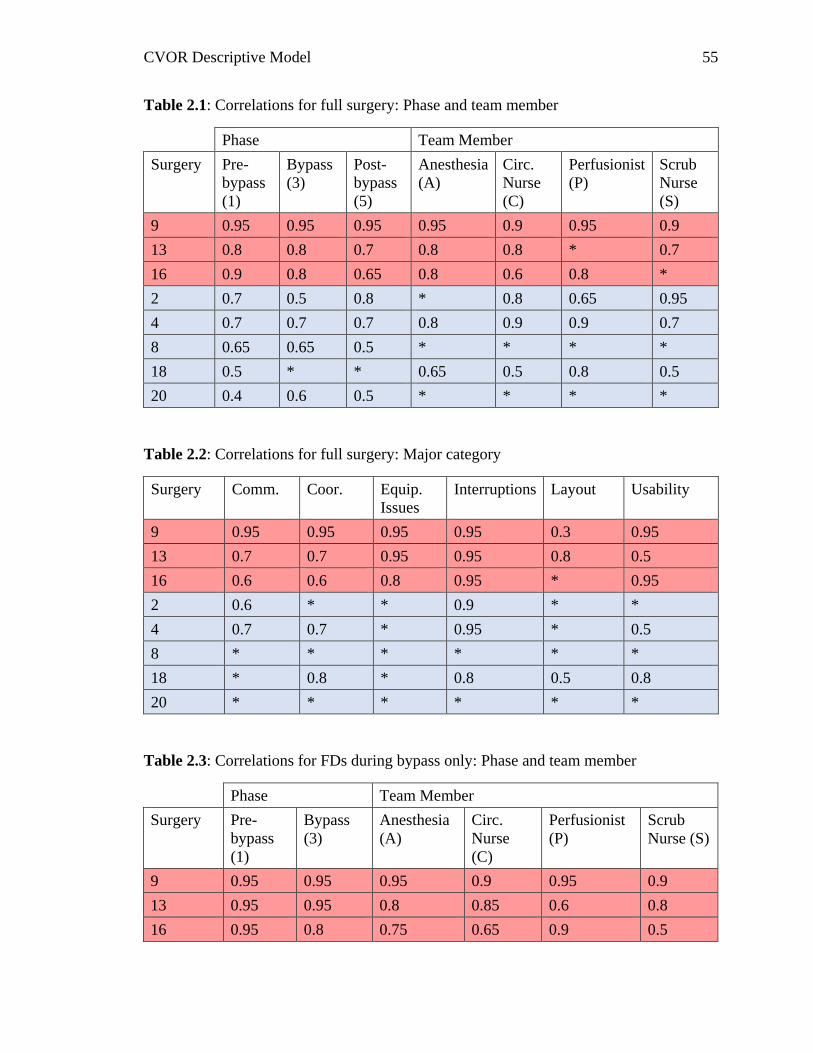
CVOR Descriptive Model 55
Table 2.1: Correlations for full surgery: Phase and team member
Phase Team Member
Surgery Pre-
bypass
(1)
Bypass
(3)
Post-
bypass
(5)
Anesthesia
(A)
Circ.
Nurse
(C)
Perfusionist
(P)
Scrub
Nurse
(S)
9 0.95 0.95 0.95 0.95 0.9 0.95 0.9
13 0.8 0.8 0.7 0.8 0.8 * 0.7
16 0.9 0.8 0.65 0.8 0.6 0.8 *
2 0.7 0.5 0.8 * 0.8 0.65 0.95
4 0.7 0.7 0.7 0.8 0.9 0.9 0.7
8 0.65 0.65 0.5 * * * *
18 0.5 * * 0.65 0.5 0.8 0.5
20 0.4 0.6 0.5 * * * *
Table 2.2: Correlations for full surgery: Major category
Surgery Comm. Coor. Equip.
Issues
Interruptions Layout Usability
9 0.95 0.95 0.95 0.95 0.3 0.95
13 0.7 0.7 0.95 0.95 0.8 0.5
16 0.6 0.6 0.8 0.95 * 0.95
2 0.6 * * 0.9 * *
4 0.7 0.7 * 0.95 * 0.5
8 * * * * * *
18 * 0.8 * 0.8 0.5 0.8
20 * * * * * *
Table 2.3: Correlations for FDs during bypass only: Phase and team member
Phase Team Member
Surgery Pre-
bypass
(1)
Bypass
(3)
Anesthesia
(A)
Circ.
Nurse
(C)
Perfusionist
(P)
Scrub
Nurse (S)
9 0.95 0.95 0.95 0.9 0.95 0.9
13 0.95 0.95 0.8 0.85 0.6 0.8
16 0.95 0.8 0.75 0.65 0.9 0.5

CVOR Descriptive Model 56
Phase Team Member
Surgery Pre-
bypass
(1)
Bypass
(3)
Anesthesia
(A)
Circ.
Nurse
(C)
Perfusionist
(P)
Scrub
Nurse (S)
2 0.75 0.5 * 0.9 0.7 0.95
4 0.75 0.7 0.9 0.9 0.95 0.7
8 0.75 0.8 * * * 0.6
18 0.75 * 0.8 0.65 0.85 0.65
20 0.5 * 0.5 * 0.55 *
Table 2.4: Correlations for FDs during bypass only: Major category
Surgery Comm. Coor. Equip.
Issues
Interruptions Layout Usability
9 0.95 0.95 0.9 0.95 0.4 0.9
13 0.65 0.7 0.95 0.8 0.4 0.6
16 0.65 0.75 0.9 0.95 * 0.95
2 0.65 0.5 0.4 0.95 * 0.5
4 0.8 0.85 0.55 0.95 * 0.65
8 * * * * * *
18 * 0.9 * 0.85 0.5 0.9
20 * * * * * *
From these various tables some interesting findings emerge. For instance, surgery
9 – the surgery that appears to have the largest peak in Figure 2.11 – correlates fairly well
with a large number of the grouped flow disruptions, across both models. This suggests
that by these models this peak is representing greater bypass times. Another interesting
finding is shown in Table 2.2, where FDs categorized as interruptions correlate with
almost all of the selected surgeries. Although early in analysis, this suggests that
interruptions specifically are a good place to investigate as a source of longer bypass
times.
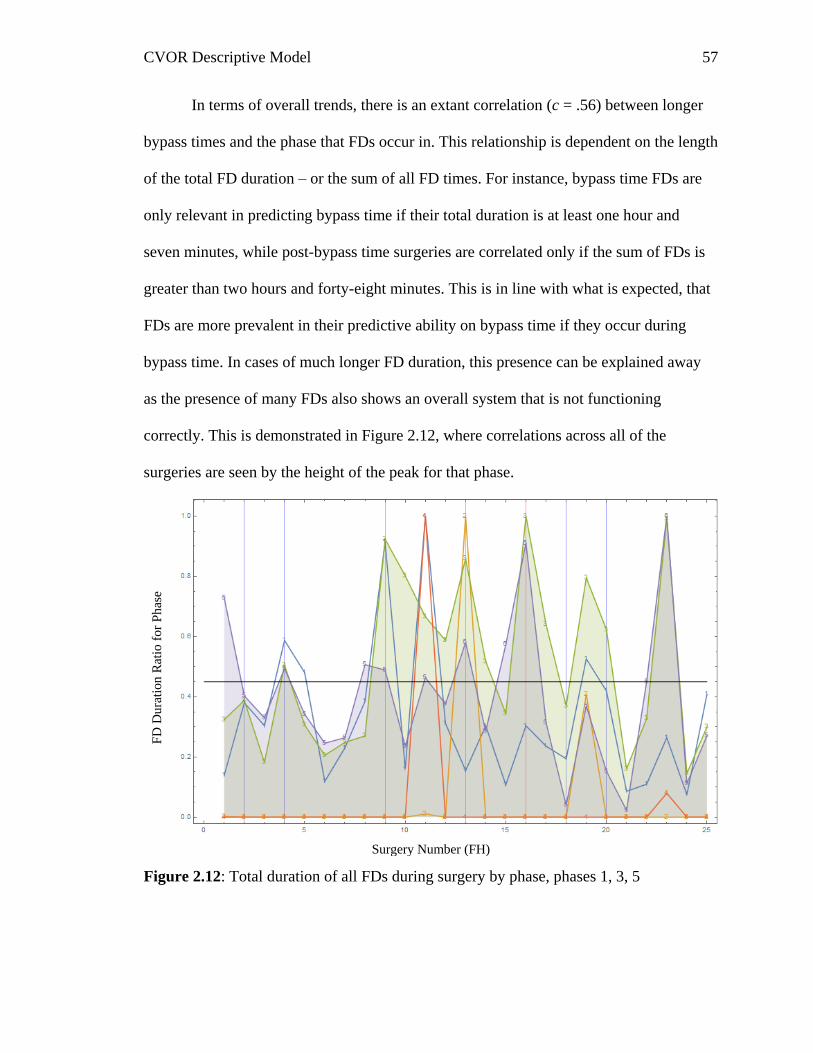
CVOR Descriptive Model 57
In terms of overall trends, there is an extant correlation (c = .56) between longer
bypass times and the phase that FDs occur in. This relationship is dependent on the length
of the total FD duration – or the sum of all FD times. For instance, bypass time FDs are
only relevant in predicting bypass time if their total duration is at least one hour and
seven minutes, while post-bypass time surgeries are correlated only if the sum of FDs is
greater than two hours and forty-eight minutes. This is in line with what is expected, that
FDs are more prevalent in their predictive ability on bypass time if they occur during
bypass time. In cases of much longer FD duration, this presence can be explained away
as the presence of many FDs also shows an overall system that is not functioning
correctly. This is demonstrated in Figure 2.12, where correlations across all of the
surgeries are seen by the height of the peak for that phase.
Figure 2.12: Total duration of all FDs during surgery by phase, phases 1, 3, 5
Surgery Number (FH)
FD
Dura
tion
Rat
io f
or
Ph
ase
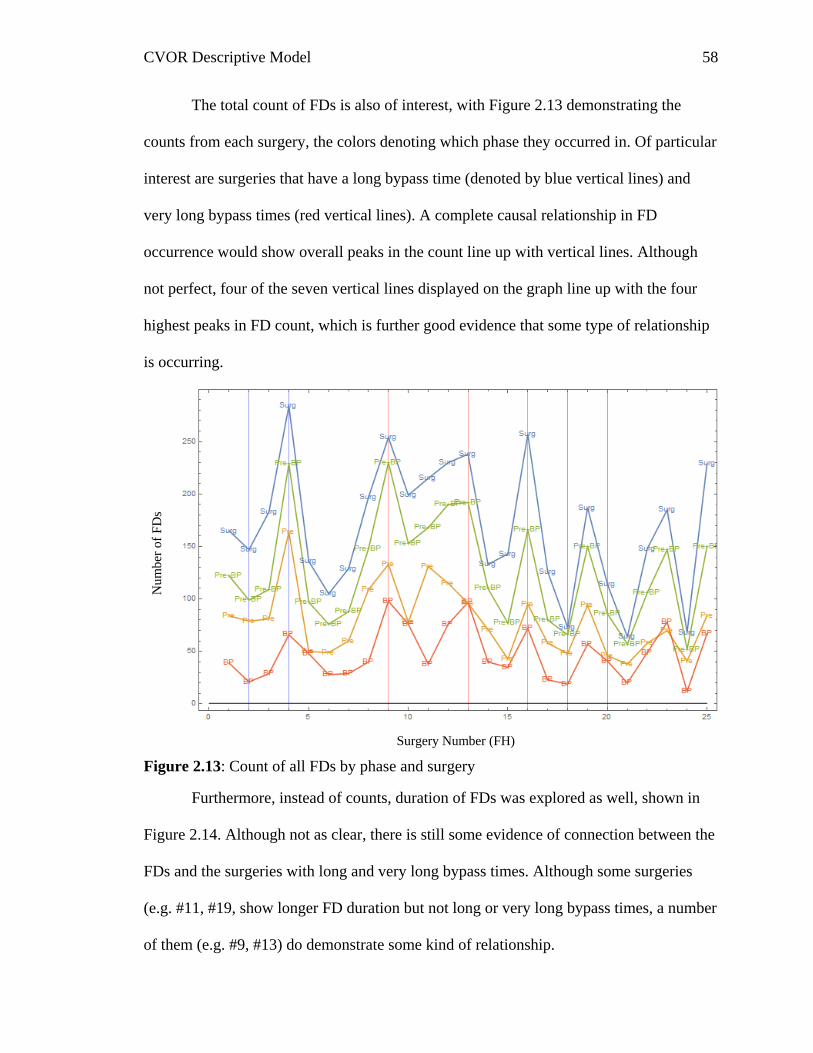
CVOR Descriptive Model 58
The total count of FDs is also of interest, with Figure 2.13 demonstrating the
counts from each surgery, the colors denoting which phase they occurred in. Of particular
interest are surgeries that have a long bypass time (denoted by blue vertical lines) and
very long bypass times (red vertical lines). A complete causal relationship in FD
occurrence would show overall peaks in the count line up with vertical lines. Although
not perfect, four of the seven vertical lines displayed on the graph line up with the four
highest peaks in FD count, which is further good evidence that some type of relationship
is occurring.
Figure 2.13: Count of all FDs by phase and surgery
Furthermore, instead of counts, duration of FDs was explored as well, shown in
Figure 2.14. Although not as clear, there is still some evidence of connection between the
FDs and the surgeries with long and very long bypass times. Although some surgeries
(e.g. #11, #19, show longer FD duration but not long or very long bypass times, a number
of them (e.g. #9, #13) do demonstrate some kind of relationship.
Surgery Number (FH)
Nu
mb
er o
f F
Ds
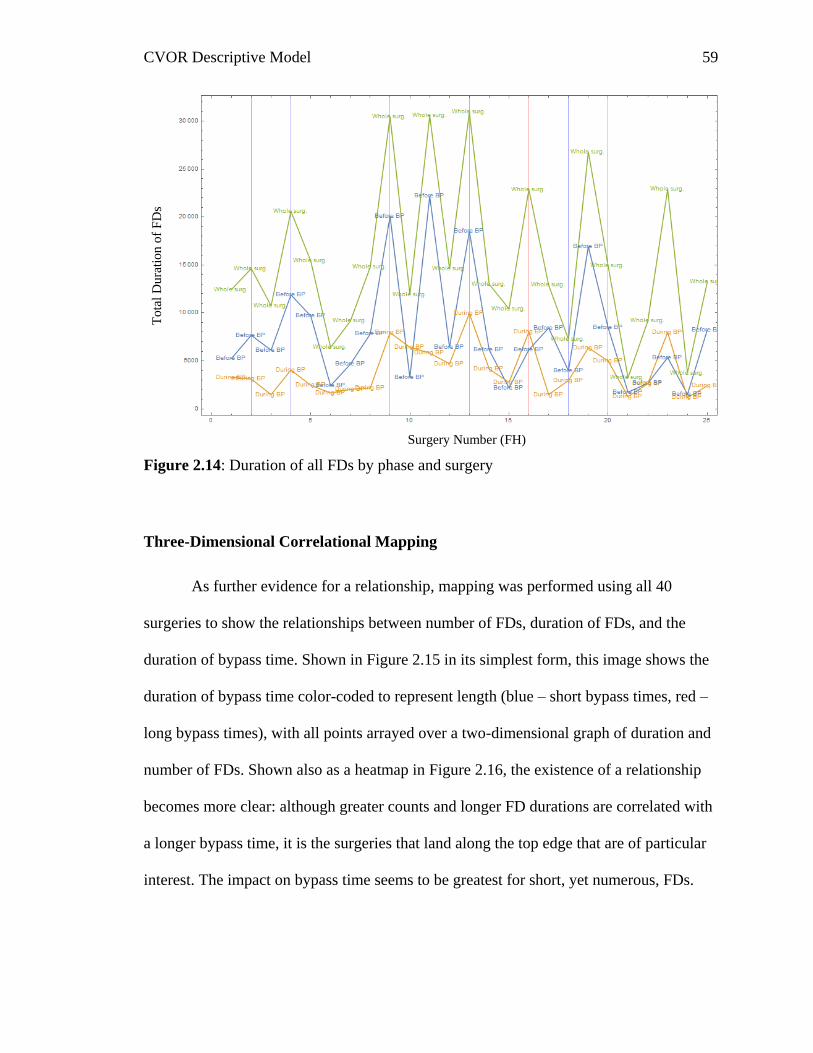
CVOR Descriptive Model 59
Figure 2.14: Duration of all FDs by phase and surgery
Three-Dimensional Correlational Mapping
As further evidence for a relationship, mapping was performed using all 40
surgeries to show the relationships between number of FDs, duration of FDs, and the
duration of bypass time. Shown in Figure 2.15 in its simplest form, this image shows the
duration of bypass time color-coded to represent length (blue – short bypass times, red –
long bypass times), with all points arrayed over a two-dimensional graph of duration and
number of FDs. Shown also as a heatmap in Figure 2.16, the existence of a relationship
becomes more clear: although greater counts and longer FD durations are correlated with
a longer bypass time, it is the surgeries that land along the top edge that are of particular
interest. The impact on bypass time seems to be greatest for short, yet numerous, FDs.
Surgery Number (FH)
To
tal
Du
rati
on
of
FD
s
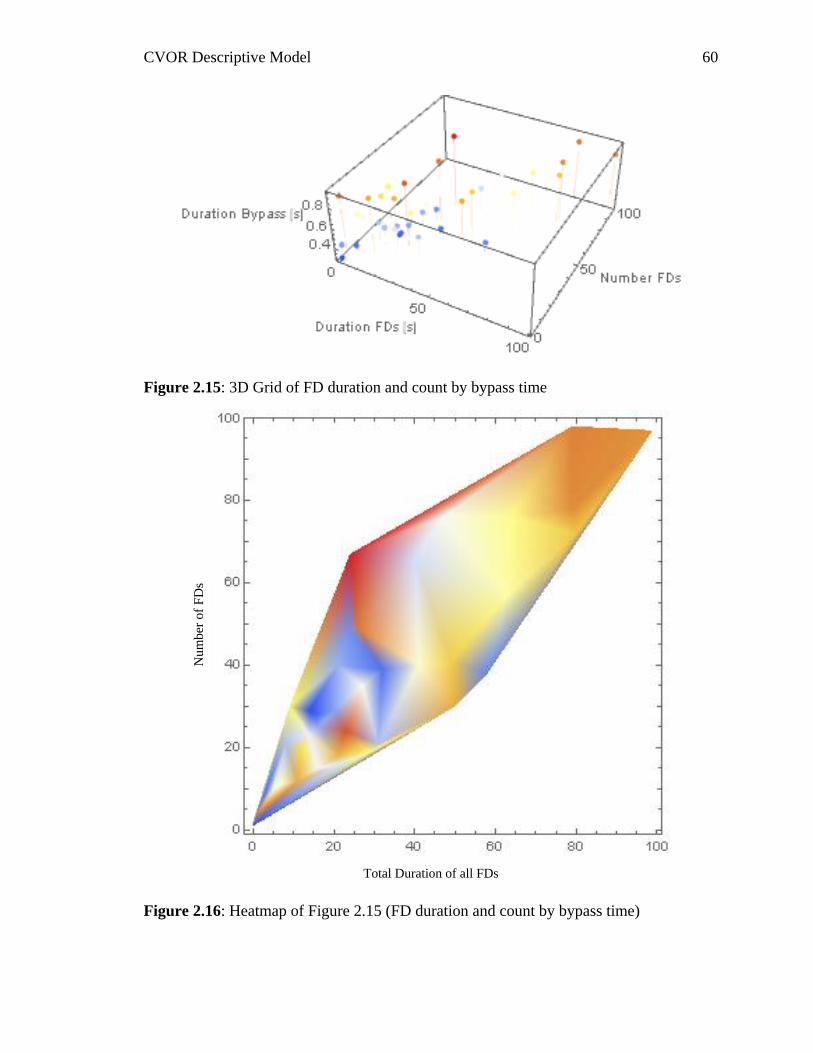
CVOR Descriptive Model 60
Figure 2.15: 3D Grid of FD duration and count by bypass time
Figure 2.16: Heatmap of Figure 2.15 (FD duration and count by bypass time)
Total Duration of all FDs
Nu
mb
er o
f F
Ds
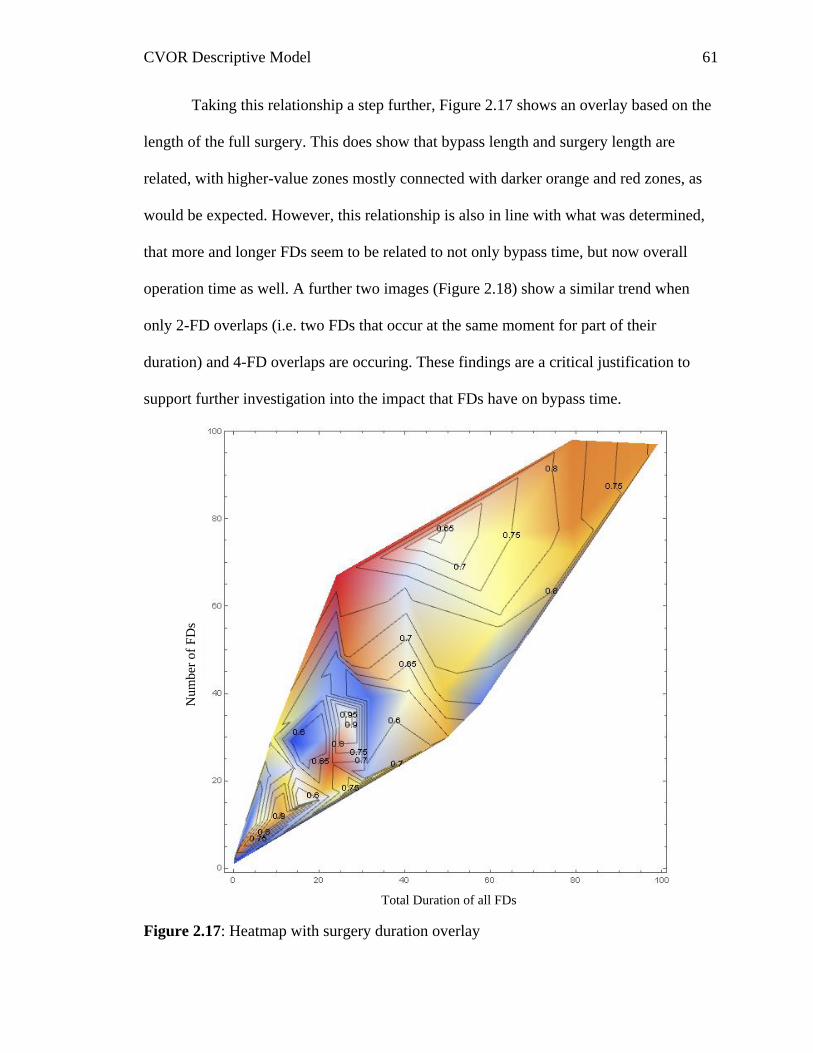
CVOR Descriptive Model 61
Taking this relationship a step further, Figure 2.17 shows an overlay based on the
length of the full surgery. This does show that bypass length and surgery length are
related, with higher-value zones mostly connected with darker orange and red zones, as
would be expected. However, this relationship is also in line with what was determined,
that more and longer FDs seem to be related to not only bypass time, but now overall
operation time as well. A further two images (Figure 2.18) show a similar trend when
only 2-FD overlaps (i.e. two FDs that occur at the same moment for part of their
duration) and 4-FD overlaps are occuring. These findings are a critical justification to
support further investigation into the impact that FDs have on bypass time.
Figure 2.17: Heatmap with surgery duration overlay
Total Duration of all FDs
Nu
mb
er o
f F
Ds
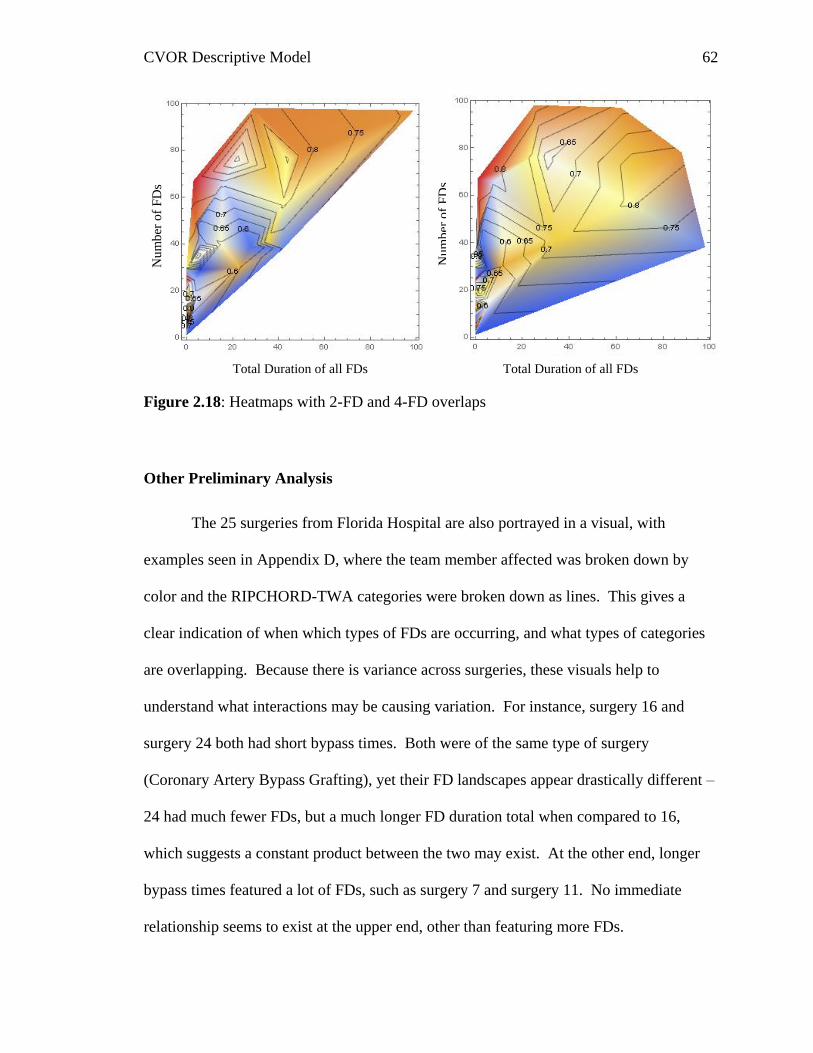
CVOR Descriptive Model 62
Figure 2.18: Heatmaps with 2-FD and 4-FD overlaps
Other Preliminary Analysis
The 25 surgeries from Florida Hospital are also portrayed in a visual, with
examples seen in Appendix D, where the team member affected was broken down by
color and the RIPCHORD-TWA categories were broken down as lines. This gives a
clear indication of when which types of FDs are occurring, and what types of categories
are overlapping. Because there is variance across surgeries, these visuals help to
understand what interactions may be causing variation. For instance, surgery 16 and
surgery 24 both had short bypass times. Both were of the same type of surgery
(Coronary Artery Bypass Grafting), yet their FD landscapes appear drastically different –
24 had much fewer FDs, but a much longer FD duration total when compared to 16,
which suggests a constant product between the two may exist. At the other end, longer
bypass times featured a lot of FDs, such as surgery 7 and surgery 11. No immediate
relationship seems to exist at the upper end, other than featuring more FDs.
Nu
mb
er o
f F
Ds
Total Duration of all FDs
Nu
mb
er o
f F
Ds
Total Duration of all FDs
CVOR Descriptive Model 63
To explore further, because the current data set includes the type of procedure, the
surgeon, and the time of day, analysis was conducted to see if these are factors that
should be included in model development. A 3-way ANOVA analysis was conducted,
testing these three variables and interactions between them. Although cell sizes were not
appropriate, some interesting results were found from the first 25 cases. There was a
significant main effect for the type of procedure, F(24) = 5.167, p = .024, with the four
types being CABG (n = 12, M = 5459, SD = 1442), Aneurysm Repair (n = 4, M = 7956,
SD = 780), Valve repair/replace (n = 7, M = 5885, SD = 2250.), and revascularization (n
= 2, M = 5943, SD = 3514). Post hoc tests were conducted, with Tukey’s HSD revealing
a significant difference between CABG and aneurysm repair at the p < .05 level. Both
time (F(24) = 2.367, p = .158) and surgeon (F(24) = 2.651, p = .097) were not significant,
but given the small and uneven cells, both were trending such that they also should be
considered for further model development.
Next Steps
Because the findings of this section demonstrate the existence of some kind of
relationship, the immediate next step was to determine a suitable mathematical modeling
technique to attempt to better understand bypass time. A review of literature on modeling
is presented in the next section, with a focus on other research in the medical and
specifically surgical domains. Beyond that, based on those findings, a suitable modeling
methodology was chosen in order to most effectively utilize this data.

CVOR Descriptive Model 64
Chapter 3: Model Theory
Overview of Mathematical Modeling
Mathematical modeling is the process of developing an explanation of a system
through concepts and logic utilizing mathematical approaches. This methodology
presents a variety of different options for analyzing and understanding a system,
depending on the goals and the type of data available. For example, a model can be static
or dynamic – static implies the model is in a steady state, while dynamic has some aspect
that changes with time (such as FDs in the current data). There are many different
methodologies that can be employed, with a description of the methodology for the
current project explained later in this chapter.
For the current project, the goal of creating a mathematical model was due to the
potential to predict a system state – namely predicting the length of bypass time because
of its link to post-operation complications. One of the main limits in this project is the
usage of existing data, which is rich enough to create a model, however possible
approaches were limited. This section will review similar research and begin to define
the target model with visual representations based on the extant literature. Additionally,
hypotheses will be presented with the basis for their inclusion.
Control Theory
The first common methodology explored is known as control theory and includes
linear control theory (LCT), feedback loops, and many other specific methods. This
overarching methodology comes from an intersection between engineering and applied
mathematics (Hautphenne, Lefeber Nazarathy & Taylor, 2013). Control theory is an
efficient way of modeling controllers in a feedback loop system. The feedback loop is a
CVOR Descriptive Model 65
way of describing how information is fed back into the decision process – in essence a
feedback system is sampling its own activity and adjusting its activity based upon some
system specific end goal (Sundkvist, Milestad, & Jansson, 2005).
One-way feedback loops are often employed in the field of biology. For example,
Ferrell (2013) explored the wide range of ways these loops occur in cells, such as
negative feedback loops that occur in mitosis when unoccupied kinetochores are sensed.
Another area they are applied is in manufacturing control systems (Takahashi &
Takahashi, 2002), where a machine takes in input to determine how to adjust its position
or output. In the case of positioning, every movement causes feedback to help the
machine know exactly how its movement translated into the new position relative to the
process of interest. In both of these cases, and in most cases for LCT, the processes have
measurable inputs and outputs that are in direct and predictable conjunction.
Markovian Chain
The second methodology explored is the continuous time Markovian chain.
Markov chains fall under the field of applied probability, in a sub-field called matrix
analytic methods (MAM) (Hautphenne et al., 2013). Unlike methodology from control
theory, a separate field from applied probability, the methodology in MAM is relatively
new, meaning that as a field there is plenty of room for expanding to new applications. It
also means that a simplified and multi-use model such as one that could be developed for
the current research would be a valuable tool.
Unlike control theory, MAM produces data geared towards analysis and
prediction. Instead of an input with a definite and guaranteed output, MAM produces
probabilities of changes. For example, Jin and Mukherjee (2014), utilized Markov chains
CVOR Descriptive Model 66
to try to predict the changes of state of civil infrastructure such as bridges. By utilizing
historical data, the probabilities of changing between states of functioning and disrepair
are possible. This example does share some similarities with the goal of the current
research – by categorizing flow disruptions as a “state”, MAM could help to predict the
switches between types of FDs, or states such as “FD” versus “No FD”.
One method of MAM that has been applied to the domain of surgery before are
bottleneck analyses (e.g. Shao, et al., 2014). In essence, this method of modeling focuses
on where probabilities of changing state are lower, thus resulting in a ‘bottleneck’. These
bottlenecks become the places in the process that are of concern and that are causing the
system to be held up. This approach makes perfect sense in an assembly line setting,
where it’s been applied many times (e.g. Wiendahl & Hegenscheidt, 2002). As
something moves down the line, each station or process has to be completed before the
construct can proceed, meaning that slow cycle times at a single station directly impact
the total throughput time.
Although a useful modelling technique, MAM is not the ideal tool to adequately
explain the more complicated system presented in an active operating room. Although
flow disruptions can have an impact on one team member, such as the circulating nurse,
the actual effect they have on other team members (e.g. the surgeon) or the overall
process could vary drastically. In practice a single flow disruption from a single team
member could critically stall the entire surgery, or it could have absolutely no impact on
the process what so ever, even if it was the exact same type of flow disruption impacting
the same team member. Although these differences in outcome can be captured by the
probabilities presented in MAM, at best it will drastically simplify a very complex
CVOR Descriptive Model 67
process. Because of this, MAM is not a sufficient model to accurately describe an
operating room.
Similar Research:
A previous study by Buddas (2014) examined bottlenecks in a humanitarian aid
supply chain. Despite not necessarily analyzing FDs by the present researches definition,
the overall idea is somewhat similar mathematically – just on a much grander scale.
Where in the CVOR a disruption commonly lasts for less than a minute, in the supply
chain system the bottlenecks that occur could result in days of time lost. There were
similarities in Buddas’ work to the current project, such as communication and
coordination issues being of note in the cause of delays. Unfortunately this paper did not
contain a mathematical model to build off of, because the final product was a process
map for administrators to follow and apply to their own processes.
A study from the same year by Zhao and colleagues (2014), involved a bottleneck
analysis of its own – this time in an emergency department. Similar to the previously
described study, these bottlenecks are not the same as FDs – they’re a greater measure
representing delays at a single place. The bottlenecks could be the result of FDs, or just a
symptom of the system design. Zhao’s team, however, did create a more rigorous
mathematical system to identify bottlenecks. Patient’s movements through the system
were analyzed, giving a numeric explanation of the system.
One of the more relevant research studies was conducted by Shao and colleagues
(2015), which examined flow disruptions in a surgical setting. Their data set included a
total of 1759 FDs across 87 separate trauma cases. For their research, FDs were
classified into one of ten types, depending on their nature. Several of these types bear
CVOR Descriptive Model 68
similarity to the RIPCHORD-TWA categories used in the present research, such as
“communication” and “equipment”. The model developed had a total of 10 possible
states, one for each of the FD types and one for the “normal state”. The analysis used
involved a continuous time Markov chain model, the proof of which is available in full in
their paper. The model did not get into individual team members, but instead the room as
a whole, and was limited to one type of FD at a time. The authors were able to identify
which disruptions were causing bottlenecks in real time, and quickly utilize those
findings to help improve system performance.
A study by Chen, Wang, Ding, and Thomas (2016) examined patient flow by
utilizing a smart hospital environment. Like Zhao and colleagues (2014), the researchers
were concerned with the overall flow in the hospital – how long individual patients take
at different points. The authors built graphical models representative of patients at each
point in time by employing Performance Evaluation Process Algebra. The purpose, and
the authors’ findings, was to support using a smart hospital environment to manage
individual’s movement and understand what zones need improvement.
Lee and colleagues (2017) modeled the entire care process from diagnosis to
surgery for lung cancer patients. The researchers divided the process into five separate
stages, each of which is not necessarily occurring in linear order. The authors employed
a bottleneck analysis, and tested the model with a large number of patients (n = 614).
The authors then determined where hold-ups occurred by applying the waiting time data
between each stage. Similar to most of the studies found, this research was limited to the
overall picture, instead of delving into the details of what caused the FDs. This paper did
include its mathematical proof, making it a valuable resource for building a model.
CVOR Descriptive Model 69
Given the current discussion, a different method is desired for modeling the
CVOR data. These previously used models, exhibiting both LCT and MAM, tend to
explore the process in an ‘assembly line’ style, focusing on the different periods as steps
in the process. This doesn’t consider the truth evident when considering what FDs
represent in our definition: deviations from the norm (Shouhed et al., 2014; Wiegmann et
al., 2007). To model these deviations, the present research sought a method that does not
simplify the FDs, but instead shows them as results of activity in the OR, and how they
can cascade into a series of FDs. This model will take into account the almost limitless
combinations of FDs, and the wide range of effects possible as a result.
Research Questions:
The present research aimed to develop a mathematical model using the previously
obtained observational data. This model was designed such that it can predict the length
of a critical phase. For the current data set, this model specifically was designed to
predict bypass time as a function of the other available data. The model, however, was
also designed to be generalizable to some extent, leaving it open to be applied to any
“critical phase” for a team or individual where flow disruption data is collected.
This project does not represent the first time the data was modeled in some
fashion. Boquet, Cohen, Reeves, and Shappell (2017) originally attempted to by creating
the error space graphics (a.k.a. “radar graphs” or “Kiviat diagrams”). By breaking down
the RIPCHORD-TWA major categories onto separate axes of a plot – or the minor
categories of a single major category – the authors aimed to create a visual depiction
based on length of disruptions. The aggregation of all FDs of a single category onto its
axis, and then connecting those points (one from each axis), an error space is created
CVOR Descriptive Model 70
which demonstrates the amount of time in a state of FD. The error space graphic,
unfortunately, is a dead end for further mathematical modeling. The area of the error
space is relatively arbitrary, due to its dependence on the amount of time in FD, in
addition to the number of axes (e.g. communication has 7 minor categories, while
equipment issues only has 4) and the order the axes are placed around the origin (e.g.
largest to smallest, alphabetical order, seeded based on some value representing impact).
Because of this, for the present project a different approach was taken.
The data set contains valuable information, similar to that used in the
development of other models. Lee and colleagues (2017) used timestamps from several
different points in lung cancer care to model what parts of the process (e.g. diagnostic
biopsy, invasive staging) cause a bottleneck that slows down care. Others modeled
waiting times in an emergency room using type stamps at various points to generate
periods such as “waiting to be seen” and “length of stay” (Zhao, et al., 2014). Based on
the literature, and the preliminary analyses the data available seemed suitable for
modeling, and so the first hypothesis was generated:
H1: A mathematical model can be developed which
generates an output descriptive of the amount of time
spent in a critical phase based on duration of flow
disruptions.
Because there is data broken down both by role and by type of flow disruption,
further distinction can be made using the generated model. Specifically, that there will be
CVOR Descriptive Model 71
some differentiation between different roles and their effect on the length of bypass time.
This logically makes sense, for example a disruption during bypass time that effects the
surgeon directly – such as a scrub nurse performing a searching activity for the
equipment the surgeon needs to continue the procedure – should have more of an effect
on the length of bypass time than a similar searching activity being performed by the
anesthesia role for a specific drug they want to administer. As the operation tends to be
mostly focused around the surgeon, different activities can be considered primary and
tertiary to the immediate need. Due to this logic, the following hypothesis was generated:
H2a: Flow disruptions will have a different effect on
critical phase length (bypass time) depending on which
team member they are specific to.
The operation will not be as simple as one role in or not in a state of flow
disruption. The roles will cycle through, where one may be in flow disruption, followed
by a brief lull and then an FD for a different role. Additionally, multiple roles may be in
an FD state at the same time – potentially up to all four roles. Because of this, the
following hypothesis was generated:
H2b: The interaction of flow disruptions between
various roles will have more of an effect on critical
phase length (bypass time) than the effect of an
individual role.
CVOR Descriptive Model 72
Finally, because the RIPCHORD-TWA taxonomy was applied to the data,
another dimension is possible for developing a descriptive model. Different categories
may have a different impact on how disruptive the event is, for example nonessential
communication FDs will not necessarily stop the task completely because individuals can
still work while making small talk, whereas a personnel rotation FD would fully take a
role out of action while they are trying to get their replacement up to speed. The final
hypothesis reflects this:
H2c: Flow disruptions will have a different effect on
critical phase length (bypass time) depending on which
major category (RIPCHORD-TWA) they pertain to.
Model Design
Because hypothesis two is prediction based on the nature of the flow disruption –
whether it’s affecting a specific role, an interaction between the roles, or is based on a
specific type of FD – it is critical to develop models representative of these changes.
There are two areas of interest, the state and the phase of the operation. The state refers
to the absence or presence of FDs. The phase refers to the overall time frame at a given
moment; so whether it’s in pre-bypass time, bypass time (the critical phase), or post-
bypass time. The following sections include visuals of the models developed with
descriptions.
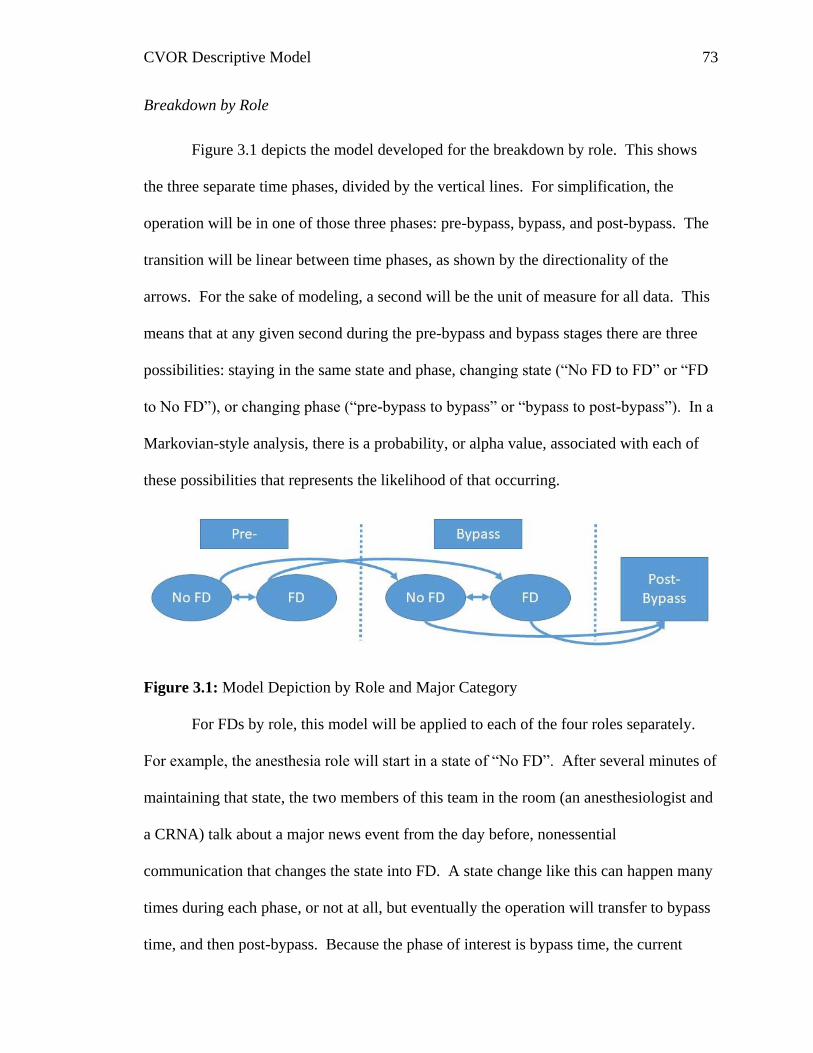
CVOR Descriptive Model 73
Breakdown by Role
Figure 3.1 depicts the model developed for the breakdown by role. This shows
the three separate time phases, divided by the vertical lines. For simplification, the
operation will be in one of those three phases: pre-bypass, bypass, and post-bypass. The
transition will be linear between time phases, as shown by the directionality of the
arrows. For the sake of modeling, a second will be the unit of measure for all data. This
means that at any given second during the pre-bypass and bypass stages there are three
possibilities: staying in the same state and phase, changing state (“No FD to FD” or “FD
to No FD”), or changing phase (“pre-bypass to bypass” or “bypass to post-bypass”). In a
Markovian-style analysis, there is a probability, or alpha value, associated with each of
these possibilities that represents the likelihood of that occurring.
Figure 3.1: Model Depiction by Role and Major Category
For FDs by role, this model will be applied to each of the four roles separately.
For example, the anesthesia role will start in a state of “No FD”. After several minutes of
maintaining that state, the two members of this team in the room (an anesthesiologist and
a CRNA) talk about a major news event from the day before, nonessential
communication that changes the state into FD. A state change like this can happen many
times during each phase, or not at all, but eventually the operation will transfer to bypass
time, and then post-bypass. Because the phase of interest is bypass time, the current
CVOR Descriptive Model 74
research is only concerned with FDs leading up to and through that critical phase – once
the phase changes to “post-bypass”, the model ends, regardless of what state it’s in.
In this case the value of interest, therefore, is the probability of transferring into
“post-bypass” from each state. This value will be represented by alpha escape (FD) or
alpha escape (no FD) – αescape_FD, or αescape_NoFD respectively. By hypothesis 2a, these
values should be different for each role, representing the difference that FDs by role have
on the length of bypass time. If, for example, αescape_FD is higher for the anesthesia role
than the surgery role, that would imply that FDs for the surgery role have more of an
impact on the length of bypass time than those for anesthesia. FDs for the anesthesia role
are less likely to prevent an escape to post-bypass.
Interaction of Roles
Figure 3.2 depicts a more complex model representative of a three team-member
interaction. This model brings a greater level of complexity to the system, because now
the “FD”/”No FD” state is not a dichotomy, but instead a much more complex system.
The numbers in Figure 3 represent the team member affected, so in the case of this
model, one, two, or all three of the team members can be in that state. The shift occurs
just one flow disruption at a time – each flow disruption in the preceding studies was
assigned to a single team member, and because of the nature of the observational data no
two flow disruptions started at the exact same time. Therefore, from the default of “No
FD”, a total of five possibilities are represented in this diagram: staying in the same state
and phase, shifting phase, or shifting state in one of three ways – a flow disruption for
team member 1, 2, or 3.
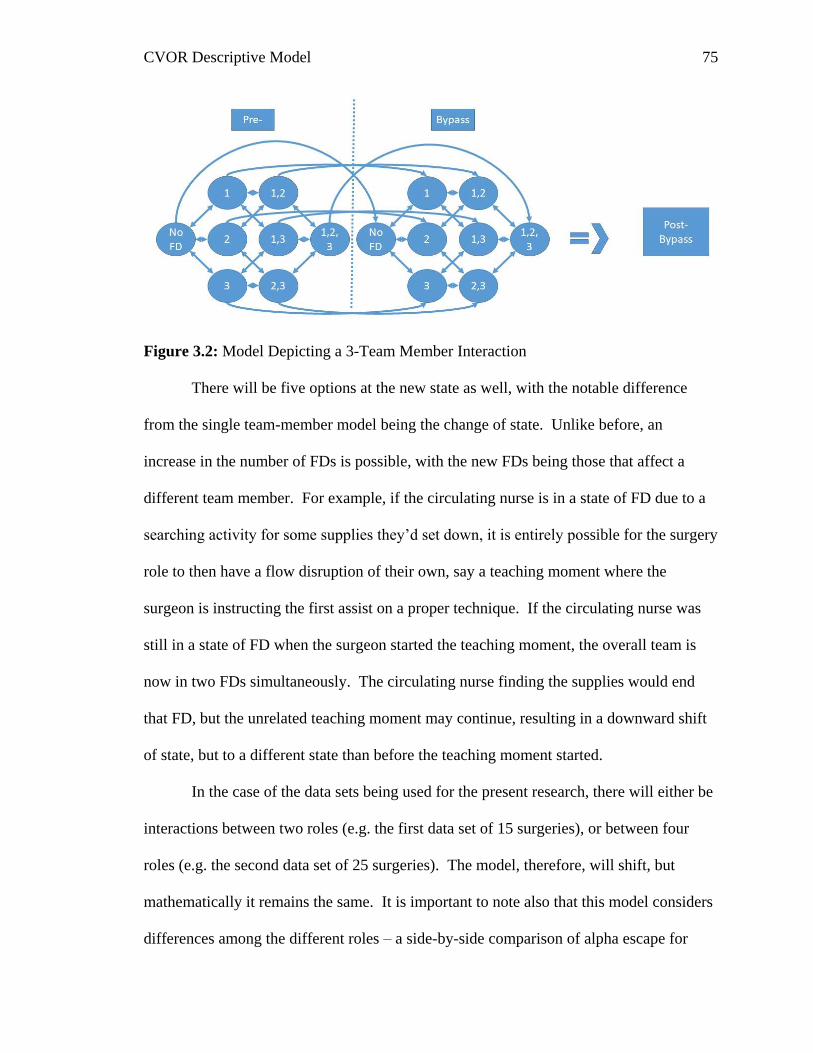
CVOR Descriptive Model 75
Figure 3.2: Model Depicting a 3-Team Member Interaction
There will be five options at the new state as well, with the notable difference
from the single team-member model being the change of state. Unlike before, an
increase in the number of FDs is possible, with the new FDs being those that affect a
different team member. For example, if the circulating nurse is in a state of FD due to a
searching activity for some supplies they’d set down, it is entirely possible for the surgery
role to then have a flow disruption of their own, say a teaching moment where the
surgeon is instructing the first assist on a proper technique. If the circulating nurse was
still in a state of FD when the surgeon started the teaching moment, the overall team is
now in two FDs simultaneously. The circulating nurse finding the supplies would end
that FD, but the unrelated teaching moment may continue, resulting in a downward shift
of state, but to a different state than before the teaching moment started.
In the case of the data sets being used for the present research, there will either be
interactions between two roles (e.g. the first data set of 15 surgeries), or between four
roles (e.g. the second data set of 25 surgeries). The model, therefore, will shift, but
mathematically it remains the same. It is important to note also that this model considers
differences among the different roles – a side-by-side comparison of alpha escape for
CVOR Descriptive Model 76
each role individually as well as for any two, three, or all four if such a state occurs in the
data set with all four roles observed simultaneously.
Breakdown by Major Category
The breakdown by major category will employ the same model depicted in Figure
11 for FDs affecting a single role. The only difference for this case is that the data set
will be divided up differently. The math will be identical. It is important to note, also,
that it is possible for two different roles to experience FDs of the same major category
that overlap – for example, the surgery role may face ineffective communication between
the surgeon and a scrub nurse, while shortly after nonessential communication starts
between the CRNA and anesthesiologist. In cases such as this, these multiple FDs will
be simplified into a single extended FD, starting when the first one starts and ending
when the last of the overlapping ones ends.
Methodology to be Employed
In a simple form, the model developed should take on the overall appearance of
Lee and colleagues (2017) bottleneck analysis, with the three phases occurring only in
sequential order. Nested in each of the phases would be a more dynamic system as seen
in the research by Shao and his team (2015). In this model, because flow disruptions
were the construct of interest, there is a large amount of variability in which state the
model is in, making it similar to the present research where the change from “FD” to “No
FD” may happen many times within one phase of the operation. While this is a simplistic
system that on the surface fits with a Markov chain-style analysis, that methodology fails
to fully address the more complex system at play.
CVOR Descriptive Model 77
One of the main short-comings of a Markov chain when considering the present
data is that Markov chains do not include any memory of past events. In essence, if one
event occurs to switch between two states, the next state change still occurs at the same
probability. This means that the history of the system is not considered. In the CVOR
setting, however, the current thinking puts events as dependent on the current state, as
evident by Figures 2.17 and 2.18, where overlapping FDs have a similar – but not
identical – impact on bypass time when compared to FDs in general. Exploring the
RIPCHORD-TWA taxonomy also makes this evident, where certain types of FDs (e.g.
coordination – personnel not available) could directly lead to another (e.g. interruption –
task deviation).
Because of the desire to fully encompass the variability inherent in the system,
methodology beyond that utilized in similar past research was explored. The option that
fits the current understanding of the data is a method known as ‘adjacent possible’. Less
rigorous than the Markov chain, the adjacent possible approach doesn’t assume set states.
Although in the model we’ve defined states of ‘FD’ and ‘no FD’, this oversimplifies the
relationships involved, because for both those states there are wide ranges of possibilities.
For example, in a state of ‘no FD’, even within the pre-bypass phase, there are a lot of
possibilities for each team member based on their current or pressing duties. Same is true
for a state of ‘FD’, just from RIPCHORD-TWA there are 37 minor categories of FDs, but
within each minor category, different possibilities exist depending on the current
activities in the CVOR. This is what adjacent possible attempts to model, the complexity
and possibilities of a real-live operation.
CVOR Descriptive Model 78
The base assumption of adjacent possible is that everything that is a step away
from reality is possible (Tria, Loreto, Servedio, & Strogatz, 2014). Each time an event
occurs, a new set of adjacent possible opens, and new occurrences – either normal
procedure or FDs – are possible. Commonly this method is employed in systems where
the output, or possibilities are ever expanding, such as the production of scientific papers
(Bettencourt, Trancik, & Kaur, 2012), novelties in text (Tria et al., 2014), and innovations
in the energy sector (Bettencourt & Kaiser, 2015).
This continuous tree of cause-and-effect that adjacent possible seeks to explain is
best illustrated using a normal operation as an example. After the tools have been laid
out, there is only a remote possibility of a tool breaking when not in use, such as the saw
blade which used to cut the sternum. Once the tool is picked up by a scrub tech to be
handed to the surgeon, a new possibility for FD opens – being dropped by the scrub tech.
Assuming it reaches the surgeon, as that individual begins using it, the blade may break
(classified as a surgical equipment issue), leading to the circulating nurse being diverted
from their task to get a new one from outside the OR. While the circulating nurse is
absent, a new set of possibilities opens up, such as issues that may be classified as
‘personnel not available’ due to their reliance on the circulating nurse. As this example
illustrates, the surgical environment is incredibly complex, and at each step more FDs are
possible – though not necessarily probable. By modeling the adjacent possible, the
present research can discover how flow disruptions interact with bypass time, not only on
their own, but in conjunction with other FDs.
The work performed before has already demonstrated that adjacent possible is a
valid method to explore. For instance, the third through sixth measures in the

CVOR Descriptive Model 79
“Correlational Development” section all explored the overlap of FDs in surgeries. This
builds off of the theory of adjacent possible and its relationship to FDs, because as FDs
are occurring, they open up the possibility of other FDs to occur, causing the system to
deteriorate.

CVOR Descriptive Model 80
Chapter 4: Model Development and Testing
Procedural Modeling
Prior to fully developing the mathematical model, another important step was to
develop a clear idea of the CVOR state. This involved developing a breakdown of the
tasks each team member is responsible for. Once task lists were compiled – at a mid-level
of detail – the tasks were arrayed in an approximate order (approximate because hospital
procedures can differ), with emphasis on where multiple individuals are involved in the
same task. These events, such as transferring the patient to the bed (involving circulating
nurse and anesthesia at the least), are the instances in a Markovian-style analysis that
could be considered bottle necks. Based on the author’s experience observing surgeries,
however, individuals will continue to work through their tasks, potentially bypassing
group efforts until instigated by another individual.
The task list presented in Table 4.1 was developed using a wide range of
resources. Several texts were explored, with text selected due to the relevance to each of
the roles: anesthesia (Hensley & Martin, 1995), surgery (Bojar, 2011), perfusionist
(Ghosh, Flater, & Perrino, 2015), and circulating nurse (Seifert, 1994). Additionally,
videos were viewed on line to help fill in some of the gaps (Perfusion UHN, 2016;
Wheatley, 2016; Grinnell Regional Medical Center, 2011). Finally, the author utilized the
experience of other researchers to validate the list in the context of the surgical suites
where data collection was actually performed (e.g. Shappell, 2016).
There is some variation in detail across different phases of the surgery, with the
most notable absence being a reduction in tasks during the actual operation to “Heart
operated on”. Although there is a large amount of complexity that the surgery role is
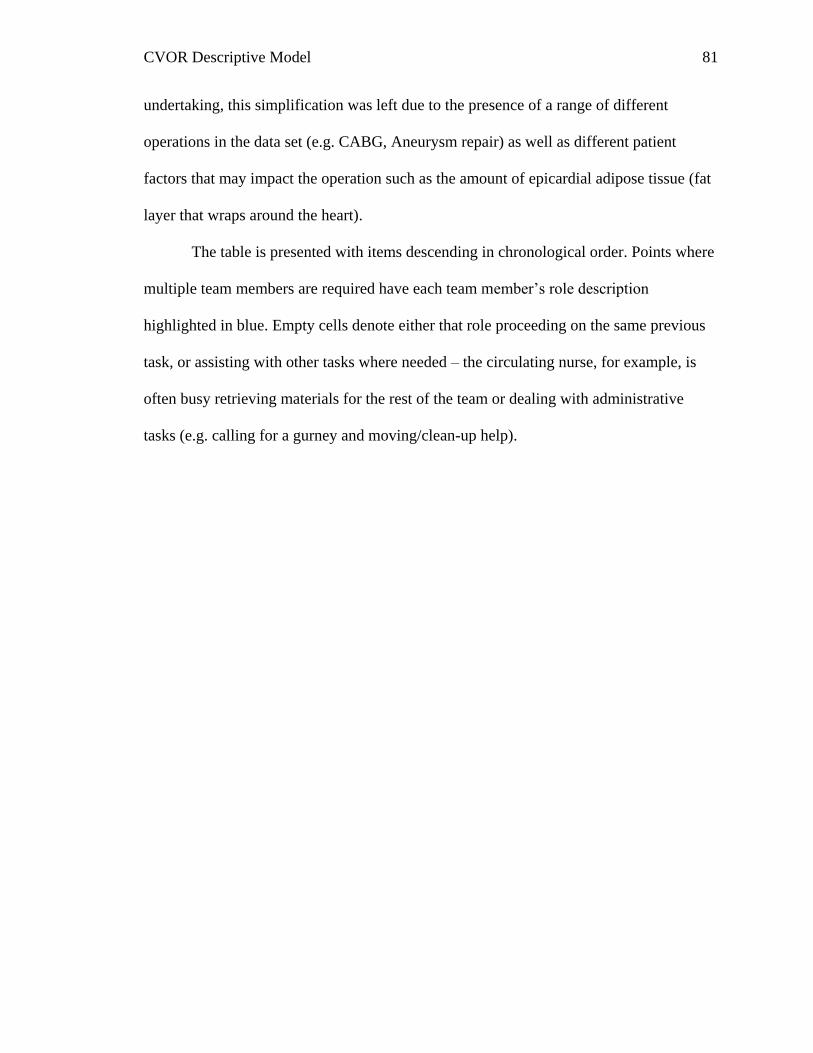
CVOR Descriptive Model 81
undertaking, this simplification was left due to the presence of a range of different
operations in the data set (e.g. CABG, Aneurysm repair) as well as different patient
factors that may impact the operation such as the amount of epicardial adipose tissue (fat
layer that wraps around the heart).
The table is presented with items descending in chronological order. Points where
multiple team members are required have each team member’s role description
highlighted in blue. Empty cells denote either that role proceeding on the same previous
task, or assisting with other tasks where needed – the circulating nurse, for example, is
often busy retrieving materials for the rest of the team or dealing with administrative
tasks (e.g. calling for a gurney and moving/clean-up help).
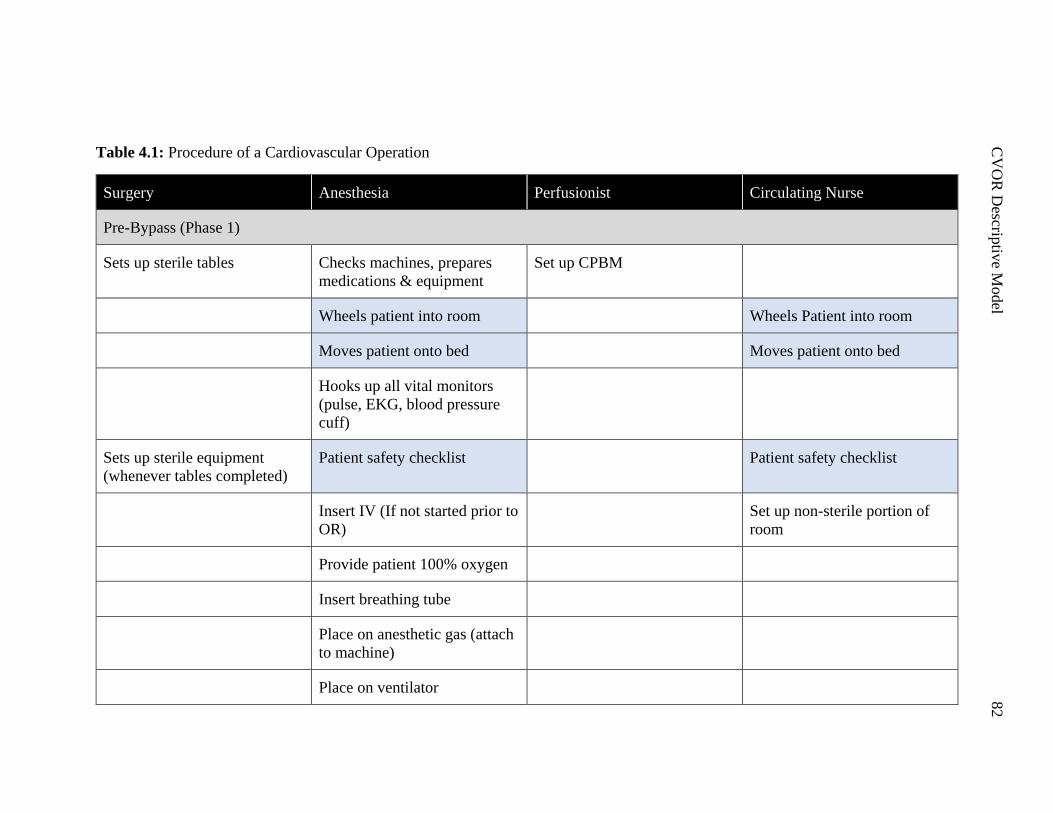
C
VO
R D
escriptiv
e Model
82
Table 4.1: Procedure of a Cardiovascular Operation
Surgery Anesthesia Perfusionist Circulating Nurse
Pre-Bypass (Phase 1)
Sets up sterile tables Checks machines, prepares
medications & equipment
Set up CPBM
Wheels patient into room Wheels Patient into room
Moves patient onto bed Moves patient onto bed
Hooks up all vital monitors
(pulse, EKG, blood pressure
cuff)
Sets up sterile equipment
(whenever tables completed)
Patient safety checklist Patient safety checklist
Insert IV (If not started prior to
OR)
Set up non-sterile portion of
room
Provide patient 100% oxygen
Insert breathing tube
Place on anesthetic gas (attach
to machine)
Place on ventilator
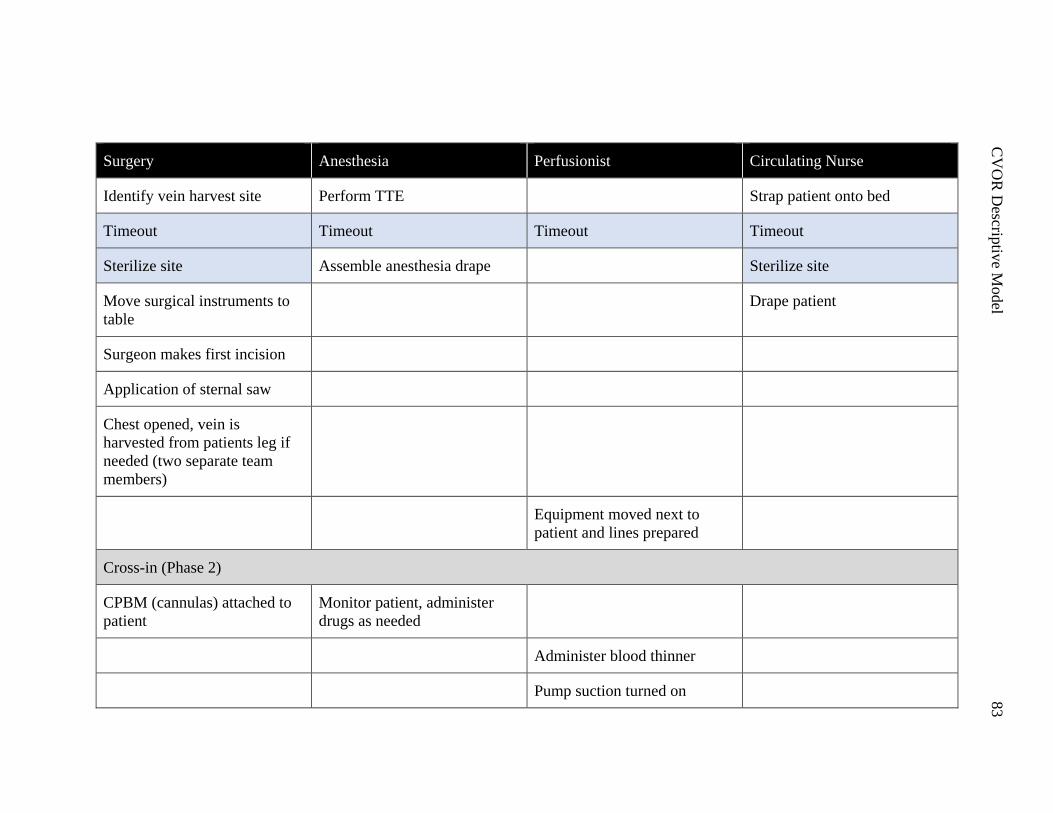
C
VO
R D
escriptiv
e Model
83
Surgery Anesthesia Perfusionist Circulating Nurse
Identify vein harvest site Perform TTE Strap patient onto bed
Timeout Timeout Timeout Timeout
Sterilize site Assemble anesthesia drape Sterilize site
Move surgical instruments to
table
Drape patient
Surgeon makes first incision
Application of sternal saw
Chest opened, vein is
harvested from patients leg if
needed (two separate team
members)
Equipment moved next to
patient and lines prepared
Cross-in (Phase 2)
CPBM (cannulas) attached to
patient
Monitor patient, administer
drugs as needed
Administer blood thinner
Pump suction turned on
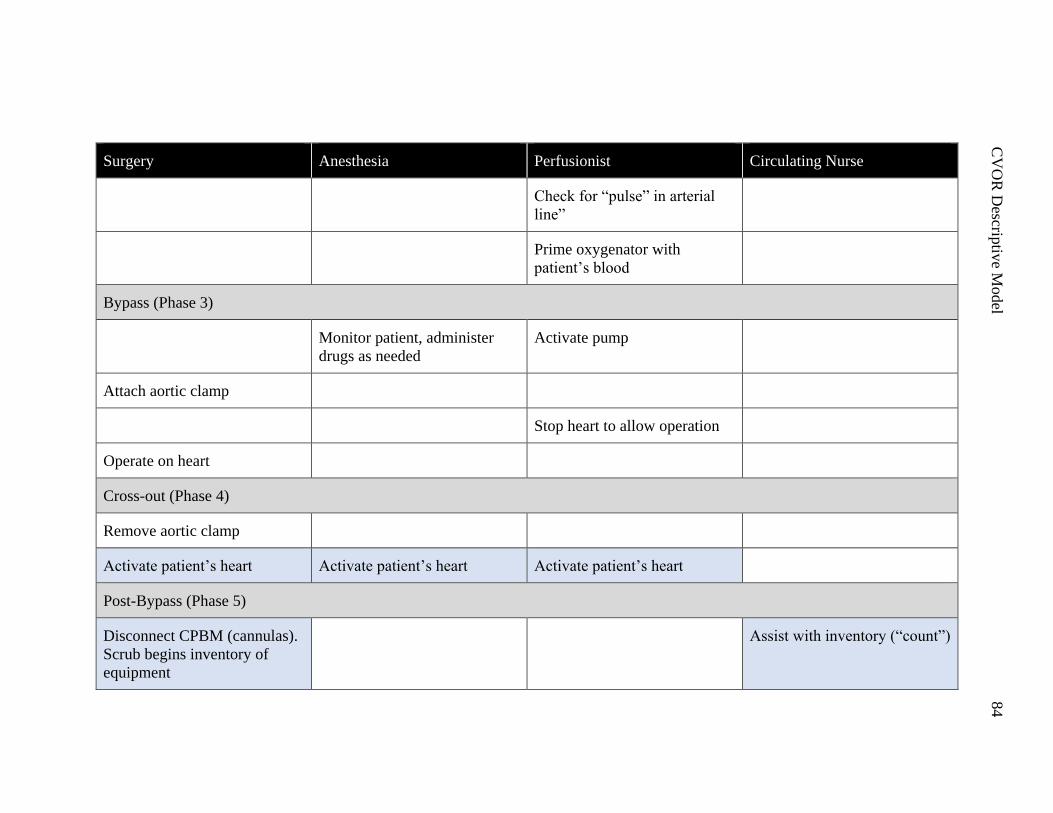
C
VO
R D
escriptiv
e Model
84
Surgery Anesthesia Perfusionist Circulating Nurse
Check for “pulse” in arterial
line”
Prime oxygenator with
patient’s blood
Bypass (Phase 3)
Monitor patient, administer
drugs as needed
Activate pump
Attach aortic clamp
Stop heart to allow operation
Operate on heart
Cross-out (Phase 4)
Remove aortic clamp
Activate patient’s heart Activate patient’s heart Activate patient’s heart
Post-Bypass (Phase 5)
Disconnect CPBM (cannulas).
Scrub begins inventory of
equipment
Assist with inventory (“count”)
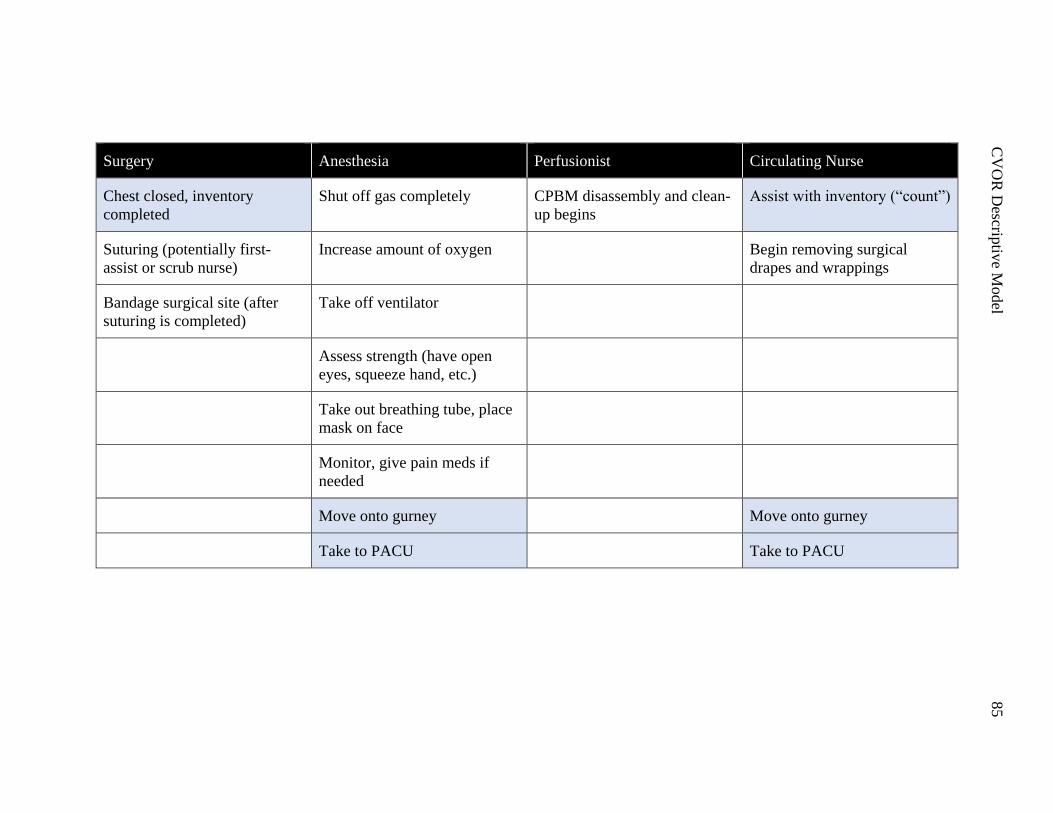
C
VO
R D
escriptiv
e Model
85
Surgery Anesthesia Perfusionist Circulating Nurse
Chest closed, inventory
completed
Shut off gas completely CPBM disassembly and clean-
up begins
Assist with inventory (“count”)
Suturing (potentially first-
assist or scrub nurse)
Increase amount of oxygen Begin removing surgical
drapes and wrappings
Bandage surgical site (after
suturing is completed)
Take off ventilator
Assess strength (have open
eyes, squeeze hand, etc.)
Take out breathing tube, place
mask on face
Monitor, give pain meds if
needed
Move onto gurney Move onto gurney
Take to PACU Take to PACU
CVOR Descriptive Model 86
Mathematical Modeling
The overview of the surgical procedure presented in the previous section was
modeled using mathematical processes built around the style of the adjacent possible
discussed previously. This method was adjusted, with other extant models with similar
theory explored and incorporated into the final product. Two methodologies: labyrinth
theory and percolation theory formed the primary basis alongside adjacent possible.
Labyrinth theory is a way to model decision points or events in a 2-dimensional
space. In essence, this methodology mathematically describes the decisions made while
navigating this space. There is an optimal path – the shortest possible “perfect” solution
to the maze, and as someone works through it they make decisions that influence how
close to optimal their solution will be.
To illustrate how this looks in the surgical environment, three different points are
presented in Figure 4.1 on a simplified maze. Each of these points is potentially very
different in the kind of action taking place, with different possible options in a maze. At
point 1, the optimal path is still being adhered to, but requires a change of direction. In
the CVOR this could be a business-as-usual decision such as deciding which valve size to
prepare – there is still some thought that has to happen, but it is a part of the regular
procedure. Point 2 involves a decision, with two separate paths that can be followed. In
the case of this maze, one ends quickly in a dead-end, but in the CVOR there may not be
any dead-ends, with decision points changing the path of the operation. FDs in this case,
could force the change in path – if both ways lead to the successful completion – where
the operation is proceeding as expected until derailed from the optimal path. This is
where the impact of an FD could be represented in this method: a FD can be seen as a
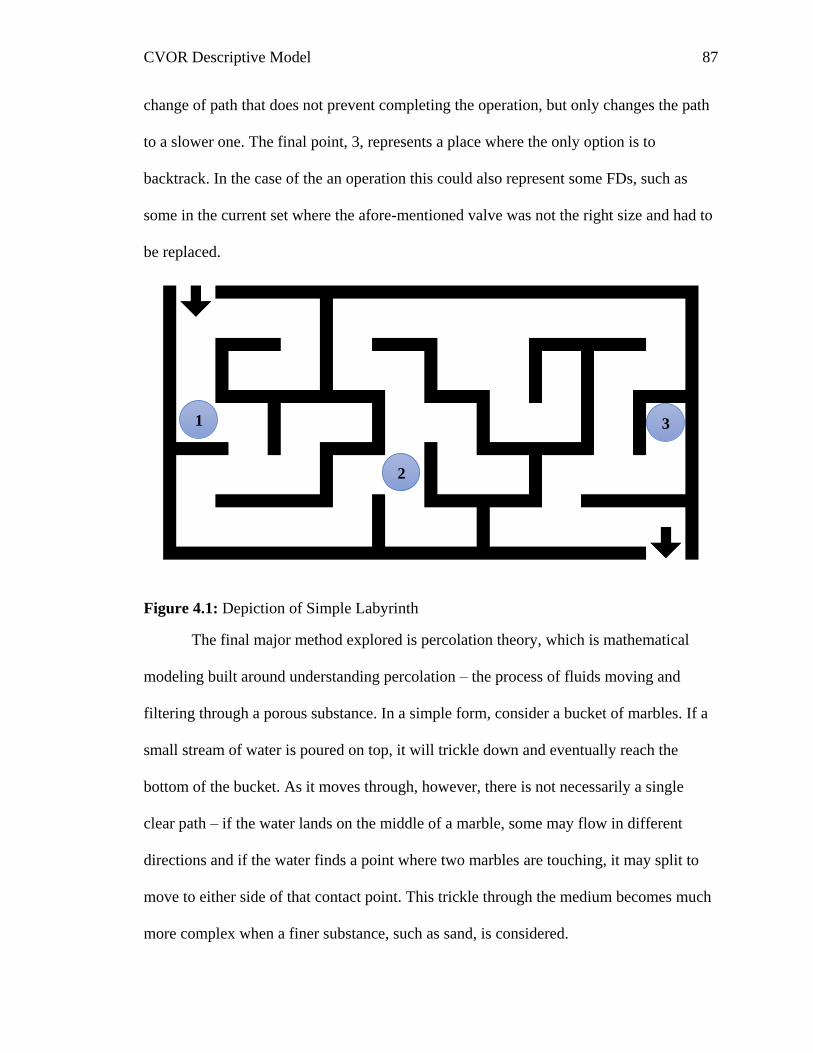
CVOR Descriptive Model 87
change of path that does not prevent completing the operation, but only changes the path
to a slower one. The final point, 3, represents a place where the only option is to
backtrack. In the case of the an operation this could also represent some FDs, such as
some in the current set where the afore-mentioned valve was not the right size and had to
be replaced.
Figure 4.1: Depiction of Simple Labyrinth
The final major method explored is percolation theory, which is mathematical
modeling built around understanding percolation – the process of fluids moving and
filtering through a porous substance. In a simple form, consider a bucket of marbles. If a
small stream of water is poured on top, it will trickle down and eventually reach the
bottom of the bucket. As it moves through, however, there is not necessarily a single
clear path – if the water lands on the middle of a marble, some may flow in different
directions and if the water finds a point where two marbles are touching, it may split to
move to either side of that contact point. This trickle through the medium becomes much
more complex when a finer substance, such as sand, is considered.
1
2
3
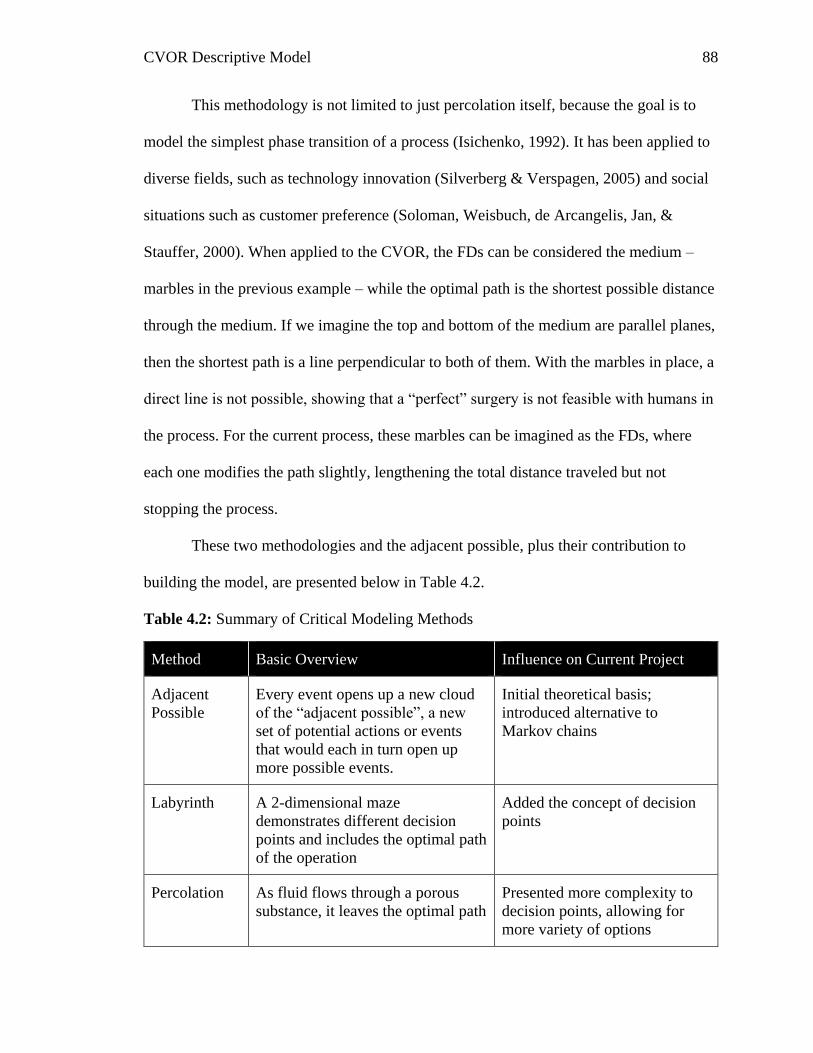
CVOR Descriptive Model 88
This methodology is not limited to just percolation itself, because the goal is to
model the simplest phase transition of a process (Isichenko, 1992). It has been applied to
diverse fields, such as technology innovation (Silverberg & Verspagen, 2005) and social
situations such as customer preference (Soloman, Weisbuch, de Arcangelis, Jan, &
Stauffer, 2000). When applied to the CVOR, the FDs can be considered the medium –
marbles in the previous example – while the optimal path is the shortest possible distance
through the medium. If we imagine the top and bottom of the medium are parallel planes,
then the shortest path is a line perpendicular to both of them. With the marbles in place, a
direct line is not possible, showing that a “perfect” surgery is not feasible with humans in
the process. For the current process, these marbles can be imagined as the FDs, where
each one modifies the path slightly, lengthening the total distance traveled but not
stopping the process.
These two methodologies and the adjacent possible, plus their contribution to
building the model, are presented below in Table 4.2.
Table 4.2: Summary of Critical Modeling Methods
Method Basic Overview Influence on Current Project
Adjacent
Possible
Every event opens up a new cloud
of the “adjacent possible”, a new
set of potential actions or events
that would each in turn open up
more possible events.
Initial theoretical basis;
introduced alternative to
Markov chains
Labyrinth A 2-dimensional maze
demonstrates different decision
points and includes the optimal path
of the operation
Added the concept of decision
points
Percolation As fluid flows through a porous
substance, it leaves the optimal path
Presented more complexity to
decision points, allowing for
more variety of options
CVOR Descriptive Model 89
Method Basic Overview Influence on Current Project
due to the geometry of the medium
that it flows through.
Final Mathematical Model
The final mathematical model was developed to incorporate aspects of the
aforementioned techniques. This model incorporates both a theoretical component and a
data-driven component.
The theoretical component divided up the procedure presented earlier into time
blocks, where every event was assigned a start and stop variable and a change in time
(“delta time”) value. Initially, every one of these “blocks” was assigned a default time of
ten minutes for the sake of building the model. As development progressed, these times
would be modified based on real times of the operation to some extent, however it should
be noted that the timing of each of these tasks and determining the true required time is
outside of the scope of the present project. As such, though these times were adjusted to
be accurate to the data, due to the presence of FDs and other imperfections in the
environment and procedures, their accuracy to a textbook performance is not known.
In addition to the time blocks, the model incorporated virtual team members
(VTM). These VTMs were not only individuals such as the patient, but also other
equipment and stations (e.g. the CPBM or the surgical “back table”) that individuals had
to interact with based on the task descriptions. This functioned as a way to track the
needs of the four primary team members in order to take into account possible cross-
overs and interferences. In total, 21 “team members” were included, as listed in Table
4.3. This list includes the four established team members as well as a wide range of
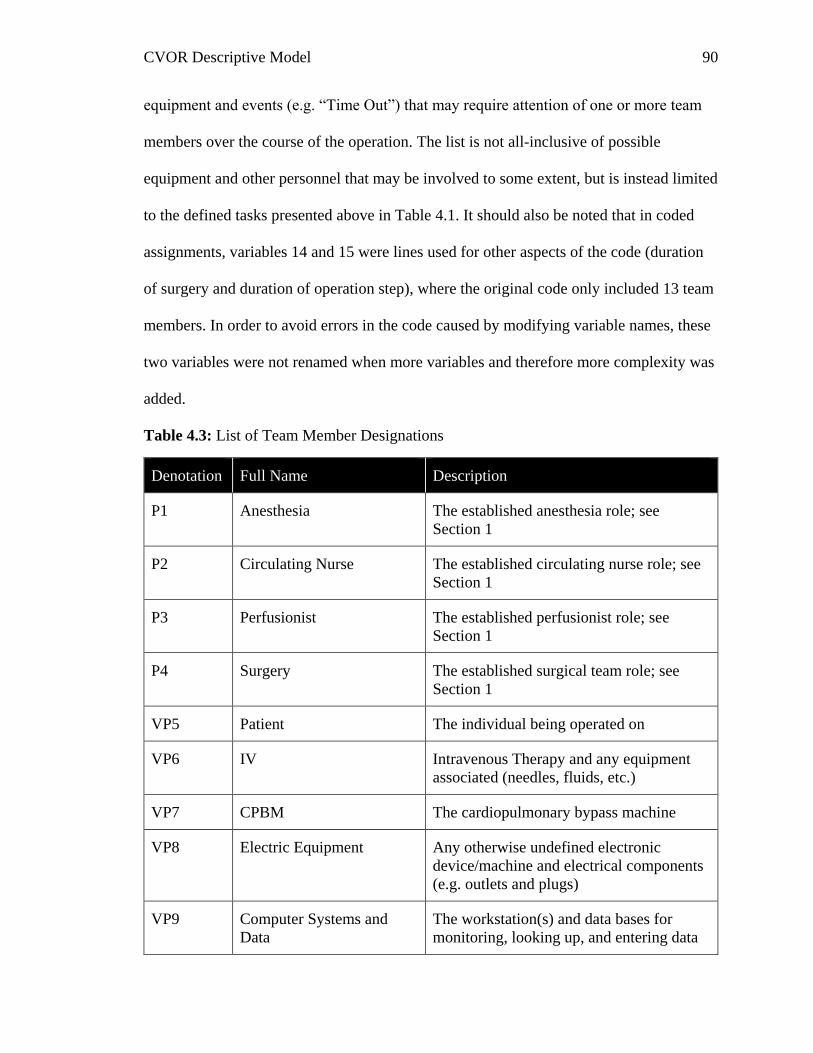
CVOR Descriptive Model 90
equipment and events (e.g. “Time Out”) that may require attention of one or more team
members over the course of the operation. The list is not all-inclusive of possible
equipment and other personnel that may be involved to some extent, but is instead limited
to the defined tasks presented above in Table 4.1. It should also be noted that in coded
assignments, variables 14 and 15 were lines used for other aspects of the code (duration
of surgery and duration of operation step), where the original code only included 13 team
members. In order to avoid errors in the code caused by modifying variable names, these
two variables were not renamed when more variables and therefore more complexity was
added.
Table 4.3: List of Team Member Designations
Denotation Full Name Description
P1 Anesthesia The established anesthesia role; see
Section 1
P2 Circulating Nurse The established circulating nurse role; see
Section 1
P3 Perfusionist The established perfusionist role; see
Section 1
P4 Surgery The established surgical team role; see
Section 1
VP5 Patient The individual being operated on
VP6 IV Intravenous Therapy and any equipment
associated (needles, fluids, etc.)
VP7 CPBM The cardiopulmonary bypass machine
VP8 Electric Equipment Any otherwise undefined electronic
device/machine and electrical components
(e.g. outlets and plugs)
VP9 Computer Systems and
Data
The workstation(s) and data bases for
monitoring, looking up, and entering data
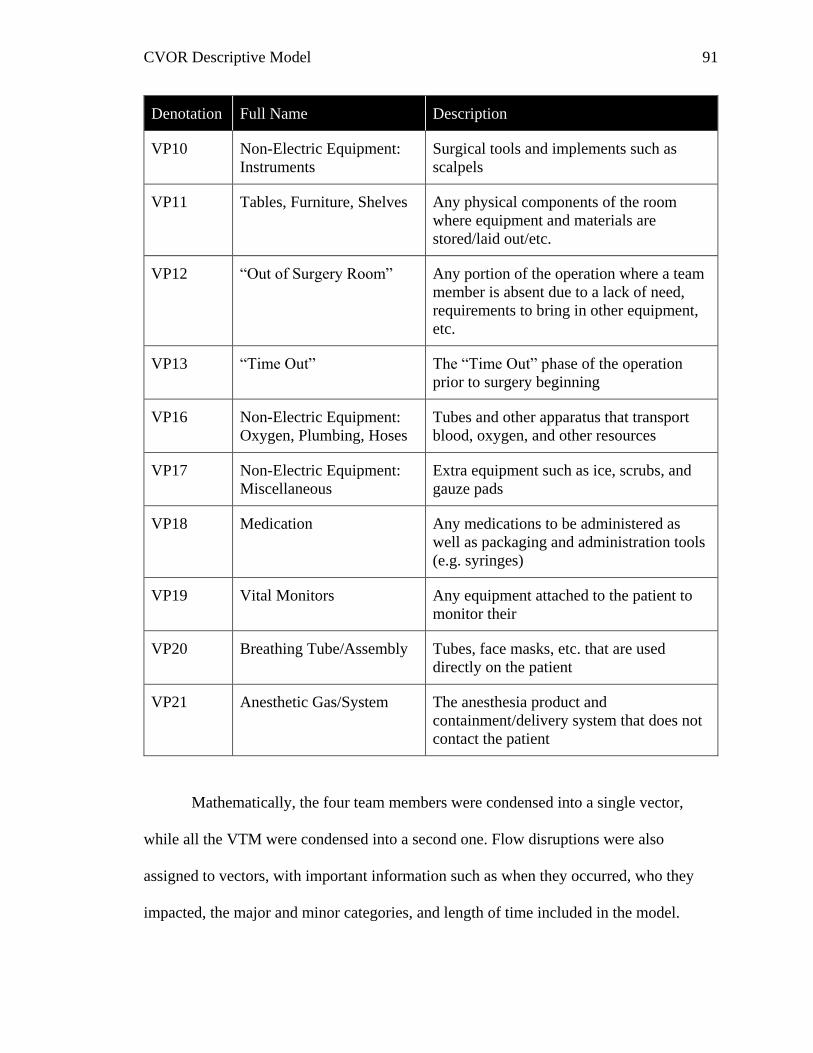
CVOR Descriptive Model 91
Denotation Full Name Description
VP10 Non-Electric Equipment:
Instruments
Surgical tools and implements such as
scalpels
VP11 Tables, Furniture, Shelves Any physical components of the room
where equipment and materials are
stored/laid out/etc.
VP12 “Out of Surgery Room” Any portion of the operation where a team
member is absent due to a lack of need,
requirements to bring in other equipment,
etc.
VP13 “Time Out” The “Time Out” phase of the operation
prior to surgery beginning
VP16 Non-Electric Equipment:
Oxygen, Plumbing, Hoses
Tubes and other apparatus that transport
blood, oxygen, and other resources
VP17 Non-Electric Equipment:
Miscellaneous
Extra equipment such as ice, scrubs, and
gauze pads
VP18 Medication Any medications to be administered as
well as packaging and administration tools
(e.g. syringes)
VP19 Vital Monitors Any equipment attached to the patient to
monitor their
VP20 Breathing Tube/Assembly Tubes, face masks, etc. that are used
directly on the patient
VP21 Anesthetic Gas/System The anesthesia product and
containment/delivery system that does not
contact the patient
Mathematically, the four team members were condensed into a single vector,
while all the VTM were condensed into a second one. Flow disruptions were also
assigned to vectors, with important information such as when they occurred, who they
impacted, the major and minor categories, and length of time included in the model.
CVOR Descriptive Model 92
Once the mathematical framework was generated, artificial FDs were
incorporated to see how theoretical FDs could impact the flow of the operation and
bypass time specifically. These artificial FDs were generated as assigned to random team
members and categories, started at random times, and lasted random durations. The
impact that these had was theorized in a variety of ways, with impact ranging from none
(e.g. an off topic conversation that happens over a task) to the extreme of requiring a task
re-start (e.g. surgical role has to re-start setting up the sterile table completely because the
table cover fell on the ground). Because at this point the impact is still being explored to
further develop the model, no assumptions were made based on the level of impact based
on the team member, the type of FD, the duration, or the time the FD occurred. The only
assumption was a potential difference in impact, with those effects randomly generated as
well utilizing a numeric value that has been termed the Peripheral Task Absorbsion
Factor or PTAF.
Peripheral Task Absorbsion Factor
The PTAF is a representation of the amount of drain on the system FDs have.
This drain can be considered in a variety of forms, such as a drain on resources and a
drain on SA. At this point, which form PTAF will take is difficult to determine, so these
alternate explanations (or partial explanations) serve as a directional means for
interpreting the results.
In terms of resources, although some can result in more surgical materials being
required (e.g. spilling/dropping), time is the main focus. Each FD could theoretically add
it’s duration to the length of the surgery – or more worrisome, bypass time. This is a
worst-case, and there is no evidence of a definite one-to-one ration of time in FD to
CVOR Descriptive Model 93
length of the operation in a general standpoint. Some FDs definitely could add their time
to the operation, but most of them will not. Some, such as many communication FDs, can
happen while team members are still engaged in other tasks. Other FDs, such as
distractions caused by cell phone use, may typically happen while the team member has
some down time from other tasks, meaning there is not anything for them to actually
delay. Because of these potential differences, the final PTAF will differ depending on
category and team member.
Situational awareness is the other area of focus for the present research, tying
back in to the error space concept developed by Boquet and colleagues (2017a).
Considering SA, the impact of FDs may not be something as blatant as a longer bypass
time, they could instead overload cognitive resources. The extra volume of tasks and
distractions, therefore, may compromise SA. This would allow for more FDs and even
errors to occur that could cause the overall system to either slow down, or in a worst case
scenario, come to a halt. Similar to time, the type of FD could have an impact – the
communication FDs may be the gateway, where having a nonessential conversation
might be enough of a distraction that a team member is less aware of their surroundings
and creates a spilling and dropping FD by knocking over materials.
True Data Inclusion
After the model was developed, the data collected at MUSC and FH were
incorporated to determine how the model behaves with real data. The same information
(e.g. length of FD, when the FD occurred) were available with the addition of the true
length of different portions of the surgery that could be incorporated into the model
CVOR Descriptive Model 94
(instead of utilizing default 10 minute/activity blocks). This difference allows for a better
understanding of bypass time length and what is impacting it.
In order to parse out the meaning of the data following its incorporation, various
mathematical techniques were applied. This consisted of creating visuals such as
scatterplots and scalograms and extracting meaning by utilizing mathematical proofs.
These activities will be discussed in more depth in the next part of this section, as well as
in the context of the results in Chapter 5:.
Visual Modeling
Visual outputs were created in conjunction the mathematical model in an effort to
better understand the data. Both images and videos were included in this this project.
Image Models
The final model utilized two different still visuals that depict the occurrence of
FDs in the operation. Specifically these visuals focused on bypass time. In both cases,
they serve as a way to better show the data, and both methods led to breakthroughs that
increased the understanding of these FDs.
The scatter plots show the FDs count against either duration or time between. The
count represents the ordered number of the FDs, so if a total of 50 occurred during bypass
time a conglomerate of all the data would have one point per X coordinate up to 50. This
was further broken down by team member and by major category. For team member, for
instance, if there were a total of 20 FDs associated with the perfusionist and 25 with the
circulating nurse, when these two parts of the data are presented on the same graph the
perfusionist will have dots up to X coordinate 20 while the circulating nurse will start at
the X origin also and work up to X coordinate 25. Duration of the FD refers to how long
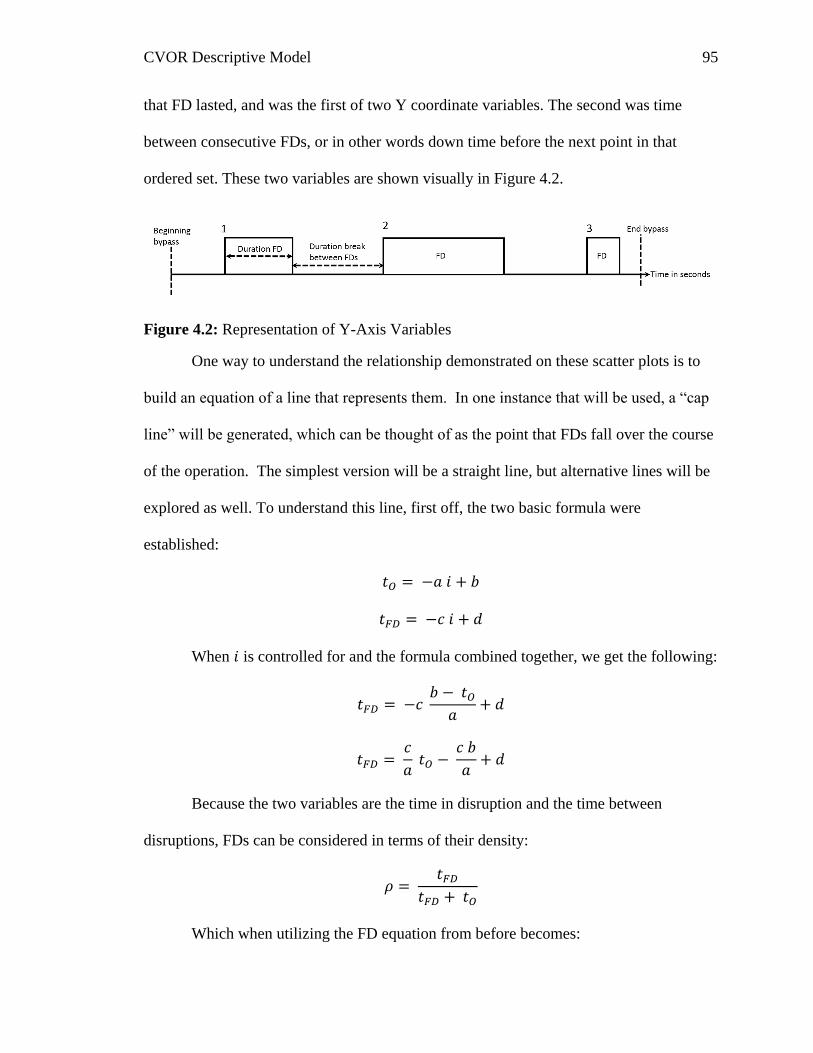
CVOR Descriptive Model 95
that FD lasted, and was the first of two Y coordinate variables. The second was time
between consecutive FDs, or in other words down time before the next point in that
ordered set. These two variables are shown visually in Figure 4.2.
Figure 4.2: Representation of Y-Axis Variables
One way to understand the relationship demonstrated on these scatter plots is to
build an equation of a line that represents them. In one instance that will be used, a “cap
line” will be generated, which can be thought of as the point that FDs fall over the course
of the operation. The simplest version will be a straight line, but alternative lines will be
explored as well. To understand this line, first off, the two basic formula were
established:
𝑡𝑂 = −𝑎 𝑖 + 𝑏
𝑡𝐹𝐷 = −𝑐 𝑖 + 𝑑
When 𝑖 is controlled for and the formula combined together, we get the following:
𝑡𝐹𝐷 = −𝑐 𝑏 − 𝑡𝑂
𝑎+ 𝑑
𝑡𝐹𝐷 = 𝑐
𝑎 𝑡𝑂 −
𝑐 𝑏
𝑎+ 𝑑
Because the two variables are the time in disruption and the time between
disruptions, FDs can be considered in terms of their density:
𝜌 = 𝑡𝐹𝐷
𝑡𝐹𝐷 + 𝑡𝑂
Which when utilizing the FD equation from before becomes:
CVOR Descriptive Model 96
𝜌 =
𝑐𝑎 𝑡𝑂 −
𝑐 𝑏𝑎 + 𝑑
𝑐𝑎
𝑡𝑂 − 𝑐 𝑏𝑎
+ 𝑑 + 𝑡𝑂
𝜌 =
𝑐𝑎
𝑡𝑂 + (𝑑 − 𝑐 𝑏𝑎
)
(𝑐𝑎
+ 1) 𝑡𝑂 + (𝑑 − 𝑐 𝑏𝑎
)
The proof walks through the steps to generate a density equation. It stands to
reason that as more time is spend in FD than out of FD, the density will approach one.
What this equation also helps to show is that the slopes of the lines that cap these
triangles and the intercepts that they are associated with both help to better understand the
system. Additionally, in the graphics the cap lines will be accompanied by bands of .95
probability regions, showing where the cap lines from different data sets (e.g. short vs.
long bypass times) overlap.
The wavelet scalograms are a visual of the power spectrum – or the distribution of
the energy in a wave. The wavelet scalogram specifically utilizes the fourier transform,
which decomposes the ‘signal’. In the case of the current research, the signal is the
occurrence of FDs over the bypass time. The X axis represents the duration of the bypass
time while the Y axis is the frequency of FDs during bypass time. The frequency can also
be thought of as the octave of the FDs, moving from infrequent at the bottom of this axis
to more frequent at the top. For this 2-dimensional visual, the value of the Fourier
coefficient is denoted by the darker color. A three dimensional version will also be
generated, where the magnitude of the Fourier coefficient will be denoted by height as
well as by color.
CVOR Descriptive Model 97
Video Models
A video was also created for demonstration purposes. This video modeled the
occurrence of FDs over the course of the operation, based off of the error space graphics
(Boquet et al., 2017a). This graphic depicted the growth of the error space over the course
of a single operation as FDs are occurring, with both different team members and
different major categories denoted on the same graphic. The same six axes will represent
the major categories, while each team member denoted as a different color as a part of the
shape.
CVOR Descriptive Model 98
Chapter 5: Results
The following subsections will discuss the results of the present study, including
the aforementioned graphical productions to assist with an explanation of the findings.
Findings are broken down based on the influence of the team member and the influence
of the RIPCHORD-TWA major category.
Although all forty surgeries were considered for the development of the model,
for the results the focus is on the 25 surgeries from Florida Hospital. This is because
unlike the MUSC data, the FH data covers all of the main team members to some extend
whereas the MUSC data is limited to only two team members per operation. Because of
this, the FD landscape – or the pattern of FDs during the time frame – will be drastically
different due to the absence of many FDs that would be occurring. All of the FD
landscapes for the 25 surgeries are displayed in Appendix E.
Overall Results
The first step to analyzing the data was to plot it against different characteristics
of the FDs. The plot shown in Figure 5.1 represents the count of FDs in the operation for
each team member against the length of time between FDs, or the open time (𝑡𝑂). All
data points included are only those that occur during bypass time. This chart shows a very
clear triangular shape, where FD occurrence is not completely random, but instead more
spread out towards the beginning of the operation and then trailing off as it progresses.
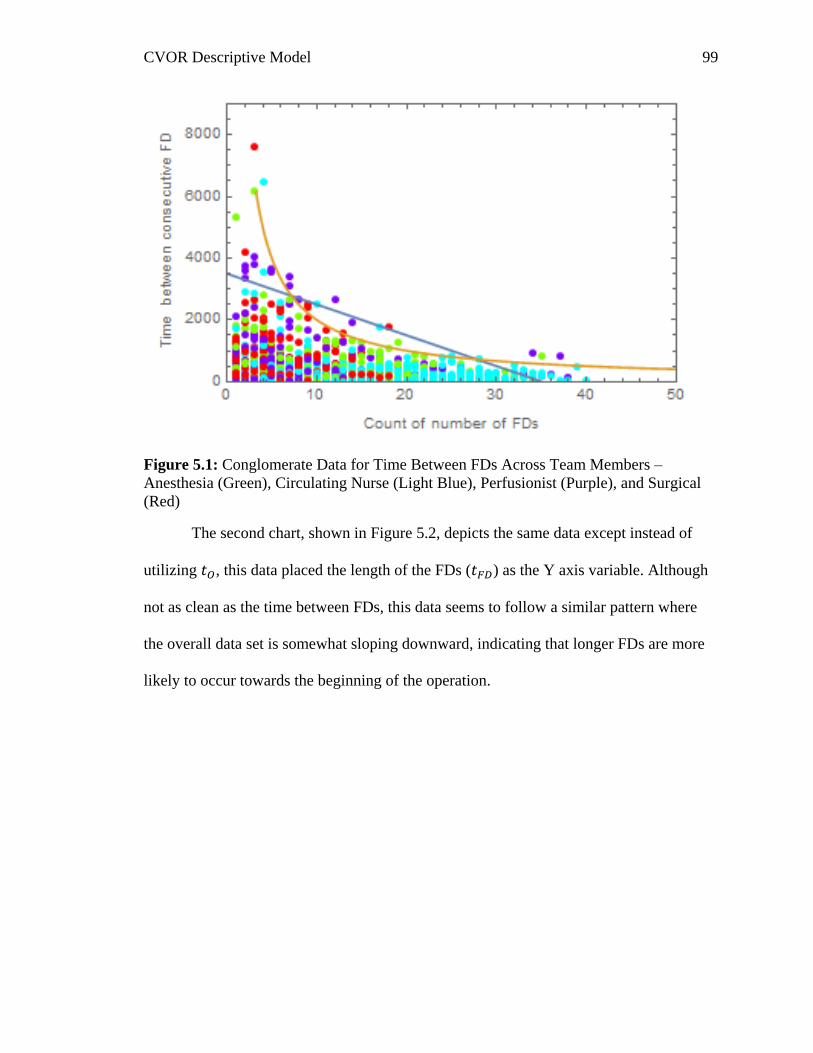
CVOR Descriptive Model 99
Figure 5.1: Conglomerate Data for Time Between FDs Across Team Members –
Anesthesia (Green), Circulating Nurse (Light Blue), Perfusionist (Purple), and Surgical
(Red)
The second chart, shown in Figure 5.2, depicts the same data except instead of
utilizing 𝑡𝑂, this data placed the length of the FDs (𝑡𝐹𝐷) as the Y axis variable. Although
not as clean as the time between FDs, this data seems to follow a similar pattern where
the overall data set is somewhat sloping downward, indicating that longer FDs are more
likely to occur towards the beginning of the operation.
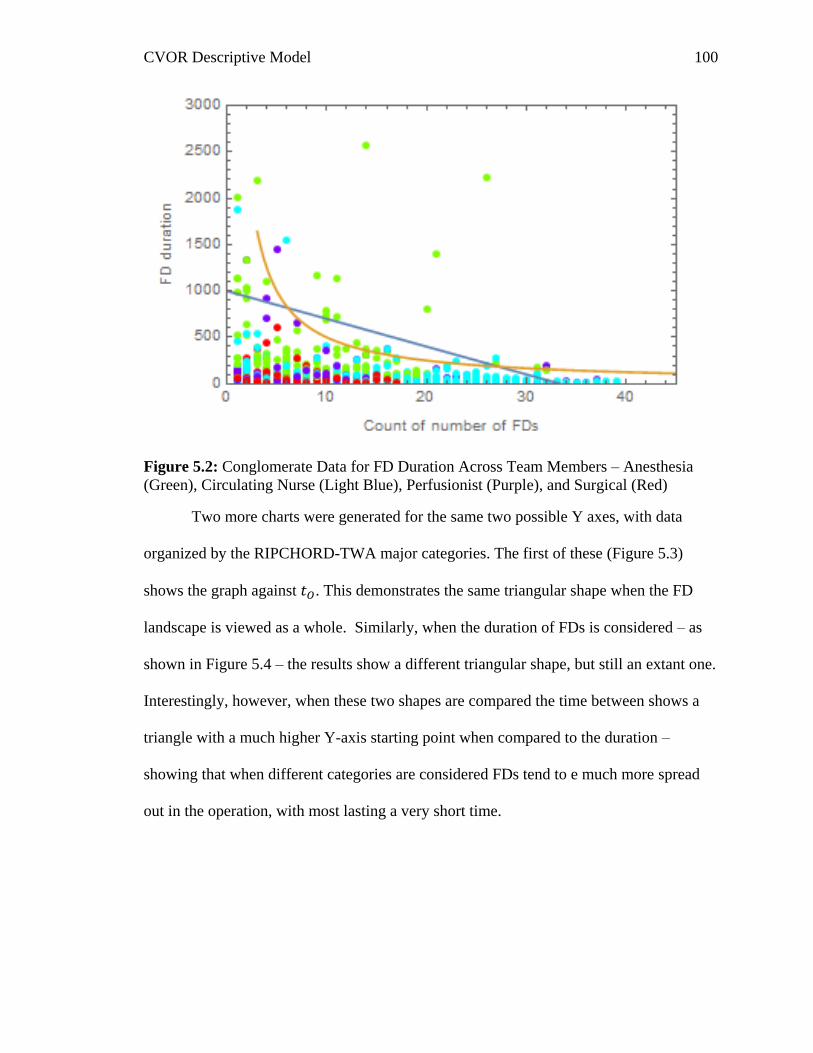
CVOR Descriptive Model 100
Figure 5.2: Conglomerate Data for FD Duration Across Team Members – Anesthesia
(Green), Circulating Nurse (Light Blue), Perfusionist (Purple), and Surgical (Red)
Two more charts were generated for the same two possible Y axes, with data
organized by the RIPCHORD-TWA major categories. The first of these (Figure 5.3)
shows the graph against 𝑡𝑂. This demonstrates the same triangular shape when the FD
landscape is viewed as a whole. Similarly, when the duration of FDs is considered – as
shown in Figure 5.4 – the results show a different triangular shape, but still an extant one.
Interestingly, however, when these two shapes are compared the time between shows a
triangle with a much higher Y-axis starting point when compared to the duration –
showing that when different categories are considered FDs tend to e much more spread
out in the operation, with most lasting a very short time.
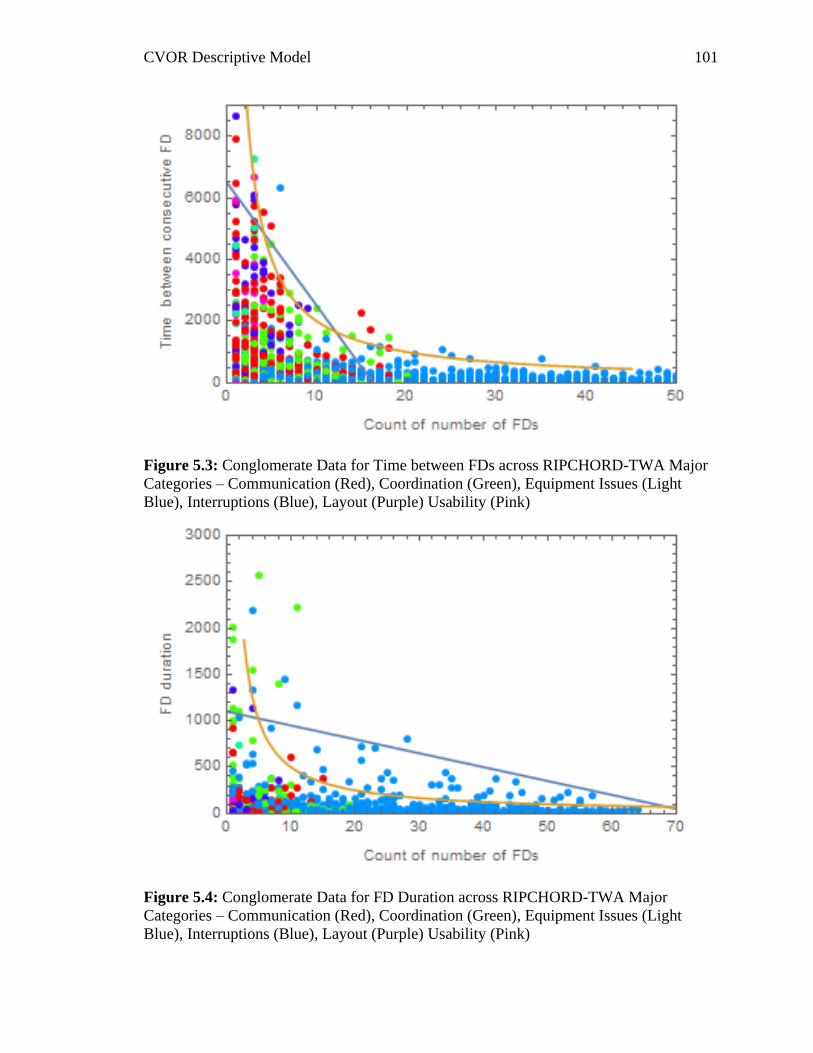
CVOR Descriptive Model 101
Figure 5.3: Conglomerate Data for Time between FDs across RIPCHORD-TWA Major
Categories – Communication (Red), Coordination (Green), Equipment Issues (Light
Blue), Interruptions (Blue), Layout (Purple) Usability (Pink)
Figure 5.4: Conglomerate Data for FD Duration across RIPCHORD-TWA Major
Categories – Communication (Red), Coordination (Green), Equipment Issues (Light
Blue), Interruptions (Blue), Layout (Purple) Usability (Pink)
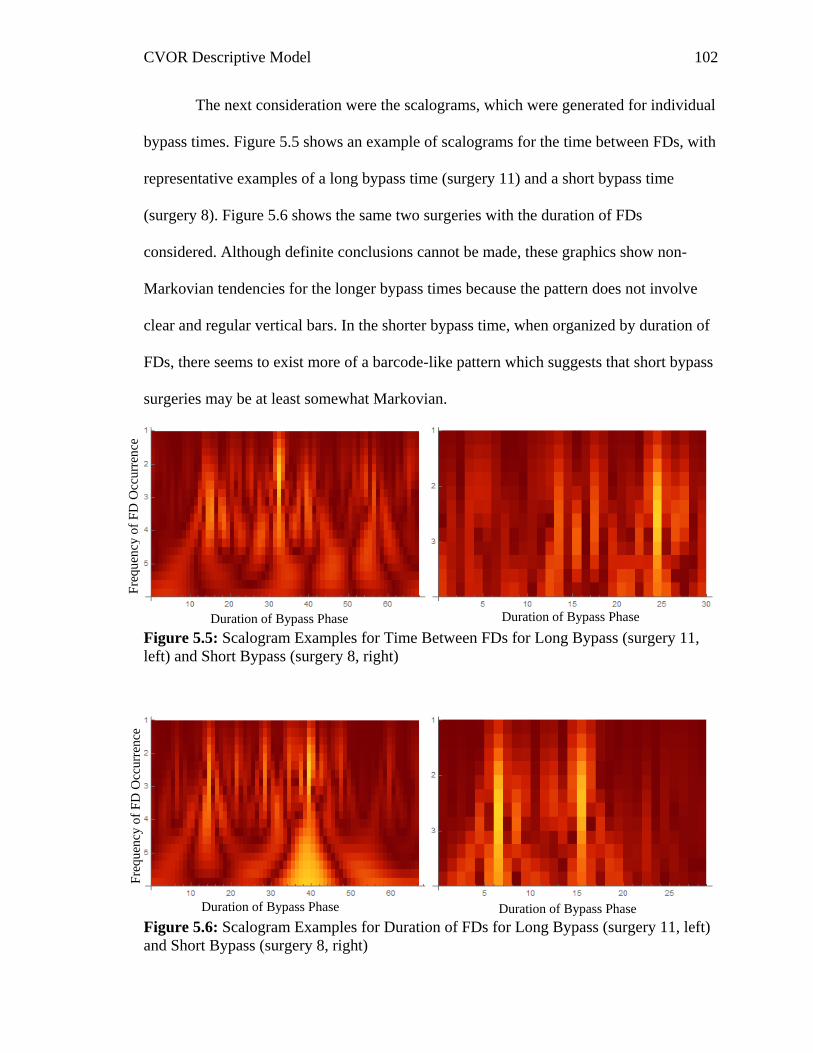
CVOR Descriptive Model 102
The next consideration were the scalograms, which were generated for individual
bypass times. Figure 5.5 shows an example of scalograms for the time between FDs, with
representative examples of a long bypass time (surgery 11) and a short bypass time
(surgery 8). Figure 5.6 shows the same two surgeries with the duration of FDs
considered. Although definite conclusions cannot be made, these graphics show non-
Markovian tendencies for the longer bypass times because the pattern does not involve
clear and regular vertical bars. In the shorter bypass time, when organized by duration of
FDs, there seems to exist more of a barcode-like pattern which suggests that short bypass
surgeries may be at least somewhat Markovian.
Figure 5.5: Scalogram Examples for Time Between FDs for Long Bypass (surgery 11,
left) and Short Bypass (surgery 8, right)
Figure 5.6: Scalogram Examples for Duration of FDs for Long Bypass (surgery 11, left)
and Short Bypass (surgery 8, right)
Duration of Bypass Phase Duration of Bypass Phase
Duration of Bypass Phase Duration of Bypass Phase
Fre
qu
ency
of
FD
Occ
urr
ence
F
requ
ency
of
FD
Occ
urr
ence
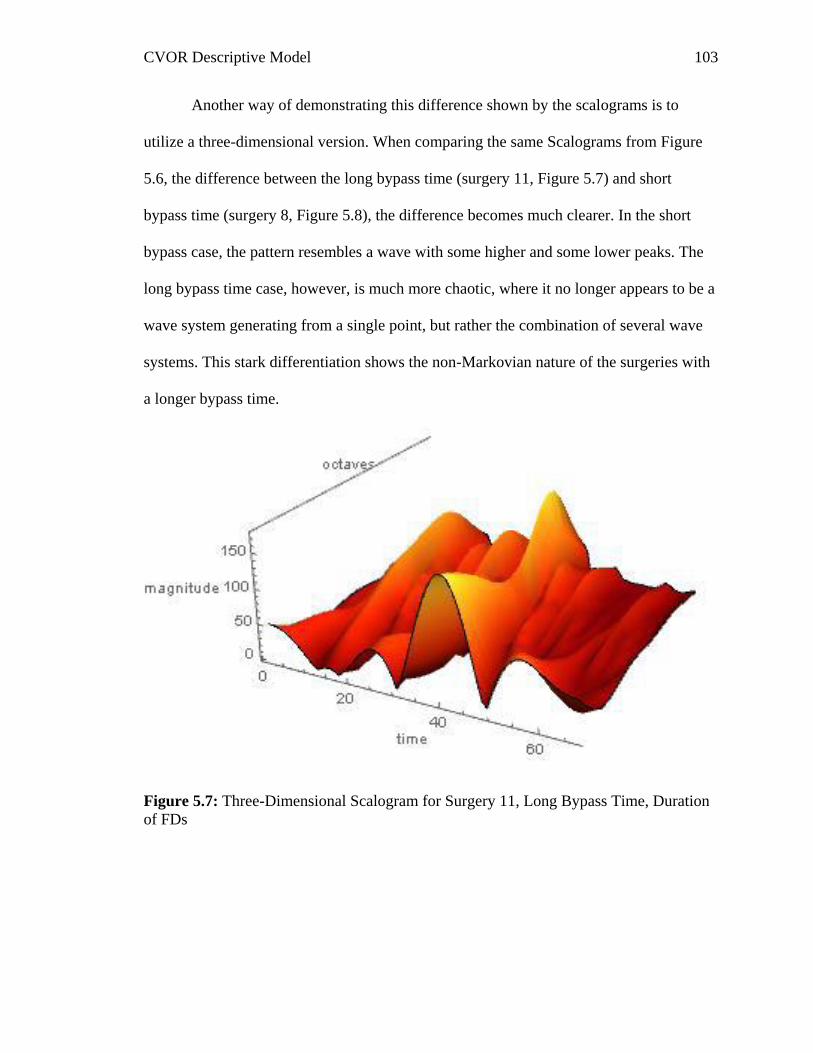
CVOR Descriptive Model 103
Another way of demonstrating this difference shown by the scalograms is to
utilize a three-dimensional version. When comparing the same Scalograms from Figure
5.6, the difference between the long bypass time (surgery 11, Figure 5.7) and short
bypass time (surgery 8, Figure 5.8), the difference becomes much clearer. In the short
bypass case, the pattern resembles a wave with some higher and some lower peaks. The
long bypass time case, however, is much more chaotic, where it no longer appears to be a
wave system generating from a single point, but rather the combination of several wave
systems. This stark differentiation shows the non-Markovian nature of the surgeries with
a longer bypass time.
Figure 5.7: Three-Dimensional Scalogram for Surgery 11, Long Bypass Time, Duration
of FDs
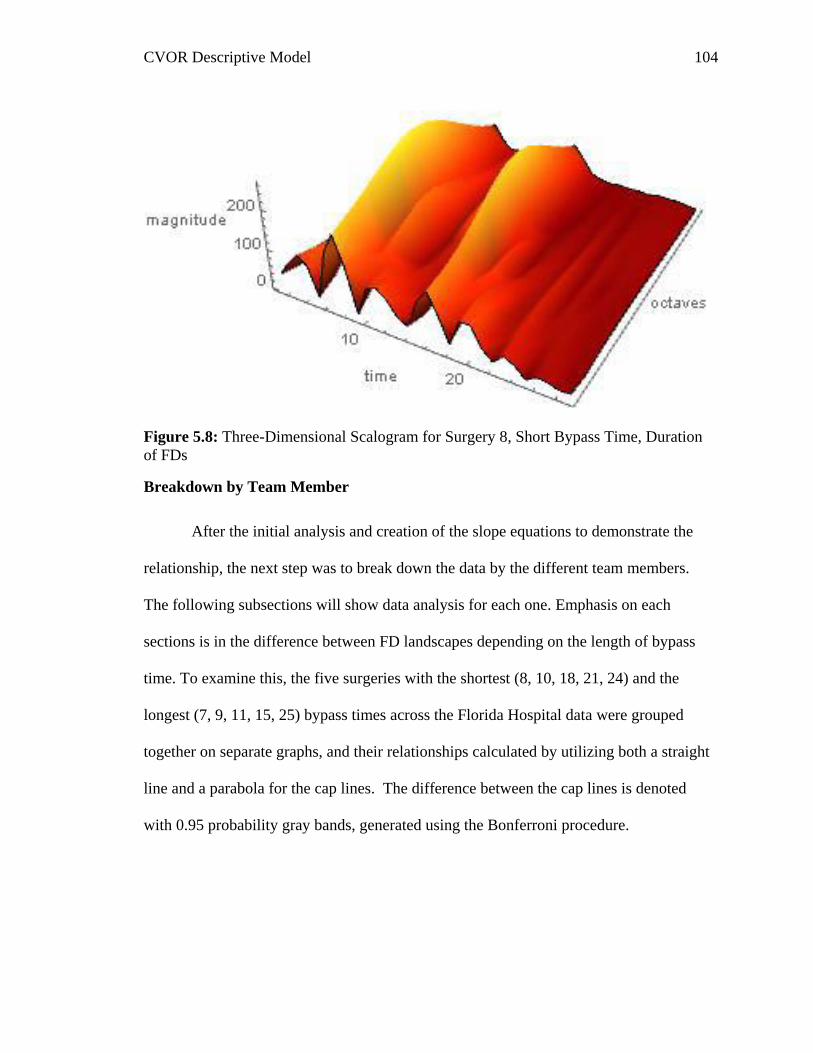
CVOR Descriptive Model 104
Figure 5.8: Three-Dimensional Scalogram for Surgery 8, Short Bypass Time, Duration
of FDs
Breakdown by Team Member
After the initial analysis and creation of the slope equations to demonstrate the
relationship, the next step was to break down the data by the different team members.
The following subsections will show data analysis for each one. Emphasis on each
sections is in the difference between FD landscapes depending on the length of bypass
time. To examine this, the five surgeries with the shortest (8, 10, 18, 21, 24) and the
longest (7, 9, 11, 15, 25) bypass times across the Florida Hospital data were grouped
together on separate graphs, and their relationships calculated by utilizing both a straight
line and a parabola for the cap lines. The difference between the cap lines is denoted
with 0.95 probability gray bands, generated using the Bonferroni procedure.
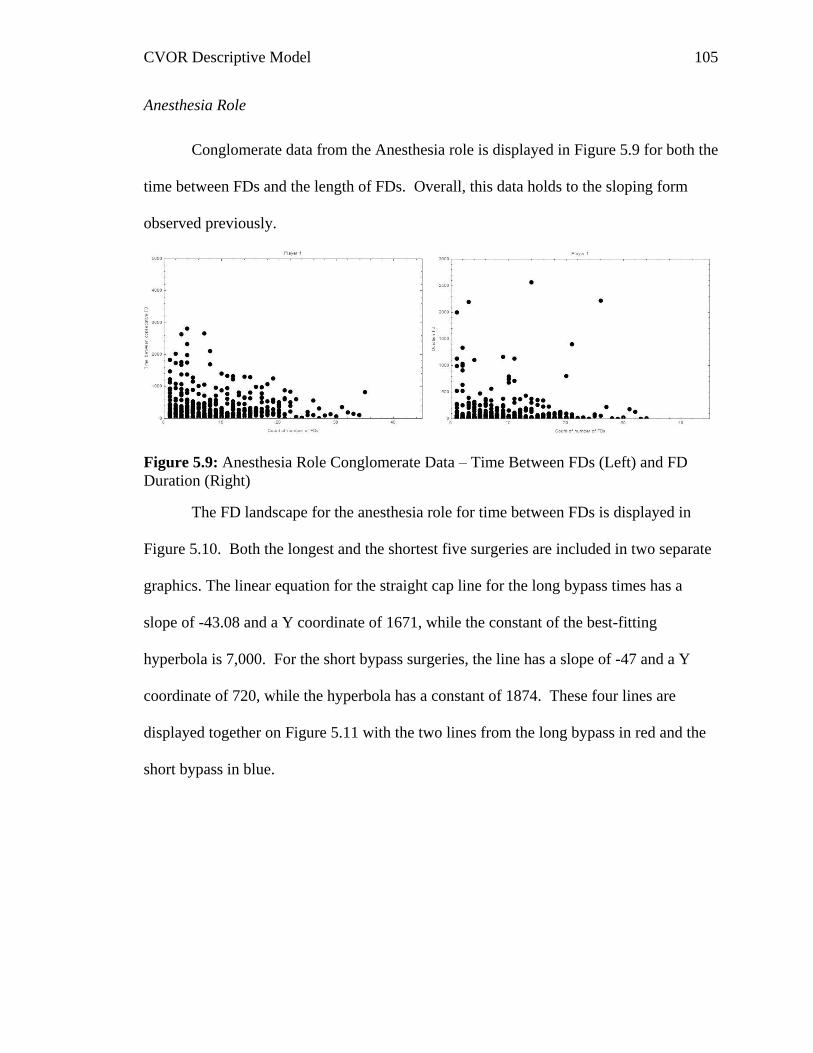
CVOR Descriptive Model 105
Anesthesia Role
Conglomerate data from the Anesthesia role is displayed in Figure 5.9 for both the
time between FDs and the length of FDs. Overall, this data holds to the sloping form
observed previously.
Figure 5.9: Anesthesia Role Conglomerate Data – Time Between FDs (Left) and FD
Duration (Right)
The FD landscape for the anesthesia role for time between FDs is displayed in
Figure 5.10. Both the longest and the shortest five surgeries are included in two separate
graphics. The linear equation for the straight cap line for the long bypass times has a
slope of -43.08 and a Y coordinate of 1671, while the constant of the best-fitting
hyperbola is 7,000. For the short bypass surgeries, the line has a slope of -47 and a Y
coordinate of 720, while the hyperbola has a constant of 1874. These four lines are
displayed together on Figure 5.11 with the two lines from the long bypass in red and the
short bypass in blue.
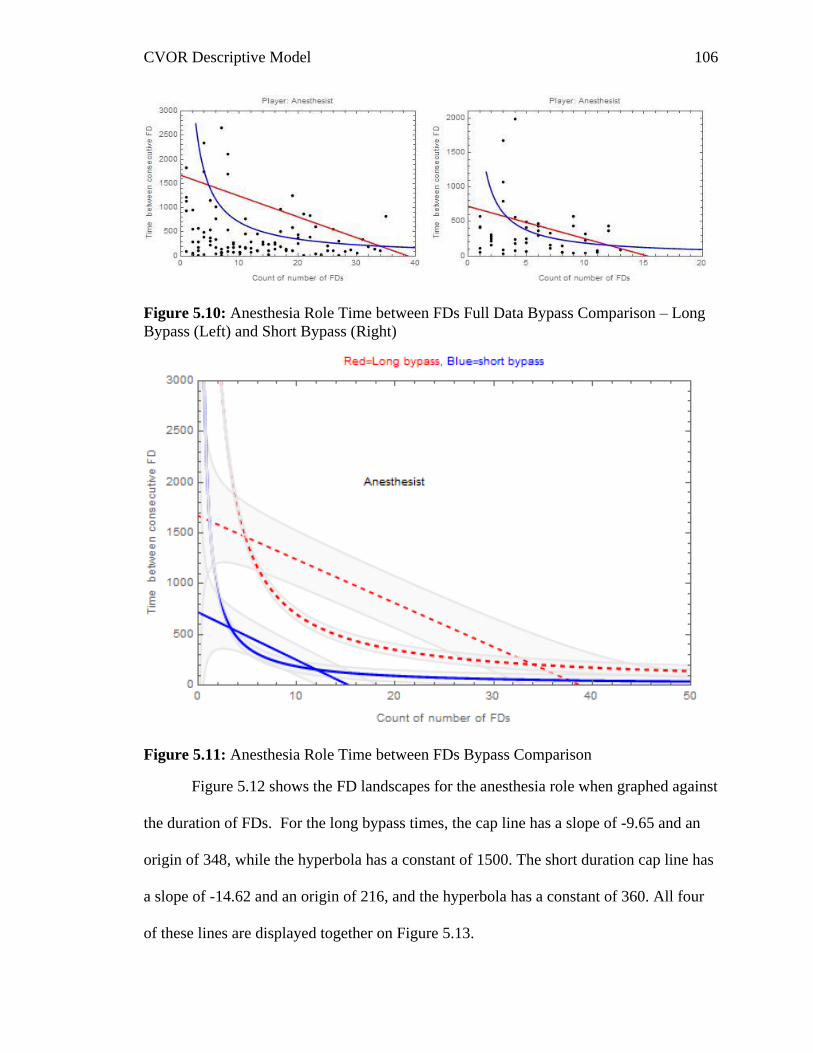
CVOR Descriptive Model 106
Figure 5.10: Anesthesia Role Time between FDs Full Data Bypass Comparison – Long
Bypass (Left) and Short Bypass (Right)
Figure 5.11: Anesthesia Role Time between FDs Bypass Comparison
Figure 5.12 shows the FD landscapes for the anesthesia role when graphed against
the duration of FDs. For the long bypass times, the cap line has a slope of -9.65 and an
origin of 348, while the hyperbola has a constant of 1500. The short duration cap line has
a slope of -14.62 and an origin of 216, and the hyperbola has a constant of 360. All four
of these lines are displayed together on Figure 5.13.
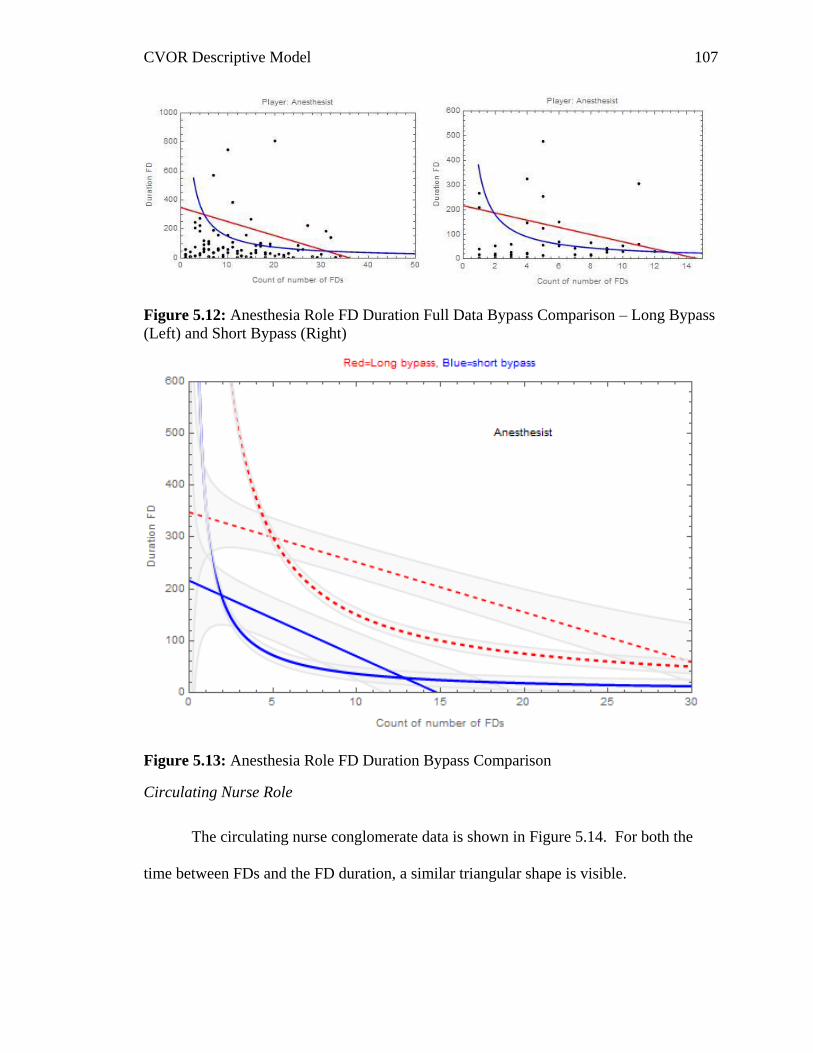
CVOR Descriptive Model 107
Figure 5.12: Anesthesia Role FD Duration Full Data Bypass Comparison – Long Bypass
(Left) and Short Bypass (Right)
Figure 5.13: Anesthesia Role FD Duration Bypass Comparison
Circulating Nurse Role
The circulating nurse conglomerate data is shown in Figure 5.14. For both the
time between FDs and the FD duration, a similar triangular shape is visible.
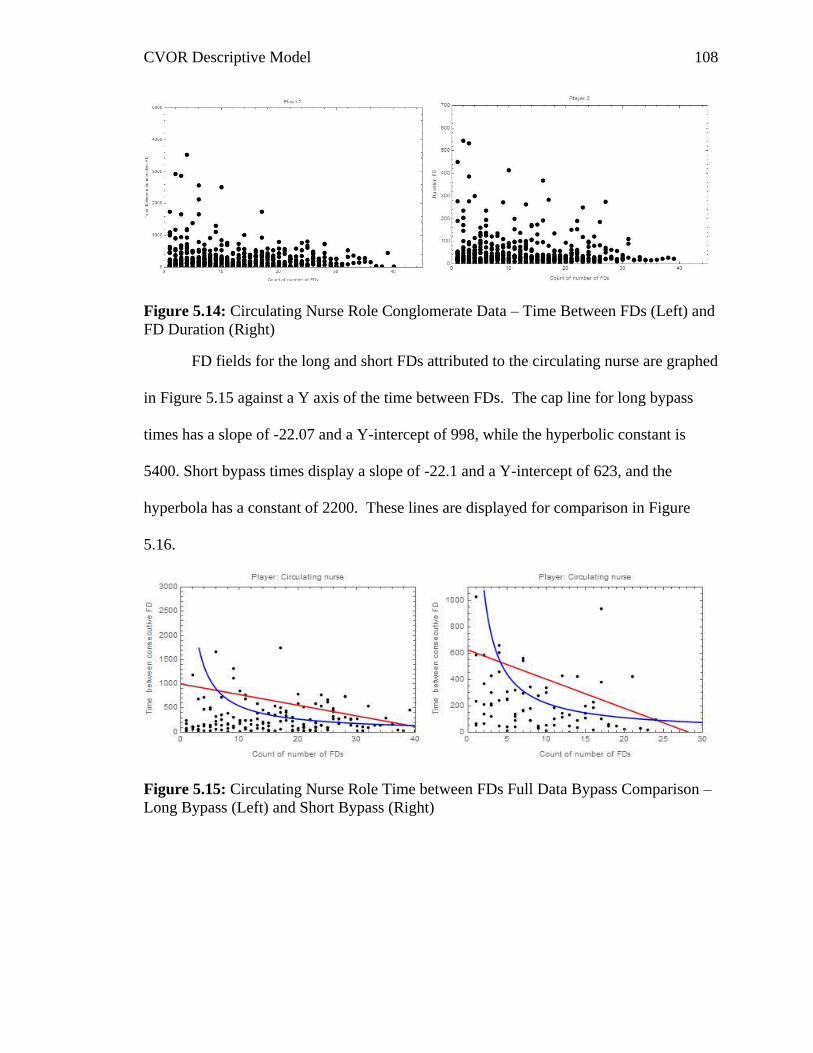
CVOR Descriptive Model 108
Figure 5.14: Circulating Nurse Role Conglomerate Data – Time Between FDs (Left) and
FD Duration (Right)
FD fields for the long and short FDs attributed to the circulating nurse are graphed
in Figure 5.15 against a Y axis of the time between FDs. The cap line for long bypass
times has a slope of -22.07 and a Y-intercept of 998, while the hyperbolic constant is
5400. Short bypass times display a slope of -22.1 and a Y-intercept of 623, and the
hyperbola has a constant of 2200. These lines are displayed for comparison in Figure
5.16.
Figure 5.15: Circulating Nurse Role Time between FDs Full Data Bypass Comparison –
Long Bypass (Left) and Short Bypass (Right)
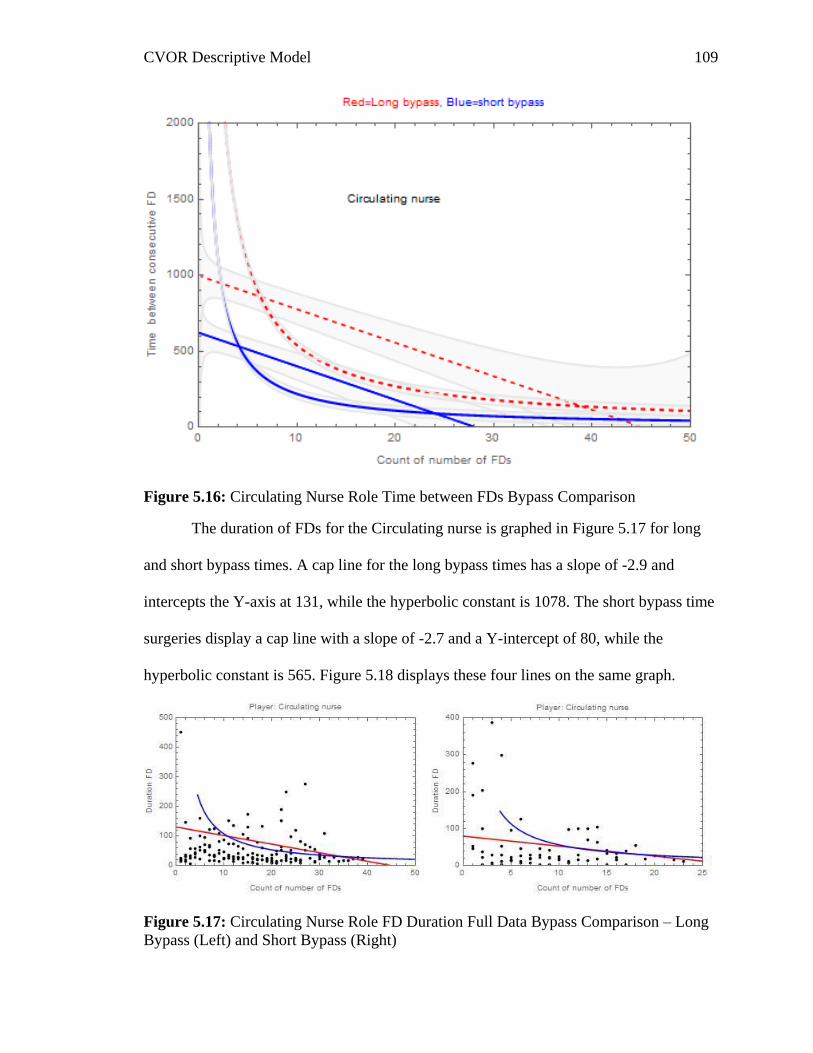
CVOR Descriptive Model 109
Figure 5.16: Circulating Nurse Role Time between FDs Bypass Comparison
The duration of FDs for the Circulating nurse is graphed in Figure 5.17 for long
and short bypass times. A cap line for the long bypass times has a slope of -2.9 and
intercepts the Y-axis at 131, while the hyperbolic constant is 1078. The short bypass time
surgeries display a cap line with a slope of -2.7 and a Y-intercept of 80, while the
hyperbolic constant is 565. Figure 5.18 displays these four lines on the same graph.
Figure 5.17: Circulating Nurse Role FD Duration Full Data Bypass Comparison – Long
Bypass (Left) and Short Bypass (Right)
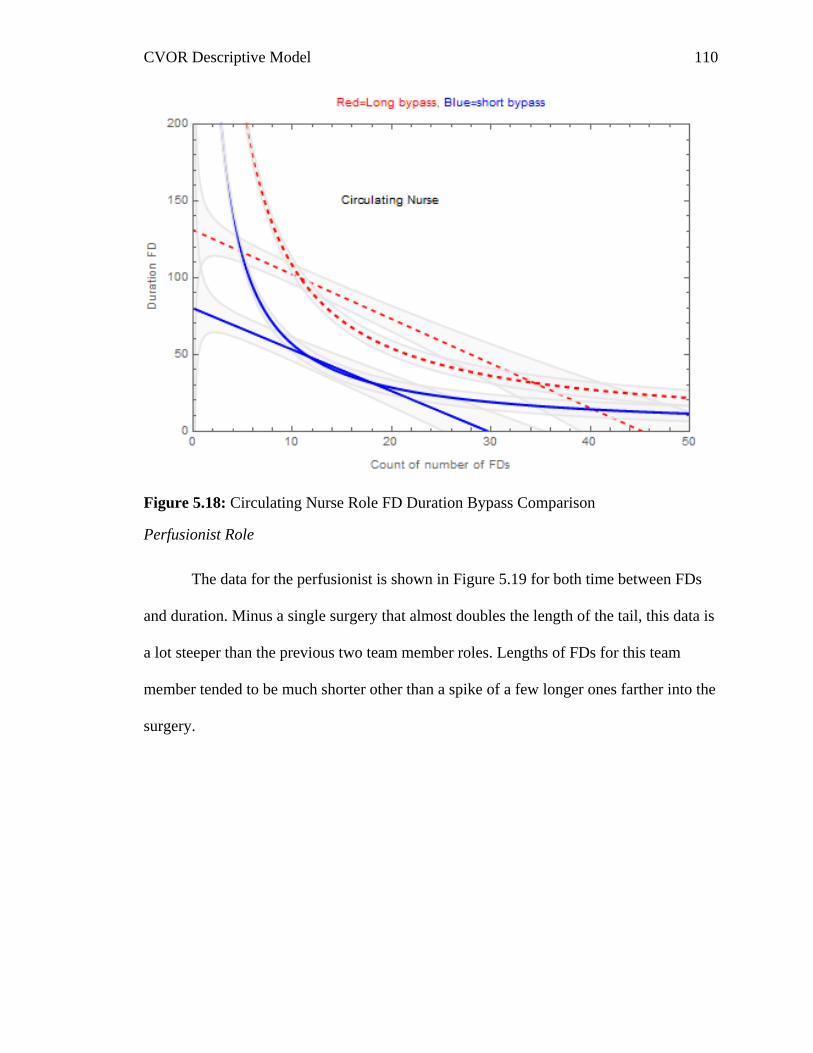
CVOR Descriptive Model 110
Figure 5.18: Circulating Nurse Role FD Duration Bypass Comparison
Perfusionist Role
The data for the perfusionist is shown in Figure 5.19 for both time between FDs
and duration. Minus a single surgery that almost doubles the length of the tail, this data is
a lot steeper than the previous two team member roles. Lengths of FDs for this team
member tended to be much shorter other than a spike of a few longer ones farther into the
surgery.
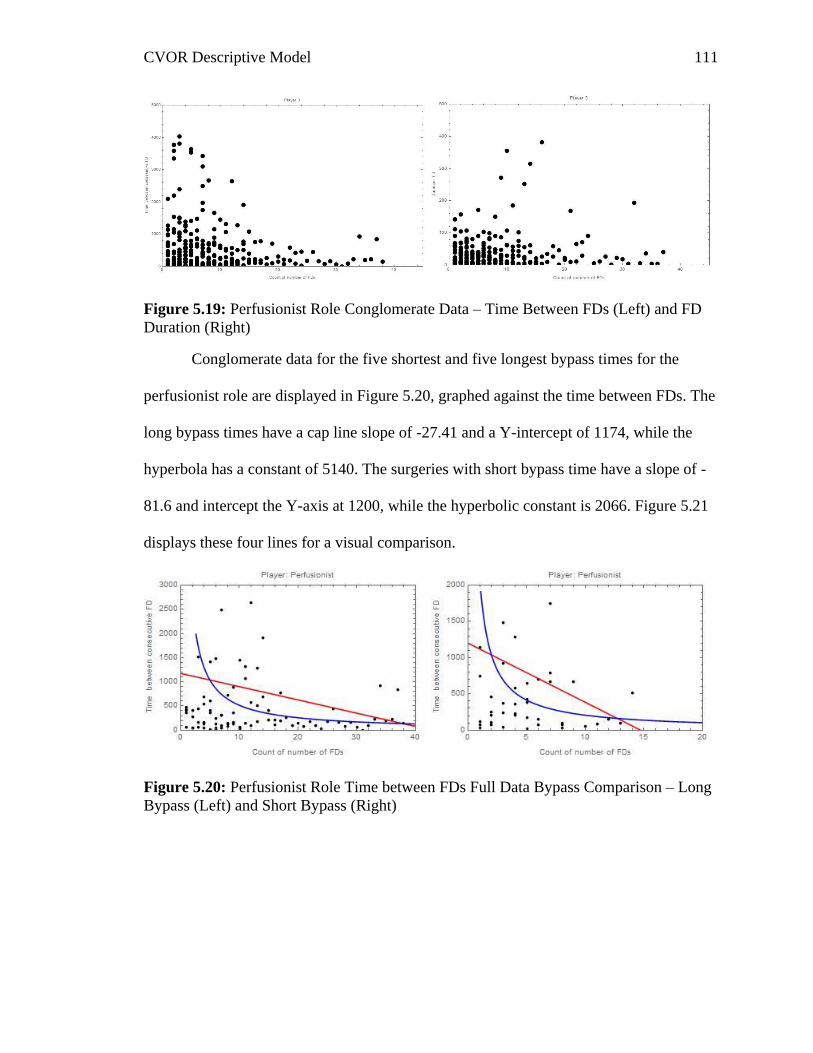
CVOR Descriptive Model 111
Figure 5.19: Perfusionist Role Conglomerate Data – Time Between FDs (Left) and FD
Duration (Right)
Conglomerate data for the five shortest and five longest bypass times for the
perfusionist role are displayed in Figure 5.20, graphed against the time between FDs. The
long bypass times have a cap line slope of -27.41 and a Y-intercept of 1174, while the
hyperbola has a constant of 5140. The surgeries with short bypass time have a slope of -
81.6 and intercept the Y-axis at 1200, while the hyperbolic constant is 2066. Figure 5.21
displays these four lines for a visual comparison.
Figure 5.20: Perfusionist Role Time between FDs Full Data Bypass Comparison – Long
Bypass (Left) and Short Bypass (Right)
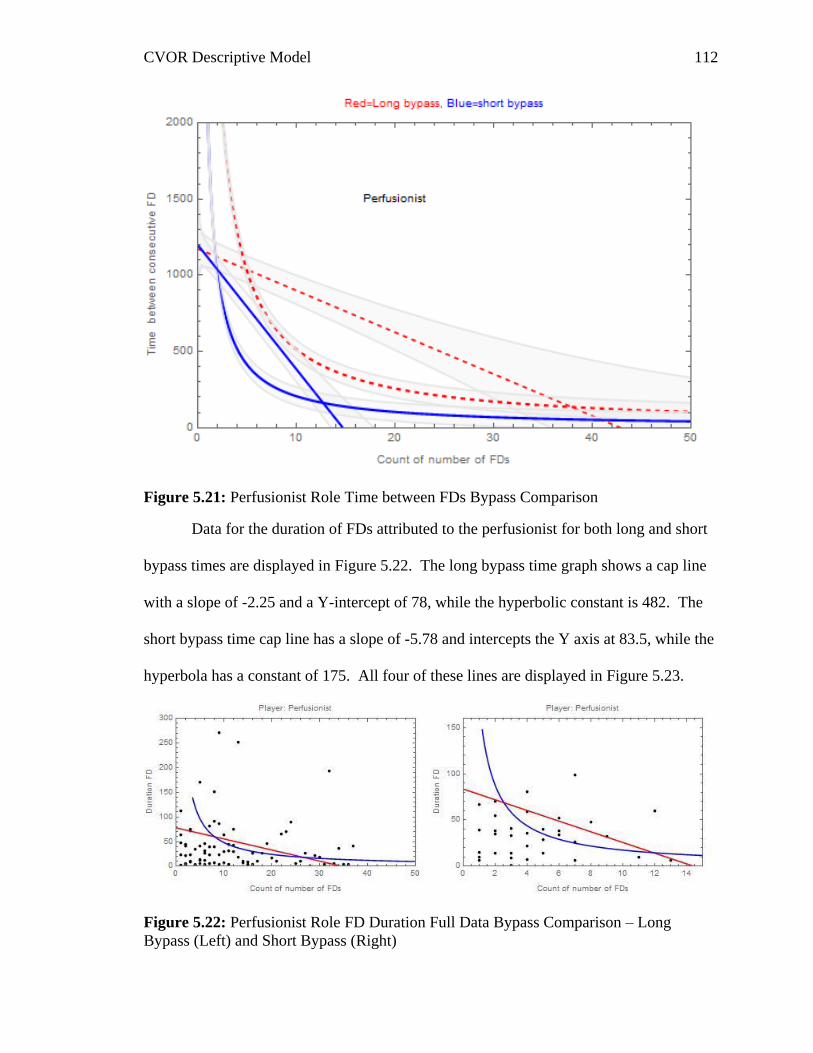
CVOR Descriptive Model 112
Figure 5.21: Perfusionist Role Time between FDs Bypass Comparison
Data for the duration of FDs attributed to the perfusionist for both long and short
bypass times are displayed in Figure 5.22. The long bypass time graph shows a cap line
with a slope of -2.25 and a Y-intercept of 78, while the hyperbolic constant is 482. The
short bypass time cap line has a slope of -5.78 and intercepts the Y axis at 83.5, while the
hyperbola has a constant of 175. All four of these lines are displayed in Figure 5.23.
Figure 5.22: Perfusionist Role FD Duration Full Data Bypass Comparison – Long
Bypass (Left) and Short Bypass (Right)
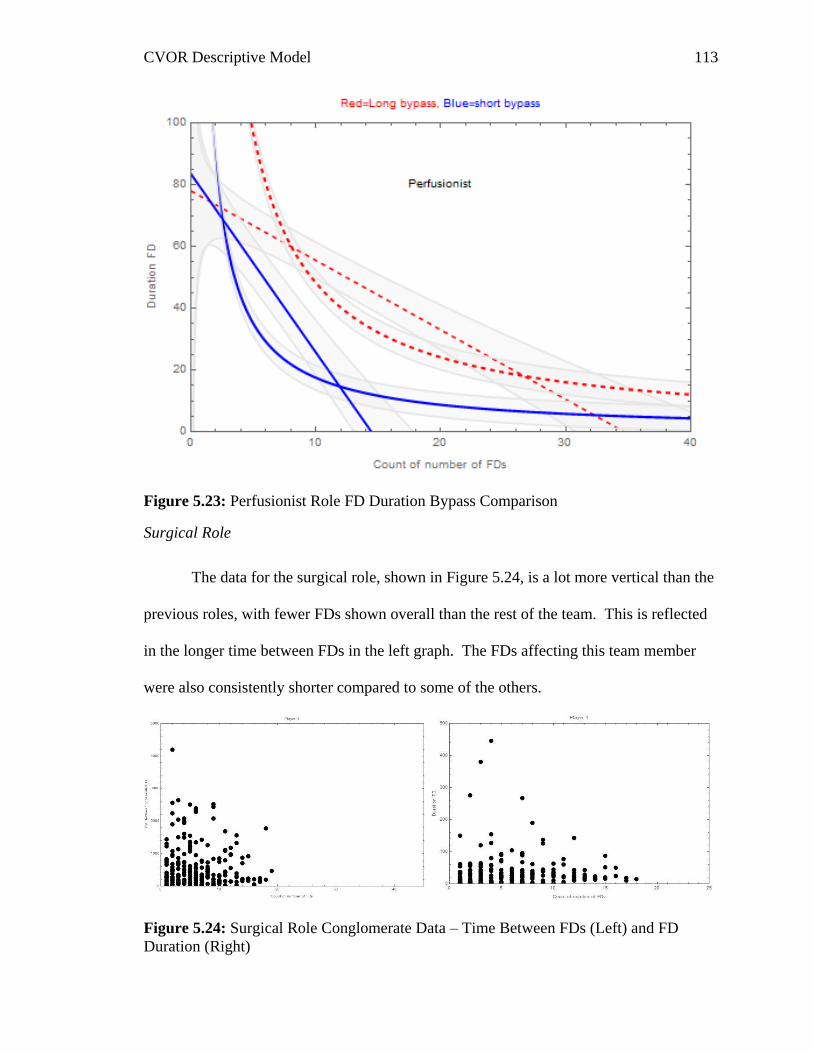
CVOR Descriptive Model 113
Figure 5.23: Perfusionist Role FD Duration Bypass Comparison
Surgical Role
The data for the surgical role, shown in Figure 5.24, is a lot more vertical than the
previous roles, with fewer FDs shown overall than the rest of the team. This is reflected
in the longer time between FDs in the left graph. The FDs affecting this team member
were also consistently shorter compared to some of the others.
Figure 5.24: Surgical Role Conglomerate Data – Time Between FDs (Left) and FD
Duration (Right)
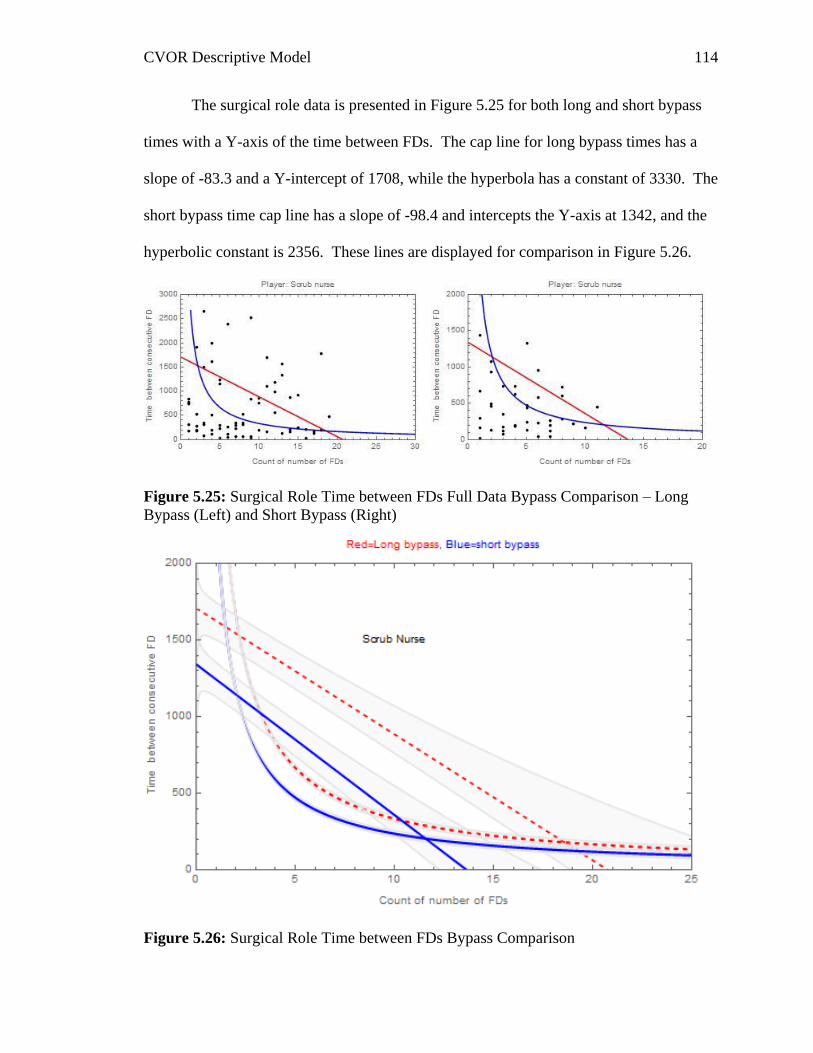
CVOR Descriptive Model 114
The surgical role data is presented in Figure 5.25 for both long and short bypass
times with a Y-axis of the time between FDs. The cap line for long bypass times has a
slope of -83.3 and a Y-intercept of 1708, while the hyperbola has a constant of 3330. The
short bypass time cap line has a slope of -98.4 and intercepts the Y-axis at 1342, and the
hyperbolic constant is 2356. These lines are displayed for comparison in Figure 5.26.
Figure 5.25: Surgical Role Time between FDs Full Data Bypass Comparison – Long
Bypass (Left) and Short Bypass (Right)
Figure 5.26: Surgical Role Time between FDs Bypass Comparison

CVOR Descriptive Model 115
The surgical role data for duration of FDs is displayed in Figure 5.27 for both
short and long bypass times. The cap line for long bypass times has a slope of -3.3 and
intercepts the Y-axis at 78 while the hyperbola constant is 230. The five shortest bypass
times have a cap line slope of -9.8 and a Y-intercept of 112.5, while the hyperbolic
constant is 235. Figure 5.28 displays these four graphs.
Figure 5.27: Surgical Role FD Duration Full Data Bypass Comparison – Long Bypass
(Left) and Short Bypass (Right)
Figure 5.28: Surgical Role FD Duration Bypass Comparison
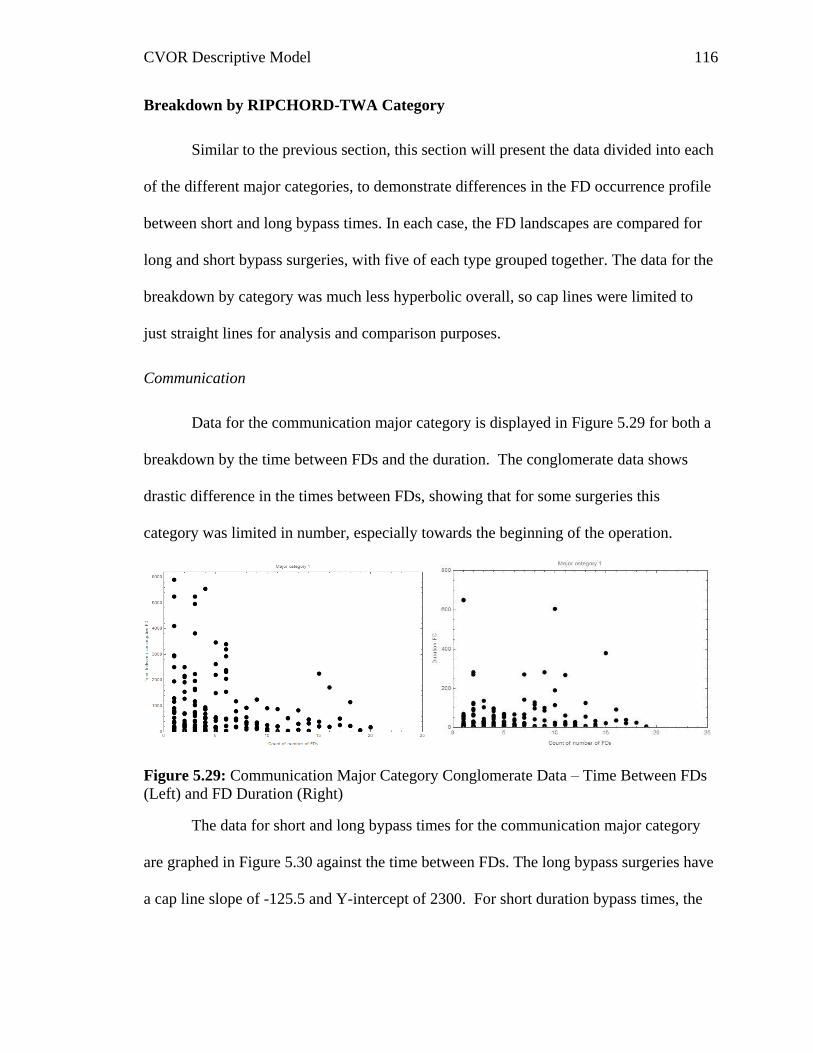
CVOR Descriptive Model 116
Breakdown by RIPCHORD-TWA Category
Similar to the previous section, this section will present the data divided into each
of the different major categories, to demonstrate differences in the FD occurrence profile
between short and long bypass times. In each case, the FD landscapes are compared for
long and short bypass surgeries, with five of each type grouped together. The data for the
breakdown by category was much less hyperbolic overall, so cap lines were limited to
just straight lines for analysis and comparison purposes.
Communication
Data for the communication major category is displayed in Figure 5.29 for both a
breakdown by the time between FDs and the duration. The conglomerate data shows
drastic difference in the times between FDs, showing that for some surgeries this
category was limited in number, especially towards the beginning of the operation.
Figure 5.29: Communication Major Category Conglomerate Data – Time Between FDs
(Left) and FD Duration (Right)
The data for short and long bypass times for the communication major category
are graphed in Figure 5.30 against the time between FDs. The long bypass surgeries have
a cap line slope of -125.5 and Y-intercept of 2300. For short duration bypass times, the
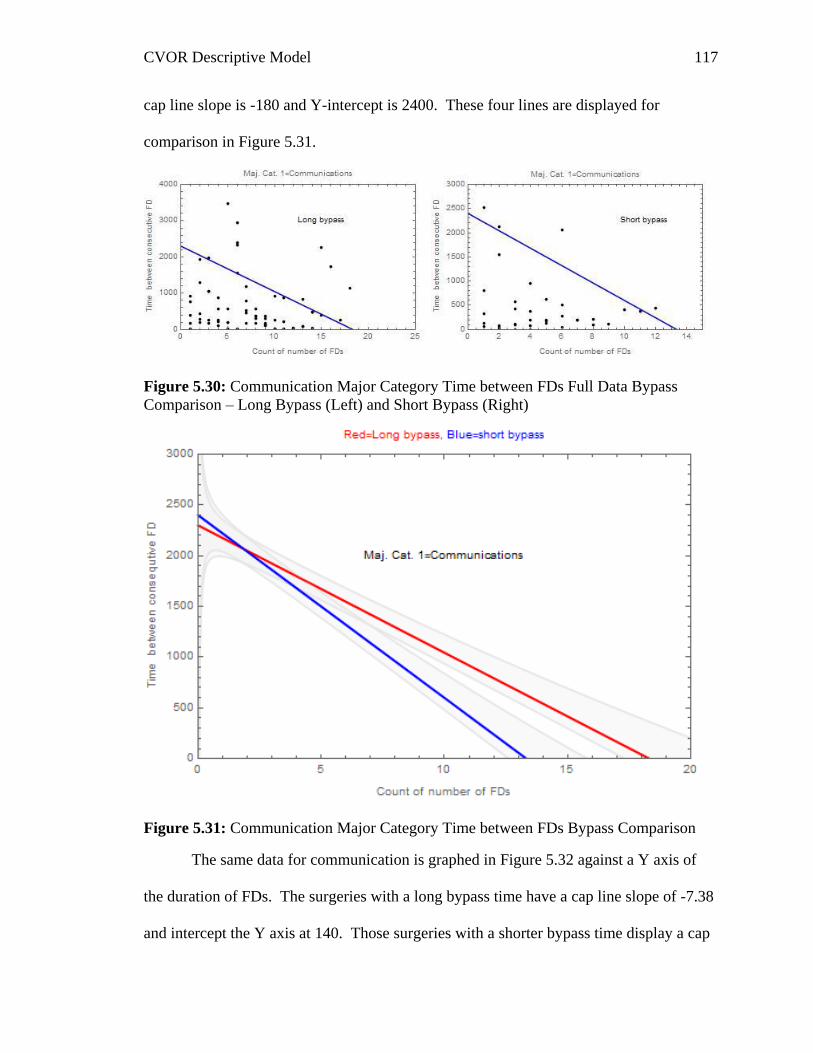
CVOR Descriptive Model 117
cap line slope is -180 and Y-intercept is 2400. These four lines are displayed for
comparison in Figure 5.31.
Figure 5.30: Communication Major Category Time between FDs Full Data Bypass
Comparison – Long Bypass (Left) and Short Bypass (Right)
Figure 5.31: Communication Major Category Time between FDs Bypass Comparison
The same data for communication is graphed in Figure 5.32 against a Y axis of
the duration of FDs. The surgeries with a long bypass time have a cap line slope of -7.38
and intercept the Y axis at 140. Those surgeries with a shorter bypass time display a cap
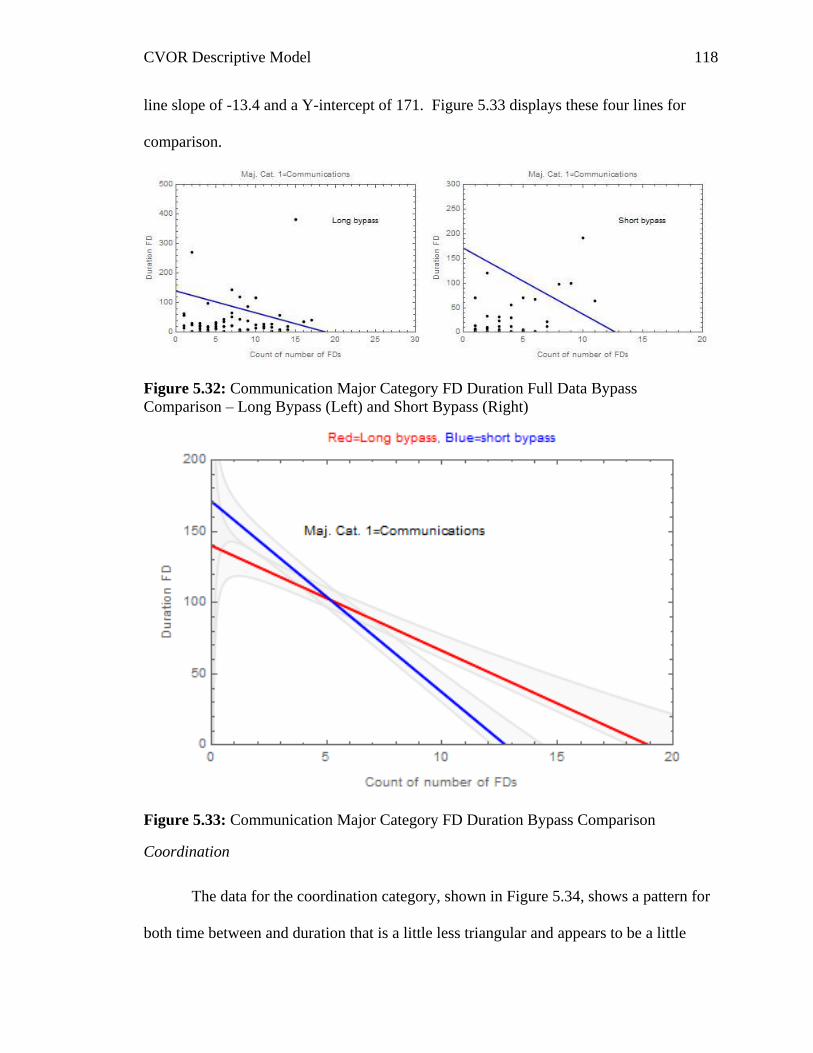
CVOR Descriptive Model 118
line slope of -13.4 and a Y-intercept of 171. Figure 5.33 displays these four lines for
comparison.
Figure 5.32: Communication Major Category FD Duration Full Data Bypass
Comparison – Long Bypass (Left) and Short Bypass (Right)
Figure 5.33: Communication Major Category FD Duration Bypass Comparison
Coordination
The data for the coordination category, shown in Figure 5.34, shows a pattern for
both time between and duration that is a little less triangular and appears to be a little
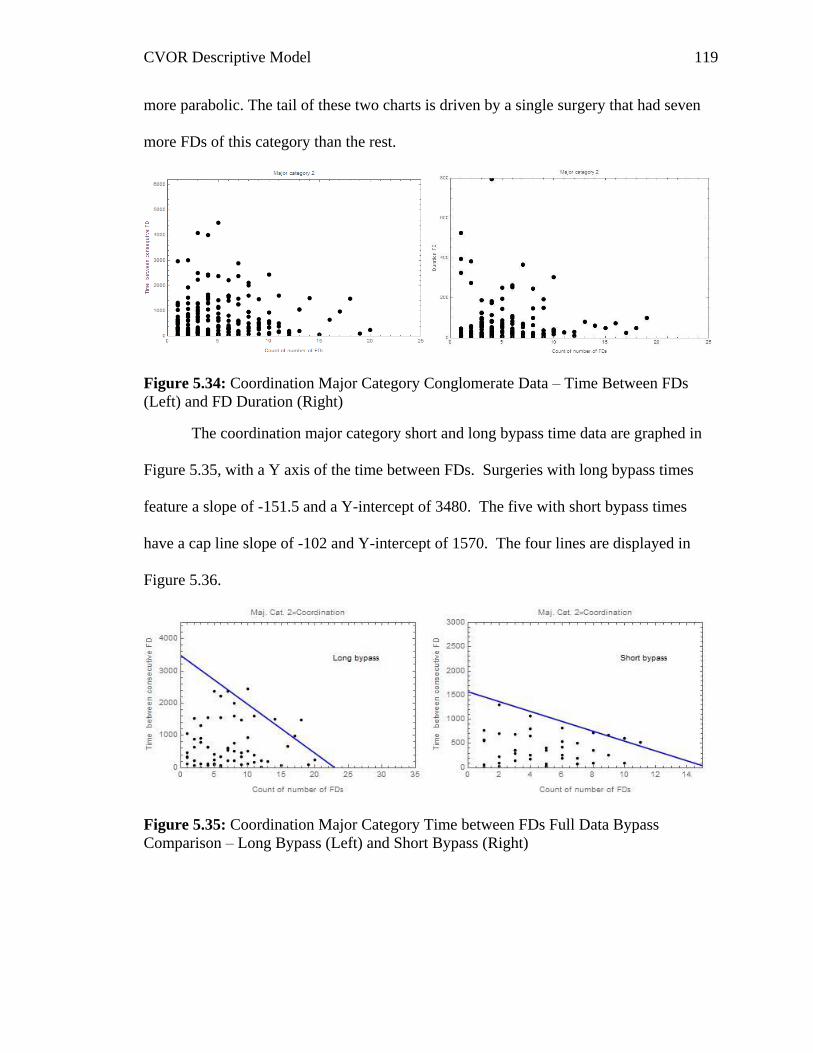
CVOR Descriptive Model 119
more parabolic. The tail of these two charts is driven by a single surgery that had seven
more FDs of this category than the rest.
Figure 5.34: Coordination Major Category Conglomerate Data – Time Between FDs
(Left) and FD Duration (Right)
The coordination major category short and long bypass time data are graphed in
Figure 5.35, with a Y axis of the time between FDs. Surgeries with long bypass times
feature a slope of -151.5 and a Y-intercept of 3480. The five with short bypass times
have a cap line slope of -102 and Y-intercept of 1570. The four lines are displayed in
Figure 5.36.
Figure 5.35: Coordination Major Category Time between FDs Full Data Bypass
Comparison – Long Bypass (Left) and Short Bypass (Right)

CVOR Descriptive Model 120
Figure 5.36: Coordination Major Category Time between FDs Bypass Comparison
Coordination FDs graphed against a Y axis of FD duration are displayed in Figure
5.37 for both long and short bypass times. The long bypass time cap line has a slope of -
16.3 and a Y-intercept of 323. The short bypass times have a cap line slope of -16.5 that
intercepts the Y axis at 204. These four lines are displayed in Figure 5.38.
Figure 5.37: Coordination Major Category FD Duration Full Data Bypass Comparison –
Long Bypass (Left) and Short Bypass (Right)
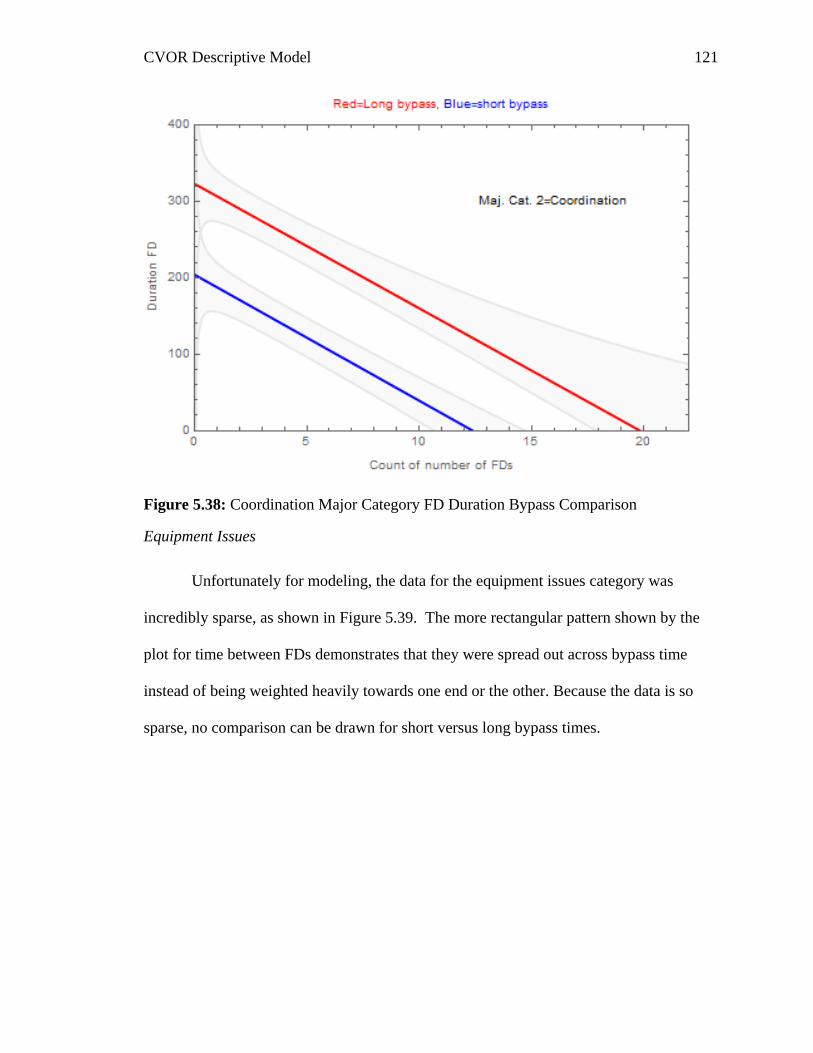
CVOR Descriptive Model 121
Figure 5.38: Coordination Major Category FD Duration Bypass Comparison
Equipment Issues
Unfortunately for modeling, the data for the equipment issues category was
incredibly sparse, as shown in Figure 5.39. The more rectangular pattern shown by the
plot for time between FDs demonstrates that they were spread out across bypass time
instead of being weighted heavily towards one end or the other. Because the data is so
sparse, no comparison can be drawn for short versus long bypass times.
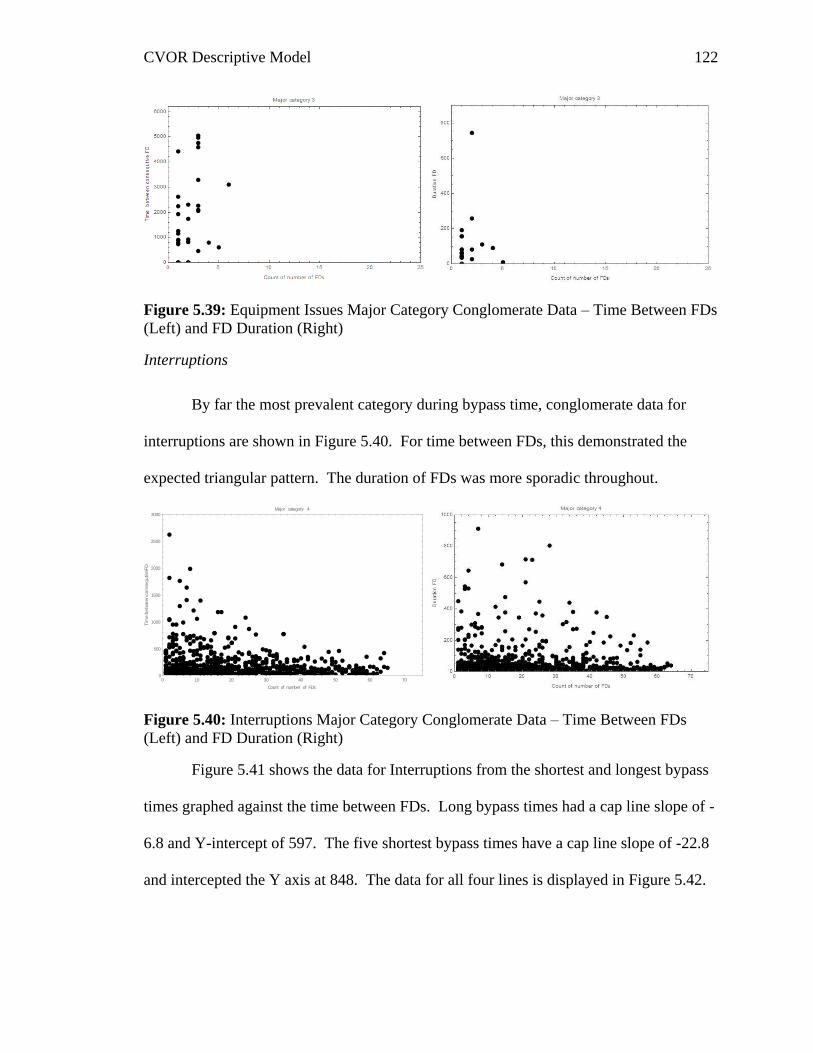
CVOR Descriptive Model 122
Figure 5.39: Equipment Issues Major Category Conglomerate Data – Time Between FDs
(Left) and FD Duration (Right)
Interruptions
By far the most prevalent category during bypass time, conglomerate data for
interruptions are shown in Figure 5.40. For time between FDs, this demonstrated the
expected triangular pattern. The duration of FDs was more sporadic throughout.
Figure 5.40: Interruptions Major Category Conglomerate Data – Time Between FDs
(Left) and FD Duration (Right)
Figure 5.41 shows the data for Interruptions from the shortest and longest bypass
times graphed against the time between FDs. Long bypass times had a cap line slope of -
6.8 and Y-intercept of 597. The five shortest bypass times have a cap line slope of -22.8
and intercepted the Y axis at 848. The data for all four lines is displayed in Figure 5.42.
0 10 20 30 40 50 60 700
500
1000
1500
2000
2500
3000
Count of number of FDs
Tim
eb
etw
ee
nco
nse
qu
tiveF
D
Major category 4
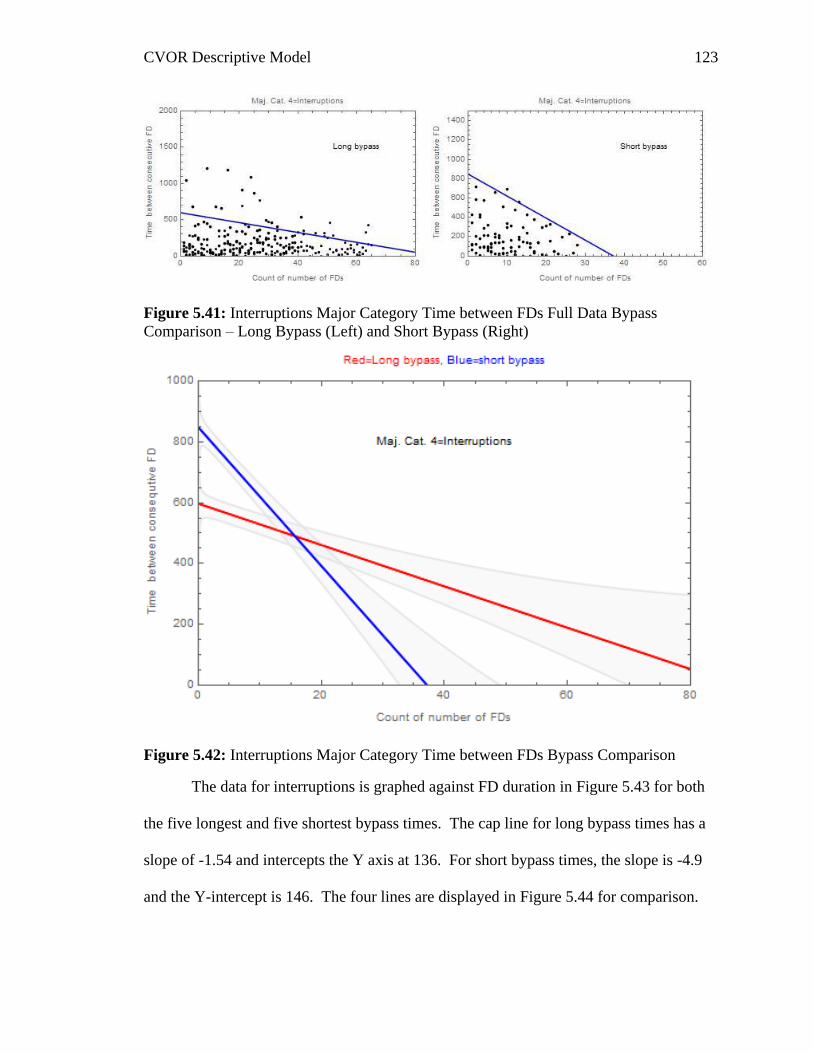
CVOR Descriptive Model 123
Figure 5.41: Interruptions Major Category Time between FDs Full Data Bypass
Comparison – Long Bypass (Left) and Short Bypass (Right)
Figure 5.42: Interruptions Major Category Time between FDs Bypass Comparison
The data for interruptions is graphed against FD duration in Figure 5.43 for both
the five longest and five shortest bypass times. The cap line for long bypass times has a
slope of -1.54 and intercepts the Y axis at 136. For short bypass times, the slope is -4.9
and the Y-intercept is 146. The four lines are displayed in Figure 5.44 for comparison.

CVOR Descriptive Model 124
Figure 5.43: Interruptions Major Category FD Duration Full Data Bypass Comparison –
Long Bypass (Left) and Short Bypass (Right)
Figure 5.44: Interruptions Major Category FD Duration Bypass Comparison
Layout
Overall, FDs from the layout category – shown in Figure 5.45 – were fairly sparse
as well as short. There is sufficient data to compare short and long bypass times,
however these statistics are weaker than some of the other categories.
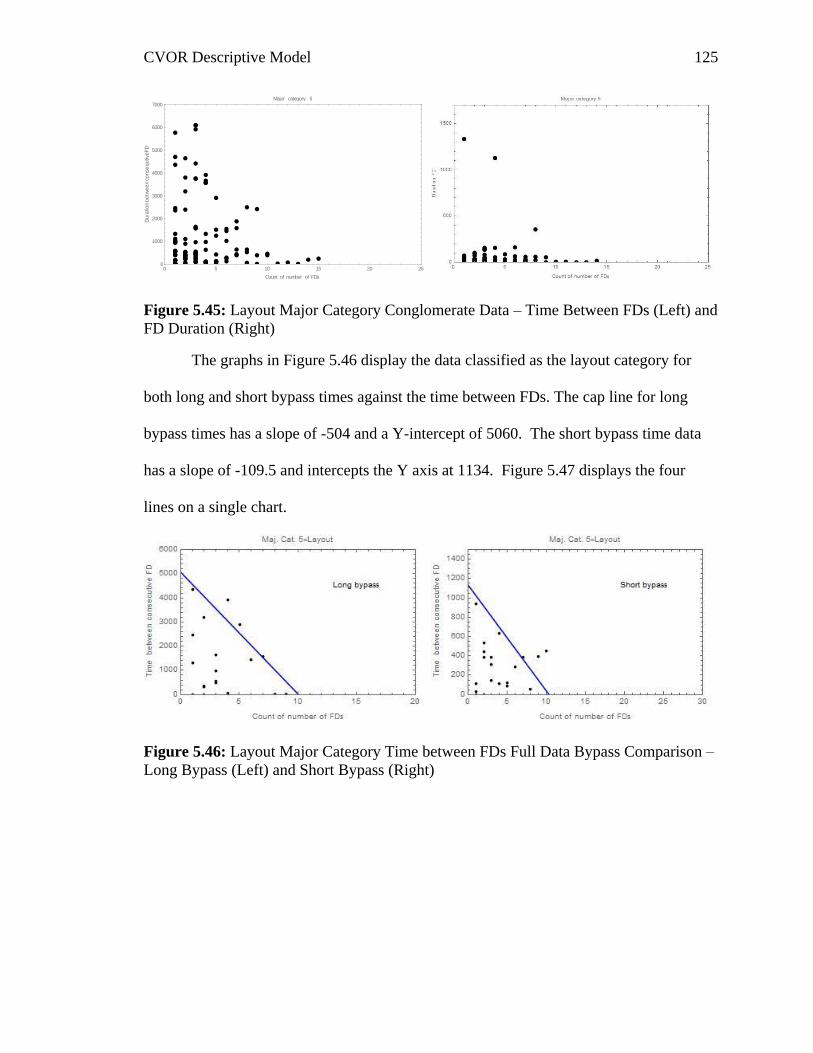
CVOR Descriptive Model 125
Figure 5.45: Layout Major Category Conglomerate Data – Time Between FDs (Left) and
FD Duration (Right)
The graphs in Figure 5.46 display the data classified as the layout category for
both long and short bypass times against the time between FDs. The cap line for long
bypass times has a slope of -504 and a Y-intercept of 5060. The short bypass time data
has a slope of -109.5 and intercepts the Y axis at 1134. Figure 5.47 displays the four
lines on a single chart.
Figure 5.46: Layout Major Category Time between FDs Full Data Bypass Comparison –
Long Bypass (Left) and Short Bypass (Right)
0 5 10 15 20 250
1000
2000
3000
4000
5000
6000
7000
Count of number of FDs
Du
ratio
nb
etw
ee
nco
nse
qutiveF
D
Major category 5
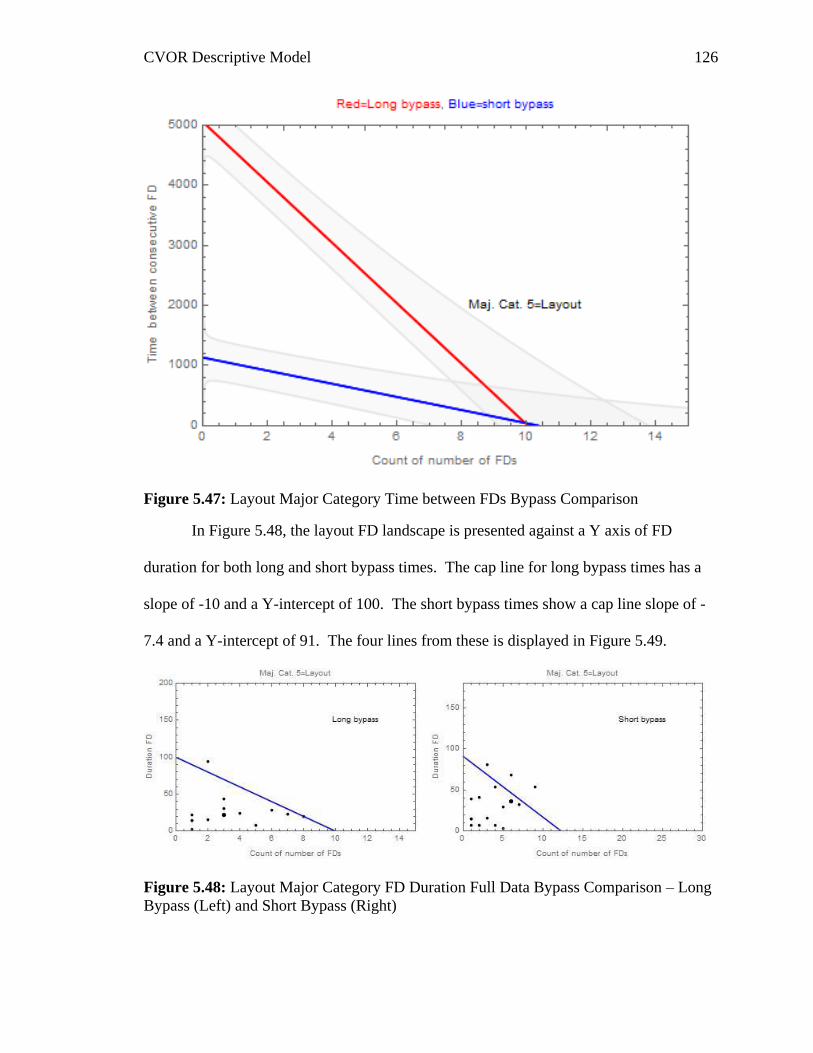
CVOR Descriptive Model 126
Figure 5.47: Layout Major Category Time between FDs Bypass Comparison
In Figure 5.48, the layout FD landscape is presented against a Y axis of FD
duration for both long and short bypass times. The cap line for long bypass times has a
slope of -10 and a Y-intercept of 100. The short bypass times show a cap line slope of -
7.4 and a Y-intercept of 91. The four lines from these is displayed in Figure 5.49.
Figure 5.48: Layout Major Category FD Duration Full Data Bypass Comparison – Long
Bypass (Left) and Short Bypass (Right)

CVOR Descriptive Model 127
Figure 5.49: Layout Major Category FD Duration Bypass Comparison
Usability
Similar to the equipment issues major category, the data for usability is fairly
sparse, and so not possible to accurately compare long and short bypass time operations.
This data is shown in Figure 5.50 for both time between FDs and the duration of the FDs.
Figure 5.50: Usability Major Category Conglomerate Data – Time Between FDs (Left)
and FD Duration (Right)
0 5 10 15 20 250
2000
4000
6000
8000
Count of number of FDs
Tim
eb
etw
een
co
nse
qu
tiveF
D
Major category 6
CVOR Descriptive Model 128
Results Summary
In total, the data overall as well as ten separate portions of the data (four team
members and six major categories) were analyzed to determine if FDs have a relationship
with bypass time. The results suggest that they do, however the relationship was different
than originally expected. The next section will explore this relationship and discuss the
meanings of these findings.
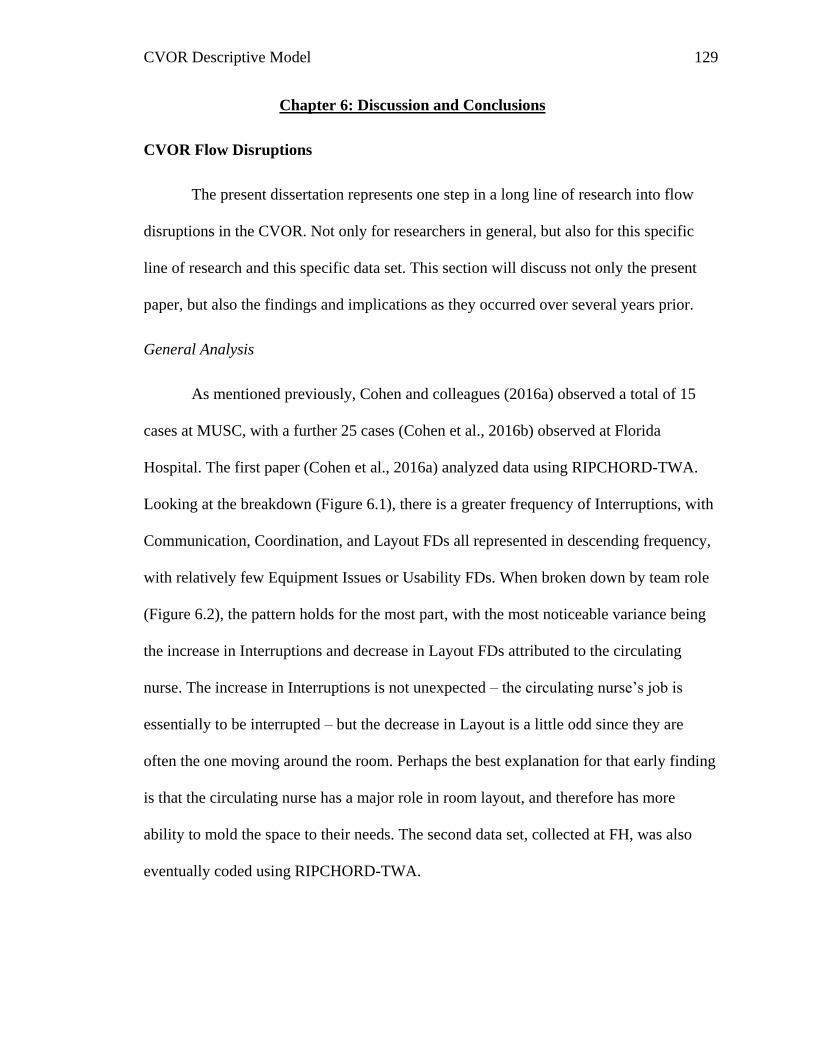
CVOR Descriptive Model 129
Chapter 6: Discussion and Conclusions
CVOR Flow Disruptions
The present dissertation represents one step in a long line of research into flow
disruptions in the CVOR. Not only for researchers in general, but also for this specific
line of research and this specific data set. This section will discuss not only the present
paper, but also the findings and implications as they occurred over several years prior.
General Analysis
As mentioned previously, Cohen and colleagues (2016a) observed a total of 15
cases at MUSC, with a further 25 cases (Cohen et al., 2016b) observed at Florida
Hospital. The first paper (Cohen et al., 2016a) analyzed data using RIPCHORD-TWA.
Looking at the breakdown (Figure 6.1), there is a greater frequency of Interruptions, with
Communication, Coordination, and Layout FDs all represented in descending frequency,
with relatively few Equipment Issues or Usability FDs. When broken down by team role
(Figure 6.2), the pattern holds for the most part, with the most noticeable variance being
the increase in Interruptions and decrease in Layout FDs attributed to the circulating
nurse. The increase in Interruptions is not unexpected – the circulating nurse’s job is
essentially to be interrupted – but the decrease in Layout is a little odd since they are
often the one moving around the room. Perhaps the best explanation for that early finding
is that the circulating nurse has a major role in room layout, and therefore has more
ability to mold the space to their needs. The second data set, collected at FH, was also
eventually coded using RIPCHORD-TWA.
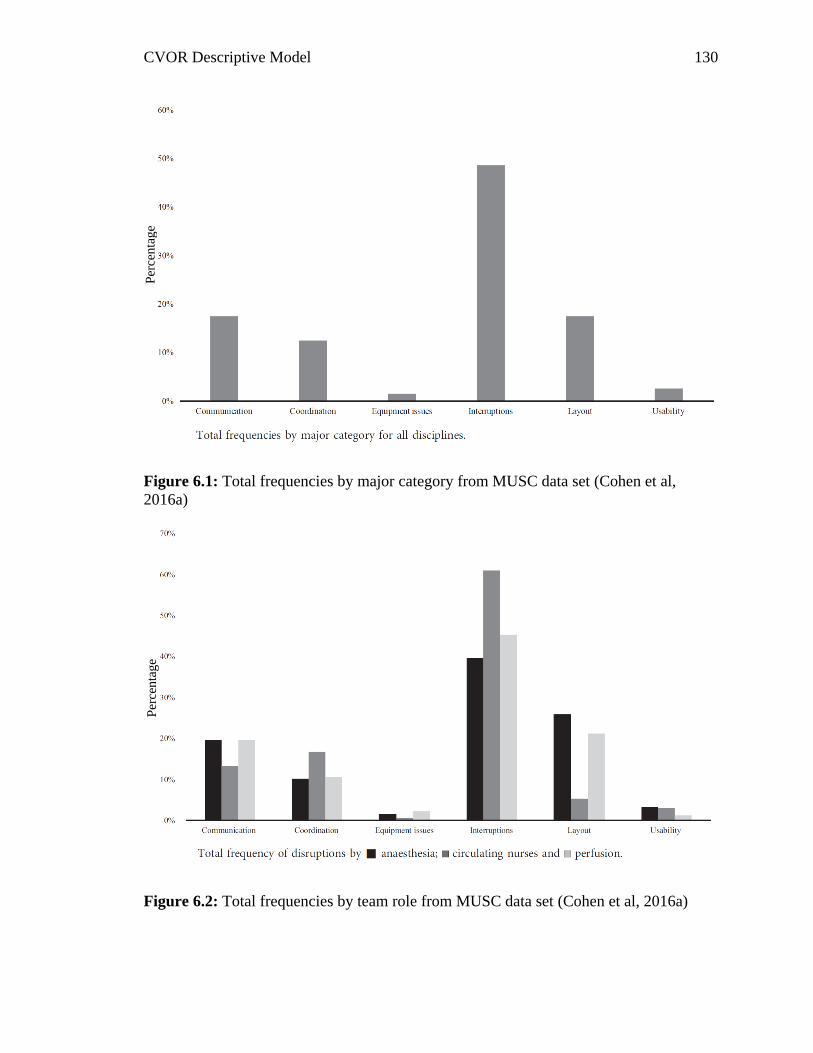
CVOR Descriptive Model 130
Figure 6.1: Total frequencies by major category from MUSC data set (Cohen et al,
2016a)
Figure 6.2: Total frequencies by team role from MUSC data set (Cohen et al, 2016a)
Per
cen
tag
e P
erce
nta
ge
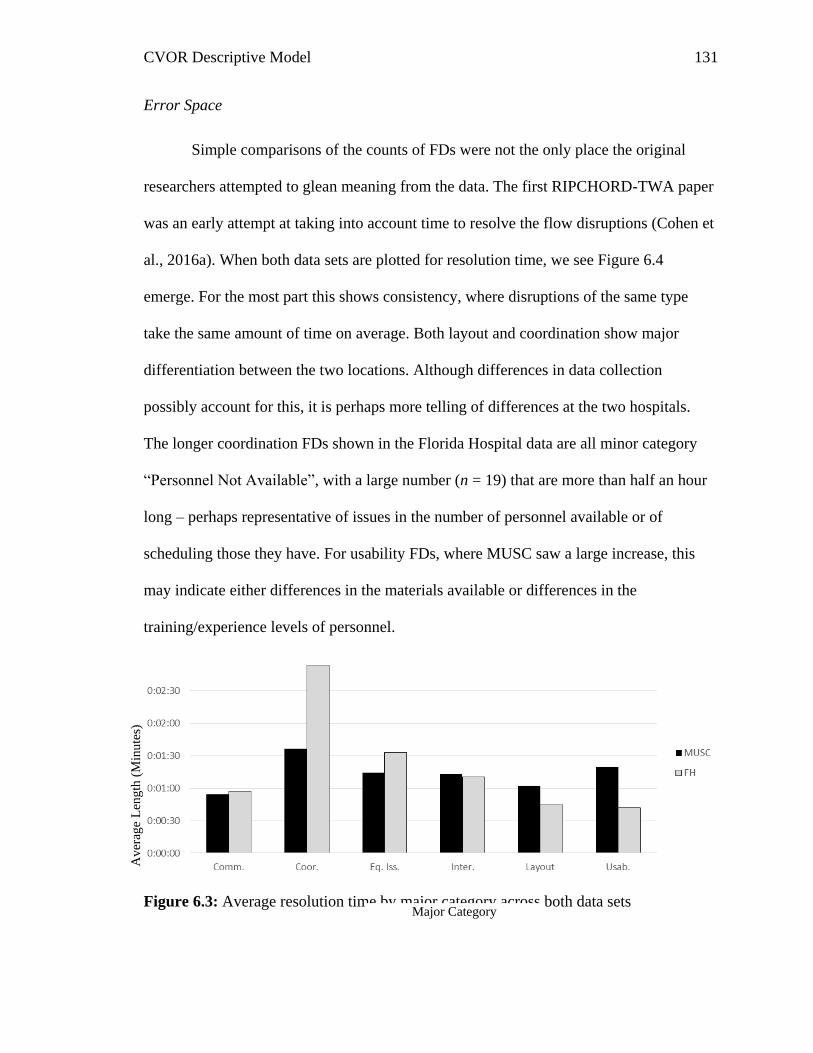
CVOR Descriptive Model 131
Error Space
Simple comparisons of the counts of FDs were not the only place the original
researchers attempted to glean meaning from the data. The first RIPCHORD-TWA paper
was an early attempt at taking into account time to resolve the flow disruptions (Cohen et
al., 2016a). When both data sets are plotted for resolution time, we see Figure 6.4
emerge. For the most part this shows consistency, where disruptions of the same type
take the same amount of time on average. Both layout and coordination show major
differentiation between the two locations. Although differences in data collection
possibly account for this, it is perhaps more telling of differences at the two hospitals.
The longer coordination FDs shown in the Florida Hospital data are all minor category
“Personnel Not Available”, with a large number (n = 19) that are more than half an hour
long – perhaps representative of issues in the number of personnel available or of
scheduling those they have. For usability FDs, where MUSC saw a large increase, this
may indicate either differences in the materials available or differences in the
training/experience levels of personnel.
Figure 6.3: Average resolution time by major category across both data sets Major Category
Av
erag
e L
eng
th (
Min
ute
s)
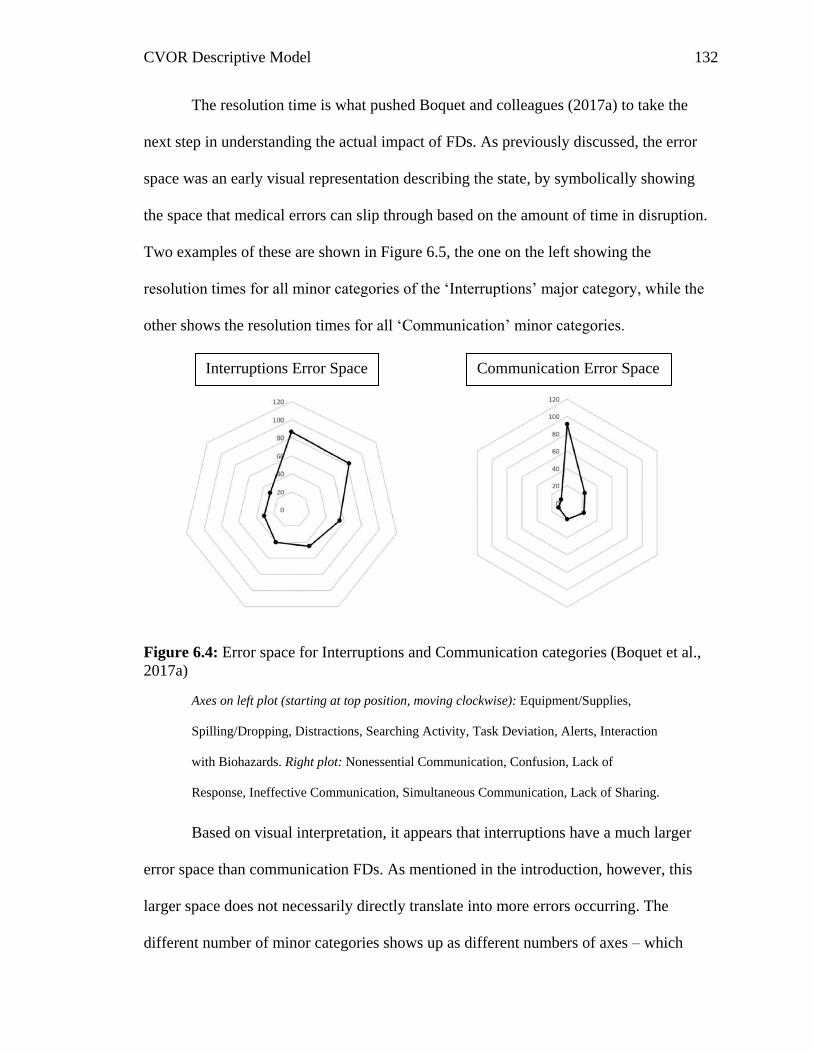
CVOR Descriptive Model 132
The resolution time is what pushed Boquet and colleagues (2017a) to take the
next step in understanding the actual impact of FDs. As previously discussed, the error
space was an early visual representation describing the state, by symbolically showing
the space that medical errors can slip through based on the amount of time in disruption.
Two examples of these are shown in Figure 6.5, the one on the left showing the
resolution times for all minor categories of the ‘Interruptions’ major category, while the
other shows the resolution times for all ‘Communication’ minor categories.
Figure 6.4: Error space for Interruptions and Communication categories (Boquet et al.,
2017a)
Axes on left plot (starting at top position, moving clockwise): Equipment/Supplies,
Spilling/Dropping, Distractions, Searching Activity, Task Deviation, Alerts, Interaction
with Biohazards. Right plot: Nonessential Communication, Confusion, Lack of
Response, Ineffective Communication, Simultaneous Communication, Lack of Sharing.
Based on visual interpretation, it appears that interruptions have a much larger
error space than communication FDs. As mentioned in the introduction, however, this
larger space does not necessarily directly translate into more errors occurring. The
different number of minor categories shows up as different numbers of axes – which
Interruptions Error Space Communication Error Space
CVOR Descriptive Model 133
impacts volume. Order also has an effect, where in these cases the FD minor categories
wrap around from longest disruption to shortest. If these results are compared to another
operating room, a different order will impact volume significantly. That would result in
researchers either deciding to maintain the same order and comparing drastically different
shapes, or maintaining the ‘longest to shortest’ order and glossing over potential
differences due to the minor category of FD.
Modeling
Because of the mathematical shortcomings of the error space visual, this
dissertation was developed as a way to expand the usefulness of FDs and attempt to tie
them into patient outcomes. Although there are multiple data sets available as a part of
the same program (2 CVOR data sets, Trauma, and Orthopedics – to name only those the
author has directly interacted with), the present study focused on just the CVOR because
of its discussed criticality and level of invasiveness. Additionally, in terms of the full life-
span of FD research, some of the earliest work focused on the CVOR (e.g. Wiegmann et
al., 2007), making it a logical focus for the next stage.
The present research began exploring modeling with common methods see in
other industries: LCT and MAM. Although both control theory and Markovian chains
have potential applications to FD data in a CVOR, it was important to focus on the best
possible method for this project. LCT is more limited to single moments in the process,
while MAM assumes some level of linearity. As this researcher and others who have
stepped into an OR can attest – the process almost never stops fully. A major disruption
may impact a team member (or several), but others continue on with their duties – in one
remarkable instance this researcher observed in orthopedics surgery, the surgeon’s

CVOR Descriptive Model 134
glasses broke in half at the nose piece, forcing him to stop operating and remove sterile
equipment to fix them. Other team members continued on. The CRNA continued
monitoring the patient and administering drugs, while the first assist and scrub nurses in
the sterile field worked on side tasks that normally would happen later in the operation.
The seven-minute disruption did not necessarily add seven minutes to the total operation
time, because for everyone but the surgeon it was almost business as usual.
The modeling for a surgery, therefore, needed to try to address the vast
complexity of the process, which is why the direction turned towards adjacent possible,
labyrinth, and percolation methodologies. The findings from this study illustrate the
benefit of this approach, both from preliminary analysis that suggested the system was
non-Markovian, as well as the suggestion of the scalogram visuals for longer bypass
times. By utilizing a less structured approach, this research was able to make some
interesting and novel findings.
The initial hypothesis of this study, H1, predicted that mathematical modeling
could be used to predict bypass time based on FD occurrence. Based on both the
theoretical modeling as well as the findings using the actual data when used in the model,
that hypothesis is partially supported. Some relationship between FDs and bypass time
exists, though the nature of that relationship – and any causality – is still not completely
known based on this research. The other three hypotheses will be discussed further in the
next three subsections.
Breakdown by Team Member
The visual slope of the data is interesting when taken as a whole, but what that
slope represents is clarified by dividing the data points into the various team members. In
CVOR Descriptive Model 135
each case it should be noted that a perfectly rectangular shape to the distribution would
indicate that FDs are occurring with regularity across bypass time. In other words, that
would mean FDs occur in a repeating pattern that would hold with the idea of a
Markovian chain.
The anesthesia role showed almost parallel cap lines for the time between FDs,
and fairly similar lines for the length of FDs as well. This similarity in shape was
unexpected because it means that long bypass times have less frequent and shorter FDs.
There are more FDs overall, but the different nature of them is not readily apparent. A
similar trend is shown by the circulating nurse role, with roughly parallel lines in both
cases. The perfusionist, on the other hand, shows almost identical Y-intercepts for both
the time between FDs and the length of FDs. In this case the difference is just the
number of FDs occurring while the relative lengths of them and spacing of them remains
constant. The final role, the surgical team, shows the same parallel lines for time between
FDs, but even more surprising the length of FDs is actually shorter in the longer bypass
times.
At the very least, hypothesis 2a – that different team members will have different
effects on bypass time – seems to be partially supported, however, like relating FDs to
bypass time, a causal relationship is difficult to determine. The relationship that FDs have
for different team members have with the length of bypass time is, however, different. A
better way to look at it may be that both bypass time and FDs are influenced by some
other aspect, whether that be situational awareness, skill, professionalism, or something
else altogether.
CVOR Descriptive Model 136
Situational awareness for instance is tied to each individual’s ability to interact
with the environment by understanding what is going on around them. If this is low, FDs
could become more prevalent such as the Layout major category, where a team member
does not realize where wires and tubing are, or spilling and dropping could occur because
the team member bumps something as they move their arm. Skill could impact the
operation by adding more time, which could also mean more FDs since a correlation
between operation length and FD count was established by this research. The third
example, professionalism, could help explain large numbers of distraction FDs that were
mostly cell phone use. There could be some individuals who are just less present
mentally, and so are generating FDs as well as holding up the operation at different times.
It should be noted, however, that although the time between FD graphics
unexpectedly showed more time between FDs for longer bypass times, the length of FDs
was also longer initially for both the anesthesia and circulating nurse roles. This is
especially concerning for the circulating nurse, specifically, when their role in the CVOR
is considered as the room manager. Their job is more-or-less to address issues in the
room and take on the responsibility of other FDs as they arise, such as helping to start a
malfunctioning machine or replacing a component dropped in the sterile field. Therefore,
the longer FDs for this role feasibly contribute to longer bypass times, because each one
may cause more tasks to assist other team member to queue for addressing later.
Interaction between Team Members
Hypothesis 2b, that an interaction of FDs between different team members will
show more of an impact on critical phase length (bypass time), was not supported by the
present methodology. The model utilizes the breakdown of tasks from Table 4.1, which
CVOR Descriptive Model 137
is overly simplified due to the varying nature of bypass time activities across different
surgery types. Because of this, only a few tasks are present, none of which require more
than one of the four roles to complete. Therefore, the model is unable to show how delays
occur during bypass time due to shared tasks being impacted.
At the same time, the model does not include support for the notion that FDs
before bypass time may be impacting it. FDs were seen as a way to gauge the chaos in
the system. By analyzing them the performance abilities of the team could be examined:
a skilled team would have fewer of them while an unskilled one would experience them
more frequently throughout the whole operation. Limits on the data, such as no accurate
gauge of team member skill, mean that this concept was not possible to fully examine and
corroborate.
Another major detractor from showing the interaction effect is that data was
limited to a single team member. In other words, every flow disruption was assigned to
one person/role, even if multiple people may have been involved. For instance, it is not
possible that a “non-essential communication” FD, or any other communication FDs,
occurred among a single team member. Each role has the potential of multiple people in
that role present – always during bypass time for the surgical role and for the rest of them
individuals being trained could be present – but still it is highly unlikely that every
communication FD did not impact at least one other role, such as the circulating nurse
requesting clarification from the surgeon. Because of this, analyzing interactions was
limited to FDs happening in sequence, so more investigation is warranted for a data set
that includes multiple assignments for a single FD.
CVOR Descriptive Model 138
The cap lines for the FD landscapes do show some interesting similarities,
specifically when the time between FDs is considered. For surgeries with longer bypass
times, the Y-intercept is almost identical for the anesthesia and surgical roles, which
suggests that these two roles are initially having FDs close together. The hyperbolic
constants for the short bypass times are fairly similar, ranging from 1874 (anesthesia) to
2356 (surgery), while the range for long bypasses is from 3330 (surgery) to 7000
(anesthesia), which also supports the findings of the scalograms, where the longer bypass
time surgeries seem to be less consistent – and therefore less Markovian.
Breakdown by Major Category
The data broken down by major category shows a variety of different
relationships when the length of bypass time is considered. For the coordination
category, the same comparison is seen as for most of the team member breakdowns:
longer bypass time has both longer and sparser FDs despite having more overall.
Communication and interruption FDs occur at a similar rate for both long and shore
bypass time in the beginning of the operation, trailing off farther to show more occurring.
The same is true for the length of the flow disruptions: both communication and
interruption FDs have similar lengths in the beginning, with more occurring in longer
bypass times. Perhaps the most interesting data set for categories is shown by layout
FDs, where short and long bypass times have about the same number of FDs overall, and
these FDs tend to be the same length as shown by the similar lines. As the chart
displaying the time between FDs starts much higher, this indicates that it takes longer to
get to each FD.
CVOR Descriptive Model 139
The hypothesis, number 2c, that suggested different types of FDs would have a
different impact on bypass time, is partially supported because a relationship does exist.
As stated before, causality is difficult to determine, and no findings for any category
suggest their time is directly added to bypass time. The opposite may be true, that longer
bypass means more FDs, but even without causality, there is still an extant relationship.
It is unfortunate that both equipment issues and usability do not have sufficient
data to see if any difference occurs for short versus long bypass times. In both these
cases, these are the categories that would seem most likely to impact the operation: if the
surgeon needs a certain piece of equipment and cannot use it either because it is broken
or because of the user interface, they may have to completely stop what they are doing to
figure it out, which in turn could cascade into the circulating nurse needing to replace it
or pull in more team members to figure it out.
For the communication category, the most common minor category was non-
essential communication, while for the interruptions category the most common was
distractions. These two minor categories are important to consider when examining the
difference in short and long bypass time surgeries: it is likely that the increase in length
also means more off-topic conversations and cell phone usage. This could result in time
added onto bypass time, however just as likely – if not more likely – is that these are an
indication that some team members have more down time or time to be bored during the
long operations, and are therefore more likely to resort to other means. This could,
therefore, indicate that the issue is with team members who are not disrupted taking
longer – or just a longer operation to complete.
CVOR Descriptive Model 140
Layout FDs are very interesting in that there seems to be about the same number
regardless of the length of bypass time, and they tend to be the same length. This
suggests that there may be specific tasks that cause these FDs to occur, such as accessing
a piece of equipment that is not needed most of the time or navigating around a machine
that is rarely used. Because of this unexpected finding, the understanding of the CVOR
may have to shift, which will be discussed in the next subsection.
CVOR State Interpretation
As the current project has progressed, the understanding of FDs and the process in
the CVOR has grown. Different mathematical modeling techniques were explored, from
LCT and MAM to adjacent possible, labyrinth, and percolation methodologies. This
research sought to find the best methodology to explain the role that FDs have in the
CVOR. Although predicting bypass time was the focus, a better understanding of FDs
overall is also a major benefit of this research project.
Perhaps the best way to explain some of the confusing findings – that FDs are
more spread out while also longer in surgeries that have longer bypass times – is to re-
address the basic understanding of what FDs are in a surgery. Some schools of thought
put surgery overall as a Markovian process, an assembly line of sorts where tasks are
happening in a set order as the operation progresses. Although this is true when seen
overall, that explanation is not as able to explain the impact of FDs as anything besides
noise in the system. The proposal from this project was to instead re-imagine FDs as the
adjacent possible, limitless potential pathways that are ever-changing and always opening
new paths. The answer seems to fall somewhere in the middle.
CVOR Descriptive Model 141
Surgery itself is a linear process. For each team member there are specific steps
that must be completed, and for the most part the order of these is rigid. FDs, on the
other hand, are by their nature almost random, occurring at drastically different times
over the course of the operation, but seemingly not random times. The cyclical nature
shown by the FD landscapes suggest that there are certain times when they can occur.
This does seem plausible given that when one or more team members needs to
communicate, this can cause confusion or ineffective communication minor categories to
occur. Likewise, distractions such as cell phone use may be considerably more likely
when a team member is between tasks or on a particularly boring portion of their task.
Therefore, the process overall seems to be Markovian with an adjacent possible cloud
nested in it.
This difference explains why FDs are less frequent for longer bypass times. As
team members take longer to complete individual tasks, they are also taking longer to
reach the next point where new FDs can start up. If someone is working through tasks
faster they will reach these points sooner, and therefore have more frequent opportunities
for their path to diverge into the FD adjacent possible cloud. When some of these FDs
encompass issues like spilling and dropping, part of the difference can be thought of as a
modern take on the classic speed-accuracy tradeoff that has been around to some extent
for more than a century (e.g. Woodworth, 1899). In addition to accuracy issues, other
types of FDs can be explained by this as well, such as personnel not available minor
category being due to the operation reaching a need for an individual sooner than
anticipated or cell phone use being due to boredom caused by a team member “hurrying
up to wait”.
CVOR Descriptive Model 142
This hypothesis of different specific tasks having their own adjacent possible
cloud is supported not only by the slowed down rate, but also by the interesting findings
for the layout category. The length of FDs remains almost constant as does the number
when short and long bypass times are considered. The only difference is when they are
occurring, with much more spread for the longer bypass times. This suggests that some
of the same issues are present – the graphed data is all from the same hospital – as
individuals have to complete certain tasks. This may mean that there are specific aspects
of the room that are causing difficulties or hold-ups, that are interacted with at specific
times over the course of the operation.
One major consideration for the difference in bypass length is the type of surgery,
because the operations cover a range of different procedures. A difference in type could
be the source of the different FD landscape, so the five surgeries selected for short bypass
time and five for long bypass time were compared. Some obvious differences occur,
such as two of the short ones being just CABG x2 (FH surgery 21 and 24) while the only
maze surgery (FH surgery 15) and an aortic aneurism repair (FH surgery 11) were among
the longest bypass times. But, some of the same procedures occurred as well, with two
short bypass times (FH surgery 10 and 18) and one long bypass time (FH surgery 25)
consisting of only an aortic valve replacement. Additionally, one of the long bypass times
was a myocardial revascularization (FH surgery 9), while the shortest one (FH surgery 8)
was both a myocardial revascularization and a CABG x2. Because there are some
similarities in types of surgeries seen across the two groups, something else, such as flow
disruptions must be impacting the operation time.
CVOR Descriptive Model 143
Interventions
Although developing and testing specific interventions is outside of the scope of
the present research, this section is included with some discussion on how these
interventions could be built. This section will address building interventions from a
theoretical standpoint, with possible interventions considered to address each of the 6
major categories of RIPCHORD-TWA. Theory will be the main focus of this section,
though some actual training regimes will be discussed as well. For some categories (e.g.
layout), interventions will be as much – if not more – focused on better practices at an
organizational level as on an individual team member. Essentially, this section is meant
as a starting point to go about developing interventions, depending on which types of FDs
emerge as the most critical for a given data set – there is no overall one-size-fits-all, and
for the present study two different data sets from two very different hospitals were
utilized.
Communication
A large number of communication FDs occurred (n = 644). The majority of these
were nonessential (n = 288) and ineffective (n = 201), with the rest of the categories
having fairly small numbers. The way to address these is drastically different, and the
need can vary across hospitals as well.
Non-essential communication basically covers any conversation that is not
pertinent to the operation. This typically takes the form of people talking about things
like TV, sports, and their children. This type of FD is more of a grey area than any of the
others, because they can be argued as both positive and negative. The negative is pretty
obvious in the context of this research – like any other FD they may negatively impact
CVOR Descriptive Model 144
SA and pull the team members away from a task at hand. And unlike other types of FDs
these are almost guaranteed to impact at least 2 team members (in the present research,
each FD was only assigned to one). In many cases this could mean that the person(s) who
did not initiate the conversation is as unexpectedly distracted as a piece of equipment
failing, etc.
The positive argument for non-essential communication stems from two areas – it
allows people to mentally refresh themselves and regroup, while also building team
relationships. It’s pretty obvious that the mind tends to wander, and this wandering is not
realistically measurable, meaning its impact cannot be fully understood. People taking a
moment to talk about what they were thinking about, to get that kind of personal need to
discuss satisfied, could help them to then focus more on the task. Building team
relationships is an important part of developing team cohesion, with conversations
allowing team members to find common ground and develop positive bonds, which has
been studied widely over many decades (e.g. Michalisin, Karau, & Tengpong, 2004; Lott
& Lott, 1961, 1966) and demonstrated time and again to be a positive.
If in the specific hospital environment non-essential communication is a negative
when data is studied using this methodology, the reason for this negativity should be
explored more. If it’s because of the quantity of conversations, then perhaps some rules
need to be put in place such as limiting it during critical phases. It’s also possible that the
type of conversation is an issue, with more hostile gossiping and even bullying not only
distracting team members but also damaging cohesion. In that situation, direct human
resource and administration intervention is probably a necessity, with a whole breadth of
responses that they can pursue.
CVOR Descriptive Model 145
For ineffective communication FDs, and almost the remainder of the
communication minor categories as well, the issues often stem from the skills and ability
of team members to communicate. Fortunately, communication is an area that has been
heavily researched, and so can be addressed with some confidence. A great example of
this process comes from the dissertation of Litzinger (2017), who utilized similar FD data
to develop interventions for a hospital’s trauma center. Communication was one of the
major focuses of that work, and was addressed through a customized training.
The training was developed to focus on effective communication techniques.
Several were presented such as call-outs, closed-loop communication, and read-backs.
Call-outs are meant to communicate information to the entire room at once, similar to the
time-out, but without team members necessarily pausing their work. This technique helps
convey critical information that can impact multiple team members, such as oxygen
saturation rates. Closed-loop communication and read backs are both methods designed
to ensure information is received accurately (AHRQ, 2016). Additionally, training
included simple strategies such as using eye contact while saying colleagues names to
better improve delivery.
Although the specific trained methods may not be universal, this provides a good
starting point when considering building a training course for another hospital. The
method Litzinger (2017) utilized, however, stands as an excellent example of how to
address FDs. Trends were classified using subject matter experts who utilized the Human
Factors Intervention Matrix (HFIX) to address frequent disruptions. In this methodology,
the developed interventions were then rated for feasibility, acceptability, cost,
effectiveness, and sustainability. This resulted in a number of interventions that were not
CVOR Descriptive Model 146
only tailored to the need, but also possible using limited hospital resources. The
interventions did not cover everything, but Litzinger did demonstrate a reduction in FDs
by collecting data post-training as well.
Coordination
The coordination major category had a total of 900 FDs prior to cleaning data.
The most prevalent minor category for coordination was unknown information (n = 389),
which includes a range of FDs from gathering or working with the wrong piece of
equipment to confusion over how to operate a device. Many of these are similar to the
results of the communication minor category “confusion” or the interruptions minor
category “teaching moments”, meaning addressing them can be effectively done in the
same manner. The second most common minor category from coordination was
personnel not available (n = 342) which covers any point when one team member leaving
the room caused a delay or a team member was needed who had not arrived.
Personnel not available is a difficult category to address, in part because many
times a team member leaves it’s brought on by other flow disruptions, such as spilling or
dropping equipment that is not stocked in the OR. Additionally, human needs such as
using the bathroom are difficult to predict for lengthy operations such as those in the
CVOR. More personnel of course could go a long way to solve the issue – bathroom
breaks and leaving to grab an item both would have less of an impact if someone is
always ready and in the room to take over. That change would be unrealistic, however,
due to the high costs to hospitals.
There are more realistic options to address the large number of this minor
category. For one, they can be analyzed to better stock operating rooms. If a certain
CVOR Descriptive Model 147
piece of equipment or material is regularly retrieved from outside the OR, it could be
prioritized over something not regularly used. Space is fairly limited, so naturally not
everything useful can be included, but some other tricks can be employed, such as
rotating stock based on surgeon preference – if a surgeon tends to use certain sutures, for
example, other types can be removed (or limited in number) to make space for different
materials.
Unknown information FDs, as mentioned previously, share a lot in common with
communication issues and teaching moments. Bad communication or poor training can
lead to these occurring, with similar FDs classified as “teaching moments” instead based
partly on the severity and on the time the team members dedicate to making a correction.
To illustrate the similarity and distinction of the three, if the surgeon requests the
circulating nurse get a 2 gauge suture and they grab a 2/0, the event could be classified as
“confusion” if the circulating nurse does not realize the surgeon is asking for a larger-
than-normal suture, “unknown information” if it’s due to the circulating nurse not
knowing about the thicker gauge and therefore assuming the surgeon meant 2/0, or it
could be a “teaching moment” if the surgeon takes that mix-up as a chance to explain
why they are using a larger than normal suture.
Because there is some similarity, suggestions from communication can be
applied. For instance closed-loop communication could help ensure accurate information
is known – in the previous example, the circulating nurse could confirm the size by
saying “two-slash-oh”, which would have then given the surgeon a chance to clarify they
meant “no, just two”. This kind of communication could provide enough of a catch to
CVOR Descriptive Model 148
prevent many of the instances of such a mistake occurring. Of course, the kind of training
and interventions need to be tailored to the particular need.
As unknown information FDs are found, they could also help to identify
shortcomings in training or the operational environment. For instance, if personnel are
not familiar with operating the electronic medical records (EMR) and take time – or need
help – pulling up information, that system could be targeted in a variety of ways. More
training may be the answer in that situation, or more extreme changes such as modifying
the EMR to make it more usable, switching EMRs, or some other solution.
Equipment Issues
One of the least frequent categories, equipment issues, only had a total of 90 FDs
classified to it. Of the four minor categories, none stood out as a huge majority, ranging
from surgeon equipment (n = 13) to anesthesia equipment (n = 31). Flow disruptions
from this category can suggest a variety of courses of action, depending on their nature.
Similar to other categories, training is potentially the answer for some FDs, not
necessarily to prevent them completely, but to at least lessen their length. If certain
devices have some difficulty being operated, or a specific portion of the operation where
hang-ups occur, a proper response could mean a several minute FD is only a few seconds
long. Therefore, training to address this type of FD may focus on troubleshooting and
tricks to better utilize the equipment.
Additionally, FDs can help hospitals know how to more effectively utilize
funding for maintenance and new equipment. This is true if a specific piece of equipment
frequently has issues – for instance the perfusionist’s barcode scanner at MUSC was
associated with a number of FDs. This could mean that for whatever reason that device
CVOR Descriptive Model 149
needs to be replaced or repaired in some way. Perhaps the barcode scanner reached the
end of its lifecycle. Or, perhaps it has not been properly maintained and cared for, such as
the scanner part of it being cleaned in a way that leaves it smudged.
Interruptions
The largest category by far, interruptions (n = 2561) accounted for approximately
half of all FDs that were observed. Distractions (n = 968) and equipment/supplies (n =
866) were by far the largest minor categories present in this study. Due to the sheer
quantity in this major category, task deviation (n = 255) and spilling & dropping (n =
229) are both noteworthy as well.
Distractions cover activities that involve individuals being pulled away from their
current task by people or technology not relevant to the current operation. The majority
of these are related to cell phone use, with some also due to other personnel entering the
room, such as a nurse from another operation looking for a specific piece of equipment.
This category is in line with “non-essential communication” in terms of its removal from
the operation, however unlike that minor category, there is not the added team-building
factor working as a potential positive. And because this type of FD is incredibly common,
they are something to be wary of.
Fortunately, this type of FD is also easier to counteract than many others. Simple
policy changes, such as banning cell phones in operating rooms, could eliminate many
FDs in a single surgery. The impact that these personal electronic devices have is a hot-
button issue in today’s world, with recent research (e.g. Fillipo & Fencl, 2016) examining
what effect they have, with most research suggesting negative impacts, or at least
potentially negative impacts depending on the situation. Additionally, a lot of research
CVOR Descriptive Model 150
(e.g. Yoong et al., 2015; Pereira et al., 2011) has not focused on cell phones specifically,
but has cited them as possible sources of distraction. This is a worrying trend, and
regardless of the findings of a mathematical model like this, their removal should be
strongly considered, because even if they do not contribute to something like bypass
time, they may have many other impacts.
Equipment & supplies FDs involve a team member retrieving something with an
unforeseen need. This could be due to an issue on planning, however many other factors
could contribute, such as patient factors requiring a different size valve than expected, or
from other FDs such as spilling and dropping. These are not as concerning as some other
types, because there is a limit to what can be prepared in the sterile field, and so
retrieving other supplies and addressing this type of FD is a part of the circulating nurse’s
job. Better organization could remove some of these – if a specific material is regularly
missing, perhaps that material needs to be added to the standard set-up. Other than that,
this category is one that can be considered almost business as usual.
Task deviation FDs are those that involve one team member being pulled away
from their current task to address another task. These could be brought on by a need by
another team member or a piece of equipment. Many of these are due to the room phone
ringing, which is considered part of the operation and duties of staff, instead of a
distraction like a personal phone would be. There is not really a definite way to address
this type of FD, because there is not really a way to coordinate phone calls into the OR,
nor is there a way to coordinate the needs of other team members inside the OR.
Training is the potential answer, for a range of personnel. For those calling in, this
training – or at least policy – could work to limit the number of calls based on necessity.
CVOR Descriptive Model 151
Technology could even impact this, with simple requests switched over to a message/chat
system that the circulating nurse can address when available, instead of via a loud phone
that could distract multiple team members. For personnel within the OR – if those prove
to be an issue – training would be drastically different, perhaps focusing on critical
thinking that could help team members best prioritize tasks. Most likely team members
will have to do both, but if they make the right choice, it could limit the impact.
Finally, spilling and dropping FDs show up fairly regularly. It is possible that
some underlying issue could be the cause – are tables too small for the supplies, meaning
some inadvertently gets pushed off? Are the gloves incredibly slick when blood is added?
Human choices could be a cause as well, such as trying to carry too much equipment at a
time. And so this category could, like all the rest, be analyzed for common trends, with
some modifications to the operating environment or guidelines and training to try to
address them. Unfortunately, a lot of these are probably uncontrollable, making this
category one of the ones that may also just have to be accepted.
Layout
As mentioned in the introduction to this section, the layout category is not as
focused on individuals as on the overall organization. Additionally, layout FDs are one
category where interventions must be carefully tailored to the specific hospital or surgical
suite. Even so, there has been some research already which has considered the layout of
surgical suites, and many layout decisions are at least somewhat standardized across
hospitals.
That is not to say the layouts cannot be improved, and with modern computing
methods researchers are able to model workflow of hospital staff to better determine how
CVOR Descriptive Model 152
the layout is impacting the individual team members. For example, Neyens and
colleagues (2018) took 25 surgery observations from three separate ORs to see how the
circulating nurse was impacted by the layout. The authors divided the OR into different
zones depending on the activity they were associated with, such as supply zones, support
zones and sterile zones. The number of zones the circulating nurses had to move through,
and distance of travel, did show some relation to the number of FDs nurses experienced.
In essence, the most complicated OR in terms of layout also showing the most FDs.
Because FD occurrence was a focus of Neyens’ work, the implications for the present
research are clear: layout FDs may be preventable by careful planning of the layout of an
OR.
Although across the present data set layout FDs were fairly infrequent – and
therefore more difficult to gauge their impact on bypass time. In other operating
environments these may be more frequent: with Neyens’ work, for example, finding an
average of more than 20 per operation (much higher than the roughly 14 per operation
from the present study). The impact of layout FDs may be much higher for an operation
where they occur frequently, making it important to consider reducing their numbers
where relevant.
The general rule of thumb that emerges for layout FDs seems to be that more
simplified layouts are preferred. More definite rules are a little more difficult, but based
on the FDs observed in this study, some areas emerge. Out of 557 layout FDs total, the
minor category with the most was wires and tubing (n = 203), with the second most
categorized as equipment positioning (n = 155). Many of these were due to positioning,
such as interfaces, outlets, etc. being too low to the ground or too high up. Additionally,
CVOR Descriptive Model 153
tangled up wires and tubing that needed to be sorted out were also mentioned many
times. Ideally hospitals would take care to better design the space and understand what
equipment needs to be where to develop the permanent structures and outlets. Some
additional equipment/materials to help organize tubing would be beneficial for more
complicated wire and tube layouts.
Although many of the FDs of this section were classified as wires/tubing and
equipment positioning, they are sometimes fairly similar to FDs classified as usability.
Because of this, discussion in the usability section will also be relevant.
Usability
The usability category had a very small number of FDs overall (n = 75). Because
of the limited data, trends are not immediately clear. Items that fell into this category
ranged from the scrub nurse having difficulties tightening a piece of rib cage equipment
to difficulties using less operation-critical equipment such as tying the trash bag. On the
hospital side, some modification can potentially be done to improve equipment, but
overall, the main way to overcome these FDs is to source more user-friendly equipment
to begin with.
Equipment that is familiar and operates as expected is desirable. For complex
machines, such as the CPBM, this would mean a replacement machine should function
similarly and require similar operator inputs. More simplified workflow is also desirable,
with a reduction in the steps needed to operate the device, or the effort to verify step
success – for example, tightening a component until a ‘click’ or a light turns on would be
easier to verify success than tightening exactly 5.5 turns. Steps should not be changed in
CVOR Descriptive Model 154
a way that makes the original workflow and training counter to the new workflow, such
as the same two steps that need to be completed in the opposite order.
There are a wide range of ways that design can be improved, with the ideal being
equipment purchased ready to be easily used. Fortunately for hospitals in this regard,
medical equipment is fairly regulated. The Food and Drug Administration (FDA), for
example, maintains guidelines on how best to design equipment (2016). Additionally, in-
depth summative testing is required for new devices to be released. The issue, oftentimes
– and part of the reason usability FDs are difficult to eliminate completely – is that
purchasing the latest equipment is expensive for most hospitals while at the same time
drastic change is slowed by the need to keep equipment still usable to surgeons with
decades of experience. Surgeons may oppose the brand new device if they’ve been using
another for decades, because although there may be many design changes to improve
usability and functionality, there are also potentially several generations of new
equipment that would be skipped over. This means that even if improvements were slight
from generation to generation of equipment, the change that occurs over several decades
may seem drastic enough that the surgeon sees it as complex and unusable.
Conclusions
The methodology that this research employed for model development is outside
of the realm of typical approaches – in not only human factors but most – if not all –
applied fields that would address issues in an environment like the CVOR. The success
demonstrated not only supports hypothesis 1, but also opens up new ways of thinking and
approaching human factors problems. The adjacent possible conceptualization not only
CVOR Descriptive Model 155
fits with the CVOR, but also has provided a new understanding of what is happening and
how CPBT is influenced.
The differences between short and long bypass times are both interesting and
noteworthy. In many cases, longer bypass times meant that FDs were longer, less
frequent in the beginning, but more numerous overall (anesthesia, circulating nurse, and
coordination). Other team members and categories (perfusionist, communication, and
interruptions) showed similar patterns of length and frequency in the beginning, with
more over the length of the operation. While the scrub nurse was a mix between these
(less frequent, but similar – and shorter – lengths in the beginning), and layouts showed
the same number and length of FDs, just more spread out. Because these differences
occur, partial support was found for both hypothesis 2a and 2c.
This range of differences between FDs supports the notion that some of their
characteristics are tied to bypass time. The findings also support a new understanding of
the state of the CVOR, and how FDs fit into it. FDs are neither predictably linear, nor are
they noise as other modeling techniques would define them. FDs are instead the possible
chaos of any step in the surgical process, providing a selection of paths that the team
member(s) could travel down to complete each part of their tasks. Although for short
bypass times the process is somewhat Markovian, for longer bypass times this system
breaks down, and as shown there tends to be many more FDs. These flow disruptions,
therefore, could be the reason that the process is non-Markovian, critical events that
damage a system and force the process to take detours for different individuals. In the
case of bypass time in the CVOR, this could be of critical importance to the well-being
and even survival of the patient.
CVOR Descriptive Model 156
The result of this study is an understanding that FDs are typically a negative
aspect of a system. Whether this negative is because they damage the system, or because
they represent symptoms of an already damages system, their existence should be limited
by better understanding and maintaining the systems state.
Recommendations for Future Research
The developed mathematical model was to some extent tailored to the CVOR
environment. The intention of it, however, is to be widely applicable to a range of
different environments. The model can easily be applied to different ORs, for instance,
with an already collected data set from orthopedics surgery coded using RIPCHORD-
TWA. Additionally, the model is not just limited to RIPCHORD-TWA, because the
categories are nothing more than a variable. Other taxonomies could be utilized, such as
the one utilized by Shao and colleagues (2015), in order to represent the data in a
different manner, or to include a different range of data. Finally, once the model has been
more developed using the medical setting, it should be applied to other environments as
well, such as aviation.
Future research should also aim to better develop the model by applying more
data. This would allow for a more complete representation of the possible types of FDs
that can occur. The basic premise of this project – understanding how FDs lead to other
FDs and a general state of disarray – would be more effectively addressed if many more
possible scenarios are taken into account in the data set.
In terms of the developed model, room for more growth is also possible. Over the
course of its development, several options were presented that could better improve the
accuracy. One of these involved adding in an exhaustion or workload factor, which could
CVOR Descriptive Model 157
both improve the data and add in a real-time component to its ability to improve a
system. For instance, biometric ratings such as heartrate could allow hospitals to monitor
the surgical team and better anticipate when staff are overworked and in need of
additional help. Although not typically employed on staff, many monitors are already
available in a medical setting. Another possible way to expand the model would be to
build it around idealized times to complete tasks in order to better understand the impact
of FDs as well as the impact of other operational factors on times to complete.
Limitations and Delimitations
As with any research project, the present study faces a number of limitations and
delimitations that will impact it moving forward. These various aspects of the study
design are not considered to be oversights, and are acceptable when considering the goal.
A list of these will be outlined in the following sections.
Limitations
The major point of contention for the present research is due to the sample used.
Although a large number of FD data points were identified across the surgeries, only 40
were observed total. Furthermore, as mentioned in chapter 1, not all of the roles were
observed in all 40 cases, with 15 of them only observing 2 roles at a time. Because of this
limit in sample size, although data will be present for creating the model, there will not be
sufficient data to definitively identify the impact of all categories of flow disruptions,
especially considering some of them (e.g. usability, equipment issues) occur very
infrequently over the data set. A larger data set would be beneficial, especially when
different quantities of different FD categories are taken into account.
CVOR Descriptive Model 158
Another limitation is due to the data collection methods. FDs were only collected
through in-room observation, with no recordings to corroborate observations or catch
missed observations. Because of this there were potentially a number of FDs in each case
that were not recorded. Unfortunately, due to the sensitive nature of active ORs, and the
concern for privacy for both patients and staff, and the lack of extra space for more
observers, this limitation is almost guaranteed in any data collection in a CVOR.
The data also does not include a clear breakdown of individuals – although there
are four roles collected, there are more than four people in the OR at a time. The roles
represent a simplification of those actually involved. This limits the ability of a model to
fully encompass various interactions and how they contribute to FDs. Along the same
lines, each FD is only assigned to a single role, even though some – such as
Communication, nonessential communication’, may involve an interaction of several
roles.
Perhaps the most striking limitation is the difficulty inferring causality. Due to
the nature of the analysis and data, a relationship was established, but this relationship
only shows that there is a link between FDs and the length of bypass time. This could be
due to FDs increasing bypass time, but it could also be due to a longer CPBT having
more time available for FDs to occur in.
Delimitations
As discussed previously, there are a wide range of mathematical model types that
could be employed to try to explain the data, such as control theory and MAM. The
present research selected only the adjacent possible methodology to target, because it is
seen as the best fit to the actual state of a CVOR. Other methodologies, however, would

CVOR Descriptive Model 159
still provide valuable information in understanding the impact of FDs on bypass time.
The scope of the present research, however, was chosen to be limited to just a single
mathematical model.
Flow disruptions are present in all surgical environments, but for the present
research only the CVOR was chosen, even though extant data is available for both trauma
bays and orthopedics surgery. Although modeling FDs in any OR could be a valuable
tool, and contribute greatly to their understanding, the present research used the CVOR
because of the identifiable and measurable bypass time critical phase. This delimitation
creates both a recognizable goal, and a measurable end-point. In future work, it is hoped
that the mathematical model can be applied to other ORs, and potentially other
environments.

CVOR Descriptive Model 160
Chapter 7: Supporting Information
References:
Agency for Healthcare Research and Quality (AHRQ). (2016). TeamSTEPPS® 2.0.
Retrieved from http://www.ahrq.gov/professionals/education/curriculum-
tools/teamstepps/index.html
American College of Surgeons (2018). New approach to surgical measurement: Phases
of surgical care. Retrieved July 7, 2018 from
https://www.facs.org/advocacy/quality/phases
American Society of Anesthesiologists (2017). About the profession: What is a physician
anesthesiologist? Retrieved November 6, 2017 from https://www.asahq.org/For-
the-Public-and-Media/About-Profession.aspx
Bettencourt, L.M.A., Kaiser, D.I. (2015). Formation of scientific fields as a universal
topological transition. Physics and Society.
Bettencourt, L.M.A., Trancik, J.E., Kaur, J. (2012). Determinants of the pace of global
innovation in energy technologies. Physics and Society.
Blocker, R.C., Eggman, A. Zemple, R., Wu, C.E., & Wiegmann, D.A. (2010).
Proceedings of the Human Factors and Ergonomics Society 54th Annual Meeting:
Developing an observational tool for reliably identifying work system factors in
the operating room that impact cardiac surgical care. Human Factors and
Ergonomics Society, Inc.
Blocker, R.C., Duff, S., Wiegmann, D., Catchpole, K., Blaha, J., Shouhed, D., Ley, E.,
Karl, C., Karl, R., & Gewertz, B. (2012). Flow disruptions in trauma surgery:
CVOR Descriptive Model 161
Type, impact, and affect. Proceedings of the Human Factors and Ergonomics
Society Annual Meeting, 56, 811-815.
Blocker, R.C., Shouhed, D., Gangi, A., Ley, E. Blaha, J., Gewertz, B., Wiegmann, D., &
Catchpole, K. (2013). Barriers to trauma patient care associated with CT
scanning. Journal of the American College of Surgeons, 217, 135-143.
Buddas, H. (2013). A bottleneck analysis in the IFRC supply chain. Journal of
Humanitarian Logistics and Supply Chain Management, 4(2), 222-244.
Bojar, R.M. (2011). Manual of perioperative care in adult cardiac surgery (5th ed.).
Chichester, UK: Wiley-Blackwell
Boquet, A.J., Cohen, T.N., Cabrera, J.S., Litzinger, T.L., Captain, K.A., Fabian, M.A.,
Miles, S.G., Shappell, S.A. (2016). Using broken windows theory as the backdrop
for a proactive approach to threat identification in healthcare. Journal of Patient
Safety.
Boquet, A.J., Cohen, T.N., Reeves, S.T., Shappell, S.A. (2017a). Flow disruptions
impacting the surgeon during cardiac surgery: Defining the boundaries of error
space. Perioperative Care and Operating Room Management, 7, 1-6.
Boquet, A.J., Cohen, T.N., Diljohn, F., Cabrera, J.S., Reeves, S., & Shappell, S.A.
(2017b). A theoretical model of flow disruptions for the anesthesia team during
cardiovascular surgery. Journal of Patient Safety, 1-6.
Carayon, P., Alvarado, C.J., Brennan, P., Gurses, A., Hundt, A., Karsh, B., Smith, M.
(2003). Work system and patient safety. In H. Luczak & K.J. Zink (Eds), Human
factors in organizational design and management VII (pp. 583-589). Santa
Monica, CA: IEA Press
CVOR Descriptive Model 162
Carayon, P., Schoofs Hundt, A., Karsh, B.T., Gurses, A.P., Alvarado, C.J., Smith, M.,
Flatley Brennan, P. (2006). Work system design for patient safety: The SEIPS
model. Quality & Safety in Healthcare, 15, 50-58.
Catchpole, K.R., de Leval, M.R., McEwan, A., Pigott, N., Elliot, M.J., McQuillan, A.,
MacDonald, C. & Goldman, A.J. (2007a). Patient handover from surgery to
intensive care: Using Formula 1 pit-stop and aviation models to improve safety
and quality. Pediatric Anesthesia, 17, 470-478.
Catchpole, K.R., Giddings, A.E.B., de Leval, M.R., Peek, G.J., Godden, P.J., Utley, M.,
Gallivan, S., Hirst, G., & Dale, T. (2007b). Identification of systems failures in
successful paediatric cardiac surgery. Ergonomics, 49(5-6), 567-588.
Catchpole, K., Gangi, A., Blocker, R., Ley, E., Blaha, J., Gewertz, B., & Wiegmann, D.
(2013). Flow disruptions in trauma care handoffs. Journal of Surgical Research,
184, 586-591.
Catchpole, K., Ley, E., Wiegmann, D., Blaha, J., Shouhed, D., Gangi, A., Blocker, R.,
Karl, R., Karl, C., Taggart, B., Starnes, B., & Gewertz, B. (2014). Human factors
subsystems approach to trauma care. JAMA Surgery. Retrieved from
http://archsurg.jamanetwork.com/article.aspx?articleid=1891733
Centers for Disease Control and Prevention (2015). Summary health statistics: National
health interview survey. Retrieved from
https://ftp.cdc.gov/pub/Health_Statistics/NCHS/NHIS/SHS/2015_SHS_Table_A-
1.pdf
Chen, X., Wang, L., Ding, J., Thomas, N. (2016). Patient flow scheduling and capacity
planning in a smart hospital environment. Access IEEE, 4, 135-148.
CVOR Descriptive Model 163
Cohen, T.N., Cabrera, J.S., Sisk, O.D., Welsh, K.L., Abernathy, J.H., Reeves, S.T.,
Wiegmann, D.A., Shappell, S.A., Boquet, A.J. (2016a). Identifying workflow
disruptions in the cardiovascular operating room. Anesthesia, 71, 948-954.
Cohen, T.N., Wiegmann, D.A., Reeves, S.T., Boquet, A.J., Shappell, S.A. (2016b).
Coding human factors observations in surgery. American Journal of Medical
Quality, 32(5), 556-562.
Eliazar, I.I., Cohen, M.H. (2013). Power-law connections: From Zipf to Heaps and
beyond. Annals of Physics, 332, 56-74.
Feldman, R. (2013). Filled radar charts should not be used to compare social indicators.
Social Indicator Research, 111, 709-712.
Ferrell, J.E. (2013). Feedback loops and reciprocal regulation: Recurring motifs in the
systems biology of the cell cycle. Current Opinions in Cell Biology, 25(6), 676-
686.
Fillipo, S., & Fencl, J. L. (2016). Social media in the OR: More than just cell phones.
AORN Journal, 103(1), 111-116.
doi:http://dx.doi.org.ezproxy.libproxy.db.erau.edu/10.1016/j.aorn.2015.10.019
Food and Drug Administration (2016). Applying human factors and usability engineering
to medical devices. Retrieved from
https://www.fda.gov/downloads/medicaldevices/.../ucm259760.pdf
Ghosh, S., Falter, F., Perrino, A.C. (Eds.). (2015). Cardiopulmonary bypass (2nd ed.).
Cambridge, UK, Cambridge University Press.
CVOR Descriptive Model 164
Grinnell Regional Medical Center (Producer). (2011). A walk through the use of
anesthesia. (Online video). Available from
https://www.youtube.com/watch?v=AuLUI81btC0
Hazlehurst, B., McMullen, C.K., Gorman, P.N. (2007). Distributed cognition in the heart
room: How situation awareness arises from coordinated communications during
cardiac surgery. Journal of Biomedical Informatics, 40, 539-551.
Hautphenne, S., Lefeber, E., Nazarathy, Y., Taylor, P. (2013). A course on structured
Markov models and control theory: A unified approach via linear algebra.
Lecture notes for AMSI Summer School
Hensley, F.A. & Martin, D.E (Eds.). (1995). A practical approach to cardiac anesthesia
(2nd ed.). Philadelphia, PA: Lippincott-Raven Publishers.
Isichenko, M.B. (1992). Percolation, statistical topography, and transport in random
media. Reviews of Modern Physics, 64(4), 961-1043.
James, J.T. (2013). A new, evidence-based estimate of patient harm associated with
hospital care. Journal of Patient Safety, 9(3), 122-128.
Jin, Y., Mukherjee, A. (2014). Markov chain applications in modelling facility condition
deterioration. International Journal of Critical Infrastructures, 10(2), 93.
Kohn L.T., Corrigan, J.M., & Donaldson, M.S. (2000). To err is human: Building a safer
health system. Washington, DC: National Academy Press.
Lee, H.K., Ju, F., Osarogiagbon, R.U., Faris, N., Yu, X., Rugless, F., Jiang, S., Li, J.
(2017). A system-theoretic method for modeling, analysis, and improvement of
lung cancer diagnosis-to surgery process. To be published in a future issue of
CVOR Descriptive Model 165
IEEE Transactions on Automation Science and Engineering. doi:
10.1109/TASE.2016.2643627
Litzinger, T.L. (2017). A prospective investigation to develop data-driven interventions
and improve process efficiency at a level II trauma center (Unpublished doctoral
dissertation). Embry-Riddle Aeronautical University, Daytona Beach, FL.
Loreto, V., Servedio, V.D.P., Strogatz, S.H., Tria, F. (2017). Dynamics on expanding
spaces: Modeling the emergence of novelties. Society and Physics.
Lott, A.J., Lott, B.E. (1961). Group cohesiveness, communication level, and conformity.
The Journal of Abnomal and Social Psychology, 62(2), 408.
Lott, A.J., Lott, B.E. (1966). Group cohesiveness and individual learning. Journal of
Educational Psychology, 57(2), 61.
Matson, K. (2001). The critical “nurse” in the circulating nurse role. AORN Journal,
73(5), 971-975.
Michalisin, M.D., Karau, S.J., Tangpong, C. (2004). The effects of performance and team
cohesion on attribution: A longitudinal simulation. Journal of Business Research,
57(10), 1108-1115.
Misasi, P., Keebler, J.R. (2017). Introduction to human factors and ergonomics of
emergency medical services In J.P. Keebler, E.H. Lazzara, and P. Misasi (ed.),
Human Factors and Ergonomics of Prehospital Emergency Care (pp. 1-12).
Boca Ranton, FL: Taylor & Francis Group.
Mitchell, I., Schuster, A., Smith, K., Pronovost, P., Wu, A. (2015). Patient safety incident
reporting: A qualitative study of thoughts and perceptions of experts 15 years
after ‘To Err is Human’. BMJ Quality & Safety, 25, 92-99.
CVOR Descriptive Model 166
Mukaka, M.M. (2012). Statistics corner: A guide to appropriate use of correlation
coefficient in medical research. Malawi Medical Journal, 24(3), 69-71.
Neyens, D.M., Bayramzadeh, S., Catchpole, K., Joseph, A., Taaffe, K., Jurewicz, K.,
Khoshkenar, A., San, D., RIPCHD.OR Study Group (2018). Using a systems
approach to evaluate a circulating nurse’s work patterns and workflow
disruptions. Applied Ergonomics, 1-8. Retrieved from
https://doi.org/10.1016/j.apergo.2018.03.017.
Nursing Crib (2017). Duties of scrub nurse. Retrieved November 6, 2017 from
http://nursingcrib.com/nursing-notes-reviewer/duties-of-scrub-nurse-2/
Palmer, G., Abernathy, J.H., Swinton, G., Allison, D., Greenstein, J., Shappell, S., Juang,
K., & Reeves, S.T. (2013). Realizing improved patient care through human-
centered operating room design: A human factors methodology for observing
flow disruptions in the cardiothoracic operating room. Anesthesiology, 119(5),
1066-1077.
Pereira, B.M., Pereira, A.M., Correia, Cdos.S., Marttos, A.C., Fiorelli, R.K., Fraga, G.P.
(2011). Interruptions and distractions in the trauma operating room:
Understanding the threat of human error. Rev. Col. Bras. Cir., 38(5), 292-298.
Perezgonzalez, J. (2013). Time is right for human factors in healthcare. Journal of the
New Zealand Medical Association, 126(1370), 117-118.
Perfusion UHN (Producer). (2016). A day in the life of a perfusionist @ UHN [Online
video]. Available from https://www.youtube.com/watch?v=Welk5ZlSC7Q
Pronovost, P., Needham, D., Berenholtz, S., Sinopoli, D., Chu, H., Cosgrove, S., Sexton,
B., Hyzy, R., Welsh, R., Roth, G., Bander, J., Kepros, J., Goeschel, C. (2006). An
CVOR Descriptive Model 167
intervention to decrease catheter-related bloodstream invections in the ICU. New
England Journal of Medicine, 355, 2725-2732.
Reason, J. (1990). Human Error. New York: Cambridge University Press.
Salis, S., Mazzanti, V.V., Merli, G., Salvi, L., Tedesco, C.C., Veglia, F., Sisullo, E.
(2008). Cardiopulmonary bypass duration is an independent predictor of
morbidity and mortality after cardiac surgery. Journal of Cardiothoracic and
Vascular Anesthesia, 22(6), 814-822.
Seifert, P.C. (1994). Mosby’s Perioperative Nursing Series: Cardiac Surgery. St. Louis,
MO., Mosby.
Shao, X., Zhong, X., Li, J., Gewertz, B., Catchpole, K., Ley, E., Blaha, J., Wiegmann,
D.A. (2015). Bottleneck analysis to reduce surgical flow disruptions: Theory and
application. IEEE Transactions on Automation Science and Engineering, 12(1),
127-139.
Shappell, S.A., Wiegmann, D.A. (2000). The Human Factors Analysis and Classification
Systems – HFACS. Department of Transportation, Office of Aviation Medicine,
Washington, DC.
Shappell, S.A. (2016). Process inefficiencies in the cardiac operating room. Presented at
the 87th annual meeting of the Aerospace Medical Association, Atlantic City, NJ.
Shouhed, D., Blocker, R., Gangi, A., Ley, E., Blaha, J., Margulies, D., & Gewertz, B. L.
(2014). Flow disruptions during trauma care. World journal of surgery, 38(2),
314-321.
Silverberg, G., Verspagen, B. (2005). A percolation model of innovation in complex
technology spaces. Journal of Economic Dynamics & Control, 29, 225-244.
CVOR Descriptive Model 168
Smith, K., Hancock, P.A. (1995). Situational awareness is adaptive, externally directed
consciousness. Human Factors, 37(1), 137-148.
Solomon, S., Weisbuch, G., de Arcangelis, L., Jan, N., Stauffer, D. (2000). Social
percolation models. Physica A, 277, 239-247.
Sundkvist, A., Milestad, R., Jansson, A.M., (2005). On the importance of tightening
feedback loops for sustainable development of food systems. Food Policy, 30(2),
224-239.
Takahashi, Y., Takahashi, H. (2002). Precise positioning control with double feedback
loop for ultralarge scale integrated manufacturing machine. Review of Scientific
Instruments, 73, 2791
Texas Heart Institute (2016). What is a perfusionist? Retrieved November 6, 2017 from
http://www.texasheart.org/HIC/Topics/FAQ/wiperfusion.cfm
Tria, F., Loreto, V., Servedio, V.D.P., Strogatz, S.H. (2014). The dynamics of correlated
novelties. Scientific Reports, 4(5890), 1-8. doi: 10.1038/srep05890
Wheatley, G. (2016). Dr. Grayson Wheatley performing on-pump CABG (coronary
artery bypass grafting) (Online video). Available from
https://www.youtube.com/watch?v=DyQiSIA1f0w.
Wiegmann, D.A., El Bardissi, A.W., Dearani, J.A., Daly, R.C., & Sundt, T.M. (2007).
Disruptions in surgical flow and their relationship to surgical errors: An
exploratory investigation. Surgery, 14(5), 658-665.
Wiendahl, H.P., Hegenscheidt, M. (2002). Bottleneck analysis of assembly lines with
characteristic curves. CIRP Annals, 51(1), 15-19.
CVOR Descriptive Model 169
Wilson, J., Kelling, G. (1982). Broken windows: The police and neighborhood safety. Atl
Mon. 211, 29-38.
Woodworth, R.S. (1899). Accuracy of voluntary movement. Psychological Review
Monographs, 27-54
Yoong, W., Khin, A., Ramlal, N., Loabile, B., Forman, S. (2015). Interruptions and
distractions in the gynecological operating theatre: Irritating or dangerous?
Ergonomics, 58(8), 1314-1319.
Zhao, Y., Peng, Q., Strome, T., Weldon, E., Zhang, M., Chochinov, A. (2015).
Bottleneck detection for improvement of emergency department efficiency.
Business Process Management Journal, 21(3), 564-585.
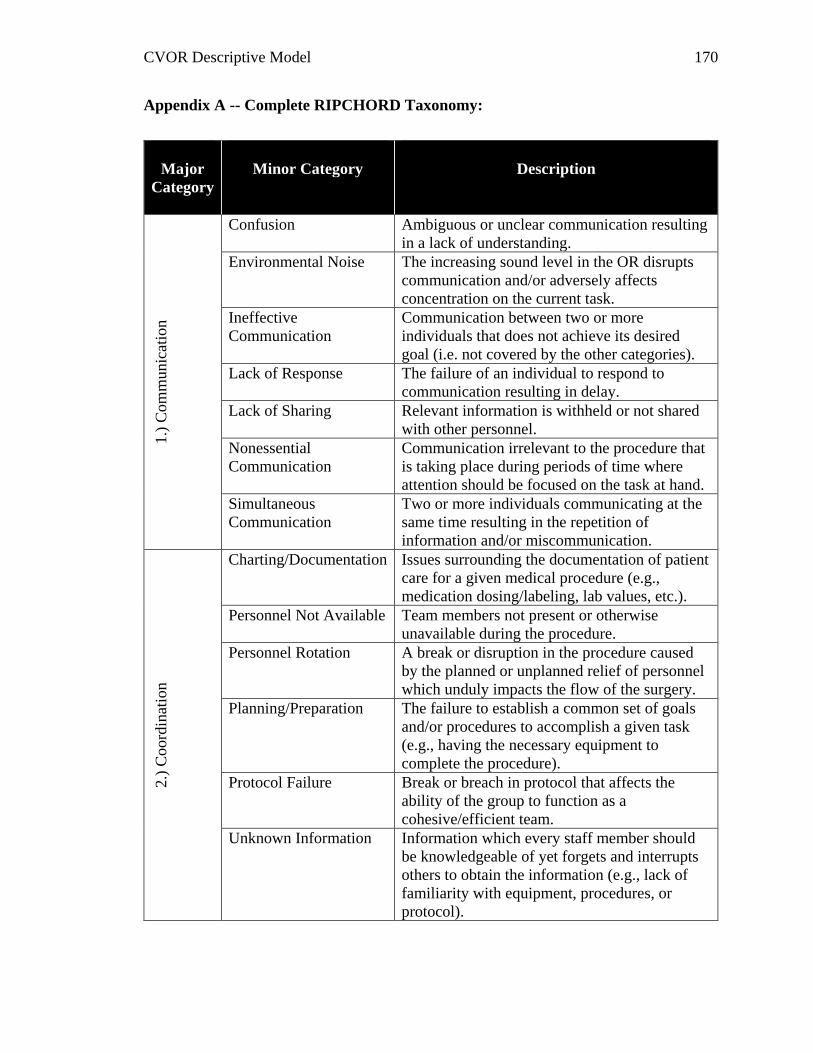
CVOR Descriptive Model 170
Appendix A -- Complete RIPCHORD Taxonomy:
Major
Category
Minor Category
Description 1.)
Com
mu
nic
atio
n
Confusion Ambiguous or unclear communication resulting
in a lack of understanding.
Environmental Noise The increasing sound level in the OR disrupts
communication and/or adversely affects
concentration on the current task.
Ineffective
Communication
Communication between two or more
individuals that does not achieve its desired
goal (i.e. not covered by the other categories).
Lack of Response The failure of an individual to respond to
communication resulting in delay.
Lack of Sharing Relevant information is withheld or not shared
with other personnel.
Nonessential
Communication
Communication irrelevant to the procedure that
is taking place during periods of time where
attention should be focused on the task at hand.
Simultaneous
Communication
Two or more individuals communicating at the
same time resulting in the repetition of
information and/or miscommunication.
2.)
Coord
inat
ion
Charting/Documentation Issues surrounding the documentation of patient
care for a given medical procedure (e.g.,
medication dosing/labeling, lab values, etc.).
Personnel Not Available Team members not present or otherwise
unavailable during the procedure.
Personnel Rotation A break or disruption in the procedure caused
by the planned or unplanned relief of personnel
which unduly impacts the flow of the surgery.
Planning/Preparation The failure to establish a common set of goals
and/or procedures to accomplish a given task
(e.g., having the necessary equipment to
complete the procedure).
Protocol Failure Break or breach in protocol that affects the
ability of the group to function as a
cohesive/efficient team.
Unknown Information Information which every staff member should
be knowledgeable of yet forgets and interrupts
others to obtain the information (e.g., lack of
familiarity with equipment, procedures, or
protocol).
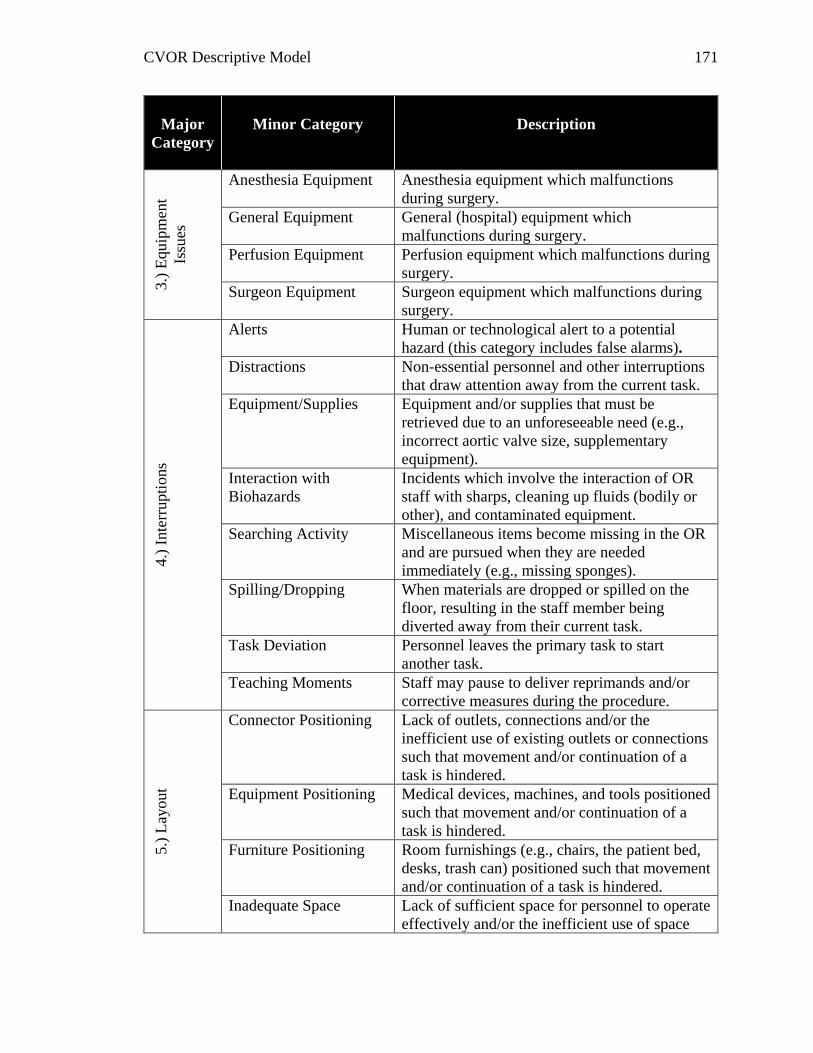
CVOR Descriptive Model 171
Major
Category
Minor Category
Description
3.)
Equip
men
t
Issu
es
Anesthesia Equipment Anesthesia equipment which malfunctions
during surgery.
General Equipment General (hospital) equipment which
malfunctions during surgery.
Perfusion Equipment Perfusion equipment which malfunctions during
surgery.
Surgeon Equipment Surgeon equipment which malfunctions during
surgery.
4.)
Inte
rrupti
ons
Alerts Human or technological alert to a potential
hazard (this category includes false alarms).
Distractions Non-essential personnel and other interruptions
that draw attention away from the current task.
Equipment/Supplies Equipment and/or supplies that must be
retrieved due to an unforeseeable need (e.g.,
incorrect aortic valve size, supplementary
equipment).
Interaction with
Biohazards
Incidents which involve the interaction of OR
staff with sharps, cleaning up fluids (bodily or
other), and contaminated equipment.
Searching Activity Miscellaneous items become missing in the OR
and are pursued when they are needed
immediately (e.g., missing sponges).
Spilling/Dropping When materials are dropped or spilled on the
floor, resulting in the staff member being
diverted away from their current task.
Task Deviation Personnel leaves the primary task to start
another task.
Teaching Moments Staff may pause to deliver reprimands and/or
corrective measures during the procedure.
5.)
Lay
out
Connector Positioning Lack of outlets, connections and/or the
inefficient use of existing outlets or connections
such that movement and/or continuation of a
task is hindered.
Equipment Positioning Medical devices, machines, and tools positioned
such that movement and/or continuation of a
task is hindered.
Furniture Positioning Room furnishings (e.g., chairs, the patient bed,
desks, trash can) positioned such that movement
and/or continuation of a task is hindered.
Inadequate Space Lack of sufficient space for personnel to operate
effectively and/or the inefficient use of space
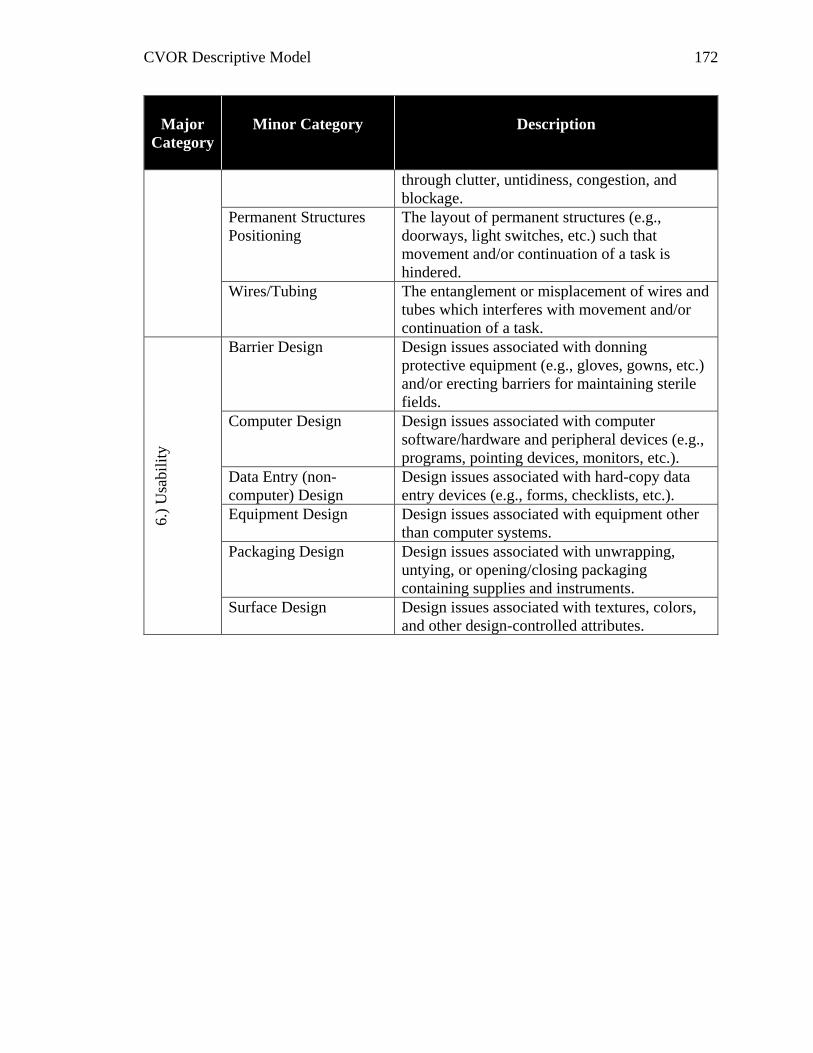
CVOR Descriptive Model 172
Major
Category
Minor Category
Description
through clutter, untidiness, congestion, and
blockage.
Permanent Structures
Positioning
The layout of permanent structures (e.g.,
doorways, light switches, etc.) such that
movement and/or continuation of a task is
hindered.
Wires/Tubing The entanglement or misplacement of wires and
tubes which interferes with movement and/or
continuation of a task.
6.)
Usa
bil
ity
Barrier Design Design issues associated with donning
protective equipment (e.g., gloves, gowns, etc.)
and/or erecting barriers for maintaining sterile
fields.
Computer Design Design issues associated with computer
software/hardware and peripheral devices (e.g.,
programs, pointing devices, monitors, etc.).
Data Entry (non-
computer) Design
Design issues associated with hard-copy data
entry devices (e.g., forms, checklists, etc.).
Equipment Design Design issues associated with equipment other
than computer systems.
Packaging Design Design issues associated with unwrapping,
untying, or opening/closing packaging
containing supplies and instruments.
Surface Design Design issues associated with textures, colors,
and other design-controlled attributes.
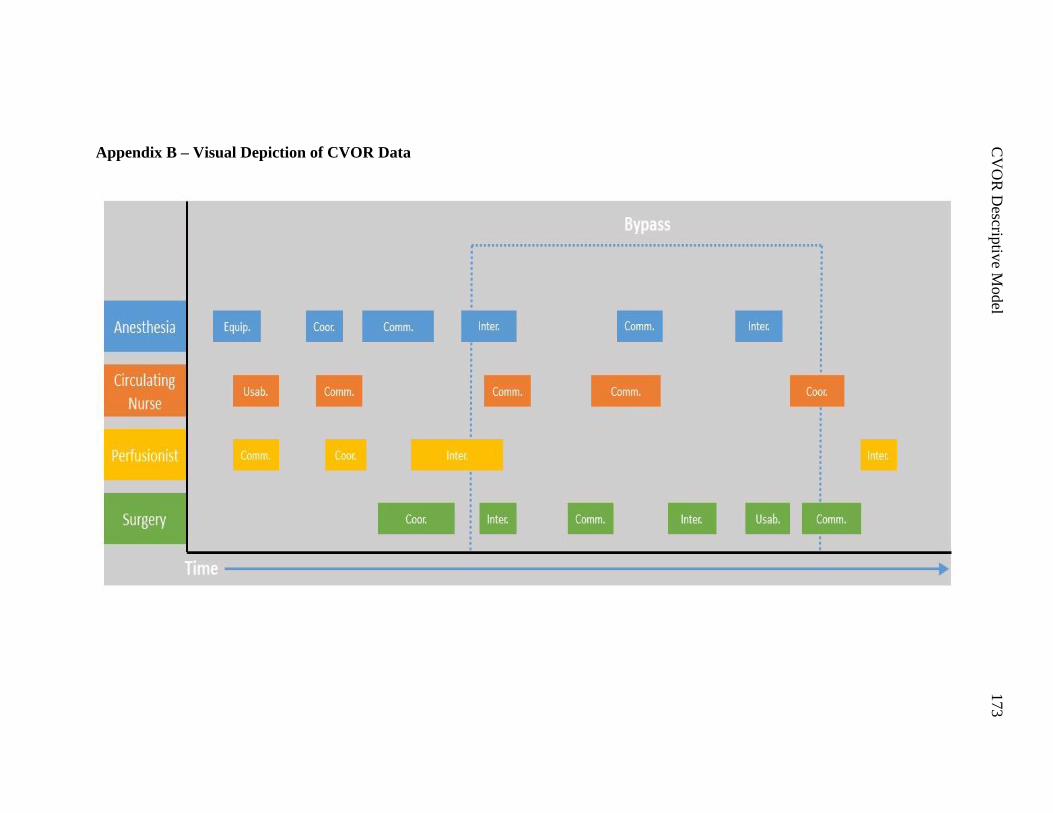
C
VO
R D
escriptiv
e Model
173
Appendix B – Visual Depiction of CVOR Data
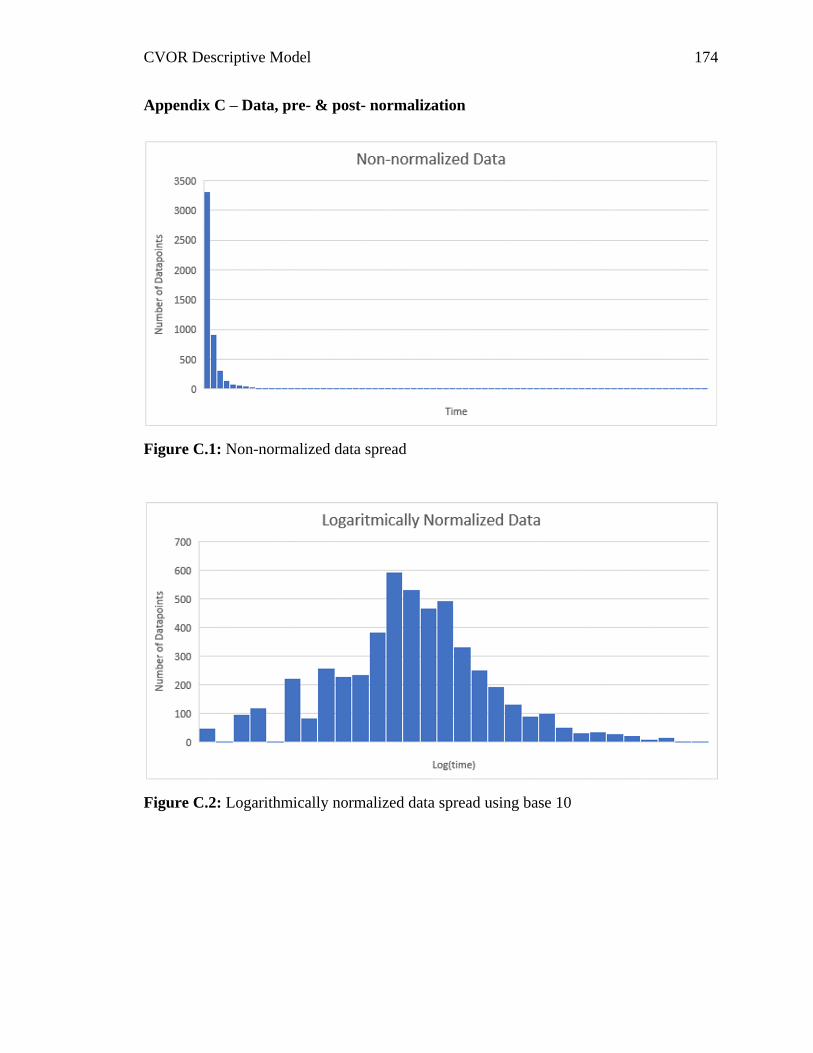
CVOR Descriptive Model 174
Appendix C – Data, pre- & post- normalization
Figure C.1: Non-normalized data spread
Figure C.2: Logarithmically normalized data spread using base 10
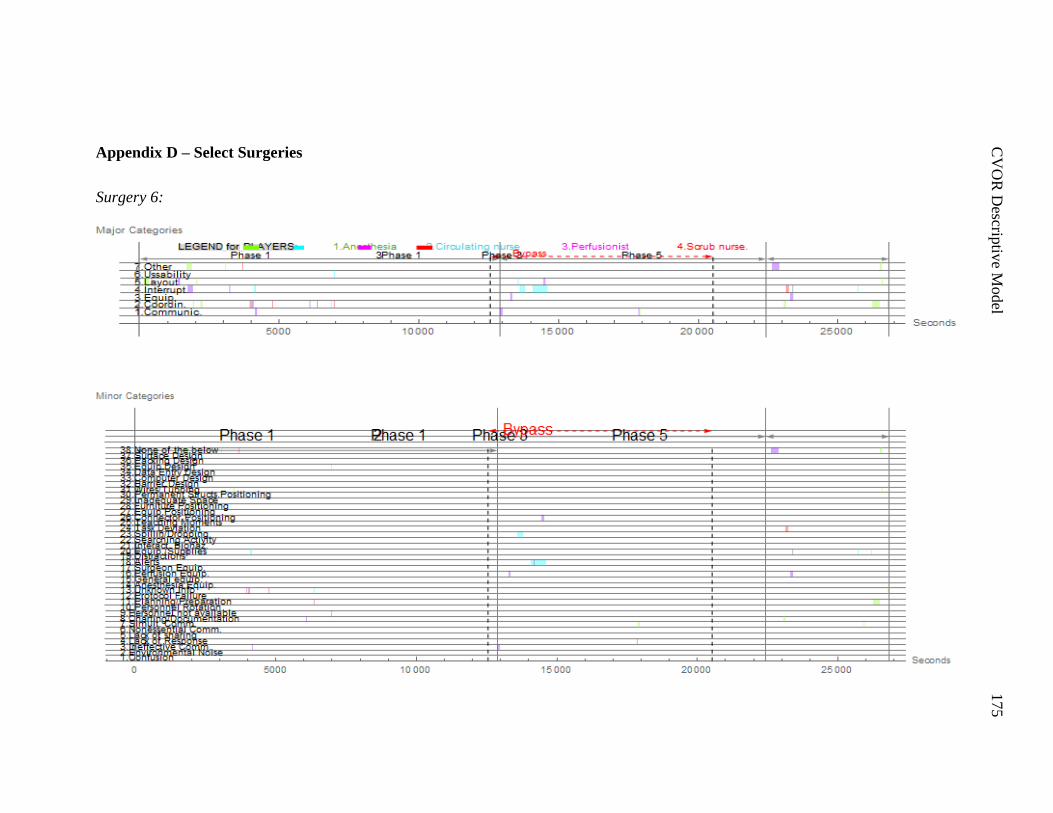
C
VO
R D
escriptiv
e Model
175
Appendix D – Select Surgeries
Surgery 6:
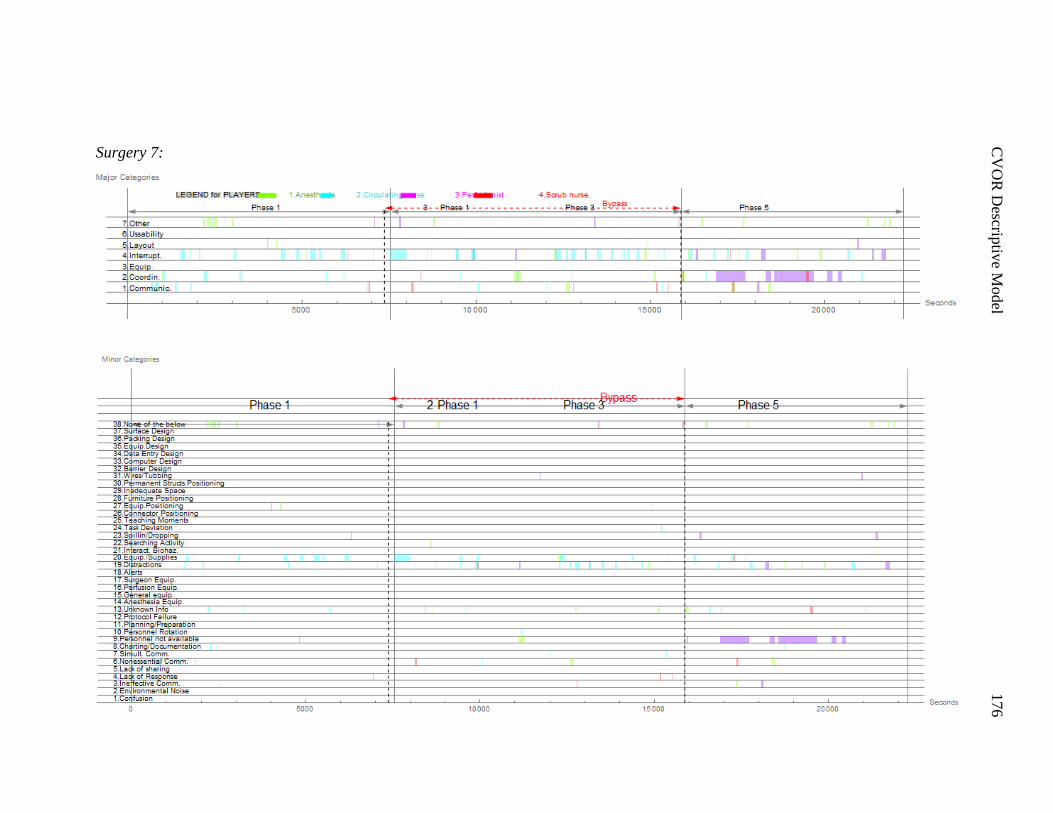
C
VO
R D
escriptiv
e Model
176
Surgery 7:
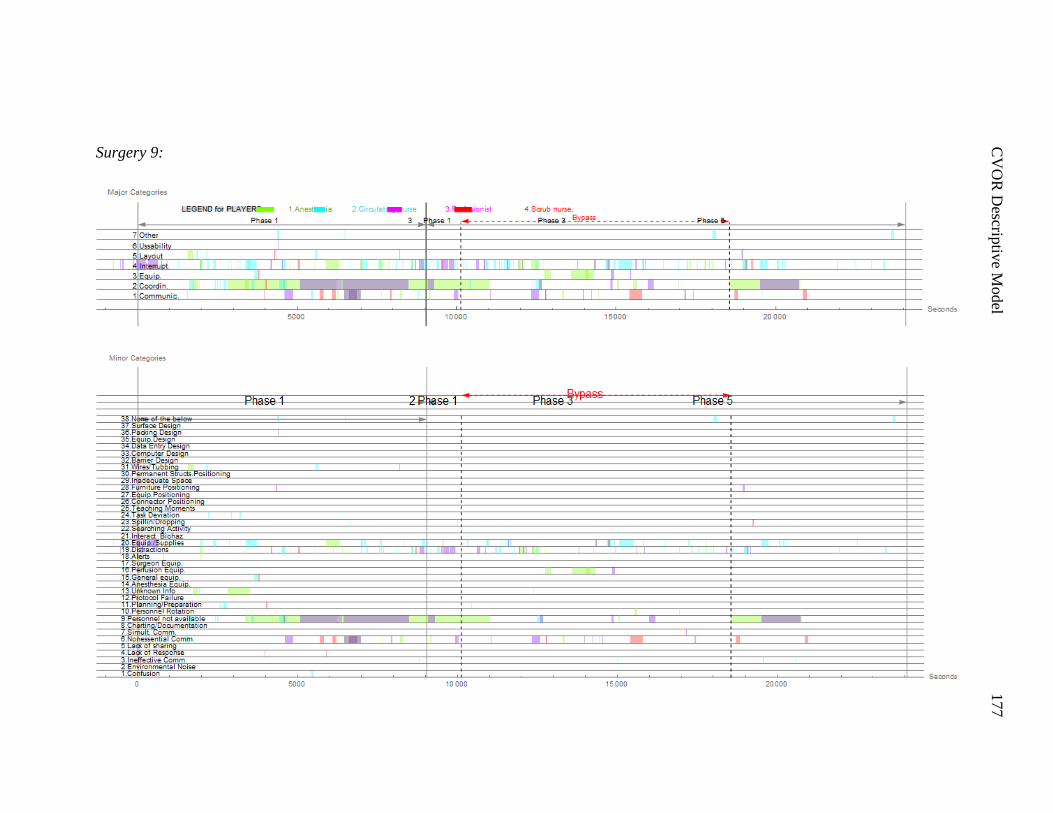
C
VO
R D
escriptiv
e Model
177
Surgery 9:
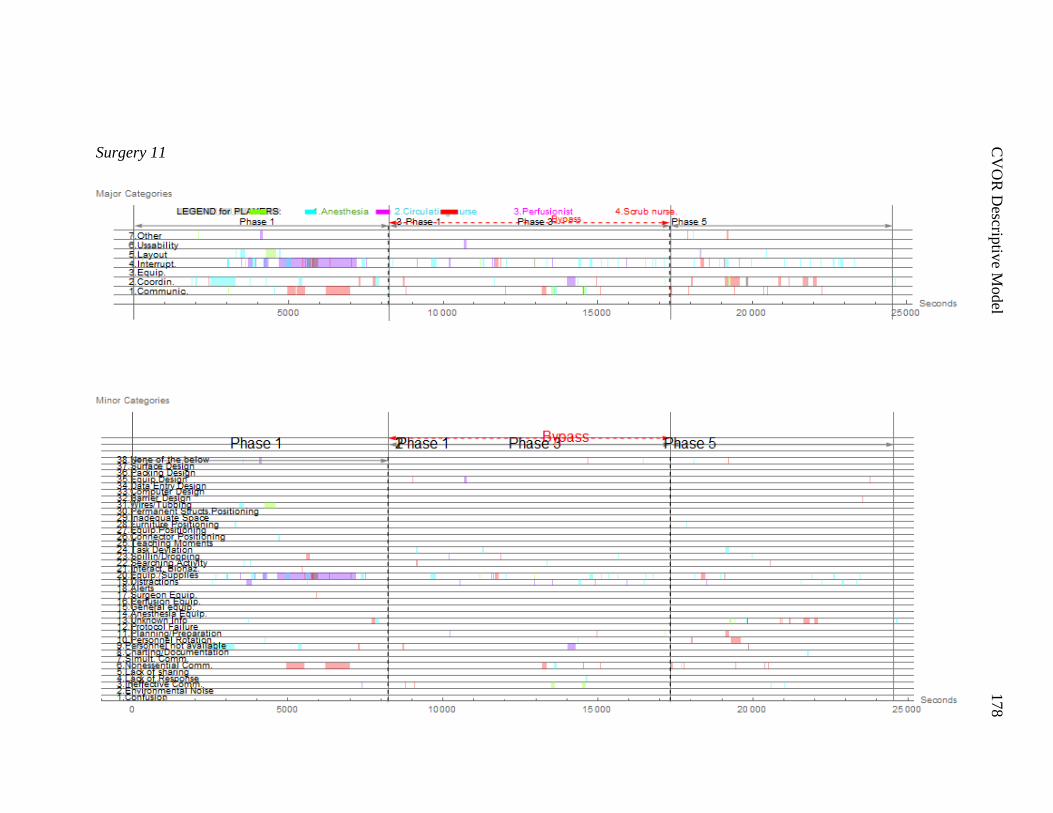
C
VO
R D
escriptiv
e Model
178
Surgery 11
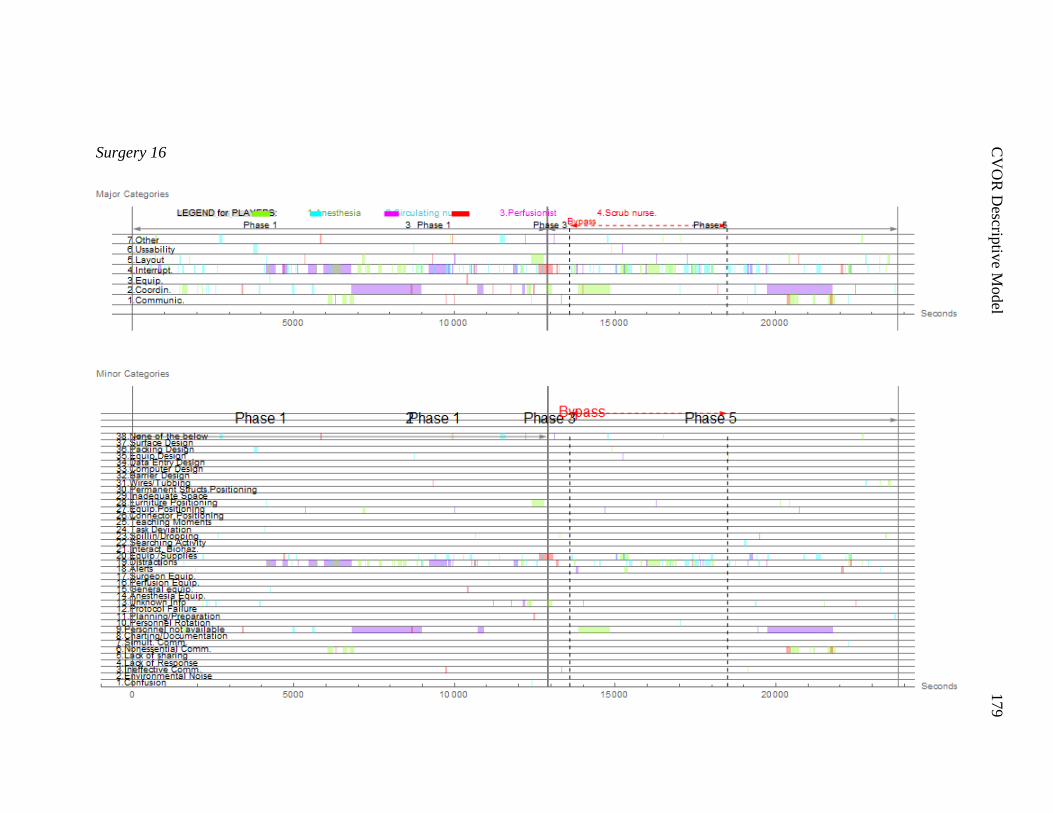
C
VO
R D
escriptiv
e Model
179
Surgery 16
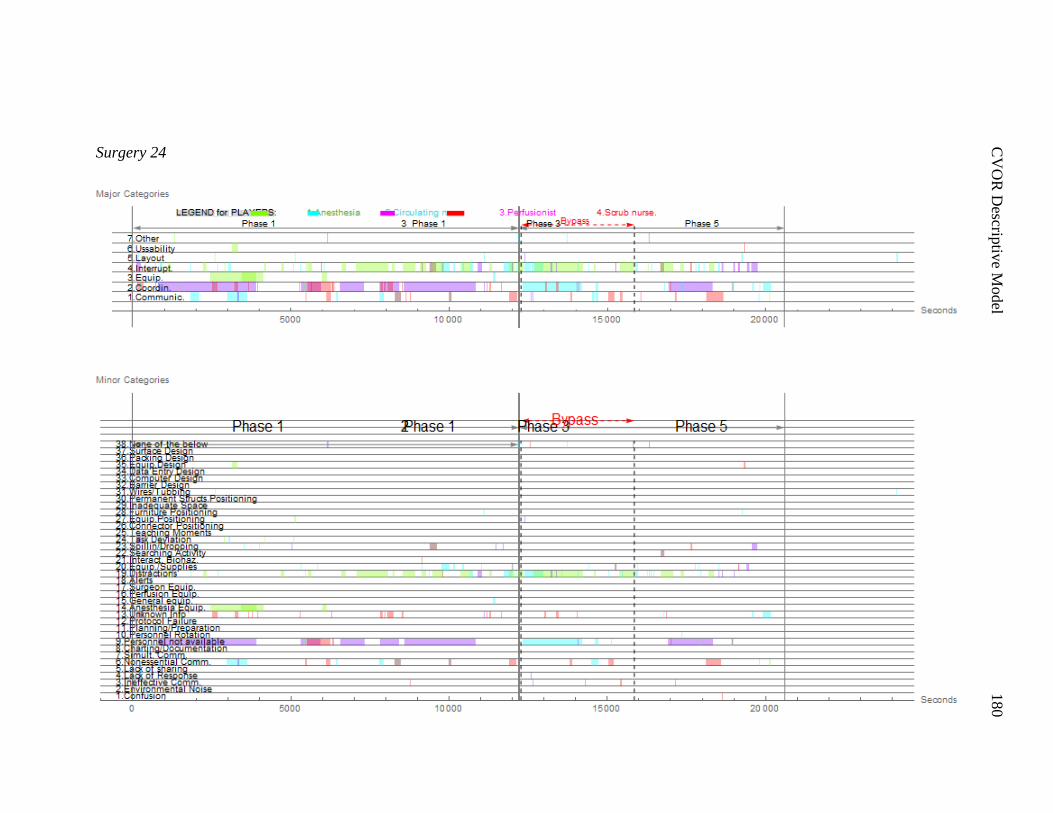
C
VO
R D
escriptiv
e Model
180
Surgery 24
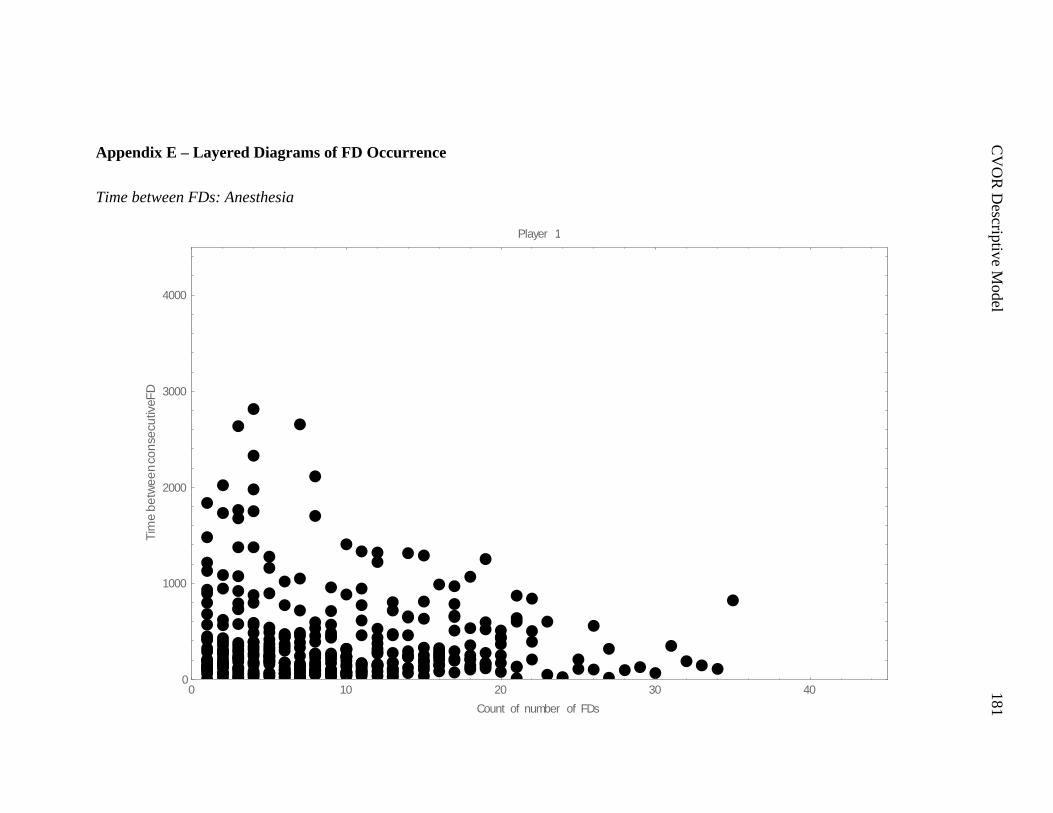
C
VO
R D
escriptiv
e Model
181
Appendix E – Layered Diagrams of FD Occurrence
Time between FDs: Anesthesia
0 10 20 30 400
1000
2000
3000
4000
Count of number of FDs
Tim
eb
etw
ee
nco
nse
cu
tiveF
D
Player 1
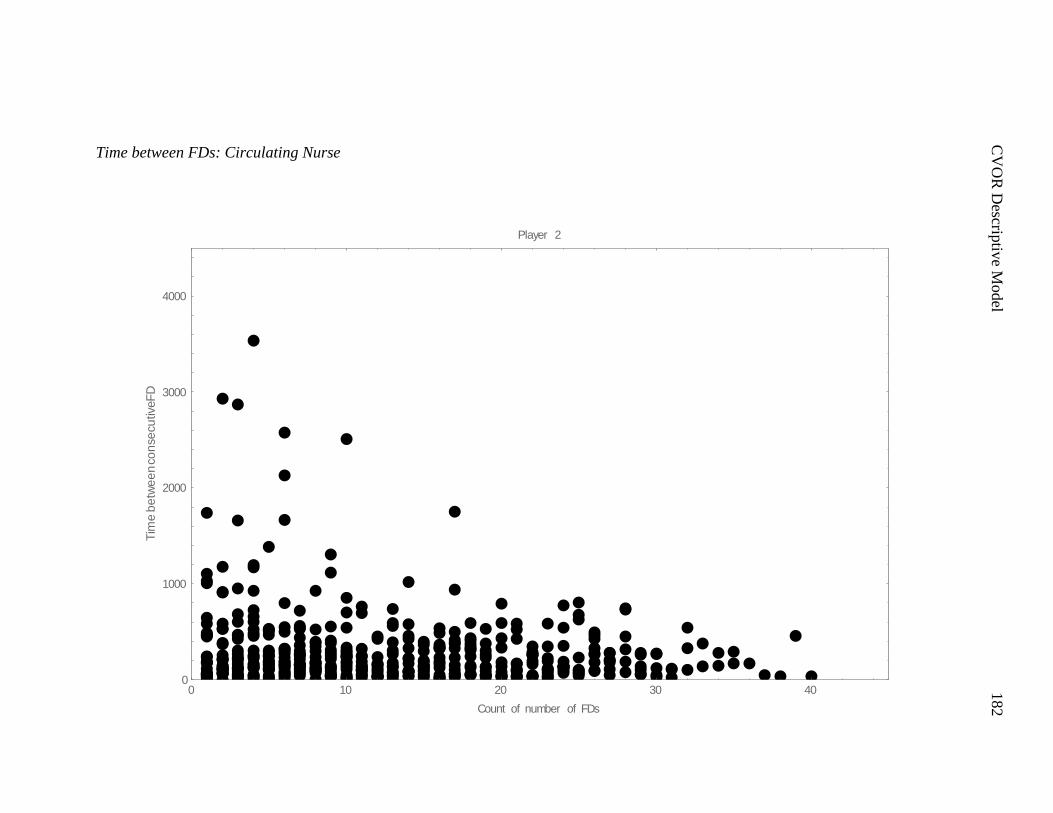
C
VO
R D
escriptiv
e Model
182
Time between FDs: Circulating Nurse
0 10 20 30 400
1000
2000
3000
4000
Count of number of FDs
Tim
eb
etw
ee
nco
nse
cu
tiveF
D
Player 2
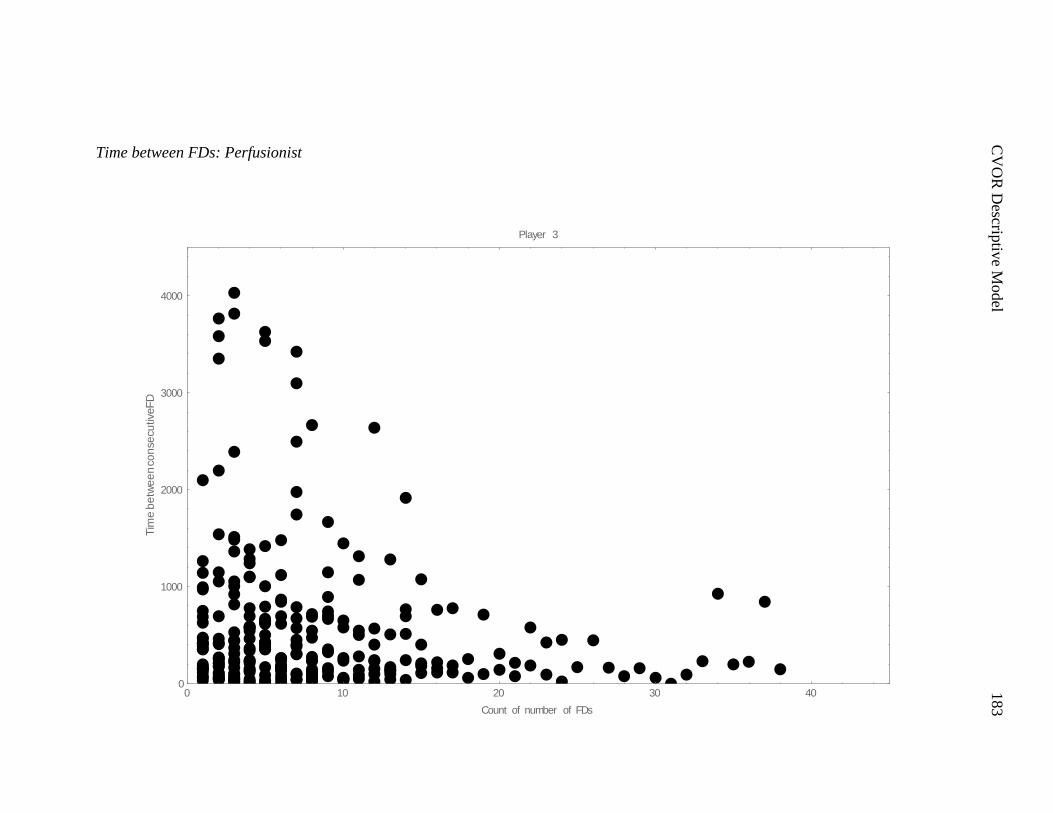
C
VO
R D
escriptiv
e Model
183
Time between FDs: Perfusionist
0 10 20 30 400
1000
2000
3000
4000
Count of number of FDs
Tim
eb
etw
ee
nco
nse
cu
tiveF
D
Player 3
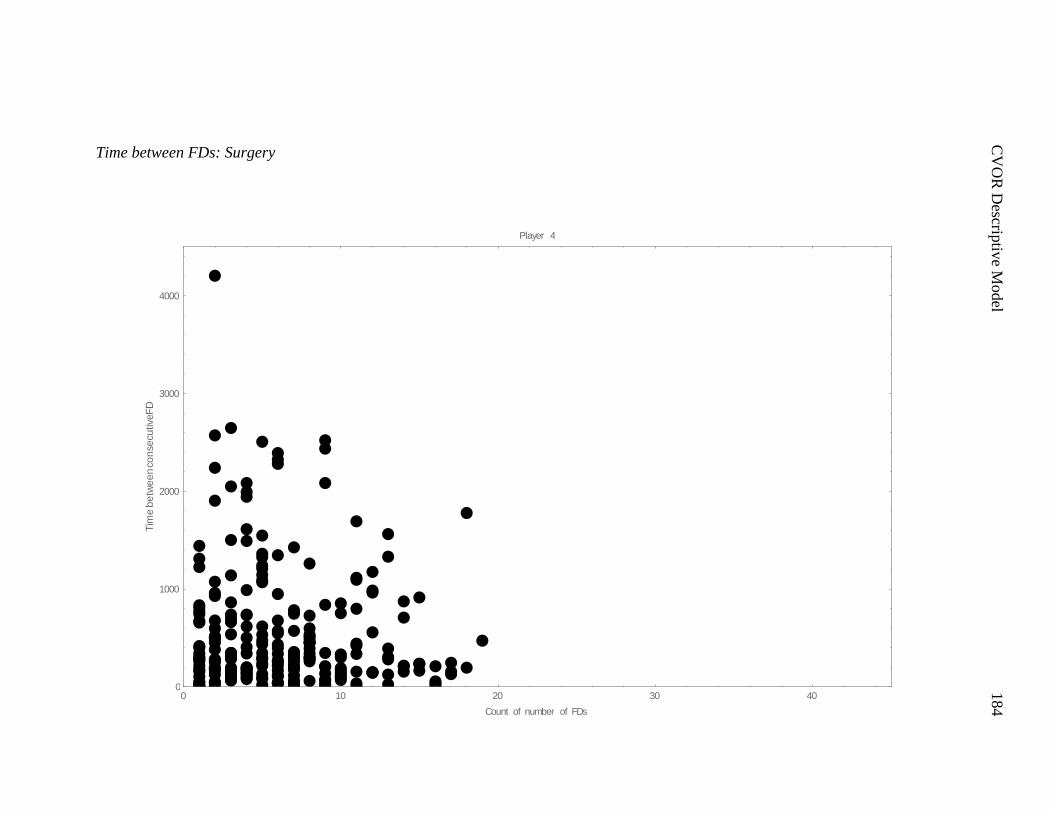
C
VO
R D
escriptiv
e Model
184
Time between FDs: Surgery
0 10 20 30 400
1000
2000
3000
4000
Count of number of FDs
Tim
eb
etw
ee
nco
nse
cu
tiveF
D
Player 4

C
VO
R D
escriptiv
e Model
185
Length of FDs: Anesthesia
0 10 20 30 400
1000
2000
3000
4000
Count of number of FDs
Du
ratio
nF
D
Player 1
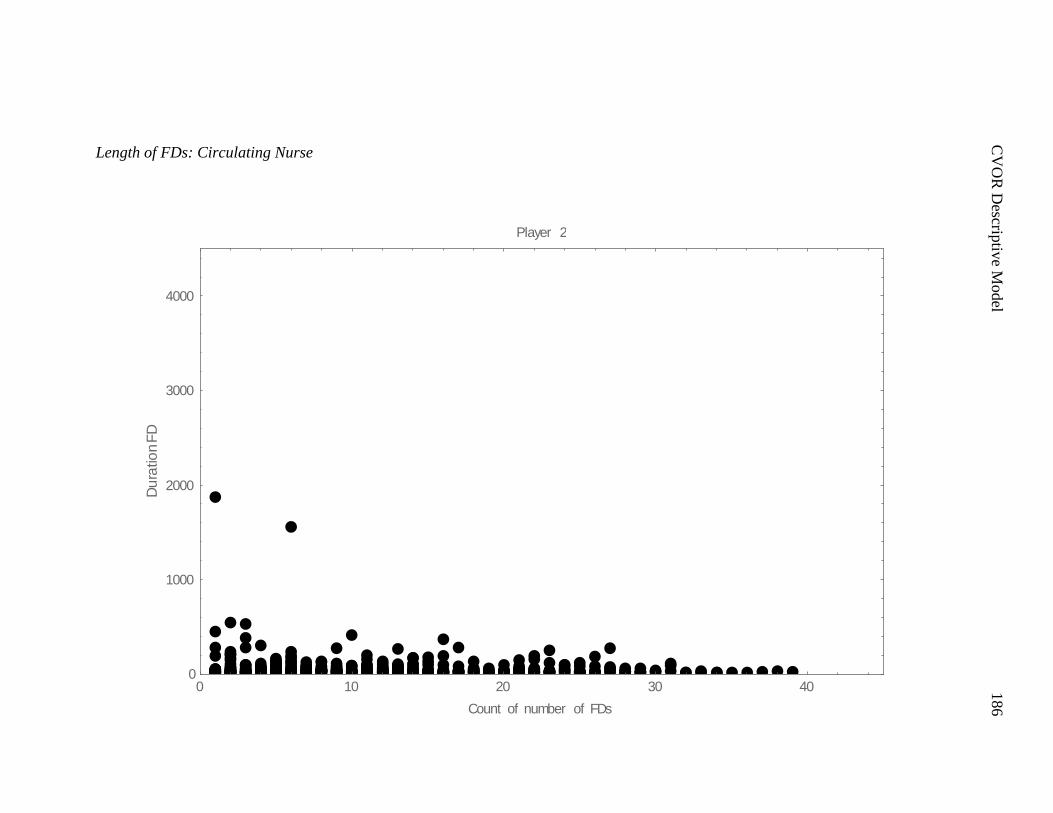
C
VO
R D
escriptiv
e Model
186
Length of FDs: Circulating Nurse
0 10 20 30 400
1000
2000
3000
4000
Count of number of FDs
Du
ratio
nF
D
Player 2
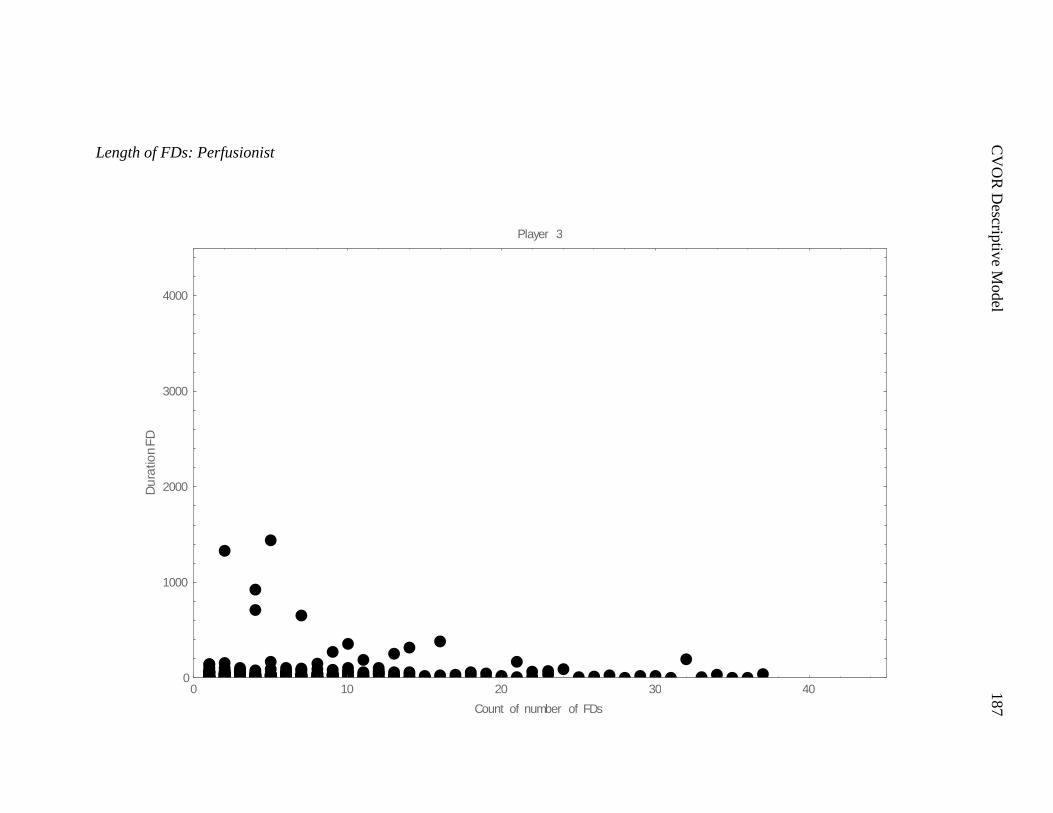
C
VO
R D
escriptiv
e Model
187
Length of FDs: Perfusionist
0 10 20 30 400
1000
2000
3000
4000
Count of number of FDs
Du
ratio
nF
D
Player 3
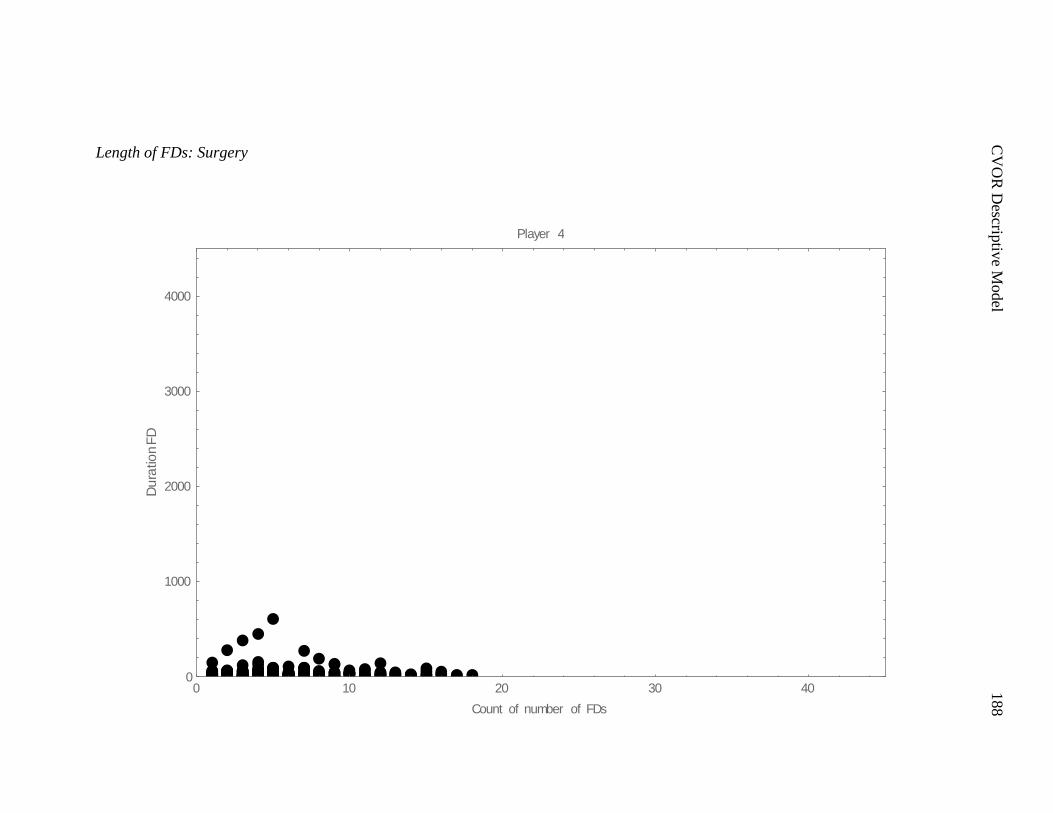
C
VO
R D
escriptiv
e Model
188
Length of FDs: Surgery
0 10 20 30 400
1000
2000
3000
4000
Count of number of FDs
Du
ratio
nF
D
Player 4
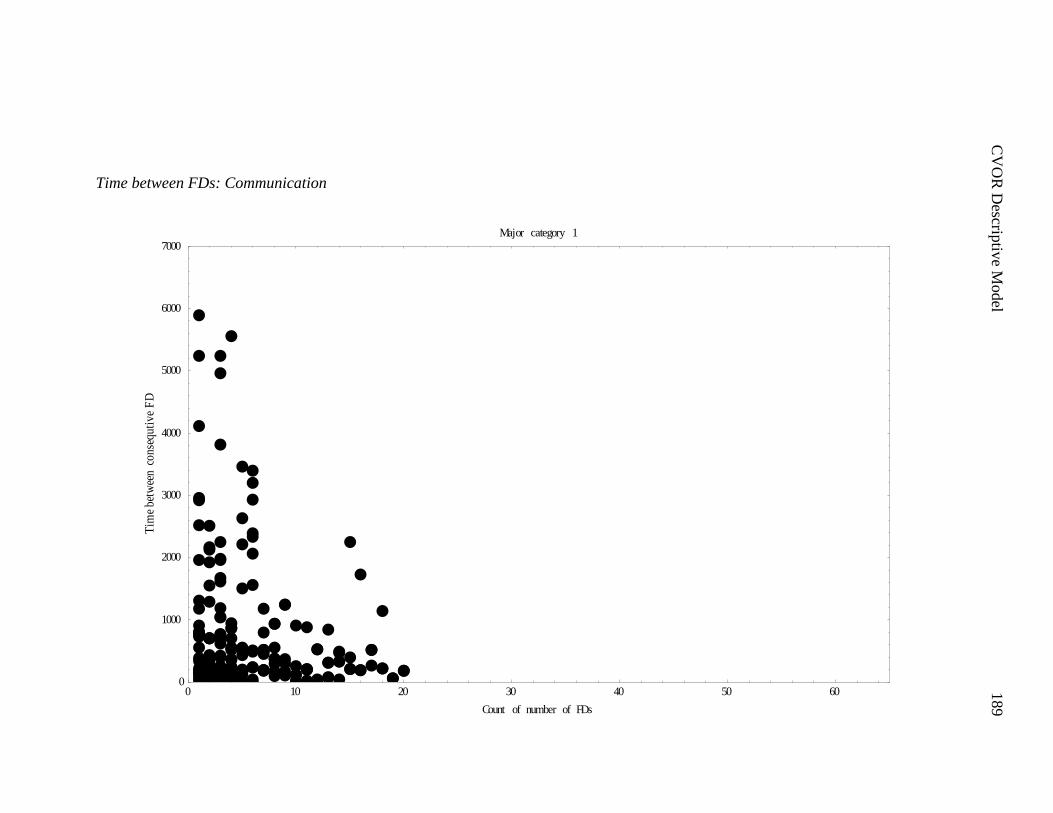
C
VO
R D
escriptiv
e Model
189
Time between FDs: Communication
0 10 20 30 40 50 600
1000
2000
3000
4000
5000
6000
7000
Count of number of FDs
Tim
ebe
twee
nco
nseq
utiv
eF
D
Major category 1

C
VO
R D
escriptiv
e Model
190
Time between FDs: Coordination
0 10 20 30 40 50 600
1000
2000
3000
4000
5000
6000
7000
Count of number of FDs
Tim
ebe
twee
nco
nseq
utiv
eF
D
Major category 2
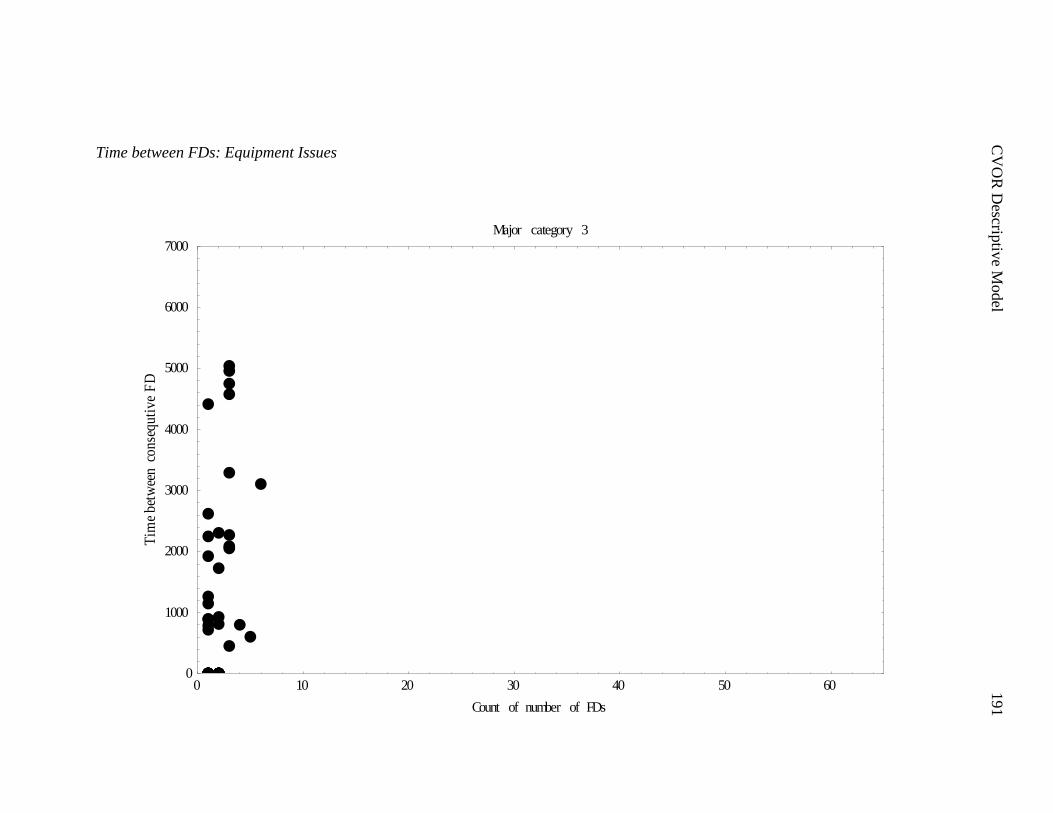
C
VO
R D
escriptiv
e Model
191
Time between FDs: Equipment Issues
0 10 20 30 40 50 600
1000
2000
3000
4000
5000
6000
7000
Count of number of FDs
Tim
ebe
twee
nco
nseq
utiv
eF
D
Major category 3
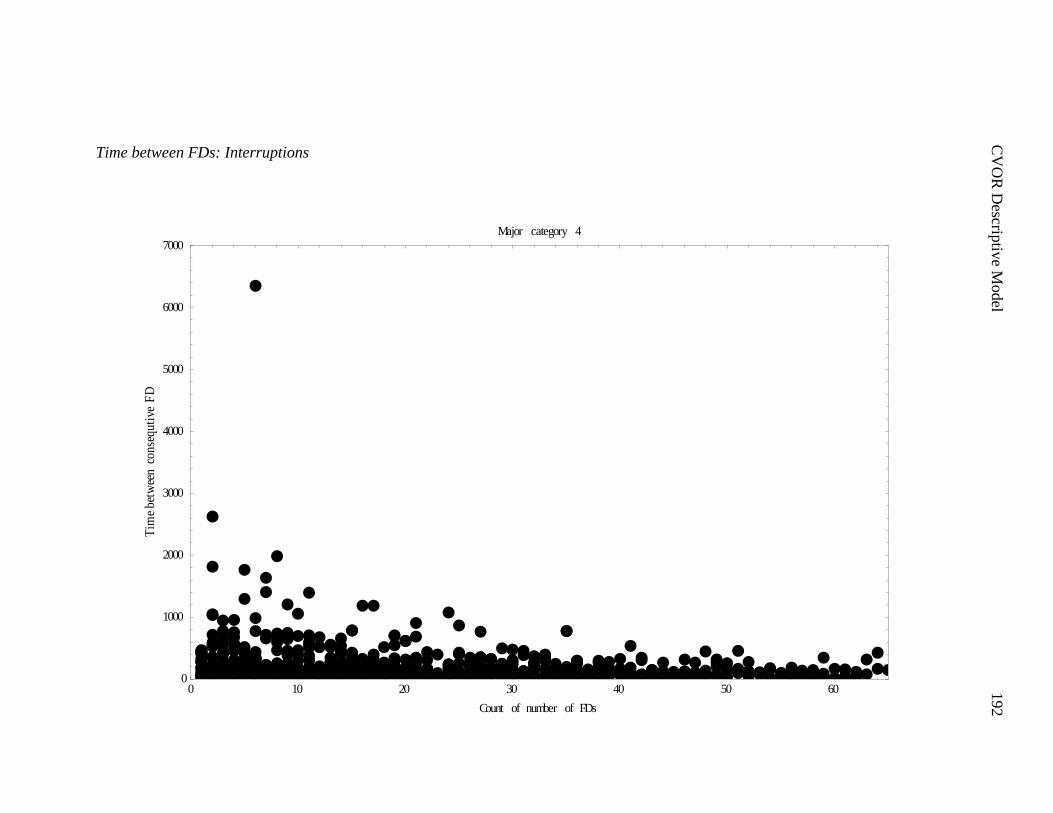
C
VO
R D
escriptiv
e Model
192
Time between FDs: Interruptions
0 10 20 30 40 50 600
1000
2000
3000
4000
5000
6000
7000
Count of number of FDs
Tim
ebe
twee
nco
nseq
utiv
eF
D
Major category 4
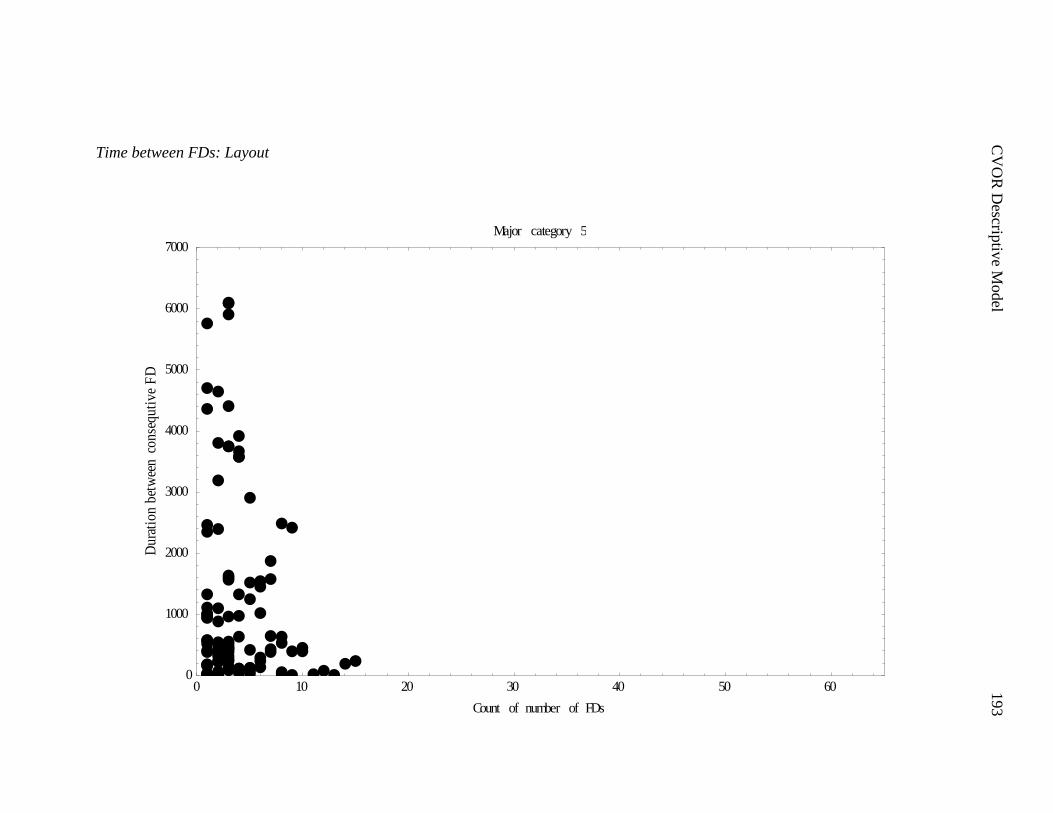
C
VO
R D
escriptiv
e Model
193
Time between FDs: Layout
0 10 20 30 40 50 600
1000
2000
3000
4000
5000
6000
7000
Count of number of FDs
Dur
atio
nbe
twee
nco
nseq
utiv
eF
D
Major category 5
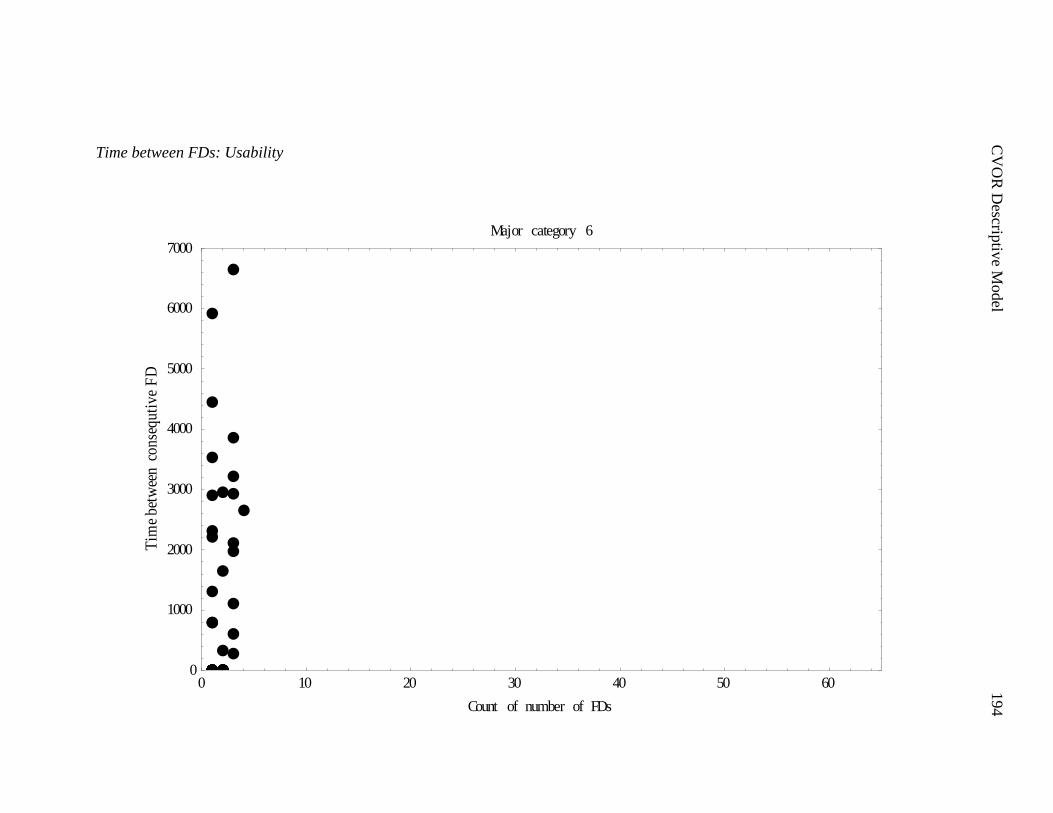
C
VO
R D
escriptiv
e Model
194
Time between FDs: Usability
0 10 20 30 40 50 600
1000
2000
3000
4000
5000
6000
7000
Count of number of FDs
Tim
ebe
twee
nco
nseq
utiv
eF
D
Major category 6
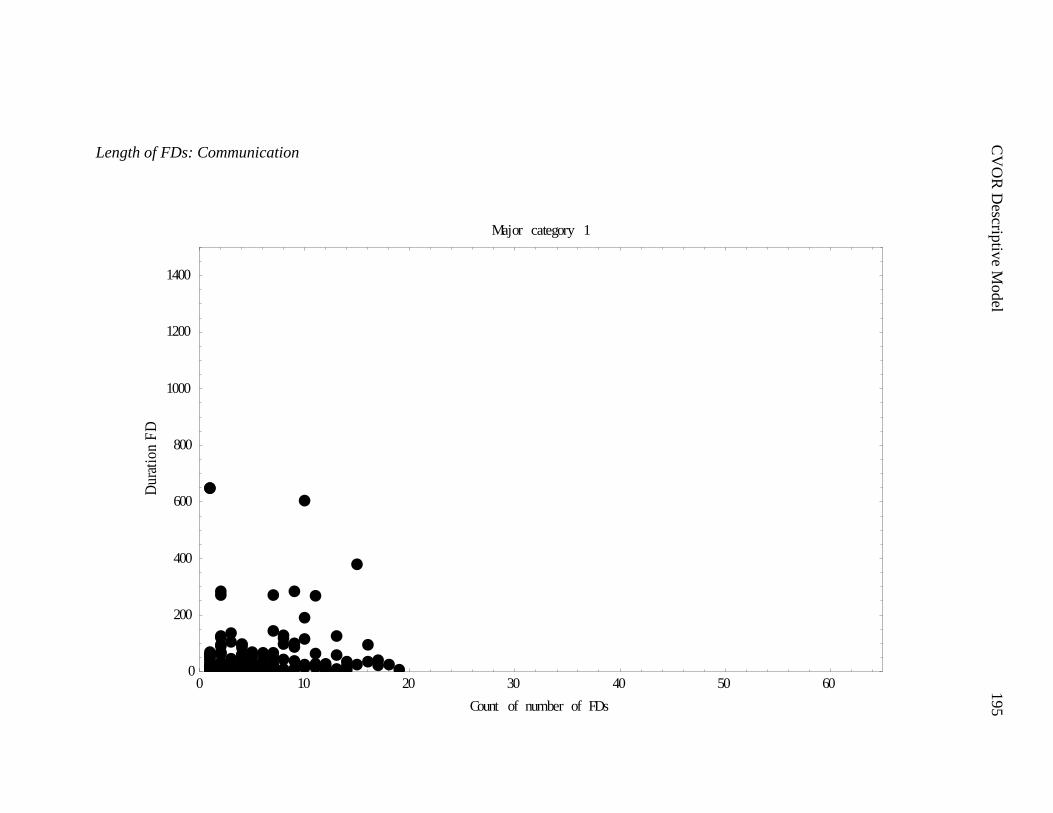
C
VO
R D
escriptiv
e Model
195
Length of FDs: Communication
0 10 20 30 40 50 600
200
400
600
800
1000
1200
1400
Count of number of FDs
Dur
atio
nF
D
Major category 1
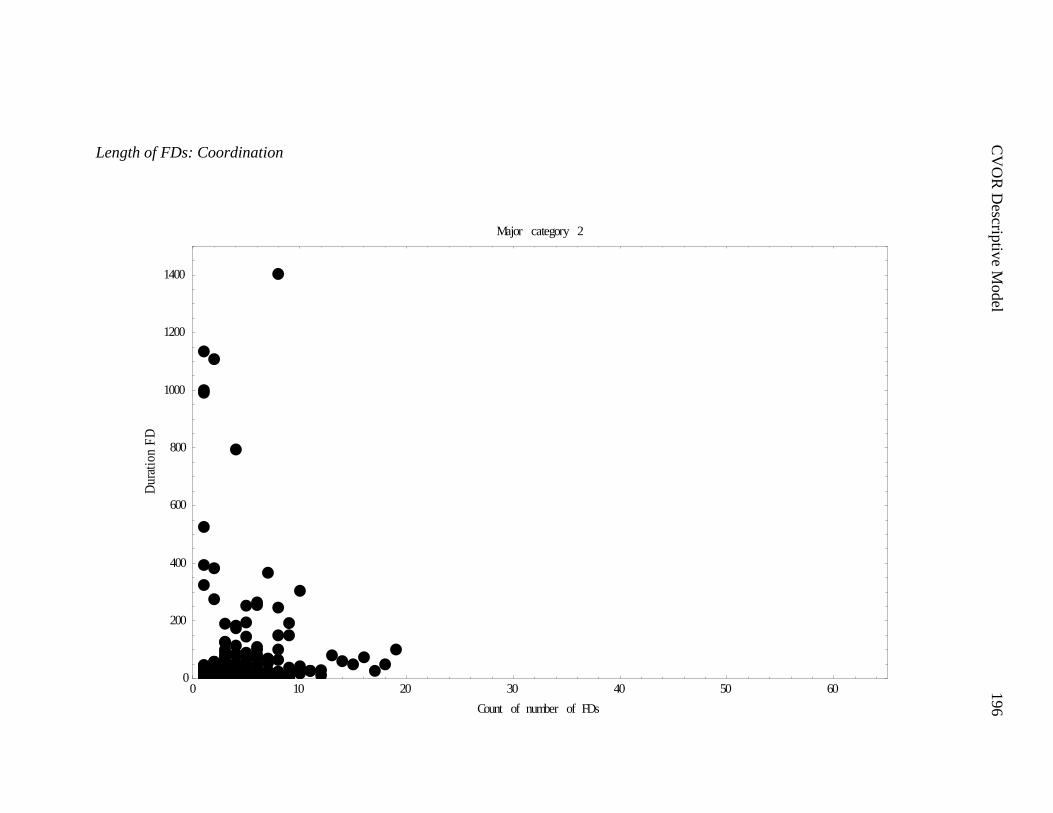
C
VO
R D
escriptiv
e Model
196
Length of FDs: Coordination
0 10 20 30 40 50 600
200
400
600
800
1000
1200
1400
Count of number of FDs
Dur
atio
nF
D
Major category 2
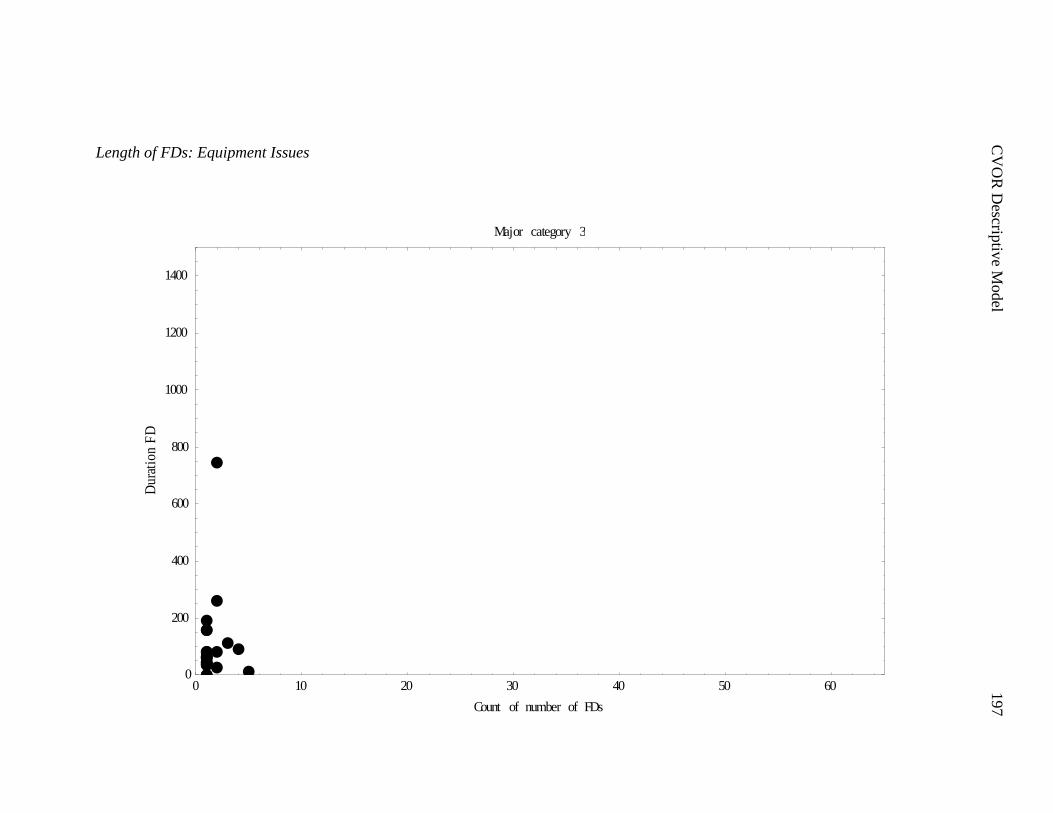
C
VO
R D
escriptiv
e Model
197
Length of FDs: Equipment Issues
0 10 20 30 40 50 600
200
400
600
800
1000
1200
1400
Count of number of FDs
Dur
atio
nF
D
Major category 3
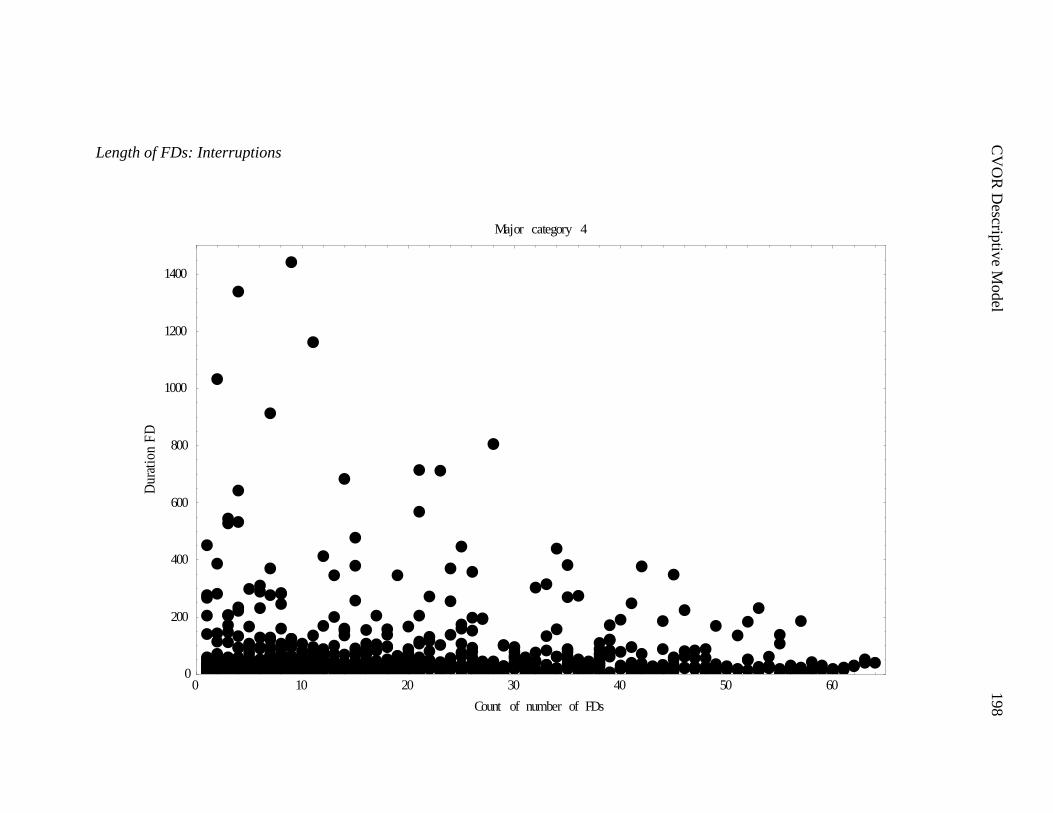
C
VO
R D
escriptiv
e Model
198
Length of FDs: Interruptions
0 10 20 30 40 50 600
200
400
600
800
1000
1200
1400
Count of number of FDs
Dur
atio
nF
D
Major category 4
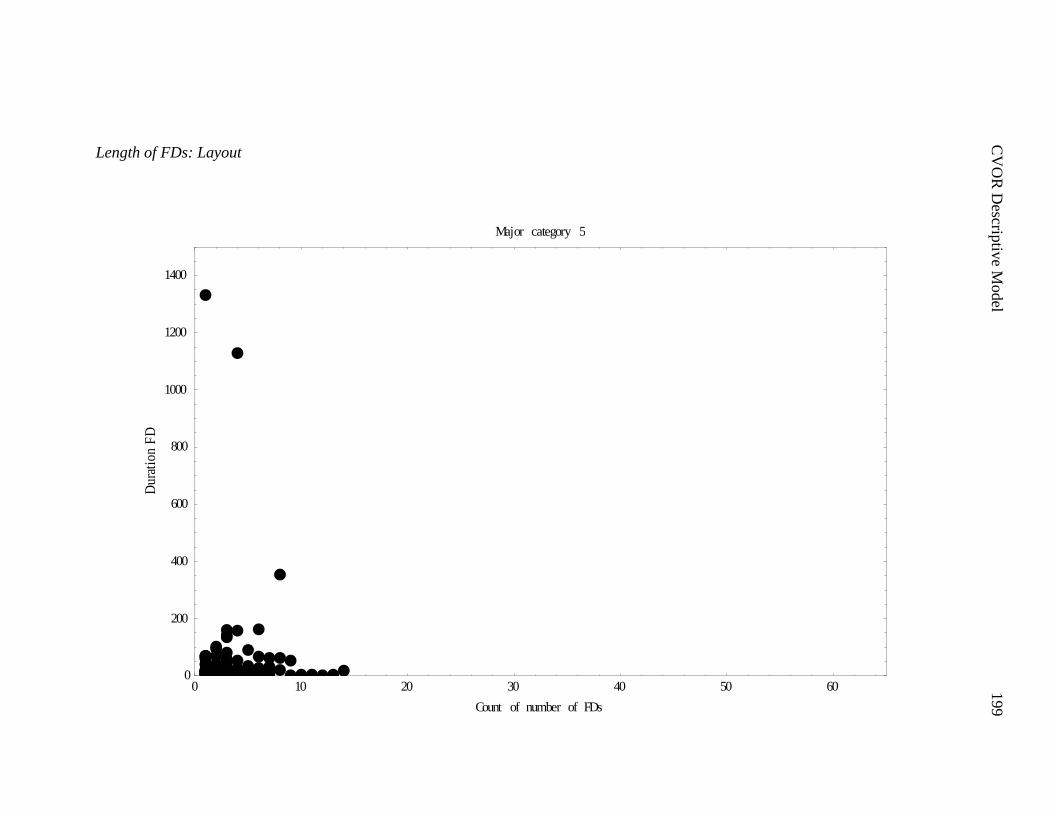
C
VO
R D
escriptiv
e Model
199
Length of FDs: Layout
0 10 20 30 40 50 600
200
400
600
800
1000
1200
1400
Count of number of FDs
Dur
atio
nF
D
Major category 5
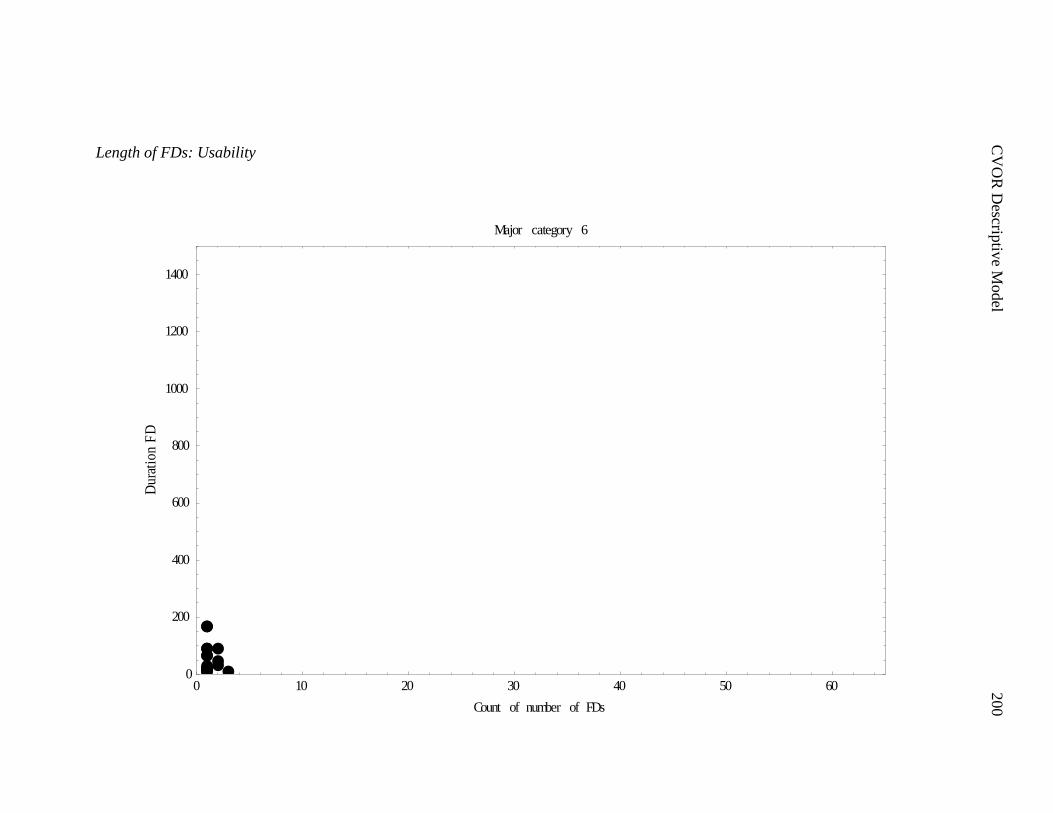
C
VO
R D
escriptiv
e Model
200
Length of FDs: Usability
0 10 20 30 40 50 600
200
400
600
800
1000
1200
1400
Count of number of FDs
Dur
atio
nF
D
Major category 6
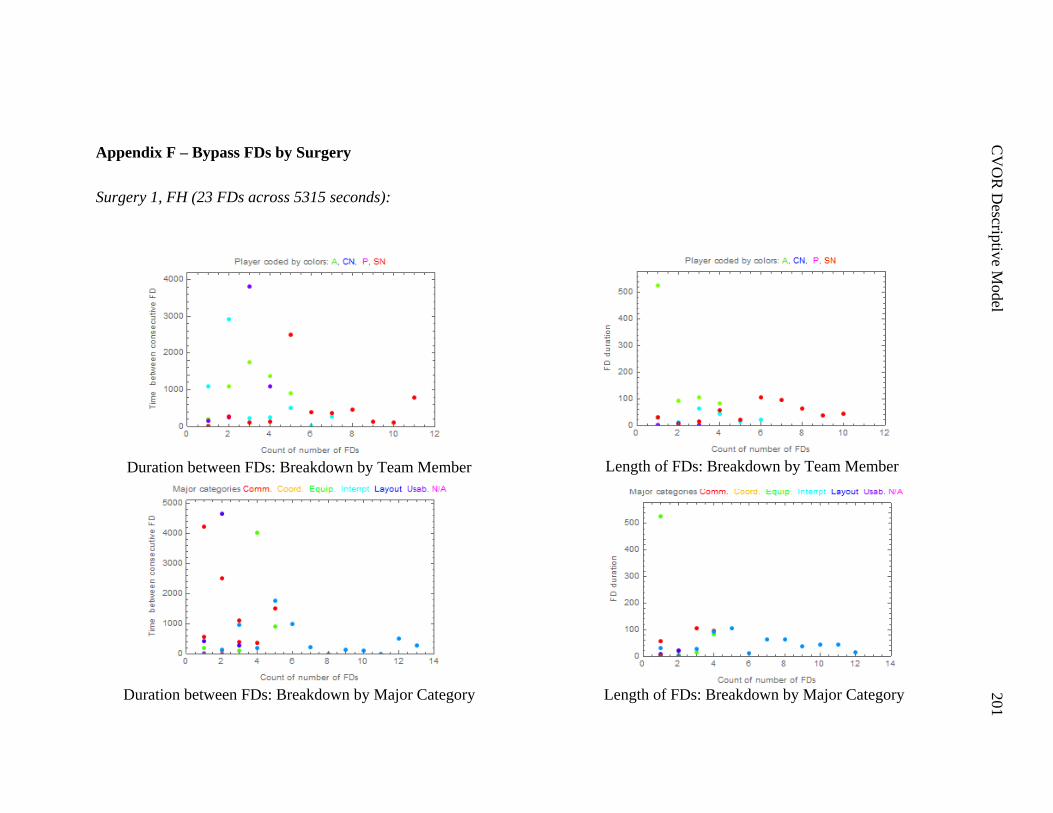
C
VO
R D
escriptiv
e Model
201
Appendix F – Bypass FDs by Surgery
Surgery 1, FH (23 FDs across 5315 seconds):
Duration between FDs: Breakdown by Team Member
Duration between FDs: Breakdown by Major Category
Length of FDs: Breakdown by Major Category
Length of FDs: Breakdown by Team Member
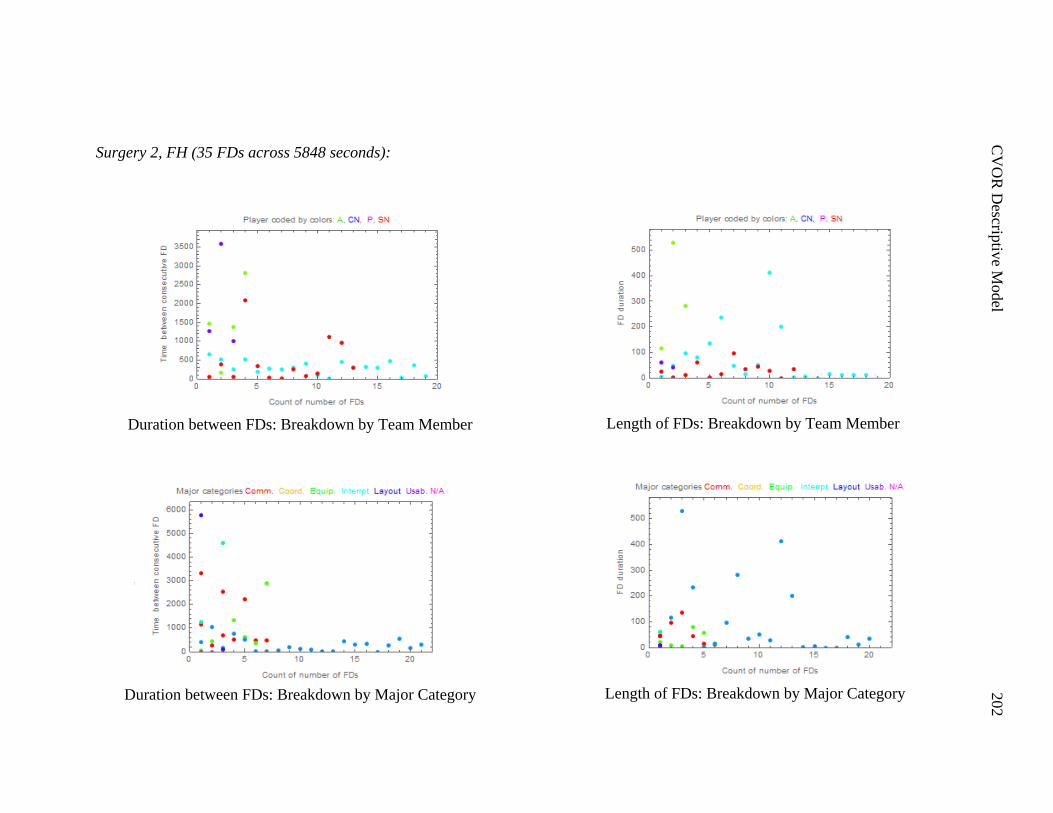
C
VO
R D
escriptiv
e Model
202
Surgery 2, FH (35 FDs across 5848 seconds):
Duration between FDs: Breakdown by Team Member
Duration between FDs: Breakdown by Major Category
Length of FDs: Breakdown by Major Category
Length of FDs: Breakdown by Team Member
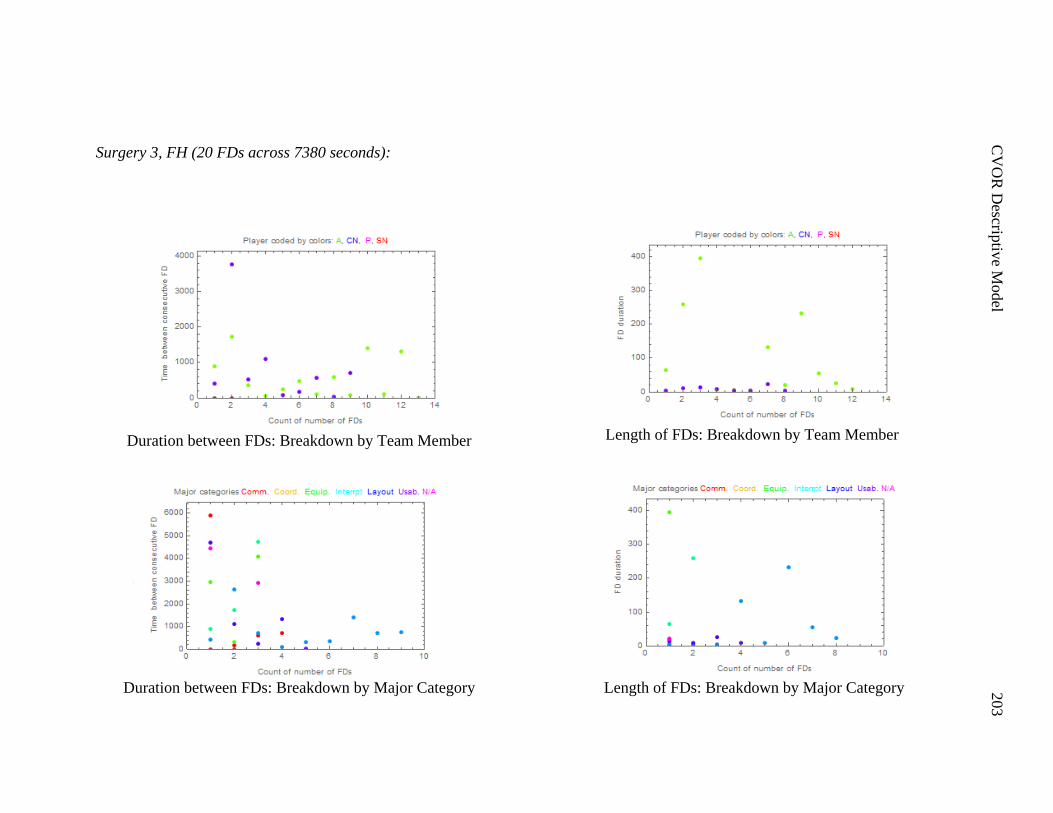
C
VO
R D
escriptiv
e Model
203
Surgery 3, FH (20 FDs across 7380 seconds):
Duration between FDs: Breakdown by Team Member
Duration between FDs: Breakdown by Major Category
Length of FDs: Breakdown by Major Category
Length of FDs: Breakdown by Team Member
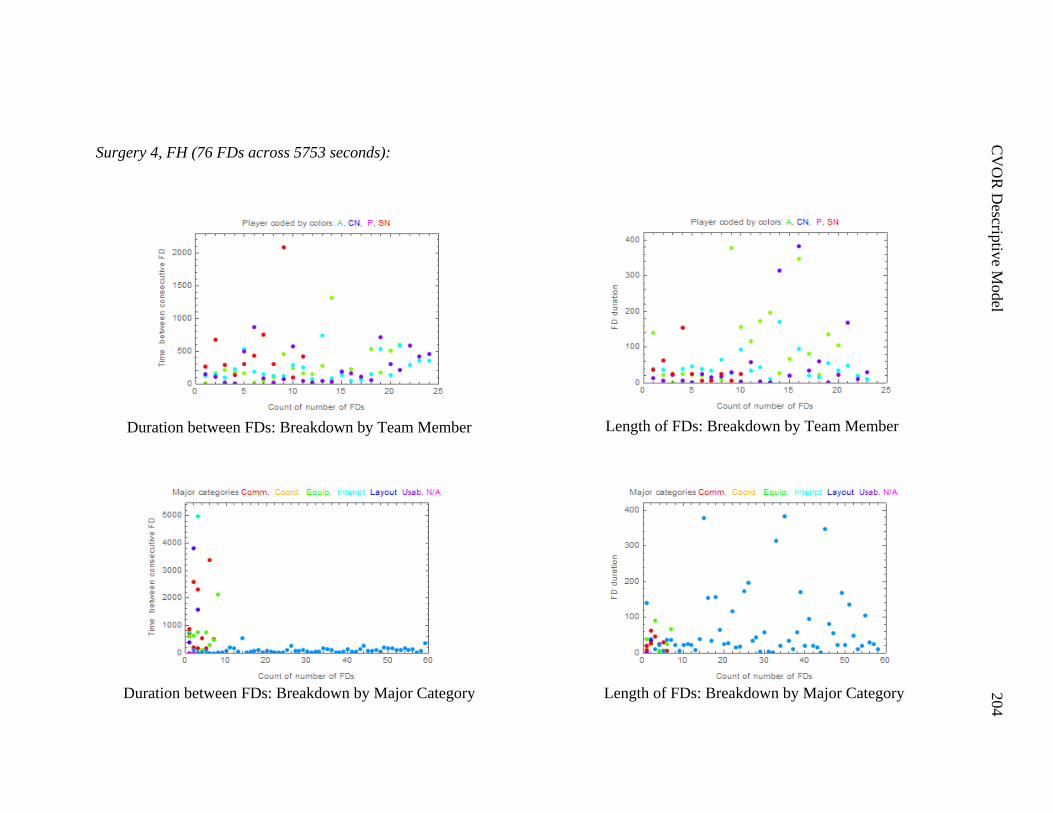
C
VO
R D
escriptiv
e Model
204
Surgery 4, FH (76 FDs across 5753 seconds):
Duration between FDs: Breakdown by Team Member
Duration between FDs: Breakdown by Major Category
Length of FDs: Breakdown by Major Category
Length of FDs: Breakdown by Team Member
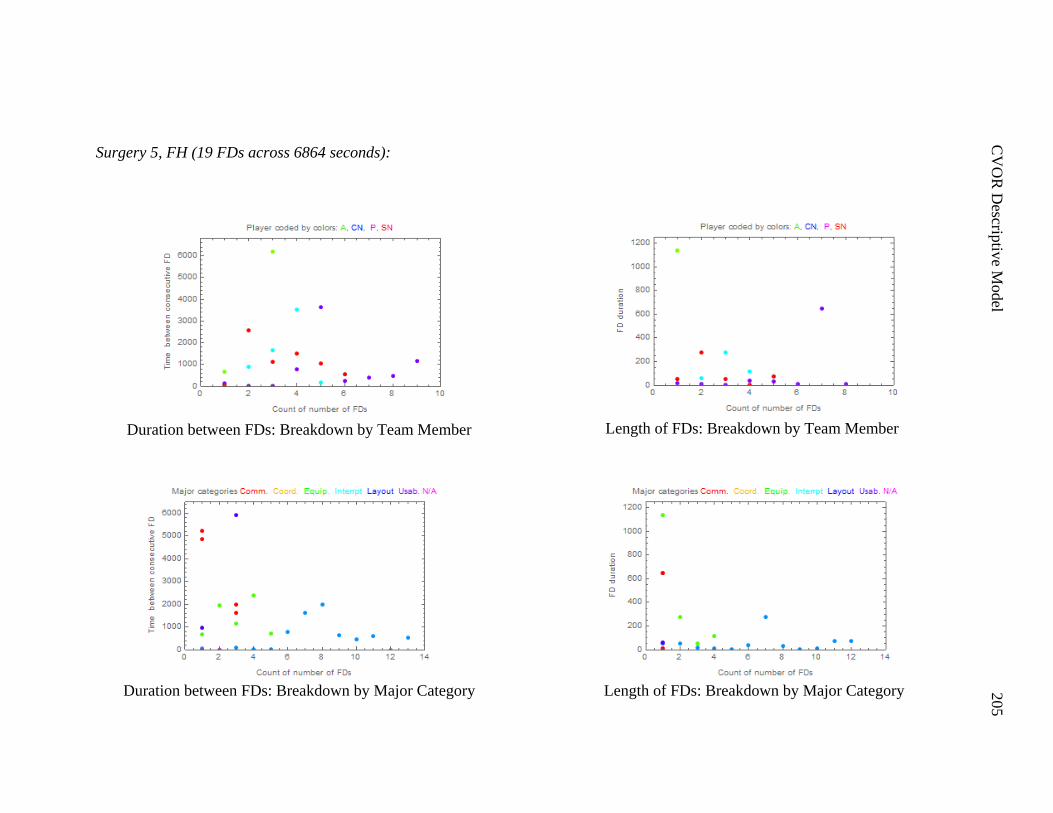
C
VO
R D
escriptiv
e Model
205
Surgery 5, FH (19 FDs across 6864 seconds):
Duration between FDs: Breakdown by Team Member
Duration between FDs: Breakdown by Major Category
Length of FDs: Breakdown by Major Category
Length of FDs: Breakdown by Team Member

C
VO
R D
escriptiv
e Model
206
Surgery 6, FH (12 FDs across 7976 seconds):
Duration between FDs: Breakdown by Team Member
Duration between FDs: Breakdown by Major Category
Length of FDs: Breakdown by Major Category
Length of FDs: Breakdown by Team Member
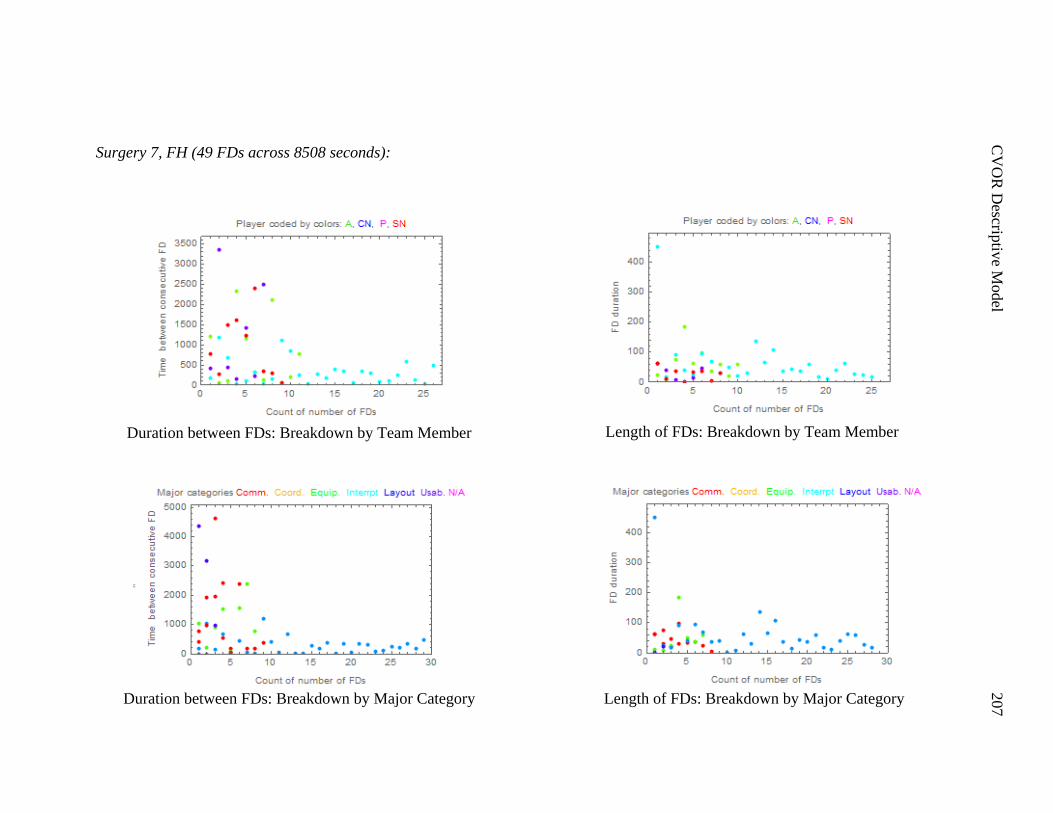
C
VO
R D
escriptiv
e Model
207
Surgery 7, FH (49 FDs across 8508 seconds):
Duration between FDs: Breakdown by Team Member
Duration between FDs: Breakdown by Major Category
Length of FDs: Breakdown by Major Category
Length of FDs: Breakdown by Team Member
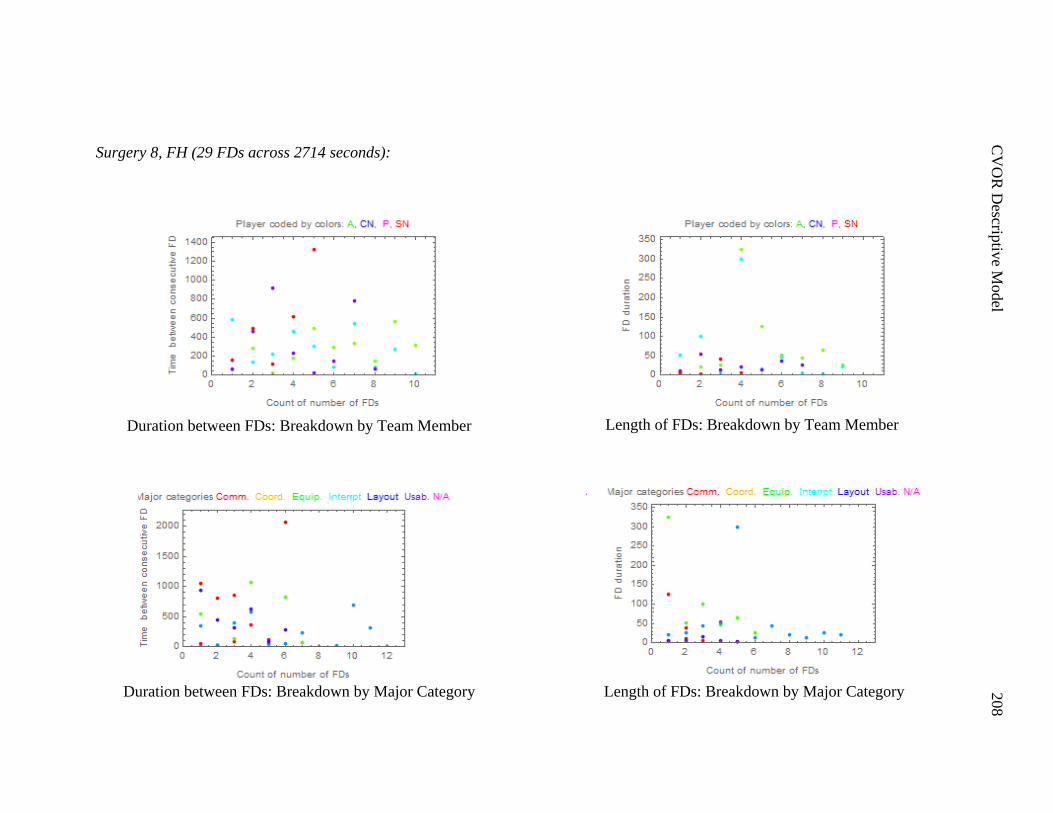
C
VO
R D
escriptiv
e Model
208
Surgery 8, FH (29 FDs across 2714 seconds):
Duration between FDs: Breakdown by Team Member
Duration between FDs: Breakdown by Major Category
Length of FDs: Breakdown by Major Category
Length of FDs: Breakdown by Team Member
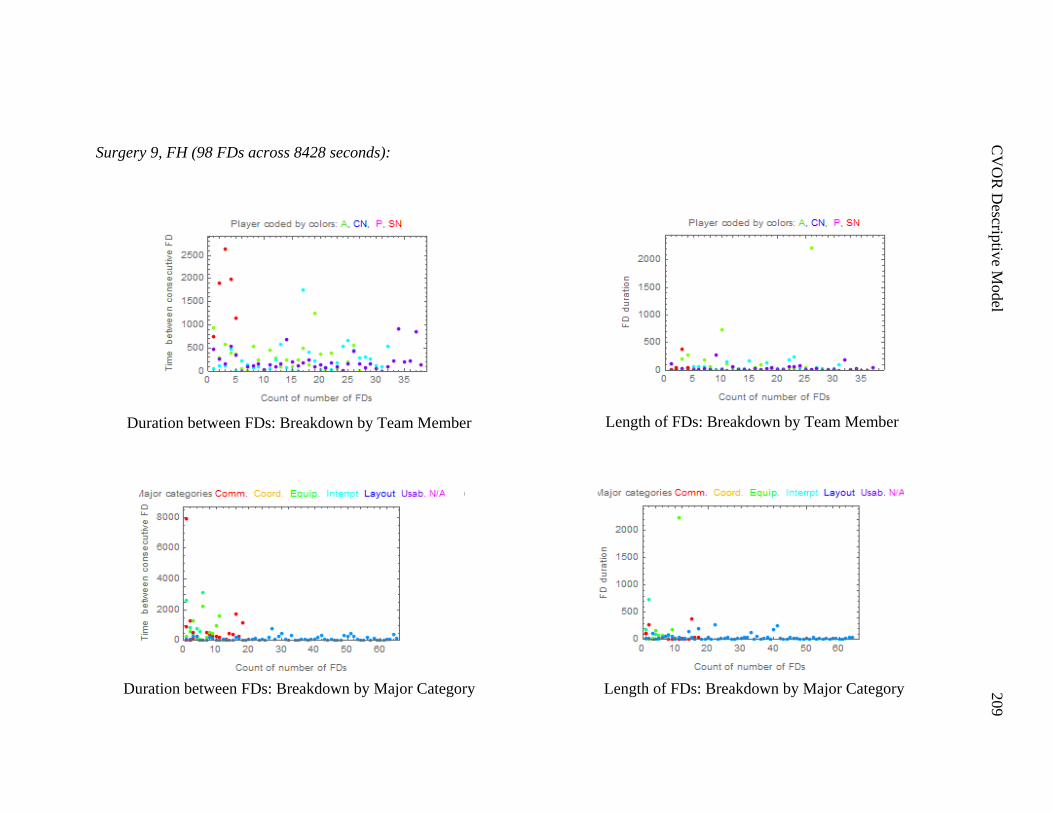
C
VO
R D
escriptiv
e Model
209
Surgery 9, FH (98 FDs across 8428 seconds):
Duration between FDs: Breakdown by Team Member
Duration between FDs: Breakdown by Major Category
Length of FDs: Breakdown by Major Category
Length of FDs: Breakdown by Team Member
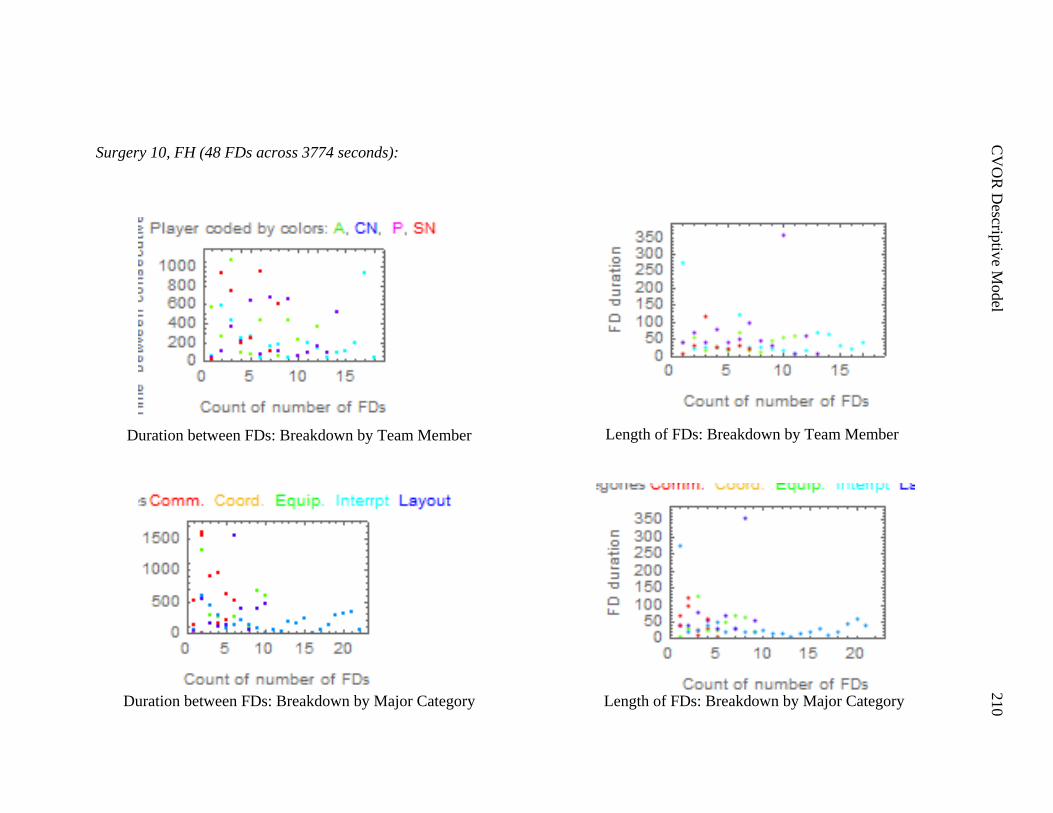
C
VO
R D
escriptiv
e Model
210
Surgery 10, FH (48 FDs across 3774 seconds):
Duration between FDs: Breakdown by Team Member
Duration between FDs: Breakdown by Major Category
Length of FDs: Breakdown by Major Category
Length of FDs: Breakdown by Team Member
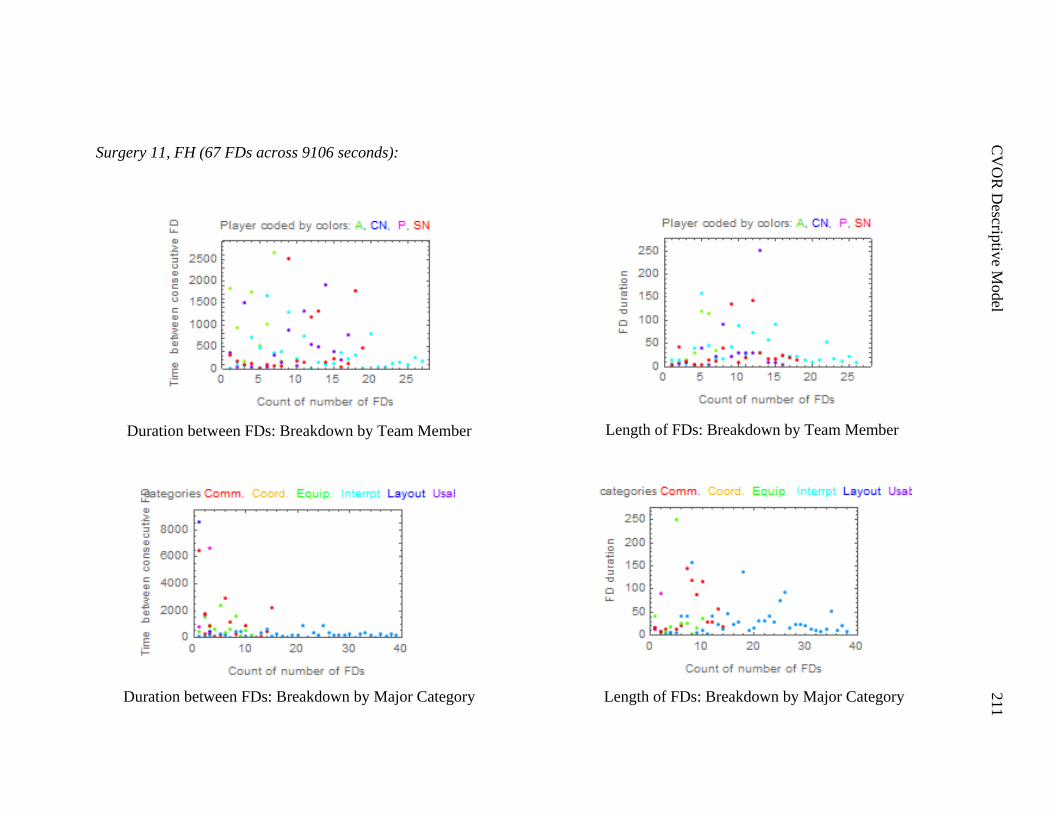
C
VO
R D
escriptiv
e Model
211
Surgery 11, FH (67 FDs across 9106 seconds):
Duration between FDs: Breakdown by Team Member
Duration between FDs: Breakdown by Major Category
Length of FDs: Breakdown by Major Category
Length of FDs: Breakdown by Team Member
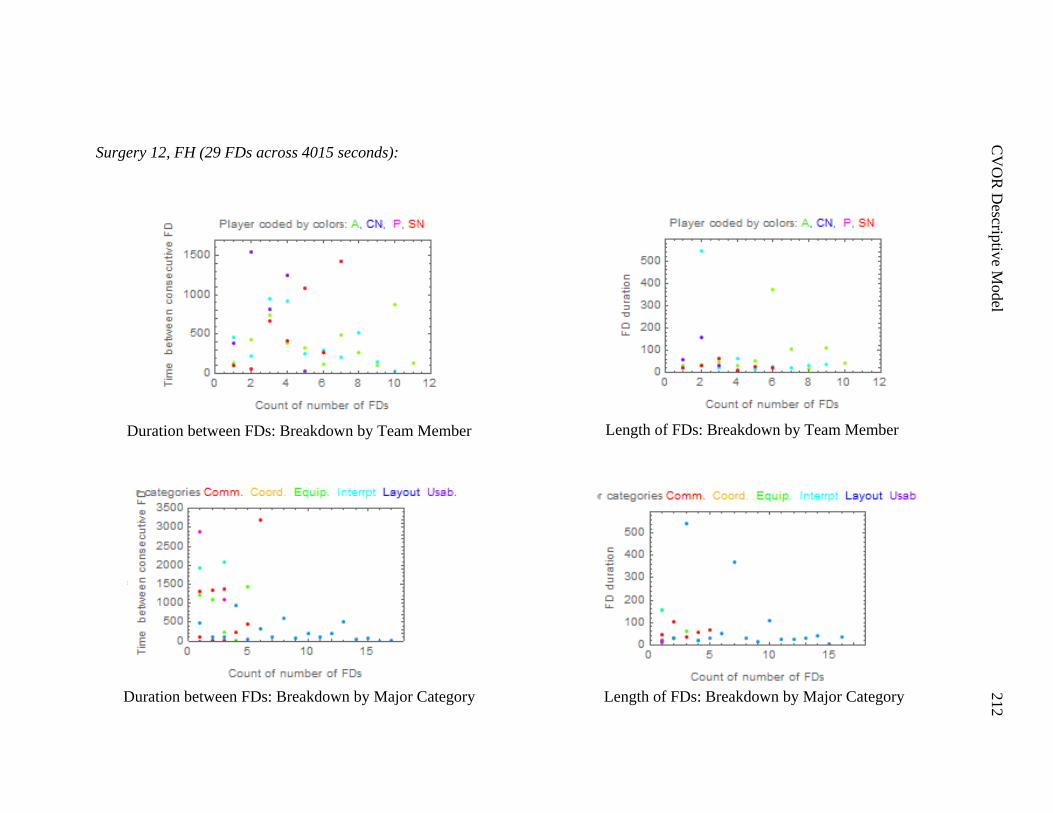
C
VO
R D
escriptiv
e Model
212
Surgery 12, FH (29 FDs across 4015 seconds):
Duration between FDs: Breakdown by Team Member
Duration between FDs: Breakdown by Major Category
Length of FDs: Breakdown by Major Category
Length of FDs: Breakdown by Team Member
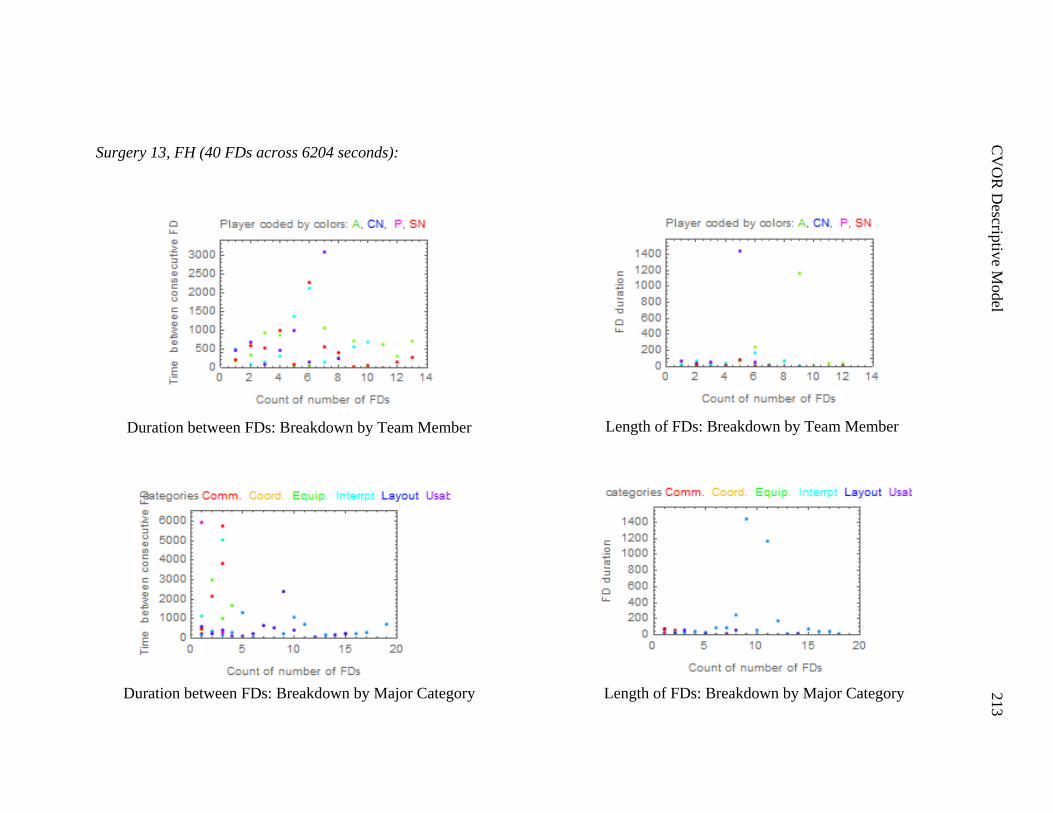
C
VO
R D
escriptiv
e Model
213
Surgery 13, FH (40 FDs across 6204 seconds):
Duration between FDs: Breakdown by Team Member
Duration between FDs: Breakdown by Major Category
Length of FDs: Breakdown by Major Category
Length of FDs: Breakdown by Team Member
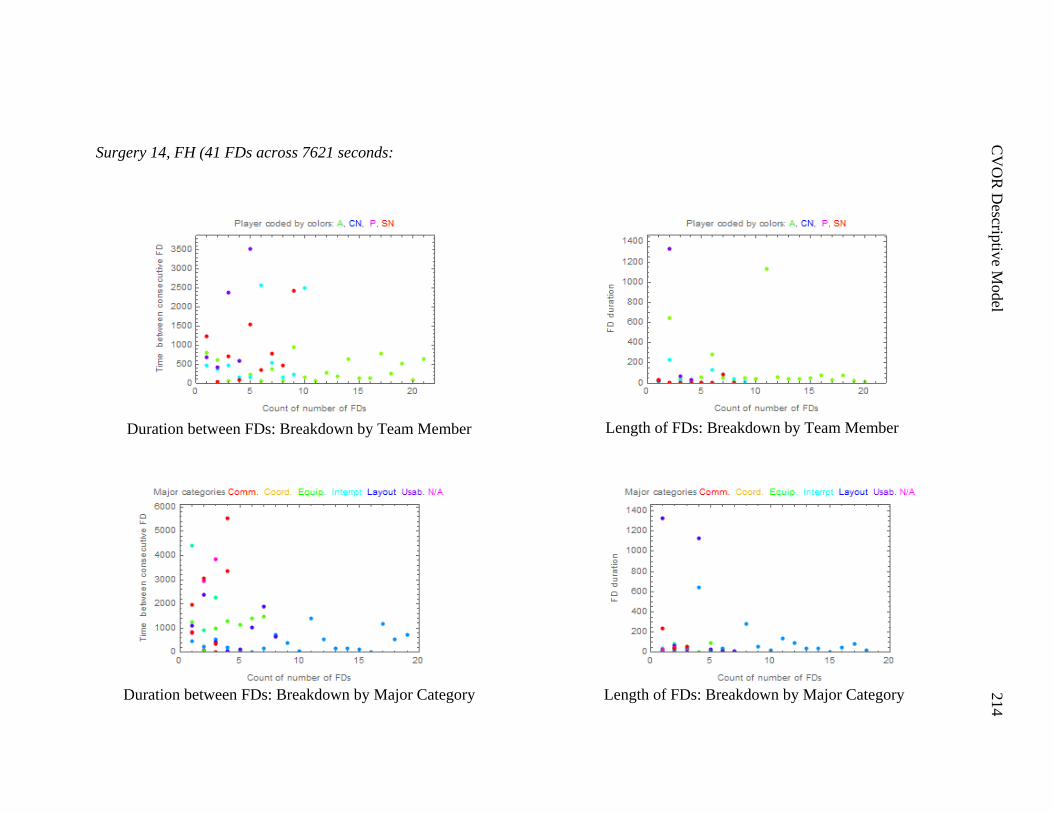
C
VO
R D
escriptiv
e Model
214
Surgery 14, FH (41 FDs across 7621 seconds:
Duration between FDs: Breakdown by Team Member
Duration between FDs: Breakdown by Major Category
Length of FDs: Breakdown by Major Category
Length of FDs: Breakdown by Team Member
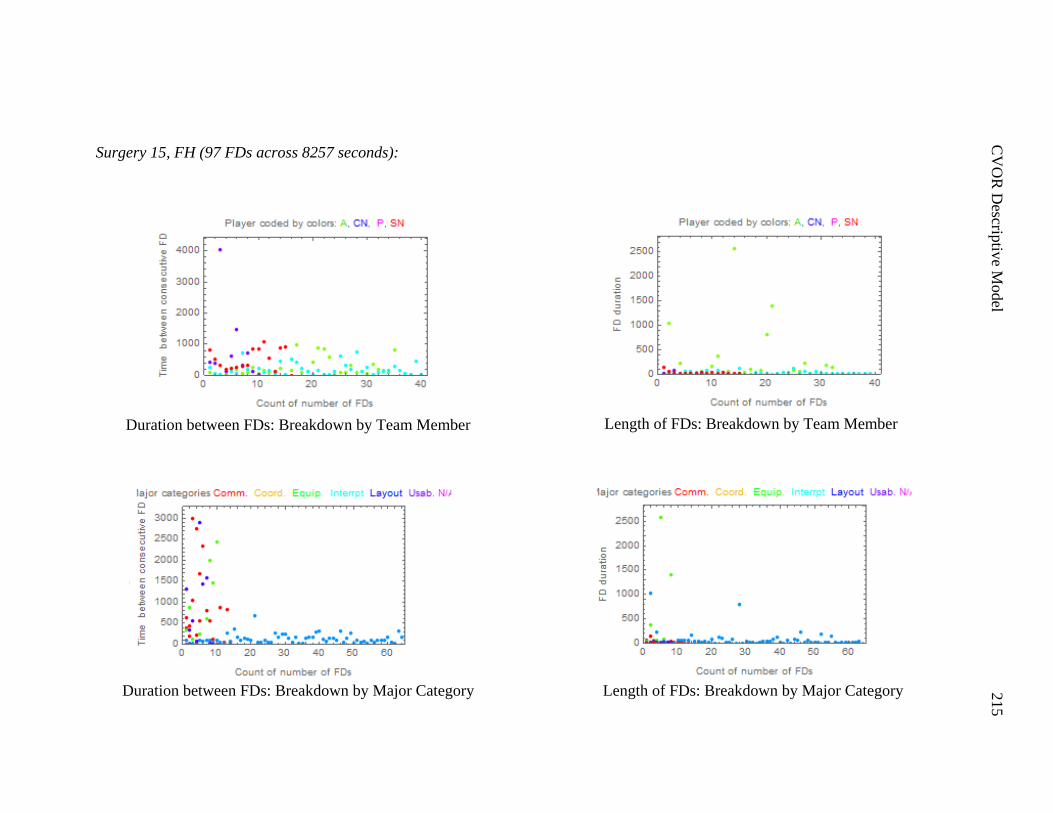
C
VO
R D
escriptiv
e Model
215
Surgery 15, FH (97 FDs across 8257 seconds):
Duration between FDs: Breakdown by Team Member
Duration between FDs: Breakdown by Major Category
Length of FDs: Breakdown by Major Category
Length of FDs: Breakdown by Team Member
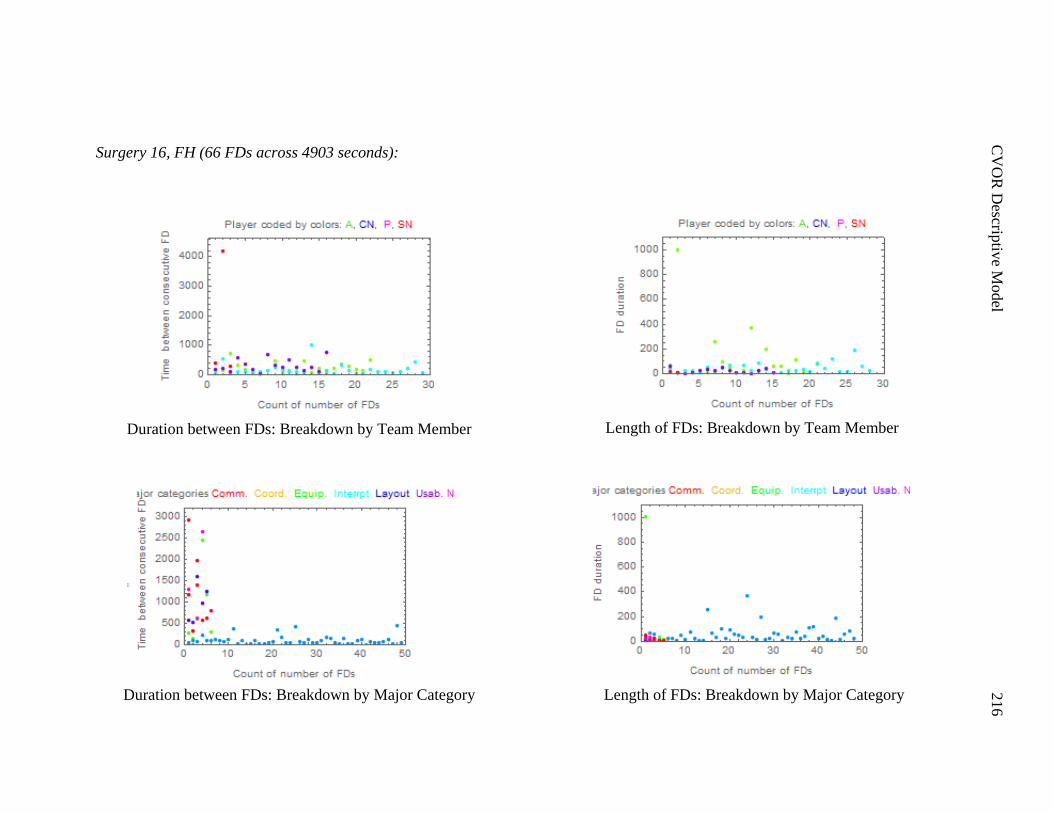
C
VO
R D
escriptiv
e Model
216
Surgery 16, FH (66 FDs across 4903 seconds):
Duration between FDs: Breakdown by Team Member
Duration between FDs: Breakdown by Major Category
Length of FDs: Breakdown by Major Category
Length of FDs: Breakdown by Team Member
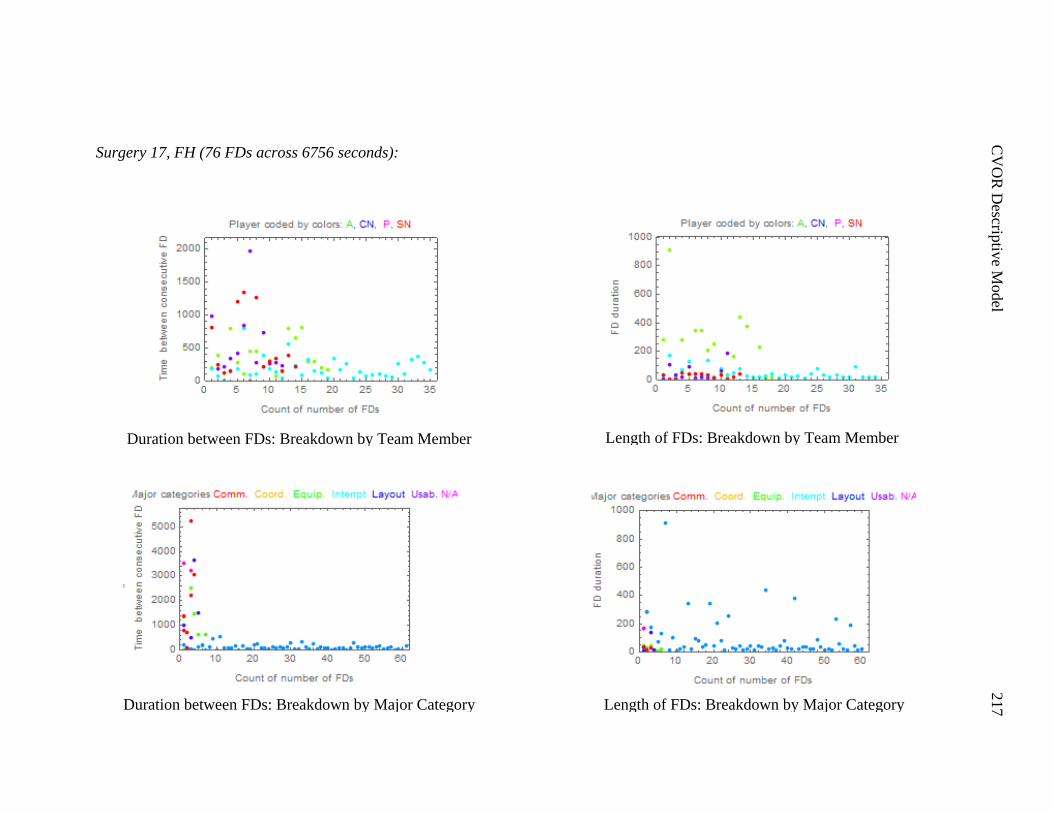
C
VO
R D
escriptiv
e Model
217
Surgery 17, FH (76 FDs across 6756 seconds):
Duration between FDs: Breakdown by Team Member
Duration between FDs: Breakdown by Major Category
Length of FDs: Breakdown by Major Category
Length of FDs: Breakdown by Team Member
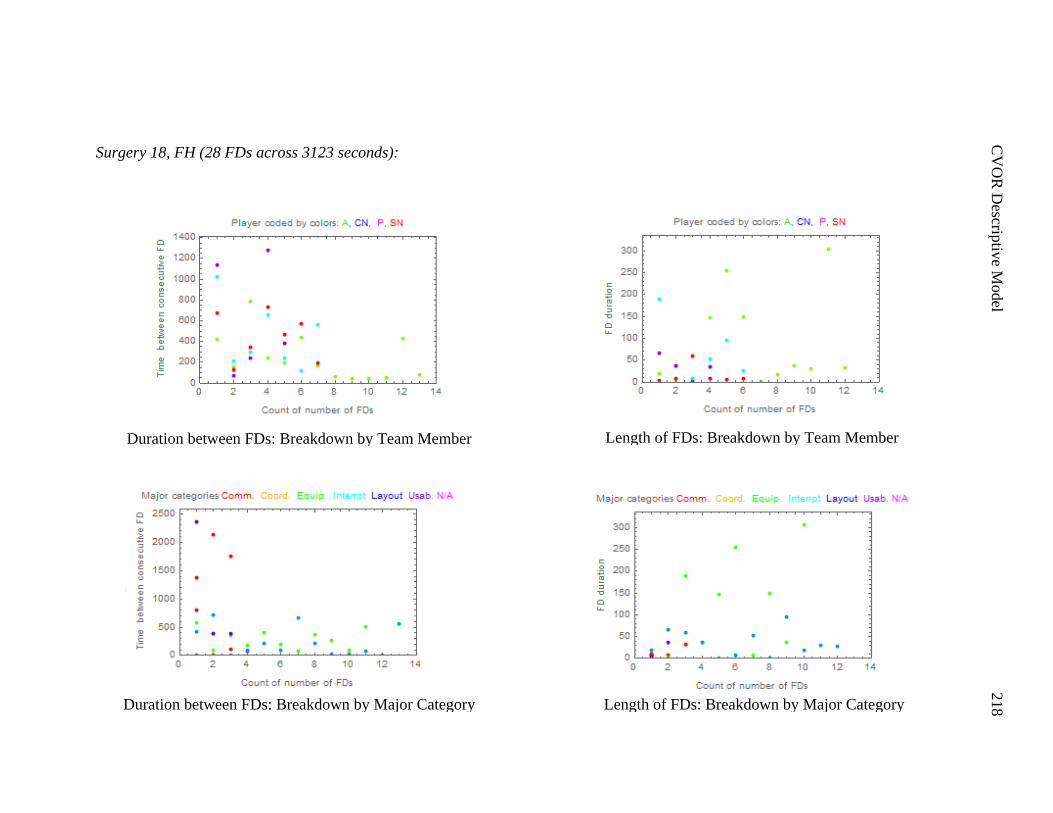
C
VO
R D
escriptiv
e Model
218
Surgery 18, FH (28 FDs across 3123 seconds):
Duration between FDs: Breakdown by Team Member
Duration between FDs: Breakdown by Major Category
Length of FDs: Breakdown by Major Category
Length of FDs: Breakdown by Team Member
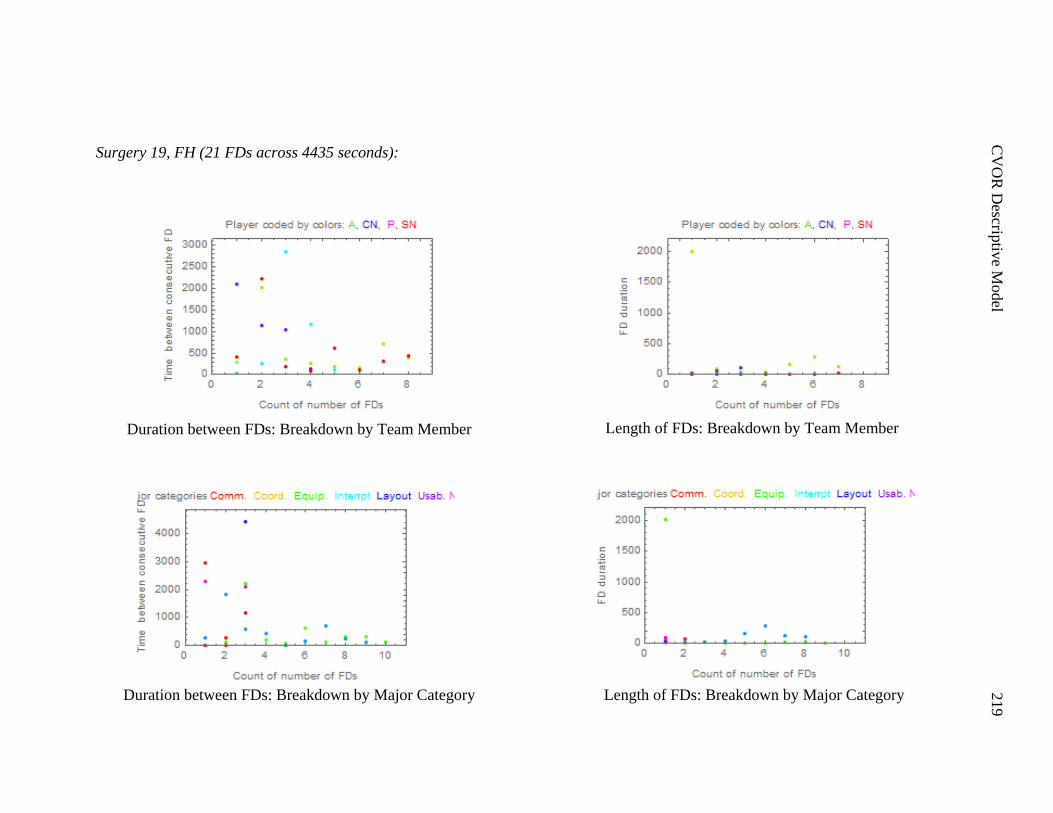
C
VO
R D
escriptiv
e Model
219
Surgery 19, FH (21 FDs across 4435 seconds):
Duration between FDs: Breakdown by Team Member
Duration between FDs: Breakdown by Major Category
Length of FDs: Breakdown by Major Category
Length of FDs: Breakdown by Team Member
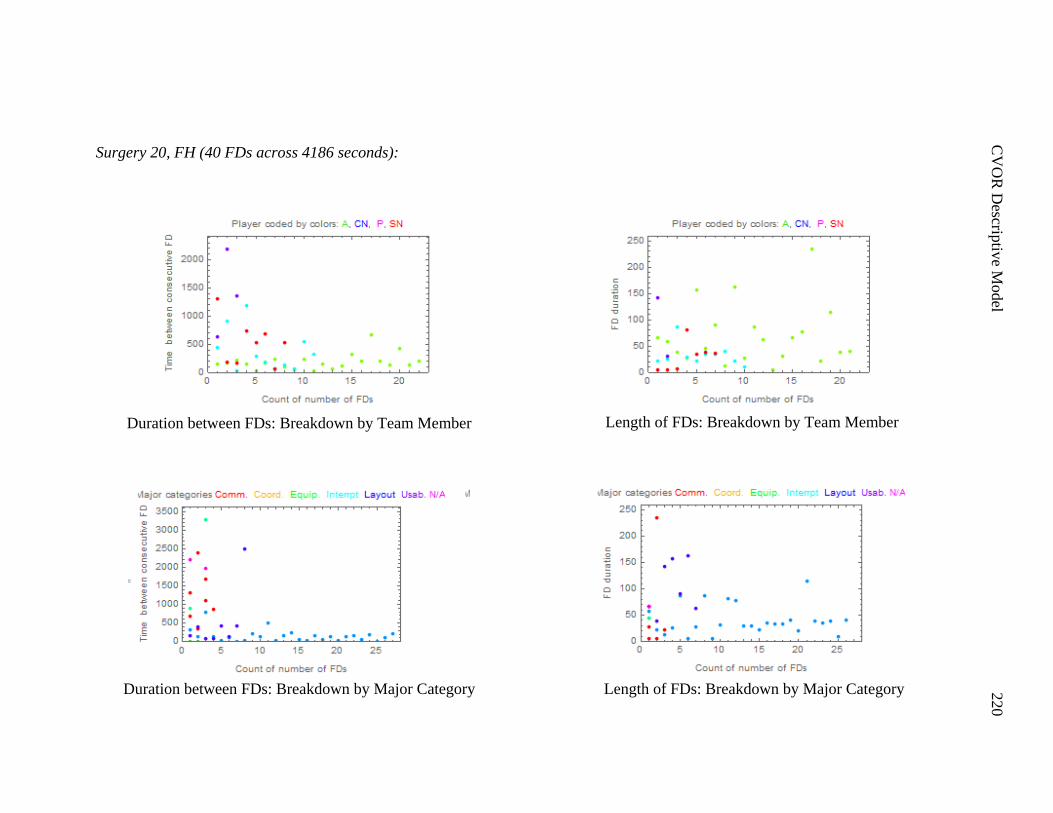
C
VO
R D
escriptiv
e Model
220
Surgery 20, FH (40 FDs across 4186 seconds):
Duration between FDs: Breakdown by Team Member
Duration between FDs: Breakdown by Major Category
Length of FDs: Breakdown by Major Category
Length of FDs: Breakdown by Team Member
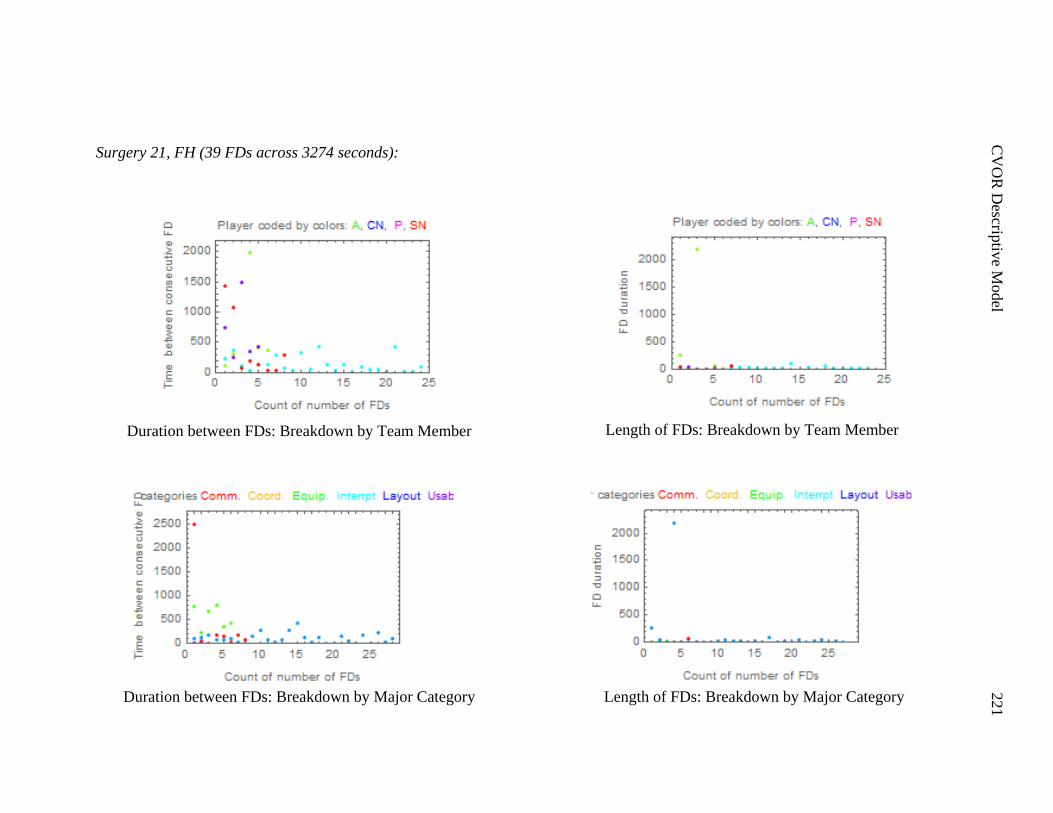
C
VO
R D
escriptiv
e Model
221
Surgery 21, FH (39 FDs across 3274 seconds):
Duration between FDs: Breakdown by Team Member
Duration between FDs: Breakdown by Major Category
Length of FDs: Breakdown by Major Category
Length of FDs: Breakdown by Team Member
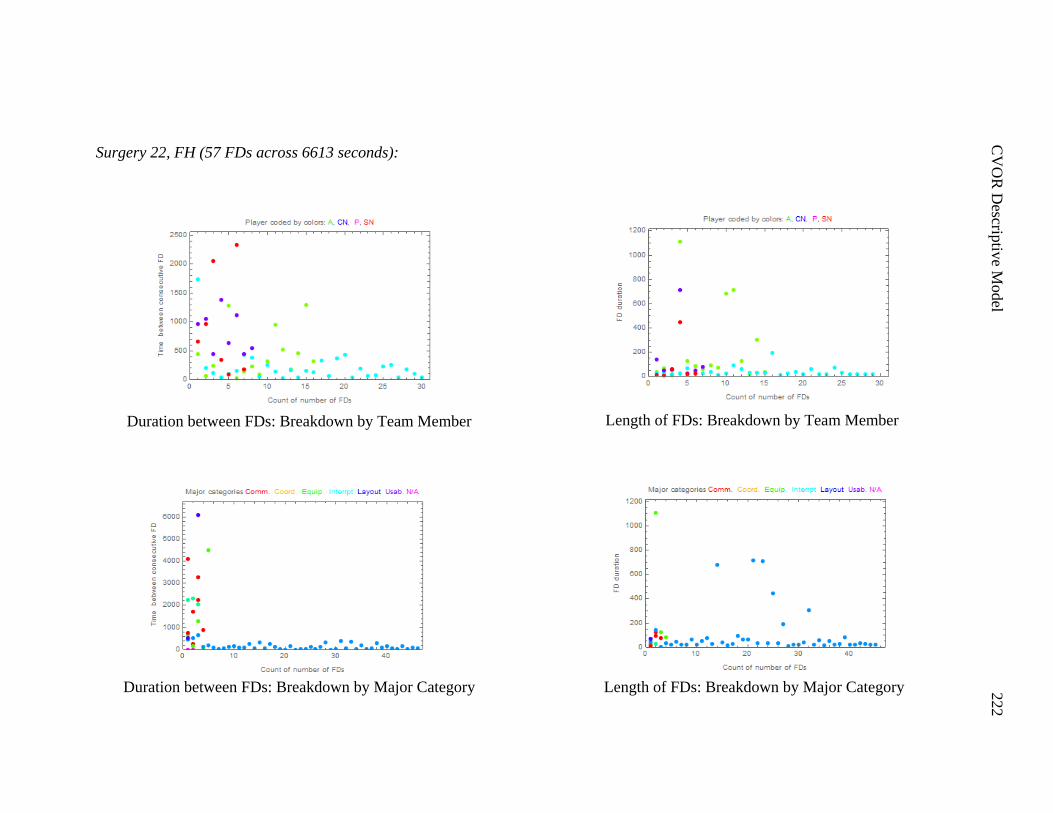
C
VO
R D
escriptiv
e Model
222
Surgery 22, FH (57 FDs across 6613 seconds):
Duration between FDs: Breakdown by Team Member
Duration between FDs: Breakdown by Major Category
Length of FDs: Breakdown by Major Category
Length of FDs: Breakdown by Team Member
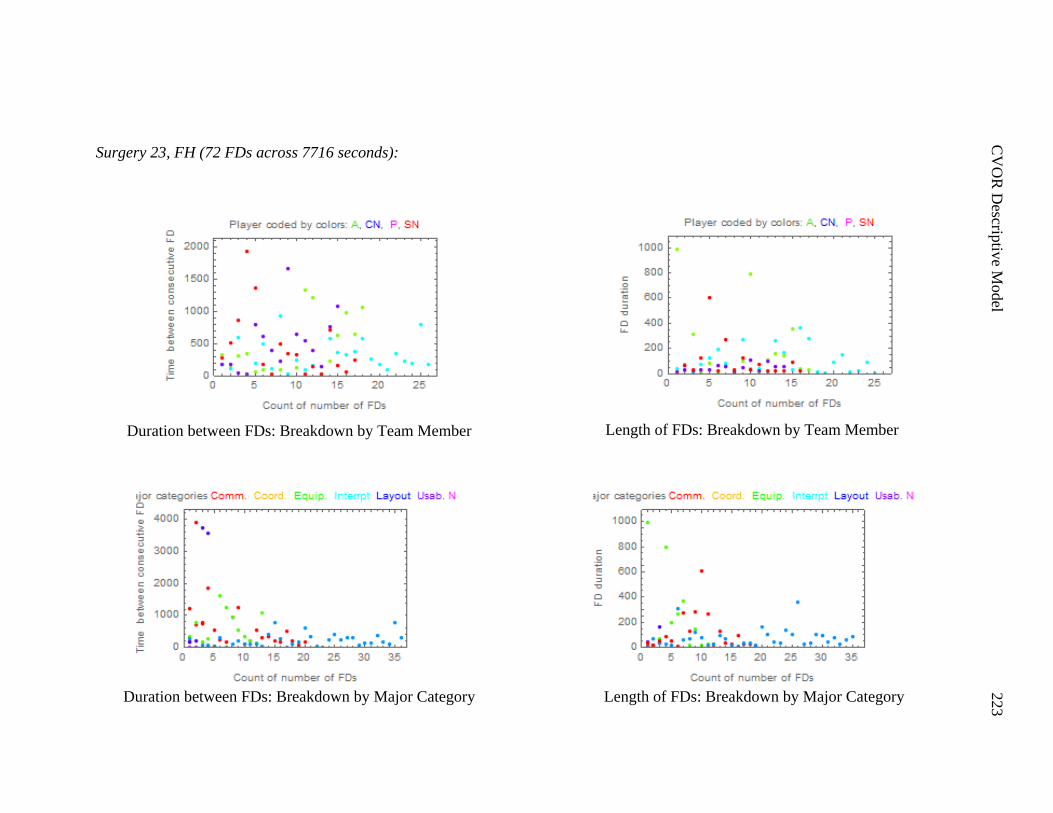
C
VO
R D
escriptiv
e Model
223
Surgery 23, FH (72 FDs across 7716 seconds):
Duration between FDs: Breakdown by Team Member
Duration between FDs: Breakdown by Major Category
Length of FDs: Breakdown by Major Category
Length of FDs: Breakdown by Team Member
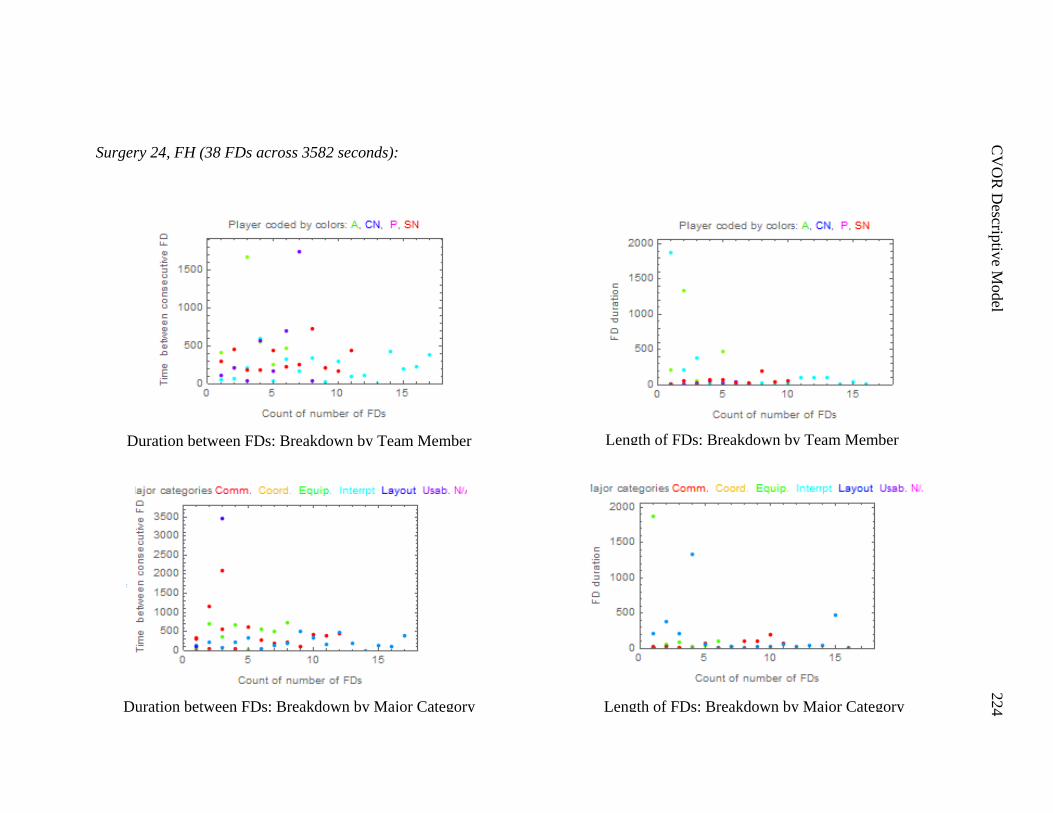
C
VO
R D
escriptiv
e Model
224
Surgery 24, FH (38 FDs across 3582 seconds):
Duration between FDs: Breakdown by Team Member
Duration between FDs: Breakdown by Major Category
Length of FDs: Breakdown by Major Category
Length of FDs: Breakdown by Team Member
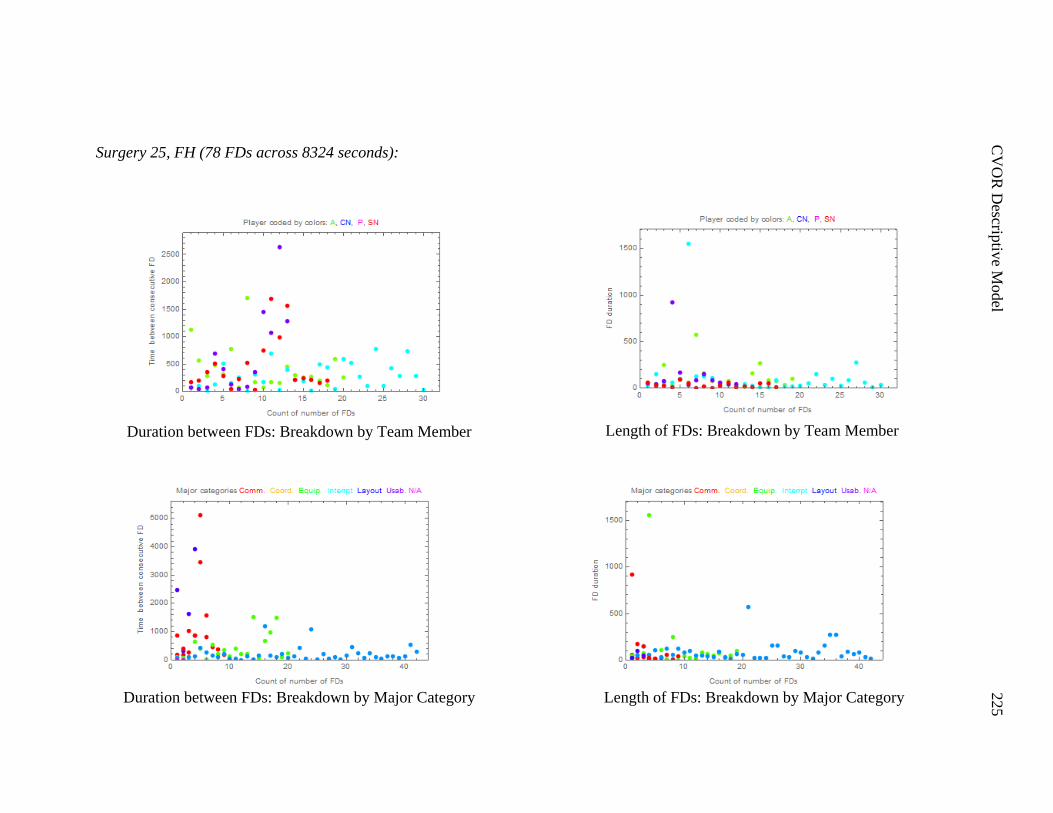
C
VO
R D
escriptiv
e Model
225
Surgery 25, FH (78 FDs across 8324 seconds):
Duration between FDs: Breakdown by Team Member
Duration between FDs: Breakdown by Major Category
Length of FDs: Breakdown by Major Category
Length of FDs: Breakdown by Team Member
Copyright © 2022 FDOKUMEN