Development and modeling of iron-gallium alloys - Dr. Alison ...
163
Development and modeling of iron-gallium alloys by Rick Allen Kellogg A dissertation submitted to the graduate faculty in partial fulfillment of the requirements for the degree of DOCTOR OF PHILOSOPHY Major: Engineering Mechanics Program of Study Committee: Alison B. Flatau, Major Professor Arthur E. Clark Thomas A. Lograsso J.Adin Mann III Ambar K. Mitra Alan M. Russell Iowa State University Ames, Iowa 2003
-
Upload
khangminh22 -
Category
Documents
-
view
1 -
download
0
Transcript of Development and modeling of iron-gallium alloys - Dr. Alison ...
Development and modeling of iron-gallium alloys
by
Rick Allen Kellogg
A dissertation submitted to the graduate faculty
in partial fulfillment of the requirements for the degree of
DOCTOR OF PHILOSOPHY
Major: Engineering Mechanics
Program of Study Committee: Alison B. Flatau, Major Professor
Arthur E. Clark Thomas A. Lograsso
J.Adin Mann III Ambar K. Mitra Alan M. Russell
Iowa State University
Ames, Iowa
2003

iii
TABLE OF CONTENTS
ACKNOWLEDGEMENTS iv
ABSTRACT v
1. INTRODUCTION 1
2. MATERIAL PROCESSING, TEXTURING AND PERFORMANCE 36
3. QUASI-STATIC MAGNETIC CHARACTERIZATION 74
4. QUASI-STATIC MECHANICAL CHARACTERIZATION 91
5. MODELING SATURATION MAGNETOSTRICTION IN POLYCRYSTALS 109
6. AUXETICITY AND ITS APPLICATIONS 131
7. CONCLUSIONS 140
APPENDIX A: ROLLING PROCEDURE 146
APPENDIX B: Fe81Ga19 SINGLE-CRYSTAL MAGNETIC RESONSE 151
APPENDIX C: POISSON’S RATIOS OF Fe-Al ALLOYS 154
REFERENCES 155
iv
ACKNOWLEDGEMENTS
Many people deserve recognition for their contributions, which made it possible for
me to complete this dissertation. I was fortunate to have the support of a superb Ph.D.
committee: Dr. Alison Flatau, Dr. Art Clark, Dr. Thomas Lograsso, Dr. Adin Mann, Dr.
Ambar Mitra and Dr. Alan Russell. I owe special thanks to my major professor Alison Flatau
for encouraging me to pursue my Ph.D. work, and for her unwavering confidence and steady
guidance throughout the research and academic process. I was privileged to collaborate with
Art Clark and greatly appreciate his insights to magnetism as well as his thoughtful advice.
Working closely with Tom Lograsso and Alan Russell on the material science aspects of this
research was a wonderful learning experience. I am grateful to Marilyn Wun-Fogel for her
support throughout my graduate career. I greatly appreciate the contributions of Dr. Shu-Fan
Cheng and Dr. Fran Laabs for their crystallographic analysis efforts and the assistance by Dr.
Bill McCallum with powder metallurgy. Dr Steve Martin and Dr. Steve Poling deserve
thanks for contributing laboratory resources. I appreciate the accommodations made by Ames
Lab and the Material Processing Center headed by Larry Jones to facilitate material
production and analysis. Amy Ross, Lanny Lincoln and Scott Hoover all deserve recognition
for lending their time, knowledge and expertise in the material processing efforts.
Undergraduate students Nick LaPointe, Nick Burgart and Troy LaPointe made outstanding
efforts toward the design and construction of laboratory test equipment, which proved
essential to the success of this research. The assistance provided by AEEM technicians Tom
Elliot and Bill Rickard and the secretarial staff was essential to completion of my degree. I
would like to recognize the financial support provided by the Office of Naval Research
through the “Graduate Traineeship Award” with oversight by Dr. Jeffrey Simmen and Jan
Lindberg, as well as NSWC Carderock, Office of Basic Energy Sciences and the National
Science Foundation. I am grateful to Iowa State University and the Department of Aerospace
Engineering and Engineering Mechanics for providing academic and administrative support.
Finally, I’d like to thank my friends and family for their generous patience and support
extended throughout the duration of my Ph.D. program.

v
ABSTRACT
Alloys of iron substituted with non-magnetic gallium (Galfenol) appear promising as
mechanically robust actuator/sensing materials. They offer desirable properties including
tensile strengths and magnetostrictive strains, respectively, on the order of 100 MPa and 100
x10-6. To advance the understanding of these materials, this dissertation examines the alloys’
magnetic and mechanical response as a function of applied magnetic field, mechanical stress,
temperature, stoichiometry and crystallographic morphology. Characterizations of the alloys’
single-crystal magnetostrictive, elastic and plastic properties are used to facilitate the
development and modeling of polycrystalline forms of the material having preferred
crystallographic orientations (i.e. texture). The polycrystalline forms have potentially higher
production yields and superior mechanical properties over those of single crystals. Iron-
gallium alloys textured by different manufacturing processes reveal which production
methods result in the most desirable magnetostrictive and mechanical performance
envelopes. Growth and deformation processing techniques such as directional solidification,
extrusion, forging and rolling were used to impart a variety of different texture distributions.
Single-crystal tensile test were used to determine the material’s elastic constants, yield stress,
slip systems and their critical resolved shear stress as well as ultimate strength and percent
elongation. Observations of the single-crystal alloys’ remarkable in-plane auxeticity (or
negative Poisson’s ratio) and quadratic correlations of the Poisson’s ratio magnitude to the
level of gallium substitution are reported. Potential applications based on in-plane auxeticity
are explored. Elastic properties, as determined from tensile testing on single-crystal
specimens, provided the basis for the development and use of a Magnetostrictive
Micromechanics Finite-Element Model (MMFEM) that captured the coupled magnetic and
mechanical behavior of polycrystalline specimens. The MMFEM correctly reflects the bulk
magnetostrictive capability of polycrystalline specimens having well-characterized texture
distributions and provides a tool for predicting the magnetostrictive performance of textures
yet to be produced.
1
1. INTRODUCTION
1.1 Motivations for magnetostrictive material research
Magnetostrictive materials are distinguished by the phenomenon of dimensional
changes occurring with changes in magnetization. Consistent with le Chatelier’s principle,
magnetostrictive materials also experience an inverse effect where magnetization changes
accompany changes in applied stress. Since James Joule’s 1842 discovery of
magnetostriction in iron, extensive work has been undertaken to develop and use
magnetostrictive materials for actuation and sensing devices. Examples of magnetostrictive
materials include the common ferromagnetic materials Fe, Ni and Co, which have maximum
magnetostrictive strain magnitudes on the order of 10 x10-6 m/m [Lee 1955]. Additionally,
high performance rare earth-Fe2 alloys such as Terfenol-D (Tb0.3Dy0.7Fe2) have been
developed that generate “giant” magnetostrictive strains on the order of 1000 x10-6 [Clark
1980]. Considering any of these magnetostrictive materials for use in actuation and sensing
applications under harsh mechanical conditions, we are left with a shortfall. None possess the
combined desired properties of mechanical toughness and appreciable magnetostrictive strain
capability simultaneously. Although polycrystalline Fe, Ni and Co have favorable
mechanical properties with elongations exceeding 20% and tensile strengths more than 250
MPa, their magnetostrictive strain capabilities are small [Metals Handbook 1948]. And while
the rare earth-Fe2 alloys develop giant magnetostrictive strains they, suffer from brittleness
and low tensile strengths of roughly 28 MPa [Butler 1988].
The prospect of developing a mechanically robust magnetostrictive material has
motivated this research effort. Providing the focus for this research, previous work has shown
that alloys of iron substituted with non-magnetic gallium (Fe-Ga alloys are also known as
Galfenol) appear promising in filling the role as a mechanically robust material with
substantial magnetostrictive capability [Clark 2000c]. In preliminary tests, as cast
polycrystalline Fe83Ga17 has been shown to endure tensile stresses up to 440 MPa with strains
approaching 0.25% before failure [Lograsso 2000]. Furthermore, studies of single crystal
Fe83Ga17 have shown the alloy to exhibit “large” magnetostrictive strains on the order of 100
x10-6 with low saturating fields of several hundred oersteds as well as displaying a limited
2
temperature dependence over a -20 to 80oC range [Cullen 2001, Kellogg 2002, Clark 2002a,
Clark 2000b]. Assuming the magnetostrictive properties of single crystal Fe-Ga alloy may be
generated in a polycrystalline form having a high degree of crystallographic orientation, the
alloy’s combined attributes are particularly attractive from the perspective of transducer
design for shock prone environments. Additional benefits of Fe-Ga alloys include
substantially lower material costs than rare-earth based magnetostrictive alternatives and the
potential for high-yield production of polycrystalline forms. Raw material cost for Fe81Ga19
is approximately $0.08/g and it might be produced by rapid deformation processing of bulk
quantities (Chapter 2). For comparison, Terfenol-D (Tb27Dy73Fe195) raw material cost is
approximately $0.50/g and current production techniques utilize carefully controlled crystal
growth processes [Snodgrass 2003]. A final consideration in the manufacture and use of the
Fe-Ga alloys is that they are not toxic and do not required any special handling.
1.2 Crystallography
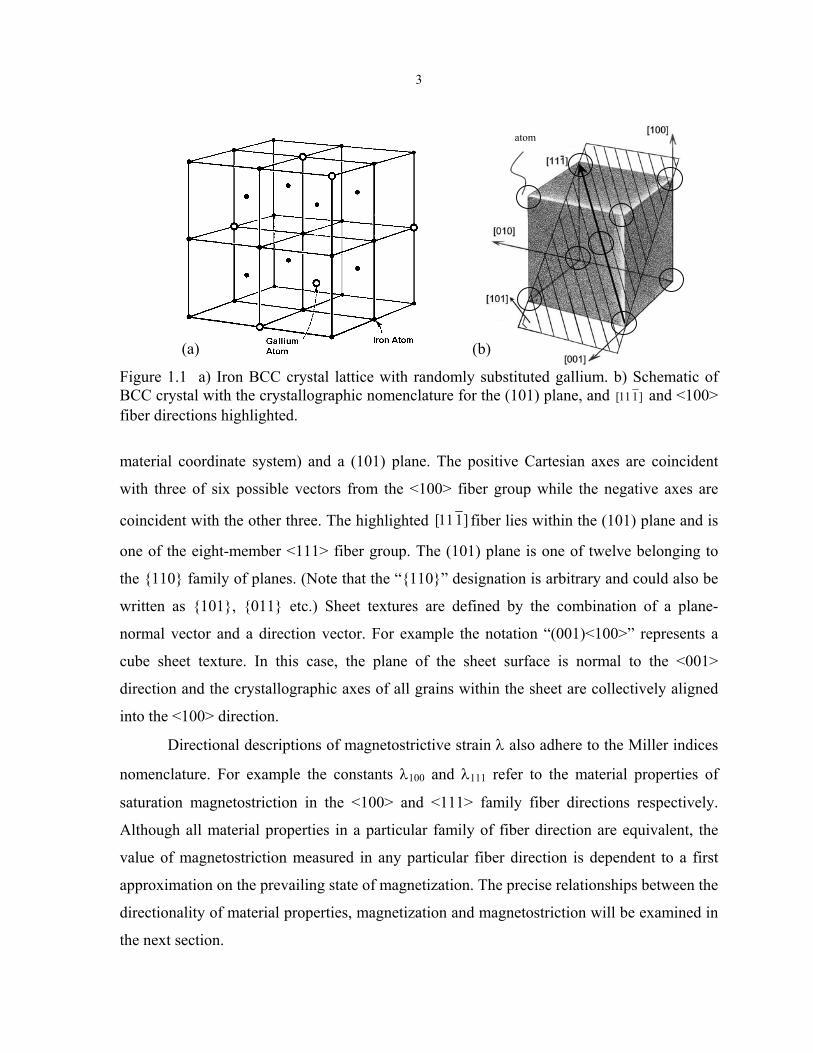
The Fe-Ga alloys to be examined in this work possess a body centered cubic (BCC)
α-Fe structure with the gallium atoms randomly substituted throughout the lattice structure
(hence the “α” prefix) as depicted in Figure 1.1a. Polycrystalline metals are often isotropic
due to their overall random crystallographic distribution, however single crystal and strongly
textured polycrystalline BCC metals exhibit a high degree of anisotropy in their physical
characteristics. As the mechanical and magnetic properties of Fe-Ga alloys are inherently
anisotropic with respect to the crystal lattice, a brief review of the Miller indices
nomenclature will facilitate later discussions on the directional magnetic, elastic and plastic
behaviors of interest.
Miller indices are used to identify a specimen’s crystallographic orientation and the
inherently directionally dependent responses arising from a given state of loading. Grouped
Miller indices of a particular fiber direction and families of equivalent fiber directions are
represented as the vectors [u v w] and <u v w>, respectively. Similarly, a plane surface is
denoted by the notation (h k l) with indices representing the plane-normal vector. The family
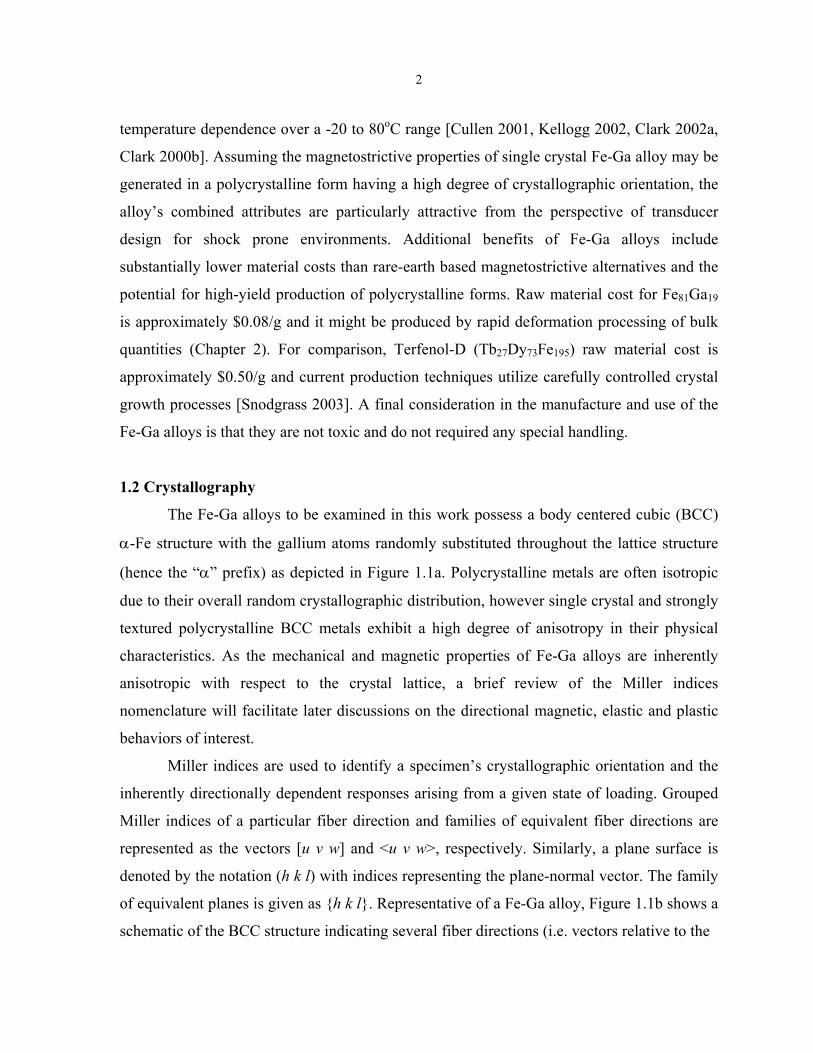
of equivalent planes is given as h k l. Representative of a Fe-Ga alloy, Figure 1.1b shows a
schematic of the BCC structure indicating several fiber directions (i.e. vectors relative to the
3
(b)
atom
(a)
Figure 1.1 a) Iron BCC crystal lattice with randomly substituted gallium. b) Schematic of BCC crystal with the crystallographic nomenclature for the (101) plane, and ]111[ and <100> fiber directions highlighted.
material coordinate system) and a (101) plane. The positive Cartesian axes are coincident
with three of six possible vectors from the <100> fiber group while the negative axes are
coincident with the other three. The highlighted ]111[ fiber lies within the (101) plane and is
one of the eight-member <111> fiber group. The (101) plane is one of twelve belonging to
the 110 family of planes. (Note that the “110” designation is arbitrary and could also be
written as 101, 011 etc.) Sheet textures are defined by the combination of a plane-
normal vector and a direction vector. For example the notation “(001)<100>” represents a
cube sheet texture. In this case, the plane of the sheet surface is normal to the <001>
direction and the crystallographic axes of all grains within the sheet are collectively aligned
into the <100> direction.
Directional descriptions of magnetostrictive strain λ also adhere to the Miller indices
nomenclature. For example the constants λ100 and λ111 refer to the material properties of
saturation magnetostriction in the <100> and <111> family fiber directions respectively.
Although all material properties in a particular family of fiber direction are equivalent, the
value of magnetostriction measured in any particular fiber direction is dependent to a first
approximation on the prevailing state of magnetization. The precise relationships between the
directionality of material properties, magnetization and magnetostriction will be examined in
the next section.
4
1.3 Magnetization and magnetostriction
The general magnetization and magnetostrictive processes of ferromagnetic materials
are described first to provide a foundation for the mathematical modeling of
magnetostriction. Thereafter, the theory representing the anisotropic magnetostrictive
properties of cubic crystals is discussed, since it can be used to quantify the magnetostrictive
properties of Fe-Ga alloys. With a fundamental description of the magnetization and
magnetostrictive processes in hand, a review of the literature on nonmagnetic species
substitution in iron, with an emphasis on gallium-substituted iron and the effect of
stoichiometry, is presented. In conclusion, the piezomagnetic relationships describing the
magnetic and mechanical coupling of magnetostrictive materials are provided as basis for
understanding the output characteristics of magnetostrictive transducers and sensors.
1.3.1 Ferromagnetic processes
Ferromagnetic materials exhibit two regimes of magnetostriction. The first one,
spontaneous magnetostriction denoted by λo, is the strain that occurs upon cooling of a
ferromagnetic material through its Curie temperature. At temperatures above the Curie
temperature, thermal energy disrupts the collective alignment of magnetic moments and
prevents the formation of magnetic domains. As the specimen is cooled below the Curie
temperature, the Weiss mean field (i.e. the imaginary internal magnetic field said to facilitate
long-range ordering of moments) promotes magnetic moments to transition from an
unordered paramagnetic state into a collection of randomly oriented domains accompanied
by spontaneous magnetostriction. For isotropic materials, this spontaneous magnetostriction
is one-half that of saturation magnetostriction, which will be discussed next. The Curie
temperature of the gallium substituted α-iron alloys is in the neighborhood of 675°C
[Kubaschewski 1982].
The second regime of magnetostriction, which is most pertinent to the operation of
actuation and sensing devices, occurs below the Curie temperature where magnetization
changes arise from applied magnetic fields. The process of magnetostriction may be
described in a classical sense where it is assumed that a material’s crystal lattice spacing is
dependent on the orientation of the local magnetic moment. (Similarly, the lattice spacing
5
dependence exists over broader regions where the collectively oriented moments compose a
magnetic domain.) The crystal lattice is spatially elongated in the direction of the magnetic
moment’s (or domain’s) magnetization vector assuming that a positive material
magnetostriction constant exists in this direction. Accompanying the lattice elongation, a
strain of opposite sign occurs in the direction transverse to the magnetization vector as a
consequence of volume conservation. The end result is asymmetrical lattice spacing with the
material’s strain being determined by orientation of the magnetic moments. Should all the
magnetic moments become aligned, thus forming a single domain in the direction of the
applied magnetic field, little further magnetostriction is possible. Relative to the zero strain
state of a demagnetized specimen, this maximum strain condition is called technical
saturation magnetostriction and is denoted by λs. Beyond the point of technical saturation
forced magnetostriction does occur with high levels of applied magnetic field. Forced
magnetostriction is a small effect that accompanies a reduction in the thermally induced
precession of magnetic moments about the applied field direction.
The magnetization and magnetostriction response of a ferromagnetic material having
a positive magnetostriction constant in the direction of magnetization are summarized
graphically in Figure 1.2a and Figure 1.2b respectively. Following the initial response to the
applied field H (from the origin), in stage Ι, as reversible magnetization slowly increases
from zero with partial magnetization, magnetostrictive strain also increases slowly. Stage ΙΙ
follows with a rapid increase in irreversible magnetization due to domain wall motion.
(Domain wall motion describes the translation of a domain boundary where the growth of
one domain occurs at the expense of a neighboring domain.) Accompanying this rapid
magnetization, magnetostriction also progresses rapidly to form the “burst region” of the
magnetostrictive response. With stage ΙΙΙ, magnetization and magnetostriction increase at a
diminishing rate as moments rotate reversibly into alignment with the applied magnetic field.
At this point, magnetization and magnetostriction reach their technical saturation values of
Ms and λs respectively. Beyond technical saturation magnetization and technical saturation
magnetostriction, slight increases in magnetization and magnetostriction occur as magnetic
moments are forced out of precession into complete alignment with the applied field. After
the initial response to increasing H, cyclic field application results in stable hysteretic

6
(b) (a)
Figure 1.2. Simulated (a) magnetization and (b) magnetostriction curves of a ferromagnetic material to the initial application of an applied magnetic field H.
magnetization and magnetostriction loops. Key points on the magnetization plot include the
remanent magnetization MR and coercive field Hc. MR corresponds to the material’s residual
magnetization at zero H and Hc. indicates the field required to drive the magnetization to zero
[Cullity 1972].
Magnetization values are given in units of amps/meter (A/m). Additionally, the
magnetic field H possesses units of amps/meter (A/m) or oersted (Oe) where 79.58 A/m = 1
Oe. Either unit for H will be used interchangeably through out this document.
Related to the M versus H curve, the magnetic flux density (or magnetic induction) B,
having units of tesla, is often used to express a material’s magnetic response to applied fields.
Induction and magnetization follow the simple relation B = µo(M+H), where the constant µo
= 4π x 10-7 Henry/m is the permeability of free space. Similar to Figure 1.2a, a B versus H
curve would have a remnant induction BR and coercive field Hc, however no saturation value
of B exists, as it would continue to increase with increasing magnetic field at a rate of µoH
even though a maximum value of M has been attained.
1.3.2 Anisotropic magnetization and magnetostriction of cubic crystals
The different curvatures of the magnetization plot, like the one shown in Figure 1.2a,
reflect anisotropy (i.e. directional dependence) in the magnetic properties of the material.
7
Different types of anisotropy include magnetocrystalline, magnetostrictive and stress
anisotropies. Magnetocrystalline and magnetostrictive anisotropy are intrinsic properties of
the material. On the other hand, stress anisotropy arises from the coupling of these two
properties, and is manifested as the magnetomechanical effect. The nature of these
anisotropies is discussed next in terms of the material’s energy state. The section will
conclude with an expression describing anisotropic magnetostriction for saturation
magnetization conditions.
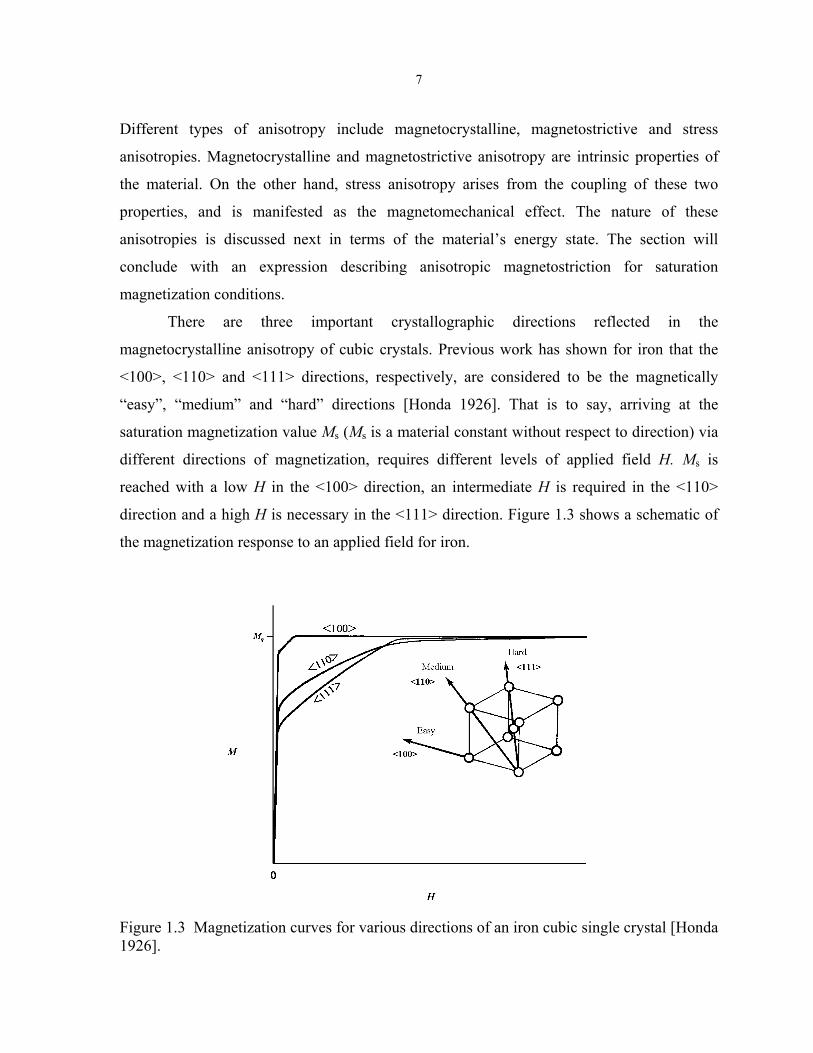
There are three important crystallographic directions reflected in the
magnetocrystalline anisotropy of cubic crystals. Previous work has shown for iron that the
<100>, <110> and <111> directions, respectively, are considered to be the magnetically
“easy”, “medium” and “hard” directions [Honda 1926]. That is to say, arriving at the
saturation magnetization value Ms (Ms is a material constant without respect to direction) via
different directions of magnetization, requires different levels of applied field H. Ms is
reached with a low H in the <100> direction, an intermediate H is required in the <110>
direction and a high H is necessary in the <111> direction. Figure 1.3 shows a schematic of
the magnetization response to an applied field for iron.
Figure 1.3 Magnetization curves for various directions of an iron cubic single crystal [Honda 1926].
8
The magnetocrystalline anisotropy that causes these various magnetization curves
acts as a force tending to hold the magnetic moments (or domains), and hence the
magnetization vectors, in alignment with the magnetically easy crystallographic directions.
An applied field must do work to rotate the magnetization vector away from an easy axis.
The material converts this work to crystal anisotropy energy Ea. The crystal anisotropy
energy for a cubic system (Equation 1.1) is expressed as a series expansion in terms of the
three direction cosines αi that Ms makes relative to the crystallographic axes. The magnetic
anisotropy constants K0, K1, K2, ... are material dependent and have units of energy/volume.
The higher order terms may generally be neglected [Cullity 1972].
( ) ( ) ...KKKEa +ααα+αα+αα+αα+= 23
22
212
21
23
23
22
22
2110 (1.1)
Using Equation 1.1 and the appropriate direction cosines, the magnetocrystalline
energies for Ms having <100>, <110> and <111> directions are respectively K0, (K0 +K1/4)
and (K0 + K1/3 + K2/27). Bozorth has shown that for cubic crystals with magnetically easy
axes, as is observed in iron, if K0 = 0, then K1 must be positive and K2 is limited to a range
between -K1/4 and + ∞ [Bozorth 1951].
Stress anisotropy also contributes to the energy balance of a crystal through the
magnetoelastic energy Eme. Eme arises from the directional dependence of Ms interacting with
anisotropic crystal strains, which are induced by a stress σ as given by the expression:
(1.2) ( ) ( )13133232212111123
23
22
22
21
21100 3
23
γγαα+γγαα+γγαασλ−γα+γα+γασλ−=meE
The magnetostrictive strain constants λ100 and λ111 are material specific and the direction
cosines γi are defined by the direction of applied stress relative to the crystallographic axes.
Notation for stress follows the usual convention where σ is positive for tension.
The total energy state for a region of constant Ms may be determined with Ea and Eme
provided that the external applied magnetic field energy Em (Equation 1.3) is also known. Em
accounts for the coupling between the applied magnetic field H and Ms where Ω is the angle
between them.
9
( Ωµ−= cosHME som
Through minimization of the sum of Ea , Eme and Em, the equilibrium energy stat
the material may be found for static applied magnetic field and stress conditions. If
directions of applied stress and magnetic field are known, the direction cosines for
saturation magnetization vector may be determined. Knowledge of the satura
magnetization direction ultimately becomes useful for determining a material’s state
magnetostriction, as will be explained next.
Lee derives a theory for the anisotropic magnetostriction of single crystals using
material constants as a first approximation in modeling the saturation magnetostriction
derivation of this model is given by Lee [Lee 1955]. The equilibrium strain state of a cry
is determined by minimization of the sum of a crystal’s anisotropic magne
magnetostrictive and elastic energies. The significant result of this theory is given
Equation 1.4, which provides the saturation magnetostriction λs, for a cubic cry
magnetized to saturation from an ideal demagnetized state. The direction cosines αi an
represent the saturation magnetization and strain measurement directions relative to
crystal axes respectively. The magnetostriction constants λ100 and λ111 are material proper
to be identified experimentally.
(( )13133232212111123
23
22
22
21
21100 3
31
23
ββαα+ββαα+ββααλ+
−βα+βα+βαλ=λ s
From a practical standpoint it difficult to achieve an ideal demagnetized state in a specim
with any certainty, however Equation 1.4 remains quite useful. For example, the net cha
in magnetostriction in the [100] crystal direction may be calculated for a change in
saturation magnetization vector from one that is initially perpendicular (⊥) into one tha
parallel (||) with the [100] direction. This is equivalent to taking the [100] direc
magnetostriction generated by a saturating applied magnetic field in the [100] direc
minus the [100] direction magnetostriction generated by a saturating applied magnetic f
in the [010] direction:
for λ⊥ the direction cosines are α2 =1, α1 = α3 = 0 and β1 = 1, β2 = β3 =0
1.3)
e of
the
the
tion
of
two
. A
stal
tic,
in
stal
d βi
the
ties
1.4)
en
nge
the
t is
tion
tion
ield
10
for λ|| the direction cosines are α1 =1, α2 = α3 = 0 and β1 = 1, β2 = β3 =0
substituting these values gives:
( ) ( )
++λ−
−++λ−++λ+
−++λ=λ−λ ⊥|| 0003
31000
230003
31001
23
111100111100
10023λ=λ−λ= ⊥||⊥−||λ .
The net magnetostriction result of (3/2)λ100 calculated above is also the solution for any
90°change in the direction of the Ms vector into one parallel with the [100] direction and is a
measure of the material’s maximum usable magnetostriction. In transducer applications
having ideal performance, the magnetic moments are prealigned orthogonally to the [100]
actuation direction by compressive stress, through the minimization of Eme, and an applied
magnetic field is used to rotate the Ms vector, through the minimization of Em, 90° into the
[100] direction. However, the real performance of these magnetostrictive elements typically
falls short of (3/2)λ100 maximum potential due to a lack of 90° moment rotation. Full 90°
rotation for all moments is not achieved since the material’s finite geometry and internal
demagnetization effects induce complex domain structures through energy minimization.
These domain structures are difficult to overcome and inhibit complete moment alignment in
the orthogonal directions by the compressive stress.
The relationships for λs (Equation 1.4) may also be extended to the analysis of
magnetostriction in polycrystalline cubic materials through volume integration, however
assumptions regarding uniform stress or strain between differently oriented grains must be
carefully considered to achieve useful results [Cullity 1972]. A finite element model
addressing grain interactions that arise from saturation magnetostriction will be described in
Chapter 5.
1.3.3 Magnetostriction in Fe-Ga alloys
Investigations into the physical behaviors of iron and iron substituted with various
non-magnetic species preceded the development of gallium substituted iron-based alloys as a
magnetostrictive material. Considering the magnetostrictive response in nearly pure iron,
work by Tatsumoto in 1959 demonstrated the effect of temperature on the anisotropic
11
magnetostriction constants in BCC single crystal iron where the iron exhibits anomalous
behaviors. In this case, measurements showed that the directional saturation
magnetostrictions λ100 ranged between 21 x10-6 and 23 x10-6 and that λ111 increased from -25
x10-6 to -20 x10-6 as the temperature was increased from -100 °C to +100 °C [Tatsumoto
1959]. With these results in mind, a subsequent analysis on the effect of species substitution
in iron was quite surprising. Work by R.C. Hall examined the room temperature anisotropy
and magnetostriction of single crystal BCC iron substituted with non-magnetic elements
including V, Cr, and Al. Hall’s results showed reductions in the magnetocrystalline
anisotropy constant K1 (making the material easier to magnetize in the <100> directions) for
additions of Al up to 17 atomic percent (at. %). Commensurate with these substitutions,
saturation magnetostrictions increased with λ100 ∼ 85 ppm and λ111 ∼ 0 for the 17 at. %
substitution levels [Hall 1959]. Hall also showed similar results for substitutions of V and Cr
[Hall 1960]. The overall trend with these non-magnetic substitutions in iron was for a
decrease in magnetocrystalline anisotropy and a significant increase magnetostriction. In
short, larger magnetostrictions could be achieved in substituted iron with lower applied
magnetic field levels.
Building on this prior work, the investigation of gallium substitution in iron by Clark
et al. led to the development of Galfenol (Ga – gallium, fe-iron, and nol – Naval ordinance
laboratory) as a prospective magnetostrictive transducer/sensing material. This
magnetostrictive alloy is a single-phase solid solution with a disordered substitution of Ga in
BCC α-Fe as depicted in Figure 1.1a. Typical compositions are Fe100-xGax where 13 ≤ x ≤ 19.
These alloys have recently been shown to exhibit large magnetostrictions, with some
approaching 400 x10-6 at room temperature. The saturation magnetostriction (λ100) is over
10-fold that of non-substituted Fe, yet the rhombohedral magnetostriction (λ111) remains
almost unchanged [Clark 2000c]. The binary phase diagram of Figure 1.4 shows that Ga
substitutions up to ∼17 at. % will retain a disordered equilibrium state down to 300°C. Given
a decline in the rate of diffusion with decreasing temperature, this disordered state is
maintained at room temperature as well. However, above ∼17 at. % Ga ordered intermetallics
such as the D03 and B2 structures may form. This ordering will later be shown to be an

12
Figure 1.4 Binary Fe-Ga phase diagram [after Kubaschewski 1982, Massalski 2002]. Detail above 30% Ga has been omitted. Symbols including γ, α, DO3, B2, β ... represent different crystallographic structures. See an introductory text on material science for further explanation; for example [Barrett 1952].
important factor in limiting the alloy’s magnetostrictive capability. Heat treatments such as
quenching from 1000°C are often used to maintain a disordered Ga distribution for
substitutions levels between 17 and 19 at. %.
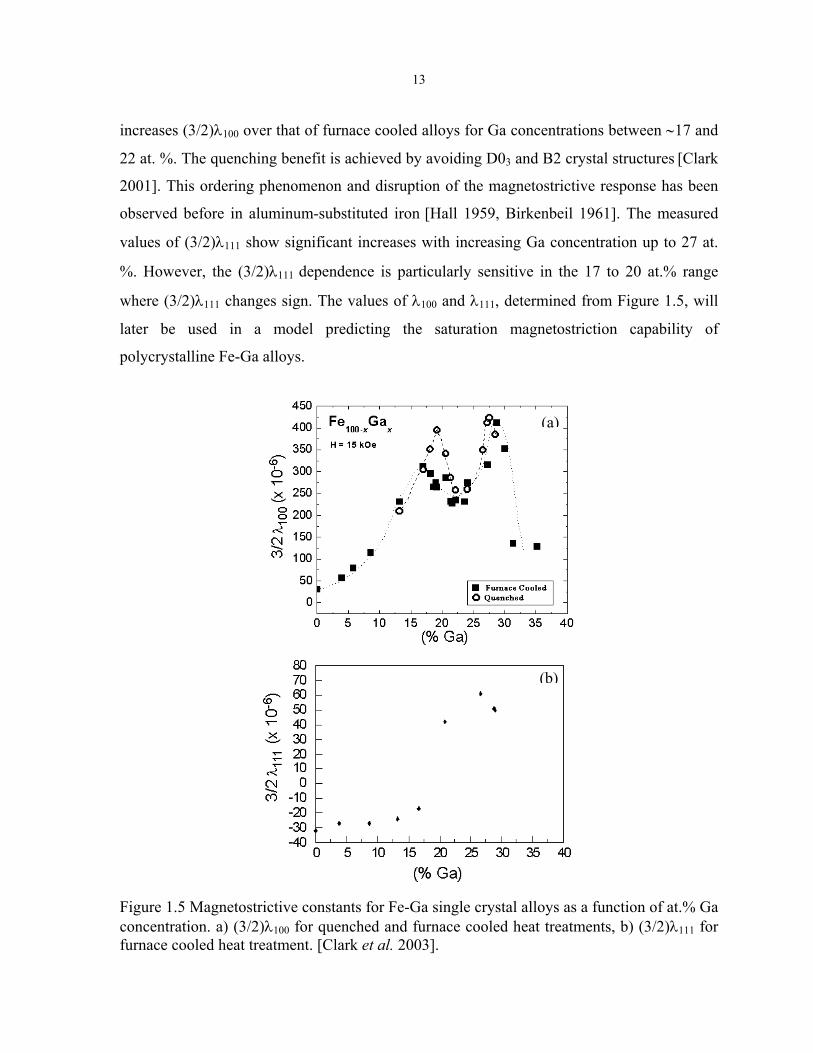
The effect of Ga concentration on the experimentally determined magnetostrictive
constants λ100 and λ111 for Fe-Ga single crystals at room temperature is shown in Figure 1.5.
The 3/2 factor for the ordinate values reflect the magnetostrictions measured due to rotation
of Ms from an orthogonal direction into one of final alignment with the [100] or [111]
direction of interest. (i.e. the net strain in the [100] direction is 150% that of λ100.) There is a
prominent double peak in (3/2)λ100 with Ga concentration. Additionally, quenching markedly
13
increases (3/2)λ100 over that of furnace cooled alloys for Ga concentrations between ∼17 and
22 at. %. The quenching benefit is achieved by avoiding D03 and B2 crystal structures [Clark
2001]. This ordering phenomenon and disruption of the magnetostrictive response has been
observed before in aluminum-substituted iron [Hall 1959, Birkenbeil 1961]. The measured
values of (3/2)λ111 show significant increases with increasing Ga concentration up to 27 at.
%. However, the (3/2)λ111 dependence is particularly sensitive in the 17 to 20 at.% range
where (3/2)λ111 changes sign. The values of λ100 and λ111, determined from Figure 1.5, will
later be used in a model predicting the saturation magnetostriction capability of
polycrystalline Fe-Ga alloys.
(b)
(a)
Figure 1.5 Magnetostrictive constants for Fe-Ga single crystal alloys as a function of at.% Ga concentration. a) (3/2)λ100 for quenched and furnace cooled heat treatments, b) (3/2)λ111 for furnace cooled heat treatment. [Clark et al. 2003].
14
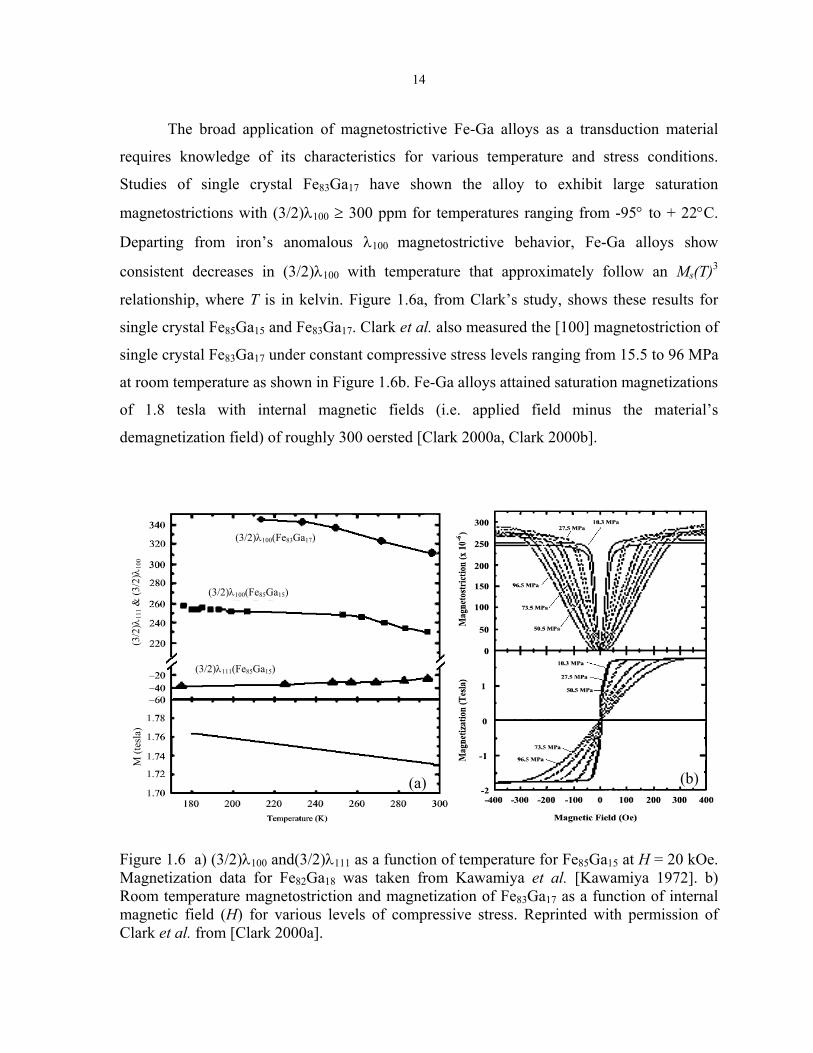
The broad application of magnetostrictive Fe-Ga alloys as a transduction material
requires knowledge of its characteristics for various temperature and stress conditions.
Studies of single crystal Fe83Ga17 have shown the alloy to exhibit large saturation
magnetostrictions with (3/2)λ100 ≥ 300 ppm for temperatures ranging from -95° to + 22°C.
Departing from iron’s anomalous λ100 magnetostrictive behavior, Fe-Ga alloys show
consistent decreases in (3/2)λ100 with temperature that approximately follow an Ms(T)3
relationship, where T is in kelvin. Figure 1.6a, from Clark’s study, shows these results for
single crystal Fe85Ga15 and Fe83Ga17. Clark et al. also measured the [100] magnetostriction of
single crystal Fe83Ga17 under constant compressive stress levels ranging from 15.5 to 96 MPa
at room temperature as shown in Figure 1.6b. Fe-Ga alloys attained saturation magnetizations
of 1.8 tesla with internal magnetic fields (i.e. applied field minus the material’s
demagnetization field) of roughly 300 oersted [Clark 2000a, Clark 2000b].
M (t
esla
) (3
/2) λ
111 &
(3/2
) λ10
0
(3/2)λ111(Fe85Ga15)
(3/2)λ100(Fe85Ga15)
(3/2)λ100(Fe83Ga17)
(b) (a)
Figure 1.6 a) (3/2)λ100 and(3/2)λ111 as a function of temperature for Fe85Ga15 at H = 20 kOe. Magnetization data for Fe82Ga18 was taken from Kawamiya et al. [Kawamiya 1972]. b) Room temperature magnetostriction and magnetization of Fe83Ga17 as a function of internal magnetic field (H) for various levels of compressive stress. Reprinted with permission of Clark et al. from [Clark 2000a].
15
An understanding of the exact mechanism of magnetostriction in iron and non-
magnetic species substituted iron remains incomplete, however research efforts on Al
substituted iron have established correlations between temperature, stoichiometry,
crystallography and magnetic and mechanical properties [Leamy 1967a, Leamy 1967b, Shull
1976]. This previous work on Al substituted iron and ongoing research with Ga substituted
iron has given rise to qualitative theories [Cullen 2001, Lograsso 2003]. Summarizing the
existing qualitative theory, Al and Ga are large atoms relative to Fe, however they fit into the
α-Fe BCC crystal lattice sites, randomly replacing Fe for substitution concentrations less
than 19 at. %. Pairs of the substituting species situated along the edges of the cubic lattice
structure tend to facilitate a short-range order, therefore resulting in an anisotropic condition
and internal strain. As the material is magnetized, magnetic moment rotation gives rise to a
magnetoelastic interaction and anisotropic magnetostriction favoring the <100> directions. It
has been shown that if Al or Ga substitution is excessive, i.e. greater than ∼17 at. %, a low-
energy long-range ordering arises between the substituted atoms. A D03 or B2
crystallographic structure then results (Figure 1.4) with an accompanying decrease in the
magnetic order and a significant reduction in the magnetostrictive effect [Kawamiya 1972,
Clark 2001]. Attempting to improve on the ambiguity of this qualitative theory, efforts by
Wu et al. are focused modeling the magnetostrictive effect at a quantum level from first
principles [Wu 2002].
1.3.4 Piezomagnetic relationships
Regardless of the incomplete description of Fe-Ga alloys’ exact magnetostrictive
mechanism, a simple model using linear piezomagnetic relationships provides insight to the
material’s coupled magnetic and mechanical (i.e. magnetomechanical) nature. Although the
magnetostrictive process is inherently nonlinear, linear approximations of the
magnetomechanical processes are useful in describing an axial magnetostrictive response
over a limited change in applied magnetic field and/or stress. The linearized one-dimensional
piezomagnetic equations at, constant temperature, take into consideration incremental
changes in the applied magnetic field ∆H and stress ∆σ, which are linearly superimposed to
give the incremental changes in strain ∆ε and magnetic flux density ∆B as [Calkins 1997]

16
Hd
E Hy
∆+∆
=∆ 33σ
ε (1.5a)
and (1.5b) HdB * ∆µ+σ∆=∆ σ33 .
The material properties of Young’s Modulus EyH and permeability µσ represent values
pertaining to constant magnetic field H and constant stress σ conditions respectively. The
piezomagnetic coefficient d33 symbolizes the axial magnetostriction coefficient and
represents the change in strain per change in magnetic field at a constant stress. The
parameter d33* represents the change in magnetic induction per change in stress at a constant
magnetic field.
Providing a figure of merit for the transduction capability of magnetostrictive
materials, the coupling factor kcc may be derived from the piezomagnetic equations [Calkins
1997]. The square of the coupling factor is defined as
σµ
HY
ccEdd
k*33332 = ,
where 0 < kcc2 < 1. This coupling provides the relationships between the constant field and
constant induction elastic modulus
( )21 ccBY
HY kEE −= (1.7)
as well as the constant strain and constant stress permeabilities
( )21 cck−= σε µµ .
Materials with higher coupling factors possess larger transduction capabilities (i.e.
effective conversion of energy between magnetic and mechanical states). However,
coupling factors also imply low permeabilities, which make them difficult to magnetize
Equation 1.6). Values of kcc expected in Ga substituted iron may be as high as 0.5 [
(1.8)
(1.6)
more
high
(see
Clark
17
2000a]. For comparison, coupling factors in Terfenol-D have been measured as high as 0.7 to
0.8 [Clark 1980]. The coupling factor kcc may be determined experimentally using the
mechanical or magnetic relationships of Equations 1.7 and 1.8.
1.4 Polycrystalline material properties and texturing
The texturing, or preferential orientation, of the crystallographic structure in metals
has long been used to tailor their physical characteristics. Textured materials such as grain-
oriented silicon-iron steels have been developed as magnetically efficient transformer cores.
Another common use of texturing is in structural applications where textured sheet metals
offer improved formability as well as tailored anisotropic strength and fatigue characteristics.
This research is focused on the development of crystallographic textured iron-
substituted alloys to produce materials that achieve highly magnetostrictive, magnetic and
favorable structural properties simultaneously. In order to engineer these optimized alloys it
is necessary to understand the effect of crystallographic texture, grain size and processing on
the material’s magnetic and mechanical properties. Because the iron-substituted alloys of
interest possess a BCC structure, the focus of this section is to examine the factors affecting
the mechanical properties of BCC materials. This section begins with a review of the
texturing requirements for optimizing the magnetoelastic properties of gallium-substituted
iron alloys. Subsequently, aspects of crystallographic texture-dependent properties including
the elastic and plastic response, effect of grain boundaries, fracture mechanics, cyclic strain
hardening/softening, fatigue and environmental susceptibility will be examined.
1.4.1 Iron - gallium texturing
The degree of texturing of the iron-gallium alloys having a BCC structure for a
stoichiometry near Fe83Ga17 is of particular interest. The single crystal magnetostrictive
performance is retained, where (3/2)λ100 ∼ 300 ppm, while avoiding the potential
complications of the ordered D03 and B2 structures which exhibit reduced magnetostrictive
capability. Additionally, for this stoichiometry, maximum magnetostrictive performance is
maintained without the need for quenching heat treatments (Section 1.3.3). The resulting
magnetomechanical capability of these materials are desirable for transducer and structural
18
applications where the generation of displacement and force is needed. Although the
maximum magnetomechanical performance of Fe-Ga alloys is achieved in a <100> oriented
single crystal, the single crystals are costly to produce and their mechanical characteristics
such as yield strength are known to be variable due to crystal surface defects.
Given the drawbacks of single crystal material, polycrystalline forms textured by
rolling or other methods provide an attractive alternative with the potential for improved
mechanical robustness and cost-effective production. The maximum magnetomechanical
response of the Fe-Ga alloy is achieved with a cube texture. Representative of the cube
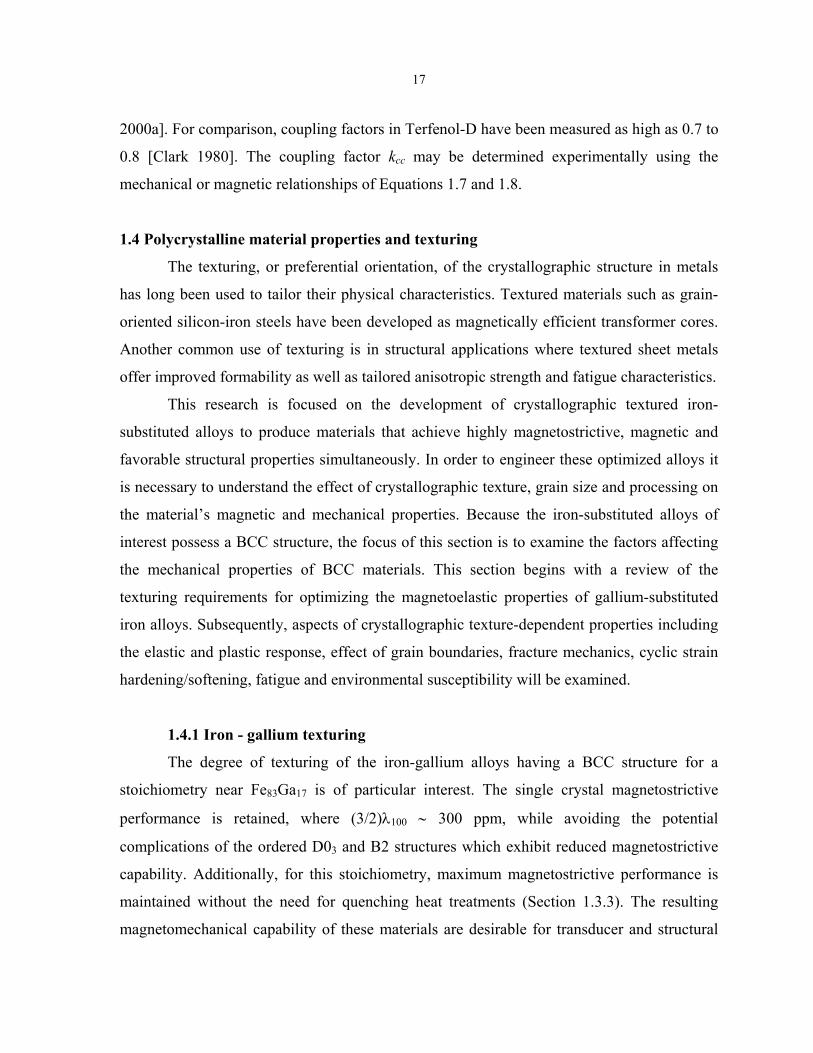
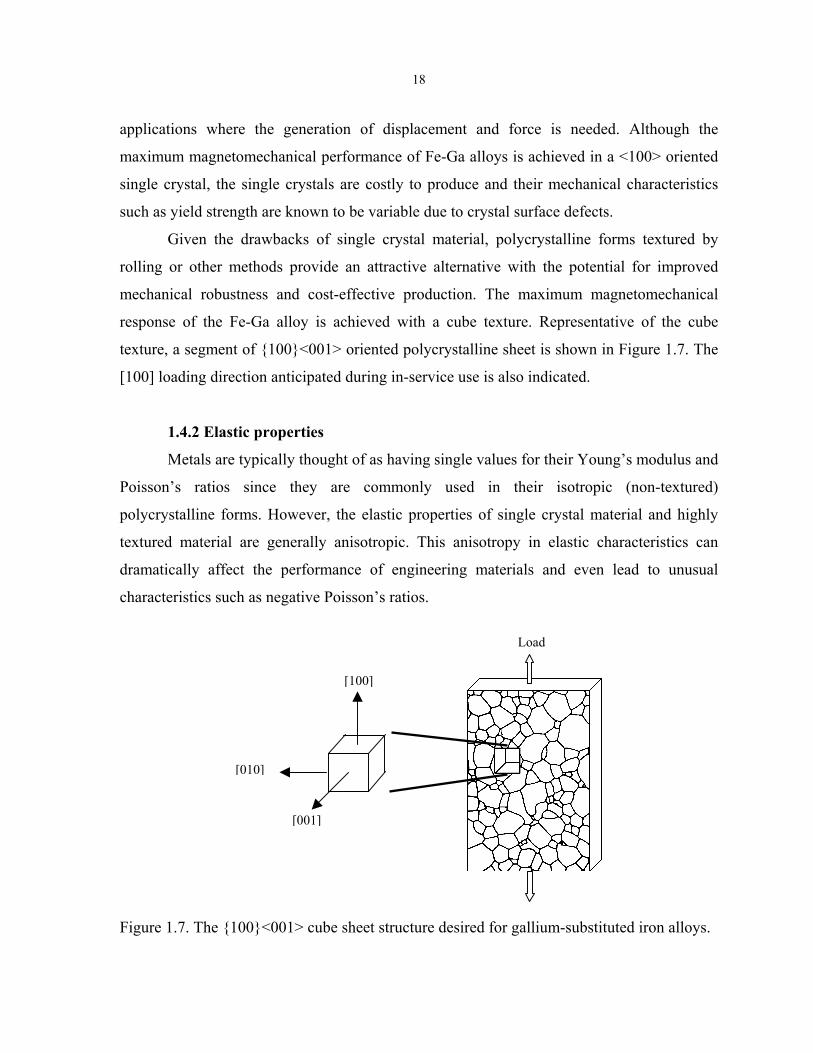
texture, a segment of 100<001> oriented polycrystalline sheet is shown in Figure 1.7. The
[100] loading direction anticipated during in-service use is also indicated.
1.4.2 Elastic properties
Metals are typically thought of as having single values for their Young’s modulus and
Poisson’s ratios since they are commonly used in their isotropic (non-textured)
polycrystalline forms. However, the elastic properties of single crystal material and highly
textured material are generally anisotropic. This anisotropy in elastic characteristics can
dramatically affect the performance of engineering materials and even lead to unusual
characteristics such as negative Poisson’s ratios.
Load
[100]
[001]
[010]
Figure 1.7. The 100<001> cube sheet structure desired for gallium-substituted iron alloys.
19
By definition, polycrystalline materials are a bound collection of single crystals as
depicted in Figure 1.7. Within the single crystals, the mechanical properties of the BCC
crystal lattice are inherently anisotropic due a directional dependence in the atomic packing
density (Fig. 1.1b). For example, single crystal iron’s lowest Young’s modulus has been
measured at 131 MPa in the [100] direction, while an intermediate modulus value of 219
MPa occurs in the [110] direction. The maximum elastic modulus value of 283 MPa was
found in the [111] direction. [Lyman 1948]. The directional properties of polycrystalline
materials, consisting of these anisotropic single crystals, may vary significantly depending on
the degree and type of texturing present. For example, wiredrawn iron exhibits a [110] fiber
texture in the direction of drawing thus giving intermediate axial elastic modulus values
compared to the radial direction. In contrast, sheet products can display near isotropic
behaviors, in plane, if the texture reflects alignment of the proper plane parallel to the sheet
surface. For example, textured (111) polycrystalline sheet steels exhibit the highest in plane
stiffness possible as no soft <100> crystal directions lie in plane [Titerov 1998].
The mathematic relationships for the anisotropic elastic properties of BCC materials
will be developed further in section 1.5 to provide a foundation for modeling the Fe-Ga
alloys’ stress-strain response induced by saturation-magnetostriction generated strains.
Modeling and analysis of a material’s bulk magnetostrictive response, utilizing these
relationships, are presented in Chapter 5. The elastic relationships governing the expression
of a material’s auxetic (negative Poisson’s ratio) behaviors will also be inspected.
Aside from influencing the overall external material behavior, the effect of elastic
anisotropy is an important factor governing the material’s internal behavior. Depending on
the degree of texturing, the individual grains within a polycrystalline material may occupy a
range of orientations with neighboring grains experiencing different degrees of interaction.
Consequently, the loading of a polycrystalline body results in stress and strain variations
within and between crystals. These stress and strain variations are important factors when
considering the plastic behavior, failure modes and environmental susceptibility of textured
polycrystalline materials.

20
1.4.3 Plastic properties
When engineering a material, one must consider how the crystal morphology will
affect the plastic response to loading. The plastic deformation of a metal coincides with the
formation and movement of dislocations, which consist of atomic irregularities in the crystal
lattice structure. Two basic dislocation types include the edge and screw dislocations. An
extra half plane of atoms in the crystal lattice characterizes the edge dislocation, while an
atomic misalignment similar to a step along the edge of a cube distinguishes a screw
dislocation [Honeycombe 1968]. The movement of these dislocations is in turn affected by
anisotropic material properties as well as crystallographic imperfections including grain
boundaries, vacancies and interstitial atoms. Throughout the process of plastic deformation,
dislocations grow and move as a result of applied stresses exceeding the yield strength of the
material. Some members of the family of BCC metals are considered to be “hard” where a
yield stress greater than 10 MPa are required to generate yield in single crystals [McLean
1962]. Controlling the extent of plastic deformation, the fractional strength of the polycrystal
compared to a perfect single crystal depends on crystal size, arrangement and imperfections.
The particular mechanisms of plastic deformation in BCC metals are now considered.
Dislocations exist in networks within the grains where they tend to form threefold
nodes in BCC metals with angles of 96° in three dimensional space. Providing an avenue for
plastic deformation through the disruption of these dislocation networks, BCC metals exhibit
eight different slip Burgers vectors (or distinct dislocation morphologies). There are several
modes of common dislocation dynamics associated with these systems. “Slip” occurs when
an applied stress drives a dislocation to move along a plane through the crystal lattice. This
results in the material above the plane shifting location relative to the material below the
plane. “Cross slip” occurs when dislocation motion transfers from one plane to an
intersecting plane. Common slip systems favored in the BCC metals are in the [111]
direction on (110) planes and in multiple directions on the (112) and (123) planes. The
highest ductility in BCC metal is typically developed with the easy slip plane oriented at 45°
to the stress direction [Prasad 1994]. As an example of anisotropic plastic deformation, the
slip mechanisms in high purity (99.96%) α-Fe are considered. At room temperature the
primary slip system is 110<111> with slip occurring at a critical resolved shear stress
21
(τCRSS) of 27.5 MPa [Dieter 1988]. The 110 set of planes is favored for slip as they are the
planes of highest planar atomic packing density, thus presenting the lowest energy barrier to
dislocation movement. Similarly the <111> family of slip directions are favored as they
possess the highest linear atomic packing density within the 110 planes. Secondary slip
occurs in pure α-Fe on the 211<111> and 321<111> since these planes have lower
relative atomic packing densities and require the addition of more energy to trigger
dislocation movement.
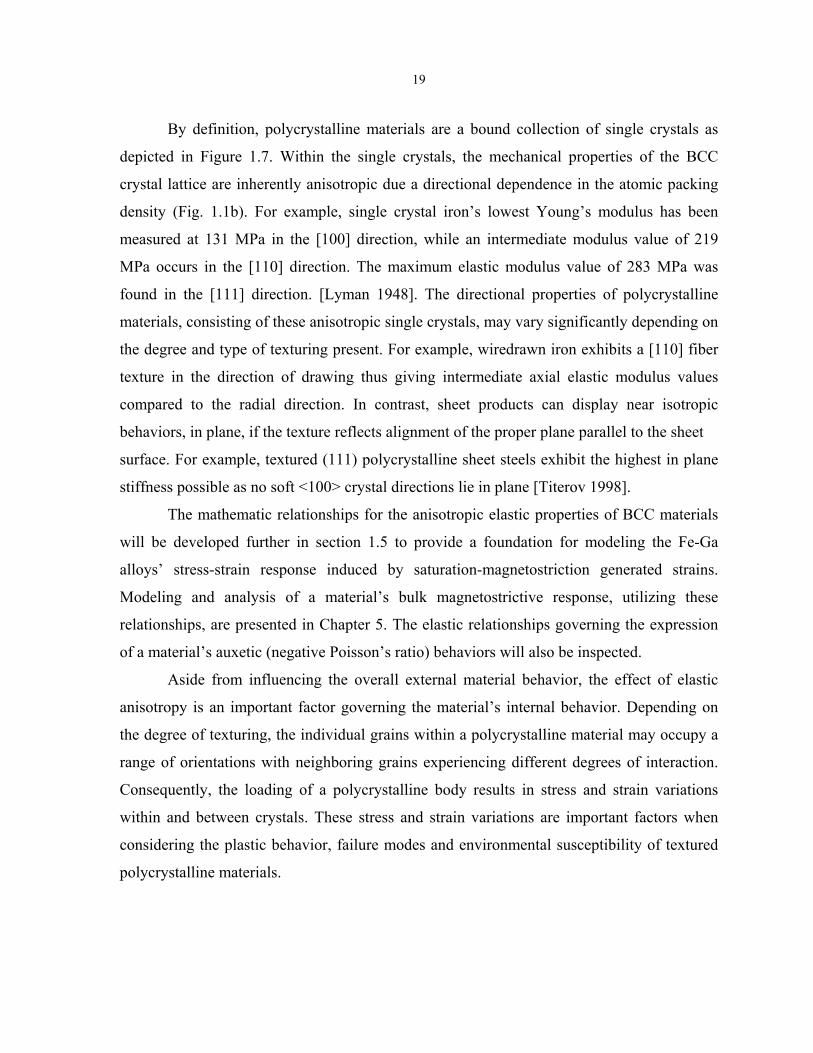
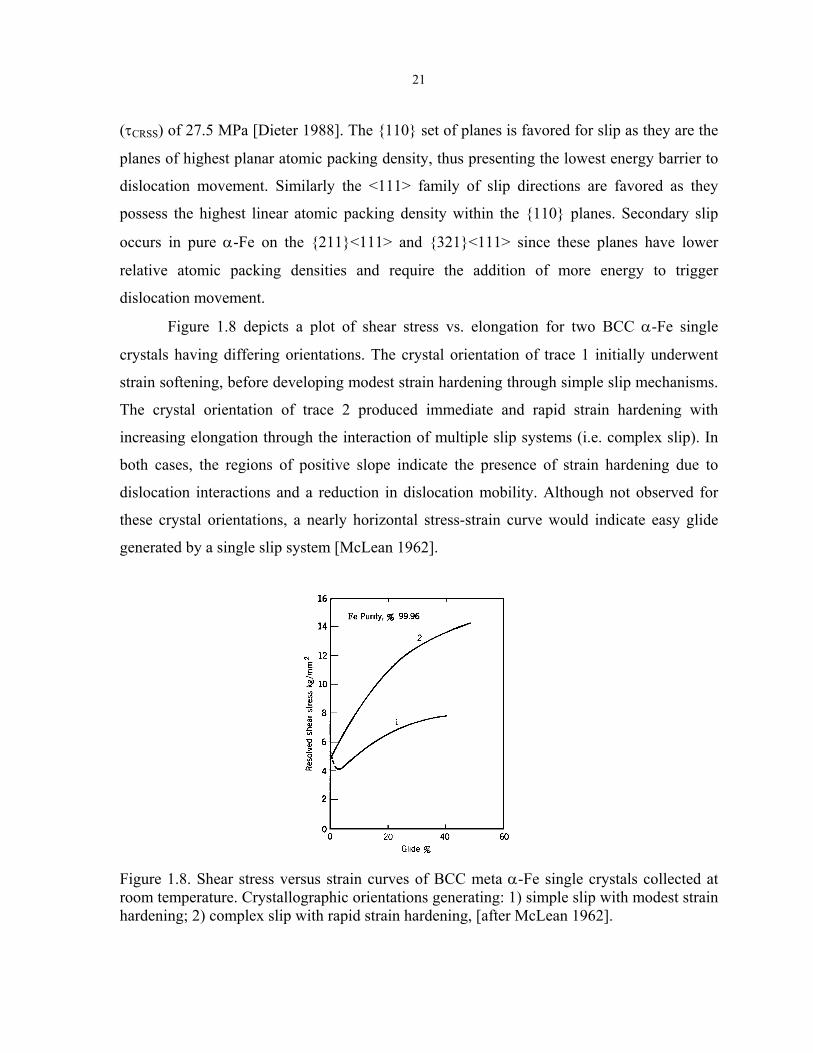
Figure 1.8 depicts a plot of shear stress vs. elongation for two BCC α-Fe single
crystals having differing orientations. The crystal orientation of trace 1 initially underwent
strain softening, before developing modest strain hardening through simple slip mechanisms.
The crystal orientation of trace 2 produced immediate and rapid strain hardening with
increasing elongation through the interaction of multiple slip systems (i.e. complex slip). In
both cases, the regions of positive slope indicate the presence of strain hardening due to
dislocation interactions and a reduction in dislocation mobility. Although not observed for
these crystal orientations, a nearly horizontal stress-strain curve would indicate easy glide
generated by a single slip system [McLean 1962].
Figure 1.8. Shear stress versus strain curves of BCC meta α-Fe single crystals collected at room temperature. Crystallographic orientations generating: 1) simple slip with modest strain hardening; 2) complex slip with rapid strain hardening, [after McLean 1962].
22
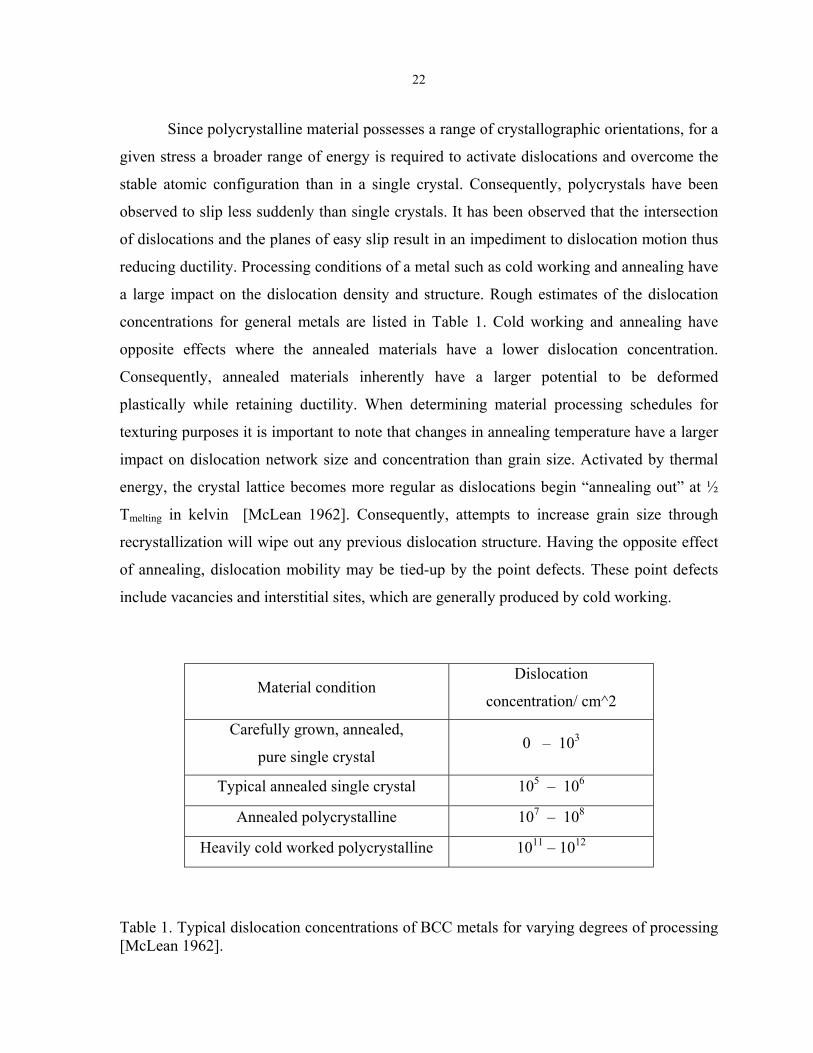
Since polycrystalline material possesses a range of crystallographic orientations, for a
given stress a broader range of energy is required to activate dislocations and overcome the
stable atomic configuration than in a single crystal. Consequently, polycrystals have been
observed to slip less suddenly than single crystals. It has been observed that the intersection
of dislocations and the planes of easy slip result in an impediment to dislocation motion thus
reducing ductility. Processing conditions of a metal such as cold working and annealing have
a large impact on the dislocation density and structure. Rough estimates of the dislocation
concentrations for general metals are listed in Table 1. Cold working and annealing have
opposite effects where the annealed materials have a lower dislocation concentration.
Consequently, annealed materials inherently have a larger potential to be deformed
plastically while retaining ductility. When determining material processing schedules for
texturing purposes it is important to note that changes in annealing temperature have a larger
impact on dislocation network size and concentration than grain size. Activated by thermal
energy, the crystal lattice becomes more regular as dislocations begin “annealing out” at ½
Tmelting in kelvin [McLean 1962]. Consequently, attempts to increase grain size through
recrystallization will wipe out any previous dislocation structure. Having the opposite effect
of annealing, dislocation mobility may be tied-up by the point defects. These point defects
include vacancies and interstitial sites, which are generally produced by cold working.
Material condition Dislocation
concentration/ cm^2
Carefully grown, annealed,
pure single crystal 0 – 103
Typical annealed single crystal 105 – 106
Annealed polycrystalline 107 – 108
Heavily cold worked polycrystalline 1011 – 1012
Table 1. Typical dislocation concentrations of BCC metals for varying degrees of processing [McLean 1962].
23
1.4.4 Grain boundaries
With the goal of producing textured iron-substituted alloys possessing optimized
mechanical properties in addition to the desired magnetic properties, one must consider the
effect of grain boundaries. Grain boundaries have long been known to significantly influence
material characteristics such as yield strength, ductility and crack propagation through their
effect on dislocation movement.
Grain boundaries are defined as an atomic misfit, over a distance two to three atoms
wide, which separate grains or localized areas of homogeneous crystallographic orientation.
The size and geometry of grain boundaries are governed by the minimization of energy,
hence satisfying surface tension and space filling rules. Grain boundaries raise the overall
energy of the material and act as preferred sites for the absorption and emission of defects.
During the process of annealing, in which thermal energy promotes atomic rearrangement
and the elimination of grain boundaries, precipitates and solutes may impede grain boundary
migration. Precipitates and solutes are often used to control a metal’s crystallography and
modify the material properties through the control of grain sizes.
In addition to grain boundaries, a more subtle but similar crystallographic structure
exists. Sub-boundaries within individual grains are commonly observed where the crystal
lattice exhibits misorientations up to 1°. Unlike grain boundaries, the sub-grain boundaries
are thought to have little influence on the material’s mechanical properties.
Grain boundaries affect a material’s mechanical properties in several ways. One-way
is due to the change in crystallographic direction from grain to grain, which causes slip
planes to become discontinuous across the grain boundary. As a result, dislocations are tied
up at the boundaries thus requiring the activation of several slip systems to move. This
increase in activation energy is one source of strain hardening under cyclic loading
conditions.
A second effect on material properties is developed through grain boundaries’ ability
to impede the mobility of dislocations. By this action, an increase in the quantity of grain
boundaries per unit volume of material (through decreasing grain size) will increase the yield
stress. Observations of many metals have shown good correlations where yield stress,
ductility and hardness are proportional to (grain size)-1/2. (These empirical relationships
24
eventually do fail however for exceedingly fine grain sizes.) To quantify the yield stress
correlation, a flow-stress relationship has been developed which assumes that all grains are
the same size and shape and that the grain boundaries have the same properties. The flow-
stress equation is listed in Equation 1.9 where σ is the flow-stress at a given plastic strain, σo
is a constant for the flow-stress of a grain in tension, K is a constant representing the flow
coupling effect of the boundary and d is the mean grain diameter [Kurzyalowski 1996].
21dK
o +=σσ (1.9)
Another grain boundary effect is that at higher temperatures grain boundaries provide
a shear system resulting in voids and creep. Finally, grain boundaries may provide a path for
crack propagation if intergranular adhesion is poor.
Grain boundaries and grain size have many implications for the material designer.
Although finer grain sizes improve mechanical characteristics such as yield strength, they
may also be detrimental from a magnetic perspective. Grain boundaries tend to impede
magnetic domain wall motion, leading to larger energy losses in changing magnetic fields.
Material texturing techniques will have to strike the proper balance between the desired
mechanical and magnetic properties through the control of grain size and their boundaries.
1.4.5 Fracture
The highest true breaking strengths of metals rarely exceed E⁄5 to E⁄10 , where E is the
material’s elastic modulus. Theoretically, a maximum strength of E⁄2 is achievable. However,
due to structural heterogeneity, failure does not begin everywhere simultaneously. There are
five common types of failure processes: ductile, brittle, adiabatic shear, creep, and fatigue
fracture. Of these, ductile and brittle fracture processes will be examined for their relevance
to the design of textured materials. The high temperature phenomena of creep and high-speed
effect of adiabatic shear are considered to be beyond the scope of interest at this time.
Fatigue will be discussed in a later section.
Ductile failures under tensile stress (experimentally observed as a cup and cone
morphology) are conveniently divided into three stages. In stage one, the specimen necks
25
down and cavities form around point imperfections. As necking continues in stage two, the
cavities join to form a larger cavity that spreads transversely through the specimen. In the
third stage, the cavity develops into a crack propagating at 45°outward to the surface. The
influence of material structure on ductile fracture is manifested in two ways. First, a strong
relationship has been demonstrated where the fracture stress is proportional to (grain size)-1/2.
This is known as the Hall-Petch relationship and has the same form as the previously
discussed relationship of yield stress to grain size [Jimenez 1995]. Second, crystallographic
texture causes anisotropy in the observed fracture strengths. Typically, BCC materials are
more ductile in the cast and or working direction. This is most likely due to availability of
active slip planes accommodating induced shear stress.
Brittle fracture occurs when crack propagation proceeds in the absence of plastic
deformation. The fracture travels along a cleavage plane within the grains and/or along grain
boundaries. A tough/brittle transition temperature To may be observed where brittle fracture
occurs below To and ductile fracture occurs above To. Below To, the yield stress exceeds the
fracture stress. For reference, To ≅ -200°C for mild steel. The stress required to propagate the
fracture path depends on the cohesive strength of the atoms. The lower the required stress is
for fracture, the lower the amount of plastic work or deformation that can be done before
failure occurs. The controlling factor is the energy of the two new surfaces after fracture.
Depending on their chemical nature, the presence of solutes can either impede or promote
brittle crack propagation along grain boundaries. The presence of oxygen in iron (as little as
0.01%) has been shown to raise To by 200°C thus changing the fracture path from a
transcrystalline (100) failure to an intergranular failure [McLean 1964]. The method of heat
treatment and cooling rate is an important factor in controlling the solute concentration along
grain boundaries. Slow cooling generally allows time for compositional segregation. Thus,
water quenching tends to lower the tough/brittle transition temperature. Increasing grain size
also has the same effect as operating at lower temperature, thus decreasing the fracture stress
relative to the yield stress. Crack propagation across a grain boundary is generally impeded
since cleavage planes across the boundary usually do not coincide. To continue propagation
of the cleavage plane, the crack must propagate intergranularly until it initiates the crack in
the adjoining crystal. Lastly, strain rate is an important factor in determining the type
26
fracture. Sufficiently high strain rates may exceed the flow rate of the material thus favoring
brittle failure over deformation. For example, notched specimens behave in an increasingly
brittle manner with higher strain rates developed at the notch root.
By taking advantage of the proper working direction, cube textured Fe-Ga alloys
should exhibit superior ductility in the expected direction of loading, i.e. on the [100]
direction. Given the fracture-stress relationship to grain size, texturing efforts should also
strive for the smallest grain size possible. To suppress intergranular brittle failures,
solutionizing heat treatments and quenching must be considered, particularly for Ga
substitution >17 at. %, to limit the formation of grain boundary precipitates. Finally, oxygen
contamination during texturing processes should be avoided to suppress intergranular brittle
failures.
1.4.6 Cyclic strain hardening/softening and fatigue
Textured iron-gallium alloys may find use in transducer or structural systems where
cyclical stress overloads resulting in plastic strains occur. Therefore, an examination of cyclic
strain hardening/softening processes leading to fatigue in BCC metals is necessary for the
appropriate design and application of these materials.
Whether a metal will undergo cyclic strain hardening or softening when first
subjected to cyclic plastic deformation generally depends on the material’s processing
history. Cold worked and solute or precipitate hardened materials cyclic soften while as-
annealed materials cyclic harden. An empirical relationship describing strain
hardening/softening is the power law relationship of Equation 1.10 where stress amplitude σa
is a function of the plastic strain amplitude εa, the cyclic strength coefficient k, and the cyclic
strain hardening exponent n [Bily 1993]. This relationship has been observed for metals in
general. However, with an adequate database, this relationship may be used to determine how
quickly a specific textured BCC material strain hardens/softens, thus ultimately leading to
fatigue life predictions.
(1.10) ( )naa k ε=σ

27
Examining the details of strain hardening/softening at a microscopic level offers some
insights to the mechanisms that will be active in textured BCC metals. According to
microscopic theory of plastic deformation, the flow stress at any point on the stress-strain
hysteresis loop (in the region of plastic deformation) represents impediments to dislocation
movement. To a first approximation, in BCC metals this is described by Equation 1.11 where
the externally applied stress σapplied is in equilibrium with the sum of internal stresses. These
internal stresses include short-range stress σshort-range due to point defects and long-range
stress σlong-range due to a pile up of dislocations.
(1.11) rangelongrangeshortapplied −− σ+σ=σ
The short-range stresses are known to be strongly dependent on temperature and strain rate
while long-range stresses are related to dislocation density and configuration. In BCC metals,
the temperature dependence of short-range stress is due to the activation of screw
dislocations. Above the transition temperature To, typically (0.1 – 0.2)Tmelt (in kelvin), screw
dislocations move as easily as edge dislocations. For pure iron, measurements have shown
that To = room temperature for strain rates of 10-5 1/sec. For comparison, typical fatigue
processes occur at strain rates of 10-3 to 10-2 1/sec. Consequently, strain hardening/softening
and ultimately the fatigue response of iron-substituted alloys will likely be governed by low
temperature processes involving edge dislocations [Bily 1993].
Gauging the scale of the temperature dependent microscopic processes just described,
strain hardening has been described as weak in BCC metals. The three factors attributed to a
weak strain hardening response are the ease of cross slip, weakness of attractive junctions
and the occurrence of pencil glide (slip occurring in the [111] direction on numerous planes)
[Bily 1993].
Despite the “weak” effect of strain hardening in BCC metals, consideration of grain
size is also warranted. It has been shown that plastic anisotropy dominates the strain
hardening process due to grain boundary interruption of slip for up to several percent of
elongation. Thereafter, the rate of strain hardening is the same in single and polycrystals
[McLean 1964]. In other words, fine-grained materials strain harden faster than their large-
grain counterparts if the elongation is not excessive.

28
Following strain hardening/softening, cyclic loading of sufficient amplitude and/or
duration promotes fatigue damage and ultimately fatigue failure. Cyclic plastic deformation
is the primary cause for the accumulation of damage during cyclic loading. Plastic
deformation of the material volume can cause changes in the material properties while
localized plastic deformation may lead to microcracks developing at nucleation sites. The
three stages of the fatigue process include:
1. Strain hardening/softening occurring due to interaction of dislocations.
2. Nucleation of fatigue cracks in localized zones of plastic slip (persistent slip bands).
3. Propagation of fatigue cracks into high stress region of localized zones of plastic
deformation.
Having examined the processes facilitating fatigue, it is obvious that the fatigue
properties of metals are significantly influenced by their microstructure. With the goal of
designing fatigue resistant textured BCC materials, several additional effects of grain
structure should be considered. Fine grains provide better fatigue resistance through
reduction of strain along slip bands thus decreasing the irreversible slip that leads to damage
accumulation. Furthermore, fine grains provide more grain boundaries thus assisting in
transcrystalline crack arrest. Finally, anisotropy developed through cold working improves
fatigue resistance for loading conditions in the direction of working due to elongated grain
structure in the direction of loading [Stephens 2001].
1.4.7 Environmental susceptibility
Another factor to be considered in the design of textured BCC metals is their
susceptibility to environmental effects. In particular, brittle failure and fatigue properties can
be heavily dependent on surface effects such as corrosion. Corrosion is known to facilitate
brittle failure at lower stress levels and shorten fatigue life. Randomly oriented grains in
polycrystalline materials tend to perpetuate these effects due to the individual grains’
anisotropic properties. The grains’ varying orientations lead to stress concentration at the
grain boundaries thus hastening crack formation and the penetration of corrosion. In contrast,
the low-angle grain boundaries of a highly textured material may reduce these stress
29
concentrations and tend to resist corrosion. Also affecting a material’s corrosion resistance,
oxide formation has been shown to be dependent on the crystal orientation at the surface.
Although composition sensitive, the rate of growth of iron oxides has been found to be
lowest on (110) iron alloy sheet surfaces. The oxide film that does form is tightly bound, thus
reducing metal loss due to further oxidation [Titerov 1998].
1.4.8 Material texturing summary
Considering the general trends in strength, fatigue and corrosion resistance of general
BCC metals, the prospects for achieving acceptable mechanical properties in heavily textured
iron-substituted alloys are good. The goal will be to produce fine-grained polycrystalline
structure free of defects and impurities in order to promote higher yield strengths and crack
propagation resistance. Although anisotropy of the desired 100<100> cube texture will
result in a soft material in the loading direction, the use of low-angle grain boundaries and
elongated crystals in the direction of loading will promote ductility and resistance to low
cycle fatigue failure. Additional benefits of a highly textured material containing low-angle
grain boundaries will be resistance to the penetration of surface corrosion.
1.5 Cubic crystal elasticity relationships
The elastic anisotropy of the BCC crystal lattice may be associated with the
directional dependence in the atomic packing density (Figure 1.1b), which is ultimately
attributed to the crystal lattice existing in its lowest energy configuration. Anisotropic elastic
properties are used to describe the material’s stress-strain relationships relative to its
crystallographic axes (i.e. the material coordinate system). The following section reviews the
elasticity relationships for cubic systems and the rotational coordinate transformation method
that allows the bulk elastic properties in the global coordinate system to be described in terms
of material stiffness constants [Mason 1958]. These transformation methods will allow
quantities such as Young’s modulus and Poisson’s ratios to be described in terms of the
material elastic constants and visa versa.
30
1.5.1 Stress-strain transformations
Analysis of a material’s anisotropic elastic properties is facilitated using the
generalized Hook’s law (Equation 1.12). In the case of cubic crystals, symmetry permits the
relationships between stress σi and strain ej to be completely defined using the three second-
order engineering elastic constants c11, c12 and c44 [Nye 1985].
jiji ec=σ (1.12)
where i = 1, 2,…6; j = 1,2,…6,and c11 = c22 = c33; c12 = c21 = c13 = c31 = c32 = c23; c44 = c55 =
c66. All other cij = 0.
This engineering stress-strain relationship may be expanded for the material coordinate
system as:
γγγεεε
=
τττσσσ
12
13
23
33
22
11
44
44
44
111212
121112
121211
12
13
23
33
22
11
cc
cccccccccc
where the engineering shear stress and engineering shear strain are represented respectively
by τ and γ. Principle stress and strains are equivalent for the tensor and engineering
representation thus the usual σ and ε notation are used.
The numbered subscripts for the stress and strain variables indicate the material
coordinate system. The first subscript represents the material face upon which the stress is
applied and the second subscript represents the direction in which the applied stress acts.
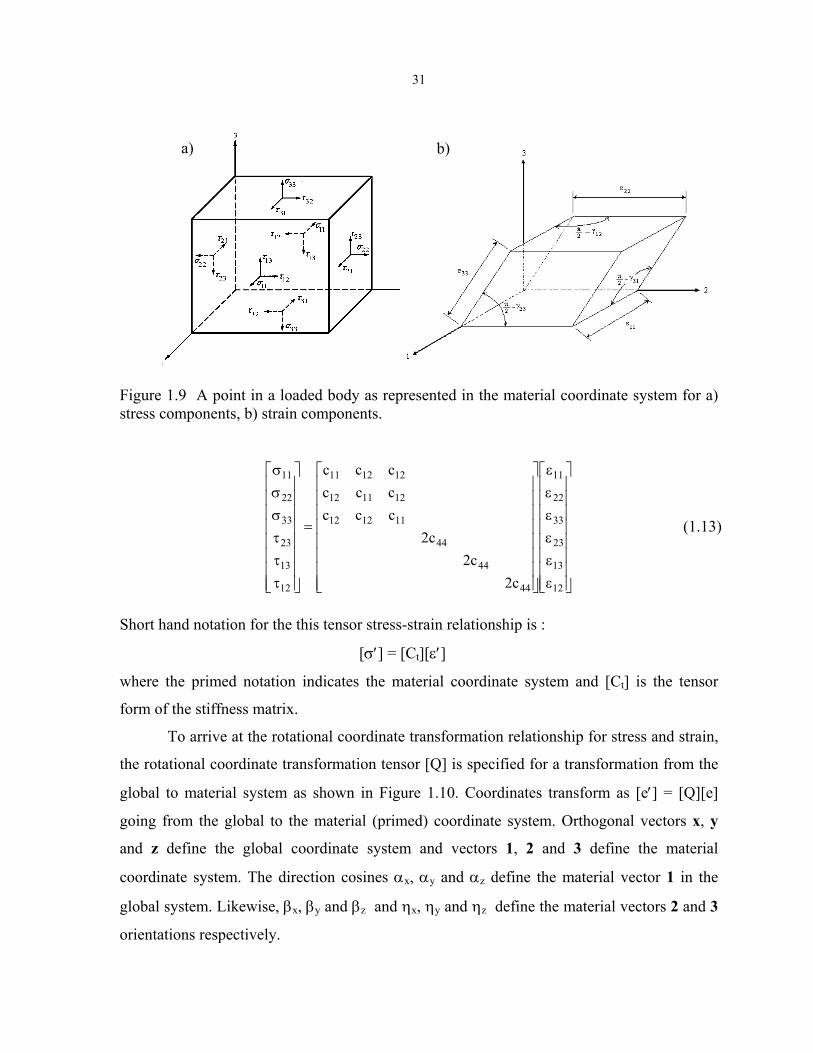
Figure 1.9 depicts the stress and strain components in a loaded body for the material
coordinate system.
Rotational coordinate transformation of the material stress-strain relationship will
allow the global elastic response to be determined for arbitrary grain orientations. To
accomplish this, tensor notation is used. The tensor representation of Hooke’s law (Equation
1.12) is given in Equation 1.13 where the conversion of engineering shear strains to tensor
shear strains requires that ε23 = γ23/2, ε13 = γ13/2, and ε12 = γ12/2. A compensating factor of 2
has been applied to the corresponding terms of the stiffness matrix.
31
b) a)
Figure 1.9 A point in a loaded body as represented in the material coordinate system for a) stress components, b) strain components.
εεεεεε
=
τττσσσ
12
13
23
33
22
11
44
44
44
111212
121112
121211
12
13
23
33
22
11
c2c2
c2ccccccccc
(1.13)
Short hand notation for the this tensor stress-strain relationship is :
[σ′] = [Ct][ε′]
where the primed notation indicates the material coordinate system and [Ct] is the tensor
form of the stiffness matrix.
To arrive at the rotational coordinate transformation relationship for stress and strain,
the rotational coordinate transformation tensor [Q] is specified for a transformation from the
global to material system as shown in Figure 1.10. Coordinates transform as [e′] = [Q][e]
going from the global to the material (primed) coordinate system. Orthogonal vectors x, y
and z define the global coordinate system and vectors 1, 2 and 3 define the material
coordinate system. The direction cosines αx, αy and αz define the material vector 1 in the
global system. Likewise, βx, βy and βz and ηx, ηy and ηz define the material vectors 2 and 3
orientations respectively.
32
ηηηβββααα
=
zyx
zyx
zyx
Q
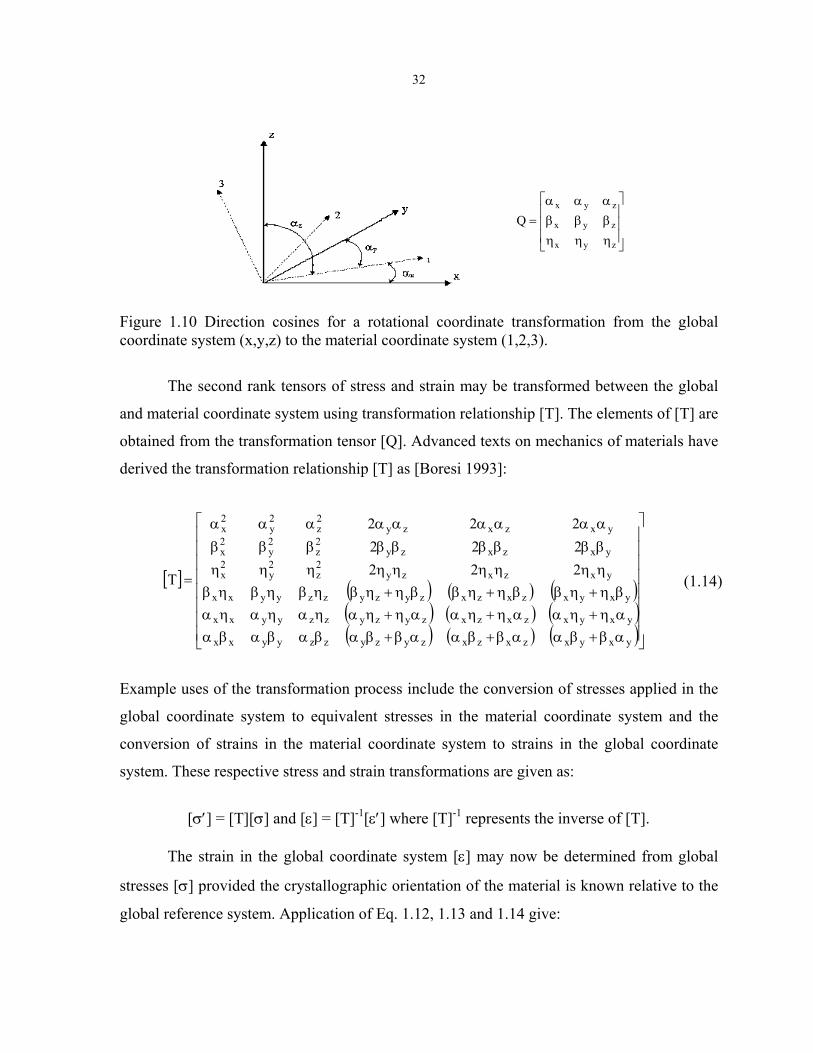
Figure 1.10 Direction cosines for a rotational coordinate transformation from the global coordinate system (x,y,z) to the material coordinate system (1,2,3).
The second rank tensors of stress and strain may be transformed between the global
and material coordinate system using transformation relationship [T]. The elements of [T] are
obtained from the transformation tensor [Q]. Advanced texts on mechanics of materials have
derived the transformation relationship [T] as [Boresi 1993]:
[ ] ( ) ( ) (( ) ( ) ( )( ) ( ) ( )
αβ+βααβ+βααβ+βαβαβαβααη+ηααη+ηααη+ηαηαηαηαβη+ηββη+ηββη+ηβηβηβηβ
ηηηηηηηηη
βββββββββ
ααααααααα
=
yxyxzxzxzyzyzzyyxx
yxyxzxzxzyzyzzyyxx
yxyxzxzxzyzyzzyyxx
yxzxzy2z
2y
2x
yxzxzy2z
2y
2x
yxzxzy2z
2y
2x
222222222
T ) (1.14)
Example uses of the transformation process include the conversion of stresses applied in the
global coordinate system to equivalent stresses in the material coordinate system and the
conversion of strains in the material coordinate system to strains in the global coordinate
system. These respective stress and strain transformations are given as:
[σ′] = [T][σ] and [ε] = [T]-1[ε′] where [T]-1 represents the inverse of [T].
The strain in the global coordinate system [ε] may now be determined from global
stresses [σ] provided the crystallographic orientation of the material is known relative to the
global reference system. Application of Eq. 1.12, 1.13 and 1.14 give:
33
[ε] = [T]-1[ε′] = [T]-1[Ct] -1[σ′] = [T]-1[Ct] -1[T] [σ] (1.15)
Rearrangement of Eq. 1.15 gives the global stress generated by global strains as [σ] = [Dt] [ε]
where the equivalent tensor stiffness matrix is:
[Dt] = [T]-1[Ct] -1[T] (1.16)
1.5.2 Elastic characteristics from material properties
The elastic characteristics such as Young’s modulus and Poisson’s ratio of a
specimen and their measurement are dependent on material properties and the material
orientation relative to the observation (global) coordinate system. Utilizing the elasticity and
transformation relationships of the previous section, elastic properties such as Young’s
modulus and Poisson’s ratio may be stated in terms of cij for any direction [Mason 1958]. The
Young’s modulus E[uvw] is defined as the ratio of stress to strain for which a collinear stress
application and strain measurement occur in the [uvw] direction. The Poisson’s ratio ν[uvw] is
defined as the negative ratio of transverse strain to longitudinal strain that results from
loading in the longitudinal direction where the [uvw] subscript indicates the direction of the
transverse strain measurement.
For uniaxial loading conditions found in typical tensile test configurations, the
anisotropy of a cubic material’s elastic properties may be emphasized by using two high-
symmetry crystal orientations and loading directions that generate minimum or maximum
crystal lattice shear stress conditions. The effects of c11 and c12 may be expressed
independently from c44 through uniaxial [100] loading of a (001)[100] single crystal. With
this loading condition the directionally dependent relationships for E and ν arise as given in
Equations 1.17 and 1.18 [Jain 1990].
Young’s modulus: 1211
11100 cc
RcΕ ][ += (1.17)
Poisson’s ratios: 1211
12001010 cc
c+
== ][][ νν , (1.18)
where ( )( 1211121111
21 ccccc
R +−= ) .
34
The effect of c44 on the elastic response becomes highly evident for the uniaxial [110]
loading of a (001)[110] single crystal. If the values of c11 and c12 are known, c44 may be
easily related to the directionally dependent values of E and ν given in Eqs. 1.19, 1.20, and
1.21 where R is the same as used above [Jain 1990].
Young’s modulus: 44
44110 2
4cRRcΕ ][ +
= (1.19)
The first Poisson’s ratio: 44
44011 2
2cRcR
+−
=][ν , )
The second Poisson’s ratio: ( )4411
4412001 2
4cRc
cc+
=][ν ,
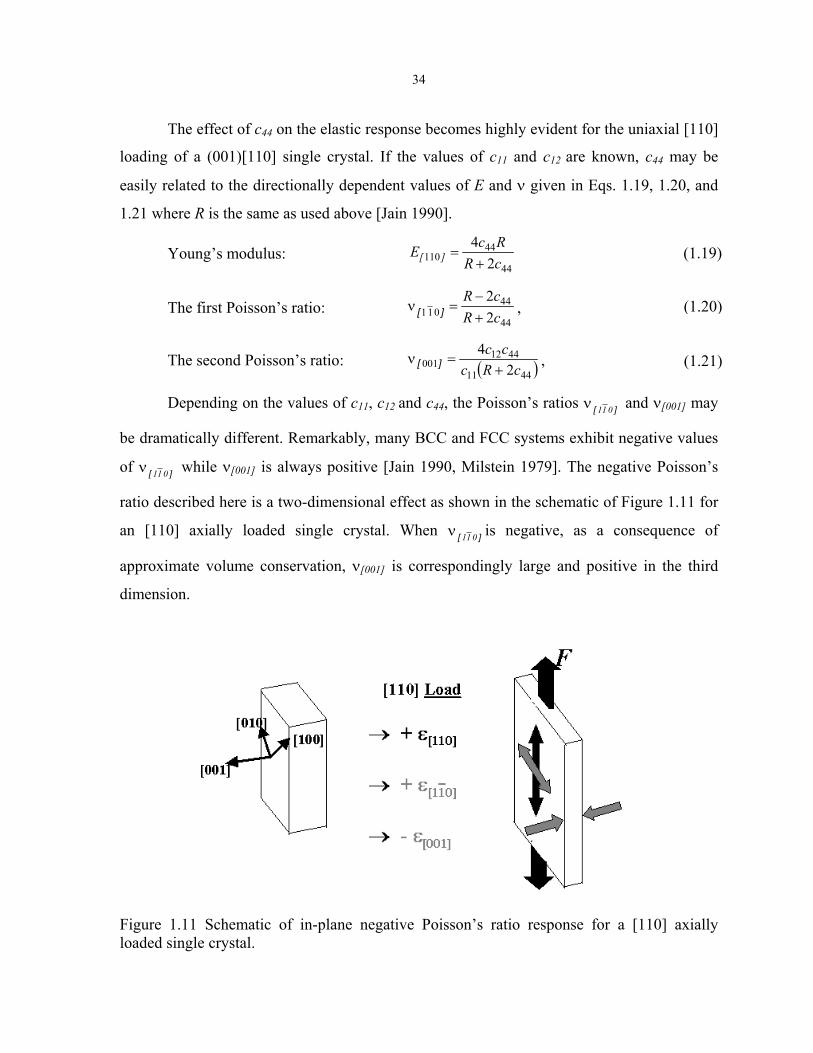
Depending on the values of c11, c12 and c44, the Poisson’s ratios ][ 011ν and ν[001]
be dramatically different. Remarkably, many BCC and FCC systems exhibit negative v
of ][ 011ν while ν[001] is always positive [Jain 1990, Milstein 1979]. The negative Pois
ratio described here is a two-dimensional effect as shown in the schematic of Figure 1.1
an [110] axially loaded single crystal. When ][ 011ν is negative, as a consequenc
approximate volume conservation, ν[001] is correspondingly large and positive in the
dimension.
Figure 1.11 Schematic of in-plane negative Poisson’s ratio response for a [110] axloaded single crystal.
(1.20
(1.21)
may
alues
son’s
1 for
e of
third
ially
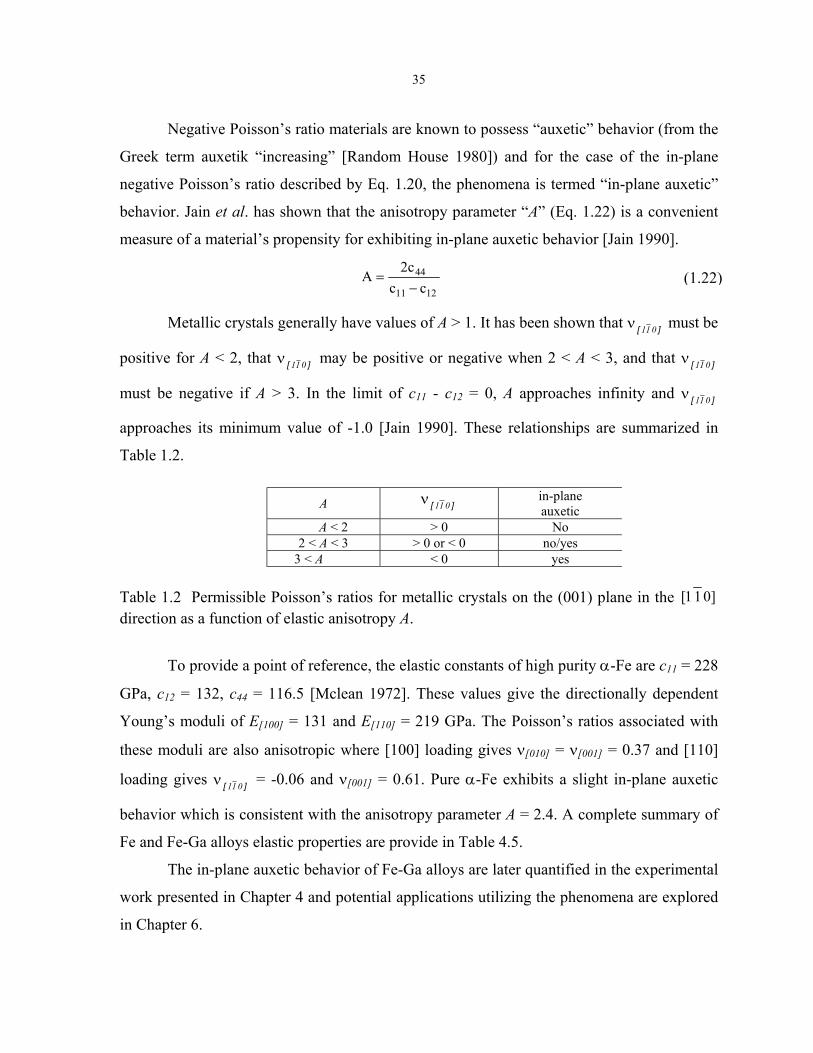
35
Negative Poisson’s ratio materials are known to possess “auxetic” behavior (from the
Greek term auxetik “increasing” [Random House 1980]) and for the case of the in-plane
negative Poisson’s ratio described by Eq. 1.20, the phenomena is termed “in-plane auxetic”
behavior. Jain et al. has shown that the anisotropy parameter “A” (Eq. 1.22) is a convenient
measure of a material’s propensity for exhibiting in-plane auxetic behavior [Jain 1990].
A1211
44
ccc2−
= ( )
Metallic crystals generally have values of A > 1. It has been shown that ][ 011ν mu
positive for A < 2, that ][ 011ν may be positive or negative when 2 < A < 3, and that ν
must be negative if A > 3. In the limit of c11 - c12 = 0, A approaches infinity and ν
approaches its minimum value of -1.0 [Jain 1990]. These relationships are summarize
Table 1.2.
2 <
3 <
Table 1.2 Permissible Poisson’s ratios for metallic crystals on the (001) plane in the 1[direction as a function of elastic anisotropy A.
To provide a point of reference, the elastic constants of high purity α-Fe are c11 =
GPa, c12 = 132, c44 = 116.5 [Mclean 1972]. These values give the directionally depen
Young’s moduli of E[100] = 131 and E[110] = 219 GPa. The Poisson’s ratios associated
these moduli are also anisotropic where [100] loading gives ν[010] = ν[001] = 0.37 and [
loading gives ][ 011ν = -0.06 and ν[001] = 0.61. Pure α-Fe exhibits a slight in-plane au
behavior which is consistent with the anisotropy parameter A = 2.4. A complete summa
Fe and Fe-Ga alloys elastic properties are provide in Table 4.5.
The in-plane auxetic behavior of Fe-Ga alloys are later quantified in the experim
work presented in Chapter 4 and potential applications utilizing the phenomena are exp
in Chapter 6.
1.22
st be
][ 011
][ 011
d in
A ][ 011ν in-plane auxetic
A < 2 > 0 No A < 3 > 0 or < 0 no/yes
A < 0 yes
]01
228
dent
with
110]
xetic
ry of
ental
lored
36
2. MATERIAL PROCESSING, TEXTURING AND PERFORMANCE
The objective of metallurgical processing of the Fe-Ga alloys is to produce a
disordered solid solution of Ga in α-Fe accompanied by a high degree of preferred
crystallographic orientation or “texture”. Single crystal specimens exemplify perfect texture
and were produced to possess the maximum elastic anisotropy and magnetostrictive potential
for their stoichiometries. These single crystal specimens are used to establish a baseline for
the alloy’s mechanical and magnetostrictive and characteristics. Although the procedure used
in the manufacture of single-crystals is well established, the best methods for producing
textured polycrystalline Fe-Ga alloys are unknown and are the focus of investigation in this
research. Polycrystalline texturing methods undertaken in this work include directional
crystal growth, deformation texturing and powder metallurgy methods.
The saturation magnetostriction properties of single crystal and textured
polycrystalline material may be determined with directionally applied magnetic fields using
disk shaped specimens and with coaxially applied compressive stress and magnetic fields
using rod shaped specimens. The testing method for disk samples is presented next as it is
used to characterize many of the specimens. Thereafter, the corresponding production
methods and saturation magnetostriction properties of single and textured polycrystalline
specimens are reported. Saturation magnetostriction testing methods for rod-shaped
specimens reported in this chapter utilize a thermally controlled transducer. This test method
is elaborated upon in Chapter 3 in conjunction with a description of the non-saturation
magnetization and magnetostriction characteristics of the rod-shaped specimens.
2.1 Saturation magnetostriction testing
The magnetostrictive properties of a specimen may be measured using a directionally
applied magnetic field. If the applied field is strong enough, the specimen becomes
magnetically saturated to form a single domain with the vector of Ms aligned in the applied
magnetic field direction. Accompanying the change from a demagnetized state to one of
magnetization saturation, the specimen experiences a net magnetostriction equivalent to the
saturation magnetostriction λs. The values of λ|| and λ⊥ represent the respective occurrence of

37
λs with the applied magnetic field oriented parallel and perpendicular to the material
direction of interest. The schematic in Figure 2.1 depicts the face view of a strain gaged disk-
shaped specimen with rotation orientations differing by 0° and 90° relative to a saturating
magnetic field H. The depiction of the field-induced change in specimen geometry from
round (dotted outline) is exaggerated for a strain response dominated by a positive
magnetostriction constant.
From the saturation magnetostriction relationship of Equation 1.4 and with disk
rotation orientations defined by the angle θ, it can be shown that λs varies as a function of
cos2(θ). Additionally, the net saturation magnetostriction λ||-⊥ gives the specimen’s maximum
magnetostriction capability for the chosen direction of strain measurement. Appropriate to
the determination of single crystal magnetostriction constants, if the strain gage orientation of
a specimen is aligned with the [100] material direction, then λ||-⊥ = (3/2)λ100. Similarly, if the
strain gage is aligned with the specimen’s [111] material axis then λ||-⊥ = (3/2)λ111. To
determine the magnetostrictive capability of textured polycrystalline specimens, where the
direction and degree of texturing may be unknown, strain gage rosettes are appropriate for
determining magnetostriction induced principle strains and ultimately the direction of
maximum λ||-⊥.
λ⊥
θ = 90°
H
λ||
θ = 0°
strain gage
H
a) b)
Figure 2.1 Schematic of saturation magnetostriction testing of a disk sample for orthogonal rotation orientations: a) Specimen and strain gage parallel to applied field H to give saturation magnetostriction λ||; b) Specimen and strain gage perpendicular to applied field H to give saturation magnetostriction λ⊥. Note that the dotted outline represents an unstrained disk under zero applied field conditions.

38
Saturation magnetostriction measurements of Fe-Ga samples, depending on the
particular specimen, utilized disk geometries with diameters from 6.4 to 7.9 mm and
thickness values ranging from 0.1 to 0.38 mm. For these dimensions the geometric
demagnetizing factors are no worse than ∼ 1%, therefore internal fields are approximately
equal to applied fields [Jiles 1998]. Disk specimens were subjected to a 9000 Oe applied field
H which was generated in a 12.7-mm air gap between neodymium-boron magnets. Annealed
low-carbon steel provided a closed magnetic flux return path between the permanent
magnets. To measure magnetostrictive strains, each strain-gaged disk specimen was rotated
through 360° in 1.8° increments by a computer controlled stepper motor. The strain data was
collected under static conditions when the specimen rotation paused momentarily at each
angular position.
2.2 Single Crystal
Single crystal disk and rod shaped test specimens were extracted from single crystal
parent material. The production methods of the parent material are described first with the
saturation magnetostriction results to follow.
2.2.1 Materials preparation
Single crystals of Fe83.8Ga16.2 and Fe80.6Ga19.4 were produced in two separate
production runs. Each crystal was grown in an alumina crucible by the modified Bridgman
technique. The starting ingot for single crystal growth was prepared by arc-melting
appropriate quantities of Fe (99.99% purity) and Ga (99.999% purity) metal several times
under an Ar atmosphere. The button was then remelted, and the alloy was drop cast into a Cu
chill cast mold to ensure compositional homogeneity throughout the ingot.
The alloy was heated under a pressure of 1.3 x 10⁻⁴ Pa up to 1075 K to degas the
crucible and the ingot. The chamber was then backfilled to a pressure of 275 kPa with high
purity Ar. The ingot was then further heated to the growth temperature and held for 1 hour to
allow thorough mixing before withdrawing the sample from the heat zone at a rate of 4
mm/h. Following growth, the ingot was annealed at 1000°C for 168 hours and furnace
cooled. X-ray diffraction analysis confirmed the crystal's single-phase, fully disordered α
structure.
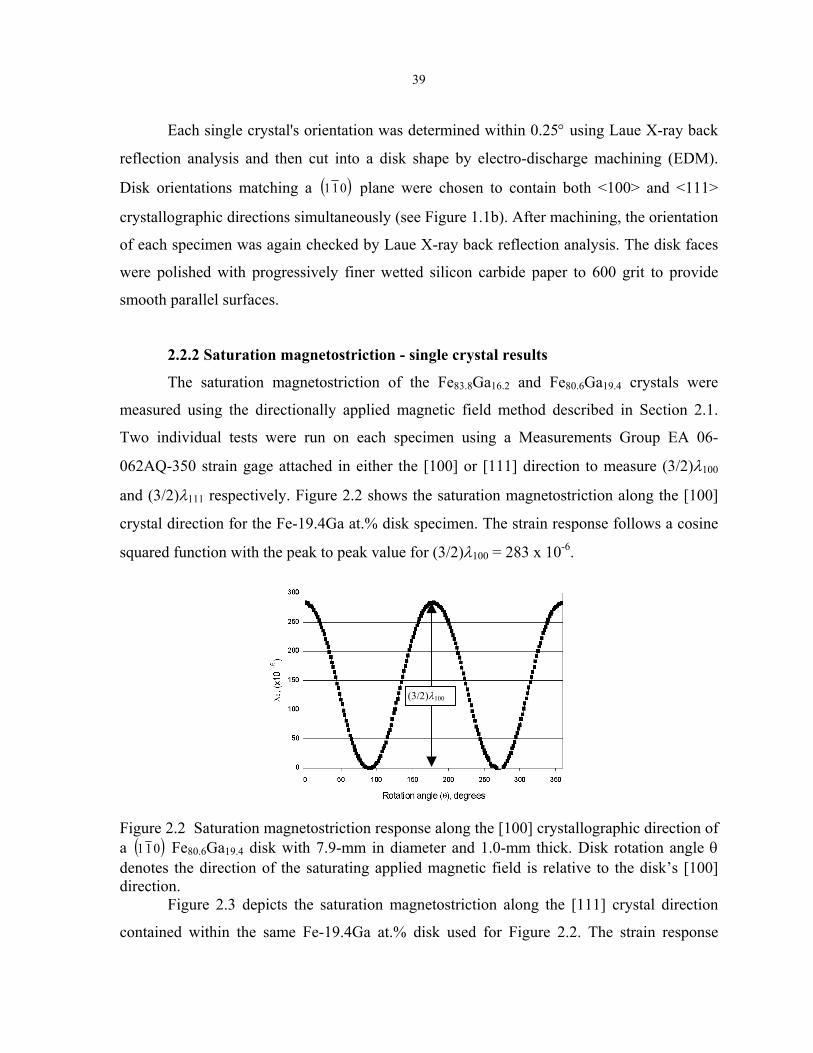
39
Each single crystal's orientation was determined within 0.25° using Laue X-ray back
reflection analysis and then cut into a disk shape by electro-discharge machining (EDM).
Disk orientations matching a ( 011 ) plane were chosen to contain both <100> and <111>
crystallographic directions simultaneously (see Figure 1.1b). After machining, the orientation
of each specimen was again checked by Laue X-ray back reflection analysis. The disk faces
were polished with progressively finer wetted silicon carbide paper to 600 grit to provide
smooth parallel surfaces.
2.2.2 Saturation magnetostriction - single crystal results
The saturation magnetostriction of the Fe83.8Ga16.2 and Fe80.6Ga19.4 crystals were
measured using the directionally applied magnetic field method described in Section 2.1.
Two individual tests were run on each specimen using a Measurements Group EA 06-
062AQ-350 strain gage attached in either the [100] or [111] direction to measure (3/2)λ100
and (3/2)λ111 respectively. Figure 2.2 shows the saturation magnetostriction along the [100]
crystal direction for the Fe-19.4Ga at.% disk specimen. The strain response follows a cosine
squared function with the peak to peak value for (3/2)λ100 = 283 x 10-6.
(3/2)λ100
Figure 2.2 Saturation magnetostriction response along the [100] crystallographic direction of a ( )011 Fe80.6Ga19.4 disk with 7.9-mm in diameter and 1.0-mm thick. Disk rotation angle θ denotes the direction of the saturating applied magnetic field is relative to the disk’s [100] direction.
Figure 2.3 depicts the saturation magnetostriction along the [111] crystal direction
contained within the same Fe-19.4Ga at.% disk used for Figure 2.2. The strain response
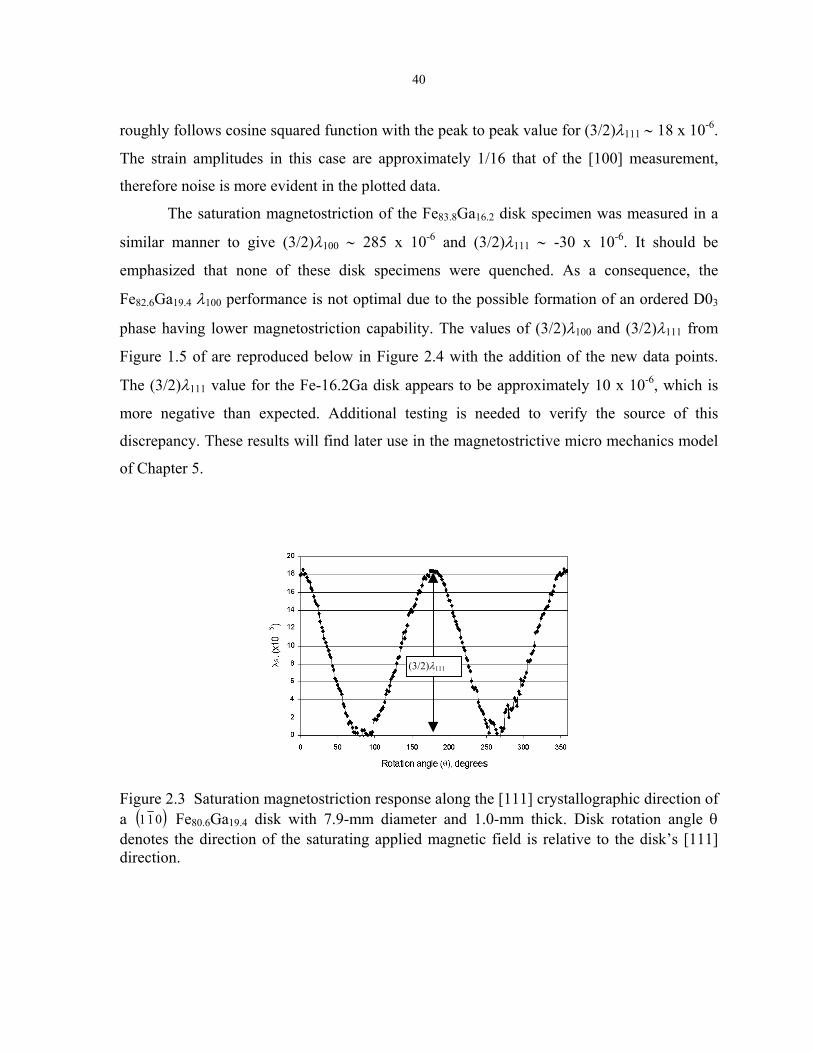
40
roughly follows cosine squared function with the peak to peak value for (3/2)λ111 ∼ 18 x 10-6.
The strain amplitudes in this case are approximately 1/16 that of the [100] measurement,
therefore noise is more evident in the plotted data.
The saturation magnetostriction of the Fe83.8Ga16.2 disk specimen was measured in a
similar manner to give (3/2)λ100 ∼ 285 x 10-6 and (3/2)λ111 ∼ -30 x 10-6. It should be
emphasized that none of these disk specimens were quenched. As a consequence, the
Fe82.6Ga19.4 λ100 performance is not optimal due to the possible formation of an ordered D03
phase having lower magnetostriction capability. The values of (3/2)λ100 and (3/2)λ111 from
Figure 1.5 of are reproduced below in Figure 2.4 with the addition of the new data points.
The (3/2)λ111 value for the Fe-16.2Ga disk appears to be approximately 10 x 10-6, which is
more negative than expected. Additional testing is needed to verify the source of this
discrepancy. These results will find later use in the magnetostrictive micro mechanics model
of Chapter 5.
(3/2)λ111
Figure 2.3 Saturation magnetostriction response along the [111] crystallographic direction of a ( 011 ) Fe80.6Ga19.4 disk with 7.9-mm diameter and 1.0-mm thick. Disk rotation angle θ denotes the direction of the saturating applied magnetic field is relative to the disk’s [111] direction.
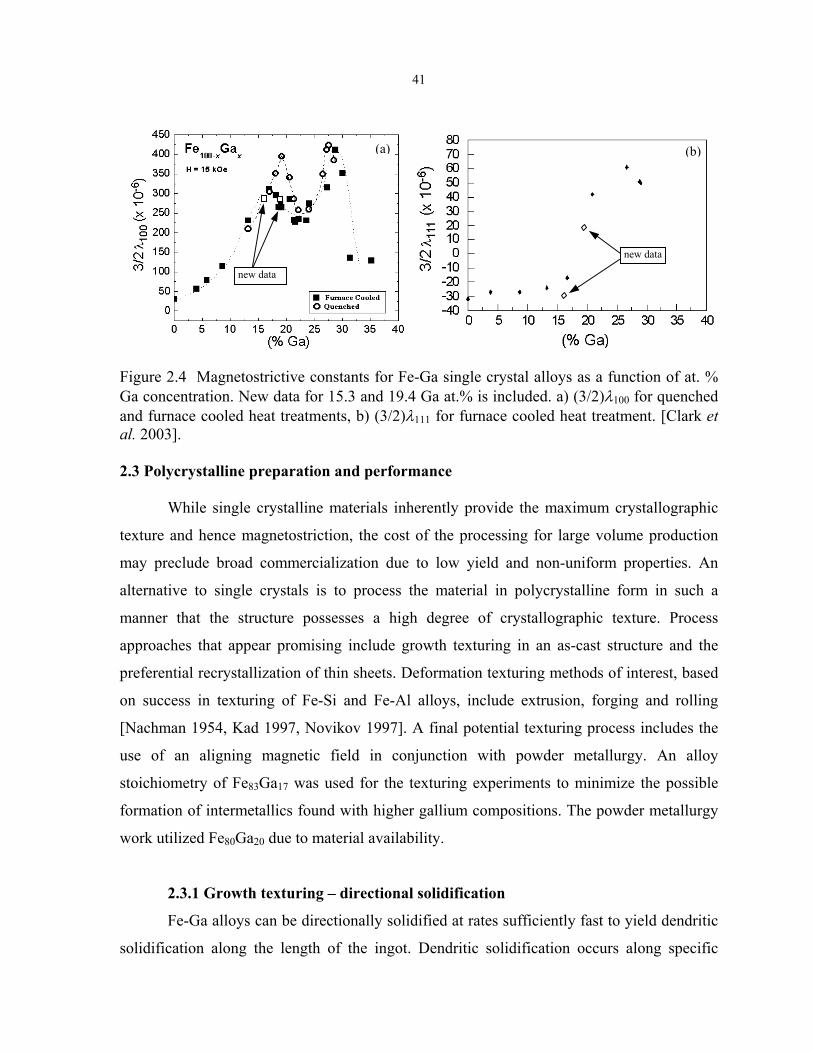
41
new data
(a)
new data
(b)
Figure 2.4 Magnetostrictive constants for Fe-Ga single crystal alloys as a function of at. % Ga concentration. New data for 15.3 and 19.4 Ga at.% is included. a) (3/2)λ100 for quenched and furnace cooled heat treatments, b) (3/2)λ111 for furnace cooled heat treatment. [Clark et al. 2003]. 2.3 Polycrystalline preparation and performance
While single crystalline materials inherently provide the maximum crystallographic
texture and hence magnetostriction, the cost of the processing for large volume production
may preclude broad commercialization due to low yield and non-uniform properties. An
alternative to single crystals is to process the material in polycrystalline form in such a
manner that the structure possesses a high degree of crystallographic texture. Process
approaches that appear promising include growth texturing in an as-cast structure and the
preferential recrystallization of thin sheets. Deformation texturing methods of interest, based
on success in texturing of Fe-Si and Fe-Al alloys, include extrusion, forging and rolling
[Nachman 1954, Kad 1997, Novikov 1997]. A final potential texturing process includes the
use of an aligning magnetic field in conjunction with powder metallurgy. An alloy
stoichiometry of Fe83Ga17 was used for the texturing experiments to minimize the possible
formation of intermetallics found with higher gallium compositions. The powder metallurgy
work utilized Fe80Ga20 due to material availability.
2.3.1 Growth texturing – directional solidification
Fe-Ga alloys can be directionally solidified at rates sufficiently fast to yield dendritic
solidification along the length of the ingot. Dendritic solidification occurs along specific

42
crystallographic directions, thereby aligning different crystals within the ingot with a
common growth direction. A directionally solidified Fe83Ga17 specimen was grown in an
alumina crucible by the modified Bridgman technique. Preparation of the starting ingot prior
to the growth process was identical to that used for the single crystal (Section 2.2.1). The
ingot was heated to the growth temperature and held for 1 hour to allow thorough mixing
before withdrawing the sample from the heat zone at a rate of 100 mm/h. Following growth,
the ingot was annealed at 1000°C for 168 hours then furnace cooled. A 50.8-mm long rod-
shaped specimen having a 6.35-mm diameter was sectioned from the ingot using EDM. The
rod’s longitudinal axis was approximately parallel with that of the ingot’s longitudinal axis.
Centerless grinding was next attempted to refine the rod geometry, however during
grinding the specimen underwent brittle fracture to produce several pieces. Visual inspection
of the fractured portion revealed that the rod was a multicrystal composed of approximately a
dozen grains. These grains were 2 to 4 mm in diameter and generally elongated in the growth
direction (along the rod axis) with up to 20-mm lengths. To discover the failure mode of the
specimen, portions of the broken rod were impacted lightly with a hammer. Additional
failure was observed to occur along grain boundaries thus releasing individual crystals.
Attempts to fracture individual crystals with the hammer were fruitless as the material
underwent extensive ductile deformation. The directionally solidified rod’s brittle failure
mode at the grain boundaries and ductile grains suggest that Ga-rich intermetallics may have
formed along the grain boundaries and/or Ga may have precipitated at the grain boundaries.
Despite the machining difficulties, a rod specimen with a 28.1-mm length was
recovered from the directionally solidified ingot for magnetostriction analysis. The saturation
magnetostriction capability of the rod was tested in a thermally controlled transducer using a
constant stress and quasi-static applied magnetic fields up to 74 kA/m. An optimized stress
level of 28 MPa for this specimen (see Chapter 4) gave the result of (3/2)λs ∼170 x 10-6. This
saturation magnetostriction output is ∼55% that of the [100] oriented Fe83Ga17 single
crystal’s performance (Figure 2.4a). Orientation imaging microscopy (OIM) analysis on the
plane normal to the growth axis (Figure 2.5) shows that dendrite growth favored the [100]
crystal orientation in the longitudinal direction. Additional analysis of the directionally
solidified specimen’s overall magnetic response is reviewed in Section 3.3. The figure’s
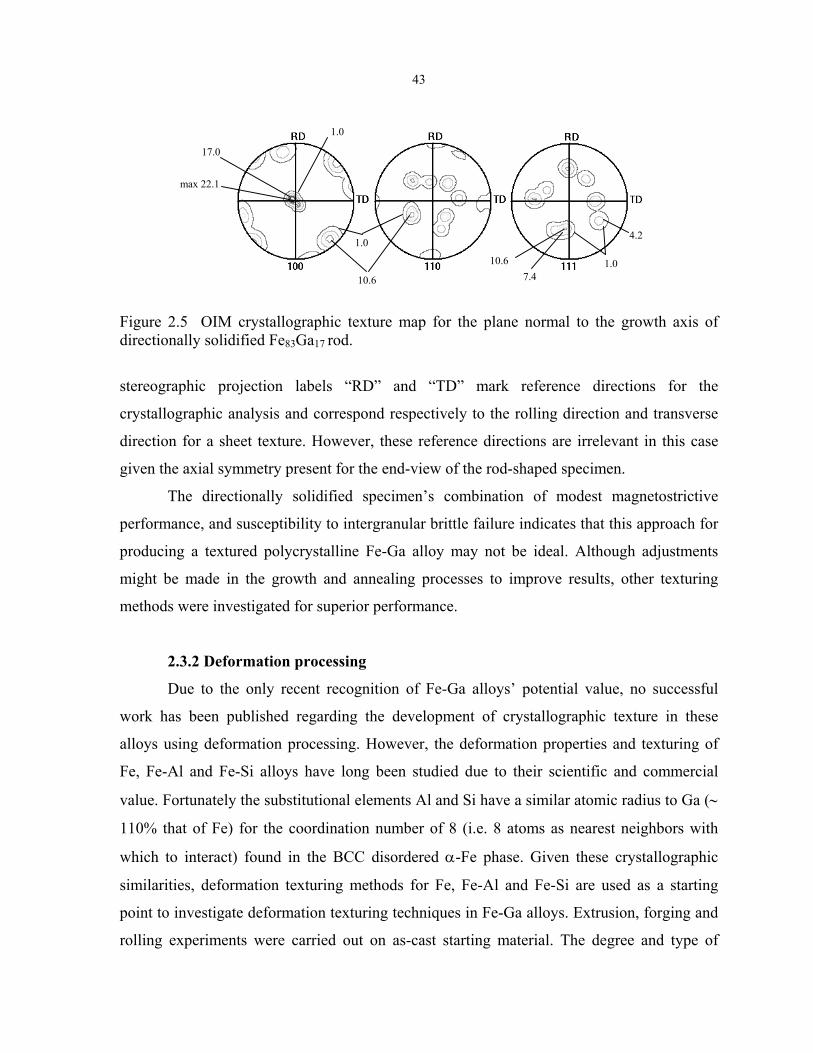
43
7.4
4.2
1.0 10.6
max 22.1
1.0
10.6
1.0
17.0
Figure 2.5 OIM crystallographic texture map for the plane normal to the growth axis of directionally solidified Fe83Ga17 rod.
stereographic projection labels “RD” and “TD” mark reference directions for the
crystallographic analysis and correspond respectively to the rolling direction and transverse
direction for a sheet texture. However, these reference directions are irrelevant in this case
given the axial symmetry present for the end-view of the rod-shaped specimen.
The directionally solidified specimen’s combination of modest magnetostrictive
performance, and susceptibility to intergranular brittle failure indicates that this approach for
producing a textured polycrystalline Fe-Ga alloy may not be ideal. Although adjustments
might be made in the growth and annealing processes to improve results, other texturing
methods were investigated for superior performance.
2.3.2 Deformation processing
Due to the only recent recognition of Fe-Ga alloys’ potential value, no successful
work has been published regarding the development of crystallographic texture in these
alloys using deformation processing. However, the deformation properties and texturing of
Fe, Fe-Al and Fe-Si alloys have long been studied due to their scientific and commercial
value. Fortunately the substitutional elements Al and Si have a similar atomic radius to Ga (∼
110% that of Fe) for the coordination number of 8 (i.e. 8 atoms as nearest neighbors with
which to interact) found in the BCC disordered α-Fe phase. Given these crystallographic
similarities, deformation texturing methods for Fe, Fe-Al and Fe-Si are used as a starting
point to investigate deformation texturing techniques in Fe-Ga alloys. Extrusion, forging and
rolling experiments were carried out on as-cast starting material. The degree and type of

44
texture developed was measured by several means: saturation magnetostriction performance
of disk or rod shaped specimens, back-reflection electron microscopy, X-ray crystallography
and OIM.
2.3.2.1 Extrusion
Extrusion is often used as a production step in forming wire out of many metals
including Fe and Fe alloys. The extrusion process entails pushing the as-cast starting material
(usually heated to facilitate plastic flow) through an opening of reduced cross sectional area.
This is much like squeezing a tube of toothpaste to force it out the opening. Further reduction
in cross sectional diameter and increases in length of the extruded material are typically
accomplished through swaging. Swaging involves somewhat similar plastic flow patterns as
those found in extrusion. Swaging is typically a cold working process which involves
symmetrically hammering the wire in the radial direction to reduce the diameter. During
swaging, the material is moved longitudinally through successively smaller die to reach the
final cross sectional dimension. Fe wire, produced by extrusion and swaging, has been shown
to possess elongated grains having a 001<110> cylindrical texture [Leber 1961]. In this
cylindrical texture (or “wire” texture), grains’ <110> crystallographic axes lie parallel to the
long axis of the wire while the 001 planes of the crystals lie normal to the radial direction.
(This orientation is 45° off the desired <100> longitudinal orientation for maximum
magnetostriction in Fe-Ga alloys.) Studies have shown that the resulting wire texture in BCC
Fe is independent of the starting texture and strongly stable to variations in processing
conditions [Barrett 1939]. It has also been observed that the recrystallization texture is <110>
in Fe [Barrett 1952].
To investigate whether the texture development in Fe-17Ga at.% alloy is similar to
that of Fe, an extruded rod-shaped specimen was produced for saturation magnetostriction
testing. To form the extruded rod, a 25.4-mm diameter ingot of Fe83Ga17 was produced by arc
melting and chill casting. The ingot was encapsulated into a cooper can and extruded in a
Loewy Hydropress. The cast ingot was extruded at elevated temperature and pressures with
an area reduction ratio of Ainitial/Afinal ∼ 4. The extruded rod’s approximate final dimension
was 12 mm in diameter and 200-mm long. Figure 2.6 shows the parameters of the extrusion
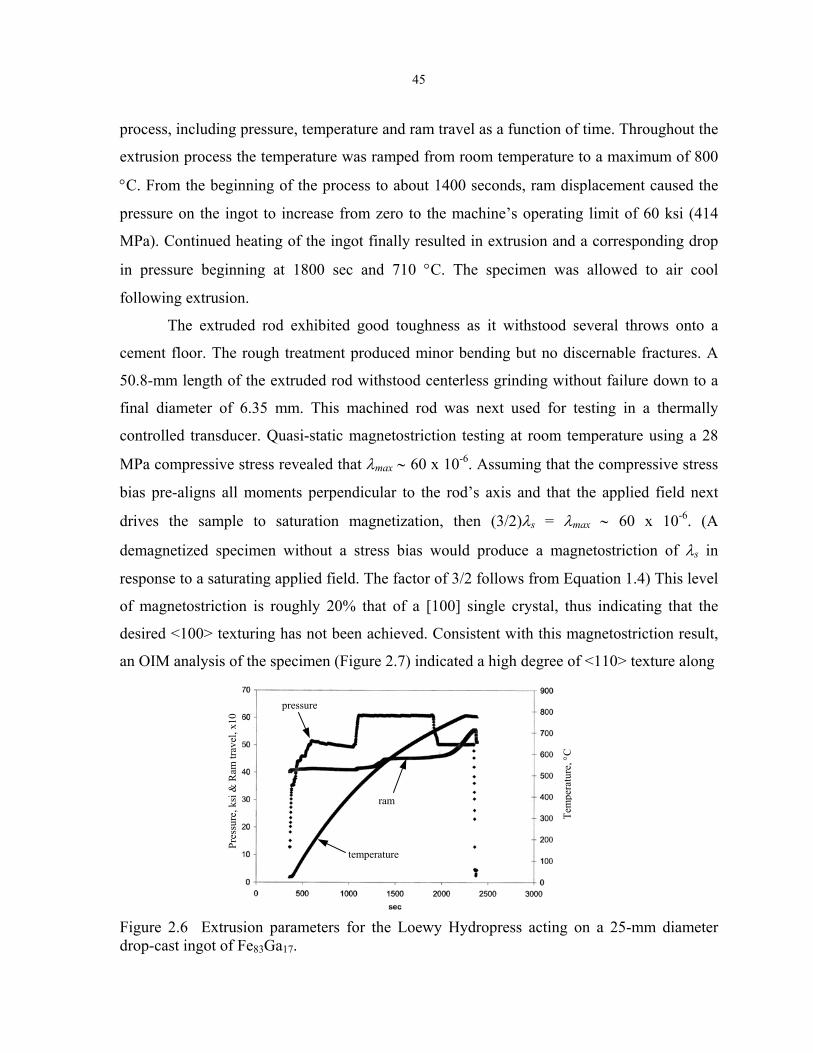
45
process, including pressure, temperature and ram travel as a function of time. Throughout the
extrusion process the temperature was ramped from room temperature to a maximum of 800
°C. From the beginning of the process to about 1400 seconds, ram displacement caused the
pressure on the ingot to increase from zero to the machine’s operating limit of 60 ksi (414
MPa). Continued heating of the ingot finally resulted in extrusion and a corresponding drop
in pressure beginning at 1800 sec and 710 °C. The specimen was allowed to air cool
following extrusion.
The extruded rod exhibited good toughness as it withstood several throws onto a
cement floor. The rough treatment produced minor bending but no discernable fractures. A
50.8-mm length of the extruded rod withstood centerless grinding without failure down to a
final diameter of 6.35 mm. This machined rod was next used for testing in a thermally
controlled transducer. Quasi-static magnetostriction testing at room temperature using a 28
MPa compressive stress revealed that λmax ∼ 60 x 10-6. Assuming that the compressive stress
bias pre-aligns all moments perpendicular to the rod’s axis and that the applied field next
drives the sample to saturation magnetization, then (3/2)λs = λmax ∼ 60 x 10-6. (A
demagnetized specimen without a stress bias would produce a magnetostriction of λs in
response to a saturating applied field. The factor of 3/2 follows from Equation 1.4) This level
of magnetostriction is roughly 20% that of a [100] single crystal, thus indicating that the
desired <100> texturing has not been achieved. Consistent with this magnetostriction result,
an OIM analysis of the specimen (Figure 2.7) indicated a high degree of <110> texture along
temperature
Tem
pera
ture
, °C
Pres
sure
, ksi
& R
am tr
avel
, x10
ram
pressure
Figure 2.6 Extrusion parameters for the Loewy Hydropress acting on a 25-mm diameter drop-cast ingot of Fe83Ga17.

46
the rod axis. The <100> texture is widely distributed at approximately 45° and 90° from the
longitudinal axis. Unfortunately, determining whether the extruded specimen possesses a
fiber or wire texture, with their respective random or radial distribution of the <100> crystal
axes, is not possible from this information.
In an attempt to ensure homogenization of the Ga distribution and ultimately improve
the magnetostriction, the extruded rod was annealed at 800 °C for 4 hours then water
quenched. Subsequent saturation magnetostriction testing, using conditions identical to those
used before the specimen was annealed, gave (3/2)λs = 30 x10-6 for a 50% loss in
performance. An X-ray derived stereographic projection of the texture distribution of the
annealed rod (Figure 2.8) shows that a strong <110> texture has been enhanced. The general
max 6.8
2.0 1.0 2.0
1.0 3.0
6.0
1.0
3.0
2.0
Figure 2.7 OIM derived stereographic projection of the crystallographic distribution for extruded Fe83Ga17. Data collected for the plane normal to the longitudinal axis of the extruded rod.
1.0
2.0
4.0
6.0
9.0
1.0
9.0
1.0
4.0
6.0
8.0
.0 2.0 2
Figure 2.8 X-ray derived stereographic projection of the crystallographic distribution for extruded Fe83Ga17 subjected to a 4 hr anneal at 800°C and water quench. Data collected for the plane normal to the longitudinal axis of the extruded rod.
47
symmetry of the <200> and <211> pole figures, about the samples longitudinal axis, is
consistent with either a <110> fiber or wire texture. Further analysis of the texture evolution,
going from the non-heat treated to the annealed specimen, has questionable value given the
different techniques (OIM and X-ray) used for each. The non-heat treated specimen was not
available for further examination.
Although the anneal-induced loss in the extruded rod’s magnetostrictive capability
was not anticipated, it might be attributed to residual stress or a strengthening of the <110>
texture component at the expense of <100> oriented grains. Another possible cause for the
loss is that recrystallization events during annealing induced formation of additional yet weak
<111> and/or <112> texture components (not obvious in Figure 2.8) in the direction of the
rod’s longitudinal axis. This second possibility is discussed next as it may dramatically affect
the bulk magnetostriction of the rod and has a potentially intriguing source.
Considering the anisotropic magnetostriction relationship (Equation 1.4) and using
the Fe83Ga17 material properties of (3/2)λ100 = 310 x10-6 and (3/2)λ111 = -16 x10-6 (from
Figure 2.4), the reduction in the annealed extruded rod’s saturation magnetostriction would
be consistent with a decline in the specimen content of <110> grains and an increase in
content of <111> and <112> grains. For longitudinally oriented single crystals with a
magnetic moment rotation from a [001] direction nearest the rod’s radial direction into a
[110], [111] or [112] direction, (3/2)λs declines from 147 x10-6 for the [110] orientation to -
11 x10-6 and -61 x10-6 for the [111] and [112] directions respectively.
Insight into the possible anneal-induced increase of <111> and <112> textures in Fe-
Ga alloys might be gained by considering earlier research by Bhandary et al. In their work,
the development of additional <111> and <112> texture components were observed in Fe
wire specimens that were recrystallized at 600 - 650°C for 30 min in the presence of DC 10 -
90 Oe magnetic fields [Bhandary 1962]. The development of these magnetically induced
<111> and <112> recrystallization textures were attributed to magnetostriction induced strain
energy and/or magnetocrystalline anisotropy and their effect on the grain nuclei stability
[Smoluchowski 1949, Sawyer 1957]. Although the extruded rod in this work was not
intentionally subjected to magnetic fields during annealing, examination of the processing
equipment revealed that the Ames Lab NRC furnace has heating elements that produced an
48
AC 140 Oe magnetic field. Supposing the longitudinal axis of the extruded specimen was
oriented coaxially with this field, the effect may have contributed to the development of a
particular recrystallization texture.
A more extensive investigation of the extruded specimen’s crystallographic
orientation distribution must be conducted to understand the anneal-induced loss in the
specimen’s magnetostrictive capability. Despite this deficiency, an analysis of the magnetic
characteristics, before and after annealing, is presented in the magnetic characterization
Section 3.3. Given the extruded specimen’s low saturation magnetostriction capability,
mechanical testing to determine the specimen’s elastic and plastic properties was not
conducted.
2.3.2.2 Hot forging
Deformation processing techniques in Fe-Al based alloys have been used in the past
to develop crystallographic textured products having a high degree mechanical anisotropy.
Particularly relevant to the present goal of <100> texturing in Fe-Ga alloys, studies by Kad et
al. of iron aluminides (Fe1-xAlx, where 15 ≤ x ≤ 20) indicate that hot axial forging (above
550°C) causes a significant crystallographic reorientation and produces a dominant <100>
fiber texture parallel to the direction of forging [Kad 1997]. It was determined that achieving
a high degree of <100> texturing required true strain ≤ -1 and that texturing success was
independent of strain rate.
To discover if hot forging could generate a significant <100> fiber texture in Fe-Ga
alloys, a Fe83Ga17 ingot with a 12.7-mm diameter and 100-mm length was produced in the
usual manner by arc melting and chill casting. An initial attempt to centerless grind the cast
ingot and remove surface casting defects resulted in intergranular brittle failure. The break
occurred transverse to the ingot’s longitudinal axis and was initiated at the root of a surface
defect less than 1-mm deep. Centerless grinding was successfully used on a shorter portion of
the ingot to produce an 11.8-mm diameter rod, 53.6-mm long. The rod ends were carefully
ground normal to the rod axis to attain a geometry as close as possible that of a right
cylinder.

49
To successfully forge the Fe-Ga rod buckling must be avoided while the longitudinal
dimension undergoes true strain of -1.0 or more. The critical length to diameter ratio for
buckling was estimated by assuming the least favorable boundary conditions for the rod ends
as pin- pin. In this case, the critical load Pcr at which point buckling is imminent for a rod of
length L, radius r, Young’s modulus E and second moment of inertia I is
LEIPcr
3π= , where
4
4rI π= .
Substituting the critical stress σcr = Pcr/A where the cross sectional area A = πr2 and
rearranging produces the critical length to diameter ratio.
crcr
EDL
σπ
=
4 (2.1)
Conservative room temperature values for the Fe-Ga alloy are E ∼ 56 GPa and σcr ∼ 450 MPa
where the critical stress is simply equivalent to the expected yield stress [Lograsso 2000]. To
make a rough estimate of [L/D]cr for buckling of the Fe-Ga rod at a forging temperature of
700°C, the values for E and σcr are reduced by factors of 2 and 3 respectively [Lyman 1948].
Using these numbers in Equation 2.1 gives [L/D]cr ∼ 11 for the hot forging process. Since the
machined rod used for this experiment has a L/D ∼ 5 buckling problems would likely be
avoided.
Forging of the Fe-Ga rod specimen was conducted in a computer controlled 223 kN
capable hydraulic MTS machine operated in constant velocity mode. The forging setup
(Figure 2.9) utilized two cylindrical mild-steel mounting blocks (89-mm diameter and 54-
mm long) to serve as an interface for the loading ram and cross arm of the MTS machine.
The large thermal mass of these mounts was used to protect the MTS machine from the hot
forging specimen. The specimen was enclosed in a soft firebrick and mounted in between
two stainless steel platens (50.8 x 50.8 x 12.7 mm). The firebrick was used to limit cooling
during the forging process as well as stabilize the specimen in between the platens during
handling. The specimen, firebrick and platen assembly were secured into one unit using
stainless steel wire and heated in a furnace prior to forging. The stainless steel platens were
keyed to the mounting blocks and also contained 0.8-mm deep recesses to constrain lateral
motion of the forging rod.

50
keyed platens forging specimen
fire brick
hydraulic ram
mount
mount
load cell
Figure 2.9 Schematic for the hot forging of a Fe83Ga17 cast rod (89-mm diameter, 54-mm long) using a hydraulic MTS machine.
To carry out the forging process, the specimen and platen assembly was heated to
700°C then placed between the mounts. The MTS machine was immediately activated to
compress the sample over a 0.5 second period. A plot of the load vs. ram displacement
(Figure 10a) shows that plastic flow began at ∼ 16 kN (or 140 MPa based on the original
cross sectional area) and that the specimen length was compressed by 33.7 mm (true strain =
-1). The increase in load throughout the forging process is attributed to increasing cross
sectional area and specimen cooling. After forging, the deformed specimen (Figure 2.10b)
was retrieved from the crushed firebrick then water quenched.
The plastic flow arising during the forging process was complex and asymmetrical
(Figure 2.10b). In regions enclosed by the white dashed lines, the grains are mostly equiaxed
and undisturbed. The mid-length of the rod generally flowed to the right and away from a
horizontal line bisecting the specimen as shown by the solid arrows. Grains were elongated
in the direction of the flow. The cross section of disk specimens (7.9-mm diameter, 1.0-mm
thick), which were later extracted for saturation magnetostriction testing, are indicated for
orientations parallel and perpendicular to the material flow direction.
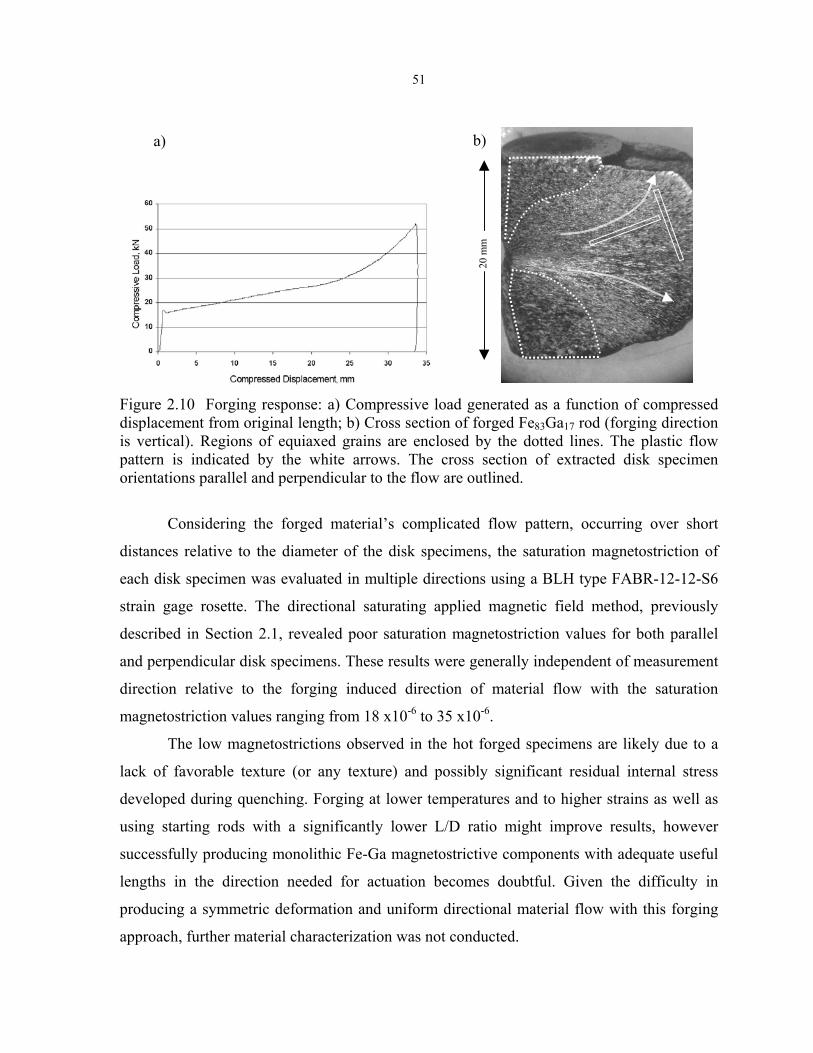
51
20
mm
b) a)
Figure 2.10 Forging response: a) Compressive load generated as a function of compressed displacement from original length; b) Cross section of forged Fe83Ga17 rod (forging direction is vertical). Regions of equiaxed grains are enclosed by the dotted lines. The plastic flow pattern is indicated by the white arrows. The cross section of extracted disk specimen orientations parallel and perpendicular to the flow are outlined.
Considering the forged material’s complicated flow pattern, occurring over short
distances relative to the diameter of the disk specimens, the saturation magnetostriction of
each disk specimen was evaluated in multiple directions using a BLH type FABR-12-12-S6
strain gage rosette. The directional saturating applied magnetic field method, previously
described in Section 2.1, revealed poor saturation magnetostriction values for both parallel
and perpendicular disk specimens. These results were generally independent of measurement
direction relative to the forging induced direction of material flow with the saturation
magnetostriction values ranging from 18 x10-6 to 35 x10-6.
The low magnetostrictions observed in the hot forged specimens are likely due to a
lack of favorable texture (or any texture) and possibly significant residual internal stress
developed during quenching. Forging at lower temperatures and to higher strains as well as
using starting rods with a significantly lower L/D ratio might improve results, however
successfully producing monolithic Fe-Ga magnetostrictive components with adequate useful
lengths in the direction needed for actuation becomes doubtful. Given the difficulty in
producing a symmetric deformation and uniform directional material flow with this forging
approach, further material characterization was not conducted.
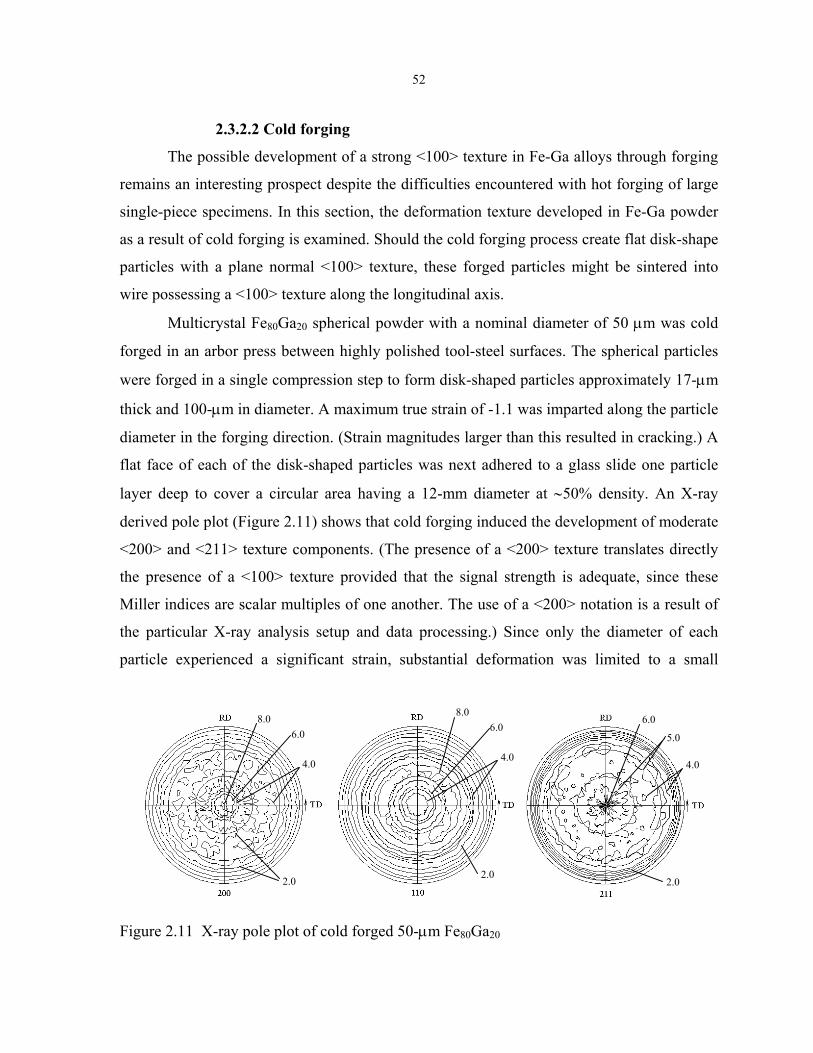
52
2.3.2.2 Cold forging
The possible development of a strong <100> texture in Fe-Ga alloys through forging
remains an interesting prospect despite the difficulties encountered with hot forging of large
single-piece specimens. In this section, the deformation texture developed in Fe-Ga powder
as a result of cold forging is examined. Should the cold forging process create flat disk-shape
particles with a plane normal <100> texture, these forged particles might be sintered into
wire possessing a <100> texture along the longitudinal axis.
Multicrystal Fe80Ga20 spherical powder with a nominal diameter of 50 µm was cold
forged in an arbor press between highly polished tool-steel surfaces. The spherical particles
were forged in a single compression step to form disk-shaped particles approximately 17-µm
thick and 100-µm in diameter. A maximum true strain of -1.1 was imparted along the particle
diameter in the forging direction. (Strain magnitudes larger than this resulted in cracking.) A
flat face of each of the disk-shaped particles was next adhered to a glass slide one particle
layer deep to cover a circular area having a 12-mm diameter at ∼50% density. An X-ray
derived pole plot (Figure 2.11) shows that cold forging induced the development of moderate
<200> and <211> texture components. (The presence of a <200> texture translates directly
the presence of a <100> texture provided that the signal strength is adequate, since these
Miller indices are scalar multiples of one another. The use of a <200> notation is a result of
the particular X-ray analysis setup and data processing.) Since only the diameter of each
particle experienced a significant strain, substantial deformation was limited to a small
5.0
2.0
4.0
6.0
2.0
4.0
6.0 8.0
2.0
4.0
6.0 8.0
Figure 2.11 X-ray pole plot of cold forged 50-µm Fe80Ga20
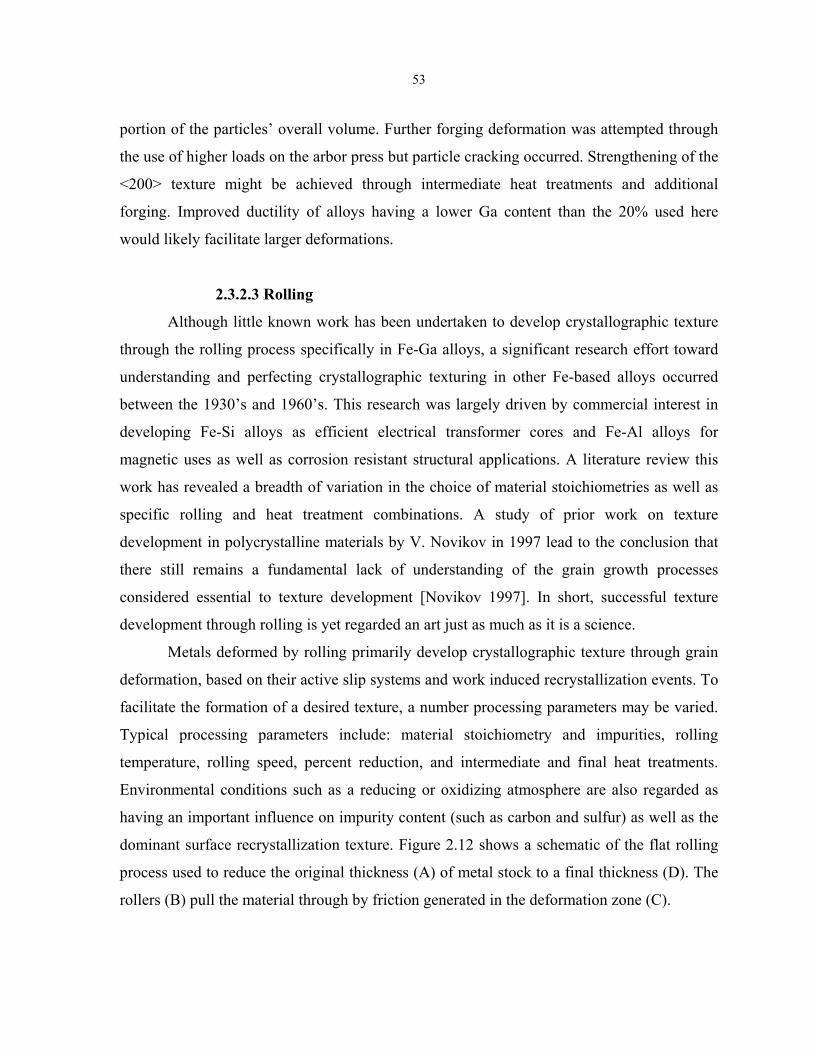
53
portion of the particles’ overall volume. Further forging deformation was attempted through
the use of higher loads on the arbor press but particle cracking occurred. Strengthening of the
<200> texture might be achieved through intermediate heat treatments and additional
forging. Improved ductility of alloys having a lower Ga content than the 20% used here
would likely facilitate larger deformations.
2.3.2.3 Rolling
Although little known work has been undertaken to develop crystallographic texture
through the rolling process specifically in Fe-Ga alloys, a significant research effort toward
understanding and perfecting crystallographic texturing in other Fe-based alloys occurred
between the 1930’s and 1960’s. This research was largely driven by commercial interest in
developing Fe-Si alloys as efficient electrical transformer cores and Fe-Al alloys for
magnetic uses as well as corrosion resistant structural applications. A literature review this
work has revealed a breadth of variation in the choice of material stoichiometries as well as
specific rolling and heat treatment combinations. A study of prior work on texture
development in polycrystalline materials by V. Novikov in 1997 lead to the conclusion that
there still remains a fundamental lack of understanding of the grain growth processes
considered essential to texture development [Novikov 1997]. In short, successful texture
development through rolling is yet regarded an art just as much as it is a science.
Metals deformed by rolling primarily develop crystallographic texture through grain
deformation, based on their active slip systems and work induced recrystallization events. To
facilitate the formation of a desired texture, a number processing parameters may be varied.
Typical processing parameters include: material stoichiometry and impurities, rolling
temperature, rolling speed, percent reduction, and intermediate and final heat treatments.
Environmental conditions such as a reducing or oxidizing atmosphere are also regarded as
having an important influence on impurity content (such as carbon and sulfur) as well as the
dominant surface recrystallization texture. Figure 2.12 shows a schematic of the flat rolling
process used to reduce the original thickness (A) of metal stock to a final thickness (D). The
rollers (B) pull the material through by friction generated in the deformation zone (C).
54
Figure 2.12 Schematic of the flat rolling process used to reduce the thickness of metal (After [Bowman 1980]).
Among the many rolling approaches available for developing <100> texture in the
rolling direction in Fe-Al and Fe-Si alloys, the general scheme is to hot roll a cast ingot into a
slab then proceed with one or more cold rolling and annealing iterations. The cold rolling
steps typically employ thickness reduction exceeding 70% and facilitate the development of a
refined crystalline structure generated through primary recrystallization during a subsequent
anneal. The final cold rolling step is then followed by a final anneal under particular
atmospheric conditions (inert, reducing or oxidizing) to cause secondary recrystallization.
Ideally, a large number of grain nuclei are available with the proper crystallographic
orientation, which are encouraged to grow at the expense misoriented grains. The
simultaneous inhibition and promotion of growth of different grain orientations are
influenced by small quantities of dispersed particles; examples include MnS, AlN and
carbides among others [Novikov 1997]. With the proper adjustments to the general
processing steps just described, two textures of interest may be produced. The well known
“Goss” or “cube on edge” texture provides a 110<100> oriented sheet having a single easy
magnetic axis. A second and even more desirable texture is the “cube” texture, which
consists of a 001<100> oriented sheet and possesses two orthogonal magnetic easy axes.
Either the Goss or cube texture could provide Fe-Ga sheet with the maximum
magnetostrictive capability of (3/2)λ100, however the cube sheet is most versatile and
magnetically efficient with its two in-plane <100> axes and single plane-normal <100> axis.
Of the dozens of patents and research studies examined, several flat rolling
approaches appeared most promising as a way to generate a favorable texture in the Fe-Ga

55
alloy. The following summary lists several approaches by their inventor’s/researcher’s names
and includes the material used and texturing objective:
Nishihara (1966 US patent #3,279,960) – Used as cast Fe100-xAlx where 4 ≤ x ≤ 12 alloy
to yield cube textured sheet.
Walter (1965, published in Journal of Applied Physics) - Used thin Fe97Si3 sheet and H2S
or O2 annealing atmosphere to favor 001 sheet formation through surface energy
control.
Littmann (1948 US patent #2,599,340) – Used as cast Fe100-xSix 2.5≤ x ≤ 4 to yield Goss
texture sheet.
Kohler (1964 US patent #3,130,192) – Used Fe100-xSix 1≤ x ≤ 6 Goss textured sheet to
yield cube texture sheet.
Pavlovic (1962 US patent #3,058,857) – Used as cast Fe100-xAlx where 2 ≤ x ≤ 19 alloy to
yield cube textured sheet.
Time constraints limited the number of texturing approaches to be investigated in the
course of this study on Fe-Ga alloys. Consequently, only the Nishihara rolling approach was
followed in an attempt to produce textured sheet. Details of the rolling procedure are listed in
Appendix A. Additional texture modifications to this resulting sheet were then attempted
through annealing under various atmospheric conditions as suggested by Walter’s research.
Alternative but untried rolling techniques include use of the Littmann process to produce
Goss textured starting material for the Kohler method and use of the Pavlovoc process as a
stand alone approach to texturing.
A version of the Nishihara rolling procedure, modified for the Fe-Ga alloy used in
this work, is presented next. A detailed schematic of the rolling procedure is listed in
Appendix B. Saturation magnetostriction values are reported for disk specimens selected at
key steps throughout the process. Stereographic projections of texture distributions are also
provided for several specimens.
An Fe83Ga17 cast ingot, measuring 9.5 x 51 x 51 mm, was produced by arc melting Fe
(99.99% purity) and Ga (99.999% purity) metal several times under an Ar atmosphere.
Several buttons of this material were placed into a mold and subjected to arc melting under
an Ar atmosphere to ensure compositional homogeneity throughout the ingot.

56
The starting ingot was enclosed in a 321 stainless steel can, backfilled with Ar,
evacuated and sealed by welding to prevent oxidation of the specimen. To minimize
diffusion bonding of the Fe-Ga specimen with the can during rolling, the can was
preoxidized at 900°C in air for 1 hr. Following hot soaking at 1000°C for 30 min, the canned
specimen was hot rolled to give a 55% reduction to a thickness of 4.2 mm over 72 passes.
Throughout the hot rolling procedure, the canned specimen was reheated at 1000°C after
every three passes for 6 minutes. A small reduction/pass was used to control cracking and
limit uneven specimen deformation, while the accumulation of reductions served to refine the
original cast grain structure. The hot-rolled specimen was next removed from the can (Figure
2.13) and annealed at 700°C for 60 min. in dry Ar then aged at 300°C for 150 min. A disk
specimen at this stage in the processing, labeled R1 (“R” for rolled) gave, a saturation
magnetostriction in the rolling direction of λRD-⊥ = 95 x 10-6 compared to the transverse
saturation magnetostriction value of λTD-⊥ = 35 x 10-6. Up to this point the rolling process has
generated some anisotropy in the magnetostriction, but the value of λRD-⊥ falls well short of
the λ||-⊥ = 300 x 10-6 capability found in the [100] direction of single crystal material.
rolled Fe-Ga ingot
Figure 2.13 Fe-Ga cast ingot after hot rolling reduction of 55% at 1000°C and the sectioned 321 stainless steel can used to protect the FeGa alloy from oxidation at temperatures above 500°C. The rolling direction is indicated on the rolled ingot. The ruler is in inches.
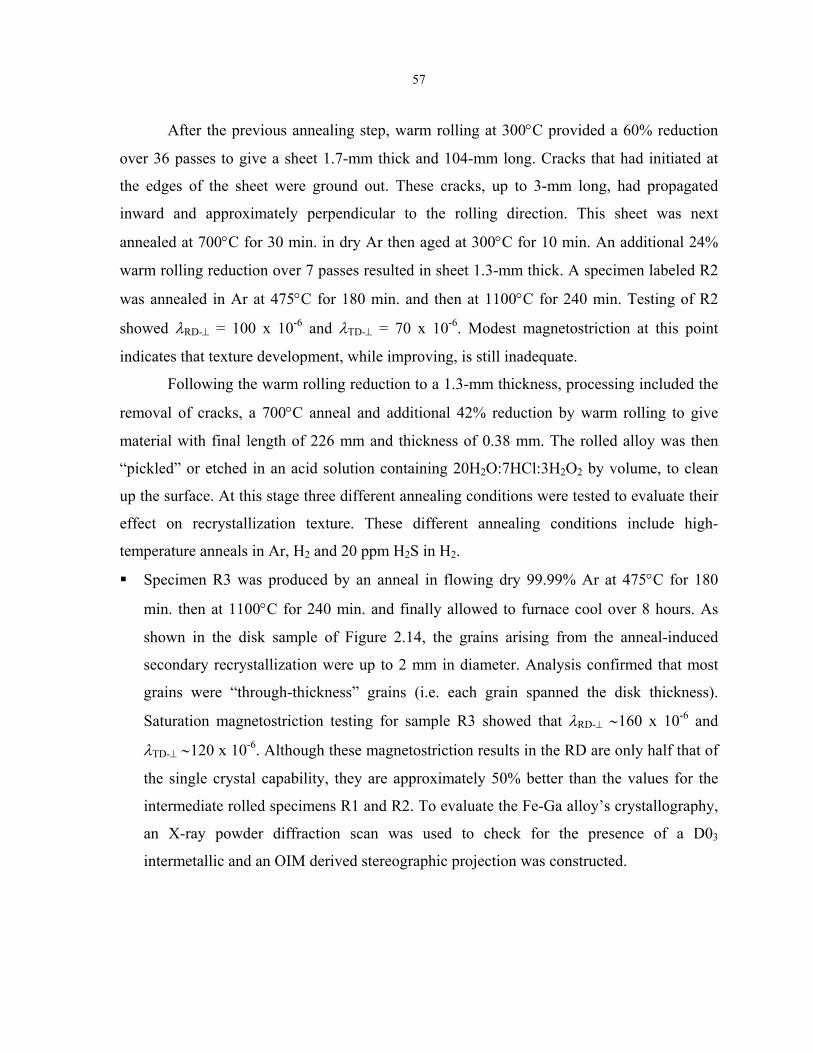
57
After the previous annealing step, warm rolling at 300°C provided a 60% reduction
over 36 passes to give a sheet 1.7-mm thick and 104-mm long. Cracks that had initiated at
the edges of the sheet were ground out. These cracks, up to 3-mm long, had propagated
inward and approximately perpendicular to the rolling direction. This sheet was next
annealed at 700°C for 30 min. in dry Ar then aged at 300°C for 10 min. An additional 24%
warm rolling reduction over 7 passes resulted in sheet 1.3-mm thick. A specimen labeled R2
was annealed in Ar at 475°C for 180 min. and then at 1100°C for 240 min. Testing of R2
showed λRD-⊥ = 100 x 10-6 and λTD-⊥ = 70 x 10-6. Modest magnetostriction at this point
indicates that texture development, while improving, is still inadequate.
Following the warm rolling reduction to a 1.3-mm thickness, processing included the
removal of cracks, a 700°C anneal and additional 42% reduction by warm rolling to give
material with final length of 226 mm and thickness of 0.38 mm. The rolled alloy was then
“pickled” or etched in an acid solution containing 20H2O:7HCl:3H2O2 by volume, to clean
up the surface. At this stage three different annealing conditions were tested to evaluate their
effect on recrystallization texture. These different annealing conditions include high-
temperature anneals in Ar, H2 and 20 ppm H2S in H2.
Specimen R3 was produced by an anneal in flowing dry 99.99% Ar at 475°C for 180
min. then at 1100°C for 240 min. and finally allowed to furnace cool over 8 hours. As
shown in the disk sample of Figure 2.14, the grains arising from the anneal-induced
secondary recrystallization were up to 2 mm in diameter. Analysis confirmed that most
grains were “through-thickness” grains (i.e. each grain spanned the disk thickness).
Saturation magnetostriction testing for sample R3 showed that λRD-⊥ ∼160 x 10-6 and
λTD-⊥ ∼120 x 10-6. Although these magnetostriction results in the RD are only half that of
the single crystal capability, they are approximately 50% better than the values for the
intermediate rolled specimens R1 and R2. To evaluate the Fe-Ga alloy’s crystallography,
an X-ray powder diffraction scan was used to check for the presence of a D03
intermetallic and an OIM derived stereographic projection was constructed.

58
7.9 mm
Figure 2.14 Optical micrograph of a 0.38-mm thick disk sample of polycrystalline Fe83Ga17, sample R3 produced by the modified Nishihara rolling procedure and recrystallized by Ar annealing. Note that the grain diameters are on the order of 1 mm and are through-thickness grains. Grain contrast was produced by etching in 20H2O:7HCl:3H2O2.
An X-ray powder diffraction scan (Figure 2.15) was collected for the range of 20° ≤
2θ ≤ 35°. (The angle 2θ is the sum of the angle of incidence and reflection of the X-ray
by the specimen surface and is governed by the atomic lattice spacing of the
crystallographic structure.) A significant increase in the X-ray reflectivity over the
baseline at 26.6° and 30.8° would confirm the presence of the D03 intermetallic [JCPDS
1997]. Although there are no peaks in this specimen at 26.6° and 30.8° one can only
safely conclude that D03 was not detected.
A stereographic projection (Figure 2.16) of a portion of the R3 disk specimen’s
crystallographic orientation was collected for the <100>, <110> and <111> directions.
The <100> pole figure shows a somewhat dispersed cube texture with <100> orientations
5.9 times more frequent than that of random within 5° of the RD and within 20° of the
sheet normal. The <110> and <111> textures are more dispersed. Keeping in mind the
mm-sized grains and the fact that only one hundred or so grains are present in this disk
sample, other specimens heat treated in this fashion may show some deviation from these
texture results. The crystallographic texture of this specimen is examined more rigorously
in Section 5.3 where it is used for validation of the magnetostrictive micromechanics
model.
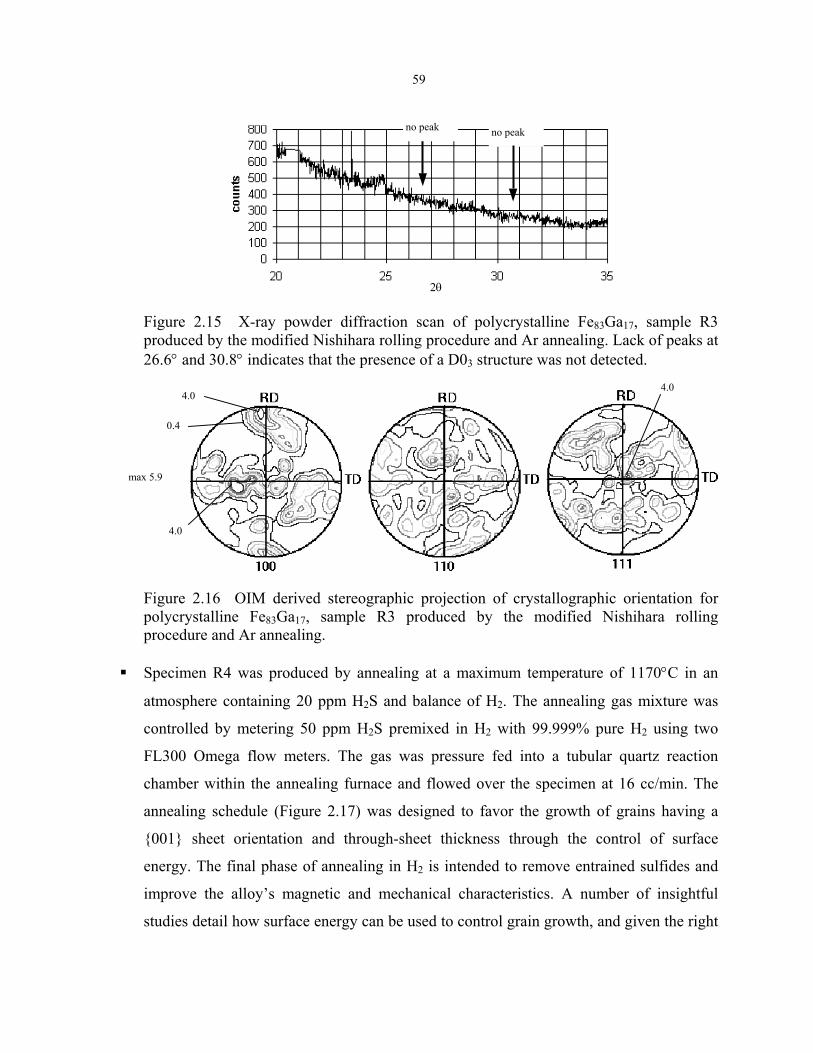
59
no peak no peak
2θ
Figure 2.15 X-ray powder diffraction scan of polycrystalline Fe83Ga17, sample R3 produced by the modified Nishihara rolling procedure and Ar annealing. Lack of peaks at 26.6° and 30.8° indicates that the presence of a D03 structure was not detected.
4.0
max 5.9
4.0
0.4
4.0
Figure 2.16 OIM derived stereographic projection of crystallographic orientation for polycrystalline Fe83Ga17, sample R3 produced by the modified Nishihara rolling procedure and Ar annealing.
Specimen R4 was produced by annealing at a maximum temperature of 1170°C in an
atmosphere containing 20 ppm H2S and balance of H2. The annealing gas mixture was
controlled by metering 50 ppm H2S premixed in H2 with 99.999% pure H2 using two
FL300 Omega flow meters. The gas was pressure fed into a tubular quartz reaction
chamber within the annealing furnace and flowed over the specimen at 16 cc/min. The
annealing schedule (Figure 2.17) was designed to favor the growth of grains having a
001 sheet orientation and through-sheet thickness through the control of surface
energy. The final phase of annealing in H2 is intended to remove entrained sulfides and
improve the alloy’s magnetic and mechanical characteristics. A number of insightful
studies detail how surface energy can be used to control grain growth, and given the right
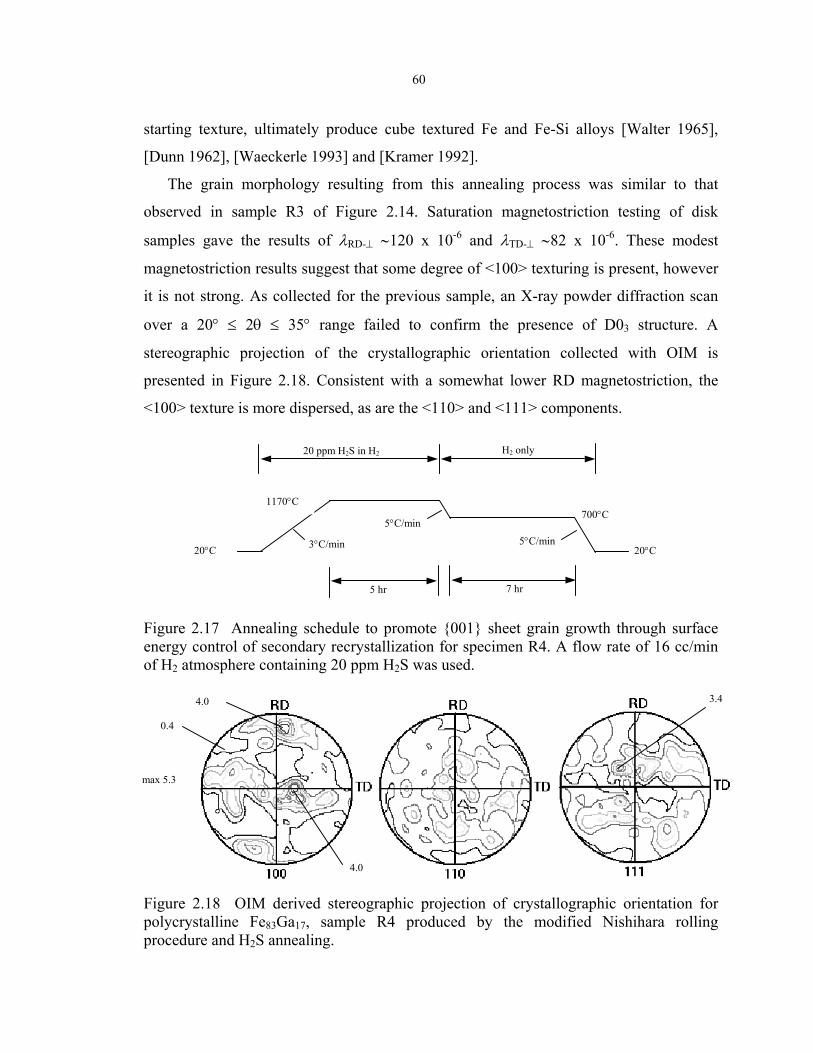
60
starting texture, ultimately produce cube textured Fe and Fe-Si alloys [Walter 1965],
[Dunn 1962], [Waeckerle 1993] and [Kramer 1992].
The grain morphology resulting from this annealing process was similar to that
observed in sample R3 of Figure 2.14. Saturation magnetostriction testing of disk
samples gave the results of λRD-⊥ ∼120 x 10-6 and λTD-⊥ ∼82 x 10-6. These modest
magnetostriction results suggest that some degree of <100> texturing is present, however
it is not strong. As collected for the previous sample, an X-ray powder diffraction scan
over a 20° ≤ 2θ ≤ 35° range failed to confirm the presence of D03 structure. A
stereographic projection of the crystallographic orientation collected with OIM is
presented in Figure 2.18. Consistent with a somewhat lower RD magnetostriction, the
<100> texture is more dispersed, as are the <110> and <111> components.
H2 only 20 ppm H2S in H2
7 hr 5 hr
5°C/min
5°C/min 700°C
1170°C
20°C 20°C 3°C/min
Figure 2.17 Annealing schedule to promote 001 sheet grain growth through surface energy control of secondary recrystallization for specimen R4. A flow rate of 16 cc/min of H2 atmosphere containing 20 ppm H2S was used.
3.4
4.0
max 5.3
0.4
4.0
Figure 2.18 OIM derived stereographic projection of crystallographic orientation for polycrystalline Fe83Ga17, sample R4 produced by the modified Nishihara rolling procedure and H2S annealing.

61
Specimen R5 was annealed in flowing dry 99.999% H2 at 475°C for 180 min. then at
1100°C for 240 min. and finally allowed to furnace cool. Testing showed λRD-⊥ ∼109 x
10-6 and λTD-⊥ ∼82 x 10-6. As in the previous two samples, the recrystallized structure
resulting from this high temperature anneal possessed mm-sized through-thickness
grains. The modest magnetostriction again indicates that texture development remains
weak under these annealing conditions. Crystallographic orientation distributions were
not collected for this sample.
The grain morphology of the three high-temperature annealed specimens (R3, R4 and
R5) all possessed a coarse grain structure and exhibited poor mechanical properties due to
brittleness. Assessed qualitatively in each case using hand-held pliers, intergranular failure
occurred after a one-time bending load induced less than a 20° deflection.
Returning to the 0.38-mm warm rolled material as the parent stock, two additional
cold rolling and heat treatment procedures were undertaken in an effort to develop stronger
<100> texture in the RD and more favorable mechanical properties. In the first cold rolling
process, sample R6 was formed from the rolled parent material by a 55% reduction from 0.38
mm to 0.17 mm using 100 passes through a 2-high Stanat rolling mill. The rollers on this mill
were approximately 460-mm long and 250 mm in diameter. The specimen was small in
comparison having a width of only 15 mm. Work hardening of the material required an
intermediate 500°C, 5 min. anneal (in air) after the first 28% reduction (30 passes) when the
890 kN roller load limit was reached. Thereafter, the specimen was annealed at 500°C for 10
min after every 10 passes. The cold rolling process was terminated after continued rolling at
the 890 kN roller load limit could no longer produce any appreciable reduction in thickness
despite further annealing. Roller deflection was significant in comparison to the specimen’s
small thickness and limited further reduction of the final specimen thickness. Saturation
magnetostriction testing of disk samples cut from this material gave λRD-⊥ = 30 x10-6. An
additional 590°C anneal for 1 hr in H2, to ensure stress relief, had little effect on the
magnetostrictive performance. The sample was etched in 20H2O:7HCl:3H2O2 for 10 seconds
to remove any residual strained surface material. Afterward an X-ray diffraction scan using a
Cu k-α source (1.542Å) provided an averaged orientation distribution function to a depth of
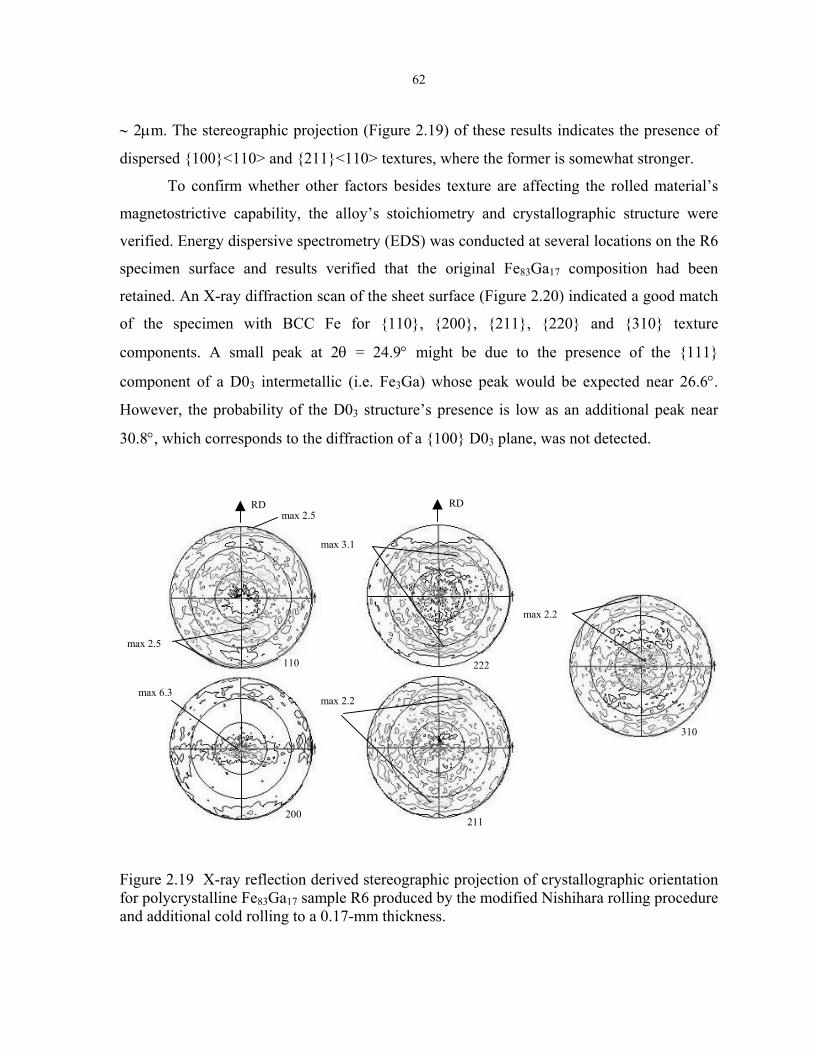
62
∼ 2µm. The stereographic projection (Figure 2.19) of these results indicates the presence of
dispersed 100<110> and 211<110> textures, where the former is somewhat stronger.
To confirm whether other factors besides texture are affecting the rolled material’s
magnetostrictive capability, the alloy’s stoichiometry and crystallographic structure were
verified. Energy dispersive spectrometry (EDS) was conducted at several locations on the R6
specimen surface and results verified that the original Fe83Ga17 composition had been
retained. An X-ray diffraction scan of the sheet surface (Figure 2.20) indicated a good match
of the specimen with BCC Fe for 110, 200, 211, 220 and 310 texture
components. A small peak at 2θ = 24.9° might be due to the presence of the 111
component of a D03 intermetallic (i.e. Fe3Ga) whose peak would be expected near 26.6°.
However, the probability of the D03 structure’s presence is low as an additional peak near
30.8°, which corresponds to the diffraction of a 100 D03 plane, was not detected.
max 2.2
310
max 2.5
max 2.2
max 3.1
max 6.3
211
222
200
110
max 2.5 RD RD
Figure 2.19 X-ray reflection derived stereographic projection of crystallographic orientation for polycrystalline Fe83Ga17 sample R6 produced by the modified Nishihara rolling procedure and additional cold rolling to a 0.17-mm thickness.

63
DO3 111 @26.6°
BCC 310 @116.5°
BCC 220 @99.1°
BCC 211 @82.4°
BCC 200 @65.1°
BCC 110 @44.7°
Figure 2.20 X-ray powder diffraction scan of polycrystalline Fe83Ga17, sample R6 produced by the modified Nishihara rolling procedure plus cold rolling to 0.17-mm thickness with 500°C intermediate anneals. The expected 2θ values for intensity peaks corresponding to BCC Fe are indicated. The lack of a peak at 30.8° indicates that the presence of a DO3 100 plane was not detected.
In the second cold rolling process, sample R7 was formed from the rolled parent
material by a 73% reduction from 0.38 mm to 0.10 mm using 32 passes through a jeweler’s
rolling mill. The rollers on this mill were approximately 75-mm long and 50 mm in diameter
and driven by a 0.5-hp electric motor. Work hardening of the material required three
intermediate 500°C anneals in air, each with a duration of 5 min. The load imposed on the
rollers was unknown and rolling was terminated when no further reduction in specimen
thickness could be achieved. Following cold rolling, the specimen was given a 590°C anneal
for 1 hr in Ar to ensure stress relief. A disk sample was extracted from the rolled sheet and
then strain gaged with a 0/60/120 rosette. Saturation magnetostriction testing gave λRD-⊥ ∼30
x10-6 while the other two gage directions produced magnetostrictions of λ||-⊥ ∼35 x10-6. To
evaluate the rolled texture, an X-ray diffraction scan was performed on the sample after
etching in 20H2O:7HCl:3H2O2 for 10 seconds. The stereographic projection (Figure 2.21)
indicates the presence of a major 100<110> and minor 211<111> texture components.
Although these textures are somewhat dispersed they are more well defined than the texture
of specimen R6 (Figure 2.19) which is less heavily rolled. The saturation magnetostriction
for this specimen is later compared with the results of the magnetostrictive micromechanical
model in Section 5.5.3.
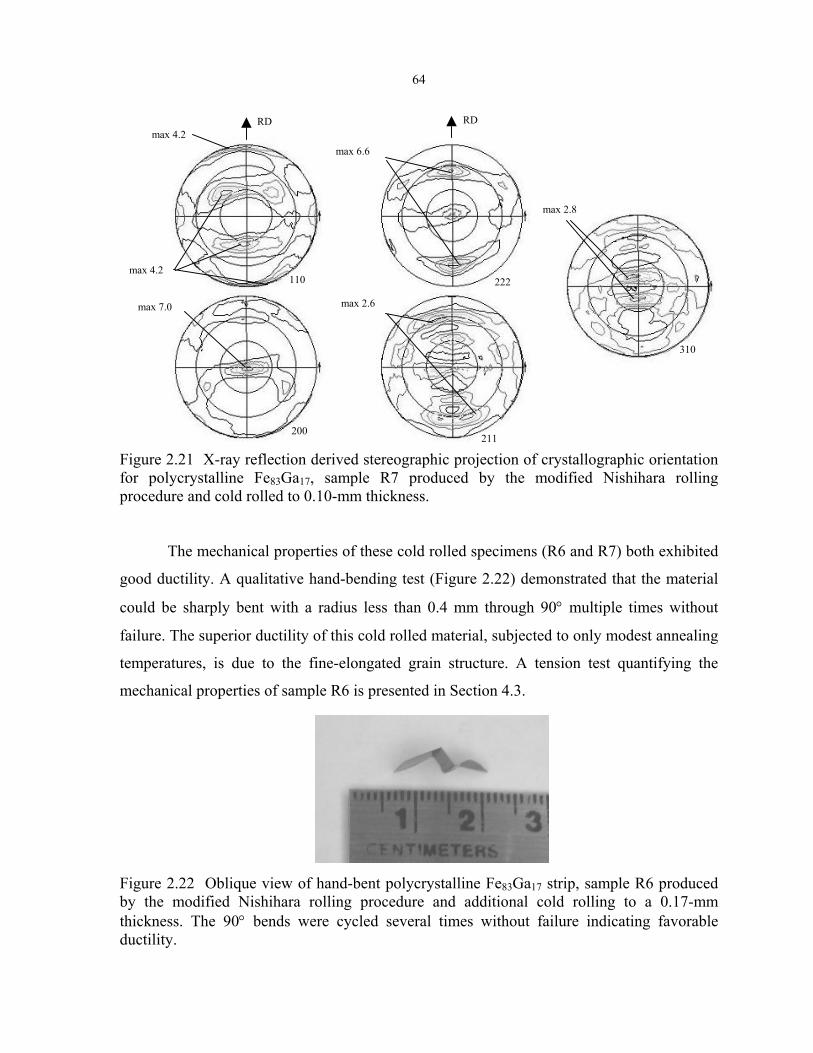
64
max 2.8
310
max 4.2
max 2.6
max 6.6
max 7.0
211
222
200
110
max 4.2 RD RD
Figure 2.21 X-ray reflection derived stereographic projection of crystallographic orientation for polycrystalline Fe83Ga17, sample R7 produced by the modified Nishihara rolling procedure and cold rolled to 0.10-mm thickness.
The mechanical properties of these cold rolled specimens (R6 and R7) both exhibited
good ductility. A qualitative hand-bending test (Figure 2.22) demonstrated that the material
could be sharply bent with a radius less than 0.4 mm through 90° multiple times without
failure. The superior ductility of this cold rolled material, subjected to only modest annealing
temperatures, is due to the fine-elongated grain structure. A tension test quantifying the
mechanical properties of sample R6 is presented in Section 4.3.
Figure 2.22 Oblique view of hand-bent polycrystalline Fe83Ga17 strip, sample R6 produced by the modified Nishihara rolling procedure and additional cold rolling to a 0.17-mm thickness. The 90° bends were cycled several times without failure indicating favorable ductility.

65
2.3.3 Powder metallurgy
A high degree of <100> crystallographic texture might be developed in
polycrystalline specimens utilizing powder metallurgy techniques. The powder metallurgy
process includes the consolidation of a particulate parent material followed by sintering to
diffusion bond the particles. It was hypothesized that crystallographic texturing would be
achieved through the directional application of a saturating applied magnetic field prior to
and during the consolidation process. The degree of texturing realized will depend on
magnetocrystalline anisotropy, shape induced magnetic anisotropy and contact forces.
Provided that spherical single crystal parent material is used, shape anisotropy will be
negligible and the torque induced by magnetocrystalline anisotropy should induce the
alignment of each particle’s [100] easy axis in the applied magnetic field direction. This
assumes that contact forces such as friction and cohesion between particles can be overcome
to allow particle rotation.
To explore the efficacy of this texturing process, spherical Fe80Ga20 powder, with
diameters up to 63 µm, was obtained from HJE Co. in Cohoes, NY, who manufactured it by
injecting molten alloy into liquid Ar. The powder was sorted into <20, 25-32, 38-45 and 53-
63 µm size fractions. Figure 2.23a shows an optical micrograph of the <20-µm size fraction
spheres. To evaluate the grain structure of the particles, the various size fractions were
separately mounted in epoxy and polished to produce a cross section for optical analysis.
Finish polishing with a 1 µm diamond slurry provided a smooth surface in which grains
boundaries could be observed after etching with 30% nitric acid in methanol for 15 sec. All
size fractions of the powdered Fe-Ga alloy contained a significant number of particles having
a dendritic and polycrystalline structure. Since effective magnetic orientation of
polycrystalline particles is not possible, the different powder fractions were annealed at
800°C for 4 hr in a furnace backfilled with ultra-high purity Ar. Although the dendritic
structure was eliminated, powder fractions above 20 µm were mostly multicrystals. Figure
2.23b shows two 50-µm diameter particles containing several grains each. This annealing
process was successful however in converting a significant portion of the <20-µm particles to
single crystals as shown in Figure 2.23c.

66
20 µm
50 µm
50 µ
m
c) b) a)
Figure 2.23 Optical micrographs of Fe80Ga20 powder. a) Spherical shape of the <20-µm size fraction; b) Cross section of 50-µm particles after 800°C anneal and etch revealing a multicrystal nature; c) Cross section of <20-µm particles after 800°C anneal and etch showing mostly single crystals with polishing artifacts.
After the annealing process was completed, the <20-µm single crystal powder
particles were tested for their anisotropic magnetization characteristics. A 50-mg quantity of
the powder was suspended in LOCTITE® then subjected to 22 kOe (equivalently 2.2 tesla in
air) magnetic field and solidified to form a composite plug. Providing that a single crystal
dominates each particle and that the magnetocrystalline anisotropy is adequate, this process
should tend to align the [100] easy magnetic axis of each particle in the field alignment
direction. A SQUID magnetometer was used to record the room temperature magnetization
of the composite plug as a function of applied field intensity for parallel and perpendicular
orientations. A plot of the magnetization responses (Figure 2.24) shows that magnetization
occurs more rapidly for the parallel specimen, which implies that the previous alignment step
had an effect on the particles’ orientation. Although not yet confirmed, one expects this
magnetic alignment process to form a <100> fiber texture in the powder aggregate, which
possesses a random crystallographic orientation about the <100> axis. An additional feature
of the plot is that saturation magnetization was not achieved even at 5000 Oe. This is due to
the high demagnetization factor for the spherical particles.
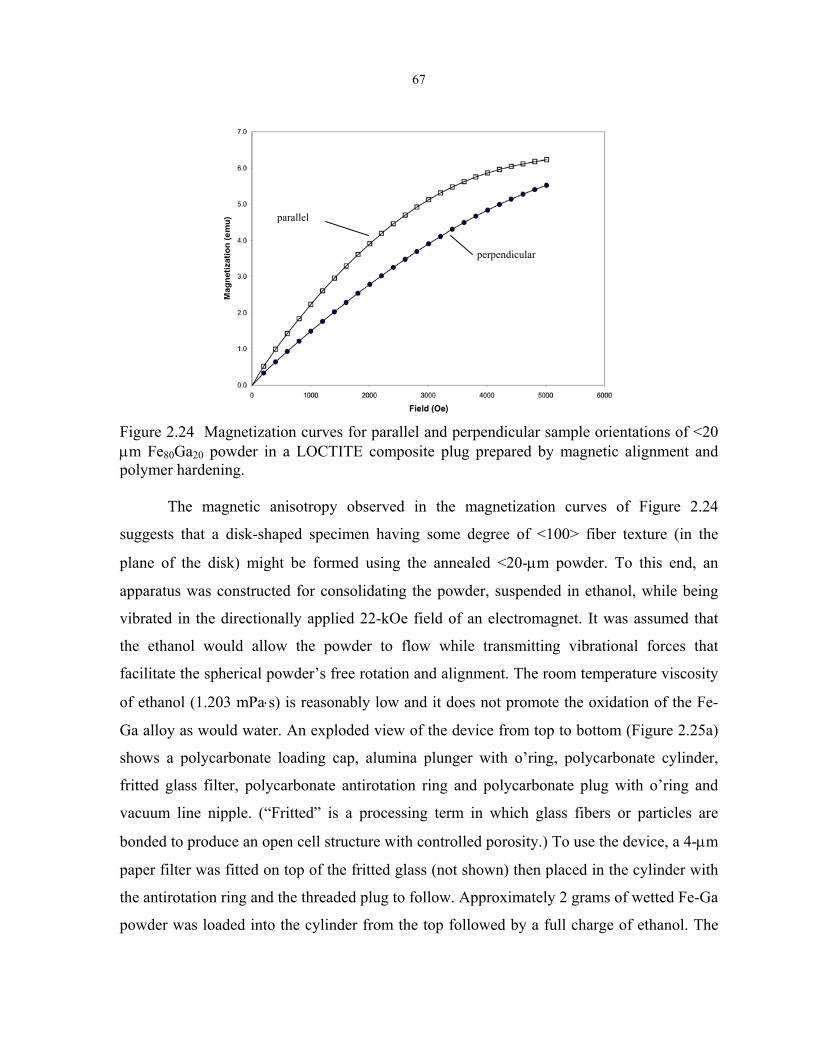
67
perpendicular
parallel
Figure 2.24 Magnetization curves for parallel and perpendicular sample orientations of <20 µm Fe80Ga20 powder in a LOCTITE composite plug prepared by magnetic alignment and polymer hardening.
The magnetic anisotropy observed in the magnetization curves of Figure 2.24
suggests that a disk-shaped specimen having some degree of <100> fiber texture (in the
plane of the disk) might be formed using the annealed <20-µm powder. To this end, an
apparatus was constructed for consolidating the powder, suspended in ethanol, while being
vibrated in the directionally applied 22-kOe field of an electromagnet. It was assumed that
the ethanol would allow the powder to flow while transmitting vibrational forces that
facilitate the spherical powder’s free rotation and alignment. The room temperature viscosity
of ethanol (1.203 mPa⋅s) is reasonably low and it does not promote the oxidation of the Fe-
Ga alloy as would water. An exploded view of the device from top to bottom (Figure 2.25a)
shows a polycarbonate loading cap, alumina plunger with o’ring, polycarbonate cylinder,
fritted glass filter, polycarbonate antirotation ring and polycarbonate plug with o’ring and
vacuum line nipple. (“Fritted” is a processing term in which glass fibers or particles are
bonded to produce an open cell structure with controlled porosity.) To use the device, a 4-µm
paper filter was fitted on top of the fritted glass (not shown) then placed in the cylinder with
the antirotation ring and the threaded plug to follow. Approximately 2 grams of wetted Fe-Ga
powder was loaded into the cylinder from the top followed by a full charge of ethanol. The
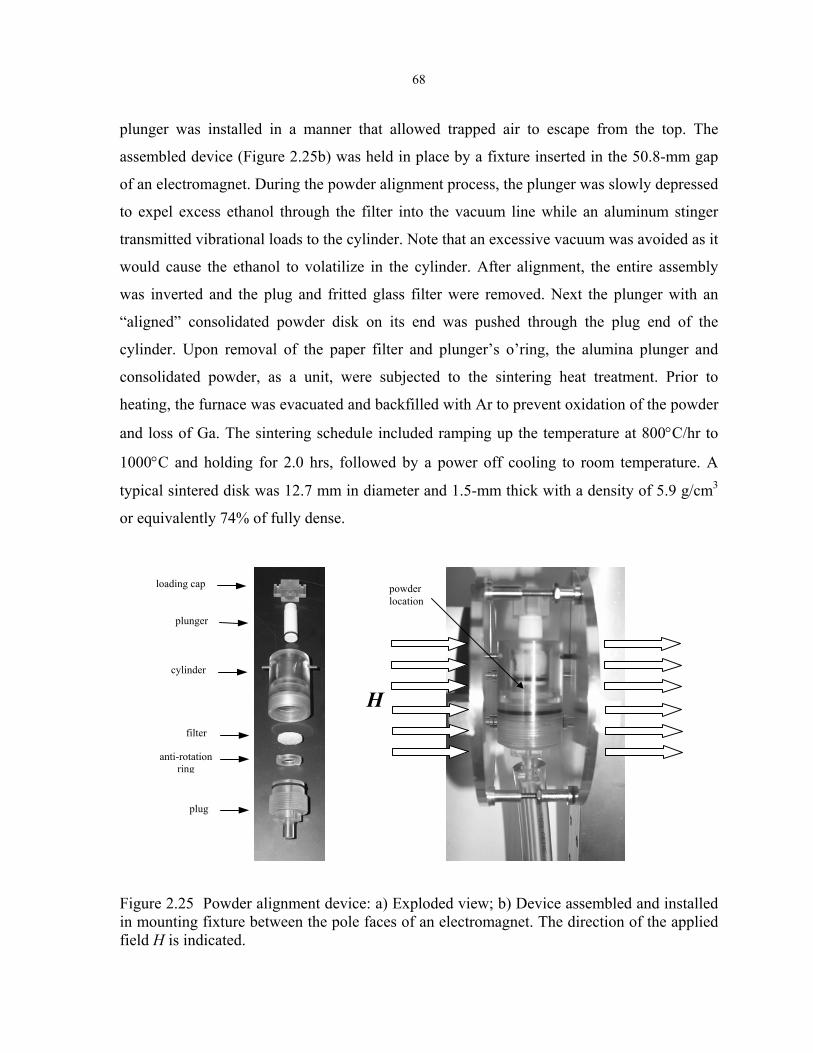
68
plunger was installed in a manner that allowed trapped air to escape from the top. The
assembled device (Figure 2.25b) was held in place by a fixture inserted in the 50.8-mm gap
of an electromagnet. During the powder alignment process, the plunger was slowly depressed
to expel excess ethanol through the filter into the vacuum line while an aluminum stinger
transmitted vibrational loads to the cylinder. Note that an excessive vacuum was avoided as it
would cause the ethanol to volatilize in the cylinder. After alignment, the entire assembly
was inverted and the plug and fritted glass filter were removed. Next the plunger with an
“aligned” consolidated powder disk on its end was pushed through the plug end of the
cylinder. Upon removal of the paper filter and plunger’s o’ring, the alumina plunger and
consolidated powder, as a unit, were subjected to the sintering heat treatment. Prior to
heating, the furnace was evacuated and backfilled with Ar to prevent oxidation of the powder
and loss of Ga. The sintering schedule included ramping up the temperature at 800°C/hr to
1000°C and holding for 2.0 hrs, followed by a power off cooling to room temperature. A
typical sintered disk was 12.7 mm in diameter and 1.5-mm thick with a density of 5.9 g/cm3
or equivalently 74% of fully dense.
plug
anti-rotation ring
filter
cylinder
plunger
loading cap powder location
H
Figure 2.25 Powder alignment device: a) Exploded view; b) Device assembled and installed in mounting fixture between the pole faces of an electromagnet. The direction of the applied field H is indicated.
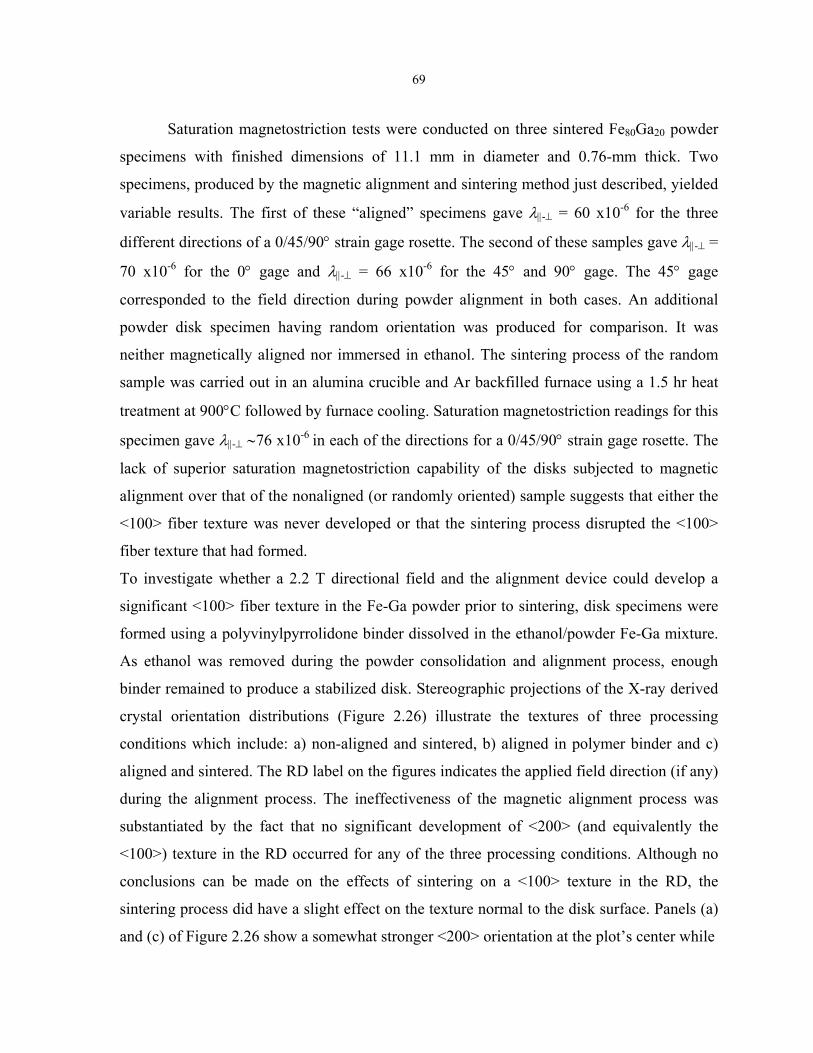
69
Saturation magnetostriction tests were conducted on three sintered Fe80Ga20 powder
specimens with finished dimensions of 11.1 mm in diameter and 0.76-mm thick. Two
specimens, produced by the magnetic alignment and sintering method just described, yielded
variable results. The first of these “aligned” specimens gave λ||-⊥ = 60 x10-6 for the three
different directions of a 0/45/90° strain gage rosette. The second of these samples gave λ||-⊥ =
70 x10-6 for the 0° gage and λ||-⊥ = 66 x10-6 for the 45° and 90° gage. The 45° gage
corresponded to the field direction during powder alignment in both cases. An additional
powder disk specimen having random orientation was produced for comparison. It was
neither magnetically aligned nor immersed in ethanol. The sintering process of the random
sample was carried out in an alumina crucible and Ar backfilled furnace using a 1.5 hr heat
treatment at 900°C followed by furnace cooling. Saturation magnetostriction readings for this
specimen gave λ||-⊥ ∼76 x10-6 in each of the directions for a 0/45/90° strain gage rosette. The
lack of superior saturation magnetostriction capability of the disks subjected to magnetic
alignment over that of the nonaligned (or randomly oriented) sample suggests that either the
<100> fiber texture was never developed or that the sintering process disrupted the <100>
fiber texture that had formed.
To investigate whether a 2.2 T directional field and the alignment device could develop a
significant <100> fiber texture in the Fe-Ga powder prior to sintering, disk specimens were
formed using a polyvinylpyrrolidone binder dissolved in the ethanol/powder Fe-Ga mixture.
As ethanol was removed during the powder consolidation and alignment process, enough
binder remained to produce a stabilized disk. Stereographic projections of the X-ray derived
crystal orientation distributions (Figure 2.26) illustrate the textures of three processing
conditions which include: a) non-aligned and sintered, b) aligned in polymer binder and c)
aligned and sintered. The RD label on the figures indicates the applied field direction (if any)
during the alignment process. The ineffectiveness of the magnetic alignment process was
substantiated by the fact that no significant development of <200> (and equivalently the
<100>) texture in the RD occurred for any of the three processing conditions. Although no
conclusions can be made on the effects of sintering on a <100> texture in the RD, the
sintering process did have a slight effect on the texture normal to the disk surface. Panels (a)
and (c) of Figure 2.26 show a somewhat stronger <200> orientation at the plot’s center while

70
a) Non-aligned and sintered
4.0 4.0 4.0
2.0 6.0 2.0 2.0 6.0
6.0
b) Subjected to a 2.2 T magnetic field and consolidated with polymer binder
3.6 4.0 3.0 1.8 2.0 2.0
5.0 4.5 5.0
c) Subjected to a 2.2 T magnetic field and sintered
5.0 5.0 5.0 2.0 2.0 7.0 2.0 7.0 7.0
Figure 2.26 X-ray derived stereographic projection of crystallographic orientation for polycrystalline <20 µm Fe80Ga20 powder: a) Non-aligned and sintered at 900°C then furnace cooled; b) Magnetically “aligned” in polyvinylpyrrolidone binder; c) Magnetically “aligned” and sintered at 1000°C then furnace cooled.
71
while a weaker signal occurs for larger angles from the plane normal. Additionally, the
<110> projections for the sintered cases show a slight increase in signal return intensity at
approximately 45° off of the plane normal. The cause for this weak texturing remains
unknown, but it might be related to surface energy effects with the Ar annealing atmosphere
similar to that discussed in Section 2.3.2.3 for the rolled material.
Summarizing the magnetically aligned powder Fe-Ga approach, the magnetic
anisotropy of each particle did not generate enough torque to rotate the particles into
alignment under the processing conditions described, however sintering in Ar has a weak yet
measurable texturing effect on a previously random crystallographic orientation distribution.
2.4 Texturing and magnetostriction performance summary
A summary of the saturation magnetostrictive performance for the texturing direction
is included in Table 2.1 along with brief comments characterizing processing, texture, grain
morphology and mechanical characteristics. Observations made throughout the various
texturing processes as well as texture and saturation magnetostriction results lead to the
following conclusions:
Single crystal - Possesses maximum magnetostriction, however Bridgman growth process
limits specimen size and yield.
Directionally solidified - Produces elongated multicrystals with moderate
magnetostrictions, but finer grain size is needed to remedy susceptibility intergranular
brittle failure.
Extrusion - Produces material with magnetostrictions comparable to Ni but only 1/5th that
of a single crystal. A strong <110> wire texture develops along with good ductility.
Hot forging - Generated low magnetostrictions due to irregular flow patterns and texture.
Use of lower aspect ratio forging blanks with larger deformations may improve this
situation.
Cold forging - Weak texture development indicates that larger deformations are needed.
A stoichiometric reduction from the 20 at.% Ga content might permit larger deformations
without specimen cracking.
72
Rolled and recrystallized - Offers the most promise for large-scale production of material
having modest magnetostrictions. Much work needs to be done to develop the proper
processing technique. Consider additives to affect grain nucleation and possibly refine the
grain structure after recrystallization to improve ductility. Note that surface textures are
likely to differ from that of the sheet interior due to surface energy effects, roller forces
and temperature gradients.
Cold rolled finish - Resulting texture did not favor good magnetostrictive performance,
however the process generates a fine- elongated grain structure with good ductility.
Magnetically aligned powder - Produced 74% dense material with mediocre
magnetostrictive capability. Contact forces appear to be overwhelming the torque
generated by magnetic anisotropy to prevent crystallographic alignment. Alignment
might be improved by increasing the particle size since larger particles have a larger
volume to surface area ratio. However, the particles single-crystal character must be
maintained to retain their magnetic anisotropy.
The originally stated objective to produce a textured polycrystalline Fe-Ga alloy that
possess a high degree of magnetostrictive capability and good mechanical properties has
clearly been difficult to achieve. Although this work has not uncovered an exemplary
processing technique it provides some guidance for future work.
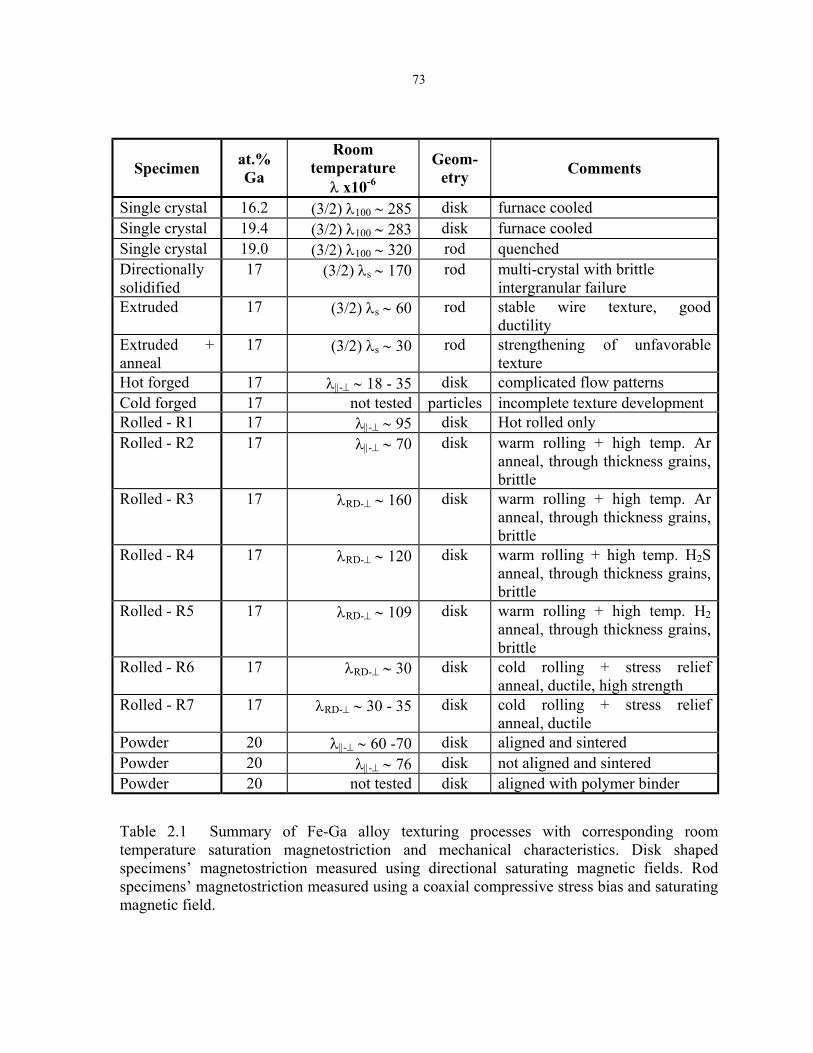
73
Specimen at.% Ga
Room temperature
λ x10-6
Geom-etry Comments
Single crystal 16.2 (3/2) λ100 ∼ 285 disk furnace cooled Single crystal 19.4 (3/2) λ100 ∼ 283 disk furnace cooled Single crystal 19.0 (3/2) λ100 ∼ 320 rod quenched Directionally solidified
17 (3/2) λs ∼ 170 rod multi-crystal with brittle intergranular failure
Extruded 17 (3/2) λs ∼ 60 rod stable wire texture, good ductility
Extruded + anneal
17 (3/2) λs ∼ 30 rod strengthening of unfavorable texture
Hot forged 17 λ||-⊥ ∼ 18 - 35 disk complicated flow patterns Cold forged 17 not tested particles incomplete texture development Rolled - R1 17 λ||-⊥ ∼ 95 disk Hot rolled only Rolled - R2 17 λ||-⊥ ∼ 70 disk warm rolling + high temp. Ar
anneal, through thickness grains, brittle
Rolled - R3 17 λRD-⊥ ∼ 160 disk warm rolling + high temp. Ar anneal, through thickness grains, brittle
Rolled - R4 17 λRD-⊥ ∼ 120 disk warm rolling + high temp. H2S anneal, through thickness grains, brittle
Rolled - R5 17 λRD-⊥ ∼ 109 disk warm rolling + high temp. H2 anneal, through thickness grains, brittle
Rolled - R6 17 λRD-⊥ ∼ 30 disk cold rolling + stress relief anneal, ductile, high strength
Rolled - R7 17 λRD-⊥ ∼ 30 - 35 disk cold rolling + stress relief anneal, ductile
Powder 20 λ||-⊥ ∼ 60 -70 disk aligned and sintered Powder 20 λ||-⊥ ∼ 76 disk not aligned and sintered Powder 20 not tested disk aligned with polymer binder
Table 2.1 Summary of Fe-Ga alloy texturing processes with corresponding room temperature saturation magnetostriction and mechanical characteristics. Disk shaped specimens’ magnetostriction measured using directional saturating magnetic fields. Rod specimens’ magnetostriction measured using a coaxial compressive stress bias and saturating magnetic field.
74
3. QUASI-STATIC MAGNETIC CHARACTERIZATION
The objective of the work presented in this chapter is characterization of the
magnetoelastic properties of single crystal and textured polycrystalline Fe-Ga alloys under
controlled mechanical, magnetic and thermal conditions. Single crystal test results will later
be used for model development and validation in Chapter 5 as well as providing a baseline
data set with which to compare the magnetoelastic response of textured polycrystalline Fe-Ga
alloys. These characterization results will also be useful for quantifying the material’s strain
and force output for transducer applications as well as stress induced magnetization changes
for sensing applications. Polycrystalline samples of interest, identified in Chapter 2, include
the directionally solidified specimen, which possesses a favorable saturation magnetostriction
output, and the extruded specimen, whose magnetostriction properties were significantly
reduced by annealing. A brief discussion of the thermally controlled transducer used for the
magnetic testing is presented first in Section 3.1. Thereafter, the single crystal response to
major loop cyclic magnetic fields under different temperature and stress conditions, as well
as its response to minor loop cyclic magnetic fields and major loop cyclic stress is examined
in Section 3.2. Next, in Section 3.3 the magnetic and magnetostrictive responses to major-
loop cyclic magnetic field conditions are compared for the directionally solidified, extruded
and single crystal specimens. The chapter concludes with a magnetic characterization
summary of the different Fe-Ga alloys examined.
3.1 Thermally controlled transducer
With the goal of testing rod-shaped Fe-Ga alloys under controlled quasi-static
conditions, thermal, magnetic and mechanical operating regimes were considered in the
design and operation of the thermally controlled transducer. A schematic (Figure 3.1)
highlights the transducer components and their magnetic and mechanical configurations,
which are essential to effective specimen characterization. The Fe-Ga rod under study resides
at transducer’s center. Immediately surrounding the rod is a sense coil (not shown) for
detecting the sample’s magnetic induction. A Hall Effect chip, which detects the local
magnetic field, is located at the midpoint of the rod length and adjacent to the rod’s surface.

75
Exterior to the sense coil and Hall chip is a cooling tube encased solenoid. For this study, the
design constraint for thermal control was steady state operation ± 1 °C over range of -21 to
+ 80 °C while generating magnetic fields up to 258 kA/m (3240 oersted). Thermally
regulated fluid was used in the heat exchange tubes to mitigate the effects of ohmic heating
produced by the drive solenoid. Minimizing demagnetizing effects of the low aspect ratio
sample, annealed low carbon steel end pieces served as interfaces between the sample and
the steel transducer housing to form a complete magnetic circuit. The end pieces and output
shaft functioned as the load path through which compressive forces up to 3600 N were
transmitted to the system through a load cell. A free-hanging weight assembly imposed
constant longitudinal compressive loads for the major and minor-loop cyclic magnetic tests,
while a hydraulic MTS machine generated variable loads for the major-loop cyclic stress
tests. For further design, construction and operational details of the thermally controlled
transducer see [Kellogg 2000].
414
mm
Figure 3.1 Thermally controlled transducer used for measuring the response of Fe-Ga rod-shaped specimens to the quasi-static application of coaxial magnetic fields and compressive stress. The closed magnetic circuit provides a flux return path.
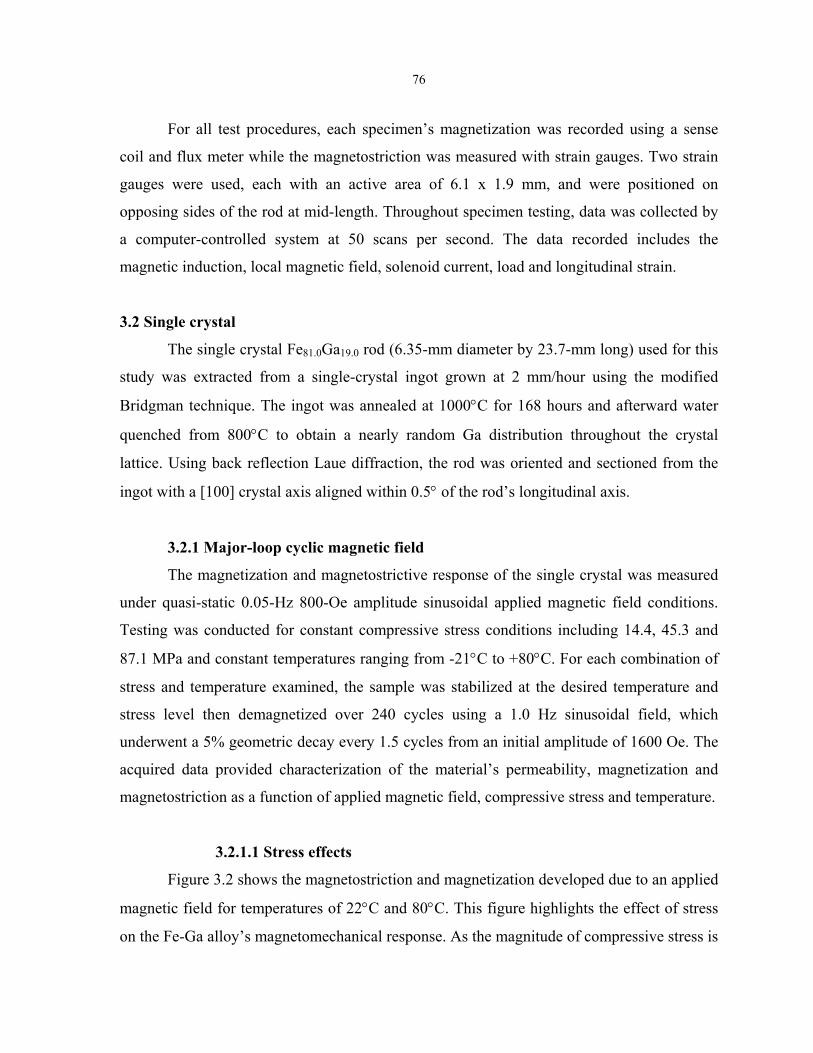
76
For all test procedures, each specimen’s magnetization was recorded using a sense
coil and flux meter while the magnetostriction was measured with strain gauges. Two strain
gauges were used, each with an active area of 6.1 x 1.9 mm, and were positioned on
opposing sides of the rod at mid-length. Throughout specimen testing, data was collected by
a computer-controlled system at 50 scans per second. The data recorded includes the
magnetic induction, local magnetic field, solenoid current, load and longitudinal strain.
3.2 Single crystal
The single crystal Fe81.0Ga19.0 rod (6.35-mm diameter by 23.7-mm long) used for this
study was extracted from a single-crystal ingot grown at 2 mm/hour using the modified
Bridgman technique. The ingot was annealed at 1000°C for 168 hours and afterward water
quenched from 800°C to obtain a nearly random Ga distribution throughout the crystal
lattice. Using back reflection Laue diffraction, the rod was oriented and sectioned from the
ingot with a [100] crystal axis aligned within 0.5° of the rod’s longitudinal axis.
3.2.1 Major-loop cyclic magnetic field
The magnetization and magnetostrictive response of the single crystal was measured
under quasi-static 0.05-Hz 800-Oe amplitude sinusoidal applied magnetic field conditions.
Testing was conducted for constant compressive stress conditions including 14.4, 45.3 and
87.1 MPa and constant temperatures ranging from -21°C to +80°C. For each combination of
stress and temperature examined, the sample was stabilized at the desired temperature and
stress level then demagnetized over 240 cycles using a 1.0 Hz sinusoidal field, which
underwent a 5% geometric decay every 1.5 cycles from an initial amplitude of 1600 Oe. The
acquired data provided characterization of the material’s permeability, magnetization and
magnetostriction as a function of applied magnetic field, compressive stress and temperature.
3.2.1.1 Stress effects
Figure 3.2 shows the magnetostriction and magnetization developed due to an applied
magnetic field for temperatures of 22°C and 80°C. This figure highlights the effect of stress
on the Fe-Ga alloy’s magnetomechanical response. As the magnitude of compressive stress is
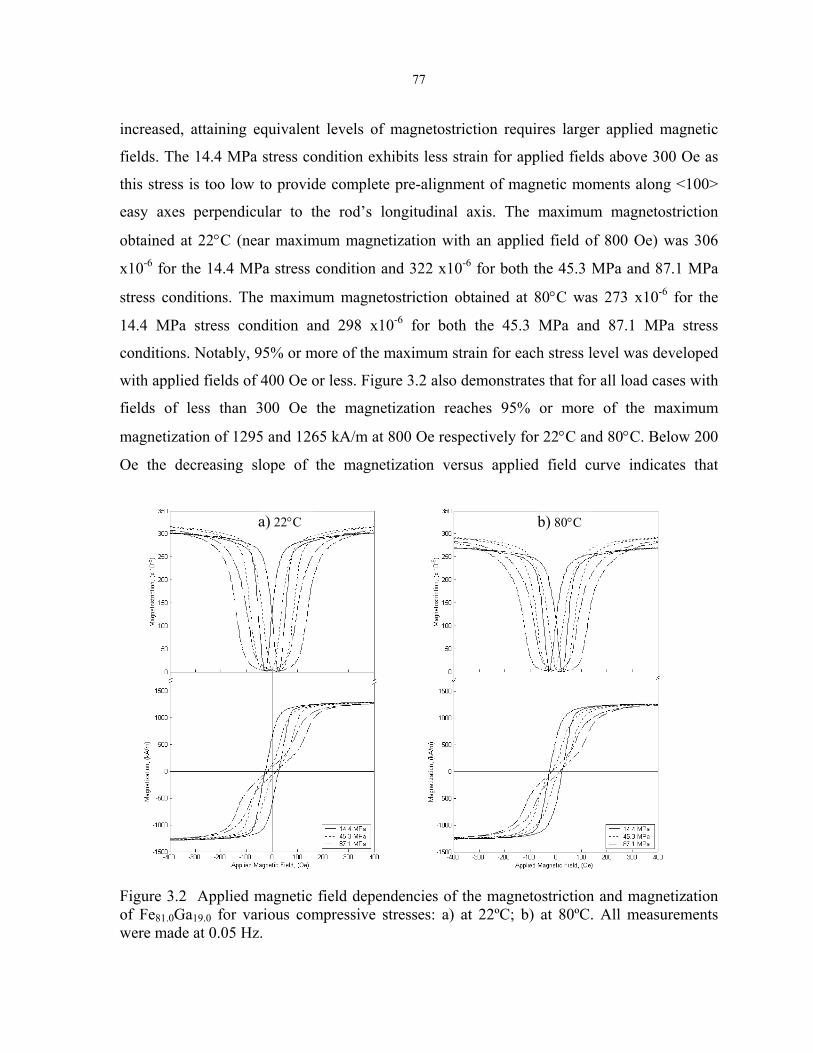
77
increased, attaining equivalent levels of magnetostriction requires larger applied magnetic
fields. The 14.4 MPa stress condition exhibits less strain for applied fields above 300 Oe as
this stress is too low to provide complete pre-alignment of magnetic moments along <100>
easy axes perpendicular to the rod’s longitudinal axis. The maximum magnetostriction
obtained at 22°C (near maximum magnetization with an applied field of 800 Oe) was 306
x10-6 for the 14.4 MPa stress condition and 322 x10-6 for both the 45.3 MPa and 87.1 MPa
stress conditions. The maximum magnetostriction obtained at 80°C was 273 x10-6 for the
14.4 MPa stress condition and 298 x10-6 for both the 45.3 MPa and 87.1 MPa stress
conditions. Notably, 95% or more of the maximum strain for each stress level was developed
with applied fields of 400 Oe or less. Figure 3.2 also demonstrates that for all load cases with
fields of less than 300 Oe the magnetization reaches 95% or more of the maximum
magnetization of 1295 and 1265 kA/m at 800 Oe respectively for 22°C and 80°C. Below 200
Oe the decreasing slope of the magnetization versus applied field curve indicates that
b) 80°C a) 22°C
Figure 3.2 Applied magnetic field dependencies of the magnetostriction and magnetization of Fe81.0Ga19.0 for various compressive stresses: a) at 22ºC; b) at 80ºC. All measurements were made at 0.05 Hz.
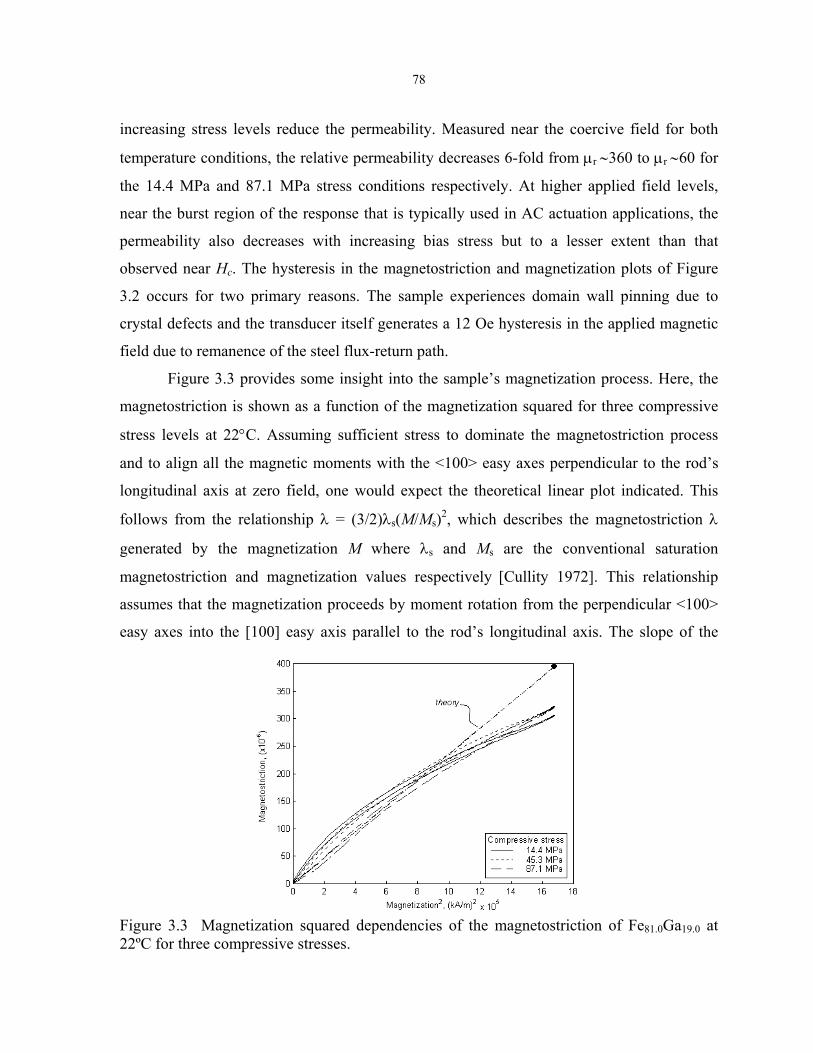
78
increasing stress levels reduce the permeability. Measured near the coercive field for both
temperature conditions, the relative permeability decreases 6-fold from µr ∼360 to µr ∼60 for
the 14.4 MPa and 87.1 MPa stress conditions respectively. At higher applied field levels,
near the burst region of the response that is typically used in AC actuation applications, the
permeability also decreases with increasing bias stress but to a lesser extent than that
observed near Hc. The hysteresis in the magnetostriction and magnetization plots of Figure
3.2 occurs for two primary reasons. The sample experiences domain wall pinning due to
crystal defects and the transducer itself generates a 12 Oe hysteresis in the applied magnetic
field due to remanence of the steel flux-return path.
Figure 3.3 provides some insight into the sample’s magnetization process. Here, the
magnetostriction is shown as a function of the magnetization squared for three compressive
stress levels at 22°C. Assuming sufficient stress to dominate the magnetostriction process
and to align all the magnetic moments with the <100> easy axes perpendicular to the rod’s
longitudinal axis at zero field, one would expect the theoretical linear plot indicated. This
follows from the relationship λ = (3/2)λs(M/Ms)2, which describes the magnetostriction λ
generated by the magnetization M where λs and Ms are the conventional saturation
magnetostriction and magnetization values respectively [Cullity 1972]. This relationship
assumes that the magnetization proceeds by moment rotation from the perpendicular <100>
easy axes into the [100] easy axis parallel to the rod’s longitudinal axis. The slope of the
Figure 3.3 Magnetization squared dependencies of the magnetostriction of Fe81.0Ga19.0 at 22ºC for three compressive stresses.
79
theoretical trace is based on values of (3/2)λs = 395 ppm (determined at room temperature by
orthogonal saturating applied fields) and Ms = 1313 kA/m that were previously measured by
Clark et al. using a (010) disk cut from the same Fe-Ga alloy ingot used in this study [Clark
2001b]. The fact that the experimental traces of Figure 3.3 are nonlinear indicates that the
stress anisotropy generated by these compressive stresses were insufficient to cause the
magnetization processes to occur solely by 90° moment rotation even at 87.1 MPa.
Additionally, the maximum λ values for both the 45.3 MPa and 87.1 MPa stress conditions at
this temperature were identically 320 x10-6, which suggests that the (3/2)λs value of 395
x10-6 may be unattainable even with further increases in compressive stress. Lower values of
maximum λ have been observed in other rod-shaped specimens (tested under compressive
stress) compared to disk shaped-specimens of identical stoichiometry (measured with
orthogonal saturating fields). This may be due in part to complex domain structures in the
stressed rod-shaped specimens.
It is anticipated that the maximum magnetostrictive capability of the Fe-Ga alloys,
observed at modest compressive stresses (45.3 MPa for example), will be retained to higher
stress levels (perhaps 400 MPa or more) and will be limited only by the material’s yield
stress. However, achieving the maximum magnetostriction at high stress will require applied
fields significantly higher than the 1000 Oe field levels used for this study. Should an Fe-Ga
alloy undergo stresses large enough to produce yield deformation, its post-yield
magnetostrictive capability should reflect the degree of alteration in its crystallographic
texture. Residual internal stresses, retained after a yielding event, may also influence the
material’s maximum magnetostrictive capability.
3.2.1.2 Temperature effects
The effects of temperature on the relationship of magnetostriction and magnetization
versus applied magnetic field were measured for the 45.3 MPa compressive stress condition.
Figure 3.4a illustrates that the magnetization exhibits only a small reduction with increasing
temperature. Likewise, the magnetostriction experiences only a small reduction with
increasing temperature for applied fields above 100 Oe. The small and consistent nature of
the temperature dependencies suggests that no anomalous changes in the anisotropy
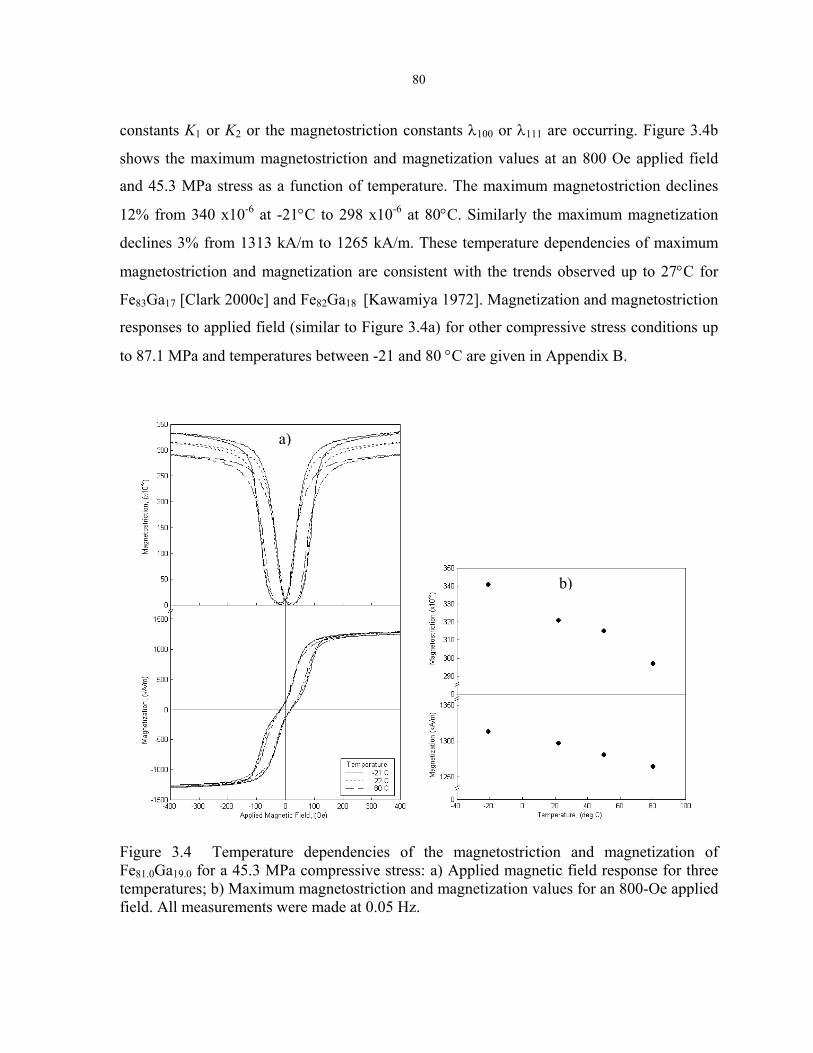
80
constants K1 or K2 or the magnetostriction constants λ100 or λ111 are occurring. Figure 3.4b
shows the maximum magnetostriction and magnetization values at an 800 Oe applied field
and 45.3 MPa stress as a function of temperature. The maximum magnetostriction declines
12% from 340 x10-6 at -21°C to 298 x10-6 at 80°C. Similarly the maximum magnetization
declines 3% from 1313 kA/m to 1265 kA/m. These temperature dependencies of maximum
magnetostriction and magnetization are consistent with the trends observed up to 27°C for
Fe83Ga17 [Clark 2000c] and Fe82Ga18 [Kawamiya 1972]. Magnetization and magnetostriction
responses to applied field (similar to Figure 3.4a) for other compressive stress conditions up
to 87.1 MPa and temperatures between -21 and 80 °C are given in Appendix B.
b)
a)
Figure 3.4 Temperature dependencies of the magnetostriction and magnetization of Fe81.0Ga19.0 for a 45.3 MPa compressive stress: a) Applied magnetic field response for three temperatures; b) Maximum magnetostriction and magnetization values for an 800-Oe applied field. All measurements were made at 0.05 Hz.

81
To supplement the knowledge of the magnetic and magnetostrictive properties of Fe-
Ga alloys, the value of Young’s modulus of a Fe81.0Ga19.0 single crystal rod was measured.
The sample’s strain (in a demagnetized state at each stress level) was obtained over a 7.2 to
87.1 MPa compressive stress range for temperatures of -21, 22 and 80 ° (Figure 3.5). Note
that the initial strain levels at -7.2 MPa were similar, so an arbitrary offset was used to allow
viewing of the trend without overlaying the data. Calculations of the slope for the 21 to 87.1
MPa compressive stress range (region of best linearity) reveal that the modulus is nearly
temperature independent with a value of 56.6 ± 0.3 GPa. This modulus is lower than the high
stress low field value of ∼77 GPa reported for single crystal Fe85Ga15 [Clark 2000c].
Kawamiya et al. has measured the coefficient of thermal expansion for BCC Fe3Ga
(Fe- 27 to 29 at.% Ga from Figure 1.4) over a 300-800 K temperature range and found that α
= 12.4 x10⁻⁶. In addition, the room temperature lattice parameter (i.e. atomic spacing along a
crystallographic axis) was experimentally determined to be 2.095 x10⁻¹⁰m [Kawamiya 1972].
Figure 3.5 Fe81.0Ga19.0 single crystal static stress-strain relationship for three different temperatures. Each data point was collected after the specimen was demagnetized under the static load. Initial strain levels are arbitrary.
3.2.2 Minor loop cyclic magnetic field
The magnetostrictive response of the Fe81.0Ga19.0 single crystal rod was measured
under quasi-static (0.05 Hz) minor-loop sinusoidal applied magnetic field conditions at room
temperature using the thermally controlled transducer. Prior to each test, the sample was
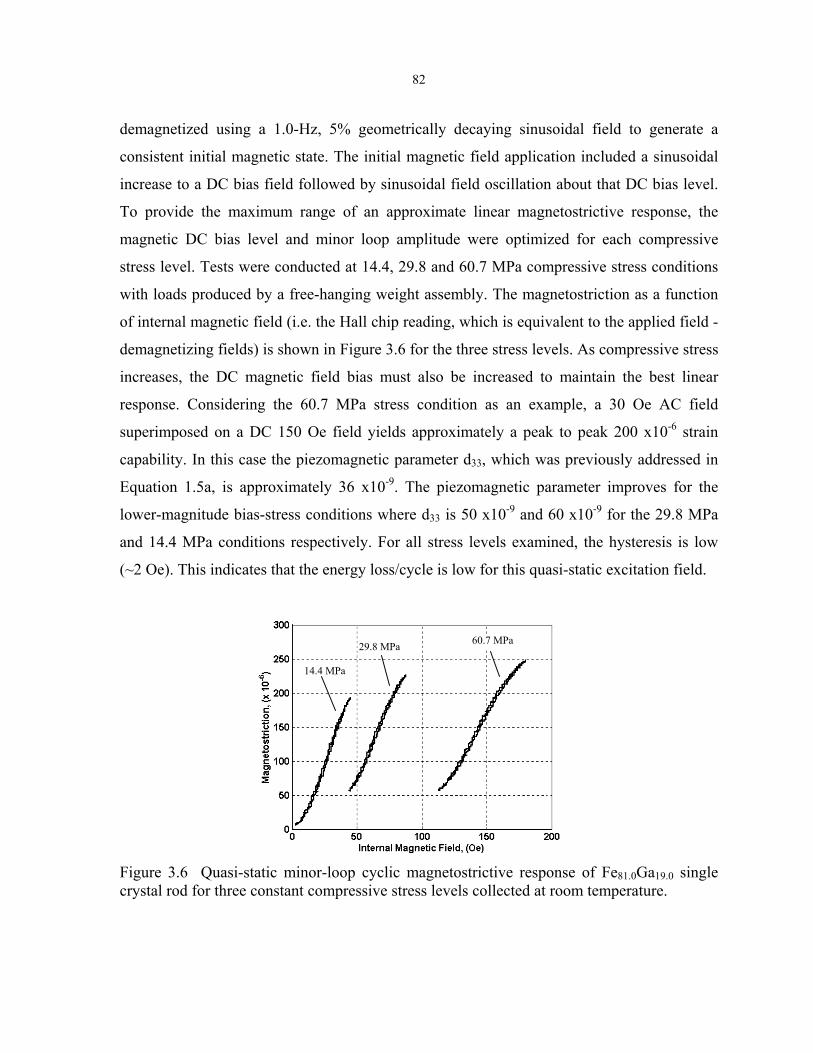
82
demagnetized using a 1.0-Hz, 5% geometrically decaying sinusoidal field to generate a
consistent initial magnetic state. The initial magnetic field application included a sinusoidal
increase to a DC bias field followed by sinusoidal field oscillation about that DC bias level.
To provide the maximum range of an approximate linear magnetostrictive response, the
magnetic DC bias level and minor loop amplitude were optimized for each compressive
stress level. Tests were conducted at 14.4, 29.8 and 60.7 MPa compressive stress conditions
with loads produced by a free-hanging weight assembly. The magnetostriction as a function
of internal magnetic field (i.e. the Hall chip reading, which is equivalent to the applied field -
demagnetizing fields) is shown in Figure 3.6 for the three stress levels. As compressive stress
increases, the DC magnetic field bias must also be increased to maintain the best linear
response. Considering the 60.7 MPa stress condition as an example, a 30 Oe AC field
superimposed on a DC 150 Oe field yields approximately a peak to peak 200 x10-6 strain
capability. In this case the piezomagnetic parameter d33, which was previously addressed in
Equation 1.5a, is approximately 36 x10-9. The piezomagnetic parameter improves for the
lower-magnitude bias-stress conditions where d33 is 50 x10-9 and 60 x10-9 for the 29.8 MPa
and 14.4 MPa conditions respectively. For all stress levels examined, the hysteresis is low
(~2 Oe). This indicates that the energy loss/cycle is low for this quasi-static excitation field.
14.4 MPa
60.7 MPa 29.8 MPa
Figure 3.6 Quasi-static minor-loop cyclic magnetostrictive response of Fe81.0Ga19.0 single crystal rod for three constant compressive stress levels collected at room temperature.
83
However, it should be noted that eddy current losses will likely become a significant loss
mechanism as the operating frequency is increased, because of the finite resistivity of the
material. The resistivity of disordered Fe1-xGax where 13 ≤ x ≤ 19 has not been measured,
however Kawamiya et al. have reported the room temperature resistivity of Fe72Ga28, which
has an ordered Fe3Ga structure, to be ∼70 µΩ⋅cm [Kawamiya 1972]. The resistivity of the
disordered Fe-Ga alloys will likely vary from this result, but the value for Fe72Ga28 is
anticipated to provide a reference point at least within an order of magnitude.
3.2.3 Major-loop cyclic stress
Major-loop cyclic compressive stress testing of the Fe81.0Ga19.0 single crystal rod was
conducted at room temperature using the thermally controlled transducer and a hydraulic
MTS machine. Strain, magnetic induction and applied magnetic field data were recorded
while the sample was linearly stress cycled in compression from 0 to 115 MPa and back. The
test procedure consisted of three processes. First, the specimen was demagnetized under zero
load over 240 cycles using a 1.0-Hz, sinusoidal field undergoing a 5% geometric decay every
1.5 cycles from an initial amplitude of 1600 Oe. This demagnetization process was used to
bring the Fe-Ga alloy sample to a reproducible demagnetized state prior to the start of each
cyclic compression test. Second, a DC magnetic field, up to 891 Oe, was applied by linearly
increasing the applied field from zero to the final value at a rate of 40 Oe/second. Finally,
while recording data, the specimen was compressed and uncompressed at 2 MPa/second
using the MTS machine in feedback load-control mode.
Repetition of the demagnetization, magnetic field application and cyclic compression
steps for various levels of DC applied magnetic field produced a thorough characterization of
the crystal’s strain and magnetization response. The combined test results for various applied
field levels are shown in Figures 3.7a and 3.7b where magnetization or equivalently material
induction J (where J = B-µoH = µoM ) and strain are plotted against stress. At the beginning
of each test, near zero stress, the initial magnetization and magnetostrictive strain levels are
those arising from field-induced changes from the demagnetized state. With increasing levels
of the applied field, the magnetization and magnetostriction values increase and approach
their saturation values. These initial magnetization and strain values could be plotted against

84
the applied field to give the initial responses (for a zero load condition) similar to that of
Figure 3.2. Tracking each curve’s response to cyclic stress, the magnetization and strain
loops are hysteretic, thus indicating an energy loss occurring over the compression and
decompression cycle. Compared to conventional metals, the overall hysteresis is larger due to
the coupling of mechanical and magnetic energy states. Energy losses arise during the
magnetization changes are due to irreversible processes such as domain wall pinning. The
stress induced hysteretic losses of this Fe-Ga alloy are significantly smaller than those
observed for giant magnetostrictive materials such as Terfenol-D [Kellogg 2000]. Notably,
the hysteresis is lowest for the curves where mechanical processes dominate the response to
stress. This occurs for the extreme applied field conditions of zero and 891 Oe where
magnetic moment rotations are limited. In the former case, compressive stress quickly pins
the magnetic moment to the <100> easy axes perpendicular to the longitudinal axis. In the
latter case, the magnetic moments are held in rigid alignment parallel to the rod’s
longitudinal axis by the applied field. In both situations limited changes in magnetization
with stress minimize the hysteresis.
The slopes of the magnetic induction curves reflect the rate of change of
magnetization with respect to stress. For constant levels of applied magnetic field, the
differential ∆J/∆σ approximates this slope to yield the piezomagnetic parameter d*33, which
was previously addressed in Equation 1.5b. The values of d*33 are plotted against stress
(Figure 3.7c) for the compression portion of the cyclic stress test. As the level of DC applied
field increases, for values above 22.3 Oe, the peak values of d*33 decrease while the peak
locations occur at increasing magnitudes of compressive stress. The lower d*33 peak values
reflect a wider distribution in stress of moment rotation while the various peak locations
reflect a changing balance between the material’s magnetic and mechanical energy states.
Sensor applications that detect stress changes using magnetomechanical coupling could
maximize sensitivity (i.e. maximize d*33) by using an optimal DC magnetic field for an
anticipated level of bias stress.
An additional feature of interest in Figure 3.7b is how the slope of the strain curves
with respect to stress vary with the different levels of applied magnetic field. In this case, the
slope gives the material’s compliance SH with the inverse ratio providing the material’s
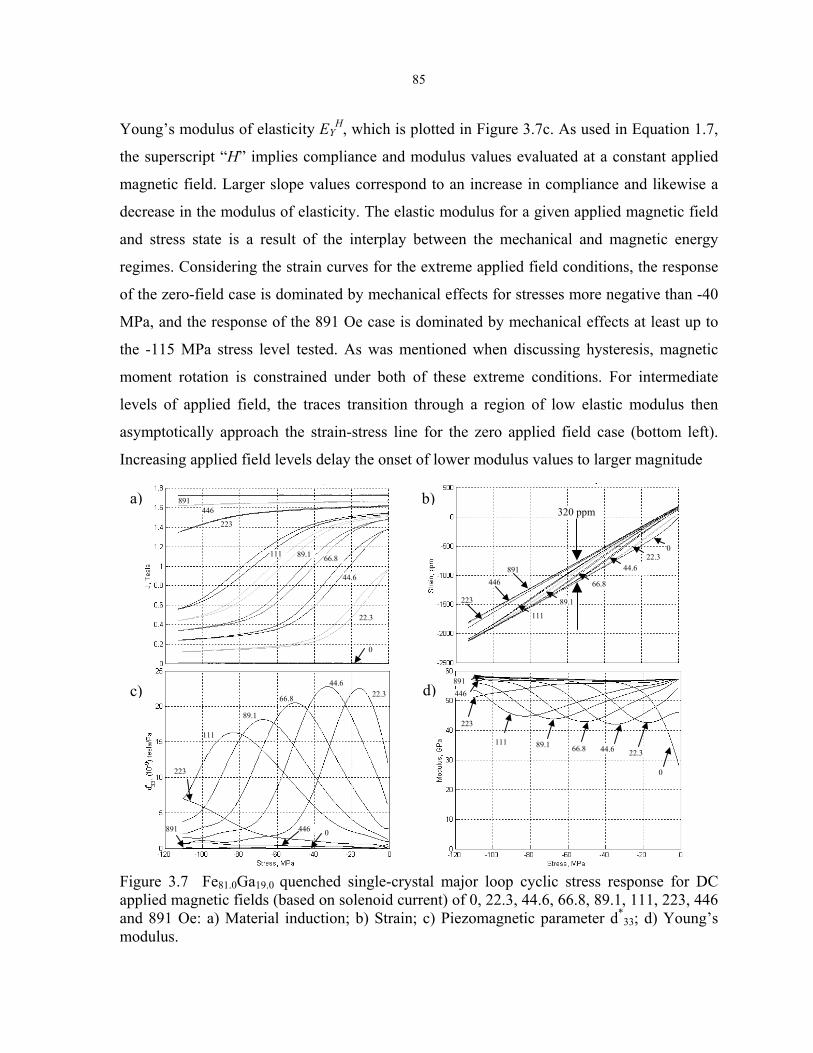
85
Young’s modulus of elasticity EYH, which is plotted in Figure 3.7c. As used in Equation 1.7,
the superscript “H” implies compliance and modulus values evaluated at a constant applied
magnetic field. Larger slope values correspond to an increase in compliance and likewise a
decrease in the modulus of elasticity. The elastic modulus for a given applied magnetic field
and stress state is a result of the interplay between the mechanical and magnetic energy
regimes. Considering the strain curves for the extreme applied field conditions, the response
of the zero-field case is dominated by mechanical effects for stresses more negative than -40
MPa, and the response of the 891 Oe case is dominated by mechanical effects at least up to
the -115 MPa stress level tested. As was mentioned when discussing hysteresis, magnetic
moment rotation is constrained under both of these extreme conditions. For intermediate
levels of applied field, the traces transition through a region of low elastic modulus then
asymptotically approach the strain-stress line for the zero applied field case (bottom left).
Increasing applied field levels delay the onset of lower modulus values to larger magnitude
d) c)
b)
223
446
111
891
89.1 66.8 44.6 22.3
0
320 ppm
891 446
111
223 89.1
66.8
44.6 22.3
0
223
446
111
891
89.1
66.8
44.6 22.3
0
223
446
111
891
89.1 66.8
44.6
22.3
0
a)
Figure 3.7 Fe81.0Ga19.0 quenched single-crystal major loop cyclic stress response for DC applied magnetic fields (based on solenoid current) of 0, 22.3, 44.6, 66.8, 89.1, 111, 223, 446 and 891 Oe: a) Material induction; b) Strain; c) Piezomagnetic parameter d*
33; d) Young’s modulus.
86
compressive stress values. An evaluation of the strain-stress curve slopes shows that high
fields and hence constant induction conditions, gave a magnetically saturated elastic modulus
of Es = 57 GPa, which was observed at all stress levels. For the zero field case, in the initial
or demagnetized state, the elastic modulus at low stress was Eo = 28 GPa and the modulus at
high stress was Eo = 57 GPa. The measured delta-E effect at low stress is (Es-Eo)/Eo = 104%.
A final point of interest for the strain-stress response is the difference in strain values
for the zero and 891 Oe applied fields at constant stress levels less than -40 MPa. Under these
conditions of maximal magnetic moment rotation the strain difference is ∼320 x10-6, which is
approximately equivalent to the room temperature saturation magnetostriction capability of
the specimen given in Figure 3.4b.
3.3 Polycrystalline magnetic response
The quasi-static magnetization and magnetostriction responses of several
polycrystalline Fe81Ga17 alloy rod-shaped specimens were investigated to better understand
their magnetic processes and determine their suitability as actuation elements. These
specimens include the directionally solidified, extruded and extruded plus annealed textured
materials produced by the methods described in Chapter 2. The room temperature response to
a 0.05-Hz sinusoidal applied magnetic field, having an amplitude of 900 Oe, was recorded
for the 28.1 MPa constant compressive stress conditions using the thermally controlled
transducer and free-hanging weight assembly.
Figure 3.8 shows the results for these three polycrystalline specimens along with the
Fe81.0Ga19.0 single crystal response for comparison. The first column of the figure illustrates
each sample’s magnetization characteristics as a function of applied magnetic field. The Fe-
19Ga single crystal saturates at ∼1300 kA/m compared to a ∼1400 kA/m value for the Fe-
17Ga polycrystalline samples. This increase in saturation magnetization is consistent with a
reduction in the content of non-magnetic Ga [Kawamiya 1972]. The magnetization curves of
the single crystal and directionally solidified specimens are nearly identical, however, the
extruded and extruded plus annealed specimens are increasingly difficult to magnetize. This
magnetization difficulty is indicated by the increasingly rounded approach to the final
saturation magnetization level. Recalling the magnetization curves for cubic Fe in Figure 1.3,
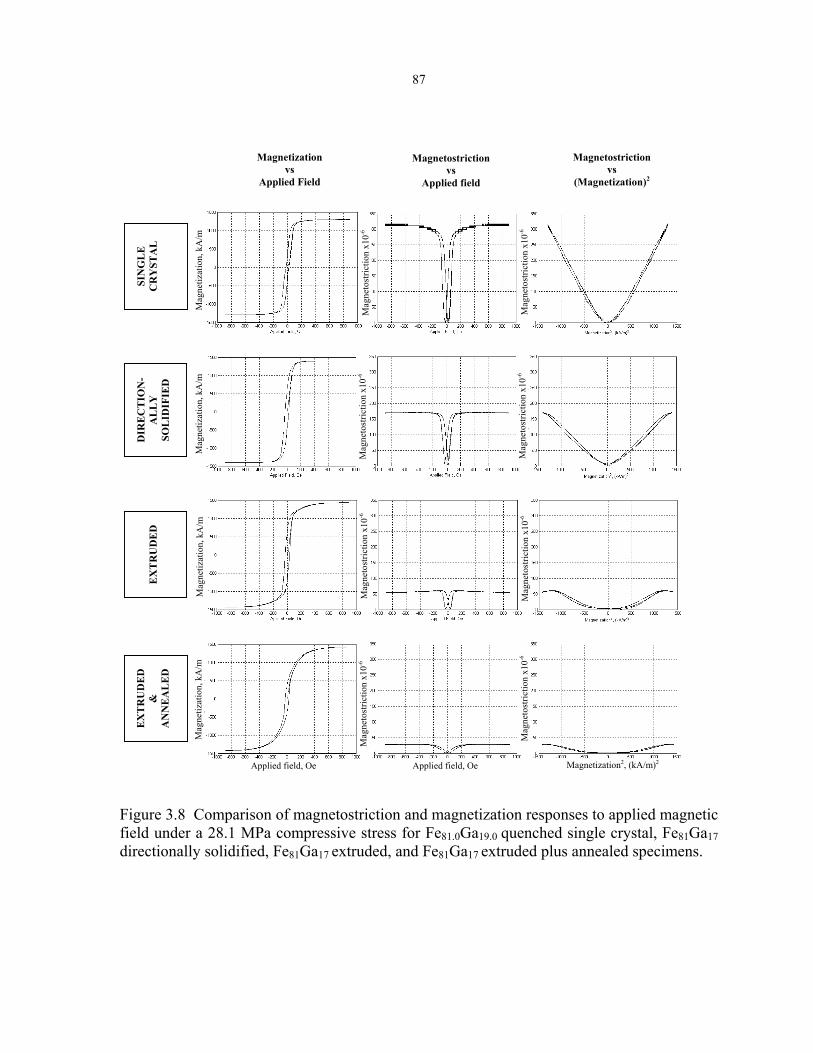
87
Magnetization vs
Applied Field
Magnetostriction vs
(Magnetization)2
Magnetostriction vs
Applied field
Magnetization2, (kA/m)2 Applied field, Oe Applied field, Oe
Mag
neto
stric
tion
x10-6
M
agne
tost
rictio
n x1
0-6
Mag
neto
stric
tion
x10-6
M
agne
tost
rictio
n x1
0-6
Mag
neto
stric
tion
x10-6
M
agne
tost
rictio
n x1
0-6
Mag
neto
stric
tion
x10-6
M
agne
tost
rictio
n x1
0-6
Mag
netiz
atio
n, k
A/m
M
agne
tizat
ion,
kA
/m
Mag
netiz
atio
n, k
A/m
M
agne
tizat
ion,
kA
/m
EX
TR
UD
ED
&
A
NN
EA
LE
D
E
XT
RU
DE
D
DIR
EC
TIO
N-
AL
LY
SO
LID
IFIE
D
SIN
GL
E
CR
YST
AL
Figure 3.8 Comparison of magnetostriction and magnetization responses to applied magnetic field under a 28.1 MPa compressive stress for Fe81.0Ga19.0 quenched single crystal, Fe81Ga17 directionally solidified, Fe81Ga17 extruded, and Fe81Ga17 extruded plus annealed specimens.
88
the material becomes increasingly difficult to magnetize going from <100> to <110> and
finally <111> crystallographic textures due to magnetocrystalline anisotropy. Comparing the
extruded and extruded plus annealed specimens, the magnetization response suggests that
annealing may have induced an increase in the <111> texture component.
The second column of Figure 3.8 presents the magnetostriction as a function of
applied magnetic field. The quenched Fe-19Ga single crystal generates the maximum output
at 320 x10-6, with its near perfect <100> texture, compared to values of 170 x10-6, 60 x10-6
and 30 x10-6 for the polycrystalline Fe-17Ga directionally solidified, extruded and extruded
plus annealed specimens respectively. This trend in decreasing magnetostrictive output
reflects an increasing deviation from the ideal <100> texture. The magnetostrictive
micromechanics model of Chapter 5 will address these magnetostriction texture
dependencies in more detail.
The final column of Figure 3.8 reveals that the magnetostriction and magnetization
relationship varies depending upon the method of processing and ultimately the degree and
type of crystallographic texture. As presented for the single crystal in Section 3.2.1.1, theory
suggests that the magnetostriction will be proportional to the magnetization squared.
Therefore, if the goal of a high degree of <100> texturing had been achieved, the plots
should increase linearly with variation of the ordinate value of M 2. Although the single
crystal is fairly linear beyond the initial magnetization phase at 400 (kA/m)2, the extruded
and polycrystalline specimens’ responses deviate substantially from linearity. Given the
presence of the crystallographic grain misorientations revealed in the texture analysis of
Figures 2.5, 2.7 and 2.8, such deviations were not altogether unanticipated.
3.4 Magnetic characterization summary
The Fe81.0Ga19.0 single crystal’s magnetic response under broad temperature and stress
conditions is well behaved. The applied magnetic fields required to develop most of the
measured maximum magnetization and magnetostriction at each constant-temperature level
are low; only 400 Oe is needed for compressive stresses up to 87.1 MPa. Surprisingly, the
stress of 87.1 MPa proved insufficient to cause magnetization processes to occur exclusively
by 90° moment rotations. Constant temperature tests showed that compressive stresses

89
greater than 14.4 MPa were needed to achieve the maximum magnetostriction. Over the
-21°C to 80°C temperature range examined, the maximum magnetostriction and
magnetization results decreased monotonically by 12% and 3% with increasing temperature
from their respective maximum values of 340 x10-6 and 1313 kA/m at -21°C. This small
magnetostrictive decrease is consistent with a correspondingly small 3.6 % decrease in
magnetization over the same temperature range (recall that magnetostriction is proportional
to magnetization squared). No anomalous responses were found. The Young’s modulus of
the demagnetized sample was nearly temperature insensitive over the -21°C to 80°C range
with a value of ∼ 55 ± 1 GPa.
The room temperature quasi-static minor-loop cyclic magnetic field tests established
that the Fe81.0Ga19.0 single crystal can generate magnetostrictions of ∼ 200 x10-6 with good
linearity for compressive stresses up to 87.1 MPa. The applied magnetic field inputs required
for this performance were a 30 Oe amplitude AC field superimposed on a bias field of 150
Oe. Transduction efficiencies should be favorable for this material as the observed hysteresis
was small, with only a 2 Oe loop width detected using the Hall chip. Operating losses in
activation applications may vary from this result however, due to differences in transducer
efficiencies arising from hysteresis in the transducer solenoid and flux-return path itself.
Major-loop cyclic stress testing demonstrated that the Fe81.0Ga19.0 single crystal’s
maximum delta-E effect is 104% with a stiff modulus of 57 GPa coinciding with limited
magnetic moment rotation and a soft modulus of 28 GPa coinciding with maximum magnetic
moment rotation. In addition, the hysteresis developed over a stress cycle was dependent on
the stress and applied magnetic field. Maximum hysteresis is produced when magnetic
moment rotation is abundant and energy is dissipated through domain wall motion and
through pinning sites. Stress induced magnetization changes gave a maximum sensitivity of
d*33 = 22.5 x10⁻⁹ tesla/Pa over a 20 MPa stress range. Optimizing this sensitivity for sensing
applications will require the proper choice of combined DC applied magnetic field and stress.
Finally, the difference between the strain values for the saturating and zero applied magnetic
fields (at any stress level less that -20 MPa) reflects the maximum magnetostriction
capability of the material. In this case that was ∼ 320 x10-6.
90
The room temperature quasi-static major-loop cyclic magnetic field tests of the
polycrystalline samples showed that the directionally solidified magnetization response was
very similar to that of the single crystal. However, the extruded and extruded plus annealed
specimens exhibited greater magnetic anisotropy due to the presence of misoriented grains
having magnetically hard axes in the direction of the applied magnetic field. These
unfavorable grain orientations likely include <110> and <111> texture components.
Magnetization trends were corroborated by the magnetostriction measurements whose values
were 170 x10-6, 60 x10-6 and 30 x10-6 for the polycrystalline Fe-17Ga directionally solidified,
extruded and extruded plus annealed specimens respectively. Unfortunately, the
polycrystalline materials’ magnetostriction capability falls far short of the 320 x10-6 value
observed for a <100> oriented single crystal.
Despite the limited magnetostriction of the polycrystalline specimens developed to
date, the large magnetostriction of single crystals, high permeability and temperature
insensitivity combined with previously observed robust mechanical properties make Fe-Ga
alloys an attractive material for sensing applications as well as transducer, active vibration
control and damping applications where the material is employed as an active structural
material.
91
4. QUASI-STATIC MECHANICAL CHARACTERIZATION
Quasi-static characterization of the Fe-Ga alloys was undertaken to advance the
understanding of their mechanical characteristics and aid in their development as robust
actuator/sensing materials. There are several specific motivations for studying the alloy’s
mechanical properties. First, knowledge of its deformation mechanisms would be useful in
modeling the evolution of crystallographic texture throughout deformation processing. This
information in turn could be used to impart a specific desired crystallographic texture in
polycrystalline forms of the alloy in order to optimize their magnetostrictive performance.
The marginal magnetostriction performance achieved so far in the extruded, rolled and
forged specimens, described in Chapter 2, clearly indicates the need for additional
information. Second, the possible challenges in using this material to form novel engineering
components with favorable structural characteristics in addition to the magnetically active
capability requires knowledge of its elastic properties and strength. Lastly, knowledge of the
alloy’s elastic properties will provide fundamental information for understanding and
predicting the magnetostriction capability of polycrystalline alloy forms through the
implementation of a magnetostrictive micromechanics model to be developed in Chapter 5.
To determine the alloy's active slip systems, critical resolved shear stresses, elastic
moduli, and Poisson's ratios, the responses to uniaxial tensile loading were studied in
Fe83Ga17 single crystal and polycrystalline rolled materials. In section 4.1, single-crystal
specimen preparation, crystallographic orientations and the tensile testing methodology are
reviewed. The plastic regime of the tensile testing results are utilized to analyze the plastic
deformation responses including slip line angles, stress levels and elongations. Subsequent
analysis of the tensile test results focus on the linear portion of the stress-strain response to
quantify the specimens’ elastic properties. Next in Section 4.2, comparisons of the Fe-Ga
plastic and elastic characteristics are made to other alloy systems. The well established
deformation processing methods for transformer steels (Fe-Si) to realize cube 100<001>
and the Goss 110<100> textures and the similarity of Fe-Al alloys system to Fe-Ga alloys
makes comparisons of their active slip systems and critically resolved shear stresses
instructive. Thereafter, the elasticity results from this study are compared to those of other
92
Fe-Ga alloy stoichiometries to provide an overview of the materials’ elastic anisotropy and
auxetic behavior. Section 4.3 presents additional information, where the tensile properties of
a cold rolled Fe83Ga17 polycrystalline specimen are examined to provide an indication of the
alloy’s structural potential. Closing out the chapter, section 4.4 summarizes the mechanical
properties of single and polycrystal specimens.
4.1 Tension testing of Fe-17Ga single crystal
BCC metals exhibit a high degree of anisotropy in their mechanical characteristics
due to the directional dependence in the atomic packing density. Recalling the directionally
dependent properties of high purity α-Fe single crystal (discussed in section 1.4.2 and 1.4.3),
Young’s modulus can vary by a factor of more than two and certain slip systems such as the
110<111> are highly favored. With these types of mechanical anisotropic effects in mind,
tension tests of a Fe-17Ga alloy were designed to utilize single crystals having specific
crystallographic orientations. The choice of these orientations was dictated by the need for
clear simple results, which was ultimately guided by the elastic analysis of section 1.5.2.
Preparation of these oriented single crystals is discussed first, followed by the testing process
and analysis of the ensuing plastic and elastic responses.
4.1.1 Materials preparation
A single crystal of Fe83Ga17 was grown using the modified Bridgman technique,
annealed and furnace cooled using the same techniques as described in section 2.2.1. The
resulting crystal was confirmed to possess a single-phase, fully disordered α-Fe structure
with a random Ga distribution.
The single crystal's orientation was next determined within 0.25° using Laue X-ray
back reflection analysis and then cut into tensile specimens by electro-discharge machining.
After machining, the orientation of each specimen was again checked by Laue X-ray back
reflection analysis. The major and minor faces of the specimens’ gauge length were polished
with progressively finer wetted silicon carbide paper to 800 grit and finished with 1-µm
diamond paste in an oil suspension to provide a smooth surface for slip line observation.

93
4.1.2 Tensile testing procedures
Four single crystal tensile specimens of Fe83Ga17 were tested. Two were cut with the
[110] direction parallel to the tensile axis. The major faces of these specimens were (001)
planes, and the minor faces were 0)1(1 planes. The other two specimens were cut with the
[100] direction parallel to the tensile axis. The major and minor faces of those specimens
were 100 planes. Schematics of the two crystal orientations and their dimensioned
geometries are shown in Figure 4.1. The wedge-shaped ends facilitated gripping the
specimen during tensile loading. Strain gages were attached on opposing major faces near the
specimen midpoint to measure the longitudinal and transverse strains. The specimen surface
under each strain gage was abraded prior to gage installation to improve bonding.
Tensile tests were conducted at room temperature in air of normal humidity.
Specimens were pulled using a hydraulic MTS machine with the cross arm operating in
constant velocity mode at ∼0.5 µm/s. During the course of each tensile test, the loading
changes on the MTS load frame and related fixturing led to slight changes in dimension of
the overall test system. As a result, the specimens were subjected to a minor variation in
strain rate. Over each specimen’s elastic-response regime the strain rate was ∼3 x 10⁻⁶ s-1.
Over each specimen’s plastic-deformation regime the system load remained more constant
and the constant cross arm velocity generated a strain rate of ∼18 x 10-6 s-1. The tensile test of
each specimen took roughly 30 minutes from start to finish. The cross arm displacement,
load, and longitudinal and transverse strain gage outputs were digitally recorded at 10 Hz.
Specimens were pulled up to 2% strain to develop distinct slip lines without excessive
rotation of the original crystal lattice orientation. Slip lines were digitally photographed using
both optical and scanning electron microscopy, and their orientation with respect to the
tensile axis was determined by computer aided image analysis.
A total of four Fe-Ga specimens were prepared and subjected to tensile testing.
However the test results for the first set of [100] and [110] specimens used slightly different
test procedures and were inconclusive and are not reported. Insights gained from the first set
of tests are reflected in the test procedures just described.

94
Figure 4.1 Schematic of [110] and [100] oriented single-crystal tensile specimen geometry with loading direction and strain gage locations indicated. Dimensions are approximately the same for all specimens.
4.1.3 Plastic behavior
The plastic responses of the Fe-Ga single crystal, including slip line formation and the
non-linear portion of the stress-strain curves, allowed for the determination of the active slip
systems and stress levels required to activate them. An analysis of the slip line angles and the
corresponding yield stress is carried out first for the [110] specimens and then the [100]
specimens to characterize the alloy’s plastic properties.
4.1.3.1 Tensile tests with [110] parallel to the tensile axis
The two single-crystal tensile specimens of Fe83Ga17 oriented with the tensile axis
parallel to the [110] direction displayed sufficient ductility to allow determination of the
active slip system and the probable critical resolved shear stress τCRSS. The strain gage data
for one of these specimens was collected to provide a stress-strain plot (Figure 4.2). Analysis
of the response gave E[110] = 160 GPa in the loading direction and ][ 011ν = -0.37 on the (001)
major face. Yielding began at 450 MPa and 0.3% elongation leading to a projected 0.2%
yield stress of 530 MPa. An ultimate tensile strength of 580 MPa was observed with no
fracture occurring through 1.6% elongation. The test was terminated at 1.6% strain with the
onset of decreasing tensile load.
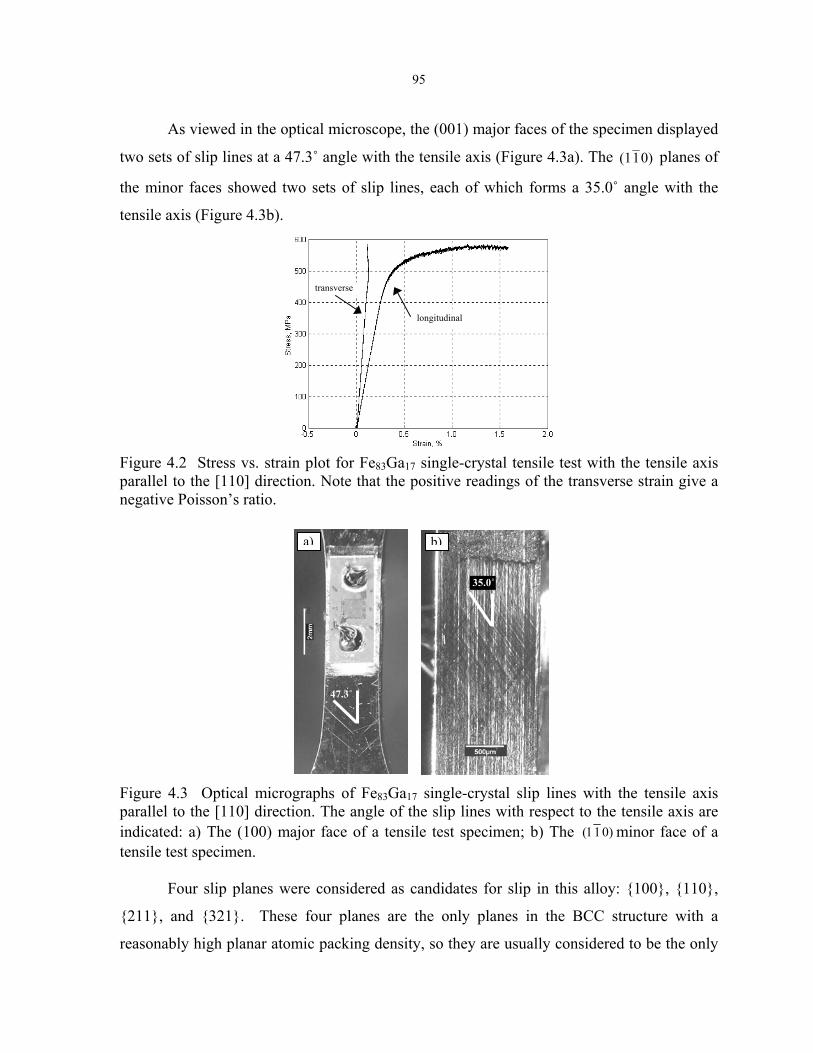
95
As viewed in the optical microscope, the (001) major faces of the specimen displayed
two sets of slip lines at a 47.3˚ angle with the tensile axis (Figure 4.3a). The 0)1(1 planes of
the minor faces showed two sets of slip lines, each of which forms a 35.0˚ angle with the
tensile axis (Figure 4.3b).
transverse
longitudinal
Figure 4.2 Stress vs. strain plot for Fe83Ga17 single-crystal tensile test with the tensile axis parallel to the [110] direction. Note that the positive readings of the transverse strain give a negative Poisson’s ratio.
35.0˚
b)a)
47.3˚
Figure 4.3 Optical micrographs of Fe83Ga17 single-crystal slip lines with the tensile axis parallel to the [110] direction. The angle of the slip lines with respect to the tensile axis are indicated: a) The (100) major face of a tensile test specimen; b) The )011( minor face of a tensile test specimen.
Four slip planes were considered as candidates for slip in this alloy: 100, 110,
211, and 321. These four planes are the only planes in the BCC structure with a
reasonably high planar atomic packing density, so they are usually considered to be the only
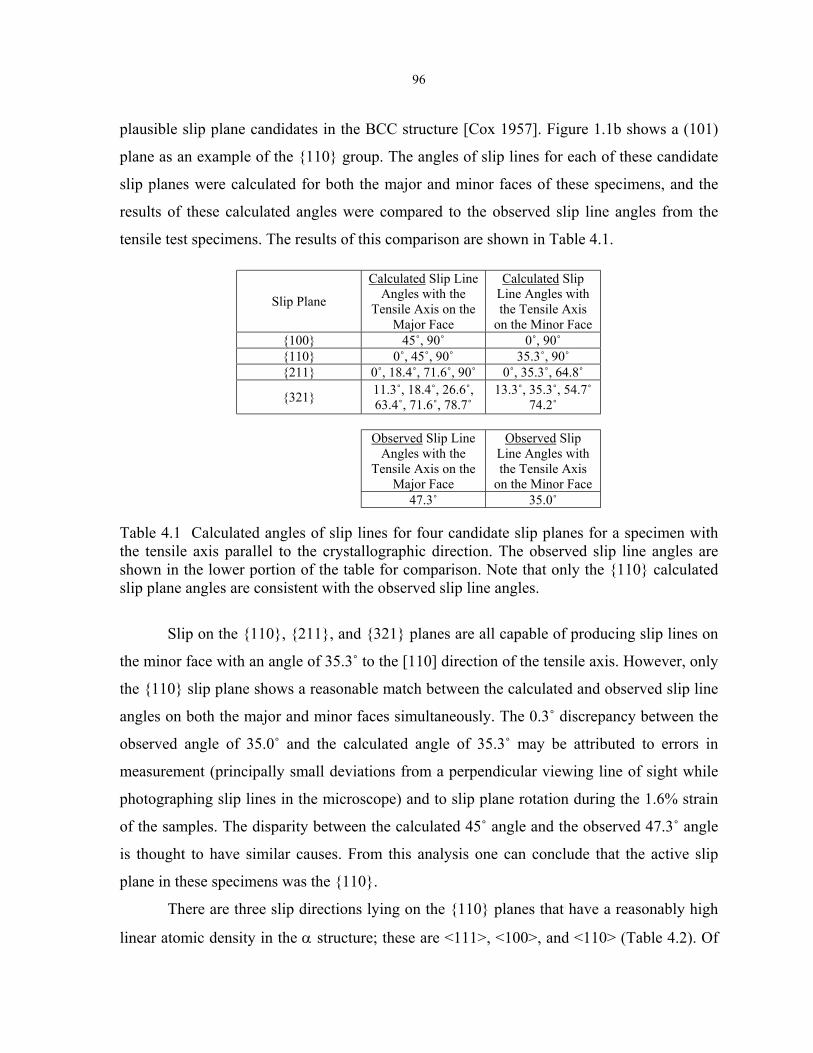
96
plausible slip plane candidates in the BCC structure [Cox 1957]. Figure 1.1b shows a (101)
plane as an example of the 110 group. The angles of slip lines for each of these candidate
slip planes were calculated for both the major and minor faces of these specimens, and the
results of these calculated angles were compared to the observed slip line angles from the
tensile test specimens. The results of this comparison are shown in Table 4.1.
Calculated Slip Line Calculated Slip
Table 4.1 Calculated the tensile axis paralleshown in the lower poslip plane angles are co
Slip on the 11
the minor face with an
the 110 slip plane sh
angles on both the ma
observed angle of 35
measurement (principa
photographing slip lin
of the samples. The di
is thought to have sim
plane in these specime
There are three
linear atomic density i
Slip Plane Angles with the Tensile Axis on the
Major Face
Line Angles with the Tensile Axis
on the Minor Face 100 45˚, 90˚ 0˚, 90˚ 110 0˚, 45˚, 90˚ 35.3˚, 90˚ 211 0˚, 18.4˚, 71.6˚, 90˚ 0˚, 35.3˚, 64.8˚
321 11.3˚, 18.4˚, 26.6˚, 63.4˚, 71.6˚, 78.7˚
13.3˚, 35.3˚, 54.7˚ 74.2˚
Observed Slip Line
Angles with the Tensile Axis on the
Major Face
Observed Slip Line Angles with the Tensile Axis
on the Minor Face 47.3˚ 35.0˚
angles of slip lines for four candidate slip planes for a specimen with l to the crystallographic direction. The observed slip line angles are rtion of the table for comparison. Note that only the 110 calculated nsistent with the observed slip line angles.
0, 211, and 321 planes are all capable of producing slip lines on
angle of 35.3˚ to the [110] direction of the tensile axis. However, only
ows a reasonable match between the calculated and observed slip line
jor and minor faces simultaneously. The 0.3˚ discrepancy between the
.0˚ and the calculated angle of 35.3˚ may be attributed to errors in
lly small deviations from a perpendicular viewing line of sight while
es in the microscope) and to slip plane rotation during the 1.6% strain
sparity between the calculated 45˚ angle and the observed 47.3˚ angle
ilar causes. From this analysis one can conclude that the active slip
ns was the 110.
slip directions lying on the 110 planes that have a reasonably high
n the α structure; these are <111>, <100>, and <110> (Table 4.2). Of
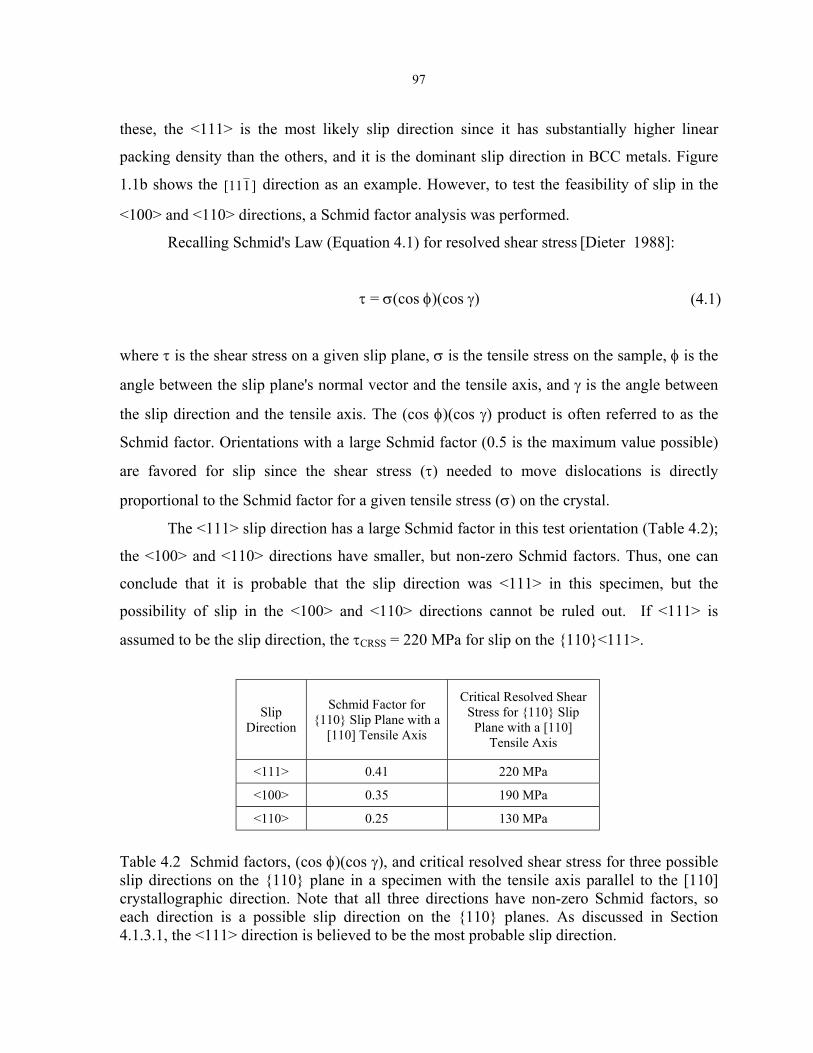
97
these, the <111> is the most likely slip direction since it has substantially higher linear
packing density than the others, and it is the dominant slip direction in BCC metals. Figure
1.1b shows the ]1[11 direction as an example. However, to test the feasibility of slip in the
<100> and <110> directions, a Schmid factor analysis was performed.
Recalling Schmid's Law (Equation 4.1) for resolved shear stress [Dieter 1988]:
τ = σ(cos φ)(cos γ)
where τ is the shear stress on a given slip plane, σ is the tensile stress on the sample, φ is the
angle between the slip plane's normal vector and the tensile axis, and γ is the angle between
the slip direction and the tensile axis. The (cos φ)(cos γ) product is often referred to as the
Schmid factor. Orientations with a large Schmid factor (0.5 is the maximum value possible)
are favored for slip since the shear stress (τ) needed to move dislocations is directly
proportional to the Schmid factor for a given tensile stress (σ) on the crystal.
The <111> slip direction has a large Schmid factor in this test orientation (Table 4.2);
the <100> and <110> directions have smaller, but non-zero Schmid factors. Thus, one can
conclude that it is probable that the slip direction was <111> in this specimen, but the
possibility of slip in the <100> and <110> directions cannot be ruled out. If <111> is
assumed to be the slip direction, the τCRSS = 220 MPa for slip on the 110<111>.
(4.1)
Table 4.2 Schmidslip directions oncrystallographic deach direction is 4.1.3.1, the <111>
Slip Direction
Schmid Factor for 110 Slip Plane with a
[110] Tensile Axis
Critical Resolved Shear Stress for 110 Slip
Plane with a [110] Tensile Axis
<111> 0.41 220 MPa
<100> 0.35 190 MPa
<110> 0.25 130 MPa
factors, (cos φ)(cos γ), and critical resolved shear stress for three possible the 110 plane in a specimen with the tensile axis parallel to the [110] irection. Note that all three directions have non-zero Schmid factors, so a possible slip direction on the 110 planes. As discussed in Section direction is believed to be the most probable slip direction.
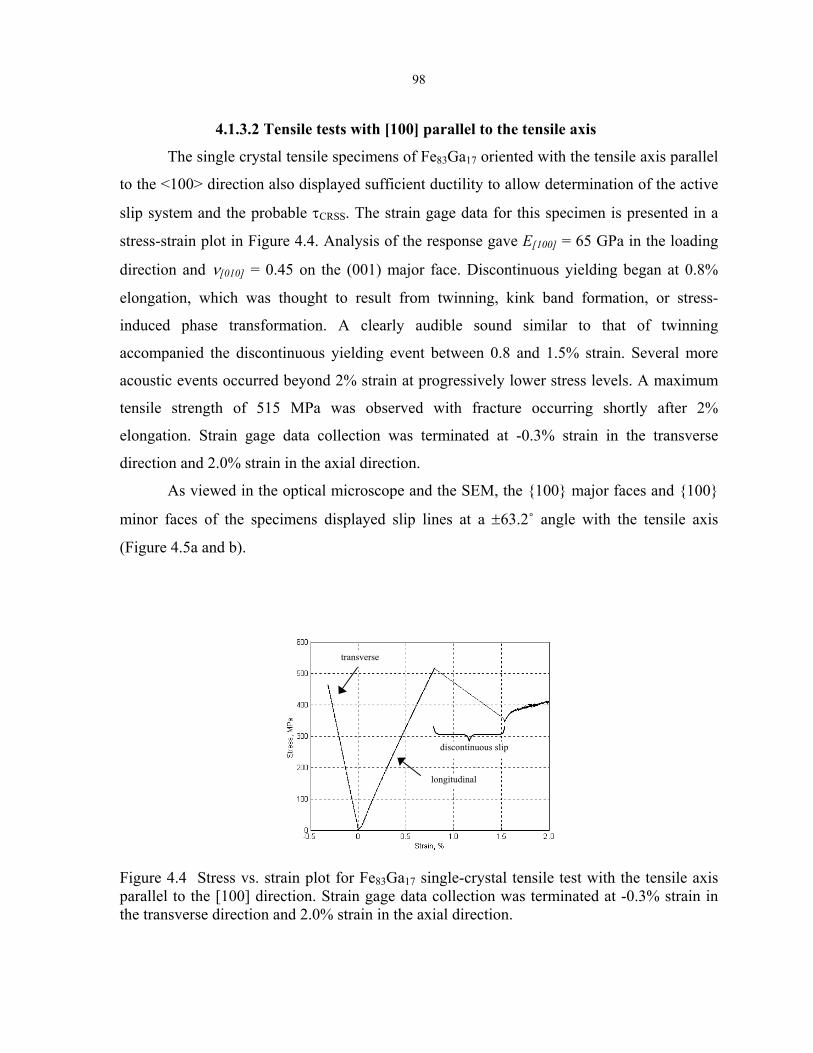
98
4.1.3.2 Tensile tests with [100] parallel to the tensile axis
The single crystal tensile specimens of Fe83Ga17 oriented with the tensile axis parallel
to the <100> direction also displayed sufficient ductility to allow determination of the active
slip system and the probable τCRSS. The strain gage data for this specimen is presented in a
stress-strain plot in Figure 4.4. Analysis of the response gave E[100] = 65 GPa in the loading
direction and ν[010] = 0.45 on the (001) major face. Discontinuous yielding began at 0.8%
elongation, which was thought to result from twinning, kink band formation, or stress-
induced phase transformation. A clearly audible sound similar to that of twinning
accompanied the discontinuous yielding event between 0.8 and 1.5% strain. Several more
acoustic events occurred beyond 2% strain at progressively lower stress levels. A maximum
tensile strength of 515 MPa was observed with fracture occurring shortly after 2%
elongation. Strain gage data collection was terminated at -0.3% strain in the transverse
direction and 2.0% strain in the axial direction.
As viewed in the optical microscope and the SEM, the 100 major faces and 100
minor faces of the specimens displayed slip lines at a ±63.2˚ angle with the tensile axis
(Figure 4.5a and b).
discontinuous slip
transverse
longitudinal
Figure 4.4 Stress vs. strain plot for Fe83Ga17 single-crystal tensile test with the tensile axis parallel to the [100] direction. Strain gage data collection was terminated at -0.3% strain in the transverse direction and 2.0% strain in the axial direction.
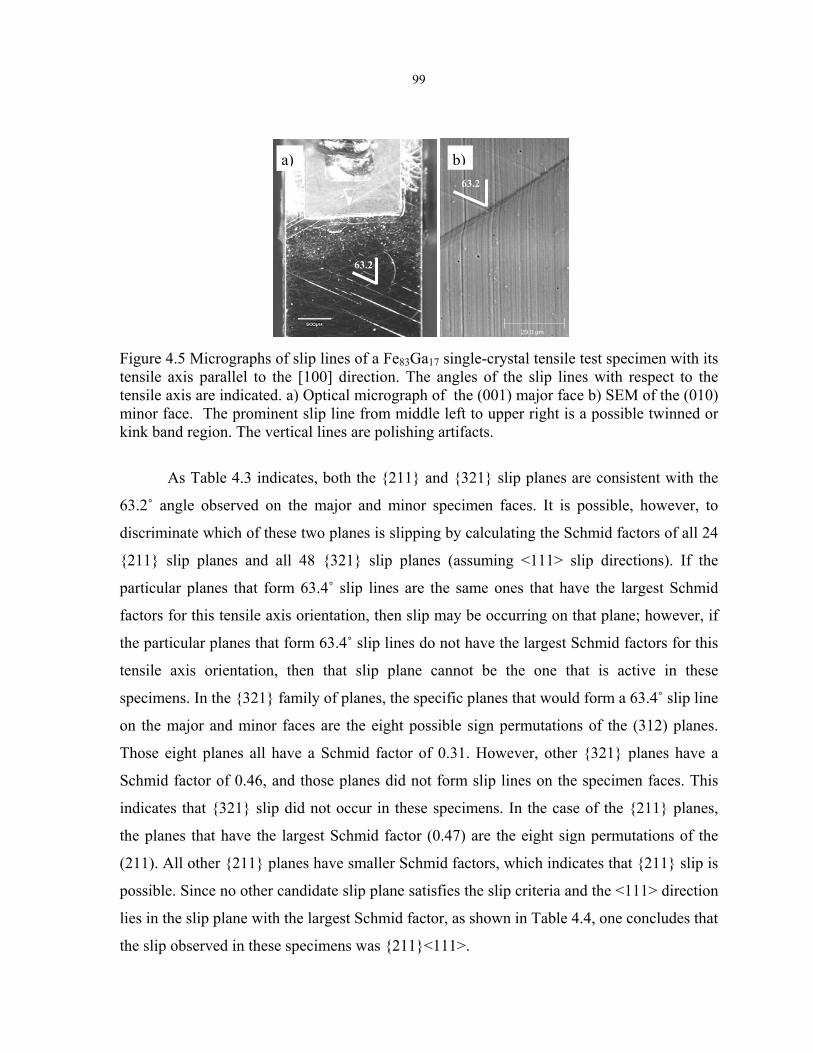
99
63.2
63.2
b)a)
Figure 4.5 Micrographs of slip lines of a Fe83Ga17 single-crystal tensile test specimen with its tensile axis parallel to the [100] direction. The angles of the slip lines with respect to the tensile axis are indicated. a) Optical micrograph of the (001) major face b) SEM of the (010) minor face. The prominent slip line from middle left to upper right is a possible twinned or kink band region. The vertical lines are polishing artifacts.
As Table 4.3 indicates, both the 211 and 321 slip planes are consistent with the
63.2˚ angle observed on the major and minor specimen faces. It is possible, however, to
discriminate which of these two planes is slipping by calculating the Schmid factors of all 24
211 slip planes and all 48 321 slip planes (assuming <111> slip directions). If the
particular planes that form 63.4˚ slip lines are the same ones that have the largest Schmid
factors for this tensile axis orientation, then slip may be occurring on that plane; however, if
the particular planes that form 63.4˚ slip lines do not have the largest Schmid factors for this
tensile axis orientation, then that slip plane cannot be the one that is active in these
specimens. In the 321 family of planes, the specific planes that would form a 63.4˚ slip line
on the major and minor faces are the eight possible sign permutations of the (312) planes.
Those eight planes all have a Schmid factor of 0.31. However, other 321 planes have a
Schmid factor of 0.46, and those planes did not form slip lines on the specimen faces. This
indicates that 321 slip did not occur in these specimens. In the case of the 211 planes,
the planes that have the largest Schmid factor (0.47) are the eight sign permutations of the
(211). All other 211 planes have smaller Schmid factors, which indicates that 211 slip is
possible. Since no other candidate slip plane satisfies the slip criteria and the <111> direction
lies in the slip plane with the largest Schmid factor, as shown in Table 4.4, one concludes that
the slip observed in these specimens was 211<111>.
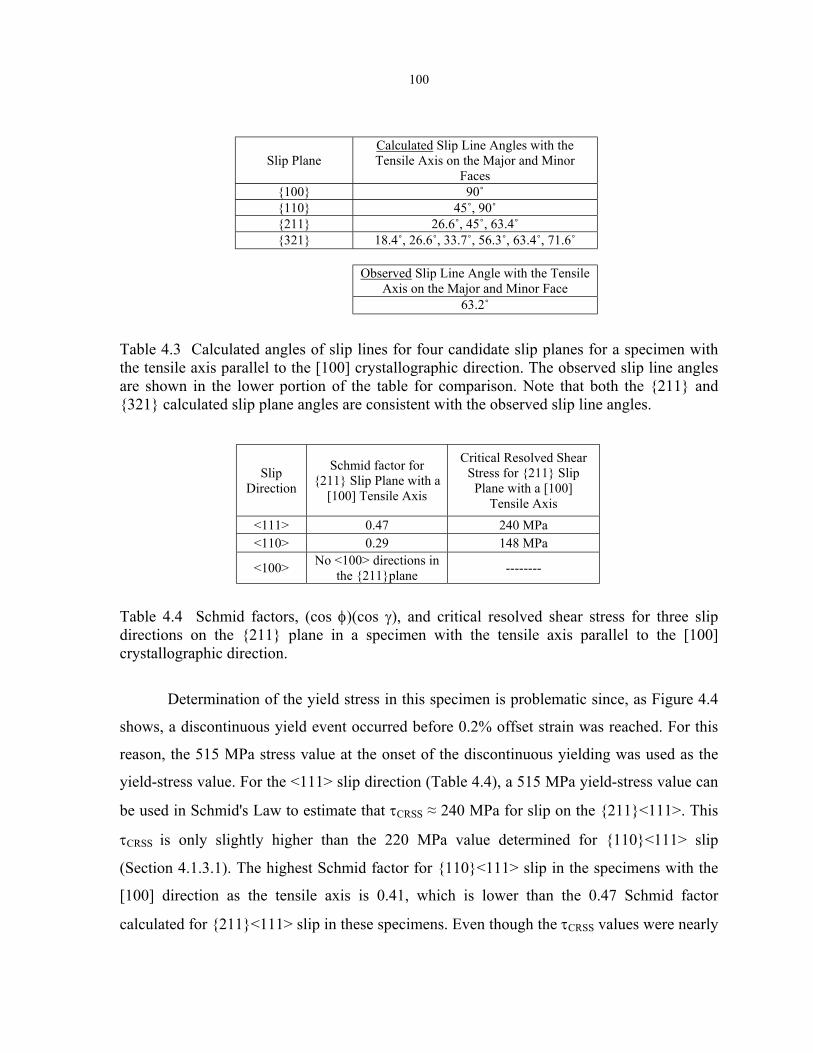
100
Table 4.3 Calculated angles of slip lines for four candidate slip planes for a specimen with the tensile axis parallel to the [100] crystallographic direction. The observed slip line angles are shown in the lower portion of the table for comparison. Note that both the 211 and 321 calculated slip plane angles are consistent with the observed slip line angles.
D
Table 4.4 Schmid fdirections on the 2crystallographic dire
Determinatio
shows, a discontinuo
reason, the 515 MPa
yield-stress value. Fo
be used in Schmid's
τCRSS is only slightl
(Section 4.1.3.1). Th
[100] direction as t
calculated for 211<
Slip irection
Schmid factor for 211 Slip Plane with a
[100] Tensile Axis
Critical Resolved Shear Stress for 211 Slip
Plane with a [100] Tensile Axis
<111> 0.47 240 MPa <110> 0.29 148 MPa
<100> No <100> directions in --------
c
n
h
Slip Plane Calculated Slip Line Angles with the Tensile Axis on the Major and Minor
Faces 100 90˚ 110 45˚, 90˚ 211 26.6˚, 45˚, 63.4˚ 321 18.4˚, 26.6˚, 33.7˚, 56.3˚, 63.4˚, 71.6˚
Observed Slip Line Angle with the Tensile
Axis on the Major and Minor Face 63.2˚
the 211plane
actors, (cos φ)(cos γ), and critical resolved shear stress for three slip 11 plane in a specimen with the tensile axis parallel to the [100] tion.
of the yield stress in this specimen is problematic since, as Figure 4.4
us yield event occurred before 0.2% offset strain was reached. For this
stress value at the onset of the discontinuous yielding was used as the
r the <111> slip direction (Table 4.4), a 515 MPa yield-stress value can
Law to estimate that τCRSS ≈ 240 MPa for slip on the 211<111>. This
y higher than the 220 MPa value determined for 110<111> slip
e highest Schmid factor for 110<111> slip in the specimens with the
e tensile axis is 0.41, which is lower than the 0.47 Schmid factor
111> slip in these specimens. Even though the τCRSS values were nearly
101
equal for these two slip systems, one would expect 211<111> slip to occur in preference to
110<111> slip due to the higher Schmid factor, and indeed that was observed in these
specimens.
4.1.4 Elastic behavior
Utilizing the linear portions of the stress-strain curves in Figures 4.2 and 4.4, the
elastic responses of the respective [110] and [100] oriented single-crystal specimens were
ascertained. The three elastic constants c11, c12, and c44 may then be determined using the
Young’s moduli and Poisson’s ratios from each of the [100] and [110] oriented crystals in
combination. The simultaneous solution of Equations 1.17 and 1.18 allow constants c11 and
c12 to be represented in terms of E[100] and ν[010] as given in Equations 4.2 and 4.3.
( )( )( )[010][010]
[010]
ννν
211E1
c 10011 −+
−= ][
(4.2)
( )( )[010][010]
[100]
ννν
211E
c 10012 −+= ][
(4.3)
Accounting for the maximum error in stress and strain, the variable E[100] is known to
within 3% for this sample. The error in the Poisson’s ratio is estimated at less than 1% by
considering the combined error in longitudinal and transverse strain measurements. Using
values of E[100] = 64.5 ± 1.8 GPa and ν[010] = 0.445 ± 0.004 (from Figure 4.2) then c11 = 225
± 20 GPa and c12 = 181 ± 20 GPa. Notice that the difference in these elastic constants, c11-c12
= E[100]/(1 + ν[010]) = 44.6 ± 1.3 GPa, has a relatively small error bar compared to either c11 or
c12 alone. This fact suggests that the values of c44 and the anisotropy parameter A (Equation
1.22) may be known with higher accuracy.
To estimate the value of c44, either Equations 1.19, 1.20 or 1.21 may be used in
conjunction with the previously determined values of c11 and c12. Since both E[110] and ][ 011ν
were measured in this study, comparisons of c44 calculated using Equations 1.19 and 1.20 are
possible. The values of E[110] = 160.4 ± 1.8 GPa and ][ 011ν = -0.374 ± 0.004 were determined
from the [110] specimen’s stress-strain curves (Figure 4.4) where the same range of error
conditions were present as in the testing of the [100] oriented specimen. A sensitivity

102
analysis shows that admissible solutions satisfying both Equations 1.19 and 1.20 give c44 =
128 ± 2 GPa.
4.2 Discussion of Fe-17Ga single-crystal mechanical properties
At room temperature, the slip system of the Fe83Ga17 single crystals observed in this
study are consistent with those of Fe, Fe-Si and Fe-Al alloy systems. Fe83Ga17 single crystals
exhibited primary slip on the 110<111> with τCRSS = 220 MPa (measured in the [110]
crystal) and secondary slip on the 211<111> with τCRSS = 240 MPa (measured in the [100]
crystal). The primary slip system in high purity (99.96%) α-Fe is 110<111> with τCRSS =
27.5 MPa and secondary slip occurring on the 211<111> and 321<111>. The primary
slip system of Fe97Si3 alloy is mixed with 100<111> and 211<111> both active at τCRSS
∼ 150 MPa [Orlans-Joliet 1990]. The aluminides such as Fe60Al40 and Fe57Al43 single crystals
both exhibit primary slip on the 110<111> with τCRSS values between 82 and 94 MPa
[Baker 2001]. Notably, τCRSS is significantly larger for the Fe-Ga and Fe-Al alloys compared
to pure α-Fe. According to the Friedel relationships, the increase in τCRSS with the presence
substitutional atoms is due to crystal lattice strain, which provides a larger energy barrier to
dislocation movement [Nabarro 1982]. The atomic radii of Si, Al and Ga are all roughly 10%
greater than that of Fe (all with a coordination number of 8 in the BCC lattice), hence
justifying that the lattice interactions are similar. The stress-strain curves of Figure 4.2 and
Figure 4.4 demonstrate that strain hardening is limited in both of the [100] or [110] samples.
Limited strain hardening indicates a lack of dislocation tie-up and is consistent with the
predominance of one active slip system [McLean 1962].
Environmental embrittlement may be a factor in the limited elongations of the
Fe83Ga17 single crystals. The crystal with a tensile axis orientation of [110] began to
experience a stress decline beyond 1.3% elongation (Figure 4.2), indicating that elongation
greater than 1.6% was limited. The crystal with a tensile axis orientation of [100] was pulled
to failure with fracture occurring shortly after 2% elongation (Figure 4.4). Previous work at
room temperature has shown that Fe60Al40 and Fe57Al43 single crystals both had higher
elongations of ~40% before fracture in a dry oxygen atmosphere compared to 20 to 30% in a
vacuum and only 10% in air [Baker 2001]. This embrittlement effect in aluminides is
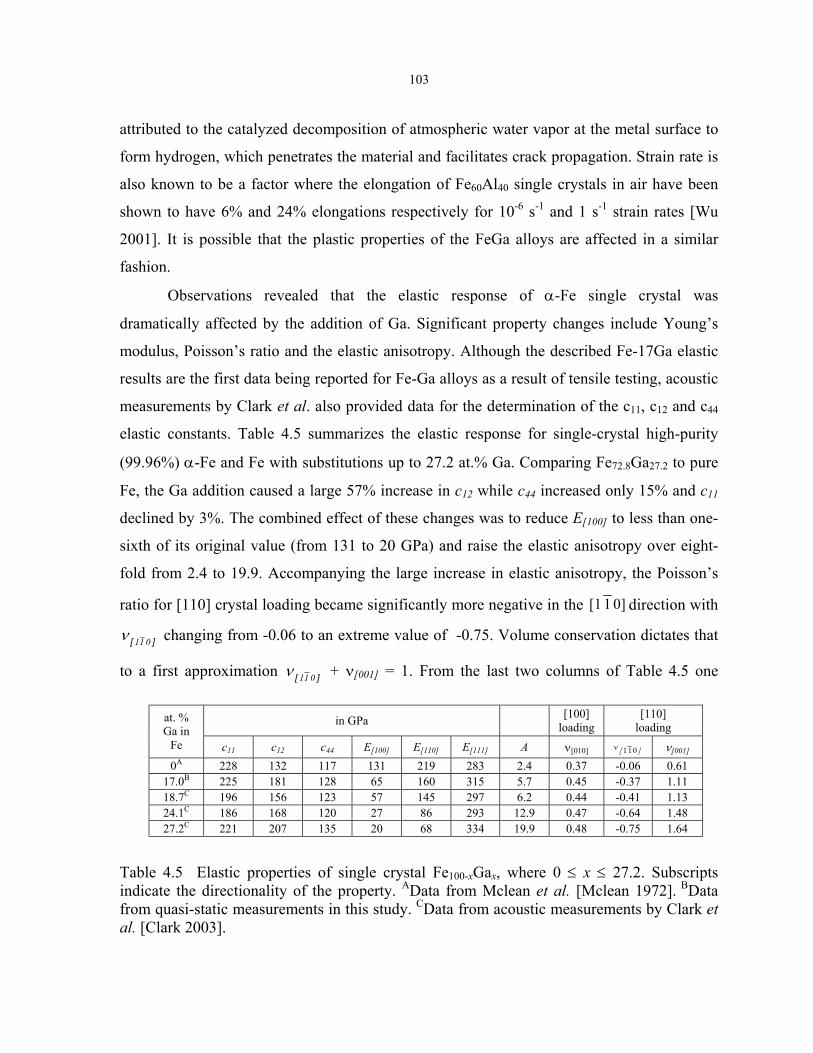
103
attributed to the catalyzed decomposition of atmospheric water vapor at the metal surface to
form hydrogen, which penetrates the material and facilitates crack propagation. Strain rate is
also known to be a factor where the elongation of Fe60Al40 single crystals in air have been
shown to have 6% and 24% elongations respectively for 10-6 s-1 and 1 s-1 strain rates [Wu
2001]. It is possible that the plastic properties of the FeGa alloys are affected in a similar
fashion.
Observations revealed that the elastic response of α-Fe single crystal was
dramatically affected by the addition of Ga. Significant property changes include Young’s
modulus, Poisson’s ratio and the elastic anisotropy. Although the described Fe-17Ga elastic
results are the first data being reported for Fe-Ga alloys as a result of tensile testing, acoustic
measurements by Clark et al. also provided data for the determination of the c11, c12 and c44
elastic constants. Table 4.5 summarizes the elastic response for single-crystal high-purity
(99.96%) α-Fe and Fe with substitutions up to 27.2 at.% Ga. Comparing Fe72.8Ga27.2 to pure
Fe, the Ga addition caused a large 57% increase in c12 while c44 increased only 15% and c11
declined by 3%. The combined effect of these changes was to reduce E[100] to less than one-
sixth of its original value (from 131 to 20 GPa) and raise the elastic anisotropy over eight-
fold from 2.4 to 19.9. Accompanying the large increase in elastic anisotropy, the Poisson’s
ratio for [110] crystal loading became significantly more negative in the 0]1[1 direction with
][ 011ν changing from -0.06 to an extreme value of -0.75. Volume conservation dictates that
to a first approximation ][ 011ν + ν[001] = 1. From the last two columns of Table 4.5 one
Table indicatfrom qal. [Cl
in GPa [100] loading
[110] loading
at. % Ga in
Fe c11 c12 c44 E[100] E[110] E[111] A ν[010] ][ 011ν ν[001] 0A 228 132 117 131 219 283 2.4 0.37 -0.06 0.61
17.0B 225 181 128 65 160 315 5.7 0.45 -0.37 1.11 18.7C 196 156 123 57 145 297 6.2 0.44 -0.41 1.13 24.1C 186 168 120 27 86 293 12.9 0.47 -0.64 1.48 27.2C 221 207 135 20 68 334 19.9 0.48 -0.75 1.64
4.5 Elastic properties of single crystal Fe100-xGax, where 0 ≤ x ≤ 27.2. Subscripts e the directionality of the property. AData from Mclean et al. [Mclean 1972]. BData uasi-static measurements in this study. CData from acoustic measurements by Clark et ark 2003].
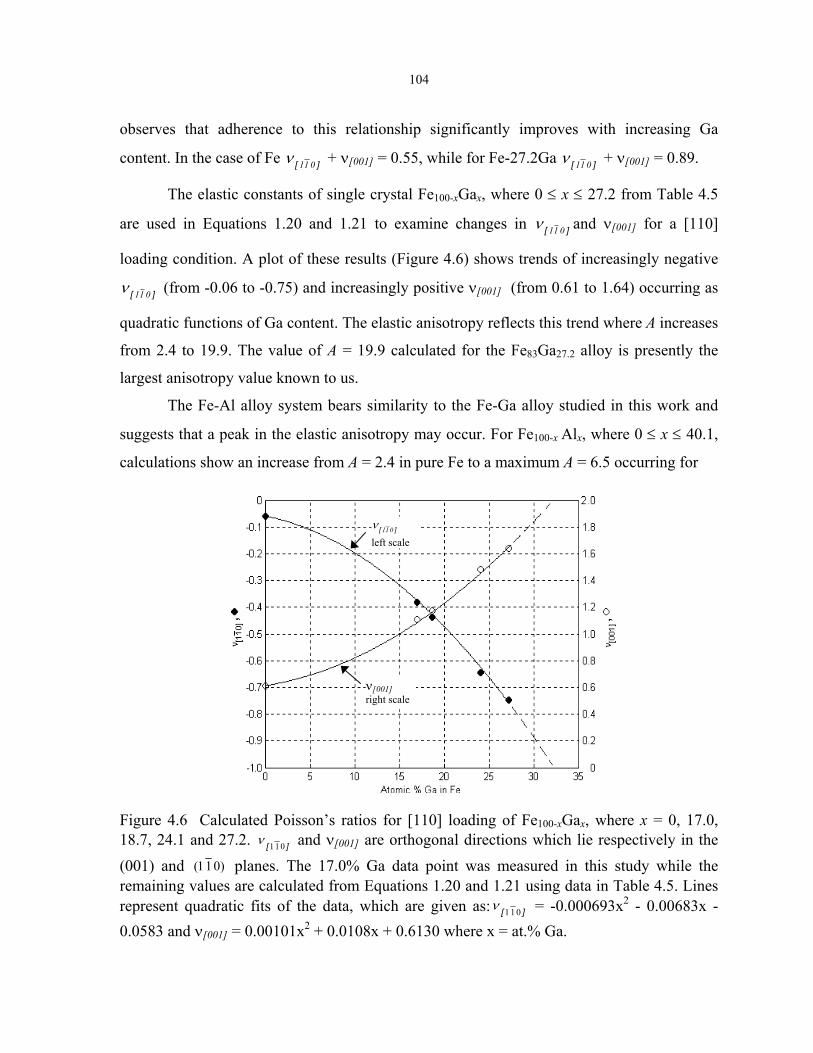
104
observes that adherence to this relationship significantly improves with increasing Ga
content. In the case of Fe ][ 011ν + ν[001] = 0.55, while for Fe-27.2Ga ][ 011ν + ν[001] = 0.89.
The elastic constants of single crystal Fe100-xGax, where 0 ≤ x ≤ 27.2 from Table 4.5
are used in Equations 1.20 and 1.21 to examine changes in ][ 011ν and ν[001] for a [110]
loading condition. A plot of these results (Figure 4.6) shows trends of increasingly negative
][ 011ν (from -0.06 to -0.75) and increasingly positive ν[001] (from 0.61 to 1.64) occurring as
quadratic functions of Ga content. The elastic anisotropy reflects this trend where A increases
from 2.4 to 19.9. The value of A = 19.9 calculated for the Fe83Ga27.2 alloy is presently the
largest anisotropy value known to us.
The Fe-Al alloy system bears similarity to the Fe-Ga alloy studied in this work and
suggests that a peak in the elastic anisotropy may occur. For Fe100-x Alx, where 0 ≤ x ≤ 40.1,
calculations show an increase from A = 2.4 in pure Fe to a maximum A = 6.5 occurring for
][ 011ν
left scale
ν[001] right scale
Figure 4.6 Calculated Poisson’s ratios for [110] loading of Fe100-xGax, where x = 0, 17.0, 18.7, 24.1 and 27.2. ][ 011ν and ν[001] are orthogonal directions which lie respectively in the (001) and )011( planes. The 17.0% Ga data point was measured in this study while the remaining values are calculated from Equations 1.20 and 1.21 using data in Table 4.5. Lines represent quadratic fits of the data, which are given as: ][ 011ν = -0.000693x2 - 0.00683x - 0.0583 and ν[001] = 0.00101x2 + 0.0108x + 0.6130 where x = at.% Ga.
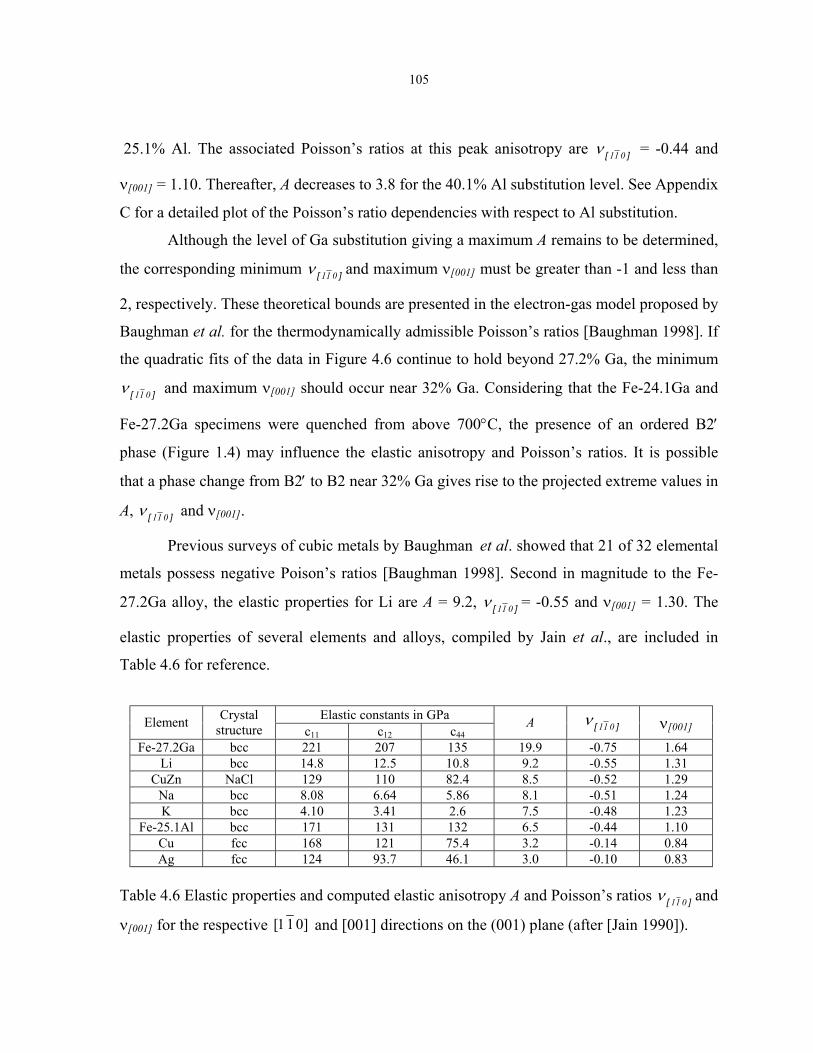
105
25.1% Al. The associated Poisson’s ratios at this peak anisotropy are ][ 011ν = -0.44 and
ν[001] = 1.10. Thereafter, A decreases to 3.8 for the 40.1% Al substitution level. See Appendix
C for a detailed plot of the Poisson’s ratio dependencies with respect to Al substitution.
Although the level of Ga substitution giving a maximum A remains to be determined,
the corresponding minimum ][ 011ν and maximum ν[001] must be greater than -1 and less than
2, respectively. These theoretical bounds are presented in the electron-gas model proposed by
Baughman et al. for the thermodynamically admissible Poisson’s ratios [Baughman 1998]. If
the quadratic fits of the data in Figure 4.6 continue to hold beyond 27.2% Ga, the minimum
][ 011ν and maximum ν[001] should occur near 32% Ga. Considering that the Fe-24.1Ga and
Fe-27.2Ga specimens were quenched from above 700°C, the presence of an ordered B2′
phase (Figure 1.4) may influence the elastic anisotropy and Poisson’s ratios. It is possible
that a phase change from B2′ to B2 near 32% Ga gives rise to the projected extreme values in
A, ][ 011ν and ν[001].
Previous surveys of cubic metals by Baughman et al. showed that 21 of 32 elemental
metals possess negative Poison’s ratios [Baughman 1998]. Second in magnitude to the Fe-
27.2Ga alloy, the elastic properties for Li are A = 9.2, ][ 011ν = -0.55 and ν[001] = 1.30. The
elastic properties of several elements and alloys, compiled by Jain et al., are included in
Table 4.6 for reference.
Ta
ν[0
Elastic constants in GPa Element Crystal structure c11 c12 c44
A ][ 011ν ν[001]
Fe-27.2Ga bcc 221 207 135 19.9 -0.75 1.64 Li bcc 14.8 12.5 10.8 9.2 -0.55 1.31
CuZn NaCl 129 110 82.4 8.5 -0.52 1.29 Na bcc 8.08 6.64 5.86 8.1 -0.51 1.24 K bcc 4.10 3.41 2.6 7.5 -0.48 1.23
Fe-25.1Al bcc 171 131 132 6.5 -0.44 1.10 Cu fcc 168 121 75.4 3.2 -0.14 0.84 Ag fcc 124 93.7 46.1 3.0 -0.10 0.83
ble 4.6 Elastic properties and computed elastic anisotropy A and Poisson’s ratios ][ 011ν and
01] for the respective ]011[ and [001] directions on the (001) plane (after [Jain 1990]).
106
4.3 Tension testing of Fe-17Ga cold-rolled polycrystal
The tensile properties of a cold rolled polycrystalline Fe83Ga17 specimen (see sample
R6 produced using the methods of section 2.3.2.3) were measured to ascertain its elastic and
plastic properties. Considering the specimen’s cold working history and combination of
dispersed 001<110> and 111<211> texture components (Figure 2.19), its properties are
expected to deviate from those of either the [100] and [110] single crystal specimens
measured in Section 4.1 and 4.2. The evaluation of this rolled material’s Young’s modulus,
Poisson’s ratio, yield strength and percent elongation will provide a new point of reference
for the design of magnetically active structural components.
The rolled tensile specimen was extracted from the R6 sample parent material using
EDM, where the longitudinal axis (tensile loading direction) was oriented parallel to the
specimen’s rolling direction. The same dimensions were used as for the single crystal
specimens to give the “dog bone” shape of Figure 4.1, however the thickness was 0.16 mm.
To minimize surface defects and hence stress concentrations, the specimen’s major faces and
edges were polished with wetted 600-grit silicon carbide paper. The same strain gage
configuration and tensile testing parameters were used as in the case of the single-crystal
tests described in section 4.1.2.
The stress-strain plot (Figure 4.7) shows that both the transverse and longitudinal
curves exhibited an elastic response to 650 MPa to be followed by plastic behavior up to a
maximum stress of 840 MPa. The tension test was terminated at a 1.5% longitudinal strain
when specimen failure occurred in a non strain-gaged region. The initial portion of the
longitudinal response demonstrated some non-linearity through 100 MPa (or 36 N for this
cross sectional area) possibly due to residual bending stresses induced in this thin sample
during strain gage installation. The longitudinal response also demonstrated a proportional
limit of 0.4% strain at 600 MPa and a 0.2% yield stress of 790 MPa. An analysis of the linear
stress-strain regime, over the 300 to 500 MPa range, gave a Young’s modulus in the rolling
direction of ERD = 154 GPa and Poisson’ ratio ν = 0.25. Although ERD is comparable to the
single crystal value of E[110] = 160 GPa (see Table 4.5 for Fe-17Ga), the positive ν suggests
that a <110> fiber texture dominates any 001<110> sheet texture content. If the
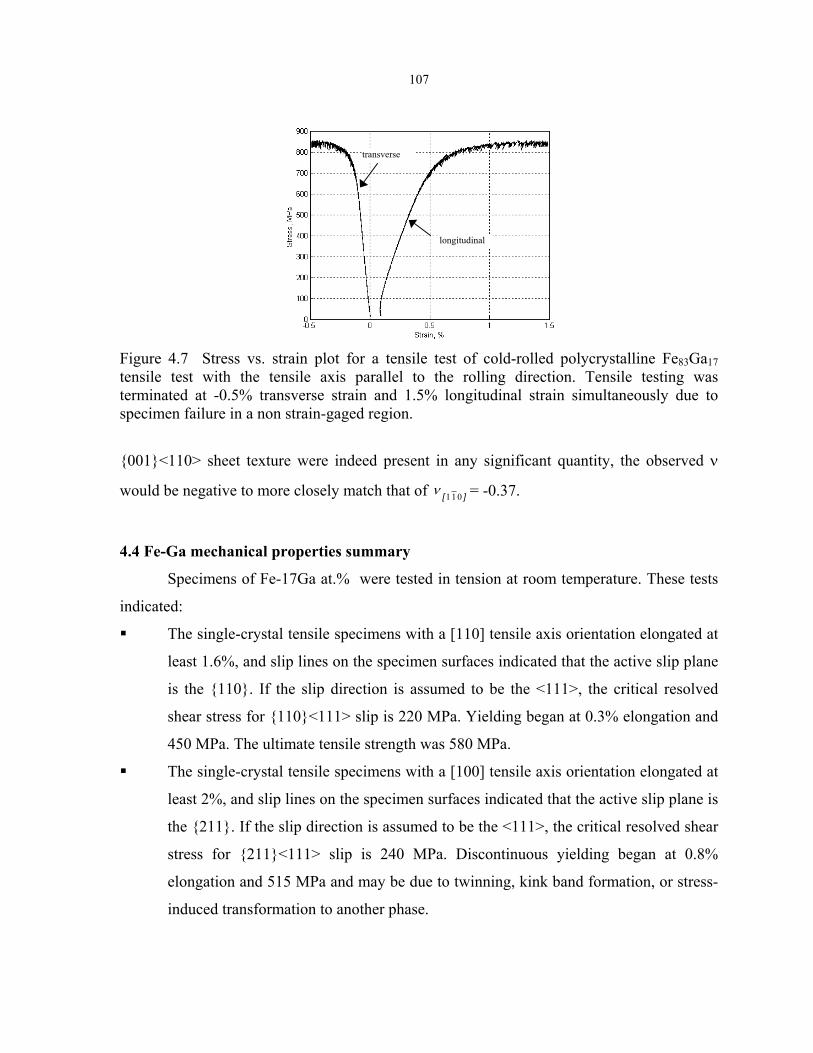
107
transverse
longitudinal
Figure 4.7 Stress vs. strain plot for a tensile test of cold-rolled polycrystalline Fe83Ga17 tensile test with the tensile axis parallel to the rolling direction. Tensile testing was terminated at -0.5% transverse strain and 1.5% longitudinal strain simultaneously due to specimen failure in a non strain-gaged region.
001<110> sheet texture were indeed present in any significant quantity, the observed ν
would be negative to more closely match that of ][ 011ν = -0.37.
4.4 Fe-Ga mechanical properties summary
Specimens of Fe-17Ga at.% were tested in tension at room temperature. These tests
indicated:
The single-crystal tensile specimens with a [110] tensile axis orientation elongated at
least 1.6%, and slip lines on the specimen surfaces indicated that the active slip plane
is the 110. If the slip direction is assumed to be the <111>, the critical resolved
shear stress for 110<111> slip is 220 MPa. Yielding began at 0.3% elongation and
450 MPa. The ultimate tensile strength was 580 MPa.
The single-crystal tensile specimens with a [100] tensile axis orientation elongated at
least 2%, and slip lines on the specimen surfaces indicated that the active slip plane is
the 211. If the slip direction is assumed to be the <111>, the critical resolved shear
stress for 211<111> slip is 240 MPa. Discontinuous yielding began at 0.8%
elongation and 515 MPa and may be due to twinning, kink band formation, or stress-
induced transformation to another phase.

108
The single-crystal Young’s modulus was 160 GPa for loading in the [110] crystal
direction with Poisson’s ratio of -0.37 on the (001) major face.
The single-crystal Young’s modulus was 65 GPa for loading in the [100] crystal
direction with Poisson’s ratio of 0.45 on the (001) major face.
The corresponding elastic constants are c11 = 225 ± 20 GPa, c12 = 181 ± 20 GPa and
c44 = 128 ± 2 GPa with an elastic anisotropy of 5.7.
Analysis of other Fe-Ga single crystal and polycrystalline alloys revealed that:
An Elastic anisotropy value of 19.9 was identified for single crystal Fe72.8Ga27.2
leading to a calculated in-plane negative Poisson’s ratio of -0.75.
Both Poisson’s ratios ][ 011ν and ν[001] are highly-correlated quadratically to the
substitution levels of Ga and Al in the Fe-Ga and Fe-Al alloy systems.
The cold rolled Fe-17Ga at.% polycrystalline specimen underwent an elongation of at
least 1.5% before failure. Yielding began at 0.4% elongation and 600 MPa while the
ultimate tensile strength was 840 MPa. The Young’s modulus was 154 GPa for
loading in the rolling direction with a corresponding Poisson’s ratio of 0.25.
These results identifying the active slip systems and shear stresses provide insight to
the possible development of texture or preferred crystallographic orientation in
polycrystalline forms of Fe-Ga alloys. The common slip mechanisms recognized for the Fe-
Ga, Fe-Si and Fe-Al alloy systems suggest that successful texturing methods used for Fe-Si
and Fe-Al might be mimicked to optimize polycrystalline Fe-Ga texture for magnetostriction
and structural applications. Environmental embrittlement and strain-rate dependencies have
been observed in Fe-Al and could also be a significant factor for the Fe-Ga alloys. These
effects warrant investigation as they affect the strength and formability of the material. The
elastic properties of the Fe-Ga alloy were observed to be increasingly anisotropic with rising
Ga content for the stoichiometries examined (0 to 27.2 at.%). The large elastic anisotropies
generate a remarkably large-magnitude negative Poisson’s ratio. This negative Poisson’s
ratio creates a significant in-plane auxetic behavior that could be exploited in applications
that capitalize on unique area effects produced under uniaxial loading.
109
5. MODELING SATURATION MAGNETOSTRCTION IN POLYCRSTALS
Successfully merging Fe-Ga alloy’s optimal single-crystal magnetostrictive
performance with desirable polycrystalline mechanical characteristics will depend on our
knowledge of the material’s combined magnetic and micromechanical behavior. It is
hypothesized that the influences of microstructural features play a significant role affecting
the overall material response provided the material properties are sufficiently anisotropic. To
gain an understanding of how saturation magnetostriction and the elastic response of
polycrystalline Fe-Ga alloys depend on crystallographic texture and grain morphology, this
work utilizes a Magnetostrictive Micromechanics Finite–Element Model (MMFEM) that was
developed and used to examine the stress and strain changes within the material due to
changes in magnetization. The ultimate objective in developing this model is to determine
whether, for a given texture distribution, misalignments between the grains’ crystallographic
orientations result in significant internal stresses that impede the desired bulk
magnetostrictive response.
This chapter first reviews existing analytic methods for estimating the
magnetostrictive response of a limited class of polycrystals (Section 5.1) and motivates the
development of the MMFEM approach. An explanation of the model is presented (Section
5.2) along with its validation through comparison to experimental results for a large-grained
rolled specimen (Section 5.3). Next, the methodology for simulating an equiaxed grain
structure and assigning a crystallographic orientation distribution is presented (Section 5.4).
Various crystallographic textures are then simulated and compared to experimental saturation
magnetostriction results (Section 5.5) for several of the specimens whose method of
manufacture was described in Chapter 2. The specimens examined include those derived
from material textured by extrusion and cold rolling as well as the non-aligned sintered
powder. A texture sensitivity analysis next reveals just how precise a texture distribution
must be to achieve stated magnetostriction objectives. The chapter concludes with a
summary of the MMFEM results.
110
5.1 Modeling approaches
Several modeling approaches have been used in the past to estimate the saturation
magnetostriction λs, arising from an ideal demagnetized state, for polycrystalline materials
composed of randomly oriented grains. As given in Equation 5.1, in each of these models λs
is represented as a linear combination of the cubic magnetostriction constants and the
variable α, which depends on assumptions made regarding grain interactions.
λ ( ) 111100 1 λα−+αλ=s (
The simplest modeling approach assumes a condition of constant stress throughout
polycrystalline aggregate and yields the Akulov approximation where α = 2/5. T
analytical result assumes no grain interaction and is equivalent to an ave
magnetostriction that is derived from the volume integration of the satura
magnetostriction relationship of Equation 1.4 [Cullity 1972]. Although the simplicity of
model is attractive, it is generally in poor agreement with experimental results for Fe and
among other materials [Callen 1965]. In other work, a modeling approach was develo
utilizing the other extreme of mechanical constraints, i.e. constant strain condit
throughout the polycrystalline aggregate (similar to the Voigt approximations). In this ca
= 2/(2+3A) where A = 2c44/(c11-c12). The material constant A is equivalent to the ela
anisotropy parameter previously given in Equation 1.22. The results of this method w
asserted by Callen et al. to be in better agreement with the experimental results, howev
more realistic representation was still desired. As neither the assumption of constant stres
constant strain is physically reasonable, an intermediate method was developed
Vladimirsky. In this approach the local stress for each grain approximates that of a spher
crystal surrounded by a homogeneous and isotropic material that is representative of
properties of the polycrystalline aggregate as a whole. An empirical fit of Vladimirs
result by Callen et al. gives the result of α = [(2/5) - (ln A)/8], where A is again the ela
anisotropy. Results of the Vladimirsky approximation are regarded as a better match to
saturation magnetostriction observed in Fe and other cubic alloys [Callen 1965].
5.1)
the
his
rage
tion
this
Ni
ped
ions
se α
stic
ere
er a
s or
by
ical
the
ky’s
stic
the

111
A comparison of the saturation magnetostriction estimates using the Akulov,
Vladimirsky and Voigt approximations are given in Table 5.1 for polycrystalline Fe83Ga17,
Fe80Ga20 and Fe72.8Ga27.2 alloys having random texture distributions. The single crystal
magnetostriction constants and elastic anisotropy for each stoichiometry are also given for
reference. The material properties were gathered from Figure 2.4 and Table 4.5 using
interpolation as needed. The variability in the results for the different approximation methods
illustrates the sensitivity to the underlying assumptions for stress and strain. Recalling the
Fe80Ga20 powder metallurgy outcome (Section 2.3.3) with λ||-⊥ ranging from 60 x10-6 to 76
x10-6, the Vladimirsky approximation with (3/2)λs = (3/2)⋅(43) x10-6 = 65 x10-6 appears most
reasonable. Somewhat of a surprise, from the Vladimirsky approximation the furnace cooled
Fe80Ga20 alloy is projected to have twice as large a λs value compared to the Fe83Ga17
polycrystal despite a 15% smaller λ100 constant. This assumed gain in magnetostriction is due
to the large increase in the λ111 constant, which more than compensates for the adverse effect
of increasing elastic anisotropy.
Furnacecooled
Fe83Ga17
Fe80Ga20
Fe72.8Ga27
Table 5.1 ComparisonGa alloys having randomeasured in furnace cvaried stress (Vladimpolycrystalline aggrega
Modeling appro
constants, and in partic
stress assumptions, app
textured polycrystalline
versatility to address m
oriented polycrystallin
Material Properties Random Polycrystal, λs x10-6
λ100 x10-6
λ111 x10-6 A
Akulov (constant
stress)
Vladi-mirsky
Voigt (constant
strain) 200 -16 5.8 70 23 6
170 19 7.0 79 43 21
.2 267 40 19.9 131 46 47
s of approximated saturation magnetostriction for polycrystalline Fe-m crystallographic texture. Estimates are based on material properties ooled single crystals and assumptions of constant stress (Akulov), irsky) or constant strain (Voigt) conditions throughout the
te.
aches utilizing the linear combination of the cubic magnetostriction
ular the Vladimirsky approximation with its more realistic underlying
ear helpful in estimating the magnetostriction capability of randomly
Fe-Ga alloys. However, a modeling method is needed which has the
aterials with crystallographic textures other than those of randomly
e aggregates. Successful development of Fe-Ga alloys requires the
112
flexibility to explore the effect of various texture distributions that can arise with different
material processing methods, since distributions are strongly influenced by material
properties including magnetostriction constants and elastic anisotropy. The MMFEM
approach provides this flexibility through inputs that specify grain morphology,
crystallographic orientation and material properties. The equilibrium stress and strain state
for each grain within the polycrystalline aggregate is computed to evaluate the material’s
bulk magnetostrictive strain response due to a change from a demagnetized state to one of
saturation magnetization. The MMFEM, its application and comparisons of its results to
experimental measurements are discussed throughout the remainder of this chapter.
5.2 Overview of the magnetostrictive micromechanics finite-element model
A magnetostrictive material’s total or “bulk” strain response εtot to mechanical loads
and saturating magnetic fields may be represented by the linear superposition of elastic
strains εelas and saturation magnetostriction λs in the relationship εtot = εelas + λs. This
superposition relationship is fundamental to the three-dimensional finite-element model used
in this work to model a polycrystal’s total strain response to changes in magnetization from
an ideal demagnetized state to one of full saturation in a specified direction. Although a
polycrystal may or may not be loaded by external mechanical forces, elastic strains can be
developed within each grain due to strains imposed from the anisotropic magnetostriction of
neighboring grains having different crystallographic orientations. Aside from forces
generated by the product of magnetostriction-induced strain and material stiffness, body
forces arising from the existence of internal and external magnetic field gradients are
considered to be negligible. The MMFEM formulation is non-dimensional and does not take
into account absolute grain size. This is appropriate considering that only small-elastic strains
are induced by magnetostriction in the material.
The MMFEM uses constant-strain four-node tetrahedrons to subdivide the material
volume, where multiple tetrahedrons compose each grain and are assigned rotationally
transformed magnetostrictive and elastic proprieties based on the grain orientation within a
global reference frame. Equations 1.4 and 1.12 respectively define the cubic single-crystal
anisotropic magnetostrictive and elastic relationships used throughout the model. Tensor

113
equivalents of these relationships are employed for rotational transformations between local
and global coordinate systems. Throughout the polycrystalline aggregate, continuity of
displacement is enforced at nodal points comprising the vertexes of adjacent tetrahedral
elements. The MMFEM simulates the magnetostrictive strain λs by introducing appropriate
nodal loading conditions for each element according to the grain’s crystallographic
orientation and the overall direction of saturation magnetization. Boundary conditions are
enforced using the penalty method in which boundary terms of the stiffness matrix and terms
of the force vector (related to the degree of freedom being constrained) are modified by a
fourfold increase in their order of magnitude. (This scaling factor or larger is commonly used
in finite-element methods [Chandrupatla 1991].) Accounting for the elastic response of
adjoining grains, the overall system is then solved for the lowest energy state using an
isoparametric formulation accommodating the Rayleigh-Ritz potential energy method. This
gives the equilibrium nodal displacement condition for the system of elements. The
elemental displacements are then converted to elemental strains. Finally, elemental stresses
are calculated using the net strain (total minus the initial magnetostrictive strains) and
elemental stiffness coefficients. The overall strain of the bulk material εtot may be found by
noting changes in nodal displacements at the boundaries of interest. Introductory texts
provide additional details on the finite-element modeling method [Chandrupatla 1991].
5.3 Model validation using through-thickness grains
To validate the MMFEM and gain a sense of the grain interaction developed in a
polycrystalline magnetostrictive sample, the simulated and experimentally measured total-
strain responses were compared for a disk specimen subjected to directionally applied
magnetic fields. The specimen under study, labeled R3, was made from Fe83Ga17 rolled
material that was subjected to a high-temperature final anneal. Production details for the
specimen were described in section 2.3.2.3. Reviewing its manufacture, the rolled sheet was
produced by a 96% hot and warm rolling reduction of an as-cast ingot. The disk specimen,
7.9 mm in diameter, was punched from the rolled material having a final thickness of 0.38
mm. A subsequent anneal of the disk for 5 h at 1100 oC in Ar induced secondary
recrystallization and produced through-thickness grains with diameters up to ∼400 µm.
114
To provide a basis for the MMFEM simulation, orientation imaging microscopy
(OIM) was used to map each grain and its crystallographic orientation over a rectangular
region encompassing the central portion of the disk. Figure 5.1 shows the rolling direction
(RD) and the mapped region relative to a portion of the disk boundary. The dotted-square
boundary outlines the strain-gage location used for actual and simulated strain measurements.
The crystallographic misorientation of each grain, relative to a 001<100> sheet texture,
was recorded and plotted in Figure 5.2. The numbered data points correspond to grains of
Figure 5.1, which lie within the strain-gaged region. The grain orientation deviations
represented by the “x” correspond to the remainder of the mapped grains outlined by the
larger rectangular area of Figure 5.1. A lack of data points clustered near the origin of the
plot reflects the poor development of cube texture. Furthermore, the absence of data points in
upper left half portion of the plot indicates that only grains with large deviations from the
sheet normal had large deviations from the rolling direction. The cause of this peculiar
orientation distribution remains unknown. To model the specimen with the FEMM method, a
fitted mesh consisting of multiple 6-sided polyhedra subdivided the grain structure. These
polyhedra compose the volume of the sheet and appear as four-sided polygons at the sheet
surface. Each polyhedra is further subdivided into five tetrahedrons.
The actual and simulated strain states of the disk were analyzed for changes in the
direction of the saturation magnetization vector from transverse to parallel with that of the
rolling direction. To accomplish this analysis, the simulation was run separately for each
magnetization direction with the difference noted between the two rolling direction strain
results. (This approach is justified by assuming a common initial state of demagnetization.)
The FEMM simulation, using material properties for Fe83Ga17 listed in Table 5.1, indicated
that εtot, ||-⊥ = 177 ± 3 x10⁻⁶ relative to the rolling direction; this value falls between the
measurements of 160 x10-6 and 180 x10-6 collected in two separate strain-gage installations.
Note that the experimental results are sensitive to minor changes in gage location due to the
low number of grains covered and their wide range of crystallographic orientation. The
MMFEM was also used to simulate the RD components of stress and strain for a change
from a demagnetized state to one of saturation magnetization in the RD. Grains having small
angular deviations from the RD (such as 2, 4 and 9) exhibit the largest magnetostrictions with
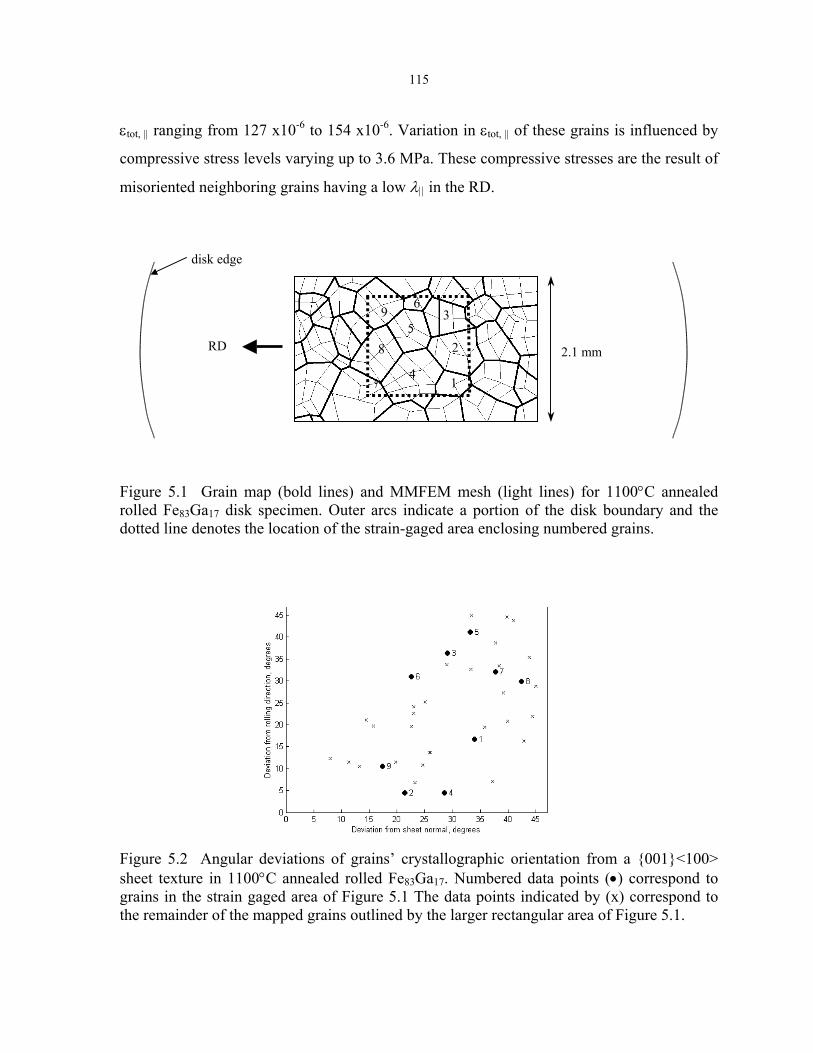
115
εtot, || ranging from 127 x10-6 to 154 x10-6. Variation in εtot, || of these grains is influenced by
compressive stress levels varying up to 3.6 MPa. These compressive stresses are the result of
misoriented neighboring grains having a low λ|| in the RD.
disk edge
RD 2.1 mm
9
7
6
8 5
4
3
2
1
Figure 5.1 Grain map (bold lines) and MMFEM mesh (light lines) for 1100°C annealed rolled Fe83Ga17 disk specimen. Outer arcs indicate a portion of the disk boundary and the dotted line denotes the location of the strain-gaged area enclosing numbered grains.
Figure 5.2 Angular deviations of grains’ crystallographic orientation from a 001<100> sheet texture in 1100°C annealed rolled Fe83Ga17. Numbered data points (•) correspond to grains in the strain gaged area of Figure 5.1 The data points indicated by (x) correspond to the remainder of the mapped grains outlined by the larger rectangular area of Figure 5.1.
116
5.4 Representation of an equiaxed grain structure
To carry out MMFEM simulations that explore the effects of crystallographic texture
on magnetostriction, a suitable imitation of a polycrystalline metallic grain structure was
needed. Once a grain structure is established, the crystallographic orientation of the grains
may be assigned using Monte-Carlo techniques to generate random or specific textures
having a Gaussian distribution.
5.4.1 Filling space
Observations of metallic microstructures show that they are composed of a network
of convex polyhedral cells having planar faces, where the number of faces per polyhedral cell
characterizes these grain structures. Typical polycrystalline metals (including the BCC
metals) exhibit a distribution of 4 to 36 faces with an average of 14 to 15 faces [Smith 1952,
Rhines 1974]. Space filling methods such as the three-dimensional Poisson-Voronoi
tesselation scheme (i.e. arraying polyhedra in space) have been devised to simulate realistic
grain structures possessing a distribution in polyhedral face numbers using Monte-Carlo
techniques [Kumar 1992].
Although a grain modeling approach such as the Poisson-Voronoi tesselation scheme
would most accurately represent an undeformed polycrystalline aggregate, a simpler
approach was used for this investigation. Unless a specific grain structure was being modeled
like the rolled and recrystallized specimen in the previous section, the MMFEM employed
equiaxed grains having a constant number of polyhedral faces. Simulating a volume of
equiaxed grains permitted this portion of research to focus on how a polycrystalline
material’s magnetostrictive capability is affected by crystallographic texture rather than grain
morphology. Simulating the equiaxed grains of the polycrystalline aggregate, a three-
dimensional tesselation of rhombic dodecahedrons was employed. The rhombic
dodecahedron has 12 faces, which is near the mean of 14-15 faces determined by Smith, and
meets the space-filling requirements without voids. The alternative of tessellating simple
cubes was considered and then discarded, as it would provide an inferior representation of
real grain morphology. It was also anticipated that cubes would exhibit excessive stress
concentrations near the vertexes, with all edges meeting at 90°, compared to the larger angles
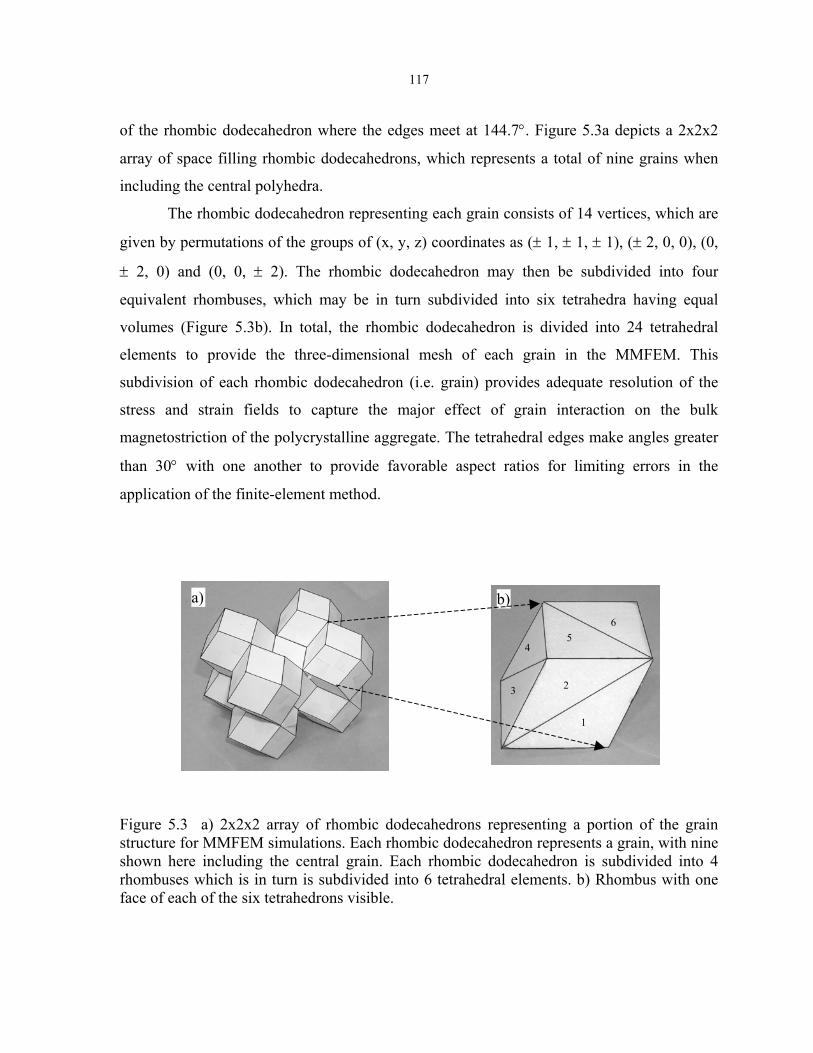
117
of the rhombic dodecahedron where the edges meet at 144.7°. Figure 5.3a depicts a 2x2x2
array of space filling rhombic dodecahedrons, which represents a total of nine grains when
including the central polyhedra.
The rhombic dodecahedron representing each grain consists of 14 vertices, which are
given by permutations of the groups of (x, y, z) coordinates as (± 1, ± 1, ± 1), (± 2, 0, 0), (0,
± 2, 0) and (0, 0, ± 2). The rhombic dodecahedron may then be subdivided into four
equivalent rhombuses, which may be in turn subdivided into six tetrahedra having equal
volumes (Figure 5.3b). In total, the rhombic dodecahedron is divided into 24 tetrahedral
elements to provide the three-dimensional mesh of each grain in the MMFEM. This
subdivision of each rhombic dodecahedron (i.e. grain) provides adequate resolution of the
stress and strain fields to capture the major effect of grain interaction on the bulk
magnetostriction of the polycrystalline aggregate. The tetrahedral edges make angles greater
than 30° with one another to provide favorable aspect ratios for limiting errors in the
application of the finite-element method.
6 5
4
3 2
1
b) a)
Figure 5.3 a) 2x2x2 array of rhombic dodecahedrons representing a portion of the grain structure for MMFEM simulations. Each rhombic dodecahedron represents a grain, with nine shown here including the central grain. Each rhombic dodecahedron is subdivided into 4 rhombuses which is in turn is subdivided into 6 tetrahedral elements. b) Rhombus with one face of each of the six tetrahedrons visible.

118
5.4.2 Assigning grain orientations
To prepare the MMFEM for a simulation run, the crystallographic texture of the
polycrystalline aggregate was first defined. This involved assigning each grain its
crystallographic orientation relative to the global coordinate system. The texture distributions
of interest may be divided into two categories. The first is a random distribution, where
grains have no preferred orientation. The random distribution is useful for simulating the
texture of cast material containing equiaxed grains and for non-aligned powder Fe-Ga alloys.
The second is a Gaussian distribution about a defined sheet texture. Crystallographic studies
of polycrystalline metals have concluded that the Gaussian distribution provides a good
representation of their textures [Barrett 1952]. This approach will find use for simulating
deformation processed and aligned powder Fe-Ga alloys. The methods used to implement the
random and Gaussian distributions are discussed next.
5.4.2.1 Random texture distribution
A random distribution of crystallographic orientations throughout the simulated
polycrystalline material was achieved by defining three angular deviations, including yaw,
pitch and roll for each grain. Angular deviations were limited to a range between +45° and
-45° due to symmetry. Starting with a grain’s local coordinate system (1, 2, 3) aligned with
the global coordinate system (x, y, z), rotations were induced by sequential application of
specific angular deviations. First, the yaw generated a rotation about the “3” axis. Next, the
pitch angle generated a rotation about the newly oriented “2” axis. And finally, the roll angle
generated a rotation about the newly oriented “1” axis. Figure 5.4 depicts the crystallographic
orientation after the rotations have been applied. Pitch and roll are defined by the respective
1-axis and 2-axes angles relative to the x-y plane, while the yaw relates the 1-axis angle
relative to the x-z plane.
Special consideration was needed in determining the yaw and pitch angles to avoid a
skewed distribution of the 1-axis location over a solid angle. For example, equating the yaw
and pitch angles to random choices of longitude and latitude, for a polar coordinate system
projected on a sphere, results in a higher concentration of 1-axis locations at increasing
latitudes. (Recall the convergence of lines of longitude near the poles of a globe.) To ensure a
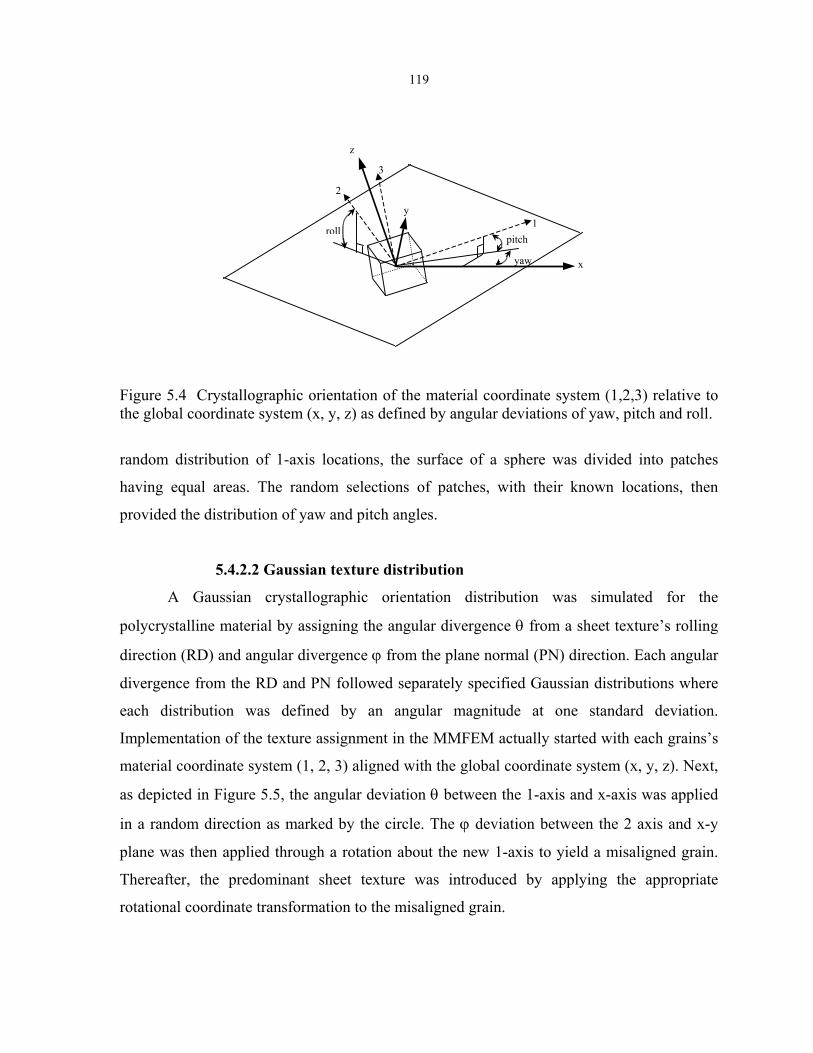
119
z
rollpitch
yaw
y
x
3
2
1
Figure 5.4 Crystallographic orientation of the material coordinate system (1,2,3) relative to the global coordinate system (x, y, z) as defined by angular deviations of yaw, pitch and roll.
random distribution of 1-axis locations, the surface of a sphere was divided into patches
having equal areas. The random selections of patches, with their known locations, then
provided the distribution of yaw and pitch angles.
5.4.2.2 Gaussian texture distribution
A Gaussian crystallographic orientation distribution was simulated for the
polycrystalline material by assigning the angular divergence θ from a sheet texture’s rolling
direction (RD) and angular divergence ϕ from the plane normal (PN) direction. Each angular
divergence from the RD and PN followed separately specified Gaussian distributions where
each distribution was defined by an angular magnitude at one standard deviation.
Implementation of the texture assignment in the MMFEM actually started with each grains’s
material coordinate system (1, 2, 3) aligned with the global coordinate system (x, y, z). Next,
as depicted in Figure 5.5, the angular deviation θ between the 1-axis and x-axis was applied
in a random direction as marked by the circle. The ϕ deviation between the 2 axis and x-y
plane was then applied through a rotation about the new 1-axis to yield a misaligned grain.
Thereafter, the predominant sheet texture was introduced by applying the appropriate
rotational coordinate transformation to the misaligned grain.
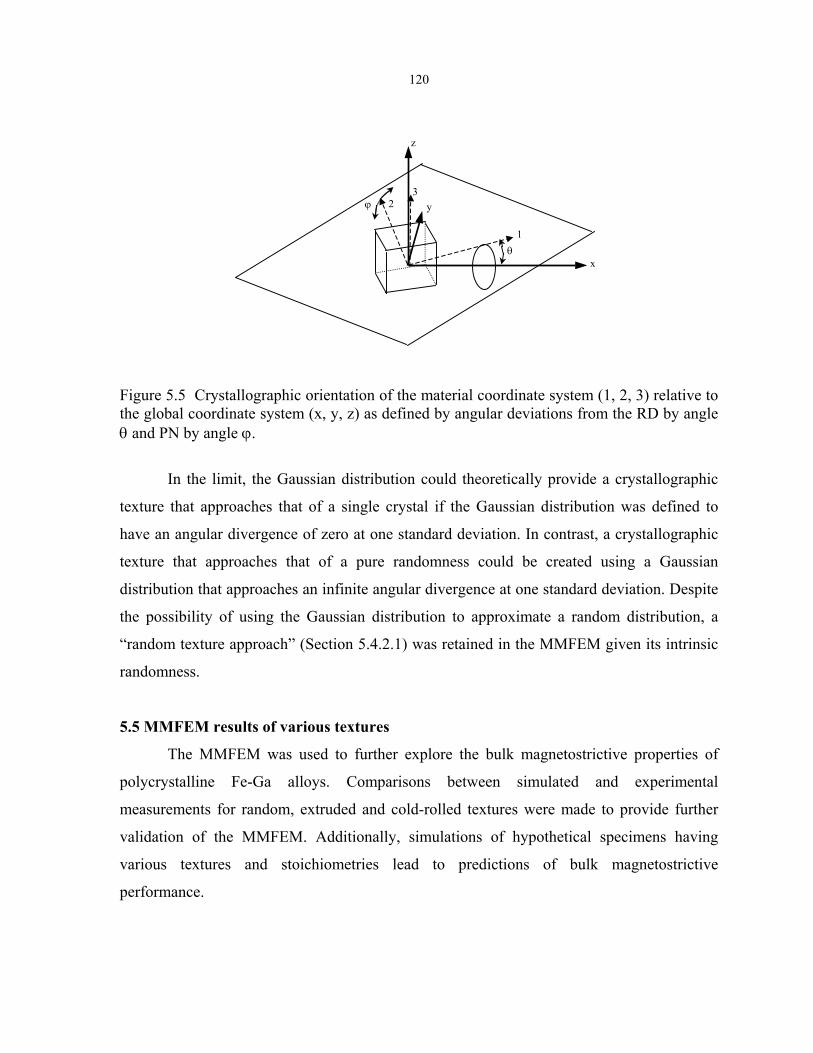
120
y ϕ
θ
z
x
3 2
1
Figure 5.5 Crystallographic orientation of the material coordinate system (1, 2, 3) relative to the global coordinate system (x, y, z) as defined by angular deviations from the RD by angle θ and PN by angle ϕ.
In the limit, the Gaussian distribution could theoretically provide a crystallographic
texture that approaches that of a single crystal if the Gaussian distribution was defined to
have an angular divergence of zero at one standard deviation. In contrast, a crystallographic
texture that approaches that of a pure randomness could be created using a Gaussian
distribution that approaches an infinite angular divergence at one standard deviation. Despite
the possibility of using the Gaussian distribution to approximate a random distribution, a
“random texture approach” (Section 5.4.2.1) was retained in the MMFEM given its intrinsic
randomness.
5.5 MMFEM results of various textures
The MMFEM was used to further explore the bulk magnetostrictive properties of
polycrystalline Fe-Ga alloys. Comparisons between simulated and experimental
measurements for random, extruded and cold-rolled textures were made to provide further
validation of the MMFEM. Additionally, simulations of hypothetical specimens having
various textures and stoichiometries lead to predictions of bulk magnetostrictive
performance.
121
5.5.1 Random texture
MMFEM simulations were carried out for randomly oriented polycrystalline
Fe83Ga17, Fe80Ga20 and Fe72.8Ga27.2 alloys for comparison with the Akulov and Vladimirsky
approximations in addition to experimental observations of sintered non-aligned Fe80Ga20
powder. Throughout all simulations, the grain structure was modeled using a 6x6x6 space-
filling array of non-dimensional rhombic dodecahedrons to give a total of 666 grains when
including off-raster interior grain sites. (Recall that the 2x2x2 array in Figure 5.3 contains 9
grains.) With 24 elements per grain, the total system included 15984 tetrahedral elements
demarcated by 3425 nodes. Monte-Carlo techniques provided a random crystallographic
distribution for use throughout multiple simulation runs as described previously in Section
5.4.2.1. Total strain calculations were based on 81 separate strain vectors distributed at one-
half grain diameter intervals throughout the interior cross section of the crystal array. To
accurately model the material’s bulk strain response for interacting grains, these interior
vectors lay at least one-grain diameter inside of the simulated material surface and joined
nodes to within one-grain diameter of the material’s opposing faces. These strain vectors
were oriented parallel to the applied magnetic field direction, which lies in the global x-
direction. Reported values in this direction are referred to by the “||” subscript.
Figure 5.5 summarizes the FEMM results for ten simulation runs for each of the three
alloys using the material properties listed in Table 5.2. The first column of the figure shows
histograms for tetrahedral elements with respect to the x-direction saturation
magnetostriction developed by non-interacting grains. The upper and lower magnetostriction
limits (i.e. λ100 and λ111) are dictated by material properties for each stoichiometry while
intermediate values arise due to deviations in crystallographic orientation from the <100> or
<111> directions. The collocated arrows, marking the simulation mean values and Akulov
approximations for magnetostriction, confirm that there is excellent agreement between this
aspect of the numerical simulation and the analytic method.
The second column of Figure 5.5 shows histograms of the internal x-vectors’ total
strain distribution, their mean values, the Vladimirsky approximation and for the Fe-20Ga
alloy, the range of experimental observations. In each case the mean strain value falls well
below that of the Akulov approximation (value indicated in the left hand column) yet higher

122
than that of the Vladimirsky approximation. This reveals that elastic grain interactions
significantly reduce the material’s bulk magnetostrictive capability, although not as adversely
as supposed by the Vladimirsky method. The experimental values of (2/3)(εtot,||-⊥) for the
sintered powder metal range from 40 to 51 x10-6, which is in good agreement with the
simulation mean result. Of the three stoichiometries examined, the Fe-27.2Ga alloy has the
largest bulk magnetostrictive capability with εtot,|| = 77 x10-6. Should this material be tested as
a disk under directionally applied fields or as a rod-shaped specimen under coaxial
compressive loads and fields, one would expect the maximum magnetostrictive strain output
of εtot,||-⊥ = (3/2) εtot,|| = 116 x10-6. Use of the (3/2) factor is appropriate given the isotropic
bulk magnetostriction developed in a random texture. Valid use of the (3/2) factor was
confirmed by additional simulation runs for εtot,||-⊥.
The final column of Figure 5.5 shows histograms for the element count with respect
to internal stress in the x-direction. On the whole, the compressive and tensile elemental
stresses balance one another to give a mean stress equal to zero. However, the shape and
magnitude of the stress distribution provide an indication of the level of grain interactions.
Considering the Fe-17Ga result with εtot,|| = 33 x10-6, the indicated 7.2 MPa stress level at one
standard deviation illustrates that two thirds of the grain elements are subjected to this or
lower magnitude stress conditions. It follows that at two standard deviations, 95% of the
grains experience less than 14.4 MPa magnitude stress levels. Comparing the Fe-20Ga case,
the lower stress magnitude of 4.3 MPa at one standard deviation facilitates a 55% larger bulk
magnetostrictive response of εtot,|| = 51 x10-6 despite the small 13% increase in λ||,s. The lower
stress levels may in part be attributed to the smaller difference between λ100 and λ111 of 151
x10-6 for Fe-20Ga compared to the difference of 216 x10-6 for Fe-17Ga. Consistent with this
trend, the Fe-27.2Ga alloy’s stress magnitude is again larger, as is the difference between
λ100 and λ111 which increases to 227 x10-6. (Values for λ100
and λ111 were taken from Figure
2.4.) Undoubtedly, elastic anisotropy also plays a role in the grain interaction and ultimately
the stress distributions. Although elastic anisotropy effects are automatically accounted for in
the MMFEM, their influence is not easily separated from those of the magnetostrictive
constants.

123
Counts vs
Magnetostriction
Counts vs
Stress
Counts vs
Total Strain
//,sλ
//,sλ
//,sλ
ε
llσ
llσ
llσ
ε
ε
Cou
nts,
int.
vect
ors
Cou
nts,
elem
ents
C
ount
s, el
emen
ts
Cou
nts,
elem
ents
Cou
nts,
int.
vect
ors A
A
A
exp.
V
V
V
tot, // = 77 x10-6
tot, // = 51x10-6
std. dev. = 6.9 MPa
std. dev. = 4.3 MPa
std. dev. = 7.2 MPa
tot , // = 33 x10-6
= 130 x10-6
Cou
nts,
int.
vect
ors
= 79 x10-6
= 70 x10-6
Fe -
27.2
Ga
Fe -
20G
a Fe
- 17
Ga
Cou
nts,
elem
ents
C
ount
s, el
emen
ts
Cou
nts,
elem
ents
Figure 5.5 MMFEM Monte-Carlo simulation of randomly oriented Fe-Ga polycrystal having different stoichiometries. Histogram of magnetostriction, total strain and stress in the applied field direction. Total strain corresponds to the bulk magnetostrictive response when accounting for misaligned grain interaction. The “A”, “V” and “exp.” annotations correspond respectively to the Akulov and Vladimirsky approximations (Table 5.1) and experimental results (Section 2.3.3). (Note that histograms for magnetostriction and stress are based on 15984 element responses while total strain reflects the response of 81 x-direction vectors.)
Fe8Fe8
Fe72
Stress, MPa Total strain, (x10-6) Magnetostriction, (x10-6)
Table 5.2 of furnace
Magnetostriction Constants x10-6 Elastic Constants, GPa
λ100 λ111 c11 c12 c44 3Ga17 200 -16 225 181 128 0Ga20 170 19 170 136 119 .8Ga27.2 267 40 196 156 120
Fe-Ga alloy material properties used in simulations. These properties reflect those cooled alloys.
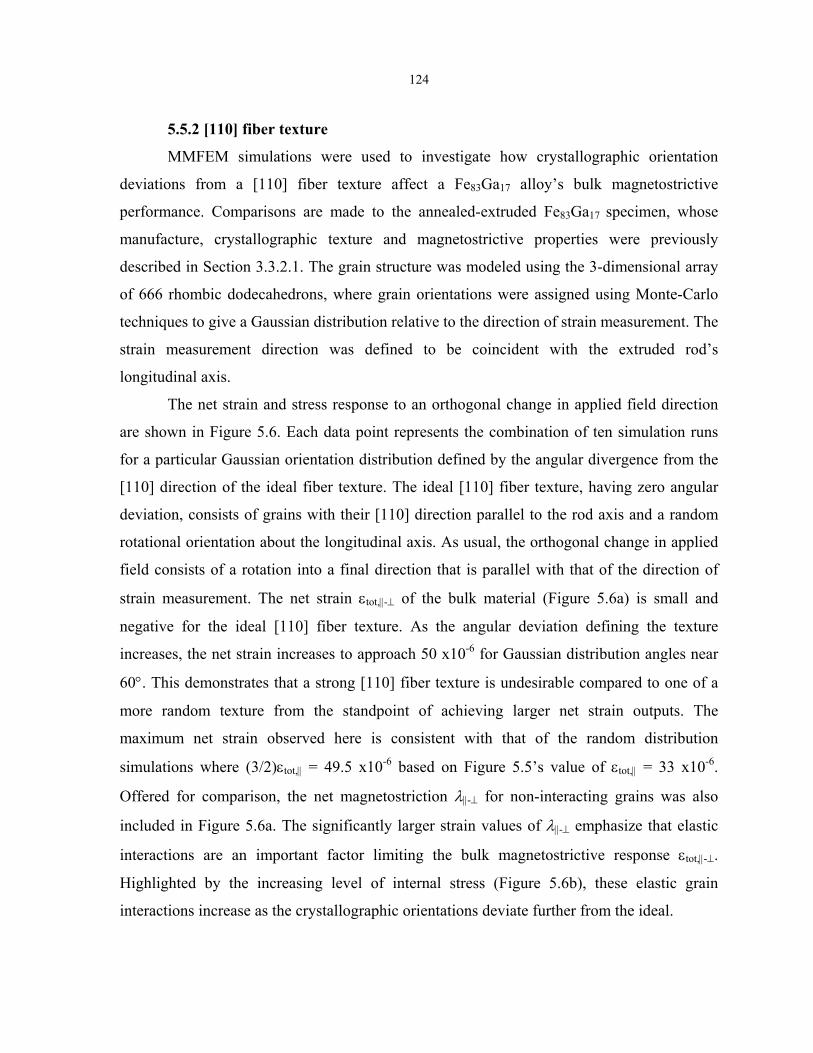
124
5.5.2 [110] fiber texture
MMFEM simulations were used to investigate how crystallographic orientation
deviations from a [110] fiber texture affect a Fe83Ga17 alloy’s bulk magnetostrictive
performance. Comparisons are made to the annealed-extruded Fe83Ga17 specimen, whose
manufacture, crystallographic texture and magnetostrictive properties were previously
described in Section 3.3.2.1. The grain structure was modeled using the 3-dimensional array
of 666 rhombic dodecahedrons, where grain orientations were assigned using Monte-Carlo
techniques to give a Gaussian distribution relative to the direction of strain measurement. The
strain measurement direction was defined to be coincident with the extruded rod’s
longitudinal axis.
The net strain and stress response to an orthogonal change in applied field direction
are shown in Figure 5.6. Each data point represents the combination of ten simulation runs
for a particular Gaussian orientation distribution defined by the angular divergence from the
[110] direction of the ideal fiber texture. The ideal [110] fiber texture, having zero angular
deviation, consists of grains with their [110] direction parallel to the rod axis and a random
rotational orientation about the longitudinal axis. As usual, the orthogonal change in applied
field consists of a rotation into a final direction that is parallel with that of the direction of
strain measurement. The net strain εtot,||-⊥ of the bulk material (Figure 5.6a) is small and
negative for the ideal [110] fiber texture. As the angular deviation defining the texture
increases, the net strain increases to approach 50 x10-6 for Gaussian distribution angles near
60°. This demonstrates that a strong [110] fiber texture is undesirable compared to one of a
more random texture from the standpoint of achieving larger net strain outputs. The
maximum net strain observed here is consistent with that of the random distribution
simulations where (3/2)εtot,|| = 49.5 x10⁻⁶ based on Figure 5.5’s value of εtot,|| = 33 x10-6.
Offered for comparison, the net magnetostriction λ||-⊥ for non-interacting grains was also
included in Figure 5.6a. The significantly larger strain values of λ||-⊥ emphasize that elastic
interactions are an important factor limiting the bulk magnetostrictive response εtot,||-⊥.
Highlighted by the increasing level of internal stress (Figure 5.6b), these elastic grain
interactions increase as the crystallographic orientations deviate further from the ideal.
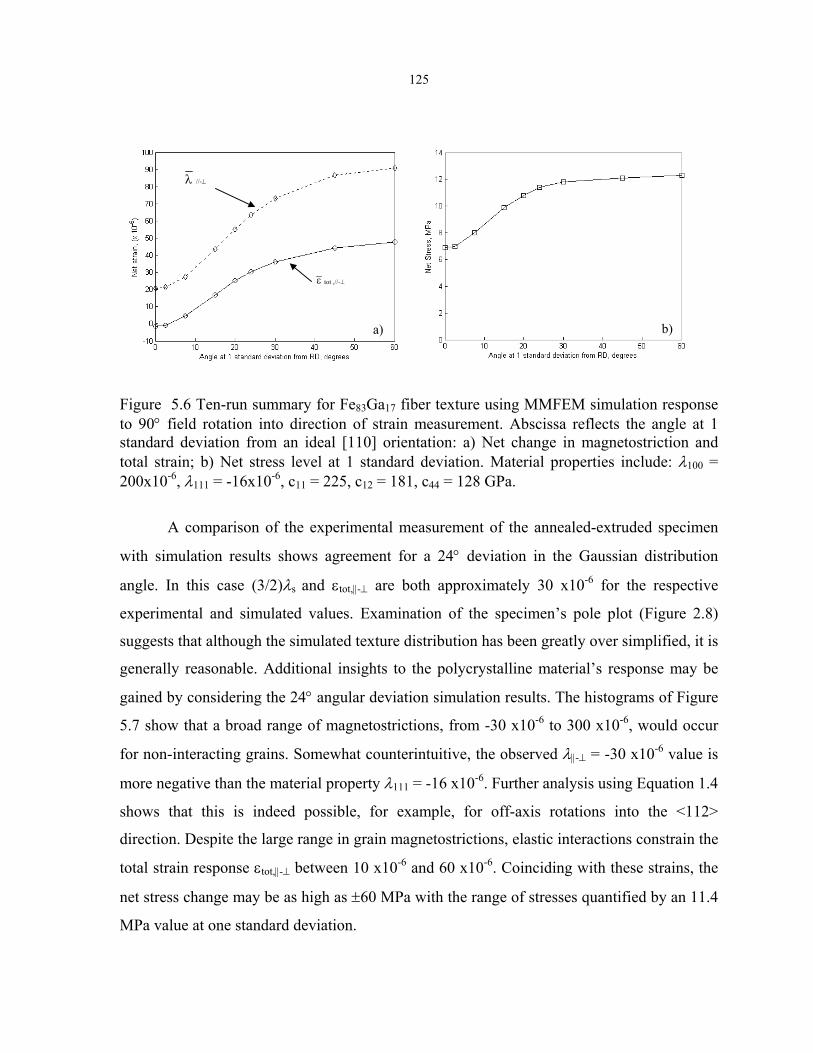
125
b)
ε tot ,//-⊥
a)
λ //-⊥
Figure 5.6 Ten-run summary for Fe83Ga17 fiber texture using MMFEM simulation response to 90° field rotation into direction of strain measurement. Abscissa reflects the angle at 1 standard deviation from an ideal [110] orientation: a) Net change in magnetostriction and total strain; b) Net stress level at 1 standard deviation. Material properties include: λ100 = 200x10-6, λ111 = -16x10-6, c11 = 225, c12 = 181, c44 = 128 GPa.
A comparison of the experimental measurement of the annealed-extruded specimen
with simulation results shows agreement for a 24° deviation in the Gaussian distribution
angle. In this case (3/2)λs and εtot,||-⊥ are both approximately 30 x10-6 for the respective
experimental and simulated values. Examination of the specimen’s pole plot (Figure 2.8)
suggests that although the simulated texture distribution has been greatly over simplified, it is
generally reasonable. Additional insights to the polycrystalline material’s response may be
gained by considering the 24° angular deviation simulation results. The histograms of Figure
5.7 show that a broad range of magnetostrictions, from -30 x10-6 to 300 x10-6, would occur
for non-interacting grains. Somewhat counterintuitive, the observed λ||-⊥ = -30 x10-6 value is
more negative than the material property λ111 = -16 x10-6. Further analysis using Equation 1.4
shows that this is indeed possible, for example, for off-axis rotations into the <112>
direction. Despite the large range in grain magnetostrictions, elastic interactions constrain the
total strain response εtot,||-⊥ between 10 x10-6 and 60 x10-6. Coinciding with these strains, the
net stress change may be as high as ±60 MPa with the range of stresses quantified by an 11.4
MPa value at one standard deviation.
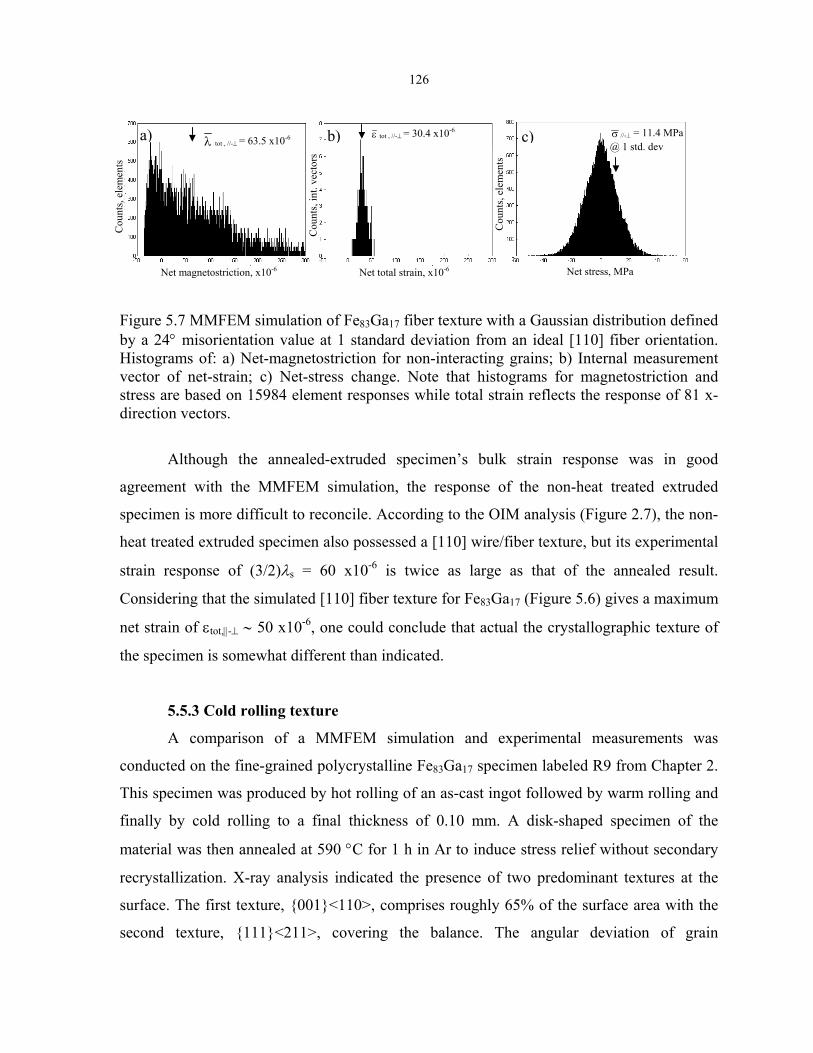
126
ελσa) b) tot , //-⊥ = 30.4 x10⁻⁶ //-⊥ = 11.4 MPa @ 1 std. dev
c) tot , //-⊥ = 63.5 x10⁻⁶
Cou
nts,
int.
vect
ors
Cou
nts,
elem
ents
Cou
nts,
elem
ents
Net stress, MPa Net magnetostriction, x10-6 Net total strain, x10-6
Figure 5.7 MMFEM simulation of Fe83Ga17 fiber texture with a Gaussian distribution defined by a 24° misorientation value at 1 standard deviation from an ideal [110] fiber orientation. Histograms of: a) Net-magnetostriction for non-interacting grains; b) Internal measurement vector of net-strain; c) Net-stress change. Note that histograms for magnetostriction and stress are based on 15984 element responses while total strain reflects the response of 81 x-direction vectors.
Although the annealed-extruded specimen’s bulk strain response was in good
agreement with the MMFEM simulation, the response of the non-heat treated extruded
specimen is more difficult to reconcile. According to the OIM analysis (Figure 2.7), the non-
heat treated extruded specimen also possessed a [110] wire/fiber texture, but its experimental
strain response of (3/2)λs = 60 x10-6 is twice as large as that of the annealed result.
Considering that the simulated [110] fiber texture for Fe83Ga17 (Figure 5.6) gives a maximum
net strain of εtot,||-⊥ ∼ 50 x10-6, one could conclude that actual the crystallographic texture of
the specimen is somewhat different than indicated.
5.5.3 Cold rolling texture
A comparison of a MMFEM simulation and experimental measurements was
conducted on the fine-grained polycrystalline Fe83Ga17 specimen labeled R9 from Chapter 2.
This specimen was produced by hot rolling of an as-cast ingot followed by warm rolling and
finally by cold rolling to a final thickness of 0.10 mm. A disk-shaped specimen of the
material was then annealed at 590 °C for 1 h in Ar to induce stress relief without secondary
recrystallization. X-ray analysis indicated the presence of two predominant textures at the
surface. The first texture, 001<110>, comprises roughly 65% of the surface area with the
second texture, 111<211>, covering the balance. The angular deviation of grain
127
orientations from both textures was assumed to follow a Gaussian distribution with one
standard deviation at 20°. The rolled material’s grain geometry approaches a width to length
to depth ratio of 50x500x1 with ∼10-µm wide grains. The MMFEM of this material used
simulated grains having a width to length to depth ratio of 4x12x1. However, solutions to
MMFEM simulations using increasing length ratios converged quickly, verifying that the
computationally cheap grain configuration of 4x12x1 should accurately represent the
material’s strain response.
Using the two texture distributions, ten simulations were conducted on a 6x3x4
matrix of grains. The strain responses over interior elements were used to minimize edge
effects. Relative to the rolling direction, simulations gave εtot,||-⊥ = 30 x10-6, and λ||-⊥ = 54
x10-6. The εtot,||-⊥ result agreed with the 30 x10-6 experimental result. Given the large
001<110> texture content, simulations show that εtot,||-⊥ ∼ 157 x10-6 is expected at a angle
of 45 degrees from RD, but the experimental observation of εtot,||-⊥ = 37 x10-6 ppm in this
direction is inconsistent with this result. This discrepancy suggests that a significant texture
change occurs throughout the specimen’s thickness or that the alloy’s magnetostrictive
characteristics have been significantly altered during processing.
5.5.4 Cube texture sensitivity analysis
A sensitivity analysis of a Fe83Ga17 polycrystal’s bulk magnetostrictive output as a
function crystallographic misorientation was performed to reveal how precise a texturing
process must be to obtain high quality actuation/sensing material. MMFEM simulations were
carried out for varying degrees of angular deviation from an ideal cube or 001<100>
texture. As was the case for the extruded and random specimen simulations, a 3-dimensional
666 grain array of rhombic dodecahedrons was used. Monte-Carlo techniques were employed
to assign each grain its crystallographic orientation using a Gaussian distribution relative to
the direction of strain measurement in addition to an independent Gaussian distribution
relative to the plane normal. Separate number generator initializations ensured that each
distribution was independent.
A summary of combined simulation runs (ten at each distribution deviation angle)
includes averages of the net strain output εtot,||-⊥, net magnetostriction λ||-⊥, and internal
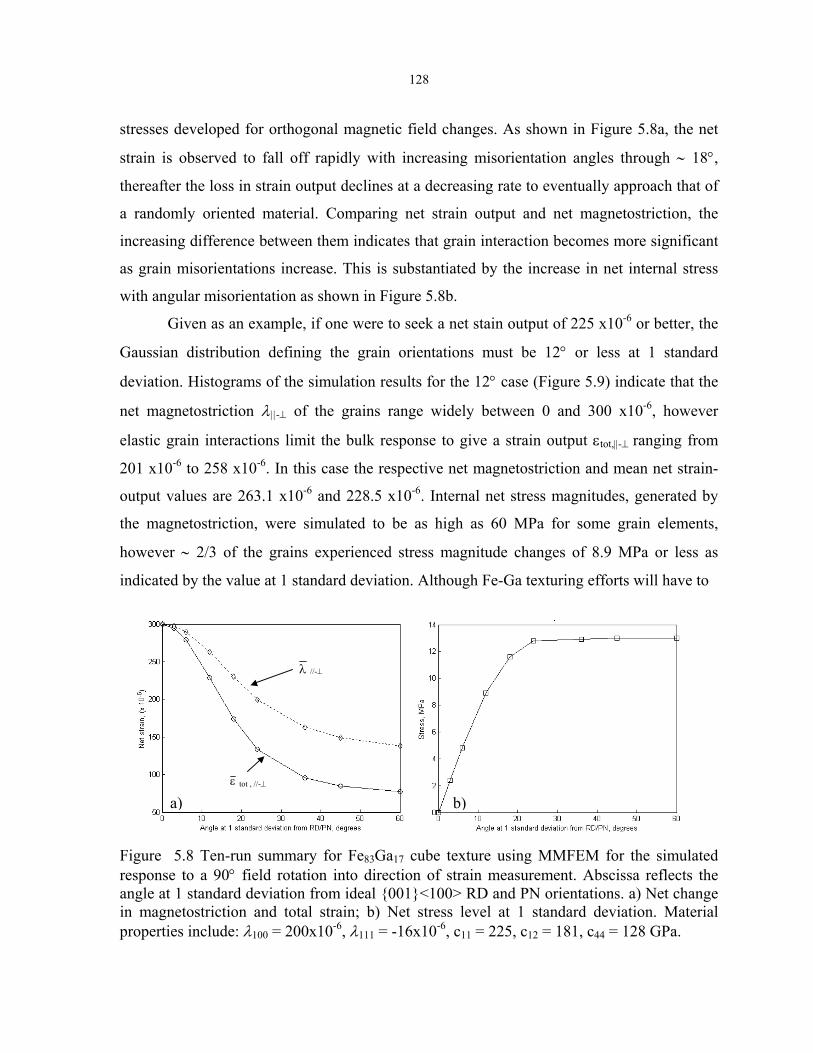
128
stresses developed for orthogonal magnetic field changes. As shown in Figure 5.8a, the net
strain is observed to fall off rapidly with increasing misorientation angles through ∼ 18°,
thereafter the loss in strain output declines at a decreasing rate to eventually approach that of
a randomly oriented material. Comparing net strain output and net magnetostriction, the
increasing difference between them indicates that grain interaction becomes more significant
as grain misorientations increase. This is substantiated by the increase in net internal stress
with angular misorientation as shown in Figure 5.8b.
Given as an example, if one were to seek a net stain output of 225 x10-6 or better, the
Gaussian distribution defining the grain orientations must be 12° or less at 1 standard
deviation. Histograms of the simulation results for the 12° case (Figure 5.9) indicate that the
net magnetostriction λ||-⊥ of the grains range widely between 0 and 300 x10-6, however
elastic grain interactions limit the bulk response to give a strain output εtot,||-⊥ ranging from
201 x10-6 to 258 x10-6. In this case the respective net magnetostriction and mean net strain-
output values are 263.1 x10⁻⁶ and 228.5 x10⁻⁶. Internal net stress magnitudes, generated by
the magnetostriction, were simulated to be as high as 60 MPa for some grain elements,
however ∼ 2/3 of the grains experienced stress magnitude changes of 8.9 MPa or less as
indicated by the value at 1 standard deviation. Although Fe-Ga texturing efforts will have to
b) a) ε tot , //-⊥
λ //-⊥
Figure 5.8 Ten-run summary for Fe83Ga17 cube texture using MMFEM for the simulated response to a 90° field rotation into direction of strain measurement. Abscissa reflects the angle at 1 standard deviation from ideal 001<100> RD and PN orientations. a) Net change in magnetostriction and total strain; b) Net stress level at 1 standard deviation. Material properties include: λ100 = 200x10-6, λ111 = -16x10-6, c11 = 225, c12 = 181, c44 = 128 GPa.

129
ελ σtot , //-⊥ = 228.5 x10⁻⁶ c) b) a) //-⊥ = 263.1 x10⁻⁶
//-⊥ = 8.9 MPa @ 1 std. dev
Cou
nts,
int.
vect
ors
Cou
nts,
elem
ents
Cou
nts,
elem
ents
Net stress, MPa Net magnetostriction, x10-6 Net total strain, x10-6
Figure 5.9 MMFEM simulation of Fe83Ga17 with a Gaussian distribution defined by a 12° misorientation value at 1 standard deviation from 001<100> cube texture. Histograms of: a) Element net-magnetostriction for non-interacting grains; b) Internal measurement vector of net-strain; c) Element net-stress change.
achieve a high degree crystallographic alignment to give good strain performance, it is
encouraging to that note cube orientation distributions tighter than 12° have been produced in
the Fe-Si alloys [Walter 1965].
Exploring a variation on the cube texture, a simulation was conducted to examine the
total strain output of a [100] fiber texture where the RD possesses a perfect [100] orientation
and grain orientations relative to the PN are random. In this instance εtot,||-⊥ = λ||-⊥ = 300
x10-6, which is consistent with Equation 1.4 where grain interaction is neglected. In fact,
simulation results show that the internal stresses developed by interacting grains remain
small, being on the order of 0.01 MPa given their common alignment along the material
direction containing the major magnetostriction constant λ100. This result substantiates that a
[100] fiber texture is just as good as the cube texture as far as magnetostrictive strain
capability is concerned. However, the fiber texture will likely remain somewhat more
difficult to magnetize as well as being more hysteretic given a mix of “hard” and “easy” axes
in the PN direction.
5.6 Modeling summary
The MMFEM successfully captures the combined magnetostrictive and
micromechanical response of polycrystalline Fe-Ga alloys. Simulation results were in good
agreement with the experimental strain measurements for the Fe80Ga20 random, Fe83Ga17
rolled high-temperature anneal (with through thickness grains) and Fe83Ga17 annealed-
130
extruded specimens. In each of these cases, the specimen’s crystallographic orientation
distribution was well defined. Despite these satisfactory modeling results, simulated and
experimental measurements were in poor agreement for the Fe83Ga17 rolled low-temperature
annealed and Fe83Ga17 non heat-treated extruded specimens. The experimentally determined
texture distributions for these two specimens were most likely not well characterized. In the
former case, the X-ray texture analysis represented only the surface of the rolled sheet and
the texture may have changed through the thickness. (This is in contrast to the well-known
orientation for each of the through thickness grains in the high-temperature annealed rolled
specimen.) In the later case, OIM analysis techniques were used. The discrete nature of OIM
analysis could have led to systematic errors in which subtle yet important texture components
were excluded.
The comparison of the total strain output of the MMFEM simulations, analytic
approximation methods and experimental results for random specimens clearly indicated that
the currently available analytic approximation methods are in disagreement. Depending on
the alloy stoichiometry and consequently its material properties, assumptions of constant
stress (Akulov method) lead to an over prediction of the total strain output by up to factor of
two, while the spherical stress field (Vladimirsky method) and constant strain (Voigt method)
approximations significantly under predict the total strain output.
Simulations addressing variations in grain misorientation from the ideal <110> fiber
and ideal 100<001> cube textures demonstrated that grain interactions can result in
significant internal stresses, (magnitudes exceeding 40 MPa) which substantially limit the
material’s total strain output. As a result, the magnetostriction prediction for non-interacting
grains consistently over predicts (in some cases by as much as a factor of two) the material’s
actual total strain capability.
Lending optimism to the success of future texturing efforts, the cube texture allows a
reasonable margin of grain misalignment while still producing substantial bulk
magnetostrictive strains. Adding further encouragement, the [100] fiber texture, provided it
has a high degree of [100] alignment in the RD, sustains this bulk magnetostrictive strain
capability equally well.

131
6. AUXETICITY AND ITS APPLICATIONS
Auxetic materials are characterized by their negative Poisson’s ratios ν, in which an
extension in the loading direction is accompanied by an extension in one or more directions
transverse to that of the load application. This auxetic behavior contrasts with the positive
Poisson’s ratio behavior of conventional materials, which are often polycrystalline and
isotropic in nature. A comparison of the Poisson’s ratios for several conventional materials
and auxetic materials are listed in Table 6.1.
A variety of “macroscopic” auxetic materials are prevalent including keyed brick
structures, composites, skin, bone, polymeric foams, metallic foams and honeycombs. The
auxetic behavior of these materials arises from the mechanical action of macroscopic
geometries such as the reentrant cell structure of foam as depicted in the schematic of Figure
6.1. The list of known molecular auxetic materials, in which auxeticity is an intrinsic
property, is significantly shorter and includes sintered ceramics, α-cristobalite, liquid
crystalline polymers and a number cubic metals [Alderson 1999].
Material ν
Rubber 0.50
Polyurethane 0.45
Steel 0.25 to 0.35
Foam plastic 0.2
Con
vent
iona
l
Cork 0
Reentrant foam plastic1 -0.25
Anisotropic cross-ply composite2
0 to -1.0
Aux
etic
Fe72.8Ga27.2 single crystal -0.75
Table 6.1 Poisson’s ratios for conventional and auxetic materials 1[Lakes 1988], 2[Gibson 1994].
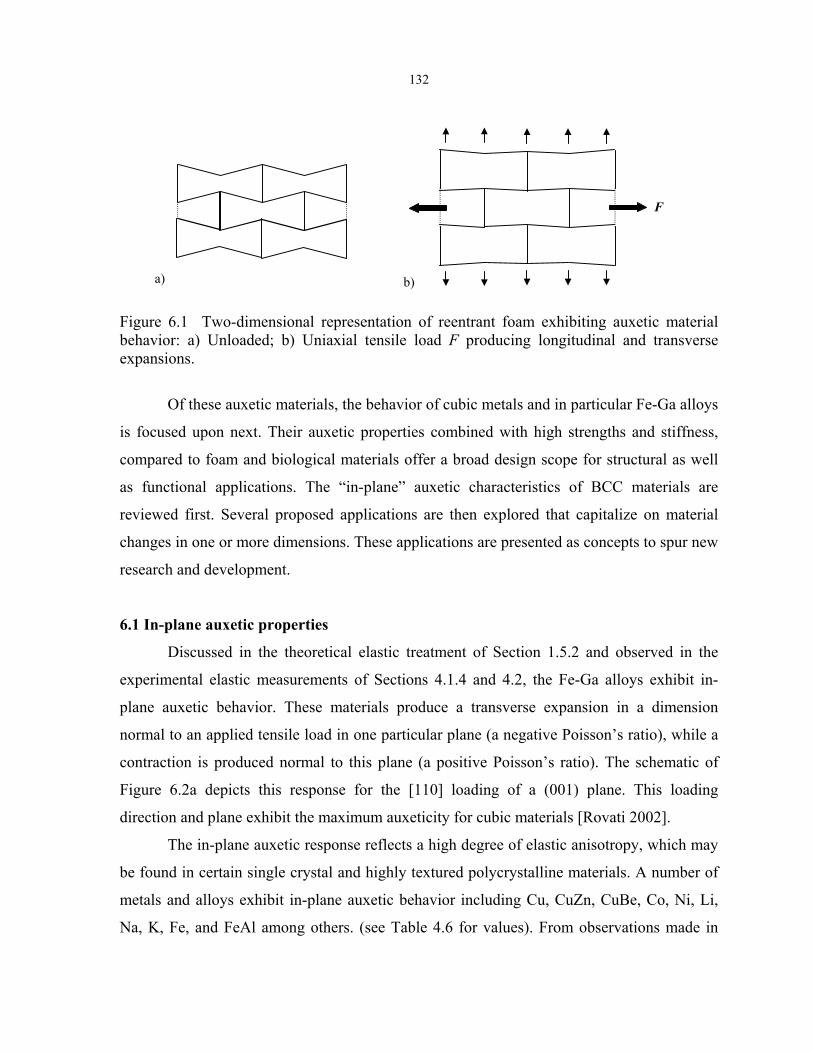
132
F
b)
a)
Figure 6.1 Two-dimensional representation of reentrant foam exhibiting auxetic material behavior: a) Unloaded; b) Uniaxial tensile load F producing longitudinal and transverse expansions.
Of these auxetic materials, the behavior of cubic metals and in particular Fe-Ga alloys
is focused upon next. Their auxetic properties combined with high strengths and stiffness,
compared to foam and biological materials offer a broad design scope for structural as well
as functional applications. The “in-plane” auxetic characteristics of BCC materials are
reviewed first. Several proposed applications are then explored that capitalize on material
changes in one or more dimensions. These applications are presented as concepts to spur new
research and development.
6.1 In-plane auxetic properties
Discussed in the theoretical elastic treatment of Section 1.5.2 and observed in the
experimental elastic measurements of Sections 4.1.4 and 4.2, the Fe-Ga alloys exhibit in-
plane auxetic behavior. These materials produce a transverse expansion in a dimension
normal to an applied tensile load in one particular plane (a negative Poisson’s ratio), while a
contraction is produced normal to this plane (a positive Poisson’s ratio). The schematic of
Figure 6.2a depicts this response for the [110] loading of a (001) plane. This loading
direction and plane exhibit the maximum auxeticity for cubic materials [Rovati 2002].
The in-plane auxetic response reflects a high degree of elastic anisotropy, which may
be found in certain single crystal and highly textured polycrystalline materials. A number of
metals and alloys exhibit in-plane auxetic behavior including Cu, CuZn, CuBe, Co, Ni, Li,
Na, K, Fe, and FeAl among others. (see Table 4.6 for values). From observations made in
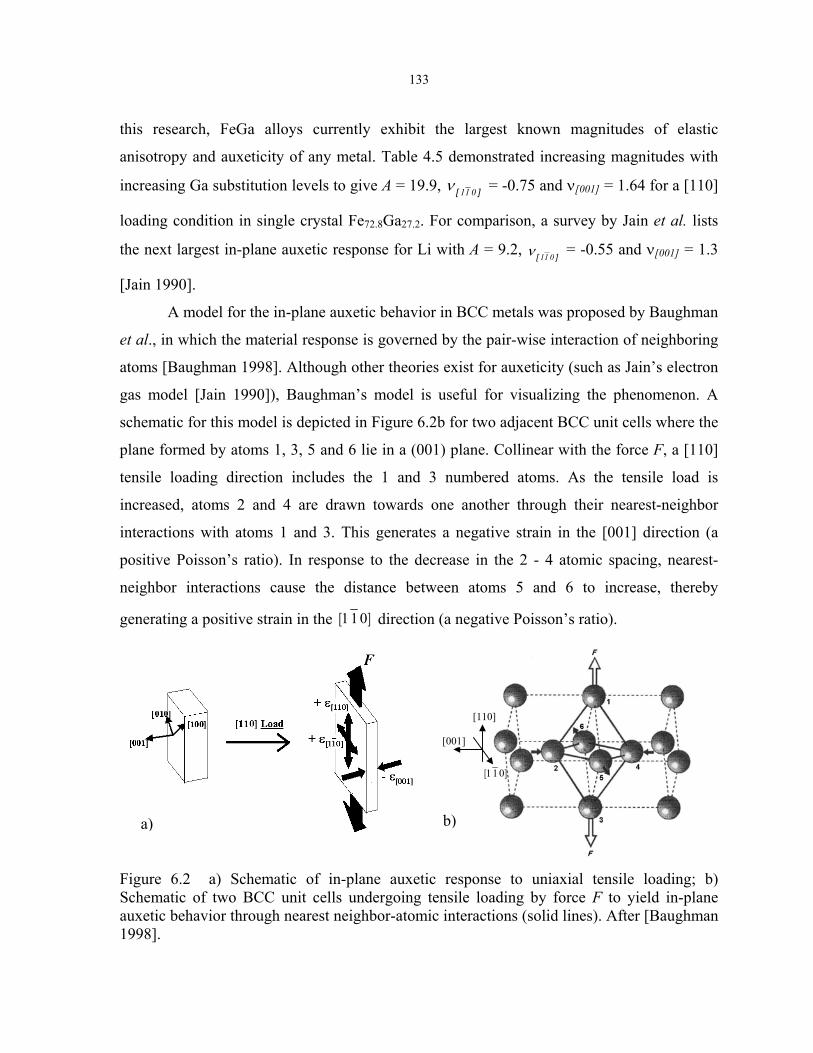
133
this research, FeGa alloys currently exhibit the largest known magnitudes of elastic
anisotropy and auxeticity of any metal. Table 4.5 demonstrated increasing magnitudes with
increasing Ga substitution levels to give A = 19.9, ][ 011ν = -0.75 and ν[001] = 1.64 for a [110]
loading condition in single crystal Fe72.8Ga27.2. For comparison, a survey by Jain et al. lists
the next largest in-plane auxetic response for Li with A = 9.2, ][ 011ν = -0.55 and ν[001] = 1.3
[Jain 1990].
A model for the in-plane auxetic behavior in BCC metals was proposed by Baughman
et al., in which the material response is governed by the pair-wise interaction of neighboring
atoms [Baughman 1998]. Although other theories exist for auxeticity (such as Jain’s electron
gas model [Jain 1990]), Baughman’s model is useful for visualizing the phenomenon. A
schematic for this model is depicted in Figure 6.2b for two adjacent BCC unit cells where the
plane formed by atoms 1, 3, 5 and 6 lie in a (001) plane. Collinear with the force F, a [110]
tensile loading direction includes the 1 and 3 numbered atoms. As the tensile load is
increased, atoms 2 and 4 are drawn towards one another through their nearest-neighbor
interactions with atoms 1 and 3. This generates a negative strain in the [001] direction (a
positive Poisson’s ratio). In response to the decrease in the 2 - 4 atomic spacing, nearest-
neighbor interactions cause the distance between atoms 5 and 6 to increase, thereby
generating a positive strain in the ]011[ direction (a negative Poisson’s ratio).
][ 011
[001]
[110]
b) a)
Figure 6.2 a) Schematic of in-plane auxetic response to uniaxial tensile loading; b) Schematic of two BCC unit cells undergoing tensile loading by force F to yield in-plane auxetic behavior through nearest neighbor-atomic interactions (solid lines). After [Baughman 1998].
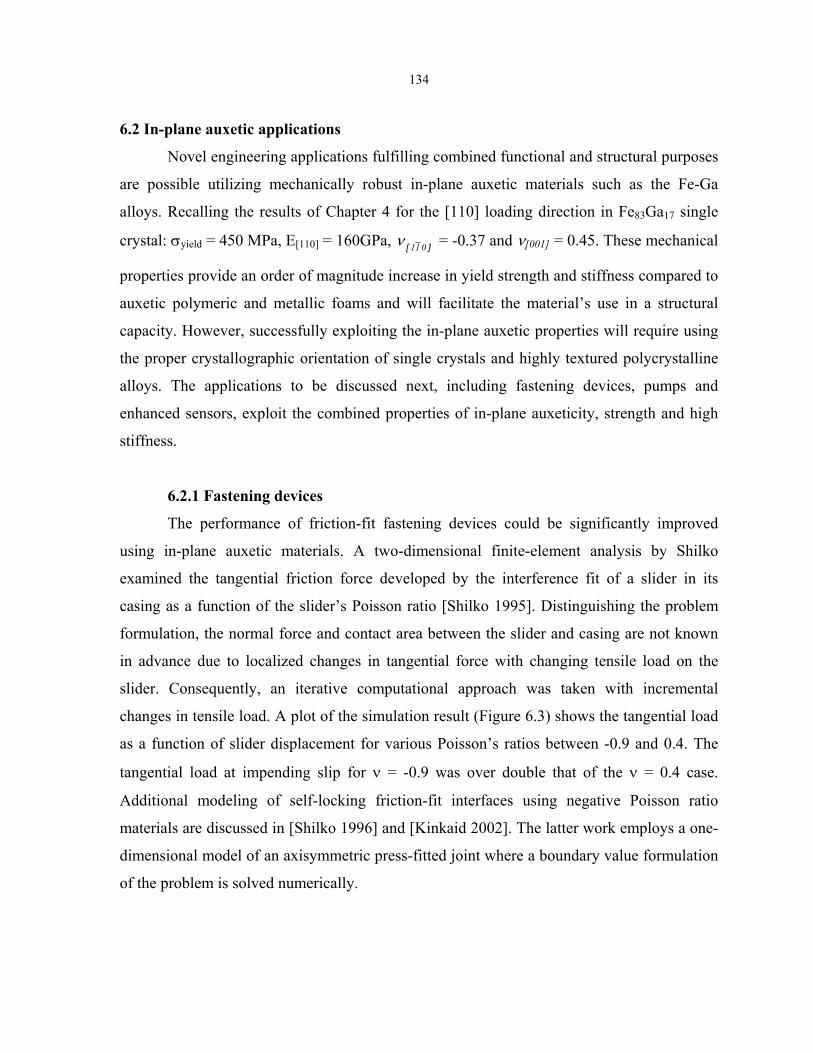
134
6.2 In-plane auxetic applications
Novel engineering applications fulfilling combined functional and structural purposes
are possible utilizing mechanically robust in-plane auxetic materials such as the Fe-Ga
alloys. Recalling the results of Chapter 4 for the [110] loading direction in Fe83Ga17 single
crystal: σyield = 450 MPa, E[110] = 160GPa, ][ 011ν = -0.37 and ν[001] = 0.45. These mechanical
properties provide an order of magnitude increase in yield strength and stiffness compared to
auxetic polymeric and metallic foams and will facilitate the material’s use in a structural
capacity. However, successfully exploiting the in-plane auxetic properties will require using
the proper crystallographic orientation of single crystals and highly textured polycrystalline
alloys. The applications to be discussed next, including fastening devices, pumps and
enhanced sensors, exploit the combined properties of in-plane auxeticity, strength and high
stiffness.
6.2.1 Fastening devices
The performance of friction-fit fastening devices could be significantly improved
using in-plane auxetic materials. A two-dimensional finite-element analysis by Shilko
examined the tangential friction force developed by the interference fit of a slider in its
casing as a function of the slider’s Poisson ratio [Shilko 1995]. Distinguishing the problem
formulation, the normal force and contact area between the slider and casing are not known
in advance due to localized changes in tangential force with changing tensile load on the
slider. Consequently, an iterative computational approach was taken with incremental
changes in tensile load. A plot of the simulation result (Figure 6.3) shows the tangential load
as a function of slider displacement for various Poisson’s ratios between -0.9 and 0.4. The
tangential load at impending slip for ν = -0.9 was over double that of the ν = 0.4 case.
Additional modeling of self-locking friction-fit interfaces using negative Poisson ratio
materials are discussed in [Shilko 1996] and [Kinkaid 2002]. The latter work employs a one-
dimensional model of an axisymmetric press-fitted joint where a boundary value formulation
of the problem is solved numerically.
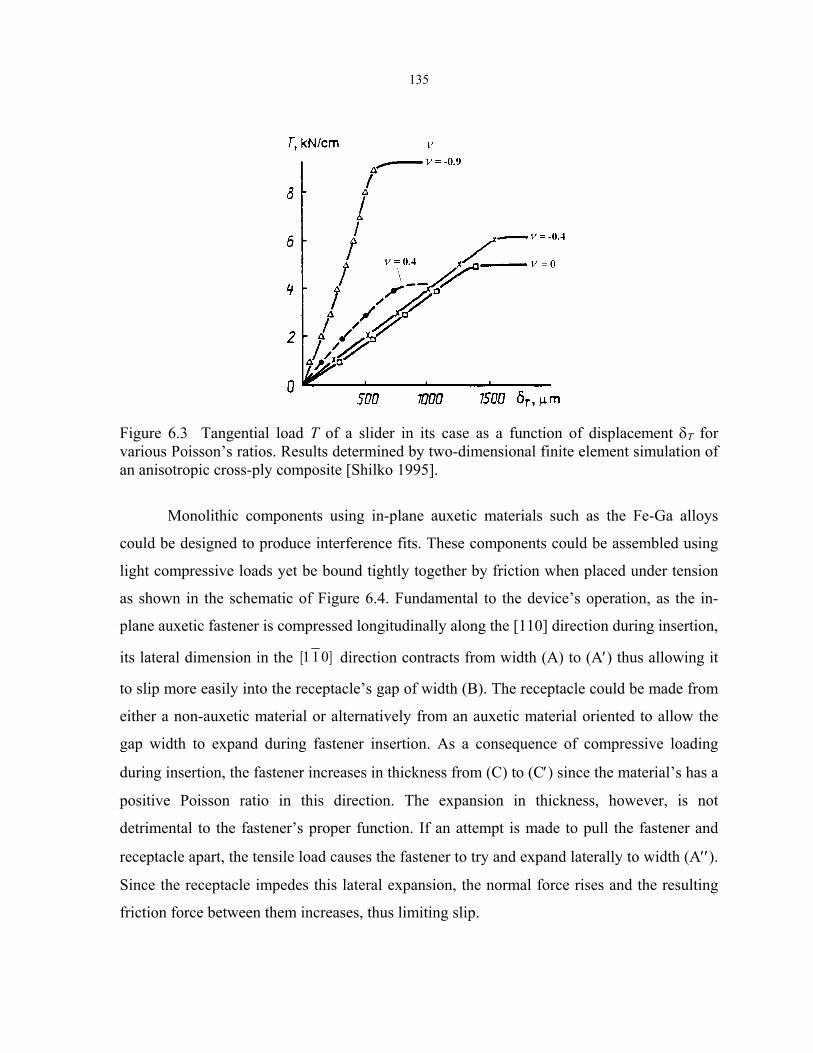
135
Figure 6.3 Tangential load T of a slider in its case as a function of displacement δT for various Poisson’s ratios. Results determined by two-dimensional finite element simulation of an anisotropic cross-ply composite [Shilko 1995].
Monolithic components using in-plane auxetic materials such as the Fe-Ga alloys
could be designed to produce interference fits. These components could be assembled using
light compressive loads yet be bound tightly together by friction when placed under tension
as shown in the schematic of Figure 6.4. Fundamental to the device’s operation, as the in-
plane auxetic fastener is compressed longitudinally along the [110] direction during insertion,
its lateral dimension in the ]011[ direction contracts from width (A) to (A′) thus allowing it
to slip more easily into the receptacle’s gap of width (B). The receptacle could be made from
either a non-auxetic material or alternatively from an auxetic material oriented to allow the
gap width to expand during fastener insertion. As a consequence of compressive loading
during insertion, the fastener increases in thickness from (C) to (C′) since the material’s has a
positive Poisson ratio in this direction. The expansion in thickness, however, is not
detrimental to the fastener’s proper function. If an attempt is made to pull the fastener and
receptacle apart, the tensile load causes the fastener to try and expand laterally to width (A′′).
Since the receptacle impedes this lateral expansion, the normal force rises and the resulting
friction force between them increases, thus limiting slip.
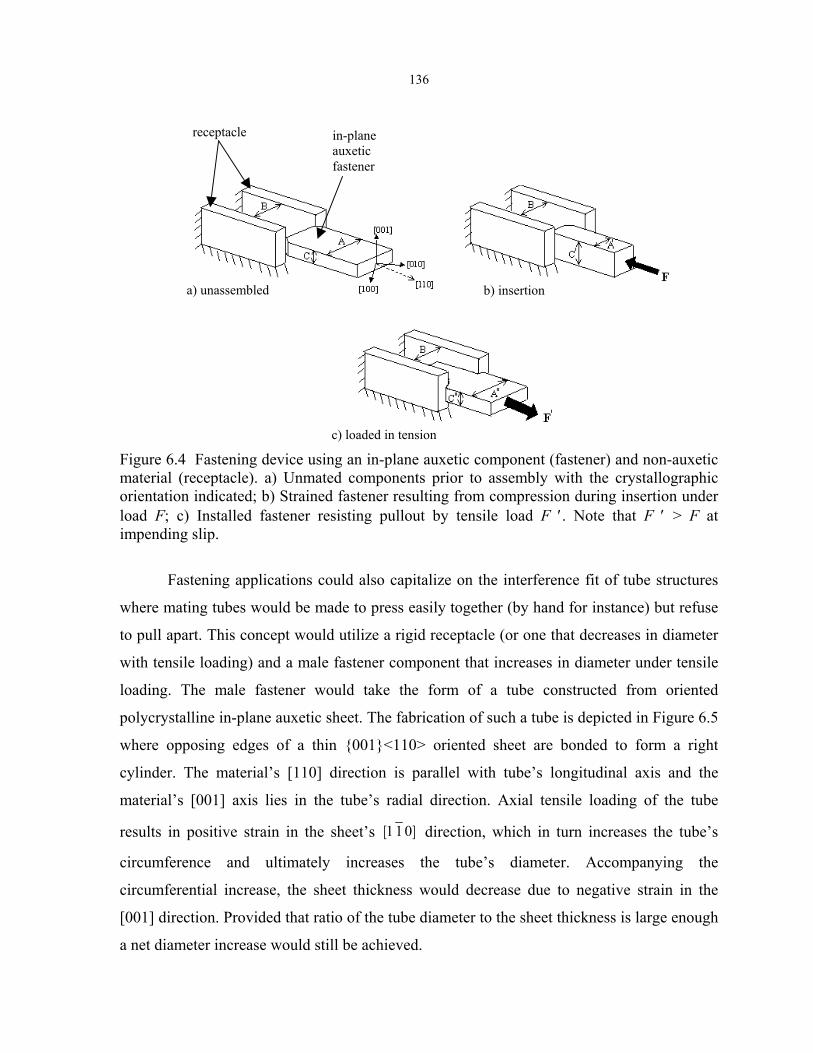
136
c) loaded in tension
b) insertion a) unassembled
in-plane auxetic fastener
receptacle
Figure 6.4 Fastening device using an in-plane auxetic component (fastener) and non-auxetic material (receptacle). a) Unmated components prior to assembly with the crystallographic orientation indicated; b) Strained fastener resulting from compression during insertion under load F; c) Installed fastener resisting pullout by tensile load F ′. Note that F ′ > F at impending slip.
Fastening applications could also capitalize on the interference fit of tube structures
where mating tubes would be made to press easily together (by hand for instance) but refuse
to pull apart. This concept would utilize a rigid receptacle (or one that decreases in diameter
with tensile loading) and a male fastener component that increases in diameter under tensile
loading. The male fastener would take the form of a tube constructed from oriented
polycrystalline in-plane auxetic sheet. The fabrication of such a tube is depicted in Figure 6.5
where opposing edges of a thin 001<110> oriented sheet are bonded to form a right
cylinder. The material’s [110] direction is parallel with tube’s longitudinal axis and the
material’s [001] axis lies in the tube’s radial direction. Axial tensile loading of the tube
results in positive strain in the sheet’s ]011[ direction, which in turn increases the tube’s
circumference and ultimately increases the tube’s diameter. Accompanying the
circumferential increase, the sheet thickness would decrease due to negative strain in the
[001] direction. Provided that ratio of the tube diameter to the sheet thickness is large enough
a net diameter increase would still be achieved.
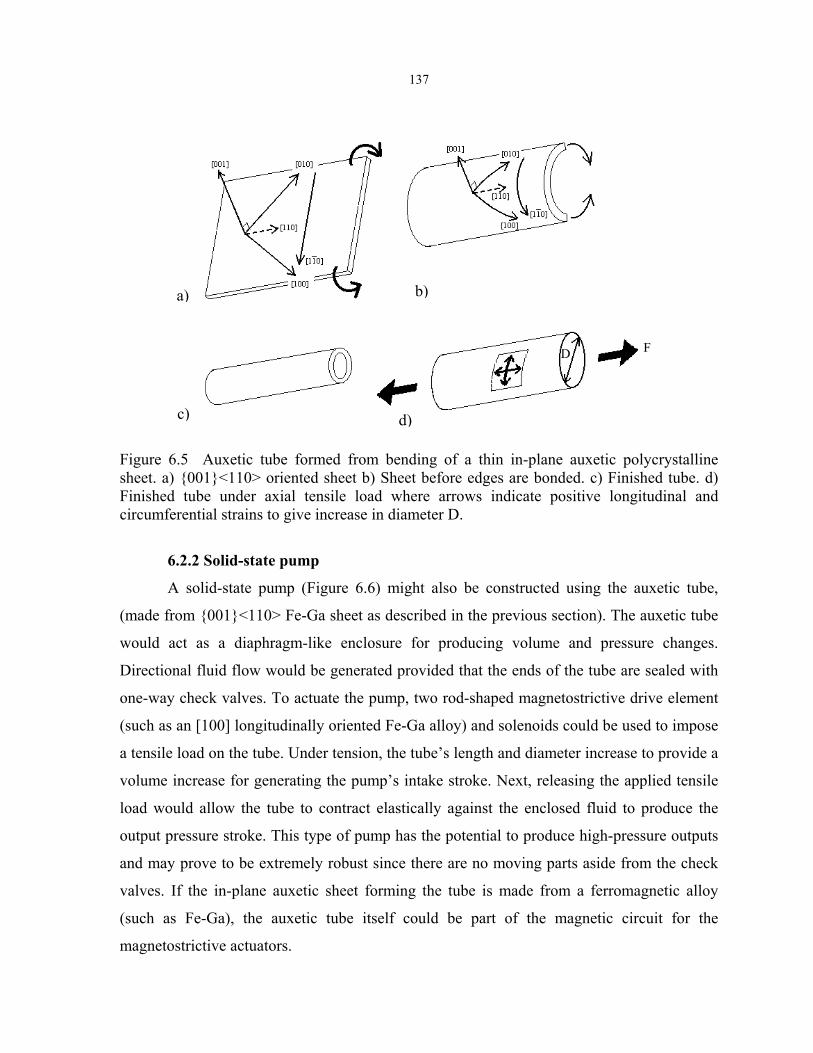
137
d)
D
c)
b) a)
F
Figure 6.5 Auxetic tube formed from bending of a thin in-plane auxetic polycrystalline sheet. a) 001<110> oriented sheet b) Sheet before edges are bonded. c) Finished tube. d) Finished tube under axial tensile load where arrows indicate positive longitudinal and circumferential strains to give increase in diameter D.
6.2.2 Solid-state pump
A solid-state pump (Figure 6.6) might also be constructed using the auxetic tube,
(made from 001<110> Fe-Ga sheet as described in the previous section). The auxetic tube
would act as a diaphragm-like enclosure for producing volume and pressure changes.
Directional fluid flow would be generated provided that the ends of the tube are sealed with
one-way check valves. To actuate the pump, two rod-shaped magnetostrictive drive element
(such as an [100] longitudinally oriented Fe-Ga alloy) and solenoids could be used to impose
a tensile load on the tube. Under tension, the tube’s length and diameter increase to provide a
volume increase for generating the pump’s intake stroke. Next, releasing the applied tensile
load would allow the tube to contract elastically against the enclosed fluid to produce the
output pressure stroke. This type of pump has the potential to produce high-pressure outputs
and may prove to be extremely robust since there are no moving parts aside from the check
valves. If the in-plane auxetic sheet forming the tube is made from a ferromagnetic alloy
(such as Fe-Ga), the auxetic tube itself could be part of the magnetic circuit for the
magnetostrictive actuators.
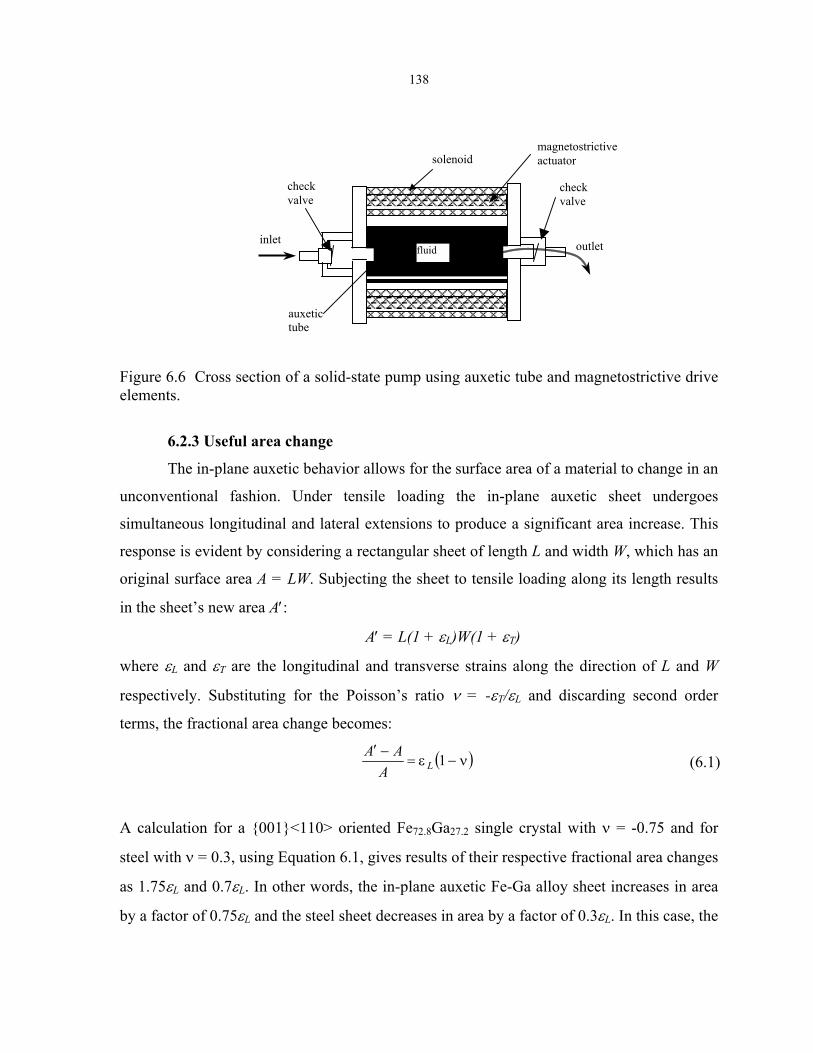
138
check valve
check valve
auxetic tube
inlet outlet
solenoid magnetostrictive actuator
fluid
Figure 6.6 Cross section of a solid-state pump using auxetic tube and magnetostrictive drive elements.
6.2.3 Useful area change
The in-plane auxetic behavior allows for the surface area of a material to change in an
unconventional fashion. Under tensile loading the in-plane auxetic sheet undergoes
simultaneous longitudinal and lateral extensions to produce a significant area increase. This
response is evident by considering a rectangular sheet of length L and width W, which has an
original surface area A = LW. Subjecting the sheet to tensile loading along its length results
in the sheet’s new area A′:
A′ = L(1 + εL)W(1 + εT)
where εL and εT are the longitudinal and transverse strains along the direction of L and W
respectively. Substituting for the Poisson’s ratio ν = -εT/εL and discarding second order
terms, the fractional area change becomes:
( )ν−ε=−′ 1LA
AA (6.1)
A calculation for a 001<110> oriented Fe72.8Ga27.2 single crystal with ν = -0.75 and for
steel with ν = 0.3, using Equation 6.1, gives results of their respective fractional area changes
as 1.75εL and 0.7εL. In other words, the in-plane auxetic Fe-Ga alloy sheet increases in area
by a factor of 0.75εL and the steel sheet decreases in area by a factor of 0.3εL. In this case, the
139
in-plane auxetic material clearly gives a larger areal response (2.5 times larger) and one of
opposite sign relative to that undergone by the traditional engineering metal.
Applications that might take advantage of the areal increase of in-plane auxetic sheet
include force and pressure sensors having improved sensitivity. It may also be possible to
bond the in-plane auxetic sheet to piezoelectric material to form a composite with improved
coupling coefficients and enhanced sensing capability. Additionally, if a ferromagnetic in-
plane auxetic material is used (such as the Fe-Ga alloys), force and pressure changes could be
sensed magnetically through changes in the materials’ state of magnetization.
6.2.4 Other possibilities
The transmission of sound and vibration in structures are governed by the mechanical
properties of the transmission material and its boundary conditions. Novel applications using
in-plane auxetic materials could capitalize on their high degree of elastic anisotropy and
internal magnetic/mechanical coupling. Applications using tailored sound and vibration
transmission properties could offer improved sensing/transmission devices as well as
variably damped structures and components through magnetic control. Applications using the
in-plane auxetic metals can also function in a higher frequency regime compared to auxetic
polymers, polymeric foam and metallic foams due to their larger modulus of elasticity.
6.3 In-plane auxetic application summary
Single and/or polycrystalline materials possessing in-plane auxetic behavior, such as
the iron-gallium alloys, provide unique and novel solutions to a range of engineering
applications. These solutions rely on combined material characteristics of high strength,
stiffness and in-plane auxeticity, which cannot be found in current polymeric or metallic
auxetic foams or traditional engineering metals. Broad classes of engineering applications to
be addressed include: easily assembled, high-strength self-locking fastening devices; simple
geometries providing useful area and/or volume change that act as solid-state pumps and
sensors; and structures and sensors with unique high frequency sound, vibration transmission
and damping characteristics.
140
7. CONCLUSIONS
The goal of this research was to increase the understanding of Fe-Ga alloys’
magnetic, magnetostrictive and mechanical properties and apply this knowledge to advance
the material’s development and function in crystallographically textured polycrystalline
forms for combined transduction and structural applications. In pursuit of this goal, the
existing base of research knowledge was drawn upon to provide a guide for subsequent
material processing, characterization, modeling and conceptualization of new applications.
A review of existing work (Chapter1) provided background information pertaining to
the magnetic and mechanical properties of Fe-Ga alloys. This included the magnetization and
magnetostrictive processes of ferromagnetic materials along with equations describing the
anisotropic magnetostrictive response of single crystals to saturating magnetic fields. The
latest theory characterizing the source of Fe-Ga alloys’ magnetostrictive nature was
reviewed, as well as descriptions of the material’s variation in magnetostrictive capacity as a
function of Ga substitution level and heat treatment. The known effects of grain morphology
on the elastic and plastic properties of BCC metals were examined, as they are important
factors in the development and use of textured polycrystalline forms of the alloy. Given the
similarity of Fe-Al and Fe-Si alloy mechanical characteristics to those of the Fe-Ga alloys, a
survey of proven Fe-Al and Fe-Si alloy crystallographic texturing methods was conducted to
provide guidelines for texturing efforts in Fe-Ga alloys. The background review concluded
with an analysis of cubic-crystal elasticity relationships to provide a foundation for modeling
the magnetoelastic interactions anticipated in polycrystalline Fe-Ga alloys.
Various methods of material processing were undertaken to maximize the
magnetostrictive output of polycrystalline Fe-Ga alloys using techniques intended to impart a
high degree of [100] crystallographic texture (Chapter 2). Magnetic and mechanical
characterization were carried out for textured material produced using directional growth,
deformation processing and magnetically aligned powder metallurgy techniques. Of these
approaches, from the standpoint of magnetostrictive performance, the two most successful
approaches to texturing of polycrystalline alloy (Fe83Ga17) were directional solidification and
rolling with a post-rolling high-temperature anneal. Directionally solidified and annealed
rolled specimens gave respective net magnetostriction results of 170 x10-6 and 160 x10-6.
141
However, additional improvement in texturing is desired since the Fe83Ga17 textured
magnetostrictive results give only ∼ 55% that of [100] oriented single crystal Fe83Ga17, which
has a net magnetostriction of 300 x10-6. Further grain refinement is also needed as both
specimens possessed large grains that were susceptible to intergranular brittle failure. Other
processing results include: extruded rod, which was mechanically robust but possessed a
dominant <110> longitudinal texture with net magnetostrictions limited to only 30 x10-6 to
60 x10-6; hot and cold forged specimens with modest texture development and low net
magnetostrictions of ∼ 35 x10-6, this might be improved with larger deformations; cold rolled
sheet with good ductility and high strengths, but containing mixed 001<110> and
111<211> surface textures with low net magnetostrictions of ∼ 30 x10-6; and sintered
magnetically “aligned” <20-µm powder, which retained a random texture with net
magnetostrictions of only 60 x10-6 to 76 x10-6.
Select single-crystal and polycrystalline Fe-Ga specimens were subjected to quasi-
static magnetic testing to quantify the effects of stress and temperature on their
magnetostrictive performance (Chapter 3). The magnetic response of Fe81.0Ga19.0 single
crystal was well behaved over a -21°C to 80°C temperature range where the maximum
magnetostriction and magnetization results decreased monotonically by 12% and 3% with
increasing temperature from their respective maximum values of 340 x10-6 and 1313 kA/m at
-21°C. Achieving near-maximal magnetization and magnetostriction values required low-
applied magnetic fields of only ∼ 400 Oe for compressive stress conditions up to 87.1 MPa.
Constant temperature tests showed that compressive stresses greater than 14.4 MPa were
needed to achieve the maximum magnetostriction. Minor-loop cyclic magnetic field tests, at
room temperature, established that the single crystal generates magnetostrictions of ∼ 200
x10-6 with good linearity and low hysteresis for compressive stresses up to 87.1 MPa using a
30 Oe amplitude AC field superimposed on a bias field of 150 Oe. The room temperature
magnetization response of the directionally solidified specimen (at a 14.4 MPa compressive
stress) was very similar to that of the single crystal. Under the same conditions however, the
extruded and extruded plus annealed specimens exhibited greater magnetic anisotropy due to
the presence of misoriented grains having magnetically hard axes in the direction of the
applied magnetic field. These unfavorable grain orientations likely include <110> and <111>
142
texture components. Magnetization trends were corroborated by the magnetostriction
measurements whose values were 170 x10-6, 60 x10-6 and 30 x10-6 for the directionally
solidified, extruded and extruded plus annealed specimens respectively.
The Fe81.0Ga19.0 single crystal was also subjected to major-loop cyclic stress testing
under various levels of DC magnetic field (Chapter 3) to characterize its magnetomechanical
properties for use in actuation and sensing applications. Analysis of the stress versus strain
response demonstrated a maximum delta-E effect of 104%, where a soft modulus of 28 GPa
coincided with maximum magnetic moment rotation and a stiff modulus of 57 GPa reflected
elastic behavior with limited magnetic moment rotation. Stress-induced magnetization
changes gave a maximum sensitivity of d*33 ∼ 22.5 tesla/Pa over a 20 MPa stress range.
Optimizing this sensitivity for sensing applications will require the proper choice of
combined DC applied magnetic field and stress.
Single-crystal specimens of Fe83Ga17 having 001<100> and 001<110>
orientations were tested in tension at room temperature to evaluate the alloy’s mechanical
properties (Chapter 4). These tests revealed that 110<111> and 211<111> slip occurred
at respective critical resolved shear stresses of 220 and 240 MPa. Depending on crystal
orientation, yielding began at 0.3% to 0.8% elongation for yield stresses of 450 to 515 MPa
and continued through ∼ 2% without failure. Slip was discontinuous in the 001<100>
oriented sample and first occurred at a maximum stress of 515 MPa. The ultimate tensile
strength of the 001<110> specimen was 580 MPa. The results for the active slip systems,
shear stresses and yield strengths provide insight to the possible development of texture in
polycrystalline forms of the Fe-Ga alloys and will guide their use in combined transduction
and structural applications.
Tensile testing also quantified the Fe83Ga17 single crystals’ elastic properties (Chapter
4), which revealed a high degree of mechanical anisotropy. The Young’s modulus was 160
GPa for loading in the [110] crystal direction with a Poisson’s ratio of -0.37 on the (001)
major face, while a Young’s modulus of 65 GPa was observed for loading in the [100]
crystal direction with a Poisson’s ratio of 0.45 on the (001) major face. The combined effect
of these Poisson’s ratios is to generate an in-plane auxetic behavior. The corresponding
elastic constants are c11 = 225 ± 20 GPa, c12 = 181 ± 20 GPa and c44 = 128 ± 2 GPa with an
143
elastic anisotropy of 5.7. An analysis of elastic constants of other Fe-Ga stoichiometries
(from other researchers’ acoustic measurements) identified a significant in-plane auxetic
behavior with a minimum Poisson’s ratio of -0.75 and elastic anisotropy value of 19.9 for
single-crystal Fe72.8Ga27.2. The magnitudes of the intrinsic elastic anisotropy and negative
Poisson’s ratio values are the largest of any material known to date. Further analysis of the
elastic properties for various stoichiometries revealed highly-correlated quadratic
relationships between the Poisson’s ratios with respect to the level of Ga substitution in Fe. A
similar observation in the Fe-Al alloy system substantiates the likelihood of a physical basis
for these correlations, which deserves further investigation.
Tensile testing of a fine-grained cold-rolled Fe83Ga17 polycrystalline specimen was
conducted (Chapter 4) to further explore the material’s elastic and plastic properties for use
in harsh mechanical environments. Yielding began at 0.4% elongation and 600 MPa, while
the ultimate tensile strength was 840 MPa for elongations reaching at least 1.5%. Although
the net magnetostriction of this specimen was low (∼30 x10-6 reported in Chapter 2), these
tensile test results provide confirmation that a fine-grained polycrystalline Fe-Ga alloy has
sufficient ductility and strength for use as a rugged transduction material.
A magnetostrictive micromechanics finite-element model (MMFEM) was
successfully developed and used to capture the combined magnetostrictive and
micromechanical response of polycrystalline Fe-Ga alloys to saturating magnetic fields
(Chapter 5). Simulation results were in good agreement with the experimental strain
measurements for random, rolled (with through thickness grains) and annealed-extruded
specimens. In each of these cases, the specimen’s crystallographic orientation distribution
was well defined. Although simulated and experimental measurements were in poorer
agreement for the rolled low-temperature annealed and non heat-treated extruded specimens,
this was very likely due to a deficiency in knowledge of their texture distributions. A
comparison of the total strain output of the MMFEM simulations, analytic approximation
methods and experimental results for random specimens clearly indicated that the analytic
approximation methods are in disagreement. Assumptions of constant stress lead to an over
prediction of the total strain output by up to factor of two, while the spherical stress field and
constant strain approximations under predict the total strain output.
144
A sensitivity analysis addressing variations in grain misorientation from an ideal cube
texture in a Fe83Ga17 alloy demonstrated that grain interactions generate internal stresses with
magnitudes exceeding 40 MPa, which substantially limit the material’s total strain output.
There is cause for optimism regarding the success of future texturing efforts. Simulations
show that an imperfect cube texture having up to a 12° margin of grain misalignment
(relative to ideal) will still produce bulk magnetostrictive strains of ∼ 225 x10-6 (75% of the
maximum for Fe83Ga17). Adding further encouragement, a [100] fiber texture having a high
degree of alignment in the actuation direction (i.e. alignment of grains’ [100] crystallographic
direction along the axis of actuation with random orientations of the grains [001] crystal
direction about that axis), sustains this bulk magnetostrictive strain capability equally well.
The identification of a large-magnitude negative Poisson’s ratio and hence the in-
plane auxetic behavior in elastically anisotropic metals such the Fe-Ga alloys has expanded
the potential design envelope beyond that of existing engineering and transduction materials.
In-plane auxetic behavior provides unique and novel solutions to a range of engineering
applications, which rely on combined material characteristics of high strength, stiffness and
in-plane auxeticity that cannot be found in current polymeric or metallic auxetic foams or
conventional engineering metals. Broad classes of engineering applications were addressed
(Chapter 6) including self-locking fastening devices and simple geometries that provide
useful area and/or volume change for use as solid-state pumps and sensors. Structures and
sensors with unique high-frequency sound, vibration transmission and damping
characteristics are also possible.
To summarize several important aspects of this work with respect to future directions:
Fe-Ga alloys exhibit excellent transduction capabilities, unique auxetic behavior and
robust mechanical attributes. Achieving the material’s maximum utility and its
widespread use in diverse applications will require the production of textured
polycrystalline forms in sufficient quantities for commercialization. To this end,
future work should pursue improving the crystallographic texturing methods having
the potential for high yield outputs. Promising approaches include directional
145
solidification and rolling, although a fine grain structure must be retained to achieve
the best mechanical performance.
The MMFEM proved successful in simulating the combined magnetostrictive and
micromechanical behavior for saturation magnetization conditions in polycrystalline
Fe-Ga alloys. However, the model has the potential to facilitate the future
development as well as expand the study and understanding of magnetostrictive
materials. The model could be extended to account for inhomogeneous stoichiometric
distributions and crystallographic phase variations as well as accommodating an
unlimited range of grain morphologies. Although it would be a challenging
undertaking, the regime of non-saturation magnetization and magnetostriction
responses could also be addressed by allowing system energy (including applied field,
magnetocrystalline and elastic anisotropy and irreversible losses) to dictate the
material’s magnetic domain structure while accounting for the material’s three-
dimensional crystallographic attributes. Such a model would allow the transduction
response to be predicted for magnetostrictive materials having any size, shape and
crystallographic structure for any level of applied magnetic field and stress.
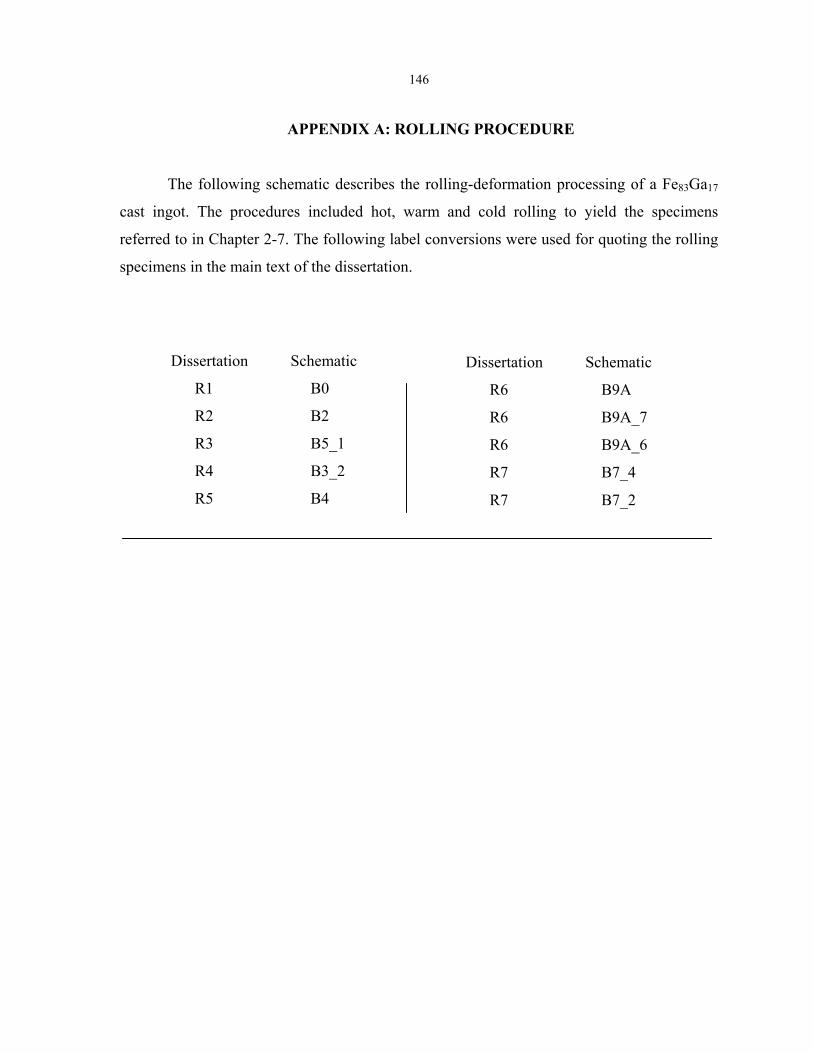
146
APPENDIX A: ROLLING PROCEDURE
The following schematic describes the rolling-deformation processing of a Fe83Ga17
cast ingot. The procedures included hot, warm and cold rolling to yield the specimens
referred to in Chapter 2-7. The following label conversions were used for quoting the rolling
specimens in the main text of the dissertation.
Dissertation Schematic
R6 B9A
R6 B9A_7
R6 B9A_6
R7 B7_4
R7 B7_2
Dissertation Schematic
R1 B0
R2 B2
R3 B5_1
R4 B3_2
R5 B4

147
all m
all temeasurements in inches
peratures in degress C
deg.C deg. KelvinTmelt 1450 1723
cast ingot width length thicknessin oxidized stainless steel 304 can 2.0 2.0 0.375sealed in argon atmosphere
- seal in stainless 321 (preoxidized @ 900C) can, backfilled with argon and evacuated- hot soak at 1000 deg. C for 30 min, argon flow over can - 4 liter/min by O2 calib.- hot roll 55.5 % reduction rollers @ 300 deg.C and 22.5 fpm reduced in 72 passes, rollers set in 0.003"/pass, reheat @ 1000 for 6 min every 3 passes- remove can
rolled thick plate width length thickness2.4 3.5 0.167
- section width into two equal pieces with diamond band saw- section length into two equal pieces- trimmed rolled product to give plates B, D, E,F; corners saved as coupon A1- remove contaminants with 50/50 HCl/H2O plus H2O2
coupon A1trimmed pieces hot rolled thick plate width length thicknessthickness 0.167 1.125 1.63 0.167
Littman / Kohler proc. DEF stacked
width length thickness width length thickness1.125 1.63 0.167 1.125 1.63 0.167
Nishihara proc. @ 700 deg.C Littman / Kohler proc. DEF stacked
width length thickness1.125 1.63 0.167
Littman / Kohler proc. DEF stacked
sectioned thick plate D
sectioned thick plate B sectioned thick plate E
sectioned thick plate F
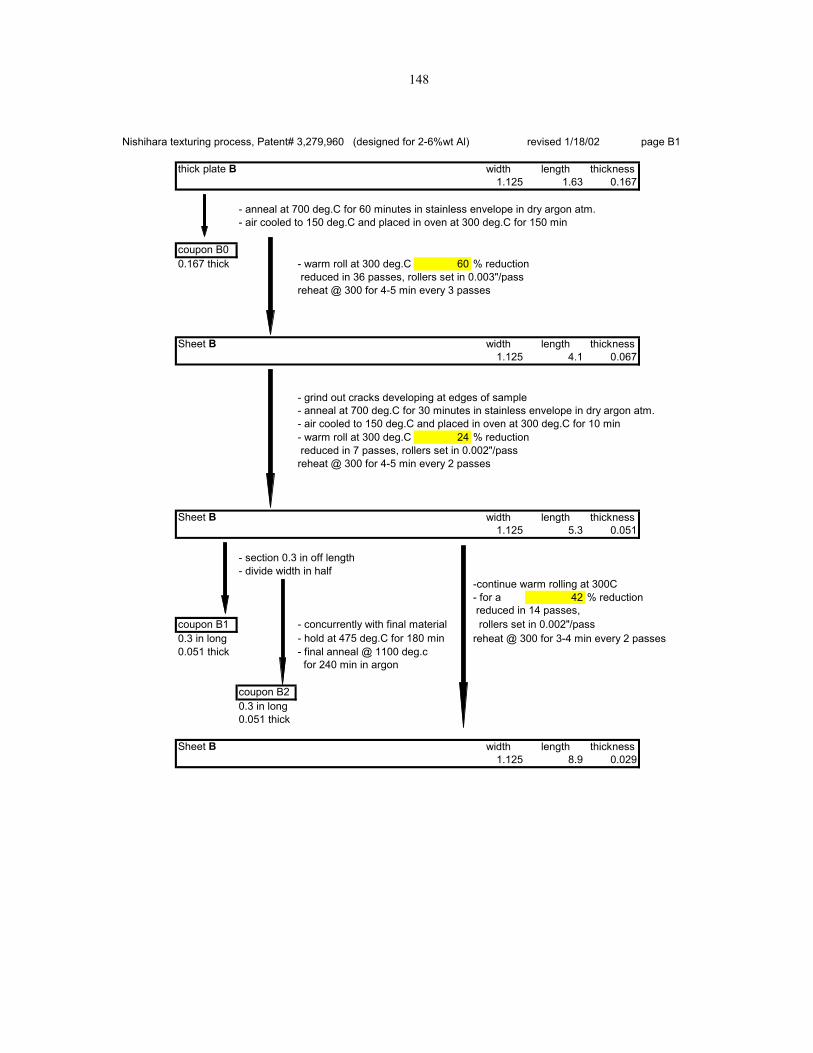
148
Nishihara texturing process, Patent# 3,279,960 (designed for 2-6%wt Al) revised 1/18/02 page B1
thick plate B width length thickness1.125 1.63 0.167
- anneal at 700 deg.C for 60 minutes in stainless envelope in dry argon atm.- air cooled to 150 deg.C and placed in oven at 300 deg.C for 150 min
coupon B00.167 thick - warm roll at 300 deg.C 60 % reduction
reduced in 36 passes, rollers set in 0.003"/passreheat @ 300 for 4-5 min every 3 passes
Sheet B width length thickness1.125 4.1 0.067
- grind out cracks developing at edges of sample- anneal at 700 deg.C for 30 minutes in stainless envelope in dry argon atm.- air cooled to 150 deg.C and placed in oven at 300 deg.C for 10 min- warm roll at 300 deg.C 24 % reduction reduced in 7 passes, rollers set in 0.002"/passreheat @ 300 for 4-5 min every 2 passes
Sheet B width length thickness1.125 5.3 0.051
- section 0.3 in off length- divide width in half
-continue warm rolling at 300C- for a 42 % reduction reduced in 14 passes,
coupon B1 - concurrently with final material rollers set in 0.002"/pass0.3 in long - hold at 475 deg.C for 180 min reheat @ 300 for 3-4 min every 2 passes0.051 thick - final anneal @ 1100 deg.c
for 240 min in argon
coupon B20.3 in long0.051 thick
Sheet B width length thickness1.125 8.9 0.029
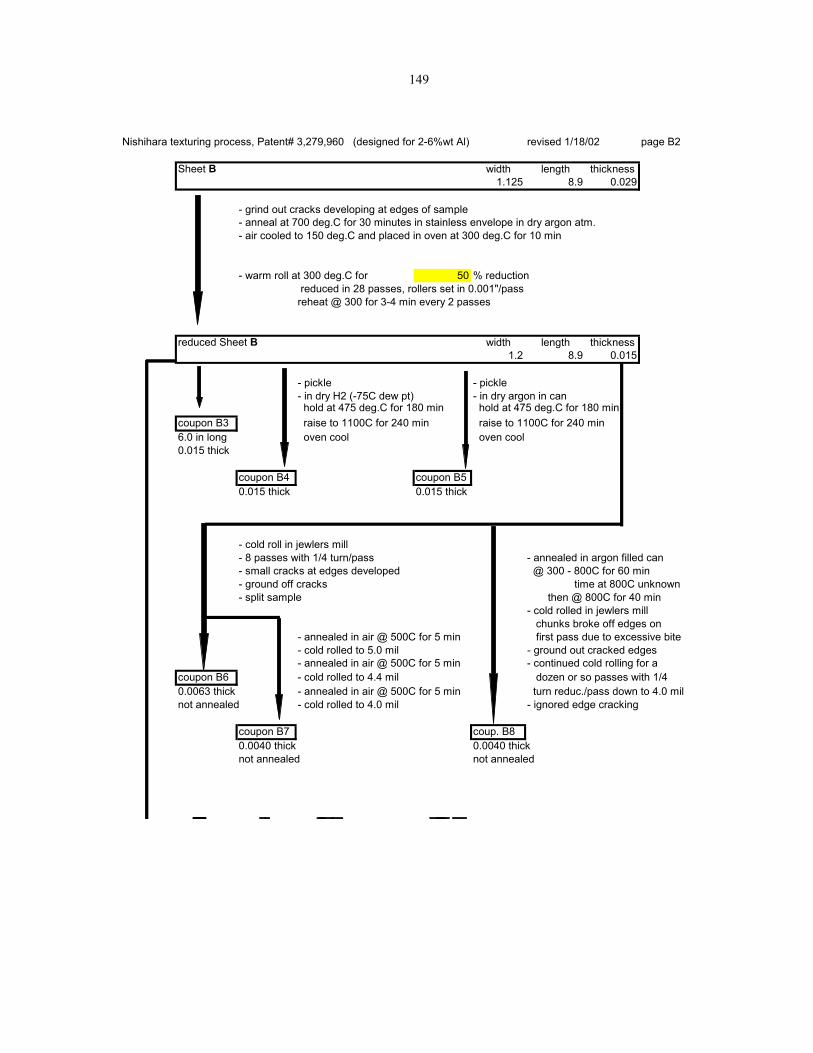
149
Nishihara texturing process, Patent# 3,279,960 (designed for 2-6%wt Al) revised 1/18/02 page B2
Sheet B width length thickness1.125 8.9 0.029
- grind out cracks developing at edges of sample- anneal at 700 deg.C for 30 minutes in stainless envelope in dry argon atm.- air cooled to 150 deg.C and placed in oven at 300 deg.C for 10 min
- warm roll at 300 deg.C for 50 % reduction reduced in 28 passes, rollers set in 0.001"/passreheat @ 300 for 3-4 min every 2 passes
reduced Sheet B width length thickness1.2 8.9 0.015
- pickle - pickle- in dry H2 (-75C dew pt) - in dry argon in can hold at 475 deg.C for 180 min hold at 475 deg.C for 180 min
coupon B3 raise to 1100C for 240 min raise to 1100C for 240 min6.0 in long oven cool oven cool0.015 thick
coupon B4 coupon B50.015 thick 0.015 thick
- cold roll in jewlers mill- 8 passes with 1/4 turn/pass - annealed in argon filled can - small cracks at edges developed @ 300 - 800C for 60 min- ground off cracks time at 800C unknown- split sample then @ 800C for 40 min
- cold rolled in jewlers mill chunks broke off edges on
- annealed in air @ 500C for 5 min first pass due to excessive bite- cold rolled to 5.0 mil - ground out cracked edges- annealed in air @ 500C for 5 min - continued cold rolling for a
coupon B6 - cold rolled to 4.4 mil dozen or so passes with 1/40.0063 thick - annealed in air @ 500C for 5 min turn reduc./pass down to 4.0 milnot annealed - cold rolled to 4.0 mil - ignored edge cracking
coupon B7 coup. B80.0040 thick 0.0040 thicknot annealed not annealed

150
reduced Sheet B width length thickness1.2 dozen or s 0.015
- annealed in air @ 500C for 30 min- subsequent cold rolling in Stanat mill at Ames lab- cold rolled to 10.8 mil in 35 passes, final load 100 ton- annealed in air @ 500C for 5 min- cold rolled to 9.7 mil in 13 passes, final load 100 ton- annealed in air @ 500C for 5 min- cold rolled to 9.0 mil in 12 passes, final load 100 ton- annealed in air @ 500C for 5 min- ground out 1/16 inch cracks along edges, split sample down length- cold rolled to 7.9 mil in 15 passes, final load 100 ton- annealed in air @ 500C for 10 min- cold rolled to 7.5 mil in 15 passes, final load 100 ton- annealed in air @ 500C for 10 min- cold rolled to 6.7 mil in 20 passes, final load 100 ton
B9A width length thicknessnot annealed 1.2 0.0 0.0067
B9A_1 1100 deg. flowing argon anneal, 1 hourB9A_2 1100 deg. flowing H2 anneal, 1 hourB9A_3 475C for 3hrs &1100C for 4 hours, flowing H2 annealB9A_4 severely oxidized during annealB9A_5 590 deg. evacuated argon annealB9A_6
- hand polished one face with 400, 1200, 2000 grit- annealed in H2 @ 590C for 1 hour, oven cooled- hand polished one face with 1200, 2000 grit- etched with: 20 H20, 7 HCl, 3 H202 for 20 seconds
0.0067 thicknotched in rolling direction
coupon B9A_8coupon B9A_7
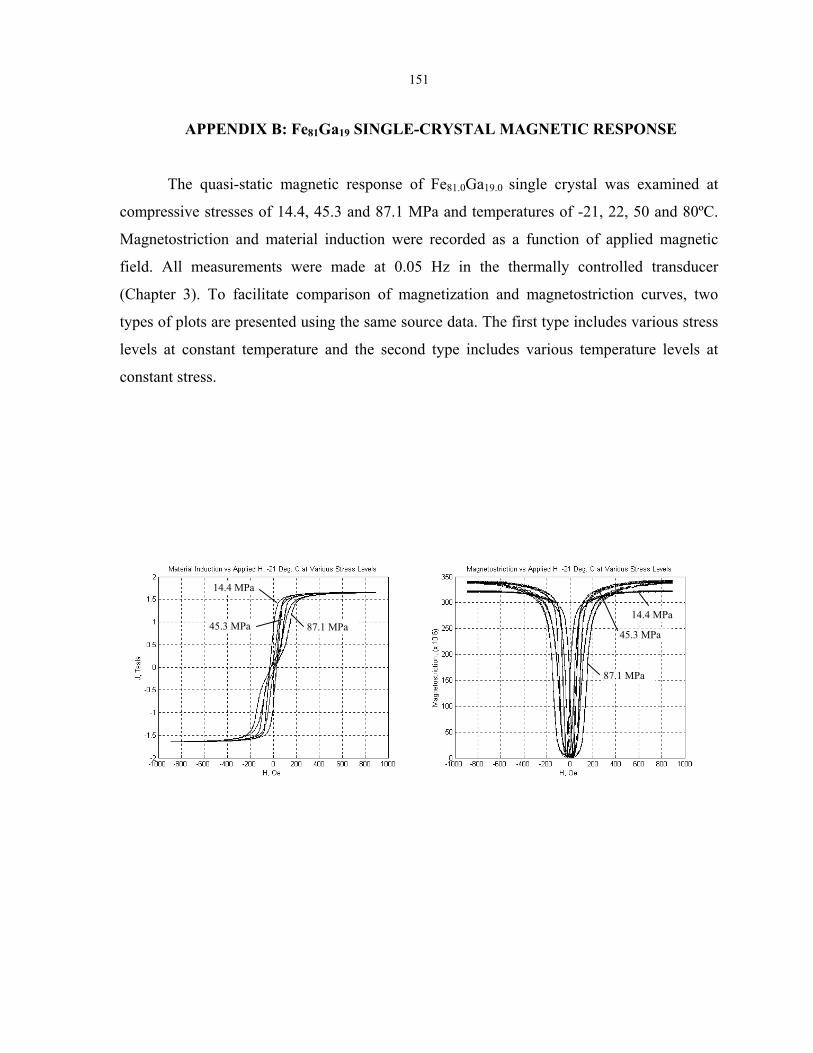
151
APPENDIX B: Fe81Ga19 SINGLE-CRYSTAL MAGNETIC RESPONSE
The quasi-static magnetic response of Fe81.0Ga19.0 single crystal was examined at
compressive stresses of 14.4, 45.3 and 87.1 MPa and temperatures of -21, 22, 50 and 80ºC.
Magnetostriction and material induction were recorded as a function of applied magnetic
field. All measurements were made at 0.05 Hz in the thermally controlled transducer
(Chapter 3). To facilitate comparison of magnetization and magnetostriction curves, two
types of plots are presented using the same source data. The first type includes various stress
levels at constant temperature and the second type includes various temperature levels at
constant stress.
45.3 MPa
14.4 MPa
87.1 MPa
87.1 MPa 45.3 MPa
14.4 MPa

152
45.3 MPa
14.4 MPa
87.1 MPa
87.1 MPa 45.3 MPa
14.4 MPa
87.1 MPa 45.3 MPa
14.4 MPa
87.1 MPa 45.3 MPa
14.4 MPa
45.3 MPa
14.4 MPa
87.1 MPa
45.3 MPa
14.4 MPa
87.1 MPa
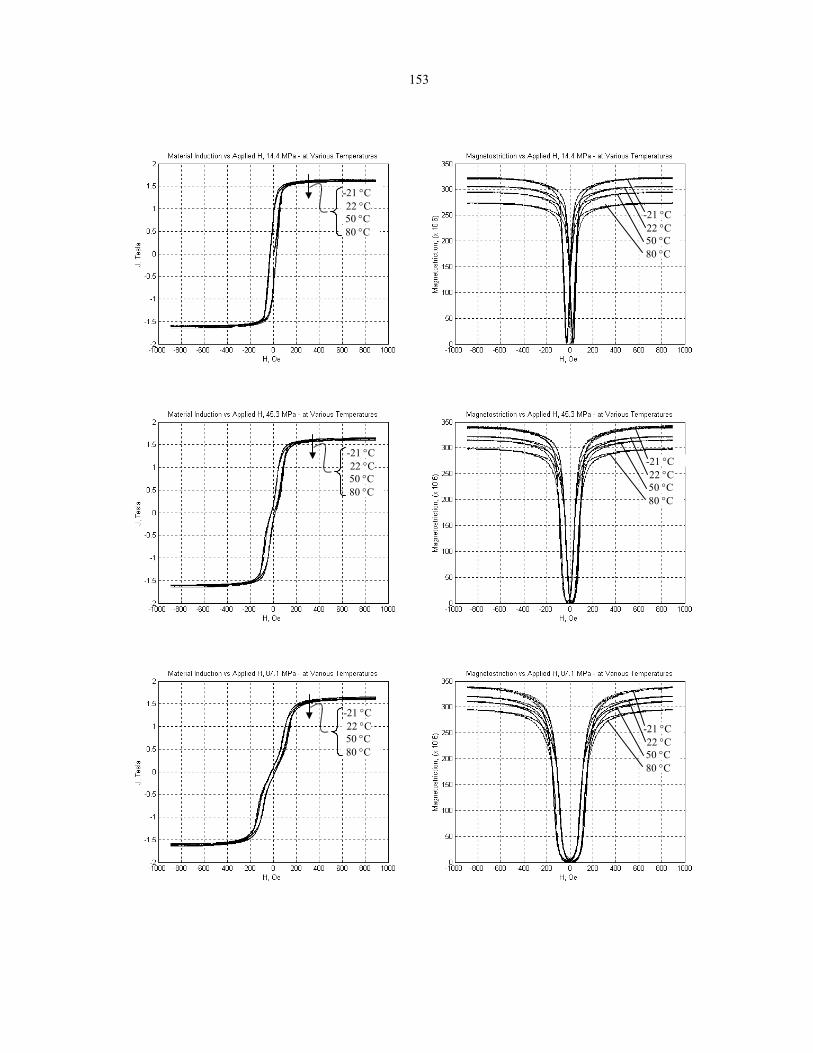
153
-21 °C 22 °C 50 °C 80 °C
-21 °C 22 °C 50 °C 80 °C
-21 °C 22 °C 50 °C 80 °C
-21 °C 22 °C 50 °C 80 °C
-21 °C 22 °C 50 °C 80 °C
-21 °C 22 °C 50 °C 80 °C
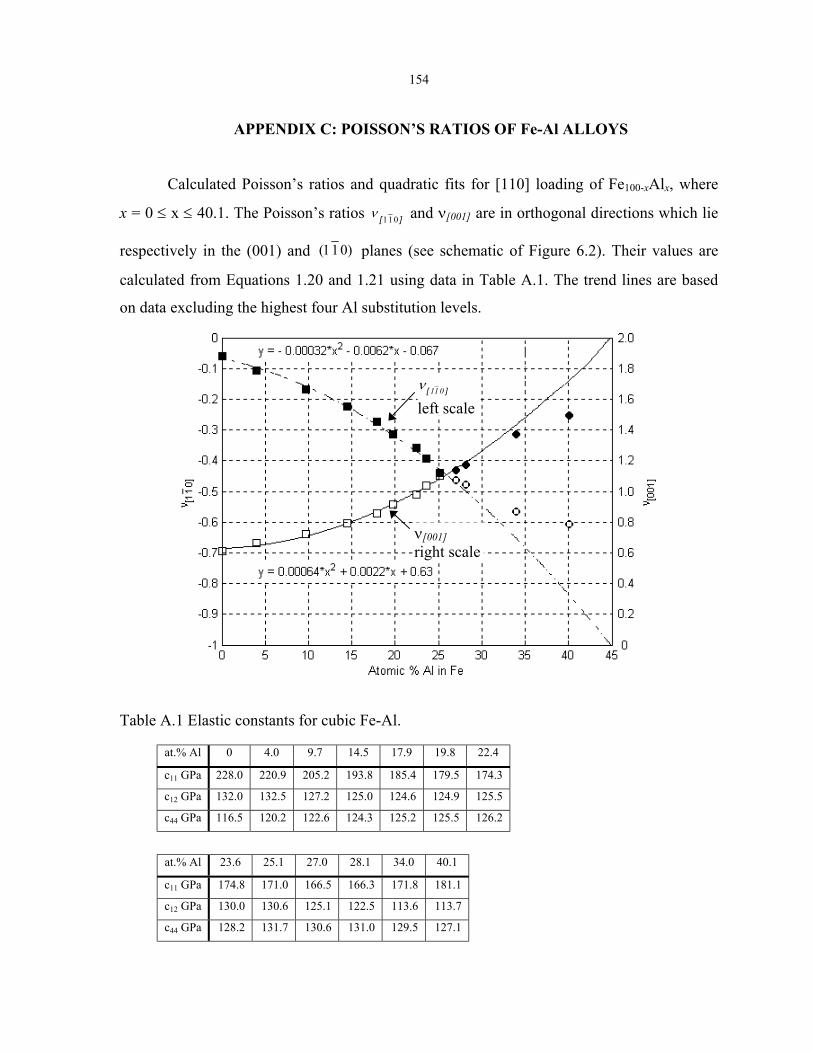
154
APPENDIX C: POISSON’S RATIOS OF Fe-Al ALLOYS
Calculated Poisson’s ratios and quadratic fits for [110] loading of Fe100-xAlx, where
x = 0 ≤ x ≤ 40.1. The Poisson’s ratios ][ 011ν and ν[001] are in orthogonal directions which lie
respectively in the (001) and )011( planes (see schematic of Figure 6.2). Their values are
calculated from Equations 1.20 and 1.21 using data in Table A.1. The trend lines are based
on data excluding the highest four Al substitution levels.
Table A.1 Elastic constants for cubic Fe-Al.
][ 011ν left scale
ν[001] right scale
at.% Al 0 4.0 9.7 14.5 17.9 19.8 22.4
c11 GPa 228.0 220.9 205.2 193.8 185.4 179.5 174.3
c12 GPa 132.0 132.5 127.2 125.0 124.6 124.9 125.5
c44 GPa 116.5 120.2 122.6 124.3 125.2 125.5 126.2
at.% Al 23.6 25.1 27.0 28.1 34.0 40.1
c11 GPa 174.8 171.0 166.5 166.3 171.8 181.1
c12 GPa 130.0 130.6 125.1 122.5 113.6 113.7
c44 GPa 128.2 131.7 130.6 131.0 129.5 127.1
155
REFERENCES
Alderson, A., “A triumph of lateral thought,” Chemistry and Industry, May 17, 1999. Baker, I., Wu, D., and George, E.P., “The low temperature tensile behavior of FeAl single
crystals,” Structural Intermetallics, p. 279-288, 2001. Barrett, C.S., and Levenson, L.H., AIME Trans. 135 p.296, 1939. Barrett, C.S., Structure of Metals, 2nd Ed., (McGraw-Hill Book Co., 1952) Baughman, R.H., Shacklette, J.M., Zakhidov, A. A., and Stafstrom, S., “Negative Poisson’s
ratios as a common feature of cubic metals,” Letters to Nature 392 p. 362-365, 1998. Bily, M., Ed., Cyclic Deformation and Fatigue of Metals, (Elsevier, New York, 1993). Birkenbeil, H.J., and Cahn, R.W., “Induced magnetic anisotropy created by magnetic of
stress annealing of iron-aluminum alloys,” Journal of Applied Physics, 32 p. 362S-363S, 1961.
Boresi, A.P., Schmidt, R.J., Sidebottom, O.M., Advanced Mechanics of Materials, 5th ed., (John Wiley & Sons, Inc., New York. 1993), Chapter 2.
Bozorth, R.M., Ferromagnetism, (Van Nostrand, New York, 1951), p. 968. Bowman, H.B., Handbook of Precision Sheet, Strip and Foil, (American Society for Metals,
Metal Park Ohio, 1980). Butler, J.L., Application Manual for the Design of Etrema Terfenol-D Magnetostrictive
Transducers, (Etrema Poducts, Inc., Ames, Iowa, 1988). Calkins, F.T., Design, Analysis, and Modeling of Giant Magnetostrictive Transducers, (Ph.D
dissertation, Iowa State University, Ames, Iowa, 1997). Callen, H.B., and Goldberg, N., “Magnetostriction of polycrystalline aggregates,” Journal of
Applied Physics, 36 p. 976 - 977, 1965. Chandrupatla, T.R., and Belegundu, A.D., Introduction to Finite Elements in Engineering,
2nd ed. (Prentice Hall, Englewood Cliffs, NJ, 1991). Clark, A.E., “Magnetostrictive rare earth-Fe2 compounds,” Ferromagnetic Materials,
Volume 1, E. P. Whohlfarth, editor, (North-Holland Publishing Company, Amsterdam, 1980), p. 531-589.
Clark, A.E., Wun-Fogle, M., Restorff, J.B., Lograsso, T.A., Ross, A.R., and Schlagel, D.L., “Magnetostrictive Galfenol/Alfenol single crystal alloys under large compressive stresses,” Actuator 2000, submitted March 29, 2000a.
Clark, A.E., Wun-Fogle, M., Restorff, J.B., Lograsso, T.A., and Schlagel, D.L., “Magnetostrictive properties of b.c.c. Fe-Ga and Fe-Ga-Al alloys,” Proceedings of the Intermag 2000 Conference, Toronto, Canada, April 10-13, 2000b.
Clark, A.E., Restorff, J.B., Wun-Fogle, M., Lograsso, T.A., and Schlagel, D.L., “Magnetostrictive properties of body-centered cubic Fe-Ga and Fe-Ga-Al alloys,” IEEE Transactions on Magnetics, 36 p. 3238-3240, 2000c.
Clark, A.E., Wun-Fogle, M., Restorff, J.B., Lograsso, T.A., and Cullen, J.R., “Effect of quenching on the magnetostriction of Fe1-xGax (0.13<x<0.21),” 8th Joint MMM-Intermag Conference, Jan 7 - 11, 2001.
Clark, A.E., Wun-Fogle, M., Restorff, J.B., and Lograsso, T.A., Proc. Pacific Rim International Conference on Advanced Materials and Processing, Honolulu, Hawaii, Dec. 11-15, 2001b.
156
Clark, A.E., Restorff, J.B., Wun-Fogle, M., and Lograsso, T.A., “Magnetostrictive properties of Galfenol alloys under compressive stress,” Materials Transactions (Japan) 43 p. 881-886, 2002a.
Clark, A.E., Hathaway, K.B., Wun-Fogle, M., Restorff, J.B., Lograsso, T.A., Keppens, V.M., Petculescu, G., and Taylor, R.A., Journal of Applied Physics, 93 p. 8621, 2003.
Cox, J.J., Mehl, R.F., and Horne, G.T., Trans. Am. Soc. Met. 49 118, 1957. Cullen, J.R., Clark, A.E., WunFogle, M., Restorff, J.B., and Lograsso, T.A.,
“Magnetoelasticity of Fe-Ga and Fe-Al alloys,” ICM Abstract Designation 1G-02, no date.
Cullen, J.R., Clark, A.E., Wun-Fogle, M., Restorff, J.B., and Lograsso, T.A., “Magnetoelasticity of Fe-Ga and Fe-Al alloys,” Journal of Magnetism and Magnetic Matererials, 226 p. 948-949, 2001.
Cullity, B.D., Introduction to Magnetic Materials, (Addison-Wesly Publishing Co., Reading MA, 1972), Chapter 8.
Dieter, G.E., Mechanical Metallurgy: SI Metric Edition, (McGraw-Hill, London, 1988), p. 126.
Dunn, C.G., and Walter, J.L., “Surface energies and other surface effects relating to secondary recrystallization textures in high-purity iron, zone-refined iron and 0.6 pct. Si-Fe,” Transaction of the Metallurgical Society of AIME, 224 p. 518 – 533, June 1962.
Gibson, R.F., Principles of Composite Material Mechanics, (McGraw-Hill, New York, 1994).
Hall, R.C., “Single crystal anisotropy and magnetostriction constants of several ferromagnetic materials including alloys of NiFe, SiFe, AlFe, CoNi, and CoFe,” Journal of Applied Physics, 30(6) p. 816 - 819, June 1959.
Hall, R.C., “Single crystal magnetic anisotropy and magnetostriction studies in iron-based alloys,” Journal of Applied Physics, 31(6) p. 1037 - 1038, June 1960.
Honda, K., Kaya, S., “On the magnetization of single crystals of iron,” Sci. Reports, Tohoku Univ., p. 721 – 753, 1926.
Jain, M. and Verma, M.P., “Poisson’s ratios in cubic crystals corresponding to (110) loading,” Indian Journal of Pure and Applied Physics, 28 p. 178-182, 1990.
Jiles, D.C., Atherton, D.L., “Theory of ferromagnetic hysteresis,” Journal of Magnetism and Magnetic Materials, 61 p. 48 - 60, June 1986.
Jiles, D.C., “Theory of the magnetomechanical effect,” Physics D: Applied Physics, 28 p. 1537 - 1546, 1995.
Jiles, D.C., Introduction to Magnetism and Magnetic Materials, Second Edition, (Chapman & Hall, London, 1998).
Jimenez, J.A., Frech, W., Ruano, O.A., and Frommeyer, G., “Microstructure and mechanical properties of rapidly solidified Fe-25%Cr-5%Al ribbons produced by planar flow casting,” Steel Research, 66(6) p. 251 – 253, June 1995.
JCPDS – International Centre for Diffraction Data, PCPDFWIN v. 1.30, 1997. Kad, B.K., Schoenfeld, S.E., Asaro, R.J., McKamey, C.G., and Sikka, V.K., “Deformation
textures in Fe3Al alloys,” Acta Maerialia 45 p. 1333-1350, 1997. Kawamiya, N., Adachi, K., Nakamura, Y., “Magnetic properties and Mossbauer
investigations of Fe-Ga alloys,” Journal of the Physical Society of Japan, 33(5) p. 1318 - 1327, Nov. 1972.

157
Kellogg, R.A., and Flatau, A.B., “Blocked force investigation of a Terfenol-D transducer,” Proc. SPIE 3668 p. 184-195, 1999.
Kellogg, R.A., The Delta-E Effect in Terfenol-D and its Application in a Tunable Mechanical Resonator, (Masters Thesis, Iowa State University, August 2000).
Kellogg, R.A., Flatau, A.B., Clark, A.E., Wun-Fogle, M., and Lograsso, T.A., “Temperature and stress dependencies of the magnetic and magnetostrictive properties of Fe81Ga19,” Journal of Applied Physics, 91 p. 7821 2002.
Kinkaid, N.M., “Pulling apart a press-fitted joint, Mathematics and Mechanics of Solids,” 7 p. 307-318, 2002.
Kittel, C., “Physical theory of ferromagnetic domains,” Reviews of Modern Physics, 21 p. 541-583, 1949.
Kramer, J.L., “Nucleation and growth effects in thin ferromagnetic sheets: a review focusing on surface energy-induced secondary recrystallization,” Metallurgical Transactions A, 23A p. 1987 - 1992, July 1992.
Kumar, S., Kurtz, S.K., Banavar, J.R, and Sharma, M.G., “Properties of a three-dimensional Poisson-Voronoi tesselation: a Monte Carlo study,” Journal of Statistical Physics, 67 p. 523-551, 1992.
Kubaschewski, O., Iron - Binary Phase Diagrams, (Springer-Verlag Berlin Heidelberg, New York, 1982).
Kurzydlowski, K.J., Ralph, B., Bucki, J.J., Garbacz, A., “Grain boundary character distribution on the flow stress of polycrystals: The influence of crystal lattice texture,” Materials Science and Engineering A, A205(1-2) p. 127-132, January 1996.
Lakes, R.S., Park, J.B., and Friis, E.A., Proc. Amer. Soc. Compos 3-rd Tecj. Conf., Basel, p. 527-533, 1988.
Leamy, H., Gibson, E.D., and Kayser, F.X., “The elastic stiffness coefficients of iron- aluminum alloys - I Experimental results and thermodynamic analysis,” Acta Metallurgica, 15 p. 1827-1837, December 1967a.
Leber, C.S., ASM Trans., 53 p. 697, 1961. Lograsso, T.A., Unpublished results from preliminary tension tests to failure of
polycrystalline Galfenol, Iowa State University, Fall, 2000. Lograsso, T.A. Ross, A.R. Schlagel, D.L., Clark, A.E., and Wun-Fogle, M., “Structural
transformations in quenched Fe-Ga alloys,” Journal of Alloys and Compounds, 350 p. 95-101, 2003.
Lyman, T., Ed., Metals Handbook, 1948 Edition, (American Society for Metals, Cleveland, Ohio, 1948).
Mason, W. P. Physical Acoustics and the Properties of Solids, (D. Van Nostrand Princeton, New Jersey 1958), A1.
Massalski, T., Editor, Binary Alloy Phase Diagrams 2nd Ed., (ASM International, Materials Park, Ohio, 2002).
McLean, D., Mechanical Properties of Metals, (John Wiley & Sons, Inc., New York, 1962). McLean, K.O., and Smith, C. S., Journal of Physics and Chemical Solids (USA) 33 p. 279,
1972. Milstein, F., and Huang, K. “Existence of a negative Poisson ratio in fcc crystals,” Physical
Review B, 19 p. 2030-2033, 1979.
158
Moffatt, W.G., Pearsall,G.W., and Wulff, J., The Structure and Properties of Materials, Vol I, (John Wiley & Sons, Inc., New York, 1964).
Nachman, J.F., and Buehler, W.J., “16 Percent aluminum-iron alloy cold rolled in the order-disorder temperature range,” Journal of Applied Physics, 25 p. 307-313, March 1954.
Nabarro, F., Proc. R. Soc. (London) A 381 p. 285, 1982. Novikov, V., Grain Growth and Control of Microstructure and Texture in Polycrystalline
Materials, (CRC Press, New York, 1997). Nye, J.F., Physical Properties of Crystals, (Clarendon, Oxford, 1985). Orlans-Joliet, B., Driver, J.H., Montheillet, F., “Plane strain compression of silicon-iron
single crystals,” Acta Metallurgica 38 p. 581-594, 1990. Prasad, Y.V., “Texture dependent mechanical properties of metals and alloys,” Transactions
of the Indian Institute of Metals, 37(4) p. 399 - 410, Aug. 1994. Random House, College Dictionary, Revised Ed. 1980. Rhines, F.N., and Craig, K.R., “Mechanism of steady-state grain growth in aluminum,”
Metallurgical Transactions, 5A p. 413-425, 1974. Rovati, M., “On the negative Poisson’s ratio of an orthorhombic alloy,” Scripta Materialia,
48 p. 235-240, 2003. Smith, C.S., Metal Interfaces, (American Society for Metals, Cleveland, Ohio, 1952). Sawyer, B., and Smoluchowski, R., Journal of Applied Physics, 28 p. 1069, 1957. Smoluchowski, R., and Turner, R.W., Journal of Applied Physics, 20 p. 745, 1949. Shilko, S.V., “Friction of anomalously elastic bodies, negative Poisson’s ratio, part 1 self-
locking effect,” Journal of Friction and Wear, 16 p. 19-25, 1995. Shull, R.D., Okamoto, H., and Beck, P.A., “Transition from ferromagnetism to
mictomagnetism in Fe-Al alloys,” Solid State Communications, 20 p. 863-868, 1976. Stephens, R.I., Fatemi, A., Stephens, R.R., and Fuchs, H.O., Metal Fatigue in Engineering,
2nd Ed., (John Wiley & Sons, Inc., New York, 2001). Tatsumoto. E., and Okamoto, T., “Temperature dependence of magnetostriction constants in
iron and silicon iron,” Journal of the Physical Society of Japan, 14(11) p. 1588-1599, 1959.
Titorov, D.B., “Texture as a factor of improving the technological properties of materials,” Metal Science and Heat Treatment, 29(11-12) p 840-843, May 1998.
Waeckerle, T., Couty, J.M., Comut, B., and Brun, C., “Effect of process on the rise of texture in magnetic iron sheets,” IEEE Transactions on Magnetics, 29 p. 3538- 3540, 1993.
Walter, J.L., “Control of texture in magnetic material by surface energy,” Journal of Applied Physics, 36 p. 1213-1220, 1965.
Wu, D., and Baker, I., “Effect of environment and strain rate on the room temperature tensile properties of FeAl single crystals,” Intermetallics, 9 p. 57-65, 2001.
Wu, R., “Origin of large magnetostriction on Fe-Ga alloys,” Journal of Applied Physics, 91 p. 7358-7360, May 2002.


![Filippo Alison: un viaggio tra le forme [english texts only]_PRE-print](https://static.fdokumen.com/doc/165x107/63134e7c5cba183dbf070a2e/filippo-alison-un-viaggio-tra-le-forme-english-texts-onlypre-print.jpg)