Development and Implementation of the National Cancer Institute's Food Attitudes and Behaviors...
13
RESEARCH ARTICLE Development and Implementation of the National Cancer Institute’s Food Attitudes and Behaviors Survey to Assess Correlates of Fruit and Vegetable Intake in Adults Temitope O. Erinosho 1 , Courtney A. Pinard 2 *, Linda C. Nebeling 3 , Richard P. Moser 3 , Abdul R. Shaikh 3 , Ken Resnicow 4 , April Y. Oh 5 , Amy L. Yaroch 2 1 University of North Carolina at Chapel Hill, Chapel Hill, North Carolina, United States of America, 2 Gretchen Swanson Center for Nutrition, Omaha, Nebraska, United States of America, 3 U.S. National Cancer Institute, Rockville, Maryland, United States of America, 4 University of Michigan, School of Public Health, Ann Arbor, Michigan, United States of America, 5 Clinical Monitoring Research Program, SAIC- Frederick, Inc., National Cancer Institute-Frederick, Frederick, Maryland, United States of America * [email protected] Abstract Background Low fruit and vegetable (FV) intake is a leading risk factor for chronic disease globally as well as in the United States. Much of the population does not consume the recommended servings of FV daily. This paper describes the development of psychosocial measures of FV intake for inclusion in the U.S. National Cancer Institute’s 2007 Food Attitudes and Be- haviors Survey. Methods This was a cross-sectional study among 3,397 adults from the United States. Scales included conventional constructs shown to be correlated with fruit and vegetable intake (FVI) in prior studies (e.g., self-efficacy, social support), and novel constructs that have been measured in few- to- no studies (e.g., views on vegetarianism, neophobia). FVI was assessed with an eight-item screener. Exploratory factor analysis, Cronbach’s alpha, and regression analyses were conducted. Results Psychosocial scales with Cronbach’s alpha 0.68 were self-efficacy, social support, per- ceived barriers and benefits of eating FVs, views on vegetarianism, autonomous and con- trolled motivation, and preference for FVs. Conventional scales that were associated (p<0.05) with FVI were self-efficacy, social support, and perceived barriers to eating FVs. Novel scales that were associated (p<0.05) with FVI were autonomous motivation, and preference for vegetables. Other single items that were associated (p<0.05) with FVI in- cluded knowledge of FV recommendations, FVI “while growing up”, and daily water consumption. PLOS ONE | DOI:10.1371/journal.pone.0115017 February 23, 2015 1 / 13 OPEN ACCESS Citation: Erinosho TO, Pinard CA, Nebeling LC, Moser RP, Shaikh AR, Resnicow K, et al. (2015) Development and Implementation of the National Cancer Institute’s Food Attitudes and Behaviors Survey to Assess Correlates of Fruit and Vegetable Intake in Adults. PLoS ONE 10(2): e0115017. doi:10.1371/journal.pone.0115017 Academic Editor: Rita Rezzani, University of Brescia, ITALY Received: August 13, 2014 Accepted: November 17, 2014 Published: February 23, 2015 Copyright: This is an open access article, free of all copyright, and may be freely reproduced, distributed, transmitted, modified, built upon, or otherwise used by anyone for any lawful purpose. The work is made available under the Creative Commons CC0 public domain dedication. Data Availability Statement: Data are available upon request due to standards and procedures set by the federal government. Many government agencies require the completion of a data users agreement before the dataset is sent to them. This is the case with the National Cancer Institute’s FAB dataset; if parties are interested in obtaining the dataset, instructions for contacting Dr. April Oh are listed on the FAB website: http://cancercontrol.cancer.gov/brp/ fab/.
-
Upload
independent -
Category
Documents
-
view
0 -
download
0
Transcript of Development and Implementation of the National Cancer Institute's Food Attitudes and Behaviors...

RESEARCH ARTICLE
Development and Implementation of theNational Cancer Institute’s Food Attitudesand Behaviors Survey to Assess Correlates ofFruit and Vegetable Intake in AdultsTemitope O. Erinosho1, Courtney A. Pinard2*, Linda C. Nebeling3, Richard P. Moser3,Abdul R. Shaikh3, Ken Resnicow4, April Y. Oh5, Amy L. Yaroch2
1 University of North Carolina at Chapel Hill, Chapel Hill, North Carolina, United States of America,2 Gretchen Swanson Center for Nutrition, Omaha, Nebraska, United States of America, 3 U.S. NationalCancer Institute, Rockville, Maryland, United States of America, 4 University of Michigan, School of PublicHealth, Ann Arbor, Michigan, United States of America, 5 Clinical Monitoring Research Program, SAIC-Frederick, Inc., National Cancer Institute-Frederick, Frederick, Maryland, United States of America
AbstractBackground
Low fruit and vegetable (FV) intake is a leading risk factor for chronic disease globally as
well as in the United States. Much of the population does not consume the recommended
servings of FV daily. This paper describes the development of psychosocial measures of
FV intake for inclusion in the U.S. National Cancer Institute’s 2007 Food Attitudes and Be-
haviors Survey.
Methods
This was a cross-sectional study among 3,397 adults from the United States.
Scales included conventional constructs shown to be correlated with fruit and vegetable
intake (FVI) in prior studies (e.g., self-efficacy, social support), and novel constructs that
have been measured in few- to- no studies (e.g., views on vegetarianism, neophobia). FVI
was assessed with an eight-item screener. Exploratory factor analysis, Cronbach’s alpha,
and regression analyses were conducted.
Results
Psychosocial scales with Cronbach’s alpha�0.68 were self-efficacy, social support, per-
ceived barriers and benefits of eating FVs, views on vegetarianism, autonomous and con-
trolled motivation, and preference for FVs. Conventional scales that were associated
(p<0.05) with FVI were self-efficacy, social support, and perceived barriers to eating FVs.
Novel scales that were associated (p<0.05) with FVI were autonomous motivation, and
preference for vegetables. Other single items that were associated (p<0.05) with FVI in-
cluded knowledge of FV recommendations, FVI “while growing up”, and daily
water consumption.
PLOS ONE | DOI:10.1371/journal.pone.0115017 February 23, 2015 1 / 13
OPEN ACCESS
Citation: Erinosho TO, Pinard CA, Nebeling LC,Moser RP, Shaikh AR, Resnicow K, et al. (2015)Development and Implementation of the NationalCancer Institute’s Food Attitudes and BehaviorsSurvey to Assess Correlates of Fruit and VegetableIntake in Adults. PLoS ONE 10(2): e0115017.doi:10.1371/journal.pone.0115017
Academic Editor: Rita Rezzani, University ofBrescia, ITALY
Received: August 13, 2014
Accepted: November 17, 2014
Published: February 23, 2015
Copyright: This is an open access article, free of allcopyright, and may be freely reproduced, distributed,transmitted, modified, built upon, or otherwise usedby anyone for any lawful purpose. The work is madeavailable under the Creative Commons CC0 publicdomain dedication.
Data Availability Statement: Data are availableupon request due to standards and procedures set bythe federal government. Many government agenciesrequire the completion of a data users agreementbefore the dataset is sent to them. This is the casewith the National Cancer Institute’s FAB dataset; ifparties are interested in obtaining the dataset,instructions for contacting Dr. April Oh are listed onthe FAB website: http://cancercontrol.cancer.gov/brp/fab/.

Conclusion
These findings may inform future behavioral interventions as well as further exploration of
other potential factors to promote and support FVI.
IntroductionDiets high in fruits and vegetables (FVs) are associated with reduced risk for obesity and severalchronic diseases [1–5]. National guidelines recommend that adults in the United States (U.S.)consume 7–13 servings (3½-6½ cups) of FVs daily, depending on sex and activity level [5,6].However, surveillance studies report that most U.S. adults consume less than recommendedamounts [7–9]. Understanding correlates of fruit and vegetable intake (FVI) are critical for de-veloping and testing effective FVI interventions.
Studies report that psychosocial factors are associated with adults’ FVI [10–16]. For in-stance, greater perceived access and availability of FVs are associated with higher FVI[11,17,18]. Having positive attitudes toward FVs, believing in their health importance, likingtheir taste, having greater self-efficacy to eat them, and being knowledgeable of the FV recom-mendations are also associated with higher FVI in adults [10,12–14,16]. Measures for assessingpsychosocial constructs related to FVI vary, and many assess a limited number of psychosocialconstructs [19–23]. Therefore, the items developed for the current survey drew from multipletraditional behavioral theories such as the Social Cognitive Theory, Self-Determination Theory,Theory of Reasoned Action, and Health Belief Model, as well as novel items that are not speci-fied in established behavioral theories [24–28]. Furthermore, although some measures havebeen developed for use with specific population subgroups such as low-income adults [13,29],but few measures for assessing psychosocial constructs have been specifically developed andtested in a national sample of U.S. adults [22].
This paper describes the development of psychosocial measures for inclusion in the U.S. Na-tional Cancer Institute’s (NCI) Food Attitudes and Behaviors (FAB) Survey. The survey includ-ed assessment of both conventional constructs that have been shown to be correlated with FVIin prior studies (e.g., barriers, self-efficacy, social support), and novel constructs that have beenmeasured in few- to- no studies that specifically assess attitudes and behaviors in relation tofood (e.g., views on vegetarianism, neophobia). First, the paper describes the process of identi-fying, selecting, and testing the psychometric properties of the survey items. Second, an evalua-tion of the psychosocial constructs’, including scales and single items, and the association withFVI will be reported.
Methods
DesignDevelopment and Pilot-testing of the FAB Survey. Survey items were selected based on anextensive literature review [15] in which we identified conventional psychosocial constructsfrom cross-sectional and longitudinal studies that were significantly associated FVI. Most con-structs and associated survey items (both existing and new items) included on the survey werebased on common health behavior theories as stated above. Some novel scales and items thatwere not related to existing theories and/or had not been examined specifically with regard toFV attitudes and behaviors were included in the survey. A content validity review was con-ducted by nutrition, public health, and health behavior experts. Extensive cognitive
Correlates of Fruit and Vegetable Intake
PLOS ONE | DOI:10.1371/journal.pone.0115017 February 23, 2015 2 / 13
Funding: The authors have no support or funding toreport.
Competing Interests: The authors have declaredthat no competing interests exist.
interviewing was conducted with 68 adults to assess comprehension of survey items, and ad-justments were made iteratively to ensure the items were understandable.
Psychometric testing of the survey was conducted in a pilot study (N = 579 adults). Basedon pilot findings, some survey items were retained for use in scales and as single items, otherswere dropped, and some items were modified for use in the larger main implementation study(described below). Findings regarding reliability estimates from the pilot were consistent withthe larger main implementation study, thus we do not report details from the pilot here.
The Main FAB Implementation Study and SampleThe final FAB Survey [30] was comprised of 65 items that assessed food attitudes, beliefs andpreferences, social support, knowledge, perceived access to FVs, food shopping behaviors,physical activity, perceived health, demographic characteristics, and FVI [31–34]. The studywas approved by the National Cancer Institute’s institutional review board and passed throughclearance at the Office of Management and Budget (OMB). The survey was administered toadults ages�18 years across the U.S. September-December, 2007. Respondents were selectedfrom the Synovate Consumer Opinion Panel (http://www.ipsos.com/) using stratified randomsampling, with an oversampling of African Americans. The FAB Survey was mailed to 5,803adults; 3,418 surveys were returned, yielding a response rate of 57%; 21 incomplete surveyswere excluded, for a final sample of 3,397. Respondents received a thank you letter and $5 forcompleting the survey.
MeasuresThe following describe the constructs and associated survey items. A full copy of the FAB Sur-vey and associated materials can be found at http://cancercontrol.cancer.gov/brp/fab/.
Psychosocial Constructs and Single Items on the FAB Survey. Conventional psychosocialconstructs included self-efficacy, social support, perceived barriers and benefits of eating FVs,and FV purchasing behaviors (Table 1). These constructs have been shown in prior studies tobe strong correlates of FVI [15]. Self-efficacy (7 items) measured confidence to consume FVs.Social support (5 items) asked about family/friends support and encouragement in eating FVs.Perceived benefits (7 items) asked about perceptions of health benefits of FVs. Perceived barri-ers (14 items) included: access, high cost, and short shelf-life of FVs.
Novel psychosocial constructs included views on vegetarianism (6 items), autonomous(11 items) and controlled motivation (7 items), preference for FVs (36 items), and food neo-phobia (3 items) (Table 2). The development of items was exploratory and based on emergingevidence or in the case of motivation, had previously been explored with other behaviors(e.g., smoking). Autonomous motivation was defined as motivations for performing behaviorsfor which the rewards were internal to the individual, while controlled motivation were thosethat were based on the receipt of external rewards or punishment [25,26,35]. Food neophobiaasked about reluctance to try new foods.
Single items on the survey were either other behaviors or items that did not fit within a scale(i.e., low alphas) and included: physical activity (participation/non-participation for�30 min-utes daily); smoking (never/former/current smoker); awareness and knowledge of FV recom-mendation; and two out of three items from the original food neophobia scale (see Table 2).Additional single items asked about “worry” (how much has worrying about your health ledyou to change the way you ate in the past year), and seasonality (do you tend to eat the sametypes of FVs all year round or tend to eat different types of FVs depending on the season?). Fi-nally, respondents were asked about the amount (cups) of water they consumed daily, and howoften they ate FVs while growing up.
Correlates of Fruit and Vegetable Intake
PLOS ONE | DOI:10.1371/journal.pone.0115017 February 23, 2015 3 / 13

Table 1. Internal consistency for conventional constructs related to fruit and vegetable intake.
FV Constructs Items for measuring construct ItemsKept
ItemsExcluded
# of itemsincluded
Cronbach’sAlpha
Self-efficacy Confidence to:
Eat a healthy snack, like a fruit/ vegetable, when hungry X 7 0.92
Eat healthy foods, like fruit/vegetables, when tired X
Eat healthy foods, like fruit/vegetables, when junk foods are inyour house
X
Eat fruit instead of cake, cookies, candy, ice cream, or othersweets for dessert
X
Eat fruits/vegetables when family and friends are eating junkfoods
X
Buy or bring FVs to eat at work X
Snack on FVs rather than on junk foods while watching TV X
Social Support My family/friends: 3 0.68
Encourage me to eat FVs
Remind me not to eat junk food X
Would say something if they saw I was not eating FVs X
Often eat FVs when we are together X
Would be willing to eat a vegetarian/vegetable-based meal X
Perceivedbenefits
If you eat plenty of FVs every day, how likely are you to:
Have more energy X 7 0.91
Live a long life X
Control your weight X
Look better (appearance) X
Be regular (cleanse the body) X
Feel good about yourself X
I eat enough FVs to keep me healthy X
Perceivedbarriers
I don’t eat FVs as much as I would like because:
They cost too much X 14 0.85
They often spoil before I get a chance to eat them X
They take too much time to prepare X
They are not filling enough X
I have trouble digesting them X
My family doesn’t like them X
I don’t know how to choose fresh FVs X
Perceivedbarriers
I don’t think of FVs when I’m looking for something to eat X
They are too messy X
I often forget to eat FVs because they are stored out of sight X
Restaurants I go to don’t serve fruit X
Restaurants I go to don’t serve vegetables X
It is not easy for me to purchase FVs in my neighborhood X
It is hard for me to eat more FVs because I don’t know how toprepare them
X
When I eat out, it is easy for me to get FVs X
Abbreviations: FVs denotes fruits and vegetables.
doi:10.1371/journal.pone.0115017.t001
Correlates of Fruit and Vegetable Intake
PLOS ONE | DOI:10.1371/journal.pone.0115017 February 23, 2015 4 / 13

Table 2. Internal consistency for novel constructs related to fruit and vegetable intake.
FV Construct Items for measuring construct ItemsKept
ItemsExcluded
# of Itemsincluded
Cronbach’sAlpha
Views onVegetarianism
Dinner doesn’t seem right without meat as a main course X 5 0.76
After I eat a meal without meat, I still feel hungry X
Vegetarians are a bit “different” X
I think meals should include some meat X
I just don’t understand how someone could be a vegetarian X
My family/friends would be willing to eat a vegetarian/ vegetable-based meal
X
Autonomousmotivation
What motivates you to eat FVs:
To feel in control of my health X 11 0.95
I have a strong value for eating healthy X
I personally believe it is a good thing for my health X
I have carefully thought about it and believe it is very importantfor me
X
I would feel better about myself if I did eat a healthy diet X
I would like to improve my physical health X
An important choice I really want to make X
Consistent with my life goals X
Important for being as healthy as possible X
To take responsibility for my own health X
Important to treat my body with respect X
ControlledMotivation
What motivates you to eat FVs:
Others would be upset with me if I did not X 7 0.89
I feel pressure from others to eat FVs X
I want others to approve of me X
It’s easier to do what I am told than to think about it X
I want others to see I can do it X
I want to set a good example for my community X
I don’t want to let others down X
I want to set a good example for my family X
Preference for FVs Preference (like/dislike) for:
a) apples, applesauce; b) bananas; c) pears; d) watermelon; e)other melon;
X 36 0.92
f) peaches, nectarine, apricots; g) plums; h) grapes; i) oranges,tangerines;
X
j) strawberries; k) other berries; l) grapefruit; m) kiwi; n) cherries;o) mango, papaya; p) pineapple; q) dried fruit
X
Preference (like/dislike) for:
a) tomatoes, tomato sauce; b) broccoli; c) spinach (cooked); X
d) collards, turnip greens, or mustard greens (cooked); e) stringbeans, green beans
X
f) asparagus; g) green, red, or yellow pepper; h) celery; i)cucumber; j) peas
X
k) lima, red, pinto, kidney, lentils, and other beans; l) squash,zucchini
X
m) Brussels sprouts; n) cauliflower; o) okra; p) corn; q) carrots; r)green salad
X
s) yams, sweet potatoes X
t) baked potatoes, mashed potatoes, or potato salad X
(Continued)
Correlates of Fruit and Vegetable Intake
PLOS ONE | DOI:10.1371/journal.pone.0115017 February 23, 2015 5 / 13
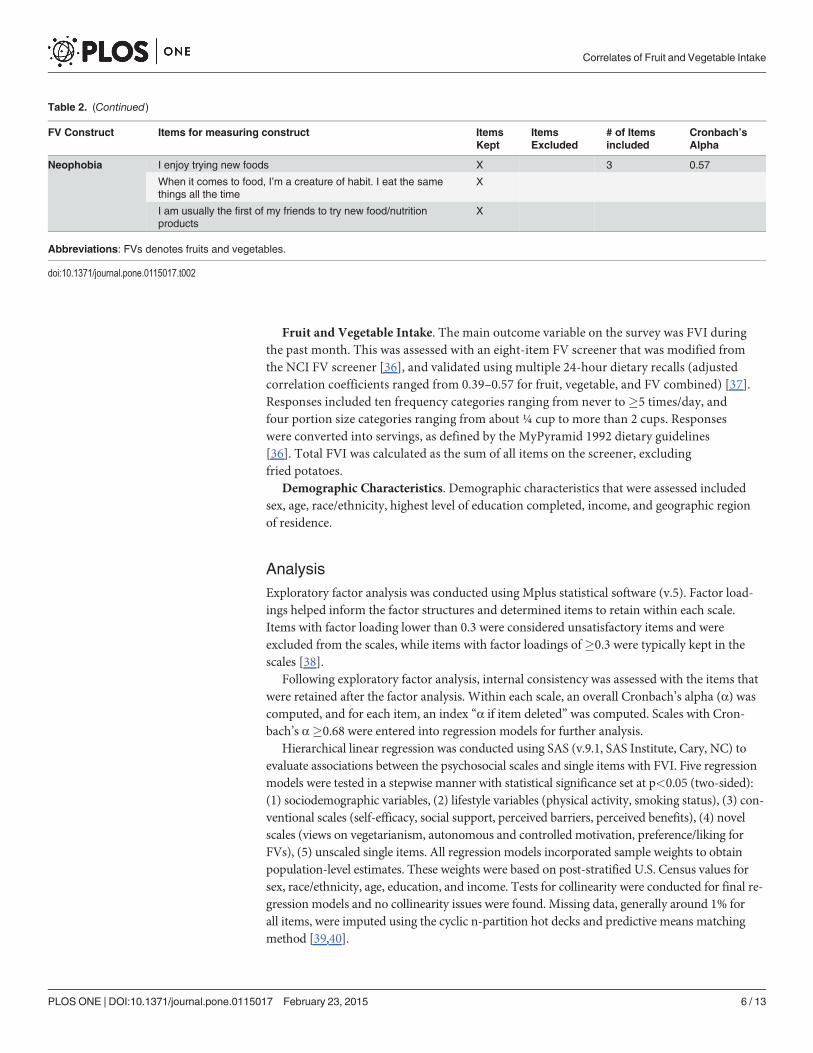
Fruit and Vegetable Intake. The main outcome variable on the survey was FVI duringthe past month. This was assessed with an eight-item FV screener that was modified fromthe NCI FV screener [36], and validated using multiple 24-hour dietary recalls (adjustedcorrelation coefficients ranged from 0.39–0.57 for fruit, vegetable, and FV combined) [37].Responses included ten frequency categories ranging from never to �5 times/day, andfour portion size categories ranging from about ¼ cup to more than 2 cups. Responseswere converted into servings, as defined by the MyPyramid 1992 dietary guidelines[36]. Total FVI was calculated as the sum of all items on the screener, excludingfried potatoes.
Demographic Characteristics. Demographic characteristics that were assessed includedsex, age, race/ethnicity, highest level of education completed, income, and geographic regionof residence.
AnalysisExploratory factor analysis was conducted using Mplus statistical software (v.5). Factor load-ings helped inform the factor structures and determined items to retain within each scale.Items with factor loading lower than 0.3 were considered unsatisfactory items and wereexcluded from the scales, while items with factor loadings of�0.3 were typically kept in thescales [38].
Following exploratory factor analysis, internal consistency was assessed with the items thatwere retained after the factor analysis. Within each scale, an overall Cronbach’s alpha (α) wascomputed, and for each item, an index “α if item deleted” was computed. Scales with Cron-bach’s α�0.68 were entered into regression models for further analysis.
Hierarchical linear regression was conducted using SAS (v.9.1, SAS Institute, Cary, NC) toevaluate associations between the psychosocial scales and single items with FVI. Five regressionmodels were tested in a stepwise manner with statistical significance set at p<0.05 (two-sided):(1) sociodemographic variables, (2) lifestyle variables (physical activity, smoking status), (3) con-ventional scales (self-efficacy, social support, perceived barriers, perceived benefits), (4) novelscales (views on vegetarianism, autonomous and controlled motivation, preference/liking forFVs), (5) unscaled single items. All regression models incorporated sample weights to obtainpopulation-level estimates. These weights were based on post-stratified U.S. Census values forsex, race/ethnicity, age, education, and income. Tests for collinearity were conducted for final re-gression models and no collinearity issues were found. Missing data, generally around 1% forall items, were imputed using the cyclic n-partition hot decks and predictive means matchingmethod [39,40].
Table 2. (Continued)
FV Construct Items for measuring construct ItemsKept
ItemsExcluded
# of Itemsincluded
Cronbach’sAlpha
Neophobia I enjoy trying new foods X 3 0.57
When it comes to food, I’m a creature of habit. I eat the samethings all the time
X
I am usually the first of my friends to try new food/nutritionproducts
X
Abbreviations: FVs denotes fruits and vegetables.
doi:10.1371/journal.pone.0115017.t002
Correlates of Fruit and Vegetable Intake
PLOS ONE | DOI:10.1371/journal.pone.0115017 February 23, 2015 6 / 13

ResultsSociodemographic characteristics of respondents are described in Table 3. Fifty-three percentwere female, 27% non-Hispanic black, and 36% were 35–54 years old. Sixty percent had com-pleted high school, 38% resided in the West, and 66% were overweight/obese.
Scales with Cronbach’s α�0.68 were self-efficacy, social support, perceived barriers andbenefits of eating FVs, views on vegetarianism, autonomous and controlled motivation, andpreference for FVs (Tables 1 and 2). Food neophobia had a Cronbach’s α<0.68, thus the scalewas excluded from the regression models while the strongest single items were included.
Table 4 describes associations between the psychosocial scale and single items and FVI. Thefinal model that included only psychosocial scales and single items that were significant inModel Five explained 31% of the variance in FVI. Lower FVI (p<0.01) was reported by respon-dents who reported not participating in physical activity (β = 0.16), or perceived barriers thatprevented them from eating FVs (β = -0.14). Lower FVI (p<0.05) was also reported by respon-dents who said they did not eat fruits (β = -0.07) or vegetables (β = -0.08) while growing up,were a “creature of habit” (i.e., eating the same foods all the time) (β = -0.03), and did not knowdaily FV recommendations (β = -0.12).
Higher FVI (p<0.05) was reported by respondents reporting greater self-efficacy (β = 0.15),social support (β = 0.08), and autonomous motivation for consuming FVs (β = 0.06), as well asa preference for vegetables (β = 0.37). Higher FVI (p<0.01) was also reported by respondents
Table 3. Sociodemographic characteristics of main implementation (unweighted frequencies andweighted percentages).
n (%)
Sex
Male 1300(47)
Female 2009(53)
Age (years)
18–34 949(31)
35–54 1312(36)
� 55 1053(33)
Race/ethnicity
Non-Hispanic white/Other 2368(73)
Non-Hispanic black 896(27)
Highest level of education completed
< high school 408(14)
High school degree 2001(60)
College degree or higher 901(26)
Region
Northeast 603(19)
Midwest 677(23)
West 1248(38)
South 493(20)
Body mass index
� 24.9 kg/m2 (under/normal weight) 1031(32)
25.0–29.9 kg/m2 (overweight) 1094(34)
� 30.0 kg/m2 (obese) 1102(33)
doi:10.1371/journal.pone.0115017.t003
Correlates of Fruit and Vegetable Intake
PLOS ONE | DOI:10.1371/journal.pone.0115017 February 23, 2015 7 / 13

Table 4. Associations of conventional and novel psychosocial constructs and single items with fruit and vegetable intake (excluding friedpotatoes)a.
Model 1 Model 2 Model 3 Model 4 Model 5 Final Modelβ (p-value) β (p-value) β (p-value) β (p-value) β (p-value) β (p-value)
Sociodemographic variables
Sex (female vs. male) 0.13(<0.001)
0.13(<0.001)
0.04(0.29) -0.03(0.46) -0.14(0.21)
Age 0.09(<0.001)
0.11<0.001) 0.06(0.02) -0.02(0.55) -0.05(0.57)
Race/ethnicity
Hispanic 0.29(0.03) 0.28(0.02) 0.14(0.21) 0.11(0.29) 0.10(0.32)
NH Black 0.20(<0.001)
0.21(<0.001)
0.01(0.90) -0.01(0.86) 0.03(0.59)
NH Other 0.34(<0.001)
0.32(<0.001)
0.20(0.03) 0.15(0.10) 0.12(0.17)
NH White Reference Reference Reference Reference Reference
Education 0.10(<0.001)
0.07(0.00) 0.05(0.02) 0.04(0.09) 0.01 (0.55)
Income 0.00(0.94) -0.00(0.50) -0.01(0.20) -0.00(0.27) -0.00 (0.20)
Region
Midwest -0.00(0.96) -0.01(0.85) 0.01(0.83) 0.03(0.65) 0.07(0.24)
Northeast 0.04(0.50) 0.05(0.47) 0.06(0.36) 0.08(0.15) 0.12(0.03)
South -0.07(0.30) -0.05(0.42) -0.06(0.27) -0.06(0.28) -0.02(0.77)
West Reference Reference Reference Reference Reference
Lifestyle variables
Physical activity (participation vs. non-participation) -0.48(<0.00) -0.30(<0.001)
-0.26(<0.001)
-0.16(<0.001)
-0.16(<0.001)
Smoking status (current vs. former and never smoker) -0.02(0.41) -0.01(0.74) 0.01(0.80) 0.00(0.93) ——
Conventional Psychosocial Constructs
Self-efficacy 0.30(<0.001)
0.20(<0.001)
0.14(<0.001)
0.15(<0.001)
Social Support 0.13(<0.001)
0.11(<0.001)
0.08(<0.001)
0.08(<0.001)
Barriers -0.31(<0.001)
-0.23(<0.001)
-0.13(<0.001)
-0.14(<0.001)
Benefits 0.04(0.08) -0.07(0.02) -0.03(0.21) ——
Novel Psychosocial Constructs
Vegetarianism views 0.03(0.19) -0.02(0.44) ——
Autonomous motivation 0.17(<0.001)
0.08(<0.001)
0.06(0.01)
Controlled motivation -0.02(0.35) -0.03(0.23) ——
Preference for fruit 0.44(<0.001)
0.20(0.06) ——
Preference for vegetable 0.55(<0.001)
0.31(0.01) 0.37(<0.001)
Singe Items
Creature of habit (eating same things all the time) -0.04(0.03) -0.03 (0.04)
Unwillingness to try new foods -0.04(0.06) ——
Not attentive to government FV recommendations -0.01(0.46) ——
Worry about one’s health 0.01(0.55) ——
Drink several cups of water daily 0.14(<0.001)
0.13(<0.001)
(Continued)
Correlates of Fruit and Vegetable Intake
PLOS ONE | DOI:10.1371/journal.pone.0115017 February 23, 2015 8 / 13

that consumed different FVs seasonally (β = 0.19), perceived that they ate more FVs than otherpeople they knew (β = 0.16), and drank several cups of water daily (β = 0.13).
DiscussionThe FAB Survey measured conventional psychosocial constructs related to FVI (i.e., self-effica-cy, social support, perceived barriers and benefits of eating FVs) that have been shown to bestrong correlates of FVI [13,15,19,20,41,42]. Additionally, the survey included the developmentand assessment of novel psychosocial constructs related to FVI (i.e., vegetarianism, autono-mous and controlled motivation, food neophobia, and preference for FVs). All scales, exceptfood neophobia, demonstrated good internal consistency with Cronbach’s α�0.68.
With regard to outcomes, adults consumed more FVs if they reported having greater self-efficacy and social support but consumed fewer FVs if they perceived more barriers. Otherstudies have reported similar findings [13,41–43].
Consistent with other studies [14,44], this study demonstrated that adults having prefer-ences for a greater selection of vegetables ate more FVs. In addition, adults with higher autono-mous motivation for consuming FVs also ate more FVs. According to the Self-DeterminationTheory, enhancing autonomous motivation is likely to result in sustainable behaviors (in thiscase, greater FVI), because it is self-driven, and not influenced by external pressures such asrewards/punishment [25,26,43]. Nevertheless, the effects of autonomous motivation on FVIhave varied across studies [35,45]. Assessing and intervening on autonomous motivation in re-lation to FVI is relatively new, hence we termed it as novel; prior studies have focused mostlyon autonomous motivation for other behaviors (i.e., smoking cessation) [46–48].
With regard to single items, the current study showed that FVI was greater among adultsthat reported eating more FVs than other people they knew, seasonality effects, and greaterwater consumption. However, lower FVI was reported by adults who did not eat FVs frequent-ly while growing up, and those not knowledgeable of the daily recommendation. The currentstudy highlights the need to introduce individuals to FVs early in life, given that these behav-iors tend to track into adulthood, where they play a significant role in health and well-being
Table 4. (Continued)
Model 1 Model 2 Model 3 Model 4 Model 5 Final Modelβ (p-value) β (p-value) β (p-value) β (p-value) β (p-value) β (p-value)
Seasonality (varying FV intake by season vs. eating sametypes year round)
0.18(<0.001)
0.19(<0.001)
Did not eat fruit when growing up (negative responses) -0.07(<0.001)
-0.08(<0.001)
Did not eat vegetable when growing up (negative responses) -0.08(<0.001)
-0.08(<0.001)
No knowledge of FV recommendations (wrong responses vs.correct)
-0.12(<0.001)
-0.12(<0.001)
Eat more FV than other people I know 0.16(<0.001)
0.16(<0.001)
Often encourage my family/friends to eat FV 0.02(0.33) ——
R2 0.02 0.06 0.21 0.25 0.32 0.31
R2 change — 0.04 0.15
Abbreviations: FVs denotes “fruits and vegetables”; NH denotes “Non-Hispanic”.aScales that demonstrated good internal consistency (Tables 1 and 2) with Cronbach’s alpha �.68 were included in the regression analyses Single items
that did not fit within a scale were also entered into the regression models.
doi:10.1371/journal.pone.0115017.t004
Correlates of Fruit and Vegetable Intake
PLOS ONE | DOI:10.1371/journal.pone.0115017 February 23, 2015 9 / 13

[49–51]. In addition, this study helps provide foundational information in elucidating the rolepsychosocial constructs may play and their potential associations with FVI and how they canbe harnessed and applied in behavioral interventions. Specifically, results from this study un-derscore the need to continue examining and intervening on “usual suspect” FV constructs(e.g., self-efficacy and social support) but that we should also continue to test novel constructs;namely ones explored in this analysis (e.g., seasonality, water intake, fruit and vegetable behav-iors when growing up), as well as others, either derived from existing theories or as they are dis-covered through conducting research. Next steps include application of this information inintervention research.
This study has some limitations. The cross-sectional design does not allow for assessment ofcausality between the psychosocial scales, single items, and FVI. Data were collected via self-report from participants and subject to recall bias. Due to budget constraints and the decliningresponse rates to random-digit-dial telephone surveys [52], the samples for both the pilot andimplementation studies were drawn from a consumer opinion panel. This approach has beenused successfully with other health survey, such as the Styles [53]. Nevertheless, the FAB sam-ple was weighted based on post-stratified 2000 U.S. Census values for sex, race/ethnicity, age,education, and income. Specifically for this sample, eligible participants were selected to be rep-resentative of the U.S. population and previous research that has compared panel and randomdigit dial results have shown comparability, indicating that panel studies are a viable alternativefor data collection, especially as telephone random digit dial response rates are dropping [54].Lastly, some consider the theory behind hot deck imputation underdeveloped [55], however,we used cyclical n-partition hot deck imputation, a method that retains the semiparametric fea-tures of the data and have no strong assumption required about distribution shapes [56,57].Strengths of the study are the large sample size and oversampling of African Americans. TheFV screener was tested for reliability and validated using 24-hour dietary recalls [37].
ConclusionsMost U.S. adults continue to not meet FV recommendations. Measures for assessing psychoso-cial constructs related to FVI vary and many assess a limited number of constructs. Few exist-ing measurement tools have been tested among a national sample of U.S. adults. This paperdescribes the development and testing of FV-related measures among a sample of U.S. adults.It describes both conventional and novel correlates of FVI, which augments the literature inthis area. Items and scales from the FAB Survey can be utilized and/or adapted by researchersinterested in measuring FVI. It can also help inform behavioral interventions.
AcknowledgmentsThe authors thank Heidi Blanck, PhD, of the Centers for Disease Control and Prevention(CDC) for her insightful feedback.
Author ContributionsConceived and designed the experiments: ALY AYO ARS. Performed the experiments: ALYAYO ARS. Analyzed the data: RPM TOE. Contributed reagents/materials/analysis tools: ALYKR LCN AYO ARS. Wrote the paper: TOE CAP ALY AYO ARS.
References1. Bazzano LA, He J, Ogden LG, Loria CM, Vupputuri S, et al. (2002) Fruit and vegetable intake and risk
of cardiovascular disease in US adults: the first National Health and Nutrition Examination Survey Epi-demiologic Follow-up Study. Am J Clin Nutr 76: 93–99. PMID: 12081821
Correlates of Fruit and Vegetable Intake
PLOS ONE | DOI:10.1371/journal.pone.0115017 February 23, 2015 10 / 13

2. Boeing H, Bechthold A, Bub A, Ellinger S, Haller D, et al. (2012) Critical review: vegetables and fruit inthe prevention of chronic diseases. Eur J Nutr 51: 637–663. doi: 10.1007/s00394-012-0380-y PMID:22684631
3. Carter P, Gray LJ, Troughton J, Khunti K, Davies MJ (2010) Fruit and vegetable intake and incidence oftype 2 diabetes mellitus: systematic review and meta-analysis. BMJ: 341.
4. Lock K, Pomerleau J, Causer L, Altmann DR, McKee M (2005) The global burden of disease attribut-able to low consumption of fruit and vegetables: implications for the global strategy on diet. Bull WorldHealth Organ 83: 100–108. PMID: 15744402
5. US Department of Health and Human Services (2010) Dietary Guidelines for Americans. http://www.cnpp.usda.gov/Publications/DietaryGuidelines/2010/PolicyDoc/PolicyDoc.pdf. Accessed 2012 Dec 4.
6. Fruits and Veggies—More Matters (FVVM). What percentage of Americans are aware that they shouldeat 5 servings of fruit and vegetales a day. http://www.fruitsandveggiesmorematters.org/archives/545.Accessed 2012 Dec 4.
7. Guenther PM, Dodd KW, Reedy J, Krebs-Smith SM (2006) Most Americans eat much less than recom-mended amounts of fruits and vegetables. J Am Diet Assoc 106: 1371–1379. PMID: 16963342
8. Kimmons J, Gillespie C, Seymour J, Serdula M, Blanck HM (2009) Fruit and vegetable intake amongadolescents and adults in the United States: percentagemeeting individualized recommendations.Medscape J Med 11: 26. PMID: 19295947
9. Krebs-Smith SM, Guenther PM, Subar AF, Kirkpatrick SI, Dodd KW (2010) Americans do not meet fed-eral dietary recommendations. J Nutr 140: 1832–1838. doi: 10.3945/jn.110.124826 PMID: 20702750
10. Brug J, Lechner L, De Vries H (1995) Psychosocial determinants of fruit and vegetable consumption.Appetite 25: 285–296. PMID: 8746967
11. Caldwell EM, Miller Kobayashi M, DuBowWM,Wytinck SM (2009) Perceived access to fruits and vege-tables associated with increased consumption. Public Health Nutr 12: 1743–1750. doi: 10.1017/S1368980008004308 PMID: 19105861
12. Campbell MK, McLerran D, Turner-McGrievy G, Feng Z, Havas S, et al. (2008) Mediation of adult fruitand vegetable consumption in the National 5 A Day for Better Health community studies. Ann BehavMed 35: 49–60. doi: 10.1007/s12160-007-9002-y PMID: 18347904
13. Havas S, Treiman K, Langenberg P, Ballesteros M, Anliker J, et al. (1998) Factors associated with fruitand vegetable consumption among women participating in WIC. J Am Diet Assoc 98: 1141–1148.PMID: 9787720
14. Krebs-Smith SM, Heimendinger J, Patterson BH, Subar AF, Kessler R, et al. (1995) Psychosocial fac-tors associated with fruit and vegetable consumption. Am J Health Promot 10: 98–104. PMID:10160052
15. Shaikh AR, Yaroch AL, Nebeling L, Yeh MC, Resnicow K (2008) Psychosocial predictors of fruit andvegetable consumption in adults a review of the literature. Am J Prev Med 34: 535–543. doi: 10.1016/j.amepre.2007.12.028 PMID: 18471592
16. Watters JL, Satia JA, Galanko JA (2007) Associations of psychosocial factors with fruit and vegetableintake among African-Americans. Public Health Nutr 10: 701–711. PMID: 17381950
17. Caspi CE, Kawachi I, Subramanian SV, Adamkiewicz G, Sorensen G (2012) The relationship betweendiet and perceived and objective access to supermarkets among low-income housing residents. SocSci Med 75: 1254–1262. doi: 10.1016/j.socscimed.2012.05.014 PMID: 22727742
18. Williams L, Ball K, Crawford D (2010) Why do some socioeconomically disadvantaged women eat bet-ter than others? An investigation of the personal, social and environmental correlates of fruit and vege-table consumption. Appetite. Dec 2010; 55(3):441–446. doi: 10.1016/j.appet.2010.08.004 PMID:20728488
19. Baranowski T, Missaghian M, Broadfoot A, Watson K, Cullen K, et al. (2006) Fruit and vegetable shop-ping practices and social support scales: A validation. J Nutr Educ Behav. 38: 340–351. PMID:17142190
20. Ling AM, Horwath C (1999) Self-efficacy and consumption of fruit and vegetables: validation of a sum-mated scale. Am J Health Promot 13: 290–298. PMID: 10538644
21. Norman GJ, Carlson JA, Sallis JF, Wagner N, Calfas KJ, et al. (2010) Reliability and validity of brief psy-chosocial measures related to dietary behaviors. Int J Behav Nutr Phys Act 7: 56. doi: 10.1186/1479-5868-7-56 PMID: 20594360
22. Obayashi S, Bianchi LJ, SongWO (2003) Reliability and validity of nutrition knowledge, social-psychological factors, and food label use scales from the 1995 Diet and Health Knowledge Survey.J Nutr Educ Behav 35: 83–91. PMID: 12725714
Correlates of Fruit and Vegetable Intake
PLOS ONE | DOI:10.1371/journal.pone.0115017 February 23, 2015 11 / 13

23. Yeh MC, Matsumori B, Obenchain J, Viladrich A, Das D, et al. (2010) Validity of a competing foodchoice construct regarding fruit and vegetable consumption among urban college freshmen. J NutrEduc Behav 42: 321–327. doi: 10.1016/j.jneb.2009.08.004 PMID: 20655281
24. Deci EL, Ryan RM (2008) Self-determination theory: A macro theory of humanmotivation, develop-ment, and health. Can Psychol 49: 182–185.
25. Ryan RM, Deci EL (2000) Self-determination theory and the facilitation of intrinsic motivation, social de-velopment, and well-being. Am Psychol 55: 68–78. PMID: 11392867
26. Fishbein M (1967) Readings in Attitude Theory and Measurement. New York: Wiley.
27. Bandura A (1977) Social Learning Theory. Englewood Cliffs, NJ: Prentice Hall.
28. Bandura A (1986) Social Foundations of Thought and Action. Englewood Cliffs, NJ: Prentice Hall.
29. Townsend MS, Kaiser LL (2005) Development of a tool to assess psychosocial indicators of fruit andvegetable intake for 2 federal programs. J Nutr Educ Behav 37: 170–184. PMID: 16029687
30. National Cancer Institute. Food Attitudes and Behaviors (FAB) Survey. http://cancercontrol.cancer.gov/brp/fab/#survey. Accessed 2013 Oct 14.
31. Blanck HM, Thompson OM, Nebeling L, Yaroch AL (2011) Improving fruit and vegetable consumption:use of farm-to-consumer venues among US adults. Prev Chronic Dis 8: A49. PMID: 21324263
32. Erinosho TO, Moser RP, Oh AY, Nebeling LC, Yaroch AL (2012) Awareness of the Fruits and Veggies-More Matters campaign, knowledge of the fruit and vegetable recommendation, and fruit and vegetableintake of adults in the 2007 Food Attitudes and Behaviors (FAB) Survey. Appetite 59: 155–160. doi: 10.1016/j.appet.2012.04.010 PMID: 22524998
33. Erinosho TO, Oh AY, Moser RP, Davis KL, Nebeling LC, et al. (2012) Association between perceivedfood environment and self-efficacy for fruit and vegetable consumption among US adults, 2007. PrevChronic Dis 9: E10. PMID: 22172177
34. Goodman AB, Blanck HM, Sherry B, Park S, Nebeling L, et al. (2013) Behaviors and attitudes associat-ed with low drinking water intake among US adults, Food Attitudes and Behaviors Survey, 2007. PrevChronic Dis 10: E51. doi: 10.5888/pcd10.120248 PMID: 23578399
35. Satia JA, Kristal AR, Curry S, Trudeau E (2001) Motivations for healthful dietary change. Public HealthNutr 4: 953–959. PMID: 11784408
36. National Cancer Institute. Fruit and vegetable screeners in the Eating at America’s Table Study(EATS): Scoring. http://appliedresearch.cancer.gov/diet/screeners/fruitveg/scoring/. Accessed 2013Oct 14.
37. Yaroch AL, Tooze J, Thompson FE, Blanck HM, Thompson OM, et al. (2012) Evaluation of three shortdietary instruments to assess fruit and vegetable intake: the National Cancer Institute’s food attitudesand behaviors survey. J Acad Nutr Diet 112: 1570–1577. doi: 10.1016/j.jand.2012.06.002 PMID:23017567
38. Tabachnick BG, Fidell LS (2007) Using Multivariate Statistics. Boston: Allyn and Bacon.
39. Piesse A, Judkins D, Fan Z (2005) Proceedings of the Section on Survey Research Methods of theAmerican Statistical Association.
40. Judkins DR (1997) Imputing for Swiss cheese patterns of missing data. Proceedings of Statistics Cana-da Symposium.
41. Ko LK, Allicok M, Campbell MK, Valle CG, Armstrong-Brown J, et al. (2011) An examination of sociode-mographic, health, psychological factors, and fruit and vegetable consumption among overweight andobese U.S. veterans. Mil Med 76: 1281–1286.
42. Resnicow K, Wallace DC, Jackson A, Digirolamo A, Odom E, et al. (2000) Dietary change through Afri-can American churches: baseline results and program description of the eat for life trial. J Cancer Educ15: 156–163. PMID: 11019764
43. Fuemmeler BF, Masse LC, Yaroch AL, Resnicow K, Campbell MK, et al. (2006) Psychosocial media-tion of fruit and vegetable consumption in the body and soul effectiveness trial. Health Psychol 25:474–483. PMID: 16846322
44. Van Duyn MA, Kristal AR, Dodd K, Campbell MK, Subar AF, et al. (2001) Association of awareness, in-trapersonal and interpersonal factors, and stage of dietary change with fruit and vegetable consump-tion: a national survey. Am J Health Promot 16: 69–78. PMID: 11727591
45. Satia JA, Galanko JA (2007) Intrinsic and extrinsic motivations for healthful dietary change in AfricanAmericans. Am J Health Behav 31: 643–656. PMID: 17691877
46. Nezami E, Sussman S, Pentz MA (2003) Motivation in tobacco use cessation research. Subst Use Mis-use 38: 25–50. PMID: 12602805
Correlates of Fruit and Vegetable Intake
PLOS ONE | DOI:10.1371/journal.pone.0115017 February 23, 2015 12 / 13

47. Patrick H, Williams GC (2012) Self-determination theory: its application to health behavior and comple-mentarity with motivational interviewing. Int J Behav Nutr Phys Act 9: 18. doi: 10.1186/1479-5868-9-18PMID: 22385676
48. Williams GC, Patrick H, Niemiec CP, Ryan RM, Deci EL, et al. (2011) The smoker’s health project: aself-determination theory intervention to facilitate maintenance of tobacco abstinence. Contemp ClinTrials 32: 535–543. doi: 10.1016/j.cct.2011.03.002 PMID: 21382516
49. Kelder SH, Perry CL, Klepp KI, Lytle LL (1994) Longitudinal tracking of adolescent smoking, physicalactivity, and food choice behaviors. Am J Public Health 84: 1121–1126. PMID: 8017536
50. Mikkila V, Rasanen L, Raitakari OT, Pietinen P, Viikari J (2004) Longitudinal changes in diet from child-hood into adulthood with respect to risk of cardiovascular diseases: The Cardiovascular Risk in YoungFinns Study. Eur J Clin Nutr 58: 1038–1045. PMID: 15220946
51. Resnicow K, Smith M, Baranowski T, Baranowski J, Vaughan R, et al. (1998) 2-year tracking of chil-dren’s fruit and vegetable intake. J Am Diet Assoc 98: 785–789. PMID: 9664920
52. Fahimi M, Link M, Mokdad A, Schwartz DA, Levy P (2008) Tracking chronic disease and risk behaviorprevalence as survey participation declines: statistics from the behavioral risk factor surveillance sys-tem and other national surveys. Prev Chronic Dis 5: A80. PMID: 18558030
53. Blanck HM, Yaroch AL, Atienza AA, Yi SL, Zhang J, et al. (2009) Factors influencing lunchtime foodchoices among working Americans. Health Educ Behav 36: 289–301. PMID: 17602103
54. Pollard WE (2002) Use of consumer panel survey data for public health communication planning: anevaluation of survey results. In Proceedings of the Section on Survey Research Methods of the Ameri-can Statistical Association: 2720–2724.
55. Andridge RR, Little RJA (2010) A review of hot deck imputation for survey non-response. Int Stat Rev78: 40–64 PMID: 21743766
56. Piesse A, Judkins D, Fan Z (2005) Item imputation made easy. In Proceedings of the Section on SurveyResearch Methods of the American Statistical Association: 3476–3479.
57. Judkins D, Krenzke T, Piesse A, Fan Z, HaungWC (2007) Reservation of skip patterns and covariatestructure through semi-parametric whole questionnaire imputation. In Proceedings of the Section onSurvey Research Methods of the American Statistical Association: 3211–3218.
Correlates of Fruit and Vegetable Intake
PLOS ONE | DOI:10.1371/journal.pone.0115017 February 23, 2015 13 / 13